 | Q2 2025 Shareholder Letter | © 2025 Rivian. All rights reserved. | 2 | ||||||||
 | |||||
During the second quarter of 2025, we made significant progress across our strategic priorities. We continue to focus on advancing our technologies and vehicle platforms to create technology enabled, compelling products that improve over time. We made progress on our R2 platform and are currently producing design validation vehicles primarily using production tooled parts. We believe R2 will embody the performance, capability, utility, and experience of the Rivian brand, but at a significantly lower price point than R1. We have substantially completed the facilities expansion in Normal, Illinois and have begun installing manufacturing equipment which is designed to manufacture up to 155,000 R2 vehicles annually. Technology is at the core of our vehicles and how we operate. We continue to integrate AI tools to enhance manufacturing, customer interactions, and internal operations, reinforcing the benefits of our vertical integration and direct to customer approach. A large part of our AI development is The Rivian Autonomy Platform. This year, we delivered meaningful updates including an updated autonomy view and enhanced highway assist, as well as a next generation onboard perception model that is more robust in difficult conditions and more responsive to behavior from nearby vehicles. Our in-house vehicle software and electrical hardware design coupled with our high quality perception stack enables the crucial data flywheel for training the Rivian Large Driving Model, a large scale foundation model for driving. Our customer fleet also has the onboard intelligence to identify scenes of interest, catalog them, and prioritize their uploads which is critical to improving the performance of our model. Our early fusion approach, where raw data from sensors is fused into a single representation, operates in an additive way where every sensor increases the fidelity of the output. | |||||
| Q2 2025 Shareholder Letter | © 2025 Rivian. All rights reserved. | 3 | ||||||||
In addition to our autonomy system, we continue to make progress on other aspects of software. Our recently launched customer OTA software updates included an enhanced suspension system for a smoother low-speed ride and a reimagined in-vehicle energy experience with faster charging times and intelligent charging visuals. In addition, we recently partnered with Google Maps for an integrated and industry-leading navigation experience tailored for Rivian. The recent launch of our R1 Quad-Motor variant highlights how our technology development has helped advance our flagship product. Within the Quad vehicle we launched a user configurable dynamics mode RAD Tuner. RAD Tuner allows customers to fine-tune vehicle dynamics behavior including torque balance, roll stiffness, ride height, and more. The new Quad-Motor is engineered for extremes and delivers exceptional performance for any adventure. We believe this variant elevates the R1 platform to a whole new level. In addition to our technology, we further expanded our footprint. In July, in partnership with the State of Georgia, we announced our East Coast headquarters in Atlanta which we expect to open later this year. The headquarters will be a focal point for our global growth strategy and a key investment in a top state for electric mobility. This site will complement our upcoming Georgia manufacturing facility in Stanton Springs North, just outside of Atlanta. The global economic landscape and the US regulatory environment presents significant uncertainty, particularly regarding evolving trade regulation, policies around regulatory credits and EVs, tariffs, and the overall impact these items may have on our results, consumer sentiment and demand. These factors have impacted and are expected to continue to impact our global supply chain, material costs and access, profitability, and capital expenditures. We are actively monitoring these developments and working to mitigate potential risks through a variety of initiatives including strategic sourcing, operational and cost efficiencies, and proactive engagement with policymakers. While uncertainties persist, we believe we are taking the appropriate steps for our long-term growth, profitability and technology leadership. During the second quarter, we demonstrated significant progress against our key value drivers: Technology leadership •Delivered OTAs providing customers with improved autonomy features, energy experience, and suspension •Partnered with Google to provide customers with a superior mapping experience through seamless integration of industry leading maps which include navigation, trip planning, and charging experiences Demand generation and enhancing customer experience •Expanded our charging network to have over 780 chargers across 123 sites while maintaining high reliability of 98% uptime in Q2’25 •We currently have 112 locations across service and retail and expect to have over 135 by the end of 2025 Drive towards profitability •R2 estimated to be less than half the cost of revenues per unit as compared to R1 •34% gross margin from software and services Optimize operational efficiency •Completed phase one of the paint shop upgrade ahead of our R2 launch, expected to reduce the required downtime starting in September by approximately one week •Increased the rate of the R1 general assembly line by 36% to more efficiently produce R1 vehicles | |||||
| Q2 2025 Shareholder Letter | © 2025 Rivian. All rights reserved. | 4 | ||||||||
 | |||||
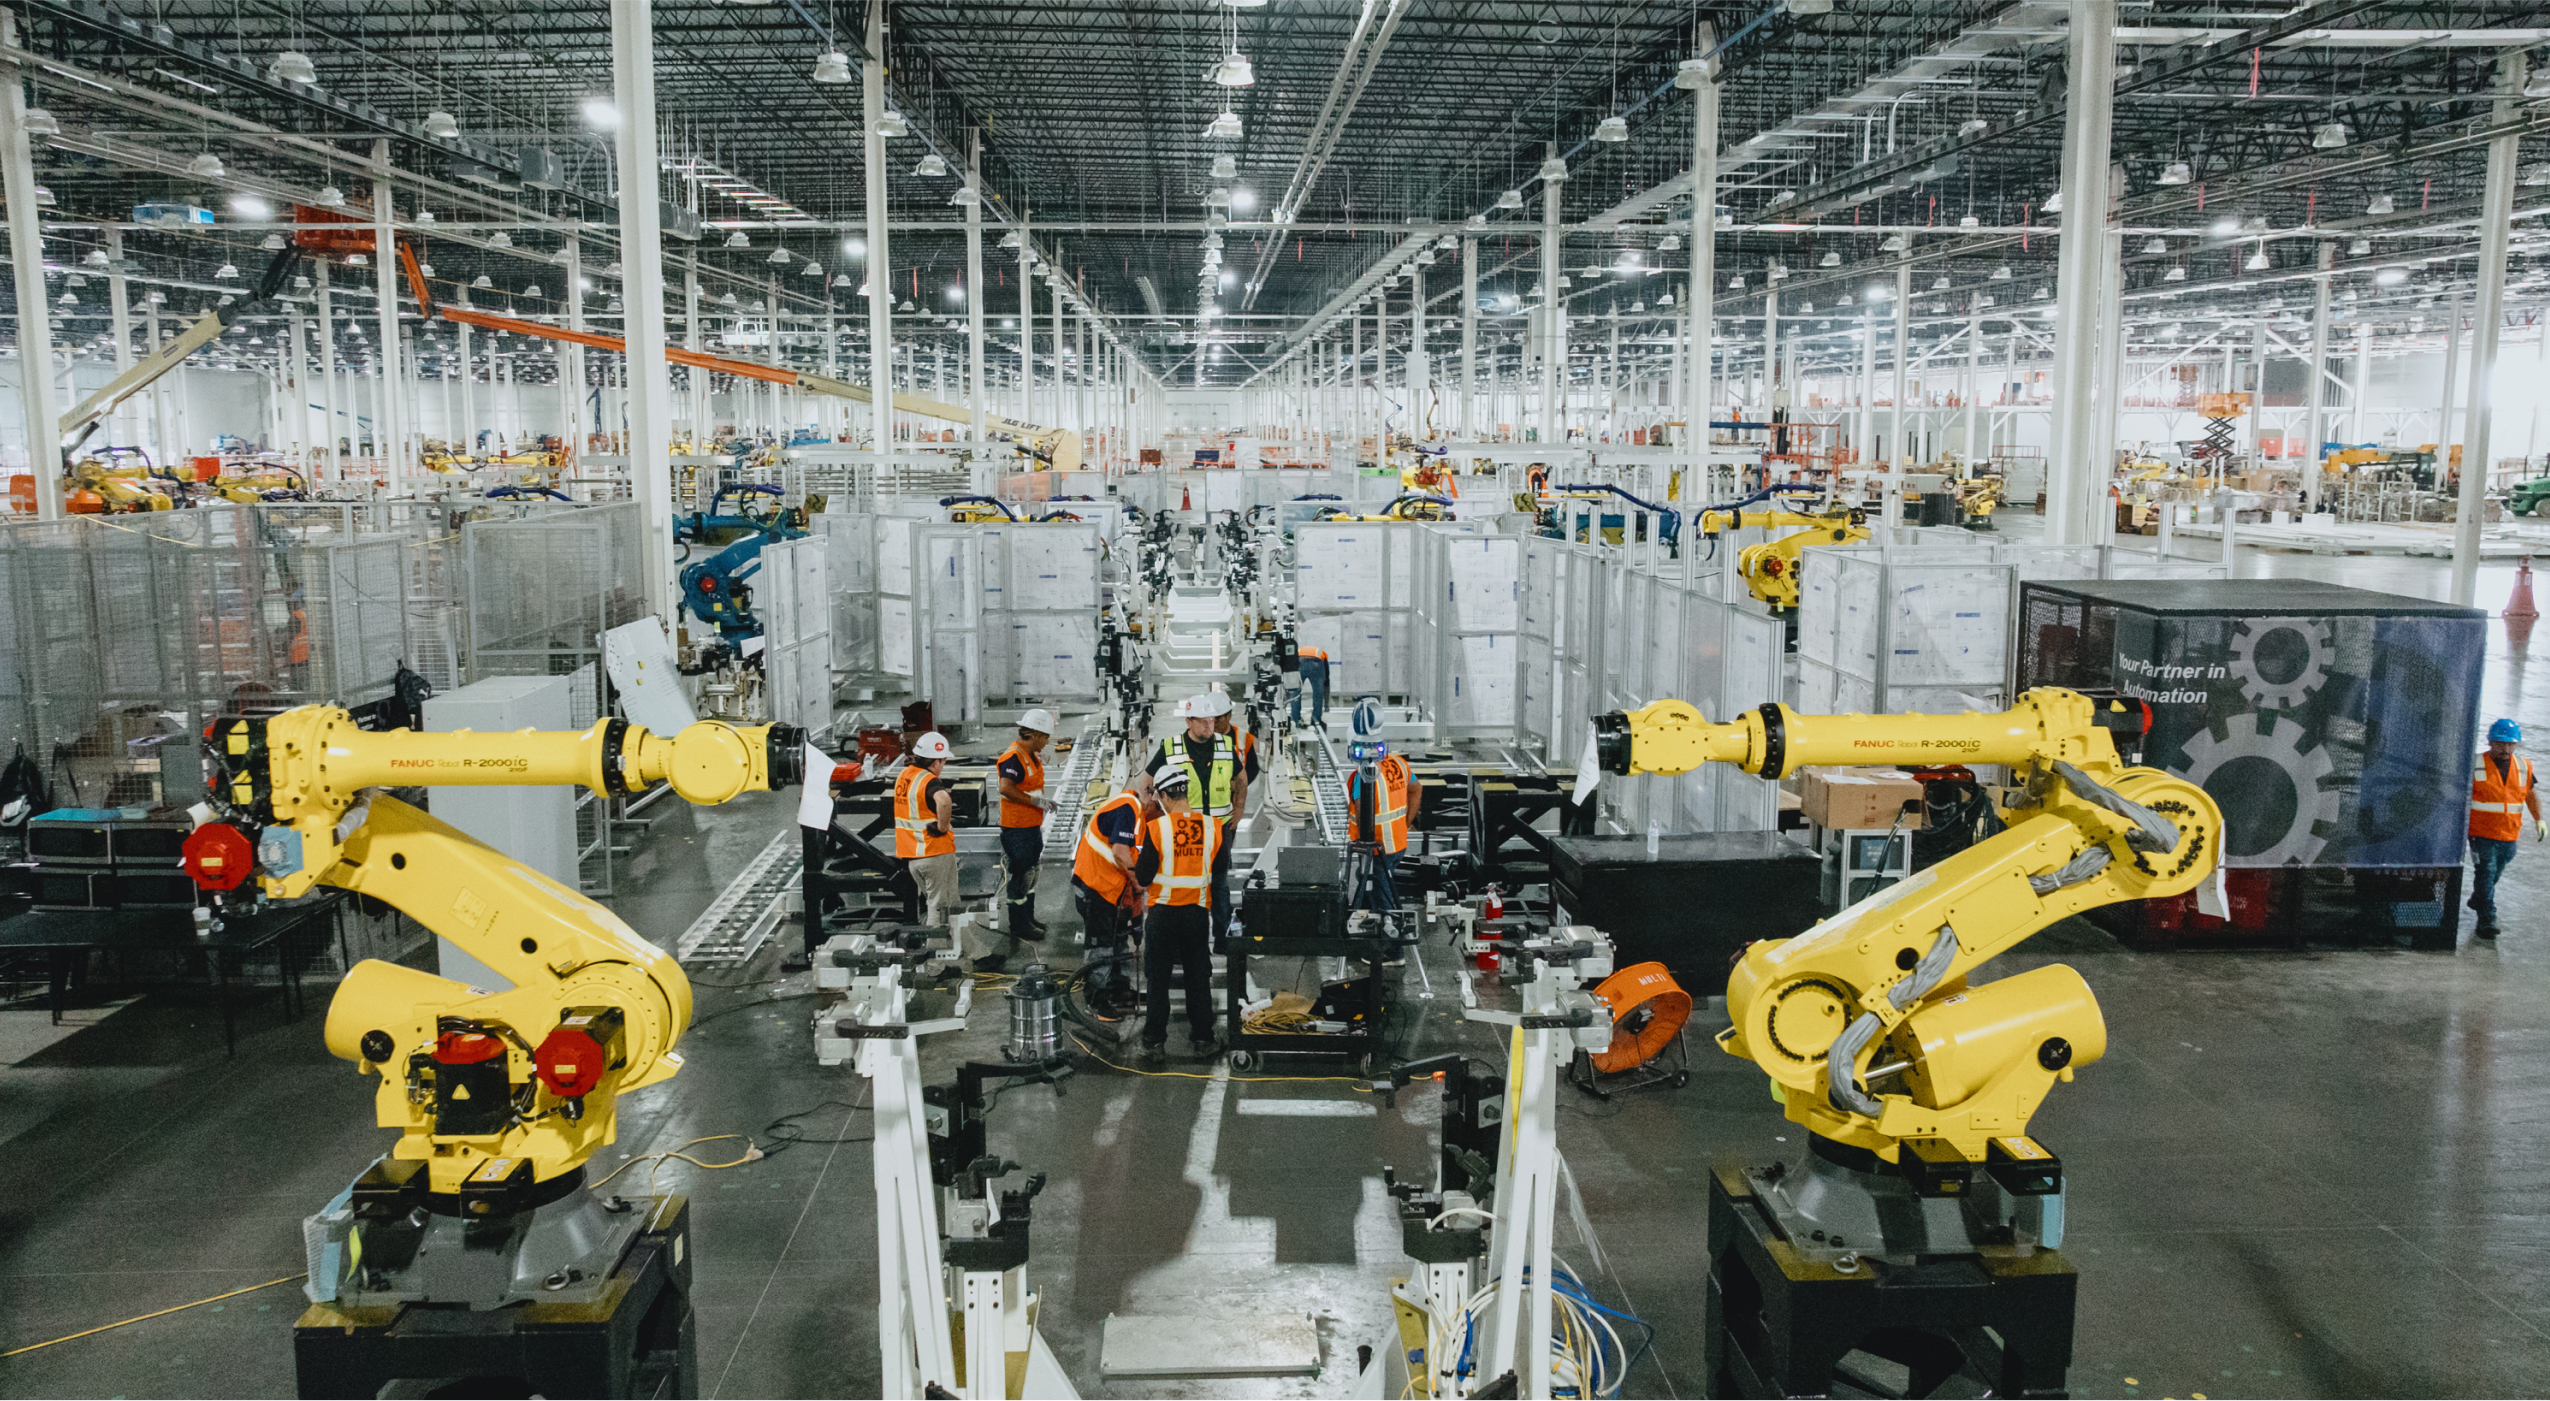
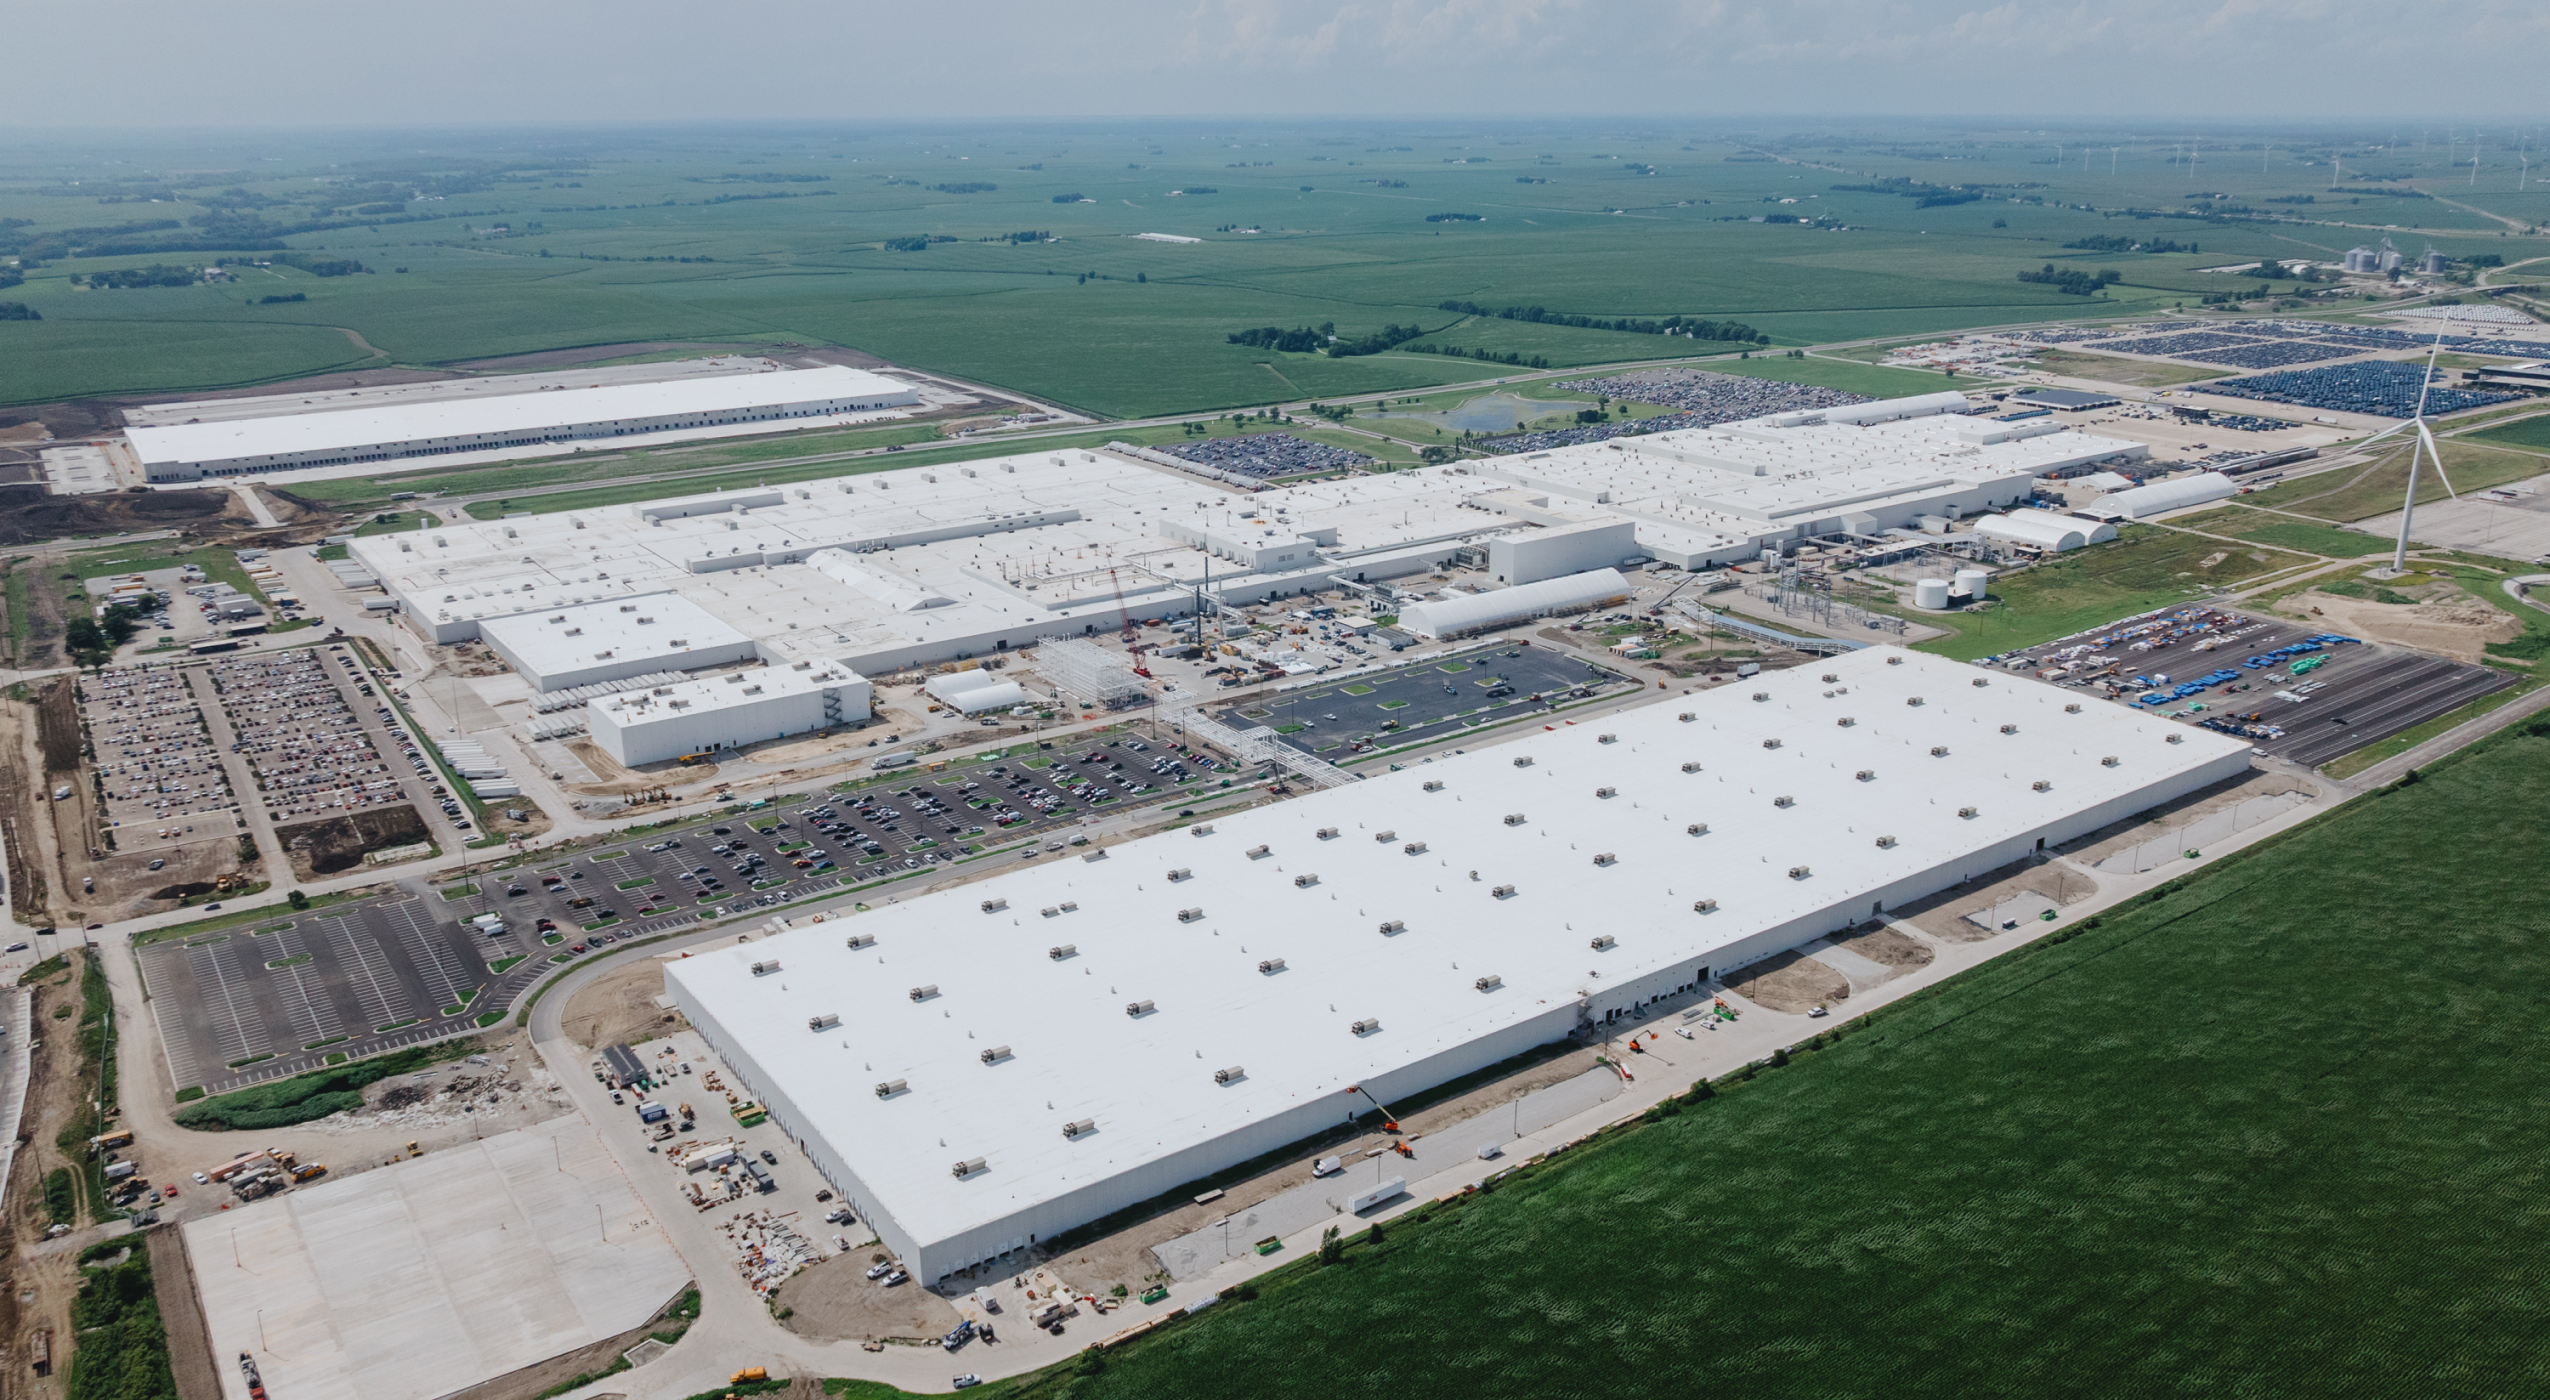
R2 Our excitement for R2 continues to grow as we approach the start of deliveries expected in the first half of 2026. We are currently in the midst of our R2 design validation builds, where we are building R2 vehicles on our pilot line. These builds enable us to validate the performance and capabilities of the full vehicle along with working with our suppliers on their ramp. Importantly, the quality of build, and associated software stability in these early validation vehicles is incredibly high. We strategically invested in development assets and mule vehicles which allowed us to advance development and supplier validation much earlier in the timeline as compared to R1. Many of the leaders helping assemble the vehicles in our pilot production line in California are the same leaders who will manage the production process in Normal, Illinois once we start saleable production expected in the first half of 2026. In preparation for our manufacturing validation builds later this year, we have substantially completed the construction of our new 1.1 million square foot building in Normal, Illinois which will house R2’s general assembly and body shop. Installation of production tooling equipment for component manufacturing is underway and we expect to commission the new R2 line in the third quarter of this year to start validating the equipment and production processes. | |||||
| Q2 2025 Shareholder Letter | © 2025 Rivian. All rights reserved. | 5 | ||||||||
 | |||||
Autonomy We have control over the software and hardware on our vehicles, and importantly have the ability to collect the exponentially growing amount of data from our best-in-class on board sensor set. This data collection and processing is ultimately what informs the training process of our core AI models. The Rivian Autonomy Platform is one of our most critical technology focus areas. This platform is designed around a data flywheel for training our Rivian Large Driving Model with an end-to-end approach. Our second generation R1 vehicles include an improved sensor set which offers high quality data from cameras and radars on the vehicles. Our autonomy features continue to improve. Most recently we upgraded our onboard machine learning model, which enables the 360º view to intelligently detect and render vehicles in complex scenarios like crossing traffic and parking lots. This advanced autonomy platform will also be available on R2. We believe high levels of autonomy that can truly offer customers enhanced safety and time back will drive purchase decisions at scale as it transforms the utility of their cars. To further our AI and autonomous driving ambitions, we are opening an office in London. Since the UK is rapidly becoming a leader in AI, establishing a presence there will allow us to tap into this valuable talent pool and complement the world class team we have built at Rivian. | |||||
| Q2 2025 Shareholder Letter | © 2025 Rivian. All rights reserved. | 6 | ||||||||
 | |||||
Software New features deployed via over the air updates continued to make dramatic improvements to our vehicles and customers' experience. Rivian and Google Maps have partnered to build a navigation experience that specifically supports Rivian’s vehicles. This partnership enhances the Rivian user experience through seamless integration offering our customers the best of both worlds. With over 100 million updates a day, Google Maps will provide industry-leading routing, estimated time of arrivals, real-time traffic updates about road disruptions, tappable points of interest, place information, and satellite imagery. In combination with our enhanced in-vehicle charging route planner, these updates improve navigation, trip planning, and charging experiences, empowering customers to confidently embark on their next adventure. In a recent OTA update, the suspension system was enhanced for a more comfortable low speed ride over rough terrain in certain drive modes. Our engineers have developed a smarter way to detect low speed bumps and jolts, using intelligent algorithms that can better analyze the data from sensors around the vehicle. This keeps the comfort valves open for a much wider range of low-speed situations, giving a significantly smoother ride. The in-vehicle energy experience has been completely reimagined. In addition to a brand new user interface, customers will better understand range, know when, how, and where to charge, and how to make the most of the vehicle's capabilities. Improvements to our charging and battery management software systems have enabled up to a 15% improvement in charging efficiency.3 | |||||
3 Based on Gen 2 large pack charging faster, adding 15% more driving range in 15 minutes of charging. Charging speeds vary based on battery capacity, state of charge, temperature, charger capacity, weather, site-specific conditions, and more. Stated speeds reflect tested conditions. | |||||
| Q2 2025 Shareholder Letter | © 2025 Rivian. All rights reserved. | 7 | ||||||||
 | |||||
Go-to-Market In the second quarter of 2025, our commercial strategy remained focused on strengthening demand through building brand awareness, deepening our customer engagement, and scaling our commercial infrastructure across the business in preparation for the planned launch of R2 in the first half of 2026. We have 31 spaces including 7 new spaces that opened since the start of the second quarter of 2025, complemented by 81 service locations with the majority providing both sales activities and demo drives. In the second quarter of 2025, we conducted over 26,000 demo drives. We plan to continue expanding our commercial footprint and expect to have over 35 spaces, and over 100 service locations by the end of 2025. The Rivian Adventure Network continues to scale, launching 10 additional sites in the second quarter, now with over 780 chargers across 123 sites in 37 states. Additionally, we upfit more than 40 sites to our latest generation chargers enabling over 65% of the network to be accessible to all electric vehicles. This widens our ability to provide reliable, quality charging to all, and to introduce more EV drivers to the Rivian brand. The Rivian Adventure Network also introduced off-peak pricing at many sites, offering drivers the flexibility to save at charging throughout the day. | |||||
| Q2 2025 Shareholder Letter | © 2025 Rivian. All rights reserved. | 8 | ||||||||
 | |||||
R1 Quad Launch In July, we launched and started deliveries of our second-generation Quad-Motor R1. Our new Quad-Motor system was designed to be the pinnacle variant of our R1 lineup with more power and capability, and more fun to drive than any of our previous R1 models. The Quad-Motor comes with a range of new software features including launch mode with launch cam, RAD Tuner, and a kick turn feature making it easier to steer in off-road conditions by controlling the power and tire grip, letting the vehicle spin about its center, even when it's moving. RAD Tuner allows customers to use intuitive sliders to adjust handling and performance settings with the ability to save drive modes for later. The feature allows the boundaries of the vehicle to be pushed through adjusting torque balance, roll stiffness, ride height, and more to transform the character of the vehicle. The Quad-Motor R1 is powered by our newest drive unit, featuring four in-house designed and manufactured motors, powering both the front and rear. The front motors are smaller, optimized for efficiency at cruising speeds. The rear motors are much larger, geared to maximize torque to the tires’ traction limit. Offering an EPA-estimated up to 374 miles of range (and up to 400 miles in Conserve mode), not only is the Quad-Motor R1 more powerful and capable than any of our previous R1 models, but it enables customers to go further on road trips. The vehicles feature a native NACS charge port. This allows customers easier access and even more convenient charging across North America. | |||||
| Q2 2025 Shareholder Letter | © 2025 Rivian. All rights reserved. | 9 | ||||||||
 | |||||
Production and Deliveries In the second quarter of 2025, we produced 5,979 and delivered 10,661 vehicles in our manufacturing facility in Normal, Illinois. Production during the second quarter for both our R1 products and commercial vans was limited due to a variety of supply chain related complexities partially driven by shifts in trade policy. In addition to the model year cutover, at the end of the second quarter, we took one week of downtime in the Normal Plant to complete the first phase of the paint shop upgrade in preparation for R2. Starting in September, we expect the production lines to be down for approximately three weeks as we increase the annual production capacity of the Normal Plant to approximately 215,000 units. We anticipate the third quarter to be our highest delivery quarter for the year across both our consumer and commercial vehicles. | |||||
| Q2 2025 Shareholder Letter | © 2025 Rivian. All rights reserved. | 10 | ||||||||
 | |||||
Strengthening Our Balance Sheet As of June 30th, 2025 we had $7,508 million of cash, cash equivalents and short-term investments on the balance sheet. Following our second quarter of gross profit in the first quarter of 2025, on June 30th we received a $1 billion equity investment from Volkswagen Group at an effective price of $19.42 which represents a 33% premium to the $14.56 30-trading day volume-weighted average stock price. The investment is part of the up to $5.8 billion agreement associated with the Rivian and Volkswagen Group technology joint venture. In addition, during the second quarter we refinanced our senior secured floating rate notes due October 2026 by issuing $1.25 billion of senior secured green notes at a fixed rate of 10% per annum, maturing January 15, 2031. In addition to the cash and cash equivalents and short-term investments reflected on our balance sheet, we expect to receive the following incremental funds: •Up to $2.5 billion of incremental capital associated with our joint venture transaction with Volkswagen Group4 ◦$1 billion equity expected in 2026 upon successful winter testing of certain Volkswagen Group vehicles ◦$1 billion loan expected in October 2026 at an interest rate equal to the yield of Volkswagen Group’s 7-year maturity debt securities in 2026 plus 0.25%. The loan will be repaid over a 10-year period but will not require principal repayment until 2029 ◦$460 million equity expected to be issued at the earlier of January 3, 2028 or start of the first production of a saleable Volkswagen Group vehicle using the joint venture’s technology •Up to $6.6 billion loan with the Department of Energy associated with the buildout of the Georgia facility5 | |||||
4 Receipt of the funds is subject to certain conditions and milestones, as discussed further in our Current Report on Form 8-K filed with the Securities and Exchange Commission (“SEC”) on November 11, 2024. 5 Receipt of the funds is subject to the satisfaction of certain borrowing conditions, as discussed further in our Current Report on Form 8-K filed with the SEC on January 16, 2025. | |||||
| Q2 2025 Shareholder Letter | © 2025 Rivian. All rights reserved. | 11 | ||||||||
 | |||||||||||
Business Outlook During the second quarter we made significant progress towards our development of R2, and advancements in AI. Due to our sourcing efforts and contracts we have in place, we are confident R2 will launch at an advantaged cost structure as compared to R1 and expect it to have a quick path to positive gross profit. Our guidance represents management’s current view on the evolving macro environment and policy impacts on our business. We are maintaining the range of our delivery guidance to 40,000 - 46,000. We anticipate the third quarter to be our peak delivery quarter of the year across both our consumer and commercial vehicles. Due to some of the recent changes associated with regulatory credits and our second quarter performance, we are increasing our guidance for adjusted EBITDA losses to ($2,000) million - ($2,250) million. We are reaffirming our capital expenditures guidance of $1,800 million - $1,900 million. | |||||||||||
| 2025 Guidance | Current Outlook | ||||||||||
Vehicles Delivered | 40,000 - 46,000 | ||||||||||
Adj. EBITDA | ($2,000) million - ($2,250) million | ||||||||||
Capital Expenditures | $1,800 million - $1,900 million | ||||||||||
| Q2 2025 Shareholder Letter | © 2025 Rivian. All rights reserved. | 12 | ||||||||

| Revenues | Automotive Total automotive revenues for the second quarter of 2025 were $927 million compared to $1,074 million in the same period in 2024. This decrease was primarily due to higher sales in the prior period associated with sales of first generation R1 vehicles ahead of the second generation introduction as well as commercial vans, partially offset by increased average selling prices. Software and Services Total software and services revenues for the second quarter of 2025 were $376 million compared to $84 million in the same period in 2024, primarily due to vehicle electrical architecture and software development services that were not performed during the prior period, an increase in remarketing sales, and increased vehicle repair and maintenance service. During the second quarter of 2025, we recognized revenue of approximately $182 million for the combined performance obligation of the joint venture. This revenue was recognized both from the ongoing payments to fund the joint venture's development services as well as from the $1,960 million of consideration that was received in conjunction with the closing of the joint venture. We expect the remainder of the consideration received at closing will be fully recognized as revenue over approximately the next three years. We expect the amount of revenue recognized each period will gradually increase over time as the joint venture ramps its operations and progresses toward completing its performance obligation. Consolidated Total consolidated revenues were $1,303 million for the second quarter of 2025, compared to $1,158 million in the same quarter in 2024. | ||||
| Q2 2025 Shareholder Letter | © 2025 Rivian. All rights reserved. | 13 | ||||||||
| Gross Profit | Automotive We generated negative automotive gross profit of $(335) million for the second quarter of 2025, compared to $(441) million for the same quarter in 2024. As a result of the lower production volumes in the second quarter of 2025, cost of revenues included an incremental approximately $137 million of fixed costs as compared to production at more normalized volumes, including $55 million of depreciation and amortization expense and $7 million of stock-based compensation expense. Software and Services We generated positive software and services gross profit of $129 million for the second quarter of 2025, compared to $(10) million for the same quarter in 2024. Consolidated We generated total negative consolidated gross profit of $(206) million for the second quarter of 2025, compared to $(451) million for the second quarter of 2024. | ||||
| Operating Expenses and Operating Loss | Total operating expenses in the second quarter of 2025 decreased to $908 million, compared to $924 million in the same period last year. In the second quarter of 2025, we recognized non-cash, stock-based compensation expense within operating expenses of $158 million as compared to $177 million in the second quarter of 2024 and depreciation and amortization expense within operating expenses of $69 million as compared to $71 million in the second quarter of 2024. Research and development (“R&D”) expense in the second quarter of 2025 was $410 million, compared to $428 million in the same period last year. The decrease was primarily due to decreases in payroll and related expenses and stock-based compensation expense, partially offset by higher engineering, design, and development costs primarily surrounding the R2 platform. The decrease in payroll and related expenses and stock-based compensation expense was primarily attributable to the cost of services provided to Volkswagen Group by the joint venture being recorded in cost of revenues during the second quarter of 2025. Selling, general, and administrative (“SG&A”) expenses of $498 million remained relatively unchanged in the second quarter of 2025, compared to $496 million in the same period last year. We experienced a loss from operations in the second quarter of 2025 totaling $(1,114) million, compared to $(1,375) million in the same period last year. | ||||
| Adjusted Operating Expenses (Non-GAAP)¹ | Adjusted R&D¹ for the second quarter of 2025 was $316 million, compared to $312 million for the same period last year. Adjusted SG&A¹ for the second quarter of 2025 was $365 million, compared to $364 million for the same period last year. Total adjusted operating expenses¹ for the second quarter of 2025 were $681 million, compared to $676 million for the same period last year. | ||||
| Net Loss | Our net loss for the second quarter of 2025 was $(1,115) million, compared to $(1,457) million for the same period last year. | ||||
| Adjusted EBITDA (Non-GAAP)¹ | Adjusted EBITDA¹ for the second quarter of 2025 was $(667) million, compared to $(857) million for the same period last year. | ||||
Adjusted Net Loss (Non-GAAP)1 | Adjusted net loss¹ for the second quarter of 2025 was $(920) million, compared to $(1,112) million for the same period last year. | ||||
| ¹A reconciliation of non-GAAP financial measures to the most comparable GAAP measure is provided later in this letter. | |||||
| Q2 2025 Shareholder Letter | © 2025 Rivian. All rights reserved. | 14 | ||||||||
| Net Cash Provided by (Used in) Operating Activities | Net cash provided by (used in) operating activities for the second quarter of 2025 was $64 million as compared to $(754) million for the same period last year. This change was primarily driven by a significant reduction in net loss for the period, as well as an increase in cash from changes in working capital, including a $250 million increase in deferred revenue from the premium associated with the equity investment by Volkswagen Group received on June 30th, 2025. | ||||
| Capital Expenditures | Capital expenditures for the second quarter of 2025 were $462 million, as compared to $283 million for the same period last year. The increase was primarily driven by the expansion of production capacity at our Normal, Illinois facility. | ||||
| Liquidity and Free Cash Flow (non-GAAP)¹ | We ended the second quarter of 2025 with $7,508 million in cash, cash equivalents, and short-term investments. Including the capacity under our asset-based revolving-credit facility, we ended the second quarter of 2025 with $8,519 million of total liquidity. We define free cash flow as net cash used in operating activities less capital expenditures. The cash provided by operating activities discussed above resulted in negative free cash flow¹ of $(398) million for the second quarter of 2025 as compared to $(1,037) million for the same period last year. | ||||
| Webcast | We will host an audio webcast to discuss our results and provide a business update at 2:00pm PT / 5:00pm ET on Tuesday, August 5, 2025. The link to the webcast will be made available on our Investor Relations website at rivian.com/investors. After the call, a replay will be available at rivian.com/investors for four weeks. | ||||
| ¹A reconciliation of non-GAAP financial measures to the most comparable GAAP measure is provided later in this letter. | |||||
| Q2 2025 Shareholder Letter | © 2025 Rivian. All rights reserved. | 15 | ||||||||
| Quarterly Financial Performance | ||||||||||||||
| (in millions, except production, delivery, and gross margin amounts) | ||||||||||||||
| (unaudited) | ||||||||||||||
| Three Months Ended | ||||||||||||||||||||||||||||||||
| June 30, 2024 | September 30, 2024 | December 31, 2024 | March 31, 2025 | June 30, 2025 | ||||||||||||||||||||||||||||
| Production | 9,612 | 13,157 | 12,727 | 14,611 | 5,979 | |||||||||||||||||||||||||||
| Delivery | 13,790 | 10,018 | 14,183 | 8,640 | 10,661 | |||||||||||||||||||||||||||
| Revenues | ||||||||||||||||||||||||||||||||
| Automotive | $ | 1,074 | $ | 776 | $ | 1,520 | $ | 922 | $ | 927 | ||||||||||||||||||||||
| Software and services | 84 | 98 | 214 | 318 | 376 | |||||||||||||||||||||||||||
Total revenues2 | $ | 1,158 | $ | 874 | $ | 1,734 | $ | 1,240 | $ | 1,303 | ||||||||||||||||||||||
| Cost of revenues | ||||||||||||||||||||||||||||||||
| Automotive | $ | 1,515 | $ | 1,155 | $ | 1,410 | $ | 830 | $ | 1,262 | ||||||||||||||||||||||
| Software and services | 94 | 111 | 154 | 204 | 247 | |||||||||||||||||||||||||||
Total cost of revenues2 | $ | 1,609 | $ | 1,266 | $ | 1,564 | $ | 1,034 | $ | 1,509 | ||||||||||||||||||||||
| Gross profit | $ | (451) | $ | (392) | $ | 170 | $ | 206 | $ | (206) | ||||||||||||||||||||||
| Gross margin | (39) | % | (45) | % | 10 | % | 17 | % | (16) | % | ||||||||||||||||||||||
| Research and development | $ | 428 | $ | 350 | $ | 374 | $ | 381 | $ | 410 | ||||||||||||||||||||||
| Selling, general, and administrative | 496 | 427 | 457 | 480 | 498 | |||||||||||||||||||||||||||
| Total operating expenses | $ | 924 | $ | 777 | $ | 831 | $ | 861 | $ | 908 | ||||||||||||||||||||||
| Adjusted research and development (non-GAAP)¹ | $ | 312 | $ | 271 | $ | 277 | $ | 285 | $ | 316 | ||||||||||||||||||||||
| Adjusted selling, general, and administrative (non-GAAP)¹ | 364 | 328 | 343 | 345 | 365 | |||||||||||||||||||||||||||
| Total adjusted operating expenses (non-GAAP)¹ | $ | 676 | $ | 599 | $ | 620 | $ | 630 | $ | 681 | ||||||||||||||||||||||
Adjusted EBITDA (non-GAAP)1,2 | $ | (857) | $ | (757) | $ | (277) | $ | (329) | $ | (667) | ||||||||||||||||||||||
Cash, cash equivalents, and short-term investments3 | $ | 7,867 | $ | 6,739 | $ | 7,700 | $ | 7,178 | $ | 7,508 | ||||||||||||||||||||||
| Net cash (used in) provided by operating activities | $ | (754) | $ | (876) | $ | 1,183 | $ | (188) | $ | 64 | ||||||||||||||||||||||
| Capital expenditures | (283) | (277) | (327) | (338) | (462) | |||||||||||||||||||||||||||
| Free cash flow (non-GAAP)¹ | $ | (1,037) | $ | (1,153) | $ | 856 | $ | (526) | $ | (398) | ||||||||||||||||||||||
| Depreciation and amortization expense | ||||||||||||||||||||||||||||||||
| Cost of revenues | $ | 203 | $ | 186 | $ | 145 | $ | 75 | $ | 185 | ||||||||||||||||||||||
| Research and development | 18 | 20 | 18 | 17 | 17 | |||||||||||||||||||||||||||
| Selling, general, and administrative | 53 | 53 | 55 | 55 | 52 | |||||||||||||||||||||||||||
| Total depreciation and amortization expense | $ | 274 | $ | 259 | $ | 218 | $ | 147 | $ | 254 | ||||||||||||||||||||||
| Stock-based compensation expense | ||||||||||||||||||||||||||||||||
| Cost of revenues | $ | 17 | $ | 6 | $ | 16 | $ | 24 | $ | 37 | ||||||||||||||||||||||
| Research and development | 98 | 59 | 79 | 79 | 77 | |||||||||||||||||||||||||||
| Selling, general, and administrative | 79 | 46 | 59 | 80 | 81 | |||||||||||||||||||||||||||
| Total stock-based compensation expense | $ | 194 | $ | 111 | $ | 154 | $ | 183 | $ | 195 | ||||||||||||||||||||||
| Inventory write-downs | ||||||||||||||||||||||||||||||||
Inventory LCNRV write-downs3 | $ | 148 | $ | 130 | $ | 66 | $ | 23 | $ | 48 | ||||||||||||||||||||||
Liabilities for losses on firm purchase commitments3 | 31 | 10 | 5 | — | — | |||||||||||||||||||||||||||
Total inventory write-downs and liabilities for losses on firm purchase commitments3 | $ | 179 | $ | 140 | $ | 71 | $ | 23 | $ | 48 | ||||||||||||||||||||||
¹ A reconciliation of non-GAAP financial measures to the most comparable GAAP measure is provided later in this letter. | ||||||||||||||||||||||||||||||||
2 The prior periods have been recast to conform to current period presentation. | ||||||||||||||||||||||||||||||||
3 Amount as of date shown. | ||||||||||||||||||||||||||||||||
| Q2 2025 Shareholder Letter | © 2025 Rivian. All rights reserved. | 16 | ||||||||
| Condensed Consolidated Balance Sheets | ||||||||||||||
| (in millions, except per share amounts) | ||||||||||||||
| (unaudited) | ||||||||||||||
| Assets | December 31, 2024 | June 30, 2025 | ||||||||||||
| Current assets: | ||||||||||||||
| Cash and cash equivalents | $ | 5,294 | $ | 4,812 | ||||||||||
| Short-term investments | 2,406 | 2,696 | ||||||||||||
| Accounts receivable, net | 443 | 254 | ||||||||||||
| Inventory | 2,248 | 2,103 | ||||||||||||
| Other current assets | 192 | 255 | ||||||||||||
| Total current assets | 10,583 | 10,120 | ||||||||||||
| Property, plant, and equipment, net | 3,965 | 4,421 | ||||||||||||
| Operating lease assets, net | 416 | 493 | ||||||||||||
| Other non-current assets | 446 | 563 | ||||||||||||
| Total assets | $ | 15,410 | $ | 15,597 | ||||||||||
| Liabilities and Stockholders’ Equity | ||||||||||||||
| Current liabilities: | ||||||||||||||
| Accounts payable | $ | 499 | $ | 489 | ||||||||||
| Accrued liabilities | 835 | 1,017 | ||||||||||||
| Current portion of deferred revenues, lease liabilities, and other liabilities | 917 | 1,437 | ||||||||||||
| Total current liabilities | 2,251 | 2,943 | ||||||||||||
| Long-term debt | 4,441 | 4,436 | ||||||||||||
| Non-current lease liabilities | 379 | 462 | ||||||||||||
| Other non-current liabilities | 1,777 | 1,677 | ||||||||||||
| Total liabilities | 8,848 | 9,518 | ||||||||||||
| Commitments and contingencies | ||||||||||||||
| Stockholders' equity: | ||||||||||||||
Preferred stock, $ 0.001 par value; 10 shares authorized and 0 shares issued and outstanding as of December 31, 2024 and June 30, 2025 | — | — | ||||||||||||
Common stock, $0.001 par value; 3,508 and 5,258 shares authorized and 1,131 and 1,214 shares issued and outstanding as of December 31, 2024 and June 30, 2025, respectively | 1 | 1 | ||||||||||||
| Additional paid-in capital | 29,866 | 31,028 | ||||||||||||
| Accumulated deficit | (23,305) | (24,967) | ||||||||||||
| Accumulated other comprehensive (loss) income | (4) | 6 | ||||||||||||
| Noncontrolling interest | 4 | 11 | ||||||||||||
| Total stockholders' equity | 6,562 | 6,079 | ||||||||||||
| Total liabilities and stockholders' equity | $ | 15,410 | $ | 15,597 | ||||||||||
| Q2 2025 Shareholder Letter | © 2025 Rivian. All rights reserved. | 17 | ||||||||
Condensed Consolidated Statements of Operations 1 | ||||||||||||||
| (in millions, except per share amounts) | ||||||||||||||
| (unaudited) | ||||||||||||||
| Three Months Ended June 30, | Six Months Ended June 30, | |||||||||||||||||||||||||
| 2024 | 2025 | 2024 | 2025 | |||||||||||||||||||||||
| Automotive | $ | 1,074 | $ | 927 | $ | 2,190 | $ | 1,849 | ||||||||||||||||||
| Software and services | 84 | 376 | 172 | 694 | ||||||||||||||||||||||
| Total revenues | 1,158 | 1,303 | 2,362 | 2,543 | ||||||||||||||||||||||
| Automotive | 1,515 | 1,262 | 3,128 | 2,092 | ||||||||||||||||||||||
| Software and services | 94 | 247 | 212 | 451 | ||||||||||||||||||||||
| Total cost of revenues | 1,609 | 1,509 | 3,340 | 2,543 | ||||||||||||||||||||||
| Gross profit | (451) | (206) | (978) | — | ||||||||||||||||||||||
| Operating expenses | ||||||||||||||||||||||||||
| Research and development | 428 | 410 | 889 | 791 | ||||||||||||||||||||||
| Selling, general, and administrative | 496 | 498 | 992 | 978 | ||||||||||||||||||||||
| Total operating expenses | 924 | 908 | 1,881 | 1,769 | ||||||||||||||||||||||
| Loss from operations | (1,375) | (1,114) | (2,859) | (1,769) | ||||||||||||||||||||||
| Interest income | 95 | 72 | 207 | 153 | ||||||||||||||||||||||
| Interest expense | (75) | (69) | (150) | (141) | ||||||||||||||||||||||
| Loss on convertible notes, net | (90) | — | (90) | — | ||||||||||||||||||||||
| Other (expense) income, net | (11) | (2) | (9) | 105 | ||||||||||||||||||||||
| Loss before income taxes | (1,456) | (1,113) | (2,901) | (1,652) | ||||||||||||||||||||||
| Provision for income taxes | (1) | (2) | (2) | (4) | ||||||||||||||||||||||
| Net loss | $ | (1,457) | $ | (1,115) | (2,903) | (1,656) | ||||||||||||||||||||
| Less: Net income attributable to noncontrolling interest | — | 2 | — | 6 | ||||||||||||||||||||||
| Net loss attributable to common stockholders | $ | (1,457) | $ | (1,117) | $ | (2,903) | $ | (1,662) | ||||||||||||||||||
| Net loss attributable to common stockholders, basic and diluted | $ | (1,457) | $ | (1,117) | $ | (2,903) | $ | (1,662) | ||||||||||||||||||
| Net loss per share attributable to Class A and Class B common stockholders, basic and diluted | $ | (1.46) | $ | (0.97) | $ | (2.93) | $ | (1.45) | ||||||||||||||||||
| Weighted-average common shares outstanding, basic and diluted | 1,001 | 1,155 | 990 | 1,146 | ||||||||||||||||||||||
1 The prior period has been recast to conform to current period presentation. | ||||||||||||||||||||||||||
| Q2 2025 Shareholder Letter | © 2025 Rivian. All rights reserved. | 18 | ||||||||
Condensed Consolidated Statements of Cash Flows 1 | ||||||||||||||
| (in millions) | ||||||||||||||
| (unaudited) | ||||||||||||||
| Six Months Ended June 30, | ||||||||||||||
| 2024 | 2025 | |||||||||||||
| Cash flows from operating activities: | ||||||||||||||
| Net loss | $ | (2,903) | $ | (1,656) | ||||||||||
| Depreciation and amortization | 554 | 396 | ||||||||||||
| Stock-based compensation expense | 427 | 377 | ||||||||||||
| Gain on equity method investment | — | (101) | ||||||||||||
| Loss on convertible notes, net | 90 | — | ||||||||||||
| Other non-cash activities | 108 | 40 | ||||||||||||
| Changes in operating assets and liabilities: | ||||||||||||||
| Accounts receivable, net | (88) | 189 | ||||||||||||
| Inventory | (125) | 108 | ||||||||||||
| Other assets | (63) | 38 | ||||||||||||
| Accounts payable and accrued liabilities | (257) | 120 | ||||||||||||
| Deferred revenues | 51 | 403 | ||||||||||||
| Other liabilities | 183 | (38) | ||||||||||||
| Net cash used in operating activities | (2,023) | (124) | ||||||||||||
| Cash flows from investing activities: | ||||||||||||||
| Purchases of equity securities and short-term investments | (2,229) | (1,942) | ||||||||||||
| Sales of short-term investments | — | 101 | ||||||||||||
| Maturities of short-term investments | 1,671 | 1,527 | ||||||||||||
| Capital expenditures | (537) | (800) | ||||||||||||
| Net cash used in investing activities | (1,095) | (1,114) | ||||||||||||
| Cash flows from financing activities: | ||||||||||||||
| Proceeds from stock-based compensation programs | 32 | 36 | ||||||||||||
| Proceeds from issuance of capital stock | — | 750 | ||||||||||||
| Proceeds from issuance of long-term debt | — | 1,250 | ||||||||||||
| Repayments of long-term debt | — | (1,250) | ||||||||||||
| Proceeds from issuance of convertible notes | 1,000 | — | ||||||||||||
| Other financing activities | (4) | (36) | ||||||||||||
| Net cash provided by financing activities | 1,028 | 750 | ||||||||||||
| Effect of exchange rate changes on cash and cash equivalents | (4) | 6 | ||||||||||||
| Net change in cash | (2,094) | (482) | ||||||||||||
| Cash, cash equivalents, and restricted cash—Beginning of period | 7,857 | 5,294 | ||||||||||||
| Cash, cash equivalents, and restricted cash—End of period | $ | 5,763 | $ | 4,812 | ||||||||||
| Supplemental disclosure of non-cash investing and financing activities: | ||||||||||||||
| Capital expenditures included in liabilities | $ | 365 | $ | 452 | ||||||||||
| Capital stock issued to settle bonuses | $ | 179 | $ | 47 | ||||||||||
| Right-of-use assets obtained in exchange for operating lease liabilities | $ | 87 | $ | 134 | ||||||||||
1 The prior period has been recast to conform to current period presentation. | ||||||||||||||
| Q2 2025 Shareholder Letter | © 2025 Rivian. All rights reserved. | 19 | ||||||||
| Depreciation and Amortization | ||||||||||||||
| (in millions) | ||||||||||||||
| (unaudited) | ||||||||||||||
| Three Months Ended June 30, | Six Months Ended June 30, | |||||||||||||||||||||||||
| 2024 | 2025 | 2024 | 2025 | |||||||||||||||||||||||
| Cost of revenues | $ | 203 | $ | 185 | $ | 413 | $ | 260 | ||||||||||||||||||
| Research and development | 18 | 17 | 36 | 34 | ||||||||||||||||||||||
| Selling, general, and administrative | 53 | 52 | 105 | 107 | ||||||||||||||||||||||
| Total depreciation and amortization expense | $ | 274 | $ | 254 | $ | 554 | $ | 401 | ||||||||||||||||||
| Stock-Based Compensation Expense | ||||||||||||||
| (in millions) | ||||||||||||||
| (unaudited) | ||||||||||||||
| Three Months Ended June 30, | Six Months Ended June 30, | |||||||||||||||||||||||||
| 2024 | 2025 | 2024 | 2025 | |||||||||||||||||||||||
| Cost of revenues | $ | 17 | $ | 37 | $ | 40 | $ | 61 | ||||||||||||||||||
| Research and development | 98 | 77 | 222 | 156 | ||||||||||||||||||||||
| Selling, general, and administrative | 79 | 81 | 165 | 161 | ||||||||||||||||||||||
| Total stock-based compensation expense | $ | 194 | $ | 195 | $ | 427 | $ | 378 | ||||||||||||||||||
| Q2 2025 Shareholder Letter | © 2025 Rivian. All rights reserved. | 20 | ||||||||
| Reconciliation of Non-GAAP | ||||||||||||||
| Financial Measures | ||||||||||||||
| (in millions) | ||||||||||||||
| (unaudited) | ||||||||||||||
| Adjusted Research and Development Expenses | Three Months Ended June 30, | Six Months Ended June 30, | ||||||||||||||||||||||||
| 2024 | 2025 | 2024 | 2025 | |||||||||||||||||||||||
| Total research and development expenses | $ | 428 | $ | 410 | $ | 889 | $ | 791 | ||||||||||||||||||
| R&D depreciation and amortization expenses | (18) | (17) | (36) | (34) | ||||||||||||||||||||||
| R&D stock-based compensation expenses | (98) | (77) | (222) | (156) | ||||||||||||||||||||||
| Adjusted research and development (non-GAAP) | $ | 312 | $ | 316 | $ | 631 | $ | 601 | ||||||||||||||||||
| Adjusted Selling, General, and Administrative Expenses | Three Months Ended June 30, | Six Months Ended June 30, | ||||||||||||||||||||||||
| 2024 | 2025 | 2024 | 2025 | |||||||||||||||||||||||
| Total selling, general, and administrative expenses | $ | 496 | $ | 498 | $ | 992 | $ | 978 | ||||||||||||||||||
| SG&A depreciation and amortization expenses | (53) | (52) | (105) | (107) | ||||||||||||||||||||||
| SG&A stock-based compensation expenses | (79) | (81) | (165) | (161) | ||||||||||||||||||||||
| Adjusted selling, general, and administrative (non-GAAP) | $ | 364 | $ | 365 | $ | 722 | $ | 710 | ||||||||||||||||||
| Adjusted Operating Expenses | Three Months Ended June 30, | Six Months Ended June 30, | ||||||||||||||||||||||||
| 2024 | 2025 | 2024 | 2025 | |||||||||||||||||||||||
| Total operating expenses | $ | 924 | $ | 908 | $ | 1,881 | $ | 1,769 | ||||||||||||||||||
| R&D depreciation and amortization expenses | (18) | (17) | (36) | (34) | ||||||||||||||||||||||
| R&D stock-based compensation expenses | (98) | (77) | (222) | (156) | ||||||||||||||||||||||
| SG&A depreciation and amortization expenses | (53) | (52) | (105) | (107) | ||||||||||||||||||||||
| SG&A stock-based compensation expenses | (79) | (81) | (165) | (161) | ||||||||||||||||||||||
| Total adjusted operating expenses (non-GAAP) | $ | 676 | $ | 681 | $ | 1,353 | $ | 1,311 | ||||||||||||||||||
| Q2 2025 Shareholder Letter | © 2025 Rivian. All rights reserved. | 21 | ||||||||
| Reconciliation of Non-GAAP | ||||||||||||||
| Financial Measures Continued | ||||||||||||||
| (in millions) | ||||||||||||||
| (unaudited) | ||||||||||||||
Adjusted EBITDA1 | Three Months Ended June 30, | Six Months Ended June 30, | ||||||||||||||||||||||||
| 2024 | 2025 | 2024 | 2025 | |||||||||||||||||||||||
| Net loss attributable to common stockholders | $ | (1,457) | $ | (1,117) | $ | (2,903) | $ | (1,662) | ||||||||||||||||||
| Interest income, net | (20) | (3) | (57) | (12) | ||||||||||||||||||||||
| Provision for income taxes | 1 | 2 | 2 | 4 | ||||||||||||||||||||||
| Depreciation and amortization | 274 | 254 | 554 | 401 | ||||||||||||||||||||||
| Stock-based compensation expense | 194 | 195 | 427 | 378 | ||||||||||||||||||||||
| Other expense (income), net | 11 | 2 | 9 | (105) | ||||||||||||||||||||||
| Loss on convertible notes, net | 90 | — | 90 | — | ||||||||||||||||||||||
| Cost of revenue efficiency initiatives | 29 | — | 156 | — | ||||||||||||||||||||||
| Restructuring expenses | — | — | 30 | — | ||||||||||||||||||||||
| Asset impairments and write-offs | 14 | — | 30 | — | ||||||||||||||||||||||
Joint venture formation expenses and other items2 | 7 | — | 7 | — | ||||||||||||||||||||||
| Adjusted EBITDA (non-GAAP) | $ | (857) | $ | (667) | $ | (1,655) | $ | (996) | ||||||||||||||||||
1 The prior periods have been recast to conform to current period presentation. | ||||||||||||||||||||||||||
2 Defined in Non-GAAP Financial Measures later in this letter. | ||||||||||||||||||||||||||
| Q2 2025 Shareholder Letter | © 2025 Rivian. All rights reserved. | 22 | ||||||||
| Reconciliation of Non-GAAP | ||||||||||||||
| Financial Measures Continued | ||||||||||||||
| (in millions, except per share amounts) | ||||||||||||||
| (unaudited) | ||||||||||||||
Adjusted Net Loss1 | Three Months Ended June 30, | Six Months Ended June 30, | ||||||||||||||||||||||||
| 2024 | 2025 | 2024 | 2025 | |||||||||||||||||||||||
| Net loss attributable to common stockholders, basic and diluted | $ | (1,457) | $ | (1,117) | $ | (2,903) | $ | (1,662) | ||||||||||||||||||
| Stock-based compensation expense | 194 | 195 | 427 | 378 | ||||||||||||||||||||||
| Other expense (income), net | 11 | 2 | 9 | (105) | ||||||||||||||||||||||
| Loss on convertible notes, net | 90 | — | 90 | — | ||||||||||||||||||||||
| Cost of revenue efficiency initiatives | 29 | — | 156 | — | ||||||||||||||||||||||
| Restructuring expenses | — | — | 30 | — | ||||||||||||||||||||||
| Asset impairments and write-offs | 14 | — | 30 | — | ||||||||||||||||||||||
| Joint venture formation expenses and other items | 7 | — | 7 | — | ||||||||||||||||||||||
| Adjusted net loss attributable to common stockholders, basic and diluted (non-GAAP) | $ | (1,112) | $ | (920) | $ | (2,154) | $ | (1,389) | ||||||||||||||||||
1 The prior period has been recast to conform to current period presentation. | ||||||||||||||||||||||||||
Adjusted Net Loss Per Share1 | Three Months Ended June 30, | Six Months Ended June 30, | ||||||||||||||||||||||||
| 2024 | 2025 | 2024 | 2025 | |||||||||||||||||||||||
| Net loss per share attributable to common stockholders, basic and diluted | $ | (1.46) | $ | (0.97) | $ | (2.93) | $ | (1.45) | ||||||||||||||||||
| Stock-based compensation expense per share | 0.19 | 0.17 | 0.43 | 0.33 | ||||||||||||||||||||||
| Other expense (income), net per share | 0.01 | — | 0.01 | (0.09) | ||||||||||||||||||||||
| Loss on convertible notes, net per share | 0.09 | — | 0.09 | — | ||||||||||||||||||||||
| Cost of revenue efficiency initiatives per share | 0.03 | — | 0.16 | — | ||||||||||||||||||||||
| Restructuring expenses per share | — | — | 0.03 | — | ||||||||||||||||||||||
| Asset impairments and write-offs per share | 0.01 | — | 0.03 | — | ||||||||||||||||||||||
| Joint venture formation expenses and other items per share | 0.01 | — | 0.01 | — | ||||||||||||||||||||||
| Adjusted net loss per share attributable to common stockholders, basic and diluted (non-GAAP) | $ | (1.12) | * | $ | (0.80) | $ | (2.17) | * | $ | (1.21) | ||||||||||||||||
| Weighted-average common shares outstanding, basic and diluted (GAAP) | 1,001 | 1,155 | 990 | 1,146 | ||||||||||||||||||||||
1 The prior period has been recast to conform to current period presentation. | ||||||||||||||||||||||||||
| *Does not calculate due to rounding. | ||||||||||||||||||||||||||
| Free Cash Flow | Three Months Ended June 30, | Six Months Ended June 30, | ||||||||||||||||||||||||
| 2024 | 2025 | 2024 | 2025 | |||||||||||||||||||||||
| Net cash (used in) provided by operating activities | $ | (754) | $ | 64 | $ | (2,023) | $ | (124) | ||||||||||||||||||
| Capital expenditures | (283) | (462) | (537) | (800) | ||||||||||||||||||||||
| Free cash flow (non-GAAP) | $ | (1,037) | $ | (398) | $ | (2,560) | $ | (924) | ||||||||||||||||||
| Q2 2025 Shareholder Letter | © 2025 Rivian. All rights reserved. | 23 | ||||||||
| Quarterly Financial Performance | ||||||||||||||
| Reconciliation of Non-GAAP | ||||||||||||||
| Financial Measures | ||||||||||||||
| (in millions) | ||||||||||||||
| (unaudited) | ||||||||||||||
| Three Months Ended | ||||||||||||||||||||||||||||||||
| June 30, 2024 | September 30, 2024 | December 31, 2024 | March 31, 2025 | June 30, 2025 | ||||||||||||||||||||||||||||
| Adjusted Research and Development Expenses | ||||||||||||||||||||||||||||||||
| Total research and development expenses | $ | 428 | $ | 350 | $ | 374 | $ | 381 | $ | 410 | ||||||||||||||||||||||
| R&D depreciation and amortization expenses | (18) | (20) | (18) | (17) | (17) | |||||||||||||||||||||||||||
| R&D stock-based compensation expenses | (98) | (59) | (79) | (79) | (77) | |||||||||||||||||||||||||||
| Adjusted research and development (non-GAAP) | $ | 312 | $ | 271 | $ | 277 | $ | 285 | $ | 316 | ||||||||||||||||||||||
| Adjusted Selling, General, and Administrative Expenses | ||||||||||||||||||||||||||||||||
| Total selling, general, and administrative expenses | $ | 496 | $ | 427 | $ | 457 | $ | 480 | $ | 498 | ||||||||||||||||||||||
| SG&A depreciation and amortization expenses | (53) | (53) | (55) | (55) | (52) | |||||||||||||||||||||||||||
| SG&A stock-based compensation expenses | (79) | (46) | (59) | (80) | (81) | |||||||||||||||||||||||||||
| Adjusted selling, general, and administrative (non-GAAP) | $ | 364 | $ | 328 | $ | 343 | $ | 345 | $ | 365 | ||||||||||||||||||||||
| Adjusted Operating Expenses | ||||||||||||||||||||||||||||||||
| Total operating expenses | $ | 924 | $ | 777 | $ | 831 | $ | 861 | $ | 908 | ||||||||||||||||||||||
| R&D depreciation and amortization expenses | (18) | (20) | (18) | (17) | (17) | |||||||||||||||||||||||||||
| R&D stock-based compensation expenses | (98) | (59) | (79) | (79) | (77) | |||||||||||||||||||||||||||
| SG&A depreciation and amortization expenses | (53) | (53) | (55) | (55) | (52) | |||||||||||||||||||||||||||
| SG&A stock-based compensation expenses | (79) | (46) | (59) | (80) | (81) | |||||||||||||||||||||||||||
| Total adjusted operating expenses (non-GAAP) | $ | 676 | $ | 599 | $ | 620 | $ | 630 | $ | 681 | ||||||||||||||||||||||
| Adjusted EBITDA | ||||||||||||||||||||||||||||||||
| Net loss attributable to common stockholders | $ | (1,457) | $ | (1,100) | $ | (744) | $ | (545) | $ | (1,117) | ||||||||||||||||||||||
| Interest income, net | (20) | (8) | (2) | (9) | (3) | |||||||||||||||||||||||||||
| Provision for income taxes | 1 | — | 3 | 2 | 2 | |||||||||||||||||||||||||||
| Depreciation and amortization | 274 | 259 | 218 | 147 | 254 | |||||||||||||||||||||||||||
| Stock-based compensation expense | 194 | 111 | 154 | 183 | 195 | |||||||||||||||||||||||||||
| Other expense (income), net | 11 | (1) | (1) | (107) | 2 | |||||||||||||||||||||||||||
| Loss (gain) on convertible notes, net | 90 | (60) | 82 | — | — | |||||||||||||||||||||||||||
| Cost of revenue efficiency initiatives | 29 | 37 | — | — | — | |||||||||||||||||||||||||||
| Restructuring expenses | — | — | — | — | — | |||||||||||||||||||||||||||
| Asset impairments and write-offs | 14 | — | — | — | — | |||||||||||||||||||||||||||
| Joint venture formation expenses and other items | 7 | 5 | 13 | — | — | |||||||||||||||||||||||||||
| Adjusted EBITDA (non-GAAP) | $ | (857) | $ | (757) | $ | (277) | $ | (329) | $ | (667) | ||||||||||||||||||||||
| Q2 2025 Shareholder Letter | © 2025 Rivian. All rights reserved. | 24 | ||||||||
| Quarterly Financial Performance | ||||||||||||||
| Reconciliation of Non-GAAP | ||||||||||||||
| Financial Measures Continued | ||||||||||||||
| (in millions, except per share amounts) | ||||||||||||||
| (unaudited) | ||||||||||||||
| Three Months Ended | ||||||||||||||||||||||||||||||||
| June 30, 2024 | September 30, 2024 | December 31, 2024 | March 31, 2025 | June 30, 2025 | ||||||||||||||||||||||||||||
Adjusted Net Loss1 | ||||||||||||||||||||||||||||||||
| Net loss attributable to common stockholders, basic and diluted | $ | (1,457) | $ | (1,100) | $ | (744) | $ | (545) | $ | (1,117) | ||||||||||||||||||||||
| Stock-based compensation expense | 194 | 111 | 154 | 183 | 195 | |||||||||||||||||||||||||||
| Other expense (income), net | 11 | (1) | (1) | (107) | 2 | |||||||||||||||||||||||||||
| Loss (gain) on convertible notes, net | 90 | (60) | 82 | — | — | |||||||||||||||||||||||||||
| Cost of revenue efficiency initiatives | 29 | 37 | — | — | — | |||||||||||||||||||||||||||
| Restructuring expenses | — | — | — | — | — | |||||||||||||||||||||||||||
| Asset impairments and write-offs | 14 | — | — | — | — | |||||||||||||||||||||||||||
| Joint venture formation expenses and other items | 7 | 5 | 13 | — | — | |||||||||||||||||||||||||||
| Adjusted net loss attributable to common stockholders, basic and diluted (non-GAAP) | $ | (1,112) | $ | (1,008) | $ | (496) | $ | (469) | $ | (920) | ||||||||||||||||||||||
1 The prior periods have been recast to conform to current period presentation. | ||||||||||||||||||||||||||||||||
Adjusted Net Loss Per Share1 | ||||||||||||||||||||||||||||||||
| Net loss per share attributable to common stockholders, basic and diluted | $ | (1.46) | $ | (1.08) | $ | (0.70) | $ | (0.48) | $ | (0.97) | ||||||||||||||||||||||
| Stock-based compensation expense per share | 0.19 | 0.11 | 0.15 | 0.16 | 0.17 | |||||||||||||||||||||||||||
| Other expense (income), net per share | 0.01 | — | — | (0.09) | — | |||||||||||||||||||||||||||
| Loss (gain) on convertible notes, net per share | 0.09 | (0.06) | 0.08 | — | — | |||||||||||||||||||||||||||
| Cost of revenue efficiency initiatives per share | 0.03 | 0.04 | — | — | — | |||||||||||||||||||||||||||
| Restructuring expenses per share | — | — | — | — | — | |||||||||||||||||||||||||||
| Asset impairments and write-offs per share | 0.01 | — | — | — | — | |||||||||||||||||||||||||||
| Joint venture formation expenses and other items per share | 0.01 | — | 0.01 | — | — | |||||||||||||||||||||||||||
| Adjusted net loss per share attributable to common stockholders, basic and diluted (non-GAAP) | $ | (1.12) | * | $ | (0.99) | $ | (0.46) | * | $ | (0.41) | $ | (0.80) | ||||||||||||||||||||
| Weighted-average common shares outstanding, basic and diluted (GAAP) | 1,001 | 1,014 | 1,058 | 1,137 | 1,155 | |||||||||||||||||||||||||||
1 The prior periods have been recast to conform to current period presentation. | ||||||||||||||||||||||||||||||||
| *Does not calculate due to rounding. | ||||||||||||||||||||||||||||||||
| Free Cash Flow | ||||||||||||||||||||||||||||||||
| Net cash (used in) provided by operating activities | $ | (754) | $ | (876) | $ | 1,183 | $ | (188) | $ | 64 | ||||||||||||||||||||||
| Capital expenditures | (283) | (277) | (327) | (338) | (462) | |||||||||||||||||||||||||||
| Free cash flow (non-GAAP) | $ | (1,037) | $ | (1,153) | $ | 856 | $ | (526) | $ | (398) | ||||||||||||||||||||||
| Q2 2025 Shareholder Letter | © 2025 Rivian. All rights reserved. | 25 | ||||||||
| Forward-Looking Statements | This shareholder letter and statements that are made on our earnings call contain forward looking statements within the meaning of the Private Securities Litigation Reform Act of 1995. All statements contained in this shareholder letter and made on our earnings call that do not relate to matters of historical fact should be considered forward-looking statements, including without limitation statements regarding our future operations, initiatives and business strategy, including our future financial results, vehicle profitability and future gross profits, our future capital expenditures, the underlying trends in our business (including customer preferences and expectation), global economic conditions, including evolving trade regulation, policies and tariffs and the resulting impact on our global supply chain and material costs and access, including changes to the availability of government and economic incentives, including tax credits, for electric vehicles, our market opportunity, and our potential for growth, our production ramp and manufacturing capacity expansion and anticipated production levels, our expected future production and deliveries, scaling our service infrastructure, our expected future products and technology and product enhancements including enhanced performance and safety features, and pricing (including the launches of R2 and R3), potential expansion of commercial van sales, future revenue opportunities, including with respect to the emerging autonomous driving market, our joint venture with Volkswagen Group, including the expected benefits from the partnership and future Volkswagen Group investments, expected benefits from partnerships with other third parties, including our partnership with Google Maps, and other expected incremental available capital pursuant to agreements with Volkswagen Group and the U.S. Department of Energy. These statements are neither promises nor guarantees and involve known and unknown risks, uncertainties, and other important factors that may cause our actual results, performance, or achievements to be materially different from any future results, performance, or achievements expressed or implied by the forward-looking statements, including, but not limited to: our history of losses as a growth-stage company and our limited operating history; we may underestimate or not effectively manage our capital expenditures and costs; that we will require additional financing and capital to support our business; our ability to maintain strong demand for our vehicles and attract and retain a large number of consumers; our ability to grow sales of our commercial vehicles, risks relating to the highly competitive automotive market, including competitors that may take steps to compete more effectively against us; consumers’ willingness to adopt electric vehicles; risks associated with our joint venture with Volkswagen Group, risks associated with additional strategic alliances or acquisitions, that we may experience significant delays in the manufacture and delivery of our vehicles; that our long-term results depend on our ability to successfully introduce and market new products and services; that we have experienced and could continue to experience cost increases or disruptions in supply of raw materials or other components used in our vehicles; our dependence on suppliers and volatility in pricing of components and raw materials; our ability to accurately estimate the supply and demand for our vehicles and predict our manufacturing requirements; our ability to scale our business and manage future growth effectively; our ability to maintain our relationship with one customer that has generated a significant portion of our revenues; that we are highly dependent on the services and reputation of our Founder and Chief Executive Officer; our ability to offer attractive financing and leasing options; that we may not succeed in maintaining and strengthening our brand; that our focus on delivering a high-quality and engaging Rivian experience may not maximize short-term financial results; risks relating to our distribution model; that we rely on complex machinery, and production involves a significant degree of risk and uncertainty; that our operations, IT systems and vehicles rely on highly technical software and hardware that could contain errors or defects; that we may not successfully develop the complex software and technology systems in coordination with the Volkswagen Group joint venture and our other vendors needed to produce our vehicles; inadequate access to charging stations and not being able to realize the benefits of our charging networks; risks related to our use of lithium-ion battery cells; that we have limited experience servicing and repairing our vehicles; that the automotive industry is rapidly evolving and may be subject to unforeseen changes; risks associated with advanced driver assistance systems technology; the unavailability, reduction or elimination of government and economic incentives and credits for electric vehicles; that we may not be able to obtain the government grants, loans, and other incentives, including regulatory credits, for which we apply or on which we rely; that vehicle retail sales depend heavily on affordable interest rates and availability of credit; insufficient warranty reserves to cover warranty claims; that future field actions, including product recalls, could harm our business; risks related to product liability claims; risks associated with international operations; our ability to attract and retain key employees and qualified personnel; our ability to maintain our culture; that our business may be adversely affected by labor and union activities; that our financial results may vary significantly from period to period; that we have incurred a significant amount of debt and expect to incur significant additional | ||||
| Q2 2025 Shareholder Letter | © 2025 Rivian. All rights reserved. | 26 | ||||||||
| Forward-Looking Statements | indebtedness; risks related to third-party vendors for certain product and service offerings; potential conflicts of interest involving our principal stockholders or their affiliates; risks associated with exchange rate and interest rate fluctuations; that breaches in data security, failure of technology systems, cyber-attacks or other security or privacy-related incidents could harm our business; risks related to our use of artificial intelligence technologies; risk of intellectual property infringement claims; that our use of open source software in our applications could subject our proprietary software to general release; our ability to prevent unauthorized use of our intellectual property; risks related to governmental regulation and legal proceedings; effect of trade tariffs or other trade barriers; effects of export and import control laws; delays, limitations and risks related to permits and approvals required to operate or expand operations; our internal control over financial reporting; and the other factors described in our filings with the SEC. These factors could cause actual results to differ materially from those indicated by the forwardlooking statements made in this shareholder letter. Any such forward looking statements represent management’s estimates as of the date of this shareholder letter. While we may elect to update such forward-looking statements at some point in the future, except as may be required by law, we disclaim any obligation to do so, even if subsequent events cause our views to change. | ||||
| Q2 2025 Shareholder Letter | © 2025 Rivian. All rights reserved. | 27 | ||||||||
| Non-GAAP Financial Measures | In addition to our results determined in accordance with generally accepted accounting principles in the United States (“GAAP”), we review financial measures that are not calculated and presented in accordance with GAAP (“non-GAAP financial measures”). We believe our non-GAAP financial measures are useful in evaluating our operating and cash performance. We use the following non-GAAP financial information, collectively, to evaluate our ongoing operations and for internal planning and forecasting purposes. We believe that non-GAAP financial information, when taken collectively, may be helpful to investors, because it focuses on underlying operating results and trends, provides consistency and comparability with past financial performance, and assists in comparisons with other companies, some of which use similar non-GAAP financial information to supplement their GAAP results. The non-GAAP financial information is presented for supplemental informational purposes only, should not be considered a substitute for financial information presented in accordance with GAAP, and may be different from similarly titled non-GAAP measures used by other companies. A reconciliation of each historical non-GAAP financial measure to the most directly comparable financial measure stated in accordance with GAAP is provided above. Reconciliations of forward-looking non-GAAP financial measures are not provided because we are unable to provide such reconciliations without unreasonable effort due to the uncertainty regarding, and potential variability of, certain items, such as stock-based compensation expense and other costs and expenses that may be incurred in the future. Investors are encouraged to review the related GAAP financial measures and the reconciliation of these non-GAAP financial measures to their most directly comparable GAAP financial measures. | ||||
Our non-GAAP financial measures include adjusted research and development expenses, adjusted selling, general, and administrative expenses, total adjusted operating expenses, adjusted EBITDA, adjusted net loss, adjusted net loss per share, and free cash flow. Adjusted research and development expenses is defined as total research and development expenses, less R&D depreciation and amortization expenses and R&D stock-based compensation expenses. Adjusted selling, general, and administrative expenses is defined as total selling, general, and administrative expenses, less SG&A depreciation and amortization expenses and SG&A stock-based compensation expenses. Adjusted operating expenses is defined as total operating expenses, less R&D depreciation and amortization expenses, R&D stock-based compensation expenses, SG&A depreciation and amortization expenses, and SG&A stock-based compensation expenses. | |||||
| Adjusted EBITDA is defined as net loss before interest expense (income), net, provision for income taxes, depreciation and amortization, stock-based compensation, other expense (income), net, and special items. Our management team ordinarily excludes special items from its review of the results of the ongoing operations. Special items is comprised of (i) cost of revenue efficiency initiatives which include costs incurred as we transition between major vehicle programs, cost incurred for negotiations with major suppliers regarding changing demand forecasts or design modifications, and other costs for enhancing capital and cost optimization of the Company (ii) restructuring expenses for significant actions taken by the Company, (iii) significant asset impairments and write-offs, and (iv) other items that we do not necessarily consider to be indicative of earnings from ongoing operating activities, including loss (gain) on convertible note, net, and joint venture formation expenses. Adjusted net loss is defined as net loss before stock-based compensation expense, other (expense) income, and special items. Our management team ordinarily excludes special items from its review of the results of the ongoing operations. Special items is comprised of (i) cost of revenue efficiency initiatives which include costs incurred as we transition between major vehicle programs, cost incurred for negotiations with major suppliers regarding changing demand forecasts or design modifications, and other costs for enhancing capital and cost optimization of the Company (ii) restructuring expenses for significant actions taken by the Company, (iii) significant asset impairments and write-offs, and (iv) other items that we do not necessarily consider to be indicative of earnings from ongoing operating activities, including loss (gain) on convertible note, net, and joint venture formation expenses. Adjusted net loss per share is defined as adjusted net loss divided by the weighted-average common shares outstanding. Free cash flow is defined as net cash used in operating activities less capital expenditures. | |||||
| Q2 2025 Shareholder Letter | © 2025 Rivian. All rights reserved. | 28 | ||||||||