 | Q4 2025 Shareholder Letter | © 2026 Rivian. All rights reserved. 2 | ||||||
 | |||||
2025 was a year of focused execution at Rivian as we laid the foundations for scaling our business. Our team progressed the development of our technology roadmap and R2, our mass-market midsized SUV, while simultaneously driving continued improvement in our customer experience and our path to profitability. While we continue to face near-term uncertainty from macroeconomic and policy developments, we remain focused on our long-term growth strategy which we believe will deliver significant shareholder value creation over time. As an American automotive technology company that develops and manufactures category-defining adventurous vehicles, we believe that the future of the automotive industry will be fully electric, autonomous and AI-defined. As we prepare for the first expected customer deliveries of R2 in the second quarter of 2026, we could not be more excited about the opportunity ahead for Rivian. In December, we hosted our first AI and Autonomy Day showcasing Rivian’s technology innovation across our vertically integrated hardware, software and autonomy teams. Our third generation autonomy platform is expected to have one of the most powerful combinations of sensors and inference compute in a consumer vehicle in North America when launched in R2 in late 2026. At the core of this platform is the Rivian Autonomy Processor (RAP1) which is optimized to support multi-modal AI in the physical world. We also unveiled our AI-centric data flywheel approach to autonomous vehicle software development and announced Universal Hands-Free, a significant expansion of our assisted driving capabilities. Lastly, we announced Rivian Assistant, a next-generation voice interface using an in-house agentic AI framework. | |||||
| Q4 2025 Shareholder Letter | © 2026 Rivian. All rights reserved. 3 | ||||||
 | |||||
In mid-January, we marked another pivotal step with our first R2 manufacturing validation build (MVB) using production tools and processes at our plant in Normal, Illinois. R2 builds upon the industry-leading technology established in our flagship R1 vehicles while dramatically reducing manufacturing complexity and vehicle cost. With the average new vehicle purchase price in the United States at just over $50,000, and the most popular configuration being a 5-seat SUV or crossover, we believe R2 will be addressing an attractive market segment with a great daily driver that delivers on the adventurous spirit customers expect from Rivian. We believe our long-term competitive advantage remains our product and brand differentiation, our vertically integrated technology, and our direct to customer sales and service model. By controlling the entire ecosystem, from our zonal network architecture and custom autonomy computer, to the full vehicle software and autonomy stack, we ensure that every Rivian vehicle continues to improve over time for our customers. | |||||
| Q4 2025 Shareholder Letter | © 2026 Rivian. All rights reserved. 4 | ||||||
 | |||||
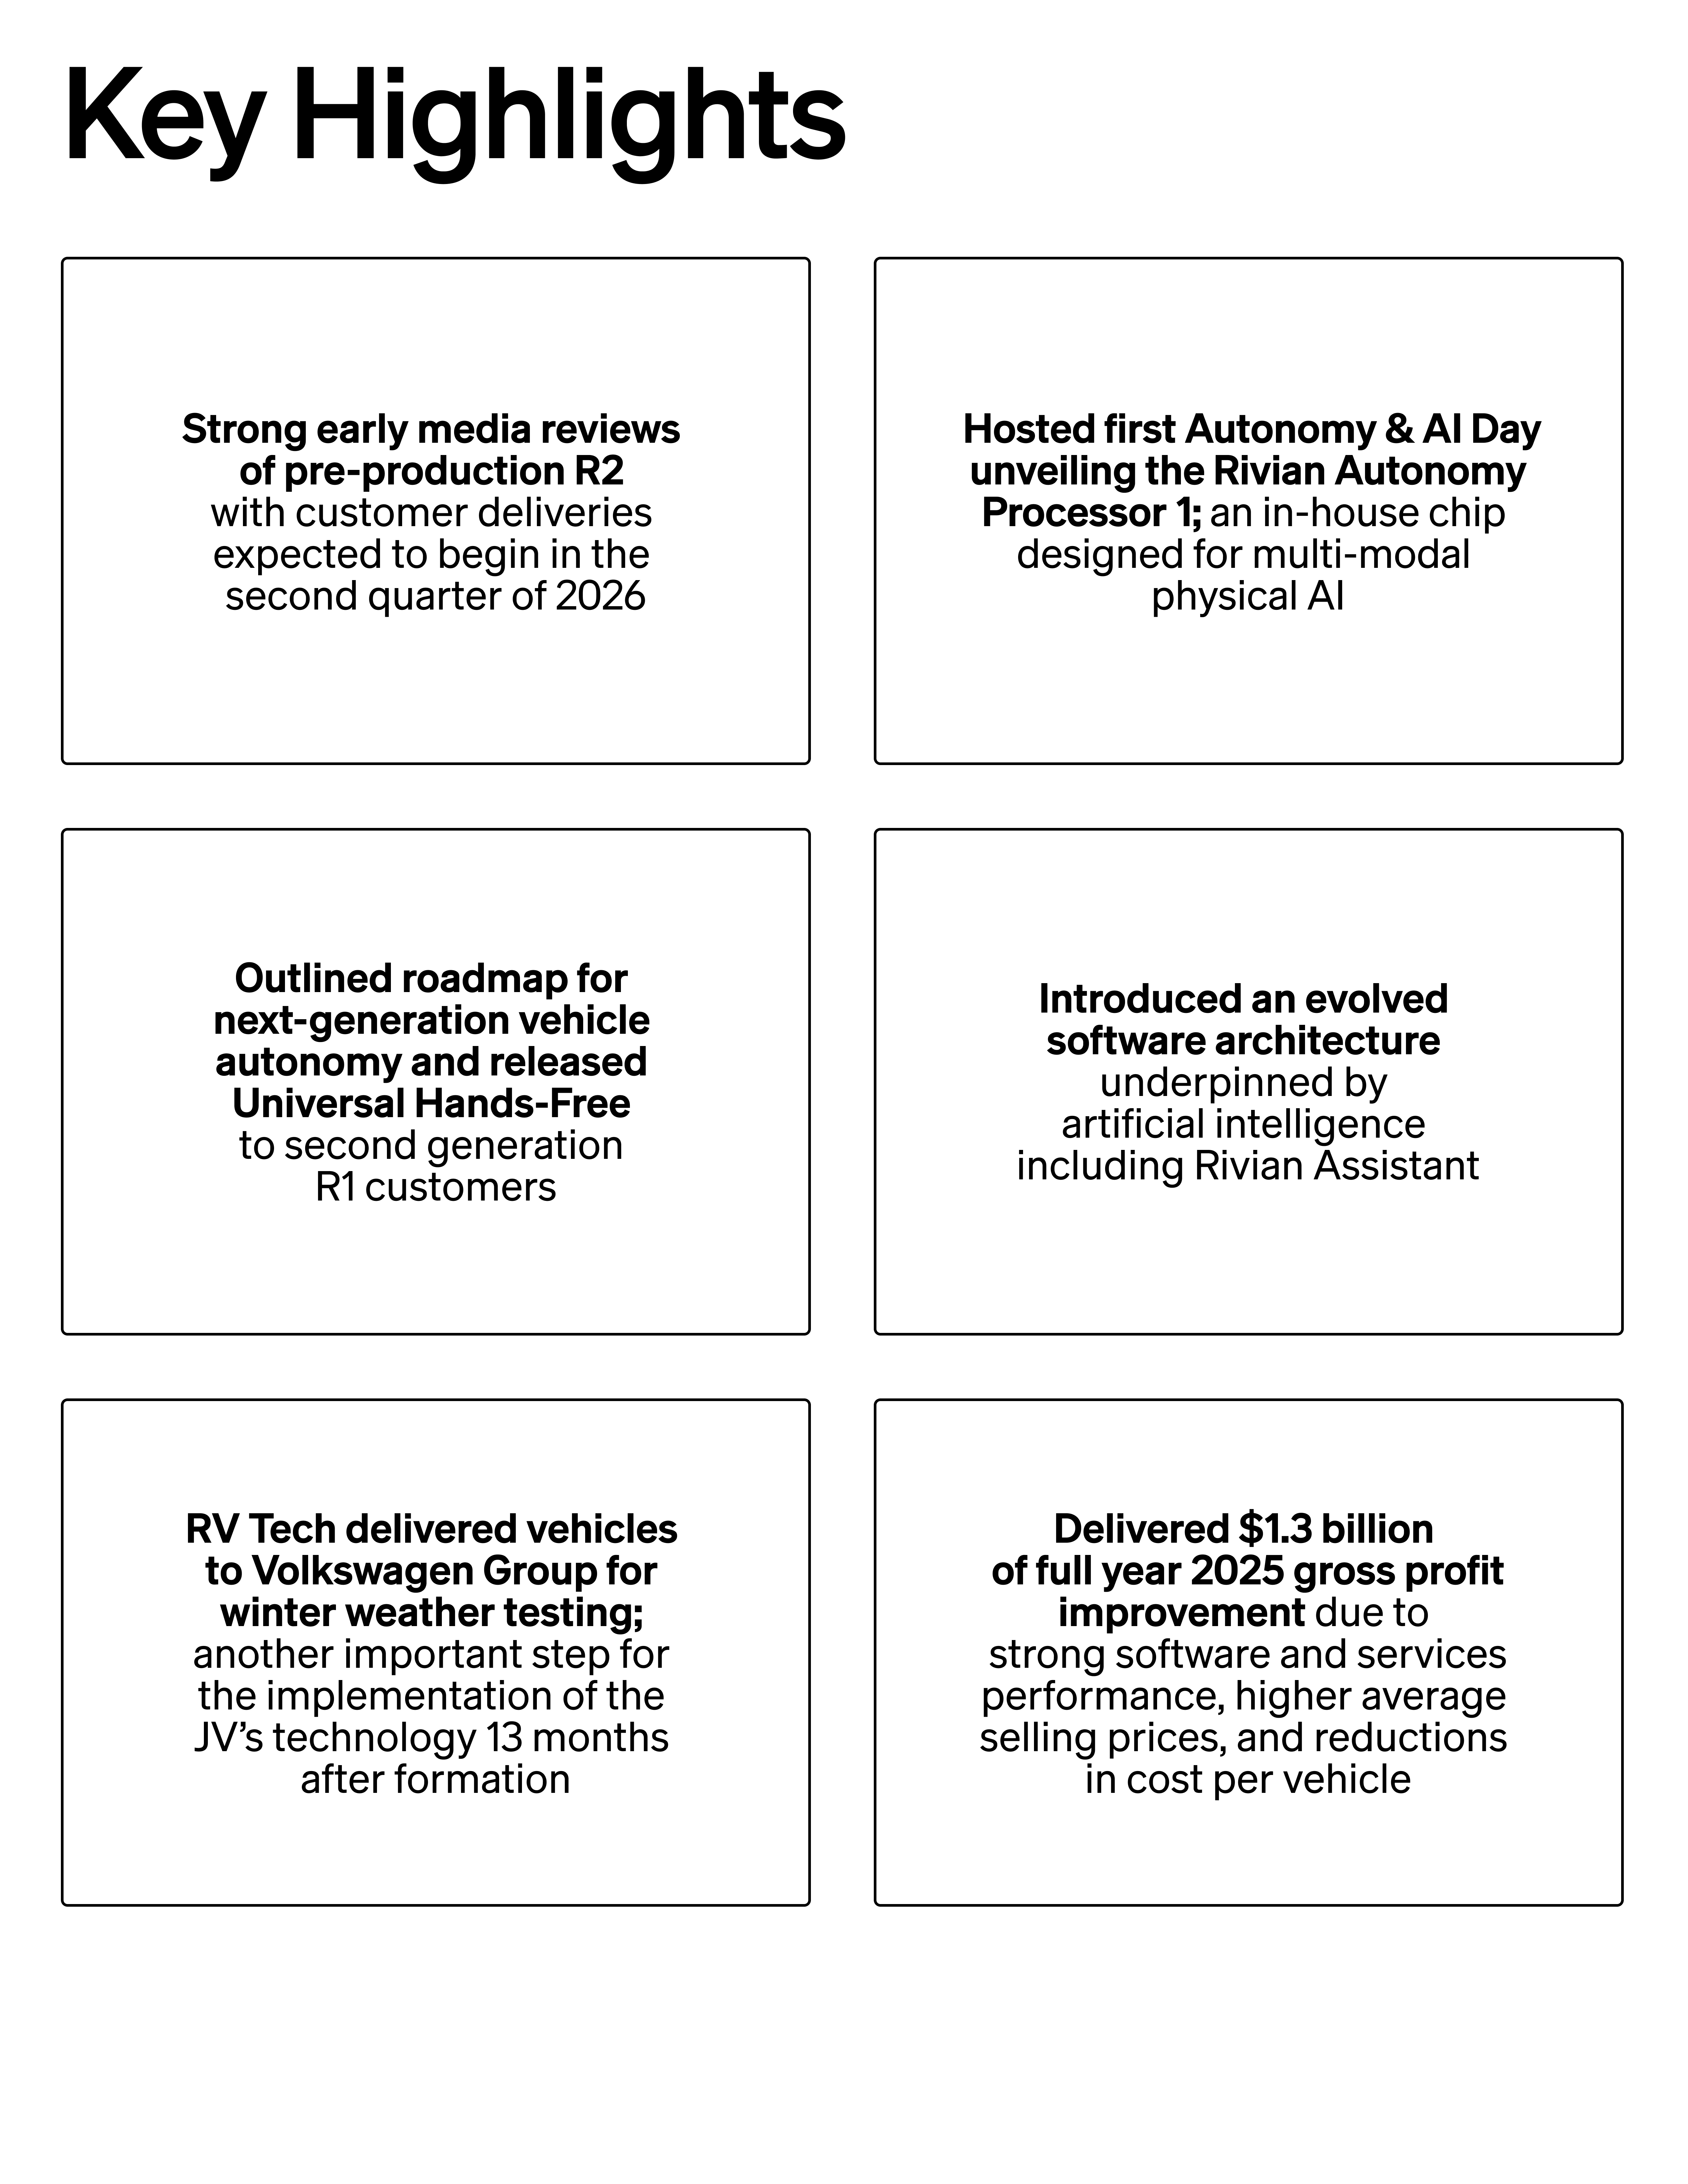
During the fourth quarter, we demonstrated significant progress against our key value drivers including: Technology Leadership •Announced Rivian’s third generation autonomy platform to be included in R2 in late 2026 –Multi-modal sensor suite includes 11 cameras (65 megapixels), 5 radars and 1 LiDAR –Rivian’s third generation autonomy computer includes two RAP1 chips capable of processing 5 billion pixels per second •Released Universal Hands-Free, expanding assisted driving capabilities to over 3.5 million miles across the US and Canada for the company’s second generation R1 vehicles •Announced Rivian Assistant, a next-generation voice interface using an in-house agentic AI framework expected to launch in early 2026 on all Rivian consumer vehicles Demand generation and enhancing customer experience •Ranked No.1 in Consumer Reports’ Owner Satisfaction ratings, with 85% of Rivian owners saying they would like to purchase the same vehicle again, 14 points better than the next brand1 •For the second year in a row, Rivian was awarded the MotorTrend Group’s Best Automaker App2 •Quad R1T won Top Gear’s US Truck of the Year3 Drive towards profitability •In the fourth quarter, delivered $120 million of consolidated gross profit, with $(59) million from the automotive segment and $179 million from the software and services segment Optimize operational efficiency •Over $7,200 improvement in automotive cost of goods sold per vehicle delivered in the fourth quarter of 2025 compared to the fourth quarter of 2024; driven by material cost reduction, operational efficiencies and product mix 1 https://www.consumerreports.org/cars/car-reliability-owner-satisfaction/most-and-least-liked-car-brands-a1291429338/ 2 https://www.motortrend.com/features/rivian-app-best-tech-2026 3 https://www.topgear.com/car-news/usa/here-are-your-winners-topgearcom-us-car-awards-2026 | |||||
| Q4 2025 Shareholder Letter | © 2026 Rivian. All rights reserved. 5 | ||||||
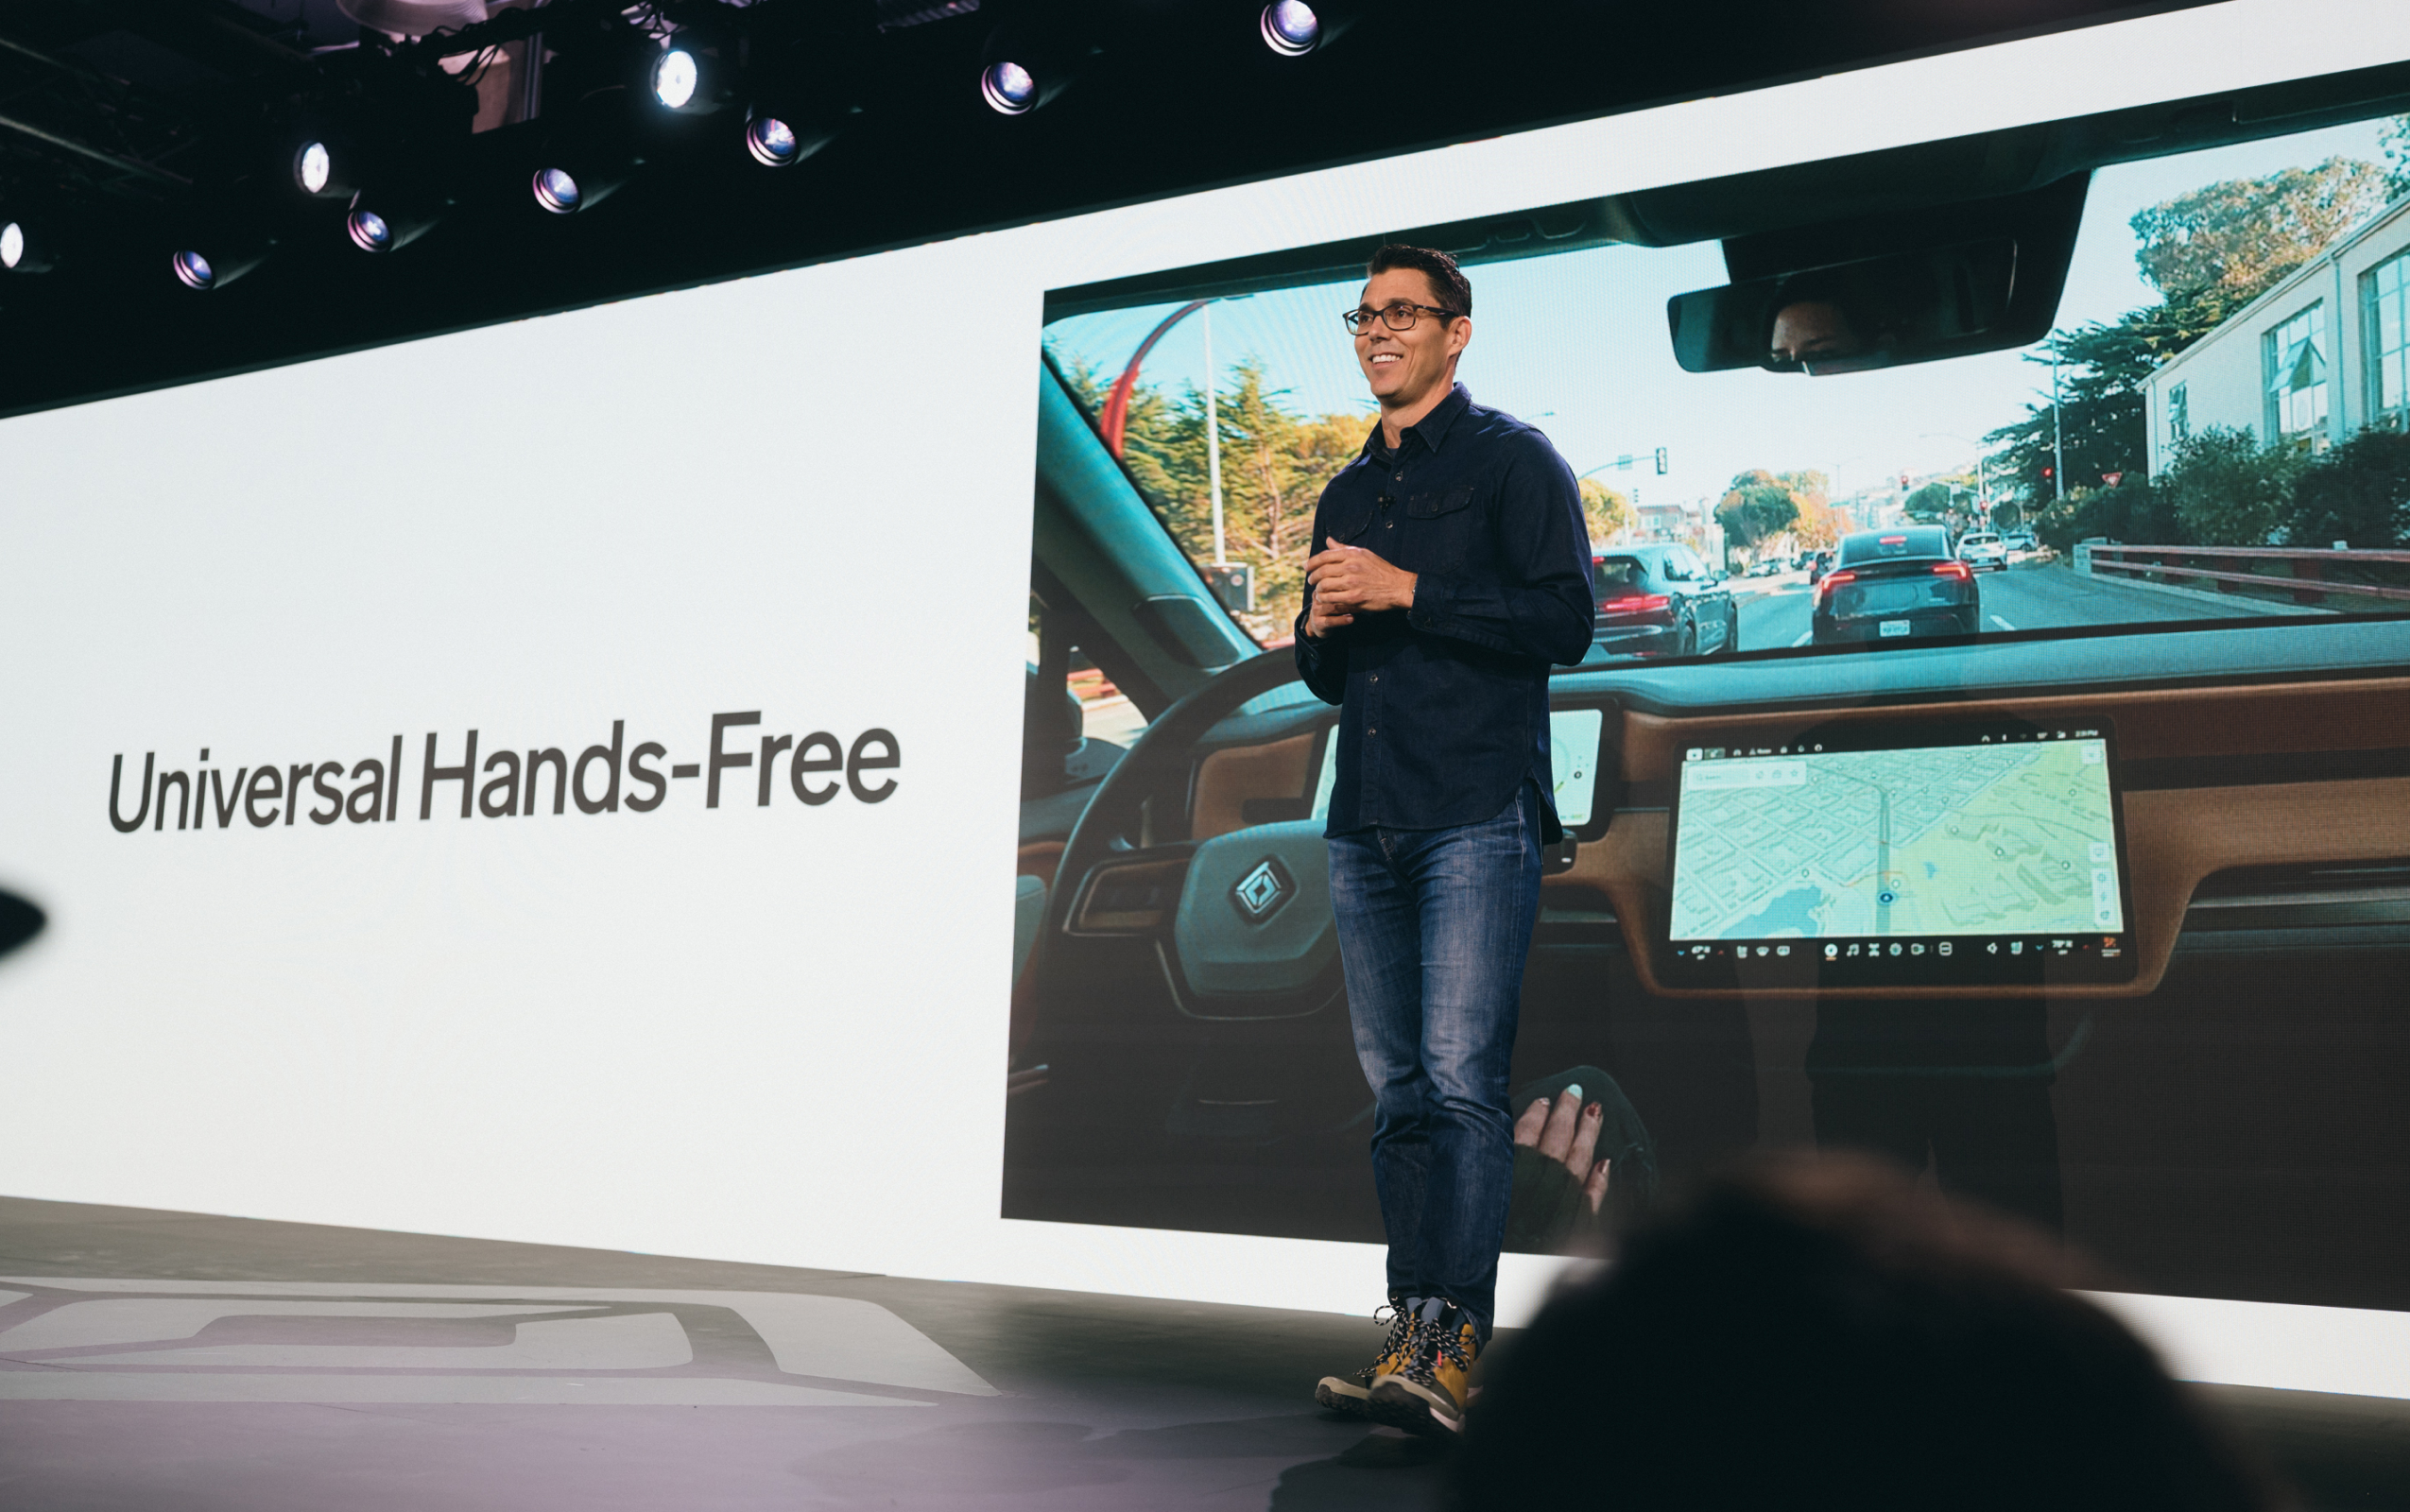 | |||||
Autonomy and AI In early 2022, Rivian began the process of a clean sheet design for our autonomy platform. We moved from a human-defined rules-based framework to a neural net based approach. The first embodiment of this work was our second generation R1 vehicles, which we launched in mid-2024. This updated platform began the process of building our data flywheel which enables our large driving model to be trained using the millions of miles driven by our second generation customers. Importantly, because the system is designed in-house, from the chip to the sensor suite and from the software to the data collection, we can move fast to deliver increasingly capable assisted driving and autonomy capabilities to further differentiate our vehicles from our competition. In December, we rolled out Universal Hands-Free, a feature that significantly expands our assisted driving capabilities to over 3.5 million miles across the US and Canada for the company’s second generation R1 vehicles. Provided lanes are marked, drivers can engage this feature on most roads. Since its release, customer utilization of our assisted driving features has surged with utilization doubling in the weeks post-launch. We believe this is just the beginning with many features, such as point-to-point navigation and beyond, on our roadmap as our data flywheel allows our assisted driving features to continually improve. Paid subscriptions for these advanced features, which we call Autonomy+, are priced at either a one-time fee of $2,500 or $49.99 per month. All second generation R1 owners will receive a 60 day trial of these features upon taking delivery. Owners who took delivery before February 3, 2026 will retain access to Autonomy+ features until April 4, 2026. At our recent Autonomy and AI Day, we introduced our third generation autonomy platform which will include a multi-modal sensor suite of cameras, radar and LiDAR. It also includes Rivian’s third generation autonomy computer with two RAP1 chips collectively capable of 1,600 Trillions of Operations per second (TOPS)4. We believe the perception stack and R2’s advanced computing capabilities with RAP1 will eventually enable Rivian to deliver autonomy features such as “eyes-off” and personal L4. 4 Sparse INT8 | |||||
| Q4 2025 Shareholder Letter | © 2026 Rivian. All rights reserved. 6 | ||||||
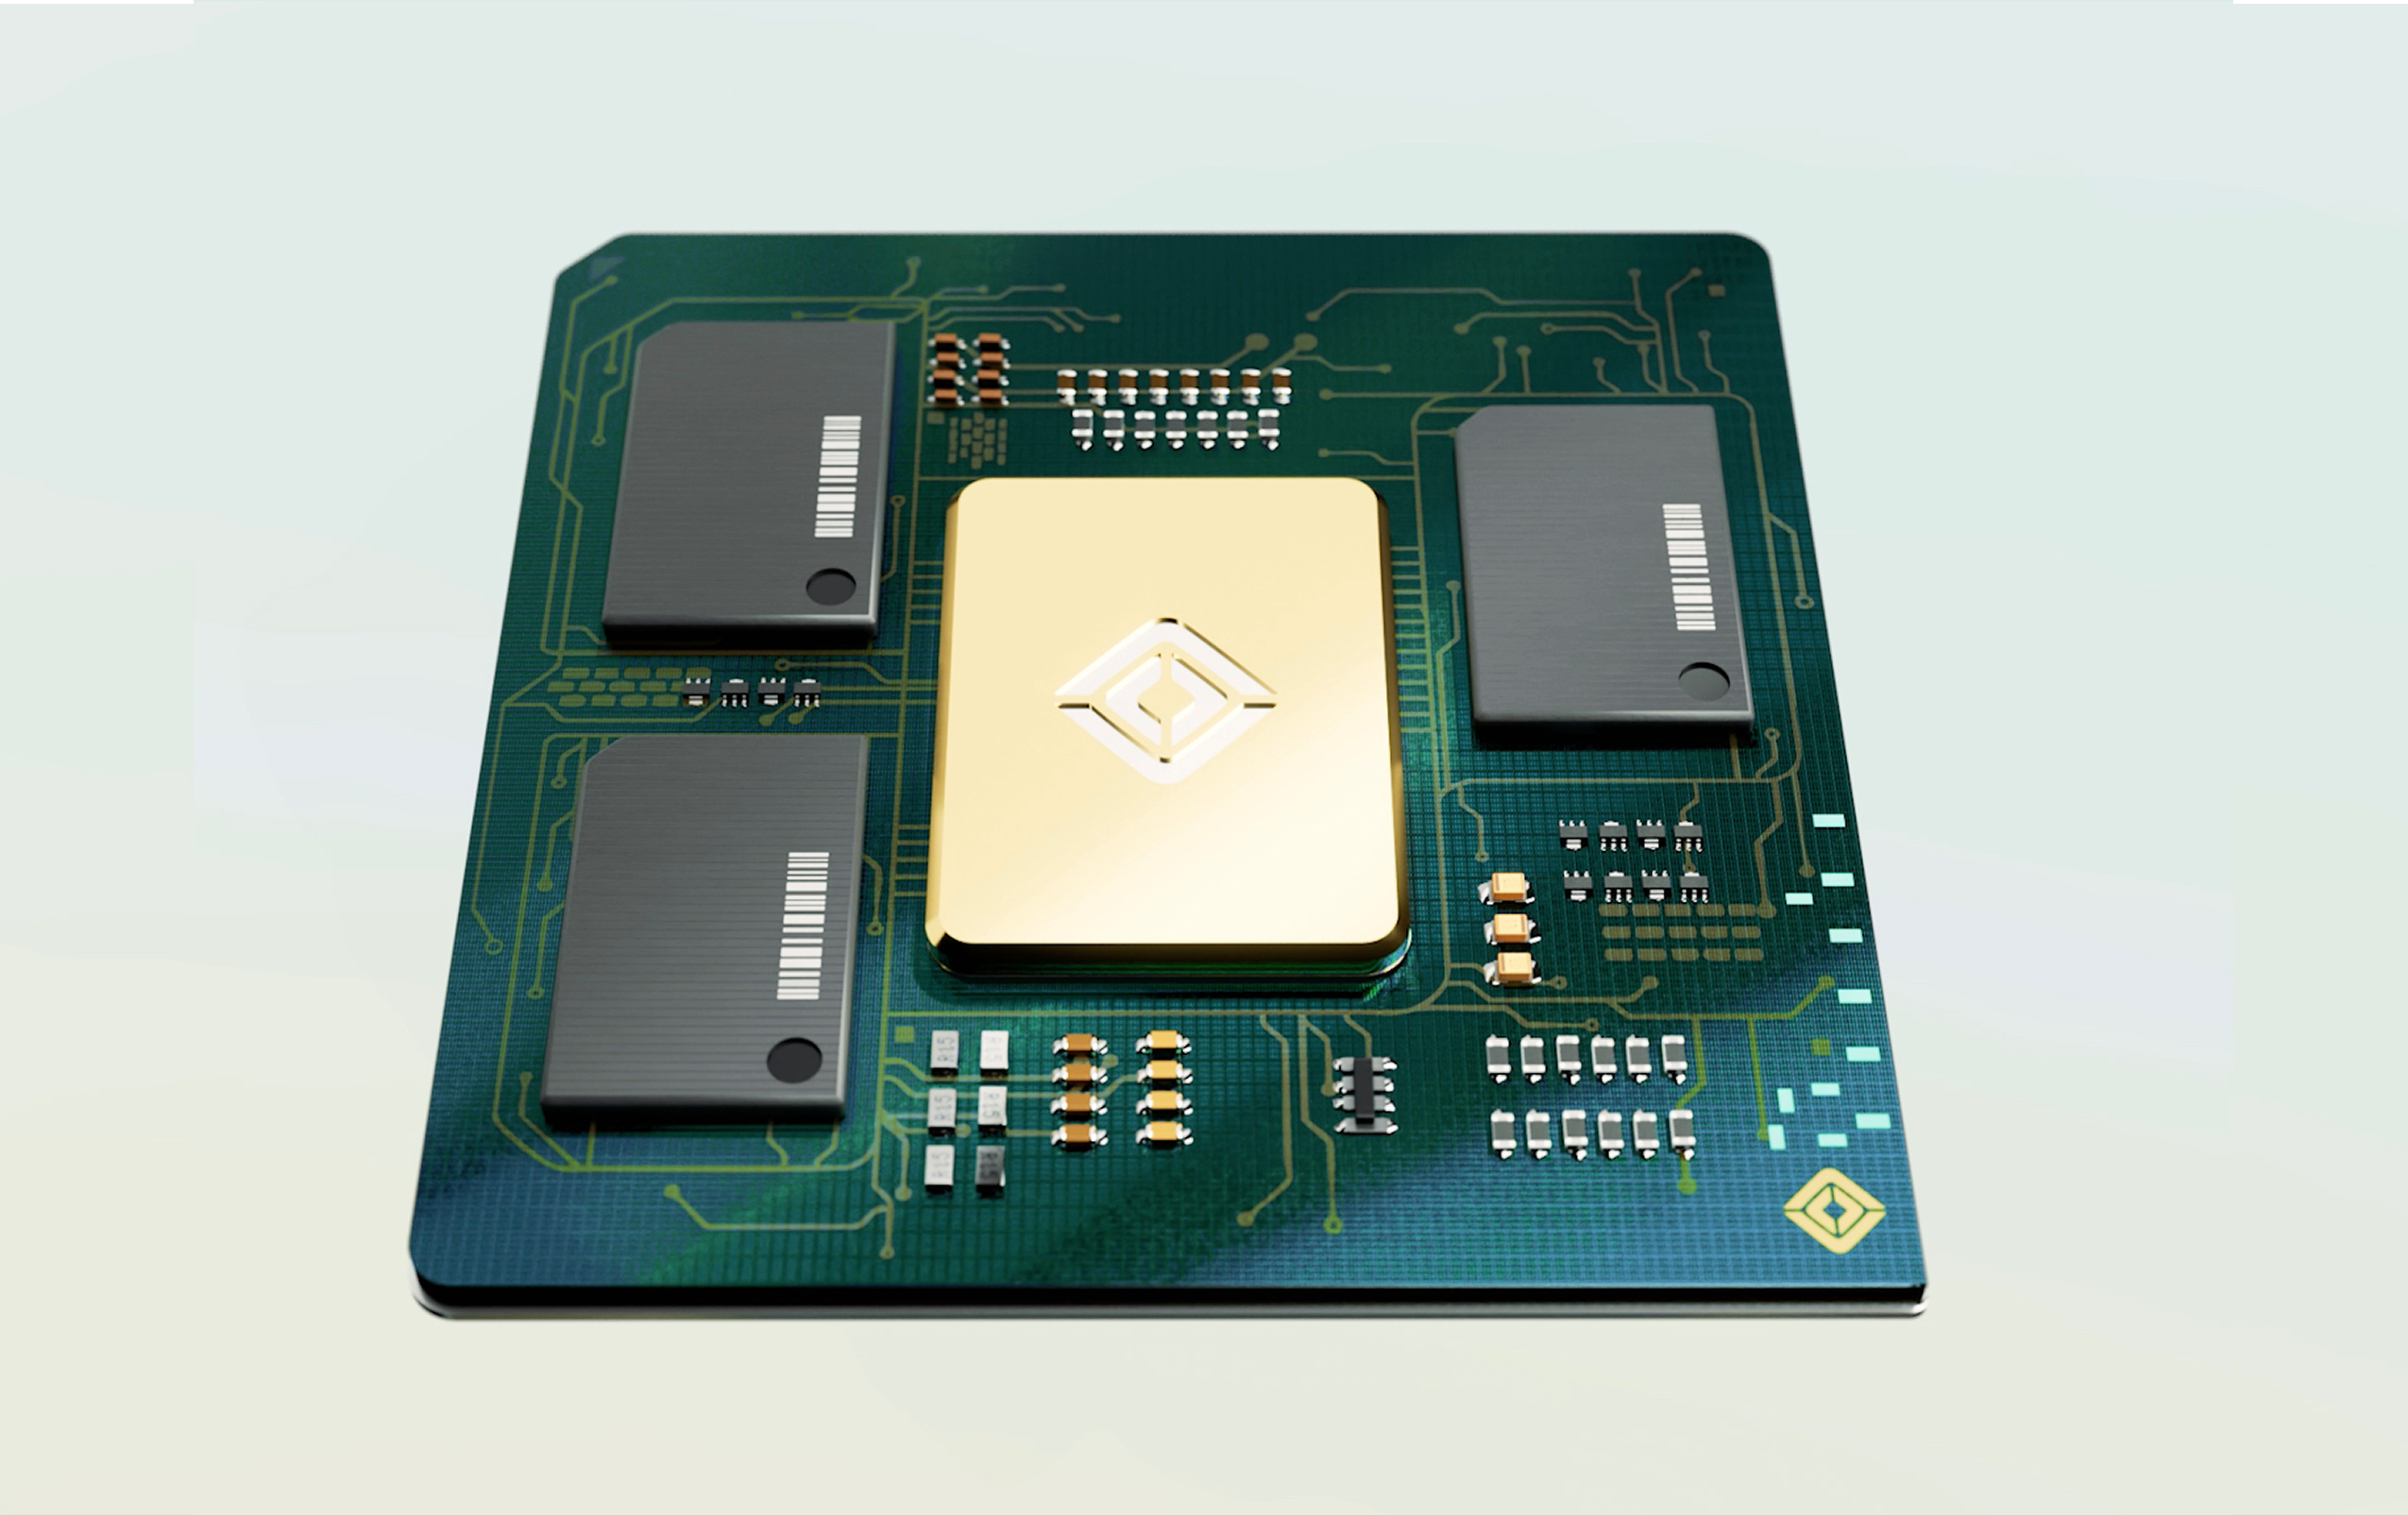 | |||||
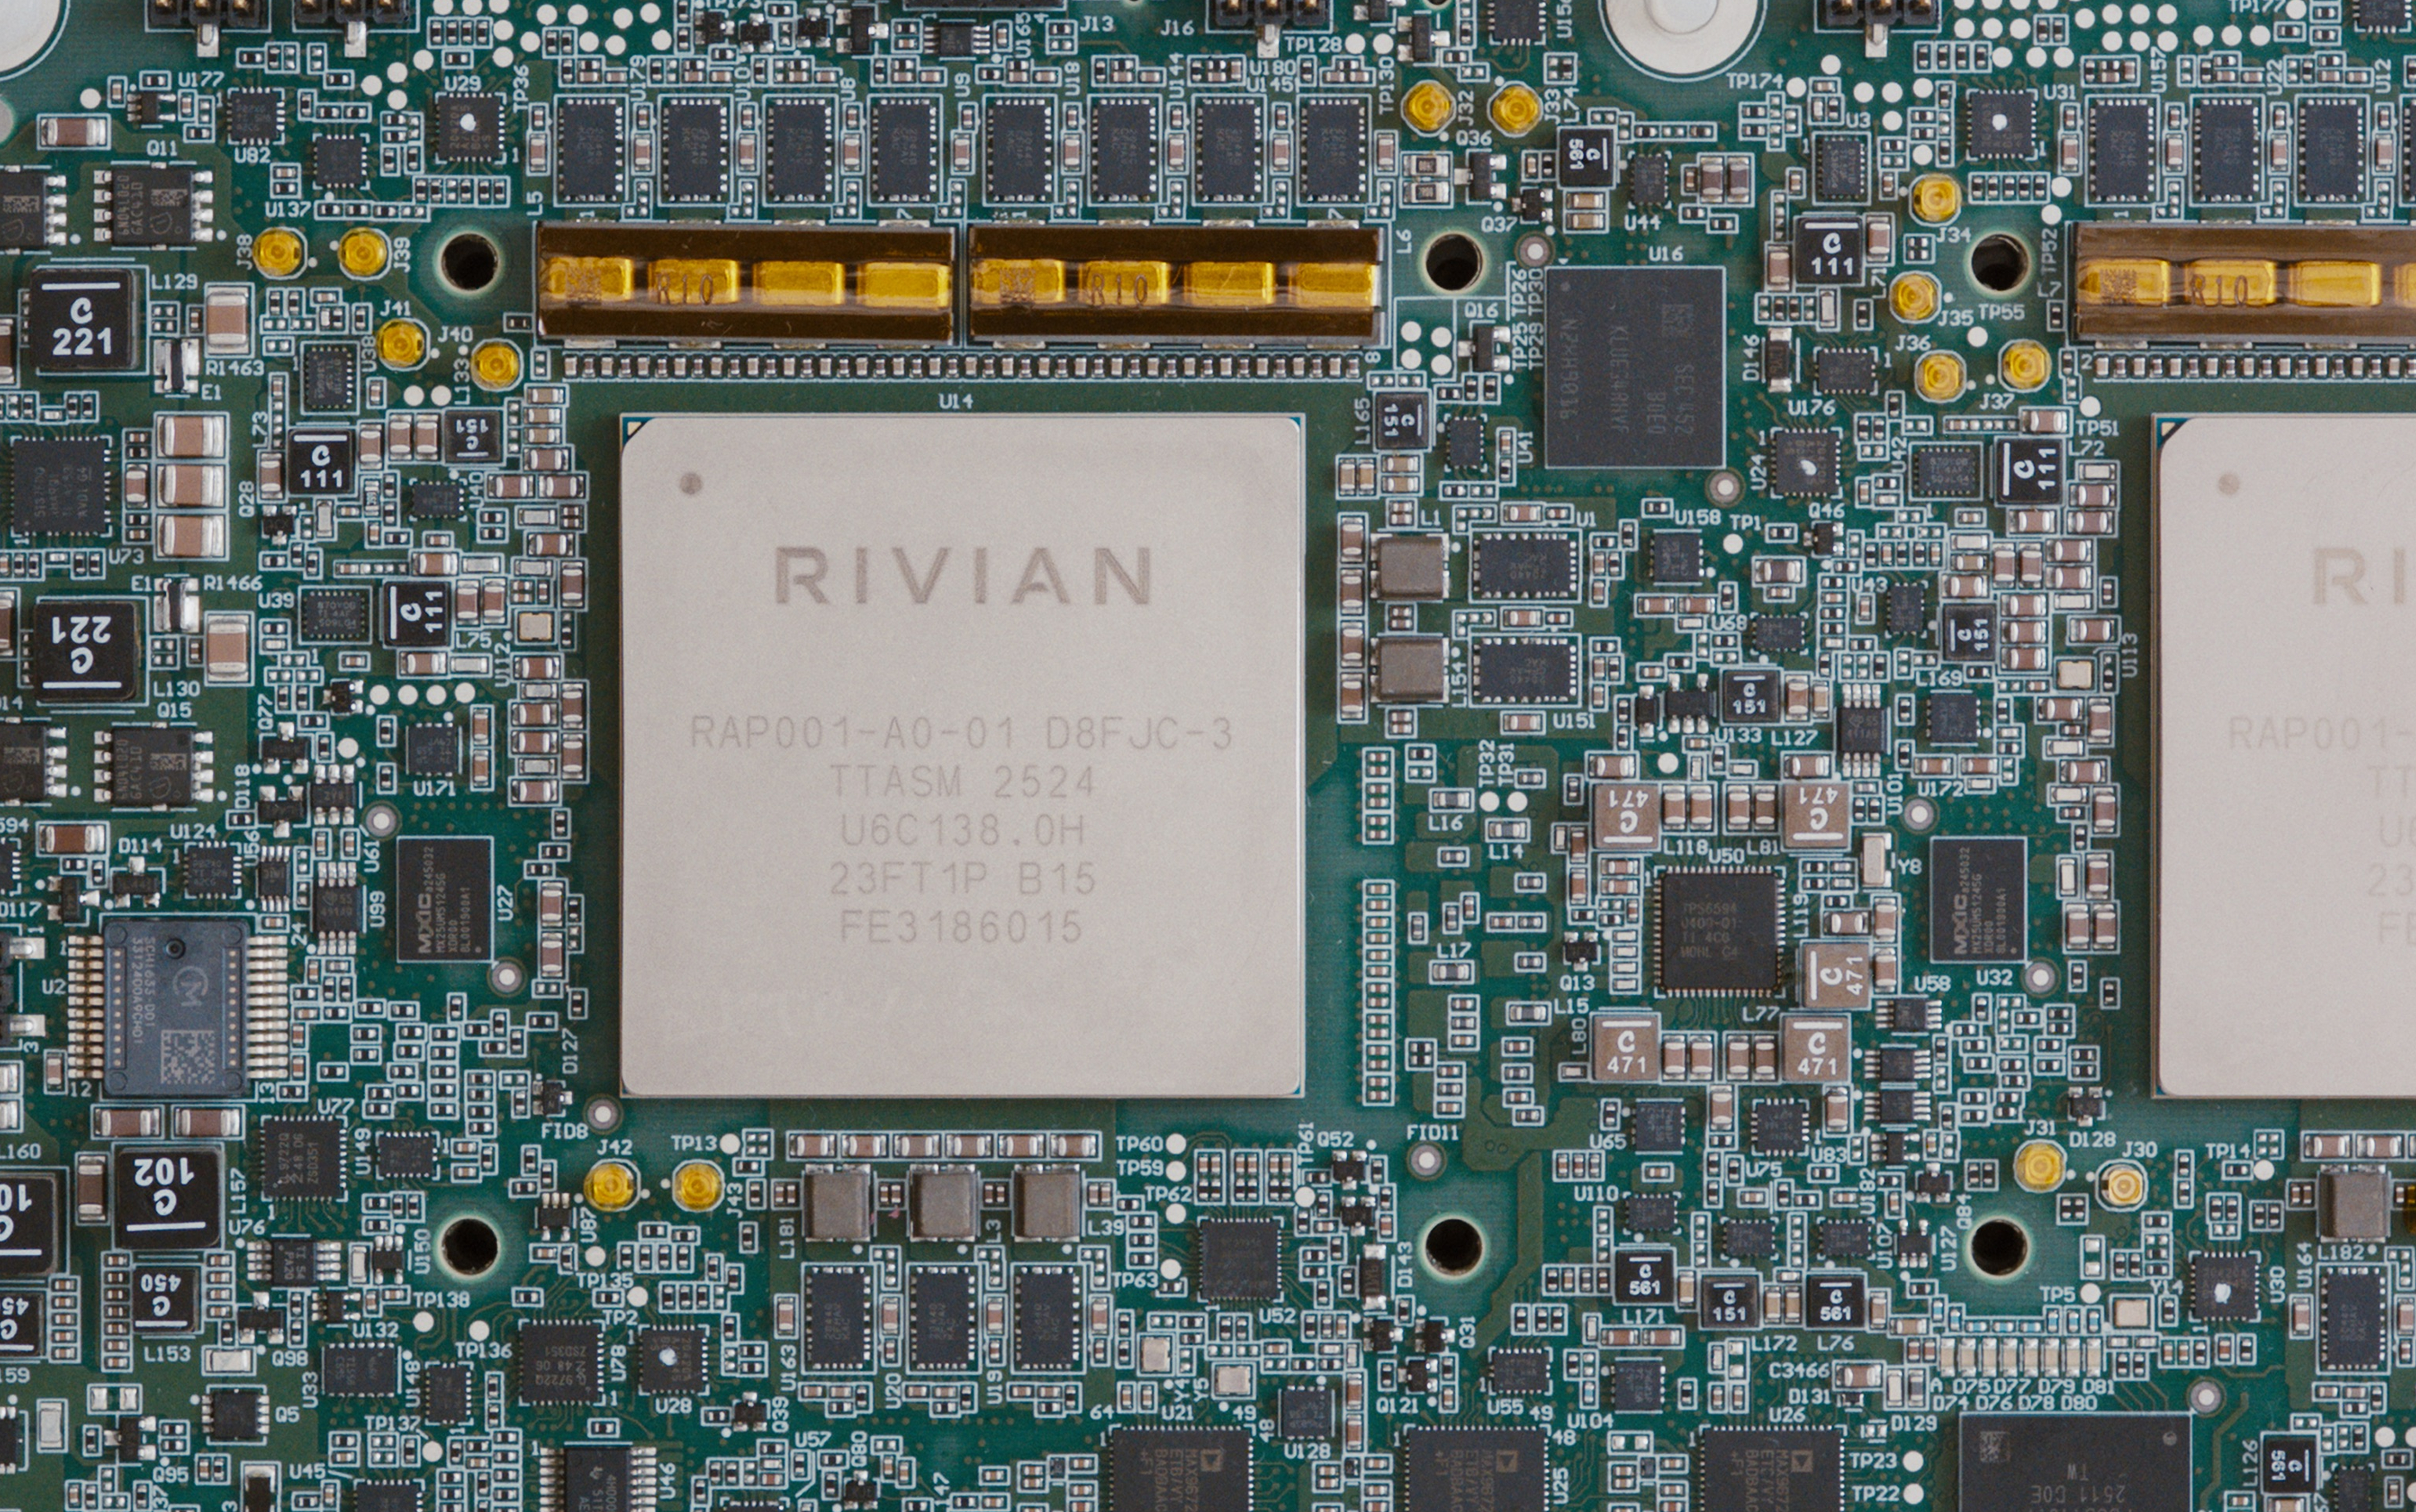
RAP 1: Vertical Integration in Silicon At the core of our autonomy platform is the Rivian Autonomy Processor, our first generation in-house custom chip designed specifically for physical AI. The development of our own chip was a strategic necessity driven by the need for velocity, performance and cost efficiency. By building RAP1, we achieve tighter integration with our assisted driving features, and eliminate the overhead and margins associated with an external silicon developer. This allows us to pursue the best performance per dollar. RAP1 features a Rivian-designed Neural Network Engine capable of 800 TOPS and is manufactured on a 5nm node with TSMC. The architecture of RAP1 represents a significant leap in efficiency and capability from our current system. It utilizes a Multi-Chip Module (MCM) design, which tightly integrates the System-on-Chip (SoC) with memory to enable high bandwidth (205GB/sec) while simplifying the printed circuit board design to reduce manufacturing and bill of material costs. This system delivers four times the peak performance of our second generation computer, while also improving power efficiency by a factor of 2.5. Furthermore, RAP1 is built to scale as multiple chips can communicate via our custom low latency "RivLink" interface. This will allow us to build systems that can be scalable from one RAP1 to multiple RAP1s depending on advanced driver assistance systems performance and feature requirements. Since AI and Autonomy Day, Rivian received production RAP1 chips in-house and we are in the final validation phases as we get ready for an expected production launch of this chip in R2 in late 2026. | |||||
| Q4 2025 Shareholder Letter | © 2026 Rivian. All rights reserved. 7 | ||||||
 | |||||
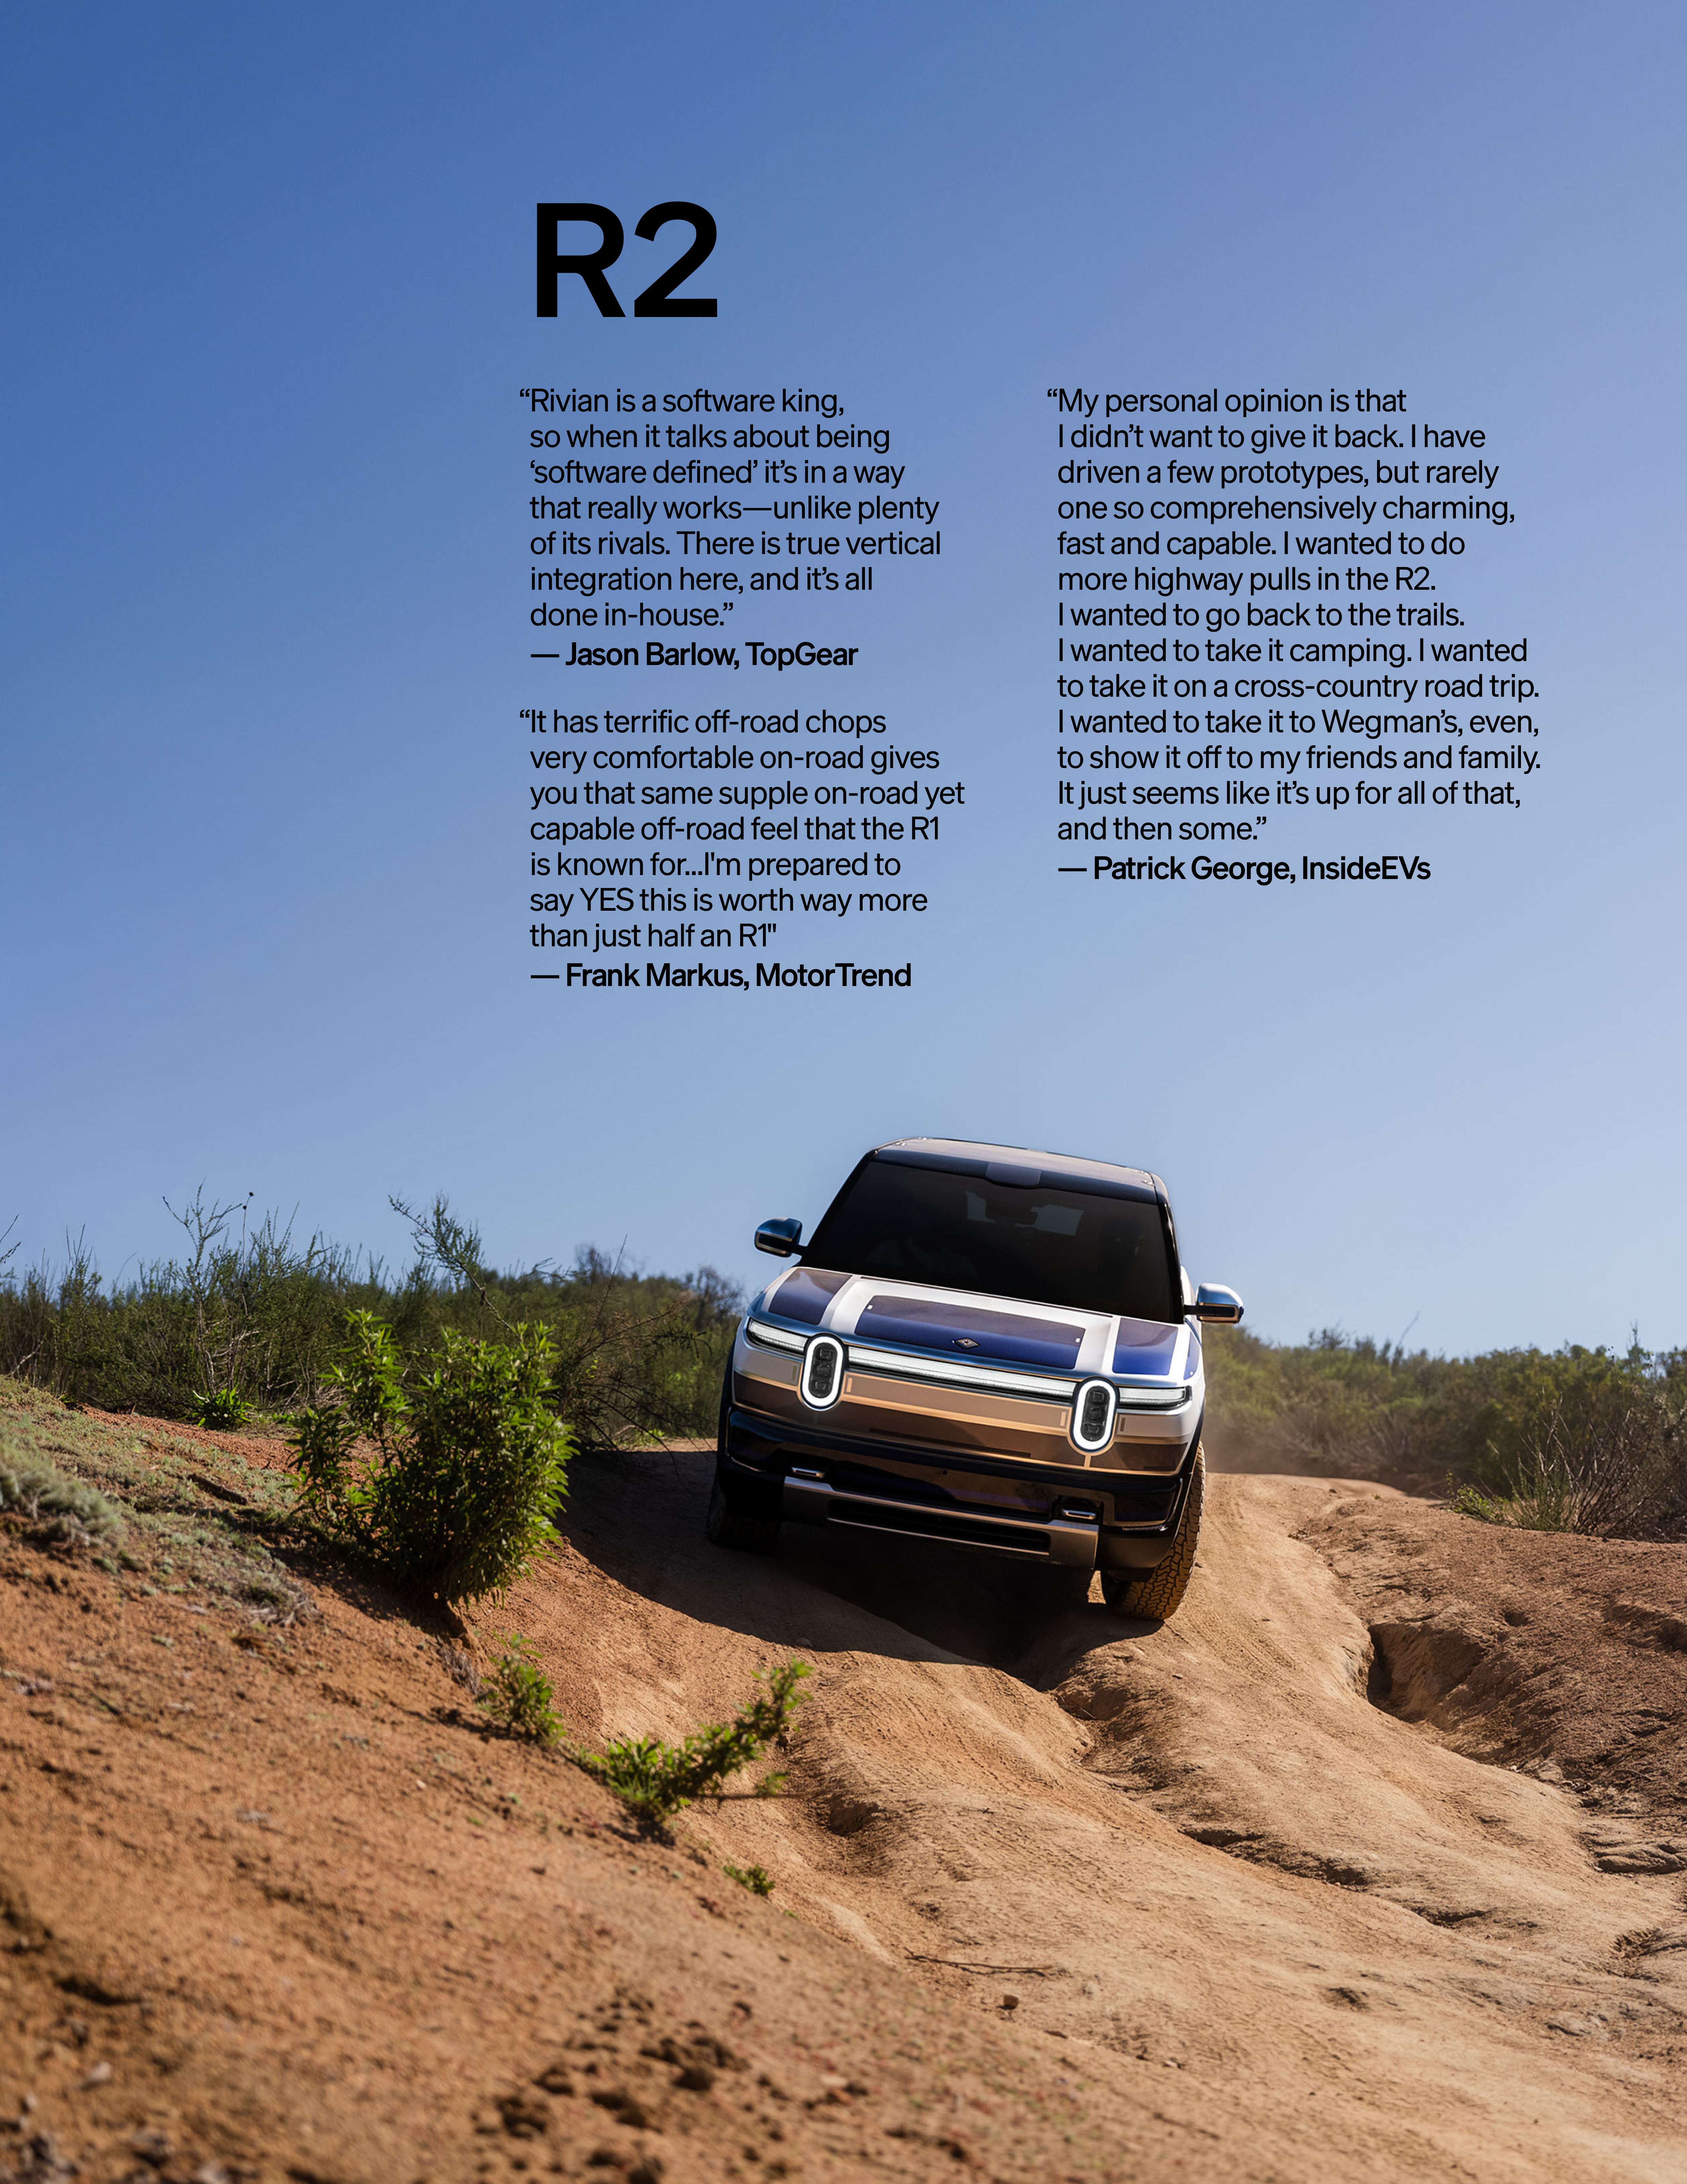
R2 Progress on the manufacturing launch of R2 remains on track with the first customer deliveries expected in the second quarter of 2026. The new 1.1 million square foot expansion in Normal is complete and factory equipment is commissioned. As a result, in mid-January we drove the first R2 manufacturing validation builds off the general assembly line. In early February, a small group of media and influencers joined us in Irvine for a first look at R2. During the event, attendees drove a Dual-Motor R2 on a mixed on-road and off-road loop. We received incredible feedback on the vehicle, its features and its performance. R2 is designed to be as capable on the trail as it is on the commute. A hallmark of the R2’s design is the power-down rear liftgate window to allow owners to carry long gear like a surfboard or create a full flow-through breeze for pets and passengers. The rear seats fold completely flat to optimize cargo space. R2 also has intuitive storage solutions such as dual gloveboxes and class-leading interior room. The R2 launch variant will be a well equipped Dual-Motor AWD variant capable of 0–60 in 3.6 seconds with over 300 miles of range. We will reveal additional product and line-up details on March 12th. | |||||
| Q4 2025 Shareholder Letter | © 2026 Rivian. All rights reserved. 9 | ||||||
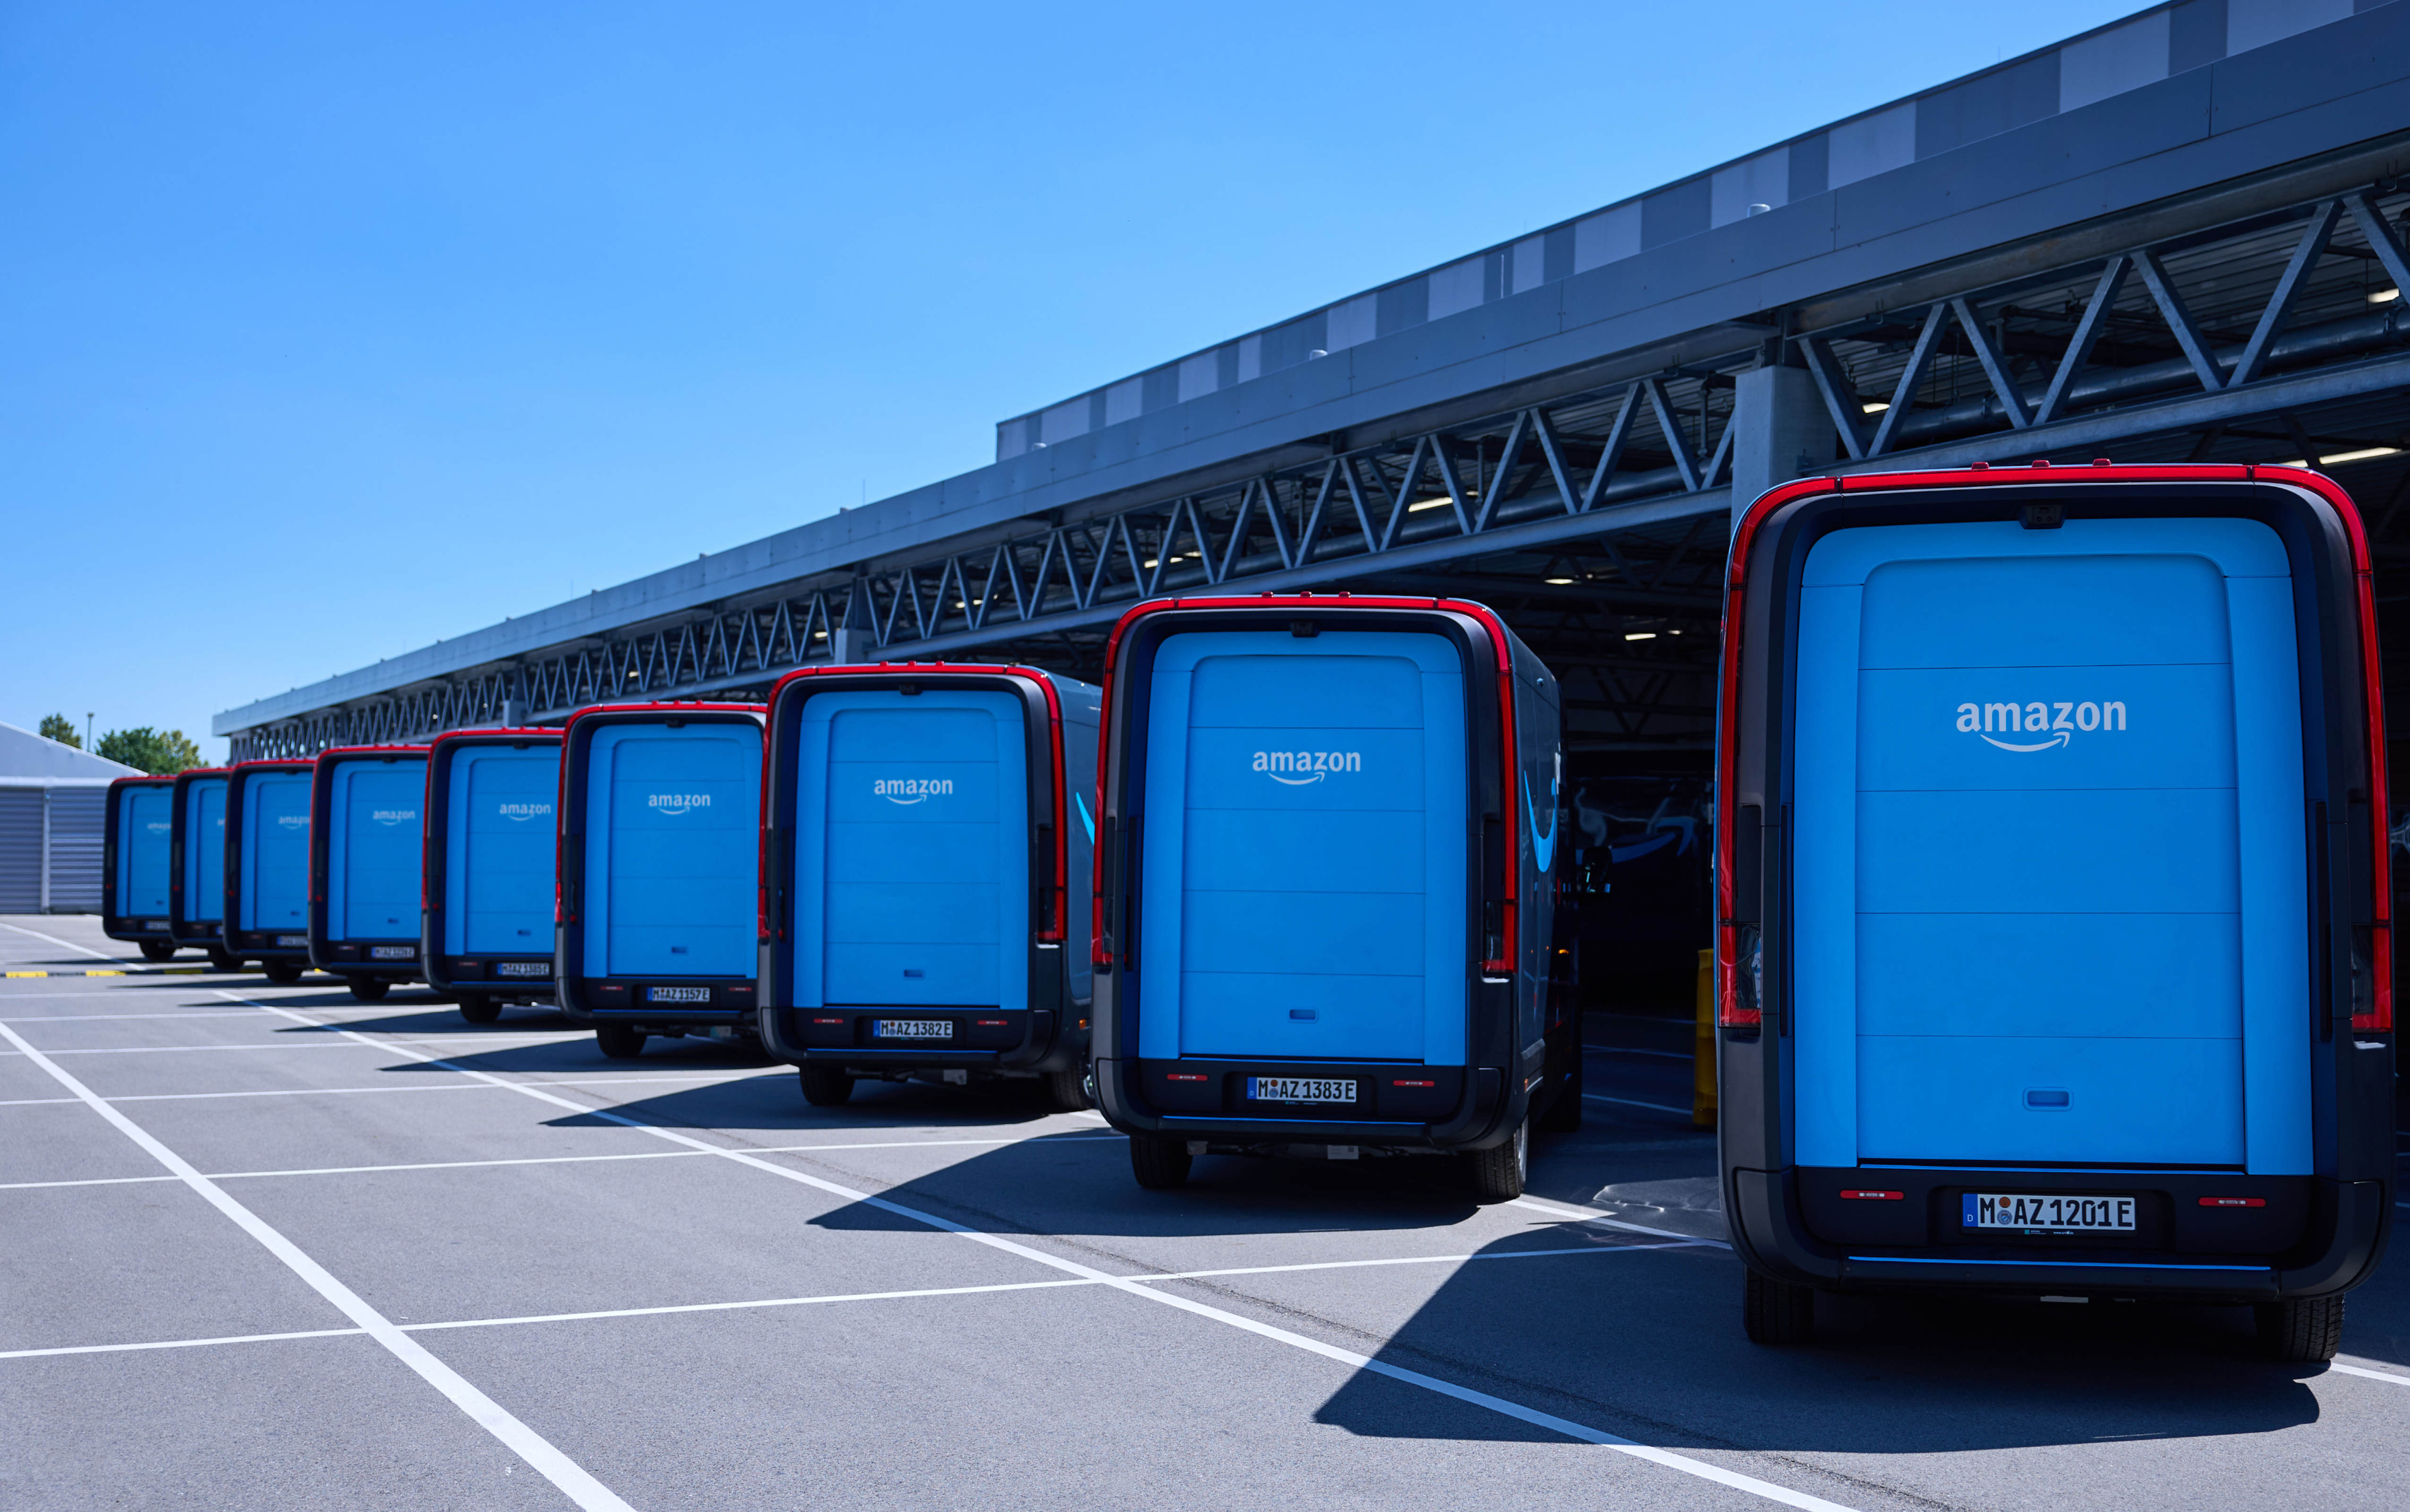 | |||||
Commercial Vans Our partnership with Amazon remains strong. Amazon now has over 30,000 custom-built Rivian Electric Delivery Vans (EDV) delivering packages across thousands of cities in the U.S. Rivian Commercial Vans have been specifically designed around the delivery process to minimize the total cost per package delivered through features such as an automatic bulkhead door that opens as the driver gets to their destination, as well as bringing a significant total cost of ownership reduction relative to internal combustion engine delivery vans. In addition to the EDV FWD standard battery pack variant already on the road, we are developing new variants of the van with a larger battery pack and AWD. The larger battery brings a 30% increase in range, while all wheel drive improves traction in conditions like mud and snow. These new variants will expand EDV route coverage in Amazon's network. | |||||
| Q4 2025 Shareholder Letter | © 2026 Rivian. All rights reserved. 10 | ||||||
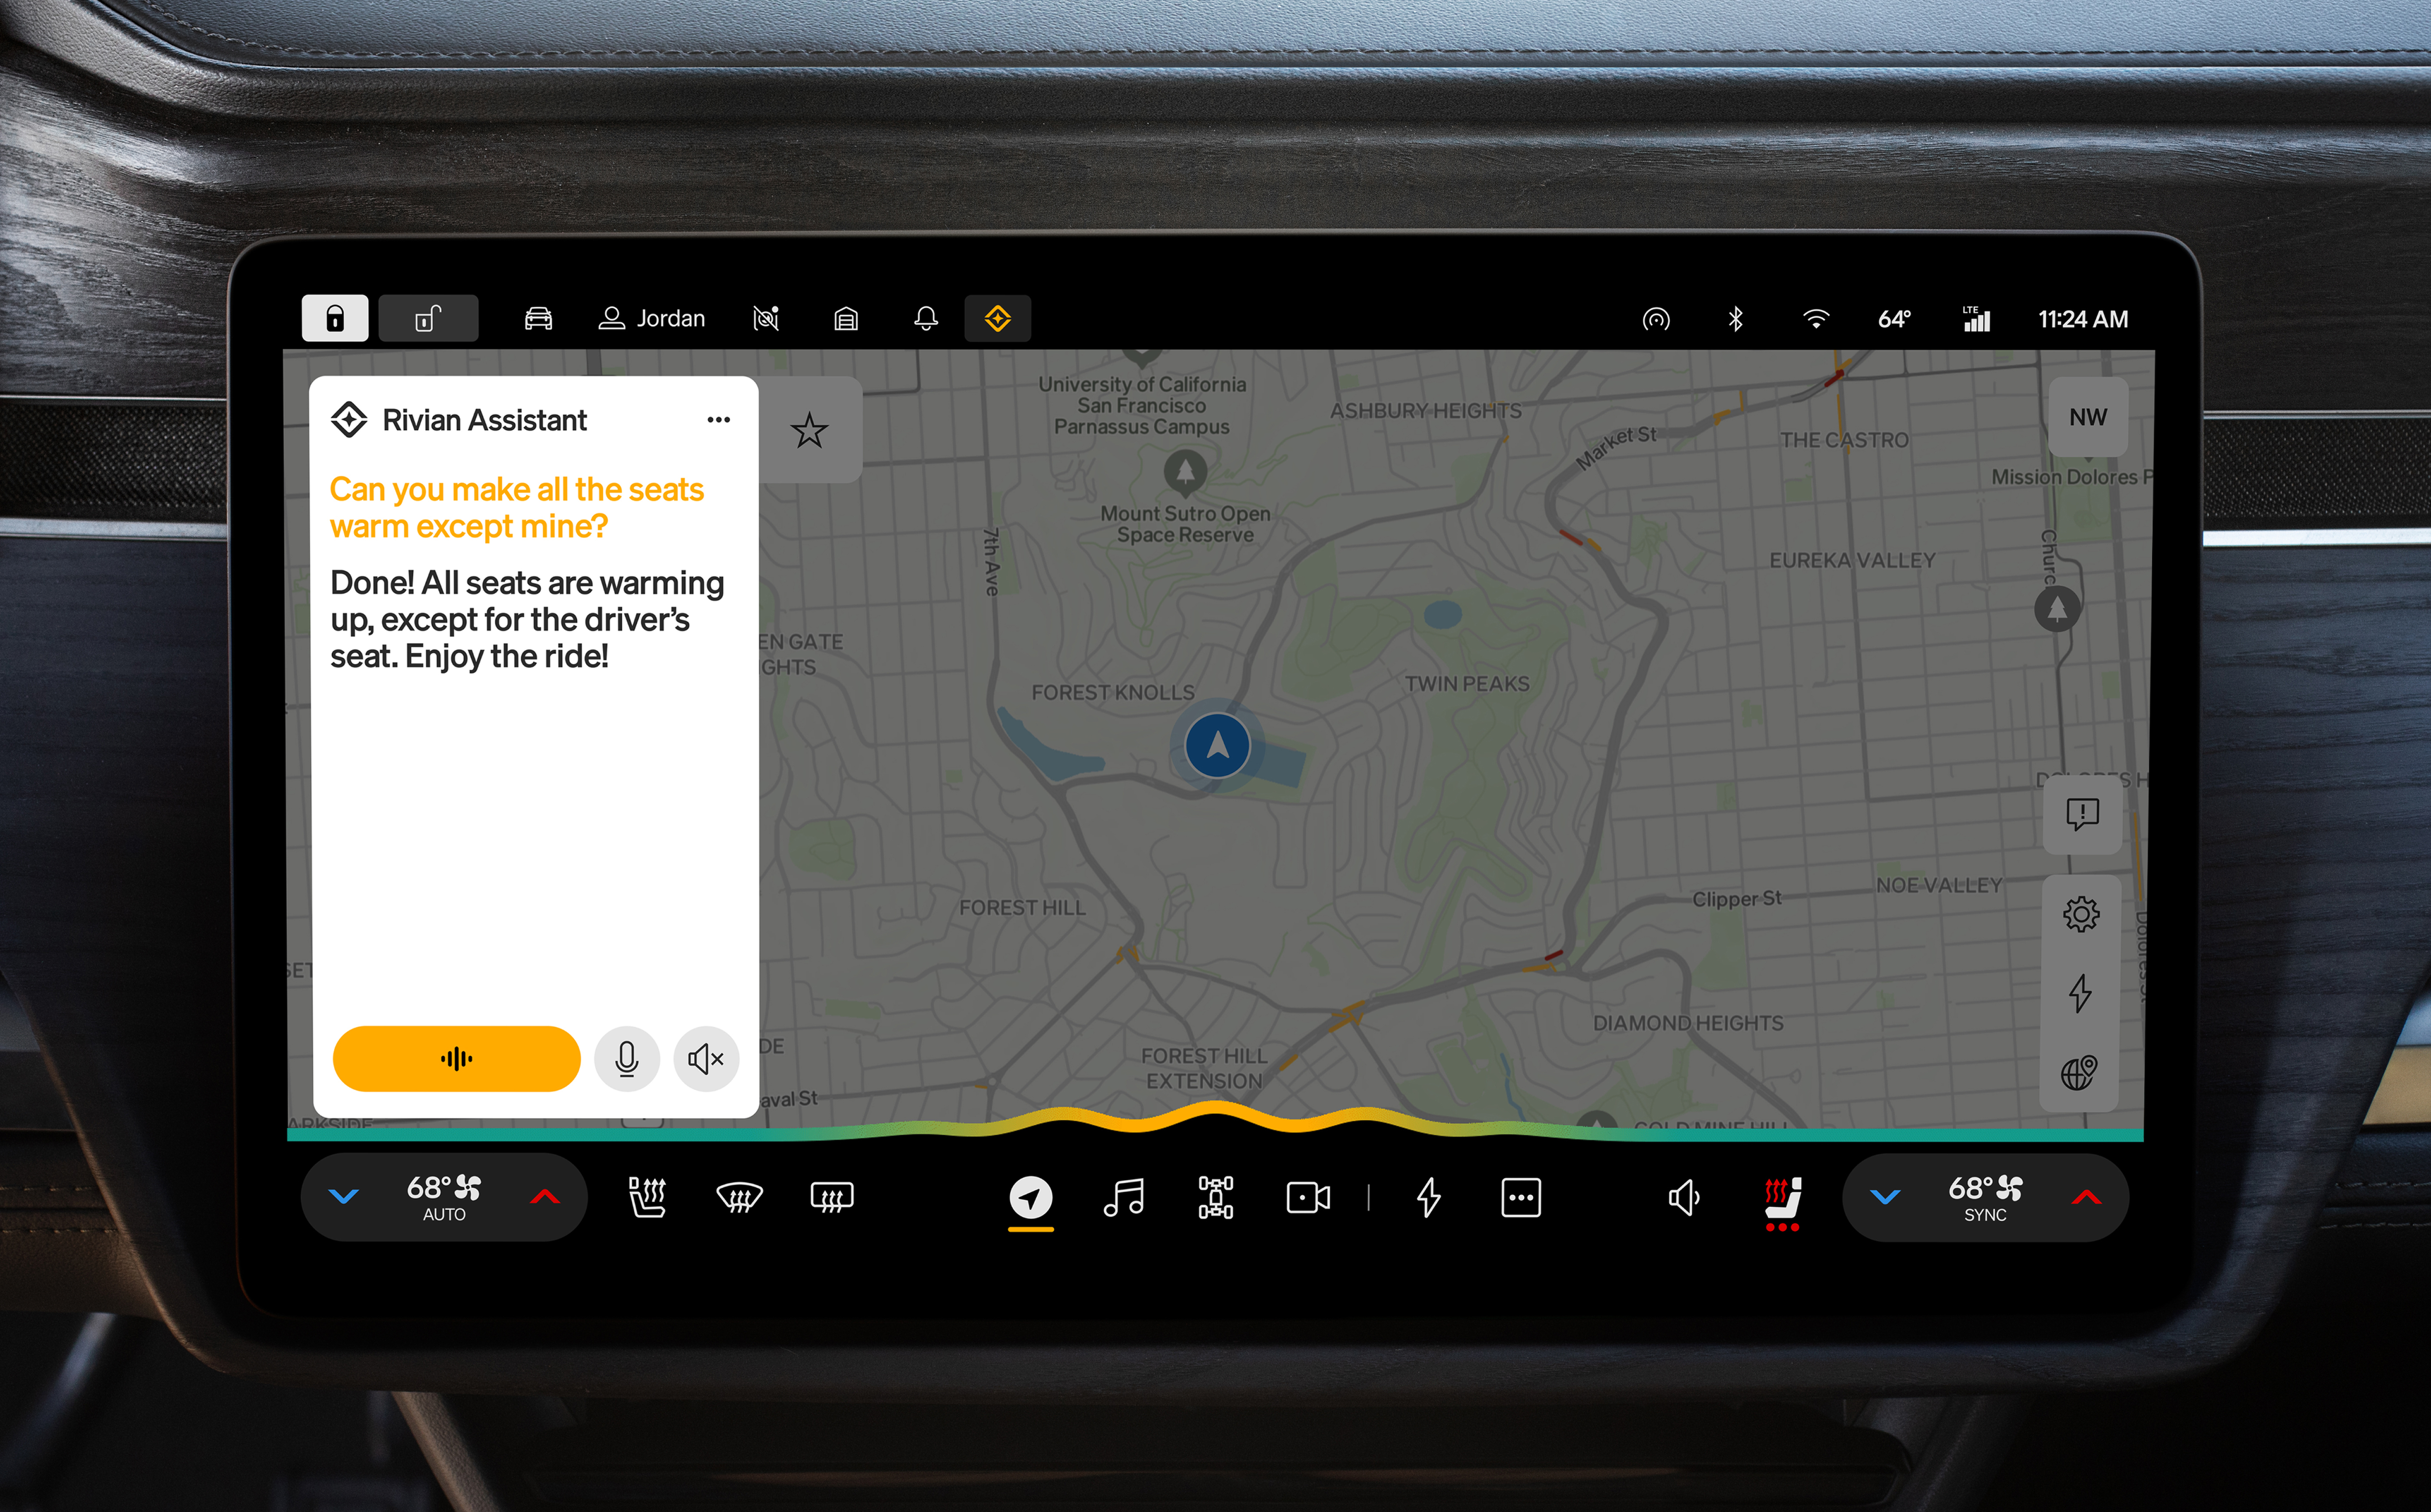 | |||||
Software Rivian has made significant progress in making software and AI core to everything we do, from the way we design, develop, manufacture and service our cars to the way our customers interact with their vehicle. This is enabled by the Rivian Unified Intelligence, a common AI foundation that understands our products and operations as one continuous system and personalizes the experience for our customers. It also defines how applications will integrate in our vehicles in the future. We also announced the Rivian Assistant, a next-generation voice interface using an in-house agentic AI framework which we expect to launch in early 2026 on all Rivian consumer vehicles. As seen in our demonstration at Autonomy and AI Day, the Rivian Assistant is designed to understand our customers and their context with features like Google Calendar integration. | |||||
| Q4 2025 Shareholder Letter | © 2026 Rivian. All rights reserved. 11 | ||||||
 | |||||
Go-to-Market We are focused on scaling our commercial and service infrastructure as well as driving brand awareness in preparation for customer deliveries of R2 in the second quarter of 2026. We now have 36 spaces, complemented by 97 service centers. Enabling potential customers to get behind the wheel is one of the most effective ways to generate demand. Our spaces and the majority of our service centers are optimized for convenient demo drives. We completed approximately 22,000 demo drives in the fourth quarter while also seeing increasing customer inquiries about R2 timing. In addition to our service centers, we have nearly 700 mobile service vehicles that carry out the majority of our service appointments at a location convenient for our customers. Our Rivian Adventure Network (RAN) now has over 930 chargers across over 140 sites. As we continue to grow the network, delivering high levels of reliability remains a key area of focus, and throughout 2025 we delivered an average uptime of 98% at RAN chargers. Additionally, we continue to position the network to seamlessly support all types of electric vehicles with over 90% of our RAN charging sites now accessible to non-Rivian customers. In December, as many families took holiday travel adventures, non-Rivian vehicles accounted for more than 40% of charging sessions at RAN chargers, serving as a great way to share our brand with potential customers, while driving utilization of our charging infrastructure. Further, we continued to roll out North American Charging Standard (NACS) compatible chargers across the network to support all electric vehicles in the marketplace and plan to continue this across 2026 as we prepare for R2. | |||||
| Q4 2025 Shareholder Letter | © 2026 Rivian. All rights reserved. 12 | ||||||
 | |||||
Production and Deliveries In the fourth quarter of 2025, we produced 10,974 and delivered 9,745 vehicles from our manufacturing facility in Normal, Illinois. The sequential step down in deliveries was primarily driven by lower R1S and R1T volumes, as expected, given the expiration of certain federal EV tax credits on September 30, 2025. At the same time, we saw strong EDV deliveries to Amazon. For the full-year 2025 we produced 42,284 and delivered 42,247 vehicles. | |||||
| Q4 2025 Shareholder Letter | © 2026 Rivian. All rights reserved. 13 | ||||||
 | |||||||||||
Business Outlook Over the course of the fiscal year 2026, we remain focused on our key value drivers: •Technology leadership •Demand generation and enhancing the customer experience •Drive towards profitability •Optimize operational efficiency | |||||||||||
| 2026 Guidance | |||||||||||
Vehicles Delivered | 62,000 – 67,000 | ||||||||||
Adj. EBITDA | $(2.10) billion – $(1.80) billion | ||||||||||
Capital Expenditures | $1.95 billion – $2.05 billion | ||||||||||
| Q4 2025 Shareholder Letter | © 2026 Rivian. All rights reserved. 14 | ||||||

| Revenue | Consolidated For the fourth quarter of 2025, consolidated revenues were $1,286 million compared to $1,734 million in the same quarter in 2024, a 26% year-over year decrease. For the full year 2025, consolidated revenues were $5,387 million compared to $4,970 million for the full year 2024, an 8% year-over year increase. Automotive For the fourth quarter of 2025, automotive revenues were $839 million compared to $1,520 million in the same quarter in 2024, a 45% decrease year-over-year primarily driven by a $270 million decrease regulatory credits sales, lower vehicle deliveries with the expiration of tax credits and a lower average sales price due to a higher mix of EDV deliveries. Revenues from the sale of regulatory credits were $29 million for the fourth quarter, as compared to $299 million for the same quarter in 2024. For the full year 2025, automotive revenues were $3,830 million compared to $4,486 million for the full year 2024, a 15% decrease year-over-year due to lower regulatory credits sales and vehicle deliveries partially offset by higher average selling prices and a higher mix of R1 deliveries. Revenues from the sale of regulatory credits were $191 million for the full year 2025 as compared to $325 million for the full year 2024. Software and Services For the fourth quarter of 2025, software and services revenues were $447 million compared to $214 million in the same quarter in 2024, a 109% increase year-over-year primarily due to an increase in vehicle electrical architecture and software development services from the joint venture with Volkswagen Group, as well as increases in sales of vehicle trade-ins (“remarketing”) and vehicle repair and maintenance services. For the full year 2025, software and services revenues were $1,557 million compared to $484 million for the full year 2024, a 222% increase year-over-year primarily due to increased vehicle electrical architecture and software development services from the joint venture with Volkswagen Group, as well as increased remarketing sales and vehicle repair and maintenance services. During the fourth quarter and full year 2025, approximately $273 million and $836 million of the revenues within software and services resulted from the software and vehicle electrical architecture joint venture with Volkswagen Group. These revenues were recognized both from the ongoing payments to fund the joint venture's development services as well as from the $1,960 million of consideration for background IP that was received in conjunction with the closing of the joint venture. We expect the remainder of the consideration received at closing will be fully recognized as revenue over approximately the next 2.5 years. | ||||
| Q4 2025 Shareholder Letter | © 2026 Rivian. All rights reserved. 15 | ||||||
| Gross Profit | Consolidated For the fourth quarter of 2025, consolidated positive gross profit was $120 million compared to $170 million for the same quarter in 2024. For the full year 2025, consolidated gross profit was $144 million compared to $(1,200) million for the full year 2024. Automotive For the fourth quarter of 2025, automotive gross profit was $(59) million compared to $110 million for the same quarter in 2024, primarily due to $270 million of lower revenues from the sale of regulatory credits. For the full year 2025, we generated negative automotive gross profit of $(432) million as compared to $(1,207) million for the full year 2024, primarily due to higher average selling prices and reductions in cost per vehicle. Software and Services For the fourth quarter of 2025, software and services gross profit was $179 million compared to $60 million for the same quarter in 2024, primarily due to increased vehicle electrical architecture and software development services from the joint venture with Volkswagen Group. For the full year 2025, software and services gross profit was $576 million compared to $7 million for the full year 2024, primarily due to increased vehicle electrical architecture and software development services from the joint venture with Volkswagen Group, as well as increased vehicle repair and maintenance services and remarketing sales. | ||||
| Operating Expenses and Operating Loss | For the fourth quarter of 2025, total operating expenses were $953 million compared to $831 million in the same quarter in 2024. For the fourth quarter of 2025, we recognized a non-cash, stock-based compensation expense within operating expenses of $162 million compared to $138 million in the same quarter in 2024 and depreciation and amortization expense within operating expenses of $79 million compared to $73 million in the same quarter in 2024. For the fourth quarter of 2025, research and development (R&D) expense was $424 million compared to $374 million in the same quarter in 2024. The increase was primarily due to an increased software and cloud spend on autonomy. For the fourth quarter of 2025, selling, general, and administrative (SG&A) expense was $529 million compared to $457 million in the same quarter in 2024, a result of expanding our go-to-market operations and footprint, including higher payroll and related expenses driven by increased headcount and stock-based compensation expenses. For the full year 2025, operating expenses were $3,729 million compared to $3,489 million for the full year 2024. For the fourth quarter of 2025, we experienced a loss from operations of $(833) million compared to $(661) million in the same quarter in 2024. For the full year 2025, we recorded a loss from operations of $(3,585) million compared to $(4,689) million for the full year 2024. | ||||
| Adjusted Operating Expenses¹ | Adjusted R&D expenses¹ for the fourth quarter of 2025 were $328 million compared to $277 million for the same quarter in 2024. Adjusted SG&A expenses¹ for the fourth quarter of 2025 were $384 million compared to $343 million for the same quarter in 2024. Total adjusted operating expenses¹ for the fourth quarter of 2025 were $712 million compared to $620 million for the same quarter in 2024. For the full year 2025, total adjusted operating expenses¹ were $2,806 million compared to $2,572 million for the full year 2024. | ||||
| ¹A reconciliation of non-GAAP financial measures to the most comparable GAAP measure is provided later in this letter. | |||||
| Q4 2025 Shareholder Letter | © 2026 Rivian. All rights reserved. 16 | ||||||
| Net Loss | Net loss for the fourth quarter of 2025 was $(804) million compared to $(743) million for the same quarter in 2024. The increased loss in the fourth quarter was primarily driven by a decrease in gross profit resulting from a decrease in sales of regulatory credits and reduced vehicle delivery volumes, partially offset by reductions in the cost per vehicle and increased vehicle electrical architecture and software development services from the joint venture with Volkswagen Group. For the full year 2025, we recorded a net loss of $(3,626) million compared to $(4,746) million for the full year 2024. | ||||
| Adjusted EBITDA¹ | Adjusted EBITDA¹ for the fourth quarter of 2025 was $(465) million compared to $(277) million for the same quarter in 2024. The increased Adjusted EBITDA¹ loss for the fourth quarter of 2025 compared to the fourth quarter of 2024 was driven primarily by a $270 million reduction in regulatory credit sales. For the full year 2025, Adjusted EBITDA¹ was $(2,063) million compared to $(2,689) million for the full year 2024. | ||||
| Net Cash Used / Provided by Operating Activities | Net cash from operating activities for the fourth quarter of 2025 was $(681) million compared to $1,183 million for the same quarter in 2024. Net cash used in operating activities for the full year 2025 was $(779) million compared to $(1,716) million for the full year 2024. | ||||
| Capital Expenditures | Capital expenditures for the fourth quarter of 2025 were $463 million compared to $327 million for the same quarter in 2024. For the full year 2025, capital expenditures were $1,710 million compared to $1,141 million for the full year 2024, due to the ongoing expansion of our manufacturing facility in Normal. | ||||
| Liquidity and Free Cash Flow¹ | We ended the fourth quarter of 2025 with $6,082 million in cash, cash equivalents, and short-term investments. Including the capacity under our asset-based revolving-credit facility, we ended the fourth quarter of 2025 with $6,588 million of total liquidity. We define free cash flow¹ as net cash used or provided by operating activities less capital expenditures. Free cash flow¹ for the fourth quarter of 2025 was $(1,144) million compared to $856 million for the same quarter in 2024. Additionally, free cash flow¹ was $(2,489) million for the full year 2025 compared to $(2,857) million for the full year 2024. | ||||
| Webcast | We will host an audio webcast to discuss our results and provide a business update at 2:00pm PT / 5:00pm ET on Thursday, February 12, 2026. The link to the webcast will be made available on our Investor Relations website at rivian.com/investors. After the call, a replay will be available at rivian.com/investors for four weeks. | ||||
| ¹A reconciliation of non-GAAP financial measures to the most comparable GAAP measure is provided later in this letter. | |||||
| Q4 2025 Shareholder Letter | © 2026 Rivian. All rights reserved. 17 | ||||||
| Quarterly Financial Performance | ||||||||||||||
| (in millions, except production, delivery, and gross margin) | ||||||||||||||
| Three Months Ended | ||||||||||||||||||||||||||||||||
| December 31, 2024 | March 31, 2025 | June 30, 2025 | September 30, 2025 | December 31, 2025 | ||||||||||||||||||||||||||||
| Production | 12,727 | 14,611 | 5,979 | 10,720 | 10,974 | |||||||||||||||||||||||||||
| Delivery | 14,183 | 8,640 | 10,661 | 13,201 | 9,745 | |||||||||||||||||||||||||||
| Revenues | ||||||||||||||||||||||||||||||||
| Automotive | $ | 1,520 | $ | 922 | $ | 927 | $ | 1,142 | $ | 839 | ||||||||||||||||||||||
| Software and services | 214 | 318 | 376 | 416 | 447 | |||||||||||||||||||||||||||
| Total revenues | $ | 1,734 | $ | 1,240 | $ | 1,303 | $ | 1,558 | $ | 1,286 | ||||||||||||||||||||||
| Cost of revenues | ||||||||||||||||||||||||||||||||
| Automotive | $ | 1,410 | $ | 830 | $ | 1,262 | $ | 1,272 | $ | 898 | ||||||||||||||||||||||
| Software and services | 154 | 204 | 247 | 262 | 268 | |||||||||||||||||||||||||||
| Total cost of revenues | $ | 1,564 | $ | 1,034 | $ | 1,509 | $ | 1,534 | $ | 1,166 | ||||||||||||||||||||||
| Gross profit | $ | 170 | $ | 206 | $ | (206) | $ | 24 | $ | 120 | ||||||||||||||||||||||
| Gross margin | 10 | % | 17 | % | (16) | % | 2 | % | 9 | % | ||||||||||||||||||||||
| Research and development | $ | 374 | $ | 381 | $ | 410 | $ | 453 | $ | 424 | ||||||||||||||||||||||
| Selling, general, and administrative | 457 | 480 | 498 | 554 | 529 | |||||||||||||||||||||||||||
| Total operating expenses | $ | 831 | $ | 861 | $ | 908 | $ | 1,007 | $ | 953 | ||||||||||||||||||||||
| Adjusted research and development (non-GAAP)¹ | $ | 277 | $ | 285 | $ | 316 | $ | 361 | $ | 328 | ||||||||||||||||||||||
| Adjusted selling, general, and administrative (non-GAAP)¹ | 343 | 345 | 365 | 422 | 384 | |||||||||||||||||||||||||||
| Total adjusted operating expenses (non-GAAP)¹ | $ | 620 | $ | 630 | $ | 681 | $ | 783 | $ | 712 | ||||||||||||||||||||||
Adjusted EBITDA (non-GAAP)1 | $ | (277) | $ | (329) | $ | (667) | $ | (602) | $ | (465) | ||||||||||||||||||||||
Cash, cash equivalents, short-term investments, and restricted cash | $ | 7,700 | $ | 7,178 | $ | 7,508 | $ | 7,088 | $ | 6,082 | ||||||||||||||||||||||
Net cash (used)/provided by operating activities | $ | 1,183 | $ | (188) | $ | 64 | $ | 26 | $ | (681) | ||||||||||||||||||||||
| Capital expenditures | (327) | (338) | (462) | (447) | (463) | |||||||||||||||||||||||||||
Free cash flow (non-GAAP)1 | $ | 856 | $ | (526) | $ | (398) | $ | (421) | $ | (1,144) | ||||||||||||||||||||||
| Depreciation and amortization expense | ||||||||||||||||||||||||||||||||
| Cost of revenues | $ | 145 | $ | 75 | $ | 185 | $ | 125 | $ | 108 | ||||||||||||||||||||||
| Research and development | 18 | 17 | 17 | 18 | 20 | |||||||||||||||||||||||||||
| Selling, general, and administrative | 55 | 55 | 52 | 55 | 59 | |||||||||||||||||||||||||||
| Total depreciation and amortization expense | $ | 218 | $ | 147 | $ | 254 | $ | 198 | $ | 187 | ||||||||||||||||||||||
| Stock-based compensation expense | ||||||||||||||||||||||||||||||||
| Cost of revenues | $ | 16 | $ | 24 | $ | 37 | $ | 24 | $ | 26 | ||||||||||||||||||||||
| Research and development | 79 | 79 | 77 | 74 | 76 | |||||||||||||||||||||||||||
| Selling, general, and administrative | 59 | 80 | 81 | 77 | 86 | |||||||||||||||||||||||||||
| Total stock-based compensation expense | $ | 154 | $ | 183 | $ | 195 | $ | 175 | $ | 188 | ||||||||||||||||||||||
| ¹ A reconciliation of non-GAAP financial measures to the most comparable GAAP measure is provided later in this letter. | ||||||||||||||||||||||||||||||||
| Q4 2025 Shareholder Letter | © 2026 Rivian. All rights reserved. 18 | ||||||
| Consolidated Balance Sheets | ||||||||||||||
| (in millions, except per share amounts) | ||||||||||||||
| Assets | December 31, 2024 | December 31, 2025 | ||||||||||||
| Current assets: | ||||||||||||||
| Cash and cash equivalents | $ | 5,294 | $ | 3,579 | ||||||||||
| Short-term investments | 2,406 | 2,503 | ||||||||||||
| Accounts receivable, net | 443 | 555 | ||||||||||||
| Inventory | 2,248 | 1,594 | ||||||||||||
| Other current assets | 192 | 361 | ||||||||||||
| Total current assets | 10,583 | 8,592 | ||||||||||||
| Property, plant, and equipment, net | 3,965 | 5,119 | ||||||||||||
| Operating lease assets, net | 416 | 571 | ||||||||||||
| Other non-current assets | 446 | 582 | ||||||||||||
| Total assets | $ | 15,410 | $ | 14,864 | ||||||||||
| Liabilities and Stockholders’ Equity | ||||||||||||||
| Current liabilities: | ||||||||||||||
| Accounts payable | $ | 499 | $ | 595 | ||||||||||
| Accrued liabilities | 835 | 1,438 | ||||||||||||
| Current portion of deferred revenues, lease liabilities, and other liabilities | 917 | 1,660 | ||||||||||||
| Total current liabilities | 2,251 | 3,693 | ||||||||||||
| Long-term debt | 4,441 | 4,440 | ||||||||||||
| Non-current lease liabilities | 379 | 551 | ||||||||||||
| Other non-current liabilities | 1,777 | 1,586 | ||||||||||||
| Total liabilities | 8,848 | 10,270 | ||||||||||||
| Commitments and contingencies | ||||||||||||||
| Stockholders' equity: | ||||||||||||||
Preferred stock, $0.001 par value; 10 shares authorized and 0 shares issued and outstanding as of December 31, 2024 and 2025 | — | — | ||||||||||||
Common stock, $0.001 par value; 3,508 and 5,258 shares authorized and 1,131 and 1,240 shares issued and outstanding as of December 31, 2024 and 2025, respectively | 1 | 1 | ||||||||||||
| Additional paid-in capital | 29,866 | 31,508 | ||||||||||||
| Accumulated deficit | (23,305) | (26,951) | ||||||||||||
| Accumulated other comprehensive (loss) income | (4) | 8 | ||||||||||||
| Noncontrolling interest | 4 | 28 | ||||||||||||
| Total stockholders' equity | 6,562 | 4,594 | ||||||||||||
| Total liabilities and stockholders' equity | $ | 15,410 | $ | 14,864 | ||||||||||
| Q4 2025 Shareholder Letter | © 2026 Rivian. All rights reserved. 19 | ||||||
| Consolidated Statements of Operations | ||||||||||||||
| (in millions, except per share amounts) | ||||||||||||||
| Three Months Ended December 31, | Twelve Months Ended December 31, | |||||||||||||||||||||||||
| 2024 | 2025 | 2024 | 2025 | |||||||||||||||||||||||
| Automotive | $ | 1,520 | $ | 839 | $ | 4,486 | $ | 3,830 | ||||||||||||||||||
| Software and services | 214 | 447 | 484 | 1,557 | ||||||||||||||||||||||
| Total revenues | 1,734 | 1,286 | 4,970 | 5,387 | ||||||||||||||||||||||
| Automotive | 1,410 | 898 | 5,693 | 4,262 | ||||||||||||||||||||||
| Software and services | 154 | 268 | 477 | 981 | ||||||||||||||||||||||
| Total cost of revenues | 1,564 | 1,166 | 6,170 | 5,243 | ||||||||||||||||||||||
| Gross (loss) profit | 170 | 120 | (1,200) | 144 | ||||||||||||||||||||||
| Operating expenses | ||||||||||||||||||||||||||
| Research and development | 374 | 424 | 1,613 | 1,668 | ||||||||||||||||||||||
| Selling, general, and administrative | 457 | 529 | 1,876 | 2,061 | ||||||||||||||||||||||
| Total operating expenses | 831 | 953 | 3,489 | 3,729 | ||||||||||||||||||||||
| Loss from operations | (661) | (833) | (4,689) | (3,585) | ||||||||||||||||||||||
| Interest income | 83 | 64 | 385 | 293 | ||||||||||||||||||||||
| Interest expense | (81) | (64) | (318) | (274) | ||||||||||||||||||||||
| Loss on convertible notes, net | (82) | — | (112) | — | ||||||||||||||||||||||
| Other income (expense), net | 1 | 32 | (7) | (54) | ||||||||||||||||||||||
| Loss before income taxes | (740) | (801) | (4,741) | (3,620) | ||||||||||||||||||||||
| Provision for income taxes | (3) | (3) | (5) | (6) | ||||||||||||||||||||||
| Net loss | $ | (743) | $ | (804) | $ | (4,746) | $ | (3,626) | ||||||||||||||||||
| Less: Net income attributable to noncontrolling interest | 1 | 7 | 1 | 20 | ||||||||||||||||||||||
| Net loss attributable to common stockholders | $ | (744) | $ | (811) | $ | (4,747) | $ | (3,646) | ||||||||||||||||||
| Net loss attributable to common stockholders, basic and diluted | $ | (744) | $ | (811) | $ | (4,747) | $ | (3,646) | ||||||||||||||||||
| Net loss per share attributable to common stockholders, basic and diluted | $ | (0.70) | $ | (0.66) | $ | (4.69) | $ | (3.07) | ||||||||||||||||||
| Weighted-average common shares outstanding, basic and diluted | 1,058 | 1,233 | 1,013 | 1,186 | ||||||||||||||||||||||
| Q4 2025 Shareholder Letter | © 2026 Rivian. All rights reserved. 20 | ||||||
Consolidated Statements of Cash Flows 1 | ||||||||||||||
| (in millions) | ||||||||||||||
| Years Ended December 31, | ||||||||||||||
| 2024 | 2025 | |||||||||||||
| Cash flows from operating activities: | ||||||||||||||
| Net loss | $ | (4,746) | $ | (3,626) | ||||||||||
| Depreciation and amortization | 1,031 | 784 | ||||||||||||
| Stock-based compensation expense | 692 | 741 | ||||||||||||
| Gain on equity method investment | — | (101) | ||||||||||||
| Loss on convertible notes, net | 112 | — | ||||||||||||
| Other non-cash activities | 28 | (17) | ||||||||||||
| Changes in operating assets and liabilities: | ||||||||||||||
| Accounts receivable, net | (282) | (112) | ||||||||||||
| Inventory | 307 | 522 | ||||||||||||
| Other assets | (221) | 9 | ||||||||||||
| Accounts payable and accrued liabilities | (572) | 571 | ||||||||||||
| Deferred revenues | 1,619 | 503 | ||||||||||||
| Other liabilities | 316 | (53) | ||||||||||||
| Net cash used in operating activities | (1,716) | (779) | ||||||||||||
| Cash flows from investing activities: | ||||||||||||||
| Purchases of equity securities and short-term investments | (4,392) | (3,206) | ||||||||||||
| Sales of equity securities and short-term investments | — | 108 | ||||||||||||
| Maturities of short-term investments | 3,553 | 2,980 | ||||||||||||
| Capital expenditures | (1,141) | (1,710) | ||||||||||||
| Net cash used in investing activities | (1,980) | (1,828) | ||||||||||||
| Cash flows from financing activities: | ||||||||||||||
| Proceeds from stock-based compensation programs | 62 | 61 | ||||||||||||
| Proceeds from issuance of capital stock | — | 750 | ||||||||||||
| Proceeds from issuance of long-term debt | — | 1,250 | ||||||||||||
| Repayments of long-term debt | — | (1,250) | ||||||||||||
| Proceeds from issuance of convertible notes | 1,000 | — | ||||||||||||
| Proceeds from funding of 50% interest in Rivian and Volkswagen Group Technologies, LLC | 79 | — | ||||||||||||
| Proceeds from funding of 46.5% interest in Mind Robotics, Inc. | — | 112 | ||||||||||||
| Purchase of capped call options | — | — | ||||||||||||
| Other financing activities | (5) | (37) | ||||||||||||
| Net cash provided by financing activities | 1,136 | 886 | ||||||||||||
| Effect of exchange rate changes on cash and cash equivalents | (3) | 6 | ||||||||||||
| Net change in cash | (2,563) | (1,715) | ||||||||||||
| Cash, cash equivalents, and restricted cash—Beginning of period | 7,857 | 5,294 | ||||||||||||
| Cash, cash equivalents, and restricted cash—End of period | $ | 5,294 | $ | 3,579 | ||||||||||
| Supplemental disclosure of cash flow information: | ||||||||||||||
| Cash paid for interest | $ | 279 | $ | 222 | ||||||||||
| Supplemental disclosure of non-cash investing and financing activities: | ||||||||||||||
| Capital expenditures included in liabilities | $ | 423 | $ | 493 | ||||||||||
| Capital stock issued to settle bonuses | $ | 179 | $ | 47 | ||||||||||
| Conversion of convertible notes | $ | 1,133 | $ | — | ||||||||||
1 The prior period has been recast to conform to current period presentation. | ||||||||||||||
| Q4 2025 Shareholder Letter | © 2026 Rivian. All rights reserved. 21 | ||||||
| Depreciation and Amortization | ||||||||||||||
| (in millions) | ||||||||||||||
| Three Months Ended December 31, | Twelve Months Ended December 31, | |||||||||||||||||||||||||
| 2024 | 2025 | 2024 | 2025 | |||||||||||||||||||||||
| Cost of revenues | $ | 145 | $ | 108 | $ | 744 | $ | 493 | ||||||||||||||||||
| Research and development | 18 | 20 | 74 | 72 | ||||||||||||||||||||||
| Selling, general, and administrative | 55 | 59 | 213 | 221 | ||||||||||||||||||||||
| Total depreciation and amortization expense | $ | 218 | $ | 187 | $ | 1,031 | $ | 786 | ||||||||||||||||||
| Stock-Based Compensation Expense | ||||||||||||||
| (in millions) | ||||||||||||||
| Three Months Ended December 31, | Twelve Months Ended December 31, | |||||||||||||||||||||||||
| 2024 | 2025 | 2024 | 2025 | |||||||||||||||||||||||
| Cost of revenues | $ | 16 | $ | 26 | $ | 62 | $ | 111 | ||||||||||||||||||
| Research and development | 79 | 76 | 360 | 306 | ||||||||||||||||||||||
| Selling, general, and administrative | 59 | 86 | 270 | 324 | ||||||||||||||||||||||
| Total stock-based compensation expense | $ | 154 | $ | 188 | $ | 692 | $ | 741 | ||||||||||||||||||
| Q4 2025 Shareholder Letter | © 2026 Rivian. All rights reserved. 22 | ||||||
| Reconciliation of Non-GAAP | ||||||||||||||
| Financial Measures | ||||||||||||||
(in millions) | ||||||||||||||
| Adjusted Research and Development Expenses | Three Months Ended December 31, | Twelve Months Ended December 31, | ||||||||||||||||||||||||
| 2024 | 2025 | 2024 | 2025 | |||||||||||||||||||||||
| Total research and development expenses | $ | 374 | $ | 424 | $ | 1,613 | $ | 1,668 | ||||||||||||||||||
| R&D depreciation and amortization expenses | (18) | (20) | (74) | (72) | ||||||||||||||||||||||
| R&D stock-based compensation expenses | (79) | (76) | (360) | (306) | ||||||||||||||||||||||
| Adjusted research and development (non-GAAP) | $ | 277 | $ | 328 | $ | 1,179 | $ | 1,290 | ||||||||||||||||||
| Adjusted Selling, General, and Administrative Expenses | Three Months Ended December 31, | Twelve Months Ended December 31, | ||||||||||||||||||||||||
| 2024 | 2025 | 2024 | 2025 | |||||||||||||||||||||||
| Total selling, general, and administrative expenses | $ | 457 | $ | 529 | $ | 1,876 | $ | 2,061 | ||||||||||||||||||
| SG&A depreciation and amortization expenses | (55) | (59) | (213) | (221) | ||||||||||||||||||||||
| SG&A stock-based compensation expenses | (59) | (86) | (270) | (324) | ||||||||||||||||||||||
| Adjusted selling, general, and administrative (non-GAAP) | $ | 343 | $ | 384 | $ | 1,393 | $ | 1,516 | ||||||||||||||||||
| Adjusted Operating Expenses | Three Months Ended December 31, | Twelve Months Ended December 31, | ||||||||||||||||||||||||
| 2024 | 2025 | 2024 | 2025 | |||||||||||||||||||||||
| Total operating expenses | $ | 831 | $ | 953 | $ | 3,489 | $ | 3,729 | ||||||||||||||||||
| R&D depreciation and amortization expenses | (18) | (20) | (74) | (72) | ||||||||||||||||||||||
| R&D stock-based compensation expenses | (79) | (76) | (360) | (306) | ||||||||||||||||||||||
| SG&A depreciation and amortization expenses | (55) | (59) | (213) | (221) | ||||||||||||||||||||||
| SG&A stock-based compensation expenses | (59) | (86) | (270) | (324) | ||||||||||||||||||||||
| Total adjusted operating expenses (non-GAAP) | $ | 620 | $ | 712 | $ | 2,572 | $ | 2,806 | ||||||||||||||||||
| Adjusted EBITDA | Three Months Ended December 31, | Twelve Months Ended December 31, | ||||||||||||||||||||||||
| 2024 | 2025 | 2024 | 2025 | |||||||||||||||||||||||
| Net loss attributable to common shareholders | $ | (744) | $ | (811) | $ | (4,747) | $ | (3,646) | ||||||||||||||||||
| Interest income, net | (2) | — | (67) | (19) | ||||||||||||||||||||||
| Provision for income taxes | 3 | 3 | 5 | 6 | ||||||||||||||||||||||
| Depreciation and amortization | 218 | 187 | 1,031 | 786 | ||||||||||||||||||||||
| Stock-based compensation expense | 154 | 188 | 692 | 741 | ||||||||||||||||||||||
| Other (income) expense, net | (1) | (32) | 7 | 54 | ||||||||||||||||||||||
| Loss on convertible note, net | 82 | — | 112 | — | ||||||||||||||||||||||
| Cost of revenue efficiency initiatives | — | — | 193 | — | ||||||||||||||||||||||
| Restructuring expenses | — | — | 30 | 15 | ||||||||||||||||||||||
| Asset impairments and write-offs | — | — | 30 | — | ||||||||||||||||||||||
Joint venture formation expenses and other items1 | 13 | — | 25 | — | ||||||||||||||||||||||
| Adjusted EBITDA (non-GAAP) | $ | (277) | $ | (465) | $ | (2,689) | $ | (2,063) | ||||||||||||||||||
1 Defined in Non-GAAP Financial Measures later in this letter. | ||||||||||||||||||||||||||
| Q4 2025 Shareholder Letter | © 2026 Rivian. All rights reserved. 23 | ||||||
| Reconciliation of Non-GAAP | ||||||||||||||
| Financial Measures Continued | ||||||||||||||
| (in millions, except per share amounts) | ||||||||||||||
Adjusted Net Loss | Three Months Ended December 31, | Twelve Months Ended December 31, | ||||||||||||||||||||||||
| 2024 | 2025 | 2024 | 2025 | |||||||||||||||||||||||
| Net loss attributable to common stockholders, basic and diluted | $ | (744) | $ | (811) | $ | (4,747) | $ | (3,646) | ||||||||||||||||||
| Stock-based compensation expense | 154 | 188 | 692 | 741 | ||||||||||||||||||||||
| Other (income) expense, net | (1) | (32) | 7 | 54 | ||||||||||||||||||||||
| Loss on convertible note, net | 82 | — | 112 | — | ||||||||||||||||||||||
| Cost of revenue efficiency initiatives | — | — | 193 | — | ||||||||||||||||||||||
| Restructuring expenses | — | — | 30 | 15 | ||||||||||||||||||||||
| Asset impairments and write-offs | — | — | 30 | — | ||||||||||||||||||||||
Joint venture formation expenses and other items1 | 13 | — | 25 | — | ||||||||||||||||||||||
| Adjusted net loss attributable to common stockholders, basic and diluted (non-GAAP) | $ | (496) | $ | (655) | $ | (3,658) | $ | (2,836) | ||||||||||||||||||
1 Defined in Non-GAAP Financial Measures later in this letter. | ||||||||||||||||||||||||||
| Adjusted Net Loss Per Share | Three Months Ended December 31, | Twelve Months Ended December 31, | ||||||||||||||||||||||||
| 2024 | 2025 | 2024 | 2025 | |||||||||||||||||||||||
| Net loss per share attributable to common stockholders, basic and diluted | $ | (0.70) | $ | (0.66) | $ | (4.69) | $ | (3.07) | ||||||||||||||||||
| Stock-based compensation expense per share | 0.15 | 0.15 | 0.68 | 0.62 | ||||||||||||||||||||||
| Other (income) expense, net per share | — | (0.03) | 0.01 | 0.05 | ||||||||||||||||||||||
Loss on convertible note, net per share | 0.08 | — | 0.11 | — | ||||||||||||||||||||||
Cost of revenue efficiency initiatives per share | — | — | 0.19 | — | ||||||||||||||||||||||
Restructuring expenses per share | — | — | 0.03 | 0.01 | ||||||||||||||||||||||
Asset impairments and write-offs per share | — | — | 0.03 | — | ||||||||||||||||||||||
Joint venture formation expenses and other items1 per share | 0.01 | — | 0.02 | — | ||||||||||||||||||||||
| Adjusted net loss per share attributable to common stockholders, basic and diluted (non-GAAP) | $ | (0.46) | * | $ | (0.54) | * | $ | (3.62) | * | $ | (2.39) | |||||||||||||||
| Weighted-average common shares outstanding, basic and diluted (GAAP) | 1,058 | 1,233 | 1,013 | 1,186 | ||||||||||||||||||||||
1 Defined in Non-GAAP Financial Measures later in this letter. | ||||||||||||||||||||||||||
*Does not calculate due to rounding. | ||||||||||||||||||||||||||
| Free Cash Flow | Three Months Ended December 31, | Twelve Months Ended December 31, | ||||||||||||||||||||||||
| 2024 | 2025 | 2024 | 2025 | |||||||||||||||||||||||
Net cash (used)/provided by operating activities | $ | 1,183 | $ | (681) | $ | (1,716) | $ | (779) | ||||||||||||||||||
| Capital expenditures | (327) | (463) | (1,141) | (1,710) | ||||||||||||||||||||||
| Free cash flow (non-GAAP) | $ | 856 | $ | (1,144) | $ | (2,857) | $ | (2,489) | ||||||||||||||||||
| Q4 2025 Shareholder Letter | © 2026 Rivian. All rights reserved. 24 | ||||||
| Quarterly Financial Performance | ||||||||||||||
| Reconciliation of Non-GAAP | ||||||||||||||
| Financial Measures | ||||||||||||||
(in millions) | ||||||||||||||
| Three Months Ended | ||||||||||||||||||||||||||||||||
| December 31, 2024 | March 31, 2025 | June 30, 2025 | September 30, 2025 | December 31, 2025 | ||||||||||||||||||||||||||||
| Adjusted Research and Development Expenses | ||||||||||||||||||||||||||||||||
| Total research and development expenses | $ | 374 | $ | 381 | $ | 410 | $ | 453 | $ | 424 | ||||||||||||||||||||||
| R&D depreciation and amortization expenses | (18) | (17) | (17) | (18) | (20) | |||||||||||||||||||||||||||
| R&D stock-based compensation expenses | (79) | (79) | (77) | (74) | (76) | |||||||||||||||||||||||||||
| Adjusted research and development (non-GAAP) | $ | 277 | $ | 285 | $ | 316 | $ | 361 | $ | 328 | ||||||||||||||||||||||
| Adjusted Selling, General, and Administrative Expenses | ||||||||||||||||||||||||||||||||
| Total selling, general, and administrative expenses | $ | 457 | $ | 480 | $ | 498 | $ | 554 | $ | 529 | ||||||||||||||||||||||
| SG&A depreciation and amortization expenses | (55) | (55) | (52) | (55) | (59) | |||||||||||||||||||||||||||
| SG&A stock-based compensation expenses | (59) | (80) | (81) | (77) | (86) | |||||||||||||||||||||||||||
| Adjusted selling, general, and administrative (non-GAAP) | $ | 343 | $ | 345 | $ | 365 | $ | 422 | $ | 384 | ||||||||||||||||||||||
| Adjusted Operating Expenses | ||||||||||||||||||||||||||||||||
| Total operating expenses | $ | 831 | $ | 861 | $ | 908 | $ | 1,007 | $ | 953 | ||||||||||||||||||||||
| R&D depreciation and amortization expenses | (18) | (17) | (17) | (18) | (20) | |||||||||||||||||||||||||||
| R&D stock-based compensation expenses | (79) | (79) | (77) | (74) | (76) | |||||||||||||||||||||||||||
| SG&A depreciation and amortization expenses | (55) | (55) | (52) | (55) | (59) | |||||||||||||||||||||||||||
| SG&A stock-based compensation expenses | (59) | (80) | (81) | (77) | (86) | |||||||||||||||||||||||||||
| Total adjusted operating expenses (non-GAAP) | $ | 620 | $ | 630 | $ | 681 | $ | 783 | $ | 712 | ||||||||||||||||||||||
| Adjusted EBITDA | ||||||||||||||||||||||||||||||||
| Net loss attributable to common shareholders | $ | (744) | $ | (545) | $ | (1,117) | $ | (1,173) | $ | (811) | ||||||||||||||||||||||
| Interest income, net | (2) | (9) | (3) | (7) | — | |||||||||||||||||||||||||||
| Provision for income taxes | 3 | 2 | 2 | (1) | 3 | |||||||||||||||||||||||||||
| Depreciation and amortization | 218 | 147 | 254 | 198 | 187 | |||||||||||||||||||||||||||
| Stock-based compensation expense | 154 | 183 | 195 | 175 | 188 | |||||||||||||||||||||||||||
| Other (income) expense, net | (1) | (107) | 2 | 191 | (32) | |||||||||||||||||||||||||||
| Loss on convertible note, net | 82 | — | — | — | — | |||||||||||||||||||||||||||
| Restructuring expenses | — | — | — | 15 | — | |||||||||||||||||||||||||||
| Asset impairments and write-offs | — | — | — | — | — | |||||||||||||||||||||||||||
Joint venture formation expenses and other items1 | 13 | — | — | — | — | |||||||||||||||||||||||||||
| Adjusted EBITDA (non-GAAP) | $ | (277) | $ | (329) | $ | (667) | $ | (602) | $ | (465) | ||||||||||||||||||||||
1 Defined in Non-GAAP Financial Measures later in this letter. | ||||||||||||||||||||||||||||||||
| Q4 2025 Shareholder Letter | © 2026 Rivian. All rights reserved. 25 | ||||||
| Quarterly Financial Performance | ||||||||||||||
| Reconciliation of Non-GAAP | ||||||||||||||
| Financial Measures Continued | ||||||||||||||
| (in millions, except per share amounts) | ||||||||||||||
| Three Months Ended | ||||||||||||||||||||||||||||||||
| December 31, 2024 | March 31, 2025 | June 30, 2025 | September 30, 2025 | December 31, 2025 | ||||||||||||||||||||||||||||
| Adjusted Net Loss | ||||||||||||||||||||||||||||||||
| Net loss attributable to common stockholders, basic and diluted | $ | (744) | $ | (545) | $ | (1,117) | $ | (1,173) | $ | (811) | ||||||||||||||||||||||
| Stock-based compensation expense | 154 | 183 | 195 | 175 | 188 | |||||||||||||||||||||||||||
| Other (income) expense, net | (1) | (107) | 2 | 191 | (32) | |||||||||||||||||||||||||||
Loss/(gain) on convertible note, net | 82 | — | — | — | — | |||||||||||||||||||||||||||
| Restructuring expenses | — | — | — | 15 | — | |||||||||||||||||||||||||||
| Asset impairments and write-offs | — | — | — | — | — | |||||||||||||||||||||||||||
Joint venture formation expenses and other items1 | 13 | — | — | — | — | |||||||||||||||||||||||||||
| Adjusted net loss attributable to common stockholders, basic and diluted (non-GAAP) | $ | (496) | $ | (469) | $ | (920) | $ | (792) | $ | (655) | ||||||||||||||||||||||
1 Defined in Non-GAAP Financial Measures later in this letter. | ||||||||||||||||||||||||||||||||
| Adjusted Net Loss Per Share | ||||||||||||||||||||||||||||||||
| Net loss per share attributable to common stockholders, basic and diluted | $ | (0.70) | $ | (0.48) | $ | (0.97) | $ | (0.96) | $ | (0.66) | ||||||||||||||||||||||
| Stock-based compensation expense per share | 0.15 | 0.16 | 0.17 | 0.14 | 0.15 | |||||||||||||||||||||||||||
Other expense, net per share | — | (0.09) | — | 0.16 | (0.03) | |||||||||||||||||||||||||||
Loss/(gain) on convertible note, net per share | 0.08 | — | — | — | — | |||||||||||||||||||||||||||
Restructuring expenses per share | — | — | — | 0.01 | — | |||||||||||||||||||||||||||
Asset impairments and write-offs per share | — | — | — | — | — | |||||||||||||||||||||||||||
Joint venture formation expenses and other items per share 1 | 0.01 | — | — | — | — | |||||||||||||||||||||||||||
| Adjusted net loss per share attributable to common stockholders, basic and diluted (non-GAAP) | $ | (0.46) | * | $ | (0.41) | $ | (0.80) | $ | (0.65) | $ | (0.54) | * | ||||||||||||||||||||
| Weighted-average common shares outstanding, basic and diluted (GAAP) | 1,058 | 1,137 | 1,155 | 1,220 | 1,233 | |||||||||||||||||||||||||||
1 Defined in Non-GAAP Financial Measures later in this letter. | ||||||||||||||||||||||||||||||||
| *Does not calculate due to rounding. | ||||||||||||||||||||||||||||||||
| Free Cash Flow | ||||||||||||||||||||||||||||||||
Net cash (used)/provided by operating activities | $ | 1,183 | $ | (188) | $ | 64 | $ | 26 | $ | (681) | ||||||||||||||||||||||
| Capital expenditures | (327) | (338) | (462) | (447) | (463) | |||||||||||||||||||||||||||
| Free cash flow (non-GAAP) | $ | 856 | $ | (526) | $ | (398) | $ | (421) | $ | (1,144) | ||||||||||||||||||||||
| Q4 2025 Shareholder Letter | © 2026 Rivian. All rights reserved. 26 | ||||||
| Forward-Looking Statements | This shareholder letter and statements that are made on our earnings call contain forward looking statements within the meaning of the Private Securities Litigation Reform Act of 1995. All statements contained in this shareholder letter and made on our earnings call that do not relate to matters of historical fact should be considered forward-looking statements, including without limitation statements regarding our future operations, initiatives and business strategy, including our future financial results, vehicle profitability and future gross profits, our future capital expenditures, the underlying trends in our business (including customer preferences and expectation), macroeconomic and policy conditions, including changes to the availability of government and economic incentives, including tax credits, for electric vehicles, our market opportunity, and our potential for growth, our production ramp and manufacturing capacity expansion and anticipated production levels, our expected future production and deliveries, scaling our service infrastructure, our expected future products and technology and product enhancements, including enhanced performance features and pricing (including the timing of launches and customer deliveries), our roadmap and timeline for the release of our next-generation vehicle autonomy systems, hardware, including RAP1, ACM3 and LiDAR, and software architecture underpinned by artificial intelligence, including LDM, Rivian Assistant, Universal Hands-Free, and RUI, future revenue opportunities, including with respect to the emerging autonomous driving market, our joint venture with Volkswagen Group, including the expected benefits from the partnership and future Volkswagen Group investments, and expected benefits from partnerships with other third parties. These statements are neither promises nor guarantees and involve known and unknown risks, uncertainties, and other important factors that may cause our actual results, performance, or achievements to be materially different from any future results, performance, or achievements expressed or implied by the forward-looking statements, including, but not limited to: our history of losses as a growth-stage company and our limited operating history; we may underestimate or not effectively manage the cost of revenues, operating expenses, and capital expenditures associated with our business and operations; that we will require additional financings to raise capital to support our business; our ability to attract and retain a large number of consumers and maintain strong demand for our vehicles, software and services; the highly competitive automotive and software and services markets in which we operate; demand for and consumers’ willingness to adopt electric vehicles; that our long-term results depend upon our ability to successfully introduce, integrate and market new products and services; that we have experienced and may in the future experience significant delays in the manufacture and delivery of our vehicles; risks associated with the development of complex software and hardware in coordination with our joint venture with Volkswagen Group and our other vendors and suppliers; risks associated with our joint venture with Volkswagen Group; risks associated with additional strategic alliances or acquisitions; we have experienced and could experience in the future cost increases and disruptions in supply of raw materials, components, or equipment used to produce our vehicles; our dependence on establishing and maintaining relationships with vendors and suppliers; our ability to accurately estimate the supply and demand for our vehicles and predict our manufacturing requirements; our ability to scale our business and manage future growth effectively; our ability to maintain our relationship with one customer that has generated a significant portion of our revenues; that we are highly dependent on the services and reputation of our Founder and Chief Executive Officer; the unavailability, reduction or elimination of government and economic incentives and credits for electric vehicles; that we may not be able to obtain or agree on acceptable terms and conditions for all or a significant portion of the government grants, loans, and other incentives, including regulatory credits, for which we apply or are approved for; risks associated with breaches in data security, failure of technology systems, cyber-attacks or other security or privacy-related incidents; risk of intellectual property infringement claims; effect of trade tariffs or other trade barriers; effects of export and import control laws; risks related to motor vehicle safety standards; delays, limitations and risks related to permits and other approvals required to build, operate or expand operations including the construction and development of facilities to support R2; and the other factors described in our filings with the SEC. These factors could cause actual results to differ materially from those indicated by the forward-looking statements made in this shareholder letter. Any such forward-looking statements represent management’s estimates as of the date of this shareholder letter. While we may elect to update such forward-looking statements at some point in the future, except as may be required by law, we disclaim any obligation to do so, even if subsequent events cause our views to change. | ||||
| Q4 2025 Shareholder Letter | © 2026 Rivian. All rights reserved. 27 | ||||||
| Non-GAAP Financial Measures | In addition to our results determined in accordance with generally accepted accounting principles in the United States (“GAAP”), we review financial measures that are not calculated and presented in accordance with GAAP (“non-GAAP financial measures”). We believe our non-GAAP financial measures are useful in evaluating our operating and cash performance. We use the following non-GAAP financial information, collectively, to evaluate our ongoing operations and for internal planning and forecasting purposes. We believe that non-GAAP financial information, when taken collectively, may be helpful to investors, because it focuses on underlying operating results and trends, provides consistency and comparability with past financial performance, and assists in comparisons with other companies, some of which use similar non-GAAP financial information to supplement their GAAP results. The non-GAAP financial information is presented for supplemental informational purposes only, should not be considered a substitute for financial information presented in accordance with GAAP, and may be different from similarly titled non-GAAP measures used by other companies. A reconciliation of each historical non-GAAP financial measure to the most directly comparable financial measure stated in accordance with GAAP is provided above. Reconciliations of forward-looking non-GAAP financial measures are not provided because we are unable to provide such reconciliations without unreasonable effort due to the uncertainty regarding, and potential variability of, certain items, such as stock-based compensation expense and other costs and expenses that may be incurred in the future. Investors are encouraged to review the related GAAP financial measures and the reconciliation of these non-GAAP financial measures to their most directly comparable GAAP financial measures. | ||||
Our non-GAAP financial measures include adjusted research and development expenses, adjusted selling, general, and administrative expenses, total adjusted operating expenses, adjusted EBITDA, adjusted net loss, adjusted net loss per share, and free cash flow. Adjusted research and development expenses is defined as total research and development expenses, less R&D depreciation and amortization expenses and R&D stock-based compensation expenses. Adjusted selling, general, and administrative expenses is defined as total selling, general, and administrative expenses, less SG&A depreciation and amortization expenses and SG&A stock-based compensation expenses. Adjusted operating expenses is defined as total operating expenses, less R&D depreciation and amortization expenses, R&D stock-based compensation expenses, SG&A depreciation and amortization expenses, and SG&A stock-based compensation expenses. | |||||
| Adjusted EBITDA is defined as net loss before interest expense (income), net, provision for income taxes, depreciation and amortization, stock-based compensation, other expense (income), net, and special items. Our management team ordinarily excludes special items from its review of the results of the ongoing operations. Special items is comprised of (i) cost of revenue efficiency initiatives which include costs incurred as we transition between major vehicle programs, cost incurred for negotiations with major suppliers regarding changing demand forecasts or design modifications, and other costs for enhancing capital and cost optimization of the Company (ii) restructuring expenses for significant actions taken by the Company, (iii) significant asset impairments and write-offs, and (iv) other items that we do not necessarily consider to be indicative of earnings from ongoing operating activities, including loss (gain) on convertible note, net, and joint venture formation expenses. Adjusted net loss is defined as net loss before stock-based compensation expense, other (expense) income, and special items. Our management team ordinarily excludes special items from its review of the results of the ongoing operations. Special items is comprised of (i) cost of revenue efficiency initiatives which include costs incurred as we transition between major vehicle programs, cost incurred for negotiations with major suppliers regarding changing demand forecasts or design modifications, and other costs for enhancing capital and cost optimization of the Company (ii) restructuring expenses for significant actions taken by the Company, (iii) significant asset impairments and write-offs, and (iv) other items that we do not necessarily consider to be indicative of earnings from ongoing operating activities, including loss (gain) on convertible note, net, and joint venture formation expenses. Adjusted net loss per share is defined as adjusted net loss divided by the weighted-average common shares outstanding. Free cash flow is defined as net cash used in operating activities less capital expenditures. | |||||
| Q4 2025 Shareholder Letter | © 2026 Rivian. All rights reserved. 28 | ||||||