
.2 TPG and Jackson Establish Long-Term Strategic Partnership January 2026
Important Notices This presentation is being provided by TPG Inc. (“TPG,” “we,” “our,” “us,” or the “Company”) solely for informational purposes for its public stockholders. To the maximum extent permitted by law, none of us or our affiliates, directors, officers, partners, employees, agents, or advisors or any other person accepts any liability related to the use or misuse of the information contained in this presentation. The Company and TPG Operating Group II, L.P. (“TPG Operating Group”) have entered into a definitive agreement (the “Investment Agreement”) providing for a long-term, strategic investment management partnership (the “Transaction”) with Jackson Financial Inc. (“Jackson”) whereby one or more TPG affiliates will serve as the investment manager for select general account assets of subsidiaries of Jackson. In furtherance of the Transaction, pursuant to the Investment Agreement, TPG agreed to issue to a subsidiary of Jackson an aggregate of $150 million of shares of Class A common stock of TPG at the Transaction’s closing (the “Closing”). In addition, TPG, through TPG Operating Group, agreed to purchase an aggregate of $500 million of shares of Jackson common stock at the Closing. The Transaction is subject to customary closing conditions. Throughout this presentation, all current period amounts are preliminary and unaudited and subject to change; totals may not sum due to rounding. For additional important information, please refer to the Endnotes and Definitions in this presentation. Additional Information about the Transaction This presentation does not constitute an offer to sell or the solicitation of an offer to buy any securities or a solicitation of any vote or approval. Proxies will not be solicited in connection with the Transaction discussed herein. This presentation shall also not constitute an offer to sell, or the solicitation of an offer to buy, interests in any of the funds discussed herein. Forward-Looking Statements This presentation contains forward-looking statements based on TPG’s beliefs and assumptions and on information currently available to TPG. Forward-looking statements can be identified by words such as “anticipates,” “intends,” “plans,” “seeks,” “believes,” “estimates,” “expects” and similar references to future periods, or by the inclusion of forecasts or projections. Examples of forward-looking statements include, but are not limited to, statements TPG makes regarding the outlook for our and/or Jackson’s future business and financial performance, estimated operational metrics, business strategy and plans and objectives of management for future operations, including, among other things, statements regarding the expected Closing and terms of the Investment Agreement. Forward-looking statements are based on TPG’s current expectations and assumptions regarding its and/or Jackson’s business, the economy and other future conditions. Because forward-looking statements relate to the future, by their nature, they are subject to inherent uncertainties, risks and changes in circumstances that are difficult to predict. As a result, TPG’s actual results may differ materially from those contemplated by the forward- looking statements. Important factors that could cause actual results to differ materially from those in the forward-looking statements include the inability to complete and recognize the anticipated benefits of the Transaction on the anticipated timeline or at all; TPG’s ability to manage growth and execute its business plan; and regional, national or global political, economic, business, competitive, market and regulatory conditions and uncertainties, among various other risks. These factors should not be construed as exhaustive and should be read in conjunction with the other cautionary statements and risk factors discussed from time to time in the Company’s filings with the Securities and Exchange Commission (the “SEC”), including, but not limited to, those described under the section entitled “Risk Factors” in our Annual Report on Form 10-K filed with the SEC on February 18, 2025 and subsequent filings with the SEC, which can be found at the SEC’s website at http://www.sec.gov. For the reasons described above, TPG cautions you against relying on any forward-looking statements, which should also be read in conjunction with the other cautionary statements that are included elsewhere in this presentation and related public filings. Any forward-looking statement made by TPG in this presentation speaks only as of the date on which TPG makes it. Factors or events that could cause our actual results to differ may emerge from time to time, and it is not possible for TPG to predict all of them. TPG undertakes no obligation to publicly update or revise any forward-looking statement, whether as a result of new information, future developments, or otherwise, except as may be required by law. No recipient should, therefore, rely on these forward-looking statements as representing the views of TPG or its management as of any date subsequent to the date of the presentation. Industry and Market Data This presentation includes market and industry data and forecasts derived from publicly available information, various industry publications, other published industry sources and management’s knowledge of the industry and the good faith estimates of management. This data involves a number of assumptions and limitations, and there can be no assurance these forecasts and estimates will prove accurate in whole or in part. While TPG believes that these sources are reliable, TPG has not independently verified this information. Projections, assumptions and estimates of TPG’s future performance and the future performance of the industry in which TPG operates are necessarily subject to a high degree of uncertainty and risk due to a variety of factors. Non-GAAP Financial Measures This presentation refers to non-GAAP financial measures that are not prepared in accordance with generally accepted accounting principles in the United States (“GAAP”), including fee-related earnings (“FRE”) and after-tax distributable earnings (“After-Tax DE”). These non-GAAP measures should not be considered in isolation from, or as an alternative to, financial measures determined in accordance with GAAP. For definitions of these non-GAAP measures, please refer to the Endnotes and Definitions for additional information. 2
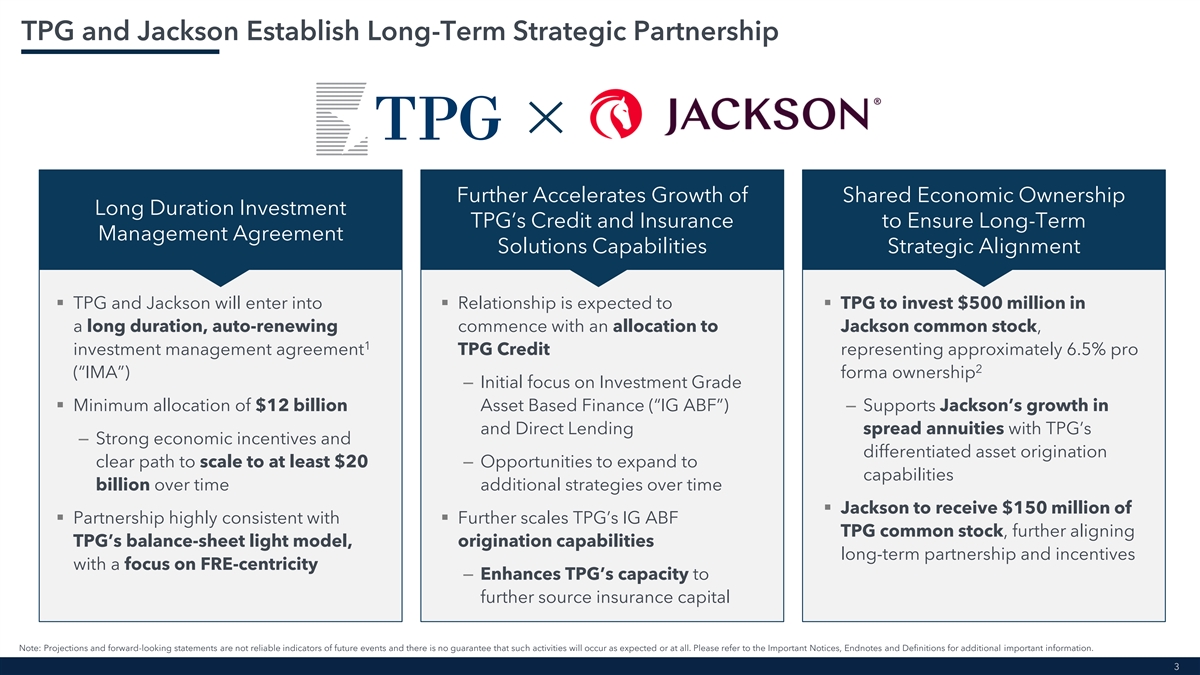
TPG and Jackson Establish Long-Term Strategic Partnership Further Accelerates Growth of Shared Economic Ownership Long Duration Investment TPG’s Credit and Insurance to Ensure Long-Term Management Agreement Solutions Capabilities Strategic Alignment ▪ TPG and Jackson will enter into ▪ Relationship is expected to ▪ TPG to invest $500 million in a long duration, auto-renewing commence with an allocation to Jackson common stock, 1 investment management agreement TPG Credit representing approximately 6.5% pro 2 (“IMA”) forma ownership – Initial focus on Investment Grade ▪ Minimum allocation of $12 billion Asset Based Finance (“IG ABF”) – Supports Jackson’s growth in and Direct Lending spread annuities with TPG’s – Strong economic incentives and differentiated asset origination clear path to scale to at least $20 – Opportunities to expand to capabilities billion over time additional strategies over time ▪ Jackson to receive $150 million of ▪ Partnership highly consistent with ▪ Further scales TPG’s IG ABF TPG common stock, further aligning TPG’s balance-sheet light model, origination capabilities long-term partnership and incentives with a focus on FRE-centricity – Enhances TPG’s capacity to further source insurance capital Note: Projections and forward-looking statements are not reliable indicators of future events and there is no guarantee that such activities will occur as expected or at all. Please refer to the Important Notices, Endnotes and Definitions for additional important information. 3
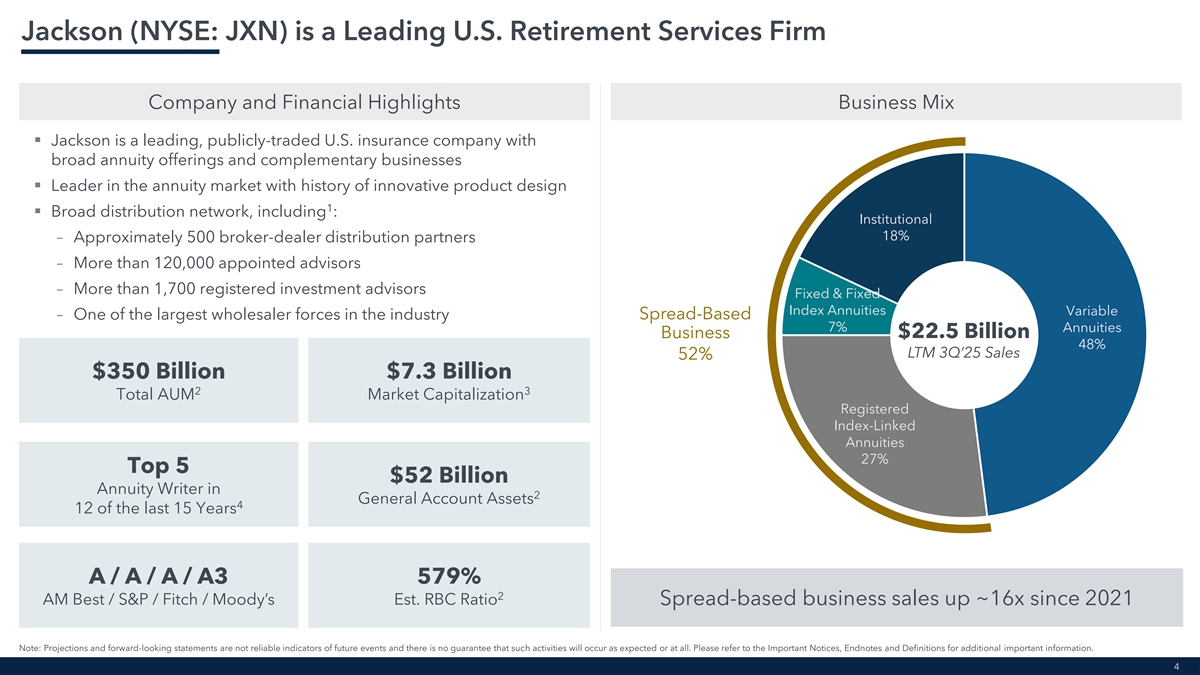
Jackson (NYSE: JXN) is a Leading U.S. Retirement Services Firm Company and Financial Highlights Business Mix ▪ Jackson is a leading, publicly-traded U.S. insurance company with broad annuity offerings and complementary businesses ▪ Leader in the annuity market with history of innovative product design 1 ▪ Broad distribution network, including : Institutional 18% – Approximately 500 broker-dealer distribution partners – More than 120,000 appointed advisors – More than 1,700 registered investment advisors Fixed & Fixed Index Annuities Variable – One of the largest wholesaler forces in the industry Spread-Based 7% Annuities Business $22.5 Billion 48% LTM 3Q’25 Sales 52% $350 Billion $7.3 Billion 2 3 Total AUM Market Capitalization Registered Index-Linked Annuities 27% Top 5 $52 Billion Annuity Writer in 2 General Account Assets 4 12 of the last 15 Years A / A / A / A3 579% 2 AM Best / S&P / Fitch / Moody’s Est. RBC Ratio Spread-based business sales up ~16x since 2021 Note: Projections and forward-looking statements are not reliable indicators of future events and there is no guarantee that such activities will occur as expected or at all. Please refer to the Important Notices, Endnotes and Definitions for additional important information. 4
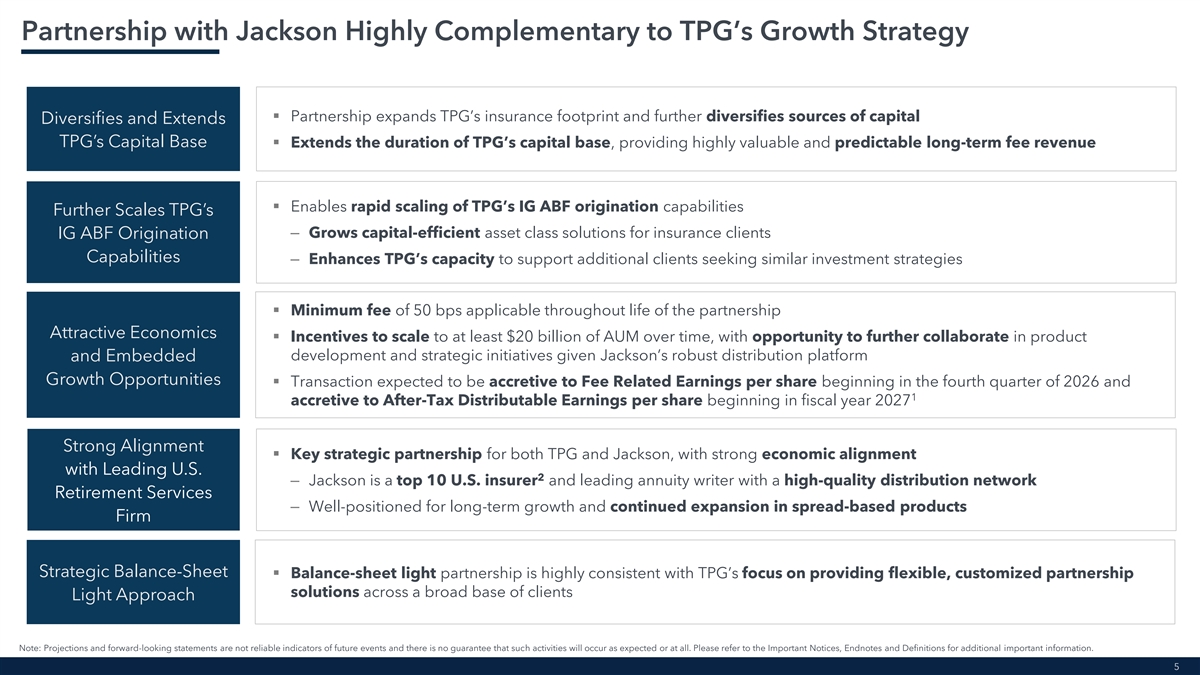
Partnership with Jackson Highly Complementary to TPG’s Growth Strategy ▪ Partnership expands TPG’s insurance footprint and further diversifies sources of capital Diversifies and Extends TPG’s Capital Base▪ Extends the duration of TPG’s capital base, providing highly valuable and predictable long-term fee revenue ▪ Enables rapid scaling of TPG’s IG ABF origination capabilities Further Scales TPG’s – Grows capital-efficient asset class solutions for insurance clients IG ABF Origination Capabilities – Enhances TPG’s capacity to support additional clients seeking similar investment strategies ▪ Minimum fee of 50 bps applicable throughout life of the partnership Attractive Economics ▪ Incentives to scale to at least $20 billion of AUM over time, with opportunity to further collaborate in product development and strategic initiatives given Jackson’s robust distribution platform and Embedded Growth Opportunities ▪ Transaction expected to be accretive to Fee Related Earnings per share beginning in the fourth quarter of 2026 and 1 accretive to After-Tax Distributable Earnings per share beginning in fiscal year 2027 Strong Alignment ▪ Key strategic partnership for both TPG and Jackson, with strong economic alignment with Leading U.S. 2 – Jackson is a top 10 U.S. insurer and leading annuity writer with a high-quality distribution network Retirement Services – Well-positioned for long-term growth and continued expansion in spread-based products Firm Strategic Balance-Sheet ▪ Balance-sheet light partnership is highly consistent with TPG’s focus on providing flexible, customized partnership solutions across a broad base of clients Light Approach Note: Projections and forward-looking statements are not reliable indicators of future events and there is no guarantee that such activities will occur as expected or at all. Please refer to the Important Notices, Endnotes and Definitions for additional important information. 5
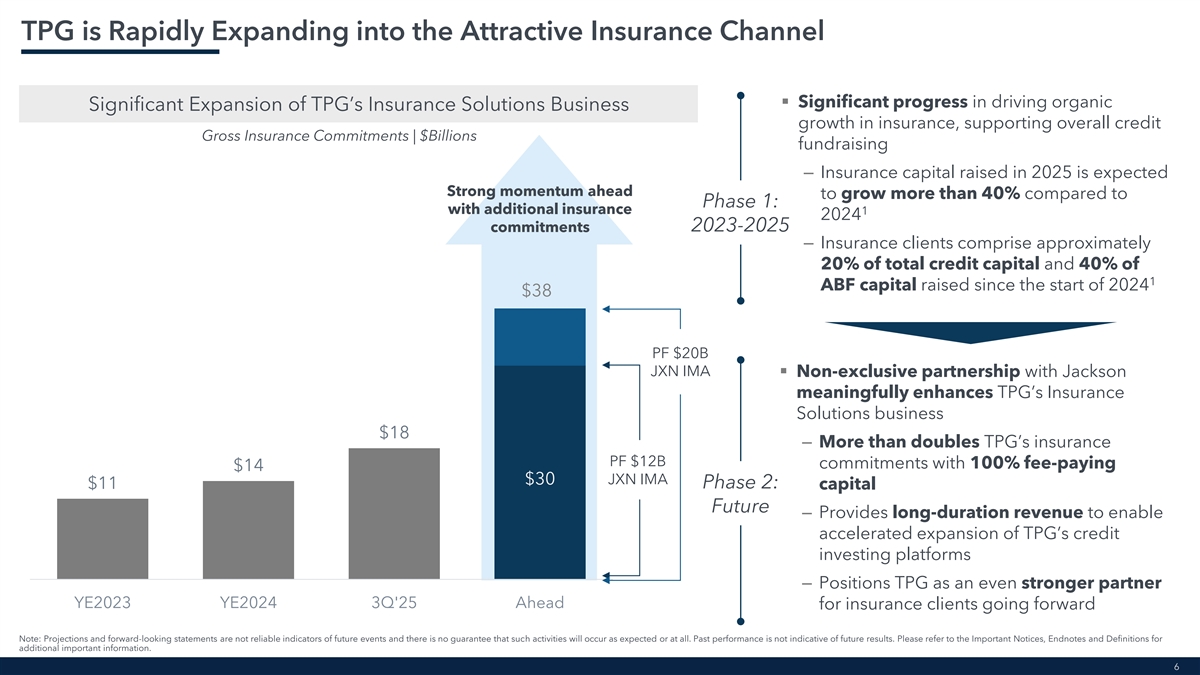
TPG is Rapidly Expanding into the Attractive Insurance Channel ▪ Significant progress in driving organic Significant Expansion of TPG’s Insurance Solutions Business growth in insurance, supporting overall credit Gross Insurance Commitments | $Billions fundraising – Insurance capital raised in 2025 is expected Strong momentum ahead to grow more than 40% compared to Phase 1: with additional insurance 1 2024 2023-2025 commitments – Insurance clients comprise approximately 20% of total credit capital and 40% of 1 ABF capital raised since the start of 2024 $38 PF $20B JXN IMA ▪ Non-exclusive partnership with Jackson meaningfully enhances TPG’s Insurance Solutions business $18 – More than doubles TPG’s insurance PF $12B commitments with 100% fee-paying $14 $30 JXN IMA $11 Phase 2: capital Future – Provides long-duration revenue to enable accelerated expansion of TPG’s credit investing platforms – Positions TPG as an even stronger partner YE2023 YE2024 3Q'25 Ahead for insurance clients going forward Note: Projections and forward-looking statements are not reliable indicators of future events and there is no guarantee that such activities will occur as expected or at all. Past performance is not indicative of future results. Please refer to the Important Notices, Endnotes and Definitions for additional important information. 6
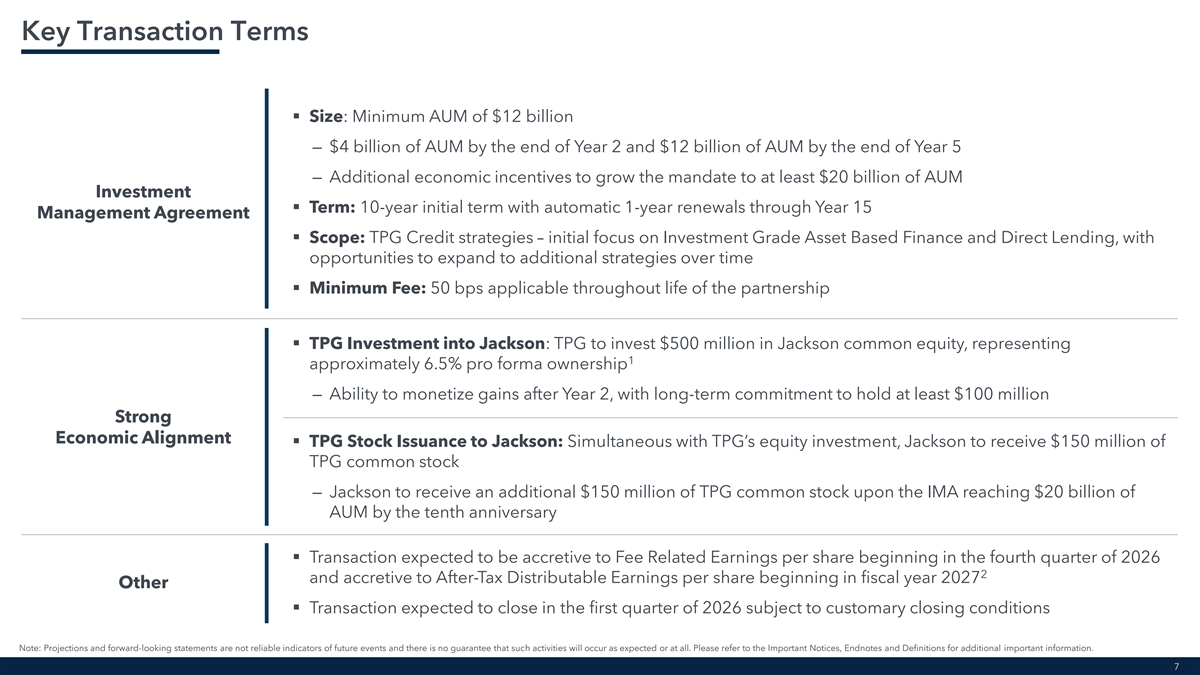
Key Transaction Terms ▪ Size: Minimum AUM of $12 billion — $4 billion of AUM by the end of Year 2 and $12 billion of AUM by the end of Year 5 — Additional economic incentives to grow the mandate to at least $20 billion of AUM Investment ▪ Term: 10-year initial term with automatic 1-year renewals through Year 15 Management Agreement ▪ Scope: TPG Credit strategies – initial focus on Investment Grade Asset Based Finance and Direct Lending, with opportunities to expand to additional strategies over time ▪ Minimum Fee: 50 bps applicable throughout life of the partnership ▪ TPG Investment into Jackson: TPG to invest $500 million in Jackson common equity, representing 1 approximately 6.5% pro forma ownership — Ability to monetize gains after Year 2, with long-term commitment to hold at least $100 million Strong Economic Alignment ▪ TPG Stock Issuance to Jackson: Simultaneous with TPG’s equity investment, Jackson to receive $150 million of TPG common stock — Jackson to receive an additional $150 million of TPG common stock upon the IMA reaching $20 billion of AUM by the tenth anniversary ▪ Transaction expected to be accretive to Fee Related Earnings per share beginning in the fourth quarter of 2026 2 and accretive to After-Tax Distributable Earnings per share beginning in fiscal year 2027 Other ▪ Transaction expected to close in the first quarter of 2026 subject to customary closing conditions Note: Projections and forward-looking statements are not reliable indicators of future events and there is no guarantee that such activities will occur as expected or at all. Please refer to the Important Notices, Endnotes and Definitions for additional important information. 7

TPG Credit Overview
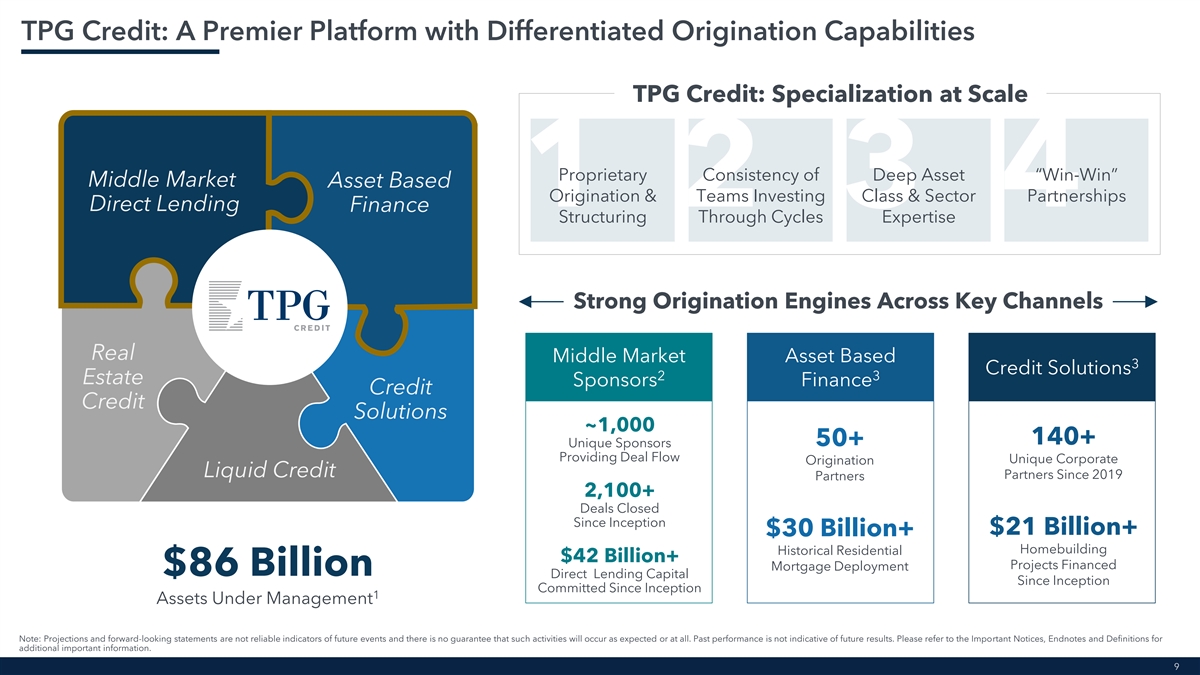
TPG Credit: A Premier Platform with Differentiated Origination Capabilities TPG Credit: Specialization at Scale Proprietary Consistency of Deep Asset “Win-Win” Middle Market Asset Based Origination & Teams Investing Class & Sector Partnerships 1 2 3 4 Direct Lending Finance Structuring Through Cycles Expertise Strong Origination Engines Across Key Channels Real Middle Market Asset Based 3 Credit Solutions 2 3 Estate Sponsors Finance Credit Credit Solutions ~1,000 140+ 50+ Unique Sponsors Providing Deal Flow Unique Corporate Origination Liquid Credit Partners Since 2019 Partners 2,100+ Deals Closed Since Inception $21 Billion+ $30 Billion+ Homebuilding Historical Residential $42 Billion+ Projects Financed Mortgage Deployment $86 Billion Direct Lending Capital Since Inception Committed Since Inception 1 Assets Under Management Note: Projections and forward-looking statements are not reliable indicators of future events and there is no guarantee that such activities will occur as expected or at all. Past performance is not indicative of future results. Please refer to the Important Notices, Endnotes and Definitions for additional important information. 9
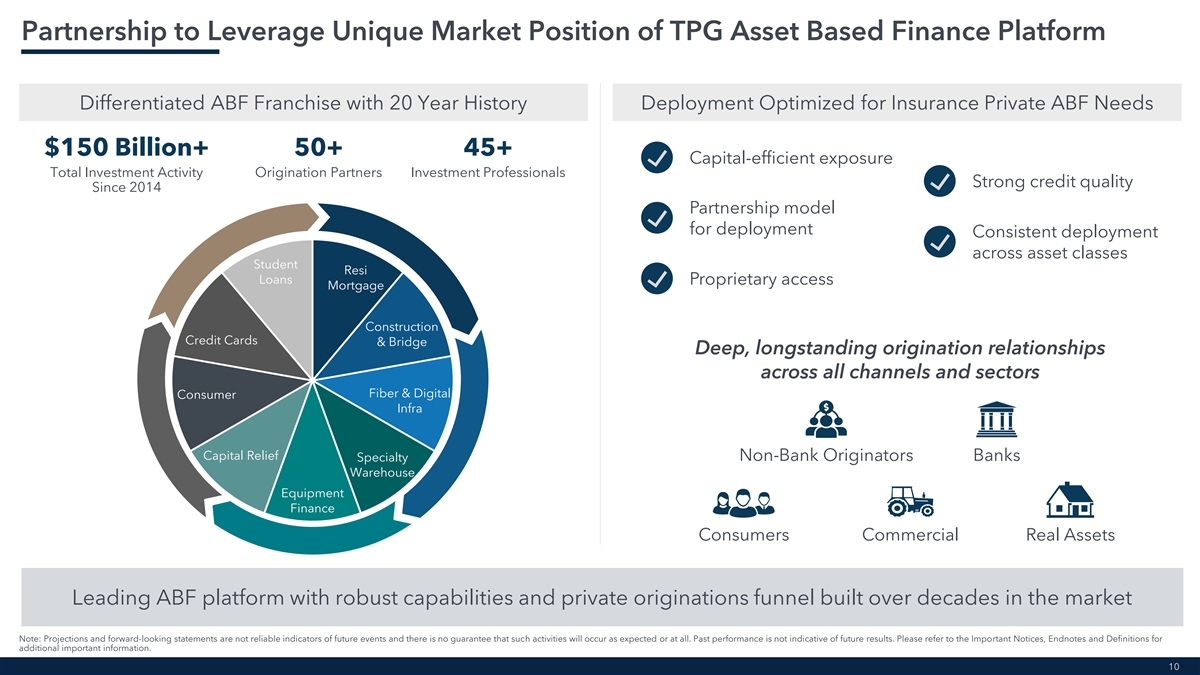
Partnership to Leverage Unique Market Position of TPG Asset Based Finance Platform Differentiated ABF Franchise with 20 Year History Deployment Optimized for Insurance Private ABF Needs $150 Billion+ 50+ 45+ Capital-efficient exposure Total Investment Activity Origination Partners Investment Professionals Strong credit quality Since 2014 Partnership model for deployment Consistent deployment across asset classes Student Resi Loans Proprietary access Mortgage Construction Credit Cards & Bridge Deep, longstanding origination relationships across all channels and sectors Fiber & Digital Consumer Infra Capital Relief Specialty Non-Bank Originators Banks Warehouse Equipment Finance Consumers Commercial Real Assets Leading ABF platform with robust capabilities and private originations funnel built over decades in the market Note: Projections and forward-looking statements are not reliable indicators of future events and there is no guarantee that such activities will occur as expected or at all. Past performance is not indicative of future results. Please refer to the Important Notices, Endnotes and Definitions for additional important information. 10
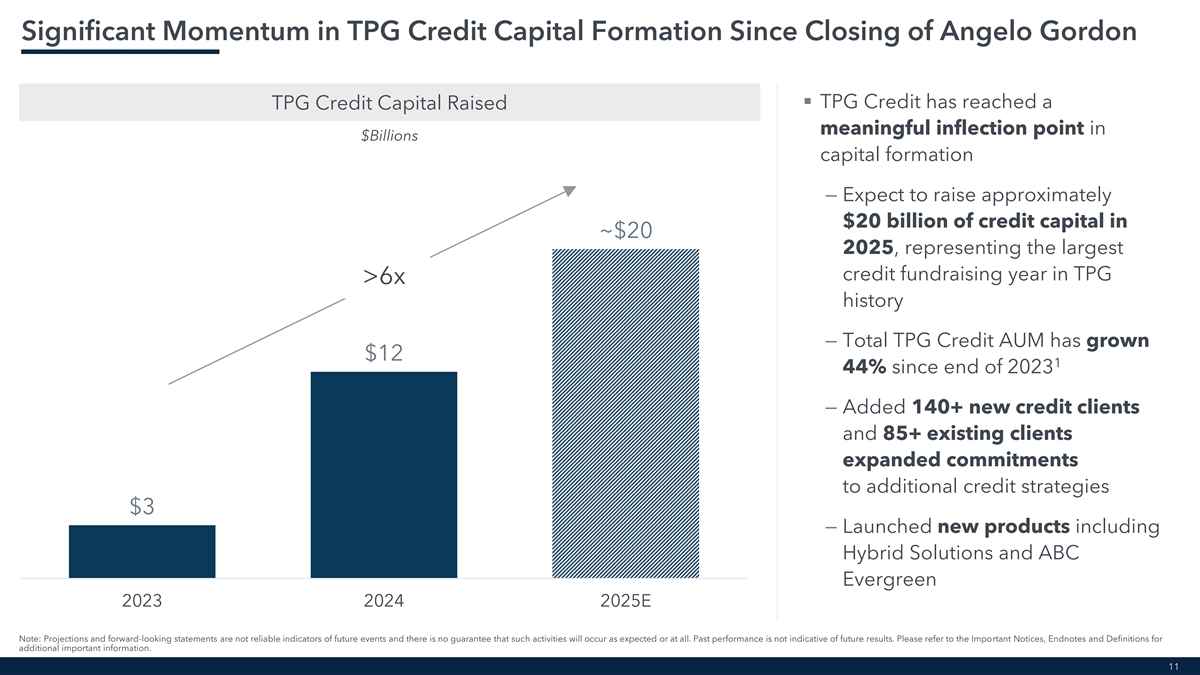
Significant Momentum in TPG Credit Capital Formation Since Closing of Angelo Gordon ▪ TPG Credit has reached a TPG Credit Capital Raised meaningful inflection point in $Billions capital formation – Expect to raise approximately $20 billion of credit capital in ~$20 2025, representing the largest credit fundraising year in TPG >6x history – Total TPG Credit AUM has grown $12 1 44% since end of 2023 – Added 140+ new credit clients and 85+ existing clients expanded commitments to additional credit strategies $3 – Launched new products including Hybrid Solutions and ABC Evergreen 2023 2024 2025E Note: Projections and forward-looking statements are not reliable indicators of future events and there is no guarantee that such activities will occur as expected or at all. Past performance is not indicative of future results. Please refer to the Important Notices, Endnotes and Definitions for additional important information. 11
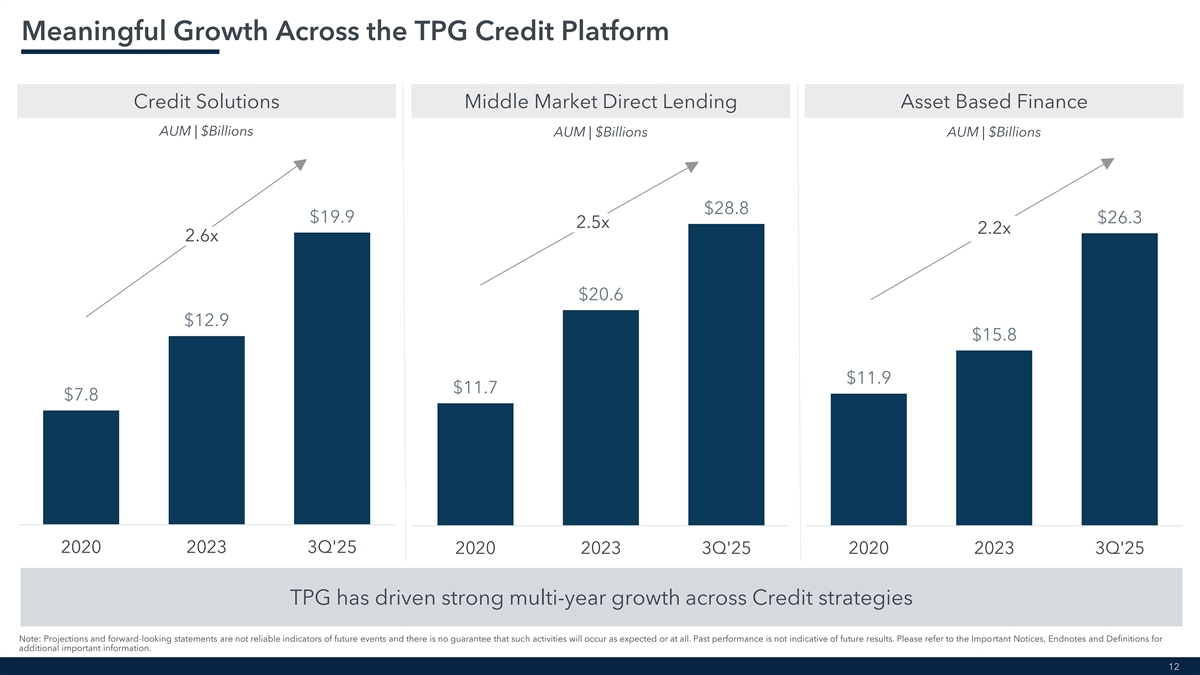
Meaningful Growth Across the TPG Credit Platform Credit Solutions Middle Market Direct Lending Asset Based Finance AUM | $Billions AUM | $Billions AUM | $Billions $28.8 $19.9 $26.3 2.5x 2.2x 2.6x $20.6 $12.9 $15.8 $11.9 $11.7 $7.8 2020 2023 3Q'25 2020 2023 3Q'25 2020 2023 3Q'25 TPG has driven strong multi-year growth across Credit strategies Note: Projections and forward-looking statements are not reliable indicators of future events and there is no guarantee that such activities will occur as expected or at all. Past performance is not indicative of future results. Please refer to the Important Notices, Endnotes and Definitions for additional important information. 12
Endnotes TPG and Jackson Establish Long-Term Strategic Partnership Key Transaction Terms 1. 10-year initial term with automatic 1-year renewals through Year 15. 1. Based on Jackson’s shares outstanding as of October 24, 2025, pro forma for the issuance of common stock to TPG, and the Jackson 30-calendar day unaffected 2. Based on Jackson’s shares outstanding as of October 24, 2025, pro forma for the VWAP for the period ending January 4, 2026. The number of shares to be issuance of common stock to TPG, and the Jackson 30-calendar day unaffected acquired by TPG will be capped at 9.9% of Jackson’s common stock; the $500 VWAP for the period ending January 4, 2026. million investment is subject to reduction to the extent necessary to remain below the cap. Jackson (NYSE: JXN) is a Leading U.S. Retirement Services Firm 2. Based on expected transaction closing in the first quarter of 2026 and TPG’s 1. Jackson’s retail annuities are distributed through approximately 500 broker-dealer expectation of capital contribution over the duration of the partnership. distribution partners and more than 120,000 appointed advisors across the three traditional broker-dealer channels including independent broker-dealers; banks TPG Credit: A Premier Platform with Differentiated Origination Capabilities and other financial institutions; and wirehouses and regional broker-dealers; and more than 1,700 registered investment advisors ( RIAs ) who have a Jackson RIA 1. TPG Credit AUM as of September 30, 2025. Excludes AUM for TRECO and TRTX. agreement and are able to access Jackson advisory solutions through an 2. As of October 2025. outsourced insurance desk. 3. As of December 2025. 2. As of September 30, 2025. 3. Based on Jackson’s share price as of January 2, 2026. Significant Momentum in TPG Credit Capital Formation Since Closing of Angelo 4. Sourced from LIMRA for the full years of 2010 through 2024. Gordon 1. As of September 30, 2025. Partnership with Jackson Highly Complementary to TPG’s Growth Strategy 1. Based on expected transaction closing in the first quarter of 2026 and TPG’s expectation of capital contribution over the duration of the partnership. 2. Based on U.S. life insurance companies ranked by total statutory assets per SNL Financial as of December 31, 2024; Includes funds withheld assets. TPG is Rapidly Expanding into the Attractive Insurance Channel 1. Based on estimated insurance capital raised as of December 31, 2025. 13
Definitions After-tax Distributable Earnings (“After-tax DE”) is a non-GAAP performance measure of our distributable earnings after reflecting the impact of income taxes. We use it to assess how income tax expense affects amounts available to be distributed to our Class A common stockholders and Common Unit holders. After-tax DE differs from U.S. GAAP net income computed in accordance with U.S. GAAP in that it does not include the items described in the definition of DE herein; however, unlike DE, it does reflect the impact of income taxes. After-Tax Income taxes, for purposes of determining After-tax DE, represent the total U.S. GAAP income tax expense adjusted to include only the current tax expense (benefit) calculated on U.S. GAAP net income before income tax and includes the current payable under our Tax Receivable Agreement. Further, the current tax expense (benefit) utilized when determining Distributable After-tax DE reflects the benefit of deductions available to the Company on certain expense items that are excluded from the underlying calculation of DE, such as equity-based Earnings compensation charges. We believe that including the amount currently payable under the Tax Receivable Agreement and utilizing the current income tax expense (benefit), as described above, when determining After-tax DE is meaningful as it increases comparability between periods and more accurately reflects earnings that are available for distribution to shareholders. Assets Under Management (“AUM”) represents the sum of: i. fair value of the investments and financial instruments held by our private equity, credit and real estate funds (including fund-level asset-related leverage), other than as described below, as well as related co-investment vehicles managed or advised by us, plus the capital that we are entitled to call from investors in those funds and vehicles, pursuant to the terms of their respective capital commitments, net of outstanding leverage associated with subscription-related credit facilities, and including capital commitments to funds that have yet to commence their investment periods; ii. the gross amount of assets (including leverage where applicable) for our real estate investment trusts and BDCs; Assets Under iii. the net asset value of certain of our hedge funds; and Management iv. the aggregate par amount of collateral assets, including principal cash, for our collateralized loan obligation vehicles. Our definition of AUM is not based on any definition of AUM that may be set forth in the agreements governing the investment funds that we manage, or calculated pursuant to any regulatory definitions. Note: In the context of page 7 and describing the Transaction, AUM refers to the fair market value of assets acquired by the Jackson portfolio, reduced by the fair market value of any assets that have been realized (each as of the original date of acquisition), and disregarding cash. Capital Raised is the aggregate amount of subscriptions and capital raised by our investment funds and co-investment vehicles during a given period, as well as the senior and subordinated notes issued through our CLOs and equity raised through our perpetual vehicles. We believe this measure is useful to investors as it measures access to capital across Capital Raised TPG and our ability to grow our management fee base. Distributable Earnings (“DE”) is used to assess performance and amounts potentially available for distributions to partners. DE is derived from and reconciled to, but not equivalent to, Distributable its most directly comparable U.S. GAAP measure of net income. DE differs from U.S. GAAP net income computed in accordance with U.S. GAAP in that it does not include (i) unrealized performance allocations and related compensation expense, (ii) unrealized investment income, (iii) equity-based compensation expense, (iv) amortization, (v) net income Earnings (loss) attributable to non-controlling interests in consolidated entities, or (vi) certain other items, such as contingent reserves. Fee-Related Earnings (“FRE”) is a supplemental performance measure and is used to evaluate our business and make resource deployment and other operational decisions. FRE differs from net income computed in accordance with U.S. GAAP in that it adjusts for the items included in the calculation of DE and also adjusts to exclude (i) realized performance Fee-Related allocations and related compensation expense, (ii) realized investment income from investments and financial instruments, (iii) net interest (interest expense less interest income), (iv) Earnings depreciation, and (v) certain non-core income and expenses. We use FRE to measure the ability of our business to cover compensation and operating expenses from fee revenues other than capital allocation-based income. The use of FRE without consideration of the related U.S. GAAP measures is not adequate due to the adjustments described herein. Non-GAAP Financial Measures represent financial measures that are calculated and presented on the basis of methodologies other than in accordance with generally accepted Non-GAAP accounting principles in the United States of America. These non-GAAP financial measures should be considered in addition to and not as a substitute for, or superior to, financial Financial Measures measures presented in accordance with U.S. GAAP. We use these measures to assess the core operating performance of our business. 14