Please wait
0001882850falseQ3--12-31http://apolloreit.com/20250930#RentalRevenuehttp://apolloreit.com/20250930#RentalRevenuehttp://apolloreit.com/20250930#RentalRevenuehttp://apolloreit.com/20250930#RentalRevenueOctober 31, 2029November 30, 2028http://fasb.org/srt/2025#ChiefExecutiveOfficerMember http://fasb.org/srt/2025#ChiefFinancialOfficerMember http://fasb.org/srt/2025#ChiefOperatingOfficerMember0001882850ck0001882850:RealEstateRelatedSecuritiesMember2025-01-012025-09-3000018828502024-07-012024-09-300001882850us-gaap:ValuationTechniqueDiscountedCashFlowMemberus-gaap:FairValueInputsLevel3Memberus-gaap:MeasurementInputDiscountRateMembersrt:MaximumMemberck0001882850:InvestmentsInRealEstateDebtMember2025-09-300001882850ck0001882850:NorthEastMember2024-12-310001882850srt:AffiliatedEntityMemberck0001882850:AccruedPerformanceParticipationAllocationMember2024-12-310001882850us-gaap:ParentMember2025-09-300001882850us-gaap:AboveMarketLeasesMember2024-12-310001882850ck0001882850:CommonClassDMember2024-12-310001882850us-gaap:CommonStockMember2025-09-300001882850ck0001882850:RedeemableNonControllingInterestMember2024-01-012024-09-300001882850ck0001882850:AboveMarketLeaseIntangiblesMember2024-01-012024-12-310001882850ck0001882850:CommonClassFIMemberck0001882850:ApolloARISHoldingsLLCMember2025-07-012025-09-300001882850ck0001882850:WestMember2025-01-012025-09-300001882850srt:AffiliatedEntityMember2025-09-300001882850ck0001882850:WestMember2024-12-310001882850ck0001882850:CommonClassSMember2025-06-300001882850ck0001882850:GeneralAndAdministrativeMembersrt:AffiliatedEntityMember2024-12-310001882850us-gaap:RetainedEarningsMember2023-12-310001882850ck0001882850:ParcWestboroughMember2025-01-012025-09-300001882850us-gaap:SubsequentEventMember2025-10-010001882850ck0001882850:CommonClassAIMember2024-12-310001882850ck0001882850:CommonClassFIMember2025-03-310001882850us-gaap:ParentMember2024-01-012024-09-300001882850us-gaap:CommercialRealEstateMember2024-12-310001882850ck0001882850:CommonClassSMember2024-12-310001882850ck0001882850:AdviserMemberck0001882850:UnregisteredClassESharesMember2025-07-012025-09-300001882850srt:MultifamilyMember2025-09-300001882850ck0001882850:ManagementFeePayableMembersrt:AffiliatedEntityMember2024-12-3100018828502024-01-012024-09-300001882850srt:MaximumMember2025-09-300001882850ck0001882850:JPMRepurchaseFacilityMember2025-09-300001882850ck0001882850:CommonClassAIiiMember2025-07-012025-09-300001882850us-gaap:CorporateNonSegmentMember2025-07-012025-09-300001882850ck0001882850:CommonClassFDMember2025-09-300001882850us-gaap:NoncontrollingInterestMember2023-12-310001882850us-gaap:CommonStockMember2024-07-012024-09-300001882850ck0001882850:CommonClassDMember2025-09-300001882850ck0001882850:RedeemableNonControllingInterestMember2025-07-012025-09-300001882850ck0001882850:CommonClassAIMember2025-09-300001882850srt:MultifamilyMember2025-01-012025-09-300001882850ck0001882850:RedeemableNonControllingInterestMember2024-07-012024-09-300001882850us-gaap:ParentMember2024-06-300001882850ck0001882850:CommonClassAIMember2025-06-300001882850us-gaap:FixedRateResidentialMortgageMember2024-12-310001882850ck0001882850:CommonClassDMember2025-01-012025-03-310001882850ck0001882850:CommonClassSAndClassDMember2025-01-012025-09-300001882850us-gaap:AdditionalPaidInCapitalMember2025-07-012025-09-300001882850ck0001882850:CommonClassAIMember2025-01-012025-03-310001882850us-gaap:LeasesAcquiredInPlaceMarketAdjustmentMember2025-01-012025-09-300001882850ck0001882850:ThreeSevenZeroSevenWNCTenHwyMember2025-01-012025-09-300001882850srt:AffiliatedEntityMember2024-12-310001882850us-gaap:FairValueInputsLevel3Memberck0001882850:InvestmentsInRealEstatesDebtMemberus-gaap:FairValueMeasurementsRecurringMember2024-12-310001882850us-gaap:FairValueInputsLevel3Memberck0001882850:InvestmentsInRealEstatesDebtMemberus-gaap:FairValueMeasurementsRecurringMember2025-01-012025-09-300001882850ck0001882850:JPMorganRepurchaseAgreementMembersrt:MaximumMember2025-09-3000018828502025-06-300001882850ck0001882850:MidwestMember2024-01-012024-12-310001882850ck0001882850:WestMember2024-01-012024-12-310001882850us-gaap:CorporateNonSegmentMember2025-01-012025-09-300001882850ck0001882850:RedeemableNonControllingInterestMember2025-06-300001882850us-gaap:RetainedEarningsMember2024-09-300001882850us-gaap:AdditionalPaidInCapitalMember2024-01-012024-09-300001882850us-gaap:FairValueInputsLevel3Memberus-gaap:ValuationTechniqueDiscountedCashFlowMembersrt:MinimumMemberus-gaap:MeasurementInputDiscountRateMemberck0001882850:InvestmentsInRealEstateDebtMember2024-12-310001882850ck0001882850:CommonClassDMember2025-11-060001882850ck0001882850:CommonClassAIMember2025-03-310001882850ck0001882850:RealEstateRelatedSecuritiesMember2024-01-012024-12-310001882850us-gaap:ParentMember2024-07-012024-09-300001882850us-gaap:ParentMember2025-01-012025-09-300001882850srt:IndustrialPropertyMember2024-12-310001882850us-gaap:NoncontrollingInterestMember2024-06-300001882850us-gaap:RetainedEarningsMember2024-01-012024-09-300001882850us-gaap:FairValueInputsLevel2Memberus-gaap:FairValueMeasurementsRecurringMemberus-gaap:CommercialMortgageBackedSecuritiesMember2024-12-310001882850ck0001882850:ApolloGlobalSecuritiesLLCMember2025-01-012025-09-300001882850ck0001882850:ClassAIOperatingPartnershipUnitsMember2025-07-012025-09-300001882850us-gaap:CommonStockMember2023-12-310001882850ck0001882850:SouthwestMember2025-09-300001882850ck0001882850:CommonClassDMembersrt:MaximumMember2025-09-300001882850ck0001882850:RentalPropertyMember2025-07-012025-09-300001882850ck0001882850:EightSixEightOneWJeffersonStreetMember2025-01-012025-09-300001882850ck0001882850:RentalPropertyMember2025-01-012025-09-300001882850us-gaap:FurnitureAndFixturesMember2025-01-012025-09-300001882850ck0001882850:LoanProceedsHeldByServicerMember2025-09-300001882850us-gaap:AdditionalPaidInCapitalMember2025-09-300001882850us-gaap:LeasesAcquiredInPlaceMember2024-12-310001882850us-gaap:FixedRateResidentialMortgageMember2025-01-012025-09-300001882850ck0001882850:FourFiveFiveThreeCayceRoadMember2024-01-012024-12-310001882850us-gaap:FixedRateResidentialMortgageMember2025-09-300001882850ck0001882850:BarclaysRepurchaseFacilityMember2025-01-012025-09-300001882850ck0001882850:StraightLineRentReceivableMember2025-09-300001882850us-gaap:OperatingSegmentsMemberck0001882850:RealEstateDebtSegmentMember2024-12-310001882850us-gaap:RestrictedStockMember2024-12-310001882850ck0001882850:AccruedStockholderServicingFeeMembersrt:AffiliatedEntityMember2025-09-300001882850us-gaap:FairValueInputsLevel3Memberck0001882850:InvestmentsInRealEstatesDebtMemberus-gaap:FairValueMeasurementsRecurringMember2025-09-300001882850ck0001882850:MidAtlanticMember2025-09-300001882850us-gaap:FixedRateResidentialMortgageMember2024-01-012024-12-310001882850ck0001882850:CommonClassSMember2025-09-300001882850ck0001882850:DistributionReinvestmentPlanMembersrt:MaximumMember2025-09-300001882850us-gaap:CommonStockMember2024-06-300001882850ck0001882850:CommonClassIMember2025-03-310001882850ck0001882850:ClassAIOperatingPartnershipUnitsMember2022-12-220001882850ck0001882850:CommonClassAIMember2025-11-060001882850ck0001882850:MidAtlanticMember2024-01-012024-12-310001882850us-gaap:OperatingSegmentsMemberck0001882850:RealEstateDebtSegmentMember2024-01-012024-09-300001882850ck0001882850:CommonClassSDAndISharesMember2025-01-012025-09-300001882850ck0001882850:CommonClassEMember2025-01-012025-09-300001882850ck0001882850:MezzanineLoansMember2024-01-012024-12-310001882850us-gaap:RestrictedStockMember2025-07-012025-09-300001882850ck0001882850:RedeemableNonControllingInterestMember2025-01-012025-09-300001882850us-gaap:FairValueMeasurementsRecurringMemberus-gaap:CommercialMortgageBackedSecuritiesMember2024-12-310001882850ck0001882850:MixedUseMember2025-01-012025-09-300001882850us-gaap:PreferredStockMember2024-01-012024-09-300001882850us-gaap:OperatingSegmentsMemberck0001882850:RealEstateSegmentMember2024-12-310001882850ck0001882850:ClassAIiiSharesMember2025-09-300001882850us-gaap:LeaseholdsAndLeaseholdImprovementsMember2025-01-012025-09-300001882850ck0001882850:CommonClassIMember2025-01-012025-03-310001882850ck0001882850:RentalPropertyMemberus-gaap:OperatingSegmentsMemberck0001882850:RealEstateSegmentMember2025-01-012025-09-300001882850ck0001882850:TenantImprovementsMember2024-01-012024-12-310001882850ck0001882850:SoutheastMember2024-01-012024-12-310001882850srt:HotelMember2024-12-310001882850us-gaap:ParentMember2025-06-300001882850ck0001882850:CommonClassEMember2024-12-310001882850ck0001882850:MidwestMember2025-09-300001882850ck0001882850:JPMRepurchaseFacilityMember2024-01-012024-12-310001882850ck0001882850:SoutheastMember2025-09-300001882850ck0001882850:ClassAIiiSharesMember2025-07-012025-09-300001882850ck0001882850:WestMember2025-09-300001882850us-gaap:LandBuildingsAndImprovementsMembersrt:MinimumMember2025-09-300001882850us-gaap:CommonStockMember2025-07-012025-09-300001882850ck0001882850:MidwestMember2024-12-310001882850us-gaap:FairValueInputsLevel2Memberus-gaap:FairValueMeasurementsRecurringMemberus-gaap:CommercialMortgageBackedSecuritiesMember2025-09-300001882850ck0001882850:OrganizationAndOfferingMembersrt:AffiliatedEntityMember2025-09-300001882850ck0001882850:MezzanineLoansMember2025-09-300001882850ck0001882850:AdviserMemberck0001882850:UnregisteredClassEUnitsMember2025-07-012025-09-300001882850us-gaap:CommercialRealEstateMember2025-01-012025-09-300001882850ck0001882850:ProductionStudioMember2024-01-012024-12-310001882850ck0001882850:CommonClassIMember2025-06-300001882850us-gaap:ValuationTechniqueDiscountedCashFlowMemberus-gaap:FairValueInputsLevel3Memberus-gaap:MeasurementInputDiscountRateMemberck0001882850:InvestmentsInRealEstateDebtMember2024-12-310001882850ck0001882850:DataCenterMember2024-01-012024-12-310001882850ck0001882850:JPMorganRepurchaseAgreementMembersrt:MinimumMember2025-09-300001882850ck0001882850:CommonClassAIiiMember2024-12-310001882850srt:MaximumMember2025-01-012025-09-300001882850ck0001882850:CommonClassEMember2025-09-300001882850srt:HotelMember2025-09-300001882850ck0001882850:SelfStorageMember2024-01-012024-12-310001882850ck0001882850:SelfStorageMember2025-01-012025-09-300001882850ck0001882850:CommonClassDAndFDSharesMemberck0001882850:ApolloGlobalSecuritiesLLCMember2025-01-012025-09-300001882850us-gaap:RetainedEarningsMember2024-07-012024-09-300001882850us-gaap:NoncontrollingInterestMember2025-06-300001882850ck0001882850:MidAtlanticMember2024-12-310001882850ck0001882850:CommonClassDMemberck0001882850:ApolloGlobalSecuritiesLLCMember2025-01-012025-09-300001882850ck0001882850:CommonClassSAndFSSharesMemberck0001882850:ApolloGlobalSecuritiesLLCMember2025-01-012025-09-300001882850ck0001882850:CommonClassDMember2025-06-300001882850srt:MultifamilyMember2024-12-310001882850ck0001882850:CommonClassFIMemberck0001882850:ApolloARISHoldingsLLCMember2025-01-012025-09-300001882850ck0001882850:AdviserMemberck0001882850:CommonClassFIAndAISharesMember2025-01-012025-09-300001882850ck0001882850:CommonClassFIMember2025-01-012025-09-300001882850ck0001882850:CommonClassFIMember2025-04-012025-06-300001882850ck0001882850:InterestReceivableMember2024-12-310001882850ck0001882850:RealEstateRelatedSecuritiesMember2024-12-310001882850ck0001882850:CommonClassFIMember2025-11-060001882850us-gaap:NoncontrollingInterestMember2024-01-012024-09-3000018828502024-01-012024-12-310001882850us-gaap:RetainedEarningsMember2025-01-012025-09-300001882850ck0001882850:CommonClassEMember2025-03-310001882850us-gaap:LandAndLandImprovementsMember2024-01-012024-12-310001882850ck0001882850:JPMRepurchaseFacilityMember2024-12-310001882850ck0001882850:CommonClassAIMember2025-07-012025-09-300001882850ck0001882850:SelfStorageMember2024-12-310001882850us-gaap:AdditionalPaidInCapitalMember2024-09-300001882850ck0001882850:MezzanineLoansMember2024-12-310001882850us-gaap:CommonStockMember2024-09-300001882850us-gaap:NoncontrollingInterestMember2025-09-300001882850ck0001882850:BofARepurchaseFacilityMember2025-09-300001882850ck0001882850:OtherMember2025-09-300001882850us-gaap:OperatingSegmentsMemberck0001882850:RealEstateSegmentMember2024-01-012024-09-300001882850ck0001882850:LyraClientSolutionsHoldingsLLCMember2025-01-012025-09-300001882850ck0001882850:CommonClassAIIMember2024-12-310001882850ck0001882850:CommonClassSMember2025-07-012025-09-300001882850ck0001882850:RealEstateIntangiblesNetMember2024-12-310001882850us-gaap:RetainedEarningsMember2025-09-300001882850ck0001882850:RentalPropertyMemberus-gaap:OperatingSegmentsMemberck0001882850:RealEstateSegmentMember2024-01-012024-09-300001882850us-gaap:RetainedEarningsMember2024-06-300001882850ck0001882850:MidwestMember2025-01-012025-09-300001882850ck0001882850:CommonClassDMember2025-04-012025-06-300001882850ck0001882850:AdviserMember2025-01-012025-09-300001882850ck0001882850:CommonClassFIMember2025-06-300001882850us-gaap:OperatingSegmentsMemberck0001882850:RealEstateDebtSegmentMember2024-07-012024-09-3000018828502024-12-310001882850us-gaap:OperatingSegmentsMemberck0001882850:RealEstateSegmentMember2025-01-012025-09-300001882850ck0001882850:CommonClassDMember2025-03-310001882850us-gaap:AdditionalPaidInCapitalMember2024-12-310001882850ck0001882850:CommonClassAIIMember2025-09-300001882850us-gaap:NoncontrollingInterestMember2025-01-012025-09-300001882850ck0001882850:RealEstateIntangiblesNetMember2025-09-300001882850ck0001882850:CommonClassFIMember2025-09-300001882850ck0001882850:MezzanineLoansMember2025-01-012025-09-300001882850ck0001882850:CommonClassEMember2025-04-012025-06-300001882850ck0001882850:CommonClassIMember2025-04-012025-06-300001882850ck0001882850:ClassAIiiSharesMember2025-01-012025-03-310001882850us-gaap:SubsequentEventMember2025-10-012025-10-010001882850ck0001882850:CommonClassAIiiMember2025-11-060001882850ck0001882850:ProductionStudioMember2025-01-012025-09-300001882850us-gaap:NoncontrollingInterestMember2025-07-012025-09-300001882850us-gaap:RetainedEarningsMember2024-12-310001882850ck0001882850:CommonClassFIMember2024-12-310001882850us-gaap:FairValueInputsLevel3Memberus-gaap:ValuationTechniqueDiscountedCashFlowMemberus-gaap:MeasurementInputDiscountRateMembersrt:MaximumMemberck0001882850:InvestmentsInRealEstateDebtMember2024-12-310001882850ck0001882850:StraightLineRentReceivableMember2024-12-310001882850us-gaap:ParentMember2025-07-012025-09-300001882850ck0001882850:InPlaceLeaseIntangiblesMember2024-01-012024-12-310001882850ck0001882850:MidAtlanticMember2025-01-012025-09-300001882850ck0001882850:SouthwestMember2024-01-012024-12-310001882850us-gaap:LeasesAcquiredInPlaceMarketAdjustmentMember2024-12-310001882850ck0001882850:CommonClassDMember2025-01-012025-09-300001882850ck0001882850:TheBeckettMember2024-01-012024-12-310001882850us-gaap:ParentMember2024-12-310001882850ck0001882850:LifeScienceMember2024-12-310001882850ck0001882850:CommonClassAIMember2025-04-012025-06-300001882850us-gaap:NoncontrollingInterestMember2024-09-300001882850ck0001882850:CommonClassFSMember2024-12-310001882850ck0001882850:ClassAIiiSharesMember2025-04-012025-06-300001882850ck0001882850:ParcWestboroughMember2025-01-012025-09-300001882850us-gaap:LeasesAcquiredInPlaceMarketAdjustmentMember2025-09-300001882850ck0001882850:CommonClassEMember2025-07-012025-09-300001882850ck0001882850:NorthEastMember2025-09-300001882850ck0001882850:AccruedStockholderServicingFeeMembersrt:AffiliatedEntityMember2024-12-310001882850ck0001882850:RentalPropertyMember2024-07-012024-09-300001882850ck0001882850:BarclaysRepurchaseFacilityMember2025-01-012025-09-300001882850ck0001882850:AdviserMemberck0001882850:ClassAIiiSharesMember2025-01-012025-09-300001882850us-gaap:FairValueMeasurementsRecurringMemberus-gaap:CommercialMortgageBackedSecuritiesMember2025-09-300001882850us-gaap:AdditionalPaidInCapitalMember2025-01-012025-09-300001882850ck0001882850:CommonClassSMember2025-11-060001882850srt:IndustrialPropertyMember2025-01-012025-09-300001882850ck0001882850:RealEstateRelatedSecuritiesMember2025-09-300001882850us-gaap:ParentMember2024-09-300001882850ck0001882850:DataCenterMember2025-01-012025-09-300001882850srt:MultifamilyMember2024-01-012024-12-310001882850us-gaap:RetainedEarningsMember2025-07-012025-09-300001882850ck0001882850:CommonClassFSMember2025-09-300001882850us-gaap:LeasesAcquiredInPlaceMember2025-09-300001882850ck0001882850:OtherMember2024-12-310001882850ck0001882850:RentalPropertyMember2024-01-012024-09-300001882850us-gaap:OperatingSegmentsMemberck0001882850:RealEstateDebtSegmentMember2025-07-012025-09-300001882850ck0001882850:FurnitureFixturesAndEquipmentMember2025-09-300001882850ck0001882850:CommonClassAIiiMember2025-09-300001882850us-gaap:CommercialRealEstateMember2024-01-012024-12-310001882850ck0001882850:InPlaceLeaseIntangiblesMember2025-01-012025-09-300001882850us-gaap:AdditionalPaidInCapitalMember2023-12-310001882850ck0001882850:DeferredFinancingCostsNetMember2025-09-300001882850ck0001882850:NorthEastMember2024-01-012024-12-310001882850us-gaap:RestrictedStockMember2025-01-012025-09-300001882850ck0001882850:CommonClassAIMember2025-01-012025-09-300001882850us-gaap:AdditionalPaidInCapitalMember2024-06-300001882850ck0001882850:RedeemableNonControllingInterestMember2023-12-3100018828502024-09-300001882850ck0001882850:UnregisteredClassESharesMember2025-07-012025-09-300001882850srt:HotelMember2024-01-012024-12-310001882850srt:MinimumMemberus-gaap:BuildingMember2025-09-300001882850ck0001882850:ClassAIiiSharesMember2025-01-012025-09-300001882850srt:IndustrialPropertyMember2025-09-300001882850ck0001882850:DataCenterMember2024-12-310001882850ck0001882850:CommonClassIAndFISharesMemberck0001882850:ApolloGlobalSecuritiesLLCMember2025-01-012025-09-300001882850ck0001882850:CommonClassDMember2025-07-012025-09-300001882850ck0001882850:JPMRepurchaseFacilityMember2025-01-012025-09-300001882850ck0001882850:CommonClassIMember2025-01-012025-09-300001882850ck0001882850:AdviserMember2025-09-300001882850ck0001882850:CommonClassIMember2025-11-060001882850ck0001882850:ClassAIOperatingPartnershipUnitsMember2022-12-222022-12-220001882850ck0001882850:UnregisteredClassEUnitsMember2025-01-012025-09-300001882850ck0001882850:ClassAIiiSharesMember2025-06-300001882850ck0001882850:LifeScienceMember2025-01-012025-09-300001882850us-gaap:CorporateNonSegmentMember2024-12-310001882850us-gaap:OperatingSegmentsMemberck0001882850:RealEstateSegmentMember2024-07-012024-09-300001882850us-gaap:RetainedEarningsMember2025-06-3000018828502025-09-300001882850ck0001882850:RedeemableNonControllingInterestMember2024-12-310001882850ck0001882850:NorthEastMember2025-01-012025-09-300001882850ck0001882850:LifeScienceMember2024-01-012024-12-310001882850ck0001882850:CommonClassFDMember2024-12-310001882850us-gaap:FairValueInputsLevel3Memberus-gaap:FairValueMeasurementsRecurringMemberus-gaap:CommercialMortgageBackedSecuritiesMember2024-12-310001882850ck0001882850:CommonClassFSFDAndFISharesMember2025-01-012025-09-300001882850us-gaap:RestrictedStockMember2025-09-300001882850ck0001882850:MixedUseMember2025-09-300001882850ck0001882850:SouthwestMember2025-01-012025-09-300001882850us-gaap:OperatingSegmentsMemberck0001882850:RealEstateDebtSegmentMember2025-01-012025-09-300001882850ck0001882850:LifeScienceMember2025-09-300001882850ck0001882850:TwoEightSixFiveCharterStreetMember2025-01-012025-09-300001882850ck0001882850:RedeemableNonControllingInterestMember2024-06-300001882850us-gaap:BuildingMembersrt:MaximumMember2025-09-300001882850ck0001882850:ClassAIiiSharesMember2025-03-310001882850ck0001882850:CommonClassEMember2025-06-300001882850us-gaap:AboveMarketLeasesMember2025-09-300001882850us-gaap:LandAndLandImprovementsMember2025-01-012025-09-300001882850ck0001882850:OrganizationAndOfferingMembersrt:AffiliatedEntityMember2024-12-310001882850ck0001882850:InterestReceivableMember2025-09-300001882850ck0001882850:CommonClassSMember2025-03-310001882850ck0001882850:ProductionStudioMember2025-09-300001882850us-gaap:CommercialRealEstateMember2025-09-300001882850ck0001882850:CommonClassSMemberck0001882850:ApolloGlobalSecuritiesLLCMember2025-01-012025-09-300001882850ck0001882850:AboveMarketLeaseIntangiblesMember2025-01-012025-09-300001882850ck0001882850:CommonClassFIMember2025-07-012025-09-300001882850ck0001882850:JPMorganRepurchaseAgreementMember2025-01-012025-09-300001882850us-gaap:BuildingAndBuildingImprovementsMember2024-01-012024-12-310001882850us-gaap:CommonStockMember2024-12-310001882850us-gaap:AdditionalPaidInCapitalMember2025-06-300001882850us-gaap:OperatingSegmentsMemberck0001882850:RealEstateSegmentMember2025-09-300001882850ck0001882850:RentalPropertyMemberus-gaap:OperatingSegmentsMemberck0001882850:RealEstateSegmentMember2024-07-012024-09-300001882850ck0001882850:CommonClassEMember2025-11-060001882850ck0001882850:UnregisteredClassESharesMember2025-01-012025-09-300001882850ck0001882850:SouthwestMember2024-12-310001882850ck0001882850:CommonClassFIMember2025-01-012025-03-310001882850ck0001882850:AdviserMembersrt:ScenarioForecastMemberck0001882850:ClassAIiiSharesMember2023-04-012027-01-020001882850us-gaap:FairValueInputsLevel3Memberus-gaap:ValuationTechniqueDiscountedCashFlowMemberus-gaap:MeasurementInputDiscountRateMembersrt:MinimumMemberck0001882850:InvestmentsInRealEstateDebtMember2025-09-300001882850ck0001882850:CommonClassAIiiMember2025-01-012025-09-300001882850us-gaap:NoncontrollingInterestMember2024-07-012024-09-300001882850ck0001882850:TwoThousandAndTwentyTwoEquityIncentivePlanMembersrt:MaximumMember2025-09-300001882850ck0001882850:RedeemableNonControllingInterestMember2025-09-300001882850us-gaap:CommonStockMember2025-01-012025-09-300001882850ck0001882850:AdviserMemberck0001882850:CommonClassSDAndISharesMember2025-01-012025-09-300001882850ck0001882850:CommonClassEMember2025-01-012025-03-310001882850ck0001882850:MortgageLoansMember2025-09-3000018828502025-07-012025-09-300001882850us-gaap:FurnitureAndFixturesMember2024-01-012024-12-310001882850us-gaap:CommonStockMember2025-06-300001882850ck0001882850:CommonClassIMember2025-07-012025-09-300001882850us-gaap:ValuationTechniqueDiscountedCashFlowMemberus-gaap:FairValueInputsLevel3Memberus-gaap:MeasurementInputDiscountRateMemberck0001882850:InvestmentsInRealEstateDebtMember2025-09-300001882850ck0001882850:CommonClassIMember2025-09-300001882850srt:IndustrialPropertyMember2024-01-012024-12-310001882850ck0001882850:DataCenterMember2025-09-300001882850ck0001882850:RedeemableNonControllingInterestMember2024-09-300001882850ck0001882850:ClassAIOperatingPartnershipUnitsMember2025-01-012025-09-300001882850us-gaap:AdditionalPaidInCapitalMember2024-07-012024-09-300001882850ck0001882850:SoutheastMember2024-12-310001882850srt:AffiliatedEntityMemberck0001882850:AccruedPerformanceParticipationAllocationMember2025-09-300001882850us-gaap:CorporateNonSegmentMember2024-01-012024-09-300001882850ck0001882850:UnregisteredClassEUnitsMember2025-07-012025-09-300001882850srt:MaximumMemberck0001882850:CommonClassSMember2025-09-300001882850ck0001882850:GeneralAndAdministrativeMembersrt:AffiliatedEntityMember2025-09-300001882850srt:HotelMember2025-01-012025-09-300001882850ck0001882850:ProductionStudioMember2024-12-310001882850us-gaap:FairValueInputsLevel3Memberus-gaap:FairValueMeasurementsRecurringMemberus-gaap:CommercialMortgageBackedSecuritiesMember2025-09-300001882850us-gaap:OperatingSegmentsMemberck0001882850:RealEstateDebtSegmentMember2025-09-300001882850us-gaap:NoncontrollingInterestMember2024-12-310001882850us-gaap:IPOMembersrt:MaximumMember2025-09-300001882850ck0001882850:CommonClassIMember2024-12-310001882850us-gaap:CorporateNonSegmentMember2024-07-012024-09-300001882850ck0001882850:RentalPropertyMemberus-gaap:OperatingSegmentsMemberck0001882850:RealEstateSegmentMember2025-07-012025-09-300001882850ck0001882850:AdviserMember2024-12-310001882850ck0001882850:BarclaysRepurchaseFacilityMember2025-09-300001882850ck0001882850:SoutheastMember2025-01-012025-09-3000018828502025-01-012025-09-300001882850us-gaap:CorporateNonSegmentMember2025-09-300001882850ck0001882850:MixedUseMember2024-01-012024-12-310001882850ck0001882850:ClassAIiiSharesMember2024-12-310001882850us-gaap:PreferredStockMemberus-gaap:NoncontrollingInterestMember2024-01-012024-09-300001882850ck0001882850:ManagementFeePayableMembersrt:AffiliatedEntityMember2025-09-300001882850us-gaap:ParentMember2023-12-310001882850us-gaap:OperatingSegmentsMemberck0001882850:RealEstateSegmentMember2025-07-012025-09-300001882850us-gaap:LandBuildingsAndImprovementsMembersrt:MaximumMember2025-09-300001882850ck0001882850:SelfStorageMember2025-09-300001882850us-gaap:BuildingAndBuildingImprovementsMember2025-01-012025-09-300001882850us-gaap:CommonStockMember2024-01-012024-09-3000018828502024-06-300001882850ck0001882850:CommonClassSMember2025-01-012025-09-3000018828502023-12-31ck0001882850:Propertyxbrli:pureck0001882850:Securitiesck0001882850:Positionsck0001882850:Shareholdersxbrli:sharesck0001882850:Investmentiso4217:USDck0001882850:Segments
UNITED STATES
SECURITIES AND EXCHANGE COMMISSION
Washington, D.C. 20549
FORM 10-Q
(Mark One)
|
|
|
☒ |
QUARTERLY REPORT PURSUANT TO SECTION 13 OR 15(d) OF THE SECURITIES EXCHANGE ACT OF 1934 |
For the quarterly period ended September 30, 2025
OR
|
|
|
☐ |
TRANSITION REPORT PURSUANT TO SECTION 13 OR 15(d) OF THE SECURITIES EXCHANGE ACT OF 1934 FOR THE TRANSITION PERIOD FROM TO |
Commission File Number: 000-56656
Apollo Realty Income Solutions, Inc.
(Exact name of Registrant as specified in its Charter)
|
|
|
Maryland |
87-2557571 |
(State or other jurisdiction of incorporation or organization) |
(I.R.S. Employer Identification No.) |
9 West 57th Street, 42nd Floor, New York, NY |
10019 |
(Address of principal executive offices) |
(Zip Code) |
Registrant's telephone number, including area code: (212) 515-3200
Securities registered pursuant to Section 12(b) of the Act: None
Indicate by check mark whether the Registrant: (1) has filed all reports required to be filed by Section 13 or 15(d) of the Securities Exchange Act of 1934 during the preceding 12 months (or for such shorter period that the Registrant was required to file such reports), and (2) has been subject to such filing requirements for the past 90 days. Yes ☒ No ☐
Indicate by check mark whether the Registrant has submitted electronically every Interactive Data File required to be submitted pursuant to Rule 405 of Regulation S-T (§232.405 of this chapter) during the preceding 12 months (or for such shorter period that the Registrant was required to submit such files). Yes ☒No ☐
Indicate by check mark whether the registrant is a large accelerated filer, an accelerated filer, a non-accelerated filer, smaller reporting company, or an emerging growth company. See the definitions of "large accelerated filer," "accelerated filer," "smaller reporting company," and "emerging growth company" in Rule 12b-2 of the Exchange Act.
|
|
|
|
|
|
|
|
Large accelerated filer |
|
☐ |
|
Accelerated filer |
|
☐ |
|
|
|
|
Non-accelerated filer |
|
☒ |
|
Smaller reporting company |
|
☒ |
|
|
|
|
|
|
|
Emerging growth company |
|
☒ |
|
|
|
|
If an emerging growth company, indicate by check mark if the registrant has elected not to use the extended transition period for complying with any new or revised financial accounting standards provided pursuant to Section 13(a) of the Exchange Act. ☒
Indicate by check mark whether the Registrant is a shell company (as defined in Rule 12b-2 of the Exchange Act). Yes ☐ No ☒
As of November 6, 2025, the Registrant had 64,817,484 outstanding shares of common stock, consisting of 39,870,478 Class A-III shares, 21,147,715 Class A-I shares, 1,537,484 Class F-I shares, 1,326,037 Class I shares, 4,909 Class D shares, 11,174 Class S shares and 919,687 Class E shares.
PART I. FINANCIAL INFORMATION
ITEM 1. FINANCIAL STATEMENTS
Apollo Realty Income Solutions, Inc.
Condensed Consolidated Balance Sheets (Unaudited)
(in thousands - except share data)
|
|
|
|
|
|
|
|
|
|
|
|
September 30, 2025 |
|
|
December 31, 2024 |
|
Assets |
|
|
|
|
|
|
Investments in real estate, net |
|
$ |
487,927 |
|
|
$ |
245,667 |
|
Investments in real estate debt, at fair value |
|
|
1,188,749 |
|
|
|
887,186 |
|
Cash and cash equivalents |
|
|
51,069 |
|
|
|
82,312 |
|
Restricted cash |
|
|
2,628 |
|
|
|
93 |
|
Other assets |
|
|
93,107 |
|
|
|
42,346 |
|
Total assets(1) |
|
$ |
1,823,480 |
|
|
$ |
1,257,604 |
|
Liabilities and Equity |
|
|
|
|
|
|
Secured debt arrangements, net |
|
$ |
270,980 |
|
|
$ |
138,920 |
|
Mortgage notes, net |
|
|
92,939 |
|
|
|
35,675 |
|
Other liabilities |
|
|
49,801 |
|
|
|
21,318 |
|
Due to affiliates |
|
|
14,361 |
|
|
|
16,531 |
|
Total liabilities(1) |
|
|
428,081 |
|
|
|
212,444 |
|
Commitments and contingencies (See Note 16) |
|
|
|
|
|
|
Redeemable non-controlling interest |
|
|
4,363 |
|
|
|
2,817 |
|
Equity |
|
|
|
|
|
|
Preferred stock, $0.01 par value per share, 100,000,000 shares authorized at September 30, 2025 and December 31, 2024, and none issued and outstanding |
|
|
— |
|
|
|
— |
|
Common stock, $0.01 par value per share (See Note 14 - Equity) |
|
|
615 |
|
|
|
453 |
|
Additional paid-in capital |
|
|
1,269,809 |
|
|
|
924,645 |
|
Retained earnings (accumulated deficit) |
|
|
7,756 |
|
|
|
8,955 |
|
Total stockholders' equity |
|
|
1,278,180 |
|
|
|
934,053 |
|
Non-controlling interest attributable to the Operating Partnership |
|
|
112,731 |
|
|
|
108,165 |
|
Non-controlling interest attributable to preferred stockholders |
|
|
125 |
|
|
|
125 |
|
Total equity |
|
|
1,391,036 |
|
|
|
1,042,343 |
|
Total liabilities and equity |
|
$ |
1,823,480 |
|
|
$ |
1,257,604 |
|
_________________
(1)Represents the consolidated assets and liabilities of ARIS Operating Partnership L.P., a Delaware limited partnership (the "Operating Partnership"). The Operating Partnership is a consolidated variable interest entity ("VIE"), of which Apollo Realty Income Solutions, Inc. (the "Company") is the sole general partner and owns approximately 91% and 89% as of September 30, 2025 and December 31, 2024, respectively. See "Note 2 - Summary of Significant Accounting Policies" for additional information.
See accompanying notes to unaudited condensed consolidated financial statements.
Apollo Realty Income Solutions, Inc.
Condensed Consolidated Statement of Operations (Unaudited)
(in thousands - except share and per share data)
|
|
|
|
|
|
|
|
|
|
|
|
|
|
|
|
|
|
Three Months Ended September 30, |
|
|
Nine Months Ended September 30, |
|
|
2025 |
|
|
2024 |
|
|
2025 |
|
|
2024 |
|
Revenues |
|
|
|
|
|
|
|
|
|
|
|
Rental revenue |
$ |
10,258 |
|
|
$ |
6,302 |
|
|
$ |
24,774 |
|
|
$ |
15,020 |
|
Total revenues |
|
10,258 |
|
|
|
6,302 |
|
|
|
24,774 |
|
|
|
15,020 |
|
Expenses |
|
|
|
|
|
|
|
|
|
|
|
Rental property operating |
$ |
2,498 |
|
|
$ |
1,474 |
|
|
$ |
5,645 |
|
|
$ |
2,871 |
|
General and administrative |
|
1,730 |
|
|
|
1,424 |
|
|
|
5,258 |
|
|
|
4,703 |
|
Management fee |
|
3,185 |
|
|
|
2,121 |
|
|
|
8,778 |
|
|
|
5,437 |
|
Performance participation allocation |
|
108 |
|
|
|
75 |
|
|
|
297 |
|
|
|
347 |
|
Depreciation and amortization |
|
4,859 |
|
|
|
2,793 |
|
|
|
11,136 |
|
|
|
6,375 |
|
Total expenses |
$ |
12,380 |
|
|
$ |
7,887 |
|
|
$ |
31,114 |
|
|
$ |
19,733 |
|
Other income |
|
|
|
|
|
|
|
|
|
|
|
Income from investments in real estate debt |
|
24,820 |
|
|
|
17,366 |
|
|
|
67,403 |
|
|
|
41,931 |
|
Other income |
|
763 |
|
|
|
1,549 |
|
|
|
2,896 |
|
|
|
4,022 |
|
Interest expense |
|
(5,723 |
) |
|
|
(4,091 |
) |
|
|
(13,485 |
) |
|
|
(6,745 |
) |
Total other income |
|
19,860 |
|
|
|
14,824 |
|
|
|
56,814 |
|
|
|
39,208 |
|
Net income (loss) |
$ |
17,738 |
|
|
$ |
13,239 |
|
|
$ |
50,474 |
|
|
$ |
34,495 |
|
Net income (loss) attributable to non-controlling interests in the Operating Partnership |
$ |
1,561 |
|
|
$ |
1,709 |
|
|
$ |
4,764 |
|
|
$ |
5,127 |
|
Net income (loss) attributable to preferred stockholders |
|
— |
|
|
|
— |
|
|
|
8 |
|
|
|
7 |
|
Net income (loss) attributable to the Company's stockholders |
$ |
16,177 |
|
|
$ |
11,530 |
|
|
$ |
45,702 |
|
|
$ |
29,361 |
|
Net income (loss) per share of common stock, basic and diluted |
$ |
0.27 |
|
|
$ |
0.32 |
|
|
$ |
0.84 |
|
|
$ |
0.96 |
|
Weighted-average shares of common stock outstanding, basic and diluted |
|
59,523,522 |
|
|
|
36,554,429 |
|
|
|
54,333,427 |
|
|
|
30,673,272 |
|
See accompanying notes to unaudited condensed consolidated financial statements.
Apollo Realty Income Solutions, Inc.
Condensed Consolidated Statement of Changes in Equity (Unaudited)
(in thousands)
|
|
|
|
|
|
|
|
|
|
|
|
|
|
|
|
|
|
|
|
|
|
|
|
|
|
|
|
|
|
|
|
|
|
|
|
Common Stock |
|
|
|
|
|
|
|
|
|
|
|
|
|
|
|
|
|
|
|
|
|
Shares |
|
|
Amount |
|
|
Additional Paid-In Capital |
|
|
Retained Earnings (Accumulated Deficit) |
|
|
Total Stockholders' Equity |
|
|
Non-Controlling Interest |
|
|
Total Equity |
|
|
Redeemable non-controlling interest |
|
|
|
|
|
|
|
|
|
|
|
|
|
|
|
|
|
|
|
|
|
|
|
|
|
|
Balance at June 30, 2025 |
|
|
56,086 |
|
|
$ |
561 |
|
|
$ |
1,154,156 |
|
|
$ |
8,717 |
|
|
$ |
1,163,434 |
|
|
$ |
111,365 |
|
|
$ |
1,274,799 |
|
|
$ |
3,978 |
|
Common stock issued |
|
|
5,698 |
|
|
|
57 |
|
|
|
121,706 |
|
|
|
— |
|
|
|
121,763 |
|
|
|
— |
|
|
|
121,763 |
|
|
|
300 |
|
Amortization of restricted stock grants |
|
|
— |
|
|
|
— |
|
|
|
25 |
|
|
|
— |
|
|
|
25 |
|
|
|
— |
|
|
|
25 |
|
|
|
— |
|
Offering costs |
|
|
— |
|
|
|
— |
|
|
|
(612 |
) |
|
|
— |
|
|
|
(612 |
) |
|
|
— |
|
|
|
(612 |
) |
|
|
— |
|
Distribution reinvestments |
|
|
148 |
|
|
|
1 |
|
|
|
3,162 |
|
|
|
— |
|
|
|
3,163 |
|
|
|
1,571 |
|
|
|
4,734 |
|
|
|
64 |
|
Net income |
|
|
— |
|
|
|
— |
|
|
|
— |
|
|
|
16,177 |
|
|
|
16,177 |
|
|
|
1,498 |
|
|
|
17,675 |
|
|
|
63 |
|
Repurchase of common stock |
|
|
(403 |
) |
|
|
(4 |
) |
|
|
(8,604 |
) |
|
|
— |
|
|
|
(8,608 |
) |
|
|
— |
|
|
|
(8,608 |
) |
|
|
— |
|
Distributions to non-controlling interests in the Operating Partnership |
|
|
— |
|
|
|
— |
|
|
|
— |
|
|
|
— |
|
|
|
— |
|
|
|
(1,578 |
) |
|
|
(1,578 |
) |
|
|
(66 |
) |
Distributions declared on common stock |
|
|
— |
|
|
|
— |
|
|
|
— |
|
|
|
(17,138 |
) |
|
|
(17,138 |
) |
|
|
— |
|
|
|
(17,138 |
) |
|
|
— |
|
Allocation to redeemable non-controlling interest |
|
|
— |
|
|
|
— |
|
|
|
(24 |
) |
|
|
— |
|
|
|
(24 |
) |
|
|
— |
|
|
|
(24 |
) |
|
|
24 |
|
Balance at September 30, 2025 |
|
|
61,529 |
|
|
$ |
615 |
|
|
$ |
1,269,809 |
|
|
$ |
7,756 |
|
|
$ |
1,278,180 |
|
|
$ |
112,856 |
|
|
$ |
1,391,036 |
|
|
$ |
4,363 |
|
|
|
|
|
|
|
|
|
|
|
|
|
|
|
|
|
|
|
|
|
|
|
|
|
|
|
|
|
|
|
|
|
|
|
|
|
|
|
|
|
|
|
|
|
|
|
|
|
|
|
|
|
|
|
|
|
|
|
|
|
|
Common Stock |
|
|
|
|
|
|
|
|
|
|
|
|
|
|
|
|
|
|
|
|
|
Shares |
|
|
Amount |
|
|
Additional Paid-In Capital |
|
|
Retained Earnings (Accumulated Deficit) |
|
|
Total Stockholders' Equity |
|
|
Non-Controlling Interest |
|
|
Total Equity |
|
|
Redeemable non-controlling interest |
|
Balance at June 30, 2024 |
|
|
32,046 |
|
|
$ |
322 |
|
|
$ |
648,320 |
|
|
$ |
5,985 |
|
|
$ |
654,627 |
|
|
$ |
104,909 |
|
|
$ |
759,536 |
|
|
$ |
2,133 |
|
Common stock issued |
|
|
6,508 |
|
|
|
65 |
|
|
|
136,350 |
|
|
|
- |
|
|
|
136,415 |
|
|
|
- |
|
|
|
136,415 |
|
|
|
280 |
|
Amortization of restricted stock grants |
|
|
- |
|
|
|
- |
|
|
|
25 |
|
|
|
- |
|
|
|
25 |
|
|
|
- |
|
|
|
25 |
|
|
|
- |
|
Offering costs |
|
|
- |
|
|
|
- |
|
|
|
(250 |
) |
|
|
- |
|
|
|
(250 |
) |
|
|
- |
|
|
|
(250 |
) |
|
|
- |
|
Distribution reinvestments |
|
|
85 |
|
|
|
1 |
|
|
|
1,792 |
|
|
|
- |
|
|
|
1,793 |
|
|
|
1,463 |
|
|
|
3,256 |
|
|
|
35 |
|
Net income |
|
|
- |
|
|
|
- |
|
|
|
- |
|
|
|
11,530 |
|
|
|
11,530 |
|
|
|
1,668 |
|
|
|
13,198 |
|
|
|
41 |
|
Repurchase of common stock |
|
|
(76 |
) |
|
|
(1 |
) |
|
|
(1,590 |
) |
|
|
- |
|
|
|
(1,591 |
) |
|
|
- |
|
|
|
(1,591 |
) |
|
|
- |
|
Distributions to non-controlling interests in the Operating Partnership |
|
|
- |
|
|
|
- |
|
|
|
- |
|
|
|
- |
|
|
|
- |
|
|
|
(1,497 |
) |
|
|
(1,497 |
) |
|
|
(38 |
) |
Distributions declared on common stock |
|
|
- |
|
|
|
- |
|
|
|
- |
|
|
|
(10,442 |
) |
|
|
(10,442 |
) |
|
|
- |
|
|
|
(10,442 |
) |
|
|
- |
|
Allocation to redeemable non-controlling interest |
|
|
- |
|
|
|
- |
|
|
|
(22 |
) |
|
|
- |
|
|
|
(22 |
) |
|
|
- |
|
|
|
(22 |
) |
|
|
22 |
|
Balance at September 30, 2024 |
|
|
38,563 |
|
|
$ |
387 |
|
|
$ |
784,625 |
|
|
$ |
7,073 |
|
|
$ |
792,085 |
|
|
$ |
106,543 |
|
|
$ |
898,628 |
|
|
$ |
2,473 |
|
|
|
|
|
|
|
|
|
|
|
|
|
|
|
|
|
|
|
|
|
|
|
|
|
|
|
|
|
|
|
|
|
|
|
|
|
Common Stock |
|
|
|
|
|
|
|
|
|
|
|
|
|
|
|
|
|
|
|
|
|
Shares |
|
|
Amount |
|
|
Additional Paid-In Capital |
|
|
Retained Earnings (Accumulated Deficit) |
|
|
Total Stockholders' Equity |
|
|
Non-Controlling Interest |
|
|
Total Equity |
|
|
Redeemable non-controlling interest |
|
Balance at December 31, 2024 |
|
|
45,212 |
|
|
$ |
453 |
|
|
$ |
924,645 |
|
|
$ |
8,955 |
|
|
$ |
934,053 |
|
|
$ |
108,290 |
|
|
$ |
1,042,343 |
|
|
$ |
2,817 |
|
Common stock issued |
|
|
16,784 |
|
|
|
168 |
|
|
|
356,982 |
|
|
|
— |
|
|
|
357,150 |
|
|
|
— |
|
|
|
357,150 |
|
|
|
1,327 |
|
Amortization of restricted stock grants |
|
|
— |
|
|
|
— |
|
|
|
75 |
|
|
|
— |
|
|
|
75 |
|
|
|
— |
|
|
|
75 |
|
|
|
— |
|
Offering costs |
|
|
— |
|
|
|
— |
|
|
|
(1,896 |
) |
|
|
— |
|
|
|
(1,896 |
) |
|
|
— |
|
|
|
(1,896 |
) |
|
|
— |
|
Distribution reinvestments |
|
|
396 |
|
|
|
3 |
|
|
|
8,437 |
|
|
|
— |
|
|
|
8,440 |
|
|
|
4,652 |
|
|
|
13,092 |
|
|
|
173 |
|
Net income |
|
|
— |
|
|
|
— |
|
|
|
— |
|
|
|
45,702 |
|
|
|
45,702 |
|
|
|
4,594 |
|
|
|
50,296 |
|
|
|
178 |
|
Repurchase of common stock |
|
|
(863 |
) |
|
|
(9 |
) |
|
|
(18,385 |
) |
|
|
— |
|
|
|
(18,394 |
) |
|
|
— |
|
|
|
(18,394 |
) |
|
|
— |
|
Distributions to non-controlling interests in the Operating Partnership |
|
|
— |
|
|
|
— |
|
|
|
— |
|
|
|
— |
|
|
|
— |
|
|
|
(4,672 |
) |
|
|
(4,672 |
) |
|
|
(181 |
) |
Distributions to non-controlling preferred stockholders |
|
|
— |
|
|
|
— |
|
|
|
— |
|
|
|
— |
|
|
|
— |
|
|
|
(8 |
) |
|
|
(8 |
) |
|
|
— |
|
Distributions declared on common stock |
|
|
— |
|
|
|
— |
|
|
|
— |
|
|
|
(46,901 |
) |
|
|
(46,901 |
) |
|
|
— |
|
|
|
(46,901 |
) |
|
|
— |
|
Allocation to redeemable non-controlling interest |
|
|
— |
|
|
|
— |
|
|
|
(49 |
) |
|
|
— |
|
|
|
(49 |
) |
|
|
— |
|
|
|
(49 |
) |
|
|
49 |
|
Balance at September 30, 2025 |
|
|
61,529 |
|
|
$ |
615 |
|
|
$ |
1,269,809 |
|
|
$ |
7,756 |
|
|
$ |
1,278,180 |
|
|
$ |
112,856 |
|
|
$ |
1,391,036 |
|
|
$ |
4,363 |
|
|
|
|
|
|
|
|
|
|
|
|
|
|
|
|
|
|
|
|
|
|
|
|
|
|
|
|
|
|
|
|
|
|
|
|
|
Common Stock |
|
|
|
|
|
|
|
|
|
|
|
|
|
|
|
|
|
|
|
|
|
Shares |
|
|
Amount |
|
|
Additional Paid-In Capital |
|
|
Retained Earnings (Accumulated Deficit) |
|
|
Total Stockholders' Equity |
|
|
Non-Controlling Interest |
|
|
Total Equity |
|
|
Redeemable non-controlling interest |
|
Balance at December 31, 2023 |
|
|
21,943 |
|
|
$ |
220 |
|
|
$ |
438,432 |
|
|
$ |
2,681 |
|
|
$ |
441,333 |
|
|
$ |
101,543 |
|
|
$ |
542,876 |
|
|
$ |
967 |
|
Common stock issued |
|
|
16,717 |
|
|
|
167 |
|
|
|
348,184 |
|
|
|
- |
|
|
|
348,351 |
|
|
|
- |
|
|
|
348,351 |
|
|
|
1,385 |
|
Preferred equity issued |
|
|
- |
|
|
|
- |
|
|
|
- |
|
|
|
- |
|
|
|
- |
|
|
|
125 |
|
|
|
125 |
|
|
|
- |
|
Amortization of restricted stock grants |
|
|
- |
|
|
|
- |
|
|
|
75 |
|
|
|
- |
|
|
|
75 |
|
|
|
- |
|
|
|
75 |
|
|
|
- |
|
Offering costs |
|
|
- |
|
|
|
- |
|
|
|
(1,003 |
) |
|
|
- |
|
|
|
(1,003 |
) |
|
|
- |
|
|
|
(1,003 |
) |
|
|
- |
|
Distribution reinvestments |
|
|
197 |
|
|
|
2 |
|
|
|
4,145 |
|
|
|
- |
|
|
|
4,147 |
|
|
|
4,037 |
|
|
|
8,184 |
|
|
|
84 |
|
Net income |
|
|
- |
|
|
|
- |
|
|
|
- |
|
|
|
29,361 |
|
|
|
29,361 |
|
|
|
5,025 |
|
|
|
34,386 |
|
|
|
109 |
|
Share class transfer |
|
|
(45 |
) |
|
|
- |
|
|
|
- |
|
|
|
- |
|
|
|
- |
|
|
|
- |
|
|
|
- |
|
|
|
- |
|
Repurchase of common stock |
|
|
(249 |
) |
|
|
(2 |
) |
|
|
(5,186 |
) |
|
|
- |
|
|
|
(5,188 |
) |
|
|
- |
|
|
|
(5,188 |
) |
|
|
- |
|
Distributions to non-controlling interests in the Operating Partnership |
|
|
- |
|
|
|
- |
|
|
|
- |
|
|
|
- |
|
|
|
- |
|
|
|
(4,180 |
) |
|
|
(4,180 |
) |
|
|
(94 |
) |
Distributions to non-controlling preferred stockholders |
|
|
- |
|
|
|
- |
|
|
|
- |
|
|
|
- |
|
|
|
- |
|
|
|
(7 |
) |
|
|
(7 |
) |
|
|
- |
|
Distributions declared on common stock |
|
|
- |
|
|
|
- |
|
|
|
- |
|
|
|
(24,969 |
) |
|
|
(24,969 |
) |
|
|
- |
|
|
|
(24,969 |
) |
|
|
- |
|
Allocation to redeemable non-controlling interest |
|
|
- |
|
|
|
- |
|
|
|
(22 |
) |
|
|
- |
|
|
|
(22 |
) |
|
|
- |
|
|
|
(22 |
) |
|
|
22 |
|
Balance at September 30, 2024 |
|
|
38,563 |
|
|
$ |
387 |
|
|
$ |
784,625 |
|
|
$ |
7,073 |
|
|
$ |
792,085 |
|
|
$ |
106,543 |
|
|
$ |
898,628 |
|
|
$ |
2,473 |
|
See accompanying notes to unaudited condensed consolidated financial statements.
Apollo Realty Income Solutions, Inc.
Condensed Consolidated Statement of Cash Flows (Unaudited)
(in thousands)
|
|
|
|
|
|
|
|
|
|
|
|
Nine Months Ended September 30, 2025 |
|
|
Nine Months Ended September 30, 2024 |
|
Cash flows from operating activities |
|
|
|
|
|
|
Net income |
|
$ |
50,474 |
|
|
$ |
34,495 |
|
Adjustments to reconcile net income to net cash provided by operating activities: |
|
|
|
|
|
|
Management fee |
|
|
8,778 |
|
|
|
5,437 |
|
Performance participation allocation |
|
|
297 |
|
|
|
347 |
|
Depreciation and amortization |
|
|
11,136 |
|
|
|
6,375 |
|
Straight line rent amortization |
|
|
(2,422 |
) |
|
|
(1,570 |
) |
Above- and below- market lease amortization, net |
|
|
(568 |
) |
|
|
(514 |
) |
Amortization of discount/premium and payment-in-kind interest |
|
|
(230 |
) |
|
|
(156 |
) |
Amortization of deferred financing costs |
|
|
1,135 |
|
|
|
707 |
|
Amortization of restricted stock awards |
|
|
75 |
|
|
|
75 |
|
Unrealized (gain)/loss on fair value of investments in real estate debt |
|
|
38 |
|
|
|
(152 |
) |
Realized gain on repayments of real-estate related securities |
|
|
(124 |
) |
|
|
(71 |
) |
Changes in assets and liabilities: |
|
|
|
|
|
|
Other assets |
|
|
(1,621 |
) |
|
|
(2,037 |
) |
Due to affiliates |
|
|
(2,299 |
) |
|
|
444 |
|
Other liabilities |
|
|
3,504 |
|
|
|
2,887 |
|
Net cash provided by operating activities |
|
|
68,173 |
|
|
|
46,267 |
|
Cash flows from investing activities: |
|
|
|
|
|
|
Acquisitions of real estate |
|
|
(261,153 |
) |
|
|
(107,241 |
) |
Capital improvements to real estate |
|
|
(140 |
) |
|
|
(64 |
) |
Origination and acquisition of commercial mortgage and mezzanine loans |
|
|
(230,061 |
) |
|
|
(210,356 |
) |
Purchase of real estate-related securities |
|
|
(33,268 |
) |
|
|
(8,978 |
) |
Add-on fundings of commercial mortgage loans |
|
|
(237,423 |
) |
|
|
(184,821 |
) |
Repayments of commercial mortgage loans |
|
|
163,795 |
|
|
|
— |
|
Repayments from real estate-related securities |
|
|
20,686 |
|
|
|
3,950 |
|
Net cash used in investing activities |
|
|
(577,564 |
) |
|
|
(507,510 |
) |
Cash flows from financing activities: |
|
|
|
|
|
|
Borrowings from mortgage notes |
|
|
58,300 |
|
|
|
— |
|
Borrowings from secured debt arrangements |
|
|
164,734 |
|
|
|
188,775 |
|
Repayments of secured debt arrangements |
|
|
(33,300 |
) |
|
|
— |
|
Payment of deferred financing costs |
|
|
(2,059 |
) |
|
|
(177 |
) |
Proceeds from issuance of common stock |
|
|
349,525 |
|
|
|
344,009 |
|
Proceeds from issuance of preferred equity |
|
|
— |
|
|
|
125 |
|
Distributions paid |
|
|
(36,884 |
) |
|
|
(18,690 |
) |
Distributions to non-controlling preferred stockholders |
|
|
(8 |
) |
|
|
(7 |
) |
Repurchase of common stock |
|
|
(17,598 |
) |
|
|
(4,871 |
) |
Offering costs paid |
|
|
(2,027 |
) |
|
|
(845 |
) |
Net cash provided by financing activities |
|
|
480,683 |
|
|
|
508,319 |
|
Net change in cash, cash equivalents and restricted cash |
|
|
(28,708 |
) |
|
|
47,076 |
|
Cash, cash equivalents and restricted cash, beginning of period |
|
|
82,405 |
|
|
|
95,205 |
|
Cash, cash equivalents and restricted cash, end of period |
|
$ |
53,697 |
|
|
$ |
142,281 |
|
|
|
|
|
|
|
|
|
|
|
|
|
|
|
|
|
|
Reconciliation of cash, cash equivalents and restricted cash to the condensed consolidated balance sheets: |
|
|
|
|
|
|
Cash and cash equivalents |
|
$ |
51,069 |
|
|
$ |
142,197 |
|
Restricted cash |
|
|
2,628 |
|
|
|
84 |
|
Total cash, cash equivalents and restricted cash |
|
$ |
53,697 |
|
|
$ |
142,281 |
|
Supplemental disclosure of cash flow information: |
|
|
|
|
|
|
Cash paid for interest |
|
$ |
11,594 |
|
|
$ |
5,257 |
|
Non-cash investing and financing activities: |
|
|
|
|
|
|
Change in loan proceeds held by servicer for repayment of commercial mortgage loan |
|
$ |
25,000 |
|
|
$ |
— |
|
Investments purchased but not settled |
|
$ |
9,975 |
|
|
$ |
— |
|
Accrued offering costs |
|
$ |
96 |
|
|
$ |
151 |
|
Accrued stockholder servicing fees due to affiliate |
|
$ |
22 |
|
|
$ |
7 |
|
Distribution reinvestments |
|
$ |
13,265 |
|
|
$ |
8,268 |
|
Distributions accrued and not paid |
|
$ |
6,464 |
|
|
$ |
4,185 |
|
Accrued repurchases of common stock |
|
$ |
2,994 |
|
|
$ |
317 |
|
Issuance of Class E shares for payment of management fee |
|
$ |
7,625 |
|
|
$ |
4,342 |
|
Redeemable non-controlling interest issuance as Class E units of the Operating Partnership for payment of management fee |
|
$ |
885 |
|
|
$ |
823 |
|
Redeemable non-controlling interest issuance as Class E units of the Operating Partnership for payment of performance participation allocation |
|
$ |
443 |
|
|
$ |
562 |
|
Allocation to redeemable non-controlling interests |
|
$ |
49 |
|
|
$ |
22 |
|
See accompanying notes to unaudited condensed consolidated financial statements.
Apollo Realty Income Solutions, Inc.
Notes to Condensed Consolidated Financial Statements
(Unaudited)
Note 1 - Organization and Business Purpose
Apollo Realty Income Solutions, Inc. (the "Company") was formed on September 8, 2021 as a Maryland corporation. The Company is the sole general partner of ARIS Operating Partnership L.P., a Delaware limited partnership (the "Operating Partnership"). ARIS Special Limited Partner, LLC (the "Special Limited Partner"), a subsidiary of Apollo Global Management, Inc. (together with its subsidiaries, "Apollo"), owns a special limited partner interest in the Operating Partnership. The Company was organized to invest primarily in a portfolio of diversified income-oriented commercial real estate in the United States. Substantially all of the Company's business is conducted through the Operating Partnership. The Company commenced its operations on December 22, 2022 and the Company and the Operating Partnership are both externally managed by ARIS Management, LLC (the "Adviser"), an indirect subsidiary of Apollo.
The Company has registered with the Securities and Exchange Commission (the "SEC") an offering of up to $5.0 billion in shares of common stock, consisting of up to $4.0 billion in shares in its primary offering and up to $1.0 billion in shares pursuant to its distribution reinvestment plan, which the Company began using to offer shares of its common stock in June 2025 (the "Follow-On Offering"). In the Follow-On Offering, the Company intends to sell any combination of six classes of shares of its common stock, Class S shares, Class D shares, Class I shares, Class F-I shares, Class A-I shares, and Class A-III shares with a dollar value up to the maximum offering amount. The share classes have different upfront selling commissions, ongoing stockholder servicing fees, management fees, and performance participation allocations. The purchase price per share for each class of common stock will vary and will generally equal the Company's prior month's net asset value ("NAV") per share, as calculated monthly, plus applicable upfront selling commissions and dealer manager fees. The Company also may issue Class E shares to certain of Apollo's affiliates and employees and the Company's directors in one or more private placements; however, Class E shares are not being offered to the public pursuant to the Follow-On Offering.
The Company has elected to be taxed as a real estate investment trust ("REIT") under the Internal Revenue Code of 1986, as amended (the "Code"), commencing with the taxable year ended December 31, 2023. To maintain its tax qualification as a REIT, the Company is required to distribute at least 90% of its taxable income, excluding net capital gains, to stockholders and meet certain other asset, income, and ownership tests.
As of September 30, 2025, the Company owned nine properties, had twenty-seven investments in commercial real estate debt, and held thirty-one real estate-related securities. The Company currently operates in two reportable segments: Real Estate and Real Estate Debt. See "Note 17 - Segment Reporting" for additional information.
Note 2 - Summary of Significant Accounting Policies
Basis of Presentation
The accompanying unaudited condensed consolidated financial statements have been prepared in accordance with accounting principles generally accepted in the United States of America ("GAAP") and include the accounts of the Company and the Operating Partnership. All intercompany balances and transactions are eliminated in consolidation.
These unaudited condensed consolidated financial statements have been prepared in accordance with the instructions to Form 10-Q and should be read in conjunction with the consolidated financial statements and notes thereto included in the Company's Annual Report on Form 10-K for the year ended December 31, 2024, as filed with the SEC. In the opinion of management, all adjustments (consisting only of normal recurring adjustments) necessary to present fairly the Company's financial position, results of operations and cash flows have been included. The Company's results of operations for the three and nine months ended September 30, 2025 are not necessarily indicative of the results to be expected for the full year or any other future period.
Principles of Consolidation
The Company consolidates all entities that it controls through either majority ownership or voting rights. In addition, the Company consolidates all variable interest entities ("VIEs") of which it is considered the primary beneficiary. VIEs are defined as entities in which equity investors (i) do not have the characteristics of a controlling financial interest and/or (ii) do not have sufficient equity at risk for the entity to finance its activities without additional subordinated financial support from other parties. The entity that consolidates a VIE is known as the primary beneficiary and is generally the entity with (i) the power to direct the activities that most significantly affect the VIE's economic performance, and (ii) the right to receive benefits from the VIE or the obligation to absorb losses of the VIE that could be significant to the VIE.
The Operating Partnership is considered to be a VIE. The Company consolidates this entity as it has the ability to direct the most significant activities of the entities such as purchases, dispositions, financings, budgets, and overall operating plans.
The accompanying condensed consolidated financial statements include the accounts of the Company and the Company's subsidiary partnerships. Third party unitholders of Operating Partnership's share of the assets, liabilities and operations of the Operating Partnership is included in non-controlling interest as equity of the Company. The noncontrolling interest is generally computed based on third party unit-holders ownership percentage.
Non-controlling interests in the Operating Partnership represent limited partnership units of the Operating Partnership ("Operating Partnership units") that are held by third parties, including the Adviser, and Operating Partnership units issued to the Adviser under an advisory agreement by and among the Company, the Operating Partnership and the Adviser (as amended, restated or otherwise modified from time to time, the "Advisory Agreement"). Operating Partnership units may be redeemed for cash, or at the Company's option, for shares of common stock of the Company on a one-for-one basis, unless those units are held by the Adviser or Special Limited Partner, in which case such Operating Partnership units shall be redeemed for shares of common stock of the Company or cash, at the holder's election. Since the number of shares of common stock outstanding is equal to the number of Operating Partnership units owned by the Company, the redemption value of each common unit of the Operating Partnership is equal to the market value of each share of common stock and distributions paid to each unitholder is equivalent to dividends paid to common stockholders, per respective share class.
Cash and Cash Equivalents
Cash and cash equivalents represent cash held in banks, cash on hand, and liquid investments with original maturities of three months or less. The Company may have bank balances in excess of federally insured amounts; however, the Company deposits its cash and cash equivalents with high credit-quality institutions to minimize credit risk exposure. As of September 30, 2025 and December 31, 2024, the Company held $51.1 million and $82.3 million of cash and cash equivalents, respectively.
Restricted Cash
Restricted cash represents cash held in a deposit account controlled by a third party, tenant security deposits and reserves held in escrow related to real estate taxes and repairs and maintenance in connection with mortgages on certain of the Company's properties. As of September 30, 2025 and December 31, 2024, the Company held $2.6 million and $0.1 million in restricted cash, respectively.
Fair Value Measurements
Under normal market conditions, the fair value of an investment is the amount that would be received to sell an asset or transfer a liability in an orderly transaction between market participants at the measurement date (i.e., the exit price). The Company uses a hierarchical framework that prioritizes and ranks the level of market price observability used in measuring investments at fair value. Market price observability is impacted by a number of factors, including the type of investment and the characteristics specific to the investment, and the state of the marketplace, including the existence and transparency of transactions between market participants. Investments with readily available actively quoted prices or for which fair value can be measured from actively quoted prices generally will have a higher degree of market price observability and a lesser degree of judgment used in measuring fair value.
Investments measured and reported at fair value are classified and disclosed in one of the following levels within the fair value hierarchy:
Level 1 — quoted prices are available in active markets for identical investments as of the measurement date. The Company does not adjust the quoted price for these investments.
Level 2 — quoted prices are available in markets that are not active or model inputs are based on inputs that are either directly or indirectly observable as of the measurement date.
Level 3 — pricing inputs are unobservable and include instances where there is minimal, if any, market activity for the investment. These inputs require significant judgment or estimation by management or third parties when determining fair value and generally represent anything that does not meet the criteria of Levels 1 and 2. Due to the inherent uncertainty of these estimates, these values may differ materially from the values that would have been used had a ready market for these investments existed.
As of September 30, 2025, the Company's investments in real estate debt consisted of commercial mortgage and mezzanine loans secured by real estate assets and real estate-related securities. The Company has elected the fair value option ("FVO") for investments in commercial mortgage and mezzanine loans secured by real estate assets as the Company believes fair value provides a more accurate depiction of the value of these assets. Real-estate related securities meet the criteria to be classified as trading securities under ASC 320, "Investments". The Company generally determines the fair value of its investments in real estate debt by utilizing third-party pricing service providers whenever available.
The Company's investments in commercial mortgage and mezzanine loans are unlikely to have readily available market quotations. In such cases, the Company will generally determine the initial value based on the acquisition price of such investment if acquired by the Company or the par value of such investment if originated by the Company. Following the initial measurement, the Company will determine fair value by utilizing or reviewing certain of the following (i) market yield data, (ii) discounted cash flow modeling, (iii) collateral asset performance, (iv) local or macro real estate performance, (v) capital market conditions, (vi) debt yield or loan-to-value ratios, and (vii) borrower financial condition and performance. The inputs used in determining the fair value of the Company's investments in commercial mortgage and mezzanine loans are considered Level 3.
The fair value of real estate-related securities may be determined by using third-party pricing service providers or broker-dealer quotes, reported trades or valuation estimates from their internal pricing models to determine the reported price. The inputs used in determining the fair value of the Company's investments in real estate-related securities are considered Level 2.
The following table details the Company's assets measured at fair value on a recurring basis ($ in thousands):
|
|
|
|
|
|
|
|
|
|
|
|
|
|
|
|
|
|
|
|
|
|
|
|
|
|
|
|
|
|
|
|
|
|
|
|
September 30, 2025 |
|
|
December 31, 2024 |
|
|
|
Level 1 |
|
|
Level 2 |
|
|
Level 3 |
|
|
Total |
|
|
Level 1 |
|
|
Level 2 |
|
|
Level 3 |
|
|
Total |
|
Assets: |
|
|
|
|
|
|
|
|
|
|
|
|
|
|
|
|
|
|
|
|
|
|
|
|
Investments in real estate debt |
|
$ |
— |
|
|
$ |
95,766 |
|
|
$ |
1,092,983 |
|
|
$ |
1,188,749 |
|
|
$ |
— |
|
|
$ |
73,120 |
|
|
$ |
814,066 |
|
|
$ |
887,186 |
|
Total |
|
$ |
— |
|
|
$ |
95,766 |
|
|
$ |
1,092,983 |
|
|
$ |
1,188,749 |
|
|
$ |
— |
|
|
$ |
73,120 |
|
|
$ |
814,066 |
|
|
$ |
887,186 |
|
The following table details the Company's assets measured at fair value on a recurring basis using Level 3 inputs ($ in thousands):
|
|
|
|
|
|
|
|
Investments in Real Estate Debt |
|
Balance as of December 31, 2024 |
|
$ |
814,066 |
|
Originations, acquisitions, and add on fundings |
|
|
467,484 |
|
Repayments |
|
|
(188,795 |
) |
Amortization of discount/premium and payment-in-kind interest |
|
|
230 |
|
Included in net income: |
|
|
|
Unrealized gain/(loss) from investments in real estate debt |
|
|
(2 |
) |
Balance as of September 30, 2025 |
|
$ |
1,092,983 |
|
The following table contains the quantitative inputs and assumptions used for items categorized in Level 3 of the fair value hierarchy ($ in thousands):
|
|
|
|
|
|
|
|
|
|
|
|
|
|
|
|
|
|
September 30, 2025 |
|
|
Fair Value |
|
|
Valuation Technique |
|
Unobservable Inputs |
|
Rate Range |
|
Weighted Average |
|
Impact to Valuation from an Increase in Input |
Assets: |
|
|
|
|
|
|
|
|
|
|
|
|
|
Investments in real estate debt |
|
$ |
1,092,983 |
|
|
Discounted cash flow |
|
Discount rate |
|
6.44% - 11.00% |
|
7.9% |
|
Decrease |
|
|
|
|
|
|
|
|
|
|
|
|
|
|
|
|
December 31, 2024 |
|
|
Fair Value |
|
|
Valuation Technique |
|
Unobservable Inputs |
|
Rate Range |
|
Weighted Average |
|
Impact to Valuation from an Increase in Input |
Assets: |
|
|
|
|
|
|
|
|
|
|
|
|
|
Investments in real estate debt |
|
$ |
814,066 |
|
|
Discounted cash flow |
|
Discount rate |
|
6.50% - 12.13% |
|
8.2% |
|
Decrease |
Valuation of liabilities not measured at fair value
As of September 30, 2025 and December 31, 2024, the fair value of the Company's secured debt arrangements and mortgage notes was $365.7 million and $176.0 million, respectively, which approximated carrying value. The fair value of the Company's indebtedness is estimated by modeling the cash flows required by the Company's debt arrangements and mortgages and discounting them back to the present value using an appropriate discount rate. Additionally, the Company considers current market rate and conditions by evaluating similar borrowing agreements with comparable loan-to-value ratios and credit profiles. The inputs used in determining the fair value of the Company's indebtedness are considered Level 3.
Investment Property and Lease Intangibles
Acquisitions of properties are accounted for utilizing the acquisition method and, accordingly, the operations of acquired properties will be included in the Company's results of operations from their respective dates of acquisition. The Company will utilize a report from an independent appraiser to record the purchase of identifiable assets acquired and liabilities assumed such as land, buildings and improvements, equipment and identifiable intangible assets and liabilities such as amounts related to in-place leases, acquired above- and below-market leases, tenant relationships, asset retirement obligations and mortgage loans payable.
The fair value of the tangible assets of an acquired property considers the value of the property as if it were vacant. The Company also considers an allocation of purchase price of other acquired intangibles, including acquired in-place leases that may have a customer relationship intangible value, including (but not limited to) the nature and extent of the existing relationship with the tenants, the tenants' credit quality and expectations of lease renewals.
The estimated fair value of acquired in-place leases is the costs the Company would have incurred to lease the properties to the occupancy level of the properties at the date of acquisition. Such estimates include the fair value of leasing commissions, legal costs, and other direct costs that would be incurred to lease the properties to such occupancy levels. Additionally, the Company evaluates the time period over which such occupancy levels would be achieved. Such evaluation includes an estimate of the net market-based rental revenues and net operating costs (primarily consisting of real estate taxes, insurance and utilities) that would be incurred during the lease-up period. Acquired in-place leases as of the date of acquisition are amortized over the remaining lease terms. The amortization of in-place lease intangibles is recorded in depreciation and amortization expense on the Company's condensed consolidated statements of operations.
Acquired above- and below-market lease values are recorded based on the present value of the difference between the contractual amounts to be paid pursuant to the in-place leases and the Company's estimate of fair market value lease rates for the corresponding in-place leases. The capitalized above- and below-market lease values are amortized as adjustments to rental revenue over the remaining terms of the respective leases, which include periods covered by bargain renewal options, if applicable. Should a tenant terminate its lease, the unamortized portion of the in-place lease value will be charged to amortization expense and the unamortized portion of out-of-market lease value will be charged to rental revenue.
The Company's investments in real estate are stated at cost and are generally depreciated on a straight-line basis over the estimated useful lives of the assets as follows:
|
|
|
|
Description |
|
Depreciable Life |
Building |
|
37 - 50 years |
Building and land improvements |
|
10 - 15 years |
Furniture, fixtures & equipment |
|
10 years |
Lease intangibles and leasehold improvements |
|
Lease term |
Significant improvements to properties are capitalized, whereas, repairs and maintenance expenses at the Company's properties are expensed as incurred and included in real estate operating expense on the Company's condensed consolidated statements of operations. When an asset is sold, the cost and related accumulated depreciation are removed from the accounts with the resulting gain or loss reflected in the Company's results of operations for the period.
Real estate assets will be evaluated for impairment on a quarterly basis. The Company will consider the following factors when performing its impairment analysis: (1) management, having the authority to approve the action, commits to a plan to sell the asset; (2) significant negative industry and economic outlook or trends; (3) expected material costs necessary to extend the life or operate the real estate asset; and (4) its ability to hold and dispose of the real estate asset in the ordinary course of business. A real estate asset is considered impaired when the sum of estimated future undiscounted cash flows to be generated by the real estate asset over the estimated remaining holding period is less than the carrying value of such real estate asset. An impairment charge is recorded equal to the excess of the carrying value of the real estate asset over the fair value. When determining the fair value of a real estate asset, the Company makes certain assumptions including, but not limited to, consideration of projected operating cash flows, comparable selling prices and projected cash flows from the eventual disposition of the real estate asset based upon its estimate of a capitalization rate and discount rate. As of September 30, 2025, the Company had not recorded any impairments on its investments in real estate.
Investments in Real Estate Debt
The Company's investments in real estate debt consist of commercial mortgage and mezzanine loans secured by real estate and real estate-related securities. The Company has elected the FVO for its commercial mortgage and mezzanine loans secured by real estate. During the nine months ended September 30, 2025, real-estate related securities met the criteria to be classified as trading securities under ASC 320, "Investments". Trading securities are recognized on a trade date basis and are carried at fair value. The unrealized gain or loss associated with holding real estate debt investments at fair value are recorded as a component of income from investments in real estate debt on the Company's condensed consolidated statement of operations. For the three and nine months ended September 30, 2025, the Company recorded $0.3 million and de minimis unrealized losses on its investments in real estate debt, respectively. For the three and nine months ended September 30, 2024, the Company recorded de minimis and $0.2 million of unrealized gains on its investments in real estate debt, respectively.
Deferred Financing Costs
Costs incurred in connection with financings are capitalized and amortized over the respective financing terms and are reflected on the accompanying condensed consolidated statement of operations as a component of interest expense. For the Company's debt facilities that have outstanding borrowings, the capitalized financing costs, net of amortization, are reflected as a direct deduction of such facilities. For debt facilities that do not have outstanding borrowings or for revolving facilities, the capitalized financing costs, net of amortization, are recorded as a component of other assets on the Company's condensed consolidated balance sheet.
Revenue Recognition
The Company's rental revenue consists of base rent and tenant reimbursement income arising from tenant leases at the Company's properties under operating leases. Base rent is recognized on a straight-line basis over the life of the lease, including any rent step ups or abatements. Revenues from the Company's multifamily properties are recorded when due from tenants and are recognized monthly as they are earned, which generally approximates a straight-line basis. The Company accounts for base rental revenue (lease component) and common area expense reimbursement (non-lease component) as one lease component under Accounting Standards Codification ("ASC") 842, "Leases".
The Company evaluates the collectability of receivables related to rental revenue on an individual lease basis. Management exercises judgment in assessing collectability and considers the length of time a receivable has been outstanding, tenant creditworthiness, payment history, available information about the financial condition of the tenant, and current economic trends, among other factors. Tenant receivables that are deemed uncollectible are recognized as a reduction to rental revenue. However, any future cash receipt on leases that are deemed uncollectible will be recorded as income on a cash basis. As of September 30, 2025, no rental revenue from the Company's leases was deemed uncollectible.
Interest income from the Company's investments in real estate debt is recognized over the life of each investment using the effective interest method and is recorded on an accrual basis. Recognition of premiums and discounts associated with these investments is deferred and recorded over the term of the investment as an adjustment to yield. Upfront costs and fees related to items for which the FVO is elected are recognized in earnings as incurred and are not deferred. Interest income, upfront costs and fees are recorded as components of income from investments in real estate debt on the Company's condensed consolidated statements of operations.
Commercial mortgage and mezzanine loans that are significantly past due may be placed on non-accrual status if the Company determines it is probable that it will not collect all payments which are contractually due. When a loan is placed on non-accrual status, interest is only recorded as interest income when it is received. A loan may be placed back on accrual status if the Company determines it is probable that it will collect all payments which are contractually due. As of September 30, 2025, none of the Company's loans were on non-accrual status.
Income Taxes
The Company has elected to be taxed as a REIT under Sections 856 through 860 of the Code commencing with its taxable year ended December 31, 2023. As long as the Company qualifies for taxation as a REIT, it generally will not be subject to federal corporate income tax to the extent it distributes its taxable income to stockholders. REITs are also subject to a number of other organizational and operational requirements. Even if the Company qualifies for taxation as a REIT, it may be subject to certain federal, state and local taxes on its income and property, including taxes on any undistributed income.
The Company has formed a wholly owned subsidiary to function as a taxable REIT subsidiary ("TRS") and filed a TRS election, together with such subsidiary, with the Internal Revenue Service. In general, a TRS may perform additional services for the Company's tenants and generally may engage in any real estate or non-real estate-related business. The TRS is subject to income taxation at the federal, state and local levels, as applicable, at regular corporate tax rates. The tax returns filed by the Company and its TRS for tax years 2022, 2023 and 2024 remain subject to examination by taxing authorities.
Earnings per Share of Common Stock
Basic earnings per share of common stock is computed by dividing net income or loss for the period by the weighted average number of shares of common stock outstanding during the period.
The restricted stock grants of Class E shares held by the Company's directors are considered to be participating securities because they contain non-forfeitable rights to distributions. The impact of these restricted stock grants on basic and diluted earnings per common share ("EPS") has been calculated using the two-class method whereby earnings are allocated to the restricted stock grants based on dividends declared and the restricted stocks' participation rights in undistributed earnings. As of September 30, 2025 and December 31, 2024, the effects of the two-class method on basic and diluted EPS were not material to the Company's condensed consolidated financial statements.
Organization and Offering Expenses
Organizational expenses are expensed as incurred on the Company's consolidated statement of operations, and offering costs are charged to equity as incurred on Company's consolidated statement of changes in stockholders' equity.
The Adviser and its affiliates advanced $8.0 million of organization and offering expenses on behalf of the Company (including legal, accounting, and other expenses attributable to the Company's organization, but excluding upfront selling commissions, dealer manager fees and stockholder servicing fees) through December 22, 2023, and the Company began reimbursing the Adviser for all such advanced expenses ratably over the 60 month period beginning December 22, 2024. Any amount due to the Adviser but not paid is recorded as a component of due to affiliates on the Company's consolidated balance sheet.
Stockholder Servicing Fee
Apollo Global Securities, LLC (the "Dealer Manager"), a registered broker-dealer affiliated with the Adviser, serves as the dealer manager for the Follow-On Offering. The Dealer Manager is entitled to receive selling commissions and dealer manager fees based on the transaction price of each applicable class of shares sold in the primary offering. The Dealer Manager is also entitled to receive a stockholder servicing fee based on the aggregate NAV of the Company's outstanding Class S shares and Class D shares.
The following table details the selling commissions, dealer manager fees, and stockholder servicing fees for each applicable share class as of September 30, 2025:
|
|
|
|
|
|
|
|
|
|
|
|
|
|
|
|
|
|
|
|
|
|
|
|
Class S Shares |
|
Class D Shares |
|
Class I Shares |
|
|
Class F-I Shares |
|
|
Class A-I Shares |
|
|
Class A-III Shares |
|
Selling commissions and dealer manager fees (% of transaction price) |
|
up to 3.5% |
|
up to 1.5% |
|
|
— |
|
|
|
— |
|
|
|
— |
|
|
|
— |
|
Stockholder servicing fee (% of NAV) |
|
0.85% |
|
0.25% |
|
|
— |
|
|
|
— |
|
|
|
— |
|
|
|
— |
|
For Class S shares sold in the primary offering, investors will pay upfront selling commissions of up to 3% and dealer manager fees of up to 0.5% of the transaction price; however, such amounts may vary at certain participating broker-dealers, provided that the sum will not exceed 3.5% of the transaction price. For Class D shares sold in the primary offering, investors will pay upfront selling commissions of up to 1.5% of the transaction price.
The Dealer Manager, as the dealer manager for the Follow-On Offering, is entitled to receive stockholder servicing fees of 0.85% per annum of the aggregate NAV for Class S shares. For Class D shares, a charge of 0.25% per annum of the aggregate NAV will be charged for stockholder servicing fees.
The Dealer Manager has entered into agreements with selected dealers that agree to distribute the Company's shares in the Follow-On Offering, which will provide, among other things, for the reallowance of the full amount of the selling commissions and stockholder servicing fees to such selected dealers. The Company will cease paying the stockholder servicing fee with respect to any Class S share or Class D share held in a stockholder's account at the end of the month in which the total selling commissions, dealer manager fees and stockholder servicing fees paid with respect to such shares would exceed, in the aggregate, 8.75% of the gross proceeds from the sale of such share. There is not a stockholder servicing fee, upfront selling commission or dealer manager fee with respect to Class I shares, Class F-I shares, Class A-I shares, and Class A-III shares. The Company accrues the cost of the stockholder servicing fee as an offering cost at the time each Class S share and Class D share is sold during the primary offering. As of September 30, 2025, the Company had accrued $22 thousand of stockholder servicing fees related to Class S and Class D shares sold. Such fees are recorded as a component of due to affiliates on the Company's condensed consolidated balance sheet.
Share Based Payments
The Company accounts for share-based compensation to its independent directors, to the Adviser and to employees of the Adviser and its affiliates using the fair value-based methodology prescribed by GAAP. Compensation cost related to restricted common stock issued is measured at its fair value at the grant date and amortized into expense over the vesting period on a straight-line basis.
Recent Accounting Pronouncements
In November 2024, the Financial Accounting Standards Board ("FASB") issued ASU 2024-03 "Expense Disaggregation Disclosures (Subtopic 220-40): Disaggregation of Income Statement Expenses" ("ASU 2024-03"). ASU 2024-03 requires disaggregation of certain expense captions in financial statement disclosures for each interim and annual reporting period. This guidance is effective for annual periods starting after December 15, 2026, and interim periods after December 15, 2027, with early adoption permitted. It is to be adopted on a prospective basis with the option to apply retrospectively. The Company has not early adopted ASU 2024-03 and is currently evaluating its impact. The Company does not expect it to materially affect its consolidated financial statements.
Note 3 - Investments in Real Estate
As of September 30, 2025 and December 31, 2024, the Company's investments in real estate, net, consisted of the following ($ in thousands):
|
|
|
|
|
|
|
|
|
|
|
|
September 30, 2025 |
|
|
December 31, 2024 |
|
Building and building improvements |
|
$ |
442,849 |
|
|
$ |
219,684 |
|
Land and land improvements |
|
|
52,340 |
|
|
|
29,244 |
|
Furniture, fixtures and equipment |
|
|
3,600 |
|
|
|
1,094 |
|
Tenant improvements |
|
|
2,513 |
|
|
|
2,513 |
|
Total |
|
|
501,302 |
|
|
|
252,535 |
|
Accumulated depreciation |
|
|
(13,375 |
) |
|
|
(6,868 |
) |
Investment in real estate, net |
|
$ |
487,927 |
|
|
$ |
245,667 |
|
Acquisitions
During the nine months ended September 30, 2025, the Company acquired $261.2 million of investments in real estate, which were comprised of three industrial properties and one multifamily property.
During the year ended December 31, 2024, the Company acquired $107.2 million of investments in real estate, which were comprised of one industrial property and one multifamily property.
The following table provides further details of the properties acquired during the nine months ended September 30, 2025 and the year ended December 31, 2024 ($ in thousands):
|
|
|
|
|
|
|
|
|
|
|
|
Property Type |
|
Acquisition Date |
|
Total Purchase Price (1) |
|
2025 Acquisitions: |
|
|
|
|
|
|
|
2865 Charter Street |
|
Industrial |
|
March 2025 |
|
$ |
75,230 |
|
Parc Westborough |
|
Multifamily |
|
May 2025 |
|
|
96,683 |
|
3707 W NC 10 Hwy |
|
Industrial |
|
August 2025 |
|
|
55,261 |
|
8681 W Jefferson Street |
|
Industrial |
|
September 2025 |
|
|
33,979 |
|
Total 2025 acquisitions |
|
|
|
|
|
$ |
261,153 |
|
|
|
|
|
|
|
|
|
2024 Acquisitions: |
|
|
|
|
|
|
|
4553 Cayce Road |
|
Industrial |
|
May 2024 |
|
$ |
57,839 |
|
The Beckett |
|
Multifamily |
|
May 2024 |
|
|
49,402 |
|
Total 2024 acquisitions |
|
|
|
|
|
$ |
107,241 |
|
(1) Purchase price is inclusive of closing costs.
The following table summarizes the purchase price allocation for the properties acquired during the nine months ended September 30, 2025, and for the properties acquired during the year ended December 31, 2024 ($ in thousands):
|
|
|
|
|
|
|
|
|
|
|
|
September 30, 2025 |
|
|
December 31, 2024 |
|
Building and building improvements |
|
$ |
223,163 |
|
|
$ |
86,888 |
|
Land and land improvements |
|
|
23,009 |
|
|
|
6,404 |
|
In-place lease intangibles |
|
|
25,617 |
|
|
|
9,950 |
|
Furniture, fixtures and equipment |
|
|
2,454 |
|
|
|
1,094 |
|
Tenant improvements |
|
|
- |
|
|
|
1,892 |
|
Above-market lease intangibles |
|
|
366 |
|
|
|
1,013 |
|
Below-market lease intangibles |
|
|
(13,456 |
) |
|
|
- |
|
Total purchase price |
|
$ |
261,153 |
|
|
$ |
107,241 |
|
Intangible assets are recorded in other assets on the accompanying condensed consolidated balance sheet. The intangibles of the properties are amortized over the remaining lease terms that they were derived from. As a result, the Company's intangibles have a weighted average amortization period of approximately 12 years. As of September 30, 2025 and December 31, 2024, the Company did not recognize any impairment on its real estate investments.
Note 4 - Investments in Real Estate Debt
The following table details the Company's investments in real estate debt as of September 30, 2025 ($ in thousands):
|
|
|
|
|
|
|
|
|
|
|
|
|
|
|
|
|
|
|
|
|
|
|
|
September 30, 2025 |
|
Type of Investment in Real Estate Debt |
|
Number of Positions |
|
Weighted Average Coupon (1) |
|
|
Weighted Average Maturity Date (2) |
|
Face Amount |
|
|
Cost Basis |
|
|
Fair Value |
|
Commercial mortgage loan |
|
25 |
|
|
7.7 |
% |
|
May 2029 (4) |
|
$ |
980,852 |
|
|
$ |
980,639 |
|
|
$ |
980,483 |
|
Mezzanine loan |
|
2 |
|
|
10.6 |
% |
|
April 2028 |
|
|
112,500 |
|
|
|
112,500 |
|
|
|
112,500 |
|
Real estate-related securities (3) |
|
31 |
|
|
5.9 |
% |
|
July 2038 |
|
|
95,654 |
|
|
|
95,475 |
|
|
|
95,766 |
|
Total investments in real estate debt: |
|
58 |
|
|
7.8 |
% |
|
January 2030 |
|
$ |
1,189,006 |
|
|
$ |
1,188,614 |
|
|
$ |
1,188,749 |
|
The following table details the Company's investments in real estate debt as of December 31, 2024 ($ in thousands):
|
|
|
|
|
|
|
|
|
|
|
|
|
|
|
|
|
|
|
|
|
|
|
|
December 31, 2024 |
|
Type of Investment in Real Estate Debt |
|
Number of Positions |
|
Weighted Average Coupon (1) |
|
|
Weighted Average Maturity Date (2) |
|
Face Amount |
|
|
Cost Basis |
|
|
Fair Value |
|
Commercial mortgage loan |
|
21 |
|
|
7.9 |
% |
|
May 2028 |
|
$ |
701,742 |
|
|
$ |
701,720 |
|
|
$ |
701,566 |
|
Mezzanine loan |
|
2 |
|
|
10.6 |
% |
|
April 2028 |
|
|
112,500 |
|
|
|
112,500 |
|
|
|
112,500 |
|
Real estate-related securities (3) |
|
29 |
|
|
6.0 |
% |
|
April 2038 |
|
|
73,035 |
|
|
|
72,794 |
|
|
|
73,120 |
|
Total investments in real estate debt: |
|
52 |
|
|
8.1 |
% |
|
March 2029 |
|
$ |
887,277 |
|
|
$ |
887,014 |
|
|
$ |
887,186 |
|
(1)Based on applicable benchmark rates as of September 30, 2025 and December 31, 2024, respectively.
(2)Weighted average maturity date is based on fully extended maturity.
(3)The Company's real estate-related securities consist of floating-rate commercial mortgage backed securities ("CMBS").
(4)One of the Company's commercial mortgage loans is past its contractual maturity. Through the date of this quarterly report, the Company received all the monthly interest income payments on the loan which are consistent with the interest rate provided for in the original loan agreement. Subsequent to the date of these condensed consolidated financial statements but prior to the date of this quarterly report, the borrower filed for Chapter 11 bankruptcy, The Company evaluated the loan for collectability as of the reporting date and determined that the loan is fully recoverable.
The table below details the type of properties securing the loans in the Company's portfolio at the dates indicated ($ in thousands):
|
|
|
|
|
|
|
|
|
|
|
|
|
|
|
|
|
|
|
|
September 30, 2025 |
|
|
December 31, 2024 |
|
Property Type |
|
|
Fair Value |
|
% of Portfolio |
|
|
Fair Value |
|
% of Portfolio |
|
Multifamily |
|
|
$ |
320,191 |
|
|
29.4 |
% |
|
$ |
353,208 |
|
|
43.2 |
% |
Data Center |
|
|
|
276,295 |
|
|
25.3 |
% |
|
|
143,836 |
|
|
17.7 |
% |
Hotel |
|
|
|
112,862 |
|
|
10.3 |
% |
|
|
119,360 |
|
|
14.7 |
% |
Industrial |
|
|
|
99,761 |
|
|
9.1 |
% |
|
|
99,761 |
|
|
12.3 |
% |
Self-Storage |
|
|
|
94,103 |
|
|
8.6 |
% |
|
|
40,700 |
|
|
5.0 |
% |
Mixed Use |
|
|
|
92,884 |
|
|
8.5 |
% |
|
|
- |
|
|
0.0 |
% |
Production Studio |
|
|
|
72,547 |
|
|
6.6 |
% |
|
|
36,260 |
|
|
4.5 |
% |
Life Sciences |
|
|
|
24,340 |
|
|
2.2 |
% |
|
|
20,941 |
|
|
2.6 |
% |
Total |
|
|
$ |
1,092,983 |
|
|
100.0 |
% |
|
$ |
814,066 |
|
|
100.0 |
% |
The table below details the geographic distribution of the properties securing the loans in the Company's portfolio at the dates indicated ($ in thousands):
|
|
|
|
|
|
|
|
|
|
|
|
|
|
|
|
|
|
|
|
September 30, 2025 |
|
|
December 31, 2024 |
|
Geographic Location |
|
|
Fair Value |
|
% of Portfolio |
|
|
Fair Value |
|
% of Portfolio |
|
Northeast |
|
|
$ |
350,800 |
|
|
32.0 |
% |
|
|
300,299 |
|
|
36.9 |
% |
West |
|
|
|
309,950 |
|
|
28.4 |
% |
|
$ |
204,847 |
|
|
25.2 |
% |
Southwest |
|
|
|
194,874 |
|
|
17.8 |
% |
|
|
76,523 |
|
|
9.4 |
% |
Mid-Atlantic |
|
|
|
123,117 |
|
|
11.3 |
% |
|
|
126,149 |
|
|
15.5 |
% |
Midwest |
|
|
|
81,624 |
|
|
7.5 |
% |
|
|
74,116 |
|
|
9.1 |
% |
Southeast |
|
|
|
32,618 |
|
|
3.0 |
% |
|
|
32,132 |
|
|
3.9 |
% |
Total |
|
|
$ |
1,092,983 |
|
|
100.0 |
% |
|
$ |
814,066 |
|
|
100.0 |
% |
The total income from investments in real estate debt disclosed on the Company's condensed consolidated statement of operations relates to interest income, upfront fees, amortization of premiums/discounts, and realized and unrealized gain/(loss) on these investments in real estate debt. For the three and nine months ended September 30, 2025, the Company recorded $0.3 million and de minimis unrealized losses on its investments in real estate debt, respectively. For the three and nine months ended September 30, 2024, the Company recorded de minimis and $0.2 million of unrealized gain on its investments in real estate debt, respectively. For the three and nine months ended September 30, 2025, realized gains on investments in real estate debt were de minimis and $0.1 million, respectively. For the three and nine months ended September 30, 2024, the Company recorded de minimis and $0.1 million of realized gains on its investments in real estate debt, respectively.
The following table details the components of the Company's other assets at the dates indicated ($ in thousands):
|
|
|
|
|
|
|
|
|
|
|
|
September 30, 2025 |
|
|
December 31, 2024 |
|
Real estate intangibles, net |
|
$ |
54,048 |
|
|
$ |
32,841 |
|
Loan proceeds held by servicer (1) |
|
|
25,166 |
|
|
|
— |
|
Straight-line rent receivable |
|
|
6,019 |
|
|
|
3,597 |
|
Interest receivable |
|
|
5,881 |
|
|
|
5,017 |
|
Deferred financing costs, net |
|
|
511 |
|
|
|
— |
|
Other |
|
|
1,482 |
|
|
|
891 |
|
Total |
|
$ |
93,107 |
|
|
$ |
42,346 |
|
(1)Includes loan principal, interest, and other fees held by the Company's third-party servicers as of the balance sheet date and remitted during the subsequent remittance cycle.
Note 6 - Intangibles
The gross carrying amount and accumulated amortization of the Company's intangible assets consisted of the following as of the dates indicated ($ in thousands):
|
|
|
|
|
|
|
|
|
|
|
|
September 30, 2025 |
|
|
December 31, 2024 |
|
Intangible assets: |
|
|
|
|
|
|
In-place lease intangibles |
|
$ |
61,929 |
|
|
$ |
36,313 |
|
Above-market lease intangibles |
|
|
1,704 |
|
|
|
1,338 |
|
Total intangible assets |
|
|
63,633 |
|
|
|
37,651 |
|
Accumulated amortization: |
|
|
|
|
|
|
In-place lease amortization |
|
|
(9,301 |
) |
|
|
(4,672 |
) |
Above-market lease amortization |
|
|
(284 |
) |
|
|
(138 |
) |
Total real estate intangible assets, net |
|
$ |
54,048 |
|
|
$ |
32,841 |
|
Intangible liabilities |
|
|
|
|
|
|
Below-market lease intangibles |
|
$ |
(24,311 |
) |
|
$ |
(10,855 |
) |
Total intangible liabilities |
|
|
(24,311 |
) |
|
|
(10,855 |
) |
Accumulated amortization: |
|
|
|
|
|
|
Below-market lease amortization |
|
|
1,728 |
|
|
|
1,014 |
|
Total real estate intangible liabilities, net |
|
$ |
(22,583 |
) |
|
$ |
(9,841 |
) |
The estimated future amortization on the Company's intangibles for each of the next five years and thereafter as of September 30, 2025, is as follows ($ in thousands):
|
|
|
|
|
|
|
|
|
|
|
|
|
|
|
|
In-Place Lease Intangibles |
|
|
Above-Market Intangibles |
|
|
Below-Market Intangibles |
|
2025 (remaining) |
|
$ |
1,920 |
|
|
$ |
50 |
|
|
$ |
(479 |
) |
2026 |
|
|
5,740 |
|
|
|
202 |
|
|
|
(1,913 |
) |
2027 |
|
|
5,740 |
|
|
|
202 |
|
|
|
(1,913 |
) |
2028 |
|
|
5,722 |
|
|
|
202 |
|
|
|
(1,904 |
) |
2029 |
|
|
5,690 |
|
|
|
202 |
|
|
|
(1,887 |
) |
2030 |
|
|
5,197 |
|
|
|
202 |
|
|
|
(1,730 |
) |
Thereafter |
|
|
22,619 |
|
|
|
360 |
|
|
|
(12,757 |
) |
|
|
$ |
52,628 |
|
|
$ |
1,420 |
|
|
$ |
(22,583 |
) |
Note 7 - Leases
Lessor
The Company's rental revenue consists of rent earned from the operating leases at the Company's industrial, retail and multifamily properties. The leases at the Company's industrial and retail properties generally includes a fixed base rent, subject to annual step-ups, and a variable component. The variable component of the Company's operating leases primarily consists of the reimbursement of operating expenses such as real estate taxes, insurance, and common area maintenance costs.
The following table summarizes the fixed and variable components of the Company's operating leases ($ in thousands):
|
|
|
|
|
|
|
|
|
|
|
|
|
|
|
|
|
|
Three Months Ended September 30, |
|
|
Nine Months Ended September 30, |
|
|
2025 |
|
|
2024 |
|
|
2025 |
|
|
2024 |
|
Fixed lease payments |
$ |
8,717 |
|
|
$ |
5,026 |
|
|
$ |
21,249 |
|
|
$ |
12,068 |
|
Variable lease payments |
|
1,272 |
|
|
$ |
1,123 |
|
|
|
2,957 |
|
|
$ |
2,438 |
|
Lease revenue |
$ |
9,989 |
|
|
$ |
6,149 |
|
|
$ |
24,206 |
|
|
$ |
14,506 |
|
Above- and below-market lease amortization |
|
269 |
|
|
|
153 |
|
|
|
568 |
|
|
|
514 |
|
Rental revenue |
$ |
10,258 |
|
|
$ |
6,302 |
|
|
$ |
24,774 |
|
|
$ |
15,020 |
|
The following table presents the undiscounted future minimum rents the Company expects to receive for its industrial, retail and multifamily properties as of September 30, 2025 ($ in thousands):
|
|
|
|
|
|
Year |
|
Future Minimum Rents |
|
2025 (remaining) |
|
$ |
7,807 |
|
2026 |
|
|
80,431 |
|
2027 |
|
|
25,627 |
|
2028 |
|
|
26,289 |
|
2029 |
|
|
26,662 |
|
2030 |
|
|
25,791 |
|
Thereafter |
|
|
148,141 |
|
Total |
|
$ |
340,748 |
|
Note 8 - Mortgage Notes
The Company's mortgage notes at September 30, 2025 and December 31, 2024 are detailed in the following table ($ in thousands):
|
|
|
|
|
|
|
|
|
|
|
|
|
|
|
|
|
|
|
|
|
|
|
|
September 30, 2025 |
|
December 31, 2024 |
|
|
Principal Balance Outstanding |
|
|
Weighted Average Interest Rate |
|
|
Weighted Average Maturity Date |
|
Principal Balance Outstanding |
|
|
Weighted Average Interest Rate |
|
|
Weighted Average Maturity Date |
Fixed rate mortgages |
|
$ |
94,300 |
|
|
|
5.45 |
% |
|
October 2029 |
|
$ |
36,000 |
|
|
|
6.05 |
% |
|
November 2028 |
Less: Unamortized deferred financing costs |
|
|
(1,361 |
) |
|
|
|
|
|
|
|
(325 |
) |
|
|
|
|
|
|
|
$ |
92,939 |
|
|
|
|
|
|
|
$ |
35,675 |
|
|
|
|
|
|
During the nine months ended September 30, 2025, the Company obtained a $58.3 million fixed-rate mortgage loan to finance the acquisition of Parc Westborough. During the year ended December 31, 2024, the Company did not obtain or repay any mortgage loans.
The following table details the future principal payments due under the Company's mortgage loans as of September 30, 2025 ($ in thousands):
|
|
|
|
|
|
Year |
|
Amount |
|
2025 (remaining) |
|
$ |
- |
|
2026 |
|
|
- |
|
2027 |
|
|
- |
|
2028 |
|
|
36,000 |
|
2029 |
|
|
- |
|
2030 |
|
|
58,300 |
|
Total |
|
$ |
94,300 |
|
The Company is subject to various financial and operational covenants under certain of its mortgage loans. As of September 30, 2025 and December 31, 2024, the Company was in compliance with all of its loan covenants.
Note 9 - Secured Debt Arrangements
The Company's borrowings under secured debt arrangements at September 30, 2025 and December 31, 2024 are detailed in the following table ($ in thousands):
|
|
|
|
|
|
|
|
|
|
|
|
|
|
|
|
|
|
|
|
|
|
|
|
|
|
|
September 30, 2025 |
|
December 31, 2024 |
|
|
Maximum Amount of Borrowings |
|
|
Borrowings Outstanding |
|
|
Weighted Average Borrowing Costs |
|
Maturity Date (1) |
|
Maximum Amount of Borrowings |
|
|
Borrowings Outstanding |
|
|
Weighted Average Borrowing Costs |
|
Maturity Date (1) |
JPM Repurchase Facility |
|
$ |
400,000 |
|
|
$ |
271,419 |
|
|
SOFR + 2.08% |
|
October 2028 |
|
$ |
250,000 |
|
|
$ |
139,985 |
|
|
SOFR + 2.42% |
|
October 2028 |
Barclays Repurchase Facility |
|
|
500,000 |
|
|
|
- |
|
|
N/A |
|
July 2030 |
|
|
- |
|
|
|
- |
|
|
N/A |
|
N/A |
Less: Unamortized deferred financing costs |
|
N/A |
|
|
|
(439 |
) |
|
|
|
|
|
N/A |
|
|
|
(1,065 |
) |
|
|
|
|
|
|
$ |
900,000 |
|
|
$ |
270,980 |
|
|
|
|
|
|
$ |
250,000 |
|
|
$ |
138,920 |
|
|
|
|
|
(1)Maturity date assumes extensions at the Company's option are exercised with consent of the financing provider.
At September 30, 2025, the Company's borrowings had the following maturities ($ in thousands):
|
|
|
|
|
|
|
|
|
|
|
|
|
|
|
|
|
|
|
|
|
|
|
|
Less than 1 year |
|
|
1 to 3 years |
|
|
3 to 5 years |
|
|
More than 5 years |
|
|
Total |
|
JPM Repurchase Facility |
|
$ |
- |
|
|
$ |
120,717 |
|
|
$ |
150,702 |
|
|
$ |
- |
|
|
$ |
271,419 |
|
The table above assumes extensions at the Company's option are exercised with consent of financing providers, where applicable.
Repurchase Agreements
Certain indirect subsidiaries (the "JPM Sellers") of the Company entered into a Master Repurchase Agreement with JPMorgan Chase Bank, National Association (the "JPM Repurchase Facility"), which provides the Company the ability to make borrowings secured by certain investments in commercial mortgage loans. The JPM Repurchase Facility has a three-year term plus two one-year extension options. The Operating Partnership has agreed to provide a limited guarantee of the obligations of the JPM Sellers under the JPM Repurchase Facility. During the nine months ended September 30, 2025, the Company increased the maximum aggregate purchase price of the JPM Repurchase Facility from $250.0 million to $400.0 million.
Additionally, during the nine months ended September 30, 2025, certain indirect subsidiaries (the "Barclays Sellers") of the Company entered into a Master Repurchase Agreement with Barclays Bank PLC (the "Barclays Repurchase Facility"), which provides the Company the ability to make borrowings secured by certain investments in commercial mortgage loans. The Barclays Repurchase Facility has a three-year term plus two one-year extension options. The Operating Partnership has agreed to provide a limited guarantee of the obligations of the Barclays Sellers under the Barclays Repurchase Facility.
Lastly, during the nine months ended September 30, 2025, an indirect subsidiary (the "BofA Seller") of the Company entered into a Master Repurchase Agreement with BofA Securities, Inc. (the "BofA Repurchase Facility"), which provides the Company the ability to make revolving borrowings secured by certain investments in real estate-related securities. The Operating Partnership has agreed to provide a payment guarantee of the obligations of the BofA Seller under the BofA Repurchase Facility. As of September 30, 2025, there were no outstanding borrowings on the BofA Repurchase Facility.
Debt Covenants
The guarantees related to the Company's secured financings contain the following financial covenants: (i) while tangible net worth is equal to or less than $450.0 million, the Operating Partnership's NAV is not permitted to decline by 20% from the preceding quarter or 40% from the corresponding calendar month of the preceding calendar year; (ii) NAV cannot decline by 50% or more from the Operating Partnership's NAV as of October 26, 2023; (iii) the Operating Partnership's ratio of total indebtedness to tangible net worth cannot be greater than 3.00:1; and (iv) the Operating Partnership's liquidity cannot be less than an amount equal to the greater of 5% of total recourse indebtedness or $30.0 million.
The Company was in compliance with the covenants under its secured financing as of September 30, 2025 and December 31, 2024. The impact of macroeconomic conditions on the commercial real estate markets and global capital markets, including increased interest rates, changes to fiscal and monetary policy, slower economic growth or recession, labor shortages, and recent distress in the banking sector, may make it more difficult to meet or satisfy these covenants in the future.
Note 10 - Other Liabilities
The following table details the components of the Company's other liabilities at the date indicated ($ in thousands):
|
|
|
|
|
|
|
|
|
|
|
|
September 30, 2025 |
|
|
December 31, 2024 |
|
Below market lease intangibles, net |
|
$ |
22,583 |
|
|
$ |
9,841 |
|
Settlement payment due for investment acquisition |
|
|
9,975 |
|
|
|
- |
|
Distribution payable |
|
|
6,464 |
|
|
|
4,859 |
|
Accounts payable and accrued expenses |
|
|
4,913 |
|
|
|
3,035 |
|
Accrued repurchases of common stock |
|
|
2,994 |
|
|
|
2,198 |
|
Real estate taxes payable |
|
|
2,872 |
|
|
|
1,385 |
|
Total |
|
$ |
49,801 |
|
|
$ |
21,318 |
|
Note 11 - Related Party Transactions
Pursuant to the Advisory Agreement the Adviser is responsible for sourcing, evaluating and monitoring the Company's investment opportunities and making decisions related to the acquisition, management, financing and disposition of the Company's assets, in accordance with the Company's investment objectives, guidelines, policies and limitations, subject to oversight by the Company's board of directors.
The Special Limited Partner holds a performance participation interest in the Operating Partnership that entitles it to receive an allocation from the Operating Partnership on Class S shares, Class D shares, and Class I shares equal to 12.5% of the annual Total Return, subject to a 5% annual Hurdle Amount and a High Water Mark, with a Catch-Up (each term as defined in the limited partnership agreement of the Operating Partnership, by and among the Company, as general partner, the Special Limited Partner and the limited partners party thereto from time to time (as amended, restated or otherwise modified from time to time, the "Limited Partnership Agreement")). On Class F-I shares, the Special Limited Partner is entitled to receive an allocation equal to 9.0% of the annual Total Return, subject to a 5% annual Hurdle Amount and a High Water Mark, with a Catch-Up (each term as defined in the Limited Partnership Agreement). Such allocation accrues monthly and is paid annually. There is no performance participation interest with respect to Class A-I shares, Class A-III shares, and Class E shares. The performance participation interest is paid, at the Adviser's election, in cash, Class E shares, Class E units or any combination thereof. During the three and nine months ended September 30, 2025, the Company accrued $0.1 million and $0.3 million of performance participation allocation, respectively. During the three and nine months ended September 30, 2024, the Company accrued $0.1 million and $0.3 million of performance participation allocation, respectively.
The Company may retain certain of the Adviser's affiliates for necessary services relating to the Company's investments or its operations, including but not limited to any accounting and audit services (including valuation support services), account management services, administrative services, data management services, information technology services, finance/budget services, legal services, operational services, risk management services, tax services, treasury services, construction, special servicing, leasing, development, coordinating closing and post-closing procedures, property oversight, statutory services, and other property management services, as well as services related to mortgage servicing, group purchasing, healthcare, consulting/brokerage, capital markets/credit origination, broker-dealer services, underwriting, placing, syndicating, structuring, arranging, debt advisory services and other similar services, loan servicing, property, title and/or other types of insurance, title agency services, management consulting and other similar operational matters. Any fees paid to the Adviser's affiliates for any such services will not reduce the management fee or performance participation allocation. Any such arrangements will be at market terms and rates.
The Company has engaged Nations Land Services, L.P. ("Nations"), a title agent company affiliated with Apollo. Nations acts as a title agent in facilitating and issuing title insurance in connection with investments by the Company, affiliates, and related parties, and third parties. Apollo receives distributions from Nations in connection with investments by the Company based on its equity interest in Nations. In each case, there will be no related offset to the Company. During the nine months ended September 30, 2025, the Company incurred $0.2 million of expenses for services provided by Nations.
In February 2025, the Company engaged Lyra Client Solutions Holdings, LLC ("Lyra"), an end-to-end client service platform affiliated with Apollo. Lyra provides administration, data management, trade operations, investor onboarding and servicing, technology and other similar services for institutional, global wealth, global family office and retail investors. During the nine months ended September 30, 2025, the Company incurred $0.3 million of expenses for services provided by Lyra.
The Dealer Manager serves as the dealer manager for the Follow-On Offering. The Dealer Manager is a registered broker-dealer affiliated with the Adviser. The Company entered into an agreement (the "Dealer Manager Agreement") with the Dealer Manager in connection with the Follow-On Offering. Subject to the terms of the Dealer Manager Agreement, the Company's obligations to pay stockholder servicing fees with respect to the Class S shares and Class D shares sold in the Follow-On Offering shall survive until such shares are no longer outstanding (including because such shares have converted into Class I shares or Class F-I shares).
The Dealer Manager is entitled to receive selling commissions of up to 3.0%, and dealer manager fees of up to 0.5%, of the transaction price of each Class S share sold in the primary offering; however, such amounts may vary at certain participating broker-dealers, provided that the sum will not exceed 3.5% of the transaction price. Participating broker-dealers are third-party broker-dealers engaged by the Dealer Manager to participate in the distribution of shares of the Company's common stock. The Dealer Manager is also entitled to receive selling commissions of up to 1.5% of the transaction price of each Class D share sold in the primary offering. The Dealer Manager also receives a stockholder servicing fee of 0.85% and 0.25% per annum of the aggregate NAV of the Company's outstanding Class S and Class D shares, respectively. The Dealer Manager has entered into agreements with selected dealers that agree to distribute the Company's shares in the Follow-On Offering, which will provide, among other things, for the reallowance of the full amount of the selling commissions and stockholder servicing fees to such selected dealers. The Company will cease paying the stockholder servicing fee with respect to any Class S share or Class D share held in a stockholder's account at the end of the month in which the total selling commissions, dealer manager fees and stockholder servicing fees paid with respect to such shares would exceed, in the aggregate, 8.75% of the gross proceeds from the sale of such shares. The Company accrues the cost of the stockholder servicing fee as an offering cost at the time each Class S share and Class D share is sold during the primary offering. There will not be a stockholder servicing fee, upfront selling commission or dealer manager fee with respect to Class I shares, Class F-I shares, Class A-I shares and Class A-III shares.
From time to time, the Company makes co-investments in commercial mortgage and mezzanine loans alongside Apollo affiliates. As of September 30, 2025, all of the Company's investments in commercial mortgage and mezzanine loans were pari-passu co-investments with Apollo affiliates.
The Company may also offer Class E shares, which will only be available to certain of Apollo's affiliates, directors and employees, in one or more private placements. These shares are not being offered to the public pursuant to the Follow-On Offering and will not incur any upfront selling costs, ongoing servicing costs, management fee or performance participation allocation.
Apollo ARIS Holdings LLC, an indirect wholly-owned subsidiary of Apollo, has elected to reinvest the dividends declared on its Class F-I shares, which resulted in the issuance of 151 and 449 additional Class F-I shares during the three and nine months ended September 30, 2025, respectively.
An affiliate of Apollo has elected to reinvest its dividends declared on its Class A-I units, which resulted in the issuance of 73,257 and 217,862 additional Class A-I units during the three and nine months ended September 30, 2025, respectively.
Due to Affiliates
The following table details the Company's expenses that are due to its Adviser:
|
|
|
|
|
|
|
|
|
|
|
|
September 30, 2025 |
|
|
December 31, 2024 |
|
Organization and offering |
|
$ |
6,746 |
|
|
$ |
7,944 |
|
General and administrative |
|
|
6,200 |
|
|
|
7,301 |
|
Management fee payable |
|
|
1,096 |
|
|
|
828 |
|
Accrued performance participation allocation |
|
|
297 |
|
|
|
443 |
|
Accrued stockholder servicing fee |
|
|
22 |
|
|
|
15 |
|
Total |
|
$ |
14,361 |
|
|
$ |
16,531 |
|
Organization and Offering Expenses
The Adviser advanced $8.0 million of organization and offering expenses (including legal, accounting, and other expenses attributable to the Company's organization, but excluding upfront selling commissions, dealer manager fees and stockholder servicing fees) on behalf of the Company for costs incurred through December 22, 2023. The Company reimburses the Adviser for all such advanced costs ratably over the 60 month period beginning December 22, 2024.
General and Administrative Expenses
The Adviser advanced $7.3 million of general and administrative expenses on behalf of the Company for expenses incurred through December 22, 2023. The Company reimburses the Adviser for all such advanced expenses ratably over the 60 month period beginning December 24, 2024.
Management Fee Payable
The Adviser is entitled to a management fee equal to 1.25% of NAV per annum, payable monthly on Class S shares, Class D shares, and Class I shares. The Adviser will be paid a management fee equal to 1.0% of NAV per annum, payable monthly on Class F-I shares, and Class A-I shares. The Adviser will be paid a management fee equal to 1.0% of NAV for Class A-III shares per annum payable monthly; and provided that, for the period from April 1, 2023 through January 2, 2027, this management fee will be reduced to 0.85% of NAV for Class A-III shares per annum payable monthly. The management fee will be paid, at the Adviser's election, in cash, Class E shares, Class E units or any combination thereof. During the three and nine months ended September 30, 2025, the Company incurred $3.2 million and $8.8 million of management fees.
During the three months ended September 30, 2025, the Company issued 129,750 Class E shares and 13,939 Class E units to the Adviser as payment for its management fee. The shares and units issued to the Adviser for payment of the management fee were issued at the applicable NAV per share/unit at the end of each month for which the fee was earned, in reliance upon the exemption from registration set forth in Section 4(a)(2) of the Securities Act of 1933, as amended (the "Securities Act"). The Adviser did not submit any repurchase requests for any shares or Operating Partnership units previously issued as payment for the management fee during the nine months ended September 30, 2025.
The Adviser has elected to reinvest the dividends declared on the shares and Operating Partnership units issued for its management fee. In connection with such dividend reinvestment, the Company issued (i) 11,018 and 27,147 Class E shares and (ii) 2,187 and 5,843 Class E units to the Adviser in lieu of cash for the dividends paid during the three and nine months ended September 30, 2025, respectively.
Accrued Performance Participation Allocation
The Special Limited Partner holds a performance participation interest in the Operating Partnership equal to (1) 12.5% of the Total Return with respect to Class S units, Class D units and Class I units and (2) 9.0% of the Total Return with respect to Class F-I units subject to a 5% Hurdle Amount and a High Water Mark with respect to such class of Operating Partnership units, with a Catch-Up.
The performance participation interest is accrued monthly and paid annually. During the nine months ended September 30, 2025, the Company issued 20,744 Class E units to the Special Limited Partner in satisfaction of the performance participation allocation earned during the year ended December 31, 2024. The Operating Partnership units issued to the Special Limited Partner for payment of the performance participation allocation were issued at the applicable NAV per share/unit as of December 31, 2024, in reliance upon the exemption from registration set forth in Section 4(a)(2) of the Securities Act. The Special Limited Partner did not submit any repurchase requests for any Operating Partnership units previously issued as payment of the performance participation allocation during the three and nine months ended September 30, 2025.
Accrued Stockholder Servicing Fee
The Company accrues the full amount of the future stockholder servicing fees payable to the Dealer Manager, up to 8.75% of the gross proceeds limit, at the time such shares are sold. The Dealer Manager has entered into agreements with the selected dealers distributing the Company's shares as part of its continuous public offering, that provide, among other things, for the payment of the full amount of the selling commissions and dealer manager fee, and all or a portion of the stockholder servicing fees received by the Dealer Manager to such selected dealers.
Note 12 - Economic Dependency
The Company depends on the Adviser and its affiliates for certain services that are essential to it, including the sale of the Company's shares of common stock, acquisition and disposition decisions, and certain other responsibilities. In the event that the Adviser and its affiliates are unable or unwilling to provide such services, the Company would be required to find alternative service providers. The Company may retain third parties, including certain of the Adviser's affiliates, for necessary services relating to its investments or operations.
Note 13 - Share Based Payments
The Company's board of directors approved the Apollo Realty Income Solutions, Inc. Amended and Restated 2022 Equity Incentive Plan (the "2022 Equity Incentive Plan"), pursuant to which shares of the Company's common stock may be granted from time to time to directors and officers of the Company and employees of the Adviser. The 2022 Equity Incentive Plan allows for up to 10,000,000 shares of the Company's common stock to be issued.
The following table summarizes the grants, vesting and forfeitures of restricted common stock during the nine months ended September 30, 2025:
|
|
|
|
|
|
|
|
|
|
|
|
Restricted Stock |
|
|
Grant Date Fair Value ($ in thousands) |
|
Outstanding as of December 31, 2024 |
|
|
4,763 |
|
|
|
|
Granted |
|
|
4,681 |
|
|
|
100 |
|
Vested |
|
|
(4,763 |
) |
|
|
— |
|
Forfeiture |
|
|
— |
|
|
|
— |
|
Outstanding as of September 30, 2025 |
|
|
4,681 |
|
|
|
|
Restricted Stock Grants
During the nine months ended September 30, 2025, the Company issued 4,681 Class E shares to the independent directors of the Company's board of directors to cover the restricted stock portion of the annual base director's fee for the independent directors' services to the Company. The fair value of these shares was determined using the most recently available NAV and they are subject to a one-year vesting period.
During the three and nine months ended September 30, 2025, the Company recorded $25 thousand and $75 thousand of restricted stock amortization as general and administrative expenses in the condensed consolidated statement of operations, respectively. There are six months of remaining amortization related to the grants of restricted stock, which represents unrecognized compensation cost of $50 thousand as of September 30, 2025.
Note 14 - Equity
Authorized Capital
As of September 30, 2025, the Company is authorized to issue preferred stock and seven classes of common stock consisting of Class S shares, Class D shares, Class I shares, Class F-I shares, Class A-I shares, Class A-III shares, and Class E shares. The differences among the classes of common stock relate to upfront selling commissions, dealer manager fees, and ongoing stockholder servicing fees, as well as varying management and performance participation allocations. See "Note 11 - Related Party Transactions" for additional information.
As of September 30, 2025 and December 31, 2024, the Company had the following classes of common stock authorized, issued and outstanding:
|
|
|
|
|
|
|
|
|
|
|
|
|
|
|
|
|
|
|
|
September 30, 2025 |
|
|
December 31, 2024 |
|
Classification |
|
Shares Authorized |
|
|
Shares Issued and Outstanding |
|
|
Shares Authorized |
|
|
Shares Issued and Outstanding |
|
Preferred Stock, $0.01 par value per share |
|
|
100,000,000 |
|
|
|
— |
|
|
|
100,000,000 |
|
|
|
— |
|
Class S Shares, $0.01 par value per share |
|
|
100,000,000 |
|
|
|
10,690 |
|
|
|
100,000,000 |
|
|
|
5,750 |
|
Class D Shares, $0.01 par value per share |
|
|
100,000,000 |
|
|
|
4,888 |
|
|
|
100,000,000 |
|
|
|
4,715 |
|
Class I Shares, $0.01 par value per share |
|
|
150,000,000 |
|
|
|
1,256,041 |
|
|
|
100,000,000 |
|
|
|
1,017,717 |
|
Class F-S Shares, $0.01 par value per share |
|
|
— |
|
|
|
— |
|
|
|
100,000,000 |
|
|
|
— |
|
Class F-D Shares, $0.01 par value per share |
|
|
— |
|
|
|
— |
|
|
|
100,000,000 |
|
|
|
— |
|
Class F-I Shares, $0.01 par value per share |
|
|
100,000,000 |
|
|
|
1,536,334 |
|
|
|
100,000,000 |
|
|
|
1,565,701 |
|
Class A-I Shares, $0.01 par value per share |
|
|
200,000,000 |
|
|
|
20,436,967 |
|
|
|
100,000,000 |
|
|
|
16,582,608 |
|
Class A-II Shares, $0.01 par value per share |
|
|
— |
|
|
|
— |
|
|
|
100,000,000 |
|
|
|
— |
|
Class A-III Shares, $0.01 par value per share |
|
|
250,000,000 |
|
|
|
37,414,743 |
|
|
|
100,000,000 |
|
|
|
25,546,118 |
|
Class E Shares, $0.01 par value per share |
|
|
100,000,000 |
|
|
|
869,398 |
|
|
|
100,000,000 |
|
|
|
489,542 |
|
Total |
|
|
1,100,000,000 |
|
|
|
61,529,061 |
|
|
|
1,100,000,000 |
|
|
|
45,212,151 |
|
Common Stock
The following table details the movement in the Company's outstanding shares of common stock:
|
|
|
|
|
|
|
|
|
|
|
|
|
|
|
|
|
|
|
|
|
|
|
|
|
|
|
|
|
|
|
|
Class S |
|
|
Class D |
|
|
Class I |
|
|
Class F-I |
|
|
Class A-I |
|
|
Class A-III |
|
|
Class E |
|
Beginning balance, December 31, 2024 |
|
|
5,750 |
|
|
|
4,715 |
|
|
|
1,017,717 |
|
|
|
1,565,701 |
|
|
|
16,582,608 |
|
|
|
25,546,118 |
|
|
|
489,542 |
|
Common stock issued |
|
|
— |
|
|
|
— |
|
|
|
51,629 |
|
|
|
— |
|
|
|
1,652,390 |
|
|
|
4,213,973 |
|
|
|
110,501 |
|
Repurchase of common stock |
|
|
— |
|
|
|
— |
|
|
|
— |
|
|
|
(2,443 |
) |
|
|
(182,844 |
) |
|
|
(112,835 |
) |
|
|
(11,990 |
) |
Dividend reinvestment |
|
|
— |
|
|
|
57 |
|
|
|
3,034 |
|
|
|
3,459 |
|
|
|
90,170 |
|
|
|
9,027 |
|
|
|
7,287 |
|
Ending balance, March 31, 2025 |
|
|
5,750 |
|
|
|
4,772 |
|
|
|
1,072,380 |
|
|
|
1,566,717 |
|
|
|
18,142,324 |
|
|
|
29,656,283 |
|
|
|
595,340 |
|
Common stock issued |
|
|
— |
|
|
|
— |
|
|
|
76,105 |
|
|
|
— |
|
|
|
1,047,441 |
|
|
|
3,809,905 |
|
|
|
123,978 |
|
Repurchase of common stock |
|
|
— |
|
|
|
— |
|
|
|
(5,752 |
) |
|
|
(9,930 |
) |
|
|
(43,330 |
) |
|
|
(91,076 |
) |
|
|
— |
|
Dividend reinvestment |
|
|
— |
|
|
|
57 |
|
|
|
3,596 |
|
|
|
3,497 |
|
|
|
99,783 |
|
|
|
18,793 |
|
|
|
9,149 |
|
Ending balance, June 30, 2025 |
|
|
5,750 |
|
|
|
4,829 |
|
|
|
1,146,329 |
|
|
|
1,560,284 |
|
|
|
19,246,218 |
|
|
|
33,393,905 |
|
|
|
728,467 |
|
Common stock issued |
|
|
4,922 |
|
|
|
— |
|
|
|
119,880 |
|
|
|
— |
|
|
|
1,173,215 |
|
|
|
4,270,583 |
|
|
|
129,749 |
|
Repurchase of common stock |
|
|
— |
|
|
|
— |
|
|
|
(14,392 |
) |
|
|
(27,402 |
) |
|
|
(88,359 |
) |
|
|
(272,533 |
) |
|
|
— |
|
Dividend reinvestment |
|
|
18 |
|
|
|
59 |
|
|
|
4,224 |
|
|
|
3,452 |
|
|
|
105,893 |
|
|
|
22,788 |
|
|
|
11,182 |
|
Ending balance, September 30, 2025 |
|
|
10,690 |
|
|
|
4,888 |
|
|
|
1,256,041 |
|
|
|
1,536,334 |
|
|
|
20,436,967 |
|
|
|
37,414,743 |
|
|
|
869,398 |
|
Distributions
The Company generally intends to distribute substantially all of its taxable income to its stockholders each year to comply with the REIT provisions of the Code, as amended. Taxable income does not necessarily equal net income calculated in accordance with GAAP.
Each class of common stock receives the same gross distribution per share. The net distribution per share varies for each share class based on differing fee structures. Additionally, net distributions will vary based on the applicable stockholder servicing fee, which is deducted from the monthly distribution per share and paid directly to the applicable distributor.
The following tables detail the aggregate distributions declared for each applicable class of common stock for the three and nine months ended September 30, 2025:
|
|
|
|
|
|
|
|
|
|
|
|
|
|
|
|
|
|
|
|
|
|
|
|
|
|
|
|
|
|
|
|
Three Months Ended September 30, 2025 |
|
|
|
Class S |
|
|
Class D |
|
|
Class I |
|
|
Class F-I |
|
|
Class A-I |
|
|
Class A-III |
|
|
Class E |
|
Aggregate gross distribution declared per share of common stock |
|
$ |
0.3368 |
|
|
$ |
0.3368 |
|
|
$ |
0.3368 |
|
|
$ |
0.3368 |
|
|
$ |
0.3368 |
|
|
$ |
0.3368 |
|
|
$ |
0.3368 |
|
Management fee per share of common stock |
|
|
(0.0668 |
) |
|
|
(0.0668 |
) |
|
|
(0.0668 |
) |
|
|
(0.0530 |
) |
|
|
(0.0539 |
) |
|
|
(0.0458 |
) |
|
|
— |
|
Stockholder servicing fee per share of common stock |
|
|
(0.0449 |
) |
|
|
(0.0134 |
) |
|
|
— |
|
|
|
— |
|
|
|
— |
|
|
|
— |
|
|
|
— |
|
Net distribution declared per share of common stock |
|
$ |
0.2251 |
|
|
$ |
0.2566 |
|
|
$ |
0.2700 |
|
|
$ |
0.2838 |
|
|
$ |
0.2829 |
|
|
$ |
0.2910 |
|
|
$ |
0.3368 |
|
|
|
|
|
|
|
|
|
|
|
|
|
|
|
|
|
|
|
|
|
|
|
|
|
|
|
|
|
|
|
|
|
Nine Months Ended September 30, 2025 |
|
|
|
Class S |
|
|
Class D |
|
|
Class I |
|
|
Class F-I |
|
|
Class A-I |
|
|
Class A-III |
|
|
Class E |
|
Aggregate gross distribution declared per share of common stock |
|
$ |
1.0095 |
|
|
$ |
1.0095 |
|
|
$ |
1.0095 |
|
|
$ |
1.0095 |
|
|
$ |
1.0095 |
|
|
$ |
1.0095 |
|
|
$ |
1.0095 |
|
Management fee per share of common stock |
|
|
(0.1995 |
) |
|
|
(0.1995 |
) |
|
|
(0.1995 |
) |
|
|
(0.1581 |
) |
|
|
(0.1608 |
) |
|
|
(0.1365 |
) |
|
|
— |
|
Stockholder servicing fee per share of common stock |
|
|
(0.1334 |
) |
|
|
(0.0398 |
) |
|
|
— |
|
|
|
— |
|
|
|
— |
|
|
|
— |
|
|
|
— |
|
Net distribution declared per share of common stock |
|
$ |
0.6766 |
|
|
$ |
0.7702 |
|
|
$ |
0.8100 |
|
|
$ |
0.8514 |
|
|
$ |
0.8487 |
|
|
$ |
0.8730 |
|
|
$ |
1.0095 |
|
Repurchases
During the three months ended September 30, 2025, the Company repurchased 272,532 Class A-III shares, 88,359 Class A-I shares, 27,402 Class F-I shares and 14,392 Class I shares for a total of $8.6 million. During the nine months ended September 30, 2025 the Company repurchased 476,443 Class A-III shares, 314,532 Class A-I shares, 39,776 Class F-I shares, 20,144 Class I shares and 11,990 Class E shares for a total of $18.4 million. The Company had no unfulfilled repurchase requests as of September 30, 2025.
Redeemable Non-Controlling Interest
In connection with its management fee, the Adviser has elected to receive Class E units. Additionally, the Special Limited Partner has elected to receive Class E units in satisfaction of the performance participation allocation. See Note 11 - Related Party Transactions for additional information on the Adviser and Special Limited Partner's interest. Because the Adviser and Special Limited Partner have the ability to redeem their Class E units for Class E shares in the Company or cash, at their election, the Company has classified these Class E units as redeemable non-controlling interest in mezzanine equity on the Company's condensed consolidated balance sheet.
During the three and nine months ended September 30, 2025, the Company issued 13,939 and 41,273 Class E units, respectively, to the Adviser for the management fee earned on the Operating Partnership units issued to an affiliate of Apollo.
During the nine months ended September 30, 2025, the Company issued 20,744 Class E units to the Special Limited Partner in satisfaction of the performance participation allocation.
The redeemable non-controlling interest is recorded at the greater of the carrying amount, adjusted for its share of income or loss and dividends, or the redemption value, which is equivalent to fair value, of such Class E units at the end of the measurement period. Accordingly, the Company recorded an allocation adjustment between Additional paid-in capital and redeemable non-controlling interest of $49 thousand during the nine months ended September 30, 2025 to reflect their redemption value.
The following table details the redeemable non-controlling interest activity related to the Adviser for the nine months ended September 30, 2025 ($ in thousands):
|
|
|
|
|
|
|
|
Adviser |
|
Balance at December 31, 2024 |
|
$ |
2,817 |
|
Settlement of management fees |
|
|
884 |
|
Settlement of performance participation allocation |
|
|
443 |
|
GAAP income allocation |
|
|
178 |
|
Distributions |
|
|
(181 |
) |
Reinvestment of distributions |
|
|
173 |
|
Fair value allocation |
|
|
49 |
|
Balance at September 30, 2025 |
|
$ |
4,363 |
|
Non-Controlling Interests - Operating Partnership Unitholders
On December 22, 2022, the Company issued 5,000,000 Class A-I units to an affiliate of Apollo for the aggregate consideration of $100.0 million in a private placement. Operating Partnership units are subject to the same fees as the corresponding classes of common stock and do not have any preferential rights relative to the Company's interest in the Operating Partnership.
Currently all Operating Partnership unitholders have elected to reinvest their dividends. In connection with such dividend reinvestment, in lieu of cash for dividends paid during the three and nine months ended September 30, 2025, the Company issued 73,257 and 217,862 Class A-I units, respectively.
Non-Controlling Interests Attributable to Preferred Stockholders
A subsidiary of the Company elected to be taxed as a REIT for U.S. federal income tax purposes. This subsidiary has issued preferred non-voting shares to be held by investors to ensure compliance with the Code requirement that REITs have at least 100 shareholders. The preferred shares have a face amount of $1,000 and carry a 12.0% annual dividend payable semi-annually. As of September 30, 2025, this subsidiary had $125,000 of preferred non-voting shares outstanding.
Note 15 - Earnings per Share
The Company's net income (loss) and weighted average number of shares outstanding for the three and nine months ended September 30, 2025, and for the three and nine months ended September 30, 2024, consist of the following (in thousands):
|
|
|
|
|
|
|
|
|
|
|
|
|
|
|
|
|
Basic and Diluted Net Income per Share Attributable to ARIS Stockholders |
Three Months Ended September 30, |
|
|
Nine Months Ended September 30, |
|
|
2025 |
|
|
2024 |
|
|
2025 |
|
|
2024 |
|
Numerator: |
|
|
|
|
|
|
|
|
|
|
|
Net income (loss) attributable to ARIS stockholders |
$ |
16,177 |
|
|
$ |
11,530 |
|
|
$ |
45,702 |
|
|
$ |
29,361 |
|
Denominator: |
|
|
|
|
|
|
|
|
|
|
|
Basic and diluted weighted average shares of common stock outstanding (1) |
|
59,524 |
|
|
|
36,554 |
|
|
|
54,333 |
|
|
|
30,673 |
|
Basic and diluted net income (loss) per share of common stock |
$ |
0.27 |
|
|
$ |
0.32 |
|
|
$ |
0.84 |
|
|
$ |
0.96 |
|
(1) The weighted average shares of common stock outstanding are inclusive of outstanding restricted stock grants, the impact of which is not material to the basic and diluted net income (loss) per share of common stock.
Note 16 - Commitments and Contingencies
From time to time, the Company may be involved in various claims and legal actions arising in the ordinary course of business. As of September 30, 2025 and December 31, 2024, the Company was not subject to any material litigation nor is the Company aware of any material litigation threatened against it.
As of September 30, 2025, the Company had $423.9 million of unfunded commitments related to its investments in real estate debt. The timing and amounts of fundings are uncertain as these commitments relate to loans for construction costs, capital expenditures, leasing costs, interest and carry costs, among others. As such, the timing and amounts of future fundings depend on the progress and performance of the underlying assets of the Company's investments in real estate debt.
Note 17 - Segment Reporting
The Company operates in two segments, Real Estate and Real Estate Debt, both of which are reportable segments. The Real Estate segment includes all of the Company's activities related to investments in properties and the Real Estate Debt segment includes all of the Company's activities related to investments in commercial mortgage and mezzanine loans and real estate-related securities. Other Corporate includes cash and cash equivalents, general and administrative expenses, management fee, performance participation allocation, interest expense and other income.
Segment information is utilized by the Company's chief operating decision maker (the "CODM") to assess performance and to allocate resources. The CODM is the Company's senior executive committee, comprised of its chief executive officer, chief operating officer and chief financial officer. Segment net operating income ("Segment NOI") is the key performance measure used by the CODM in evaluating the performance of each reportable segment. The CODM uses Segment NOI to make key operating decisions, such as identifying attractive investment opportunities and/or dispositions of existing investments, determining the sources and suitable level of leverage used to finance the Company's investments and deciding the appropriate amount and timing of its distributions.
Segment NOI for the Real Estate segment is calculated as revenue less rental operating expenses. Segment NOI for the Real Estate Debt segment is equal to income from investments in real estate debt. Segment NOI excludes corporate level transactions.
The following table sets forth the total assets by segment as of September 30, 2025 and December 31, 2024 ($ in thousands):
|
|
|
|
|
|
|
|
|
|
|
|
September 30, 2025 |
|
|
December 31, 2024 |
|
Real Estate |
|
$ |
549,476 |
|
|
$ |
282,996 |
|
Real Estate Debt |
|
|
1,220,307 |
|
|
|
892,203 |
|
Other Corporate |
|
|
53,697 |
|
|
|
82,405 |
|
Total Assets |
|
$ |
1,823,480 |
|
|
$ |
1,257,604 |
|
The following table sets forth the financial results by segment for the three months ended September 30, 2025 ($ in thousands):
|
|
|
|
|
|
|
|
|
|
|
|
|
|
|
|
|
|
|
|
Real Estate |
|
|
Real Estate Debt |
|
|
Other Corporate |
|
|
Total |
|
Revenue |
|
|
|
|
|
|
|
|
|
|
|
|
Rental revenue |
|
$ |
10,258 |
|
|
$ |
— |
|
|
$ |
— |
|
|
$ |
10,258 |
|
Total revenues |
|
|
10,258 |
|
|
|
— |
|
|
|
— |
|
|
|
10,258 |
|
Segment Expenses |
|
|
|
|
|
|
|
|
|
|
|
|
Rental property operating |
|
|
(2,498 |
) |
|
|
— |
|
|
|
— |
|
|
|
(2,498 |
) |
Total segment expenses |
|
|
(2,498 |
) |
|
|
— |
|
|
|
— |
|
|
|
(2,498 |
) |
Income from investments in real estate debt |
|
|
— |
|
|
|
24,820 |
|
|
|
— |
|
|
|
24,820 |
|
Segment net operating income |
|
$ |
7,760 |
|
|
$ |
24,820 |
|
|
$ |
— |
|
|
$ |
32,580 |
|
Other income and expenses |
|
|
|
|
|
|
|
|
|
|
|
|
Other income |
|
$ |
— |
|
|
$ |
— |
|
|
$ |
763 |
|
|
$ |
763 |
|
Interest expense, net |
|
|
— |
|
|
|
— |
|
|
|
(5,723 |
) |
|
|
(5,723 |
) |
Depreciation and amortization |
|
|
(4,859 |
) |
|
|
— |
|
|
|
— |
|
|
|
(4,859 |
) |
General and administrative |
|
|
— |
|
|
|
— |
|
|
|
— |
|
|
|
(1,730 |
) |
Management fee |
|
|
— |
|
|
|
— |
|
|
|
— |
|
|
|
(3,185 |
) |
Performance participation allocation |
|
|
— |
|
|
|
— |
|
|
|
— |
|
|
|
(108 |
) |
Total other income and expenses |
|
|
(4,859 |
) |
|
|
— |
|
|
|
(4,960 |
) |
|
|
(14,842 |
) |
Net income |
|
|
|
|
|
|
|
|
|
|
$ |
17,738 |
|
Net income attributable to non-controlling interests in the Operating Partnership |
|
|
|
|
|
|
|
|
|
|
$ |
1,561 |
|
Net income (loss) attributable to preferred stockholders |
|
|
|
|
|
|
|
|
|
|
$ |
— |
|
Net income attributable to ARIS stockholders |
|
|
|
|
|
|
|
|
|
|
$ |
16,177 |
|
The following table sets forth the financial results by segment for the three months ended September 30, 2024 ($ in thousands):
|
|
|
|
|
|
|
|
|
|
|
|
|
|
|
|
|
|
|
|
Real Estate |
|
|
Real Estate Debt |
|
|
Other Corporate |
|
|
Total |
|
Revenue |
|
|
|
|
|
|
|
|
|
|
|
|
Rental revenue |
|
$ |
6,302 |
|
|
$ |
— |
|
|
$ |
— |
|
|
$ |
6,302 |
|
Total revenues |
|
|
6,302 |
|
|
|
— |
|
|
|
— |
|
|
|
6,302 |
|
Segment Expenses |
|
|
|
|
|
|
|
|
|
|
|
|
Rental property operating |
|
|
(1,474 |
) |
|
|
— |
|
|
|
— |
|
|
|
(1,474 |
) |
Total segment expenses |
|
|
(1,474 |
) |
|
|
— |
|
|
|
— |
|
|
|
(1,474 |
) |
Income from investments in real estate debt |
|
|
— |
|
|
|
17,366 |
|
|
|
— |
|
|
|
17,366 |
|
Segment net operating income |
|
$ |
4,828 |
|
|
$ |
17,366 |
|
|
$ |
— |
|
|
$ |
22,194 |
|
Other income and expenses |
|
|
|
|
|
|
|
|
|
|
|
|
Other income |
|
$ |
— |
|
|
$ |
— |
|
|
$ |
1,549 |
|
|
$ |
1,549 |
|
Interest expense, net |
|
|
— |
|
|
|
— |
|
|
|
(4,091 |
) |
|
|
(4,091 |
) |
Depreciation and amortization |
|
|
(2,793 |
) |
|
|
— |
|
|
|
— |
|
|
|
(2,793 |
) |
General and administrative |
|
|
— |
|
|
|
— |
|
|
|
— |
|
|
|
(1,424 |
) |
Management fee |
|
|
— |
|
|
|
— |
|
|
|
— |
|
|
|
(2,121 |
) |
Performance participation allocation |
|
|
— |
|
|
|
— |
|
|
|
— |
|
|
|
(75 |
) |
Total other income and expenses |
|
|
(2,793 |
) |
|
|
— |
|
|
|
(2,542 |
) |
|
|
(8,955 |
) |
Net income |
|
|
|
|
|
|
|
|
|
|
$ |
13,239 |
|
Net income attributable to non-controlling interests in the Operating Partnership |
|
|
|
|
|
|
|
|
|
|
$ |
1,709 |
|
Net income (loss) attributable to preferred stockholders |
|
|
|
|
|
|
|
|
|
|
$ |
— |
|
Net income attributable to ARIS stockholders |
|
|
|
|
|
|
|
|
|
|
$ |
11,530 |
|
The following table sets forth the financial results by segment for the nine months ended September 30, 2025 ($ in thousands):
|
|
|
|
|
|
|
|
|
|
|
|
|
|
|
|
|
|
|
|
Real Estate |
|
|
Real Estate Debt |
|
|
Other Corporate |
|
|
Total |
|
Revenue |
|
|
|
|
|
|
|
|
|
|
|
|
Rental revenue |
|
$ |
24,774 |
|
|
$ |
— |
|
|
$ |
— |
|
|
$ |
24,774 |
|
Total revenues |
|
|
24,774 |
|
|
|
— |
|
|
|
— |
|
|
|
24,774 |
|
Segment Expenses |
|
|
|
|
|
|
|
|
|
|
|
|
Rental property operating |
|
|
(5,645 |
) |
|
|
— |
|
|
|
— |
|
|
|
(5,645 |
) |
Total segment expenses |
|
|
(5,645 |
) |
|
|
— |
|
|
|
— |
|
|
|
(5,645 |
) |
Income from investments in real estate debt |
|
|
— |
|
|
|
67,403 |
|
|
|
— |
|
|
|
67,403 |
|
Segment net operating income |
|
$ |
19,129 |
|
|
$ |
67,403 |
|
|
$ |
— |
|
|
$ |
86,532 |
|
Other income and expenses |
|
|
|
|
|
|
|
|
|
|
|
|
Other income |
|
$ |
— |
|
|
$ |
— |
|
|
$ |
2,896 |
|
|
$ |
2,896 |
|
Interest expense, net |
|
|
— |
|
|
|
— |
|
|
|
(13,485 |
) |
|
|
(13,485 |
) |
Depreciation and amortization |
|
|
(11,136 |
) |
|
|
— |
|
|
|
— |
|
|
|
(11,136 |
) |
General and administrative |
|
|
— |
|
|
|
— |
|
|
|
— |
|
|
|
(5,258 |
) |
Management fee |
|
|
— |
|
|
|
— |
|
|
|
— |
|
|
|
(8,778 |
) |
Performance participation allocation |
|
|
— |
|
|
|
— |
|
|
|
— |
|
|
|
(297 |
) |
Total other income and expenses |
|
|
(11,136 |
) |
|
|
— |
|
|
|
(10,589 |
) |
|
|
(36,058 |
) |
Net income |
|
|
|
|
|
|
|
|
|
|
$ |
50,474 |
|
Net income attributable to non-controlling interests in the Operating Partnership |
|
|
|
|
|
|
|
|
|
|
$ |
4,764 |
|
Net income (loss) attributable to preferred stockholders |
|
|
|
|
|
|
|
|
|
|
$ |
8 |
|
Net income attributable to ARIS stockholders |
|
|
|
|
|
|
|
|
|
|
$ |
45,702 |
|
The following table sets forth the financial results by segment for the nine months ended September 30, 2024 ($ in thousands):
|
|
|
|
|
|
|
|
|
|
|
|
|
|
|
|
|
|
|
|
Real Estate |
|
|
Real Estate Debt |
|
|
Other Corporate |
|
|
Total |
|
Revenue |
|
|
|
|
|
|
|
|
|
|
|
|
Rental revenue |
|
$ |
15,020 |
|
|
$ |
— |
|
|
$ |
— |
|
|
$ |
15,020 |
|
Total revenues |
|
|
15,020 |
|
|
|
— |
|
|
|
— |
|
|
|
15,020 |
|
Segment Expenses |
|
|
|
|
|
|
|
|
|
|
|
|
Rental property operating |
|
|
(2,871 |
) |
|
|
— |
|
|
|
— |
|
|
|
(2,871 |
) |
Total segment expenses |
|
|
(2,871 |
) |
|
|
— |
|
|
|
— |
|
|
|
(2,871 |
) |
Income from investments in real estate debt |
|
|
— |
|
|
|
41,931 |
|
|
|
— |
|
|
|
41,931 |
|
Segment net operating income |
|
$ |
12,149 |
|
|
$ |
41,931 |
|
|
$ |
— |
|
|
$ |
54,080 |
|
Other income and expenses |
|
|
|
|
|
|
|
|
|
|
|
|
Other income |
|
$ |
— |
|
|
$ |
— |
|
|
$ |
4,022 |
|
|
$ |
4,022 |
|
Interest expense, net |
|
|
— |
|
|
|
— |
|
|
|
(6,745 |
) |
|
|
(6,745 |
) |
Depreciation and amortization |
|
|
(6,375 |
) |
|
|
— |
|
|
|
— |
|
|
|
(6,375 |
) |
General and administrative |
|
|
— |
|
|
|
— |
|
|
|
— |
|
|
|
(4,703 |
) |
Management fee |
|
|
— |
|
|
|
— |
|
|
|
— |
|
|
|
(5,437 |
) |
Performance participation allocation |
|
|
— |
|
|
|
— |
|
|
|
— |
|
|
|
(347 |
) |
Total other income and expenses |
|
|
|
|
|
|
|
|
|
|
|
|
Net income |
|
|
|
|
|
|
|
|
|
|
$ |
34,495 |
|
Net income attributable to non-controlling interests in the Operating Partnership |
|
|
|
|
|
|
|
|
|
|
$ |
5,127 |
|
Net income (loss) attributable to preferred stockholders |
|
|
|
|
|
|
|
|
|
|
$ |
7 |
|
Net income attributable to ARIS stockholders |
|
|
|
|
|
|
|
|
|
|
$ |
29,361 |
|
Note 18 - Subsequent Events
Subsequent to the nine months ended September 30, 2025, the following events took place:
Investment Activity: The Company funded approximately $23.0 million for previously closed mortgage loans and purchased $20.0 million of real estate-related securities.
ITEM 2. MANAGEMENT'S DISCUSSION AND ANALYSIS OF FINANCIAL CONDITION AND RESULTS OF OPERATIONS
References herein to "Apollo Realty Income Solutions," "ARIS," "Company," "we," "us," or "our" refer to Apollo Realty Income Solutions, Inc. and its subsidiaries unless the context specifically requires otherwise.
The following discussion should be read in conjunction with the unaudited condensed consolidated financial statements and accompanying notes thereto appearing elsewhere in this Quarterly Report on Form 10-Q. In addition to historical data, this discussion contains forward-looking statements about our business, operations, and financial performance based on current expectations that involve risks, uncertainties and assumptions. Our actual results may differ materially from those in this discussion as a result of various factors, including but not limited to those discussed in Part I. Item 1A - "Risk Factors" in our Annual Report on Form 10-K for the year ended December 31, 2024 filed with the SEC on March 21, 2025.
Forward-Looking Statements
This Quarterly Report on Form 10-Q contains forward-looking statements within the meaning of the federal securities laws and the Private Securities Litigation Reform Act of 1995. These forward-looking statements can be identified by the use of forward-looking terminology such as "believe", "expect", "anticipate", "estimate", "plan", "continue", "intend", "should", "may" or similar expressions, or the negatives thereof. These may include our financial projections and estimates and their underlying assumptions, statements about plans, objectives and expectations with respect to future operations, statements with respect to acquisitions, statements regarding future performance and statements regarding identified but not yet closed acquisitions. Such forward-looking statements are inherently uncertain and there are or may be important factors that could cause actual outcomes or results to differ materially from those indicated in such statements. We believe these factors also include but are not limited to those described under the section entitled "Risk Factors" in our Annual Report on Form 10-K for the year ended December 31, 2024 filed with the SEC on March 21, 2025, and any such updated factors included in our periodic filings with the SEC, which are accessible on the SEC’s website at www.sec.gov. These factors should not be construed as exhaustive and should be read in conjunction with the other cautionary statements that are included in this document (or our prospectus and other filings). Except as otherwise required by federal securities laws, we undertake no obligation to publicly update or revise any forward-looking statements, whether as a result of new information, future developments or otherwise.
Overview
We are a Maryland corporation formed on September 8, 2021. We were formed to invest primarily in a portfolio of diversified income-oriented commercial real estate in the United States. We are an externally advised, perpetual-life corporation that intends to qualify as a REIT for U.S. federal income tax purposes. We were formed to directly and indirectly acquire real estate and real estate-related assets and, to a lesser extent, commercial real estate debt. Our investment objectives are to invest in assets that will enable us to:
•provide current income in the form of regular, stable cash distributions to achieve an attractive dividend yield;
•preserve and protect invested capital;
•realize appreciation in NAV from proactive investment management and asset management; and
•provide an investment alternative for stockholders seeking to allocate a portion of their long-term investment portfolios to commercial real estate with lower volatility than public real estate companies.
There can be no assurance that we will achieve our investment objective, which is primarily to acquire a portfolio of diversified institutional quality, income-oriented commercial real estate located in the United States. This may include hotel, industrial, data centers, multifamily, retail and office assets, as well as others, including, without limitation, healthcare, student housing, life sciences, hospitality, senior living, manufactured housing and storage properties. Our real estate debt investments will focus on non-distressed public and private real estate debt, including, but not limited to, commercial mortgage-backed securities, commercial mortgage and mezzanine loans, and other forms of debt, and may also include preferred equity.
We elected to be taxed as a REIT for U.S. federal income tax purposes beginning with our taxable year ended December 31, 2023. We plan to own all or substantially all of our assets through the Operating Partnership.
Our board of directors will, at all times, have ultimate oversight and policy-making authority over us, including responsibility for governance, financial controls, compliance and disclosure. However, pursuant to the Advisory Agreement, we have delegated to the Adviser the authority to source, evaluate and monitor our investment opportunities and make decisions related to the acquisition, management, financing and disposition of our assets, in accordance with our investment objectives, guidelines, policies and limitations, subject to oversight by our board of directors.
On June 29, 2022, we commenced our initial public offering for up to $5.0 billion in shares of our common stock (the "Initial Public Offering"). On June 26, 2025, the Initial Public Offering terminated and we commenced our Follow-On Offering of up to $5.0 billion in shares of common stock, consisting of up to $4.0 billion in shares in our primary offering and up to $1.0 billion in shares pursuant to our distribution reinvestment plan. Additionally, we are conducting a private offering of Class E shares to certain of Apollo's affiliates and employees and our directors, which is exempt from the registration provisions set forth in Section 4(a)(2) of the Securities Act. As of November 6, 2025, we have
received cumulative net proceeds of $1.5 billion, including proceeds received pursuant to our distribution reinvestment plan, from the sale of our Class S shares, Class D shares, Class I shares, Class F-I shares, Class A-I shares, Class A-III shares and Class E shares in our continuous public and private offerings. We have contributed the net proceeds from the sale of shares to the Operating Partnership in exchange for a corresponding number of Class S units, Class D units, Class I units, Class F-I units, Class A-I units, Class A-III units and Class E units. The Operating Partnership has primarily used the net proceeds to make investments in real estate, real estate debt and real estate-related securities, as further described below under "Portfolio". We intend to continue selling shares of our common stock on a monthly basis through the Follow-On Offering and our private offering.
We are not aware of any material trends or uncertainties, favorable or unfavorable, other than national economic conditions affecting real estate generally, that may be reasonably anticipated to have a material impact on either capital resources or the revenues or income to be derived from acquiring properties or real estate debt.
Q3 Highlights
Operating and Capital Raise Results:
•We raised $121.9 million, inclusive of $2.9 million from our distribution reinvestment plan, of net proceeds in the Follow-On Offering during the three months ended September 30, 2025.
•We declared monthly net distributions totaling $18.8 million for the three months ended September 30, 2025.
•The details of our annualized distribution rates and total returns for the three months ended September 30, 2025 are shown in the following table:
|
|
|
|
|
|
|
|
|
|
|
|
|
|
|
|
Class S |
|
Class D |
|
Class I |
|
Class F-I |
|
Class A-I |
|
Class A-III |
Annualized Distribution Rate(1) |
|
4.3% |
|
4.8% |
|
5.1% |
|
5.4% |
|
5.3% |
|
5.4% |
Year-to-Date Total Return, without upfront selling commissions(2) |
|
3.8% |
|
4.2% |
|
4.4% |
|
4.8% |
|
5.2% |
|
5.3% |
Year-to-Date Total Return, assuming maximum upfront selling commissions(2) |
|
0.3% |
|
2.7% |
|
N/A |
|
N/A |
|
N/A |
|
N/A |
Inception-to-Date Total Return, without upfront selling commissions(2) |
|
5.4% |
|
6.0% |
|
6.2% |
|
6.4% |
|
7.7% |
|
7.3% |
Inception-to-Date Total Return, assuming maximum upfront selling commissions(2) |
|
2.9% |
|
4.4% |
|
N/A |
|
N/A |
|
N/A |
|
N/A |
(1)Reflects the distribution amount as of September 30, 2025 annualized and divided by the prior month's NAV, which is inclusive of all fees and expenses.
(2)Total return is calculated as the change in NAV per share during the period, plus distributions per share (assuming distributions are reinvested in accordance with our distribution reinvestment plan) divided by the NAV per share at the beginning of the period. Inception-to-Date returns are annualized.
Investing and Financing Activity:
•Acquired a 736,000 square foot industrial property located in Newton, NC ("3707 W NC 10 Hwy") and a 127,000 square foot industrial property located in Tolleson, AZ ("8681 W Jefferson Street"), for $55.3 million and $34.0 million, respectively, inclusive of acquisition costs. Both properties are 100% leased with approximately nine years and five years of remaining lease term, respectively.
•Committed $175.0 million of capital to new commercial mortgage loans (with $108.8 million funded at closing) and provided $77.0 million of add-on fundings to existing commercial mortgage loans during the three months ended September 30, 2025.
•Received $74.7 million of repayments from commercial mortgage loans and $5.9 million of repayments from real estate-related securities, resulting in a $47 thousand realized gain.
•Entered into a $500.0 million repurchase agreement with Barclays, providing us with additional capacity to borrow against our investments in commercial mortgage loans.
•Actively utilized available capacity under our secured debt arrangements, obtaining $103.0 million of net proceeds from the JPM Repurchase Facility.
•As of September 30, 2025, our leverage ratio was 0.3x. Our leverage ratio is calculated by dividing (i) the fair value of asset-specific and corporate level debt by (ii) NAV.
Current Portfolio:
•Our current portfolio as of September 30, 2025 consisted of investments in real estate debt (approximately 68% based on fair value) and investments in real estate (approximately 32% based on fair value).
•Our investments in real estate debt as of September 30, 2025 consisted of floating-rate commercial mortgage loans (approximately 82% based on fair value), fixed-rate mezzanine loans (approximately 9% based on fair value) and real estate-related securities (approximately 8% based on fair value). The collateral for our commercial mortgage loans and mezzanine loans consisted primarily of Multifamily (approximately 29% based on fair value), Data Center (approximately 25% based on fair value) and Hotel (approximately 10% based on fair value) property types and were concentrated in the Northeast (approximately 32% based on fair value), West (approximately 28% based on fair value), Southwest (approximately 18% based on fair value) and Mid-Atlantic (approximately 11% based on fair value) regions.
•Our nine properties as of September 30, 2025 consisted of Industrial (approximately 63% based on fair value), Multifamily (approximately 26% based on fair value) and Retail (approximately 11% based on fair value) property types and were concentrated in the Southeast (approximately 41% based on fair value), Midwest (approximately 36% based on fair value) and Northeast (approximately 17% based on fair value) regions.
NAV History
We began determining NAV per share on a monthly basis in December 2022. Set forth below is additional historical information regarding our NAV per share since December 22, 2022, the date upon which we commenced operations.
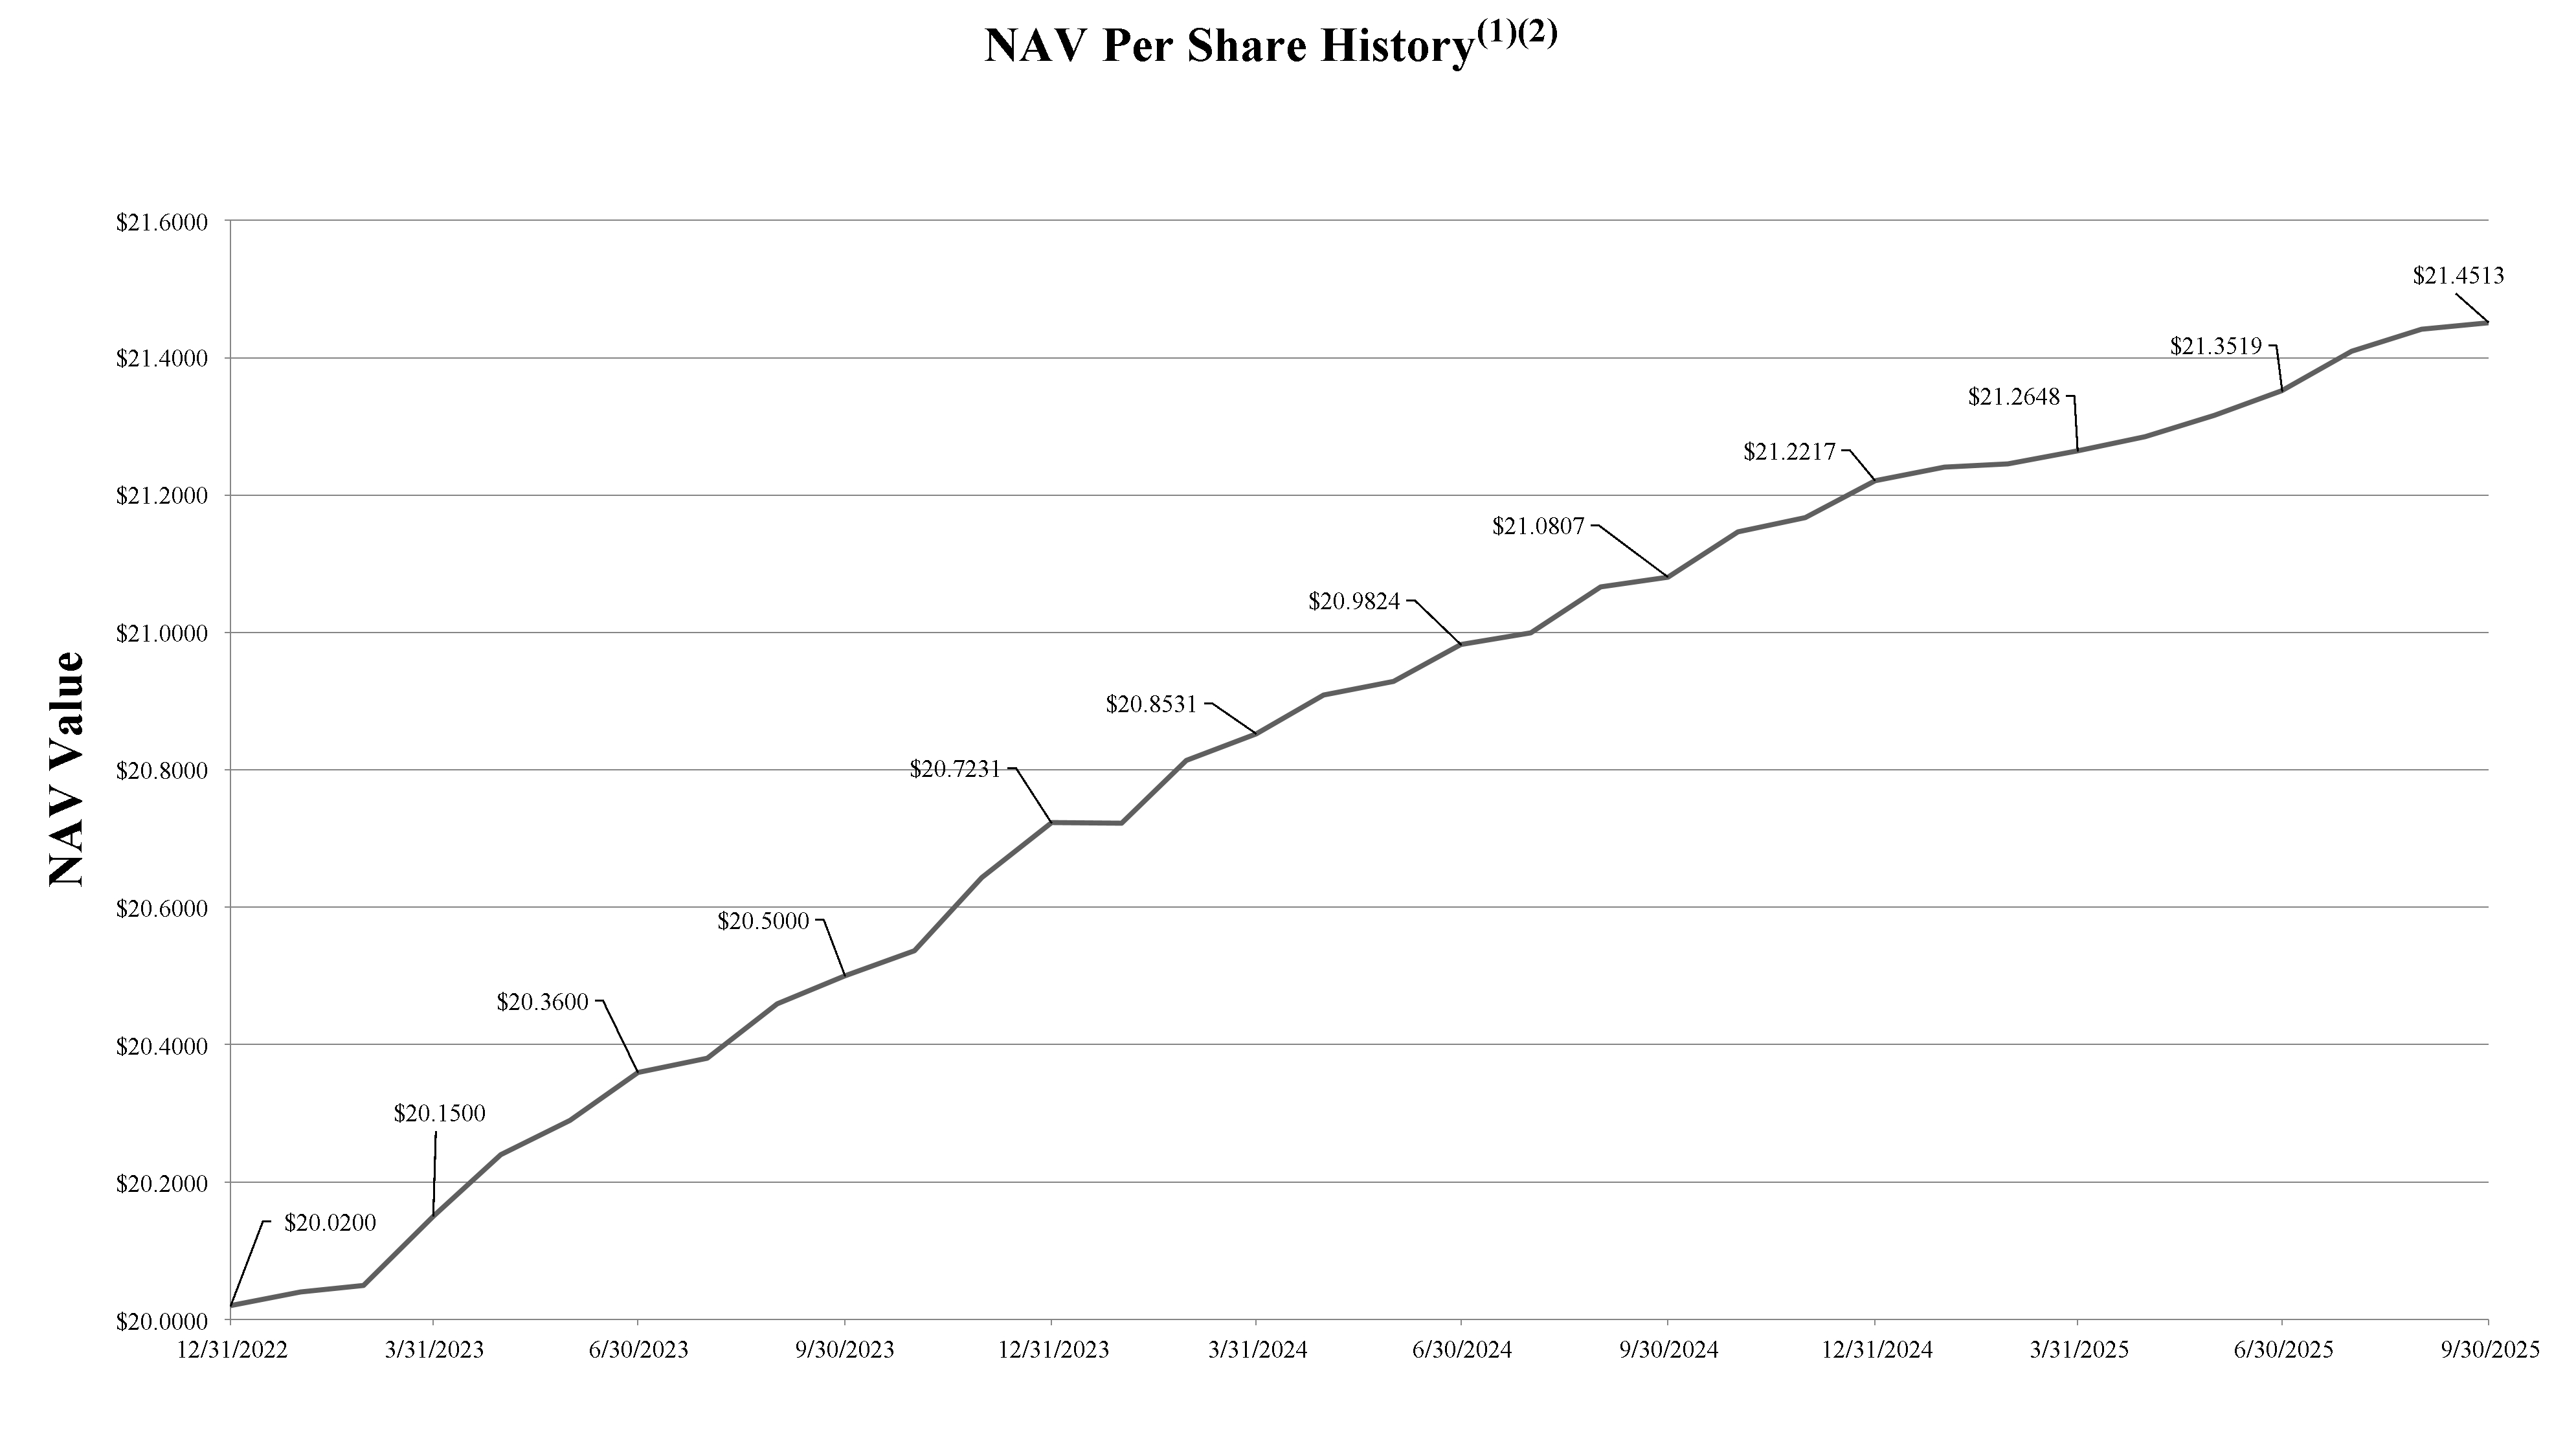
(1)Please see Item 2. "Management's Discussion and Analysis of Financial Condition and Results of Operations-Net Asset Value" for additional information concerning the methodology used to determine, and the limitations of, NAV per share. (2)Represents our historical total NAV per share, as of the respective dates.
Portfolio
Portfolio Summary
The following chart allocates our investments in real estate and real estate debt based on fair value as of September 30, 2025:
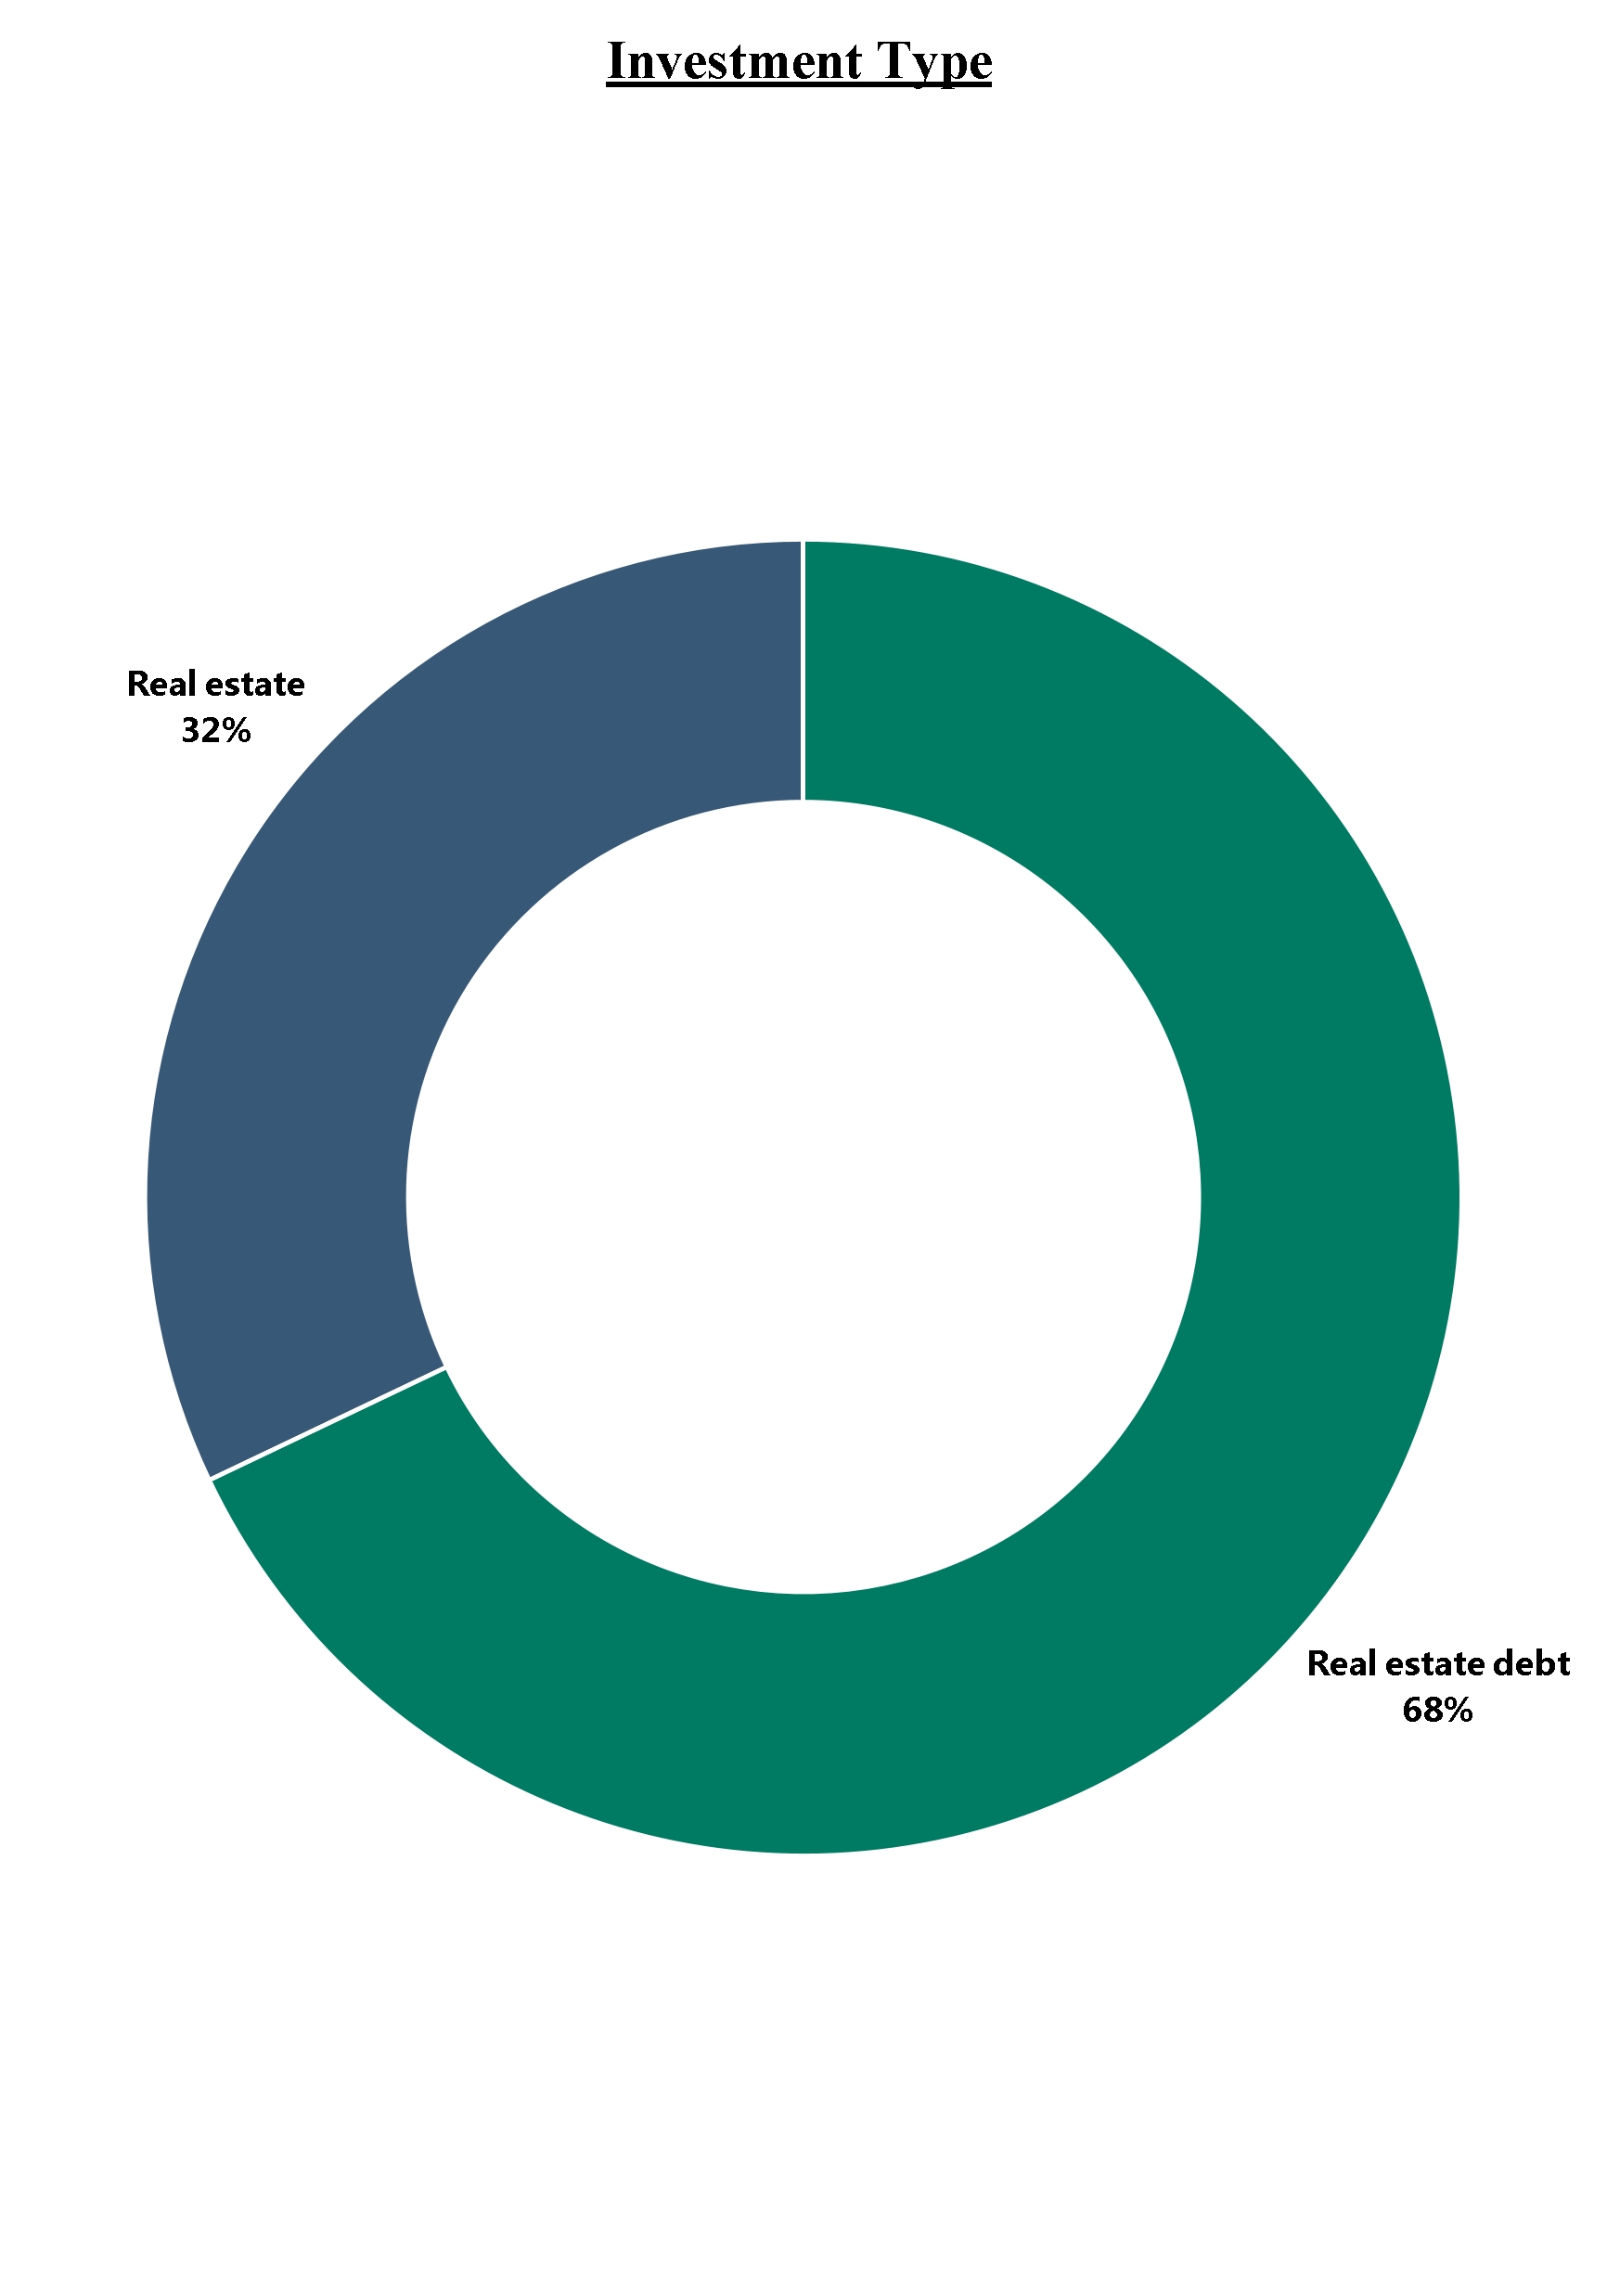
The following charts further describe the diversification of our investments in real estate and real estate debt based on fair value as of September 30, 2025(1)(2).
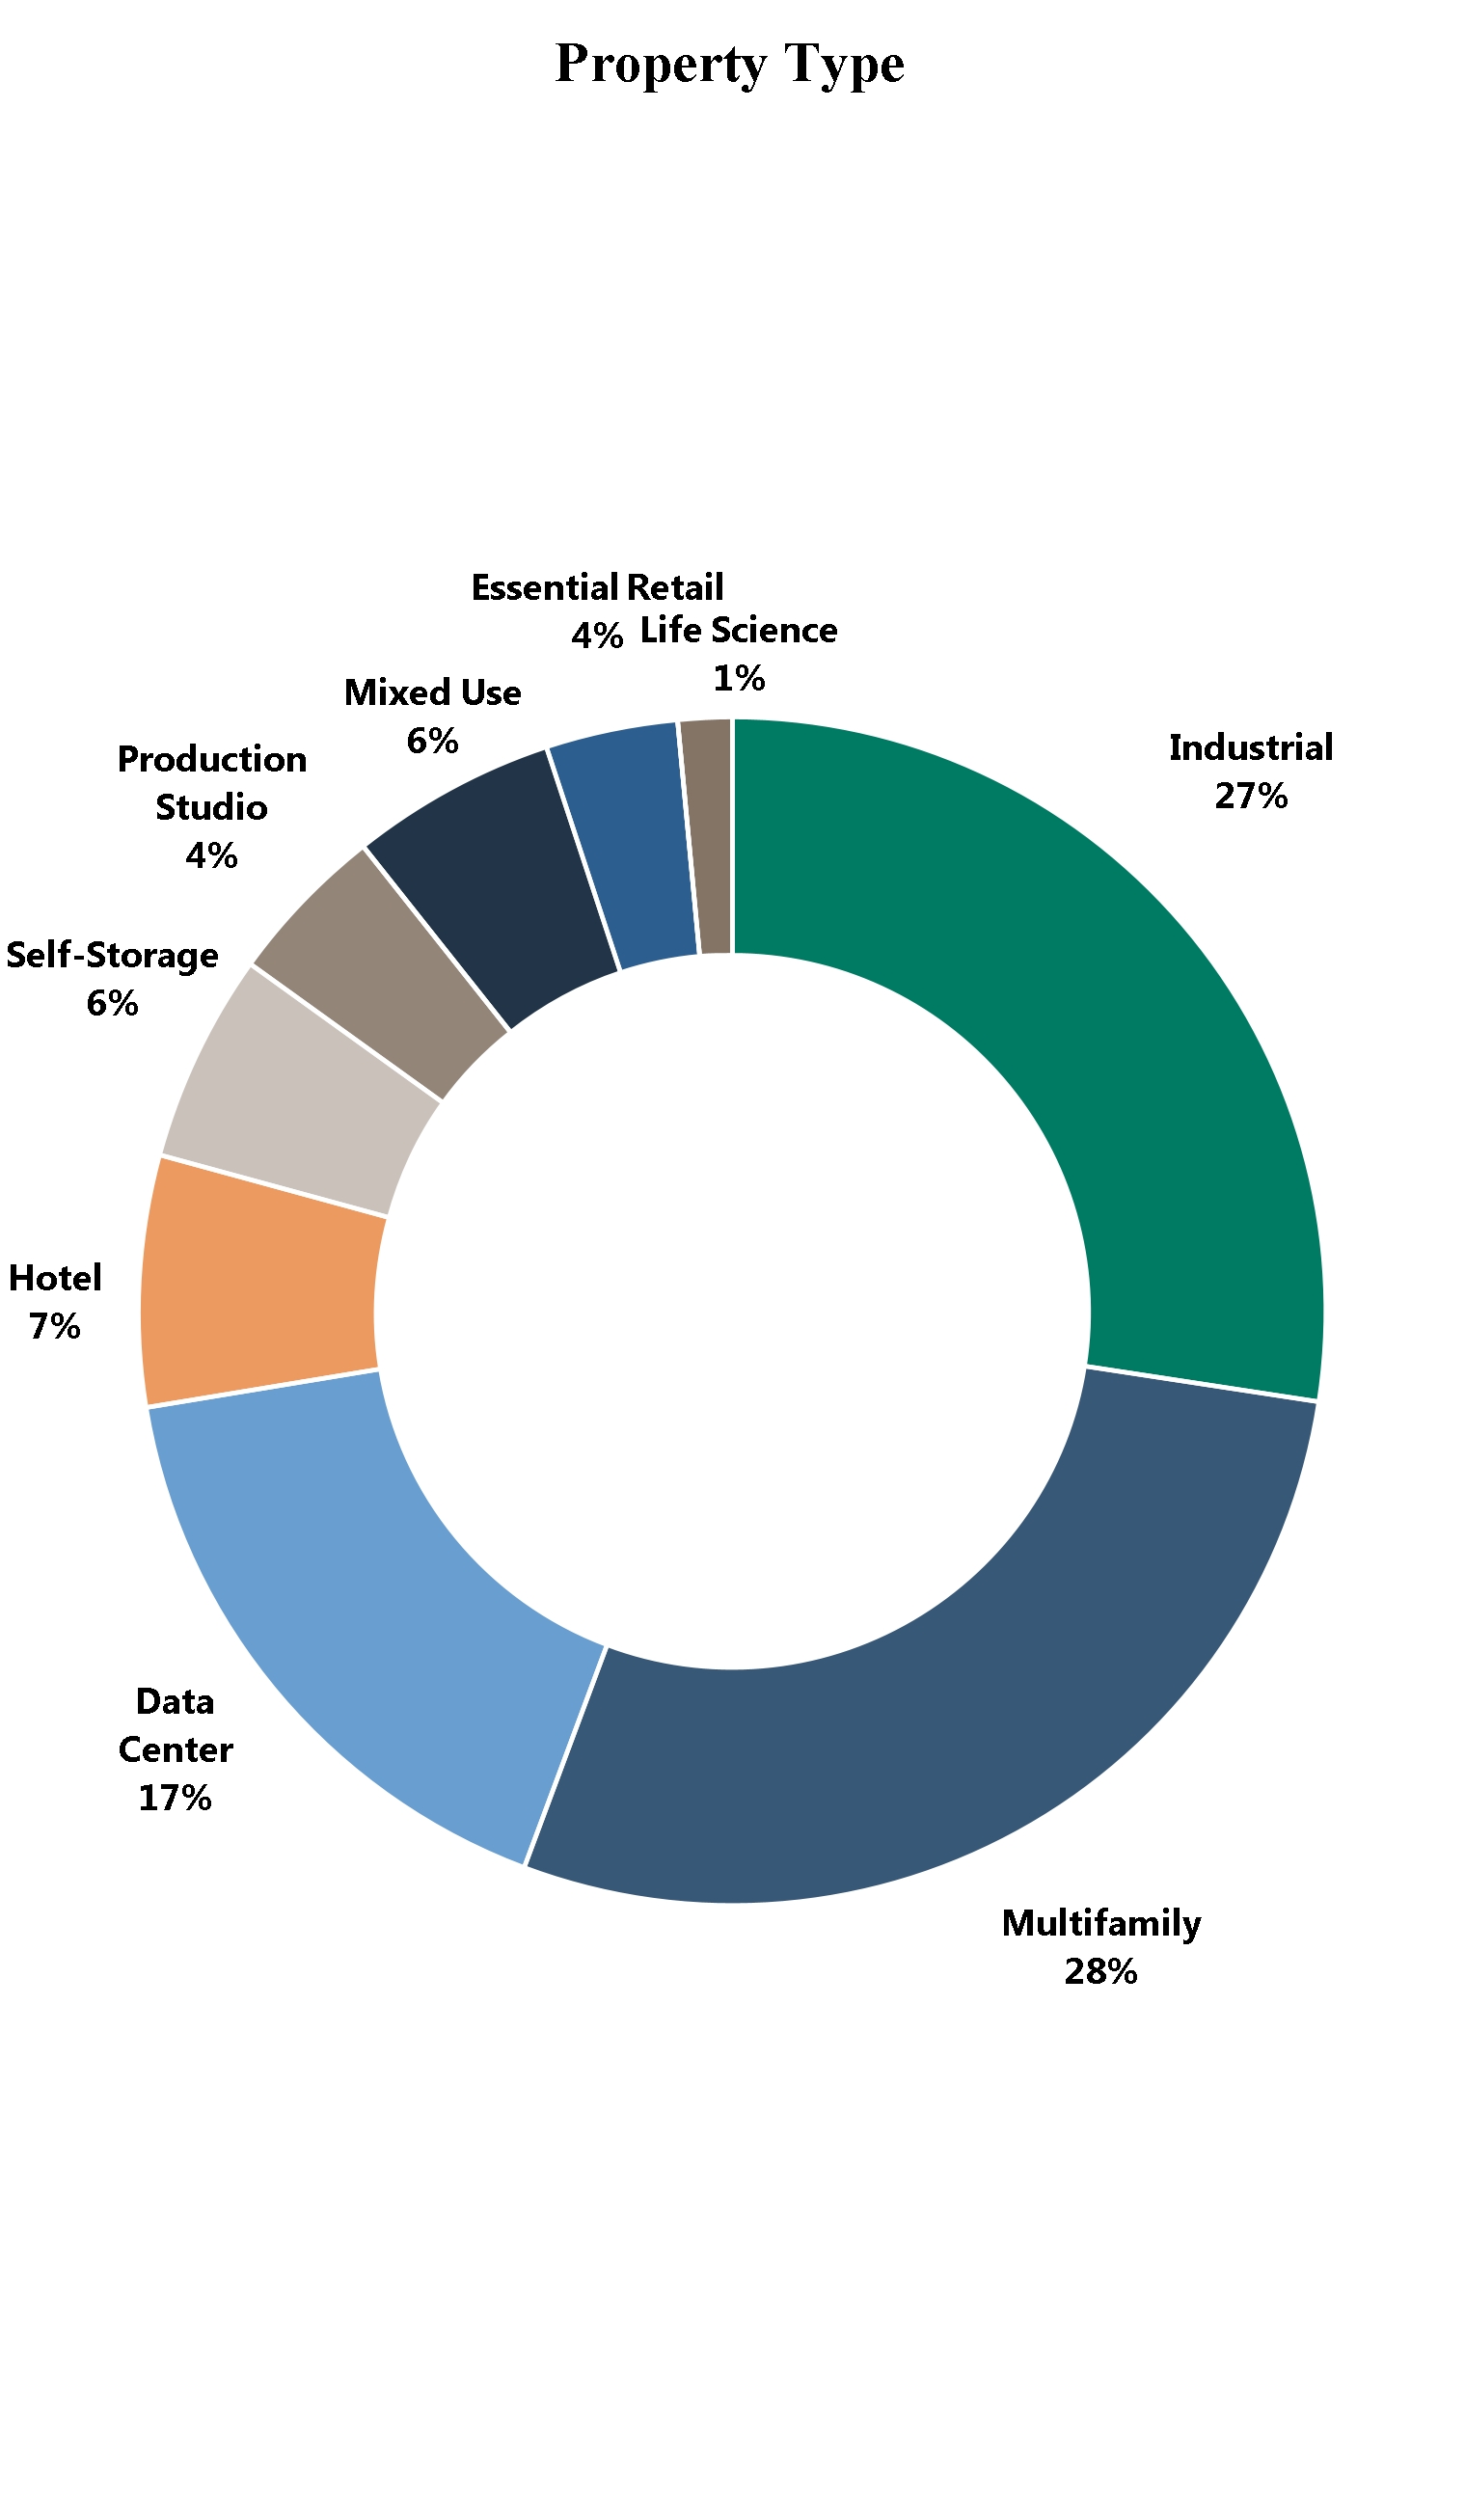
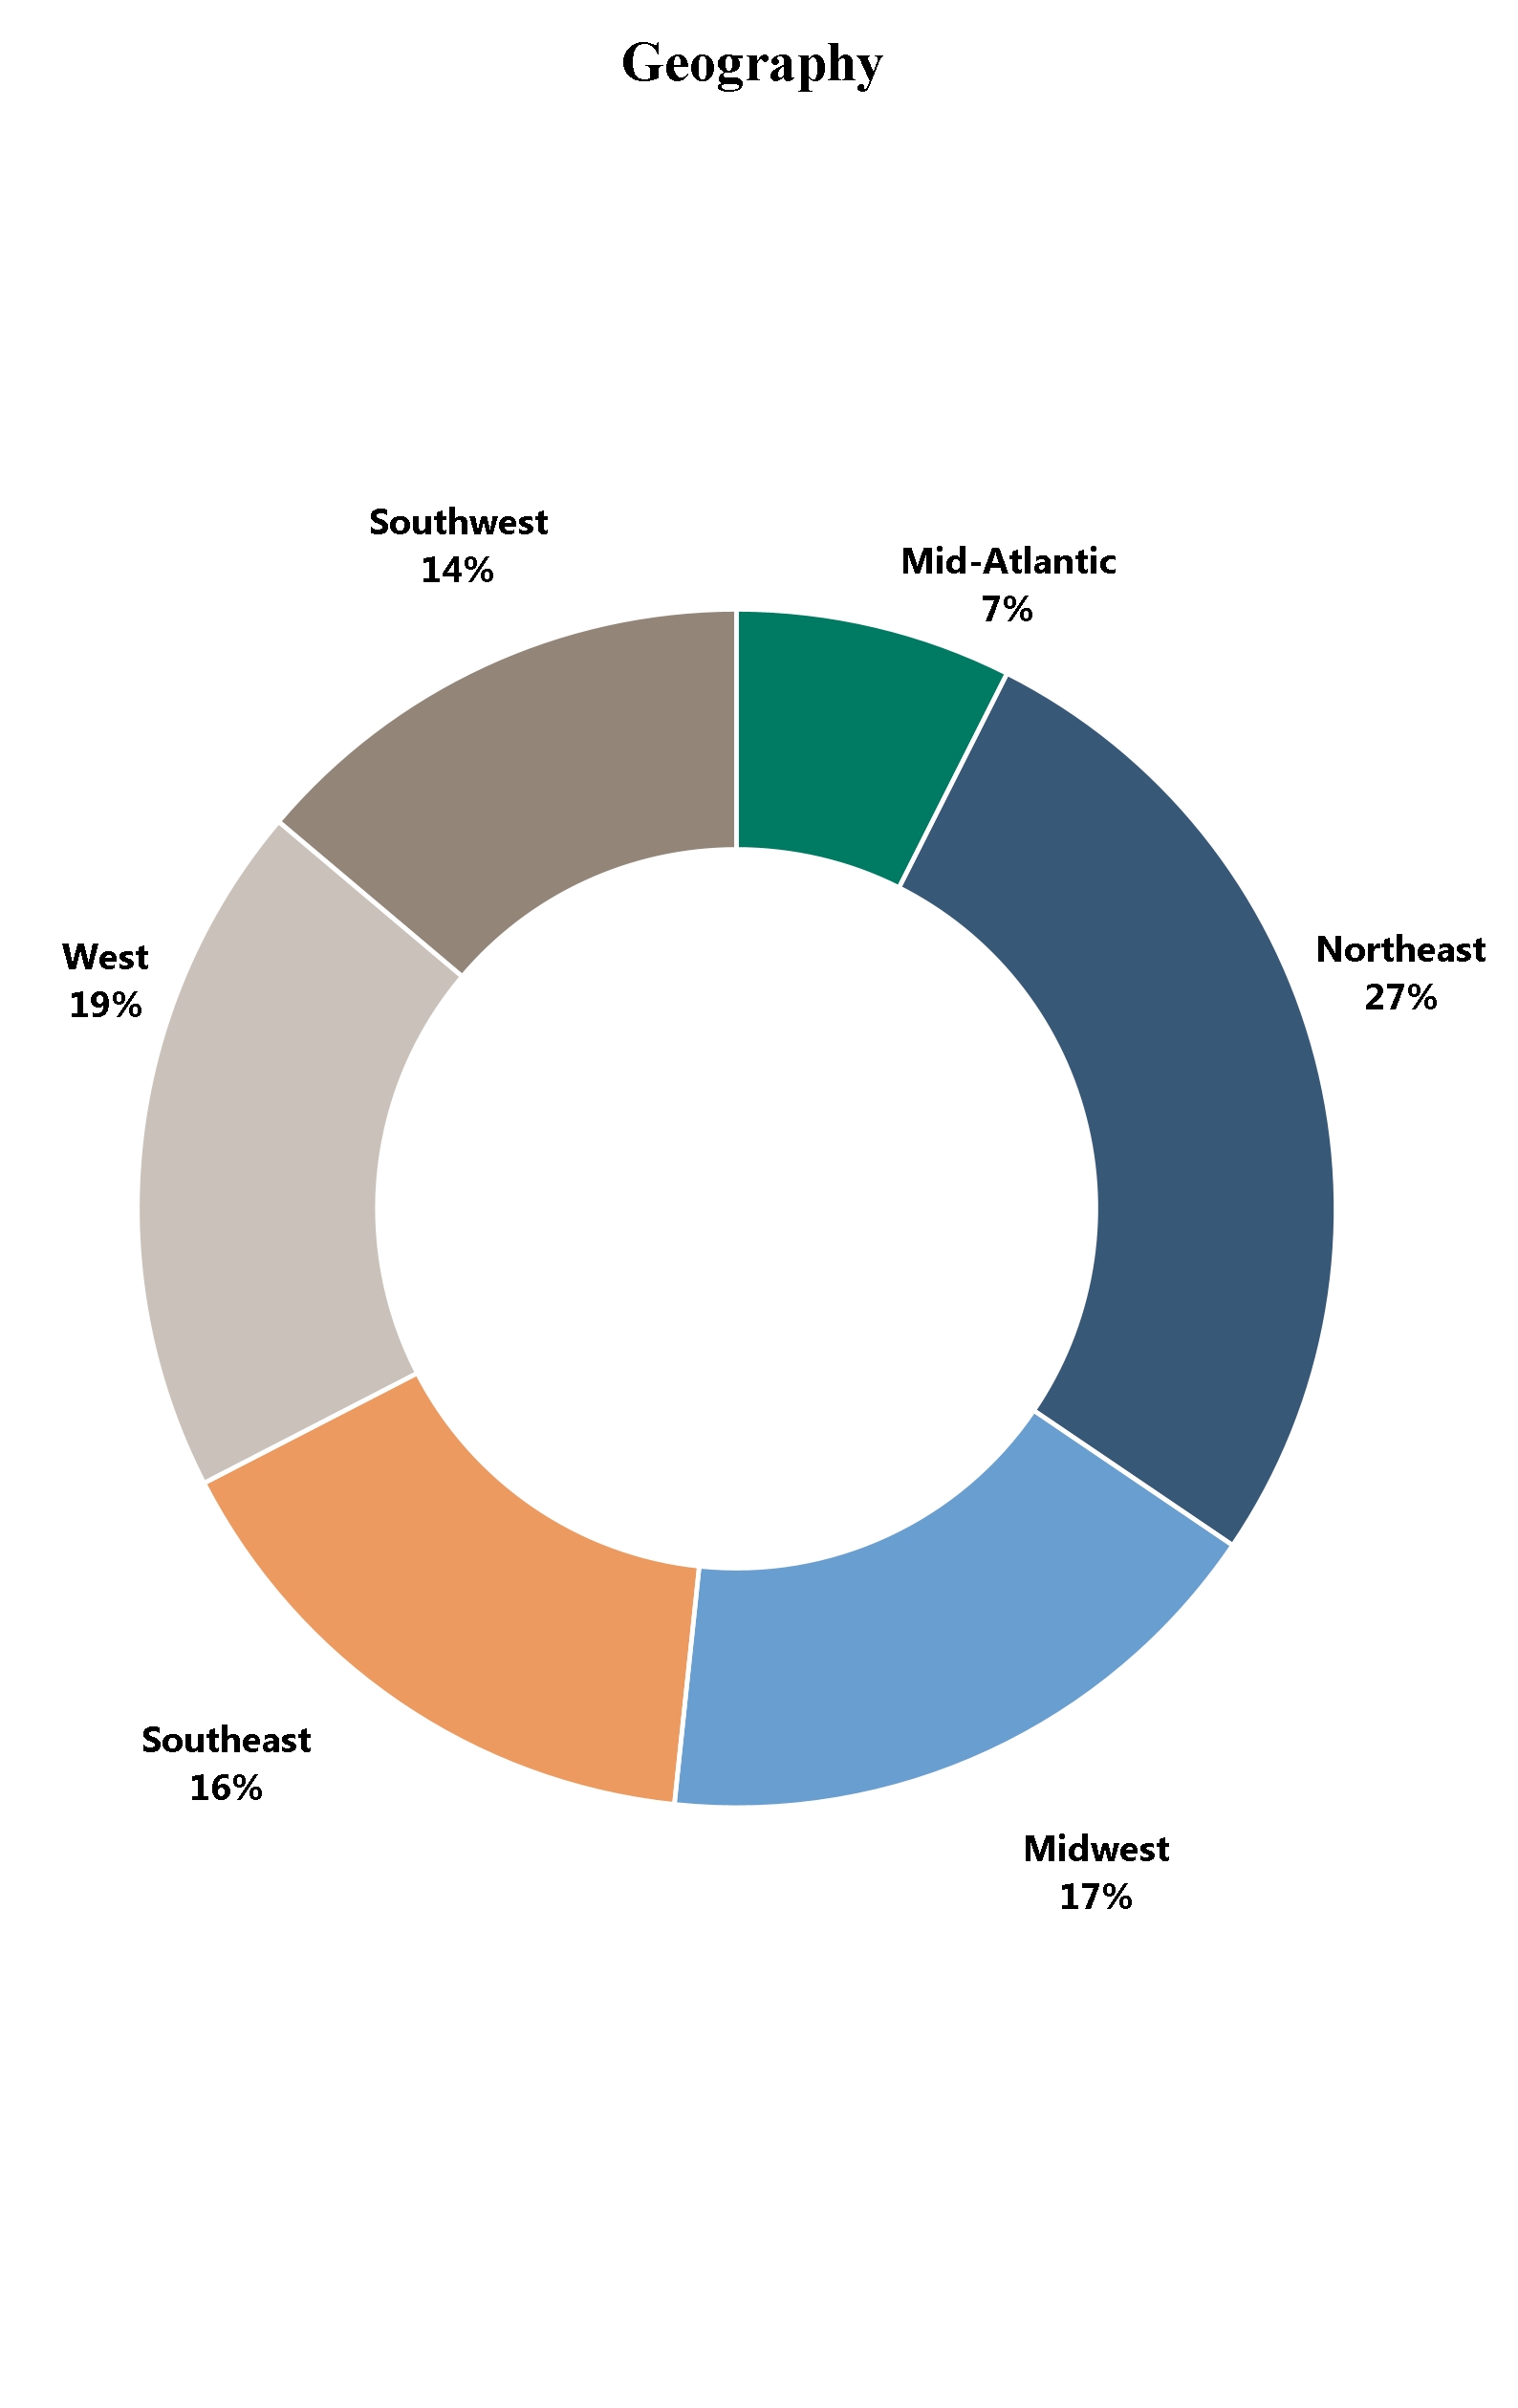
(1)Excludes fair value of real estate-related securities.
(2)Includes properties secured by real estate debt investments.
Investments in Real Estate
As of September 30, 2025, we owned nine real estate properties, which are summarized in the following table ($ in thousands):
|
|
|
|
|
|
|
|
|
|
|
|
|
|
|
|
|
|
|
|
September 30, 2025 |
|
Property Type |
|
Number of Properties |
|
|
Sq. Feet (in thousands)/Units |
|
|
Occupancy(1) |
|
Gross Asset Value (2) |
|
|
Average Effective Annual Base Rent per Leased Square Foot/Units (3) |
|
Industrial |
|
|
6 |
|
|
|
2,762 sq. ft. |
|
|
100% |
|
$ |
354,240 |
|
|
$ |
7.05 |
|
Multifamily |
|
|
2 |
|
|
|
435 units |
|
|
95% |
|
|
147,600 |
|
|
$ |
26,145 |
|
Retail |
|
|
1 |
|
|
|
118 sq. ft. |
|
|
100% |
|
|
59,600 |
|
|
$ |
30.51 |
|
Total |
|
|
9 |
|
|
|
|
|
|
|
$ |
561,440 |
|
|
|
|
(1)For our industrial and retail investments, occupancy rate is defined as all leased square footage divided by the total available square footage as of September 30, 2025. For our multifamily investments, occupancy is defined as the percentage of actual rent divided by gross potential rent (defined as actual rent for occupied units and market rent for vacant units) for the three months ended September 30, 2025.
(2)Based on fair value as of September 30, 2025.
(3)For our industrial and retail properties, average effective annual base rent per leased square foot represents the annualized base rent per leased square foot for the three months ended September 30, 2025. The average effective annual base rent includes the effects of rent concessions and abatements, and excludes tenant recoveries, straight-line rent, and above-market and below-market lease amortization. For our multifamily properties, average effective annual base rent per leased unit represents the annualized base rent per leased unit for the three months ended September 30, 2025. The average effective annual base rent includes the effects of rent concessions and abatements, and excludes tenant recoveries, straight-line rent, and above-market and below-market lease amortization.
The following table provides information regarding our portfolio of real estate properties as of September 30, 2025 ($ in thousands):
|
|
|
|
|
|
|
|
|
|
|
|
|
|
|
|
|
|
|
|
|
|
|
|
September 30, 2025 |
|
Investment |
|
Number of Properties |
|
|
Property Type |
|
Location |
|
Acquisition Date |
|
Sq. Feet (in thousands)/Units |
|
|
Occupancy(1) |
|
Gross Asset Value (2) |
|
Rickenbacker (6900 Shook Road) |
|
|
1 |
|
|
Industrial |
|
Columbus, Ohio |
|
January 2023 |
|
|
165 sq. ft. |
|
|
100% |
|
$ |
55,600 |
|
Hallmark (1551 Shepherd Road) |
|
|
1 |
|
|
Industrial |
|
Liberty, Missouri |
|
October 2023 |
|
|
847 sq. ft. |
|
|
100% |
|
|
70,600 |
|
PepsiCo / Quaker Distribution Center (4553 Cayce Road) |
|
|
1 |
|
|
Industrial |
|
Byhalia, Mississippi |
|
May 2024 |
|
|
708 sq. ft. |
|
|
100% |
|
|
62,600 |
|
2865 Charter Street |
|
|
1 |
|
|
Industrial |
|
Columbus, Ohio |
|
March 2025 |
|
|
179 sq. ft. |
|
|
100% |
|
|
76,200 |
|
3707 W NC 10 Hwy |
|
|
1 |
|
|
Industrial |
|
Newton, North Carolina |
|
August 2025 |
|
|
736 sq. ft. |
|
|
100% |
|
|
55,261 |
|
8681 W Jefferson Street |
|
|
1 |
|
|
Industrial |
|
Tolleson, Arizona |
|
September 2025 |
|
|
127 sq. ft. |
|
|
100% |
|
|
33,979 |
|
The Beckett |
|
|
1 |
|
|
Multifamily |
|
Charleston, South Carolina |
|
May 2024 |
|
|
186 units |
|
|
96% |
|
|
50,800 |
|
Parc Westborough |
|
|
1 |
|
|
Multifamily |
|
Westborough, Massachusetts |
|
May 2025 |
|
|
249 units |
|
|
94% |
|
|
96,800 |
|
16000 Pines |
|
|
1 |
|
|
Retail |
|
Pembroke Pines, Florida |
|
August 2023 |
|
|
118 sq. ft. |
|
|
100% |
|
|
59,600 |
|
Total |
|
|
9 |
|
|
|
|
|
|
|
|
|
|
|
|
|
$ |
561,440 |
|
___________
(1)For our industrial and retail investments, occupancy is defined as all leased square footage divided by the total available square footage as of September 30, 2025. For our multifamily investments, occupancy is defined as the percentage of actual rent divided by gross potential rent (defined as actual rent for occupied units and market rent for vacant units) for the three months ended September 30, 2025.
(2)Based on fair value as of September 30, 2025.
Lease Expirations
The following schedule details the expiring leases at our industrial and retail properties by annualized base rent as of September 30, 2025 ($ and square feet in thousands). The table below excludes our multifamily properties as substantially all leases at such properties expire within 12 months.
|
|
|
|
|
|
|
|
|
|
|
|
|
|
|
|
|
|
|
|
|
|
|
Year |
|
Number of Expiring Leases |
|
|
Annualized Base Rent(1) |
|
|
% of Total Annualized Base Rent Expiring |
|
|
Sq. Feet |
|
|
% of Total Square Feet Expiring |
|
|
2025 (remaining) |
|
|
- |
|
|
$ |
- |
|
|
|
0 |
% |
|
|
- |
|
|
|
0 |
% |
|
2026 |
|
|
- |
|
|
|
- |
|
|
|
0 |
% |
|
|
- |
|
|
|
0 |
% |
|
2027 |
|
|
- |
|
|
|
- |
|
|
|
0 |
% |
|
|
- |
|
|
|
0 |
% |
|
2028 |
|
|
1 |
|
|
|
133 |
|
|
|
1 |
% |
|
|
2 |
|
|
|
0 |
% |
|
2029 |
|
|
2 |
|
|
|
295 |
|
|
|
1 |
% |
|
|
10 |
|
|
|
0 |
% |
|
2030 |
|
|
1 |
|
|
|
2,030 |
|
|
|
8 |
% |
|
|
127 |
|
|
|
4 |
% |
|
2031 |
|
|
3 |
|
|
|
4,217 |
|
|
|
17 |
% |
|
|
718 |
|
|
|
25 |
% |
|
2032 |
|
|
6 |
|
|
|
545 |
|
|
|
2 |
% |
|
|
11 |
|
|
|
0 |
% |
|
2033 |
|
|
5 |
|
|
|
4,718 |
|
|
|
19 |
% |
|
|
856 |
|
|
|
30 |
% |
|
2034 |
|
|
1 |
|
|
|
450 |
|
|
|
2 |
% |
|
|
25 |
|
|
|
1 |
% |
|
Thereafter |
|
|
7 |
|
|
|
11,910 |
|
|
|
49 |
% |
|
|
1,131 |
|
|
|
39 |
% |
|
Total |
|
|
26 |
|
|
$ |
24,298 |
|
|
|
100 |
% |
|
|
2,880 |
|
|
|
100 |
% |
|
___________
(1)Annualized base rent is determined from the annualized base rent per leased square foot as of September 30, 2025, including the effects of rent concessions and abatements and excluding tenant recoveries, straight-line rent, and above-market and below-market lease amortization.
Investments in Real Estate Debt
The following table summarizes our investments in real estate debt as of September 30, 2025 ($ in thousands):
___________
|
|
|
|
|
|
|
|
|
|
|
|
|
|
|
|
|
|
|
|
|
|
|
|
September 30, 2025 |
|
Type of Investment in Real Estate Debt |
|
Number of Positions |
|
Weighted Average Coupon (1) |
|
|
Weighted Average Maturity Date (2) |
|
Face Amount |
|
|
Cost Basis |
|
|
Fair Value |
|
Commercial mortgage loan |
|
25 |
|
|
7.7 |
% |
|
May 2029 (4) |
|
$ |
980,852 |
|
|
$ |
980,639 |
|
|
$ |
980,483 |
|
Mezzanine loan |
|
2 |
|
|
10.6 |
% |
|
April 2028 |
|
|
112,500 |
|
|
|
112,500 |
|
|
|
112,500 |
|
Real estate-related securities (3) |
|
31 |
|
|
5.9 |
% |
|
July 2038 |
|
|
95,654 |
|
|
|
95,475 |
|
|
|
95,766 |
|
Total investments in real estate debt: |
|
58 |
|
|
7.8 |
% |
|
January 2030 |
|
$ |
1,189,006 |
|
|
$ |
1,188,614 |
|
|
$ |
1,188,749 |
|
(1)Based on applicable benchmark rates as of September 30, 2025.
(2)Weighted average maturity date is based on fully extended maturity.
(3)Our real estate-related securities consist of floating-rate CMBS.
(4)One of our commercial mortgage loans is past its contractual maturity. Through the date of this quarterly report, we received all the monthly interest income payments on the loan which are consistent with the interest rate provided for in the original loan agreement. Subsequent to the date of these condensed consolidated financial statements but prior to the date of this quarterly report, the borrower filed for Chapter 11 bankruptcy. We evaluated the loan for collectability as of the reporting date and determined that the loan is fully recoverable.
The following table summarizes our investments in commercial real estate loans as of September 30, 2025 ($ in thousands):
|
|
|
|
|
|
|
|
|
|
|
|
|
|
|
|
|
|
|
|
|
|
|
|
|
|
Commercial Real Estate Loan Portfolio |
|
|
|
|
|
|
September 30, 2025 |
|
# |
|
|
Type |
|
Property Type |
|
Geography |
|
Coupon(1) |
|
Maturity Date(2) |
|
Commitment |
|
|
Cost Basis |
|
|
Fair Value |
|
|
1 |
|
|
First Mortgage |
|
Data Center |
|
Southwest |
|
6.8% |
|
January 2030 |
|
$ |
125,000 |
|
|
$ |
98,580 |
|
|
$ |
98,580 |
|
|
2 |
|
|
First Mortgage |
|
Mixed Use |
|
Northeast |
|
7.8% |
|
August 2030 |
|
|
100,000 |
|
|
|
92,885 |
|
|
|
92,885 |
|
|
3 |
|
|
First Mortgage |
|
Production Studio |
|
West |
|
8.3% |
|
September 2028 |
|
|
100,000 |
|
|
|
72,547 |
|
|
|
72,547 |
|
|
4 |
|
|
First Mortgage |
|
Self-Storage |
|
Various |
|
7.2% |
|
May 2030 |
|
|
96,700 |
|
|
|
94,103 |
|
|
|
94,103 |
|
|
5 |
|
|
First Mortgage |
|
Data Center |
|
Mid-Atlantic |
|
8.2% |
|
April 2029 |
|
|
85,000 |
|
|
|
64,920 |
|
|
|
64,920 |
|
|
6 |
|
|
First Mortgage |
|
Data Center |
|
Mid-Atlantic |
|
8.7% |
|
September 2030 |
|
|
75,000 |
|
|
|
24,258 |
|
|
|
24,258 |
|
|
7 |
|
|
First Mortgage |
|
Hotel |
|
Various |
|
9.1% |
|
July 2030 |
|
|
75,000 |
|
|
|
17,400 |
|
|
|
17,400 |
|
|
8 |
|
|
First Mortgage |
|
Multifamily |
|
Northeast |
|
8.6% |
|
July 2028 |
|
|
65,000 |
|
|
|
47,414 |
|
|
|
47,414 |
|
|
9 |
|
|
First Mortgage |
|
Data Center |
|
Mid-Atlantic |
|
7.8% |
|
July 2029 |
|
|
65,000 |
|
|
|
30,175 |
|
|
|
30,175 |
|
|
10 |
|
|
Mezzanine |
|
Multifamily |
|
Various |
|
11.0% |
|
July 2029 |
|
|
62,500 |
|
|
|
62,500 |
|
|
|
62,500 |
|
|
11 |
|
|
First Mortgage |
|
Multifamily |
|
West |
|
7.3% |
|
February 2029 |
|
|
60,000 |
|
|
|
60,000 |
|
|
|
60,000 |
|
|
12 |
|
|
First Mortgage |
|
Multifamily |
|
Northeast |
|
7.3% |
|
January 2029 |
|
|
50,000 |
|
|
|
50,000 |
|
|
|
50,000 |
|
|
13 |
|
|
Mezzanine |
|
Industrial |
|
Various |
|
10.0% |
|
September 2026 |
|
|
50,000 |
|
|
|
50,000 |
|
|
|
50,000 |
|
|
14 |
|
|
First Mortgage |
|
Industrial |
|
Northeast |
|
7.8% |
|
March 2028 |
|
|
50,000 |
|
|
|
49,761 |
|
|
|
49,761 |
|
|
15 |
|
|
First Mortgage |
|
Hotel |
|
West |
|
8.1% |
|
February 2029 |
|
|
50,000 |
|
|
|
46,254 |
|
|
|
46,254 |
|
|
16 |
|
|
First Mortgage |
|
Data Center |
|
West |
|
7.8% |
|
February 2030 |
|
|
50,000 |
|
|
|
29,720 |
|
|
|
29,933 |
|
|
17 |
|
|
First Mortgage |
|
Multifamily |
|
Southeast |
|
8.6% |
|
December 2028 |
|
|
50,000 |
|
|
|
10,987 |
|
|
|
10,987 |
|
|
18 |
|
|
First Mortgage |
|
Multifamily |
|
West |
|
8.1% |
|
March 2031 |
|
|
50,000 |
|
|
|
8,929 |
|
|
|
8,929 |
|
|
19 |
|
|
First Mortgage |
|
Multifamily |
|
Southwest |
|
7.3% |
|
July 2029 |
|
|
35,000 |
|
|
|
34,107 |
|
|
|
34,107 |
|
|
20 |
|
|
First Mortgage |
|
Data Center |
|
Southwest |
|
6.6% |
|
June 2030 |
|
|
33,719 |
|
|
|
3,522 |
|
|
|
3,522 |
|
|
21 |
|
|
First Mortgage |
|
Data Center |
|
Southwest |
|
6.6% |
|
June 2030 |
|
|
33,349 |
|
|
|
16,885 |
|
|
|
16,885 |
|
|
22 |
|
|
First Mortgage |
|
Data Center |
|
Southwest |
|
6.6% |
|
June 2030 |
|
|
32,932 |
|
|
|
8,023 |
|
|
|
8,023 |
|
|
23 |
|
|
First Mortgage |
|
Multifamily |
|
Northeast |
|
8.1% |
|
July 2025 (3) |
|
|
26,000 |
|
|
|
22,905 |
|
|
|
22,905 |
|
|
24 |
|
|
First Mortgage |
|
Hotel |
|
Northeast |
|
7.9% |
|
November 2027 |
|
|
25,000 |
|
|
|
25,000 |
|
|
|
25,000 |
|
|
25 |
|
|
First Mortgage |
|
Life Sciences |
|
Northeast |
|
7.6% |
|
August 2029 |
|
|
25,000 |
|
|
|
24,663 |
|
|
|
24,340 |
|
|
26 |
|
|
First Mortgage |
|
Hotel |
|
Various |
|
8.1% |
|
July 2028 |
|
|
25,000 |
|
|
|
24,254 |
|
|
|
24,208 |
|
|
27 |
|
|
First Mortgage |
|
Multifamily |
|
Midwest |
|
8.6% |
|
December 2028 |
|
|
25,000 |
|
|
|
23,347 |
|
|
|
23,347 |
|
|
|
|
|
|
|
|
|
|
|
|
|
|
|
|
|
|
|
|
|
|
|
|
|
|
|
Total W/A |
|
8.0% |
|
April 2029 |
|
$ |
1,520,200 |
|
|
$ |
1,093,139 |
|
|
$ |
1,092,983 |
|
____________
(1)Based on applicable benchmark rates as of September 30, 2025.
(2)Weighted average maturity date is based on fully extended maturity.
(3)Loan is past its contractual maturity. Through the date of this quarterly report, we received all the monthly interest income payments on the loan which are consistent with the interest rate provided for in the original loan agreement. Subsequent to the date of these condensed consolidated financial statements but prior to the date of this quarterly report, the borrower filed for Chapter 11 bankruptcy. We evaluated the loan for collectability as of the reporting date and determined that the loan is fully recoverable.
Results of Operations
The following table sets forth information regarding our consolidated results of operations for the three months ended September 30, 2025 and 2024 ($ in thousands):
|
|
|
|
|
|
|
|
|
|
|
|
|
|
|
|
Three Months Ended September 30, |
|
|
Change |
|
|
|
2025 |
|
|
2024 |
|
|
$ |
|
Revenues |
|
|
|
|
|
|
|
|
|
Rental revenue |
|
$ |
10,258 |
|
|
$ |
6,302 |
|
|
$ |
3,956 |
|
Total revenues |
|
|
10,258 |
|
|
|
6,302 |
|
|
|
3,956 |
|
Expenses |
|
|
|
|
|
|
|
|
|
Rental property operating |
|
$ |
2,498 |
|
|
$ |
1,474 |
|
|
$ |
1,024 |
|
General and administrative |
|
|
1,730 |
|
|
|
1,424 |
|
|
|
306 |
|
Management fee |
|
|
3,185 |
|
|
|
2,121 |
|
|
|
1,064 |
|
Performance participation allocation |
|
|
108 |
|
|
|
75 |
|
|
|
33 |
|
Depreciation and amortization |
|
|
4,859 |
|
|
|
2,793 |
|
|
|
2,066 |
|
Total expenses |
|
$ |
12,380 |
|
|
$ |
7,887 |
|
|
$ |
4,493 |
|
Other income |
|
|
|
|
|
|
|
|
|
Income from investments in real estate debt |
|
|
24,820 |
|
|
|
17,366 |
|
|
|
7,454 |
|
Other income |
|
|
763 |
|
|
|
1,549 |
|
|
|
(786 |
) |
Interest expense |
|
|
(5,723 |
) |
|
|
(4,091 |
) |
|
|
(1,632 |
) |
Total other income |
|
|
19,860 |
|
|
|
14,824 |
|
|
|
5,036 |
|
Net income |
|
$ |
17,738 |
|
|
$ |
13,239 |
|
|
$ |
4,499 |
|
Rental Revenue
Rental revenue primarily consists of base rent arising from tenant leases at our properties. Rental revenue is recognized on a straight-line basis over the life of the lease. The $4.0 million increase in rental revenue was due to the acquisition of four additional properties subsequent to September 30, 2024.
Rental Property Operating Expenses
Rental property operating expenses consist of the costs of ownership and operation of our real estate investments. Examples of rental property operating expenses include real estate taxes, insurance, utilities and repair and maintenance expenses. The $1.0 million increase in rental property operating expenses was due to the acquisition of four additional properties subsequent to September 30, 2024.
General and Administrative Expenses
General and administrative expenses consist primarily of legal fees, accounting fees and fees for other professional services. The $0.3 million increase in general and administrative expenses was due to an increase in transaction activity.
Management Fee
Management fees are earned by the Adviser for providing services pursuant to the Advisory Agreement and are based on the month end NAV for the respective share classes. The $1.1 million increase in management fees was due to the increase in our average NAV from September 30, 2024 to September 30, 2025 which was primarily driven by our capital raise activity and appreciation from our investments.
Performance Participation Allocation
The performance participation allocation relates to allocations from the Operating Partnership to the Special Limited Partner based on the total return of the Operating Partnership. Total return is defined as distributions paid or accrued plus the change in aggregate NAV since the beginning of the year, before giving effect to (x) changes resulting solely from the proceeds of issuances of additional Operating Partnership units, (y) any allocation or accrual to the performance participation interest and (z) applicable stockholder servicing fee expenses allocable to such Operating Partnership units. There was a minimal increase in the performance participation allocation for the three months ended September 30, 2025 compared to the three months ended September 30, 2024 due an increase in outstanding shares subject to the performance participation allocation.
Depreciation and Amortization
Depreciation and amortization expenses are impacted by the values assigned to buildings and in-place lease assets as part of the initial purchase price allocation. The $2.1 million increase in depreciation and amortization expense was due to the acquisition of four additional properties subsequent to September 30, 2024.
Income from Investments in Real Estate Debt
Income from investments in real estate debt consists of interest income, fees revenue, realized gains and losses and unrealized gains and losses resulting from the changes in fair value. The $7.5 million increase in income from investments in real estate debt is due to originations, acquisitions and add-on fundings subsequent to September 30, 2024, resulting in higher interest income. As of September 30, 2025, we owned 58 positions in commercial mortgage loans, mezzanine loans and real estate-related securities, compared to 36 positions as of September 30, 2024, and the balance of our investments in real estate debt, at fair value increased from $728.8 million to $1,188.7 million during the same time period.
Other Income
Other income primarily consists of interest earned on our cash and cash equivalents balance. The $0.8 million decrease in other income was driven by lower average cash balances during the three months ended September 30, 2025 as compared to the three months ended September 30, 2024.
Interest Expense
Interest expense is primarily related to interest incurred on our mortgage loans and secured debt arrangements. The $1.6 million increase in interest expense was driven by an increase of $82.8 million of indebtedness related to our secured debt arrangements and an increase of $58.3 million of indebtedness related to our mortgage notes as of September 30, 2024.
The following table sets forth information regarding our consolidated results of operations for the nine months ended September 30, 2025 and 2024 ($ in thousands):
|
|
|
|
|
|
|
|
|
|
|
|
|
|
|
|
Nine Months Ended September 30, |
|
|
Change |
|
|
|
2025 |
|
|
2024 |
|
|
$ |
|
Revenues |
|
|
|
|
|
|
|
|
|
Rental revenue |
|
$ |
24,774 |
|
|
$ |
15,020 |
|
|
$ |
9,754 |
|
Total revenues |
|
|
24,774 |
|
|
|
15,020 |
|
|
|
9,754 |
|
Expenses |
|
|
|
|
|
|
|
|
|
Rental property operating |
|
$ |
5,645 |
|
|
$ |
2,871 |
|
|
$ |
2,774 |
|
General and administrative |
|
|
5,258 |
|
|
|
4,703 |
|
|
|
555 |
|
Management fee |
|
|
8,778 |
|
|
|
5,437 |
|
|
|
3,341 |
|
Performance participation allocation |
|
|
297 |
|
|
|
347 |
|
|
|
(50 |
) |
Depreciation and amortization |
|
|
11,136 |
|
|
|
6,375 |
|
|
|
4,761 |
|
Total expenses |
|
$ |
31,114 |
|
|
$ |
19,733 |
|
|
$ |
11,381 |
|
Other income |
|
|
|
|
|
|
|
|
|
Income from investments in real estate debt |
|
|
67,403 |
|
|
|
41,931 |
|
|
|
25,472 |
|
Other income |
|
|
2,896 |
|
|
|
4,022 |
|
|
|
(1,126 |
) |
Interest expense |
|
|
(13,485 |
) |
|
|
(6,745 |
) |
|
|
(6,740 |
) |
Total other income |
|
|
56,814 |
|
|
|
39,208 |
|
|
|
17,606 |
|
Net income |
|
$ |
50,474 |
|
|
$ |
34,495 |
|
|
$ |
15,979 |
|
Rental Revenue
Rental revenue primarily consists of base rent arising from tenant leases at our properties. Rental revenue is recognized on a straight-line basis over the life of the lease. The $9.8 million increase in rental revenue was due to the acquisition of four additional properties subsequent to September 30, 2024.
Rental Property Operating Expenses
Rental property operating expenses consist of the costs of ownership and operation of our real estate investments. Examples of rental property operating expenses include real estate taxes, insurance, utilities and repair and maintenance expenses. The $2.8 million increase in rental property operating expenses was due to the acquisition of four additional properties subsequent to September 30, 2024.
General and Administrative Expenses
General and administrative expenses consist primarily of legal fees, accounting fees and fees for other professional services. The $0.6 million increase in general and administrative expenses was due to an increase in transaction activity.
Management Fee
Management fees are earned by the Adviser for providing services pursuant to the Advisory Agreement and are based on the month end NAV for the respective share classes. The $3.3 million increase in management fees was due to the increase in our average NAV from September 30, 2024 to September 30, 2025 which was primarily driven by our capital raise activity and appreciation from our investments.
Performance Participation Allocation
The performance participation allocation relates to allocations from the Operating Partnership to the Special Limited Partner based on the total return of the Operating Partnership. Total return is defined as distributions paid or accrued plus the change in aggregate NAV since the beginning of the year, before giving effect to (x) changes resulting solely from the proceeds of issuances of additional Operating Partnership units, (y) any allocation or accrual to the performance participation interest and (z) applicable stockholder servicing fee expenses allocable to such Operating Partnership units. In April 2024, approximately 5.2 million Class F-I shares, which are subject to the performance participation allocation, were exchanged for approximately 5.2 million Class A-I shares, which are not subject to the performance participation allocation, driving the $0.1 million decrease in the performance participation allocation as compared to the nine months ended September 30, 2024.
Depreciation and Amortization
Depreciation and amortization expenses are impacted by the values assigned to buildings and in-place lease assets as part of the initial purchase price allocation. The $4.8 million increase in depreciation and amortization expenses was due to the acquisition of four additional properties subsequent to September 30, 2024.
Income from Investments in Real Estate Debt
Income from investments in real estate debt consists of interest income, fees revenue, realized gains and losses and unrealized gains and losses resulting from the changes in fair value. The $25.5 million increase in income from investments in real estate debt is due to originations, acquisitions and add-on fundings subsequent to September 30, 2024, resulting in higher interest income. As of September 30, 2025, we owned 58 positions in commercial mortgage loans, mezzanine loans and real estate-related securities, compared to 36 positions as of September 30, 2024, and the balance of our investments in real estate debt, at fair value increased from $728.8 million to $1,188.7 million during the same time period.
Other Income
Other income primarily consists of interest earned on our cash and cash equivalents balance. The $1.1 million decrease in other income was driven by lower average cash balances during the nine months ended September 30, 2025 as compared to the nine months ended September 30, 2024.
Interest Expense
Interest expense is primarily related to interest incurred on our mortgage loans and secured debt arrangements. The $6.7 million increase in interest expense was driven by an increase of $82.8 million of indebtedness related to our secured debt arrangements and an increase of $58.3 million of indebtedness related to our mortgage notes as of September 30, 2024.
Liquidity and Capital Resources
Liquidity is a measure of our ability to fund our investments, to make distributions to our stockholders, to repurchase shares of our common stock pursuant to our share repurchase plan, to pay our offering costs, operating fees and expenses and to make debt service payments on any outstanding indebtedness we may incur. We anticipate our offering and operating fees and expenses will include, among other things, the management fee we will pay to the Adviser, the performance participation allocation that the Operating Partnership will pay to the Special Limited Partner, stockholder servicing fees we will pay to the Dealer Manager, legal, audit and valuation expenses, federal and state filing fees, printing expenses, administrative fees, transfer agent fees, marketing and distribution expenses and fees related to acquiring, financing, appraising and managing our properties. We do not have any office or personnel expenses as we do not have any employees.
The Adviser and its affiliates have advanced $8.0 million of organization and offering expenses and $7.3 million of general and administrative expenses on our behalf through December 22, 2023. We began reimbursing the Adviser and its affiliates for all such advanced expenses ratably over a 60-month period beginning on December 22, 2024.
As of September 30, 2025, our liquidity comprised of $51.1 million of unrestricted cash and cash equivalents and $628.6 million of undrawn capacity on our secured debt arrangements. We may generate incremental liquidity through our operating cash flows, which were $68.2 million for the nine months ended September 30, 2025. Additionally, we may create liquidity through either the sale of, or borrowing against, our investments in real estate-related securities, which were classified as trading securities and carried at their estimated fair value of $95.8 million as of September 30, 2025. As of September 30, 2025, we remain low leveraged with a current leverage ratio of 0.3x, calculated as dividing (i) the fair value of asset-specific and corporate level debt by (ii) NAV.
Over time, we generally intend to fund our cash needs for items other than asset acquisitions from operations. We expect our cash needs for acquisitions will be funded primarily from the sale of shares of our common stock and through the assumption or incurrence of debt. During the nine months ended September 30, 2025, we received $349.5 million of proceeds from the sale of shares of common stock, including proceeds from our private offerings, and repurchased $17.6 million of shares of our common stock under our share repurchase plan.
Potential sources of liquidity include secured or unsecured financings from banks or other lenders and proceeds from the sale of assets, equity issuances by the Operating Partnership or the sale of beneficial interests in specific Delaware statutory trusts holding real properties, including properties placed by the Operating Partnership or affiliates of Apollo. As of September 30, 2025, we held approximately $1,022.0 million of unencumbered assets at fair value outside of trading securities mentioned in the preceding paragraph, consisting of investments in real estate, as well as commercial mortgage and mezzanine loans.
Funds From Operations and Adjusted Funds From Operations
We believe funds from operations ("FFO") is a meaningful non-GAAP supplemental measure of our operating results. Our condensed consolidated financial statements are presented under historical cost accounting which, among other things, requires depreciation of real estate investments to be calculated on a straight-line basis. As a result, our operating results imply that the value of our real estate investments has decreased evenly over time. However, we believe that the value of our real estate investments will fluctuate over time based on market conditions and, as such, depreciation under historical cost accounting may be less informative as a measure of our performance. FFO is an operating measure defined by the National Association of Real Estate Investment Trusts ("NAREIT") that is broadly used in the REIT industry. FFO, as defined by NAREIT and presented below, is calculated as net income or loss (computed in accordance with GAAP), excluding (i) depreciation and amortization, (ii) impairment of investments in real estate, (iii) net gains or losses from sales of real estate, and (iv) consolidated and unconsolidated joint ventures.
We also believe that adjusted FFO ("AFFO") is a meaningful supplemental non-GAAP disclosure of our operating results. AFFO further adjusts FFO in order for our operating results to reflect the specific characteristics of our business by adjusting for items we believe are not related to our core operations. Our adjustments to FFO to arrive at AFFO include removing the impact of (i) straight-line rental income and expense, (ii) unrealized gains or losses from changes in the fair value of real estate debt and other financial instruments, (iii) non-cash performance participation allocation, even if repurchased by us, (iv) amortization of restricted stock awards, (v) amortization of above- and below-market lease intangibles, and (vi) similar adjustments for unconsolidated joint ventures. AFFO is not defined by NAREIT and our calculation of AFFO may not be comparable to disclosures made by other REITs.
FFO and AFFO should not be considered to be more relevant or accurate than the GAAP methodology in calculating net income or in evaluating our operating performance. In addition, FFO and AFFO should not be considered as alternatives to net income as indications of our performance or as alternatives to cash flows from operating activities as indications of our liquidity, but rather should be reviewed in conjunction with these and other GAAP measurements. Further, FFO and AFFO are not intended to be used as liquidity measures indicative of cash flow available to fund our cash needs, including our ability to make distributions to our stockholders.
The following table presents a reconciliation of net income to FFO and AFFO ($ in thousands):
|
|
|
|
|
|
|
|
|
|
|
|
|
|
|
|
|
|
Three Months Ended September 30, |
|
|
Nine Months Ended September 30, |
|
|
2025 |
|
|
2024 |
|
|
2025 |
|
|
2024 |
|
Net income |
$ |
17,738 |
|
|
$ |
13,239 |
|
|
$ |
50,474 |
|
|
$ |
34,495 |
|
Adjustments to arrive at FFO: |
|
|
|
|
|
|
|
|
|
|
|
Depreciation and amortization |
|
4,859 |
|
|
|
2,793 |
|
|
|
11,136 |
|
|
|
6,375 |
|
FFO |
$ |
22,597 |
|
|
$ |
16,032 |
|
|
$ |
61,610 |
|
|
$ |
40,870 |
|
Adjustments to arrive at AFFO: |
|
|
|
|
|
|
|
|
|
|
|
Straight-line rental income |
|
(680 |
) |
|
|
(689 |
) |
|
|
(2,422 |
) |
|
|
(1,570 |
) |
Unrealized (gain)/loss on fair value of investments in real estate debt |
|
326 |
|
|
|
3 |
|
|
|
38 |
|
|
|
(152 |
) |
Non-cash performance participation allocation |
|
108 |
|
|
|
75 |
|
|
|
297 |
|
|
|
347 |
|
Amortization of restricted stock awards |
|
25 |
|
|
|
25 |
|
|
|
75 |
|
|
|
75 |
|
Amortization of above- and below-market leases, net |
|
(270 |
) |
|
|
(153 |
) |
|
|
(568 |
) |
|
|
(514 |
) |
AFFO |
$ |
22,106 |
|
|
$ |
15,293 |
|
|
$ |
59,030 |
|
|
$ |
39,056 |
|
Net Asset Value
NAV per share is calculated in accordance with the valuation guidelines approved by our board of directors. Our total NAV presented in the following tables includes the NAV of our Class S shares, Class I shares, Class F-I shares, Class A-I shares, Class A-III shares and Class E shares and units held by parties other than us. The following table provides a breakdown of the major components of our total NAV as of September 30, 2025 ($ and shares/units in thousands):
|
|
|
|
|
|
Components of NAV |
|
September 30, 2025 |
|
Investments in real estate |
|
$ |
561,440 |
|
Investments in real estate debt |
|
|
1,188,749 |
|
Cash and cash equivalents |
|
|
51,069 |
|
Restricted cash |
|
|
2,628 |
|
Other assets |
|
|
33,040 |
|
Mortgage notes at fair value, net of deferred financing costs |
|
|
(92,939 |
) |
Secured debt arrangements, net |
|
|
(270,980 |
) |
Other liabilities |
|
|
(27,217 |
) |
Accrued performance participation allocation |
|
|
(297 |
) |
Management fee payable |
|
|
(1,096 |
) |
Net asset value |
|
$ |
1,444,397 |
|
Number of outstanding shares/units |
|
|
67,334 |
|
The following table provides a breakdown of our total NAV and NAV per share/unit by class as of September 30, 2025 ($ and shares/units in thousands, except per share/unit data):
|
|
|
|
|
|
|
|
|
|
|
|
|
|
|
|
|
|
|
|
|
|
|
|
|
|
|
|
|
|
|
|
|
|
|
|
|
|
|
|
|
|
NAV Per Share/Unit |
|
Class S Shares |
|
|
Class D Shares |
|
|
Class I Shares |
|
|
Class F-I Shares |
|
|
Class A-I Shares |
|
|
Class A-III Shares |
|
|
Class E Shares(1) |
|
|
Third-party Operating Partnership Class A-I Units(2) |
|
|
Third-party Operating Partnership Class E Units(2) |
|
|
Total |
|
Net asset value |
|
$ |
226 |
|
|
$ |
104 |
|
|
$ |
26,456 |
|
|
$ |
32,236 |
|
|
$ |
439,394 |
|
|
$ |
802,395 |
|
|
$ |
18,765 |
|
|
$ |
120,458 |
|
|
$ |
4,363 |
|
|
$ |
1,444,397 |
|
Number of outstanding shares/units |
|
|
11 |
|
|
|
5 |
|
|
|
1,256 |
|
|
|
1,536 |
|
|
|
20,437 |
|
|
|
37,415 |
|
|
|
869 |
|
|
|
5,603 |
|
|
|
202 |
|
|
|
67,334 |
|
NAV per share/unit as of September 30, 2025 |
|
$ |
21.1594 |
|
|
$ |
21.2638 |
|
|
$ |
21.0632 |
|
|
$ |
20.9824 |
|
|
$ |
21.4999 |
|
|
$ |
21.4460 |
|
|
$ |
21.5844 |
|
|
$ |
21.4999 |
|
|
$ |
21.5844 |
|
|
$ |
21.4513 |
|
___________
(1)Class E shares of our common stock are offered to certain of Apollo's affiliates, directors and employees in one or more private placements.
(2)Includes the Operating Partnership units held by parties other than us.
Consistent with the disclosure in our prospectus regarding our NAV calculation, our investments in real estate and real estate debt are initially valued at cost. The valuations of our real properties as of September 30, 2025, excluding certain newly acquired properties that are held at cost which we believe reflects the fair value of such properties, were provided by the independent valuation advisor in accordance with our valuation procedures. Certain key assumptions that were used by the independent valuation advisor in the discounted cash flow analysis are set forth in the following table based on weighted-averages by property types where we have multiple real estate investments. Once we own more than one retail property, we will include the key assumptions for such property type.
|
|
|
|
|
|
Property Type |
|
Discount Rate |
|
Exit Capitalization Rate |
Industrial |
|
7.6% |
|
6.4% |
Multifamily |
|
7.1% |
|
5.3% |
A change in these assumptions or factors would impact the calculation of the value of our property investments. For example, assuming all other factors remain unchanged, the changes listed below would result in the following effects on our investment values:
|
|
|
|
|
|
|
|
Input |
|
Hypothetical Change |
|
Industrial Investment Values |
|
Multifamily Investment Values |
Discount rate |
|
0.25% Decrease |
|
+2.15% |
|
+1.93% |
(weighted average) |
|
0.25% Increase |
|
(2.09)% |
|
(1.95)% |
Exit Capitalization Rate |
|
0.25% Decrease |
|
+2.10% |
|
+3.09% |
(weighted average) |
|
0.25% Increase |
|
(1.94)% |
|
(2.88)% |
The following table reconciles stockholders' equity and the Operating Partnership partners' capital per our condensed consolidated balance sheet to our NAV ($ in thousands):
|
|
|
|
|
|
Reconciliation of Stockholders' Equity to NAV |
|
September 30, 2025 |
|
Stockholders' equity under U.S. GAAP |
|
$ |
1,278,180 |
|
Non-controlling interests attributable to the Operating Partnership and preferred stockholders |
|
|
112,856 |
|
Redeemable non-controlling interests |
|
|
4,363 |
|
Total stockholders' equity, redeemable non-controlling interests and the Operating Partnership partners' capital under GAAP |
|
$ |
1,395,399 |
|
Adjustments: |
|
|
|
Unrealized net real estate appreciation |
|
|
20,817 |
|
Accumulated depreciation and amortization |
|
|
15,213 |
|
Advanced organization and offering costs and advanced operating expenses |
|
|
12,946 |
|
Accrued stockholder servicing fee |
|
|
22 |
|
NAV |
|
$ |
1,444,397 |
|
The following details the adjustments to reconcile GAAP stockholders' equity to our NAV:
•Our investments in real estate are presented at their depreciated cost basis in our GAAP consolidated financial statements. Additionally, our mortgage notes and secured debt arrangements are presented at their amortized cost basis in our GAAP consolidated financial statements. Since these assets and liabilities are recorded at their fair value to determine our NAV, any increases or decreases in fair market value of our investments in real estate, our mortgage notes or secured debt arrangements therefore represent a reconciling item above.
•In accordance with GAAP, we depreciate our investments in real estate and amortize certain other assets and liabilities. Such depreciation and amortization are not recorded for the purposes of calculating NAV.
•The Adviser and its affiliates advanced organization and offering costs and general and administrative expenses on our behalf (including legal, accounting, and other expenses attributable to our organization, but excluding upfront selling commissions, dealer manager fees and stockholder servicing fees) through December 22, 2023. We began reimbursing the Adviser and its affiliates for all such advanced expenses paid through December 22, 2023 ratably over a 60 month period beginning December 22, 2024. Under GAAP, organization costs and general and administrative expenses are expensed as incurred and offering costs are charged to equity as such amounts are incurred. For NAV, such costs are recognized as a reduction of NAV as they are reimbursed to the Adviser.
•Accrued stockholder servicing fees represent the accrual for the cost of the stockholder servicing fee for Class S shares and Class D shares. Under GAAP, we accrued the full cost of the stockholder servicing fees payable over the life of each share (assuming such share remains outstanding the length of time required to pay the maximum stockholder servicing fee) as an offering cost at the time we sold the Class S shares and Class D shares. For purposes of calculating NAV, we recognize the stockholder servicing fees as a reduction of NAV on a monthly basis when such fees are accrued.
Distributions
Beginning in April 2023, we have declared and intend to continue to declare monthly distributions for each class of our common stock, which are generally paid 20 days after month-end. Distributions are made on all classes of our common stock at the same time and each class of our common stock received the same aggregate gross distribution per share; however, the net distribution differs for each class because of different allocations of class-specific stockholder servicing fees, management fees and performance participation allocation. The table below details the net per share distribution for each of our share classes for the nine months ended September 30, 2025:
|
|
|
|
|
|
|
|
|
|
|
|
|
|
|
|
|
|
|
|
|
|
|
|
|
|
|
|
|
|
Record Date |
|
Class S Shares |
|
|
Class D Shares |
|
|
Class I Shares |
|
|
Class F-I Shares |
|
|
Class A-I Shares and Operating Partnership Units |
|
|
Class A-III Shares |
|
|
Class E Shares and Operating Partnership Units |
|
January 31, 2025 |
|
$ |
0.0749 |
|
|
$ |
0.0855 |
|
|
$ |
0.0900 |
|
|
$ |
0.0946 |
|
|
$ |
0.0943 |
|
|
$ |
0.0970 |
|
|
$ |
0.1121 |
|
February 28, 2025 |
|
|
0.0762 |
|
|
|
0.0859 |
|
|
|
0.0900 |
|
|
|
0.0946 |
|
|
|
0.0943 |
|
|
|
0.0970 |
|
|
|
0.1121 |
|
March 31, 2025 |
|
|
0.0749 |
|
|
|
0.0855 |
|
|
|
0.0900 |
|
|
|
0.0946 |
|
|
|
0.0943 |
|
|
|
0.0970 |
|
|
|
0.1121 |
|
April 30, 2025 |
|
|
0.0753 |
|
|
|
0.0856 |
|
|
|
0.0900 |
|
|
|
0.0946 |
|
|
|
0.0943 |
|
|
|
0.0970 |
|
|
|
0.1121 |
|
May 31, 2025 |
|
|
0.0749 |
|
|
|
0.0855 |
|
|
|
0.0900 |
|
|
|
0.0946 |
|
|
|
0.0943 |
|
|
|
0.0970 |
|
|
|
0.1121 |
|
June 30, 2025 |
|
|
0.0753 |
|
|
|
0.0856 |
|
|
|
0.0900 |
|
|
|
0.0946 |
|
|
|
0.0943 |
|
|
|
0.0970 |
|
|
|
0.1122 |
|
July 31, 2025 |
|
|
0.0749 |
|
|
|
0.0855 |
|
|
|
0.0900 |
|
|
|
0.0946 |
|
|
|
0.0943 |
|
|
|
0.0970 |
|
|
|
0.1122 |
|
August 31, 2025 |
|
|
0.0749 |
|
|
|
0.0855 |
|
|
|
0.0900 |
|
|
|
0.0946 |
|
|
|
0.0943 |
|
|
|
0.0970 |
|
|
|
0.1123 |
|
September 30, 2025 |
|
|
0.0753 |
|
|
|
0.0856 |
|
|
|
0.0900 |
|
|
|
0.0946 |
|
|
|
0.0943 |
|
|
|
0.0970 |
|
|
|
0.1123 |
|
Total |
|
$ |
0.6766 |
|
|
$ |
0.7702 |
|
|
$ |
0.8100 |
|
|
$ |
0.8514 |
|
|
$ |
0.8487 |
|
|
$ |
0.8730 |
|
|
$ |
1.0095 |
|
The following tables summarize our distributions declared during the nine months ended September 30, 2025 and 2024 ($ in thousands):
|
|
|
|
|
|
|
|
|
|
|
|
|
|
|
|
|
|
|
|
Nine Months Ended September 30, 2025 |
|
|
Nine Months Ended September 30, 2024 |
|
|
|
Amount |
|
|
Percentage |
|
|
Amount |
|
|
Percentage |
|
Distributions |
|
|
|
|
|
|
|
|
|
|
|
|
Payable in cash |
|
$ |
38,489 |
|
|
|
74 |
% |
|
$ |
20,975 |
|
|
|
72 |
% |
Reinvested in shares |
|
|
13,265 |
|
|
|
26 |
% |
|
|
8,268 |
|
|
|
28 |
% |
Total distributions(1) |
|
$ |
51,754 |
|
|
|
100 |
% |
|
$ |
29,243 |
|
|
|
100 |
% |
Sources of distributions |
|
|
|
|
|
|
|
|
|
|
|
|
Cash flows from operating activities(2) |
|
$ |
51,754 |
|
|
|
100 |
% |
|
$ |
29,243 |
|
|
|
100 |
% |
Total sources of distributions |
|
$ |
51,754 |
|
|
|
100 |
% |
|
$ |
29,243 |
|
|
|
100 |
% |
|
|
|
|
|
|
|
|
|
|
|
|
|
AFFO |
|
$ |
59,030 |
|
|
|
|
|
$ |
39,056 |
|
|
|
|
___________
(1)Includes distributions declared on Operating Partnership units.
(2)During the nine months ended September 30, 2025, we received cash flows from operating activities in the amount of $68.2 million.
Cash Flows
The following table provides a breakdown of the net change in our cash and cash equivalents ($ in thousands):
|
|
|
|
|
|
|
|
|
|
|
|
Nine Months Ended September 30, |
|
|
|
2025 |
|
|
2024 |
|
Cash flows provided by operating activities |
|
$ |
68,173 |
|
|
$ |
46,267 |
|
Cash flows used in investing activities |
|
|
(577,564 |
) |
|
|
(507,510 |
) |
Cash flows provided by financing activities |
|
|
480,683 |
|
|
|
508,319 |
|
Net decrease in cash and cash equivalents |
|
$ |
(28,708 |
) |
|
$ |
47,076 |
|
Cash flows provided by operating activities increased by approximately $21.9 million during the nine months ended September 30, 2025 compared to the nine months ended September 30, 2024 due to increased cash flows from income related to our investments in real estate and real estate debt.
Cash flows used in investing activities increased by approximately $70.1 million during the nine months ended September 30, 2025 compared to the nine months ended September 30, 2024. The increase is primarily due to a net increase of $154.0 million in acquisitions of real estate and
a net increase of $96.6 million of fundings related to investments in real estate debt. This was offset by a $180.5 million increase in repayments from our investments in real estate debt.
Cash flows provided by financing activities decreased by approximately $27.6 million during the nine months ended September 30, 2025 compared to the nine months ended September 30, 2024. The decrease is primarily driven by a $57.3 million net reduction in borrowing proceeds from our secured debt arrangements and increases of $18.2 million in cash distributions, $12.7 million in share repurchases, $1.9 million in payments for deferred financing costs and $1.2 million in payments for offering costs. This was offset by an increase of $58.3 million in borrowing proceeds from mortgage notes and a $5.5 million increase in proceeds from the issuance of our common stock.
Critical Accounting Policies
Our discussion and analysis of our financial condition and results of operations is based upon our condensed consolidated financial statements, which have been prepared in accordance with GAAP. There have been no material changes to our Critical Accounting Policies described in our Annual Report on Form 10-K for the year ended December 31, 2024 filed with the SEC on March 21, 2025.
Recent Accounting Pronouncements
See Note 2 - Summary of Significant Accounting Policies to our condensed consolidated financial statements in this Quarterly Report on Form 10-Q for a discussion concerning recent accounting pronouncements.
ITEM 3. QUANTITATIVE AND QUALITATIVE DISCLOSURES ABOUT MARKET RISK
Interest Rate Risk
Our investments in real estate debt and secured debt arrangements are primarily floating-rate and indexed to the Secured Overnight Financing Rate ("SOFR"), thereby exposing us to interest rate risk resulting in increases or decreases to net income depending on interest rate movements. As of September 30, 2025, we held $1.2 billion of investments in real estate debt, including real estate debt securities, and had outstanding borrowings of $271.4 million on our secured debt arrangements. While we cannot predict factors that may or may not affect interest rates, a 50 bps increase or decrease in SOFR would have resulted in an increase or decrease to income from investments in real estate debt of $1.3 million and $4.8 million for the three and nine months ended September 30, 2025, respectively, and an increase or decrease to interest expense of $0.3 million and $0.9 million for the three and nine months ended September 30, 2025, respectively.
We may be exposed to interest rate changes primarily as a result of long-term debt we may use to fund capital expenditures, repurchase shares of our common stock and expand our investment portfolio and operations. Market fluctuations in real estate financing may affect the availability and cost of funds needed to expand our investment portfolio. In addition, restrictions upon the availability of real estate financing or high interest rates for real estate loans could adversely affect our ability to dispose of real estate in the future. We will seek to limit the impact of interest rate changes on earnings and cash flows and to lower our overall borrowing costs. We may use derivative financial instruments to hedge exposures to changes in interest rates on loans secured by our assets.
Credit Risk
We are subject to varying degrees of credit risk in connection with our target assets. We seek to mitigate this risk by seeking to acquire high quality assets, at appropriate prices given anticipated and unanticipated losses, and by deploying a value-driven approach to underwriting and diligence, consistent with the Adviser's historical investment strategy, with a focus on current cash flows and potential risks to cash flow. The Adviser seeks to enhance its due diligence and underwriting efforts by accessing the Adviser's knowledge base and industry contacts. Nevertheless, unanticipated credit losses could occur, which could adversely impact our operating results.
Market Risk
Our investments in real estate debt are subject to volatility and may be affected adversely by a number of factors, including, but not limited to, national, regional and local economic conditions (which may be adversely affected by industry slowdowns and other factors); local real estate conditions; changes or continued weakness in specific industry segments; construction quality, age and design; demographic factors; retroactive changes to building or similar codes; pandemics; natural disasters and other acts of god. In addition, decreases in property values reduce the value of the collateral and the potential proceeds available to a borrower to repay the underlying loans or loans, as the case may be, which could also cause us to suffer losses.
ITEM 4. CONTROLS AND PROCEDURES
Evaluation of Disclosure Controls and Procedures
The Company maintains disclosure controls and procedures (as that term is defined in Rules 13a-15(e) and 15d-15(e) under the Exchange Act) that are designed to ensure that information required to be disclosed in the Company's reports under the Exchange Act is recorded, processed, and summarized and reported within the time periods specified in SEC rules and forms, and that such information is accumulated and communicated to the Company's management, including its Chief Executive Officer ("CEO") and Chief Financial Officer ("CFO"), as appropriate, to allow timely decisions regarding required disclosures. Any controls and procedures, no matter how well designed and operated, can provide only reasonable assurance of achieving the desired control objectives. An evaluation of the effectiveness of the design and operation of our disclosure controls and procedures as of the end of the period covered by this Quarterly Report on Form 10-Q was made under the supervision and with the participation of our management, including our CEO and CFO. Based upon this evaluation, our CEO and CFO have concluded that our disclosure controls and procedures (a) are effective to ensure that information required to be disclosed by us in reports filed or submitted under the Exchange Act is timely recorded, processed, summarized and reported and (b) include, without limitation, controls and procedures designed to ensure that information required to be disclosed by us in reports filed or submitted under the Exchange Act is accumulated and communicated to our management, including our CEO and CFO, as appropriate to allow timely decisions regarding required disclosure.
Changes in Internal Control over Financial Reporting
There have been no changes in our internal control over financial reporting (as that term is defined in Rule 13a-15(f) of the Exchange Act) that occurred during the period covered by this Quarterly Report on Form 10-Q that have materially affected, or are reasonably likely to materially affect, our internal control over financial reporting.
PART II. OTHER INFORMATION
ITEM 1. LEGAL PROCEEDINGS
From time to time, we may be involved in various claims and legal action arising in the ordinary course of business. As of September 30, 2025, we were not involved in any material legal proceedings.
ITEM 1A. RISK FACTORS
There have been no material changes to the risk factors previously disclosed under Part I, Item 1A. "Risk Factors" in our Annual Report on Form 10-K for the year ended December 31, 2024 filed with the SEC on March 21, 2025.
ITEM 2. UNREGISTERED SALES OF EQUITY SECURITIES AND USE OF PROCEEDS
Unregistered Sales of Equity Securities
During the three months ended September 30, 2025, we sold equity securities that were not registered under the Securities Act. As described in Note 11 - Related Party Transactions to our condensed consolidated financial statements, the Adviser is entitled to an annual management fee payable monthly in cash, shares of common stock, or Operating Partnership units, in each case at the Adviser's election. For the three months ended September 30, 2025, the Adviser elected to receive its management fee in Class E shares and Class E units. In connection with the Adviser's election, we issued 129,750 Class E shares and 13,939 Class E units to the Adviser during the three months ended September 30, 2025 in satisfaction of the management fee.
During the three months ended September 30, 2025, we issued 164 Class E shares to certain of Apollo's affiliates and employees in lieu of cash for the dividends paid for a total value of approximately $4 thousand. These issuances were made in reliance upon the exemption from the registration set forth in Section 4(a)(2) of the Securities Act.
During the three months ended September 30, 2025, all unitholders of the Operating Partnership elected to reinvest their dividends. In connection with such dividend reinvestment, we issued 73,257 and 2,984 Class A-I units and Class E units, respectively, to the unitholders of the Operating Partnership in lieu of cash for the dividends paid during the three months ended September 30, 2025. These issuances were made in reliance upon the exemption from registration set forth in Section 4(a)(2) of the Securities Act.
Share Repurchase Plan
We have adopted a share repurchase plan, whereby on a monthly basis, stockholders may request that we repurchase all or any portion of their shares. We may choose to repurchase all, some or none of the shares that have been requested to be repurchased at the end of any particular month, in our discretion, subject to any limitations in the share repurchase plan. The aggregate NAV of total repurchases of Class S shares, Class D shares, Class I shares, Class F-I shares, Class A-I shares, Class A-III shares and Class E shares is limited to 2% of the aggregate NAV per month and 5% of the aggregate NAV per calendar quarter. Shares are repurchased at a price equal to the transaction price on the applicable repurchase date. Due to the illiquid nature of investments in real estate, we may not have sufficient liquid resources to fund repurchase requests and have established limitations on the amount of funds we may use for repurchases during any calendar month and quarter. Further, our board of directors may modify or suspend the share repurchase plan.
During the three months ended September 30, 2025, we repurchased 272,532 Class A-III shares, 88,359 Class A-I shares, 27,402 Class F-I shares and 14,392 Class I shares pursuant to our share repurchase plan for $8.6 million. We did not repurchase any Class S shares, Class D shares or Class E shares. The "Liquidity and Capital Resources" section within Item 7. "Management's Discussion and Analysis of Financial Condition and Results of Operations" details our sources of capital used to pay such repurchases.
|
|
|
|
|
|
|
|
|
|
|
|
|
|
|
|
|
|
|
|
|
|
Month of |
|
Total Number of Shares Repurchased |
|
|
Average Price Paid per Share |
|
|
Total Number of Shares Repurchased as Part of Publicly Announced Plans or Programs |
|
|
Repurchases as Percentage of NAV(1) |
|
|
Maximum Number of Shares Pending Repurchase Pursuant to Publicly Announced Plans or Programs |
|
July 2025 |
|
|
61,003 |
|
|
|
21.25 |
|
|
|
61,003 |
|
|
|
0.10 |
% |
|
|
— |
|
August 2025 |
|
|
201,965 |
|
|
|
21.38 |
|
|
|
201,965 |
|
|
|
0.35 |
% |
|
|
— |
|
September 2025 |
|
|
139,718 |
|
|
|
21.43 |
|
|
|
139,718 |
|
|
|
0.23 |
% |
|
|
— |
|
Total |
|
|
402,685 |
|
|
|
21.38 |
|
|
|
402,685 |
|
|
|
0.69 |
% |
|
|
— |
|
____________
(1) Represents aggregate NAV of the shares repurchased under our share repurchase plan over aggregate NAV of all shares outstanding, in each case, based on the NAV as of the last calendar day of the prior month.
ITEM 3. DEFAULTS UPON SENIOR SECURITIES
None
ITEM 4. MINE SAFETY DISCLOSURES
Not applicable.
ITEM 5. OTHER INFORMATION
Not applicable.
ITEM 6. EXHIBITS
|
|
|
|
Exhibit Number |
|
Description |
3.1 |
|
Third Articles of Amendment and Restatement (incorporated by reference to Exhibit 3.1 to the Registrant's Current Report on Form 8-K filed on December 23, 2022) |
3.2 |
|
Articles Supplementary (incorporated by reference to Exhibit 3.1 to the Registrant's Current Report on Form 8-K filed on July 2, 2025) |
3.3 |
|
Amended and Restated Bylaws (incorporated by reference to Exhibit 3.2 to the Pre-Effective Amendment No. 1 to the Registrant's Registration Statement on Form S-11 as filed by the Registrant with the Securities and Exchange Commission on June 7, 2022) |
4.1 |
|
Second Amended and Restated Share Repurchase Plan (incorporated by reference to Exhibit 4.1 to the Registrant's Current Report on Form 8-K filed on July 2, 2025) |
4.2 |
|
Second Amended and Restated Distribution Reinvestment Plan (incorporated by reference to Exhibit 4.2 to the Registrant's Current Report on Form 8-K filed on July 2, 2025) |
4.3 |
|
Form of Subscription Agreement (incorporated by reference to Exhibit 4.3 to the Pre-Effective Amendment No. 1 to the Registrant's Registration Statement on Form S-11 as filed by the Registrant with the Securities and Exchange Commission on June 16, 2025) |
10.1 |
|
Fourth Amended and Restated Advisory Agreement (incorporated by reference to Exhibit 10.1 to the Registrant's Current Report on Form 8-K filed on July 2, 2025) |
10.2 |
|
Third Amended and Restated Limited Partnership Agreement (incorporated by reference to Exhibit 10.2 to the Registrant's Current Report on Form 8-K filed on July 2, 2025) |
31.1* |
|
Certification of Principal Executive Officer Pursuant to Rules 13a-14(a) and 15d-14(a) under the Securities Exchange Act of 1934, as Adopted Pursuant to Section 302 of the Sarbanes-Oxley Act of 2002 |
31.2* |
|
Certification of Principal Financial Officer Pursuant to Rules 13a-14(a) and 15d-14(a) under the Securities Exchange Act of 1934, as Adopted Pursuant to Section 302 of the Sarbanes-Oxley Act of 2002 |
32.1* |
|
Certification of Principal Executive Officer and Principal Financial Officer Pursuant to 18 U.S.C. Section 1350, as Adopted Pursuant to Section 906 of the Sarbanes-Oxley Act of 2002 |
101.INS* |
|
Inline XBRL Instance Document - the instance document does not appear in the Interactive Data File because its XBRL tags are embedded within the Inline XBRL document |
101.SCH* |
|
Inline XBRL Taxonomy Extension Schema With Embedded Linkbase Documents |
104* |
|
Cover Page Interactive Data File (embedded with the Inline XBRL document) |
|
|
|
* |
|
Filed herewith |
The agreements and other documents filed as exhibits to this report are not intended to provide factual information or other disclosure other than with respect to the terms of the agreements or other documents themselves, and you should not rely on them for that purpose. In particular, any representations and warranties made by us in these agreements or other documents were made solely within the specific context of the relevant agreement or document and may not describe the actual state of affairs as of the date they were made or at any other time.
SIGNATURES
Pursuant to the requirements of the Securities Exchange Act of 1934, the registrant has duly caused this report to be signed on
its behalf by the undersigned thereunto duly authorized.
|
|
|
|
|
|
|
Apollo Realty Income Solutions, Inc. |
|
|
|
|
November 6, 2025 |
|
By: |
/s/ Jess Lipsey |
|
|
|
Jess Lipsey |
|
|
|
President, Chief Executive Officer and Director |
|
|
|
(Principal Executive Officer) |
|
|
|
|
November 6, 2025 |
|
By: |
/s/ Anastasia Mironova |
|
|
|
Anastasia Mironova |
|
|
|
Chief Financial Officer, Treasurer and Secretary |
|
|
|
(Principal Financial Officer and Principal Accounting Officer) |
|
|
|
|