Please wait
0001886878falseIn the event that the Common Shares to which this relates are sold to or through underwriters or dealer managers, a corresponding supplement will disclose the applicable sale load and/or commission.You will pay brokerage charges if you direct your broker or the plan agent to sell your Common Shares that you acquired pursuant to a dividend reinvestment plan. You may also pay a pro rata share of brokerage commissions incurred in connection with open market purchase pursuant to the Fund’s Dividend Reinvestment Plan.The related supplement will disclose the estimated amount of offering expense, the offering price and the offering expenses borne by the Fund and indirectly by all of its Common Shareholders as a percentage of the offering price.Management fees include fees payable to the Investment Manager for advisory services and for supervisory, administrative and other services. The Fund pays for the advisory, supervisory and administrative services it requires under what is essentially an all-in fee structure (the “unified management fee”). Pursuant to an investment management agreement, PIMCO is paid a Management Fee of 1.25% of the Fund’s average daily total managed assets. The Fund (and not PIMCO) will be responsible for certain fees and expenses, which are reflected in the table above, that are not covered by the management fee under the investment management agreement. Please see Note 9, Fees and Expenses in the Notes to Financial Statements for an explanation of the unified management fee and definition of “total managed assets.”Reflects the Fund’s use of leverage in the form of reverse repurchase agreements averaged over the period ended June 30, 2025, which represented 39.75% of the Fund’s average total managed assets, including the assets attributable to leverage (or 65.96% of the Fund’s average net assets attributable to Common Shares), as of that date, at an annual interest rate cost to the Fund of 5.605%, which is the weighted average interest rate cost during the period ended June 30, 2025. See “Effects of Leverage.” The actual amount of interest expense borne by the Fund will vary over time in accordance with the level of the Fund’s use of reverse repurchase agreements, dollar rolls/buybacks and/or borrowings and variations in market interest rates. Borrowing expense is required to be treated as an expense of the Fund for accounting purposes. Any associated income or gains (or losses) realized from leverage obtained through such instruments is not reflected in the Annual Expenses table above, but would be reflected in the Fund’s performance results.“Other Expenses” are estimated for the Fund’s fiscal year ending June 30, 2026.“Interest Payments on Borrowed Funds” are borne by the Fund separately from management fees paid to PIMCO. Excluding these expenses, Total Annual Expenses are 2.09%.Such prices reflect inter-dealer prices, without retail mark-up, mark-down or commission and may not represent actual transactions.Performance quoted represents past performance. Past performance is not a guarantee or a reliable indicator of future results. Current performance may be lower or higher than performance shown. Investment return and the principal value of an investment will fluctuate. Returns shown do not reflect the deduction of taxes that a shareholder would pay on Fund distributions or the sale of Fund shares. Total return, market price, NAV, market price distribution rate, and NAV distribution rate will fluctuate with changes in market conditions. Performance current to the most recent month-end is available at www.pimco.com or via (844) 33-PIMCO. Performance is calculated assuming all dividends and distributions are reinvested at prices obtained under the Fund’s dividend reinvestment plan. Performance does not reflect any brokerage commissions in connection with the purchase or sale of Fund shares. Performance of an index is shown in light of a requirement by the Securities and Exchange Commission that the performance of an appropriate broad-based securities market index be disclosed. However, the Fund is not managed to an index nor should the index be viewed as a “benchmark” for the Fund’s performance. The index is not intended to be indicative of the Fund’s investment strategies, portfolio components or past or future performance. Please see Additional Information Regarding the Funds for a description of the Fund’s principal investment strategies.Distribution rates are not performance and are calculated by annualizing the most recent distribution per share and dividing by the NAV or Market Price, as applicable, as of the reported date. Distributions may be comprised of ordinary income, net capital gains, and/or a return of capital (ROC) of your investment in the Fund. Because the distribution rate may include a ROC, it should not be confused with yield or income. If the Fund estimates that a portion of its distribution may be comprised of amounts from sources other than net investment income in accordance with its policies and good accounting practices, the Fund will notify shareholders of the estimated composition of such distribution through a Section 19 Notice. Please refer to the most recent Section 19 Notice, if applicable, for additional information regarding the estimated composition of distributions. Please visit www.pimco.com for most recent Section 19 Notice, if applicable. Final determination of a distribution’s tax character will be provided to shareholders when such information is available. 0001886878 2024-07-01 2025-06-30 0001886878 2023-10-01 2023-12-31 0001886878 2023-07-01 2023-09-30 0001886878 2025-04-01 2025-06-30 0001886878 2025-01-01 2025-03-31 0001886878 2024-10-01 2024-12-31 0001886878 2024-07-01 2024-09-30 0001886878 2024-04-01 2024-06-30 0001886878 2024-01-01 2024-03-31 0001886878 2025-06-30 0001886878 cik0001886878:AntiTakeoverProvisionsMember 2024-07-01 2025-06-30 0001886878 cik0001886878:AssetAllocationRiskMember 2024-07-01 2025-06-30 0001886878 cik0001886878:AutonomousOrElectricVehicleRiskMember 2024-07-01 2025-06-30 0001886878 cik0001886878:CallRiskMember 2024-07-01 2025-06-30 0001886878 cik0001886878:CertainAffiliationsMember 2024-07-01 2025-06-30 0001886878 cik0001886878:CollateralizedBondObligationsCollateralizedLoanObligationsAndCollateralizedDebtObligationsRiskMember 2024-07-01 2025-06-30 0001886878 cik0001886878:CommoditiesRiskMember 2024-07-01 2025-06-30 0001886878 cik0001886878:ConfidentialInformationAccessRiskMember 2024-07-01 2025-06-30 0001886878 cik0001886878:ContingentConvertibleSecuritiesRiskMember 2024-07-01 2025-06-30 0001886878 cik0001886878:ConvertibleSecuritiesRiskMember 2024-07-01 2025-06-30 0001886878 cik0001886878:CorporateDebtSecuritiesRiskMember 2024-07-01 2025-06-30 0001886878 cik0001886878:EnergySectorRiskMember 2024-07-01 2025-06-30 0001886878 cik0001886878:CyberSecurityRiskMember 2024-07-01 2025-06-30 0001886878 cik0001886878:DebtSecuritiesRiskMember 2024-07-01 2025-06-30 0001886878 cik0001886878:DerivativesRiskMember 2024-07-01 2025-06-30 0001886878 cik0001886878:DistressedAndDefaultedSecuritiesRiskMember 2024-07-01 2025-06-30 0001886878 cik0001886878:DistributionRateRiskMember 2024-07-01 2025-06-30 0001886878 cik0001886878:EmergingMarketsRiskMember 2024-07-01 2025-06-30 0001886878 cik0001886878:CounterpartyRiskMember 2024-07-01 2025-06-30 0001886878 cik0001886878:CovenantLiteObligationsRiskMember 2024-07-01 2025-06-30 0001886878 cik0001886878:CreditDefaultSwapsRiskMember 2024-07-01 2025-06-30 0001886878 cik0001886878:CreditRiskOneMember 2024-07-01 2025-06-30 0001886878 cik0001886878:CsdrRelatedRiskMember 2024-07-01 2025-06-30 0001886878 cik0001886878:CurrencyRiskMember 2024-07-01 2025-06-30 0001886878 cik0001886878:IssuerRiskMember 2024-07-01 2025-06-30 0001886878 cik0001886878:LeverageRiskMember 2024-07-01 2025-06-30 0001886878 cik0001886878:LimitedTermRiskMember 2024-07-01 2025-06-30 0001886878 cik0001886878:LiquidityRiskMember 2024-07-01 2025-06-30 0001886878 cik0001886878:LoanOriginationRiskMember 2024-07-01 2025-06-30 0001886878 cik0001886878:LoansAndOtherIndebtednessLoanParticipationsAndAssignmentsRiskMember 2024-07-01 2025-06-30 0001886878 cik0001886878:ManagementRiskMember 2024-07-01 2025-06-30 0001886878 cik0001886878:MarketDiscountRiskMember 2024-07-01 2025-06-30 0001886878 cik0001886878:MarketDisruptionsRiskMember 2024-07-01 2025-06-30 0001886878 cik0001886878:MarketRiskMember 2024-07-01 2025-06-30 0001886878 cik0001886878:MortgageRelatedAndOtherAssetBackedInstrumentsRiskMember 2024-07-01 2025-06-30 0001886878 cik0001886878:RiskOfInvestingInChinaMember 2024-07-01 2025-06-30 0001886878 cik0001886878:RiskRetentionInvestmentRiskMember 2024-07-01 2025-06-30 0001886878 cik0001886878:SecuritiesLendingRiskMember 2024-07-01 2025-06-30 0001886878 cik0001886878:SeniorDebtRiskMember 2024-07-01 2025-06-30 0001886878 cik0001886878:ShortExposureRiskMember 2024-07-01 2025-06-30 0001886878 cik0001886878:SpecialPurposeAcquisitionCompaniesSpacsRiskMember 2024-07-01 2025-06-30 0001886878 cik0001886878:SmallerCompanyRiskMember 2024-07-01 2025-06-30 0001886878 cik0001886878:SovereignDebtRiskMember 2024-07-01 2025-06-30 0001886878 cik0001886878:MortgageRelatedDerivativeInstrumentsRiskMember 2024-07-01 2025-06-30 0001886878 cik0001886878:MunicipalBondRiskMember 2024-07-01 2025-06-30 0001886878 cik0001886878:NonDiversificationRiskMember 2024-07-01 2025-06-30 0001886878 cik0001886878:PlatformRiskMember 2024-07-01 2025-06-30 0001886878 cik0001886878:PortfolioTurnoverRiskMember 2024-07-01 2025-06-30 0001886878 cik0001886878:PotentialConflictsOfInterestRiskAllocationOfInvestmentOpportunitiesMember 2024-07-01 2025-06-30 0001886878 cik0001886878:PrivatelyIssuedMortgageRelatedSecuritiesRiskMember 2024-07-01 2025-06-30 0001886878 cik0001886878:RealEstateRiskMember 2024-07-01 2025-06-30 0001886878 cik0001886878:RegulationSSecuritiesRiskMember 2024-07-01 2025-06-30 0001886878 cik0001886878:OperationalRiskMember 2024-07-01 2025-06-30 0001886878 cik0001886878:OtherInvestmentCompaniesRiskMember 2024-07-01 2025-06-30 0001886878 cik0001886878:OtherPooledInvestmentVehiclesRiskMember 2024-07-01 2025-06-30 0001886878 cik0001886878:PreferredSecuritiesRiskMember 2024-07-01 2025-06-30 0001886878 cik0001886878:PrepaymentsRiskMember 2024-07-01 2025-06-30 0001886878 cik0001886878:PrivacyAndDataSecurityRiskMember 2024-07-01 2025-06-30 0001886878 cik0001886878:PrivateFundsRiskTaxRiskMember 2024-07-01 2025-06-30 0001886878 cik0001886878:PrivatePlacementsAndRestrictedSecuritiesRiskMember 2024-07-01 2025-06-30 0001886878 cik0001886878:PrivateRealEstateInvestmentsRiskMember 2024-07-01 2025-06-30 0001886878 cik0001886878:EquitySecuritiesAndRelatedMarketRiskMember 2024-07-01 2025-06-30 0001886878 cik0001886878:FocusedInvestmentRiskMember 2024-07-01 2025-06-30 0001886878 cik0001886878:ForeignNonUSGovernmentSecuritiesRiskMember 2024-07-01 2025-06-30 0001886878 cik0001886878:ForeignNonUSInvestmentRiskMember 2024-07-01 2025-06-30 0001886878 cik0001886878:ForeignLoanOriginationsRiskMember 2024-07-01 2025-06-30 0001886878 cik0001886878:HighYieldSecuritiesRiskMember 2024-07-01 2025-06-30 0001886878 cik0001886878:IndustrySpecificRisksMember 2024-07-01 2025-06-30 0001886878 cik0001886878:InflationDeflationRiskMember 2024-07-01 2025-06-30 0001886878 cik0001886878:InflationIndexedSecurityRiskMember 2024-07-01 2025-06-30 0001886878 cik0001886878:InsurancelinkedAndOtherInstrumentsRiskMember 2024-07-01 2025-06-30 0001886878 us-gaap:InterestRateRiskMember 2024-07-01 2025-06-30 0001886878 cik0001886878:RegulatoryChangesRiskMember 2024-07-01 2025-06-30 0001886878 cik0001886878:RegulatoryRiskCommodityPoolOperatorMember 2024-07-01 2025-06-30 0001886878 cik0001886878:ReinvestmentRiskMember 2024-07-01 2025-06-30 0001886878 cik0001886878:ReitRiskMember 2024-07-01 2025-06-30 0001886878 cik0001886878:StructuredInvestmentsRiskMember 2024-07-01 2025-06-30 0001886878 cik0001886878:SubprimeRiskMember 2024-07-01 2025-06-30 0001886878 cik0001886878:SubsidiaryRiskMember 2024-07-01 2025-06-30 0001886878 cik0001886878:SyntheticConvertibleSecuritiesRiskMember 2024-07-01 2025-06-30 0001886878 cik0001886878:TaxRiskMember 2024-07-01 2025-06-30 0001886878 cik0001886878:TotalReturnSwapRiskMember 2024-07-01 2025-06-30 0001886878 cik0001886878:USGovernmentSecuritiesRiskMember 2024-07-01 2025-06-30 0001886878 cik0001886878:ValuationRiskMember 2024-07-01 2025-06-30 0001886878 cik0001886878:ZeroCouponBondStepUpsAndPaymentInKindSecuritiesRiskMember 2024-07-01 2025-06-30 0001886878 cik0001886878:UseOfDerivativesMember 2024-07-01 2025-06-30 0001886878 cik0001886878:RepurchaseAgreementsRiskMember 2024-07-01 2025-06-30 0001886878 cik0001886878:RisksofDebtSecuritiesofMLPsMember 2024-07-01 2025-06-30 0001886878 cik0001886878:RisksofEquitySecuritiesofMLPsMember 2024-07-01 2025-06-30 0001886878 cik0001886878:RisksOfMlpSubordinatedUnitsMember 2024-07-01 2025-06-30 0001886878 cik0001886878:AffiliatedPartyRiskMember 2024-07-01 2025-06-30 0001886878 cik0001886878:LackOfDiversificationOfMlpCustomersAndSuppliersMember 2024-07-01 2025-06-30 0001886878 cik0001886878:MlpGeneralPartnerAndManagingMemberInterestsMember 2024-07-01 2025-06-30 0001886878 cik0001886878:RisksOfEtnsMember 2024-07-01 2025-06-30 0001886878 cik0001886878:CommonSharesMember 2024-07-01 2025-06-30 xbrli:pure iso4217:USD xbrli:shares iso4217:USD xbrli:shares
UNITED STATES
SECURITIES AND EXCHANGE COMMISSION
Washington, D.C. 20549
CERTIFIED SHAREHOLDER REPORT OF REGISTERED MANAGEMENT
INVESTMENT COMPANIES
Investment Company Act file number:
811-23749
PIMCO Access Income Fund
(Exact name of registrant as specified in charter)
1633 Broadway, New York, NY 10019
(Address of principal executive offices)
Bijal Y. Parikh
Treasurer (Principal Financial & Accounting Officer)
650 Newport Center Drive, Newport Beach, CA 92660
(Name and address of agent for service)
Copies to:
David C. Sullivan
Ropes & Gray LLP
Prudential Tower
800 Boylston Street
Boston, MA 02199
Registrant’s telephone number, including area code: (844) 337-4626
Date of fiscal year end: June 30
Date of reporting period: June 30, 2025
Form N-CSR is to be used by management investment companies to file reports with the Commission not later than 10 days after the transmission to stockholders of any report that is required to be transmitted to stockholders under Rule 30e-1 under the Investment Company Act of 1940 (17 CFR 270.30e-1). The Commission may use the information provided on Form N-CSR in its regulatory, disclosure review, inspection, and policymaking roles.
A registrant is required to disclose the information specified by Form N-CSR, and the Commission will make this information public. A registrant is not required to respond to the collection of information contained in Form N-CSR unless the Form displays a currently valid Office of Management and Budget (“OMB”) control number. Please direct comments concerning the accuracy of the information collection burden estimate and any suggestions for reducing the burden to Secretary, Securities and Exchange Commission, 100 F Street, NE, Washington, DC 20549-1090. The OMB has reviewed this collection of information under the clearance requirements of 44 U.S.C. § 3507.
Item 1. |
Reports to Stockholders. |
The following is a copy of the report transmitted to shareholders pursuant to Rule 30e-1 under the Investment Company Act of 1940, as amended (the “1940 Act”) (17 CFR 270.30e-1).
Annual Report
June 30, 2025
PCM Fund, Inc. | PCM | NYSE
PIMCO Global StocksPLUS
& Income Fund | PGP | NYSE
PIMCO Strategic Income Fund, Inc. | RCS | NYSE
PIMCO Access Income Fund | PAXS | NYSE
PIMCO Dynamic Income Fund | PDI | NYSE
PIMCO Dynamic Income Opportunities Fund | PDO | NYSE
PIMCO Dynamic Income Strategy Fund | PDX | NYSE
Table of Contents
|
|
|
|
|
|
|
|
| |
|
|
| |
| |
|
|
|
|
Page |
|
|
| |
|
|
| |
|
| |
|
|
| |
| |
|
|
|
| |
|
2 |
|
|
|
| |
| |
|
|
|
| |
|
19 |
|
|
|
| |
| |
|
|
|
| |
|
20 |
|
|
|
| |
| |
|
|
|
| |
|
22 |
|
|
|
| |
| |
|
|
|
| |
|
23 |
|
|
|
| |
| |
|
|
|
| |
|
24 |
|
|
|
| |
| |
|
|
|
| |
|
25 |
|
|
|
| |
| |
|
|
|
| |
|
26 |
|
|
|
| |
| |
|
|
|
| |
|
28 |
|
|
|
| |
| |
|
|
|
| |
|
30 |
|
|
|
| |
| |
|
|
|
| |
|
31 |
|
|
|
| |
| |
|
|
|
| |
|
127 |
|
|
|
| |
| |
|
|
|
| |
|
167 |
|
|
|
| |
| |
|
|
|
| |
|
168 |
|
|
|
| |
| |
|
|
|
| |
|
169 |
|
|
|
| |
| |
|
|
|
| |
|
171 |
|
|
|
| |
| |
|
|
|
| |
|
172 |
|
|
|
| |
| |
|
|
|
| |
|
174 |
|
|
|
| |
| |
|
|
|
| |
|
175 |
|
|
|
| |
| |
|
|
|
| |
|
177 |
|
|
|
| |
| |
|
|
|
| |
|
178 |
|
|
|
| |
| |
|
|
|
| |
|
215 |
|
|
|
| |
| |
|
|
|
| |
|
265 |
|
|
|
| |
| |
|
|
|
| |
|
266 |
|
|
|
| |
| |
|
|
|
| |
|
267 |
|
|
|
| |
| |
|
|
|
| |
|
273 |
|
|
|
| |
| |
|
|
|
| |
|
277 |
|
|
|
| |
| |
|
|
|
| |
|
284 |
|
|
| |
|
|
| |
|
| |
|
|
| |
| Fund |
|
Fund
Summary |
|
|
Schedule of
Investments |
|
|
| |
|
|
| |
|
| |
|
|
| |
| |
|
|
6 |
|
|
|
32 |
|
|
|
| |
| |
|
|
7 |
|
|
|
41 |
|
|
|
| |
| |
|
|
8 |
|
|
|
54 |
|
|
|
| |
| |
|
|
9 |
|
|
|
67 |
|
|
|
| |
| |
|
|
12 |
|
|
|
79 |
|
|
|
| |
| |
|
|
15 |
|
|
|
103 |
|
|
|
| |
| |
|
|
18 |
|
|
|
117 |
|
| |
|
Consolidated Schedule of Investments |
|
|
|
|
| |
Important Information About the Funds |
|
|
|
|
Information regarding each Fund’s principal investment strategies, principal risks and risk management strategies, the effects of each Fund’s leverage, and each Fund’s fundamental investment restrictions, including a summary of certain changes thereto during the most recent fiscal year, can be found within the relevant sections of this report. Please refer to the Table of Contents for further information.
We believe that bond funds have an important role to play in a well-diversified investment portfolio. It is important to note, however, that in an environment where interest rates may trend upward, rising rates would negatively impact the performance of most bond funds, and fixed-income securities and other instruments held by a Fund are likely to decrease in value. A wide variety of factors can cause interest rates or yields of U.S. Treasury securities (or yields of other types of bonds) to rise (e.g., central bank monetary policies, inflation rates, general economic conditions, etc.). In addition, changes in interest rates can be sudden and unpredictable, and there is no guarantee that Fund management will anticipate such movement accurately. A Fund may lose money as a result of movements in interest rates.
As of the date of this report, interest rates in the United States and many parts of the world, including certain European countries, remain high. In efforts to combat inflation, the U.S. Federal Reserve (the “Fed”) raised interest rates multiple times in 2022 and 2023. In September 2024, the Fed lowered interest rates for the first time since March 2020. It is uncertain whether rates will remain steady, increase or decrease in the future. As such, the Funds may face a heightened level of risk associated with changing interest rates and/or bond yields. This could be driven by a variety of factors, including but not limited to central bank monetary policies, changing inflation or real growth rates, general economic conditions, increasing bond issuances or reduced market demand for certain types of bonds or bonds generally. Further, while bond markets have steadily grown over the past three decades, dealer inventories of corporate bonds are near historic lows in relation to market size. As a result, there has been a significant reduction in the ability of dealers to “make markets”.
Bond funds and individual bonds with a longer duration (a measure used to determine the sensitivity of a security’s price to changes in interest rates) tend to be more sensitive to changes in interest rates, usually making them more volatile than funds or securities with shorter durations. All of the factors mentioned above, individually or collectively, could lead to increased volatility and/or lower liquidity in the fixed income markets, or negatively impact a Fund’s performance or cause a Fund to incur losses.
A Fund may enter into opposite sides of multiple interest rate swaps or other derivatives with respect to the same underlying reference instrument (e.g., a
10-year
U.S. treasury) that have different effective
dates with respect to interest accrual time periods also for the principal purpose of generating distributable gains (characterized as ordinary income for tax purposes) that are not part of a Fund’s duration or yield curve management strategies. In such a “paired swap transaction,” a Fund would generally enter into one or more interest rate swap agreements whereby a Fund agrees to make regular payments starting at the time the Fund enters into the agreements equal to a floating interest rate in return for payments equal to a fixed interest rate (the “initial leg”). A Fund would also enter into one or more interest rate swap agreements on the same underlying instrument, but take the opposite position (i.e., in this example, a Fund would make regular payments equal to a fixed interest rate in return for receiving payments equal to a floating interest rate) with respect to a contract whereby the payment obligations do not commence until a date following the commencement of the initial leg (the “forward leg”).
A Fund may engage in investment strategies, including those that employ the use of paired swaps transactions, the use of interest rate swaps to seek to capitalize on differences between short-term and long-term interest rates and other derivatives transactions, to, among other things, seek to generate current, distributable income, even if such strategies could potentially result in declines in a Fund’s net asset value (“NAV”). A Fund’s income and gain-generating strategies, including certain derivatives strategies, may generate current income and gains taxable as ordinary income sufficient to support monthly distributions even in situations when a Fund has experienced a decline in net assets due to, for example, adverse changes in the broad U.S. or non-U.S. equity markets or a Fund’s debt investments, or arising from its use of derivatives. For instance, a portion of a Fund’s monthly distributions may be sourced from paired swap transactions utilized to produce current distributable ordinary income for tax purposes on the initial leg, with a substantial possibility that a Fund will later realize a corresponding capital loss and potential decline in its NAV with respect to the forward leg (to the extent there are not corresponding offsetting capital gains being generated from other sources). Because some or all of these transactions may generate capital losses without corresponding offsetting capital gains, portions of a Fund’s distributions recognized as ordinary income for tax purposes (such as from paired swap transactions, for example) may be economically similar to a taxable return of capital when considered together with such capital losses. More generally, sales of a Fund’s portfolio holdings may result in short-term capital gains (which are generally taxed to shareholders at ordinary income tax rates when distributed net of short-term capital losses and net of long-term capital losses), potentially subjecting shareholders of a Fund to adverse tax consequences.
Classifications of the Funds’ portfolio holdings in this report are made according to financial reporting standards. The classification of a
particular portfolio holding as shown in the Allocation Breakdown and Schedule of Investments or Consolidated Schedule of Investments sections of this report may differ from the classification used for the Funds’ compliance calculations, including those used in the Funds’ then-current prospectus, investment objectives, regulatory and other investment limitations and policies, which may be based on different asset class, sector or geographical classifications. Each Fund is separately monitored for compliance with respect to investment parameters and regulatory requirements.
The geographical classification of foreign
(non-U.S.)
securities in this report, if any, are classified by the country of incorporation of a holding. In certain instances, a security’s country of incorporation may be different from its country of economic exposure.
In February 2022, Russia launched an invasion of Ukraine. As a result, Russia and other countries, persons and entities that provided material aid to Russia’s aggression against Ukraine, have been the subject of economic sanctions and import and export controls imposed by countries throughout the world, including the United States. Such measures, including the United States’ enforcement of sanctions or other similar measures on various Russian entities and persons, and the Russian government’s response, have had and may continue to have an adverse effect on the Russian, Belarusian and other securities, instruments and economies, which may, in turn, negatively impact a Fund. The extent, duration and impact of Russia’s military action in Ukraine, related sanctions and retaliatory actions are difficult to ascertain, but could be significant and have severe adverse effects on the region, including significant adverse effects on the regional, European and global economies and the markets for certain securities and commodities, such as oil and natural gas, as well as other sectors. Further, a Fund may have investments in securities and instruments that are economically tied to the region and may have been negatively impacted by the sanctions and counter-sanctions by Russia, including declines in value and reductions in liquidity. The sanctions may cause a Fund to sell portfolio holdings at a disadvantageous time or price or to continue to hold investments that a Fund may no longer seek to hold.
The United States’ enforcement of restrictions on U.S. investments in certain issuers and tariffs on goods from certain other countries has contributed to and may continue to contribute to international trade tensions and may impact portfolio securities. The U.S. government has indicated an intent to alter its approach to international trade policy, including in some cases renegotiating, modifying or terminating certain bilateral or multi-lateral trade arrangements with foreign countries, and it has proposed to take and/or taken related actions, including the imposition of or stated potential imposition of a broad range of tariffs. The imposition of tariffs, trade restrictions, currency restrictions or similar actions (or retaliatory measures taken in response) could lead
to, for example, price volatility, reduced market sentiment, and changes in inflation expectations. These and other geopolitical events may contribute to increased instability in the U.S. and global economies and markets, which may have an adverse effect on the performance of the Funds and their investments.
The common shares of the Funds trade on the New York Stock Exchange. As with any stock, the price of a Fund’s common shares will fluctuate with market conditions and other factors. If you sell your common shares of a Fund, the price received may be more or less than your original investment. Shares of closed-end management investment companies, such as the Funds, frequently trade at a discount from their NAV and may trade at a price that is less than the initial offering price and/or the NAV of such shares. Further, if a Fund’s shares trade at a price that is more than the initial offering price and/or the NAV of such shares, including at a substantial premium and/or for an extended period of time, there is no assurance that any such premium will be sustained for any period of time and will not decrease, or that the shares will not trade at a discount to NAV thereafter.
U.S. and global markets have experienced increased volatility, including as a result of the failures of certain U.S. and non-U.S. banks in 2023, which could be harmful to the Funds and issuers in which they invest. For example, if a bank at which a Fund or issuer has an account fails, any cash or other assets in bank or custody accounts, which may be substantial in size, could be temporarily inaccessible or permanently lost by the Fund or issuer. If a bank that provides a subscription line credit facility, asset-based facility, other credit facility and/or other services to an issuer or to a fund fails, the issuer or fund could be unable to draw funds under its credit facilities or obtain replacement credit facilities or other services from other lending institutions with similar terms.
Issuers in which a Fund may invest can be affected by volatility in the banking sector. Even if banks used by issuers in which the Funds invest remain solvent, volatility in the banking sector could contribute to, cause or intensify an economic recession, increase the costs of capital and banking services or result in the issuers being unable to obtain or refinance indebtedness at all or on as favorable terms as could otherwise have been obtained. Potential impacts to funds and issuers resulting from changes in the banking sector, market conditions and potential legislative or regulatory responses are uncertain. Such conditions and responses, as well as a changing interest rate environment, can contribute to decreased market liquidity and erode the value of certain holdings, including those of U.S. and non-U.S. banks. Continued market volatility and uncertainty and/or a downturn in market and economic and financial conditions, as a result of developments in the banking sector or otherwise (including as a result of delayed access to cash or credit facilities), could have an adverse impact on the Funds and issuers in which they invest.
|
|
|
|
|
|
|
|
|
|
|
|
| |
| |
|
|
ANNUAL REPORT |
|
|
| |
|
|
JUNE 30, 2025 |
|
|
3 |
|
|
|
|
| |
Important Information About the Funds |
|
|
|
|
On each Fund Summary page in this Shareholder Report, the Average Annual Total Return table and Cumulative Returns chart measure performance assuming that any dividend and capital gain distributions were reinvested. Total return is calculated by determining the percentage change in NAV or market price (as applicable) in the specified period. Returns do not reflect the deduction of taxes that a shareholder would pay on (i) Fund distributions or (ii) the sale of Fund shares. Total return for a period of more than one year represents the average annual total return. Performance at market price will differ from results at NAV. Although market price returns tend to reflect investment results over time, during shorter periods returns at market price can also be influenced by factors such as changing views about a Fund, market conditions, supply and demand for the Fund’s shares, or changes in the Fund’s dividends. Performance shown is net of fees and expenses. Historical NAV performance for a Fund may have been positively impacted by fee waivers or expense limitations in place during some or all of the periods shown, if applicable. Future performance (including total return or yield) and distributions may be negatively impacted by the expiration or reduction of any such fee waivers or expense limitations.
The dividend rate that a Fund pays on its common shares may vary as portfolio and market conditions change, and will depend on a number of factors, including without limit the amount of a Fund’s undistributed net investment income and net short- and long-term capital gains, as well as the costs of any leverage obtained by a Fund. As portfolio and market conditions change, the rate of distributions on the common shares and a Fund’s dividend policy could change. There can be no assurance that a change in market conditions or other factors will not result in a change in a Fund’s distribution rate or that the rate will be sustainable in the future.
The following table discloses the inception date and diversification status of each Fund:
|
|
|
|
|
|
|
|
|
|
|
|
| |
|
|
|
| |
|
|
|
|
|
|
|
|
|
|
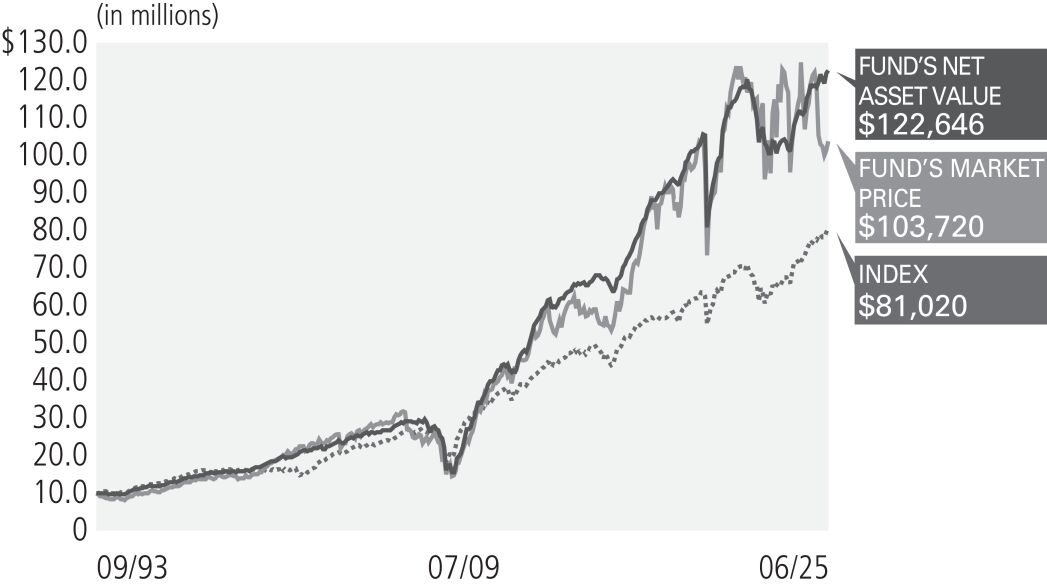
| PCM Fund, Inc. |
|
|
|
| |
|
09/02/93 |
|
|
|
Diversified |
|
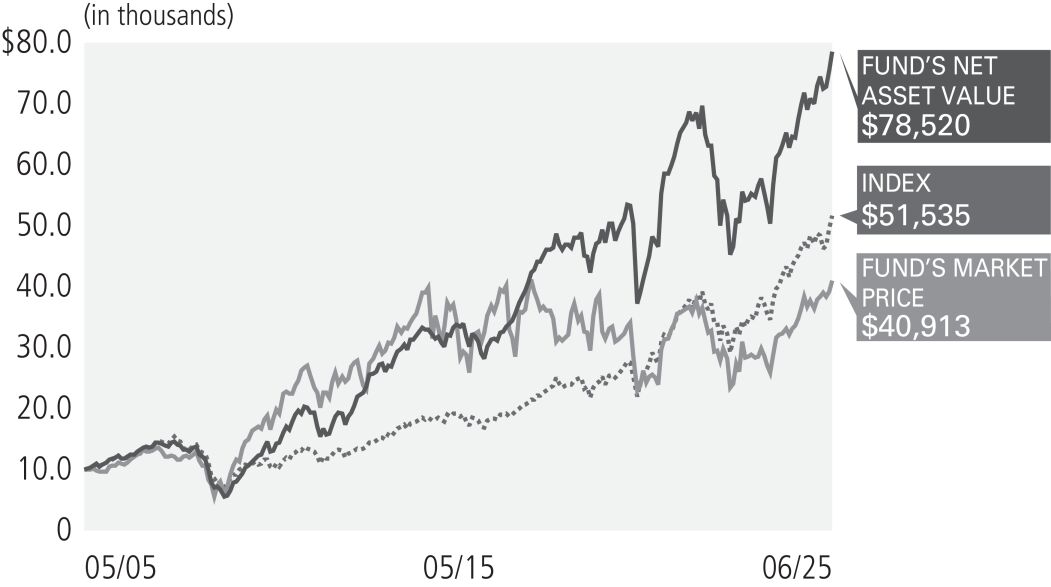
PIMCO Global StocksPLUS & Income Fund |
|
|
|
| |
|
05/31/05 |
|
|
|
Diversified |
|
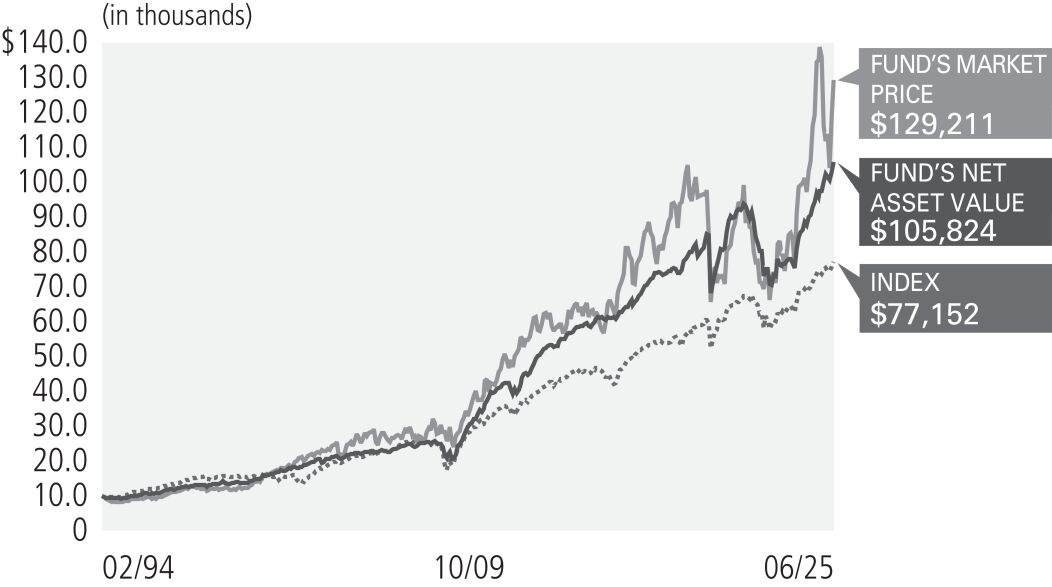
| PIMCO Strategic Income Fund, Inc. |
|
|
|
| |
|
02/24/94 |
|
|
|
Diversified |
|
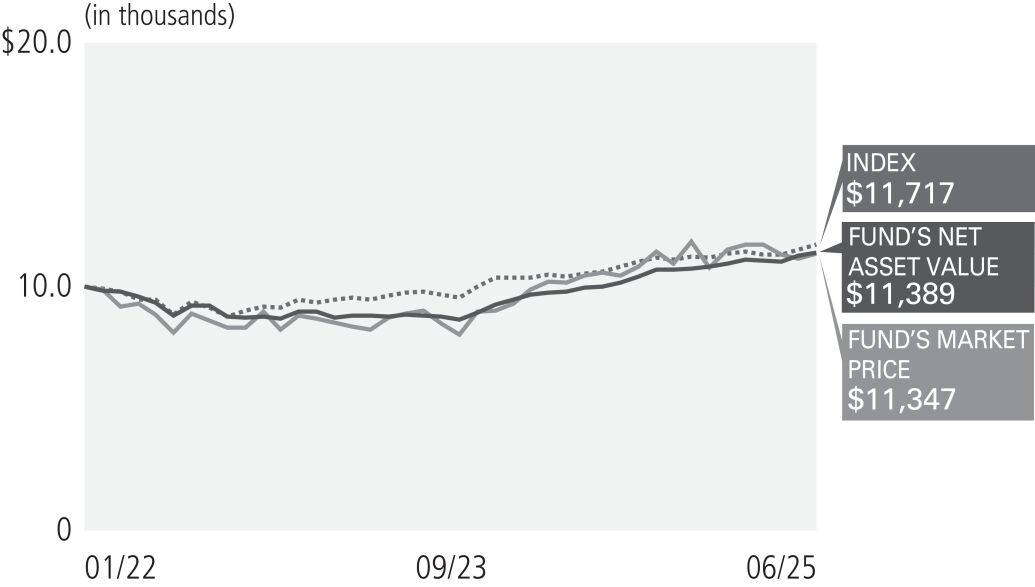
| PIMCO Access Income Fund |
|
|
|
| |
|
01/31/22 |
|
|
|
Diversified |
|
| PIMCO Dynamic Income Fund |
|
|
|
| |
|
05/30/12 |
|
|
|
Diversified |
|
| PIMCO Dynamic Income Opportunities Fund |
|
|
|
| |
|
01/29/21 |
|
|
|
Diversified |
|
| PIMCO Dynamic Income Strategy Fund |
|
|
|
| |
|
02/01/19 |
|
|
|
Non-Diversified |
|
An investment in a Fund is not a bank deposit and is not guaranteed or insured by the Federal Deposit Insurance Corporation or any other government agency. It is possible to lose money on investments in a Fund.
The Trustees/Directors
1
are responsible generally for overseeing the management of the Funds. The Trustees authorize the Funds to enter into service agreements with Pacific Investment Management Company LLC (“PIMCO”) and other service providers in order to provide, and in some cases authorize service providers to procure through other parties, necessary or desirable services on behalf of the Funds. Shareholders are not parties to or third-party beneficiaries of such service agreements. Neither a Fund’s prospectus original or any subsequent or Statement of Additional Information (“SAI”), any press release or shareholder report, any contracts filed as exhibits to a Fund’s registration statement, nor any other communications, disclosure documents or regulatory filings (including this report) from or on behalf of a Fund creates a contract between or among any shareholders of a Fund, on the one hand, and the Fund, a service provider to the Fund, and/or the Trustees or officers of the Fund, on the other hand.
The Trustees (or the Funds and their officers, service providers or other delegates acting under authority of the Trustees) may amend its most recent prospectus or use a new prospectus or SAI with respect to a Fund, adopt and disclose new or amended policies and other changes in press releases and shareholder reports and/or amend, file and/or issue any other communications, disclosure documents or regulatory filings, and may amend or enter into any contracts to which a Fund is a party, and interpret the investment objective(s), policies, restrictions and contractual provisions applicable to any Fund, without shareholder input or approval, except in circumstances in which shareholder approval is specifically required by law (such as changes to fundamental investment policies) or where a shareholder approval requirement is specifically disclosed in a Fund’s then-current prospectus, SAI or shareholder report and is otherwise still in effect.
PIMCO has adopted written proxy voting policies and procedures (“Proxy Policy”) as required by Rule
206(4)-6
under the Investment Advisers Act of 1940, as amended. The Proxy Policy has been adopted by the Funds as the policies and procedures that PIMCO will use when voting proxies on behalf of the Funds. A description of the policies and procedures that PIMCO uses to vote proxies relating to portfolio securities of each Fund, and information about how each Fund voted proxies relating to portfolio securities held during the most recent twelve-month period ended June 30, are available without charge, upon request, by calling the Funds at (844)
33-PIMCO,
on the Funds’ website at www.pimco.com, and on the Securities and Exchange Commission’s (“SEC”) website at www.sec.gov.
The Funds file their complete schedules of portfolio holdings with the SEC for the first and third quarters of each fiscal year as an exhibit to
|
Hereinafter, the terms “Trustee” or “Trustees” used herein shall refer to a Director or Directors of applicable Funds. |
their reports on Form N-PORT. The Funds’ Form N-PORT reports are available to the public on the SEC’s website at www.sec.gov and on PIMCO’s website at www.pimco.com, and upon request by calling PIMCO at (844) 33-PIMCO. In August 2024, the SEC adopted amendments to Form N-PORT requiring funds to file
Form N-PORT
reports on a monthly basis and within 30 days of month end, with each report being made public 60 days after month end. On April 16, 2025, the SEC extended the compliance date for Form N-PORT amendments and fund groups with $1 billion or more in net assets will be required to comply with the amendments for reports filed on or after November 17, 2027.
SEC rules allow the Funds to fulfill their obligation to deliver shareholder reports to investors by providing access to such reports online free of charge and by mailing a notice that the report is electronically available. Investors may elect to receive all future reports in paper free of charge by contacting their financial intermediary or, if invested directly with a Fund, investors can inform the Fund by calling (844) 33-PIMCO. Any election to receive reports in paper will apply to all funds held with the fund complex if invested directly with a Fund or to all funds held in the investor’s account if invested through a financial intermediary. Paper copies of the Funds’ shareholder reports are required to be provided free of charge by the Fund or financial intermediary upon request.
In September 2023, the SEC adopted amendments to Rule 35d-1 under the Investment Company Act of 1940, as amended, the rule governing fund naming conventions (the “Names Rule”). In general, the Names Rule requires funds with certain types of names to adopt a policy to invest at least 80% of their assets in the type of investment suggested by the name. The amendments expand the scope of the current rule to include any term used in a fund name that suggests the fund makes investments that have, or whose issuers have, particular characteristics. Additionally, the amendments modify the circumstances under which a fund may deviate from its 80% investment policy and address the calculation methodology of derivatives instruments for purposes of the rule. Changes to a fund’s calculation methodology for derivatives instruments for purposes of Rule 35d-1 consistent with such amendments and applicable regulatory interpretations thereof will not constitute a change to a fund’s policy adopted pursuant to Rule 35d-1 and will not require notice or shareholder approval. The amendments became effective on December 11, 2023. On March 14, 2025, the SEC extended the compliance date from December 11, 2025 to June 11, 2026 for fund groups with $1 billion or more in net assets and modified the operation of the compliance dates to allow for compliance based on the timing of certain annual disclosure and reporting obligations that are tied to a fund’s fiscal year-end.
|
|
|
|
|
|
|
|
|
|
|
|
| |
| |
|
|
ANNUAL REPORT |
|
|
| |
|
|
JUNE 30, 2025 |
|
|
5 |
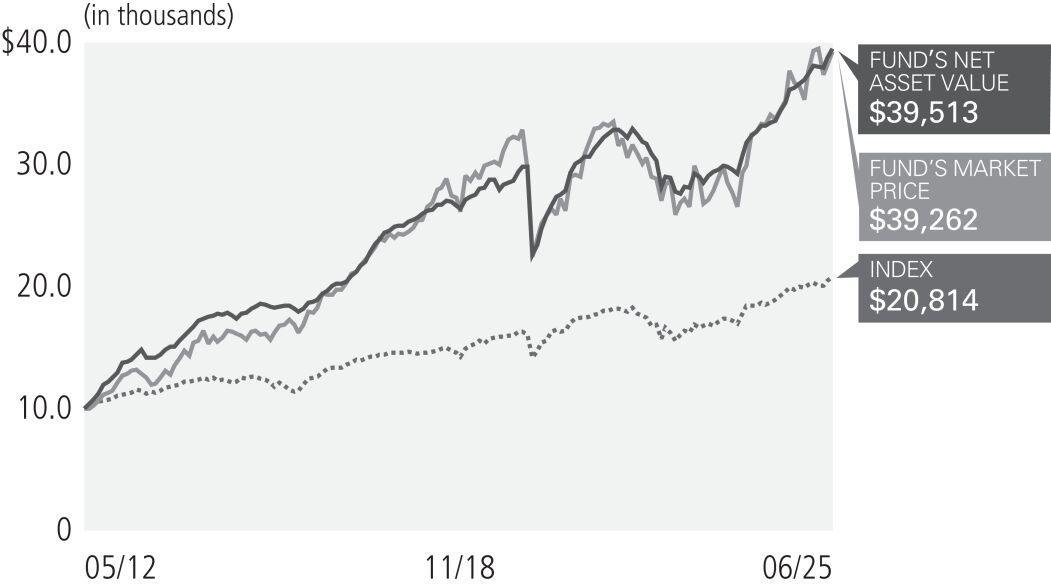
Cumulative Returns Through June 30, 2025
$10,000 invested at the end of the month when the Fund commenced operations.
Allocation Breakdown as of June 30, 2025
|
|
|
|
|
|
|
|
| |
| Asset-Backed Securities |
|
|
29.7% |
|
|
|
| |
|
|
| |
Non-Agency Mortgage-Backed Securities |
|
|
24.6% |
|
|
|
| |
|
|
| |
| Corporate Bonds & Notes |
|
|
14.1% |
|
|
|
| |
|
|
| |
| Loan Participations and Assignments |
|
|
13.5% |
|
|
|
| |
|
|
| |
| |
|
|
6.9% |
|
|
|
| |
|
|
| |
| Common Stocks |
|
|
5.8% |
|
|
|
| |
|
|
| |
| U.S. Government Agencies |
|
|
4.0% |
|
|
|
| |
|
|
| |
| Other |
|
|
1.4% |
|
|
|
|
|
| |
|
% of Investments, at value. |
| |
|
Allocation Breakdown and % of investments exclude securities sold short and financial derivative instruments, if any. |
| |
|
Includes Central Funds Used for Cash Management Purposes. |
|
|
|
|
|
|
|
|
|
|
|
|
|
|
|
|
|
|
| |
|
Average Annual Total Return (1) for the period ended June 30, 2025 |
|
|
|
|
|
|
| |
| |
|
|
|
|
|
|
5 Year |
|
|
10 Year |
|
|
Commencement
of Operations
(09/02/93) |
|

|
|
Market Price |
|
|
(3.21)% |
|
|
|
2.99% |
|
|
|
6.25% |
|
|
|
7.63% |
|

|
|
NAV |
|
|
10.06% |
|
|
|
5.82% |
|
|
|
6.05% |
|
|
|
8.20% |
|

|
|
ICE BofA US High Yield Index |
|
|
10.24% |
|
|
|
6.01% |
|
|
|
5.29% |
|
|
|
|
|
All Fund returns are net of fees and expenses and include applicable fee waivers and/or expense limitations. Absent any applicable fee waivers and/or expense limitations, performance would have been lower and there can be no assurance that any such waivers or limitations will continue in the future.
Average Annual Return since 08/31/1993.
It is not possible to invest directly in an unmanaged index.
|
Performance quoted represents past performance. Past performance is not a guarantee or a reliable indicator of future results. Current performance may be lower or higher than performance shown. Investment return and the principal value of an investment will fluctuate. Returns shown do not reflect the deduction of taxes that a shareholder would pay on Fund distributions or the sale of Fund shares. Total return, market price, NAV, market price distribution rate, and NAV distribution rate will fluctuate with changes in market conditions. The NAV presented may differ from the NAV reported for the same period in other Fund materials. Performance current to the most recent month-end is available at www.pimco.com or via (844) 33-PIMCO. Performance is calculated assuming all dividends and distributions are reinvested at prices obtained under the Fund’s dividend reinvestment plan. Performance does not reflect any brokerage commissions in connection with the purchase or sale of Fund shares. |
|
Performance of an index is shown in light of a requirement by the Securities and Exchange Commission that the performance of an appropriate broad-based securities market index be disclosed. However, the Fund is not managed to an index nor should the index be viewed as a “benchmark” for the Fund’s performance. The index is not intended to be indicative of the Fund’s investment strategies, portfolio components or past or future performance. Please see Additional Information Regarding the Funds for a description of the Fund’s principal investment strategies. |
|
Distribution rates are not performance and are calculated by annualizing the most recent distribution per share and dividing by the NAV or Market Price, as applicable, as of the reported date. Distributions may be comprised of ordinary income, net capital gains, and/or a return of capital (ROC) of your investment in the Fund. Because the distribution rate may include a ROC, it should not be confused with yield or income. If the Fund estimates that a portion of its distribution may be comprised of amounts from sources other than net investment income in accordance with its policies and good accounting practices, the Fund will notify shareholders of the estimated composition of such distribution through a Section 19 Notice. Please refer to the most recent Section 19 Notice, if applicable, for additional information regarding the estimated composition of distributions. Please visit www.pimco.com for most recent Section 19 Notice, if applicable. Final determination of a distribution’s tax character will be provided to shareholders when such information is available. |
|
Represents total effective leverage outstanding, as a percentage of total managed assets. Total effective leverage consists of preferred shares, reverse repurchase agreements and other borrowings, credit default swap notional and floating rate notes issued in tender option bond transactions, as applicable (collectively “Total Effective Leverage”). The Fund may engage in other transactions not included in Total Effective Leverage disclosed above that may give rise to a form of leverage, including certain derivative transactions. For the purpose of calculating Total Effective Leverage outstanding as a percentage of total managed assets, total managed assets refer to total assets (including assets attributable to Total Effective Leverage that may be outstanding) minus accrued liabilities (other than liabilities representing Total Effective Leverage). |
Fund Information (as of June 30, 2025)
(
¹
)
|
|
|
|
| |
| Market Price |
|
|
$6.33 |
|
|
| |
| NAV |
|
|
$5.99 |
|
|
| |
| Premium/(Discount) to NAV |
|
|
5.68% |
|
|
| |
Market Price Distribution Rate (2) |
|
|
12.18% |
|
|
| |
| |
|
|
12.87% |
|
|
| |
Total Effective Leverage (3) |
|
|
34.50% |
|
Investment Objective and Strategy Overview
The Fund’s primary investment objective is to achieve high current income. Capital gain from the disposition of investments is a secondary objective of the Fund.
Fund Insights at NAV
The following affected performance (on a gross basis) during the reporting period:
| » |
|
Exposure to the residential mortgage credit sector contributed to performance, as the sector posted positive performance. |
| » |
|
Holdings related to corporate special situation investments, which include companies undergoing stress, distress, challenges or significant transition, contributed to performance, as the securities posted positive returns. |
| » |
|
Exposure to the commercial mortgage credit sector contributed to performance, as the sector posted positive performance. |
| » |
|
Exposure to corporate credit, notably high yield credit and bank loans, contributed to performance, as the asset classes posted positive returns. |
| » |
|
The costs associated with one or more forms of leverage detracted from performance. That said, the net impact on the Fund’s performance of the cost of leverage is generally determined by comparing the return on the additional investments purchased with such leverage against the cost of such leverage. |
| » |
|
Exposure to asset backed securities detracted from performance, as select student and auto loans posted negative performance. |
| » |
|
There were no other material detractors for this Fund. |
PIMCO Global StocksPLUS
& Income Fund
Cumulative Returns Through June 30, 2025
$10,000 invested at the end of the month when the Fund commenced operations.
Allocation Breakdown as of June 30, 2025
|
|
|
|
| |
| U.S. Government Agencies |
|
|
28.4% |
|
|
| |
| Corporate Bonds & Notes |
|
|
23.1% |
|
|
| |
| Loan Participations and Assignments |
|
|
16.6% |
|
|
| |
Non-Agency Mortgage-Backed Securities |
|
|
7.2% |
|
|
| |
| |
|
|
7.2% |
|
|
| |
| Common Stocks |
|
|
5.9% |
|
|
| |
| Sovereign Issues |
|
|
4.5% |
|
|
| |
| Asset-Backed Securities |
|
|
3.8% |
|
|
| |
| Preferred Securities |
|
|
1.5% |
|
|
| |
| Municipal Bonds & Notes |
|
|
1.2% |
|
|
| |
| Other |
|
|
0.6% |
|
| |
|
% of Investments, at value. |
| |
|
Allocation Breakdown and % of investments exclude securities sold short and financial derivative instruments, if any. |
| |
|
Includes Central Funds Used for Cash Management Purposes. |
|
|
|
|
|
|
|
|
|
|
|
|
|
|
|
|
|
|
| |
|
Average Annual Total Return (1) for the period ended June 30, 2025 |
|
|
|
|
|
|
| |
| |
|
|
|
1 Year |
|
|
5 Year |
|
|
10 Year |
|
|
Commencement
of Operations
(05/31/05) |
|
|
|
|
Market Price |
|
|
21.99% |
|
|
|
10.99% |
|
|
|
3.71% |
|
|
|
7.27% |
|
|
|
|
NAV |
|
|
21.79% |
|
|
|
12.78% |
|
|
|
8.91% |
|
|
|
10.81% |
|
|
|
|
MSCI World Index |
|
|
16.26% |
|
|
|
14.55% |
|
|
|
10.66% |
|
|
|
8.50% |
|
All Fund returns are net of fees and expenses and include applicable fee waivers and/or expense limitations. Absent any applicable fee waivers and/or expense limitations, performance would have been lower and there can be no assurance that any such waivers or limitations will continue in the future.
It is not possible to invest directly in an unmanaged index.
|
Performance quoted represents past performance. Past performance is not a guarantee or a reliable indicator of future results. Current performance may be lower or higher than performance shown. Investment return and the principal value of an investment will fluctuate. Returns shown do not reflect the deduction of taxes that a shareholder would pay on Fund distributions or the sale of Fund shares. Total return, market price, NAV, market price distribution rate, and NAV distribution rate will fluctuate with changes in market conditions. The NAV presented may differ from the NAV reported for the same period in other Fund materials. Performance current to the most recent month-end is available at www.pimco.com or via (844) 33-PIMCO. Performance is calculated assuming all dividends and distributions are reinvested at prices obtained under the Fund’s dividend reinvestment plan. Performance does not reflect any brokerage commissions in connection with the purchase or sale of Fund shares. |
|
Performance of an index is shown in light of a requirement by the Securities and Exchange Commission that the performance of an appropriate broad-based securities market index be disclosed. However, the Fund is not managed to an index nor should the index be viewed as a “benchmark” for the Fund’s performance. The index is not intended to be indicative of the Fund’s investment strategies, portfolio components or past or future performance. Please see Additional Information Regarding the Funds for a description of the Fund’s principal investment strategies. |
|
Distribution rates are not performance and are calculated by annualizing the most recent distribution per share and dividing by the NAV or Market Price, as applicable, as of the reported date. Distributions may be comprised of ordinary income, net capital gains, and/or a return of capital (ROC) of your investment in the Fund. Because the distribution rate may include a ROC, it should not be confused with yield or income. If the Fund estimates that a portion of its distribution may be comprised of amounts from sources other than net investment income in accordance with its policies and good accounting practices, the Fund will notify shareholders of the estimated composition of such distribution through a Section 19 Notice. Please refer to the most recent Section 19 Notice, if applicable, for additional information regarding the estimated composition of distributions. Please visit www.pimco.com for most recent Section 19 Notice, if applicable. Final determination of a distribution’s tax character will be provided to shareholders when such information is available. |
|
Represents total effective leverage outstanding, as a percentage of total managed assets. Total effective leverage consists of preferred shares, reverse repurchase agreements and other borrowings, credit default swap notional and floating rate notes issued in tender option bond transactions, as applicable (collectively “Total Effective Leverage”). The Fund may engage in other transactions not included in Total Effective Leverage disclosed above that may give rise to a form of leverage, including certain derivative transactions. For the purpose of calculating Total Effective Leverage outstanding as a percentage of total managed assets, total managed assets refer to total assets (including assets attributable to Total Effective Leverage that may be outstanding) minus accrued liabilities (other than liabilities representing Total Effective Leverage). |
Fund Information (as of June 30, 2025)
(1)
|
|
|
|
| |
| Market Price |
|
|
$8.29 |
|
|
| |
| NAV |
|
|
$8.14 |
|
|
| |
| Premium/(Discount) to NAV |
|
|
1.84% |
|
|
| |
Market Price Distribution Rate (2) |
|
|
9.99% |
|
|
| |
| |
|
|
10.17% |
|
|
| |
Total Effective Leverage (3) |
|
|
18.60% |
|
Investment Objective and Strategy Overview
PIMCO Global StocksPLUS
& Income Fund’s investment objective is to seek total return comprised of current income, current gains and long-term capital appreciation.
Fund Insights at NAV
The following affected performance (on a gross basis) during the reporting period:
| » |
|
Exposure to global equities contributed to performance, as the asset class posted positive returns. |
| » |
|
Holdings related to corporate special situation investments, which include companies undergoing stress, distress, challenges or significant transition, contributed to performance, as the securities posted positive returns. |
| » |
|
Exposure to emerging market debt contributed to performance, as spreads tightened. |
| » |
|
Exposure to corporate credit, notably high yield credit and bank loans, contributed to performance, as the asset classes posted positive returns. |
| » |
|
The costs associated with one or more forms of leverage detracted from performance. That said, the net impact on the Fund’s performance of the cost of leverage is generally determined by comparing the return on the additional investments purchased with such leverage against the cost of such leverage. |
| » |
|
There were no other material detractors for this Fund. |
|
|
|
|
|
|
|
|
|
|
|
|
| |
| |
|
|
ANNUAL REPORT |
|
|
| |
|
|
JUNE 30, 2025 |
|
|
7 |
PIMCO Strategic Income Fund, Inc.
Cumulative Returns Through June 30, 2025
$10,000 invested at the end of the month when the Fund commenced operations.
Allocation Breakdown as of June 30, 2025
|
|
|
|
| |
| U.S. Government Agencies |
|
|
57.0% |
|
|
| |
| Corporate Bonds & Notes |
|
|
17.2% |
|
|
| |
Non-Agency Mortgage-Backed Securities |
|
|
7.5% |
|
|
| |
| Loan Participations and Assignments |
|
|
6.9% |
|
|
| |
| Common Stocks |
|
|
3.4% |
|
|
| |
| Sovereign Issues |
|
|
2.4% |
|
|
| |
| |
|
|
1.9% |
|
|
| |
| Asset-Backed Securities |
|
|
1.7% |
|
|
| |
| Municipal Bonds & Notes |
|
|
1.1% |
|
|
| |
| Other |
|
|
0.9% |
|
| |
|
% of Investments, at value. |
| |
|
Allocation Breakdown and % of investments exclude securities sold short and financial derivative instruments, if any. |
| |
|
Includes Central Funds Used for Cash Management Purposes. |
|
|
|
|
|
|
|
|
|
|
|
|
|
|
|
|
|
|
| |
|
Average Annual Total Return (1) for the period ended June 30, 2025 |
|
|
|
|
|
|
| |
| |
|
|
|
1 Year |
|
|
5 Year |
|
|
10 Year |
|
|
Commencement
of Operations
(02/24/94) |
|
|
|
|
Market Price |
|
|
21.79% |
|
|
|
12.67% |
|
|
|
8.11% |
|
|
|
8.52% |
|
|
|
|
NAV |
|
|
16.91% |
|
|
|
6.86% |
|
|
|
5.63% |
|
|
|
7.81% |
|
|
|
|
ICE BofA US High Yield Index |
|
|
10.24% |
|
|
|
6.01% |
|
|
|
5.29% |
|
|
|
|
|
All Fund returns are net of fees and expenses and include applicable fee waivers and/or expense limitations. Absent any applicable fee waivers and/or expense limitations, performance would have been lower and there can be no assurance that any such waivers or limitations will continue in the future.
Average Annual Return since 2/28/1994.
It is not possible to invest directly in an unmanaged index.
|
Performance quoted represents past performance. Past performance is not a guarantee or a reliable indicator of future results. Current performance may be lower or higher than performance shown. Investment return and the principal value of an investment will fluctuate. Returns shown do not reflect the deduction of taxes that a shareholder would pay on Fund distributions or the sale of Fund shares. Total return, market price, NAV, market price distribution rate, and NAV distribution rate will fluctuate with changes in market conditions. Performance current to the most recent month-end is available at www.pimco.com or via (844) 33-PIMCO. Performance is calculated assuming all dividends and distributions are reinvested at prices obtained under the Fund’s dividend reinvestment plan. Performance does not reflect any brokerage commissions in connection with the purchase or sale of Fund shares. |
|
The performance information shown for the Fund includes historical performance information for the periods prior to February 8, 2002, during which the Fund had a different investment manager. As of February 8, 2002, PIMCO became the Fund’s investment manager. The Fund’s performance prior to that time may have been different if the Fund were advised by PIMCO. |
|
Performance of an index is shown in light of a requirement by the Securities and Exchange Commission that the performance of an appropriate broad-based securities market index be disclosed. However, the Fund is not managed to an index nor should the index be viewed as a “benchmark” for the Fund’s performance. The index is not intended to be indicative of the Fund’s investment strategies, portfolio components or past or future performance. Please see Additional Information Regarding the Funds for a description of the Fund’s principal investment strategies. |
|
Distribution rates are not performance and are calculated by annualizing the most recent distribution per share and dividing by the NAV or Market Price, as applicable, as of the reported date. Distributions may be comprised of ordinary income, net capital gains, and/or a return of capital (ROC) of your investment in the Fund. Because the distribution rate may include a ROC, it should not be confused with yield or income. If the Fund estimates that a portion of its distribution may be comprised of amounts from sources other than net investment income in accordance with its policies and good accounting practices, the Fund will notify shareholders of the estimated composition of such distribution through a Section 19 Notice. Please refer to the most recent Section 19 Notice, if applicable, for additional information regarding the estimated composition of distributions. Please visit www.pimco.com for most recent Section 19 Notice, if applicable. Final determination of a distribution’s tax character will be provided to shareholders when such information is available. |
|
Represents total effective leverage outstanding, as a percentage of total managed assets. Total effective leverage consists of preferred shares, reverse repurchase agreements and other borrowings, credit default swap notional and floating rate notes issued in tender option bond transactions, as applicable (collectively “Total Effective Leverage”). The Fund may engage in other transactions not included in Total Effective Leverage disclosed above that may give rise to a form of leverage, including certain derivative transactions. For the purpose of calculating Total Effective Leverage outstanding as a percentage of total managed assets, total managed assets refer to total assets (including assets attributable to Total Effective Leverage that may be outstanding) minus accrued liabilities (other than liabilities representing Total Effective Leverage). |
Fund Information (as of June 30, 2025)
(1)
|
|
|
|
| |
| Market Price |
|
|
$6.96 |
|
|
| |
| NAV |
|
|
$4.54 |
|
|
| |
| Premium/(Discount) to NAV |
|
|
53.30% |
|
|
| |
Market Price Distribution Rate (2) |
|
|
6.90% |
|
|
| |
| |
|
|
10.57% |
|
|
| |
Total Effective Leverage (3) |
|
|
33.00% |
|
Investment Objective and Strategy Overview
The Fund’s primary investment objective is to generate a level of income that is higher than that generated by high quality, intermediate-term U.S. debt securities. The Fund also seeks capital appreciation to the extent consistent with this objective.
Fund Insights at NAV
The following affected performance (on a gross basis) during the reporting period:
| » |
|
Exposure to the agency mortgage-backed securities sector contributed to performance, as the sector posted positive performance. |
| » |
|
Exposure to emerging markets contributed to performance, as spreads tightened. |
| » |
|
Exposure to corporate credit, notably investment grade and high yield credit, contributed to performance, as the asset classes posted positive returns. |
| » |
|
The costs associated with one or more forms of leverage detracted from performance. That said, the net impact on the Fund’s performance of the cost of leverage is generally determined by comparing the return on the additional investments purchased with such leverage against the cost of such leverage. |
| » |
|
Exposure to student loan asset backed securities detracted from performance, as select student loans posted negative performance. |
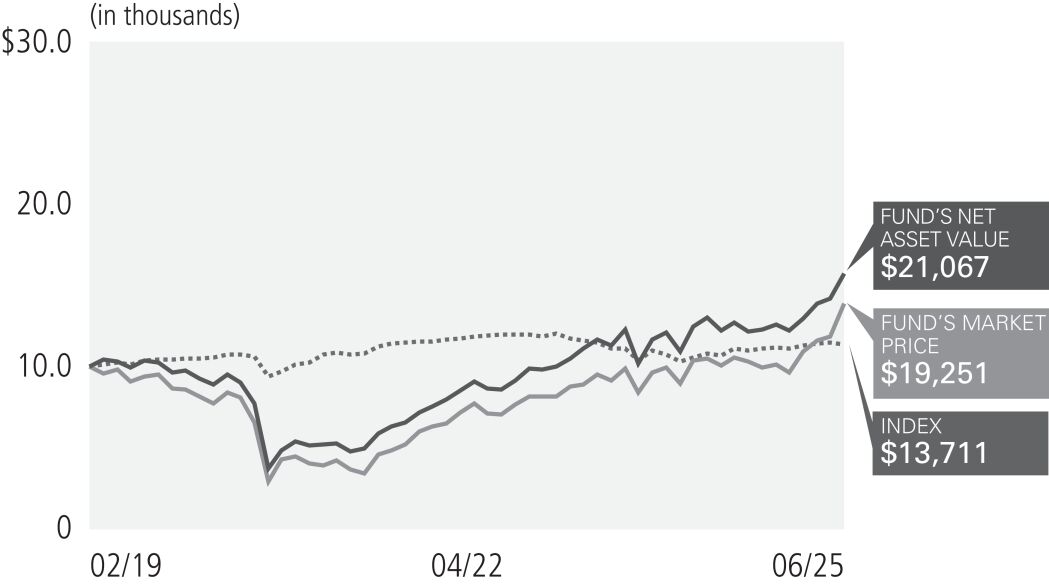
Cumulative Returns Through June 30, 2025
$10,000 invested at the end of the month when the Fund commenced operations.
Allocation Breakdown as of June 30, 2025
|
|
|
|
| |
Loan Participations and Assignments |
|
|
21.9% |
|
|
| |
Non-Agency Mortgage-Backed Securities |
|
|
20.9% |
|
|
| |
Asset-Backed Securities |
|
|
18.7% |
|
|
| |
Corporate Bonds & Notes |
|
|
17.4% |
|
|
| |
|
|
|
6.8% |
|
|
| |
Common Stocks |
|
|
4.8% |
|
|
| |
Sovereign Issues |
|
|
4.3% |
|
|
| |
U.S. Government Agencies |
|
|
3.5% |
|
|
| |
Preferred Securities |
|
|
1.7% |
|
|
| |
Other |
|
|
0.0% |
|
| |
|
% of Investments, at value. |
| |
|
Allocation Breakdown and % of investments exclude securities sold short and financial derivative instruments, if any. |
| |
|
Includes Central Funds Used for Cash Management Purposes. |
|
|
|
|
|
|
|
|
|
|
| |
|
Average Annual Total Return ( ¹ ) for the period ended June 30, 2025 |
|
|
|
|
| |
| |
|
|
|
1 Year |
|
|
Commencement
of Operations
(01/31/22) |
|
|
|
|
Market Price |
|
|
7.30% |
|
|
|
3.78% |
|
|
|
|
NAV |
|
|
13.97% |
|
|
|
3.93% |
|
|
|
|
ICE BofA US High Yield Index |
|
|
10.24% |
|
|
|
4.75% |
|
All Fund returns are net of fees and expenses and include applicable fee waivers and/or expense limitations. Absent any applicable fee waivers and/or expense limitations, performance would have been lower and there can be no assurance that any such waivers or limitations will continue in the future.
It is not possible to invest directly in an unmanaged index.
|
Performance quoted represents past performance. Past performance is not a guarantee or a reliable indicator of future results. Current performance may be lower or higher than performance shown. Investment return and the principal value of an investment will fluctuate. Returns shown do not reflect the deduction of taxes that a shareholder would pay on Fund distributions or the sale of Fund shares. Total return, market price, NAV, market price distribution rate, and NAV distribution rate will fluctuate with changes in market conditions. Performance current to the most recent month-end is available at www.pimco.com or via (844) 33-PIMCO. Performance is calculated assuming all dividends and distributions are reinvested at prices obtained under the Fund’s dividend reinvestment plan. Performance does not reflect any brokerage commissions in connection with the purchase or sale of Fund shares. |
|
Performance of an index is shown in light of a requirement by the Securities and Exchange Commission that the performance of an appropriate broad-based securities market index be disclosed. However, the Fund is not managed to an index nor should the index be viewed as a “benchmark” for the Fund’s performance. The index is not intended to be indicative of the Fund’s investment strategies, portfolio components or past or future performance. Please see Additional Information Regarding the Funds for a description of the Fund’s principal investment strategies. |
|
Distribution rates are not performance and are calculated by annualizing the most recent distribution per share and dividing by the NAV or Market Price, as applicable, as of the reported date. Distributions may be comprised of ordinary income, net capital gains, and/or a return of capital (ROC) of your investment in the Fund. Because the distribution rate may include a ROC, it should not be confused with yield or income. If the Fund estimates that a portion of its distribution may be comprised of amounts from sources other than net investment income in accordance with its policies and good accounting practices, the Fund will notify shareholders of the estimated composition of such distribution through a Section 19 Notice. Please refer to the most recent Section 19 Notice, if applicable, for additional information regarding the estimated composition of distributions. Please visit www.pimco.com for most recent Section 19 Notice, if applicable. Final determination of a distribution’s tax character will be provided to shareholders when such information is available. |
|
Represents total effective leverage outstanding, as a percentage of total managed assets. Total effective leverage consists of preferred shares, reverse repurchase agreements and other borrowings, credit default swap notional and floating rate notes issued in tender option bond transactions, as applicable (collectively “Total Effective Leverage”). The Fund may engage in other transactions not included in Total Effective Leverage disclosed above that may give rise to a form of leverage, including certain derivative transactions. For the purpose of calculating Total Effective Leverage outstanding as a percentage of total managed assets, total managed assets refer to total assets (including assets attributable to Total Effective Leverage that may be outstanding) minus accrued liabilities (other than liabilities representing Total Effective Leverage). |
Fund Information (as of June 30, 2025)
(
¹
)
|
|
|
|
| |
Market Price |
|
|
$15.11 |
|
|
| |
NAV |
|
|
$15.23 |
|
|
| |
Premium/(Discount) to NAV |
|
|
(0.79)% |
|
|
| |
Market Price Distribution Rate (2) |
|
|
11.86% |
|
|
| |
|
|
|
11.77% |
|
|
| |
Total Effective Leverage (3) |
|
|
40.10% |
|
Investment Objective and Strategy Overview
PIMCO Access Income Fund’s investment objective is to seek current income as a primary objective and capital appreciation as a secondary objective.
Fund Insights at NAV
The following affected performance (on a gross basis) during the reporting period:
| » |
|
Holdings related to corporate special situation investments, which include companies undergoing stress, distress, challenges or significant transition, contributed to performance, as the securities posted positive returns. |
| » |
|
Exposures to the residential mortgage credit sector contributed to performance, as the sector posted positive performance. |
| » |
|
Exposure to emerging market debt contributed to performance, as spreads tightened. |
| » |
|
Exposure to corporate credit, notably bank loans and high yield credit, contributed to performance, as the asset classes posted positive returns. |
| » |
|
The costs associated with one or more forms of leverage detracted from performance. That said, the net impact on the Fund’s performance of the cost of leverage is generally determined by comparing the return on the additional investments purchased with such leverage against the cost of such leverage. |
| » |
|
Exposure to holdings related to emerging markets special situations detracted from performance, as holdings of a Brazilian telecommunications operator posted negative returns. |
| » |
|
There were no other material detractors for this Fund. |
|
|
|
|
|
|
|
|
|
|
|
|
| |
| |
|
|
ANNUAL REPORT |
|
|
| |
|
|
JUNE 30, 2025 |
|
|
9 |
|
|
|
|
| |
Market and Net Asset Value Information |
|
|
|
|
The Fund’s common shares are listed on the NYSE under the trading or “ticker” symbol “PAXS”. The Fund’s common shares commenced trading on the NYSE in January 2022. The conduct of any offering and the issuance of additional common shares pursuant to any offering may have an adverse effect on prices in the secondary market for the Fund’s common shares by increasing the number of shares available, which may put downward pressure on the market price for the common shares. The NAV of the Fund’s common shares will be reduced immediately following an offering by the sales load, commissions and offering expenses paid or reimbursed by the Fund in connection with such offering. The completion of an offering may result in an immediate dilution of the NAV per common share for all existing common shareholders.
The following table sets forth, for each of the periods indicated, the high and low closing market prices of the Fund’s Common Shares on the NYSE, the high and low NAV per Common Share and the high and low premium/discount to NAV per Common Share. See Note 3, Investment Valuation and Fair Value Measurements in the Notes to Financial Statements for information as to how the Fund’s NAV is determined.
|
|
|
|
|
|
|
|
|
|
|
|
|
|
|
|
|
|
|
|
|
|
|
|
| |
|
|
Common share market price (1) |
|
|
Common share
net asset value |
|
|
Premium (discount) as
a % of net asset value |
|
|
|
|
|
|
|
|
|
|
|
|
|
|
|
|
|
|
|
|
Quarter ended June 30, 2025 |
|
$ |
16.12 |
|
|
$ |
14.15 |
|
|
$ |
15.30 |
|
|
$ |
14.64 |
|
|
|
5.36% |
|
|
|
(5.10)% |
|
Quarter ended March 31, 2025 |
|
$ |
16.37 |
|
|
$ |
15.25 |
|
|
$ |
15.52 |
|
|
$ |
15.16 |
|
|
|
6.02% |
|
|
|
(0.52)% |
|
Quarter ended December 31, 2024 |
|
$ |
17.17 |
|
|
$ |
15.13 |
|
|
$ |
15.63 |
|
|
$ |
15.27 |
|
|
|
9.85% |
|
|
|
(1.43)% |
|
Quarter ended September 30, 2024 |
|
$ |
16.63 |
|
|
$ |
14.97 |
|
|
$ |
15.63 |
|
|
$ |
15.00 |
|
|
|
6.62% |
|
|
|
(1.06)% |
|
Quarter ended June 30, 2024 |
|
$ |
16.20 |
|
|
$ |
14.74 |
|
|
$ |
15.23 |
|
|
$ |
14.79 |
|
|
|
7.93% |
|
|
|
(0.47)% |
|
Quarter ended March 31, 2024 |
|
$ |
15.75 |
|
|
$ |
14.30 |
|
|
$ |
15.23 |
|
|
$ |
14.69 |
|
|
|
4.24% |
|
|
|
(3.44)% |
|
Quarter ended December 31, 2023 |
|
$ |
14.48 |
|
|
$ |
12.66 |
|
|
$ |
14.85 |
|
|
$ |
14.02 |
|
|
|
0.63% |
|
|
|
(9.89)% |
|
Quarter ended September 30, 2023 |
|
$ |
15.01 |
|
|
$ |
13.59 |
|
|
$ |
14.91 |
|
|
$ |
14.44 |
|
|
|
1.70% |
|
|
|
(6.15)% |
|
|
Such prices reflect inter-dealer prices, without retail mark-up, mark-down or commission and may not represent actual transactions. |
|
|
|
|
|
|
| |
10 |
|
PIMCO CLOSED-END FUNDS |
|
|
|
|
Summary of Fund Expenses
The following table is intended to assist investors in understanding the fees and expenses (annualized) that an investor in Common Shares of the Fund would bear, directly or indirectly, as a result of an offering. The table reflects the use of leverage in the form of reverse repurchase agreements averaged over the period ended June 30, 2025 in an amount equal to 39.75% of the Fund’s average total managed assets, including the assets attributable to such leverage (or 65.96% of the Fund’s average net assets attributable to Common Shares), and shows Fund expenses as a percentage of net assets attributable to Common Shares. The percentages above do not reflect the Fund’s use of other forms of economic leverage, such as credit default swaps or other derivative instruments. The table and example below are based on the Fund’s capital structure as of June 30, 2025. The extent of the Fund’s assets attributable to leverage following an offering, and the Fund’s associated expenses, are likely to vary (perhaps significantly) from these assumptions.
Shareholder Transaction Expenses
|
|
|
|
|
|
|
|
| |
|
|
| |
Sales load ( as a percentage of offering price) (1) |
|
|
|
| |
|
[ ]% |
|
|
|
| |
Offering Expenses Borne by Common Shareholders ( as a percentage of offering price) (2) |
|
|
|
| |
|
|
|
|
|
| |
Dividend Reinvestment Plan Fees (3) |
|
|
|
| |
|
|
|
|
In the event that the Common Shares to which this relates are sold to or through underwriters or dealer managers, a corresponding supplement will disclose the applicable sale load and/or commission. |
|
The related supplement will disclose the estimated amount of offering expense, the offering price and the offering expenses borne by the Fund and indirectly by all of its Common Shareholders as a percentage of the offering price. |
|
You will pay brokerage charges if you direct your broker or the plan agent to sell your Common Shares that you acquired pursuant to a dividend reinvestment plan. You may also pay a pro rata share of brokerage commissions incurred in connection with open market purchase pursuant to the Fund’s Dividend Reinvestment Plan. |
Annual Expenses
|
|
|
|
|
|
|
|
| |
| |
|
|
|
|
Percentage of
Net Assets Attributable to
Common Shares (reflecting
leverage attributable to
reverse
repurchase agreements) |
|
|
|
| |
|
|
|
|
| |
|
2.08% |
|
|
|
| |
Interest Payments on Borrowed Funds (2) |
|
|
|
| |
|
3.76% |
|
|
|
| |
|
|
|
|
| |
|
0.01% |
|
|
|
| |
|
|
|
|
| |
|
|
|
|
Management fees include fees payable to the Investment Manager for advisory services and for supervisory, administrative and other services. The Fund pays for the advisory, supervisory and administrative services it requires under what is essentially an all-in fee structure (the “unified management fee”). Pursuant to an investment management agreement, PIMCO is paid a Management Fee of 1.25% of the Fund’s average daily total managed assets. The Fund (and not PIMCO) will be responsible for certain fees and expenses, which are reflected in the table above, that are not covered by the management fee under the investment management agreement. Please see Note 9, Fees and Expenses in the Notes to Financial Statements for an explanation of the unified management fee and definition of “total managed assets.” |
|
Reflects the Fund’s use of leverage in the form of reverse repurchase agreements averaged over the period ended June 30, 2025, which represented 39.75% of the Fund’s average total managed assets, including the assets attributable to leverage (or 65.96% of the Fund’s average net assets attributable to Common Shares), as of that date, at an annual interest rate cost to the Fund of 5.605%, which is the weighted average interest rate cost during the period ended June 30, 2025. See “Effects of Leverage.” The actual amount of interest expense borne by the Fund will vary over time in accordance with the level of the Fund’s use of reverse repurchase agreements, dollar rolls/buybacks and/or borrowings and variations in market interest rates. Borrowing expense is required to be treated as an expense of the Fund for accounting purposes. Any associated income or gains (or losses) realized from leverage obtained through such instruments is not reflected in the Annual Expenses table above, but would be reflected in the Fund’s performance results. |
|
“Other Expenses” are estimated for the Fund’s fiscal year ending June 30, 2026. |
|
“Interest Payments on Borrowed Funds” are borne by the Fund separately from management fees paid to PIMCO. Excluding these expenses, Total Annual Expenses are 2.09%. |
Example
The following example illustrates the expenses that you would pay on a $1,000 investment in Common Shares of the Fund, assuming (1) that the Fund’s net assets do not increase or decrease, (2) that the Fund incurs total annual expenses of 5.85% of net assets attributable to Common Shares in years 1 through 10 (assuming assets attributable to reverse repurchase agreements representing 39.75% of the Fund’s total managed assets) and (3) a 5% annual return
(1)
:
|
|
|
|
|
|
|
|
|
|
|
|
|
|
|
|
|
|
|
|
| |
| |
|
|
|
|
|
|
|
|
|
|
|
|
|
|
|
|
|
|
|
|
| |
Total Expenses Incurred |
|
|
|
| |
$ |
58 |
|
|
$ |
173 |
|
|
$ |
286 |
|
|
$ |
561 |
|
|
The example above should not be considered a representation of future expenses. Actual expenses may be higher or lower than those shown. The example assumes that the estimated Interest Payments on Borrowed Funds and Other Expenses set forth in the Annual Expenses table are accurate, that the rate listed under Total Annual Expenses remains the same each year and that all dividends and distributions are reinvested at NAV. Actual expenses may be greater or less than those assumed. Moreover, the Fund’s actual rate of return may be greater or less than the hypothetical 5% annual return shown in the example. The example does not include commissions or estimated offering expenses, which would cause the expenses shown in the example to increase. In connection with an offering of Common Shares, the prospectus supplement will set forth an example including sales load and estimated offering costs. |
|
|
|
|
|
|
|
|
|
|
|
|
| |
| |
|
|
ANNUAL REPORT |
|
|
| |
|
|
JUNE 30, 2025 |
|
|
11 |
PIMCO Dynamic Income Fund
Cumulative Returns Through June 30, 2025
$10,000 invested at the end of the month when the Fund commenced operations.
Allocation Breakdown as of June 30, 2025
|
|
|
|
| |
Loan Participations and Assignments |
|
|
24.4% |
|
|
| |
Non-Agency Mortgage-Backed Securities |
|
|
22.5% |
|
|
| |
Corporate Bonds & Notes |
|
|
18.7% |
|
|
| |
Asset-Backed Securities |
|
|
12.1% |
|
|
| |
|
|
|
8.9% |
|
|
| |
Common Stocks |
|
|
5.2% |
|
|
| |
Sovereign Issues |
|
|
4.7% |
|
|
| |
Preferred Securities |
|
|
1.4% |
|
|
| |
U.S. Government Agencies |
|
|
1.2% |
|
|
| |
Other |
|
|
0.9% |
|
| |
|
% of Investments, at value. |
| |
|
Allocation Breakdown and % of investments exclude securities sold short and financial derivative instruments, if any. |
| |
|
Includes Central Funds Used for Cash Management Purposes. |
|
|
|
|
|
|
|
|
|
|
|
|
|
|
|
|
|
|
| |
|
Average Annual Total Return (1) for the period ended June 30, 2025 |
|
|
|
|
|
|
| |
| |
|
|
|
1 Year |
|
|
5 Year |
|
|
10 Year |
|
|
Commencement
of Operations
(05/30/12) |
|
|
|
|
Market Price |
|
|
16.42% |
|
|
|
8.75% |
|
|
|
9.34% |
|
|
|
11.21% |
|
|
|
|
NAV |
|
|
17.60% |
|
|
|
8.87% |
|
|
|
7.84% |
|
|
|
11.09% |
|
|
|
|
ICE BofA US High Yield Index |
|
|
10.24% |
|
|
|
6.01% |
|
|
|
5.29% |
|
|
|
5.75% |
|
All Fund returns are net of fees and expenses and include applicable fee waivers and/or expense limitations. Absent any applicable fee waivers and/or expense limitations, performance would have been lower and there can be no assurance that any such waivers or limitations will continue in the future.
It is not possible to invest directly in an unmanaged index.
|
Performance quoted represents past performance. Past performance is not a guarantee or a reliable indicator of future results. Current performance may be lower or higher than performance shown. Investment return and the principal value of an investment will fluctuate. Returns shown do not reflect the deduction of taxes that a shareholder would pay on Fund distributions or the sale of Fund shares. Total return, market price, NAV, market price distribution rate, and NAV distribution rate will fluctuate with changes in market conditions. The NAV presented may differ from the NAV reported for the same period in other Fund materials. Performance current to the most recent month-end is available at www.pimco.com or via (844) 33-PIMCO. Performance is calculated assuming all dividends and distributions are reinvested at prices obtained under the Fund’s dividend reinvestment plan. Performance does not reflect any brokerage commissions in connection with the purchase or sale of Fund shares. |
|
Performance of an index is shown in light of a requirement by the Securities and Exchange Commission that the performance of an appropriate broad-based securities market index be disclosed. However, the Fund is not managed to an index nor should the index be viewed as a “benchmark” for the Fund’s performance. The index is not intended to be indicative of the Fund’s investment strategies, portfolio components or past or future performance. Please see Additional Information Regarding the Funds for a description of the Fund’s principal investment strategies. |
|
Distribution rates are not performance and are calculated by annualizing the most recent distribution per share and dividing by the NAV or Market Price, as applicable, as of the reported date. Distributions may be comprised of ordinary income, net capital gains, and/or a return of capital (ROC) of your investment in the Fund. Because the distribution rate may include a ROC, it should not be confused with yield or income. If the Fund estimates that a portion of its distribution may be comprised of amounts from sources other than net investment income in accordance with its policies and good accounting practices, the Fund will notify shareholders of the estimated composition of such distribution through a Section 19 Notice. Please refer to the most recent Section 19 Notice, if applicable, for additional information regarding the estimated composition of distributions. Please visit www.pimco.com for most recent Section 19 Notice, if applicable. Final determination of a distribution’s tax character will be provided to shareholders when such information is available. |
|
Represents total effective leverage outstanding, as a percentage of total managed assets. Total effective leverage consists of preferred shares, reverse repurchase agreements and other borrowings, credit default swap notional and floating rate notes issued in tender option bond transactions, as applicable (collectively “Total Effective Leverage”). The Fund may engage in other transactions not included in Total Effective Leverage disclosed above that may give rise to a form of leverage, including certain derivative transactions. For the purpose of calculating Total Effective Leverage outstanding as a percentage of total managed assets, total managed assets refer to total assets (including assets attributable to Total Effective Leverage that may be outstanding) minus accrued liabilities (other than liabilities representing Total Effective Leverage). |
Fund Information (as of June 30, 2025)
(1)
|
|
|
|
| |
Market Price |
|
|
$18.97 |
|
|
| |
NAV |
|
|
$16.93 |
|
|
| |
Premium/(Discount) to NAV |
|
|
12.05% |
|
|
| |
Market Price Distribution Rate (2) |
|
|
13.95% |
|
|
| |
|
|
|
15.63% |
|
|
| |
Total Effective Leverage (3) |
|
|
34.46% |
|
Investment Objective and Strategy Overview
PIMCO Dynamic Income Fund’s primary investment objective is to seek current income, and capital appreciation is a secondary objective.
Fund Insights at NAV
The following affected performance (on a gross basis) during the reporting period:
| » |
|
Holdings related to corporate special situation investments, which include companies undergoing stress, distress, challenges or significant transition, contributed to performance, as the securities posted positive returns. |
| » |
|
Exposure to emerging market debt contributed to absolute performance, as the sector posted positive performance. |
| » |
|
Exposure to corporate credit, notably bank loans and high yield credit, contributed to performance, as the asset classes posted positive returns. |
| » |
|
The costs associated with one or more forms of leverage detracted from performance. That said, the net impact on the Fund’s performance of the cost of leverage is generally determined by comparing the return on the additional investments purchased with such leverage against the cost of such leverage. |
| » |
|
Exposure to holdings related to emerging markets special situations detracted from performance, as holdings of a Brazilian telecommunications operator posted negative returns. |
|
|
|
|
|
|
| |
12 |
|
PIMCO CLOSED-END FUNDS |
|
|
|
|
|
|
|
|
| |
Market and Net Asset Value Information |
|
|
|
|
The Fund’s common shares are listed on the NYSE under the trading or “ticker” symbol “PDI”. The Fund’s common shares commenced trading on the NYSE in May 2012. The conduct of any offering and the issuance of additional common shares pursuant to any offering may have an adverse effect on prices in the secondary market for the Fund’s common shares by increasing the number of shares available, which may put downward pressure on the market price for the common shares. The NAV of the Fund’s common shares will be reduced immediately following an offering by the sales load, commissions and offering expenses paid or reimbursed by the Fund in connection with such offering. The completion of an offering may result in an immediate dilution of the NAV per common share for all existing common shareholders.
The following table sets forth, for each of the periods indicated, the high and low closing market prices of the Fund’s Common Shares on the NYSE, the high and low NAV per Common Share and the high and low premium/discount to NAV per Common Share. See Note 3, Investment Valuation and Fair Value Measurements in the Notes to Financial Statements for information as to how the Fund’s NAV is determined.
|
|
|
|
|
|
|
|
|
|
|
|
|
|
|
|
|
|
|
|
|
|
|
|
| |
PIMCO Dynamic Income Fund |
|
Common share market price (1) |
|
|
Common share
net asset value |
|
|
Premium (discount) as
a % of net asset value |
|
|
|
|
|
|
|
|
|
|
|
|
|
|
|
|
|
|
|
|
Quarter ended June 30, 2025 |
|
$ |
19.87 |
|
|
$ |
17.02 |
|
|
$ |
16.97 |
|
|
$ |
16.26 |
|
|
|
17.09% |
|
|
|
2.72% |
|
Quarter ended March 31, 2025 |
|
$ |
20.05 |
|
|
$ |
18.34 |
|
|
$ |
17.29 |
|
|
$ |
16.94 |
|
|
|
16.81% |
|
|
|
7.13% |
|
Quarter ended December 31, 2024 |
|
$ |
20.85 |
|
|
$ |
18.33 |
|
|
$ |
17.44 |
|
|
$ |
17.05 |
|
|
|
19.76% |
|
|
|
7.01% |
|
Quarter ended September 30, 2024 |
|
$ |
20.27 |
|
|
$ |
18.70 |
|
|
$ |
17.41 |
|
|
$ |
16.75 |
|
|
|
16.73% |
|
|
|
10.06% |
|
Quarter ended June 30, 2024 |
|
$ |
19.76 |
|
|
$ |
18.58 |
|
|
$ |
17.25 |
|
|
$ |
16.75 |
|
|
|
14.88% |
|
|
|
10.33% |
|
Quarter ended March 31, 2024 |
|
$ |
19.58 |
|
|
$ |
17.95 |
|
|
$ |
17.32 |
|
|
$ |
17.00 |
|
|
|
13.38% |
|
|
|
4.48% |
|
Quarter ended December 31, 2023 |
|
$ |
18.16 |
|
|
$ |
15.53 |
|
|
$ |
17.18 |
|
|
$ |
16.17 |
|
|
|
7.98% |
|
|
|
(4.08)% |
|
Quarter ended September 30, 2023 |
|
$ |
19.54 |
|
|
$ |
16.89 |
|
|
$ |
17.41 |
|
|
$ |
16.64 |
|
|
|
13.28% |
|
|
|
1.50% |
|
|
Such prices reflect inter-dealer prices, without retail mark-up, mark-down or commission and may not represent actual transactions. |
|
|
|
|
|
|
|
|
|
|
|
|
| |
| |
|
|
ANNUAL REPORT |
|
|
| |
|
|
JUNE 30, 2025 |
|
|
13 |
Summary of Fund Expenses
The following table is intended to assist investors in understanding the fees and expenses (annualized) that an investor in Common Shares of the Fund would bear, directly or indirectly, as a result of an offering. The table reflects the use of leverage in the form of reverse repurchase agreements averaged over the period ended June 30, 2025 in an amount equal to 33.48% of the Fund’s average total managed assets, including the assets attributable to such leverage (or 50.32% of the Fund’s average net assets attributable to Common Shares) and shows Fund expenses as a percentage of net assets attributable to Common Shares. The percentages above do not reflect the Fund’s use of other forms of economic leverage, such as credit default swaps or other derivative instruments. The table and example below are based on the Fund’s capital structure as of June 30, 2025. The extent of the Fund’s assets attributable to leverage following an offering, and the Fund’s associated expenses, are likely to vary (perhaps significantly) from these assumptions.
Shareholder Transaction Expenses
|
|
|
|
|
|
|
|
| |
|
|
| |
Sales load (as a percentage of offering price) (1) |
|
|
|
| |
|
[ ]% |
|
|
|
| |
Offering Expenses Borne by Common Shareholders (as a percentage of offering price) (2) |
|
|
|
| |
|
[ ]% |
|
|
|
| |
Dividend Reinvestment Plan Fees (3) |
|
|
|
| |
|
[ ]% |
|
|
In the event that the Common Shares to which this relates are sold to or through underwriters or dealer managers, a corresponding supplement will disclose the applicable sale load and/or commission. |
|
The related supplement will disclose the estimated amount of offering expense, the offering price and the offering expenses borne by the Fund and indirectly by all of its Common Shareholders as a percentage of the offering price. |
|
You will pay brokerage charges if you direct your broker or the plan agent to sell your Common Shares that you acquired pursuant to a dividend reinvestment plan. You may also pay a pro rata share of brokerage commissions incurred in connection with open market purchase pursuant to the Fund’s Dividend Reinvestment Plan. |
Annual Expenses
|
|
|
|
|
|
|
|
| |
| |
|
|
|
|
Percentage of
Net Assets Attributable to
Common Shares (reflecting
leverage attributable to
reverse repurchase
agreements) |
|
|
|
| |
| |
|
|
|
| |
|
1.66% |
|
|
|
| |
Interest Expenses on Borrowed Funds (2) |
|
|
|
| |
|
2.79% |
|
|
|
| |
| |
|
|
|
| |
|
0.01% |
|
|
|
| |
| |
|
|
|
| |
|
|
|
|
Management fees include fees payable to the Investment Manager for advisory services and for supervisory, administrative and other services. The Fund pays for the advisory, supervisory and administrative services it requires under what is essentially an all-in fee structure (the “unified management fee”). Pursuant to an investment management agreement, PIMCO is paid a Management Fee of 1.10% of the Fund’s average daily total managed assets. “Total managed assets” includes total assets of the Fund (including any assets attributable to any reverse repurchase agreements, dollar rolls, borrowings and preferred shares that may be outstanding) minus accrued liabilities (other than liabilities representing reverse repurchase agreements, dollar rolls and borrowings). The Fund (and not PIMCO) will be responsible for certain fees |
| |
and expenses which are, reflected in the table above, that are not covered by the unified management fee under the investment management agreement. Please see Note 9, Fees and Expenses in the Notes to Financial Statements for an explanation of the unified management fee and definition of “total managed assets.” |
|
Reflects the Fund’s use of leverage in the form of reverse repurchase agreements averaged over the period ended June 30, 2025, which represented 33.48% of the Fund’s average total managed assets, including the assets attributable to leverage (or 50.32% of the Fund’s average net assets attributable to Common Shares), as of that date, at an annual interest rate cost to the Fund of 5.46%, which is the weighted average interest rate cost during the period ended June 30, 2025. See “Effects of Leverage.” The actual amount of interest expense borne by the Fund will vary over time in accordance with the level of the Fund’s use of reverse repurchase agreements, dollar rolls and/or borrowings and variations in market interest rates. Borrowing expense is required to be treated as an expense of the Fund for accounting purposes. Any associated income or gains (or losses) realized from leverage obtained through such instruments is not reflected in the Annual Expenses table above, but would be reflected in the Fund’s performance results. |
|
“Other Expenses” are estimated for the Fund’s fiscal year ending June 30, 2026. |
|
“Interest Payments on Borrowed Funds” is borne by the Fund separately from the management fees paid to PIMCO. Excluding such expense, Total Annual Expenses are 1.67%. |
Example
The following example illustrates the expenses that you would pay on a $1,000 investment in Common Shares of the Fund, assuming (1) that the Fund’s net assets do not increase or decrease, (2) that the Fund incurs total annual expenses of 4.46% of net assets attributable to Common Shares in years 1 through 10 (assuming assets attributable to reverse repurchase agreements representing 33.48% of the Fund’s total managed assets) and (3) a 5% annual return
(1)
:
|
|
|
|
|
|
|
|
|
|
|
|
|
|
|
|
|
|
|
|
| |
| |
|
|
|
|
|
|
|
|
|
|
|
|
|
|
|
|
|
|
|
|
| |
| Total Expenses Incurred |
|
|
|
| |
$ |
45 |
|
|
$ |
135 |
|
|
$ |
226 |
|
|
$ |
458 |
|
|
The example above should not be considered a representation of future expenses. Actual expenses may be higher or lower than those shown. The example assumes that the estimated Interest Payments on Borrowed Funds and Other Expenses set forth in the Annual Expenses table are accurate, that the rate listed under Total Annual Expenses remains the same each year and that all dividends and distributions are reinvested at NAV. Actual expenses may be greater or less than those assumed. Moreover, the Fund’s actual rate of return may be greater or less than the hypothetical 5% annual return shown in the example. The example does not include commissions or estimated offering expenses, which would cause the expenses shown in the example to increase. In connection with an offering of Common Shares, the prospectus supplement will set forth an example including sales load and estimated offering costs. |
|
|
|
|
|
|
| |
14 |
|
PIMCO CLOSED-END FUNDS |
|
|
|
|
PIMCO Dynamic Income Opportunities Fund
Cumulative Returns Through June 30, 2025
$10,000 invested at the end of the month when the Fund commenced operations.
Allocation Breakdown as of June 30, 2025
|
|
|
|
| |
| Loan Participations and Assignments |
|
|
23.1% |
|
|
| |
| Corporate Bonds & Notes |
|
|
20.4% |
|
|
| |
Non-Agency Mortgage-Backed Securities |
|
|
18.5% |
|
|
| |
| Asset-Backed Securities |
|
|
13.7% |
|
|
| |
| |
|
|
7.0% |
|
|
| |
| Common Stocks |
|
|
6.4% |
|
|
| |
| Sovereign Issues |
|
|
4.2% |
|
|
| |
| U.S. Government Agencies |
|
|
3.8% |
|
|
| |
| Convertible Bonds & Notes |
|
|
1.1% |
|
|
| |
| Preferred Securities |
|
|
1.0% |
|
|
| |
| Other |
|
|
0.8% |
|
| |
|
% of Investments, at value. |
| |
|
Allocation Breakdown and % of investments exclude securities sold short and financial derivative instruments, if any. |
| |
|
Includes Central Funds Used for Cash Management Purposes. |
|
|
|
|
|
|
|
|
|
|
| |
|
Average Annual Total Return (1) for the period ended June 30, 2025 |
|
|
|
|
| |
| |
|
|
|
|
|
|
Commencement
of Operations
(01/29/21) |
|
|
|
|
Market Price |
|
|
13.97% |
|
|
|
3.17% |
|
|
|
|
NAV |
|
|
15.58% |
|
|
|
2.59% |
|
|
|
|
ICE BofA US High Yield Index |
|
|
10.24% |
|
|
|
4.14% |
|
All Fund returns are net of fees and expenses and include applicable fee waivers and/or expense limitations. Absent any applicable fee waivers and/or expense limitations, performance would have been lower and there can be no assurance that any such waivers or limitations will continue in the future.
It is not possible to invest directly in an unmanaged index.
|
Performance quoted represents past performance. Past performance is not a guarantee or a reliable indicator of future results. Current performance may be lower or higher than performance shown. Investment return and the principal value of an investment will fluctuate. Returns shown do not reflect the deduction of taxes that a shareholder would pay on Fund distributions or the sale of Fund shares. Total return, market price, NAV, market price distribution rate, and NAV distribution rate will fluctuate with changes in market conditions. The NAV presented may differ from the NAV reported for the same period in other Fund materials. Performance current to the most recent month-end is available at www.pimco.com or via (844) 33-PIMCO. Performance is calculated assuming all dividends and distributions are reinvested at prices obtained under the Fund’s dividend reinvestment plan. Performance does not reflect any brokerage commissions in connection with the purchase or sale of Fund shares. |
|
Performance of an index is shown in light of a requirement by the Securities and Exchange Commission that the performance of an appropriate broad-based securities market index be disclosed. However, the Fund is not managed to an index nor should the index be viewed as a “benchmark” for the Fund’s performance. The index is not intended to be indicative of the Fund’s investment strategies, portfolio components or past or future performance. Please see Additional Information Regarding the Funds for a description of the Fund’s principal investment strategies. |
|
Distribution rates are not performance and are calculated by annualizing the most recent distribution per share and dividing by the NAV or Market Price, as applicable, as of the reported date. Distributions may be comprised of ordinary income, net capital gains, and/or a return of capital (ROC) of your investment in the Fund. Because the distribution rate may include a ROC, it should not be confused with yield or income. If the Fund estimates that a portion of its distribution may be comprised of amounts from sources other than net investment income in accordance with its policies and good accounting practices, the Fund will notify shareholders of the estimated composition of such distribution through a Section 19 Notice. Please refer to the most recent Section 19 Notice, if applicable, for additional information regarding the estimated composition of distributions. Please visit www.pimco.com for most recent Section 19 Notice, if applicable. Final determination of a distribution’s tax character will be provided to shareholders when such information is available. |
|
Represents total effective leverage outstanding, as a percentage of total managed assets. Total effective leverage consists of preferred shares, reverse repurchase agreements and other borrowings, credit default swap notional and floating rate notes issued in tender option bond transactions, as applicable (collectively “Total Effective Leverage”). The Fund may engage in other transactions not included in Total Effective Leverage disclosed above that may give rise to a form of leverage, including certain derivative transactions. For the purpose of calculating Total Effective Leverage outstanding as a percentage of total managed assets, total managed assets refer to total assets (including assets attributable to Total Effective Leverage that may be outstanding) minus accrued liabilities (other than liabilities representing Total Effective Leverage). |
Fund Information (as of June 30, 2025)
(1)
|
|
|
|
| |
| Market Price |
|
|
$13.48 |
|
|
| |
| NAV |
|
|
$13.00 |
|
|
| |
| Premium/(Discount) to NAV |
|
|
3.69% |
|
|
| |
Market Price Distribution Rate (2) |
|
|
11.39% |
|
|
| |
| |
|
|
11.81% |
|
|
| |
Total Effective Leverage (3) |
|
|
36.52% |
|
Investment Objective and Strategy Overview
PIMCO Dynamic Income Opportunities Fund’s investment objective is to seek current income as a primary objective and capital appreciation as a secondary objective.
Fund Insights at NAV
The following affected performance (on a gross basis) during the reporting period:
| » |
|
Holdings related to corporate special situation investments, which include companies undergoing stress, distress, challenges or significant transition, contributed to performance, as the securities posted positive returns. |
| » |
|
Exposures to the residential mortgage credit sector contributed to performance, as the sector posted positive performance. |
| » |
|
Exposure to corporate credit, notably bank loans and high yield credit, contributed to performance, as the asset classes posted positive returns. |
| » |
|
Exposure to emerging market debt contributed to performance, as spreads tightened. |
| » |
|
The costs associated with one or more forms of leverage detracted from performance. That said, the net impact on the Fund’s performance of the cost of leverage is generally determined by comparing the return on the additional investments purchased with such leverage against the cost of such leverage. |
| » |
|
There were no other material detractors for this Fund. |
|
|
|
|
|
|
|
|
|
|
|
|
| |
| |
|
|
ANNUAL REPORT |
|
|
| |
|
|
JUNE 30, 2025 |
|
|
15 |
|
|
|
|
| |
Market and Net Asset Value Information |
|
|
|
|
The Fund’s common shares are listed on the NYSE under the trading or “ticker” symbol “PDO”. The Fund’s common shares commenced trading on the NYSE in January 2021. The conduct of any offering and the issuance of additional common shares pursuant to any offering may have an adverse effect on prices in the secondary market for the Fund’s common shares by increasing the number of shares available, which may put downward pressure on the market price for the common shares. The NAV of the Fund’s common shares will be reduced immediately following an offering by the sales load, commissions and offering expenses paid or reimbursed by the Fund in connection with such offering. The completion of an offering may result in an immediate dilution of the NAV per common share for all existing common shareholders.
The following table sets forth, for each of the periods indicated, the high and low closing market prices of the Fund’s Common Shares on the NYSE, the high and low NAV per Common Share and the high and low premium/discount to NAV per Common Share. See Note 3, Investment Valuation and Fair Value Measurements in the Notes to Financial Statements for information as to how the Fund’s NAV is determined.
|
|
|
|
|
|
|
|
|
|
|
|
|
|
|
|
|
|
|
|
|
|
|
|
| |
PIMCO Dynamic Income Opportunities Fund |
|
Common share market price (1) |
|
|
Common share
net asset value |
|
|
Premium (discount) as
a % of net asset value |
|
Quarter |
|
High |
|
|
Low |
|
|
High |
|
|
Low |
|
|
High |
|
|
Low |
|
| Quarter ended June 30, 2025 |
|
$ |
13.88 |
|
|
$ |
12.24 |
|
|
$ |
13.02 |
|
|
$ |
12.48 |
|
|
|
6.69% |
|
|
|
(3.62)% |
|
| Quarter ended March 31, 2025 |
|
$ |
14.08 |
|
|
$ |
13.33 |
|
|
$ |
13.21 |
|
|
$ |
12.90 |
|
|
|
6.77% |
|
|
|
3.25% |
|
| Quarter ended December 31, 2024 |
|
$ |
14.37 |
|
|
$ |
13.12 |
|
|
$ |
13.35 |
|
|
$ |
12.97 |
|
|
|
8.05% |
|
|
|
1.00% |
|
| Quarter ended September 30, 2024 |
|
$ |
14.12 |
|
|
$ |
13.15 |
|
|
$ |
13.32 |
|
|
$ |
12.65 |
|
|
|
6.19% |
|
|
|
2.26% |
|
| Quarter ended June 30, 2024 |
|
$ |
13.38 |
|
|
$ |
12.48 |
|
|
$ |
12.80 |
|
|
$ |
12.40 |
|
|
|
5.29% |
|
|
|
0.16% |
|
| Quarter ended March 31, 2024 |
|
$ |
13.23 |
|
|
$ |
12.24 |
|
|
$ |
12.68 |
|
|
$ |
12.35 |
|
|
|
5.59% |
|
|
|
(1.45)% |
|
| Quarter ended December 31, 2023 |
|
$ |
12.48 |
|
|
$ |
10.68 |
|
|
$ |
12.42 |
|
|
$ |
11.63 |
|
|
|
3.65% |
|
|
|
(8.33)% |
|
| Quarter ended September 30, 2023 |
|
$ |
13.21 |
|
|
$ |
11.88 |
|
|
$ |
12.76 |
|
|
$ |
12.04 |
|
|
|
4.95% |
|
|
|
(1.65)% |
|
|
Such prices reflect inter-dealer prices, without retail mark-up, mark-down or commission and may not represent actual transactions. |
|
|
|
|
|
|
| |
16 |
|
PIMCO CLOSED-END FUNDS |
|
|
|
|
Summary of Fund Expenses
The following table is intended to assist investors in understanding the fees and expenses (annualized) that an investor in Common Shares of the Fund would bear, directly or indirectly, as a result of an offering. The table reflects the use of leverage in the form of reverse repurchase agreements averaged over the period ended June 30, 2025 in an amount equal to 37.18% of the Fund’s average total managed assets, including the assets attributable to such leverage (or 59.19% of the Fund’s average net assets attributable to Common Shares), and shows Fund expenses as a percentage of net assets attributable to Common Shares. The percentages above do not reflect the Fund’s use of other forms of economic leverage, such as credit default swaps or other derivative instruments. The table and example below are based on the Fund’s capital structure as of June 30, 2025. The extent of the Fund’s assets attributable to leverage following an offering, and the Fund’s associated expenses, are likely to vary (perhaps significantly) from these assumptions.
Shareholder Transaction Expenses
|
|
|
|
|
|
|
|
| |
|
|
| |
Sales load (as a percentage of offering price) (1) |
|
|
|
| |
|
[ ]% |
|
|
|
| |
Offering Expenses Borne by Common Shareholders (as a percentage of offering price) (2) |
|
|
|
| |
|
[ ]% |
|
|
|
| |
Dividend Reinvestment Plan Fees (3) |
|
|
|
| |
|
[ ]% |
|
|
In the event that the Common Shares to which this relates are sold to or through underwriters or dealer managers, a corresponding supplement will disclose the applicable sale load and/or commission. |
|
The related supplement will disclose the estimated amount of offering expense, the offering price and the offering expenses borne by the Fund and indirectly by all of its Common Shareholders as a percentage of the offering price. |
|
You will pay brokerage charges if you direct your broker or the plan agent to sell your Common Shares that you acquired pursuant to a dividend reinvestment plan. You may also pay a pro rata share of brokerage commissions incurred in connection with open market purchase pursuant to the Fund’s Dividend Reinvestment Plan. |
Annual Expenses
|
|
|
|
|
|
|
|
| |
| |
|
|
|
|
Percentage of
Net Assets Attributable to
Common Shares (reflecting
leverage attributable to
reverse
repurchase agreements) |
|
|
|
| |
| |
|
|
|
| |
|
1.83% |
|
|
|
| |
Interest Payments on Borrowed Funds (2) |
|
|
|
| |
|
3.38% |
|
|
|
| |
| |
|
|
|
| |
|
0.01% |
|
|
|
| |
| |
|
|
|
| |
|
|
|
|
Management fees include fees payable to the Investment Manager for advisory services and for supervisory, administrative and other services. The Fund pays for the advisory, supervisory and administrative services it requires under what is essentially an all-in fee structure (the “unified management fee”). Pursuant to an investment management agreement, PIMCO is paid a Management Fee of 1.15% of the Fund’s average daily total managed assets. The Fund (and not PIMCO) will be responsible for certain fees and expenses which are, reflected in the table above, that are not covered by the management fee under the investment management agreement. Please see Note 9, Fees and Expenses in the Notes to Financial Statements for an explanation of the unified management fee and definition of “total managed assets.” |
|
Reflects the Fund’s use of leverage in the form of reverse repurchase agreements averaged over the period ended June 30, 2025, which represented 39.75% of the Fund’s average total managed assets, including the assets attributable to leverage (or 59.19% of the Fund’s average net assets attributable to Common Shares), as of that date, at an annual interest rate cost to the Fund of 5.616%, which is the weighted average interest rate cost during the period ended June 30, 2025. See “Effects of Leverage.” The actual amount of interest expense borne by the Fund will vary over time in accordance with the level of the Fund’s use of reverse repurchase agreements, dollar rolls/buybacks and/or borrowings and variations in market interest rates. Borrowing expense is required to be treated as an expense of the Fund for accounting purposes. Any associated income or gains (or losses) realized from leverage obtained through such instruments is not reflected in the Annual Expenses table above, but would be reflected in the Fund’s performance results. |
|
“Other Expenses” are estimated for the Fund’s fiscal year ending June 30, 2026. |
|
“Interest Payments on Borrowed Funds” are borne by the Fund separately from management fees paid to PIMCO. Excluding these expenses, Total Annual Expenses are 1.84%. |
Example
The following example illustrates the expenses that you would pay on a $1,000 investment in Common Shares of the Fund, assuming (1) that the Fund’s net assets do not increase or decrease, (2) that the Fund incurs total annual expenses of 5.22% of net assets attributable to Common Shares in years 1 through 10 (assuming assets attributable to reverse repurchase agreements representing 37.18% of the Fund’s total managed assets) and (3) a 5% annual return
(1)
:
|
|
|
|
|
|
|
|
|
|
|
|
|
|
|
|
|
|
|
|
| |
| |
|
|
|
|
|
|
|
|
|
|
|
|
|
|
|
|
|
|
|
|
| |
| Total Expenses Incurred |
|
|
|
| |
$ |
52 |
|
|
$ |
156 |
|
|
$ |
260 |
|
|
$ |
517 |
|
|
The example above should not be considered a representation of future expenses. Actual expenses may be higher or lower than those shown. The example assumes that the estimated Interest Payments on Borrowed Funds and Other Expenses set forth in the Annual Expenses table are accurate, that the rate listed under Total Annual Expenses remains the same each year and that all dividends and distributions are reinvested at NAV. Actual expenses may be greater or less than those assumed. Moreover, the Fund’s actual rate of return may be greater or less than the hypothetical 5% annual return shown in the example. The example does not include commissions or estimated offering expenses, which would cause the expenses shown in the example to increase. In connection with an offering of Common Shares, the prospectus supplement will set forth an example including sales load and estimated offering costs. |
|
|
|
|
|
|
|
|
|
|
|
|
| |
| |
|
|
ANNUAL REPORT |
|
|
| |
|
|
JUNE 30, 2025 |
|
|
17 |
PIMCO Dynamic Income Strategy Fund
Cumulative Returns Through June 30, 2025
$10,000 invested at the end of the month when the Fund commenced operations.
Allocation Breakdown as of June 30, 2025
|
|
|
|
| |
| Common Stocks |
|
|
19.6% |
|
|
| |
| Asset-Backed Securities |
|
|
19.2% |
|
|
| |
| Corporate Bonds & Notes |
|
|
17.3% |
|
|
| |
| Loan Participations and Assignments |
|
|
15.3% |
|
|
| |
| Master Limited Partnerships |
|
|
9.4% |
|
|
| |
| Short-Term Instruments‡ |
|
|
9.4% |
|
|
| |
| Non-Agency Mortgage-Backed Securities |
|
|
7.2% |
|
|
| |
| U.S. Government Agencies |
|
|
1.7% |
|
|
| |
| Other |
|
|
0.9% |
|
| |
|
% of Investments, at value. |
| |
|
Allocation Breakdown and % of investments exclude securities sold short and financial derivative instruments, if any. |
| |
|
Includes Central Funds Used for Cash Management Purposes. |
|
|
|
|
|
|
|
|
|
|
|
|
|
|
| |
|
Average Annual Total Return (1) for the period ended June 30, 2025 |
|
|
|
|
|
| |
| |
|
|
|
|
|
|
5 Year |
|
|
Commencement
of Operations
(02/01/19) |
|
|
|
|
Market Price |
|
|
18.92% |
|
|
|
36.68% |
|
|
|
11.87% |
|
|
|
|
NAV |
|
|
15.14% |
|
|
|
32.49% |
|
|
|
12.18% |
|
|
|
|
ICE BofA US High Yield Index |
|
|
10.24% |
|
|
|
6.01% |
|
|
|
5.30% |
|
All Fund returns are net of fees and expenses and include applicable fee waivers and/or expense limitations. Absent any applicable fee waivers and/or expense limitations, performance would have been lower and there can be no assurance that any such waivers or limitations will continue in the future.
It is not possible to invest directly in an unmanaged index.
|
Performance quoted represents past performance. Past performance is not a guarantee or a reliable indicator of future results. Current performance may be lower or higher than performance shown. Investment return and the principal value of an investment will fluctuate. Returns shown do not reflect the deduction of taxes that a shareholder would pay on Fund distributions or the sale of Fund shares. Total return, market price, NAV, market price distribution rate, and NAV distribution rate will fluctuate with changes in market conditions. Performance current to the most recent month-end is available at www.pimco.com or via (844) 33-PIMCO. Performance is calculated assuming all dividends and distributions are reinvested at prices obtained under the Fund’s dividend reinvestment plan. Performance does not reflect any brokerage commissions in connection with the purchase or sale of Fund shares. |
|
Performance of the Index is shown in light of a requirement by the Securities and Exchange Commission that the performance of an appropriate broad-based securities market index be disclosed. However, the Fund is not managed to an index nor should the Index be viewed as a “benchmark” for the Fund’s performance. The Index is not intended to be indicative of the Fund’s investment strategies, portfolio components or past or future performance. Please see Additional Information Regarding the Fund for a description of the Fund’s principal investment strategies. |
|
Distribution rates are not performance and are calculated by annualizing the most recent distribution per share and dividing by the NAV or Market Price, as applicable, as of the reported date. Distributions may be comprised of ordinary income, net capital gains, and/or a return of capital (ROC) of your investment in the Fund. Because the distribution rate may include a ROC, it should not be confused with yield or income. If the Fund estimates that a portion of its distribution may be comprised of amounts from sources other than net investment income in accordance with its policies and good accounting practices, the Fund will notify shareholders of the estimated composition of such distribution through a Section 19 Notice. Please refer to the most recent Section 19 Notice, if applicable, for additional information regarding the estimated composition of distributions. Please visit www.pimco.com for most recent Section 19 Notice, if applicable. Final determination of a distribution’s tax character will be provided to shareholders when such information is available. |
|
Represents total effective leverage outstanding, as a percentage of total managed assets. Total effective leverage consists of preferred shares, reverse repurchase agreements and other borrowings, credit default swap notional and floating rate notes issued in tender option bond transactions, as applicable (collectively “Total Effective Leverage”). The Fund may engage in other transactions not included in Total Effective Leverage disclosed above that may give rise to a form of leverage, including certain derivative transactions. For the purpose of calculating Total Effective Leverage outstanding as a percentage of total managed assets, total managed assets refer to total assets (including assets attributable to Total Effective Leverage that may be outstanding) minus accrued liabilities (other than liabilities representing Total Effective Leverage). |
Fund Information as of June 30, 2025
(1)
|
|
|
|
| |
| Market Price |
|
|
$24.65 |
|
|
| |
| NAV |
|
|
$26.76 |
|
|
| |
| Premium/(Discount) to NAV |
|
|
(7.88)% |
|
|
| |
Market Price Distribution Rate (2) |
|
|
6.49% |
|
|
| |
| |
|
|
5.98% |
|
|
| |
Total Effective Leverage (3) |
|
|
23.00% |
|
Investment Objective and Strategy Overview
PIMCO Dynamic Income Strategy Fund investment objective is to seek current income as a primary objective and capital appreciation as a secondary objective.
Fund Insights at NAV
The following affected performance (on a gross basis) during the reporting period:
| » |
|
Equity exposures contributed to performance, as select securities, including shares of a liquefied natural gas exporter, posted positive returns. |
| » |
|
Exposure to corporate credit, notably high yield credit and bank loans, contributed to performance, as the asset classes posted positive returns. |
| » |
|
Holdings related to corporate special situation investments, which include companies undergoing stress, distress, challenges or significant transition, contributed to performance, as the securities posted positive returns. |
| » |
|
Exposures to the residential mortgage credit sector contributed to performance, as the sector posted positive returns. |
| » |
|
The costs associated with one or more forms of leverage detracted from performance. That said, the net impact on the Fund’s performance of the cost of leverage is generally determined by comparing the return on the additional investments purchased with such leverage against the cost of such leverage. |
| » |
|
Active exposure to commodities detracted from performance, as select positions generated negative returns. |
| » |
|
There were no other material detractors for this Fund. |
|
|
|
|
|
|
| |
18 |
|
PIMCO CLOSED-END FUNDS |
|
|
|
|
|
|
| |
|
|
|
|
| |
ICE BofA US High Yield Index |
|
ICE BofA U.S. High Yield Index tracks the performance of below investment grade U.S. dollar-denominated corporate bonds publicly issued in the U.S. domestic market. Qualifying bonds must have at least one year remaining term to maturity, a fixed coupon schedule and a minimum amount outstanding of USD 100 million. Bonds must be rated below investment grade based on a composite of Moody’s and S&P. It is not possible to invest directly in an unmanaged index. |
|
| |
MSCI World Index |
|
The MSCI World Index is a broad global equity index that represents large and mid-cap equity performance across all 23 developed markets countries. It covers approximately 85% of the free float-adjusted market capitalization in each country. |
|
|
|
|
|
|
|
|
|
|
|
|
| |
| |
|
|
ANNUAL REPORT |
|
|
| |
|
|
JUNE 30, 2025 |
|
|
19 |
|
|
|
|
|
|
|
|
|
|
|
|
|
|
|
|
|
|
|
|
|
|
|
|
|
|
|
|
|
|
|
|
| |
| |
|
|
|
|
Investment Operations |
|
|
|
|
| |
|
|
|
|
|
|
|
|
|
|
|
|
|
|
|
|
|
|
|
|
|
|
|
|
| Selected Per Share Data for the Year or Period Ended^: |
|
Net Asset Value Beginning of Year |
|
|
Net Investment Income |
|
|
Net Realized/ Unrealized Gain (Loss) |
|
|
Total |
|
|
From Net Investment Income |
|
|
From Net Realized Capital Gains |
|
|
Tax Basis Return of Capital |
|
|
Total |
|
|
|
|
|
|
|
|
|
| |
| PCM Fund, Inc. |
|
|
|
| |
|
|
| |
|
|
| |
|
|
| |
|
|
| |
|
|
| |
|
|
| |
|
| |
|
|
|
|
|
|
|
|
| |
| 06/30/2025 |
|
$ |
6.26 |
|
|
$ |
0.70 |
|
|
$ |
(0.12 |
) |
|
$ |
0.58 |
|
|
$ |
(0.69 |
) |
|
$ |
0.00 |
|
|
$ |
(0.18 |
) |
|
$ |
(0.87 |
) |
|
|
|
|
|
|
|
|
| |
| 06/30/2024 |
|
|
6.74 |
|
|
|
0.59 |
|
|
|
(0.11 |
) |
|
|
0.48 |
|
|
|
(0.57 |
) |
|
|
0.00 |
|
|
|
(0.39 |
) |
|
|
(0.96 |
) |
|
|
|
|
|
|
|
|
| |
| 06/30/2023 |
|
|
7.69 |
|
|
|
0.82 |
|
|
|
(0.81 |
) |
|
|
0.01 |
|
|
|
(0.73 |
) |
|
|
0.00 |
|
|
|
(0.23 |
) |
|
|
(0.96 |
) |
|
|
|
|
|
|
|
|
| |
| 06/30/2022 |
|
|
9.52 |
|
|
|
0.79 |
|
|
|
(1.66 |
) |
|
|
(0.87 |
) |
|
|
(0.93 |
) |
|
|
0.00 |
|
|
|
(0.03 |
) |
|
|
(0.96 |
) |
|
|
|
|
|
|
|
|
| |
| 06/30/2021 |
|
|
8.47 |
|
|
|
0.97 |
|
|
|
1.04 |
|
|
|
2.01 |
|
|
|
(0.96 |
) |
|
|
0.00 |
|
|
|
0.00 |
|
|
|
(0.96 |
) |
|
|
|
|
|
|
|
|
| |
PIMCO Global StocksPLUS & Income Fund |
|
|
|
| |
|
|
| |
|
|
| |
|
|
| |
|
|
| |
|
|
| |
|
|
| |
|
| |
|
|
|
|
|
|
|
|
| |
| 06/30/2025 |
|
$ |
7.43 |
|
|
$ |
0.77 |
|
|
$ |
0.76 |
|
|
$ |
1.53 |
|
|
$ |
(0.82 |
) |
|
$ |
0.00 |
|
|
$ |
(0.01 |
) |
|
$ |
(0.83 |
) |
|
|
|
|
|
|
|
|
| |
| 06/30/2024 |
|
|
7.29 |
|
|
|
0.62 |
|
|
|
0.35 |
|
|
|
0.97 |
|
|
|
(0.67 |
) |
|
|
0.00 |
|
|
|
(0.16 |
) |
|
|
(0.83 |
) |
|
|
|
|
|
|
|
|
| |
| 06/30/2023 |
|
|
7.27 |
|
|
|
0.77 |
|
|
|
0.08 |
|
|
|
0.85 |
|
|
|
(0.83 |
) |
|
|
0.00 |
|
|
|
0.00 |
|
|
|
(0.83 |
) |
|
|
|
|
|
|
|
|
| |
| 06/30/2022 |
|
|
10.44 |
|
|
|
0.87 |
|
|
|
(3.21 |
) |
|
|
(2.34 |
) |
|
|
(0.83 |
) |
|
|
0.00 |
|
|
|
0.00 |
|
|
|
(0.83 |
) |
|
|
|
|
|
|
|
|
| |
| 06/30/2021 |
|
|
7.47 |
|
|
|
0.95 |
|
|
|
2.85 |
|
|
|
3.80 |
|
|
|
(0.83 |
) |
|
|
0.00 |
|
|
|
0.00 |
|
|
|
(0.83 |
) |
|
|
|
|
|
|
|
|
| |
| PIMCO Strategic Income Fund, Inc. |
|
|
|
| |
|
|
| |
|
|
| |
|
|
| |
|
|
| |
|
|
| |
|
|
| |
|
| |
|
|
|
|
|
|
|
|
| |
| 06/30/2025 |
|
$ |
4.39 |
|
|
$ |
0.48 |
|
|
$ |
0.22 |
|
|
$ |
0.70 |
|
|
$ |
(0.54 |
) |
|
$ |
0.00 |
|
|
$ |
(0.01 |
) |
|
$ |
(0.55 |
) |
|
|
|
|
|
|
|
|
| |
| 06/30/2024 |
|
|
4.32 |
|
|
|
0.38 |
|
|
|
0.30 |
|
|
|
0.68 |
|
|
|
(0.43 |
) |
|
|
0.00 |
|
|
|
(0.18 |
) |
|
|
(0.61 |
) |
|
|
|
|
|
|
|
|
| |
| 06/30/2023 |
|
|
4.68 |
|
|
|
0.39 |
|
|
|
(0.14 |
) |
|
|
0.25 |
|
|
|
(0.61 |
) |
|
|
0.00 |
|
|
|
(0.00 |
) |
|
|
(0.61 |
) |
|
|
|
|
|
|
|
|
| |
| 06/30/2022 |
|
|
6.55 |
|
|
|
0.61 |
|
|
|
(1.87 |
) |
|
|
(1.26 |
) |
|
|
(0.60 |
) |
|
|
0.00 |
|
|
|
(0.01 |
) |
|
|
(0.61 |
) |
|
|
|
|
|
|
|
|
| |
| 06/30/2021 |
|
|
5.94 |
|
|
|
0.58 |
|
|
|
0.64 |
|
|
|
1.22 |
|
|
|
(0.41 |
) |
|
|
0.00 |
|
|
|
(0.20 |
) |
|
|
(0.61 |
) |
|
|
|
|
|
|
|
|
| |
| PIMCO Access Income Fund (Consolidated) |
|
|
|
| |
|
|
| |
|
|
| |
|
|
| |
|
|
| |
|
|
| |
|
|
| |
|
| |
|
|
|
|
|
|
|
|
| |
| 06/30/2025 |
|
$ |
15.02 |
|
|
$ |
1.59 |
|
|
$ |
0.42 |
|
|
$ |
2.01 |
|
|
$ |
(1.66 |
) |
|
$ |
0.00 |
|
|
$ |
(0.13 |
) |
|
$ |
(1.79 |
) |
|
|
|
|
|
|
|
|
| |
| 06/30/2024 |
|
|
14.86 |
|
|
|
1.36 |
|
|
|
0.59 |
|
|
|
1.95 |
|
|
|
(1.47 |
) |
|
|
0.00 |
|
|
|
(0.32 |
) |
|
|
(1.79 |
) |
|
|
|
|
|
|
|
|
| |
| 06/30/2023 |
|
|
17.20 |
|
|
|
1.81 |
|
|
|
(1.90 |
) |
|
|
(0.09 |
) |
|
|
(2.25 |
) |
|
|
0.00 |
|
|
|
0.00 |
|
|
|
(2.25 |
) |
|
|
|
|
|
|
|
|
| |
| 01/31/2022 - 06/30/2022 |
|
|
20.00 |
|
|
|
0.45 |
|
|
|
(2.78 |
) |
|
|
(2.33 |
) |
|
|
(0.47 |
) |
|
|
0.00 |
|
|
|
0.00 |
|
|
|
(0.47 |
) |
|
|
|
|
|
|
|
|
| |
| PIMCO Dynamic Income Fund (Consolidated) |
|
|
|
| |
|
|
| |
|
|
| |
|
|
| |
|
|
| |
|
|
| |
|
|
| |
|
| |
|
|
|
|
|
|
|
|
| |
| 6/30/2025 |
|
$ |
16.82 |
|
|
$ |
2.12 |
|
|
$ |
0.23 |
|
|
$ |
2.35 |
|
|
$ |
(2.13 |
) |
|
$ |
0.00 |
|
|
$ |
(0.52 |
) |
|
$ |
(2.65 |
) |
|
|
|
|
|
|
|
|
| |
| 6/30/2024 |
|
|
17.27 |
|
|
|
1.77 |
|
|
|
0.19 |
|
|
|
1.96 |
|
|
|
(1.37 |
) |
|
|
0.00 |
|
|
|
(1.28 |
) |
|
|
(2.65 |
) |
|
|
|
|
|
|
|
|
| |
| 6/30/2023 |
|
|
19.72 |
|
|
|
2.23 |
|
|
|
(1.56 |
) |
|
|
0.67 |
|
|
|
(3.30 |
) |
|
|
0.00 |
|
|
|
0.00 |
|
|
|
(3.30 |
) |
|
|
|
|
|
|
|
|
| |
| 6/30/2022 |
|
|
25.23 |
|
|
|
2.84 |
|
|
|
(5.77 |
) |
|
|
(2.93 |
) |
|
|
(2.65 |
) |
|
|
0.00 |
|
|
|
0.00 |
|
|
|
(2.65 |
) |
|
|
|
|
|
|
|
|
| |
| 6/30/2021 |
|
|
22.59 |
|
|
|
2.51 |
|
|
|
2.57 |
|
|
|
5.08 |
|
|
|
(2.52 |
) |
|
|
0.00 |
|
|
|
(0.13 |
) |
|
|
(2.65 |
) |
|
|
|
|
|
|
|
|
| |
| 06/30/2020 ~ |
|
|
28.29 |
|
|
|
2.92 |
|
|
|
(5.80 |
) |
|
|
(2.88 |
) |
|
|
(3.07 |
) |
|
|
0.00 |
|
|
|
0.00 |
|
|
|
(3.07 |
) |
|
|
|
|
|
|
|
|
| |
| 06/30/2019 ~ |
|
|
28.98 |
|
|
|
2.73 |
|
|
|
(0.37 |
) |
|
|
2.36 |
|
|
|
(3.15 |
) |
|
|
0.00 |
|
|
|
0.00 |
|
|
|
(3.15 |
) |
|
|
|
|
|
|
|
|
| |
| 06/30/2018 ~ |
|
|
28.32 |
|
|
|
2.95 |
|
|
|
0.18 |
|
|
|
3.13 |
|
|
|
(2.65 |
) |
|
|
0.00 |
|
|
|
0.00 |
|
|
|
(2.65 |
) |
|
|
|
|
|
|
|
|
| |
| 06/30/2017 ~ |
|
|
26.56 |
|
|
|
2.60 |
|
|
|
3.18 |
|
|
|
5.78 |
|
|
|
(4.10 |
) |
|
|
0.00 |
|
|
|
0.00 |
|
|
|
(4.10 |
) |
|
|
|
|
|
|
|
|
| |
| 06/30/2016 ~ |
|
|
31.38 |
|
|
|
3.87 |
|
|
|
(3.45 |
) |
|
|
0.42 |
|
|
|
(4.25 |
) |
|
|
(0.99 |
) |
|
|
0.00 |
|
|
|
(5.24 |
) |
|
|
|
|
|
|
|
|
| |
| PIMCO Dynamic Income Opportunities Fund (Consolidated) |
|
|
|
| |
|
|
| |
|
|
| |
|
|
| |
|
|
| |
|
|
| |
|
|
| |
|
| |
|
|
|
|
|
|
|
|
| |
| 6/30/2025 |
|
$ |
12.65 |
|
|
$ |
1.42 |
|
|
$ |
0.40 |
|
|
$ |
1.82 |
|
|
$ |
(1.47 |
) |
|
$ |
0.00 |
|
|
$ |
(0.06 |
) |
|
$ |
(1.53 |
) |
|
|
|
|
|
|
|
|
| |
| 6/30/2024 |
|
|
12.69 |
|
|
|
1.31 |
|
|
|
0.17 |
|
|
|
1.48 |
|
|
|
(1.08 |
) |
|
|
0.00 |
|
|
|
(0.45 |
) |
|
|
(1.53 |
) |
|
|
|
|
|
|
|
|
| |
| 6/30/2023 |
|
|
15.31 |
|
|
|
1.50 |
|
|
|
(1.63 |
) |
|
|
(0.13 |
) |
|
|
(2.49 |
) |
|
|
0.00 |
|
|
|
0.00 |
|
|
|
(2.49 |
) |
|
|
|
|
|
|
|
|
| |
| 6/30/2022 |
|
|
20.50 |
|
|
|
1.73 |
|
|
|
(5.01 |
) |
|
|
(3.28 |
) |
|
|
(1.79 |
) |
|
|
(0.12 |
) |
|
|
0.00 |
|
|
|
(1.91 |
) |
|
|
|
|
|
|
|
|
| |
| |
|
|
20.00 |
|
|
|
0.49 |
|
|
|
0.47 |
|
|
|
0.96 |
|
|
|
(0.47 |
) |
|
|
0.00 |
|
|
|
0.00 |
|
|
|
(0.47 |
) |
|
|
|
|
|
|
|
|
| |
| PIMCO Dynamic Income Strategy Fund (Consolidated) |
|
|
|
| |
|
|
| |
|
|
| |
|
|
| |
|
|
| |
|
|
| |
|
|
| |
|
| |
|
|
|
|
|
|
|
|
| |
| 6/30/2025 |
|
$ |
24.93 |
|
|
$ |
1.40 |
|
|
$ |
2.28 |
|
|
$ |
3.68 |
|
|
$ |
(1.48 |
) |
|
$ |
(0.37 |
) |
|
$ |
0.00 |
|
|
$ |
(1.85 |
) |
|
|
|
|
|
|
|
|
| |
| 6/30/2024 |
|
|
18.49 |
|
|
|
0.72 |
|
|
|
6.76 |
|
|
|
7.48 |
|
|
|
(1.04 |
) |
|
|
0.00 |
|
|
|
0.00 |
|
|
|
(1.04 |
) |
|
|
|
|
|
|
|
|
| |
| 6/30/2023 |
|
|
15.24 |
|
|
|
0.39 |
|
|
|
3.74 |
|
|
|
4.13 |
|
|
|
(0.66 |
) |
|
|
0.00 |
|
|
|
(0.22 |
) |
|
|
(0.88 |
) |
|
|
|
|
|
|
|
|
| |
| 6/30/2022 |
|
|
14.27 |
|
|
|
0.43 |
|
|
|
1.32 |
|
|
|
1.75 |
|
|
|
(0.47 |
) |
|
|
0.00 |
|
|
|
(0.31 |
) |
|
|
(0.78 |
) |
|
|
|
|
|
|
|
|
| |
| 6/30/2021 |
|
|
8.63 |
|
|
|
0.32 |
|
|
|
6.00 |
|
|
|
6.32 |
|
|
|
(0.09 |
) |
|
|
0.00 |
|
|
|
(0.59 |
) |
|
|
(0.68 |
) |
* |
Annualized, except for organizational expense, if any. |
^ |
A zero balance may reflect actual amounts rounding to less than $0.01 or 0.01%. |
~ |
Not covered by the Report of Independent Registered Public Accounting Firm. |
|
Includes adjustments required by U.S. GAAP and may differ from net asset values and performance reported elsewhere by the Funds. |
|
Per share amounts based on average number of shares outstanding during the year or period. |
|
The tax characterization of distributions is determined in accordance with Federal income tax regulations. See Note 2, Distributions — Common Shares, in the Notes to Financial Statements for more information. |
|
Total investment return is calculated assuming a purchase of a share at the market price on the first day and a sale of a share at the market price on the last day of each year reported. Dividends and distributions, if any, are assumed, for purposes of this calculation, to be reinvested at prices obtained under the Fund’s dividend reinvestment plan. Total investment return does not reflect brokerage commissions in connection with the purchase or sale of Fund shares. |
|
Ratio includes interest expense which primarily relates to participation in borrowing and financing transactions. See Note 5, Borrowings and Other Financing Transactions, in the Notes to Financial Statements for more information. |
|
Effective December 13, 2021, the Fund’s Investment advisory fee was decreased by 0.05% to an annual rate of 1.10%. |
|
|
|
|
|
|
| |
20 |
|
PIMCO CLOSED-END FUNDS |
|
|
See Accompanying Notes |
|
|
|
|
|
|
|
|
|
|
|
|
|
|
|
|
|
|
|
|
|
|
|
|
|
|
|
|
|
|
|
|
|
|
|
|
|
|
|
|
|
|
|
|
|
|
|
| |
| |
|
|
|
|
|
Common Share |
|
|
Ratios/Supplemental Data |
|
|
|
|
| |
|
|
|
|
|
|
|
|
|
|
|
|
|
|
|
|
|
Ratios to Average Net Assets |
|
|
|
|
| Increase resulting from Common Share offering |
|
|
Offering Cost Charged to Paid in Capital |
|
|
Net Asset Value End of Year or |
|
|
Market Price End of Year or Period |
|
|
Total Investment |
|
|
Net Assets Applicable to Common Shareholders End of Year or Period (000s) |
|
|
|
|
|
Expenses Excluding |
|
|
Expenses Excluding Interest Expense |
|
|
Expenses Excluding Interest Expense and
Waivers |
|
|
Net Investment Income (Loss) |
|
|
Portfolio Turnover Rate |
|
|
|
|
|
|
|
|
|
|
|
|
| |
|
|
|
| |
|
|
| |
|
|
| |
|
|
| |
|
|
| |
|
|
| |
|
|
| |
|
|
| |
|
|
| |
|
|
| |
|
|
| |
|
| |
|
|
|
|
|
|
|
|
|
|
|
| |
| $ |
N/A |
|
|
$ |
N/A |
|
|
$ |
5.97 |
|
|
$ |
6.33 |
|
|
|
(3.21 |
)% |
|
$ |
73,084 |
|
|
|
4.76 |
% |
|
|
4.76 |
% |
|
|
1.43 |
% |
|
|
1.43 |
% |
|
|
11.41 |
% |
|
|
14 |
% |
|
|
|
|
|
|
|
|
|
|
|
| |
| |
N/A |
|
|
|
N/A |
|
|
|
6.26 |
|
|
|
7.42 |
|
|
|
(12.97 |
) |
|
|
75,490 |
|
|
|
6.69 |
|
|
|
6.69 |
|
|
|
1.58 |
|
|
|
1.58 |
|
|
|
9.21 |
|
|
|
10 |
|
|
|
|
|
|
|
|
|
|
|
|
| |
| |
N/A |
|
|
|
N/A |
|
|
|
6.74 |
|
|
|
9.63 |
|
|
|
16.30 |
|
|
|
80,318 |
|
|
|
5.68 |
|
|
|
5.68 |
|
|
|
1.68 |
|
|
|
1.68 |
|
|
|
11.29 |
|
|
|
20 |
|
|
|
|
|
|
|
|
|
|
|
|
| |
| |
N/A |
|
|
|
N/A |
|
|
|
7.69 |
|
|
|
9.25 |
|
|
|
(14.44 |
) |
|
|
90,639 |
|
|
|
2.30 |
|
|
|
2.30 |
|
|
|
1.63 |
|
|
|
1.63 |
|
|
|
8.71 |
|
|
|
65 |
|
|
|
|
|
|
|
|
|
|
|
|
| |
| |
N/A |
|
|
|
N/A |
|
|
|
9.52 |
|
|
|
11.87 |
|
|
|
38.25 |
|
|
|
111,154 |
|
|
|
2.49 |
|
|
|
2.49 |
|
|
|
1.60 |
|
|
|
1.60 |
|
|
|
10.56 |
|
|
|
127 |
|
|
|
|
|
|
|
|
|
|
|
|
| |
|
|
|
| |
|
|
| |
|
|
| |
|
|
| |
|
|
| |
|
|
| |
|
|
| |
|
|
| |
|
|
| |
|
|
| |
|
|
| |
|
| |
|
|
|
|
|
|
|
|
|
|
|
| |
| $ |
N/A |
|
|
$ |
N/A |
|
|
$ |
8.13 |
|
|
$ |
8.29 |
|
|
|
21.99 |
% |
|
$ |
93,918 |
|
|
|
2.53 |
% |
|
|
2.53 |
% |
|
|
1.33 |
% |
|
|
1.33 |
% |
|
|
9.95 |
% |
|
|
576 |
% |
|
|
|
|
|
|
|
|
|
|
|
| |
| |
N/A |
|
|
|
N/A |
|
|
|
7.43 |
|
|
|
7.55 |
|
|
|
17.56 |
|
|
|
85,162 |
|
|
|
3.43 |
|
|
|
3.43 |
|
|
|
1.39 |
|
|
|
1.39 |
|
|
|
8.63 |
|
|
|
586 |
|
|
|
|
|
|
|
|
|
|
|
|
| |
| |
N/A |
|
|
|
N/A |
|
|
|
7.29 |
|
|
|
7.20 |
|
|
|
2.32 |
|
|
|
82,667 |
|
|
|
3.79 |
|
|
|
3.79 |
|
|
|
1.65 |
|
|
|
1.65 |
|
|
|
10.69 |
|
|
|
483 |
|
|
|
|
|
|
|
|
|
|
|
|
| |
| |
N/A |
|
|
|
N/A |
|
|
|
7.27 |
|
|
|
7.89 |
|
|
|
(22.51 |
) |
|
|
81,353 |
|
|
|
2.09 |
|
|
|
2.09 |
|
|
|
1.76 |
|
|
|
1.76 |
|
|
|
8.96 |
|
|
|
373 |
|
|
|
|
|
|
|
|
|
|
|
|
| |
| |
N/A |
|
|
|
N/A |
|
|
|
10.44 |
|
|
|
11.10 |
|
|
|
48.12 |
|
|
|
115,748 |
|
|
|
2.03 |
|
|
|
2.03 |
|
|
|
1.66 |
|
|
|
1.66 |
|
|
|
10.35 |
|
|
|
503 |
|
|
|
|
|
|
|
|
|
|
|
|
| |
|
|
|
| |
|
|
| |
|
|
|
|
|
|
| |
|
|
| |
|
|
| |
|
|
| |
|
|
| |
|
|
| |
|
|
| |
|
|
| |
|
| |
|
|
|
|
|
|
|
|
|
|
|
| |
| $ |
N/A |
|
|
$ |
N/A |
|
|
$ |
4.54 |
|
|
$ |
6.96 |
|
|
|
21.79 |
% |
|
$ |
212,131 |
|
|
|
3.49 |
% |
|
|
3.49 |
% |
|
|
0.96 |
% |
|
|
0.96 |
% |
|
|
10.78 |
% |
|
|
948 |
% |
|
|
|
|
|
|
|
|
|
|
|
| |
| |
N/A |
|
|
|
N/A |
|
|
|
4.39 |
|
|
|
6.21 |
|
|
|
33.49 |
|
|
|
202,598 |
|
|
|
5.12 |
|
|
|
5.12 |
|
|
|
0.98 |
|
|
|
0.98 |
|
|
|
8.83 |
|
|
|
819 |
|
|
|
|
|
|
|
|
|
|
|
|
| |
| |
N/A |
|
|
|
N/A |
|
|
|
4.32 |
|
|
|
5.20 |
|
|
|
14.43 |
|
|
|
196,497 |
|
|
|
3.87 |
|
|
|
3.87 |
|
|
|
0.97 |
|
|
|
0.97 |
|
|
|
8.73 |
|
|
|
639 |
|
|
|
|
|
|
|
|
|
|
|
|
| |
| |
N/A |
|
|
|
N/A |
|
|
|
4.68 |
|
|
|
5.13 |
|
|
|
(25.44 |
) |
|
|
210,018 |
|
|
|
1.44 |
|
|
|
1.44 |
|
|
|
0.98 |
|
|
|
0.98 |
|
|
|
10.29 |
|
|
|
678 |
|
|
|
|
|
|
|
|
|
|
|
|
| |
| |
N/A |
|
|
|
N/A |
|
|
|
6.55 |
|
|
|
7.61 |
|
|
|
30.90 |
|
|
|
290,989 |
|
|
|
1.36 |
|
|
|
1.36 |
|
|
|
0.96 |
|
|
|
0.96 |
|
|
|
8.97 |
|
|
|
774 |
|
|
|
|
|
|
|
|
|
|
|
|
| |
|
|
|
| |
|
|
| |
|
|
|
|
|
|
| |
|
|
| |
|
|
| |
|
|
| |
|
|
| |
|
|
| |
|
|
| |
|
|
| |
|
| |
|
|
|
|
|
|
|
|
|
|
|
| |
| $ |
0.01 |
|
|
$ |
N/A |
|
|
$ |
15.25 |
|
|
$ |
15.11 |
|
|
|
7.30 |
% |
|
$ |
694,861 |
|
|
|
5.85 |
% |
|
|
5.85 |
% |
|
|
2.09 |
% |
|
|
2.09 |
% |
|
|
10.43 |
% |
|
|
24 |
% |
|
|
|
|
|
|
|
|
|
|
|
| |
| |
N/A |
|
|
|
N/A |
|
|
|
15.02 |
|
|
|
15.81 |
|
|
|
21.00 |
|
|
|
662,635 |
|
|
|
7.11 |
|
|
|
7.11 |
|
|
|
2.19 |
|
|
|
2.19 |
|
|
|
9.26 |
|
|
|
17 |
|
|
|
|
|
|
|
|
|
|
|
|
| |
| |
N/A |
|
|
|
N/A |
|
|
|
14.86 |
|
|
|
14.75 |
|
|
|
7.53 |
|
|
|
653,891 |
|
|
|
5.92 |
|
|
|
5.92 |
|
|
|
2.24 |
|
|
|
2.24 |
|
|
|
11.10 |
|
|
|
28 |
|
|
|
|
|
|
|
|
|
|
|
|
| |
| |
N/A |
|
|
|
N/A |
|
|
|
17.20 |
|
|
|
15.83 |
|
|
|
(18.72 |
) |
|
|
756,653 |
|
|
|
1.79 |
* |
|
|
1.79 |
* |
|
|
1.51 |
* |
|
|
1.51 |
* |
|
|
5.81 |
* |
|
|
16 |
|
|
|
|
|
|
|
|
|
|
|
|
| |
|
|
|
| |
|
|
| |
|
|
|
|
|
|
| |
|
|
| |
|
|
| |
|
|
| |
|
|
| |
|
|
| |
|
|
| |
|
|
| |
|
| |
|
|
|
|
|
|
|
|
|
|
|
| |
| $ |
0.41 |
|
|
$ |
0.00 |
|
|
$ |
16.93 |
|
|
$ |
18.97 |
|
|
|
16.42 |
% |
|
$ |
6,642,643 |
|
|
|
4.46 |
% |
|
|
4.46 |
% |
|
|
1.67 |
% |
|
|
1.67 |
% |
|
|
12.48 |
% |
|
|
28 |
% |
|
|
|
|
|
|
|
|
|
|
|
| |
| |
0.24 |
|
|
|
0.00 |
|
|
|
16.82 |
|
|
|
18.81 |
|
|
|
16.48 |
|
|
|
5,303,316 |
|
|
|
6.13 |
|
|
|
6.13 |
|
|
|
1.84 |
|
|
|
1.84 |
|
|
|
10.47 |
|
|
|
17 |
|
|
|
|
|
|
|
|
|
|
|
|
| |
| |
0.18 |
|
|
|
0.00 |
|
|
|
17.27 |
|
|
|
18.75 |
|
|
|
7.22 |
|
|
|
4,578,482 |
|
|
|
5.12 |
|
|
|
5.12 |
|
|
|
1.92 |
|
|
|
1.92 |
|
|
|
12.10 |
|
|
|
20 |
|
|
|
|
|
|
|
|
|
|
|
|
| |
| |
0.07 |
|
|
|
0.00 |
|
|
|
19.72 |
|
|
|
20.87 |
|
|
|
(19.10 |
) |
|
|
4,466,886 |
|
|
|
2.64 |
(f) |
|
|
2.64 |
(f) |
|
|
2.00 |
(f) |
|
|
2.00 |
(f) |
|
|
12.28 |
|
|
|
27 |
|
|
|
|
|
|
|
|
|
|
|
|
| |
| |
0.21 |
|
|
|
0.00 |
|
|
|
25.23 |
|
|
|
28.81 |
|
|
|
29.29 |
|
|
|
1,781,435 |
|
|
|
2.78 |
|
|
|
2.78 |
|
|
|
2.04 |
|
|
|
2.04 |
|
|
|
10.36 |
|
|
|
38 |
|
|
|
|
|
|
|
|
|
|
|
|
| |
| |
0.25 |
|
|
|
0.00 |
|
|
|
22.59 |
|
|
|
24.72 |
|
|
|
(14.18 |
) |
|
|
1,375,107 |
|
|
|
3.72 |
|
|
|
3.72 |
|
|
|
1.99 |
|
|
|
1.99 |
|
|
|
11.44 |
|
|
|
21 |
|
|
|
|
|
|
|
|
|
|
|
|
| |
| |
0.10 |
|
|
|
(0.00 |
) |
|
|
28.29 |
|
|
|
32.15 |
|
|
|
12.03 |
|
|
|
1,603,368 |
|
|
|
3.96 |
|
|
|
3.96 |
|
|
|
1.89 |
|
|
|
1.89 |
|
|
|
9.70 |
|
|
|
12 |
|
|
|
|
|
|
|
|
|
|
|
|
| |
| |
0.18 |
|
|
|
(0.00 |
) |
|
|
28.98 |
|
|
|
31.87 |
|
|
|
15.54 |
|
|
|
1,575,523 |
|
|
|
4.07 |
|
|
|
4.07 |
|
|
|
2.01 |
|
|
|
2.01 |
|
|
|
10.26 |
|
|
|
9 |
|
|
|
|
|
|
|
|
|
|
|
|
| |
| |
0.08 |
|
|
|
0.00 |
|
|
|
28.32 |
|
|
|
30.18 |
|
|
|
27.07 |
|
|
|
1,372,674 |
|
|
|
4.08 |
|
|
|
4.08 |
|
|
|
2.14 |
|
|
|
2.14 |
|
|
|
9.58 |
|
|
|
20 |
|
|
|
|
|
|
|
|
|
|
|
|
| |
| |
N/A |
|
|
|
N/A |
|
|
|
26.56 |
|
|
|
27.57 |
|
|
|
13.75 |
|
|
|
1,222,499 |
|
|
|
3.60 |
|
|
|
3.60 |
|
|
|
2.12 |
|
|
|
2.12 |
|
|
|
13.67 |
|
|
|
13 |
|
|
|
|
|
|
|
|
|
|
|
|
| |
|
|
|
| |
|
|
| |
|
|
|
|
|
|
| |
|
|
| |
|
|
| |
|
|
| |
|
|
| |
|
|
| |
|
|
| |
|
|
| |
|
| |
|
|
|
|
|
|
|
|
|
|
|
| |
| $ |
0.06 |
|
|
$ |
0.00 |
|
|
$ |
13.00 |
|
|
$ |
13.48 |
|
|
|
13.97 |
% |
|
$ |
1,713,149 |
|
|
|
5.22 |
% |
|
|
5.22 |
% |
|
|
1.84 |
% |
|
|
1.84 |
% |
|
|
10.91 |
% |
|
|
22 |
% |
|
|
|
|
|
|
|
|
|
|
|
| |
| |
0.01 |
|
|
|
0.00 |
|
|
|
12.65 |
|
|
|
13.29 |
|
|
|
15.12 |
|
|
|
1,465,670 |
|
|
|
6.63 |
|
|
|
6.63 |
|
|
|
1.97 |
|
|
|
1.97 |
|
|
|
10.68 |
|
|
|
25 |
|
|
|
|
|
|
|
|
|
|
|
|
| |
| |
0.00 |
|
|
|
0.00 |
|
|
|
12.69 |
|
|
|
13.06 |
|
|
|
13.17 |
|
|
|
1,406,536 |
|
|
|
5.75 |
|
|
|
5.75 |
|
|
|
2.11 |
|
|
|
2.11 |
|
|
|
10.67 |
|
|
|
17 |
|
|
|
|
|
|
|
|
|
|
|
|
| |
| |
N/A |
|
|
|
N/A |
|
|
|
15.31 |
|
|
|
13.85 |
|
|
|
(33.77 |
) |
|
|
1,684,507 |
|
|
|
2.79 |
|
|
|
2.79 |
|
|
|
2.12 |
|
|
|
2.12 |
|
|
|
9.11 |
|
|
|
47 |
|
|
|
|
|
|
|
|
|
|
|
|
| |
| |
0.01 |
|
|
|
N/A |
|
|
|
20.50 |
|
|
|
23.18 |
|
|
|
16.70 |
|
|
|
2,227,301 |
|
|
|
2.10 |
* |
|
|
2.10 |
* |
|
|
1.78 |
* |
|
|
1.78 |
* |
|
|
5.93 |
* |
|
|
49 |
|
|
|
|
|
|
|
|
|
|
|
|
| |
|
|
|
| |
|
|
| |
|
|
|
|
|
|
| |
|
|
| |
|
|
| |
|
|
| |
|
|
| |
|
|
| |
|
|
| |
|
|
| |
|
| |
|
|
|
|
|
|
|
|
|
|
|
| |
| $ |
N/A |
|
|
$ |
N/A |
|
|
$ |
26.76 |
|
|
$ |
24.65 |
|
|
|
18.92 |
% |
|
$ |
1,196,516 |
|
|
|
3.29 |
% |
|
|
3.29 |
% |
|
|
1.65 |
% |
|
|
1.65 |
%* |
|
|
5.34 |
% |
|
|
53 |
% |
|
|
|
|
|
|
|
|
|
|
|
| |
| |
N/A |
|
|
|
N/A |
|
|
|
24.93 |
|
|
|
22.28 |
|
|
|
48.61 |
|
|
|
1,114,645 |
|
|
|
2.31 |
|
|
|
2.32 |
|
|
|
1.45 |
|
|
|
1.46 |
|
|
|
3.25 |
|
|
|
113 |
|
|
|
|
|
|
|
|
|
|
|
|
| |
| |
N/A |
|
|
|
N/A |
|
|
|
18.49 |
|
|
|
15.76 |
|
|
|
29.99 |
|
|
|
826,517 |
|
|
|
2.66 |
|
|
|
2.68 |
|
|
|
1.65 |
|
|
|
1.67 |
|
|
|
2.16 |
|
|
|
50 |
|
|
|
|
|
|
|
|
|
|
|
|
| |
| |
N/A |
|
|
|
N/A |
|
|
|
15.24 |
|
|
|
12.84 |
|
|
|
8.76 |
|
|
|
681,193 |
|
|
|
1.76 |
|
|
|
1.79 |
|
|
|
1.68 |
|
|
|
1.71 |
|
|
|
2.71 |
|
|
|
77 |
|
|
|
|
|
|
|
|
|
|
|
|
| |
| |
N/A |
|
|
|
N/A |
|
|
|
14.27 |
|
|
|
12.50 |
|
|
|
90.94 |
|
|
|
637,792 |
|
|
|
1.54 |
|
|
|
1.60 |
|
|
|
1.53 |
|
|
|
1.59 |
|
|
|
2.96 |
|
|
|
118 |
|
|
|
|
|
|
|
|
|
|
|
|
|
| |
| |
|
|
ANNUAL REPORT |
|
|
| |
|
|
JUNE 30, 2025 |
|
|
21 |
|
|
|
|
| |
Statements of Assets and Liabilities |
|
|
|
June 30, 2025 |
|
|
|
|
|
|
|
|
|
|
|
|
| |
(Amounts in thousands , except per share amounts) |
|
PCM Fund, Inc. |
|
|
PIMCO Income Fund |
|
|
PIMCO Strategic Income Fund, Inc. |
|
|
|
|
| |
Assets: |
|
|
|
| |
|
|
| |
|
| |
|
|
|
| |
|
|
|
|
|
|
|
|
|
|
|
|
|
Investments in securities |
|
$ |
102,136 |
|
|
$ |
142,208 |
|
|
$ |
591,849 |
|
Investments in Affiliates |
|
|
7,137 |
|
|
|
10,174 |
|
|
|
7,682 |
|
Financial Derivative Instruments |
|
|
|
|
|
|
|
|
|
|
|
|
Exchange-traded or centrally cleared |
|
|
47 |
|
|
|
348 |
|
|
|
258 |
|
Over the counter |
|
|
0 |
|
|
|
6,464 |
|
|
|
798 |
|
Cash |
|
|
80 |
|
|
|
77 |
|
|
|
1,283 |
|
Deposits with counterparty |
|
|
1,423 |
|
|
|
3,392 |
|
|
|
6,193 |
|
Foreign currency, at value |
|
|
5 |
|
|
|
204 |
|
|
|
476 |
|
Receivable for investments sold |
|
|
212 |
|
|
|
2,784 |
|
|
|
2,533 |
|
Receivable for TBA investments sold |
|
|
0 |
|
|
|
46,326 |
|
|
|
415,439 |
|
Interest and/or dividends receivable |
|
|
776 |
|
|
|
1,259 |
|
|
|
3,048 |
|
Dividends receivable from Affiliates |
|
|
23 |
|
|
|
36 |
|
|
|
48 |
|
Other assets |
|
|
11 |
|
|
|
0 |
|
|
|
0 |
|
Total Assets |
|
|
111,850 |
|
|
|
213,272 |
|
|
|
1,029,607 |
|
|
|
|
| |
Liabilities: |
|
|
|
| |
|
|
| |
|
| |
|
|
|
| |
Borrowings & Other Financing Transactions |
|
|
|
|
|
|
|
|
|
|
|
|
Payable for reverse repurchase agreements |
|
$ |
36,729 |
|
|
$ |
19,351 |
|
|
$ |
95,152 |
|
Payable for short sales |
|
|
0 |
|
|
|
634 |
|
|
|
6,286 |
|
Financial Derivative Instruments |
|
|
|
|
|
|
|
|
|
|
|
|
Exchange-traded or centrally cleared |
|
|
92 |
|
|
|
1,578 |
|
|
|
552 |
|
Over the counter |
|
|
112 |
|
|
|
938 |
|
|
|
2,166 |
|
Payable for investments purchased |
|
|
526 |
|
|
|
4,072 |
|
|
|
6,448 |
|
Payable for investments in Affiliates purchased |
|
|
24 |
|
|
|
37 |
|
|
|
49 |
|
Payable for investments purchased on a delayed-delivery basis |
|
|
0 |
|
|
|
6 |
|
|
|
0 |
|
Payable for TBA investments purchased |
|
|
0 |
|
|
|
84,456 |
|
|
|
701,383 |
|
Payable for unfunded loan commitments |
|
|
398 |
|
|
|
1,044 |
|
|
|
0 |
|
Deposits from counterparty |
|
|
21 |
|
|
|
6,341 |
|
|
|
3,407 |
|
Distributions payable to common shareholders |
|
|
786 |
|
|
|
797 |
|
|
|
1,869 |
|
Accrued management fees |
|
|
78 |
|
|
|
98 |
|
|
|
159 |
|
Foreign capital gains tax payable |
|
|
0 |
|
|
|
2 |
|
|
|
5 |
|
Total Liabilities |
|
|
38,766 |
|
|
|
119,354 |
|
|
|
817,476 |
|
|
|
|
| |
Commitments and Contingent Liabilities^ |
|
|
|
|
|
|
|
|
|
|
|
|
|
|
|
| |
Net Assets Applicable to Common Shareholders |
|
$ |
73,084 |
|
|
$ |
93,918 |
|
|
$ |
212,131 |
|
|
|
|
| |
Net Assets Applicable to Common Shareholders Consist of: |
|
|
|
| |
|
|
| |
|
| |
|
|
|
| |
|
|
$ |
12 |
|
|
$ |
0 |
|
|
$ |
0 |
|
Paid in capital in excess of par |
|
|
106,418 |
|
|
|
135,391 |
|
|
|
342,814 |
|
Distributable earnings (accumulated loss) |
|
|
(33,346 |
) |
|
|
(41,473 |
) |
|
|
(130,683 |
) |
|
|
|
| |
Net Assets Applicable to Common Shareholders |
|
$ |
73,084 |
|
|
$ |
93,918 |
|
|
$ |
212,131 |
|
|
|
|
| |
Common Shares Outstanding |
|
|
12,236 |
|
|
|
11,553 |
|
|
|
46,726 |
|
|
|
|
| |
Net Asset Value Per Common Share (a) |
|
$ |
5.97 |
|
|
$ |
8.13 |
|
|
$ |
4.54 |
|
|
|
|
| |
Cost of investments in securities |
|
$ |
125,382 |
|
|
$ |
164,176 |
|
|
$ |
648,814 |
|
Cost of investments in Affiliates |
|
$ |
7,130 |
|
|
$ |
10,166 |
|
|
$ |
7,680 |
|
Cost of foreign currency held |
|
$ |
4 |
|
|
$ |
232 |
|
|
$ |
557 |
|
Proceeds received on short sales |
|
$ |
0 |
|
|
$ |
629 |
|
|
$ |
6,238 |
|
Cost or premiums of financial derivative instruments, net |
|
$ |
977 |
|
|
$ |
(43 |
) |
|
$ |
7,206 |
|
|
A zero balance may reflect actual amounts rounding to less than one thousand. |
|
See Note 9, Fees and Expenses, in the Notes to Financial Statements for more information. |
|
($0.001 per share), ($0.00001 per share), ($0.00001 per share). |
|
Includes adjustments required by U.S. GAAP and may differ from net asset values and performance reported elsewhere by the Funds. |
|
|
|
|
|
|
| |
22 |
|
PIMCO CLOSED-END FUNDS |
|
|
See Accompanying Notes |
|
|
|
|
|
| |
Consolidated Statements of Assets and Liabilities |
|
|
|
June 30, 2025 |
|
|
|
|
|
|
|
|
|
|
|
|
|
|
|
|
| |
(Amounts in thousands , except per share amounts) |
|
PIMCO Access Income Fund |
|
|
PIMCO Dynamic Income Fund |
|
|
PIMCO Dynamic Income Opportunities Fund |
|
|
PIMCO Dynamic Income Strategy Fund |
|
|
|
|
|
| |
Assets: |
|
|
|
| |
|
|
| |
|
|
| |
|
| |
|
|
|
|
| |
|
|
|
|
|
|
|
|
|
|
|
|
|
|
|
|
|
Investments in securities* |
|
$ |
1,079,330 |
|
|
$ |
8,825,639 |
|
|
$ |
2,492,603 |
|
|
$ |
1,186,837 |
|
Investments in Affiliates |
|
|
74,240 |
|
|
|
951,848 |
|
|
|
167,775 |
|
|
|
380,850 |
|
Financial Derivative Instruments |
|
|
|
|
|
|
|
|
|
|
|
|
|
|
|
|
Exchange-traded or centrally cleared |
|
|
449 |
|
|
|
5,478 |
|
|
|
1,322 |
|
|
|
365 |
|
Over the counter |
|
|
2,700 |
|
|
|
15,402 |
|
|
|
8,234 |
|
|
|
3,650 |
|
Cash |
|
|
323 |
|
|
|
50,032 |
|
|
|
548 |
|
|
|
0 |
|
Deposits with counterparty |
|
|
11,322 |
|
|
|
127,707 |
|
|
|
33,972 |
|
|
|
4,973 |
|
Foreign currency, at value |
|
|
2,492 |
|
|
|
6,507 |
|
|
|
23,083 |
|
|
|
812 |
|
Receivable for investments sold |
|
|
11,350 |
|
|
|
379,075 |
|
|
|
34,738 |
|
|
|
6,781 |
|
Receivable for investments in Affiliates sold |
|
|
0 |
|
|
|
0 |
|
|
|
0 |
|
|
|
2,200 |
|
Receivable for Fund shares sold |
|
|
0 |
|
|
|
11,301 |
|
|
|
531 |
|
|
|
0 |
|
Interest and/or dividends receivable |
|
|
10,136 |
|
|
|
108,796 |
|
|
|
27,198 |
|
|
|
9,227 |
|
Dividends receivable from Affiliates |
|
|
180 |
|
|
|
1,760 |
|
|
|
485 |
|
|
|
371 |
|
Other assets |
|
|
370 |
|
|
|
2,501 |
|
|
|
628 |
|
|
|
20 |
|
Total Assets |
|
|
1,192,892 |
|
|
|
10,486,046 |
|
|
|
2,791,117 |
|
|
|
1,596,086 |
|
|
|
|
|
| |
Liabilities: |
|
|
|
| |
|
|
| |
|
|
| |
|
| |
|
|
|
|
| |
Borrowings & Other Financing Transactions |
|
|
|
|
|
|
|
|
|
|
|
|
|
|
|
|
Payable for reverse repurchase agreements |
|
$ |
456,952 |
|
|
$ |
3,398,288 |
|
|
$ |
975,727 |
|
|
$ |
358,300 |
|
Financial Derivative Instruments |
|
|
|
|
|
|
|
|
|
|
|
|
|
|
|
|
Exchange-traded or centrally cleared |
|
|
406 |
|
|
|
2,812 |
|
|
|
1,108 |
|
|
|
0 |
|
Over the counter |
|
|
8,487 |
|
|
|
64,779 |
|
|
|
18,715 |
|
|
|
7,923 |
|
Payable for investments purchased |
|
|
10,754 |
|
|
|
168,442 |
|
|
|
29,832 |
|
|
|
16,862 |
|
Payable for investments in Affiliates purchased |
|
|
187 |
|
|
|
1,821 |
|
|
|
498 |
|
|
|
388 |
|
Payable for investments purchased on a delayed-delivery basis |
|
|
58 |
|
|
|
977 |
|
|
|
224 |
|
|
|
426 |
|
Payable for unfunded loan commitments |
|
|
8,185 |
|
|
|
75,861 |
|
|
|
18,537 |
|
|
|
4,852 |
|
Deposits from counterparty |
|
|
5,063 |
|
|
|
35,768 |
|
|
|
13,789 |
|
|
|
3,002 |
|
Distributions payable to common shareholders |
|
|
6,808 |
|
|
|
85,793 |
|
|
|
16,840 |
|
|
|
5,964 |
|
Overdraft due to custodian |
|
|
0 |
|
|
|
0 |
|
|
|
0 |
|
|
|
274 |
|
Accrued management fees |
|
|
1,130 |
|
|
|
8,590 |
|
|
|
2,415 |
|
|
|
1,579 |
|
Foreign capital gains tax payable |
|
|
1 |
|
|
|
75 |
|
|
|
277 |
|
|
|
0 |
|
Other liabilities |
|
|
0 |
|
|
|
197 |
|
|
|
6 |
|
|
|
0 |
|
Total Liabilities |
|
|
498,031 |
|
|
|
3,843,403 |
|
|
|
1,077,968 |
|
|
|
399,570 |
|
|
|
|
|
| |
Commitments and Contingent Liabilities^ |
|
|
|
|
|
|
|
|
|
|
|
|
|
|
|
|
|
|
|
|
| |
Net Assets Applicable to Common Shareholders |
|
$ |
694,861 |
|
|
$ |
6,642,643 |
|
|
$ |
1,713,149 |
|
|
$ |
1,196,516 |
|
|
|
|
|
| |
Net Assets Applicable to Common Shareholders Consist of: |
|
|
|
| |
|
|
| |
|
|
| |
|
| |
|
|
|
|
| |
|
|
$ |
0 |
|
|
$ |
4 |
|
|
$ |
1 |
|
|
$ |
0 |
|
Paid in capital in excess of par |
|
|
884,706 |
|
|
|
8,705,545 |
|
|
|
2,433,244 |
|
|
|
781,434 |
|
Distributable earnings (accumulated loss) |
|
|
(189,845 |
) |
|
|
(2,062,906 |
) |
|
|
(720,096 |
) |
|
|
415,082 |
|
|
|
|
|
| |
Net Assets Applicable to Common Shareholders |
|
$ |
694,861 |
|
|
$ |
6,642,643 |
|
|
$ |
1,713,149 |
|
|
$ |
1,196,516 |
|
|
|
|
|
| |
Common Shares Outstanding |
|
|
45,569 |
|
|
|
392,444 |
|
|
|
131,767 |
|
|
|
44,707 |
|
|
|
|
|
| |
Net Asset Value Per Common Share (a) |
|
$ |
15.25 |
|
|
$ |
16.93 |
|
|
$ |
13.00 |
|
|
$ |
26.76 |
|
|
|
|
|
| |
Cost of investments in securities |
|
$ |
1,196,042 |
|
|
$ |
9,772,580 |
|
|
$ |
2,827,118 |
|
|
|
1,136,192 |
|
Cost of investments in Affiliates |
|
$ |
74,357 |
|
|
$ |
980,316 |
|
|
$ |
168,035 |
|
|
|
158,562 |
|
Cost of foreign currency held |
|
$ |
2,459 |
|
|
$ |
5,825 |
|
|
$ |
22,574 |
|
|
|
811 |
|
Cost or premiums of financial derivative instruments, net |
|
$ |
13,203 |
|
|
$ |
33,850 |
|
|
$ |
26,733 |
|
|
|
(1 |
) |
|
|
|
|
| |
* Includes repurchase agreements of: |
|
$ |
0 |
|
|
$ |
166,689 |
|
|
$ |
0 |
|
|
$ |
2,200 |
|
|
A zero balance may reflect actual amounts rounding to less than one thousand. |
|
See Note 9, Fees and Expenses, in the Notes to Financial Statements for more information. |
|
Includes adjustments required by U.S. GAAP and may differ from net asset values and performance reported elsewhere by the Funds. |
|
|
|
|
|
|
|
|
|
|
|
|
| |
| |
|
|
ANNUAL REPORT |
|
|
| |
|
|
JUNE 30, 2025 |
|
|
23 |
|
|
|
|
|
|
|
|
|
|
|
|
| |
Year Ended June 30, 2025 |
|
|
|
PCM Fund, Inc. |
|
|
PIMCO Global StocksPLUS & Income Fund |
|
|
PIMCO
Strategic
Income Fund,
Inc. |
|
|
|
|
| |
| Investment Income: |
|
|
|
| |
|
|
| |
|
| |
|
|
|
| |
| Interest, net of foreign taxes* |
|
$ |
11,502 |
|
|
$ |
9,713 |
|
|
$ |
27,336 |
|
| Dividends, net of foreign taxes** |
|
|
113 |
|
|
|
512 |
|
|
|
1,223 |
|
| Dividends from Investments in Affiliates |
|
|
408 |
|
|
|
796 |
|
|
|
615 |
|
| Miscellaneous income |
|
|
116 |
|
|
|
163 |
|
|
|
421 |
|
| Total Income |
|
|
12,139 |
|
|
|
11,184 |
|
|
|
29,595 |
|
|
|
|
| |
| Expenses: |
|
|
|
| |
|
|
| |
|
| |
|
|
|
| |
| Management fees |
|
|
1,061 |
|
|
|
1,185 |
|
|
|
1,980 |
|
| Trustee fees and related expenses |
|
|
9 |
|
|
|
10 |
|
|
|
23 |
|
| Interest expense |
|
|
2,497 |
|
|
|
1,076 |
|
|
|
5,242 |
|
| Miscellaneous expense |
|
|
4 |
|
|
|
3 |
|
|
|
6 |
|
| Total Expenses |
|
|
3,571 |
|
|
|
2,274 |
|
|
|
7,251 |
|
|
|
|
| |
| Net Investment Income (Loss) |
|
|
8,568 |
|
|
|
8,910 |
|
|
|
22,344 |
|
|
|
|
| |
| Net Realized Gain (Loss): |
|
|
|
| |
|
|
| |
|
| |
|
|
|
| |
| Investments in securities |
|
|
1,187 |
|
|
|
(437 |
) |
|
|
8,324 |
|
| Investments in Affiliates |
|
|
3 |
|
|
|
16 |
|
|
|
17 |
|
| Exchange-traded or centrally cleared financial derivative instruments |
|
|
195 |
|
|
|
1,819 |
|
|
|
4,365 |
|
| Over the counter financial derivative instruments |
|
|
(59 |
) |
|
|
2,472 |
|
|
|
(993 |
) |
| Short sales |
|
|
2 |
|
|
|
0 |
|
|
|
0 |
|
| Foreign currency |
|
|
0 |
|
|
|
(91 |
) |
|
|
(176 |
) |
|
|
|
| |
| Net Realized Gain (Loss) |
|
|
1,328 |
|
|
|
3,779 |
|
|
|
11,537 |
|
|
|
|
| |
| Net Change in Unrealized Appreciation (Depreciation): |
|
|
|
| |
|
|
| |
|
| |
|
|
|
| |
| Investments in securities |
|
|
(3,742 |
) |
|
|
2,305 |
|
|
|
3,102 |
|
| Investments in Affiliates |
|
|
3 |
|
|
|
0 |
|
|
|
0 |
|
| Exchange-traded or centrally cleared financial derivative instruments |
|
|
659 |
|
|
|
687 |
|
|
|
(3,646 |
) |
| Over the counter financial derivative instruments |
|
|
107 |
|
|
|
1,953 |
|
|
|
(1,523 |
) |
| Foreign currency assets and liabilities |
|
|
1 |
|
|
|
(54 |
) |
|
|
(465 |
) |
|
|
|
| |
| Net Change in Unrealized Appreciation (Depreciation) |
|
|
(2,972 |
) |
|
|
4,891 |
|
|
|
(2,532 |
) |
|
|
|
| |
| Net Increase (Decrease) in Net Assets Resulting from Operations |
|
$ |
6,924 |
|
|
$ |
17,580 |
|
|
$ |
31,349 |
|
|
|
|
| |
| * Foreign tax withholdings |
|
$ |
0 |
|
|
$ |
17 |
|
|
$ |
44 |
|
|
|
|
| |
| ** Foreign tax withholdings — Dividends |
|
$ |
0 |
|
|
$ |
18 |
|
|
$ |
47 |
|
|
A zero balance may reflect actual amounts rounding to less than one thousand. |
|
|
|
|
|
|
| |
24 |
|
PIMCO CLOSED-END FUNDS |
|
|
See Accompanying Notes |
|
|
|
|
|
| |
Consolidated Statements of Operations |
|
|
|
|
|
|
|
|
|
|
|
|
|
|
|
|
|
|
|
|
| |
Year Ended June 30, 2025 |
|
|
|
|
|
|
|
|
|
|
|
|
|
|
PIMCO Access Income
Fund |
|
|
PIMCO
Dynamic
Income Fund |
|
|
PIMCO
Dynamic
Income
Opportunities
Fund |
|
|
PIMCO
Dynamic
Income
Strategy Fund |
|
|
|
|
|
| |
| Investment Income: |
|
|
|
| |
|
|
| |
|
|
| |
|
| |
|
|
|
|
| |
| Interest, net of foreign taxes* |
|
$ |
101,087 |
|
|
$ |
929,426 |
|
|
$ |
231,979 |
|
|
$ |
73,925 |
|
| Dividends, net of foreign taxes** |
|
|
5,133 |
|
|
|
44,142 |
|
|
|
16,259 |
|
|
|
22,382 |
|
| Dividends from Investments in Affiliates |
|
|
3,557 |
|
|
|
30,409 |
|
|
|
8,380 |
|
|
|
4,240 |
|
| Miscellaneous income |
|
|
1,505 |
|
|
|
19,292 |
|
|
|
4,513 |
|
|
|
409 |
|
| Total Income |
|
|
111,282 |
|
|
|
1,023,269 |
|
|
|
261,131 |
|
|
|
100,956 |
|
|
|
|
|
| |
| Expenses: |
|
|
|
| |
|
|
| |
|
|
| |
|
| |
|
|
|
|
| |
| Management fees |
|
|
14,213 |
|
|
|
100,039 |
|
|
|
29,664 |
|
|
|
18,957 |
|
| Dividends on short sales |
|
|
0 |
|
|
|
0 |
|
|
|
0 |
|
|
|
200 |
|
| Trustee fees and related expenses |
|
|
81 |
|
|
|
589 |
|
|
|
170 |
|
|
|
121 |
|
| Interest expense |
|
|
25,699 |
|
|
|
168,712 |
|
|
|
54,711 |
|
|
|
19,230 |
|
| Miscellaneous expense |
|
|
21 |
|
|
|
205 |
|
|
|
15 |
|
|
|
8 |
|
| Total Expenses |
|
|
40,014 |
|
|
|
269,545 |
|
|
|
84,560 |
|
|
|
38,516 |
|
| Waiver and/or Reimbursement by PIMCO |
|
|
0 |
|
|
|
0 |
|
|
|
0 |
|
|
|
(50 |
) |
| Net Expenses |
|
|
40,014 |
|
|
|
269,545 |
|
|
|
84,560 |
|
|
|
38,466 |
|
|
|
|
|
| |
| Net Investment Income (Loss) |
|
|
71,268 |
|
|
|
753,724 |
|
|
|
176,571 |
|
|
|
62,490 |
|
|
|
|
|
| |
| Net Realized Gain (Loss): |
|
|
|
| |
|
|
| |
|
|
| |
|
| |
|
|
|
|
| |
| Investments in securities |
|
|
15,771 |
|
|
|
(59,209 |
) |
|
|
(80,217 |
) |
|
|
87,836 |
|
| Investments in Affiliates |
|
|
22 |
|
|
|
626 |
|
|
|
57 |
|
|
|
22 |
|
| Exchange-traded or centrally cleared financial derivative instruments |
|
|
7,760 |
|
|
|
50,660 |
|
|
|
23,774 |
|
|
|
(9,513 |
) |
| Over the counter financial derivative instruments |
|
|
(1,852 |
) |
|
|
4,432 |
|
|
|
(2,039 |
) |
|
|
61,922 |
|
| Short sales |
|
|
0 |
|
|
|
5 |
|
|
|
0 |
|
|
|
17 |
|
| Foreign currency |
|
|
(1,505 |
) |
|
|
(2,433 |
) |
|
|
(2,015 |
) |
|
|
(481 |
) |
|
|
|
|
| |
| Net Realized Gain (Loss) |
|
|
20,196 |
|
|
|
(5,919 |
) |
|
|
(60,440 |
) |
|
|
139,803 |
|
|
|
|
|
| |
| Net Change in Unrealized Appreciation (Depreciation): |
|
|
|
| |
|
|
| |
|
|
| |
|
| |
|
|
|
|
| |
| Investments in securities |
|
|
5,980 |
|
|
|
255,291 |
|
|
|
131,377 |
|
|
|
(219,791 |
) |
| Investments in Affiliates |
|
|
(141 |
) |
|
|
(108,132 |
) |
|
|
(314 |
) |
|
|
222,269 |
|
| Exchange-traded or centrally cleared financial derivative instruments |
|
|
643 |
|
|
|
747 |
|
|
|
(2,957 |
) |
|
|
(2,846 |
) |
| Over the counter financial derivative instruments |
|
|
(6,684 |
) |
|
|
(75,233 |
) |
|
|
(18,137 |
) |
|
|
(37,322 |
) |
| Foreign currency assets and liabilities |
|
|
(2,006 |
) |
|
|
(14,366 |
) |
|
|
(3,362 |
) |
|
|
(15 |
) |
|
|
|
|
| |
| Net Change in Unrealized Appreciation (Depreciation) |
|
|
(2,208 |
) |
|
|
58,307 |
|
|
|
106,607 |
|
|
|
(37,705 |
) |
|
|
|
|
| |
| Net Increase (Decrease) in Net Assets Resulting from Operations |
|
$ |
89,256 |
|
|
$ |
806,112 |
|
|
$ |
222,738 |
|
|
$ |
164,588 |
|
|
|
|
|
| |
| * Foreign tax withholdings — Interest |
|
$ |
10 |
|
|
$ |
743 |
|
|
$ |
547 |
|
|
$ |
0 |
|
|
|
|
|
| |
| ** Foreign tax withholdings — Dividends |
|
$ |
156 |
|
|
$ |
895 |
|
|
$ |
332 |
|
|
$ |
489 |
|
|
A zero balance may reflect actual amounts rounding to less than one thousand. |
|
|
|
|
|
|
|
|
|
|
|
|
| |
| |
|
|
ANNUAL REPORT |
|
|
| |
|
|
JUNE 30, 2025 |
|
|
25 |
|
|
|
|
| |
Statements of Changes in Net Assets |
|
|
|
|
|
|
|
|
|
|
|
|
|
|
|
|
|
|
|
|
| |
| |
|
PCM Fund, Inc. |
|
|
& Income Fund |
|
|
|
|
|
| |
|
|
Year Ended
June 30, 2025 |
|
|
Year Ended
June 30, 2024 |
|
|
Year Ended
June 30, 2025 |
|
|
Year Ended
June 30, 2024 |
|
|
|
|
|
| |
| Increase (Decrease) in Net Assets from: |
|
|
|
| |
|
|
| |
|
|
| |
|
| |
|
|
|
|
| |
| Operations: |
|
|
|
| |
|
|
| |
|
|
| |
|
| |
|
|
|
|
| |
| Net investment income (loss) |
|
$ |
8,568 |
|
|
$ |
7,091 |
|
|
$ |
8,910 |
|
|
$ |
7,054 |
|
| Net realized gain (loss) |
|
|
1,328 |
|
|
|
(4,601 |
) |
|
|
3,779 |
|
|
|
1,471 |
|
| Net change in unrealized appreciation (depreciation) |
|
|
(2,972 |
) |
|
|
2,982 |
|
|
|
4,891 |
|
|
|
2,536 |
|
|
|
|
|
| |
| Net Increase (Decrease) in Net Assets Applicable to Common Shareholders Resulting from Operations |
|
|
6,924 |
|
|
|
5,472 |
|
|
|
17,580 |
|
|
|
11,061 |
|
|
|
|
|
| |
| Distributions to Common Shareholders: |
|
|
|
| |
|
|
| |
|
|
| |
|
| |
|
|
|
|
| |
| From net investment income and/or net realized capital gains |
|
|
(8,280 |
) |
|
|
(6,853 |
) |
|
|
(9,383 |
) |
|
|
(7,573 |
) |
| Tax basis return of capital |
|
|
(2,238 |
) |
|
|
(4,659 |
) |
|
|
(155 |
) |
|
|
(1,873 |
) |
|
|
|
|
| |
Total Distributions to Common Shareholders (a) |
|
|
(10,518 |
) |
|
|
(11,512 |
) |
|
|
(9,538 |
) |
|
|
(9,446 |
) |
|
|
|
|
| |
| Common Share Transactions*: |
|
|
|
| |
|
|
| |
|
|
| |
|
| |
|
|
|
|
| |
| Issued as reinvestment of distributions |
|
|
1,188 |
|
|
|
1,212 |
|
|
|
714 |
|
|
|
880 |
|
|
|
|
|
| |
| Net increase (decrease) resulting from common share transactions |
|
|
1,188 |
|
|
|
1,212 |
|
|
|
714 |
|
|
|
880 |
|
|
|
|
|
| |
| Total increase (decrease) in net assets applicable to common shareholders |
|
|
(2,406 |
) |
|
|
(4,828 |
) |
|
|
8,756 |
|
|
|
2,495 |
|
|
|
|
|
| |
| Net Assets Applicable to Common Shareholders: |
|
|
|
| |
|
|
| |
|
|
| |
|
| |
|
|
|
|
| |
| Beginning of year |
|
|
75,490 |
|
|
|
80,318 |
|
|
|
85,162 |
|
|
|
82,667 |
|
| End of year |
|
$ |
73,084 |
|
|
$ |
75,490 |
|
|
$ |
93,918 |
|
|
$ |
85,162 |
|
|
|
|
|
| |
| *Common Share Transactions: |
|
|
|
| |
|
|
| |
|
|
| |
|
| |
|
|
|
|
| |
| Shares issued as reinvestment of distributions |
|
|
171 |
|
|
|
152 |
|
|
|
93 |
|
|
|
123 |
|
| Net increase (decrease) in common shares outstanding |
|
|
171 |
|
|
|
152 |
|
|
|
93 |
|
|
|
123 |
|
|
A zero balance may reflect actual amounts rounding to less than one thousand. |
|
The tax characterization of distributions is determined in accordance with Federal income tax regulations. See Note 2, Distributions — Common Shares, in the Notes to Financial Statements for more information. |
|
|
|
|
|
|
| |
26 |
|
PIMCO CLOSED-END FUNDS |
|
|
See Accompanying Notes |
|
|
|
|
|
|
|
| |
| PIMCO Strategic Income Fund, Inc. |
|
|
| |
Year Ended
June 30, 2025 |
|
|
Year Ended
June 30, 2024 |
|
|
| |
|
|
|
| |
|
| |
|
| |
|
|
|
| |
|
| |
|
| |
| $ |
22,344 |
|
|
$ |
17,330 |
|
| |
11,537 |
|
|
|
(7,251 |
) |
| |
(2,532 |
) |
|
|
20,555 |
|
|
| |
|
31,349 |
|
|
|
30,634 |
|
|
| |
|
|
|
| |
|
| |
|
| |
| |
(25,038 |
) |
|
|
(19,691 |
) |
| |
(332 |
) |
|
|
(8,388 |
) |
|
| |
| |
(25,370 |
) |
|
|
(28,079 |
) |
|
| |
|
|
|
| |
|
| |
|
| |
| |
3,554 |
|
|
|
3,546 |
|
|
| |
| |
3,554 |
|
|
|
3,546 |
|
|
| |
| |
9,533 |
|
|
|
6,101 |
|
|
| |
|
|
|
| |
|
| |
|
| |
| |
202,598 |
|
|
|
196,497 |
|
| $ |
212,131 |
|
|
$ |
202,598 |
|
|
| |
|
|
|
| |
|
| |
|
| |
| |
548 |
|
|
|
656 |
|
| |
548 |
|
|
|
656 |
|
|
|
|
|
|
|
|
|
|
|
|
|
| |
| |
|
|
ANNUAL REPORT |
|
|
| |
|
|
JUNE 30, 2025 |
|
|
27 |
|
|
|
|
| |
Consolidated Statements of Changes in Net Assets |
|
|
|
|
|
|
|
|
|
|
|
|
|
|
|
|
|
|
|
|
| |
| |
|
PIMCO Access Income Fund |
|
|
PIMCO Dynamic Income Fund |
|
|
|
|
|
| |
|
|
Year Ended
June 30, 2025 |
|
|
Year Ended
June 30, 2024 |
|
|
Year Ended
June 30, 2025 |
|
|
Year Ended
June 30, 2024 |
|
|
|
|
|
| |
| Increase (Decrease) in Net Assets from: |
|
|
|
| |
|
|
| |
|
|
| |
|
| |
|
|
|
|
| |
| Operations: |
|
|
|
| |
|
|
| |
|
|
| |
|
| |
|
|
|
|
| |
| Net investment income (loss) |
|
$ |
71,268 |
|
|
$ |
59,880 |
|
|
$ |
753,724 |
|
|
$ |
512,673 |
|
| Net realized gain (loss) |
|
|
20,196 |
|
|
|
(21,757 |
) |
|
|
(5,919 |
) |
|
|
(316,618 |
) |
| Net change in unrealized appreciation (depreciation) |
|
|
(2,208 |
) |
|
|
47,978 |
|
|
|
58,307 |
|
|
|
367,415 |
|
|
|
|
|
| |
| Net Increase (Decrease) in Net Assets Applicable to Common Shareholders Resulting from Operations |
|
|
89,256 |
|
|
|
86,101 |
|
|
|
806,112 |
|
|
|
563,470 |
|
|
|
|
|
| |
| Distributions to Common Shareholders: |
|
|
|
| |
|
|
| |
|
|
| |
|
| |
|
|
|
|
| |
| From net investment income and/or net realized capital gains |
|
|
(74,206 |
) |
|
|
(64,934 |
) |
|
|
(753,252 |
) |
|
|
(394,343 |
) |
| Tax basis return of capital |
|
|
(5,940 |
) |
|
|
(14,011 |
) |
|
|
(185,588 |
) |
|
|
(369,848 |
) |
|
|
|
|
| |
Total Distributions to Common Shareholders (a) |
|
|
(80,146 |
) |
|
|
(78,945 |
) |
|
|
(938,840 |
) |
|
|
(764,191 |
) |
|
|
|
|
| |
| Common Share Transactions*: |
|
|
|
| |
|
|
| |
|
|
| |
|
| |
|
|
|
|
| |
| Receipts for shares sold |
|
|
17,340 |
|
|
|
0 |
|
|
|
1,354,690 |
|
|
|
836,643 |
|
| Issued as reinvestment of distributions |
|
|
5,776 |
|
|
|
1,588 |
|
|
|
117,365 |
|
|
|
88,912 |
|
|
|
|
|
| |
| Net increase (decrease) resulting from common share transactions |
|
|
23,116 |
|
|
|
1,588 |
|
|
|
1,472,055 |
|
|
|
925,555 |
|
|
|
|
|
| |
| Total increase (decrease) in net assets applicable to common shareholders |
|
|
32,226 |
|
|
|
8,744 |
|
|
|
1,339,327 |
|
|
|
724,834 |
|
|
|
|
|
| |
| Net Assets Applicable to Common Shareholders: |
|
|
|
| |
|
|
| |
|
|
| |
|
| |
|
|
|
|
| |
| Beginning of period |
|
|
662,635 |
|
|
|
653,891 |
|
|
|
5,303,316 |
|
|
|
4,578,482 |
|
| End of period |
|
$ |
694,861 |
|
|
$ |
662,635 |
|
|
$ |
6,642,643 |
|
|
$ |
5,303,316 |
|
|
|
|
|
| |
| *Common Share Transactions: |
|
|
|
| |
|
|
| |
|
|
| |
|
| |
|
|
|
|
| |
| Shares sold |
|
|
1,089 |
|
|
|
0 |
|
|
|
70,783 |
|
|
|
45,079 |
|
| Shares issued as reinvestment of distributions |
|
|
374 |
|
|
|
105 |
|
|
|
6,410 |
|
|
|
5,042 |
|
| Net increase (decrease) in common shares outstanding |
|
|
1,463 |
|
|
|
105 |
|
|
|
77,193 |
|
|
|
50,121 |
|
|
A zero balance may reflect actual amounts rounding to less than one thousand. |
|
The tax characterization of distributions is determined in accordance with Federal income tax regulations. See Note 2, Distributions — Common Shares, in the Notes to Financial Statements for more information. |
|
|
|
|
|
|
| |
28 |
|
PIMCO CLOSED-END FUNDS |
|
|
See Accompanying Notes |
|
|
|
|
|
|
|
|
|
|
|
|
|
|
|
| |
| PIMCO Dynamic Income Opportunities Fund |
|
|
PIMCO Dynamic Income Strategy Fund |
|
|
|
|
| |
Year Ended
June 30, 2025 |
|
|
Year Ended
June 30, 2024 |
|
|
Year Ended
June 30, 2025 |
|
|
Year Ended
June 30, 2024 |
|
|
|
|
| |
|
|
|
| |
|
|
| |
|
|
| |
|
| |
|
|
|
| |
|
|
|
| |
|
|
| |
|
|
| |
|
| |
|
|
|
| |
| $ |
176,571 |
|
|
$ |
148,562 |
|
|
$ |
62,490 |
|
|
$ |
32,260 |
|
| |
(60,440 |
) |
|
|
(118,203 |
) |
|
|
139,803 |
|
|
|
182,930 |
|
| |
106,607 |
|
|
|
138,960 |
|
|
|
(37,705 |
) |
|
|
119,431 |
|
|
|
|
| |
| |
222,738 |
|
|
|
169,319 |
|
|
|
164,588 |
|
|
|
334,621 |
|
|
|
|
| |
|
|
|
| |
|
|
| |
|
|
| |
|
| |
|
|
|
| |
| |
(184,112 |
) |
|
|
(122,934 |
) |
|
|
(82,717 |
) |
|
|
(46,493 |
) |
| |
(6,947 |
) |
|
|
(50,758 |
) |
|
|
0 |
|
|
|
0 |
|
|
|
|
| |
| |
(191,059 |
) |
|
|
(173,692 |
) |
|
|
(82,717 |
) |
|
|
(46,493 |
) |
|
|
|
| |
|
|
|
| |
|
|
| |
|
|
| |
|
| |
|
|
|
| |
| |
190,692 |
|
|
|
42,968 |
|
|
|
0 |
|
|
|
0 |
|
| |
25,108 |
|
|
|
20,539 |
|
|
|
0 |
|
|
|
0 |
|
|
|
|
| |
| |
215,800 |
|
|
|
63,507 |
|
|
|
0 |
|
|
|
0 |
|
|
|
|
| |
| |
247,479 |
|
|
|
59,134 |
|
|
|
81,871 |
|
|
|
288,128 |
|
|
|
|
| |
|
|
|
| |
|
|
| |
|
|
| |
|
| |
|
|
|
| |
| |
1,465,670 |
|
|
|
1,406,536 |
|
|
|
1,114,645 |
|
|
|
826,517 |
|
| $ |
1,713,149 |
|
|
$ |
1,465,670 |
|
|
$ |
1,196,516 |
|
|
$ |
1,114,645 |
|
|
|
|
| |
|
|
|
| |
|
|
| |
|
|
| |
|
| |
|
|
|
| |
| |
14,025 |
|
|
|
3,299 |
|
|
|
0 |
|
|
|
0 |
|
| |
1,920 |
|
|
|
1,646 |
|
|
|
0 |
|
|
|
0 |
|
| |
15,945 |
|
|
|
4,945 |
|
|
|
0 |
|
|
|
0 |
|
|
|
|
|
|
|
|
|
|
|
|
|
| |
| |
|
|
ANNUAL REPORT |
|
|
| |
|
|
JUNE 30, 2025 |
|
|
29 |
|
|
|
|
|
|
|
|
|
|
|
|
| |
Year Ended June 30, 2025 |
|
|
|
|
|
|
|
|
|
|
|
PCM Fund,
Inc. |
|
|
PIMCO Global StocksPLUS & Income Fund |
|
|
PIMCO
Strategic
Income Fund,
Inc. |
|
|
|
|
| |
| Cash Flows Provided by (Used for) Operating Activities: |
|
|
|
| |
|
|
| |
|
| |
|
|
|
| |
| Net increase (decrease) in net assets resulting from operations |
|
$ |
6,924 |
|
|
$ |
17,580 |
|
|
$ |
31,349 |
|
|
|
|
| |
| Adjustments to Reconcile Net Increase (Decrease) in Net Assets from Operations to Net Cash Provided by (Used for) Operating Activities: |
|
|
|
| |
|
|
| |
|
| |
|
|
|
| |
| Purchases of long-term securities |
|
|
(21,510 |
) |
|
|
(766,724 |
) |
|
|
(5,581,424 |
) |
| Proceeds from sales of long-term securities |
|
|
35,241 |
|
|
|
749,609 |
|
|
|
5,586,198 |
|
| (Purchases) Proceeds from sales of short-term portfolio investments, net |
|
|
2,160 |
|
|
|
10,253 |
|
|
|
14,206 |
|
| (Increase) decrease in deposits with counterparty |
|
|
1,276 |
|
|
|
(926 |
) |
|
|
112 |
|
| (Increase) decrease in receivable for investments sold |
|
|
879 |
|
|
|
34,917 |
|
|
|
(312,269 |
) |
| (Increase) decrease in interest and/or dividends receivable |
|
|
161 |
|
|
|
(232 |
) |
|
|
(162 |
) |
| (Increase) decrease in dividends receivable from Affiliates |
|
|
10 |
|
|
|
35 |
|
|
|
30 |
|
| Proceeds from (Payments on) exchange-traded or centrally cleared financial derivative instruments |
|
|
1,021 |
|
|
|
3,443 |
|
|
|
1,549 |
|
| Proceeds from (Payments on) over the counter financial derivative instruments |
|
|
16 |
|
|
|
2,569 |
|
|
|
(971 |
) |
| (Increase) decrease in other assets |
|
|
(1 |
) |
|
|
0 |
|
|
|
0 |
|
| Increase (decrease) in payable for investments purchased |
|
|
311 |
|
|
|
(35,200 |
) |
|
|
306,494 |
|
| Increase (decrease) in deposits from counterparty |
|
|
21 |
|
|
|
1,984 |
|
|
|
982 |
|
| Increase (decrease) in accrued management fees |
|
|
(10 |
) |
|
|
11 |
|
|
|
10 |
|
| Proceeds from (Payments on) short sales transactions, net |
|
|
2 |
|
|
|
(1 |
) |
|
|
2,209 |
|
| Proceeds from (Payments on) foreign currency transactions |
|
|
1 |
|
|
|
(116 |
) |
|
|
(611 |
) |
| |
|
|
|
|
|
|
|
|
|
|
|
|
| Investments in securities |
|
|
(1,187 |
) |
|
|
437 |
|
|
|
(8,324 |
) |
| Investments in Affiliates |
|
|
(3 |
) |
|
|
(16 |
) |
|
|
(17 |
) |
| Exchange-traded or centrally cleared financial derivative instruments |
|
|
(195 |
) |
|
|
(1,819 |
) |
|
|
(4,365 |
) |
| Over the counter financial derivative instruments |
|
|
59 |
|
|
|
(2,472 |
) |
|
|
993 |
|
| Short sales |
|
|
(2 |
) |
|
|
0 |
|
|
|
0 |
|
| Foreign currency |
|
|
0 |
|
|
|
91 |
|
|
|
176 |
|
Net Change in Unrealized (Appreciation) Depreciation |
|
|
|
|
|
|
|
|
|
|
|
|
| Investments in securities |
|
|
3,742 |
|
|
|
(2,305 |
) |
|
|
(3,102 |
) |
| Investments in Affiliates |
|
|
(3 |
) |
|
|
0 |
|
|
|
0 |
|
| Exchange-traded or centrally cleared financial derivative instruments |
|
|
(659 |
) |
|
|
(687 |
) |
|
|
3,646 |
|
| Over the counter financial derivative instruments |
|
|
(107 |
) |
|
|
(1,953 |
) |
|
|
1,523 |
|
| Foreign currency assets and liabilities |
|
|
(1 |
) |
|
|
54 |
|
|
|
465 |
|
| Net amortization (accretion) on investments |
|
|
(1,194 |
) |
|
|
(1,501 |
) |
|
|
(4,000 |
) |
|
|
|
| |
| Net Cash Provided by (Used for) Operating Activities |
|
|
26,952 |
|
|
|
7,031 |
|
|
|
34,697 |
|
|
|
|
| |
| Cash Flows Received from (Used for) Financing Activities: |
|
|
|
| |
|
|
| |
|
| |
|
|
|
| |
| Increase (decrease) in overdraft due to custodian |
|
|
(12 |
) |
|
|
(19 |
) |
|
|
(270 |
) |
| Cash distributions paid to common shareholders* |
|
|
(9,509 |
) |
|
|
(8,818 |
) |
|
|
(22,302 |
) |
| Proceeds from reverse repurchase agreements |
|
|
243,687 |
|
|
|
110,694 |
|
|
|
767,301 |
|
| Payments on reverse repurchase agreements |
|
|
(261,037 |
) |
|
|
(108,637 |
) |
|
|
(777,703 |
) |
|
|
|
| |
| Net Cash Received from (Used for) Financing Activities |
|
|
(26,871 |
) |
|
|
(6,780 |
) |
|
|
(32,974 |
) |
|
|
|
| |
| Net Increase (Decrease) in Cash and Foreign Currency |
|
|
81 |
|
|
|
251 |
|
|
|
1,723 |
|
|
|
|
| |
| Cash and Foreign Currency: |
|
|
|
| |
|
|
| |
|
| |
|
|
|
| |
| Beginning of year |
|
|
4 |
|
|
|
30 |
|
|
|
36 |
|
| End of year |
|
$ |
85 |
|
|
$ |
281 |
|
|
$ |
1,759 |
|
|
|
|
| |
| * Reinvestment of distributions |
|
$ |
1,188 |
|
|
$ |
714 |
|
|
$ |
3,554 |
|
|
|
|
| |
| Supplemental Disclosure of Cash Flow Information: |
|
|
|
| |
|
|
| |
|
| |
|
|
|
| |
| Interest expense paid during the year |
|
$ |
2,848 |
|
|
$ |
1,184 |
|
|
$ |
5,403 |
|
| |
|
$ |
262 |
|
|
$ |
837 |
|
|
$ |
2,535 |
|
|
A zero balance may reflect actual amounts rounding to less than one thousand. |
A Statement of Cash Flows is presented when a Fund has a significant amount of borrowing during the year, based on the average total borrowing outstanding in relation to total assets or when substantially all of a Fund’s investments are not classified as Level 1 or 2 in the fair value hierarchy.
|
|
|
|
|
|
| |
30 |
|
PIMCO CLOSED-END FUNDS |
|
|
See Accompanying Notes |
|
|
|
|
|
| |
Consolidated Statements of Cash Flows |
|
|
|
|
|
|
|
|
|
|
|
|
|
|
|
|
|
|
|
|
| |
Year Ended June 30, 2025 |
|
|
|
|
|
|
|
|
|
|
|
|
|
|
PIMCO
Access
Income Fund |
|
|
PIMCO
Dynamic
Income Fund |
|
|
PIMCO
Dynamic
Income
Opportunities
Fund |
|
|
PIMCO
Dynamic
Income
Strategy Fund |
|
|
|
|
|
| |
| Cash Flows Provided by (Used for) Operating Activities: |
|
|
|
| |
|
|
| |
|
|
| |
|
| |
|
|
|
|
| |
| Net increase (decrease) in net assets resulting from operations |
|
$ |
89,256 |
|
|
$ |
806,112 |
|
|
$ |
222,738 |
|
|
$ |
164,588 |
|
|
|
|
|
| |
| Adjustments to Reconcile Net Increase (Decrease) in Net Assets from Operations to Net Cash Provided by (Used for) Operating Activities: |
|
|
|
| |
|
|
| |
|
|
| |
|
| |
|
|
|
|
| |
| Purchases of long-term securities |
|
|
(340,272 |
) |
|
|
(3,882,689 |
) |
|
|
(713,499 |
) |
|
|
(895,948 |
) |
| Proceeds from sales of long-term securities |
|
|
395,704 |
|
|
|
3,100,173 |
|
|
|
682,468 |
|
|
|
796,255 |
|
| (Purchases) Proceeds from sales of short-term portfolio investments, net |
|
|
7,164 |
|
|
|
(43,501 |
) |
|
|
(11,178 |
) |
|
|
(27,421 |
) |
| (Increase) decrease in deposits with counterparty |
|
|
(1,842 |
) |
|
|
(17,938 |
) |
|
|
(7,200 |
) |
|
|
(2,584 |
) |
| (Increase) decrease in receivable for investments sold |
|
|
3,408 |
|
|
|
(251,592 |
) |
|
|
(6,711 |
) |
|
|
9,924 |
|
| (Increase) decrease in interest and/or dividends receivable |
|
|
1,729 |
|
|
|
(11,781 |
) |
|
|
714 |
|
|
|
(1,201 |
) |
| (Increase) decrease in dividends receivable from Affiliates |
|
|
100 |
|
|
|
448 |
|
|
|
56 |
|
|
|
(49 |
) |
| Proceeds from (Payments on) exchange-traded or centrally cleared financial derivative instruments |
|
|
9,022 |
|
|
|
52,408 |
|
|
|
21,852 |
|
|
|
(12,657 |
) |
| Proceeds from (Payments on) over the counter financial derivative instruments |
|
|
(1,985 |
) |
|
|
(15,951 |
) |
|
|
(2,321 |
) |
|
|
61,922 |
|
| (Increase) decrease in other assets |
|
|
(268 |
) |
|
|
(306 |
) |
|
|
(55 |
) |
|
|
4 |
|
| Increase (decrease) in payable for investments purchased |
|
|
(26,883 |
) |
|
|
(150,628 |
) |
|
|
(54,706 |
) |
|
|
(13,510 |
) |
| Increase (decrease) in deposits from counterparty |
|
|
1,672 |
|
|
|
10,121 |
|
|
|
(7,135 |
) |
|
|
(28,101 |
) |
| Increase (decrease) in accrued management fees |
|
|
22 |
|
|
|
1,471 |
|
|
|
251 |
|
|
|
314 |
|
| Proceeds from (Payments on) short sales transactions, net |
|
|
0 |
|
|
|
5 |
|
|
|
0 |
|
|
|
17 |
|
| Proceeds from (Payments on) foreign currency transactions |
|
|
(2,098 |
) |
|
|
(5,055 |
) |
|
|
(3,209 |
) |
|
|
(496 |
) |
| Increase (decrease) in foreign capital gains tax payable |
|
|
0 |
|
|
|
(8 |
) |
|
|
244 |
|
|
|
0 |
|
| Increase (decrease) in other liabilities |
|
|
0 |
|
|
|
5 |
|
|
|
6 |
|
|
|
0 |
|
| |
|
|
|
|
|
|
|
|
|
|
|
|
|
|
|
|
| Investments in securities |
|
|
(15,771 |
) |
|
|
59,209 |
|
|
|
80,217 |
|
|
|
(87,836 |
) |
| Investments in Affiliates |
|
|
(22 |
) |
|
|
(626 |
) |
|
|
(57 |
) |
|
|
(22 |
) |
| Exchange-traded or centrally cleared financial derivative instruments |
|
|
(7,760 |
) |
|
|
(50,660 |
) |
|
|
(23,774 |
) |
|
|
9,513 |
|
| Over the counter financial derivative instruments |
|
|
1,852 |
|
|
|
(4,432 |
) |
|
|
2,039 |
|
|
|
(61,922 |
) |
| Short sales |
|
|
0 |
|
|
|
(5 |
) |
|
|
0 |
|
|
|
(17 |
) |
| Foreign currency |
|
|
1,505 |
|
|
|
2,433 |
|
|
|
2,015 |
|
|
|
481 |
|
Net Change in Unrealized (Appreciation) Depreciation |
|
|
|
|
|
|
|
|
|
|
|
|
|
|
|
|
| Investments in securities |
|
|
(5,980 |
) |
|
|
(255,291 |
) |
|
|
(131,377 |
) |
|
|
219,791 |
|
| Investments in Affiliates |
|
|
141 |
|
|
|
108,132 |
|
|
|
314 |
|
|
|
(222,269 |
) |
| Exchange-traded or centrally cleared financial derivative instruments |
|
|
(643 |
) |
|
|
(747 |
) |
|
|
2,957 |
|
|
|
2,846 |
|
| Over the counter financial derivative instruments |
|
|
6,684 |
|
|
|
75,233 |
|
|
|
18,137 |
|
|
|
37,322 |
|
| Foreign currency assets and liabilities |
|
|
2,006 |
|
|
|
14,366 |
|
|
|
3,362 |
|
|
|
15 |
|
| Net amortization (accretion) on investments |
|
|
(16,421 |
) |
|
|
(164,578 |
) |
|
|
(34,875 |
) |
|
|
(10,620 |
) |
|
|
|
|
| |
| Net Cash Provided by (Used for) Operating Activities |
|
|
100,320 |
|
|
|
(625,672 |
) |
|
|
41,273 |
|
|
|
(61,661 |
) |
|
|
|
|
| |
| Cash Flows Received from (Used for) Financing Activities: |
|
|
|
| |
|
|
| |
|
|
| |
|
| |
|
|
|
|
| |
| Proceeds from shares sold |
|
|
17,340 |
|
|
|
1,346,664 |
|
|
|
191,784 |
|
|
|
0 |
|
| Increase (decrease) in overdraft due to custodian |
|
|
(1,226 |
) |
|
|
(2,304 |
) |
|
|
(2,587 |
) |
|
|
(50 |
) |
| Cash distributions paid* |
|
|
(74,151 |
) |
|
|
(804,856 |
) |
|
|
(163,879 |
) |
|
|
(81,818 |
) |
| Proceeds from reverse repurchase agreements |
|
|
3,739,835 |
|
|
|
21,571,380 |
|
|
|
7,028,318 |
|
|
|
1,983,429 |
|
| Payments on reverse repurchase agreements |
|
|
(3,779,303 |
) |
|
|
(21,455,986 |
) |
|
|
(7,071,530 |
) |
|
|
(1,839,089 |
) |
|
|
|
|
| |
| Net Cash Received from (Used for) Financing Activities |
|
|
(97,505 |
) |
|
|
654,898 |
|
|
|
(17,894 |
) |
|
|
62,472 |
|
|
|
|
|
| |
| Net Increase (Decrease) in Cash and Foreign Currency |
|
|
2,815 |
|
|
|
29,226 |
|
|
|
23,379 |
|
|
|
811 |
|
|
|
|
|
| |
| Cash and Foreign Currency: |
|
|
|
| |
|
|
| |
|
|
| |
|
| |
|
|
|
|
| |
| Beginning of year |
|
|
0 |
|
|
|
27,313 |
|
|
|
252 |
|
|
|
1 |
|
| End of year |
|
$ |
2,815 |
|
|
$ |
56,539 |
|
|
$ |
23,631 |
|
|
$ |
812 |
|
|
|
|
|
| |
| *Reinvestment of distributions |
|
$ |
5,776 |
|
|
$ |
117,365 |
|
|
$ |
25,108 |
|
|
$ |
0 |
|
|
|
|
|
| |
| Supplemental Disclosure of Cash Flow Information: |
|
|
|
| |
|
|
| |
|
|
| |
|
| |
|
|
|
|
| |
| Dividends on short sales paid during the year |
|
$ |
0 |
|
|
$ |
0 |
|
|
$ |
0 |
|
|
$ |
200 |
|
| Interest expense paid during the year |
|
$ |
26,981 |
|
|
$ |
179,446 |
|
|
$ |
58,160 |
|
|
$ |
18,692 |
|
| |
|
$ |
9,385 |
|
|
$ |
64,848 |
|
|
$ |
19,958 |
|
|
$ |
1,129 |
|
|
A zero balance may reflect actual amounts rounding to less than one thousand. |
A Statement of Cash Flows is presented when a Fund has a significant amount of borrowing during the year, based on the average total borrowing outstanding in relation to total assets or when substantially all of a Fund’s investments are not classified as Level 1 or 2 in the fair value hierarchy.
|
|
|
|
|
|
|
|
|
|
|
|
| |
| |
|
|
ANNUAL REPORT |
|
|
| |
|
|
JUNE 30, 2025 |
|
|
31 |
(Amounts in thousands*, except number of shares, contracts, units and ounces, if any)
|
|
|
|
|
|
|
|
|
|
|
|
| |
| |
|
|
|
PRINCIPAL
AMOUNT
(000S) |
|
|
|
|
MARKET
VALUE
(000S) |
|
INVESTMENTS IN SECURITIES 139.7% |
|
|
| |
LOAN PARTICIPATIONS AND ASSIGNMENTS 20.3% |
|
|
| |
|
6.313% (TSFR1M + 2.000%) due 05/17/2029 ~ |
|
$ |
|
|
488 |
|
|
$ |
|
|
490 |
|
|
Aspire Bakeries Holdings LLC |
|
8.572% (TSFR1M + 4.250%) due 12/23/2030 ~ |
|
| |
|
198 |
|
|
| |
|
200 |
|
|
| |
|
8.427% (TSFR1M + 4.000%) due 08/19/2028 ~ |
|
| |
|
299 |
|
|
| |
|
296 |
|
|
| |
|
7.822% - 7.830% (TSFR3M + 3.500%) due 03/24/2031 ~ |
|
| |
|
198 |
|
|
| |
|
198 |
|
|
| |
|
7.546% (TSFR3M + 3.250%) due 07/06/2029 ~ |
|
| |
|
597 |
|
|
| |
|
500 |
|
|
| |
|
| |
|
| |
|
26 |
|
|
| |
|
26 |
|
|
CoreWeave Compute Acquisition Co. LLC |
|
TBD% - 10.330% (TSFR3M + 6.000%) due 05/16/2029 «~µ |
|
| |
|
800 |
|
|
| |
|
819 |
|
|
| |
|
TBD% - 1.000% due 01/03/2031 «µ |
|
| |
|
91 |
|
|
| |
|
92 |
|
8.816% (TSFR1M + 4.500%) due 01/03/2031 «~ |
|
| |
|
409 |
|
|
| |
|
414 |
|
|
Encina Private Credit LLC |
|
TBD% - 8.524% due 11/30/2025 «µ |
|
| |
|
522 |
|
|
| |
|
509 |
|
|
| |
|
7.927% (TSFR1M + 3.500%) due 02/10/2028 «~ |
|
| |
|
189 |
|
|
| |
|
146 |
|
|
Envision Healthcare Corp. |
|
11.110% (TSFR3M + 6.750%) due 07/20/2026 « |
|
| |
|
81 |
|
|
| |
|
81 |
|
12.235% (TSFR3M + 7.875%) due 11/03/2028 « |
|
| |
|
1,782 |
|
|
| |
|
1,836 |
|
|
| |
|
9.057% (TSFR3M + 4.500%) due 11/06/2028 ~ |
|
| |
|
99 |
|
|
| |
|
98 |
|
|
| |
|
9.541% (TSFR3M + 5.000%) due 03/30/2027 ~ |
|
| |
|
395 |
|
|
| |
|
374 |
|
|
Foundation Building Materials Holding Co. LLC |
|
7.791% - 7.807% (TSFR3M + 3.250%) due 01/31/2028 ~ |
|
| |
|
299 |
|
|
| |
|
296 |
|
|
| |
|
| |
|
| |
|
100 |
|
|
| |
|
100 |
|
|
| |
|
9.016% (TSFR3M + 4.750%) due 06/01/2029 ~ |
|
| |
|
1,169 |
|
|
| |
|
975 |
|
10.079% (TSFR3M + 5.750%) due 06/01/2029 ~µ |
|
| |
|
156 |
|
|
| |
|
161 |
|
|
| |
|
9.427% (TSFR1M + 5.000%) due 10/30/2028 ~ |
|
| |
|
396 |
|
|
| |
|
358 |
|
|
| |
|
7.441% (TSFR1M + 3.000%) due 06/30/2027 ~ |
|
| |
|
27 |
|
|
| |
|
18 |
|
|
Lealand Finance Co. BV (5.441% Cash and 3.000% PIK) |
|
8.441% (TSFR1M + 1.000%) due 12/31/2027 ~(c) |
|
| |
|
224 |
|
|
| |
|
118 |
|
|
Mercury Aggregator LP (13.500% PIK) |
|
13.500% due 04/03/2026 «(c) |
|
| |
|
232 |
|
|
| |
|
158 |
|
|
Mercury Aggregator LP (3.500% PIK) |
|
3.500% due 04/03/2026 «(c) |
|
| |
|
127 |
|
|
| |
|
87 |
|
|
| |
|
8.577% (TSFR1M + 4.250%) due 05/03/2028 ~ |
|
| |
|
299 |
|
|
| |
|
281 |
|
|
| |
|
8.780% (TSFR3M + 4.500%) due 07/01/2031 ~ |
|
| |
|
498 |
|
|
| |
|
480 |
|
|
| |
|
9.271% (TSFR3M + 4.750%) due 07/06/2028 ~ |
|
| |
|
346 |
|
|
| |
|
325 |
|
|
|
|
|
|
|
|
|
|
|
|
|
| |
| |
|
|
|
PRINCIPAL
AMOUNT
(000S) |
|
|
|
|
MARKET
VALUE
(000S) |
|
|
| |
|
8.177% (TSFR1M + 3.750%) due 02/01/2028 ~ |
|
$ |
|
|
398 |
|
|
$ |
|
|
352 |
|
|
| |
|
7.557% (TSFR3M + 3.000%) due 04/24/2028 ~ |
|
| |
|
317 |
|
|
| |
|
315 |
|
|
| |
|
| |
|
| |
|
502 |
|
|
| |
|
502 |
|
|
| |
|
11.296% (TSFR3M + 7.000%) due 05/13/2027 ~ |
|
| |
|
1,073 |
|
|
| |
|
1,021 |
|
|
| |
|
| |
|
| |
|
100 |
|
|
| |
|
97 |
|
10.927% (TSFR1M + 6.500%) due 10/26/2029 ~ |
|
| |
|
960 |
|
|
| |
|
939 |
|
|
| |
|
9.441% (TSFR1M + 5.000%) due 06/20/2028 ~ |
|
| |
|
2,038 |
|
|
| |
|
1,935 |
|
|
Vista Management Holding, Inc. |
|
8.048% (TSFR3M + 3.750%) due 04/01/2031 ~ |
|
| |
|
100 |
|
|
| |
|
100 |
|
|
| |
|
| |
|
| |
|
277 |
|
|
| |
|
109 |
|
|
| |
| |
|
|
| |
| |
|
|
|
Total Loan Participations and Assignments
(Cost $14,865) |
|
|
|
|
|
| |
|
|
|
|
| |
CORPORATE BONDS & NOTES 21.1% |
|
|
| |
|
|
|
| |
|
| |
|
| |
|
200 |
|
|
| |
|
192 |
|
|
| |
|
6.600% due 06/10/2029 (j) |
|
| |
|
100 |
|
|
| |
|
104 |
|
|
| |
|
| |
|
| |
|
400 |
|
|
| |
|
424 |
|
|
Nuveen Churchill Direct Lending Corp. |
|
6.650% due 03/15/2030 (j) |
|
| |
|
1,000 |
|
|
| |
|
1,028 |
|
|
| |
|
| |
|
| |
|
100 |
|
|
| |
|
103 |
|
|
| |
|
6.000% due 01/15/2030 (j) |
|
| |
|
1,065 |
|
|
| |
|
999 |
|
10.500% due 02/15/2028 (j) |
|
| |
|
633 |
|
|
| |
|
671 |
|
|
Voyager Aviation Holdings LLC |
|
8.500% due 05/09/2026 ^«(d) |
|
| |
|
991 |
|
|
| |
|
0 |
|
|
| |
| |
|
|
| |
| |
|
|
|
|
| |
| |
|
|
| |
| |
|
3,521 |
|
|
| |
| |
|
|
| |
| |
|
|
|
|
| |
|
|
|
| |
|
| |
|
| |
|
100 |
|
|
| |
|
101 |
|
|
| |
|
| |
|
| |
|
100 |
|
|
| |
|
103 |
|
|
| |
|
| |
|
| |
|
100 |
|
|
| |
|
104 |
|
|
Claritev Corp. (6.500% Cash and 0.750% PIK) |
|
7.250% due 03/31/2031 (c) |
|
| |
|
541 |
|
|
| |
|
382 |
|
|
| |
|
5.880% due 01/10/2028 (j) |
|
| |
|
387 |
|
|
| |
|
392 |
|
|
| |
|
| |
|
| |
|
660 |
|
|
| |
|
600 |
|
| |
|
| |
|
400 |
|
|
| |
|
347 |
|
|
| |
|
| |
|
| |
|
800 |
|
|
| |
|
825 |
|
|
| |
|
| |
|
| |
|
15 |
|
|
| |
|
1 |
|
|
Fertitta Entertainment LLC |
|
| |
|
| |
|
400 |
|
|
| |
|
369 |
|
|
| |
|
| |
|
| |
|
1,405 |
|
|
| |
|
1,405 |
|
|
| |
|
6.000% due 01/30/2033 «(i) |
|
| |
|
1,012 |
|
|
| |
|
1,403 |
|
|
| |
|
| |
|
| |
|
100 |
|
|
| |
|
104 |
|
|
|
|
|
|
|
|
|
|
|
|
|
| |
| |
|
|
|
PRINCIPAL
AMOUNT
(000S) |
|
|
|
|
MARKET
VALUE
(000S) |
|
|
| |
|
9.875% due 09/20/2031 (j) |
|
$ |
|
|
400 |
|
|
$ |
|
|
389 |
|
|
| |
|
| |
|
| |
|
100 |
|
|
| |
|
108 |
|
11.000% due 10/15/2030 (j) |
|
| |
|
500 |
|
|
| |
|
552 |
|
|
MPH Acquisition Holdings LLC |
|
| |
|
| |
|
63 |
|
|
| |
|
52 |
|
|
MPH Acquisition Holdings LLC (6.500% Cash and 5.000% PIK) |
|
11.500% due 12/31/2030 (c) |
|
| |
|
96 |
|
|
| |
|
95 |
|
|
Newfold Digital Holdings Group, Inc. |
|
| |
|
| |
|
300 |
|
|
| |
|
176 |
|
|
Olympus Water U.S. Holding Corp. |
|
| |
|
| |
|
200 |
|
|
| |
|
204 |
|
|
Performance Food Group, Inc. |
|
6.125% due 09/15/2032 (j) |
|
| |
|
100 |
|
|
| |
|
102 |
|
|
| |
|
| |
|
| |
|
200 |
|
|
| |
|
195 |
|
|
Prime Healthcare Services, Inc. |
|
| |
|
| |
|
500 |
|
|
| |
|
497 |
|
|
| |
|
6.375% due 03/01/2032 (j) |
|
| |
|
400 |
|
|
| |
|
412 |
|
| |
|
| |
|
100 |
|
|
| |
|
103 |
|
|
Specialty Building Products Holdings LLC |
|
| |
|
| |
|
100 |
|
|
| |
|
98 |
|
|
| |
|
| |
|
| |
|
238 |
|
|
| |
|
211 |
|
|
| |
|
| |
|
| |
|
326 |
|
|
| |
|
330 |
|
|
| |
|
| |
|
| |
|
500 |
|
|
| |
|
463 |
|
|
| |
|
10.625% due 06/28/2028 (j) |
|
| |
|
249 |
|
|
| |
|
213 |
|
|
| |
|
| |
|
| |
|
100 |
|
|
| |
|
103 |
|
|
| |
|
9.500% due 02/01/2029 (j) |
|
| |
|
200 |
|
|
| |
|
218 |
|
9.875% due 02/01/2032 (j) |
|
| |
|
300 |
|
|
| |
|
324 |
|
|
Venture Global Plaquemines LNG LLC |
|
6.500% due 01/15/2034 (b) |
|
| |
|
150 |
|
|
| |
|
150 |
|
6.750% due 01/15/2036 (b) |
|
| |
|
200 |
|
|
| |
|
200 |
|
|
| |
|
7.000% due 02/01/2033 (j) |
|
| |
|
200 |
|
|
| |
|
208 |
|
|
| |
| |
|
|
| |
| |
|
|
|
|
| |
| |
|
|
| |
| |
|
11,539 |
|
|
| |
| |
|
|
| |
| |
|
|
|
|
| |
|
|
|
Pacific Gas & Electric Co. |
|
4.300% due 03/15/2045 (j) |
|
| |
|
463 |
|
|
| |
|
350 |
|
|
| |
| |
|
|
| |
| |
|
|
|
Total Corporate Bonds & Notes (Cost $16,242) |
|
|
|
|
|
| |
|
|
|
|
| |
U.S. GOVERNMENT AGENCIES 6.0% |
|
|
| |
|
4.000% due 06/25/2050 (a) |
|
| |
|
548 |
|
|
| |
|
107 |
|
|
| |
|
0.700% due 11/25/2055 ~(a) |
|
| |
|
5,794 |
|
|
| |
|
351 |
|
1.730% due 05/25/2050 •(a) |
|
| |
|
1,259 |
|
|
| |
|
167 |
|
2.079% due 11/25/2045 ~(a) |
|
| |
|
1,027 |
|
|
| |
|
45 |
|
3.500% due 02/25/2041 (a) |
|
| |
|
1,389 |
|
|
| |
|
195 |
|
4.000% due 07/25/2050 (a) |
|
| |
|
4,862 |
|
|
| |
|
1,156 |
|
5.000% due 03/15/2040 (a) |
|
| |
|
100 |
|
|
| |
|
3 |
|
11.805% due 10/25/2041 •(j) |
|
| |
|
1,100 |
|
|
| |
|
1,170 |
|
12.105% due 11/25/2041 •(j) |
|
| |
|
1,100 |
|
|
| |
|
1,178 |
|
|
| |
| |
|
|
| |
| |
|
|
|
Total U.S. Government Agencies (Cost $4,211) |
|
|
|
|
|
| |
|
|
|
|
| |
NON-AGENCY MORTGAGE-BACKED SECURITIES 36.7% |
|
|
| |
|
| |
|
| |
|
655 |
|
|
| |
|
613 |
|
|
Adjustable Rate Mortgage Trust |
|
| |
|
| |
|
44 |
|
|
| |
|
42 |
|
|
Ashford Hospitality Trust |
|
5.884% due 04/15/2035 •(j) |
|
| |
|
900 |
|
|
| |
|
891 |
|
|
|
|
|
|
|
| |
32 |
|
PIMCO CLOSED-END FUNDS |
|
|
See Accompanying Notes |
|
|
|
|
|
|
|
|
|
|
|
|
|
| |
| |
|
|
|
PRINCIPAL
AMOUNT
(000S) |
|
|
|
|
MARKET
VALUE
(000S) |
|
|
Banc of America Alternative Loan Trust |
|
| |
|
$ |
|
|
55 |
|
|
$ |
|
|
49 |
|
|
Banc of America Funding Trust |
|
| |
|
| |
|
88 |
|
|
| |
|
64 |
|
| |
|
| |
|
31 |
|
|
| |
|
27 |
|
| |
|
| |
|
26 |
|
|
| |
|
26 |
|
| |
|
| |
|
243 |
|
|
| |
|
174 |
|
|
Banc of America Mortgage Trust |
|
| |
|
| |
|
35 |
|
|
| |
|
34 |
|
|
Bank of America Mortgage Trust |
|
| |
|
| |
|
62 |
|
|
| |
|
62 |
|
|
Barclays Commercial Mortgage Securities Trust |
|
| |
|
| |
|
1,000 |
|
|
| |
|
848 |
|
|
| |
|
| |
|
| |
|
38 |
|
|
| |
|
32 |
|
|
| |
|
| |
|
| |
|
671 |
|
|
| |
|
622 |
|
| |
|
| |
|
22 |
|
|
| |
|
16 |
|
| |
|
| |
|
173 |
|
|
| |
|
79 |
|
| |
|
| |
|
86 |
|
|
| |
|
61 |
|
| |
|
| |
|
433 |
|
|
| |
|
222 |
|
| |
|
| |
|
355 |
|
|
| |
|
316 |
|
| |
|
| |
|
20 |
|
|
| |
|
10 |
|
| |
|
| |
|
54 |
|
|
| |
|
52 |
|
|
Bear Stearns Commercial Mortgage Securities Trust |
|
| |
|
| |
|
17 |
|
|
| |
|
17 |
|
|
CBA Commercial Small Balance Commercial Mortgage |
|
| |
|
| |
|
63 |
|
|
| |
|
61 |
|
|
| |
|
| |
|
| |
|
48 |
|
|
| |
|
45 |
|
|
Chase Mortgage Finance Trust |
|
| |
|
| |
|
155 |
|
|
| |
|
83 |
|
|
Citigroup Mortgage Loan Trust |
|
| |
|
| |
|
999 |
|
|
| |
|
495 |
|
| |
|
| |
|
651 |
|
|
| |
|
262 |
|
|
Citigroup Mortgage Loan Trust, Inc. |
|
| |
|
| |
|
779 |
|
|
| |
|
689 |
|
|
Citigroup Mortgage Loan Trust, Inc. Mortgage Pass-Through Certificates |
|
| |
|
| |
|
52 |
|
|
| |
|
35 |
|
|
Connecticut Avenue Securities Trust |
|
| |
|
| |
|
800 |
|
|
| |
|
820 |
|
|
Countrywide Alternative Loan Trust |
|
| |
|
| |
|
3,338 |
|
|
| |
|
702 |
|
| |
|
| |
|
97 |
|
|
| |
|
82 |
|
| |
|
| |
|
327 |
|
|
| |
|
297 |
|
| |
|
| |
|
370 |
|
|
| |
|
154 |
|
| |
|
| |
|
158 |
|
|
| |
|
22 |
|
6.000% due 04/25/2036 (j) |
|
| |
|
2,129 |
|
|
| |
|
999 |
|
|
Countrywide Home Loan Mortgage Pass-Through Trust |
|
| |
|
| |
|
48 |
|
|
| |
|
43 |
|
| |
|
| |
|
153 |
|
|
| |
|
138 |
|
| |
|
| |
|
57 |
|
|
| |
|
50 |
|
| |
|
| |
|
176 |
|
|
| |
|
76 |
|
| |
|
| |
|
198 |
|
|
| |
|
148 |
|
| |
|
| |
|
2 |
|
|
| |
|
2 |
|
|
Credit Suisse First Boston Mortgage Securities Corp. |
|
| |
|
| |
|
23 |
|
|
| |
|
24 |
|
|
Credit Suisse Mortgage Capital Mortgage-Backed Trust |
|
6.000% due 07/25/2036 (j) |
|
| |
|
834 |
|
|
| |
|
385 |
|
| |
|
| |
|
126 |
|
|
| |
|
66 |
|
| |
|
| |
|
143 |
|
|
| |
|
60 |
|
|
| |
|
0.000% due 10/15/2036 ~(a) |
|
| |
|
147,870 |
|
|
| |
|
0 |
|
|
Extended Stay America Trust |
|
8.126% due 07/15/2038 •(j) |
|
| |
|
772 |
|
|
| |
|
773 |
|
|
First Horizon Alternative Mortgage Securities Trust |
|
| |
|
| |
|
1 |
|
|
| |
|
0 |
|
|
GS Mortgage Securities Trust |
|
0.533% due 08/10/2043 ~(a) |
|
| |
|
1,712 |
|
|
| |
|
0 |
|
|
| |
|
| |
|
| |
|
529 |
|
|
| |
|
306 |
|
|
|
|
|
|
|
|
|
|
|
|
|
| |
| |
|
|
|
PRINCIPAL
AMOUNT
(000S) |
|
|
|
|
MARKET
VALUE
(000S) |
|
|
HarborView Mortgage Loan Trust |
|
| |
|
$ |
|
|
361 |
|
|
$ |
|
|
234 |
|
|
IndyMac INDA Mortgage Loan Trust |
|
| |
|
| |
|
80 |
|
|
| |
|
64 |
|
|
IndyMac INDX Mortgage Loan Trust |
|
| |
|
| |
|
87 |
|
|
| |
|
48 |
|
|
JP Morgan Alternative Loan Trust |
|
6.500% due 03/25/2036 (j) |
|
| |
|
695 |
|
|
| |
|
357 |
|
|
JP Morgan Chase Commercial Mortgage Securities Trust |
|
0.492% due 02/15/2046 «~(a) |
|
| |
|
50,165 |
|
|
| |
|
199 |
|
5.805% due 07/05/2033 •(j) |
|
| |
|
843 |
|
|
| |
|
735 |
|
| |
|
| |
|
206 |
|
|
| |
|
195 |
|
8.609% due 02/15/2035 •(j) |
|
| |
|
741 |
|
|
| |
|
704 |
|
10.966% due 11/15/2038 •(j) |
|
| |
|
900 |
|
|
| |
|
859 |
|
|
| |
|
| |
|
| |
|
6 |
|
|
| |
|
6 |
|
|
| |
|
| |
|
| |
|
137 |
|
|
| |
|
86 |
|
|
MASTR Adjustable Rate Mortgages Trust |
|
| |
|
| |
|
163 |
|
|
| |
|
70 |
|
|
MASTR Asset Securitization Trust |
|
| |
|
| |
|
141 |
|
|
| |
|
80 |
|
|
Merrill Lynch Mortgage Investors Trust |
|
| |
|
| |
|
8 |
|
|
| |
|
7 |
|
| |
|
| |
|
25 |
|
|
| |
|
23 |
|
| |
|
| |
|
32 |
|
|
| |
|
31 |
|
| |
|
| |
|
2 |
|
|
| |
|
2 |
|
| |
|
| |
|
6 |
|
|
| |
|
5 |
|
|
| |
|
4.221% due 12/25/2066 ~(j) |
|
| |
|
1,000 |
|
|
| |
|
835 |
|
4.392% due 08/25/2061 ~(j) |
|
| |
|
1,000 |
|
|
| |
|
838 |
|
|
Morgan Stanley Capital Trust |
|
0.817% due 11/12/2049 ~(a) |
|
| |
|
66 |
|
|
| |
|
0 |
|
| |
|
| |
|
400 |
|
|
| |
|
379 |
|
|
Morgan Stanley Mortgage Loan Trust |
|
| |
|
| |
|
136 |
|
|
| |
|
44 |
|
| |
|
| |
|
134 |
|
|
| |
|
118 |
|
|
Morgan Stanley Resecuritization Trust |
|
4.742% due 03/26/2037 ~(j) |
|
| |
|
1,570 |
|
|
| |
|
1,344 |
|
|
Mortgage Equity Conversion Asset Trust |
|
| |
|
| |
|
28 |
|
|
| |
|
26 |
|
|
Natixis Commercial Mortgage Securities Trust |
|
| |
|
| |
|
1,197 |
|
|
| |
|
630 |
|
8.256% due 03/15/2035 •(j) |
|
| |
|
263 |
|
|
| |
|
263 |
|
9.505% due 03/15/2035 •(j) |
|
| |
|
525 |
|
|
| |
|
524 |
|
|
New Residential Mortgage Loan Trust |
|
| |
|
| |
|
2,900 |
|
|
| |
|
1,708 |
|
|
| |
|
| |
|
| |
|
7 |
|
|
| |
|
7 |
|
|
Residential Accredit Loans, Inc. Trust |
|
| |
|
| |
|
152 |
|
|
| |
|
103 |
|
| |
|
| |
|
91 |
|
|
| |
|
81 |
|
| |
|
| |
|
51 |
|
|
| |
|
40 |
|
| |
|
| |
|
97 |
|
|
| |
|
81 |
|
|
Residential Asset Securitization Trust |
|
| |
|
| |
|
182 |
|
|
| |
|
54 |
|
|
Residential Funding Mortgage Securities, Inc. Trust |
|
| |
|
| |
|
74 |
|
|
| |
|
64 |
|
|
| |
|
| |
|
| |
|
450 |
|
|
| |
|
357 |
|
|
Structured Adjustable Rate Mortgage Loan Trust |
|
| |
|
| |
|
142 |
|
|
| |
|
75 |
|
| |
|
| |
|
156 |
|
|
| |
|
86 |
|
| |
|
| |
|
12 |
|
|
| |
|
11 |
|
|
TBW Mortgage-Backed Trust |
|
| |
|
| |
|
102 |
|
|
| |
|
35 |
|
|
Verus Securitization Trust |
|
| |
|
| |
|
500 |
|
|
| |
|
496 |
|
|
WaMu Mortgage Pass-Through Certificates Trust |
|
4.252% due 12/25/2036 ~(j) |
|
| |
|
138 |
|
|
| |
|
125 |
|
5.334% due 10/25/2045 •(j) |
|
| |
|
2,352 |
|
|
| |
|
2,036 |
|
| |
|
| |
|
132 |
|
|
| |
|
132 |
|
|
|
|
|
|
|
|
|
|
|
|
|
| |
| |
|
|
|
PRINCIPAL
AMOUNT
(000S) |
|
|
|
|
MARKET
VALUE
(000S) |
|
|
Washington Mutual Mortgage Pass-Through Certificates Trust |
|
6.500% due 08/25/2036 (j) |
|
$ |
|
|
548 |
|
|
$ |
|
|
484 |
|
|
Wells Fargo Commercial Mortgage Trust |
|
5.092% due 12/15/2039 ~(j) |
|
| |
|
1,042 |
|
|
| |
|
959 |
|
|
| |
|
| |
|
| |
|
2,400 |
|
|
| |
|
126 |
|
|
| |
| |
|
|
| |
| |
|
|
|
Total Non-Agency Mortgage-Backed Securities (Cost $32,519) |
|
|
|
|
|
| |
|
|
|
|
| |
ASSET-BACKED SECURITIES 44.3% |
|
|
| |
AUTOMOBILE ABS OTHER 0.0% |
|
|
Flagship Credit Auto Trust |
|
0.000% due 06/15/2029 «(f) |
|
| |
|
14 |
|
|
| |
|
0 |
|
|
| |
| |
|
|
| |
| |
|
|
|
|
| |
|
|
|
Asset-Backed Securities Corp. Home Equity Loan Trust |
|
| |
|
| |
|
58 |
|
|
| |
|
55 |
|
|
Citigroup Mortgage Loan Trust |
|
4.754% due 12/25/2036 •(j) |
|
| |
|
966 |
|
|
| |
|
529 |
|
| |
|
| |
|
597 |
|
|
| |
|
215 |
|
|
Countrywide Asset-Backed Certificates Trust |
|
4.834% due 06/25/2037 •(j) |
|
| |
|
436 |
|
|
| |
|
435 |
|
4.839% due 09/25/2046 •(j) |
|
| |
|
4,124 |
|
|
| |
|
3,275 |
|
4.914% due 05/25/2036 •(j) |
|
| |
|
6,533 |
|
|
| |
|
5,538 |
|
6.309% due 10/25/2035 •(j) |
|
| |
|
2,210 |
|
|
| |
|
1,850 |
|
|
| |
|
| |
|
| |
|
143 |
|
|
| |
|
144 |
|
|
GE Capital Mortgage Services, Inc. Trust |
|
| |
|
| |
|
13 |
|
|
| |
|
12 |
|
|
| |
|
7.059% due 12/25/2034 •(j) |
|
| |
|
2,156 |
|
|
| |
|
1,676 |
|
|
Home Equity Mortgage Loan Asset-Backed Trust |
|
4.674% due 04/25/2037 •(j) |
|
| |
|
2,937 |
|
|
| |
|
1,989 |
|
|
HSI Asset Securitization Corp. Trust |
|
4.654% due 04/25/2037 •(j) |
|
| |
|
2,621 |
|
|
| |
|
1,298 |
|
4.774% due 12/25/2036 •(j) |
|
| |
|
4,107 |
|
|
| |
|
983 |
|
|
MASTR Asset-Backed Securities Trust |
|
4.654% due 08/25/2036 •(j) |
|
| |
|
2,315 |
|
|
| |
|
849 |
|
|
Morgan Stanley ABS Capital, Inc. Trust |
|
4.574% due 10/25/2036 •(j) |
|
| |
|
7,838 |
|
|
| |
|
3,420 |
|
| |
|
| |
|
58 |
|
|
| |
|
57 |
|
|
People’s Financial Realty Mortgage Securities Trust |
|
4.564% due 09/25/2036 •(j) |
|
| |
|
5,581 |
|
|
| |
|
1,038 |
|
|
Renaissance Home Equity Loan Trust |
|
7.238% due 09/25/2037 (j) |
|
| |
|
3,221 |
|
|
| |
|
1,276 |
|
|
Soundview Home Loan Trust |
|
5.384% due 10/25/2037 •(j) |
|
| |
|
1,408 |
|
|
| |
|
1,086 |
|
|
Structured Asset Investment Loan Trust |
|
| |
|
| |
|
68 |
|
|
| |
|
82 |
|
|
| |
| |
|
|
| |
| |
|
|
|
|
| |
| |
|
|
| |
| |
|
25,807 |
|
|
| |
| |
|
|
| |
| |
|
|
|
|
| |
MANUFACTURING HOUSE ABS OTHER 0.9% |
|
|
Conseco Finance Securitizations Corp. |
|
| |
|
| |
|
612 |
|
|
| |
|
619 |
|
|
UCFC Manufactured Housing Contract |
|
| |
|
| |
|
14 |
|
|
| |
|
14 |
|
|
| |
| |
|
|
| |
| |
|
|
|
|
| |
| |
|
|
| |
| |
|
633 |
|
|
| |
| |
|
|
| |
| |
|
|
|
|
| |
MANUFACTURING HOUSE SEQUENTIAL 0.2% |
|
|
Bombardier Capital Mortgage Securitization Corp. |
|
| |
|
| |
|
1,185 |
|
|
| |
|
87 |
|
|
Conseco Finance Securitizations Corp. |
|
| |
|
| |
|
324 |
|
|
| |
|
65 |
|
|
| |
| |
|
|
| |
| |
|
|
|
|
| |
| |
|
|
| |
| |
|
152 |
|
|
| |
| |
|
|
| |
| |
|
|
|
|
| |
WHOLE LOAN COLLATERAL 2.0% |
|
|
Bear Stearns Asset-Backed Securities Trust |
|
| |
|
| |
|
21 |
|
|
| |
|
14 |
|
|
|
|
|
|
|
|
|
|
|
|
|
| |
| See Accompanying Notes |
|
|
ANNUAL REPORT |
|
|
| |
|
|
JUNE 30, 2025 |
|
|
33 |
|
|
|
|
|
|
|
|
|
|
|
|
| |
| |
|
|
|
PRINCIPAL
AMOUNT
(000S) |
|
|
|
|
MARKET
VALUE
(000S) |
|
|
Citigroup Mortgage Loan Trust |
|
5.134% due 11/25/2046 •(j) |
|
$ |
|
|
1,100 |
|
|
$ |
|
|
898 |
|
|
First Franklin Mortgage Loan Trust |
|
| |
|
| |
|
312 |
|
|
| |
|
287 |
|
|
| |
|
| |
|
| |
|
654 |
|
|
| |
|
285 |
|
|
| |
| |
|
|
| |
| |
|
|
|
|
| |
| |
|
|
| |
| |
|
1,484 |
|
|
| |
| |
|
|
| |
| |
|
|
|
|
| |
|
|
|
| |
|
| |
|
| |
|
1,200 |
|
|
| |
|
1,220 |
|
|
AIM Aviation Finance Ltd. |
|
6.213% due 02/15/2040 þ(j) |
|
| |
|
553 |
|
|
| |
|
528 |
|
|
| |
|
| |
|
| |
|
500 |
|
|
| |
|
229 |
|
|
| |
|
| |
|
| |
|
600 |
|
|
| |
|
247 |
|
|
| |
|
| |
|
| |
|
500 |
|
|
| |
|
500 |
|
|
| |
|
| |
|
| |
|
600 |
|
|
| |
|
545 |
|
|
| |
|
| |
|
| |
|
600 |
|
|
| |
|
304 |
|
|
| |
|
0.000% due 07/16/2029 «(f) |
|
| |
|
5 |
|
|
| |
|
1 |
|
0.000% due 03/15/2030 «(f) |
|
| |
|
8 |
|
|
| |
|
27 |
|
|
National Collegiate Commutation Trust |
|
| |
|
| |
|
3,496 |
|
|
| |
|
517 |
|
|
SMB Private Education Loan Trust |
|
0.000% due 02/16/2055 «(f) |
|
| |
|
0 |
|
|
| |
|
180 |
|
|
SoFi Professional Loan Program LLC |
|
0.000% due 09/25/2040 «(f) |
|
| |
|
339 |
|
|
| |
|
26 |
|
|
| |
| |
|
|
| |
| |
|
|
|
|
| |
| |
|
|
| |
| |
|
4,324 |
|
|
| |
| |
|
|
| |
| |
|
|
|
Total Asset-Backed Securities
(Cost $47,727) |
|
|
|
|
|
| |
|
|
|
|
| |
| |
|
|
|
SHARES |
|
|
|
|
|
|
|
|
|
| |
COMMUNICATION SERVICES 1.5% |
|
|
|
|
|
| |
Clear Channel Outdoor Holdings, Inc. (e) |
|
| |
|
108,013 |
|
|
| |
|
127 |
|
|
|
|
|
| |
iHeartMedia, Inc. ‘A’ (e) |
|
| |
|
25,745 |
|
|
| |
|
45 |
|
|
|
|
|
| |
iHeartMedia, Inc. ‘B’ «(e) |
|
| |
|
20,009 |
|
|
| |
|
31 |
|
|
|
|
|
| |
Windstream Services LLC «(e) |
|
| |
|
43,518 |
|
|
| |
|
853 |
|
|
| |
| |
|
|
| |
| |
|
|
|
|
| |
| |
|
|
| |
| |
|
1,056 |
|
|
| |
| |
|
|
| |
| |
|
|
|
|
|
|
|
|
|
|
|
|
|
|
|
| |
| |
|
|
|
|
|
|
|
|
|
|
CONSUMER DISCRETIONARY 0.0% |
|
|
|
|
|
| |
| |
|
| |
|
2,750 |
|
|
$ |
|
|
17 |
|
|
| |
| |
|
|
| |
| |
|
|
|
|
| |
|
|
|
|
|
|
| |
MNSN Holdings, Inc. «(e)(i) |
|
| |
|
511 |
|
|
| |
|
2 |
|
|
| |
| |
|
|
| |
| |
|
|
|
|
| |
|
|
|
|
|
|
| |
| |
|
| |
|
81,058 |
|
|
| |
|
3,660 |
|
|
| |
| |
|
|
| |
| |
|
|
|
|
| |
|
|
|
|
|
|
| |
Incora New Equity «(e)(i) |
|
| |
|
47,162 |
|
|
| |
|
1,593 |
|
|
|
|
|
| |
Mcdermott International Ltd. (e) |
|
| |
|
57 |
|
|
| |
|
1 |
|
|
|
|
|
| |
Westmoreland Mining
Holdings «(e)(i) |
|
| |
|
9,154 |
|
|
| |
|
6 |
|
|
|
|
|
| |
Westmoreland Mining LLC «(e)(i) |
|
| |
|
16,748 |
|
|
| |
|
39 |
|
|
| |
| |
|
|
| |
| |
|
|
|
|
| |
| |
|
|
| |
| |
|
1,639 |
|
|
| |
| |
|
|
| |
| |
|
|
|
Total Common Stocks (Cost $8,246) |
|
|
|
|
|
| |
|
|
|
|
| |
|
|
|
| |
COMMUNICATION SERVICES 0.2% |
|
|
|
|
|
| |
Windstream - Exp. 04/08/2060 « |
|
| |
|
8,652 |
|
|
| |
|
169 |
|
|
| |
| |
|
|
| |
| |
|
|
|
|
| |
CONSUMER DISCRETIONARY 0.0% |
|
|
|
|
|
| |
West Marine - Exp. 09/11/2028 « |
|
| |
|
357 |
|
|
| |
|
0 |
|
|
| |
| |
|
|
| |
| |
|
|
|
Total Warrants (Cost $113) |
|
|
|
|
|
| |
|
|
|
|
| |
PREFERRED SECURITIES 1.0% |
|
|
| |
|
|
|
| |
|
| |
|
| |
|
1,626 |
|
|
| |
|
29 |
|
|
| |
|
0.000% due 11/07/2032 (f) |
|
| |
|
440 |
|
|
| |
|
0 |
|
| |
|
| |
|
583 |
|
|
| |
|
309 |
|
|
|
|
|
| |
Syniverse Holdings, Inc. «(i) |
|
| |
|
448,404 |
|
|
| |
|
424 |
|
|
| |
| |
|
|
| |
| |
|
|
|
Total Preferred Securities (Cost $792) |
|
|
|
|
|
| |
|
|
|
|
| |
REAL ESTATE INVESTMENT TRUSTS 0.8% |
|
|
| |
|
|
|
|
|
|
| |
| |
|
| |
|
34,736 |
|
|
| |
|
150 |
|
|
|
|
|
|
|
|
|
|
|
|
|
| |
| |
|
|
|
SHARES |
|
|
|
|
MARKET
VALUE
(000S) |
|
|
|
|
|
| |
| |
|
| |
|
13,531 |
|
|
$ |
|
|
441 |
|
|
| |
| |
|
|
| |
| |
|
|
|
Total Real Estate Investment Trusts (Cost $254) |
|
|
|
|
|
| |
|
|
|
|
| |
SHORT-TERM INSTRUMENTS 0.6% |
|
|
| |
|
|
|
State Street Institutional U.S. Government Money Market Fund, Premier Class |
|
|
|
|
|
| |
| |
|
| |
|
127,559 |
|
|
| |
|
127 |
|
|
| |
| |
|
|
| |
| |
|
|
|
|
| |
| |
|
|
|
PRINCIPAL
AMOUNT
(000S) |
|
|
|
|
|
|
|
|
4.390% due 08/07/2025 (f)(g)(m) |
|
$ |
|
|
286 |
|
|
| |
|
285 |
|
|
| |
| |
|
|
| |
| |
|
|
|
Total Short-Term Instruments
(Cost $413) |
|
|
|
|
|
| |
|
|
|
|
|
|
|
| |
|
| |
| |
|
|
| |
| |
|
| |
Total Investments in Securities
(Cost $125,382) |
|
|
|
|
|
| |
|
|
|
|
| |
| |
|
|
|
SHARES |
|
|
|
|
|
|
INVESTMENTS IN AFFILIATES 9.8% |
|
|
| |
SHORT-TERM INSTRUMENTS 9.8% |
|
|
| |
CENTRAL FUNDS USED FOR CASH MANAGEMENT PURPOSES 9.8% |
|
|
|
|
|
| |
PIMCO Short-Term Floating NAV Portfolio III |
|
| |
|
732,964 |
|
|
| |
|
7,137 |
|
|
| |
| |
|
|
| |
| |
|
|
|
Total Short-Term Instruments
(Cost $7,130) |
|
|
|
|
|
| |
|
|
|
|
|
|
|
| |
|
| |
| |
|
|
| |
| |
|
| |
Total Investments in Affiliates
(Cost $7,130) |
|
|
|
|
|
|
|
|
| |
|
| |
| |
|
|
| |
| |
|
| |
Total Investments 149.5%
(Cost $132,512) |
|
|
$ |
|
|
|
|
|
| |
Financial Derivative
Instruments (k)(l) (0.2)% (Cost or Premiums, net $977) |
|
| |
|
|
| |
| |
|
|
|
|
| |
Other Assets and Liabilities, net (49.3)% |
|
|
|
|
|
| |
|
|
|
Net Assets Applicable to Common Shareholders 100.0% |
|
|
$ |
|
|
|
|
|
|
| |
| |
|
|
|
NOTES TO SCHEDULE OF INVESTMENTS:
|
A zero balance may reflect actual amounts rounding to less than one thousand. |
|
Security valued using significant unobservable inputs (Level 3). |
|
All or a portion of this amount represents unfunded loan commitments. The interest rate for the unfunded portion will be determined at the time of funding. See Note 4, Securities and Other Investments, in the Notes to Financial Statements for more information regarding unfunded loan commitments. |
|
Variable or Floating rate security. Rate shown is the rate in effect as of period end. Certain variable rate securities are not based on a published reference rate and spread, rather are determined by the issuer or agent and are based on current market conditions. Reference rate is as of reset date, which may vary by security. These securities may not indicate a reference rate and/or spread in their description. |
|
Rate shown is the rate in effect as of period end. The rate may be based on a fixed rate, a capped rate or a floor rate and may convert to a variable or floating rate in the future. These securities do not indicate a reference rate and spread in their description. |
|
Coupon represents a rate which changes periodically based on a predetermined schedule or event. Rate shown is the rate in effect as of period end. |
|
Security is an Interest Only (“IO”) or IO Strip. |
|
Payment in-kind security. |
|
Security is not accruing income as of the date of this report. |
|
Security did not produce income within the last twelve months. |
|
|
|
|
|
|
| |
34 |
|
PIMCO CLOSED-END FUNDS |
|
|
See Accompanying Notes |
|
|
Coupon represents a yield to maturity. |
|
Coupon represents a 7-Day Yield. |
(i) RESTRICTED SECURITIES:
|
|
|
|
|
|
|
|
|
|
|
|
|
|
|
|
|
|
|
|
|
|
|
|
| |
|
|
|
|
|
|
|
|
|
|
|
|
|
|
|
|
|
Market Value
as Percentage
of Net Assets |
|
| |
|
|
|
| |
|
|
| |
|
|
|
|
$ |
3,387 |
|
|
$ |
3,660 |
|
|
|
5.01 |
% |
| |
|
|
|
| |
|
|
| |
|
12/09/2024 |
|
|
|
25 |
|
|
|
29 |
|
|
|
0.04 |
|
| |
|
|
|
| |
|
|
| |
|
01/31/2025 |
|
|
|
2,291 |
|
|
|
1,593 |
|
|
|
2.18 |
|
Incora Top Holdco LLC 6.000% due 01/30/2033 |
|
|
|
| |
|
|
| |
|
01/31/2025 |
|
|
|
1,012 |
|
|
|
1,403 |
|
|
|
1.92 |
|
| |
|
|
|
| |
|
|
| |
|
03/16/2023 - 03/29/2023 |
|
|
|
6 |
|
|
|
2 |
|
|
|
0.00 |
|
| |
|
|
|
| |
|
|
| |
|
05/12/2022 - 05/30/2025 |
|
|
|
442 |
|
|
|
424 |
|
|
|
0.58 |
|
| |
|
|
|
| |
|
|
| |
|
09/12/2023 |
|
|
|
39 |
|
|
|
17 |
|
|
|
0.02 |
|
Westmoreland Mining Holdings |
|
|
|
| |
|
|
| |
|
12/08/2014 |
|
|
|
266 |
|
|
|
6 |
|
|
|
0.01 |
|
| |
|
|
|
| |
|
|
| |
|
06/30/2023 - 02/03/2025 |
|
|
|
84 |
|
|
|
39 |
|
|
|
0.05 |
|
|
| |
|
|
| |
|
|
| |
|
|
| |
|
|
|
|
|
|
|
|
|
|
|
|
|
| |
$ |
7,552 |
|
|
$ |
7,173 |
|
|
|
9.81 |
% |
|
|
| |
|
|
|
|
|
|
|
|
|
|
|
BORROWINGS AND OTHER FINANCING TRANSACTIONS
REVERSE REPURCHASE AGREEMENTS:
|
|
|
|
|
|
|
|
|
|
|
|
|
|
|
|
|
|
|
|
| |
|
|
|
|
|
|
|
|
|
|
|
|
|
Payable for
Reverse
Repurchase
Agreements |
|
| |
|
|
5.490% |
|
|
|
04/22/2025 |
|
|
|
10/21/2025 |
|
|
$ |
(1,944 |
) |
|
$ |
(1,965 |
) |
| |
|
|
4.600 |
|
|
|
02/10/2025 |
|
|
|
TBD |
|
|
|
(306 |
) |
|
|
(311 |
) |
| |
|
|
5.600 |
|
|
|
04/25/2025 |
|
|
|
10/23/2025 |
|
|
|
(398 |
) |
|
|
(402 |
) |
|
| |
|
5.620 |
|
|
|
04/25/2025 |
|
|
|
10/23/2025 |
|
|
|
(7,199 |
) |
|
|
(7,273 |
) |
|
| |
|
5.820 |
|
|
|
04/22/2025 |
|
|
|
07/22/2025 |
|
|
|
(1,520 |
) |
|
|
(1,537 |
) |
| |
|
|
4.330 |
|
|
|
06/10/2025 |
|
|
|
TBD |
|
|
|
(344 |
) |
|
|
(345 |
) |
|
| |
|
4.700 |
|
|
|
12/20/2024 |
|
|
|
TBD |
|
|
|
(793 |
) |
|
|
(812 |
) |
|
| |
|
5.020 |
|
|
|
06/13/2025 |
|
|
|
09/15/2025 |
|
|
|
(628 |
) |
|
|
(630 |
) |
|
| |
|
5.560 |
|
|
|
02/05/2025 |
|
|
|
08/04/2025 |
|
|
|
(608 |
) |
|
|
(622 |
) |
|
| |
|
5.590 |
|
|
|
06/24/2025 |
|
|
|
10/22/2025 |
|
|
|
(1,027 |
) |
|
|
(1,028 |
) |
| |
|
|
4.700 |
|
|
|
05/19/2025 |
|
|
|
TBD |
|
|
|
(284 |
) |
|
|
(285 |
) |
|
| |
|
4.890 |
|
|
|
04/21/2025 |
|
|
|
07/21/2025 |
|
|
|
(509 |
) |
|
|
(514 |
) |
| |
|
|
4.700 |
|
|
|
06/24/2025 |
|
|
|
TBD |
|
|
|
(568 |
) |
|
|
(568 |
) |
|
| |
|
5.220 |
|
|
|
06/24/2025 |
|
|
|
08/22/2025 |
|
|
|
(223 |
) |
|
|
(223 |
) |
| |
|
|
5.477 |
|
|
|
06/04/2025 |
|
|
|
03/04/2026 |
|
|
|
(522 |
) |
|
|
(524 |
) |
| |
|
|
4.590 |
|
|
|
04/09/2025 |
|
|
|
07/10/2025 |
|
|
|
(684 |
) |
|
|
(692 |
) |
|
| |
|
4.720 |
|
|
|
06/04/2025 |
|
|
|
09/04/2025 |
|
|
|
(288 |
) |
|
|
(289 |
) |
|
| |
|
4.790 |
|
|
|
06/04/2025 |
|
|
|
09/04/2025 |
|
|
|
(788 |
) |
|
|
(790 |
) |
|
| |
|
4.940 |
|
|
|
05/27/2025 |
|
|
|
10/27/2025 |
|
|
|
(97 |
) |
|
|
(98 |
) |
|
| |
|
5.020 |
|
|
|
06/17/2025 |
|
|
|
09/17/2025 |
|
|
|
(764 |
) |
|
|
(765 |
) |
|
| |
|
5.040 |
|
|
|
06/17/2025 |
|
|
|
09/17/2025 |
|
|
|
(668 |
) |
|
|
(670 |
) |
| |
|
|
5.510 |
|
|
|
06/20/2025 |
|
|
|
12/19/2025 |
|
|
|
(4,096 |
) |
|
|
(4,103 |
) |
| |
|
|
5.440 |
|
|
|
06/13/2025 |
|
|
|
10/14/2025 |
|
|
|
(615 |
) |
|
|
(617 |
) |
|
| |
|
5.540 |
|
|
|
06/24/2025 |
|
|
|
08/08/2025 |
|
|
|
(157 |
) |
|
|
(157 |
) |
|
| |
|
5.640 |
|
|
|
04/07/2025 |
|
|
|
07/07/2025 |
|
|
|
(1,746 |
) |
|
|
(1,770 |
) |
| |
|
|
4.740 |
|
|
|
06/24/2025 |
|
|
|
09/24/2025 |
|
|
|
(364 |
) |
|
|
(364 |
) |
|
| |
|
5.490 |
|
|
|
05/19/2025 |
|
|
|
11/19/2025 |
|
|
|
(673 |
) |
|
|
(677 |
) |
| |
|
|
4.500 |
|
|
|
12/20/2024 |
|
|
|
TBD |
|
|
|
(18 |
) |
|
|
(19 |
) |
| |
|
|
5.270 |
|
|
|
03/10/2025 |
|
|
|
09/10/2025 |
|
|
|
(2,248 |
) |
|
|
(2,285 |
) |
|
| |
|
5.310 |
|
|
|
05/19/2025 |
|
|
|
11/19/2025 |
|
|
|
(99 |
) |
|
|
(99 |
) |
|
| |
|
5.400 |
|
|
|
04/08/2025 |
|
|
|
07/08/2025 |
|
|
|
(1,167 |
) |
|
|
(1,182 |
) |
|
| |
|
5.500 |
|
|
|
04/08/2025 |
|
|
|
07/08/2025 |
|
|
|
(5,048 |
) |
|
|
(5,113 |
) |
|
| |
|
|
| |
|
|
| |
|
|
| |
|
|
| |
|
|
|
Total Reverse Repurchase Agreements |
|
|
|
| |
|
|
| |
|
|
| |
|
|
| |
|
|
|
|
| |
|
|
| |
|
|
| |
|
|
| |
|
|
| |
|
|
|
|
|
|
|
|
|
|
|
|
|
|
|
| |
See Accompanying Notes |
|
|
|
|
|
| |
|
|
JUNE 30, 2025 |
|
|
|
BORROWINGS AND OTHER FINANCING TRANSACTIONS SUMMARY
The following is a summary by counterparty of the market value of Borrowings and Other Financing Transactions and collateral pledged/(received) as of June 30, 2025:
|
|
|
|
|
|
|
|
|
|
|
|
|
|
|
|
|
|
|
|
|
|
|
|
| |
|
|
Repurchase
Agreement
Proceeds
to be
Received |
|
|
Payable for
Reverse
Repurchase
Agreements |
|
|
Payable for Sale-Buyback Transactions |
|
|
Total
Borrowings and
Other Financing
Transactions |
|
|
Collateral
Pledged/(Received) |
|
|
|
|
Global/Master Repurchase Agreement |
|
| |
|
$ |
0 |
|
|
$ |
(1,965 |
) |
|
$ |
0 |
|
|
$ |
(1,965 |
) |
|
$ |
2,621 |
|
|
$ |
656 |
|
| |
|
|
0 |
|
|
|
(311 |
) |
|
|
0 |
|
|
|
(311 |
) |
|
|
332 |
|
|
|
21 |
|
| |
|
|
0 |
|
|
|
(9,212 |
) |
|
|
0 |
|
|
|
(9,212 |
) |
|
|
12,242 |
|
|
|
3,030 |
|
| |
|
|
0 |
|
|
|
(3,437 |
) |
|
|
0 |
|
|
|
(3,437 |
) |
|
|
4,341 |
|
|
|
904 |
|
| |
|
|
0 |
|
|
|
(799 |
) |
|
|
0 |
|
|
|
(799 |
) |
|
|
876 |
|
|
|
77 |
|
| |
|
|
0 |
|
|
|
(791 |
) |
|
|
0 |
|
|
|
(791 |
) |
|
|
934 |
|
|
|
143 |
|
| |
|
|
0 |
|
|
|
(524 |
) |
|
|
0 |
|
|
|
(524 |
) |
|
|
729 |
|
|
|
205 |
|
| |
|
|
0 |
|
|
|
(3,304 |
) |
|
|
0 |
|
|
|
(3,304 |
) |
|
|
3,922 |
|
|
|
618 |
|
| |
|
|
0 |
|
|
|
(4,103 |
) |
|
|
0 |
|
|
|
(4,103 |
) |
|
|
6,078 |
|
|
|
1,975 |
|
| |
|
|
0 |
|
|
|
(2,544 |
) |
|
|
0 |
|
|
|
(2,544 |
) |
|
|
3,318 |
|
|
|
774 |
|
| |
|
|
0 |
|
|
|
(1,041 |
) |
|
|
0 |
|
|
|
(1,041 |
) |
|
|
1,229 |
|
|
|
188 |
|
| |
|
|
0 |
|
|
|
(19 |
) |
|
|
0 |
|
|
|
(19 |
) |
|
|
18 |
|
|
|
(1 |
) |
| |
|
|
0 |
|
|
|
0 |
|
|
|
0 |
|
|
|
0 |
|
|
|
11,570 |
|
|
|
11,570 |
|
| |
|
|
0 |
|
|
|
(8,679 |
) |
|
|
0 |
|
|
|
(8,679 |
) |
|
|
0 |
|
|
|
(8,679 |
) |
|
| |
|
|
|
|
|
|
|
|
|
|
|
|
|
|
| |
|
|
| |
|
| |
Total Borrowings and Other Financing Transactions |
|
|
|
|
|
|
|
|
|
|
|
|
|
|
|
| |
|
|
| |
|
| |
|
| |
|
|
|
|
|
|
|
|
|
|
|
|
|
|
| |
|
|
| |
|
| |
CERTAIN TRANSFERS ACCOUNTED FOR AS SECURED BORROWINGS
Remaining Contractual Maturity of the Agreements
|
|
|
|
|
|
|
|
|
|
|
|
|
|
|
|
|
|
|
|
| |
| |
|
|
|
|
|
|
|
|
|
|
|
|
|
|
|
Reverse Repurchase Agreements |
|
| |
|
$ |
0 |
|
|
$ |
(1,206 |
) |
|
$ |
(1,600 |
) |
|
$ |
(2,438 |
) |
|
$ |
(5,244 |
) |
| |
|
|
0 |
|
|
|
(1,537 |
) |
|
|
0 |
|
|
|
0 |
|
|
|
(1,537 |
) |
Non-Agency Mortgage-Backed Securities |
|
|
0 |
|
|
|
(1,170 |
) |
|
|
(2,910 |
) |
|
|
(6,117 |
) |
|
|
(10,197 |
) |
| |
|
|
0 |
|
|
|
(6,895 |
) |
|
|
(2,285 |
) |
|
|
(10,571 |
) |
|
|
(19,751 |
) |
|
| |
|
|
|
|
|
|
|
|
|
|
|
|
|
|
|
|
|
|
|
| |
|
|
|
|
|
|
|
|
|
|
|
|
|
|
|
|
|
|
|
|
|
| |
|
|
|
|
|
|
|
|
|
|
|
|
|
|
|
|
|
|
|
Payable for reverse repurchase agreements |
|
|
|
|
|
|
|
| |
|
|
|
|
Securities with an aggregate market value of $47,917 and cash of $315 have been pledged as collateral under the terms of the above master agreements as of June 30, 2025. |
|
The average amount of borrowings outstanding during the period ended June 30, 2025 was $(42,532) at a weighted average interest rate of 5.803%. Average borrowings may include reverse repurchase agreements and sale-buyback transactions, if held during the period. |
|
Open maturity reverse repurchase agreement. |
|
Net Exposure represents the net receivable/(payable) that would be due from/to the counterparty in the event of default. Exposure from borrowings and other financing transactions can only be netted across transactions governed under the same master agreement with the same legal entity. See Note 8, Master Netting Arrangements, in the Notes to Financial Statements for more information. |
(k) FINANCIAL DERIVATIVE INSTRUMENTS: EXCHANGE-TRADED OR CENTRALLY CLEARED
FUTURES CONTRACTS:
SHORT FUTURES CONTRACTS
|
|
|
|
|
|
|
|
|
|
|
|
|
|
|
|
|
|
|
|
|
|
|
|
| |
| Description |
|
Expiration
Month |
|
|
# of
Contracts |
|
|
Notional
Amount |
|
|
Unrealized
Appreciation/
(Depreciation) |
|
|
|
|
| |
|
|
|
|
|
3-Month SOFR Active Contract December Futures |
|
|
03/2026 |
|
|
|
1 |
|
|
$ |
(241 |
) |
|
$ |
4 |
|
|
$ |
0 |
|
|
$ |
0 |
|
3-Month SOFR Active Contract June Futures |
|
|
09/2025 |
|
|
|
2 |
|
|
|
(478 |
) |
|
|
11 |
|
|
|
0 |
|
|
|
0 |
|
3-Month SOFR Active Contract March Futures |
|
|
06/2026 |
|
|
|
1 |
|
|
|
(242 |
) |
|
|
3 |
|
|
|
0 |
|
|
|
0 |
|
3-Month SOFR Active Contract September Futures |
|
|
12/2025 |
|
|
|
1 |
|
|
|
(240 |
) |
|
|
5 |
|
|
|
0 |
|
|
|
0 |
|
|
| |
|
|
| |
|
|
| |
|
|
| |
|
|
|
|
|
|
|
|
|
|
|
| |
|
|
|
|
|
|
|
|
|
|
|
|
|
|
|
| |
|
|
|
|
|
|
|
|
|
|
|
SWAP AGREEMENTS:
INTEREST RATE SWAPS
|
|
|
|
|
|
|
|
|
|
|
|
|
|
|
|
|
|
|
|
|
|
|
|
|
|
|
|
|
|
|
|
|
|
|
|
|
|
|
|
| |
|
|
Floating Rate Index |
|
Fixed Rate |
|
|
Payment
Frequency |
|
Maturity
Date |
|
|
Notional
Amount |
|
|
Premiums
Paid/(Received) |
|
|
Unrealized
Appreciation/
(Depreciation) |
|
|
Market
Value |
|
|
Variation Margin |
|
| |
|
|
|
|
|
| |
|
1-Day USD-SOFR Compounded-OIS |
|
|
3.250 |
% |
|
Annual |
|
|
06/18/2030 |
|
|
$ |
|
|
|
|
7,200 |
|
|
$ |
(69 |
) |
|
$ |
11 |
|
|
$ |
(58 |
) |
|
$ |
12 |
|
|
$ |
0 |
|
| |
|
1-Day USD-SOFR Compounded-OIS |
|
|
2.300 |
|
|
Annual |
|
|
01/17/2026 |
|
|
|
|
| |
|
300 |
|
|
|
0 |
|
|
|
6 |
|
|
|
6 |
|
|
|
0 |
|
|
|
0 |
|
| |
|
1-Day USD-SOFR Compounded-OIS |
|
|
1.250 |
|
|
|
|
|
12/15/2026 |
|
|
|
|
| |
|
200 |
|
|
|
(1 |
) |
|
|
(7 |
) |
|
|
(8 |
) |
|
|
0 |
|
|
|
0 |
|
| |
|
1-Day USD-SOFR Compounded-OIS |
|
|
1.550 |
|
|
Semi-Annual |
|
|
01/20/2027 |
|
|
|
|
| |
|
1,900 |
|
|
|
(4 |
) |
|
|
(67 |
) |
|
|
(71 |
) |
|
|
0 |
|
|
|
0 |
|
| |
|
1-Day USD-SOFR Compounded-OIS |
|
|
0.500 |
|
|
Semi-Annual |
|
|
06/16/2028 |
|
|
|
|
| |
|
140 |
|
|
|
(5 |
) |
|
|
(8 |
) |
|
|
(13 |
) |
|
|
0 |
|
|
|
0 |
|
| |
|
1-Day USD-SOFR Compounded-OIS |
|
|
3.750 |
|
|
Annual |
|
|
12/20/2028 |
|
|
|
|
| |
|
4,900 |
|
|
|
45 |
|
|
|
(5 |
) |
|
|
40 |
|
|
|
5 |
|
|
|
0 |
|
| |
|
1-Day USD-SOFR Compounded-OIS |
|
|
1.700 |
|
|
Semi-Annual |
|
|
01/12/2029 |
|
|
|
|
| |
|
2,000 |
|
|
|
(6 |
) |
|
|
(128 |
) |
|
|
(134 |
) |
|
|
2 |
|
|
|
0 |
|
| |
|
1-Day USD-SOFR Compounded-OIS |
|
|
4.250 |
|
|
Annual |
|
|
06/19/2029 |
|
|
|
|
| |
|
7,800 |
|
|
|
(32 |
) |
|
|
279 |
|
|
|
247 |
|
|
|
10 |
|
|
|
0 |
|
| |
|
1-Day USD-SOFR Compounded-OIS |
|
|
4.500 |
|
|
Annual |
|
|
06/17/2030 |
|
|
|
|
| |
|
10,300 |
|
|
|
8 |
|
|
|
496 |
|
|
|
504 |
|
|
|
18 |
|
|
|
0 |
|
| |
|
1-Day USD-SOFR Compounded-OIS |
|
|
1.370 |
|
|
Semi-Annual |
|
|
07/19/2031 |
|
|
|
|
| |
|
100 |
|
|
|
0 |
|
|
|
13 |
|
|
|
13 |
|
|
|
0 |
|
|
|
0 |
|
| |
|
1-Day USD-SOFR Compounded-OIS |
|
|
1.360 |
|
|
Semi-Annual |
|
|
07/20/2031 |
|
|
|
|
| |
|
100 |
|
|
|
0 |
|
|
|
13 |
|
|
|
13 |
|
|
|
0 |
|
|
|
0 |
|
| |
|
1-Day USD-SOFR Compounded-OIS |
|
|
3.500 |
|
|
Annual |
|
|
12/20/2033 |
|
|
|
|
| |
|
1,800 |
|
|
|
54 |
|
|
|
(31 |
) |
|
|
23 |
|
|
|
0 |
|
|
|
(6 |
) |
| |
|
1-Day USD-SOFR Compounded-OIS |
|
|
3.000 |
|
|
Semi-Annual |
|
|
12/19/2038 |
|
|
|
|
| |
|
5,200 |
|
|
|
13 |
|
|
|
611 |
|
|
|
624 |
|
|
|
0 |
|
|
|
(24 |
) |
| |
|
1-Day USD-SOFR Compounded-OIS |
|
|
2.000 |
|
|
Semi-Annual |
|
|
01/15/2050 |
|
|
|
|
| |
|
100 |
|
|
|
(1 |
) |
|
|
37 |
|
|
|
36 |
|
|
|
0 |
|
|
|
(1 |
) |
| |
|
1-Day USD-SOFR Compounded-OIS |
|
|
1.625 |
|
|
Semi-Annual |
|
|
01/16/2050 |
|
|
|
|
| |
|
400 |
|
|
|
0 |
|
|
|
166 |
|
|
|
166 |
|
|
|
0 |
|
|
|
(2 |
) |
| |
|
1-Day USD-SOFR Compounded-OIS |
|
|
1.750 |
|
|
Semi-Annual |
|
|
01/22/2050 |
|
|
|
|
| |
|
700 |
|
|
|
(4 |
) |
|
|
281 |
|
|
|
277 |
|
|
|
0 |
|
|
|
(4 |
) |
| |
|
1-Day USD-SOFR Compounded-OIS |
|
|
1.625 |
|
|
Semi-Annual |
|
|
02/03/2050 |
|
|
|
|
| |
|
400 |
|
|
|
(2 |
) |
|
|
168 |
|
|
|
166 |
|
|
|
0 |
|
|
|
(2 |
) |
| |
|
1-Day USD-SOFR Compounded-OIS |
|
|
1.450 |
|
|
Semi-Annual |
|
|
04/07/2051 |
|
|
|
|
| |
|
1,300 |
|
|
|
(1 |
) |
|
|
596 |
|
|
|
595 |
|
|
|
0 |
|
|
|
(6 |
) |
| |
|
1-Day USD-SOFR Compounded-OIS |
|
|
1.750 |
|
|
Annual |
|
|
06/15/2052 |
|
|
|
|
| |
|
5,700 |
|
|
|
994 |
|
|
|
1,097 |
|
|
|
2,091 |
|
|
|
0 |
|
|
|
(32 |
) |
| |
|
1-Day USD-SOFR Compounded-OIS |
|
|
1.750 |
|
|
Annual |
|
|
12/21/2052 |
|
|
|
|
| |
|
2,800 |
|
|
|
674 |
|
|
|
400 |
|
|
|
1,074 |
|
|
|
0 |
|
|
|
(15 |
) |
|
| |
| |
|
|
| |
| |
|
|
| |
|
|
| |
|
|
| |
|
|
|
|
|
|
|
|
|
|
|
|
|
|
|
|
|
|
|
| |
|
|
|
|
| |
|
|
| |
|
|
|
|
|
|
|
|
|
|
|
|
|
|
|
|
|
|
|
|
|
| |
|
|
| |
|
|
| |
|
|
|
|
|
|
|
|
|
|
|
|
|
|
|
|
|
|
|
FINANCIAL DERIVATIVE INSTRUMENTS: EXCHANGE-TRADED OR CENTRALLY CLEARED SUMMARY
The following is a summary of the market value and variation margin of Exchange-Traded or Centrally Cleared Financial Derivative Instruments as of June 30, 2025:
|
|
|
|
|
|
|
|
|
|
|
|
|
|
|
|
|
|
|
|
|
|
|
|
|
|
|
|
|
|
|
|
|
|
|
|
| |
| |
|
Financial Derivative Assets |
|
|
|
|
|
Financial Derivative Liabilities |
|
| |
|
|
|
|
|
|
|
Total |
|
|
|
|
|
|
|
|
Variation Margin
Liability |
|
|
Total |
|
| |
|
|
|
|
|
|
|
|
|
|
|
|
|
|
|
|
|
|
|
|
|
Total Exchange-Traded or Centrally Cleared |
|
|
|
|
|
|
|
|
|
|
|
|
|
|
|
|
|
|
|
| |
|
|
|
|
|
|
|
|
|
|
|
|
|
|
|
|
| |
|
|
|
|
|
|
|
|
|
|
|
|
|
|
|
|
|
|
| |
|
|
|
|
|
|
|
|
|
|
|
|
|
|
|
Cash of $1,024 has been pledged as collateral for exchange-traded and centrally cleared financial derivative instruments as of June 30, 2025. See Note 8, Master Netting Arrangements, in the Notes to Financial Statements for more information.
(l) FINANCIAL DERIVATIVE INSTRUMENTS: OVER THE COUNTER
SWAP AGREEMENTS:
CREDIT DEFAULT SWAPS ON CREDIT INDEXES - SELL PROTECTION
(1)
|
|
|
|
|
|
|
|
|
|
|
|
|
|
|
|
|
|
|
|
|
|
|
|
|
|
|
|
|
|
|
|
|
|
|
|
| |
|
|
Index/Tranches |
|
Fixed
Receive Rate |
|
|
Payment
Frequency |
|
Maturity
Date |
|
|
|
|
|
Premiums
Paid/(Received) |
|
|
Unrealized
Appreciation/
(Depreciation) |
|
|
Swap Agreements, at Value (3) |
|
| |
|
|
|
|
|
GST |
|
|
|
|
0.320 |
% |
|
Monthly |
|
|
07/25/2045 |
|
|
$ |
|
|
|
|
1,405 |
|
|
$ |
(280 |
) |
|
$ |
175 |
|
|
$ |
0 |
|
|
$ |
(105 |
) |
|
| |
ABX.HE.PENAAA.7-1 Index « |
|
|
0.090 |
|
|
Monthly |
|
|
08/25/2037 |
|
|
|
|
| |
|
363 |
|
|
|
(406 |
) |
|
|
399 |
|
|
|
0 |
|
|
|
(7 |
) |
|
| |
| |
|
|
| |
| |
|
|
| |
|
|
| |
|
|
| |
|
|
|
|
|
|
|
|
|
|
|
|
|
|
|
| |
|
|
|
|
|
|
|
|
|
|
|
|
|
|
|
|
|
|
|
| |
|
|
|
|
|
|
|
|
|
|
|
|
|
|
|
FINANCIAL DERIVATIVE INSTRUMENTS: OVER THE COUNTER SUMMARY
The following is a summary by counterparty of the market value of OTC financial derivative instruments and collateral pledged/(received) as of June 30, 2025:
|
|
|
|
|
|
|
|
|
|
|
|
|
|
|
|
|
|
|
|
|
|
|
|
|
|
|
|
|
|
|
|
|
|
|
|
|
|
|
|
|
|
|
|
|
|
|
|
| |
| |
|
Financial Derivative Assets |
|
|
|
|
|
Financial Derivative Liabilities |
|
|
|
|
|
|
|
|
|
|
|
|
Forward
Foreign
Currency
Contracts |
|
|
|
|
|
|
|
|
|
|
|
|
|
|
Forward
Foreign
Currency
Contracts |
|
|
|
|
|
|
|
|
|
|
|
Net Market
Value of OTC
Derivatives |
|
|
Collateral
Pledged/
(Received) |
|
|
|
|
| |
|
$ |
0 |
|
|
$ |
0 |
|
|
$ |
0 |
|
|
$ |
0 |
|
|
|
|
| |
$ |
0 |
|
|
$ |
0 |
|
|
$ |
(112 |
) |
|
$ |
(112 |
) |
|
$ |
(112 |
) |
|
$ |
285 |
|
|
$ |
173 |
|
|
| |
|
|
|
|
|
|
|
|
|
|
|
|
|
|
|
|
|
|
| |
|
|
|
|
|
|
|
|
|
|
|
|
|
|
|
|
|
|
| |
|
|
| |
|
| |
|
|
|
|
|
|
|
|
|
|
|
|
| |
See Accompanying Notes |
|
|
|
|
|
| |
|
|
JUNE 30, 2025 |
|
|
|
|
Securities with an aggregate market value of $285 have been pledged as collateral for financial derivative instruments as governed by International Swaps and Derivatives Association, Inc. master agreements as of June 30, 2025. |
|
If the Fund is a seller of protection and a credit event occurs, as defined under the terms of that particular swap agreement, the Fund will either (i) pay to the buyer of protection an amount equal to the notional amount of the swap and take delivery of the referenced obligation or underlying securities comprising the referenced index or (ii) pay a net settlement amount in the form of cash, securities or other deliverable obligations equal to the notional amount of the swap less the recovery value of the referenced obligation or underlying securities comprising the referenced index. |
|
The maximum potential amount the Fund could be required to pay as a seller of credit protection or receive as a buyer of credit protection if a credit event occurs as defined under the terms of that particular swap agreement. |
|
The prices and resulting values for credit default swap agreements serve as indicators of the current status of the payment/performance risk and represent the likelihood of an expected liability (or profit) for the credit derivative should the notional amount of the swap agreement be closed/sold as of the period end. Increasing market values, in absolute terms when compared to the notional amount of the swap, represent a deterioration of the underlying referenced instrument’s credit soundness and a greater likelihood or risk of default or other credit event occurring as defined under the terms of the agreement. |
|
Net Exposure represents the net receivable/(payable) that would be due from/to the counterparty in the event of default. Exposure from OTC financial derivative instruments can only be netted across transactions governed under the same master agreement with the same legal entity. See Note 8, Master Netting Arrangements, in the Notes to Financial Statements for more information. |
FAIR VALUE OF FINANCIAL DERIVATIVE INSTRUMENTS
The following is a summary of the fair valuation of the Fund’s derivative instruments categorized by risk exposure. See Note 7, Principal and Other Risks, in the Notes to Financial Statements on risks of the Fund.
Fair Values of Financial Derivative Instruments on the Statements of Assets and Liabilities as of June 30, 2025:
|
|
|
|
|
|
|
|
|
|
|
|
|
|
|
|
|
|
|
|
|
|
|
|
| |
| |
|
Derivatives not accounted for as hedging instruments |
|
| |
|
|
|
|
|
|
|
|
|
|
|
|
|
|
|
|
|
|
Financial Derivative Instruments - Assets |
|
Exchange-traded or centrally cleared |
|
| |
|
$ |
0 |
|
|
$ |
0 |
|
|
$ |
0 |
|
|
$ |
0 |
|
|
$ |
47 |
|
|
$ |
47 |
|
|
| |
|
|
|
|
|
|
|
|
|
|
|
|
|
|
|
|
|
|
|
|
|
|
|
|
Financial Derivative Instruments - Liabilities |
|
Exchange-traded or centrally cleared |
|
| |
|
$ |
0 |
|
|
$ |
0 |
|
|
$ |
0 |
|
|
$ |
0 |
|
|
$ |
92 |
|
|
$ |
92 |
|
|
| |
|
|
|
|
|
|
|
|
|
|
|
|
|
|
|
|
|
|
|
|
|
|
|
| |
|
| |
|
$ |
0 |
|
|
$ |
112 |
|
|
$ |
0 |
|
|
$ |
0 |
|
|
$ |
0 |
|
|
$ |
112 |
|
|
| |
|
|
|
|
|
|
|
|
|
|
|
|
|
|
|
|
|
|
|
|
|
|
|
|
| |
$ |
0 |
|
|
$ |
112 |
|
|
$ |
0 |
|
|
$ |
0 |
|
|
$ |
92 |
|
|
$ |
204 |
|
|
| |
|
|
|
|
|
|
|
|
|
|
|
|
|
|
|
|
|
|
|
|
|
|
|
The effect of Financial Derivative Instruments on the Statements of Operations for the period ended June 30, 2025:
|
|
|
|
|
|
|
|
|
|
|
|
|
|
|
|
|
|
|
|
|
|
|
|
| |
| |
|
Derivatives not accounted for as hedging instruments |
|
| |
|
|
|
|
|
|
|
|
|
|
|
|
|
|
|
|
|
|
Net Realized Gain (Loss) on Financial Derivative Instruments |
|
Exchange-traded or centrally cleared |
|
| |
|
$ |
0 |
|
|
$ |
0 |
|
|
$ |
0 |
|
|
$ |
0 |
|
|
$ |
43 |
|
|
$ |
43 |
|
| |
|
|
0 |
|
|
|
0 |
|
|
|
0 |
|
|
|
0 |
|
|
|
152 |
|
|
|
152 |
|
|
| |
|
|
|
|
|
|
|
|
|
|
|
|
|
|
|
|
|
|
|
|
|
|
|
|
| |
$ |
0 |
|
|
$ |
0 |
|
|
$ |
0 |
|
|
$ |
0 |
|
|
$ |
195 |
|
|
$ |
195 |
|
|
| |
|
|
|
|
|
|
|
|
|
|
|
|
|
|
|
|
|
|
|
|
|
|
|
| |
|
| |
|
$ |
0 |
|
|
$ |
(59 |
) |
|
$ |
0 |
|
|
$ |
0 |
|
|
$ |
0 |
|
|
$ |
(59 |
) |
|
| |
|
|
|
|
|
|
|
|
|
|
|
|
|
|
|
|
|
|
|
|
|
|
|
|
| |
|
| |
$ |
0 |
|
|
$ |
(59 |
) |
|
$ |
0 |
|
|
$ |
0 |
|
|
$ |
195 |
|
|
$ |
136 |
|
|
| |
|
|
|
|
|
|
|
|
|
|
|
|
|
|
|
|
|
|
|
|
|
|
|
|
Net Change in Unrealized Appreciation (Depreciation) on Financial Derivative Instruments |
|
Exchange-traded or centrally cleared |
|
| |
|
$ |
0 |
|
|
$ |
0 |
|
|
$ |
0 |
|
|
$ |
0 |
|
|
$ |
(49 |
) |
|
$ |
(49 |
) |
| |
|
|
0 |
|
|
|
0 |
|
|
|
0 |
|
|
|
0 |
|
|
|
708 |
|
|
|
708 |
|
|
| |
|
|
|
|
|
|
|
|
|
|
|
|
|
|
|
|
|
|
|
|
|
|
|
|
| |
$ |
0 |
|
|
$ |
0 |
|
|
$ |
0 |
|
|
$ |
0 |
|
|
$ |
659 |
|
|
$ |
659 |
|
|
| |
|
|
|
|
|
|
|
|
|
|
|
|
|
|
|
|
|
|
|
|
|
|
|
| |
|
| |
|
$ |
0 |
|
|
$ |
107 |
|
|
$ |
0 |
|
|
$ |
0 |
|
|
$ |
0 |
|
|
$ |
107 |
|
|
| |
|
|
|
|
|
|
|
|
|
|
|
|
|
|
|
|
|
|
|
|
|
|
|
|
| |
$ |
0 |
|
|
$ |
107 |
|
|
$ |
0 |
|
|
$ |
0 |
|
|
$ |
659 |
|
|
$ |
766 |
|
|
| |
|
|
|
|
|
|
|
|
|
|
|
|
|
|
|
|
|
|
|
|
|
|
|
FAIR VALUE MEASUREMENTS
The following is a summary of the fair valuations according to the inputs used as of June
30, 2025 in valuing the Fund’s assets and
liabilities:
|
|
|
|
|
|
|
|
|
|
|
|
|
|
|
|
| |
| Category and Subcategory |
|
|
|
|
|
|
|
|
|
|
Fair Value at
06/30/2025 |
|
Investments in Securities, at Value |
|
Loan Participations and Assignments |
|
$ |
0 |
|
|
$ |
10,053 |
|
|
$ |
4,753 |
|
|
$ |
14,806 |
|
| |
|
| |
|
|
0 |
|
|
|
3,521 |
|
|
|
0 |
|
|
|
3,521 |
|
| |
|
|
350 |
|
|
|
8,205 |
|
|
|
2,984 |
|
|
|
11,539 |
|
| |
|
|
0 |
|
|
|
350 |
|
|
|
0 |
|
|
|
350 |
|
| |
|
|
0 |
|
|
|
4,372 |
|
|
|
0 |
|
|
|
4,372 |
|
Non-Agency Mortgage-Backed Securities |
|
|
0 |
|
|
|
26,641 |
|
|
|
199 |
|
|
|
26,840 |
|
| |
|
| |
|
|
0 |
|
|
|
25,807 |
|
|
|
0 |
|
|
|
25,807 |
|
Manufacturing House ABS Other |
|
|
0 |
|
|
|
633 |
|
|
|
0 |
|
|
|
633 |
|
Manufacturing House Sequential |
|
|
0 |
|
|
|
152 |
|
|
|
0 |
|
|
|
152 |
|
| |
|
|
0 |
|
|
|
1,484 |
|
|
|
0 |
|
|
|
1,484 |
|
| |
|
|
0 |
|
|
|
2,370 |
|
|
|
1,954 |
|
|
|
4,324 |
|
| |
|
| |
|
|
172 |
|
|
|
0 |
|
|
|
884 |
|
|
|
1,056 |
|
| |
|
|
0 |
|
|
|
0 |
|
|
|
17 |
|
|
|
17 |
|
| |
|
|
0 |
|
|
|
0 |
|
|
|
2 |
|
|
|
2 |
|
| |
|
|
0 |
|
|
|
0 |
|
|
|
3,660 |
|
|
|
3,660 |
|
| |
|
|
1 |
|
|
|
0 |
|
|
|
1,638 |
|
|
|
1,639 |
|
| |
|
| |
|
|
0 |
|
|
|
0 |
|
|
|
169 |
|
|
|
169 |
|
| |
|
| |
|
|
0 |
|
|
|
309 |
|
|
|
453 |
|
|
|
762 |
|
Real Estate Investment Trusts |
|
| |
|
|
591 |
|
|
|
0 |
|
|
|
0 |
|
|
|
591 |
|
| |
|
| |
|
|
0 |
|
|
|
127 |
|
|
|
0 |
|
|
|
127 |
|
|
|
|
|
|
|
|
|
|
|
|
|
|
|
|
|
| |
| Category and Subcategory |
|
Level 1 |
|
|
Level 2 |
|
|
Level 3 |
|
|
Fair Value at
06/30/2025 |
|
| |
|
$ |
0 |
|
|
$ |
285 |
|
|
$ |
0 |
|
|
$ |
285 |
|
|
| |
|
|
|
|
|
|
|
|
|
|
|
|
|
|
|
|
| |
$ |
1,114 |
|
|
$ |
84,309 |
|
|
$ |
16,713 |
|
|
$ |
102,136 |
|
|
| |
|
|
|
|
|
|
|
|
|
|
|
|
|
|
|
|
Investments in Affiliates, at Value |
|
| |
|
Central Funds Used for Cash Management Purposes |
|
$ |
7,137 |
|
|
$ |
0 |
|
|
$ |
0 |
|
|
$ |
7,137 |
|
|
| |
|
|
|
|
|
|
|
|
|
|
|
|
|
|
|
|
|
|
|
| |
| |
|
$ |
8,251 |
|
|
$ |
84,309 |
|
|
$ |
16,713 |
|
|
$ |
109,273 |
|
|
| |
|
|
|
|
|
|
|
|
|
|
|
|
|
|
|
|
Financial Derivative Instruments - Assets |
|
Exchange-traded or centrally cleared |
|
$ |
0 |
|
|
$ |
47 |
|
|
$ |
0 |
|
|
$ |
47 |
|
|
| |
|
|
|
|
|
|
|
|
|
|
|
|
|
|
|
|
Financial Derivative Instruments - Liabilities |
|
Exchange-traded or centrally cleared |
|
|
0 |
|
|
|
(92 |
) |
|
|
0 |
|
|
|
(92 |
) |
| |
|
|
0 |
|
|
|
0 |
|
|
|
(112 |
) |
|
|
(112 |
) |
|
| |
|
|
|
|
|
|
|
|
|
|
|
|
|
|
|
|
| |
$ |
0 |
|
|
$ |
(92 |
) |
|
$ |
(112 |
) |
|
$ |
(204 |
) |
|
| |
|
|
|
|
|
|
|
|
|
|
|
|
|
|
|
|
|
|
|
| |
Total Financial Derivative Instruments |
|
$ |
0 |
|
|
$ |
(45 |
) |
|
$ |
(112 |
) |
|
$ |
(157 |
) |
|
| |
|
|
|
|
|
|
|
|
|
|
|
|
|
|
|
|
|
|
|
| |
| |
|
$ |
8,251 |
|
|
$ |
84,264 |
|
|
$ |
16,601 |
|
|
$ |
109,116 |
|
|
| |
|
|
|
|
|
|
|
|
|
|
|
|
|
|
|
The following is a reconciliation of the fair valuations using significant unobservable inputs (Level 3) for the Fund during the period ended June 30, 2025:
|
|
|
|
|
|
|
|
|
|
|
|
|
|
|
|
|
|
|
|
|
|
|
|
|
|
|
|
|
|
|
|
|
|
|
|
|
|
|
|
| |
|
|
Beginning
Balance
at 06/30/2024 |
|
|
|
|
|
|
|
|
Accrued
Discounts/
(Premiums) |
|
|
|
|
|
Net Change in Unrealized Appreciation/ (Depreciation) (2) |
|
|
|
|
|
|
|
|
Ending
Balance
at 06/30/2025 |
|
|
Net Change in Unrealized Appreciation/ (Depreciation) on Investments Held at 06/30/2025 (2) |
|
Investments in Securities, at Value |
|
Loan Participations and Assignments |
|
$ |
4,920 |
|
|
$ |
1,076 |
|
|
$ |
(1,329 |
) |
|
$ |
8 |
|
|
$ |
71 |
|
|
$ |
(102 |
) |
|
$ |
109 |
|
|
$ |
0 |
|
|
$ |
4,753 |
|
|
$ |
(32 |
) |
| |
|
| |
|
|
134 |
|
|
|
0 |
|
|
|
(185 |
) |
|
|
0 |
|
|
|
10 |
|
|
|
41 |
|
|
|
0 |
|
|
|
0 |
|
|
|
0 |
|
|
|
0 |
|
| |
|
|
3,804 |
|
|
|
2,417 |
|
|
|
(3,303 |
) |
|
|
(7 |
) |
|
|
(1,037 |
) |
|
|
934 |
|
|
|
176 |
|
|
|
0 |
|
|
|
2,984 |
|
|
|
391 |
|
Non-Agency Mortgage-Backed Securities |
|
|
1,159 |
|
|
|
18 |
|
|
|
(212 |
) |
|
|
15 |
|
|
|
19 |
|
|
|
256 |
|
|
|
0 |
|
|
|
(1,056 |
) |
|
|
199 |
|
|
|
197 |
|
| |
|
|
|
| |
|
|
| |
|
|
| |
|
|
| |
|
|
| |
|
|
| |
|
|
| |
|
|
| |
|
|
| |
|
| |
| |
|
|
672 |
|
|
|
0 |
|
|
|
0 |
|
|
|
0 |
|
|
|
0 |
|
|
|
(672 |
) |
|
|
0 |
|
|
|
0 |
|
|
|
0 |
|
|
|
0 |
|
| |
|
|
541 |
|
|
|
0 |
|
|
|
(217 |
) |
|
|
4 |
|
|
|
24 |
|
|
|
(3 |
) |
|
|
0 |
|
|
|
(349 |
) |
|
|
0 |
|
|
|
0 |
|
| |
|
|
104 |
|
|
|
0 |
|
|
|
(112 |
) |
|
|
2 |
|
|
|
(250 |
) |
|
|
270 |
|
|
|
0 |
|
|
|
(14 |
) |
|
|
0 |
|
|
|
0 |
|
| |
|
|
545 |
|
|
|
1,710 |
|
|
|
0 |
|
|
|
(5 |
) |
|
|
0 |
|
|
|
(296 |
) |
|
|
0 |
|
|
|
0 |
|
|
|
1954 |
|
|
|
(296 |
) |
| |
|
Communication Services (4) |
|
|
748 |
|
|
|
0 |
|
|
|
0 |
|
|
|
0 |
|
|
|
0 |
|
|
|
136 |
|
|
|
0 |
|
|
|
0 |
|
|
|
884 |
|
|
|
136 |
|
Consumer Discretionary (5) |
|
|
1,800 |
|
|
|
0 |
|
|
|
(1,825 |
) |
|
|
0 |
|
|
|
1,400 |
|
|
|
(1,358 |
) |
|
|
0 |
|
|
|
0 |
|
|
|
17 |
|
|
|
0 |
|
| |
|
|
173 |
|
|
|
0 |
|
|
|
(187 |
) |
|
|
0 |
|
|
|
138 |
|
|
|
(124 |
) |
|
|
0 |
|
|
|
0 |
|
|
|
0 |
|
|
|
0 |
|
| |
|
|
0 |
|
|
|
6 |
|
|
|
0 |
|
|
|
0 |
|
|
|
0 |
|
|
|
(4 |
) |
|
|
0 |
|
|
|
0 |
|
|
|
2 |
|
|
|
(4 |
) |
| |
|
|
4,013 |
|
|
|
0 |
|
|
|
0 |
|
|
|
0 |
|
|
|
0 |
|
|
|
(353 |
) |
|
|
0 |
|
|
|
0 |
|
|
|
3,660 |
|
|
|
(353 |
) |
| |
|
|
60 |
|
|
|
2,313 |
|
|
|
0 |
|
|
|
0 |
|
|
|
0 |
|
|
|
(735 |
) |
|
|
0 |
|
|
|
0 |
|
|
|
1,638 |
|
|
|
(735 |
) |
| |
|
|
|
| |
|
|
| |
|
|
| |
|
|
| |
|
|
| |
|
|
| |
|
|
| |
|
|
| |
|
|
| |
|
| |
| |
|
|
0 |
|
|
|
112 |
|
|
|
0 |
|
|
|
0 |
|
|
|
0 |
|
|
|
57 |
|
|
|
0 |
|
|
|
0 |
|
|
|
169 |
|
|
|
57 |
|
| |
|
| |
|
|
380 |
|
|
|
75 |
|
|
|
0 |
|
|
|
0 |
|
|
|
0 |
|
|
|
(2 |
) |
|
|
0 |
|
|
|
0 |
|
|
|
453 |
|
|
|
(2 |
) |
|
| |
|
|
|
|
|
|
|
|
|
|
|
|
|
|
|
|
|
|
|
|
|
|
|
|
|
|
|
|
|
|
|
|
|
|
|
|
|
|
|
|
| |
$ |
19,053 |
|
|
$ |
7,727 |
|
|
$ |
(7,370 |
) |
|
$ |
17 |
|
|
$ |
375 |
|
|
$ |
(1,955 |
) |
|
$ |
285 |
|
|
$ |
(1,419 |
) |
|
$ |
16,713 |
|
|
$ |
(641 |
) |
|
| |
|
|
|
|
|
|
|
|
|
|
|
|
|
|
|
|
|
|
|
|
|
|
|
|
|
|
|
|
|
|
|
|
|
|
|
|
|
|
|
|
Financial Derivative Instruments - Liabilities |
|
| |
|
$ |
(144 |
) |
|
$ |
18 |
|
|
$ |
(8 |
) |
|
$ |
0 |
|
|
$ |
(84 |
) |
|
$ |
106 |
|
|
$ |
0 |
|
|
$ |
0 |
|
|
$ |
(112 |
) |
|
$ |
20 |
|
|
| |
|
|
|
|
|
|
|
|
|
|
|
|
|
|
|
|
|
|
|
|
|
|
|
|
|
|
|
|
|
|
|
|
|
|
|
|
|
|
|
|
|
|
|
|
|
|
|
|
|
| |
| |
|
$ |
18,909 |
|
|
$ |
7,745 |
|
|
$ |
(7,378 |
) |
|
$ |
17 |
|
|
$ |
291 |
|
|
$ |
(1,849 |
) |
|
$ |
285 |
|
|
$ |
(1,419 |
) |
|
$ |
16,601 |
|
|
$ |
(621 |
) |
|
| |
|
|
|
|
|
|
|
|
|
|
|
|
|
|
|
|
|
|
|
|
|
|
|
|
|
|
|
|
|
|
|
|
|
|
|
|
|
|
|
|
|
|
|
|
|
|
|
|
|
|
|
| |
See Accompanying Notes |
|
|
|
|
|
| |
|
|
JUNE 30, 2025 |
|
|
|
The following is a summary of significant unobservable inputs used in the fair valuations of assets and liabilities categorized within Level 3 of the fair value hierarchy:
|
|
|
|
|
|
|
|
|
|
|
|
|
|
|
|
|
|
| |
| Category and Subcategory |
|
Ending
Balance
at 06/30/2025 |
|
|
Valuation Technique |
|
Unobservable Inputs |
|
|
|
(% Unless Noted Otherwise) |
|
| |
|
|
|
Weighted Average |
|
Investments in Securities, at Value |
|
Loan Participations and Assignments |
|
$ |
1,917 |
|
|
|
|
|
|
X |
|
|
16.470 |
|
|
|
— |
|
|
| |
|
2,075 |
|
|
|
|
|
|
| |
|
|
|
|
|
11.363 |
|
|
| |
|
146 |
|
|
Indicative Market Quotation |
|
|
|
| |
|
77.000 |
|
|
|
— |
|
|
| |
|
615 |
|
|
|
|
|
|
| |
|
|
|
|
|
90.045 |
|
| |
|
|
|
| |
| |
| |
| |
|
|
| |
|
| |
| |
|
|
2,808 |
|
|
Comparable Companies / Discounted Cash Flow |
|
Revenue Multiple/Discount Rate |
|
X/% |
|
|
0.900/10.500 |
|
|
|
— |
|
|
| |
|
176 |
|
|
Indicative Market Quotation |
|
|
|
| |
|
58.500 |
|
|
|
— |
|
Non-Agency Mortgage-Backed Securities |
|
|
199 |
|
|
|
|
|
|
| |
|
10.000 |
|
|
|
— |
|
| |
|
|
|
| |
| |
| |
| |
|
|
| |
|
| |
| |
|
|
1,454 |
|
|
|
|
|
|
| |
|
|
|
|
|
10.328 |
|
|
| |
|
500 |
|
|
|
|
|
|
| |
|
100.000 |
|
|
|
— |
|
| |
|
|
|
| |
| |
| |
| |
|
|
| |
|
| |
| |
|
|
853 |
|
|
|
|
|
|
X |
|
|
4.864 |
|
|
|
— |
|
|
| |
|
31 |
|
|
|
|
Stock Price w/Liquidity Discount |
|
| |
|
12.000 |
|
|
|
— |
|
| |
|
|
17 |
|
|
Comparable Companies / Discounted Cash Flow |
|
Revenue Multiple/Discount Rate |
|
X/% |
|
|
0.500/20.750 |
|
|
|
— |
|
| |
|
|
2 |
|
|
Indicative Market Quotation |
|
|
|
$ |
|
|
4.000 |
|
|
|
— |
|
| |
|
|
3,660 |
|
|
|
|
|
|
X |
|
|
16.470 |
|
|
|
— |
|
| |
|
|
1,593 |
|
|
Comparable Companies / Discounted Cash Flow |
|
Revenue Multiple/Discount Rate |
|
X/% |
|
|
0.900/10.500 |
|
|
|
— |
|
|
| |
|
45 |
|
|
Indicative Market Quotation |
|
|
|
| |
|
|
|
|
|
2.125 |
|
| |
|
|
|
| |
| |
| |
| |
|
|
| |
|
| |
| |
|
|
169 |
|
|
|
|
|
|
X |
|
|
4.864 |
|
|
|
— |
|
| |
|
|
|
| |
| |
| |
| |
|
|
| |
|
| |
| |
|
|
29 |
|
|
|
|
|
|
X |
|
|
|
| |
|
— |
|
|
| |
|
424 |
|
|
|
|
|
|
| |
|
15.314 |
|
|
|
— |
|
|
Financial Derivative Instruments - Liabilities |
|
| |
|
|
(112 |
) |
|
Indicative Market Quotation |
|
|
|
| |
|
92.500-98.500 |
|
|
|
92.853 |
|
|
| |
|
|
|
|
| |
| |
| |
|
|
| |
|
| |
| |
|
$ |
16,601 |
|
|
| |
| |
| |
|
|
| |
|
| |
|
| |
|
|
|
|
| |
| |
| |
|
|
| |
|
| |
|
Net Purchases and Settlements for Financial Derivative Instruments may include payments made or received upon entering into swap agreements to compensate for differences between the stated terms of the swap agreement and prevailing market conditions. |
|
Any difference between Net Change in Unrealized Appreciation/(Depreciation) and Net Change in Unrealized Appreciation/(Depreciation) on Investments Held at June 30, 2025 may be due to an investment no longer held or categorized as Level 3 at period end. |
|
Sector type updated from Non-Agency Mortgage-Backed Securities and Automobile ABS Other to Whole Loan Collateral since prior fiscal year end. |
|
Sector type updated from Industrials and Utilities to Communication Services since prior fiscal year end. |
|
Sector type updated from Industrials to Consumer Discretionary since prior fiscal year end. |
|
Security type updated from Common Stock to Preferred Securities Industrials since prior fiscal year end. |
|
|
|
|
|
|
| |
40 |
|
PIMCO CLOSED-END FUNDS |
|
|
See Accompanying Notes |
|
|
|
|
|
|
|
| |
|
|
PIMCO Global StocksPLUS & Income Fund |
|
|
|
June 30, 2025 |
(Amounts in thousands*, except number of shares, contracts, units and ounces, if any)
|
|
|
|
|
|
|
|
|
|
|
|
| |
| |
|
|
|
PRINCIPAL
AMOUNT
(000S) |
|
|
|
|
MARKET
VALUE
(000S) |
|
INVESTMENTS IN SECURITIES 151.4% |
|
|
| |
LOAN PARTICIPATIONS AND ASSIGNMENTS 26.9% |
|
|
Aligned Data Centers International LP |
|
| |
|
$ |
|
|
500 |
|
|
$ |
|
|
501 |
|
|
| |
|
9.756% (TSFR3M + 5.500%) due 08/15/2028 ~ |
|
| |
|
396 |
|
|
| |
|
360 |
|
|
| |
|
10.561% (TSFR1M + 6.250%) due 10/08/2030 ~ |
|
| |
|
900 |
|
|
| |
|
870 |
|
|
| |
|
7.546% (TSFR3M + 3.250%) due 07/06/2029 ~ |
|
| |
|
497 |
|
|
| |
|
417 |
|
|
| |
|
| |
|
| |
|
106 |
|
|
| |
|
106 |
|
8.307% (TSFR3M + 4.000%) due 12/09/2031 ~ |
|
| |
|
800 |
|
|
| |
|
802 |
|
|
CoreWeave Compute Acquisition Co. LLC |
|
TBD% (TSFR3M + 6.000%) due 05/16/2029 «~µ |
|
| |
|
1,300 |
|
|
| |
|
1,330 |
|
|
| |
|
| |
|
| |
|
36 |
|
|
| |
|
37 |
|
8.816% (TSFR1M + 4.500%) due 01/03/2031 «~ |
|
| |
|
164 |
|
|
| |
|
165 |
|
|
| |
|
| |
|
| |
|
188 |
|
|
| |
|
186 |
|
| |
|
| |
|
19 |
|
|
| |
|
19 |
|
|
| |
|
7.927% (TSFR1M + 3.500%) due 02/10/2028 «~ |
|
| |
|
199 |
|
|
| |
|
153 |
|
|
Envision Healthcare Corp. |
|
11.110% (TSFR3M + 6.750%) due 07/20/2026 « |
|
| |
|
226 |
|
|
| |
|
226 |
|
12.235% (TSFR3M + 7.875%) due 11/03/2028 « |
|
| |
|
1,995 |
|
|
| |
|
2,055 |
|
|
| |
|
8.780% (TSFR3M + 4.500%) due 12/19/2030 ~ |
|
| |
|
400 |
|
|
| |
|
398 |
|
|
Gateway Casinos & Entertainment Ltd. |
|
10.563% (TSFR3M + 6.250%) due 12/18/2030 |
|
| |
|
825 |
|
|
| |
|
825 |
|
|
| |
|
TBD% - 10.079% (TSFR3M + 5.750%) due 06/01/2029 ~µ |
|
| |
|
99 |
|
|
| |
|
103 |
|
9.016% (TSFR3M + 4.750%) due 06/01/2029 ~ |
|
| |
|
746 |
|
|
| |
|
622 |
|
|
| |
|
7.441% (TSFR1M + 3.000%) due 06/30/2027 ~ |
|
| |
|
7 |
|
|
| |
|
5 |
|
|
Lealand Finance Co. BV (5.441% Cash and 3.000% PIK) |
|
8.441% (TSFR1M + 1.000%) due 12/31/2027 ~(c) |
|
| |
|
74 |
|
|
| |
|
39 |
|
|
Mercury Aggregator LP (13.500% PIK) |
|
| |
|
| |
|
9 |
|
|
| |
|
6 |
|
|
Mercury Aggregator LP (3.500% PIK) |
|
| |
|
| |
|
5 |
|
|
| |
|
3 |
|
|
MPH Acquisition Holdings LLC |
|
8.030% (TSFR3M + 3.750%) due 12/31/2030 ~ |
|
| |
|
754 |
|
|
| |
|
745 |
|
9.141% (TSFR3M + 4.600%) due 12/31/2030 ~ |
|
| |
|
176 |
|
|
| |
|
158 |
|
|
| |
|
| |
|
GBP |
|
|
1,000 |
|
|
| |
|
1,370 |
|
|
| |
|
8.177% (TSFR1M + 3.750%) due 02/01/2028 ~ |
|
$ |
|
|
748 |
|
|
| |
|
662 |
|
|
| |
|
6.980% (EUR003M + 5.000%) due 03/13/2030 ~ |
|
EUR |
|
|
400 |
|
|
| |
|
323 |
|
|
Promotora de Informaciones SA |
|
7.344% (EUR003M + 5.220%) due 06/29/2029 ~ |
|
| |
|
3,393 |
|
|
| |
|
4,017 |
|
|
| |
|
| |
|
$ |
|
|
600 |
|
|
| |
|
601 |
|
|
|
|
|
|
|
|
|
|
|
|
|
| |
| |
|
|
|
PRINCIPAL
AMOUNT
(000S) |
|
|
|
|
MARKET
VALUE
(000S) |
|
|
| |
|
| |
|
$ |
|
|
400 |
|
|
$ |
|
|
400 |
|
| |
|
| |
|
565 |
|
|
| |
|
565 |
|
|
| |
|
TBD% - 0.500% due 01/30/2032 «µ |
|
| |
|
31 |
|
|
| |
|
30 |
|
6.000% (JY0003M + 5.250%) due 01/30/2032 «~ |
|
JPY |
|
|
2,624 |
|
|
| |
|
18 |
|
7.679% (CDOR03 + 5.000%) due 01/30/2032 «~ |
|
CAD |
|
|
25 |
|
|
| |
|
18 |
|
9.131% (TSFR6M + 5.000%) due 01/30/2032 «~ |
|
$ |
|
|
136 |
|
|
| |
|
133 |
|
|
Steenbok Lux Finco 2 SARL |
|
| |
|
EUR |
|
|
2,679 |
|
|
| |
|
1,077 |
|
|
Stepstone Group MidCo 2 GmbH |
|
8.608% - 8.651% (TSFR3M + 4.500%) due 12/19/2031 |
|
$ |
|
|
200 |
|
|
| |
|
195 |
|
|
| |
|
11.296% (TSFR3M + 7.000%) due 05/13/2027 ~ |
|
| |
|
2,040 |
|
|
| |
|
1,942 |
|
|
| |
|
| |
|
| |
|
100 |
|
|
| |
|
97 |
|
10.927% (TSFR1M + 6.500%) due 10/26/2029 ~ |
|
| |
|
1,195 |
|
|
| |
|
1,169 |
|
|
| |
|
9.441% (TSFR1M + 5.000%) due 06/20/2028 ~ |
|
| |
|
1,568 |
|
|
| |
|
1,488 |
|
|
| |
|
| |
|
HKD |
|
|
6,593 |
|
|
| |
|
850 |
|
|
| |
|
| |
|
$ |
|
|
397 |
|
|
| |
|
157 |
|
|
| |
| |
|
|
| |
| |
|
|
|
Total Loan Participations and Assignments (Cost $26,389) |
|
|
|
|
|
| |
|
|
|
|
| |
CORPORATE BONDS & NOTES 37.5% |
|
|
| |
|
|
|
| |
|
| |
|
EUR |
|
|
1,433 |
|
|
| |
|
1,717 |
|
|
| |
|
5.100% due 12/31/2099 (h) |
|
$ |
|
|
13 |
|
|
| |
|
17 |
|
|
| |
|
8.500% due 11/15/2029 (k) |
|
| |
|
200 |
|
|
| |
|
192 |
|
|
| |
|
7.500% due 05/30/2029 (k) |
|
| |
|
600 |
|
|
| |
|
633 |
|
|
Corestate Capital Holding SA (8.000% Cash or 9.000% PIK) |
|
8.000% due 12/31/2026 (c) |
|
EUR |
|
|
150 |
|
|
| |
|
72 |
|
Credit Suisse AG AT1 Claim |
|
$ |
|
|
200 |
|
|
| |
|
24 |
|
|
Ford Motor Credit Co. LLC |
|
| |
|
| |
|
300 |
|
|
| |
|
303 |
|
6.436% due 03/20/2028 ~(k) |
|
| |
|
900 |
|
|
| |
|
887 |
|
|
HA Sustainable Infrastructure Capital, Inc. |
|
| |
|
| |
|
1,000 |
|
|
| |
|
1,013 |
|
6.375% due 07/01/2034 (k) |
|
| |
|
400 |
|
|
| |
|
400 |
|
|
| |
|
| |
|
| |
|
7 |
|
|
| |
|
3 |
|
|
| |
|
| |
|
| |
|
100 |
|
|
| |
|
99 |
|
|
| |
|
7.200% due 11/28/2033 (k) |
|
| |
|
500 |
|
|
| |
|
562 |
|
|
Kennedy Wilson Europe Real Estate Ltd. |
|
| |
|
EUR |
|
|
63 |
|
|
| |
|
74 |
|
|
| |
|
| |
|
$ |
|
|
250 |
|
|
| |
|
144 |
|
|
Stellantis Finance U.S., Inc. |
|
6.450% due 03/18/2035 (k) |
|
| |
|
450 |
|
|
| |
|
452 |
|
|
| |
|
| |
|
GBP |
|
|
5 |
|
|
| |
|
7 |
|
|
| |
|
| |
|
EUR |
|
|
967 |
|
|
| |
|
336 |
|
|
| |
|
6.000% due 01/15/2030 (k) |
|
$ |
|
|
1,127 |
|
|
| |
|
1,057 |
|
| |
|
| |
|
100 |
|
|
| |
|
101 |
|
10.500% due 02/15/2028 (k) |
|
| |
|
361 |
|
|
| |
|
383 |
|
|
|
|
|
|
|
|
|
|
|
|
|
| |
| |
|
|
|
PRINCIPAL
AMOUNT
(000S) |
|
|
|
|
MARKET
VALUE
(000S) |
|
|
Voyager Aviation Holdings LLC |
|
8.500% due 05/09/2026 ^«(d) |
|
$ |
|
|
1,216 |
|
|
$ |
|
|
0 |
|
|
| |
| |
|
|
| |
| |
|
|
|
|
| |
| |
|
|
| |
| |
|
8,476 |
|
|
| |
| |
|
|
| |
| |
|
|
|
|
| |
|
|
|
| |
|
| |
|
EUR |
|
|
200 |
|
|
| |
|
85 |
|
| |
|
$ |
|
|
1,500 |
|
|
| |
|
522 |
|
|
| |
|
| |
|
EUR |
|
|
100 |
|
|
| |
|
99 |
|
| |
|
$ |
|
|
200 |
|
|
| |
|
165 |
|
| |
|
| |
|
1,125 |
|
|
| |
|
931 |
|
| |
|
| |
|
200 |
|
|
| |
|
168 |
|
| |
|
| |
|
600 |
|
|
| |
|
540 |
|
|
Aston Martin Capital Holdings Ltd. |
|
| |
|
| |
|
200 |
|
|
| |
|
190 |
|
|
| |
|
| |
|
EUR |
|
|
600 |
|
|
| |
|
713 |
|
|
| |
|
| |
|
$ |
|
|
500 |
|
|
| |
|
517 |
|
|
Cheplapharm Arzneimittel GmbH |
|
7.125% due 06/15/2031 (b) |
|
EUR |
|
|
400 |
|
|
| |
|
475 |
|
|
| |
|
5.250% due 01/10/2031 (b) |
|
| |
|
500 |
|
|
| |
|
601 |
|
6.500% due 01/10/2031 (b) |
|
$ |
|
|
500 |
|
|
| |
|
505 |
|
|
| |
|
| |
|
| |
|
2,000 |
|
|
| |
|
1,819 |
|
| |
|
| |
|
100 |
|
|
| |
|
87 |
|
|
| |
|
| |
|
| |
|
1,750 |
|
|
| |
|
1,721 |
|
| |
|
| |
|
30 |
|
|
| |
|
29 |
|
|
| |
|
| |
|
| |
|
15 |
|
|
| |
|
1 |
|
|
| |
|
6.250% due 01/15/2035 (k) |
|
| |
|
450 |
|
|
| |
|
457 |
|
|
| |
|
| |
|
| |
|
1,489 |
|
|
| |
|
1,489 |
|
|
| |
|
6.000% due 01/30/2033 «(j) |
|
| |
|
1,072 |
|
|
| |
|
1,487 |
|
|
Intelsat Jackson Holdings SA |
|
6.500% due 03/15/2030 (k) |
|
| |
|
1,025 |
|
|
| |
|
1,048 |
|
|
| |
|
6.941% due 07/07/2032 •(b) |
|
EUR |
|
|
600 |
|
|
| |
|
693 |
|
|
MPH Acquisition Holdings LLC (6.500% Cash and 5.000% PIK) |
|
11.500% due 12/31/2030 (c) |
|
$ |
|
|
100 |
|
|
| |
|
99 |
|
|
Newfold Digital Holdings Group, Inc. |
|
| |
|
| |
|
300 |
|
|
| |
|
175 |
|
|
| |
|
4.810% due 09/17/2030 (k) |
|
| |
|
1,000 |
|
|
| |
|
918 |
|
|
| |
|
8.000% due 04/15/2030 (k) |
|
| |
|
400 |
|
|
| |
|
408 |
|
|
| |
|
6.700% due 02/16/2032 (k) |
|
| |
|
100 |
|
|
| |
|
93 |
|
| |
|
| |
|
200 |
|
|
| |
|
193 |
|
| |
|
| |
|
306 |
|
|
| |
|
317 |
|
|
Prime Healthcare Services, Inc. |
|
9.375% due 09/01/2029 (k) |
|
| |
|
400 |
|
|
| |
|
397 |
|
|
Thames Water Super Senior Issuer PLC |
|
| |
|
GBP |
|
|
5 |
|
|
| |
|
8 |
|
|
Thames Water Utilities Finance PLC |
|
| |
|
| |
|
100 |
|
|
| |
|
91 |
|
|
Thames Water Utilities Ltd. |
|
0.000% due 03/22/2027 (g) |
|
| |
|
1 |
|
|
| |
|
1 |
|
|
| |
|
| |
|
$ |
|
|
130 |
|
|
| |
|
115 |
|
|
| |
|
10.625% due 06/28/2028 (k) |
|
| |
|
756 |
|
|
| |
|
648 |
|
|
| |
|
0.000% due 12/29/2049 ~(h) |
|
BRL |
|
|
20,000 |
|
|
| |
|
1,262 |
|
|
| |
|
7.000% due 01/15/2030 (k) |
|
$ |
|
|
500 |
|
|
| |
|
506 |
|
| |
|
| |
|
296 |
|
|
| |
|
323 |
|
9.875% due 02/01/2032 (k) |
|
| |
|
500 |
|
|
| |
|
540 |
|
|
|
|
|
|
|
|
|
|
|
|
|
| |
| See Accompanying Notes |
|
|
ANNUAL REPORT |
|
|
| |
|
|
JUNE 30, 2025 |
|
|
41 |
|
|
|
|
|
|
| |
|
|
PIMCO Global StocksPLUS & Income Fund |
|
|
|
|
|
|
|
|
|
|
|
|
|
|
|
|
| |
| |
|
|
|
PRINCIPAL
AMOUNT
(000S) |
|
|
|
|
MARKET
VALUE
(000S) |
|
|
Venture Global Plaquemines LNG LLC |
|
6.500% due 01/15/2034 (b) |
|
$ |
|
|
300 |
|
|
$ |
|
|
300 |
|
6.750% due 01/15/2036 (b) |
|
| |
|
300 |
|
|
| |
|
300 |
|
|
| |
|
| |
|
EUR |
|
|
300 |
|
|
| |
|
351 |
|
| |
|
$ |
|
|
200 |
|
|
| |
|
197 |
|
|
| |
|
7.750% due 09/15/2030 (k) |
|
| |
|
450 |
|
|
| |
|
454 |
|
|
Yinson Boronia Production BV |
|
8.947% due 07/31/2042 (k) |
|
| |
|
396 |
|
|
| |
|
422 |
|
|
| |
| |
|
|
| |
| |
|
|
|
|
| |
| |
|
|
| |
| |
|
22,460 |
|
|
| |
| |
|
|
| |
| |
|
|
|
|
| |
|
|
|
Chile Electricity Lux MPC SARL |
|
5.580% due 10/20/2035 (k) |
|
| |
|
440 |
|
|
| |
|
441 |
|
|
| |
|
5.250% due 11/15/2028 (k) |
|
| |
|
1,000 |
|
|
| |
|
990 |
|
|
| |
|
| |
|
| |
|
239 |
|
|
| |
|
227 |
|
|
Oi SA (10.000% Cash or 6.000% PIK and 7.500% Cash or 13.500% PIK) |
|
10.000% due 06/30/2027 (c) |
|
| |
|
436 |
|
|
| |
|
284 |
|
|
Oi SA (10.000% Cash or 6.000% PIK and 7.500% Cash or 13.500% PIK) |
|
10.000% due 06/30/2027 (c) |
|
| |
|
1,135 |
|
|
| |
|
739 |
|
|
| |
|
8.500% due 12/31/2028 (c) |
|
| |
|
2,429 |
|
|
| |
|
164 |
|
|
Pacific Gas & Electric Co. |
|
4.300% due 03/15/2045 (k) |
|
| |
|
827 |
|
|
| |
|
625 |
|
|
| |
|
5.375% due 03/22/2030 (k) |
|
| |
|
833 |
|
|
| |
|
784 |
|
|
| |
| |
|
|
| |
| |
|
|
|
|
| |
| |
|
|
| |
| |
|
4,254 |
|
|
| |
| |
|
|
| |
| |
|
|
|
Total Corporate Bonds & Notes
(Cost $38,224) |
|
|
|
|
|
| |
|
|
|
|
| |
CONVERTIBLE BONDS & NOTES 0.5% |
|
|
| |
|
|
|
Corestate Capital Holding SA (8.000% Cash or 9.000% PIK) |
|
8.000% due 12/31/2026 (c) |
|
EUR |
|
|
25 |
|
|
| |
|
12 |
|
|
| |
| |
|
|
| |
| |
|
|
|
|
| |
|
|
|
| |
|
| |
|
$ |
|
|
600 |
|
|
| |
|
503 |
|
|
| |
| |
|
|
| |
| |
|
|
|
Total Convertible Bonds & Notes (Cost $628) |
|
|
|
|
|
| |
|
|
|
|
| |
MUNICIPAL BONDS & NOTES 2.0% |
|
|
| |
|
|
|
Maricopa County, Arizona Industrial Development Authority Revenue Notes, Series 2024 |
|
| |
|
| |
|
450 |
|
|
| |
|
466 |
|
|
| |
| |
|
|
| |
| |
|
|
|
|
| |
|
|
|
New York City, New York General Obligation Bonds, Series 2025 |
|
| |
|
| |
|
130 |
|
|
| |
|
137 |
|
| |
|
| |
|
420 |
|
|
| |
|
437 |
|
|
| |
| |
|
|
| |
| |
|
|
|
|
| |
| |
|
|
| |
| |
|
574 |
|
|
| |
| |
|
|
| |
| |
|
|
|
|
| |
|
|
|
Tobacco Settlement Finance Authority, West Virginia Revenue Bonds, Series 2007 |
|
0.000% due 06/01/2047 (g) |
|
| |
|
8,800 |
|
|
| |
|
805 |
|
|
| |
| |
|
|
| |
| |
|
|
|
Total Municipal Bonds & Notes (Cost $2,166) |
|
|
|
|
|
| |
|
|
|
|
| |
U.S. GOVERNMENT AGENCIES 46.1% |
|
|
| |
|
| |
|
| |
|
224 |
|
|
| |
|
145 |
|
|
|
|
|
|
|
|
|
|
|
|
|
| |
| |
|
|
|
PRINCIPAL
AMOUNT
(000S) |
|
|
|
|
MARKET
VALUE
(000S) |
|
1.580% due 11/25/2049 •(a) |
|
$ |
|
|
92 |
|
|
$ |
|
|
12 |
|
1.630% due 03/25/2037 •(a) |
|
| |
|
84 |
|
|
| |
|
8 |
|
1.730% due 11/25/2039 •(a) |
|
| |
|
82 |
|
|
| |
|
8 |
|
1.880% due 01/25/2038 •(a) |
|
| |
|
124 |
|
|
| |
|
11 |
|
1.960% due 03/25/2037 •(a) |
|
| |
|
97 |
|
|
| |
|
9 |
|
1.980% due 12/25/2037 •(a) |
|
| |
|
122 |
|
|
| |
|
10 |
|
1.990% due 06/25/2037 •(a) |
|
| |
|
49 |
|
|
| |
|
4 |
|
2.030% due 04/25/2037 •(a) |
|
| |
|
247 |
|
|
| |
|
28 |
|
2.180% due 11/25/2035 •(a) |
|
| |
|
7 |
|
|
| |
|
0 |
|
2.380% due 11/25/2036 •(a) |
|
| |
|
450 |
|
|
| |
|
54 |
|
2.780% due 02/25/2037 •(a) |
|
| |
|
85 |
|
|
| |
|
10 |
|
3.000% due 04/25/2050 (a) |
|
| |
|
9,992 |
|
|
| |
|
1,560 |
|
| |
|
| |
|
21 |
|
|
| |
|
21 |
|
|
| |
|
0.700% due 11/25/2055 ~(a) |
|
| |
|
5,267 |
|
|
| |
|
319 |
|
1.730% due 05/25/2050 •(a) |
|
| |
|
868 |
|
|
| |
|
115 |
|
2.022% due 03/15/2037 •(a) |
|
| |
|
214 |
|
|
| |
|
21 |
|
2.152% due 09/15/2036 •(a) |
|
| |
|
113 |
|
|
| |
|
12 |
|
2.162% due 09/15/2036 •(a) |
|
| |
|
255 |
|
|
| |
|
26 |
|
11.805% due 10/25/2041 •(k) |
|
| |
|
1,200 |
|
|
| |
|
1,276 |
|
|
| |
|
1.668% due 12/20/2048 •(a) |
|
| |
|
693 |
|
|
| |
|
71 |
|
|
| |
|
| |
|
| |
|
3,300 |
|
|
| |
|
3,001 |
|
| |
|
| |
|
2,100 |
|
|
| |
|
2,010 |
|
| |
|
| |
|
100 |
|
|
| |
|
98 |
|
|
Uniform Mortgage-Backed Security |
|
3.500% due 03/01/2048 - 04/01/2048 (k) |
|
| |
|
309 |
|
|
| |
|
284 |
|
|
Uniform Mortgage-Backed Security, TBA |
|
| |
|
| |
|
150 |
|
|
| |
|
124 |
|
| |
|
| |
|
1,250 |
|
|
| |
|
1,082 |
|
3.500% due 07/01/2055 - 08/01/2055 |
|
| |
|
8,100 |
|
|
| |
|
7,292 |
|
| |
|
| |
|
1,650 |
|
|
| |
|
1,534 |
|
| |
|
| |
|
1,200 |
|
|
| |
|
1,147 |
|
| |
|
| |
|
2,400 |
|
|
| |
|
2,351 |
|
| |
|
| |
|
5,500 |
|
|
| |
|
5,495 |
|
| |
|
| |
|
6,700 |
|
|
| |
|
6,802 |
|
| |
|
| |
|
7,700 |
|
|
| |
|
7,940 |
|
| |
|
| |
|
400 |
|
|
| |
|
419 |
|
|
| |
| |
|
|
| |
| |
|
|
|
Total U.S. Government Agencies
(Cost $42,936) |
|
|
|
|
|
| |
|
|
|
|
| |
NON-AGENCY MORTGAGE-BACKED SECURITIES 11.8% |
|
|
Atrium Hotel Portfolio Trust |
|
6.109% due 12/15/2036 •(k) |
|
| |
|
600 |
|
|
| |
|
581 |
|
|
Banc of America Funding Trust |
|
| |
|
| |
|
71 |
|
|
| |
|
67 |
|
| |
|
| |
|
88 |
|
|
| |
|
64 |
|
| |
|
| |
|
78 |
|
|
| |
|
73 |
|
|
Banc of America Mortgage Trust |
|
| |
|
| |
|
1 |
|
|
| |
|
0 |
|
|
Bear Stearns Adjustable Rate Mortgage Trust |
|
| |
|
| |
|
60 |
|
|
| |
|
51 |
|
|
| |
|
| |
|
| |
|
71 |
|
|
| |
|
58 |
|
| |
|
| |
|
54 |
|
|
| |
|
31 |
|
| |
|
| |
|
48 |
|
|
| |
|
37 |
|
|
Bear Stearns Structured Products, Inc. Trust |
|
| |
|
| |
|
118 |
|
|
| |
|
94 |
|
| |
|
| |
|
194 |
|
|
| |
|
138 |
|
|
CBA Commercial Small Balance Commercial Mortgage |
|
| |
|
| |
|
63 |
|
|
| |
|
61 |
|
|
| |
|
| |
|
| |
|
52 |
|
|
| |
|
49 |
|
|
Chevy Chase Funding LLC Mortgage-Backed Certificates |
|
| |
|
| |
|
20 |
|
|
| |
|
20 |
|
| |
|
| |
|
1 |
|
|
| |
|
1 |
|
|
Citigroup Mortgage Loan Trust |
|
5.293% due 11/25/2035 ~(k) |
|
| |
|
952 |
|
|
| |
|
472 |
|
| |
|
| |
|
46 |
|
|
| |
|
47 |
|
|
Connecticut Avenue Securities Trust |
|
| |
|
| |
|
900 |
|
|
| |
|
922 |
|
|
Countrywide Alternative Loan Trust |
|
2.716% due 07/25/2036 •(a) |
|
| |
|
707 |
|
|
| |
|
133 |
|
| |
|
| |
|
67 |
|
|
| |
|
57 |
|
4.784% due 05/25/2036 •(k) |
|
| |
|
1,158 |
|
|
| |
|
316 |
|
|
|
|
|
|
|
|
|
|
|
|
|
| |
| |
|
|
|
PRINCIPAL
AMOUNT
(000S) |
|
|
|
|
MARKET
VALUE
(000S) |
|
| |
|
$ |
|
|
51 |
|
|
$ |
|
|
45 |
|
| |
|
| |
|
28 |
|
|
| |
|
17 |
|
| |
|
| |
|
398 |
|
|
| |
|
264 |
|
| |
|
| |
|
148 |
|
|
| |
|
149 |
|
| |
|
| |
|
11 |
|
|
| |
|
6 |
|
| |
|
| |
|
21 |
|
|
| |
|
22 |
|
6.500% due 08/25/2036 (k) |
|
| |
|
1,976 |
|
|
| |
|
596 |
|
7.607% due 07/25/2035 •(k) |
|
| |
|
329 |
|
|
| |
|
296 |
|
|
Countrywide Home Loan Mortgage Pass-Through Trust |
|
| |
|
| |
|
192 |
|
|
| |
|
163 |
|
| |
|
| |
|
7 |
|
|
| |
|
7 |
|
| |
|
| |
|
48 |
|
|
| |
|
46 |
|
| |
|
| |
|
88 |
|
|
| |
|
82 |
|
| |
|
| |
|
15 |
|
|
| |
|
15 |
|
| |
|
| |
|
40 |
|
|
| |
|
37 |
|
| |
|
| |
|
11 |
|
|
| |
|
6 |
|
|
Credit Suisse Mortgage Capital Mortgage-Backed Trust |
|
| |
|
| |
|
73 |
|
|
| |
|
64 |
|
|
Extended Stay America Trust |
|
| |
|
| |
|
858 |
|
|
| |
|
859 |
|
|
First Horizon Alternative Mortgage Securities Trust |
|
| |
|
| |
|
118 |
|
|
| |
|
82 |
|
|
First Horizon Mortgage Pass-Through Trust |
|
| |
|
| |
|
158 |
|
|
| |
|
79 |
|
|
| |
|
| |
|
| |
|
52 |
|
|
| |
|
45 |
|
|
HarborView Mortgage Loan Trust |
|
| |
|
| |
|
29 |
|
|
| |
|
23 |
|
| |
|
| |
|
2 |
|
|
| |
|
2 |
|
| |
|
| |
|
1 |
|
|
| |
|
1 |
|
| |
|
| |
|
15 |
|
|
| |
|
4 |
|
|
HSI Asset Loan Obligation Trust |
|
| |
|
| |
|
90 |
|
|
| |
|
58 |
|
|
ILPT Commercial Mortgage Trust |
|
| |
|
| |
|
600 |
|
|
| |
|
594 |
|
|
IndyMac INDX Mortgage Loan Trust |
|
| |
|
| |
|
245 |
|
|
| |
|
219 |
|
| |
|
| |
|
389 |
|
|
| |
|
484 |
|
| |
|
| |
|
1 |
|
|
| |
|
1 |
|
|
| |
|
| |
|
| |
|
137 |
|
|
| |
|
71 |
|
| |
|
| |
|
25 |
|
|
| |
|
10 |
|
|
MASTR Adjustable Rate Mortgages Trust |
|
| |
|
| |
|
49 |
|
|
| |
|
45 |
|
| |
|
| |
|
231 |
|
|
| |
|
99 |
|
|
Merrill Lynch Alternative Note Asset Trust |
|
| |
|
| |
|
591 |
|
|
| |
|
178 |
|
|
Opteum Mortgage Acceptance Corp. Trust |
|
| |
|
| |
|
151 |
|
|
| |
|
50 |
|
|
RBSSP Resecuritization Trust |
|
| |
|
| |
|
723 |
|
|
| |
|
561 |
|
|
Residential Accredit Loans, Inc. Trust |
|
| |
|
| |
|
50 |
|
|
| |
|
45 |
|
| |
|
| |
|
313 |
|
|
| |
|
211 |
|
| |
|
| |
|
254 |
|
|
| |
|
78 |
|
| |
|
| |
|
84 |
|
|
| |
|
70 |
|
|
Structured Adjustable Rate Mortgage Loan Trust |
|
| |
|
| |
|
142 |
|
|
| |
|
75 |
|
| |
|
| |
|
174 |
|
|
| |
|
96 |
|
| |
|
| |
|
108 |
|
|
| |
|
73 |
|
| |
|
| |
|
28 |
|
|
| |
|
17 |
|
5.799% due 05/25/2035 •(k) |
|
| |
|
619 |
|
|
| |
|
486 |
|
|
Structured Asset Mortgage Investments Trust |
|
4.894% due 02/25/2036 •(k) |
|
| |
|
127 |
|
|
| |
|
103 |
|
| |
|
| |
|
82 |
|
|
| |
|
68 |
|
|
SunTrust Adjustable Rate Mortgage Loan Trust |
|
| |
|
| |
|
23 |
|
|
| |
|
14 |
|
|
WaMu Mortgage Pass-Through Certificates Trust |
|
4.252% due 12/25/2036 ~(k) |
|
| |
|
154 |
|
|
| |
|
140 |
|
| |
|
| |
|
40 |
|
|
| |
|
36 |
|
|
Wells Fargo Commercial Mortgage Trust |
|
5.092% due 12/15/2039 ~(k) |
|
| |
|
1,065 |
|
|
| |
|
981 |
|
|
| |
| |
|
|
| |
| |
|
|
|
Total Non-Agency Mortgage-Backed Securities (Cost $12,079) |
|
|
|
|
|
| |
|
|
|
|
|
|
|
|
|
|
|
|
|
|
|
| |
| |
|
|
|
PRINCIPAL
AMOUNT
(000S) |
|
|
|
|
MARKET
VALUE
(000S) |
|
|
| |
ASSET-BACKED SECURITIES 6.2% |
|
|
| |
|
|
|
Carrington Mortgage Loan Trust |
|
| |
|
$ |
|
|
24 |
|
|
$ |
|
|
23 |
|
|
Citigroup Mortgage Loan Trust |
|
| |
|
| |
|
116 |
|
|
| |
|
38 |
|
|
Countrywide Asset-Backed Certificates |
|
| |
|
| |
|
26 |
|
|
| |
|
25 |
|
|
Morgan Stanley ABS Capital, Inc. Trust |
|
| |
|
| |
|
55 |
|
|
| |
|
49 |
|
|
Soundview Home Loan Trust |
|
| |
|
| |
|
147 |
|
|
| |
|
40 |
|
|
Washington Mutual Asset-Backed Certificates Trust |
|
| |
|
| |
|
73 |
|
|
| |
|
25 |
|
|
| |
| |
|
|
| |
| |
|
|
|
|
| |
| |
|
|
| |
| |
|
200 |
|
|
| |
| |
|
|
| |
| |
|
|
|
|
| |
MANUFACTURING HOUSE SEQUENTIAL 0.2% |
|
|
Bombardier Capital Mortgage Securitization Corp. |
|
| |
|
| |
|
1,421 |
|
|
| |
|
104 |
|
|
Conseco Finance Securitizations Corp. |
|
| |
|
| |
|
364 |
|
|
| |
|
73 |
|
|
| |
| |
|
|
| |
| |
|
|
|
|
| |
| |
|
|
| |
| |
|
177 |
|
|
| |
| |
|
|
| |
| |
|
|
|
|
| |
WHOLE LOAN COLLATERAL 0.7% |
|
|
Bear Stearns Asset-Backed Securities Trust |
|
| |
|
| |
|
517 |
|
|
| |
|
158 |
|
8.925% due 03/25/2036 •(k) |
|
| |
|
1,631 |
|
|
| |
|
508 |
|
|
| |
|
| |
|
| |
|
14 |
|
|
| |
|
13 |
|
|
| |
| |
|
|
| |
| |
|
|
|
|
| |
| |
|
|
| |
| |
|
679 |
|
|
| |
| |
|
|
| |
| |
|
|
|
|
| |
|
|
|
| |
|
| |
|
EUR |
|
|
243 |
|
|
| |
|
66 |
|
|
| |
|
| |
|
| |
|
1,000 |
|
|
| |
|
869 |
|
|
| |
|
| |
|
$ |
|
|
34,966 |
|
|
| |
|
82 |
|
|
Carlyle Global Market Strategies CLO Ltd. |
|
| |
|
| |
|
1,700 |
|
|
| |
|
167 |
|
|
Carlyle Global Market Strategies Euro CLO DAC |
|
| |
|
EUR |
|
|
300 |
|
|
| |
|
107 |
|
| |
|
| |
|
613 |
|
|
| |
|
471 |
|
|
| |
|
| |
|
$ |
|
|
600 |
|
|
| |
|
99 |
|
|
| |
|
0.000% due 12/15/2028 «(g) |
|
| |
|
2 |
|
|
| |
|
0 |
|
0.000% due 04/16/2029 «(g) |
|
| |
|
2 |
|
|
| |
|
0 |
|
0.000% due 07/16/2029 «(g) |
|
| |
|
2 |
|
|
| |
|
0 |
|
|
SMB Private Education Loan Trust |
|
0.000% due 09/18/2046 «(g) |
|
| |
|
1 |
|
|
| |
|
260 |
|
0.000% due 10/15/2048 «(g) |
|
| |
|
2 |
|
|
| |
|
383 |
|
0.000% due 02/16/2055 «(g) |
|
| |
|
0 |
|
|
| |
|
179 |
|
|
| |
|
| |
|
| |
|
11,457 |
|
|
| |
|
2,104 |
|
|
| |
| |
|
|
| |
| |
|
|
|
|
| |
| |
|
|
| |
| |
|
4,787 |
|
|
| |
| |
|
|
| |
| |
|
|
|
Total Asset-Backed Securities (Cost $20,146) |
|
|
|
|
|
| |
| |
|
|
| |
| |
|
|
|
|
| |
|
| |
|
| |
|
|
|
Argentina Government International Bond |
|
0.750% due 07/09/2030 þ(k) |
|
| |
|
451 |
|
|
| |
|
305 |
|
| |
|
| |
|
87 |
|
|
| |
|
73 |
|
| |
|
| |
|
205 |
|
|
| |
|
128 |
|
5.000% due 01/09/2038 (k) |
|
| |
|
1,597 |
|
|
| |
|
1,138 |
|
|
Avenir Issuer Ireland DAC |
|
| |
|
| |
|
318 |
|
|
| |
|
298 |
|
|
Dominican Republic International Bond |
|
10.500% due 03/15/2037 (k) |
|
DOP |
|
|
57,800 |
|
|
| |
|
988 |
|
|
|
|
|
|
|
|
|
|
|
|
|
| |
| |
|
|
|
PRINCIPAL
AMOUNT
(000S) |
|
|
|
|
MARKET
VALUE
(000S) |
|
|
El Salvador Government International Bond |
|
| |
|
$ |
|
|
200 |
|
|
$ |
|
|
206 |
|
|
Republic of Greece Government International Bond |
|
| |
|
EUR |
|
|
73 |
|
|
| |
|
86 |
|
| |
|
| |
|
162 |
|
|
| |
|
203 |
|
| |
|
| |
|
127 |
|
|
| |
|
158 |
|
| |
|
| |
|
159 |
|
|
| |
|
196 |
|
|
Romania Government International Bond |
|
| |
|
| |
|
400 |
|
|
| |
|
482 |
|
5.250% due 05/30/2032 (k) |
|
| |
|
800 |
|
|
| |
|
929 |
|
| |
|
| |
|
300 |
|
|
| |
|
357 |
|
|
Russia Government International Bond |
|
| |
|
$ |
|
|
200 |
|
|
| |
|
140 |
|
|
Turkiye Government International Bond |
|
| |
|
TRY |
|
|
24,200 |
|
|
| |
|
584 |
|
| |
|
| |
|
4,400 |
|
|
| |
|
107 |
|
|
| |
|
| |
|
$ |
|
|
450 |
|
|
| |
|
464 |
|
|
Venezuela Government International Bond |
|
9.250% due 09/15/2027 ^(d) |
|
| |
|
62 |
|
|
| |
|
13 |
|
|
| |
| |
|
|
| |
| |
|
|
|
Total Sovereign Issues (Cost $6,284) |
|
|
|
|
|
| |
|
|
|
|
| |
| |
|
|
|
SHARES |
|
|
|
|
|
|
|
| |
|
|
|
| |
COMMUNICATION SERVICES 1.4% |
|
|
|
|
|
| |
Clear Channel Outdoor Holdings, Inc. (e) |
|
| |
|
97,913 |
|
|
| |
|
115 |
|
|
|
|
|
| |
iHeartMedia, Inc. ‘A’ (e) |
|
| |
|
22,927 |
|
|
| |
|
40 |
|
|
|
|
|
| |
iHeartMedia, Inc. ‘B’ «(e) |
|
| |
|
17,837 |
|
|
| |
|
28 |
|
|
|
|
|
| |
| |
|
| |
|
725,410 |
|
|
| |
|
85 |
|
|
|
|
|
| |
Windstream Services LLC «(e) |
|
| |
|
52,536 |
|
|
| |
|
1,030 |
|
|
| |
| |
|
|
| |
| |
|
|
|
|
| |
| |
|
|
| |
| |
|
1,298 |
|
|
| |
| |
|
|
| |
| |
|
|
|
|
| |
|
|
|
|
|
|
| |
Steinhoff International Holdings NV «(e)(j) |
|
| |
|
4,155,239 |
|
|
| |
|
0 |
|
|
| |
| |
|
|
| |
| |
|
|
|
|
| |
|
|
|
|
|
|
| |
Banca Monte dei Paschi di Siena SpA |
|
| |
|
123,500 |
|
|
| |
|
1,051 |
|
|
|
|
|
| |
Intelsat Emergence SA «(j) |
|
| |
|
34,354 |
|
|
| |
|
1,185 |
|
|
|
|
|
| |
MNSN Holdings, Inc. «(e)(j) |
|
| |
|
508 |
|
|
| |
|
2 |
|
|
| |
| |
|
|
| |
| |
|
|
|
|
| |
| |
|
|
| |
| |
|
2,238 |
|
|
| |
| |
|
|
| |
| |
|
|
|
|
| |
|
|
|
|
|
|
| |
| |
|
| |
|
71,417 |
|
|
| |
|
3,224 |
|
|
| |
| |
|
|
| |
| |
|
|
|
|
| |
|
|
|
|
|
|
| |
Drillco Holding Lux SA «(j) |
|
| |
|
5,770 |
|
|
| |
|
118 |
|
|
|
|
|
| |
| |
|
| |
|
13,432 |
|
|
| |
|
275 |
|
|
|
|
|
| |
Incora New Equity «(e)(j) |
|
| |
|
49,990 |
|
|
| |
|
1,689 |
|
|
|
|
|
| |
Sierra Hamilton Holder LLC «(e)(j) |
|
| |
|
100,456 |
|
|
| |
|
0 |
|
|
|
|
|
| |
Westmoreland Mining Holdings «(e)(j) |
|
| |
|
13,114 |
|
|
| |
|
8 |
|
|
|
|
|
| |
Westmoreland Mining LLC «(e)(j) |
|
| |
|
41,325 |
|
|
| |
|
97 |
|
|
| |
| |
|
|
| |
| |
|
|
|
|
| |
| |
|
|
| |
| |
|
2,187 |
|
|
| |
| |
|
|
| |
| |
|
|
|
Total Common Stocks (Cost $10,763) |
|
|
|
|
|
| |
|
|
|
|
| |
|
|
|
| |
COMMUNICATION SERVICES 0.2% |
|
|
|
|
|
| |
Windstream - Exp. 04/08/2060 « |
|
| |
|
10,446 |
|
|
| |
|
205 |
|
|
| |
| |
|
|
| |
| |
|
|
|
|
|
|
|
|
|
|
|
|
|
|
|
| |
| |
|
|
|
|
|
|
|
|
|
|
|
|
|
|
|
|
| |
Intelsat Emergence SA - Exp. 02/17/2027 « |
|
| |
|
236 |
|
|
$ |
|
|
0 |
|
|
| |
| |
|
|
| |
| |
|
|
|
Total Warrants (Cost $899) |
|
|
|
|
|
| |
|
|
|
|
| |
PREFERRED SECURITIES 2.5% |
|
|
| |
|
|
|
|
|
|
| |
| |
|
| |
|
173,624 |
|
|
| |
|
0 |
|
|
| |
|
6.268% (US0003M + 1.750%) due 01/15/2067 ~ |
|
| |
|
1,000,000 |
|
|
| |
|
699 |
|
|
| |
|
| |
|
| |
|
2,501 |
|
|
| |
|
537 |
|
| |
|
| |
|
0 |
|
|
| |
|
414 |
|
|
| |
| |
|
|
| |
| |
|
|
|
|
| |
| |
|
|
| |
| |
|
1,650 |
|
|
| |
| |
|
|
| |
| |
|
|
|
|
| |
|
|
|
| |
|
0.000% due 11/07/2032 (g) |
|
| |
|
440 |
|
|
| |
|
0 |
|
| |
|
| |
|
579 |
|
|
| |
|
307 |
|
|
|
|
|
| |
Syniverse Holdings, Inc. «(j) |
|
| |
|
417,067 |
|
|
| |
|
395 |
|
|
| |
| |
|
|
| |
| |
|
|
|
|
| |
| |
|
|
| |
| |
|
702 |
|
|
| |
| |
|
|
| |
| |
|
|
|
Total Preferred Securities (Cost $2,783) |
|
|
|
|
|
| |
|
|
|
|
| |
REAL ESTATE INVESTMENT TRUSTS 0.1% |
|
|
| |
|
|
|
|
|
|
| |
| |
|
| |
|
32,667 |
|
|
| |
|
141 |
|
|
| |
| |
|
|
| |
| |
|
|
|
Total Real Estate Investment Trusts
(Cost $207) |
|
|
|
|
|
| |
|
|
|
|
| |
SHORT-TERM INSTRUMENTS 0.8% |
|
|
| |
|
|
|
State Street Institutional U.S. Government Money Market Fund, Premier Class |
|
| |
|
| |
|
172,871 |
|
|
| |
|
173 |
|
|
| |
| |
|
|
| |
| |
|
|
|
| |
|
|
|
|
|
|
|
|
|
|
|
|
4.353% due 09/11/2025 (f)(g)(n) |
|
| |
|
560 |
|
|
| |
|
555 |
|
|
| |
| |
|
|
| |
| |
|
|
|
Total Short-Term Instruments (Cost $728) |
|
|
|
|
|
| |
|
|
|
Total Investments in Securities (Cost $164,176) |
|
|
|
|
|
| |
|
|
|
| |
|
|
|
|
|
|
|
|
|
|
|
| |
INVESTMENTS IN AFFILIATES 10.8% |
|
|
| |
SHORT-TERM INSTRUMENTS 10.8% |
|
|
| |
CENTRAL FUNDS USED FOR CASH MANAGEMENT PURPOSES 10.8% |
|
|
|
|
|
| |
PIMCO Short-Term Floating NAV Portfolio III |
|
| |
|
1,044,844 |
|
|
| |
|
10,174 |
|
|
| |
| |
|
|
| |
| |
|
|
|
Total Short-Term Instruments
(Cost $10,166) |
|
|
|
|
|
| |
|
|
|
|
|
|
|
| |
|
| |
| |
|
|
| |
| |
|
| |
Total Investments in Affiliates
(Cost $10,166) |
|
|
|
|
|
| |
|
| |
|
| |
Total Investments 162.2%
(Cost $174,342) |
|
|
$ |
|
|
|
|
|
| |
Financial Derivative
Instruments (l)(m) 4.6% (Cost or Premiums, net $(43)) |
|
|
| |
|
|
|
|
| |
Other Assets and Liabilities, net (66.8)% |
|
|
|
|
|
| |
|
|
|
|
|
|
$ |
|
|
|
|
|
|
| |
| |
|
|
|
|
|
|
|
|
|
|
|
|
|
|
|
| |
See Accompanying Notes |
|
|
|
|
|
| |
|
|
JUNE 30, 2025 |
|
|
|
|
|
|
|
|
|
| |
|
|
PIMCO Global StocksPLUS & Income Fund |
|
|
|
|
NOTES TO SCHEDULE OF INVESTMENTS:
|
A zero balance may reflect actual amounts rounding to less than one thousand. |
|
Security valued using significant unobservable inputs (Level 3). |
|
All or a portion of this amount represents unfunded loan commitments. The interest rate for the unfunded portion will be determined at the time of funding. See Note 4, Securities and Other Investments, in the Notes to Financial Statements for more information regarding unfunded loan commitments. |
|
Variable or Floating rate security. Rate shown is the rate in effect as of period end. Certain variable rate securities are not based on a published reference rate and spread, rather are determined by the issuer or agent and are based on current market conditions. Reference rate is as of reset date, which may vary by security. These securities may not indicate a reference rate and/or spread in their description. |
|
Rate shown is the rate in effect as of period end. The rate may be based on a fixed rate, a capped rate or a floor rate and may convert to a variable or floating rate in the future. These securities do not indicate a reference rate and spread in their description. |
|
Coupon represents a rate which changes periodically based on a predetermined schedule or event. Rate shown is the rate in effect as of period end. |
|
Security is an Interest Only (“IO”) or IO Strip. |
|
Payment in-kind security. |
|
Security is not accruing income as of the date of this report. |
|
Security did not produce income within the last twelve months. |
|
Coupon represents a weighted average yield to maturity. |
|
Perpetual maturity; date shown, if applicable, represents next contractual call date. |
|
Coupon represents a 7-Day Yield. |
(j) RESTRICTED SECURITIES:
|
|
|
|
|
|
|
|
|
|
|
|
|
|
|
|
|
|
|
|
|
|
|
|
| |
|
|
|
|
|
|
|
|
|
|
|
|
|
|
|
|
|
Market Value
as Percentage
of Net Assets |
|
| |
|
|
|
| |
|
|
| |
|
|
|
|
$ |
2,984 |
|
|
$ |
3,224 |
|
|
|
3.43 |
% |
| |
|
|
|
| |
|
|
| |
|
06/08/2023 |
|
|
|
116 |
|
|
|
118 |
|
|
|
0.13 |
|
| |
|
|
|
| |
|
|
| |
|
01/31/2025 |
|
|
|
2,428 |
|
|
|
1,689 |
|
|
|
1.80 |
|
Incora Top Holdco LLC 6.000% due 01/30/2033 |
|
|
|
| |
|
|
| |
|
01/31/2025 |
|
|
|
1,072 |
|
|
|
1,487 |
|
|
|
1.58 |
|
| |
|
|
|
| |
|
|
| |
|
06/19/2017 - 03/01/2024 |
|
|
|
2,403 |
|
|
|
1,185 |
|
|
|
1.26 |
|
| |
|
|
|
| |
|
|
| |
|
03/16/2023 - 03/29/2023 |
|
|
|
6 |
|
|
|
2 |
|
|
|
0.00 |
|
Sierra Hamilton Holder LLC |
|
|
|
| |
|
|
| |
|
07/31/2017 |
|
|
|
25 |
|
|
|
0 |
|
|
|
0.00 |
|
Steinhoff International Holdings NV |
|
|
|
| |
|
|
| |
|
06/30/2023 - 10/30/2023 |
|
|
|
0 |
|
|
|
0 |
|
|
|
0.00 |
|
| |
|
|
|
| |
|
|
| |
|
05/12/2022 - 05/30/2025 |
|
|
|
411 |
|
|
|
395 |
|
|
|
0.42 |
|
Westmoreland Mining Holdings |
|
|
|
| |
|
|
| |
|
12/08/2014 - 08/05/2016 |
|
|
|
367 |
|
|
|
8 |
|
|
|
0.01 |
|
| |
|
|
|
| |
|
|
| |
|
06/30/2023 - 02/03/2025 |
|
|
|
172 |
|
|
|
97 |
|
|
|
0.10 |
|
|
| |
|
|
| |
|
|
| |
|
|
| |
|
|
|
|
|
|
|
|
|
|
|
|
|
| |
$ |
9,984 |
|
|
$ |
8,205 |
|
|
|
8.73 |
% |
|
|
| |
|
|
|
|
|
|
|
|
|
|
|
BORROWINGS AND OTHER FINANCING TRANSACTIONS
REVERSE REPURCHASE AGREEMENTS:
|
|
|
|
|
|
|
|
|
|
|
|
|
|
|
|
|
|
|
|
|
|
|
|
| |
|
|
Borrowing |
|
|
Settlement Date |
|
|
Maturity Date |
|
|
|
|
|
Payable for
Reverse
Repurchase
Agreements |
|
| |
|
|
4.870 |
% |
|
|
04/07/2025 |
|
|
|
07/07/2025 |
|
|
|
$ |
|
|
|
(130 |
) |
|
$ |
(132 |
) |
|
| |
|
4.870 |
|
|
|
06/10/2025 |
|
|
|
08/11/2025 |
|
|
|
|
| |
|
(869 |
) |
|
|
(871 |
) |
|
| |
|
5.620 |
|
|
|
04/25/2025 |
|
|
|
10/23/2025 |
|
|
|
|
| |
|
(249 |
) |
|
|
(252 |
) |
|
| |
|
5.820 |
|
|
|
04/22/2025 |
|
|
|
07/22/2025 |
|
|
|
|
| |
|
(826 |
) |
|
|
(836 |
) |
| |
|
|
4.700 |
|
|
|
12/20/2024 |
|
|
|
TBD |
|
|
|
|
| |
|
(839 |
) |
|
|
(860 |
) |
|
| |
|
5.530 |
|
|
|
05/27/2025 |
|
|
|
08/27/2025 |
|
|
|
|
| |
|
(249 |
) |
|
|
(250 |
) |
| |
|
|
4.940 |
|
|
|
04/09/2025 |
|
|
|
10/08/2025 |
|
|
|
|
| |
|
(3,259 |
) |
|
|
(3,296 |
) |
|
| |
|
4.940 |
|
|
|
05/29/2025 |
|
|
|
10/08/2025 |
|
|
|
|
| |
|
(360 |
) |
|
|
(362 |
) |
| |
|
|
4.650 |
|
|
|
03/24/2025 |
|
|
|
TBD |
|
|
|
|
| |
|
(492 |
) |
|
|
(498 |
) |
|
| |
|
4.650 |
|
|
|
06/24/2025 |
|
|
|
TBD |
|
|
|
|
| |
|
(327 |
) |
|
|
(327 |
) |
|
| |
|
4.870 |
|
|
|
06/27/2025 |
|
|
|
07/25/2025 |
|
|
|
|
| |
|
(860 |
) |
|
|
(860 |
) |
| |
|
|
5.377 |
|
|
|
06/04/2025 |
|
|
|
03/04/2026 |
|
|
|
|
| |
|
(1,550 |
) |
|
|
(1,556 |
) |
| |
|
|
4.470 |
|
|
|
06/13/2025 |
|
|
|
07/14/2025 |
|
|
|
|
| |
|
(270 |
) |
|
|
(271 |
) |
|
| |
|
4.930 |
|
|
|
04/11/2025 |
|
|
|
07/11/2025 |
|
|
|
|
| |
|
(496 |
) |
|
|
(502 |
) |
|
| |
|
4.980 |
|
|
|
04/11/2025 |
|
|
|
07/11/2025 |
|
|
|
|
| |
|
(770 |
) |
|
|
(779 |
) |
| |
|
|
4.750 |
|
|
|
05/09/2025 |
|
|
|
08/01/2025 |
|
|
|
|
| |
|
(1,187 |
) |
|
|
(1,195 |
) |
| |
|
|
2.130 |
|
|
|
06/11/2025 |
|
|
|
TBD |
|
|
|
EUR |
|
|
|
(752 |
) |
|
|
(887 |
) |
| |
|
|
5.540 |
|
|
|
06/24/2025 |
|
|
|
08/08/2025 |
|
|
|
$ |
|
|
|
(476 |
) |
|
|
(476 |
) |
|
|
|
|
|
|
| |
44 |
|
PIMCO CLOSED-END FUNDS |
|
|
See Accompanying Notes |
|
|
|
|
|
|
|
|
|
|
|
|
|
|
|
|
|
|
|
|
|
|
|
|
|
| |
Counterparty |
|
Borrowing |
|
|
Settlement Date |
|
|
Maturity Date |
|
|
|
|
|
Payable for
Reverse
Repurchase
Agreements |
|
| |
|
|
4.600 |
% |
|
|
12/20/2024 |
|
|
|
TBD |
|
|
$ |
| |
|
|
(77 |
) |
|
$ |
(79 |
) |
| |
|
|
4.540 |
|
|
|
05/15/2025 |
|
|
|
TBD |
|
|
|
|
| |
|
(586 |
) |
|
|
(589 |
) |
|
| |
|
4.580 |
|
|
|
04/07/2025 |
|
|
|
TBD |
|
|
|
|
| |
|
(3,383 |
) |
|
|
(3,383 |
) |
|
| |
|
4.650 |
|
|
|
12/20/2024 |
|
|
|
TBD |
|
|
|
|
| |
|
(876 |
) |
|
|
(898 |
) |
| |
|
|
5.310 |
|
|
|
05/19/2025 |
|
|
|
11/19/2025 |
|
|
|
|
| |
|
(191 |
) |
|
|
(192 |
) |
|
| |
|
|
| |
|
|
| |
|
|
| |
|
|
| |
|
|
| |
|
|
|
Total Reverse Repurchase Agreements |
|
|
|
| |
|
|
| |
|
|
| |
|
|
| |
|
|
| |
|
|
|
|
| |
|
|
| |
|
|
| |
|
|
| |
|
|
| |
|
|
| |
|
|
|
SHORT SALES:
|
|
|
|
|
|
|
|
|
|
|
|
|
|
|
|
|
|
|
|
| |
|
|
|
|
|
|
|
|
|
|
|
|
|
|
|
|
U.S. Government Agencies (0.7)% |
|
Uniform Mortgage-Backed Security, TBA |
|
|
2.000 |
% |
|
|
08/01/2055 |
|
|
$ |
800 |
|
|
$ |
(629 |
) |
|
$ |
(634 |
) |
|
| |
|
|
| |
|
|
| |
|
|
| |
|
|
|
|
|
|
|
| |
|
|
|
| |
|
|
| |
|
|
| |
|
|
|
|
|
|
|
|
| |
|
|
| |
|
|
| |
|
|
| |
|
|
|
|
|
|
|
BORROWINGS AND OTHER FINANCING TRANSACTIONS SUMMARY
The following is a summary by counterparty of the market value of Borrowings and Other Financing Transactions and collateral pledged/(received) as of June 30, 2025:
|
|
|
|
|
|
|
|
|
|
|
|
|
|
|
|
|
|
|
|
|
|
|
|
| |
|
|
Repurchase
Agreement
Proceeds
to be
Received |
|
|
Payable for
Reverse
Repurchase
Agreements |
|
|
Payable for Sale-Buyback Transactions |
|
|
Total
Borrowings and
Other Financing
Transactions |
|
|
Collateral
Pledged/(Received) |
|
|
|
|
Global/Master Repurchase Agreement |
|
| |
|
$ |
0 |
|
|
$ |
(2,091 |
) |
|
$ |
0 |
|
|
$ |
(2,091 |
) |
|
$ |
2,751 |
|
|
$ |
660 |
|
| |
|
|
0 |
|
|
|
(1,110 |
) |
|
|
0 |
|
|
|
(1,110 |
) |
|
|
1,373 |
|
|
|
263 |
|
| |
|
|
0 |
|
|
|
(3,658 |
) |
|
|
0 |
|
|
|
(3,658 |
) |
|
|
4,245 |
|
|
|
587 |
|
| |
|
|
0 |
|
|
|
0 |
|
|
|
0 |
|
|
|
0 |
|
|
|
(10 |
) |
|
|
(10 |
) |
| |
|
|
0 |
|
|
|
(1,685 |
) |
|
|
0 |
|
|
|
(1,685 |
) |
|
|
1,961 |
|
|
|
276 |
|
| |
|
|
0 |
|
|
|
(1,556 |
) |
|
|
0 |
|
|
|
(1,556 |
) |
|
|
1,764 |
|
|
|
208 |
|
| |
|
|
0 |
|
|
|
(1,552 |
) |
|
|
0 |
|
|
|
(1,552 |
) |
|
|
1,845 |
|
|
|
293 |
|
| |
|
|
0 |
|
|
|
(1,195 |
) |
|
|
0 |
|
|
|
(1,195 |
) |
|
|
1,202 |
|
|
|
7 |
|
| |
|
|
0 |
|
|
|
(887 |
) |
|
|
0 |
|
|
|
(887 |
) |
|
|
929 |
|
|
|
42 |
|
| |
|
|
0 |
|
|
|
(476 |
) |
|
|
0 |
|
|
|
(476 |
) |
|
|
648 |
|
|
|
172 |
|
| |
|
|
0 |
|
|
|
(79 |
) |
|
|
0 |
|
|
|
(79 |
) |
|
|
93 |
|
|
|
14 |
|
| |
|
|
0 |
|
|
|
(4,870 |
) |
|
|
0 |
|
|
|
(4,870 |
) |
|
|
5,078 |
|
|
|
208 |
|
| |
|
|
0 |
|
|
|
0 |
|
|
|
0 |
|
|
|
0 |
|
|
|
242 |
|
|
|
242 |
|
| |
|
|
0 |
|
|
|
(192 |
) |
|
|
0 |
|
|
|
(192 |
) |
|
|
0 |
|
|
|
(192 |
) |
|
| |
|
|
|
|
|
|
|
|
|
|
|
|
|
|
| |
|
|
| |
|
| |
Total Borrowings and Other Financing Transactions |
|
|
|
|
|
|
|
|
|
|
|
|
|
|
|
| |
|
|
| |
|
| |
|
| |
|
|
|
|
|
|
|
|
|
|
|
|
|
|
| |
|
|
| |
|
| |
CERTAIN TRANSFERS ACCOUNTED FOR AS SECURED BORROWINGS
Remaining Contractual Maturity of the Agreements
|
|
|
|
|
|
|
|
|
|
|
|
|
|
|
|
|
|
|
|
| |
| |
|
Overnight and Continuous |
|
|
|
|
|
|
|
|
|
|
|
|
|
Reverse Repurchase Agreements |
|
| |
|
$ |
0 |
|
|
$ |
(132 |
) |
|
$ |
(1,347 |
) |
|
$ |
(10,292 |
) |
|
$ |
(11,771 |
) |
| |
|
|
0 |
|
|
|
(1,107 |
) |
|
|
0 |
|
|
|
0 |
|
|
|
(1,107 |
) |
Non-Agency Mortgage-Backed Securities |
|
|
0 |
|
|
|
(1,281 |
) |
|
|
(250 |
) |
|
|
(1,596 |
) |
|
|
(3,127 |
) |
| |
|
|
0 |
|
|
|
0 |
|
|
|
0 |
|
|
|
(404 |
) |
|
|
(404 |
) |
| |
|
|
0 |
|
|
|
(860 |
) |
|
|
(1,195 |
) |
|
|
(887 |
) |
|
|
(2,942 |
) |
|
| |
|
|
|
|
|
|
|
|
|
|
|
|
|
|
|
|
|
|
|
| |
|
|
|
|
|
|
|
|
|
|
|
|
|
|
|
|
|
|
|
|
|
| |
|
|
|
|
|
|
|
|
|
|
|
|
|
|
|
|
|
|
|
Payable for reverse repurchase agreements |
|
|
|
|
|
|
| |
|
|
| |
|
|
| |
|
|
| |
|
|
| |
|
|
|
|
Securities with an aggregate market value of $22,373 have been pledged as collateral under the terms of the above master agreements as of June 30, 2025. |
|
The average amount of borrowings outstanding during the period ended June 30, 2025 was $(17,326) at a weighted average interest rate of 5.349%. Average borrowings may include reverse repurchase agreements and sale-buyback transactions, if held during the period. |
|
Open maturity reverse repurchase agreement. |
|
Net Exposure represents the net receivable/(payable) that would be due from/to the counterparty in the event of default. Exposure from borrowings and other financing transactions can only be netted across transactions governed under the same master agreement with the same legal entity. See Note 8, Master Netting Arrangements, in the Notes to Financial Statements for more information. |
|
|
|
|
|
|
|
|
|
|
|
|
| |
| See Accompanying Notes |
|
|
ANNUAL REPORT |
|
|
| |
|
|
JUNE 30, 2025 |
|
|
45 |
|
|
|
|
|
|
| |
|
|
PIMCO Global StocksPLUS & Income Fund |
|
|
|
|
(l) FINANCIAL DERIVATIVE INSTRUMENTS: EXCHANGE-TRADED OR CENTRALLY CLEARED
PURCHASED OPTIONS:
OPTIONS ON EXCHANGE-TRADED FUTURES CONTRACTS
|
|
|
|
|
|
|
|
|
|
|
|
|
|
|
|
|
|
|
|
|
|
|
|
| |
|
|
|
|
|
|
|
|
|
|
|
|
|
|
|
|
|
|
|
Put - CME E-mini S&P 500 July 2025 Futures |
|
$ |
5,775.000 |
|
|
|
07/18/2025 |
|
|
|
146 |
|
|
$ |
7 |
|
|
$ |
317 |
|
|
$ |
41 |
|
|
| |
|
|
| |
|
|
| |
|
|
| |
|
|
| |
|
|
|
|
|
|
|
| |
|
|
|
|
|
|
|
|
|
|
| |
|
|
| |
|
|
| |
|
|
| |
|
|
| |
|
|
|
|
|
|
|
WRITTEN OPTIONS:
OPTIONS ON EXCHANGE-TRADED FUTURES CONTRACTS
|
|
|
|
|
|
|
|
|
|
|
|
|
|
|
|
|
|
|
|
|
|
|
|
| |
|
|
|
|
|
|
|
|
|
|
|
Notional Amount |
|
|
|
|
|
|
|
Call - CME E-mini S&P 500 July 2025 Futures |
|
$ |
6,075.000 |
|
|
|
07/18/2025 |
|
|
|
146 |
|
|
$ |
7 |
|
|
$ |
(734 |
) |
|
$ |
(1,484 |
) |
|
| |
|
|
| |
|
|
| |
|
|
| |
|
|
| |
|
|
|
|
|
|
|
| |
|
|
|
|
|
|
|
|
|
|
|
| |
|
|
|
|
|
|
|
FUTURES CONTRACTS:
LONG FUTURES CONTRACTS
|
|
|
|
|
|
|
|
|
|
|
|
|
|
|
|
|
|
|
|
|
|
|
|
| |
| Description |
|
Expiration
Month |
|
|
# of
Contracts |
|
|
Notional
Amount |
|
|
Unrealized
Appreciation/
(Depreciation) |
|
|
|
|
| |
|
|
|
|
|
E-Mini S&P 500 Index September Futures |
|
|
09/2025 |
|
|
|
151 |
|
|
$ |
47,216 |
|
|
$ |
1,432 |
|
|
$ |
227 |
|
|
$ |
0 |
|
U.S. Treasury 10-Year Note September Futures |
|
|
09/2025 |
|
|
|
1 |
|
|
|
112 |
|
|
|
2 |
|
|
|
0 |
|
|
|
0 |
|
|
| |
|
|
| |
|
|
| |
|
|
| |
|
|
|
|
|
|
|
|
|
|
|
|
| |
|
|
| |
|
|
| |
|
|
| |
$ |
1,434 |
|
|
$ |
227 |
|
|
$ |
0 |
|
|
| |
|
|
| |
|
|
| |
|
|
| |
|
|
|
|
|
|
|
|
|
|
|
SHORT FUTURES CONTRACTS
|
|
|
|
|
|
|
|
|
|
|
|
|
|
|
|
|
|
|
|
|
|
|
|
| |
| Description |
|
Expiration
Month |
|
|
# of
Contracts |
|
|
Notional
Amount |
|
|
Unrealized
Appreciation/
(Depreciation) |
|
|
|
|
| |
|
|
|
|
|
3-Month SOFR Active Contract December Futures |
|
|
03/2026 |
|
|
|
1 |
|
|
$ |
(241 |
) |
|
$ |
4 |
|
|
$ |
0 |
|
|
$ |
0 |
|
3-Month SOFR Active Contract June Futures |
|
|
09/2025 |
|
|
|
2 |
|
|
|
(478 |
) |
|
|
11 |
|
|
|
0 |
|
|
|
0 |
|
3-Month SOFR Active Contract March Futures |
|
|
06/2026 |
|
|
|
1 |
|
|
|
(242 |
) |
|
|
3 |
|
|
|
0 |
|
|
|
0 |
|
3-Month SOFR Active Contract September Futures |
|
|
12/2025 |
|
|
|
1 |
|
|
|
(240 |
) |
|
|
5 |
|
|
|
0 |
|
|
|
0 |
|
|
| |
|
|
| |
|
|
| |
|
|
| |
|
|
|
|
|
|
|
|
|
|
|
|
| |
|
|
| |
|
|
| |
|
|
| |
$ |
23 |
|
|
$ |
0 |
|
|
$ |
0 |
|
|
| |
|
|
| |
|
|
| |
|
|
| |
|
|
|
|
|
|
|
|
|
|
|
| |
|
|
|
|
|
|
|
|
|
|
|
|
|
|
|
| |
|
|
|
|
|
|
|
|
|
|
|
SWAP AGREEMENTS:
INTEREST RATE SWAPS
|
|
|
|
|
|
|
|
|
|
|
|
|
|
|
|
|
|
|
|
|
|
|
|
|
|
|
|
|
|
|
|
|
|
|
|
|
|
| |
Pay/ Receive
Floating Rate |
|
Floating Rate Index |
|
Fixed Rate |
|
|
Payment
Frequency |
|
|
|
|
Notional
Amount |
|
|
|
|
|
Unrealized
Appreciation/
(Depreciation) |
|
|
Market
Value |
|
|
|
|
| |
|
|
|
|
|
| |
|
1-Day GBP-SONIO Compounded-OIS |
|
|
3.500 |
% |
|
Annual |
|
|
03/19/2030 |
|
|
GBP |
|
|
1,500 |
|
|
$ |
(41 |
) |
|
$ |
22 |
|
|
$ |
(19 |
) |
|
$ |
0 |
|
|
$ |
0 |
|
| |
|
1-Day GBP-SONIO Compounded-OIS |
|
|
0.750 |
|
|
Annual |
|
|
09/21/2052 |
|
|
| |
|
600 |
|
|
|
123 |
|
|
|
386 |
|
|
|
509 |
|
|
|
1 |
|
|
|
0 |
|
| |
|
1-Day USD-SOFR Compounded-OIS |
|
|
3.250 |
|
|
Annual |
|
|
06/18/2030 |
|
|
$ |
|
|
8,300 |
|
|
|
(76 |
) |
|
|
8 |
|
|
|
(68 |
) |
|
|
14 |
|
|
|
0 |
|
| |
|
1-Day USD-SOFR Compounded-OIS |
|
|
2.300 |
|
|
Annual |
|
|
01/17/2026 |
|
|
| |
|
300 |
|
|
|
0 |
|
|
|
6 |
|
|
|
6 |
|
|
|
0 |
|
|
|
0 |
|
| |
|
1-Day USD-SOFR Compounded-OIS |
|
|
4.250 |
|
|
Annual |
|
|
06/15/2027 |
|
|
| |
|
26,000 |
|
|
|
(151 |
) |
|
|
518 |
|
|
|
367 |
|
|
|
11 |
|
|
|
0 |
|
| |
|
1-Day USD-SOFR Compounded-OIS |
|
|
1.500 |
|
|
|
|
|
12/15/2028 |
|
|
| |
|
1,250 |
|
|
|
(12 |
) |
|
|
102 |
|
|
|
90 |
|
|
|
0 |
|
|
|
(1 |
) |
| |
|
1-Day USD-SOFR Compounded-OIS |
|
|
1.750 |
|
|
Annual |
|
|
06/15/2029 |
|
|
| |
|
340 |
|
|
|
(37 |
) |
|
|
16 |
|
|
|
(21 |
) |
|
|
0 |
|
|
|
0 |
|
| |
|
1-Day USD-SOFR Compounded-OIS |
|
|
3.750 |
|
|
Annual |
|
|
06/20/2029 |
|
|
| |
|
1,200 |
|
|
|
(23 |
) |
|
|
7 |
|
|
|
(16 |
) |
|
|
0 |
|
|
|
(1 |
) |
| |
|
1-Day USD-SOFR Compounded-OIS |
|
|
1.750 |
|
|
Semi-Annual |
|
|
01/15/2030 |
|
|
| |
|
600 |
|
|
|
(5 |
) |
|
|
55 |
|
|
|
50 |
|
|
|
0 |
|
|
|
(1 |
) |
| |
|
1-Day USD-SOFR Compounded-OIS |
|
|
2.000 |
|
|
Semi-Annual |
|
|
02/12/2030 |
|
|
| |
|
4,400 |
|
|
|
(56 |
) |
|
|
367 |
|
|
|
311 |
|
|
|
0 |
|
|
|
(6 |
) |
| |
|
1-Day USD-SOFR Compounded-OIS |
|
|
2.000 |
|
|
Semi-Annual |
|
|
03/10/2030 |
|
|
| |
|
500 |
|
|
|
0 |
|
|
|
35 |
|
|
|
35 |
|
|
|
0 |
|
|
|
(1 |
) |
| |
|
1-Day USD-SOFR Compounded-OIS |
|
|
1.000 |
|
|
Semi-Annual |
|
|
12/16/2030 |
|
|
| |
|
400 |
|
|
|
(12 |
) |
|
|
67 |
|
|
|
55 |
|
|
|
0 |
|
|
|
(1 |
) |
| |
|
1-Day USD-SOFR Compounded-OIS |
|
|
0.750 |
|
|
Semi-Annual |
|
|
06/16/2031 |
|
|
| |
|
2,229 |
|
|
|
(174 |
) |
|
|
(188 |
) |
|
|
(362 |
) |
|
|
4 |
|
|
|
0 |
|
| |
|
1-Day USD-SOFR Compounded-OIS |
|
|
1.750 |
|
|
Annual |
|
|
06/15/2032 |
|
|
| |
|
220 |
|
|
|
(9 |
) |
|
|
(15 |
) |
|
|
(24 |
) |
|
|
1 |
|
|
|
0 |
|
| |
|
1-Day USD-SOFR Compounded-OIS |
|
|
3.000 |
|
|
Annual |
|
|
06/21/2033 |
|
|
| |
|
40 |
|
|
|
0 |
|
|
|
(2 |
) |
|
|
(2 |
) |
|
|
0 |
|
|
|
0 |
|
| |
|
1-Day USD-SOFR Compounded-OIS |
|
|
3.500 |
|
|
Annual |
|
|
12/20/2033 |
|
|
| |
|
2,900 |
|
|
|
93 |
|
|
|
(56 |
) |
|
|
37 |
|
|
|
0 |
|
|
|
(10 |
) |
| |
|
1-Day USD-SOFR Compounded-OIS |
|
|
3.500 |
|
|
Annual |
|
|
12/20/2033 |
|
|
| |
|
1,500 |
|
|
|
21 |
|
|
|
(41 |
) |
|
|
(20 |
) |
|
|
5 |
|
|
|
0 |
|
|
|
|
|
|
|
| |
46 |
|
PIMCO CLOSED-END FUNDS |
|
|
See Accompanying Notes |
|
|
|
|
|
|
|
|
|
|
|
|
|
|
|
|
|
|
|
|
|
|
|
|
|
|
|
|
|
|
|
|
|
|
|
|
|
|
|
| |
Pay/ Receive
Floating Rate |
|
Floating Rate Index |
|
Fixed Rate |
|
|
Payment
Frequency |
|
Maturity
Date |
|
|
Notional
Amount |
|
|
Premiums
Paid/(Received) |
|
|
Unrealized
Appreciation/
(Depreciation) |
|
|
Market
Value |
|
|
Variation Margin |
|
| |
Asset |
|
|
Liability |
|
| |
|
|
|
|
3.750 |
% |
|
Annual |
|
|
06/20/2034 |
|
|
$ |
|
|
2,450 |
|
|
$ |
(73 |
) |
|
$ |
94 |
|
|
$ |
21 |
|
|
$ |
9 |
|
|
$ |
0 |
|
| |
|
|
|
|
3.000 |
|
|
|
|
|
12/19/2048 |
|
|
| |
|
1,900 |
|
|
|
(5 |
) |
|
|
(362 |
) |
|
|
(367 |
) |
|
|
12 |
|
|
|
0 |
|
| |
|
|
|
|
1.500 |
|
|
Annual |
|
|
06/15/2052 |
|
|
| |
|
5,400 |
|
|
|
468 |
|
|
|
1,733 |
|
|
|
2,201 |
|
|
|
0 |
|
|
|
(29 |
) |
| |
|
|
|
|
1.750 |
|
|
Annual |
|
|
06/15/2052 |
|
|
| |
|
6,000 |
|
|
|
713 |
|
|
|
1,484 |
|
|
|
2,197 |
|
|
|
0 |
|
|
|
(33 |
) |
| |
|
|
|
|
11.250 |
|
|
Maturity |
|
|
01/04/2027 |
|
|
BRL |
|
|
300 |
|
|
|
0 |
|
|
|
(4 |
) |
|
|
(4 |
) |
|
|
0 |
|
|
|
0 |
|
| |
|
|
|
|
11.275 |
|
|
Maturity |
|
|
01/04/2027 |
|
|
| |
|
100 |
|
|
|
0 |
|
|
|
(1 |
) |
|
|
(1 |
) |
|
|
0 |
|
|
|
0 |
|
| |
|
|
|
|
11.290 |
|
|
Maturity |
|
|
01/04/2027 |
|
|
| |
|
100 |
|
|
|
0 |
|
|
|
(1 |
) |
|
|
(1 |
) |
|
|
0 |
|
|
|
0 |
|
| |
|
|
|
|
11.731 |
|
|
Maturity |
|
|
01/04/2027 |
|
|
| |
|
100 |
|
|
|
0 |
|
|
|
(1 |
) |
|
|
(1 |
) |
|
|
0 |
|
|
|
0 |
|
| |
|
|
|
|
11.746 |
|
|
Maturity |
|
|
01/04/2027 |
|
|
| |
|
300 |
|
|
|
0 |
|
|
|
(3 |
) |
|
|
(3 |
) |
|
|
0 |
|
|
|
0 |
|
| |
|
|
|
|
11.901 |
|
|
Maturity |
|
|
01/04/2027 |
|
|
| |
|
800 |
|
|
|
0 |
|
|
|
(6 |
) |
|
|
(6 |
) |
|
|
0 |
|
|
|
0 |
|
| |
|
|
|
|
0.650 |
|
|
Annual |
|
|
02/26/2029 |
|
|
EUR |
|
|
6,100 |
|
|
|
6 |
|
|
|
(431 |
) |
|
|
(425 |
) |
|
|
0 |
|
|
|
(6 |
) |
| |
|
|
|
|
0.150 |
|
|
Annual |
|
|
03/18/2030 |
|
|
| |
|
1,300 |
|
|
|
(18 |
) |
|
|
193 |
|
|
|
175 |
|
|
|
1 |
|
|
|
0 |
|
| |
|
|
|
|
0.150 |
|
|
Annual |
|
|
06/17/2030 |
|
|
| |
|
3,000 |
|
|
|
(132 |
) |
|
|
484 |
|
|
|
352 |
|
|
|
4 |
|
|
|
0 |
|
| |
|
|
|
|
0.250 |
|
|
Annual |
|
|
09/21/2032 |
|
|
| |
|
800 |
|
|
|
72 |
|
|
|
70 |
|
|
|
142 |
|
|
|
1 |
|
|
|
0 |
|
| |
|
|
|
|
1.250 |
|
|
Annual |
|
|
08/19/2049 |
|
|
| |
|
2,700 |
|
|
|
11 |
|
|
|
851 |
|
|
|
862 |
|
|
|
9 |
|
|
|
0 |
|
| |
|
|
|
|
0.250 |
|
|
Annual |
|
|
03/18/2050 |
|
|
| |
|
400 |
|
|
|
48 |
|
|
|
(266 |
) |
|
|
(218 |
) |
|
|
0 |
|
|
|
(1 |
) |
| |
|
|
|
|
0.500 |
|
|
Annual |
|
|
06/17/2050 |
|
|
| |
|
1,000 |
|
|
|
171 |
|
|
|
(659 |
) |
|
|
(488 |
) |
|
|
0 |
|
|
|
(3 |
) |
| |
|
|
|
|
0.830 |
|
|
Annual |
|
|
12/09/2052 |
|
|
| |
|
1,600 |
|
|
|
11 |
|
|
|
176 |
|
|
|
187 |
|
|
|
1 |
|
|
|
0 |
|
| |
|
|
|
|
3.500 |
|
|
Semi-Annual |
|
|
06/19/2034 |
|
|
CAD |
|
|
1,000 |
|
|
|
35 |
|
|
|
0 |
|
|
|
35 |
|
|
|
2 |
|
|
|
0 |
|
| |
|
|
|
|
3.500 |
|
|
Semi-Annual |
|
|
06/20/2044 |
|
|
| |
|
600 |
|
|
|
7 |
|
|
|
(22 |
) |
|
|
(15 |
) |
|
|
0 |
|
|
|
(1 |
) |
|
| |
| |
|
|
| |
| |
|
|
| |
| |
|
|
| |
|
|
|
|
|
|
|
|
|
|
|
|
|
|
|
|
|
|
|
| |
|
|
|
| |
|
|
|
|
|
|
|
|
|
|
|
|
|
|
|
|
|
|
|
|
| |
|
|
| |
|
|
|
|
|
|
|
|
|
|
|
|
|
|
|
|
|
|
|
FINANCIAL DERIVATIVE INSTRUMENTS: EXCHANGE-TRADED OR CENTRALLY CLEARED SUMMARY
The following is a summary of the market value and variation margin of Exchange-Traded or Centrally Cleared Financial Derivative Instruments as of June 30, 2025:
|
|
|
|
|
|
|
|
|
|
|
|
|
|
|
|
|
|
|
|
|
|
|
|
|
|
|
|
|
|
|
|
|
|
|
|
| |
| |
|
Financial Derivative Assets |
|
|
|
|
|
Financial Derivative Liabilities |
|
| |
|
|
|
|
|
|
|
|
|
|
|
|
|
|
|
|
Variation Margin
Liability |
|
|
|
|
| |
|
|
|
|
|
|
|
|
|
|
|
|
|
|
|
|
|
|
|
|
|
|
|
|
|
|
|
Total Exchange-Traded or Centrally Cleared |
|
|
|
|
|
|
|
|
|
|
|
|
|
|
|
|
|
|
|
| |
|
|
|
|
|
|
|
|
|
|
|
|
|
|
|
|
| |
|
|
|
|
|
|
|
|
|
|
|
|
|
|
|
|
|
|
| |
|
|
|
|
|
|
|
|
|
|
|
|
|
|
|
Cash of $3,392 has been pledged as collateral for exchange-traded and centrally cleared financial derivative instruments as of June 30, 2025. See Note 8, Master Netting Arrangements, in the Notes to Financial Statements for more information.
|
This instrument has a forward starting effective date. See Note 2, Securities Transactions and Investment Income, in the Notes to Financial Statements for further information. |
|
Unsettled variation margin asset of $5 for closed futures is outstanding at period end. |
(m) FINANCIAL DERIVATIVE INSTRUMENTS: OVER THE COUNTER
FORWARD FOREIGN CURRENCY CONTRACTS:
|
|
|
|
|
|
|
|
|
|
|
|
|
|
|
|
|
|
|
|
| |
|
|
|
|
|
|
|
|
|
|
Unrealized Appreciation/
(Depreciation) |
|
| |
|
|
|
|
| |
|
|
07/2025 |
|
|
$ |
|
10 |
|
AUD |
|
|
16 |
|
|
$ 0 |
|
$ |
0 |
|
|
| |
|
07/2025 |
|
|
| |
2,786 |
|
EUR |
|
|
2,379 |
|
|
17 |
|
|
0 |
|
|
| |
|
08/2025 |
|
|
AUD |
|
16 |
|
$ |
|
|
10 |
|
|
0 |
|
|
0 |
|
|
| |
|
08/2025 |
|
|
EUR |
|
2,379 |
|
| |
|
2,792 |
|
|
0 |
|
|
(17 |
) |
|
|
|
|
|
|
|
| |
| |
|
|
07/2025 |
|
|
DOP |
|
1,250 |
|
| |
|
21 |
|
|
0 |
|
|
0 |
|
|
| |
|
07/2025 |
|
|
EUR |
|
11,593 |
|
| |
|
13,182 |
|
|
0 |
|
|
(474 |
) |
|
| |
|
08/2025 |
|
|
DOP |
|
539 |
|
| |
|
9 |
|
|
0 |
|
|
0 |
|
|
|
|
|
|
|
|
| |
| |
|
|
07/2025 |
|
|
$ |
|
177 |
|
EUR |
|
|
156 |
|
|
7 |
|
|
0 |
|
|
| |
|
08/2025 |
|
|
TRY |
|
671 |
|
$ |
|
|
16 |
|
|
0 |
|
|
0 |
|
|
|
|
|
|
|
|
| |
| |
|
|
07/2025 |
|
|
EUR |
|
1,020 |
|
| |
|
1,158 |
|
|
0 |
|
|
(43 |
) |
|
| |
|
07/2025 |
|
|
TRY |
|
5,342 |
|
| |
|
131 |
|
|
0 |
|
|
(2 |
) |
|
| |
|
07/2025 |
|
|
$ |
|
748 |
|
EUR |
|
|
654 |
|
|
22 |
|
|
0 |
|
|
| |
|
07/2025 |
|
|
| |
1,734 |
|
GBP |
|
|
1,276 |
|
|
17 |
|
|
0 |
|
|
| |
|
07/2025 |
|
|
| |
452 |
|
TRY |
|
|
18,333 |
|
|
8 |
|
|
0 |
|
|
| |
|
08/2025 |
|
|
GBP |
|
1,084 |
|
$ |
|
|
1,475 |
|
|
0 |
|
|
(13 |
) |
|
| |
|
08/2025 |
|
|
$ |
|
838 |
|
TRY |
|
|
34,879 |
|
|
8 |
|
|
0 |
|
|
|
|
|
|
|
|
| |
| |
|
|
07/2025 |
|
|
EUR |
|
292 |
|
$ |
|
|
336 |
|
|
0 |
|
|
(9 |
) |
|
|
|
|
|
|
|
|
|
|
|
|
| |
| See Accompanying Notes |
|
|
ANNUAL REPORT |
|
|
| |
|
|
JUNE 30, 2025 |
|
|
47 |
|
|
|
|
|
|
| |
|
|
PIMCO Global StocksPLUS & Income Fund |
|
|
|
|
|
|
|
|
|
|
|
|
|
|
|
|
|
|
|
|
|
|
|
|
| |
| Counterparty |
|
Settlement
Month |
|
|
Currency to
be Delivered |
|
Currency to
be Received |
|
|
Unrealized Appreciation/
(Depreciation) |
|
| |
Asset |
|
Liability |
|
|
| |
|
07/2025 |
|
|
$ |
|
1,033 |
|
EUR |
|
|
892 |
|
|
$ 18 |
|
$ |
0 |
|
|
| |
|
07/2025 |
|
|
| |
95 |
|
GBP |
|
|
70 |
|
|
1 |
|
|
0 |
|
|
|
|
|
|
|
|
| |
| |
|
|
07/2025 |
|
|
| |
13,340 |
|
EUR |
|
|
11,499 |
|
|
205 |
|
|
0 |
|
|
| |
|
08/2025 |
|
|
EUR |
|
11,474 |
|
$ |
|
|
13,340 |
|
|
0 |
|
|
(205 |
) |
|
|
|
|
|
|
|
| |
| |
|
|
07/2025 |
|
|
AUD |
|
16 |
|
| |
|
10 |
|
|
0 |
|
|
0 |
|
|
| |
|
07/2025 |
|
|
BRL |
|
523 |
|
| |
|
95 |
|
|
0 |
|
|
(2 |
) |
|
| |
|
07/2025 |
|
|
CHF |
|
109 |
|
| |
|
132 |
|
|
0 |
|
|
(5 |
) |
|
| |
|
07/2025 |
|
|
JPY |
|
40,606 |
|
| |
|
283 |
|
|
1 |
|
|
0 |
|
|
| |
|
07/2025 |
|
|
$ |
|
92 |
|
BRL |
|
|
524 |
|
|
5 |
|
|
0 |
|
|
| |
|
07/2025 |
|
|
| |
135 |
|
CHF |
|
|
108 |
|
|
1 |
|
|
0 |
|
|
| |
|
08/2025 |
|
|
CHF |
|
108 |
|
$ |
|
|
135 |
|
|
0 |
|
|
(1 |
) |
|
| |
|
09/2025 |
|
|
$ |
|
95 |
|
BRL |
|
|
532 |
|
|
2 |
|
|
0 |
|
|
|
|
|
|
|
|
| |
| |
|
|
08/2025 |
|
|
DOP |
|
23,829 |
|
$ |
|
|
372 |
|
|
0 |
|
|
(22 |
) |
|
| |
|
09/2025 |
|
|
| |
6,321 |
|
| |
|
100 |
|
|
1 |
|
|
(4 |
) |
|
| |
|
11/2025 |
|
|
| |
2,294 |
|
| |
|
38 |
|
|
1 |
|
|
0 |
|
|
|
|
|
|
|
|
| |
| |
|
|
08/2025 |
|
|
$ |
|
485 |
|
EUR |
|
|
413 |
|
|
2 |
|
|
0 |
|
|
|
|
|
|
|
|
| |
| |
|
|
07/2025 |
|
|
CAD |
|
58 |
|
$ |
|
|
42 |
|
|
0 |
|
|
0 |
|
|
| |
|
07/2025 |
|
|
EUR |
|
2,554 |
|
| |
|
2,964 |
|
|
0 |
|
|
(44 |
) |
|
| |
|
07/2025 |
|
|
HKD |
|
6,208 |
|
| |
|
794 |
|
|
2 |
|
|
0 |
|
|
| |
|
07/2025 |
|
|
JPY |
|
2,454 |
|
| |
|
17 |
|
|
0 |
|
|
0 |
|
|
| |
|
07/2025 |
|
|
$ |
|
42 |
|
CAD |
|
|
58 |
|
|
0 |
|
|
0 |
|
|
| |
|
07/2025 |
|
|
| |
334 |
|
EUR |
|
|
292 |
|
|
10 |
|
|
0 |
|
|
| |
|
07/2025 |
|
|
| |
137 |
|
JPY |
|
|
20,000 |
|
|
2 |
|
|
0 |
|
|
| |
|
08/2025 |
|
|
CAD |
|
58 |
|
$ |
|
|
42 |
|
|
0 |
|
|
(1 |
) |
|
| |
|
08/2025 |
|
|
$ |
|
1,513 |
|
EUR |
|
|
1,287 |
|
|
7 |
|
|
0 |
|
|
|
|
|
|
|
|
| |
| |
|
|
07/2025 |
|
|
JPY |
|
917 |
|
$ |
|
|
6 |
|
|
0 |
|
|
0 |
|
|
|
|
|
|
|
|
| |
| |
|
|
08/2025 |
|
|
$ |
|
367 |
|
TRY |
|
|
15,328 |
|
|
4 |
|
|
0 |
|
|
|
|
|
|
|
|
| |
| |
|
|
07/2025 |
|
|
| |
312 |
|
JPY |
|
|
44,400 |
|
|
0 |
|
|
(4 |
) |
|
|
|
|
|
|
|
| |
| |
|
|
07/2025 |
|
|
JPY |
|
19,547 |
|
$ |
|
|
135 |
|
|
0 |
|
|
0 |
|
|
| |
|
08/2025 |
|
|
$ |
|
135 |
|
JPY |
|
|
19,475 |
|
|
0 |
|
|
0 |
|
|
|
|
|
|
|
|
| |
| |
|
|
07/2025 |
|
|
GBP |
|
1,346 |
|
$ |
|
|
1,824 |
|
|
0 |
|
|
(24 |
) |
|
| |
|
08/2025 |
|
|
$ |
|
96 |
|
GBP |
|
|
70 |
|
|
0 |
|
|
0 |
|
|
| |
|
|
| |
| |
| |
| |
|
|
| |
|
|
|
|
|
Total Forward Foreign Currency Contracts |
|
|
|
|
|
|
|
|
|
| |
|
|
|
|
|
SWAP AGREEMENTS:
CREDIT DEFAULT SWAPS ON ASSET-BACKED SECURITIES - SELL PROTECTION
(1)
|
|
|
|
|
|
|
|
|
|
|
|
|
|
|
|
|
|
|
|
|
|
|
|
|
|
|
|
|
|
|
|
|
|
|
|
| |
| Counterparty |
|
Reference Obligation |
|
Fixed
Receive Rate |
|
|
Payment
Frequency |
|
Maturity
Date |
|
|
|
|
|
Premiums
Paid/(Received) |
|
|
Unrealized
Appreciation/
(Depreciation) |
|
|
Swap Agreements, at Value (4) |
|
| |
|
|
|
|
|
BOA |
|
Long Beach Mortgage Loan Trust 6.584% due 07/25/2033 |
|
|
6.250% |
|
|
Monthly |
|
|
07/25/2033 |
|
|
$ |
|
|
|
|
77 |
|
|
$ |
0 |
|
|
$ |
0 |
|
|
$ |
0 |
|
|
$ |
0 |
|
|
| |
|
|
| |
| |
|
|
| |
|
|
| |
|
|
| |
|
|
|
|
|
|
|
|
|
|
|
|
|
|
|
CREDIT DEFAULT SWAPS ON CORPORATE ISSUES - SELL PROTECTION
(1)
|
|
|
|
|
|
|
|
|
|
|
|
|
|
|
|
|
|
|
|
|
|
|
|
|
|
|
|
|
|
|
|
|
|
|
|
|
|
|
|
|
|
| |
| Counterparty |
|
Reference Entity |
|
Fixed
Receive Rate |
|
|
Payment
Frequency |
|
|
Maturity
Date |
|
|
Implied Credit Spread at June 30, 2025 (2) |
|
|
|
|
|
Premiums
Paid/(Received) |
|
|
Unrealized
Appreciation/
(Depreciation) |
|
|
Swap Agreements, at Value (4) |
|
| |
|
|
|
|
|
DUB |
|
|
|
|
4.650 |
% |
|
|
Quarterly |
|
|
|
06/30/2029 |
|
|
|
|
|
|
$ |
|
|
|
|
400 |
|
|
$ |
0 |
|
|
$ |
24 |
|
|
$ |
24 |
|
|
$ |
0 |
|
|
|
|
|
|
|
|
|
|
|
|
| |
GST |
|
|
|
|
1.000 |
|
|
|
Quarterly |
|
|
|
06/20/2026 |
|
|
|
1.490 |
% |
|
|
|
| |
|
500 |
|
|
|
(4 |
) |
|
|
2 |
|
|
|
0 |
|
|
|
(2 |
) |
|
|
|
|
|
|
|
|
|
|
|
| |
MYC |
|
|
|
|
1.000 |
|
|
|
Quarterly |
|
|
|
12/20/2028 |
|
|
|
3.804 |
|
|
|
|
| |
|
100 |
|
|
|
(19 |
) |
|
|
10 |
|
|
|
0 |
|
|
|
(9 |
) |
|
| |
| |
|
|
| |
|
|
| |
|
|
| |
|
|
| |
|
|
| |
|
|
| |
|
|
|
|
|
|
|
|
|
|
|
|
|
|
|
|
| |
|
|
| |
|
|
| |
|
|
| |
|
|
| |
$ |
(23 |
) |
|
$ |
36 |
|
|
$ |
24 |
|
|
$ |
(11 |
) |
|
|
| |
|
|
|
|
|
|
|
|
|
|
|
|
|
|
|
CREDIT DEFAULT SWAPS ON CREDIT INDEXES - SELL PROTECTION
(1)
|
|
|
|
|
|
|
|
|
|
|
|
|
|
|
|
|
|
|
|
|
|
|
|
|
|
|
|
|
|
|
|
|
|
|
|
| |
| Counterparty |
|
Index/Tranches |
|
Fixed
Receive Rate |
|
|
Payment
Frequency |
|
Maturity
Date |
|
|
|
|
|
Premiums
Paid/(Received) |
|
|
Unrealized
Appreciation/
(Depreciation) |
|
|
Swap Agreements, at Value (4) |
|
| |
|
|
|
|
|
GST |
|
|
|
|
0.320 |
% |
|
Monthly |
|
|
07/25/2045 |
|
|
$ |
|
|
|
|
624 |
|
|
$ |
(124 |
) |
|
$ |
78 |
|
|
$ |
0 |
|
|
$ |
(46 |
) |
|
| |
ABX.HE.PENAAA.7-1 Index « |
|
|
0.090 |
|
|
Monthly |
|
|
08/25/2037 |
|
|
|
|
| |
|
387 |
|
|
|
(434 |
) |
|
|
427 |
|
|
|
0 |
|
|
|
(7 |
) |
|
| |
| |
|
|
| |
| |
|
|
| |
|
|
| |
|
|
| |
|
|
|
|
|
|
|
|
|
|
|
|
|
|
|
|
| |
|
|
| |
| |
|
|
| |
|
|
| |
|
|
| |
$ |
(558 |
) |
|
$ |
505 |
|
|
$ |
0 |
|
|
$ |
(53 |
) |
|
| |
|
|
| |
| |
|
|
| |
|
|
| |
|
|
| |
|
|
|
|
|
|
|
|
|
|
|
|
|
|
|
TOTAL RETURN SWAPS ON INDEXES
|
|
|
|
|
|
|
|
|
|
|
|
|
|
|
|
|
|
|
|
|
|
|
|
|
|
|
|
|
|
|
|
|
|
| |
|
|
|
|
|
|
|
|
|
|
|
|
|
|
|
|
|
|
|
|
|
Unrealized
Appreciation/
(Depreciation) |
|
|
|
|
| |
|
|
|
|
|
| |
|
|
|
|
|
|
30 |
|
|
4.680% (FEDL01 plus a specified spread) |
|
Monthly |
|
11/03/2025 |
|
$ |
290 |
|
|
$ |
0 |
|
|
$ |
(1 |
) |
|
$ |
0 |
|
|
$ |
(1 |
) |
|
|
|
|
|
|
|
|
|
|
|
| |
| |
|
|
|
|
|
|
124 |
|
|
4.430% (FEDL01 plus a specified spread) |
|
Monthly |
|
07/02/2025 |
|
|
1,171 |
|
|
|
0 |
|
|
|
22 |
|
|
|
22 |
|
|
|
0 |
|
|
|
|
|
|
|
|
|
|
|
|
| |
| |
|
|
|
|
|
|
4,588 |
|
|
4.840% (FEDL01 plus a specified spread) |
|
Maturity |
|
01/21/2026 |
|
|
37,089 |
|
|
|
0 |
|
|
|
6,077 |
|
|
|
6,077 |
|
|
|
0 |
|
|
|
|
|
|
|
|
|
|
|
|
| |
|
| |
|
|
|
|
|
62 |
|
|
|
|
Monthly |
|
06/03/2026 |
|
|
599 |
|
|
|
0 |
|
|
|
0 |
|
|
|
0 |
|
|
|
0 |
|
|
|
|
|
|
|
|
|
|
|
|
| |
| |
|
|
|
|
|
|
39 |
|
|
|
|
Monthly |
|
11/05/2025 |
|
|
376 |
|
|
|
0 |
|
|
|
(1 |
) |
|
|
0 |
|
|
|
(1 |
) |
|
|
|
|
|
|
|
|
|
|
|
| |
|
| |
|
|
|
|
|
40 |
|
|
|
|
Monthly |
|
05/06/2026 |
|
|
386 |
|
|
|
0 |
|
|
|
(2 |
) |
|
|
0 |
|
|
|
(2 |
) |
|
| |
| |
| |
|
|
| |
| |
| |
| |
|
|
| |
|
|
|
|
|
|
|
|
|
|
|
|
|
|
|
|
| |
| |
| |
|
|
| |
| |
| |
|
|
| |
$ |
0 |
|
|
$ |
6,095 |
|
|
$ |
6,099 |
|
|
$ |
(4 |
) |
|
| |
| |
| |
|
|
| |
| |
| |
|
|
| |
|
|
|
|
|
|
|
|
|
|
|
|
|
|
|
| |
|
|
|
|
|
|
|
|
|
|
|
|
|
|
|
|
|
|
|
| |
|
|
|
|
|
|
|
|
|
|
|
|
|
|
|
FINANCIAL DERIVATIVE INSTRUMENTS: OVER THE COUNTER SUMMARY
The following is a summary by counterparty of the market value of OTC financial derivative instruments and collateral pledged/(received) as of June 30, 2025:
|
|
|
|
|
|
|
|
|
|
|
|
|
|
|
|
|
|
|
|
|
|
|
|
|
|
|
|
|
|
|
|
|
|
|
|
|
|
|
|
|
|
|
|
|
|
|
|
| |
| |
|
Financial Derivative Assets |
|
|
|
|
|
Financial Derivative Liabilities |
|
|
|
|
|
|
|
|
|
|
|
|
Forward
Foreign
Currency
Contracts |
|
|
|
|
|
|
|
|
|
|
|
|
|
|
Forward
Foreign
Currency
Contracts |
|
|
|
|
|
|
|
|
|
|
|
Net Market
Value of OTC
Derivatives |
|
|
Collateral
Pledged/
(Received) |
|
|
|
|
| |
|
$ |
17 |
|
|
$ |
0 |
|
|
$ |
0 |
|
|
$ |
17 |
|
|
|
|
| |
$ |
(17 |
) |
|
$ |
0 |
|
|
$ |
0 |
|
|
$ |
(17 |
) |
|
$ |
0 |
|
|
$ |
0 |
|
|
$ |
0 |
|
| |
|
|
0 |
|
|
|
0 |
|
|
|
0 |
|
|
|
0 |
|
|
|
|
| |
|
(474 |
) |
|
|
0 |
|
|
|
0 |
|
|
|
(474 |
) |
|
|
(474 |
) |
|
|
262 |
|
|
|
(212 |
) |
| |
|
|
7 |
|
|
|
0 |
|
|
|
0 |
|
|
|
7 |
|
|
|
|
| |
|
0 |
|
|
|
0 |
|
|
|
0 |
|
|
|
0 |
|
|
|
7 |
|
|
|
0 |
|
|
|
7 |
|
| |
|
|
55 |
|
|
|
0 |
|
|
|
0 |
|
|
|
55 |
|
|
|
|
| |
|
(58 |
) |
|
|
0 |
|
|
|
0 |
|
|
|
(58 |
) |
|
|
(3 |
) |
|
|
0 |
|
|
|
(3 |
) |
| |
|
|
19 |
|
|
|
0 |
|
|
|
0 |
|
|
|
19 |
|
|
|
|
| |
|
(9 |
) |
|
|
0 |
|
|
|
0 |
|
|
|
(9 |
) |
|
|
10 |
|
|
|
0 |
|
|
|
10 |
|
| |
|
|
205 |
|
|
|
0 |
|
|
|
24 |
|
|
|
229 |
|
|
|
|
| |
|
(205 |
) |
|
|
0 |
|
|
|
0 |
|
|
|
(205 |
) |
|
|
24 |
|
|
|
0 |
|
|
|
24 |
|
| |
|
|
9 |
|
|
|
0 |
|
|
|
0 |
|
|
|
9 |
|
|
|
|
| |
|
(8 |
) |
|
|
0 |
|
|
|
0 |
|
|
|
(8 |
) |
|
|
1 |
|
|
|
0 |
|
|
|
1 |
|
| |
|
|
2 |
|
|
|
0 |
|
|
|
0 |
|
|
|
2 |
|
|
|
|
| |
|
(26 |
) |
|
|
0 |
|
|
|
0 |
|
|
|
(26 |
) |
|
|
(24 |
) |
|
|
0 |
|
|
|
(24 |
) |
| |
|
|
0 |
|
|
|
0 |
|
|
|
0 |
|
|
|
0 |
|
|
|
|
| |
|
0 |
|
|
|
0 |
|
|
|
(56 |
) |
|
|
(56 |
) |
|
|
(56 |
) |
|
|
258 |
|
|
|
202 |
|
| |
|
|
2 |
|
|
|
0 |
|
|
|
22 |
|
|
|
24 |
|
|
|
|
| |
|
0 |
|
|
|
0 |
|
|
|
0 |
|
|
|
0 |
|
|
|
24 |
|
|
|
0 |
|
|
|
24 |
|
| |
|
|
21 |
|
|
|
0 |
|
|
|
0 |
|
|
|
21 |
|
|
|
|
| |
|
(45 |
) |
|
|
0 |
|
|
|
0 |
|
|
|
(45 |
) |
|
|
(24 |
) |
|
|
0 |
|
|
|
(24 |
) |
| |
|
|
0 |
|
|
|
0 |
|
|
|
0 |
|
|
|
0 |
|
|
|
|
| |
|
0 |
|
|
|
0 |
|
|
|
(9 |
) |
|
|
(9 |
) |
|
|
(9 |
) |
|
|
0 |
|
|
|
(9 |
) |
| |
|
|
0 |
|
|
|
0 |
|
|
|
6,077 |
|
|
|
6,077 |
|
|
|
|
| |
|
0 |
|
|
|
0 |
|
|
|
0 |
|
|
|
0 |
|
|
|
6,077 |
|
|
|
(6,070 |
) |
|
|
7 |
|
| |
|
|
4 |
|
|
|
0 |
|
|
|
0 |
|
|
|
4 |
|
|
|
|
| |
|
0 |
|
|
|
0 |
|
|
|
0 |
|
|
|
0 |
|
|
|
4 |
|
|
|
0 |
|
|
|
4 |
|
| |
|
|
0 |
|
|
|
0 |
|
|
|
0 |
|
|
|
0 |
|
|
|
|
| |
|
(4 |
) |
|
|
0 |
|
|
|
0 |
|
|
|
(4 |
) |
|
|
(4 |
) |
|
|
0 |
|
|
|
(4 |
) |
| |
|
|
0 |
|
|
|
0 |
|
|
|
0 |
|
|
|
0 |
|
|
|
|
| |
|
(24 |
) |
|
|
0 |
|
|
|
0 |
|
|
|
(24 |
) |
|
|
(24 |
) |
|
|
0 |
|
|
|
(24 |
) |
| |
|
|
0 |
|
|
|
0 |
|
|
|
0 |
|
|
|
0 |
|
|
|
|
| |
|
0 |
|
|
|
0 |
|
|
|
(3 |
) |
|
|
(3 |
) |
|
|
(3 |
) |
|
|
0 |
|
|
|
(3 |
) |
|
| |
|
|
|
|
|
|
|
|
|
|
|
|
|
|
|
|
|
|
| |
|
|
|
|
|
|
|
|
|
|
|
|
|
|
|
|
|
|
| |
|
|
| |
|
| |
| |
|
|
|
|
|
|
|
|
|
|
|
|
|
|
|
|
|
|
|
| |
|
|
|
|
|
|
|
|
|
|
|
|
|
|
|
|
|
|
| |
|
|
| |
|
| |
|
| |
|
|
|
|
|
|
|
|
|
|
|
|
|
|
|
|
|
|
| |
|
|
|
|
|
|
|
|
|
|
|
|
|
|
|
|
|
|
| |
|
|
| |
|
| |
|
Securities with an aggregate market value of $520 have been pledged as collateral for financial derivative instruments as governed by International Swaps and Derivatives Association, Inc. master agreements as of June 30, 2025. |
|
Implied credit spread is not available due to significant unobservable inputs being used in the fair valuation. |
|
If the Fund is a seller of protection and a credit event occurs, as defined under the terms of that particular swap agreement, the Fund will either (i) pay to the buyer of protection an amount equal to the notional amount of the swap and take delivery of the referenced obligation or underlying securities comprising the referenced index or (ii) pay a net settlement amount in the form of cash, securities or other deliverable obligations equal to the notional amount of the swap less the recovery value of the referenced obligation or underlying securities comprising the referenced index. |
|
Implied credit spreads, represented in absolute terms, utilized in determining the market value of credit default swap agreements on corporate issues as of period end serve as indicators of the current status of the payment/performance risk and represent the likelihood or risk of default for the credit derivative. The implied credit spread of a particular referenced entity reflects the cost of buying/selling protection and may include upfront payments required to be made to enter into the agreement. Wider credit spreads represent a deterioration of the referenced entity’s credit soundness and a greater likelihood or risk of default or other credit event occurring as defined under the terms of the agreement. |
|
The maximum potential amount the Fund could be required to pay as a seller of credit protection or receive as a buyer of credit protection if a credit event occurs as defined under the terms of that particular swap agreement. |
|
The prices and resulting values for credit default swap agreements serve as indicators of the current status of the payment/performance risk and represent the likelihood of an expected liability (or profit) for the credit derivative should the notional amount of the swap agreement be closed/sold as of the period end. Increasing market values, in absolute terms when compared to the notional amount of the swap, represent a deterioration of the underlying referenced instrument’s credit soundness and a greater likelihood or risk of default or other credit event occurring as defined under the terms of the agreement. |
|
|
|
|
|
|
|
|
|
|
|
|
| |
| See Accompanying Notes |
|
|
ANNUAL REPORT |
|
|
| |
|
|
JUNE 30, 2025 |
|
|
49 |
|
|
|
|
|
|
| |
|
|
PIMCO Global StocksPLUS & Income Fund |
|
|
|
|
|
Receive represents that the Fund receives payments for any positive net return on the underlying reference. The Fund makes payments for any negative net return on such underlying reference. Pay represents that the Fund receives payments for any negative net return on the underlying reference. The Fund makes payments for any positive net return on such underlying reference. |
|
Net Exposure represents the net receivable/(payable) that would be due from/to the counterparty in the event of default. Exposure from OTC financial derivative instruments can only be netted across transactions governed under the same master agreement with the same legal entity. See Note 8, Master Netting Arrangements, in the Notes to Financial Statements for more information. |
FAIR VALUE OF FINANCIAL DERIVATIVE INSTRUMENTS
The following is a summary of the fair valuation of the Fund’s derivative instruments categorized by risk exposure. See Note 7, Principal and Other Risks, in the Notes to Financial Statements on risks of the Fund.
Fair Values of Financial Derivative Instruments on the Statements of Assets and Liabilities as of June 30, 2025:
|
|
|
|
|
|
|
|
|
|
|
|
|
|
|
|
|
|
|
|
|
|
|
|
| |
| |
|
Derivatives not accounted for as hedging instruments |
|
| |
|
|
|
|
|
|
|
|
|
|
|
|
|
|
|
|
|
|
Financial Derivative Instruments - Assets |
|
Exchange-traded or centrally cleared |
|
| |
|
$ |
0 |
|
|
$ |
0 |
|
|
$ |
41 |
|
|
$ |
0 |
|
|
$ |
0 |
|
|
$ |
41 |
|
| |
|
|
0 |
|
|
|
0 |
|
|
|
232 |
|
|
|
0 |
|
|
|
0 |
|
|
|
232 |
|
| |
|
|
0 |
|
|
|
0 |
|
|
|
0 |
|
|
|
0 |
|
|
|
75 |
|
|
|
75 |
|
|
| |
|
|
|
|
|
|
|
|
|
|
|
|
|
|
|
|
|
|
|
|
|
|
|
|
| |
$ |
0 |
|
|
$ |
0 |
|
|
$ |
273 |
|
|
$ |
0 |
|
|
$ |
75 |
|
|
$ |
348 |
|
|
| |
|
|
|
|
|
|
|
|
|
|
|
|
|
|
|
|
|
|
|
|
|
|
|
| |
|
Forward Foreign Currency Contracts |
|
$ |
0 |
|
|
$ |
0 |
|
|
$ |
0 |
|
|
$ |
341 |
|
|
$ |
0 |
|
|
$ |
341 |
|
| |
|
|
0 |
|
|
|
24 |
|
|
|
6,099 |
|
|
|
0 |
|
|
|
0 |
|
|
|
6,123 |
|
|
| |
|
|
|
|
|
|
|
|
|
|
|
|
|
|
|
|
|
|
|
|
|
|
|
|
| |
$ |
0 |
|
|
$ |
24 |
|
|
$ |
6,099 |
|
|
$ |
341 |
|
|
$ |
0 |
|
|
$ |
6,464 |
|
|
| |
|
|
|
|
|
|
|
|
|
|
|
|
|
|
|
|
|
|
|
|
|
|
|
|
| |
$ |
0 |
|
|
$ |
24 |
|
|
$ |
6,372 |
|
|
$ |
341 |
|
|
$ |
75 |
|
|
$ |
6,812 |
|
|
| |
|
|
|
|
|
|
|
|
|
|
|
|
|
|
|
|
|
|
|
|
|
|
|
|
Financial Derivative Instruments - Liabilities |
|
Exchange-traded or centrally cleared |
|
| |
|
$ |
0 |
|
|
$ |
0 |
|
|
$ |
1,484 |
|
|
$ |
0 |
|
|
$ |
0 |
|
|
$ |
1,484 |
|
| |
|
|
0 |
|
|
|
0 |
|
|
|
0 |
|
|
|
0 |
|
|
|
94 |
|
|
|
94 |
|
|
| |
|
|
|
|
|
|
|
|
|
|
|
|
|
|
|
|
|
|
|
|
|
|
|
|
| |
$ |
0 |
|
|
$ |
0 |
|
|
$ |
1,484 |
|
|
$ |
0 |
|
|
$ |
94 |
|
|
$ |
1,578 |
|
|
| |
|
|
|
|
|
|
|
|
|
|
|
|
|
|
|
|
|
|
|
|
|
|
|
| |
|
Forward Foreign Currency Contracts |
|
$ |
0 |
|
|
$ |
0 |
|
|
$ |
0 |
|
|
$ |
870 |
|
|
$ |
0 |
|
|
$ |
870 |
|
| |
|
|
0 |
|
|
|
64 |
|
|
|
4 |
|
|
|
0 |
|
|
|
0 |
|
|
|
68 |
|
|
| |
|
|
|
|
|
|
|
|
|
|
|
|
|
|
|
|
|
|
|
|
|
|
|
|
| |
$ |
0 |
|
|
$ |
64 |
|
|
$ |
4 |
|
|
$ |
870 |
|
|
$ |
0 |
|
|
$ |
938 |
|
|
| |
|
|
|
|
|
|
|
|
|
|
|
|
|
|
|
|
|
|
|
|
|
|
|
|
| |
$ |
0 |
|
|
$ |
64 |
|
|
$ |
1,488 |
|
|
$ |
870 |
|
|
$ |
94 |
|
|
$ |
2,516 |
|
|
| |
|
|
|
|
|
|
|
|
|
|
|
|
|
|
|
|
|
|
|
|
|
|
|
The effect of Financial Derivative Instruments on the Statements of Operations for the period ended June 30, 2025:
|
|
|
|
|
|
|
|
|
|
|
|
|
|
|
|
|
|
|
|
|
|
|
|
| |
| |
|
Derivatives not accounted for as hedging instruments |
|
| |
|
|
|
|
|
|
|
|
|
|
|
|
|
|
|
|
|
|
Net Realized Gain (Loss) on Financial Derivative Instruments |
|
Exchange-traded or centrally cleared |
|
| |
|
$ |
0 |
|
|
$ |
0 |
|
|
$ |
(1,192 |
) |
|
$ |
0 |
|
|
$ |
0 |
|
|
$ |
(1,192 |
) |
| |
|
|
0 |
|
|
|
0 |
|
|
|
7 |
|
|
|
0 |
|
|
|
0 |
|
|
|
7 |
|
| |
|
|
0 |
|
|
|
0 |
|
|
|
2,704 |
|
|
|
0 |
|
|
|
40 |
|
|
|
2,744 |
|
| |
|
|
0 |
|
|
|
9 |
|
|
|
0 |
|
|
|
0 |
|
|
|
251 |
|
|
|
260 |
|
|
| |
|
|
|
|
|
|
|
|
|
|
|
|
|
|
|
|
|
|
|
|
|
|
|
|
| |
$ |
0 |
|
|
$ |
9 |
|
|
$ |
1,519 |
|
|
$ |
0 |
|
|
$ |
291 |
|
|
$ |
1,819 |
|
|
| |
|
|
|
|
|
|
|
|
|
|
|
|
|
|
|
|
|
|
|
|
|
|
|
| |
|
Forward Foreign Currency Contracts |
|
$ |
0 |
|
|
$ |
0 |
|
|
$ |
0 |
|
|
$ |
(171 |
) |
|
$ |
0 |
|
|
$ |
(171 |
) |
| |
|
|
0 |
|
|
|
(40 |
) |
|
|
2,683 |
|
|
|
0 |
|
|
|
0 |
|
|
|
2,643 |
|
|
| |
|
|
|
|
|
|
|
|
|
|
|
|
|
|
|
|
|
|
|
|
|
|
|
|
| |
$ |
0 |
|
|
$ |
(40 |
) |
|
$ |
2,683 |
|
|
$ |
(171 |
) |
|
$ |
0 |
|
|
$ |
2,472 |
|
|
| |
|
|
|
|
|
|
|
|
|
|
|
|
|
|
|
|
|
|
|
|
|
|
|
|
| |
$ |
0 |
|
|
$ |
(31 |
) |
|
$ |
4,202 |
|
|
$ |
(171 |
) |
|
$ |
291 |
|
|
$ |
4,291 |
|
|
| |
|
|
|
|
|
|
|
|
|
|
|
|
|
|
|
|
|
|
|
|
|
|
|
|
|
|
|
|
|
|
|
|
|
|
|
|
|
|
|
|
|
|
|
|
|
|
|
| |
| |
|
Derivatives not accounted for as hedging instruments |
|
| |
|
Commodity
Contracts |
|
|
Credit
Contracts |
|
|
Equity
Contracts |
|
|
Foreign
Exchange
Contracts |
|
|
Interest
Rate Contracts |
|
|
Total |
|
Net Change in Unrealized Appreciation (Depreciation) on Financial Derivative Instruments |
|
Exchange-traded or centrally cleared |
|
| |
|
$ |
0 |
|
|
$ |
0 |
|
|
$ |
(248 |
) |
|
$ |
0 |
|
|
$ |
0 |
|
|
$ |
(248 |
) |
| |
|
|
0 |
|
|
|
0 |
|
|
|
(1,002 |
) |
|
|
0 |
|
|
|
0 |
|
|
|
(1,002 |
) |
| |
|
|
0 |
|
|
|
0 |
|
|
|
1,388 |
|
|
|
0 |
|
|
|
(48 |
) |
|
|
1,340 |
|
| |
|
|
0 |
|
|
|
0 |
|
|
|
0 |
|
|
|
0 |
|
|
|
597 |
|
|
|
597 |
|
|
| |
|
|
|
|
|
|
|
|
|
|
|
|
|
|
|
|
|
|
|
|
|
|
|
|
| |
$ |
0 |
|
|
$ |
0 |
|
|
$ |
138 |
|
|
$ |
0 |
|
|
$ |
549 |
|
|
$ |
687 |
|
|
| |
|
|
|
|
|
|
|
|
|
|
|
|
|
|
|
|
|
|
|
|
|
|
|
| |
|
Forward Foreign Currency Contracts |
|
$ |
0 |
|
|
$ |
0 |
|
|
$ |
0 |
|
|
$ |
(727 |
) |
|
$ |
0 |
|
|
$ |
(727 |
) |
| |
|
|
0 |
|
|
|
125 |
|
|
|
2,555 |
|
|
|
0 |
|
|
|
0 |
|
|
|
2,680 |
|
|
| |
|
|
|
|
|
|
|
|
|
|
|
|
|
|
|
|
|
|
|
|
|
|
|
|
| |
$ |
0 |
|
|
$ |
125 |
|
|
$ |
2,555 |
|
|
$ |
(727 |
) |
|
$ |
0 |
|
|
$ |
1,953 |
|
|
| |
|
|
|
|
|
|
|
|
|
|
|
|
|
|
|
|
|
|
|
|
|
|
|
|
| |
$ |
0 |
|
|
$ |
125 |
|
|
$ |
2,693 |
|
|
$ |
(727 |
) |
|
$ |
549 |
|
|
$ |
2,640 |
|
|
| |
|
|
|
|
|
|
|
|
|
|
|
|
|
|
|
|
|
|
|
|
|
|
|
FAIR VALUE MEASUREMENTS
The following is a summary of the fair valuations according to the inputs used as of June
30, 2025 in valuing the Fund’s assets and
liabilities:
|
|
|
|
|
|
|
|
|
|
|
|
|
|
|
|
| |
|
|
|
|
|
|
|
|
|
|
|
Fair
Value at
06/30/2025 |
|
Investments in Securities, at Value |
|
Loan Participations and Assignments |
|
$ |
0 |
|
|
$ |
18,391 |
|
|
$ |
6,852 |
|
|
$ |
25,243 |
|
| |
|
| |
|
|
0 |
|
|
|
8,469 |
|
|
|
7 |
|
|
|
8,476 |
|
| |
|
|
600 |
|
|
|
18,709 |
|
|
|
3,151 |
|
|
|
22,460 |
|
| |
|
|
0 |
|
|
|
4,254 |
|
|
|
0 |
|
|
|
4,254 |
|
Convertible Bonds & Notes |
|
| |
|
|
0 |
|
|
|
12 |
|
|
|
0 |
|
|
|
12 |
|
| |
|
|
0 |
|
|
|
503 |
|
|
|
0 |
|
|
|
503 |
|
| |
|
| |
|
|
0 |
|
|
|
466 |
|
|
|
0 |
|
|
|
466 |
|
| |
|
|
0 |
|
|
|
574 |
|
|
|
0 |
|
|
|
574 |
|
| |
|
|
0 |
|
|
|
805 |
|
|
|
0 |
|
|
|
805 |
|
| |
|
|
0 |
|
|
|
43,299 |
|
|
|
0 |
|
|
|
43,299 |
|
Non-Agency Mortgage-Backed Securities |
|
|
0 |
|
|
|
11,045 |
|
|
|
0 |
|
|
|
11,045 |
|
| |
|
| |
|
|
0 |
|
|
|
200 |
|
|
|
0 |
|
|
|
200 |
|
Manufacturing House Sequential |
|
|
0 |
|
|
|
177 |
|
|
|
0 |
|
|
|
177 |
|
| |
|
|
0 |
|
|
|
679 |
|
|
|
0 |
|
|
|
679 |
|
| |
|
|
0 |
|
|
|
3,965 |
|
|
|
822 |
|
|
|
4,787 |
|
| |
|
|
0 |
|
|
|
6,855 |
|
|
|
0 |
|
|
|
6,855 |
|
| |
|
| |
|
|
240 |
|
|
|
0 |
|
|
|
1,058 |
|
|
|
1,298 |
|
| |
|
|
1,051 |
|
|
|
0 |
|
|
|
1,187 |
|
|
|
2,238 |
|
| |
|
|
0 |
|
|
|
0 |
|
|
|
3,224 |
|
|
|
3,224 |
|
| |
|
|
0 |
|
|
|
0 |
|
|
|
2,187 |
|
|
|
2,187 |
|
| |
|
| |
|
|
0 |
|
|
|
0 |
|
|
|
205 |
|
|
|
205 |
|
| |
|
| |
|
|
414 |
|
|
|
1,236 |
|
|
|
0 |
|
|
|
1,650 |
|
| |
|
|
0 |
|
|
|
307 |
|
|
|
395 |
|
|
|
702 |
|
Real Estate Investment Trusts |
|
| |
|
|
141 |
|
|
|
0 |
|
|
|
0 |
|
|
|
141 |
|
|
|
|
|
|
|
|
|
|
|
|
|
|
|
|
|
| |
Category and Subcategory |
|
Level 1 |
|
|
Level 2 |
|
|
Level 3 |
|
|
Fair
Value at
06/30/2025 |
|
| |
|
| |
|
$ |
0 |
|
|
$ |
173 |
|
|
$ |
0 |
|
|
$ |
173 |
|
| |
|
|
0 |
|
|
|
555 |
|
|
|
0 |
|
|
|
555 |
|
|
| |
|
|
|
|
|
|
|
|
|
|
|
|
|
|
|
|
| |
$ |
2,446 |
|
|
$ |
120,674 |
|
|
$ |
19,088 |
|
|
$ |
142,208 |
|
|
| |
|
|
|
|
|
|
|
|
|
|
|
|
|
|
|
|
Investments in Affiliates, at Value |
|
| |
|
Central Funds Used for Cash Management Purposes |
|
$ |
10,174 |
|
|
$ |
0 |
|
|
$ |
0 |
|
|
$ |
10,174 |
|
|
| |
|
|
|
|
|
|
|
|
|
|
|
|
|
|
|
|
|
|
|
| |
| |
|
$ |
12,620 |
|
|
$ |
120,674 |
|
|
$ |
19,088 |
|
|
$ |
152,382 |
|
|
| |
|
|
|
|
|
|
|
|
|
|
|
|
|
|
|
|
Short Sales, at Value - Liabilities |
|
| |
|
$ |
0 |
|
|
$ |
(634 |
) |
|
$ |
0 |
|
|
$ |
(634 |
) |
|
| |
|
|
|
|
|
|
|
|
|
|
|
|
|
|
|
|
Financial Derivative Instruments - Assets |
|
Exchange-traded or centrally cleared |
|
|
268 |
|
|
|
75 |
|
|
|
0 |
|
|
|
343 |
|
| |
|
|
0 |
|
|
|
6,440 |
|
|
|
24 |
|
|
|
6,464 |
|
|
| |
|
|
|
|
|
|
|
|
|
|
|
|
|
|
|
|
| |
$ |
268 |
|
|
$ |
6,515 |
|
|
$ |
24 |
|
|
$ |
6,807 |
|
|
Financial Derivative Instruments - Liabilities |
|
Exchange-traded or centrally cleared |
|
|
(1,484 |
) |
|
|
(94 |
) |
|
|
0 |
|
|
|
(1,578 |
) |
| |
|
|
0 |
|
|
|
(885 |
) |
|
|
(53 |
) |
|
|
(938 |
) |
|
| |
|
|
|
|
|
|
|
|
|
|
|
|
|
|
|
|
| |
$ |
(1,484 |
) |
|
$ |
(979 |
) |
|
$ |
(53 |
) |
|
$ |
(2,516 |
) |
|
| |
|
|
|
|
|
|
|
|
|
|
|
|
|
|
|
|
|
|
|
| |
Total Financial Derivative Instruments |
|
$ |
(1,216 |
) |
|
$ |
5,536 |
|
|
$ |
(29 |
) |
|
$ |
4,291 |
|
|
| |
|
|
|
|
|
|
|
|
|
|
|
|
|
|
|
|
|
|
|
| |
| |
|
$ |
11,404 |
|
|
$ |
125,576 |
|
|
$ |
19,059 |
|
|
$ |
156,039 |
|
|
| |
|
|
|
|
|
|
|
|
|
|
|
|
|
|
|
|
|
|
|
|
|
|
|
|
|
|
|
| |
See Accompanying Notes |
|
|
|
|
|
| |
|
|
JUNE 30, 2025 |
|
|
|
|
|
|
|
|
|
| |
|
|
PIMCO Global StocksPLUS & Income Fund |
|
|
|
|
The following is a reconciliation of the fair valuations using significant unobservable inputs (Level 3) for the Fund during the period ended June 30, 2025:
|
|
|
|
|
|
|
|
|
|
|
|
|
|
|
|
|
|
|
|
|
|
|
|
|
|
|
|
|
|
|
|
|
|
|
|
|
|
|
|
| |
|
|
Beginning
Balance
at 06/30/2024 |
|
|
|
|
|
|
|
|
Accrued
Discounts/
(Premiums) |
|
|
|
|
|
Net Change in Unrealized Appreciation/ (Depreciation) (2) |
|
|
|
|
|
|
|
|
Ending
Balance
at 06/30/2025 |
|
|
Net Change in Unrealized Appreciation/ (Depreciation) on Investments Held at 06/30/2025 (2) |
|
Investments in Securities, at Value |
|
Loan Participations and Assignments |
|
$ |
8,272 |
|
|
$ |
2,715 |
|
|
$ |
(4,516 |
) |
|
$ |
16 |
|
|
$ |
206 |
|
|
$ |
2 |
|
|
$ |
157 |
|
|
$ |
0 |
|
|
$ |
6,852 |
|
|
$ |
128 |
|
| |
|
| |
|
|
1,074 |
|
|
|
6 |
|
|
|
(1,113 |
) |
|
|
0 |
|
|
|
44 |
|
|
|
(4 |
) |
|
|
0 |
|
|
|
0 |
|
|
|
7 |
|
|
|
0 |
|
| |
|
|
4,032 |
|
|
|
2,561 |
|
|
|
(3,501 |
) |
|
|
(8 |
) |
|
|
(1,100 |
) |
|
|
991 |
|
|
|
176 |
|
|
|
0 |
|
|
|
3,151 |
|
|
|
414 |
|
Non-Agency Mortgage-Backed Securities |
|
|
1,085 |
|
|
|
2 |
|
|
|
(145 |
) |
|
|
26 |
|
|
|
30 |
|
|
|
23 |
|
|
|
0 |
|
|
|
(1,021 |
) |
|
|
0 |
|
|
|
0 |
|
| |
|
|
|
| |
|
|
| |
|
|
| |
|
|
| |
|
|
| |
|
|
| |
|
|
| |
|
|
| |
|
|
| |
|
| |
| |
|
|
23 |
|
|
|
0 |
|
|
|
0 |
|
|
|
0 |
|
|
|
0 |
|
|
|
1 |
|
|
|
0 |
|
|
|
(24 |
) |
|
|
0 |
|
|
|
0 |
|
| |
|
|
16 |
|
|
|
0 |
|
|
|
(4 |
) |
|
|
2 |
|
|
|
1 |
|
|
|
(2 |
) |
|
|
0 |
|
|
|
(13 |
) |
|
|
0 |
|
|
|
0 |
|
| |
|
|
946 |
|
|
|
0 |
|
|
|
0 |
|
|
|
0 |
|
|
|
0 |
|
|
|
(124 |
) |
|
|
0 |
|
|
|
0 |
|
|
|
822 |
|
|
|
(124 |
) |
| |
|
Communication Services (3) |
|
|
897 |
|
|
|
0 |
|
|
|
0 |
|
|
|
0 |
|
|
|
0 |
|
|
|
161 |
|
|
|
0 |
|
|
|
0 |
|
|
|
1,058 |
|
|
|
160 |
|
Consumer Discretionary (4) |
|
|
70 |
|
|
|
0 |
|
|
|
(71 |
) |
|
|
0 |
|
|
|
71 |
|
|
|
(70 |
) |
|
|
0 |
|
|
|
0 |
|
|
|
0 |
|
|
|
0 |
|
| |
|
|
15 |
|
|
|
0 |
|
|
|
(16 |
) |
|
|
0 |
|
|
|
8 |
|
|
|
(7 |
) |
|
|
0 |
|
|
|
0 |
|
|
|
0 |
|
|
|
0 |
|
| |
|
|
1,278 |
|
|
|
6 |
|
|
|
0 |
|
|
|
0 |
|
|
|
0 |
|
|
|
(97 |
) |
|
|
0 |
|
|
|
0 |
|
|
|
1,187 |
|
|
|
(97 |
) |
| |
|
|
3,535 |
|
|
|
0 |
|
|
|
0 |
|
|
|
0 |
|
|
|
0 |
|
|
|
(311 |
) |
|
|
0 |
|
|
|
0 |
|
|
|
3,224 |
|
|
|
(311 |
) |
| |
|
|
535 |
|
|
|
2,512 |
|
|
|
0 |
|
|
|
0 |
|
|
|
0 |
|
|
|
(860 |
) |
|
|
0 |
|
|
|
0 |
|
|
|
2,187 |
|
|
|
(860 |
) |
| |
|
|
|
| |
|
|
| |
|
|
| |
|
|
| |
|
|
| |
|
|
| |
|
|
| |
|
|
| |
|
|
| |
|
| |
| |
|
|
0 |
|
|
|
136 |
|
|
|
0 |
|
|
|
0 |
|
|
|
0 |
|
|
|
69 |
|
|
|
0 |
|
|
|
0 |
|
|
|
205 |
|
|
|
69 |
|
| |
|
|
1 |
|
|
|
0 |
|
|
|
0 |
|
|
|
0 |
|
|
|
0 |
|
|
|
(1 |
) |
|
|
0 |
|
|
|
0 |
|
|
|
0 |
|
|
|
0 |
|
| |
|
| |
|
|
353 |
|
|
|
48 |
|
|
|
0 |
|
|
|
0 |
|
|
|
0 |
|
|
|
(6 |
) |
|
|
0 |
|
|
|
0 |
|
|
|
395 |
|
|
|
(6 |
) |
|
| |
|
|
|
|
|
|
|
|
|
|
|
|
|
|
|
|
|
|
|
|
|
|
|
|
|
|
|
|
|
|
|
|
|
|
|
|
|
|
|
|
| |
$ |
22,132 |
|
|
$ |
7,986 |
|
|
$ |
(9,366 |
) |
|
$ |
36 |
|
|
$ |
(740 |
) |
|
$ |
(235 |
) |
|
$ |
333 |
|
|
$ |
(1,058 |
) |
|
$ |
19,088 |
|
|
$ |
(627 |
) |
|
| |
|
|
|
|
|
|
|
|
|
|
|
|
|
|
|
|
|
|
|
|
|
|
|
|
|
|
|
|
|
|
|
|
|
|
|
|
|
|
|
|
Financial Derivative Instruments - Assets |
|
| |
|
$ |
31 |
|
|
$ |
0 |
|
|
$ |
0 |
|
|
$ |
0 |
|
|
$ |
0 |
|
|
$ |
(7 |
) |
|
$ |
0 |
|
|
$ |
0 |
|
|
$ |
24 |
|
|
$ |
(7 |
) |
|
| |
|
|
|
|
|
|
|
|
|
|
|
|
|
|
|
|
|
|
|
|
|
|
|
|
|
|
|
|
|
|
|
|
|
|
|
|
|
|
|
|
Financial Derivative Instruments - Liabilities |
|
| |
|
$ |
(85 |
) |
|
$ |
8 |
|
|
$ |
(133 |
) |
|
$ |
0 |
|
|
$ |
32 |
|
|
$ |
125 |
|
|
$ |
0 |
|
|
$ |
0 |
|
|
$ |
(53 |
) |
|
$ |
23 |
|
|
| |
|
|
|
|
|
|
|
|
|
|
|
|
|
|
|
|
|
|
|
|
|
|
|
|
|
|
|
|
|
|
|
|
|
|
|
|
|
|
|
|
|
|
|
|
|
|
|
|
|
| |
| |
|
$ |
22,078 |
|
|
$ |
7,994 |
|
|
$ |
(9,499 |
) |
|
$ |
36 |
|
|
$ |
(708 |
) |
|
$ |
(117 |
) |
|
$ |
333 |
|
|
$ |
(1,058 |
) |
|
$ |
19,059 |
|
|
$ |
(611 |
) |
|
| |
|
|
|
|
|
|
|
|
|
|
|
|
|
|
|
|
|
|
|
|
|
|
|
|
|
|
|
|
|
|
|
|
|
|
|
|
|
|
|
The following is a summary of significant unobservable inputs used in the fair valuations of assets and liabilities categorized within Level 3 of the fair value hierarchy:
|
|
|
|
|
|
|
|
|
|
|
|
|
|
|
|
|
|
|
|
| |
| Category and Subcategory |
|
Ending
Balance
at 06/30/2025 |
|
|
Valuation Technique |
|
Unobservable Inputs |
|
|
|
|
(% Unless Noted Otherwise) |
|
| |
|
|
|
Weighted Average |
|
Investments in Securities, at Value |
|
Loan Participations and Assignments |
|
$ |
2,281 |
|
|
Comparable Companies |
|
|
|
|
X |
|
|
|
16.470 |
|
|
|
— |
|
|
| |
|
2,605 |
|
|
Discounted Cash Flow |
|
|
|
|
|
| |
|
|
|
|
|
7.554 |
|
|
| |
|
1,003 |
|
|
Indicative Market Quotation |
|
|
|
|
|
| |
|
|
|
|
|
97.548 |
|
|
| |
|
604 |
|
|
Recent Transaction |
|
|
|
|
|
| |
|
|
|
|
|
99.661 |
|
|
| |
|
359 |
|
|
Third Party Vendor |
|
|
|
|
|
| |
|
|
|
|
|
74.123 |
|
| |
|
|
|
| |
| |
| |
|
|
| |
|
|
| |
|
| |
| |
|
|
7 |
|
|
Recent transaction price |
|
|
|
|
|
| |
|
93.500 |
|
|
|
— |
|
| |
|
|
2,976 |
|
|
Comparable Companies /
Discounted Cash Flow |
|
Revenue Multiple/Discount Rate |
|
|
X/ |
% |
|
|
0.900/10.500 |
|
|
|
— |
|
|
| |
|
175 |
|
|
Indicative Market Quotation |
|
|
|
|
|
| |
|
58.500 |
|
|
|
— |
|
| |
|
|
|
| |
| |
| |
|
|
| |
|
|
| |
|
| |
| |
|
|
822 |
|
|
Discounted Cash Flow |
|
|
|
|
|
| |
|
|
|
|
|
12.217 |
|
| |
|
|
|
| |
| |
| |
|
|
| |
|
|
| |
|
| |
| |
|
|
1,030 |
|
|
Comparable Companies |
|
|
|
|
X |
|
|
|
4.864 |
|
|
|
— |
|
|
| |
|
28 |
|
|
Reference Instrument |
|
Stock Price w/Liquidity Discount |
|
|
|
| |
|
12.000 |
|
|
|
— |
|
| |
|
|
1,185 |
|
|
Comparable Companies |
|
|
|
|
X |
|
|
|
5.200 |
|
|
|
— |
|
|
| |
|
2 |
|
|
Indicative Market Quotation |
|
|
|
|
$ |
|
|
|
4.000 |
|
|
|
— |
|
| |
|
|
3,224 |
|
|
Comparable Companies |
|
|
|
|
X |
|
|
|
16.470 |
|
|
|
— |
|
|
|
|
|
|
|
| |
52 |
|
PIMCO CLOSED-END FUNDS |
|
|
See Accompanying Notes |
|
|
|
|
|
|
|
|
|
|
|
|
|
|
|
|
|
|
|
|
|
| |
| Category and Subcategory |
|
Ending
Balance
at 06/30/2025 |
|
|
Valuation Technique |
|
Unobservable Inputs |
|
|
|
|
(% Unless Noted Otherwise) |
|
| |
Input Value(s) |
|
|
Weighted Average |
|
| |
|
$ |
1,689 |
|
|
Comparable Companies /
Discounted Cash Flow |
|
Revenue Multiple/
Discount Rate |
|
|
X/ |
% |
|
|
0.900/10.500 |
|
|
|
— |
|
|
| |
|
498 |
|
|
Indicative Market Quotation |
|
|
|
|
|
| |
|
|
|
|
|
16.647 |
|
| |
|
|
|
| |
| |
| |
|
|
| |
|
|
| |
|
| |
| |
|
|
205 |
|
|
Comparable Companies |
|
|
|
|
X |
|
|
|
4.864 |
|
|
|
— |
|
| |
|
| |
|
|
395 |
|
|
Discounted Cash Flow |
|
|
|
|
|
| |
|
15.314 |
|
|
|
— |
|
|
Financial Derivative Instruments - Assets |
|
| |
|
|
24 |
|
|
Indicative Market Quotation |
|
|
|
|
|
| |
|
5.914 |
|
|
|
— |
|
|
Financial Derivative Instruments - Liabilities |
|
| |
|
|
(53 |
) |
|
Indicative Market Quotation |
|
|
|
|
|
| |
|
|
|
|
|
93.283 |
|
|
| |
|
|
|
|
| |
| |
|
|
| |
|
|
| |
|
| |
| |
|
$ |
19,059 |
|
|
| |
| |
|
|
| |
|
|
| |
|
| |
|
| |
|
|
|
|
| |
| |
|
|
| |
|
|
| |
|
| |
|
Net Purchases and Settlements for Financial Derivative Instruments may include payments made or received upon entering into swap agreements to compensate for differences between the stated terms of the swap agreement and prevailing market conditions. |
|
Any difference between Net Change in Unrealized Appreciation/(Depreciation) and Net Change in Unrealized Appreciation/(Depreciation) on Investments Held at June 30, 2025 may be due to an investment no longer held or categorized as Level 3 at period end. |
|
Sector type updated from Utilities to Communication Services since prior fiscal year end. |
|
Sector type updated from Industrials to Consumer Discretionary since prior fiscal year end. |
|
Sector type updated from Common Stocks to Preferred Securities Industrials since prior fiscal year end. |
|
|
|
|
|
|
|
|
|
|
|
|
| |
| See Accompanying Notes |
|
|
ANNUAL REPORT |
|
|
| |
|
|
JUNE 30, 2025 |
|
|
53 |
|
|
|
|
|
|
| |
|
|
PIMCO Strategic Income Fund, Inc. |
|
|
|
|
(Amounts in thousands*, except number of shares, contracts, units and ounces, if any)
|
|
|
|
|
|
|
|
|
|
|
|
| |
| |
|
|
|
PRINCIPAL
AMOUNT
(000S) |
|
|
|
|
MARKET
VALUE
(000S) |
|
INVESTMENTS IN SECURITIES 279.0% |
|
|
| |
LOAN PARTICIPATIONS AND ASSIGNMENTS 19.4% |
|
|
| |
|
| |
|
$ |
|
|
700 |
|
|
$ |
|
|
663 |
|
|
| |
|
9.756% (TSFR3M + 5.500%) due 08/15/2028 ~ |
|
| |
|
792 |
|
|
| |
|
720 |
|
|
| |
|
7.546% (TSFR3M + 3.250%) due 07/06/2029 ~ |
|
| |
|
1,094 |
|
|
| |
|
916 |
|
|
Envision Healthcare Corp. |
|
12.235% (TSFR3M + 7.875%) due 11/03/2028 « |
|
| |
|
3,738 |
|
|
| |
|
3,851 |
|
|
| |
|
8.780% (TSFR3M + 4.500%) due 12/19/2030 ~ |
|
| |
|
1,300 |
|
|
| |
|
1,294 |
|
|
Gateway Casinos & Entertainment Ltd. |
|
10.563% (TSFR3M + 6.250%) due 12/18/2030 |
|
| |
|
1,982 |
|
|
| |
|
1,982 |
|
|
| |
|
TBD% - 10.079% (TSFR3M + 5.750%) due 06/01/2029 ~µ |
|
| |
|
165 |
|
|
| |
|
170 |
|
TBD% - 10.079% (TSFR3M + 4.750%) due 06/01/2029 ~ |
|
| |
|
1,237 |
|
|
| |
|
1,032 |
|
|
| |
|
7.441% (TSFR1M + 3.000%) due 06/30/2027 ~ |
|
| |
|
28 |
|
|
| |
|
18 |
|
|
Lealand Finance Co. BV (5.441% Cash and 3.000% PIK) |
|
8.441% (TSFR1M + 1.000%) due 12/31/2027 ~(c) |
|
| |
|
215 |
|
|
| |
|
113 |
|
|
Mercury Aggregator LP (13.500% PIK) |
|
13.500% due 04/03/2026 «(c) |
|
| |
|
578 |
|
|
| |
|
394 |
|
|
Mercury Aggregator LP (3.500% PIK) |
|
3.500% due 04/03/2026 «(c) |
|
| |
|
317 |
|
|
| |
|
216 |
|
|
| |
|
| |
|
GBP |
|
|
1,650 |
|
|
| |
|
2,261 |
|
|
| |
|
8.177% (TSFR1M + 3.750%) due 02/01/2028 ~ |
|
$ |
|
|
1,167 |
|
|
| |
|
1,033 |
|
|
| |
|
6.980% (EUR003M + 5.000%) due 03/13/2030 ~ |
|
EUR |
|
|
1,000 |
|
|
| |
|
807 |
|
|
Promotora de Informaciones SA |
|
7.594% (EUR003M + 5.470%) due 12/31/2029 ~ |
|
| |
|
5,052 |
|
|
| |
|
5,862 |
|
|
| |
|
| |
|
$ |
|
|
1,193 |
|
|
| |
|
1,193 |
|
|
Steenbok Lux Finco 2 SARL |
|
| |
|
EUR |
|
|
13,967 |
|
|
| |
|
4,741 |
|
|
Stepstone Group MidCo 2 GmbH |
|
6.673% (EUR006M + 4.500%) due 04/26/2032 ~ |
|
| |
|
2,000 |
|
|
| |
|
2,315 |
|
8.608% - 8.651% (TSFR3M + 4.500%) due 12/19/2031 |
|
$ |
|
|
300 |
|
|
| |
|
292 |
|
|
| |
|
11.296% (TSFR3M + 7.000%) due 05/13/2027 ~ |
|
| |
|
4,757 |
|
|
| |
|
4,529 |
|
|
| |
|
| |
|
| |
|
300 |
|
|
| |
|
292 |
|
10.927% (TSFR1M + 6.500%) due 10/26/2029 ~ |
|
| |
|
2,687 |
|
|
| |
|
2,629 |
|
|
| |
|
9.441% (TSFR1M + 5.000%) due 06/20/2028 ~ |
|
| |
|
3,990 |
|
|
| |
|
3,787 |
|
|
| |
|
| |
|
| |
|
2 |
|
|
| |
|
1 |
|
|
| |
| |
|
|
| |
| |
|
|
|
Total Loan Participations and Assignments
(Cost $47,750) |
|
|
|
|
|
| |
|
|
|
|
| |
CORPORATE BONDS & NOTES 48.7% |
|
|
| |
|
|
|
| |
|
6.350% due 10/23/2029 (j) |
|
| |
|
1,500 |
|
|
| |
|
1,516 |
|
|
|
|
|
|
|
|
|
|
|
|
|
| |
| |
|
|
|
PRINCIPAL
AMOUNT
(000S) |
|
|
|
|
MARKET
VALUE
(000S) |
|
|
| |
|
8.500% due 11/15/2029 (j) |
|
$ |
|
|
1,300 |
|
|
$ |
|
|
1,247 |
|
|
| |
|
6.600% due 06/10/2029 (j) |
|
| |
|
1,000 |
|
|
| |
|
1,037 |
|
|
| |
|
5.936% due 05/30/2035 •(j) |
|
| |
|
900 |
|
|
| |
|
923 |
|
6.293% due 01/14/2036 •(j) |
|
| |
|
750 |
|
|
| |
|
788 |
|
|
| |
|
7.500% due 05/30/2029 (j) |
|
| |
|
1,300 |
|
|
| |
|
1,372 |
|
|
Corestate Capital Holding SA (8.000% Cash or 9.000% PIK) |
|
8.000% due 12/31/2026 (c) |
|
EUR |
|
|
150 |
|
|
| |
|
71 |
|
|
Country Garden Holdings Co. Ltd. |
|
5.400% due 05/27/2049 ^(d) |
|
$ |
|
|
1,000 |
|
|
| |
|
77 |
|
6.150% due 09/17/2025 ^(d) |
|
| |
|
200 |
|
|
| |
|
15 |
|
|
Credit Suisse AG AT1 Claim |
|
|
| |
| |
|
600 |
|
|
| |
|
72 |
|
|
| |
|
5.950% due 04/15/2035 (j) |
|
| |
|
300 |
|
|
| |
|
302 |
|
|
| |
|
| |
|
| |
|
100 |
|
|
| |
|
95 |
|
|
| |
|
| |
|
| |
|
100 |
|
|
| |
|
89 |
|
|
F&G Annuities & Life, Inc. |
|
6.250% due 10/04/2034 (j) |
|
| |
|
400 |
|
|
| |
|
396 |
|
6.500% due 06/04/2029 (j) |
|
| |
|
700 |
|
|
| |
|
722 |
|
|
Fairfax India Holdings Corp. |
|
5.000% due 02/26/2028 (j) |
|
| |
|
2,400 |
|
|
| |
|
2,260 |
|
|
Ford Motor Credit Co. LLC |
|
5.918% due 03/20/2028 (j) |
|
| |
|
700 |
|
|
| |
|
707 |
|
6.436% due 03/20/2028 ~(j) |
|
| |
|
1,900 |
|
|
| |
|
1,873 |
|
|
Fortitude Group Holdings LLC |
|
6.250% due 04/01/2030 (j) |
|
| |
|
600 |
|
|
| |
|
618 |
|
|
HA Sustainable Infrastructure Capital, Inc. |
|
| |
|
| |
|
2,300 |
|
|
| |
|
2,330 |
|
6.375% due 07/01/2034 (j) |
|
| |
|
1,000 |
|
|
| |
|
1,001 |
|
|
Hudson Pacific Properties LP |
|
3.250% due 01/15/2030 (j) |
|
| |
|
300 |
|
|
| |
|
246 |
|
3.950% due 11/01/2027 (j) |
|
| |
|
100 |
|
|
| |
|
96 |
|
4.650% due 04/01/2029 (j) |
|
| |
|
300 |
|
|
| |
|
270 |
|
5.950% due 02/15/2028 (j) |
|
| |
|
900 |
|
|
| |
|
878 |
|
|
| |
|
7.200% due 11/28/2033 (j) |
|
| |
|
3,600 |
|
|
| |
|
4,044 |
|
|
| |
|
6.404% due 11/04/2029 (j) |
|
| |
|
900 |
|
|
| |
|
927 |
|
|
Nissan Motor Acceptance Co. LLC |
|
6.448% due 09/13/2027 ~(j) |
|
| |
|
665 |
|
|
| |
|
657 |
|
|
Sammons Financial Group, Inc. |
|
6.875% due 04/15/2034 (j) |
|
| |
|
1,000 |
|
|
| |
|
1,073 |
|
|
| |
|
| |
|
| |
|
1,900 |
|
|
| |
|
2,029 |
|
|
Stellantis Finance U.S., Inc. |
|
6.450% due 03/18/2035 (j) |
|
| |
|
1,050 |
|
|
| |
|
1,056 |
|
|
| |
|
| |
|
EUR |
|
|
5,074 |
|
|
| |
|
1,763 |
|
|
| |
|
6.000% due 01/15/2030 (j) |
|
$ |
|
|
2,738 |
|
|
| |
|
2,568 |
|
6.500% due 02/15/2029 (j) |
|
| |
|
1,700 |
|
|
| |
|
1,645 |
|
| |
|
| |
|
100 |
|
|
| |
|
101 |
|
10.500% due 02/15/2028 (j) |
|
| |
|
213 |
|
|
| |
|
226 |
|
|
| |
| |
|
|
| |
| |
|
|
|
|
| |
| |
|
|
| |
| |
|
35,090 |
|
|
| |
| |
|
|
| |
| |
|
|
|
|
| |
|
|
|
| |
|
| |
|
EUR |
|
|
1,100 |
|
|
| |
|
467 |
|
| |
|
$ |
|
|
3,000 |
|
|
| |
|
1,045 |
|
|
| |
|
| |
|
EUR |
|
|
1,100 |
|
|
| |
|
1,088 |
|
| |
|
| |
|
400 |
|
|
| |
|
396 |
|
| |
|
| |
|
500 |
|
|
| |
|
496 |
|
| |
|
$ |
|
|
400 |
|
|
| |
|
331 |
|
| |
|
| |
|
200 |
|
|
| |
|
169 |
|
| |
|
| |
|
391 |
|
|
| |
|
325 |
|
|
|
|
|
|
|
|
|
|
|
|
|
| |
| |
|
|
|
PRINCIPAL
AMOUNT
(000S) |
|
|
|
|
MARKET
VALUE
(000S) |
|
| |
|
EUR |
|
|
300 |
|
|
$ |
|
|
319 |
|
| |
|
$ |
|
|
1,400 |
|
|
| |
|
1,261 |
|
|
| |
|
6.421% due 08/02/2033 (j) |
|
| |
|
300 |
|
|
| |
|
326 |
|
|
| |
|
6.250% due 01/21/2029 (j) |
|
| |
|
200 |
|
|
| |
|
210 |
|
6.375% due 11/21/2030 (j) |
|
| |
|
400 |
|
|
| |
|
425 |
|
|
Booz Allen Hamilton, Inc. |
|
5.950% due 04/15/2035 (j) |
|
| |
|
400 |
|
|
| |
|
407 |
|
|
| |
|
5.750% due 06/20/2030 (j) |
|
GBP |
|
|
2,627 |
|
|
| |
|
3,610 |
|
|
| |
|
| |
|
$ |
|
|
1,100 |
|
|
| |
|
1,137 |
|
|
| |
|
| |
|
| |
|
50 |
|
|
| |
|
41 |
|
|
| |
|
| |
|
| |
|
50 |
|
|
| |
|
41 |
|
|
| |
|
7.507% due 01/10/2032 (j) |
|
| |
|
464 |
|
|
| |
|
487 |
|
|
| |
|
5.250% due 01/10/2031 (b) |
|
EUR |
|
|
1,000 |
|
|
| |
|
1,201 |
|
6.500% due 01/10/2031 (b) |
|
$ |
|
|
1,000 |
|
|
| |
|
1,010 |
|
|
| |
|
| |
|
| |
|
3,558 |
|
|
| |
|
3,236 |
|
| |
|
| |
|
3,000 |
|
|
| |
|
2,603 |
|
|
| |
|
6.875% due 04/29/2030 (j) |
|
| |
|
2,860 |
|
|
| |
|
2,836 |
|
| |
|
| |
|
1,300 |
|
|
| |
|
1,278 |
|
| |
|
| |
|
80 |
|
|
| |
|
77 |
|
|
| |
|
| |
|
| |
|
43 |
|
|
| |
|
2 |
|
|
Gazprom PJSC Via Gaz Capital SA |
|
| |
|
| |
|
1,710 |
|
|
| |
|
1,496 |
|
|
| |
|
6.327% due 04/01/2035 (j) |
|
| |
|
700 |
|
|
| |
|
697 |
|
|
| |
|
6.250% due 01/15/2035 (j) |
|
| |
|
1,000 |
|
|
| |
|
1,016 |
|
|
| |
|
| |
|
| |
|
3,629 |
|
|
| |
|
3,629 |
|
|
| |
|
6.000% due 01/30/2033 «(i) |
|
| |
|
2,614 |
|
|
| |
|
3,624 |
|
|
Intelsat Jackson Holdings SA |
|
6.500% due 03/15/2030 (j) |
|
| |
|
1,956 |
|
|
| |
|
1,999 |
|
|
| |
|
9.875% due 09/20/2031 (j) |
|
| |
|
827 |
|
|
| |
|
805 |
|
|
| |
|
6.941% due 07/07/2032 •(b) |
|
EUR |
|
|
1,400 |
|
|
| |
|
1,616 |
|
|
MPH Acquisition Holdings LLC (6.500% Cash and 5.000% PIK) |
|
11.500% due 12/31/2030 (c) |
|
$ |
|
|
600 |
|
|
| |
|
596 |
|
|
Newfold Digital Holdings Group, Inc. |
|
| |
|
| |
|
1,200 |
|
|
| |
|
702 |
|
| |
|
| |
|
1,250 |
|
|
| |
|
944 |
|
|
| |
|
4.810% due 09/17/2030 (j) |
|
| |
|
2,600 |
|
|
| |
|
2,387 |
|
|
| |
|
6.700% due 02/16/2032 (j) |
|
| |
|
784 |
|
|
| |
|
729 |
|
6.840% due 01/23/2030 (j) |
|
| |
|
200 |
|
|
| |
|
193 |
|
8.750% due 06/02/2029 (j) |
|
| |
|
350 |
|
|
| |
|
363 |
|
|
Spirit Airlines Pass-Through Trust |
|
| |
|
| |
|
540 |
|
|
| |
|
496 |
|
|
| |
|
4.875% due 09/30/2039 (j) |
|
| |
|
647 |
|
|
| |
|
573 |
|
|
| |
|
10.625% due 06/28/2028 (j) |
|
| |
|
1,454 |
|
|
| |
|
1,245 |
|
|
United Airlines Pass-Through Trust |
|
| |
|
| |
|
66 |
|
|
| |
|
63 |
|
|
| |
|
0.000% due 12/29/2049 ~(h) |
|
BRL |
|
|
50,000 |
|
|
| |
|
3,155 |
|
|
| |
|
7.000% due 01/15/2030 (j) |
|
$ |
|
|
1,500 |
|
|
| |
|
1,518 |
|
9.500% due 02/01/2029 (j) |
|
| |
|
912 |
|
|
| |
|
994 |
|
9.875% due 02/01/2032 (j) |
|
| |
|
340 |
|
|
| |
|
367 |
|
|
|
|
|
|
|
| |
54 |
|
PIMCO CLOSED-END FUNDS |
|
|
See Accompanying Notes |
|
|
|
|
|
|
|
|
|
|
|
|
|
| |
| |
|
|
|
PRINCIPAL
AMOUNT
(000S) |
|
|
|
|
MARKET
VALUE
(000S) |
|
|
Venture Global Plaquemines LNG LLC |
|
6.500% due 01/15/2034 (b) |
|
$ |
|
|
700 |
|
|
$ |
|
|
700 |
|
6.750% due 01/15/2036 (b) |
|
| |
|
700 |
|
|
| |
|
700 |
|
|
| |
|
| |
|
EUR |
|
|
600 |
|
|
| |
|
703 |
|
10.000% due 10/15/2030 (j) |
|
$ |
|
|
400 |
|
|
| |
|
394 |
|
|
| |
|
8.250% due 10/01/2031 (j) |
|
| |
|
1,000 |
|
|
| |
|
1,048 |
|
|
| |
| |
|
|
| |
| |
|
|
|
|
| |
| |
|
|
| |
| |
|
57,576 |
|
|
| |
| |
|
|
| |
| |
|
|
|
|
| |
|
|
|
Chile Electricity Lux MPC SARL |
|
5.580% due 10/20/2035 (j) |
|
| |
|
1,026 |
|
|
| |
|
1,028 |
|
|
| |
|
5.250% due 11/15/2028 (j) |
|
| |
|
3,300 |
|
|
| |
|
3,268 |
|
6.250% due 03/15/2030 (j) |
|
| |
|
100 |
|
|
| |
|
102 |
|
|
| |
|
| |
|
| |
|
1,131 |
|
|
| |
|
1,029 |
|
|
Oi SA (10.000% Cash or 6.000% PIK and 7.500% Cash or 13.500% PIK) |
|
10.000% due 06/30/2027 (c) |
|
| |
|
2,313 |
|
|
| |
|
1,506 |
|
|
| |
|
8.500% due 12/31/2028 (c) |
|
| |
|
2,140 |
|
|
| |
|
144 |
|
|
Pacific Gas & Electric Co. |
|
4.300% due 03/15/2045 (j) |
|
| |
|
950 |
|
|
| |
|
718 |
|
|
| |
|
5.375% due 03/22/2030 (j) |
|
| |
|
2,334 |
|
|
| |
|
2,196 |
|
|
Tierra Mojada Luxembourg SARL |
|
5.750% due 12/01/2040 (j) |
|
| |
|
688 |
|
|
| |
|
651 |
|
|
| |
| |
|
|
| |
| |
|
|
|
|
| |
| |
|
|
| |
| |
|
10,642 |
|
|
| |
| |
|
|
| |
| |
|
|
|
Total Corporate Bonds & Notes
(Cost $107,886) |
|
|
|
|
|
| |
|
|
|
|
| |
CONVERTIBLE BONDS & NOTES 0.0% |
|
|
| |
|
|
|
Corestate Capital Holding SA (8.000% Cash or 9.000% PIK) |
|
8.000% due 12/31/2026 (c) |
|
EUR |
|
|
175 |
|
|
| |
|
83 |
|
|
| |
| |
|
|
| |
| |
|
|
|
Total Convertible Bonds & Notes
(Cost $197) |
|
|
|
|
|
| |
|
|
|
|
| |
MUNICIPAL BONDS & NOTES 3.0% |
|
|
| |
|
|
|
Golden State, California Tobacco Securitization Corp. Revenue Bonds, Series 2021 |
|
| |
|
$ |
|
|
1,000 |
|
|
| |
|
835 |
|
| |
|
| |
|
45 |
|
|
| |
|
41 |
|
|
| |
| |
|
|
| |
| |
|
|
|
|
| |
| |
|
|
| |
| |
|
876 |
|
|
| |
| |
|
|
| |
| |
|
|
|
|
| |
|
|
|
Illinois State General Obligation Bonds, (BABs), Series 2010 |
|
| |
|
| |
|
12 |
|
|
| |
|
12 |
|
|
| |
| |
|
|
| |
| |
|
|
|
|
| |
|
|
|
Detroit, Michigan General Obligation Bonds, Series 2014 |
|
| |
|
| |
|
2,983 |
|
|
| |
|
2,334 |
|
|
| |
| |
|
|
| |
| |
|
|
|
|
| |
|
|
|
New York City, New York General Obligation Bonds, Series 2025 |
|
| |
|
| |
|
310 |
|
|
| |
|
325 |
|
| |
|
| |
|
530 |
|
|
| |
|
552 |
|
|
| |
| |
|
|
| |
| |
|
|
|
|
| |
| |
|
|
| |
| |
|
877 |
|
|
| |
| |
|
|
| |
| |
|
|
|
|
|
|
|
|
|
|
|
|
|
|
|
| |
| |
|
|
|
|
|
|
|
|
|
|
|
|
|
Tobacco Settlement Finance Authority, West Virginia Revenue Bonds, Series 2007 |
|
0.000% due 06/01/2047 (g) |
|
$ |
|
|
25,300 |
|
|
$ |
|
|
2,315 |
|
|
| |
| |
|
|
| |
| |
|
|
|
Total Municipal Bonds & Notes
(Cost $7,547) |
|
|
|
|
|
| |
|
|
|
|
| |
U.S. GOVERNMENT AGENCIES 161.1% |
|
|
| |
|
0.000% due 02/25/2052 •(a) |
|
| |
|
106,707 |
|
|
| |
|
1,325 |
|
1.148% due 12/25/2042 ~(a) |
|
| |
|
2,113 |
|
|
| |
|
35 |
|
1.580% due 10/25/2049 •(a)(j) |
|
| |
|
5,389 |
|
|
| |
|
716 |
|
1.630% due 02/25/2049 •(a) |
|
| |
|
54 |
|
|
| |
|
6 |
|
1.680% due 07/25/2050 •(a)(j) |
|
| |
|
802 |
|
|
| |
|
99 |
|
2.086% due 08/25/2054 ~(a)(j) |
|
| |
|
3,183 |
|
|
| |
|
169 |
|
2.330% due 07/25/2041 •(a) |
|
| |
|
201 |
|
|
| |
|
8 |
|
2.500% due 12/25/2027 (a) |
|
| |
|
240 |
|
|
| |
|
4 |
|
3.000% due 06/25/2050 (a) |
|
| |
|
986 |
|
|
| |
|
197 |
|
3.500% due 07/25/2036 (a)(j) |
|
| |
|
2,251 |
|
|
| |
|
211 |
|
3.500% due 07/25/2042 - 12/25/2049 (a) |
|
| |
|
294 |
|
|
| |
|
33 |
|
4.000% due 06/25/2050 (a)(j) |
|
| |
|
511 |
|
|
| |
|
101 |
|
| |
|
| |
|
189 |
|
|
| |
|
189 |
|
| |
|
| |
|
323 |
|
|
| |
|
321 |
|
| |
|
| |
|
12 |
|
|
| |
|
12 |
|
5.000% due 07/25/2037 (a) |
|
| |
|
354 |
|
|
| |
|
50 |
|
5.000% due 01/25/2038 (j) |
|
| |
|
1,657 |
|
|
| |
|
1,692 |
|
| |
|
| |
|
46 |
|
|
| |
|
47 |
|
| |
|
| |
|
5 |
|
|
| |
|
5 |
|
| |
|
| |
|
139 |
|
|
| |
|
142 |
|
5.500% due 11/25/2032 (j) |
|
| |
|
916 |
|
|
| |
|
943 |
|
5.500% due 12/25/2034 - 04/25/2035 |
|
| |
|
623 |
|
|
| |
|
643 |
|
| |
|
| |
|
7 |
|
|
| |
|
7 |
|
| |
|
| |
|
612 |
|
|
| |
|
610 |
|
6.000% due 09/25/2031 - 01/25/2044 |
|
| |
|
451 |
|
|
| |
|
466 |
|
6.500% due 04/01/2031 - 11/01/2047 |
|
| |
|
1,430 |
|
|
| |
|
1,482 |
|
6.500% due 04/01/2037 (j) |
|
| |
|
106 |
|
|
| |
|
107 |
|
| |
|
| |
|
1 |
|
|
| |
|
1 |
|
7.000% due 06/18/2027 - 01/01/2047 |
|
| |
|
299 |
|
|
| |
|
308 |
|
| |
|
| |
|
133 |
|
|
| |
|
133 |
|
| |
|
| |
|
1 |
|
|
| |
|
1 |
|
| |
|
| |
|
4 |
|
|
| |
|
4 |
|
7.500% due 11/25/2026 - 06/25/2044 |
|
| |
|
295 |
|
|
| |
|
302 |
|
| |
|
| |
|
51 |
|
|
| |
|
53 |
|
| |
|
| |
|
469 |
|
|
| |
|
486 |
|
8.500% due 06/18/2027 - 06/25/2030 |
|
| |
|
6 |
|
|
| |
|
6 |
|
|
| |
|
0.000% due 11/15/2048 •(a)(j) |
|
| |
|
4,323 |
|
|
| |
|
144 |
|
1.580% due 04/25/2048 - 11/25/2049 •(a)(j) |
|
| |
|
23,579 |
|
|
| |
|
3,153 |
|
1.730% due 05/25/2050 •(a) |
|
| |
|
521 |
|
|
| |
|
69 |
|
1.990% due 05/15/2038 ~(a) |
|
| |
|
1,461 |
|
|
| |
|
119 |
|
2.079% due 11/25/2045 ~(a) |
|
| |
|
5,336 |
|
|
| |
|
236 |
|
2.257% due 11/15/2038 ~(a)(j) |
|
| |
|
5,159 |
|
|
| |
|
283 |
|
2.591% due 08/15/2036 ~(a) |
|
| |
|
523 |
|
|
| |
|
34 |
|
3.000% due 11/25/2050 (a)(j) |
|
| |
|
7,496 |
|
|
| |
|
1,360 |
|
3.000% due 01/25/2051 (a) |
|
| |
|
436 |
|
|
| |
|
72 |
|
3.500% due 05/25/2050 (a) |
|
| |
|
455 |
|
|
| |
|
87 |
|
| |
|
| |
|
54 |
|
|
| |
|
50 |
|
5.500% due 04/01/2039 - 06/15/2041 (j) |
|
| |
|
1,664 |
|
|
| |
|
1,727 |
|
6.000% due 12/15/2028 - 03/15/2035 |
|
| |
|
402 |
|
|
| |
|
416 |
|
| |
|
| |
|
1 |
|
|
| |
|
1 |
|
6.500% due 03/15/2026 - 10/25/2043 |
|
| |
|
752 |
|
|
| |
|
778 |
|
6.500% due 07/15/2032 - 03/25/2044 (j) |
|
| |
|
1,231 |
|
|
| |
|
1,248 |
|
| |
|
| |
|
32 |
|
|
| |
|
33 |
|
7.000% due 07/15/2027 - 10/25/2043 |
|
| |
|
666 |
|
|
| |
|
688 |
|
7.500% due 12/01/2025 - 02/25/2042 |
|
| |
|
185 |
|
|
| |
|
188 |
|
8.000% due 12/01/2026 - 04/15/2030 |
|
| |
|
13 |
|
|
| |
|
13 |
|
11.805% due 10/25/2041 •(j) |
|
| |
|
2,800 |
|
|
| |
|
2,977 |
|
12.105% due 11/25/2041 •(j) |
|
| |
|
2,800 |
|
|
| |
|
2,998 |
|
|
| |
|
1.618% due 08/20/2049 - 09/20/2049 •(a)(j) |
|
| |
|
41,271 |
|
|
| |
|
5,326 |
|
1.768% due 06/20/2047 •(a)(j) |
|
| |
|
4,436 |
|
|
| |
|
568 |
|
4.000% due 10/15/2051 - 03/15/2052 |
|
| |
|
6,499 |
|
|
| |
|
6,087 |
|
6.000% due 04/15/2029 - 12/15/2038 |
|
| |
|
291 |
|
|
| |
|
300 |
|
|
|
|
|
|
|
|
|
|
|
|
|
| |
| |
|
|
|
PRINCIPAL
AMOUNT
(000S) |
|
|
|
|
MARKET
VALUE
(000S) |
|
6.000% due 11/15/2038 (j) |
|
$ |
|
|
107 |
|
|
$ |
|
|
112 |
|
6.500% due 04/15/2032 - 10/20/2038 |
|
| |
|
128 |
|
|
| |
|
132 |
|
7.000% due 11/15/2025 - 06/15/2026 |
|
| |
|
1 |
|
|
| |
|
0 |
|
7.500% due 10/15/2025 - 02/15/2029 |
|
| |
|
95 |
|
|
| |
|
93 |
|
| |
|
| |
|
4 |
|
|
| |
|
5 |
|
|
| |
|
3.500% due 07/01/2055 (b) |
|
| |
|
1,800 |
|
|
| |
|
1,637 |
|
| |
|
| |
|
3,700 |
|
|
| |
|
3,441 |
|
| |
|
| |
|
100 |
|
|
| |
|
96 |
|
|
U.S. Small Business Administration |
|
| |
|
| |
|
33 |
|
|
| |
|
33 |
|
| |
|
| |
|
2 |
|
|
| |
|
2 |
|
| |
|
| |
|
3 |
|
|
| |
|
3 |
|
|
Uniform Mortgage-Backed Security |
|
4.000% due 06/01/2047 - 03/01/2048 |
|
| |
|
170 |
|
|
| |
|
161 |
|
4.000% due 09/01/2047 - 11/01/2047 (j) |
|
| |
|
4,372 |
|
|
| |
|
4,141 |
|
4.500% due 03/01/2028 - 08/01/2041 |
|
| |
|
94 |
|
|
| |
|
94 |
|
6.000% due 12/01/2032 - 10/01/2036 |
|
| |
|
107 |
|
|
| |
|
109 |
|
6.000% due 04/01/2035 - 06/01/2040 (j) |
|
| |
|
1,317 |
|
|
| |
|
1,380 |
|
6.500% due 11/01/2028 - 02/01/2038 |
|
| |
|
479 |
|
|
| |
|
500 |
|
8.000% due 09/01/2027 - 11/01/2031 |
|
| |
|
28 |
|
|
| |
|
29 |
|
|
Uniform Mortgage-Backed Security, TBA |
|
| |
|
| |
|
100 |
|
|
| |
|
91 |
|
| |
|
| |
|
700 |
|
|
| |
|
686 |
|
| |
|
| |
|
258,800 |
|
|
| |
|
266,851 |
|
7.000% due 08/01/2055 - 09/01/2055 |
|
| |
|
20,800 |
|
|
| |
|
21,805 |
|
|
| |
|
| |
|
| |
|
18 |
|
|
| |
|
18 |
|
6.750% due 02/15/2026 - 06/15/2026 |
|
| |
|
6 |
|
|
| |
|
7 |
|
| |
|
| |
|
475 |
|
|
| |
|
498 |
|
|
| |
| |
|
|
| |
| |
|
|
|
Total U.S. Government Agencies (Cost $356,735) |
|
|
|
|
|
| |
|
|
|
|
| |
NON-AGENCY MORTGAGE-BACKED SECURITIES 21.4% |
|
|
Adjustable Rate Mortgage Trust |
|
| |
|
| |
|
137 |
|
|
| |
|
128 |
|
| |
|
| |
|
96 |
|
|
| |
|
95 |
|
|
Ashford Hospitality Trust |
|
5.884% due 04/15/2035 •(j) |
|
| |
|
2,200 |
|
|
| |
|
2,179 |
|
|
Atrium Hotel Portfolio Trust |
|
6.109% due 12/15/2036 •(j) |
|
| |
|
1,600 |
|
|
| |
|
1,549 |
|
|
Banc of America Mortgage Trust |
|
| |
|
| |
|
3 |
|
|
| |
|
3 |
|
|
| |
|
| |
|
| |
|
93 |
|
|
| |
|
77 |
|
|
| |
|
| |
|
| |
|
196 |
|
|
| |
|
90 |
|
|
Bear Stearns Commercial Mortgage Securities Trust |
|
| |
|
| |
|
62 |
|
|
| |
|
61 |
|
| |
|
| |
|
129 |
|
|
| |
|
127 |
|
|
| |
|
3.957% due 03/10/2039 (j) |
|
| |
|
1,000 |
|
|
| |
|
945 |
|
|
Colony Mortgage Capital Ltd. |
|
6.701% due 11/15/2038 •(j) |
|
| |
|
1,000 |
|
|
| |
|
957 |
|
|
| |
|
| |
|
| |
|
1,380 |
|
|
| |
|
1,162 |
|
|
Countrywide Alternative Loan Trust |
|
| |
|
| |
|
764 |
|
|
| |
|
685 |
|
|
Countrywide Home Loan Mortgage Pass-Through Trust |
|
| |
|
| |
|
597 |
|
|
| |
|
523 |
|
| |
|
| |
|
104 |
|
|
| |
|
101 |
|
| |
|
| |
|
567 |
|
|
| |
|
424 |
|
|
Countrywide Home Loan Reperforming REMIC Trust |
|
| |
|
| |
|
104 |
|
|
| |
|
103 |
|
| |
|
| |
|
22 |
|
|
| |
|
23 |
|
|
|
|
|
|
|
|
|
|
|
|
|
| |
| See Accompanying Notes |
|
|
ANNUAL REPORT |
|
|
| |
|
|
JUNE 30, 2025 |
|
|
55 |
|
|
|
|
|
|
| |
|
|
PIMCO Strategic Income Fund, Inc. |
|
|
|
|
|
|
|
|
|
|
|
|
|
|
|
|
| |
| |
|
|
|
PRINCIPAL
AMOUNT
(000S) |
|
|
|
|
MARKET
VALUE
(000S) |
|
|
Credit Suisse First Boston Mortgage-Backed Pass-Through Certificates |
|
| |
|
$ |
|
|
42 |
|
|
$ |
|
|
42 |
|
|
Credit Suisse Mortgage Capital Mortgage-Backed Trust |
|
| |
|
| |
|
1,200 |
|
|
| |
|
983 |
|
| |
|
| |
|
731 |
|
|
| |
|
94 |
|
|
| |
|
| |
|
GBP |
|
|
1,582 |
|
|
| |
|
2,026 |
|
| |
|
| |
|
1,130 |
|
|
| |
|
1,382 |
|
| |
|
| |
|
960 |
|
|
| |
|
1,314 |
|
|
GC Pastor Hipotecario FTA |
|
| |
|
EUR |
|
|
491 |
|
|
| |
|
533 |
|
|
GMACM Mortgage Loan Trust |
|
| |
|
$ |
|
|
14 |
|
|
| |
|
13 |
|
|
| |
|
| |
|
| |
|
341 |
|
|
| |
|
347 |
|
|
GSMPS Mortgage Loan Trust |
|
7.000% due 06/25/2043 (j) |
|
| |
|
1,124 |
|
|
| |
|
1,187 |
|
| |
|
| |
|
10 |
|
|
| |
|
10 |
|
| |
|
| |
|
240 |
|
|
| |
|
233 |
|
|
| |
|
| |
|
| |
|
28 |
|
|
| |
|
26 |
|
|
ILPT Commercial Mortgage Trust |
|
| |
|
| |
|
1,400 |
|
|
| |
|
1,387 |
|
|
| |
|
| |
|
EUR |
|
|
150 |
|
|
| |
|
156 |
|
|
JP Morgan Chase Commercial Mortgage Securities Trust |
|
5.158% due 04/15/2037 •(j) |
|
$ |
|
|
976 |
|
|
| |
|
966 |
|
| |
|
| |
|
900 |
|
|
| |
|
655 |
|
| |
|
| |
|
1,700 |
|
|
| |
|
154 |
|
7.609% due 02/15/2035 •(j) |
|
| |
|
987 |
|
|
| |
|
941 |
|
10.966% due 11/15/2038 •(j) |
|
| |
|
2,200 |
|
|
| |
|
2,100 |
|
|
| |
|
| |
|
| |
|
1 |
|
|
| |
|
1 |
|
| |
|
| |
|
573 |
|
|
| |
|
452 |
|
|
MASTR Adjustable Rate Mortgages Trust |
|
| |
|
| |
|
195 |
|
|
| |
|
179 |
|
|
MASTR Alternative Loan Trust |
|
| |
|
| |
|
181 |
|
|
| |
|
88 |
|
| |
|
| |
|
14 |
|
|
| |
|
15 |
|
|
MASTR Reperforming Loan Trust |
|
| |
|
| |
|
1,992 |
|
|
| |
|
1,314 |
|
| |
|
| |
|
1,060 |
|
|
| |
|
715 |
|
|
Morgan Stanley Resecuritization Trust |
|
| |
|
| |
|
6,020 |
|
|
| |
|
5,539 |
|
|
NAAC Reperforming Loan REMIC Trust |
|
| |
|
| |
|
386 |
|
|
| |
|
356 |
|
7.500% due 03/25/2034 (j) |
|
| |
|
1,193 |
|
|
| |
|
1,119 |
|
| |
|
| |
|
1,159 |
|
|
| |
|
1,071 |
|
|
| |
|
| |
|
| |
|
1,000 |
|
|
| |
|
974 |
|
|
| |
|
| |
|
EUR |
|
|
1,016 |
|
|
| |
|
1,163 |
|
| |
|
| |
|
1,016 |
|
|
| |
|
1,107 |
|
|
RBSSP Resecuritization Trust |
|
| |
|
$ |
|
|
2,145 |
|
|
| |
|
1,095 |
|
| |
|
| |
|
5,169 |
|
|
| |
|
1,769 |
|
|
Residential Accredit Loans, Inc. Trust |
|
| |
|
| |
|
576 |
|
|
| |
|
512 |
|
|
Residential Asset Mortgage Products Trust |
|
| |
|
| |
|
126 |
|
|
| |
|
119 |
|
| |
|
| |
|
598 |
|
|
| |
|
281 |
|
| |
|
| |
|
5 |
|
|
| |
|
2 |
|
|
Structured Asset Securities Corp. Mortgage Loan Trust |
|
| |
|
| |
|
2,026 |
|
|
| |
|
1,159 |
|
|
WaMu Mortgage Pass-Through Certificates Trust |
|
| |
|
| |
|
40 |
|
|
| |
|
40 |
|
|
Washington Mutual MSC Mortgage Pass-Through Certificates Trust |
|
| |
|
| |
|
23 |
|
|
| |
|
24 |
|
| |
|
| |
|
60 |
|
|
| |
|
62 |
|
|
Wells Fargo Commercial Mortgage Trust |
|
5.092% due 12/15/2039 ~(j) |
|
| |
|
2,558 |
|
|
| |
|
2,355 |
|
|
| |
| |
|
|
| |
| |
|
|
|
Total Non-Agency Mortgage-Backed Securities (Cost $48,762) |
|
|
|
|
|
| |
|
|
|
|
|
|
|
|
|
|
|
|
|
|
|
| |
| |
|
|
|
|
|
|
|
|
|
|
ASSET-BACKED SECURITIES 4.8% |
|
|
| |
AUTOMOBILE ABS OTHER 0.0% |
|
|
Flagship Credit Auto Trust |
|
0.000% due 12/15/2025 «(g) |
|
$ |
|
|
12 |
|
|
$ |
|
|
0 |
|
|
| |
| |
|
|
| |
| |
|
|
|
|
| |
|
|
|
Ameriquest Mortgage Securities, Inc. Asset-Backed Pass-Through Certificates |
|
| |
|
| |
|
39 |
|
|
| |
|
26 |
|
|
Bear Stearns Asset-Backed Securities Trust |
|
| |
|
| |
|
66 |
|
|
| |
|
66 |
|
|
Countrywide Asset-Backed Certificates Trust |
|
4.284% due 11/25/2034 •(j) |
|
| |
|
2,297 |
|
|
| |
|
1,909 |
|
4.834% due 06/25/2037 •(j) |
|
| |
|
1,278 |
|
|
| |
|
1,277 |
|
|
| |
| |
|
|
| |
| |
|
|
|
|
| |
| |
|
|
| |
| |
|
3,278 |
|
|
| |
| |
|
|
| |
| |
|
|
|
|
| |
MANUFACTURING HOUSE ABS OTHER 0.0% |
|
|
Access Financial Manufactured Housing Contract Trust |
|
| |
|
| |
|
200 |
|
|
| |
|
1 |
|
|
| |
| |
|
|
| |
| |
|
|
|
|
| |
MANUFACTURING HOUSE SEQUENTIAL 0.2% |
|
|
| |
|
| |
|
| |
|
34 |
|
|
| |
|
30 |
|
|
Conseco Finance Securitizations Corp. |
|
| |
|
| |
|
1,417 |
|
|
| |
|
284 |
|
|
| |
| |
|
|
| |
| |
|
|
|
|
| |
| |
|
|
| |
| |
|
314 |
|
|
| |
| |
|
|
| |
| |
|
|
|
|
| |
|
|
|
| |
|
| |
|
| |
|
2,000 |
|
|
| |
|
2,033 |
|
|
| |
|
| |
|
| |
|
658 |
|
|
| |
|
589 |
|
|
| |
|
| |
|
| |
|
1,213 |
|
|
| |
|
635 |
|
|
Madison Park Funding Ltd. |
|
| |
|
| |
|
500 |
|
|
| |
|
159 |
|
|
| |
|
| |
|
| |
|
250 |
|
|
| |
|
127 |
|
|
| |
|
0.000% due 12/15/2028 «(g) |
|
| |
|
6 |
|
|
| |
|
0 |
|
0.000% due 04/16/2029 «(g) |
|
| |
|
10 |
|
|
| |
|
0 |
|
0.000% due 07/16/2029 «(g) |
|
| |
|
7 |
|
|
| |
|
1 |
|
|
National Collegiate Commutation Trust |
|
| |
|
| |
|
10,387 |
|
|
| |
|
1,538 |
|
|
SMB Private Education Loan Trust |
|
0.000% due 10/15/2048 «(g) |
|
| |
|
5 |
|
|
| |
|
1,150 |
|
0.000% due 02/16/2055 «(g) |
|
| |
|
0 |
|
|
| |
|
421 |
|
|
| |
| |
|
|
| |
| |
|
|
|
|
| |
| |
|
|
| |
| |
|
6,653 |
|
|
| |
| |
|
|
| |
| |
|
|
|
Total Asset-Backed Securities
(Cost $29,792) |
|
|
|
|
|
| |
|
|
|
|
| |
|
|
|
Argentina Government International Bond |
|
| |
|
| |
|
453 |
|
|
| |
|
307 |
|
| |
|
| |
|
242 |
|
|
| |
|
202 |
|
| |
|
| |
|
112 |
|
|
| |
|
74 |
|
5.000% due 01/09/2038 (j) |
|
| |
|
4,388 |
|
|
| |
|
3,126 |
|
|
Avenir Issuer Ireland DAC |
|
| |
|
| |
|
700 |
|
|
| |
|
657 |
|
|
Dominican Republic International Bond |
|
10.500% due 03/15/2037 (j) |
|
DOP |
|
|
130,400 |
|
|
| |
|
2,230 |
|
|
El Salvador Government International Bond |
|
| |
|
$ |
|
|
300 |
|
|
| |
|
310 |
|
|
Ghana Government International Bond |
|
0.000% due 07/03/2026 (g) |
|
| |
|
17 |
|
|
| |
|
17 |
|
0.000% due 01/03/2030 (g) |
|
| |
|
37 |
|
|
| |
|
31 |
|
| |
|
| |
|
172 |
|
|
| |
|
162 |
|
| |
|
| |
|
247 |
|
|
| |
|
193 |
|
|
|
|
|
|
|
|
|
|
|
|
|
| |
| |
|
|
|
PRINCIPAL
AMOUNT
(000S) |
|
|
|
|
MARKET
VALUE
(000S) |
|
|
Romania Government International Bond |
|
| |
|
EUR |
|
|
2,800 |
|
|
$ |
|
|
3,260 |
|
| |
|
| |
|
1,900 |
|
|
| |
|
2,205 |
|
|
Turkiye Government International Bond |
|
| |
|
TRY |
|
|
57,400 |
|
|
| |
|
1,384 |
|
| |
|
| |
|
10,000 |
|
|
| |
|
244 |
|
|
Venezuela Government International Bond |
|
9.250% due 09/15/2027 ^(d) |
|
$ |
|
|
171 |
|
|
| |
|
35 |
|
|
| |
| |
|
|
| |
| |
|
|
|
Total Sovereign Issues (Cost $13,895) |
|
|
|
|
|
| |
|
|
|
|
| |
| |
|
|
|
SHARES |
|
|
|
|
|
|
|
|
|
| |
COMMUNICATION SERVICES 0.6% |
|
|
|
|
|
| |
Clear Channel Outdoor Holdings, Inc. (e) |
|
| |
|
291,816 |
|
|
| |
|
341 |
|
|
|
|
|
| |
iHeartMedia, Inc. ‘A’ (e) |
|
| |
|
68,102 |
|
|
| |
|
120 |
|
|
|
|
|
| |
iHeartMedia, Inc. ‘B’ «(e) |
|
| |
|
52,880 |
|
|
| |
|
82 |
|
|
|
|
|
| |
| |
|
| |
|
358,638 |
|
|
| |
|
42 |
|
|
|
|
|
| |
Promotora de Informaciones SA ‘A’ (e) |
|
| |
|
207,627 |
|
|
| |
|
93 |
|
|
|
|
|
| |
Windstream Services LLC «(e) |
|
| |
|
28,052 |
|
|
| |
|
550 |
|
|
| |
| |
|
|
| |
| |
|
|
|
|
| |
| |
|
|
| |
| |
|
1,228 |
|
|
| |
| |
|
|
| |
| |
|
|
|
|
| |
|
|
|
|
|
|
| |
Steinhoff International Holdings NV «(e)(i) |
|
| |
|
17,707,907 |
|
|
| |
|
0 |
|
|
| |
| |
|
|
| |
| |
|
|
|
|
| |
|
|
|
|
|
|
| |
Banca Monte dei Paschi di Siena SpA |
|
| |
|
323,500 |
|
|
| |
|
2,752 |
|
|
|
|
|
| |
Intelsat Emergence SA «(i) |
|
| |
|
98,888 |
|
|
| |
|
3,412 |
|
|
|
|
|
| |
MNSN Holdings, Inc. «(e)(i) |
|
| |
|
1,054 |
|
|
| |
|
4 |
|
|
| |
| |
|
|
| |
| |
|
|
|
|
| |
| |
|
|
| |
| |
|
6,168 |
|
|
| |
| |
|
|
| |
| |
|
|
|
|
| |
|
|
|
|
|
|
| |
| |
|
| |
|
192,582 |
|
|
| |
|
8,694 |
|
|
| |
| |
|
|
| |
| |
|
|
|
|
| |
|
|
|
|
|
|
| |
Incora New Equity «(e)(i) |
|
| |
|
121,860 |
|
|
| |
|
4,117 |
|
|
|
|
|
| |
Westmoreland Mining Holdings «(e)(i) |
|
| |
|
69 |
|
|
| |
|
0 |
|
|
|
|
|
| |
Westmoreland Mining LLC «(e)(i) |
|
| |
|
219 |
|
|
| |
|
1 |
|
|
| |
| |
|
|
| |
| |
|
|
|
|
| |
| |
|
|
| |
| |
|
4,118 |
|
|
| |
| |
|
|
| |
| |
|
|
|
Total Common Stocks (Cost $25,208) |
|
|
|
|
|
| |
|
|
|
|
| |
|
|
|
| |
COMMUNICATION SERVICES 0.1% |
|
|
|
|
|
| |
Windstream - Exp. 04/08/2060 « |
|
| |
|
5,577 |
|
|
| |
|
109 |
|
|
| |
| |
|
|
| |
| |
|
|
|
|
| |
|
|
|
|
|
|
| |
Intelsat Emergence SA - Exp. 02/17/2027 « |
|
| |
|
711 |
|
|
| |
|
2 |
|
|
| |
| |
|
|
| |
| |
|
|
|
Total Warrants (Cost $2,734) |
|
|
|
|
|
| |
|
|
|
|
| |
PREFERRED SECURITIES 1.9% |
|
|
| |
|
|
|
|
|
|
| |
| |
|
| |
|
906,702 |
|
|
| |
|
0 |
|
|
| |
|
5.000% due 03/15/2026 •(h) |
|
| |
|
1,300,000 |
|
|
| |
|
1,306 |
|
|
Farm Credit Bank of Texas |
|
5.700% due 09/15/2025 •(h) |
|
| |
|
1,000,000 |
|
|
| |
|
1,000 |
|
|
| |
| |
|
|
| |
| |
|
|
|
|
| |
| |
|
|
| |
| |
|
2,306 |
|
|
| |
| |
|
|
| |
| |
|
|
|
|
|
|
|
|
|
|
|
|
|
|
|
| |
| |
|
|
|
SHARES |
|
|
|
|
MARKET
VALUE
(000S) |
|
|
|
|
| |
|
0.000% due 11/07/2032 (g) |
|
| |
|
5,040 |
|
|
$ |
|
|
0 |
|
| |
|
| |
|
1,202 |
|
|
| |
|
637 |
|
|
|
|
|
| |
Syniverse Holdings, Inc. «(i) |
|
| |
|
1,066,208 |
|
|
| |
|
1,009 |
|
|
| |
| |
|
|
| |
| |
|
|
|
|
| |
| |
|
|
| |
| |
|
1,646 |
|
|
| |
| |
|
|
| |
| |
|
|
|
Total Preferred Securities (Cost $4,029) |
|
|
|
|
|
| |
|
|
|
|
| |
REAL ESTATE INVESTMENT TRUSTS 0.6% |
|
|
| |
|
|
|
|
|
|
| |
| |
|
| |
|
54,523 |
|
|
| |
|
235 |
|
|
|
|
|
| |
| |
|
| |
|
33,427 |
|
|
| |
|
1,090 |
|
|
| |
| |
|
|
| |
| |
|
|
|
Total Real Estate Investment Trusts (Cost $822) |
|
|
|
|
|
| |
|
|
|
|
| |
| |
|
|
|
PRINCIPAL
AMOUNT
(000S) |
|
|
|
|
|
|
SHORT-TERM INSTRUMENTS 1.7% |
|
|
| |
NIGERIA TREASURY BILLS 1.1% |
|
31.083% due 06/11/2026 - 06/29/2026 (f)(g) |
|
NGN |
|
|
4,232,990 |
|
|
| |
|
2,222 |
|
|
| |
| |
|
|
| |
| |
|
|
|
|
| |
|
|
4.326% due 07/17/2025 - 10/21/2025 (f)(g)(m) |
|
$ |
|
|
1,359 |
|
|
| |
|
1,347 |
|
|
| |
| |
|
|
| |
| |
|
|
|
Total Short-Term Instruments
(Cost $3,457) |
|
|
|
|
|
| |
|
|
|
|
|
|
|
| |
|
| |
| |
|
|
| |
| |
|
| |
Total Investments in Securities
(Cost $648,814) |
|
|
|
|
|
| |
|
|
|
|
| |
|
|
|
|
|
|
|
|
|
|
|
|
| |
| |
|
|
|
|
|
|
|
|
|
|
INVESTMENTS IN AFFILIATES 3.6% |
|
|
| |
SHORT-TERM INSTRUMENTS 3.6% |
|
|
| |
CENTRAL FUNDS USED FOR CASH MANAGEMENT PURPOSES 3.6% |
|
|
|
|
|
| |
PIMCO Short-Term
Floating NAV Portfolio III |
|
| |
|
788,926 |
|
|
$ |
|
|
7,682 |
|
|
| |
| |
|
|
| |
| |
|
|
|
Total Short-Term Instruments
(Cost $7,680) |
|
|
|
|
|
| |
|
|
|
|
|
|
|
| |
|
| |
| |
|
|
| |
| |
|
| |
Total Investments in Affiliates
(Cost $7,680) |
|
|
|
|
|
| |
|
| |
|
| |
Total Investments 282.6%
(Cost $656,494) |
|
|
$ |
|
|
|
|
|
| |
Financial Derivative
Instruments (k)(l) (0.8)% (Cost or Premiums, net $7,206) |
|
|
|
| |
| |
|
|
|
|
| |
Other Assets and Liabilities, net (181.8)% |
|
|
|
|
|
| |
|
|
|
|
|
|
$ |
|
|
|
|
|
|
| |
| |
|
|
|
NOTES TO SCHEDULE OF INVESTMENTS:
|
A zero balance may reflect actual amounts rounding to less than one thousand. |
|
Security valued using significant unobservable inputs (Level 3). |
|
All or a portion of this amount represents unfunded loan commitments. The interest rate for the unfunded portion will be determined at the time of funding. See Note 4, Securities and Other Investments, in the Notes to Financial Statements for more information regarding unfunded loan commitments. |
|
Variable or Floating rate security. Rate shown is the rate in effect as of period end. Certain variable rate securities are not based on a published reference rate and spread, rather are determined by the issuer or agent and are based on current market conditions. Reference rate is as of reset date, which may vary by security. These securities may not indicate a reference rate and/or spread in their description. |
|
Rate shown is the rate in effect as of period end. The rate may be based on a fixed rate, a capped rate or a floor rate and may convert to a variable or floating rate in the future. These securities do not indicate a reference rate and spread in their description. |
|
Coupon represents a rate which changes periodically based on a predetermined schedule or event. Rate shown is the rate in effect as of period end. |
|
Security is an Interest Only (“IO”) or IO Strip. |
|
Payment in-kind security. |
|
Security is not accruing income as of the date of this report. |
|
Security did not produce income within the last twelve months. |
|
Coupon represents a weighted average yield to maturity. |
|
Perpetual maturity; date shown, if applicable, represents next contractual call date. |
(i) RESTRICTED SECURITIES:
|
|
|
|
|
|
|
|
|
|
|
|
|
|
|
|
|
|
|
|
|
|
|
|
| |
|
|
|
|
|
|
|
|
|
|
|
|
|
|
|
|
|
Market Value
as Percentage
of Net Assets |
|
| |
|
|
|
| |
|
|
| |
|
|
|
|
$ |
8,047 |
|
|
$ |
8,694 |
|
|
|
4.10 |
% |
| |
|
|
|
| |
|
|
| |
|
01/31/2025 |
|
|
|
5,919 |
|
|
|
4,117 |
|
|
|
1.94 |
|
Incora Top Holdco LLC 6.000% due 01/30/2033 |
|
|
|
| |
|
|
| |
|
01/31/2025 |
|
|
|
2,614 |
|
|
|
3,624 |
|
|
|
1.71 |
|
| |
|
|
|
| |
|
|
| |
|
06/19/2017 - 02/23/2024 |
|
|
|
6,774 |
|
|
|
3,412 |
|
|
|
1.61 |
|
|
|
|
|
|
|
|
|
|
|
|
|
| |
| See Accompanying Notes |
|
|
ANNUAL REPORT |
|
|
| |
|
|
JUNE 30, 2025 |
|
|
57 |
|
|
|
|
|
|
| |
|
|
PIMCO Strategic Income Fund, Inc. |
|
|
|
|
|
|
|
|
|
|
|
|
|
|
|
|
|
|
|
|
|
|
|
|
|
|
|
|
| |
Issuer Description |
|
|
|
|
|
|
|
Acquisition
Date |
|
|
Cost |
|
|
Market
Value |
|
|
Market Value
as Percentage
of Net Assets |
|
| |
|
|
|
| |
|
|
| |
|
|
|
|
$ |
12 |
|
|
$ |
4 |
|
|
|
0.00 |
% |
Steinhoff International Holdings NV |
|
|
|
| |
|
|
| |
|
06/30/2023 - 10/30/2023 |
|
|
|
0 |
|
|
|
0 |
|
|
|
0.00 |
|
| |
|
|
|
| |
|
|
| |
|
05/12/2022 - 05/30/2025 |
|
|
|
1,052 |
|
|
|
1,009 |
|
|
|
0.47 |
|
Westmoreland Mining Holdings |
|
|
|
| |
|
|
| |
|
03/26/2019 |
|
|
|
0 |
|
|
|
0 |
|
|
|
0.00 |
|
| |
|
|
|
| |
|
|
| |
|
06/30/2023 - 02/03/2025 |
|
|
|
1 |
|
|
|
1 |
|
|
|
0.00 |
|
|
| |
|
|
| |
|
|
| |
|
|
| |
|
|
|
|
|
|
|
|
|
|
|
|
|
| |
$ |
24,419 |
|
|
$ |
20,861 |
|
|
|
9.83 |
% |
|
| |
|
|
| |
|
|
| |
|
|
| |
|
|
|
|
|
|
|
|
|
|
|
BORROWINGS AND OTHER FINANCING TRANSACTIONS
REVERSE REPURCHASE AGREEMENTS:
|
|
|
|
|
|
|
|
|
|
|
|
|
|
|
|
|
|
|
|
|
|
|
|
| |
|
|
|
|
|
|
|
|
|
|
|
|
|
|
Payable for
Reverse
Repurchase
Agreements |
|
| |
|
|
4.600 |
% |
|
|
02/10/2025 |
|
|
|
TBD |
|
|
|
$ |
|
|
|
(592 |
) |
|
$ |
(603 |
) |
| |
|
|
4.450 |
|
|
|
05/29/2025 |
|
|
|
TBD |
|
|
|
|
| |
|
(897 |
) |
|
|
(900 |
) |
|
| |
|
4.611 |
|
|
|
06/13/2025 |
|
|
|
09/15/2025 |
|
|
|
GBP |
|
|
|
(2,441 |
) |
|
|
(3,359 |
) |
|
| |
|
4.650 |
|
|
|
12/20/2024 |
|
|
|
TBD |
|
|
|
$ |
|
|
|
(292 |
) |
|
|
(299 |
) |
|
| |
|
4.650 |
|
|
|
06/24/2025 |
|
|
|
TBD |
|
|
|
|
| |
|
(196 |
) |
|
|
(196 |
) |
|
| |
|
4.870 |
|
|
|
06/10/2025 |
|
|
|
08/11/2025 |
|
|
|
|
| |
|
(1,651 |
) |
|
|
(1,655 |
) |
|
| |
|
5.140 |
|
|
|
05/15/2025 |
|
|
|
11/12/2025 |
|
|
|
|
| |
|
(5,330 |
) |
|
|
(5,368 |
) |
|
| |
|
5.140 |
|
|
|
05/16/2025 |
|
|
|
11/12/2025 |
|
|
|
|
| |
|
(765 |
) |
|
|
(770 |
) |
|
| |
|
5.620 |
|
|
|
04/25/2025 |
|
|
|
10/23/2025 |
|
|
|
|
| |
|
(2,537 |
) |
|
|
(2,563 |
) |
|
| |
|
5.820 |
|
|
|
04/22/2025 |
|
|
|
07/22/2025 |
|
|
|
|
| |
|
(3,869 |
) |
|
|
(3,913 |
) |
| |
|
|
4.770 |
|
|
|
06/06/2025 |
|
|
|
07/07/2025 |
|
|
|
|
| |
|
(1,801 |
) |
|
|
(1,807 |
) |
|
| |
|
4.770 |
|
|
|
06/12/2025 |
|
|
|
07/14/2025 |
|
|
|
|
| |
|
(932 |
) |
|
|
(935 |
) |
|
| |
|
5.590 |
|
|
|
06/24/2025 |
|
|
|
10/22/2025 |
|
|
|
|
| |
|
(1,487 |
) |
|
|
(1,489 |
) |
| |
|
|
4.600 |
|
|
|
05/19/2025 |
|
|
|
TBD |
|
|
|
|
| |
|
(766 |
) |
|
|
(771 |
) |
|
| |
|
4.700 |
|
|
|
05/19/2025 |
|
|
|
TBD |
|
|
|
|
| |
|
(77 |
) |
|
|
(77 |
) |
|
| |
|
4.740 |
|
|
|
06/11/2025 |
|
|
|
08/11/2025 |
|
|
|
|
| |
|
(980 |
) |
|
|
(982 |
) |
|
| |
|
4.840 |
|
|
|
06/05/2025 |
|
|
|
08/05/2025 |
|
|
|
|
| |
|
(8,977 |
) |
|
|
(9,008 |
) |
|
| |
|
4.890 |
|
|
|
04/10/2025 |
|
|
|
07/10/2025 |
|
|
|
|
| |
|
(286 |
) |
|
|
(289 |
) |
|
| |
|
4.890 |
|
|
|
04/21/2025 |
|
|
|
07/21/2025 |
|
|
|
|
| |
|
(1,876 |
) |
|
|
(1,893 |
) |
| |
|
|
4.470 |
|
|
|
06/12/2025 |
|
|
|
07/14/2025 |
|
|
|
|
| |
|
(6,253 |
) |
|
|
(6,268 |
) |
| |
|
|
4.700 |
|
|
|
04/10/2025 |
|
|
|
TBD |
|
|
|
|
| |
|
(311 |
) |
|
|
(314 |
) |
|
| |
|
4.870 |
|
|
|
06/27/2025 |
|
|
|
07/25/2025 |
|
|
|
|
| |
|
(1,939 |
) |
|
|
(1,940 |
) |
|
| |
|
5.220 |
|
|
|
06/24/2025 |
|
|
|
08/22/2025 |
|
|
|
|
| |
|
(1,844 |
) |
|
|
(1,846 |
) |
|
| |
|
5.270 |
|
|
|
06/24/2025 |
|
|
|
08/22/2025 |
|
|
|
|
| |
|
(810 |
) |
|
|
(810 |
) |
|
| |
|
5.320 |
|
|
|
06/24/2025 |
|
|
|
08/22/2025 |
|
|
|
|
| |
|
(1,615 |
) |
|
|
(1,616 |
) |
| |
|
|
4.550 |
|
|
|
04/03/2025 |
|
|
|
TBD |
|
|
|
|
| |
|
(1,414 |
) |
|
|
(1,430 |
) |
|
| |
|
4.720 |
|
|
|
06/11/2025 |
|
|
|
09/11/2025 |
|
|
|
|
| |
|
(201 |
) |
|
|
(201 |
) |
|
| |
|
4.820 |
|
|
|
06/11/2025 |
|
|
|
09/11/2025 |
|
|
|
|
| |
|
(2,412 |
) |
|
|
(2,419 |
) |
| |
|
|
4.570 |
|
|
|
04/10/2025 |
|
|
|
07/10/2025 |
|
|
|
|
| |
|
(1,075 |
) |
|
|
(1,086 |
) |
|
| |
|
4.590 |
|
|
|
04/09/2025 |
|
|
|
07/10/2025 |
|
|
|
|
| |
|
(4,539 |
) |
|
|
(4,587 |
) |
|
| |
|
4.730 |
|
|
|
06/17/2025 |
|
|
|
09/17/2025 |
|
|
|
|
| |
|
(490 |
) |
|
|
(491 |
) |
|
| |
|
4.790 |
|
|
|
06/04/2025 |
|
|
|
09/04/2025 |
|
|
|
|
| |
|
(560 |
) |
|
|
(562 |
) |
|
| |
|
4.880 |
|
|
|
04/11/2025 |
|
|
|
07/11/2025 |
|
|
|
|
| |
|
(839 |
) |
|
|
(848 |
) |
|
| |
|
4.940 |
|
|
|
05/27/2025 |
|
|
|
10/27/2025 |
|
|
|
|
| |
|
(1,923 |
) |
|
|
(1,933 |
) |
| |
|
|
4.750 |
|
|
|
05/09/2025 |
|
|
|
08/01/2025 |
|
|
|
|
| |
|
(2,584 |
) |
|
|
(2,602 |
) |
| |
|
|
5.280 |
|
|
|
04/03/2025 |
|
|
|
07/03/2025 |
|
|
|
|
| |
|
(1,805 |
) |
|
|
(1,828 |
) |
| |
|
|
5.190 |
|
|
|
06/24/2025 |
|
|
|
12/22/2025 |
|
|
|
|
| |
|
(1,278 |
) |
|
|
(1,279 |
) |
|
| |
|
5.440 |
|
|
|
05/19/2025 |
|
|
|
11/19/2025 |
|
|
|
|
| |
|
(710 |
) |
|
|
(714 |
) |
| |
|
|
4.820 |
|
|
|
06/06/2025 |
|
|
|
07/07/2025 |
|
|
|
|
| |
|
(1,200 |
) |
|
|
(1,204 |
) |
| |
|
|
5.540 |
|
|
|
06/24/2025 |
|
|
|
08/08/2025 |
|
|
|
|
| |
|
(915 |
) |
|
|
(916 |
) |
| |
|
|
4.510 |
|
|
|
06/12/2025 |
|
|
|
07/14/2025 |
|
|
|
|
| |
|
(4,383 |
) |
|
|
(4,393 |
) |
| |
|
|
4.570 |
|
|
|
01/28/2025 |
|
|
|
TBD |
|
|
|
|
| |
|
(1,509 |
) |
|
|
(1,539 |
) |
|
| |
|
4.570 |
|
|
|
02/12/2025 |
|
|
|
TBD |
|
|
|
|
| |
|
(611 |
) |
|
|
(621 |
) |
|
| |
|
4.600 |
|
|
|
12/20/2024 |
|
|
|
TBD |
|
|
|
|
| |
|
(3,272 |
) |
|
|
(3,353 |
) |
|
| |
|
4.650 |
|
|
|
01/28/2025 |
|
|
|
TBD |
|
|
|
|
| |
|
(758 |
) |
|
|
(773 |
) |
|
| |
|
4.650 |
|
|
|
02/05/2025 |
|
|
|
TBD |
|
|
|
|
| |
|
(1,066 |
) |
|
|
(1,086 |
) |
|
| |
|
4.670 |
|
|
|
05/12/2025 |
|
|
|
07/14/2025 |
|
|
|
|
| |
|
(4,364 |
) |
|
|
(4,393 |
) |
|
| |
|
4.680 |
|
|
|
04/09/2025 |
|
|
|
07/08/2025 |
|
|
|
|
| |
|
(778 |
) |
|
|
(787 |
) |
|
| |
|
4.680 |
|
|
|
04/10/2025 |
|
|
|
07/08/2025 |
|
|
|
|
| |
|
(1,154 |
) |
|
|
(1,166 |
) |
|
| |
|
4.680 |
|
|
|
04/25/2025 |
|
|
|
07/08/2025 |
|
|
|
|
| |
|
(861 |
) |
|
|
(869 |
) |
|
| |
|
4.720 |
|
|
|
04/21/2025 |
|
|
|
07/21/2025 |
|
|
|
|
| |
|
(1,258 |
) |
|
|
(1,270 |
) |
|
| |
|
4.800 |
|
|
|
04/09/2025 |
|
|
|
07/08/2025 |
|
|
|
|
| |
|
(943 |
) |
|
|
(954 |
) |
| |
|
|
4.500 |
|
|
|
12/20/2024 |
|
|
|
TBD |
|
|
|
|
| |
|
(608 |
) |
|
|
(622 |
) |
|
| |
|
4.520 |
|
|
|
12/20/2024 |
|
|
|
TBD |
|
|
|
|
| |
|
(378 |
) |
|
|
(387 |
) |
|
| |
|
4.650 |
|
|
|
12/20/2024 |
|
|
|
TBD |
|
|
|
|
| |
|
(1,139 |
) |
|
|
(1,168 |
) |
|
| |
|
|
| |
|
|
| |
|
|
| |
|
|
| |
|
|
| |
|
|
|
Total Reverse Repurchase Agreements |
|
|
|
| |
|
|
| |
|
|
| |
|
|
| |
|
|
| |
|
|
|
|
| |
|
|
| |
|
|
| |
|
|
| |
|
|
| |
|
|
| |
|
|
|
SHORT SALES:
|
|
|
|
|
|
|
|
|
|
|
|
|
|
|
|
|
|
|
|
| |
|
|
|
|
|
|
|
|
|
|
|
|
|
|
|
|
U.S. Government Agencies (3.0)% |
|
Uniform Mortgage-Backed Security, TBA |
|
|
2.000 |
% |
|
|
07/01/2040 |
|
|
$ |
300 |
|
|
$ |
(270 |
) |
|
$ |
(274 |
) |
Uniform Mortgage-Backed Security, TBA |
|
|
2.000 |
|
|
|
08/01/2055 |
|
|
|
1,950 |
|
|
|
(1,534 |
) |
|
|
(1,545 |
) |
Uniform Mortgage-Backed Security, TBA |
|
|
2.500 |
|
|
|
08/01/2055 |
|
|
|
600 |
|
|
|
(494 |
) |
|
|
(498 |
) |
Uniform Mortgage-Backed Security, TBA |
|
|
4.000 |
|
|
|
08/01/2055 |
|
|
|
1,900 |
|
|
|
(1,749 |
) |
|
|
(1,767 |
) |
Uniform Mortgage-Backed Security, TBA |
|
|
5.500 |
|
|
|
08/01/2055 |
|
|
|
1,900 |
|
|
|
(1,887 |
) |
|
|
(1,898 |
) |
Uniform Mortgage-Backed Security, TBA |
|
|
6.000 |
|
|
|
07/01/2055 |
|
|
|
27 |
|
|
|
(27 |
) |
|
|
(27 |
) |
Uniform Mortgage-Backed Security, TBA |
|
|
6.000 |
|
|
|
08/01/2055 |
|
|
|
273 |
|
|
|
(277 |
) |
|
|
(277 |
) |
|
| |
|
|
| |
|
|
| |
|
|
| |
|
|
|
|
|
|
|
| |
|
|
|
| |
|
|
| |
|
|
| |
|
|
|
|
|
|
|
|
| |
|
|
| |
|
|
| |
|
|
| |
|
|
|
|
|
|
|
BORROWINGS AND OTHER FINANCING TRANSACTIONS SUMMARY
The following is a summary by counterparty of the market value of Borrowings and Other Financing Transactions and collateral pledged/(received) as of June 30, 2025:
|
|
|
|
|
|
|
|
|
|
|
|
|
|
|
|
|
|
|
|
|
|
|
|
| |
|
|
Repurchase
Agreement
Proceeds
to be
Received |
|
|
Payable for
Reverse
Repurchase
Agreements |
|
|
Payable for Sale-Buyback Transactions |
|
|
Total
Borrowings and
Other Financing
Transactions |
|
|
Collateral
Pledged/(Received) |
|
|
|
|
Global/Master Repurchase Agreement |
|
| |
|
$ |
0 |
|
|
$ |
(603 |
) |
|
$ |
0 |
|
|
$ |
(603 |
) |
|
$ |
642 |
|
|
$ |
39 |
|
| |
|
|
0 |
|
|
|
(19,023 |
) |
|
|
0 |
|
|
|
(19,023 |
) |
|
|
24,077 |
|
|
|
5,054 |
|
| |
|
|
0 |
|
|
|
(4,231 |
) |
|
|
0 |
|
|
|
(4,231 |
) |
|
|
5,659 |
|
|
|
1,428 |
|
| |
|
|
0 |
|
|
|
(13,020 |
) |
|
|
0 |
|
|
|
(13,020 |
) |
|
|
14,153 |
|
|
|
1,133 |
|
| |
|
|
0 |
|
|
|
(6,268 |
) |
|
|
0 |
|
|
|
(6,268 |
) |
|
|
6,534 |
|
|
|
266 |
|
| |
|
|
0 |
|
|
|
(6,526 |
) |
|
|
0 |
|
|
|
(6,526 |
) |
|
|
8,066 |
|
|
|
1,540 |
|
| |
|
|
0 |
|
|
|
(4,050 |
) |
|
|
0 |
|
|
|
(4,050 |
) |
|
|
4,534 |
|
|
|
484 |
|
| |
|
|
0 |
|
|
|
(9,507 |
) |
|
|
0 |
|
|
|
(9,507 |
) |
|
|
10,174 |
|
|
|
667 |
|
| |
|
|
0 |
|
|
|
(2,602 |
) |
|
|
0 |
|
|
|
(2,602 |
) |
|
|
3,112 |
|
|
|
510 |
|
| |
|
|
0 |
|
|
|
(1,828 |
) |
|
|
0 |
|
|
|
(1,828 |
) |
|
|
2,355 |
|
|
|
527 |
|
| |
|
|
0 |
|
|
|
(1,993 |
) |
|
|
0 |
|
|
|
(1,993 |
) |
|
|
2,511 |
|
|
|
518 |
|
| |
|
|
0 |
|
|
|
(1,204 |
) |
|
|
0 |
|
|
|
(1,204 |
) |
|
|
1,430 |
|
|
|
226 |
|
| |
|
|
0 |
|
|
|
(916 |
) |
|
|
0 |
|
|
|
(916 |
) |
|
|
1,245 |
|
|
|
329 |
|
| |
|
|
0 |
|
|
|
(4,393 |
) |
|
|
0 |
|
|
|
(4,393 |
) |
|
|
4,627 |
|
|
|
234 |
|
| |
|
|
0 |
|
|
|
(16,811 |
) |
|
|
0 |
|
|
|
(16,811 |
) |
|
|
18,784 |
|
|
|
1,973 |
|
| |
|
|
0 |
|
|
|
(2,177 |
) |
|
|
0 |
|
|
|
(2,177 |
) |
|
|
2,234 |
|
|
|
57 |
|
|
| |
|
|
|
|
|
|
|
|
|
|
|
|
|
|
| |
|
|
| |
|
| |
Total Borrowings and Other Financing Transactions |
|
|
|
|
|
|
|
|
|
|
|
|
|
|
|
| |
|
|
| |
|
| |
|
| |
|
|
|
|
|
|
|
|
|
|
|
|
|
|
| |
|
|
| |
|
| |
CERTAIN TRANSFERS ACCOUNTED FOR AS SECURED BORROWINGS
Remaining Contractual Maturity of the Agreements
|
|
|
|
|
|
|
|
|
|
|
|
|
|
|
|
|
|
|
|
| |
| |
|
|
|
|
|
|
|
|
|
|
|
|
|
|
|
Reverse Repurchase Agreements |
|
| |
|
$ |
0 |
|
|
$ |
(17,294 |
) |
|
$ |
(19,593 |
) |
|
$ |
(16,072 |
) |
|
$ |
(52,959 |
) |
| |
|
|
0 |
|
|
|
(18,520 |
) |
|
|
0 |
|
|
|
(5,368 |
) |
|
|
(23,888 |
) |
Non-Agency Mortgage-Backed Securities |
|
|
0 |
|
|
|
(2,676 |
) |
|
|
(4,272 |
) |
|
|
(4,252 |
) |
|
|
(11,200 |
) |
| |
|
|
0 |
|
|
|
0 |
|
|
|
0 |
|
|
|
(2,563 |
) |
|
|
(2,563 |
) |
| |
|
|
0 |
|
|
|
(1,940 |
) |
|
|
(2,602 |
) |
|
|
0 |
|
|
|
(4,542 |
) |
|
| |
|
|
|
|
|
|
|
|
|
|
|
|
|
|
|
|
|
|
|
| |
|
|
|
|
|
|
|
|
|
|
|
|
|
|
|
|
|
|
|
|
|
| |
|
|
|
|
|
|
|
|
|
|
|
|
|
|
|
|
|
|
|
Payable for reverse repurchase agreements |
|
|
|
|
|
|
| |
|
|
| |
|
|
| |
|
|
| |
|
|
| |
|
|
|
|
Securities with an aggregate market value of $110,738 and cash of $400 have been pledged as collateral under the terms of the above master agreements as of June 30, 2025. |
|
The average amount of borrowings outstanding during the period ended June 30, 2025 was $(98,457) at a weighted average interest rate of 5.161%. Average borrowings may include reverse repurchase agreements and sale-buyback transactions, if held during the period. |
|
Open maturity reverse repurchase agreement. |
|
Net Exposure represents the net receivable/(payable) that would be due from/to the counterparty in the event of default. Exposure from borrowings and other financing transactions can only be netted across transactions governed under the same master agreement with the same legal entity. See Note 8, Master Netting Arrangements, in the Notes to Financial Statements for more information. |
|
|
|
|
|
|
|
|
|
|
|
|
| |
| See Accompanying Notes |
|
|
ANNUAL REPORT |
|
|
| |
|
|
JUNE 30, 2025 |
|
|
59 |
|
|
|
|
|
|
| |
|
|
PIMCO Strategic Income Fund, Inc. |
|
|
|
|
(k) FINANCIAL DERIVATIVE INSTRUMENTS: EXCHANGE-TRADED OR CENTRALLY CLEARED
FUTURES CONTRACTS:
LONG FUTURES CONTRACTS
|
|
|
|
|
|
|
|
|
|
|
|
|
|
|
|
|
|
|
|
|
|
|
|
| |
|
|
|
|
|
|
|
|
|
|
|
Unrealized
Appreciation/
(Depreciation) |
|
|
|
|
| |
|
|
|
|
|
U.S. Treasury 10-Year Note September Futures |
|
|
09/2025 |
|
|
|
18 |
|
|
$ |
2,018 |
|
|
$ |
35 |
|
|
$ |
6 |
|
|
$ |
0 |
|
|
| |
|
|
| |
|
|
| |
|
|
| |
|
|
|
|
|
|
|
|
|
|
|
SHORT FUTURES CONTRACTS
|
|
|
|
|
|
|
|
|
|
|
|
|
|
|
|
|
|
|
|
|
|
|
|
| |
|
|
|
|
|
|
|
|
|
|
|
Unrealized
Appreciation/
(Depreciation) |
|
|
|
|
| |
|
|
|
|
|
3-Month SOFR Active Contract December Futures |
|
|
03/2026 |
|
|
|
5 |
|
|
$ |
(1,204 |
) |
|
$ |
19 |
|
|
$ |
0 |
|
|
$ |
0 |
|
3-Month SOFR Active Contract June Futures |
|
|
09/2025 |
|
|
|
4 |
|
|
|
(957 |
) |
|
|
22 |
|
|
|
0 |
|
|
|
0 |
|
3-Month SOFR Active Contract March Futures |
|
|
06/2026 |
|
|
|
4 |
|
|
|
(966 |
) |
|
|
12 |
|
|
|
0 |
|
|
|
(1 |
) |
3-Month SOFR Active Contract September Futures |
|
|
12/2025 |
|
|
|
4 |
|
|
|
(960 |
) |
|
|
18 |
|
|
|
0 |
|
|
|
0 |
|
|
| |
|
|
| |
|
|
| |
|
|
| |
|
|
|
|
|
|
|
|
|
|
|
|
| |
|
|
| |
|
|
| |
|
|
| |
$ |
71 |
|
|
$ |
0 |
|
|
$ |
(1 |
) |
|
| |
|
|
| |
|
|
| |
|
|
| |
|
|
|
|
|
|
|
|
|
|
|
| |
|
|
|
|
|
|
|
|
|
|
|
|
|
|
|
| |
|
|
|
|
|
|
|
|
|
|
|
SWAP AGREEMENTS:
CREDIT DEFAULT SWAPS ON CORPORATE ISSUES - BUY PROTECTION
(1)
|
|
|
|
|
|
|
|
|
|
|
|
|
|
|
|
|
|
|
|
|
|
|
|
|
|
|
|
|
|
|
|
|
|
|
|
|
|
| |
|
|
|
|
|
|
|
|
|
|
Implied Credit Spread at June 30, 2025 (3) |
|
|
|
|
|
|
|
|
Unrealized
Appreciation/
(Depreciation) |
|
|
|
|
|
|
|
| |
|
|
|
|
|
| |
|
|
(1.000 |
)% |
|
Quarterly |
|
|
06/20/2026 |
|
|
|
0.296 |
% |
|
$ |
900 |
|
|
$ |
(2 |
) |
|
$ |
(4 |
) |
|
$ |
(6 |
) |
|
$ |
0 |
|
|
$ |
0 |
|
|
| |
|
|
| |
| |
|
|
| |
|
|
| |
|
|
| |
|
|
|
|
|
|
|
|
|
|
|
|
|
|
|
|
|
|
|
CREDIT DEFAULT SWAPS ON CORPORATE ISSUES - SELL PROTECTION
(2)
|
|
|
|
|
|
|
|
|
|
|
|
|
|
|
|
|
|
|
|
|
|
|
|
|
|
|
|
|
|
|
|
|
|
|
|
|
|
| |
|
|
|
|
|
|
|
|
|
|
Implied Credit Spread at June 30, 2025 (3) |
|
|
|
|
|
|
|
|
Unrealized
Appreciation/
(Depreciation) |
|
|
|
|
|
|
|
| |
|
|
|
|
|
| |
|
|
1.000 |
% |
|
Quarterly |
|
|
06/20/2028 |
|
|
|
0.431 |
% |
|
$ |
500 |
|
|
$ |
(5 |
) |
|
$ |
13 |
|
|
$ |
8 |
|
|
$ |
0 |
|
|
$ |
0 |
|
| |
|
|
1.000 |
|
|
Quarterly |
|
|
06/20/2030 |
|
|
|
0.742 |
|
|
|
1,200 |
|
|
|
3 |
|
|
|
12 |
|
|
|
15 |
|
|
|
1 |
|
|
|
0 |
|
|
| |
|
|
| |
| |
|
|
| |
|
|
| |
|
|
| |
|
|
|
|
|
|
|
|
|
|
|
|
|
|
|
|
|
|
|
|
|
| |
| |
|
|
| |
|
|
| |
$ |
(2 |
) |
|
$ |
25 |
|
|
$ |
23 |
|
|
$ |
1 |
|
|
$ |
0 |
|
|
|
| |
| |
|
|
| |
|
|
| |
|
|
|
|
|
|
|
|
|
|
|
|
|
|
|
|
|
|
|
INTEREST RATE SWAPS
|
|
|
|
|
|
|
|
|
|
|
|
|
|
|
|
|
|
|
|
|
|
|
|
|
|
|
|
|
|
|
|
|
|
|
|
|
|
|
|
| |
Pay/Receive
Floating Rate |
|
|
|
Fixed Rate |
|
|
|
|
|
|
|
|
|
|
|
|
|
Unrealized
Appreciation/
(Depreciation) |
|
|
|
|
|
|
|
| |
|
|
|
|
|
| |
|
1-Day GBP-SONIO Compounded-OIS |
|
|
3.500 |
% |
|
Annual |
|
|
03/19/2030 |
|
|
|
GBP |
|
|
|
14,400 |
|
|
$ |
(393 |
) |
|
$ |
214 |
|
|
$ |
(179 |
) |
|
$ |
0 |
|
|
$ |
(1 |
) |
| |
|
1-Day GBP-SONIO Compounded-OIS |
|
|
0.750 |
|
|
Annual |
|
|
09/21/2052 |
|
|
|
|
| |
|
5,900 |
|
|
|
680 |
|
|
|
4,322 |
|
|
|
5,002 |
|
|
|
14 |
|
|
|
0 |
|
| |
|
1-Day USD-SOFR Compounded-OIS |
|
|
2.300 |
|
|
Annual |
|
|
01/17/2026 |
|
|
|
$ |
|
|
|
700 |
|
|
|
0 |
|
|
|
14 |
|
|
|
14 |
|
|
|
0 |
|
|
|
0 |
|
| |
|
1-Day USD-SOFR Compounded-OIS |
|
|
1.350 |
|
|
|
|
|
01/20/2027 |
|
|
|
|
| |
|
3,200 |
|
|
|
(1 |
) |
|
|
132 |
|
|
|
131 |
|
|
|
0 |
|
|
|
0 |
|
| |
|
1-Day USD-SOFR Compounded-OIS |
|
|
1.360 |
|
|
Semi-Annual |
|
|
02/15/2027 |
|
|
|
|
| |
|
2,130 |
|
|
|
0 |
|
|
|
86 |
|
|
|
86 |
|
|
|
0 |
|
|
|
(1 |
) |
| |
|
1-Day USD-SOFR Compounded-OIS |
|
|
1.450 |
|
|
Semi-Annual |
|
|
02/17/2027 |
|
|
|
|
| |
|
3,500 |
|
|
|
(1 |
) |
|
|
135 |
|
|
|
134 |
|
|
|
0 |
|
|
|
(1 |
) |
| |
|
1-Day USD-SOFR Compounded-OIS |
|
|
1.420 |
|
|
Semi-Annual |
|
|
02/24/2027 |
|
|
|
|
| |
|
1,000 |
|
|
|
0 |
|
|
|
38 |
|
|
|
38 |
|
|
|
0 |
|
|
|
0 |
|
| |
|
1-Day USD-SOFR Compounded-OIS |
|
|
1.650 |
|
|
Semi-Annual |
|
|
02/24/2027 |
|
|
|
|
| |
|
3,400 |
|
|
|
(9 |
) |
|
|
(106 |
) |
|
|
(115 |
) |
|
|
1 |
|
|
|
0 |
|
| |
|
1-Day USD-SOFR Compounded-OIS |
|
|
1.000 |
|
|
Annual |
|
|
06/15/2027 |
|
|
|
|
| |
|
11,200 |
|
|
|
(763 |
) |
|
|
221 |
|
|
|
(542 |
) |
|
|
3 |
|
|
|
0 |
|
| |
|
1-Day USD-SOFR Compounded-OIS |
|
|
1.750 |
|
|
Annual |
|
|
06/15/2027 |
|
|
|
|
| |
|
28,200 |
|
|
|
(1,308 |
) |
|
|
350 |
|
|
|
(958 |
) |
|
|
9 |
|
|
|
0 |
|
| |
|
1-Day USD-SOFR Compounded-OIS |
|
|
2.000 |
|
|
Annual |
|
|
12/21/2027 |
|
|
|
|
| |
|
47,200 |
|
|
|
3,512 |
|
|
|
(1,326 |
) |
|
|
2,186 |
|
|
|
0 |
|
|
|
(27 |
) |
| |
|
1-Day USD-SOFR Compounded-OIS |
|
|
1.420 |
|
|
Semi-Annual |
|
|
08/17/2028 |
|
|
|
|
| |
|
3,800 |
|
|
|
(1 |
) |
|
|
255 |
|
|
|
254 |
|
|
|
0 |
|
|
|
(3 |
) |
| |
|
1-Day USD-SOFR Compounded-OIS |
|
|
1.370 |
|
|
Semi-Annual |
|
|
08/25/2028 |
|
|
|
|
| |
|
11,363 |
|
|
|
(3 |
) |
|
|
776 |
|
|
|
773 |
|
|
|
0 |
|
|
|
(8 |
) |
| |
|
1-Day USD-SOFR Compounded-OIS |
|
|
1.500 |
|
|
Semi-Annual |
|
|
12/15/2028 |
|
|
|
|
| |
|
7,141 |
|
|
|
97 |
|
|
|
(609 |
) |
|
|
(512 |
) |
|
|
6 |
|
|
|
0 |
|
| |
|
1-Day USD-SOFR Compounded-OIS |
|
|
3.750 |
|
|
Annual |
|
|
12/20/2028 |
|
|
|
|
| |
|
59,000 |
|
|
|
1,147 |
|
|
|
(1,632 |
) |
|
|
(485 |
) |
|
|
0 |
|
|
|
(62 |
) |
| |
|
1-Day USD-SOFR Compounded-OIS |
|
|
1.500 |
|
|
Semi-Annual |
|
|
01/12/2029 |
|
|
|
|
| |
|
2,365 |
|
|
|
0 |
|
|
|
177 |
|
|
|
177 |
|
|
|
0 |
|
|
|
(2 |
) |
| |
|
1-Day USD-SOFR Compounded-OIS |
|
|
1.700 |
|
|
Semi-Annual |
|
|
01/12/2029 |
|
|
|
|
| |
|
8,600 |
|
|
|
(26 |
) |
|
|
(553 |
) |
|
|
(579 |
) |
|
|
7 |
|
|
|
0 |
|
| |
|
1-Day USD-SOFR Compounded-OIS |
|
|
1.000 |
|
|
Annual |
|
|
06/15/2029 |
|
|
|
|
| |
|
2,810 |
|
|
|
(113 |
) |
|
|
(139 |
) |
|
|
(252 |
) |
|
|
3 |
|
|
|
0 |
|
| |
|
1-Day USD-SOFR Compounded-OIS |
|
|
1.750 |
|
|
Annual |
|
|
06/15/2029 |
|
|
|
|
| |
|
73,390 |
|
|
|
(5,265 |
) |
|
|
746 |
|
|
|
(4,519 |
) |
|
|
83 |
|
|
|
0 |
|
| |
|
1-Day USD-SOFR Compounded-OIS |
|
|
3.000 |
|
|
Semi-Annual |
|
|
06/19/2029 |
|
|
|
|
| |
|
44,200 |
|
|
|
2,283 |
|
|
|
(3,411 |
) |
|
|
(1,128 |
) |
|
|
51 |
|
|
|
0 |
|
| |
|
1-Day USD-SOFR Compounded-OIS |
|
|
3.750 |
|
|
Annual |
|
|
06/20/2029 |
|
|
|
|
| |
|
13,500 |
|
|
|
(254 |
) |
|
|
78 |
|
|
|
(176 |
) |
|
|
0 |
|
|
|
(17 |
) |
| |
|
1-Day USD-SOFR Compounded-OIS |
|
|
1.500 |
|
|
Semi-Annual |
|
|
12/18/2029 |
|
|
|
|
| |
|
4,500 |
|
|
|
(46 |
) |
|
|
(364 |
) |
|
|
(410 |
) |
|
|
6 |
|
|
|
0 |
|
| |
|
1-Day USD-SOFR Compounded-OIS |
|
|
2.000 |
|
|
Annual |
|
|
12/21/2029 |
|
|
|
|
| |
|
13,700 |
|
|
|
(1,410 |
) |
|
|
440 |
|
|
|
(970 |
) |
|
|
18 |
|
|
|
0 |
|
|
|
|
|
|
|
| |
60 |
|
PIMCO CLOSED-END FUNDS |
|
|
See Accompanying Notes |
|
|
|
|
|
|
|
|
|
|
|
|
|
|
|
|
|
|
|
|
|
|
|
|
|
|
|
|
|
|
|
|
|
|
|
|
|
|
|
|
|
| |
Pay/Receive
Floating Rate |
|
Floating Rate Index |
|
Fixed Rate |
|
|
Payment
Frequency |
|
|
Maturity
Date |
|
|
Notional
Amount |
|
|
Premiums
Paid/(Received) |
|
|
Unrealized
Appreciation/
(Depreciation) |
|
|
Market
Value |
|
|
Variation Margin |
|
| |
Asset |
|
|
Liability |
|
| |
|
1-Day USD-SOFR Compounded-OIS |
|
|
3.000 |
% |
|
|
Annual |
|
|
|
06/21/2030 |
|
|
$ |
|
|
6,800 |
|
|
$ |
179 |
|
|
$ |
(47 |
) |
|
$ |
132 |
|
|
$ |
0 |
|
|
$ |
(11 |
) |
| |
|
1-Day USD-SOFR Compounded-OIS |
|
|
1.000 |
|
|
|
Semi-Annual |
|
|
|
12/16/2030 |
|
|
| |
|
4,805 |
|
|
|
21 |
|
|
|
635 |
|
|
|
656 |
|
|
|
0 |
|
|
|
(7 |
) |
| |
|
1-Day USD-SOFR Compounded-OIS |
|
|
3.500 |
|
|
|
Annual |
|
|
|
12/20/2030 |
|
|
| |
|
3,900 |
|
|
|
259 |
|
|
|
(251 |
) |
|
|
8 |
|
|
|
0 |
|
|
|
(7 |
) |
| |
|
1-Day USD-SOFR Compounded-OIS |
|
|
1.750 |
|
|
|
Semi-Annual |
|
|
|
12/15/2031 |
|
|
| |
|
12,200 |
|
|
|
(165 |
) |
|
|
1,603 |
|
|
|
1,438 |
|
|
|
0 |
|
|
|
(25 |
) |
| |
|
1-Day USD-SOFR Compounded-OIS |
|
|
1.250 |
|
|
|
Annual |
|
|
|
06/15/2032 |
|
|
| |
|
38,250 |
|
|
|
4,949 |
|
|
|
483 |
|
|
|
5,432 |
|
|
|
0 |
|
|
|
(87 |
) |
| |
|
1-Day USD-SOFR Compounded-OIS |
|
|
1.750 |
|
|
|
Annual |
|
|
|
06/15/2032 |
|
|
| |
|
46,980 |
|
|
|
1,980 |
|
|
|
3,212 |
|
|
|
5,192 |
|
|
|
0 |
|
|
|
(109 |
) |
| |
|
1-Day USD-SOFR Compounded-OIS |
|
|
3.000 |
|
|
|
Annual |
|
|
|
06/21/2033 |
|
|
| |
|
8,305 |
|
|
|
320 |
|
|
|
17 |
|
|
|
337 |
|
|
|
0 |
|
|
|
(25 |
) |
| |
|
1-Day USD-SOFR Compounded-OIS |
|
|
3.500 |
|
|
|
Annual |
|
|
|
12/20/2033 |
|
|
| |
|
2,510 |
|
|
|
42 |
|
|
|
(10 |
) |
|
|
32 |
|
|
|
0 |
|
|
|
(8 |
) |
| |
|
1-Day USD-SOFR Compounded-OIS |
|
|
3.750 |
|
|
|
Annual |
|
|
|
06/20/2034 |
|
|
| |
|
1,300 |
|
|
|
(46 |
) |
|
|
35 |
|
|
|
(11 |
) |
|
|
0 |
|
|
|
(5 |
) |
| |
|
1-Day USD-SOFR Compounded-OIS |
|
|
3.750 |
|
|
|
Annual |
|
|
|
06/20/2034 |
|
|
| |
|
250 |
|
|
|
(7 |
) |
|
|
9 |
|
|
|
2 |
|
|
|
1 |
|
|
|
0 |
|
| |
|
1-Day USD-SOFR Compounded-OIS |
|
|
2.000 |
|
|
|
Semi-Annual |
|
|
|
01/15/2050 |
|
|
| |
|
4,400 |
|
|
|
(31 |
) |
|
|
1,593 |
|
|
|
1,562 |
|
|
|
0 |
|
|
|
(23 |
) |
| |
|
1-Day USD-SOFR Compounded-OIS |
|
|
1.750 |
|
|
|
Semi-Annual |
|
|
|
01/22/2050 |
|
|
| |
|
4,100 |
|
|
|
(10 |
) |
|
|
1,629 |
|
|
|
1,619 |
|
|
|
0 |
|
|
|
(20 |
) |
| |
|
1-Day USD-SOFR Compounded-OIS |
|
|
1.875 |
|
|
|
Semi-Annual |
|
|
|
02/07/2050 |
|
|
| |
|
1,400 |
|
|
|
(5 |
) |
|
|
528 |
|
|
|
523 |
|
|
|
0 |
|
|
|
(7 |
) |
| |
|
1-Day USD-SOFR Compounded-OIS |
|
|
1.250 |
|
|
|
Semi-Annual |
|
|
|
12/16/2050 |
|
|
| |
|
5,700 |
|
|
|
537 |
|
|
|
2,214 |
|
|
|
2,751 |
|
|
|
0 |
|
|
|
(26 |
) |
| |
|
1-Day USD-SOFR Compounded-OIS |
|
|
1.450 |
|
|
|
Semi-Annual |
|
|
|
04/07/2051 |
|
|
| |
|
3,500 |
|
|
|
(1 |
) |
|
|
1,603 |
|
|
|
1,602 |
|
|
|
0 |
|
|
|
(17 |
) |
| |
|
1-Day USD-SOFR Compounded-OIS |
|
|
1.650 |
|
|
|
Semi-Annual |
|
|
|
04/08/2051 |
|
|
| |
|
2,100 |
|
|
|
1 |
|
|
|
(893 |
) |
|
|
(892 |
) |
|
|
11 |
|
|
|
0 |
|
| |
|
1-Day USD-SOFR Compounded-OIS |
|
|
1.500 |
|
|
|
Annual |
|
|
|
06/15/2052 |
|
|
| |
|
2,800 |
|
|
|
(106 |
) |
|
|
(1,035 |
) |
|
|
(1,141 |
) |
|
|
15 |
|
|
|
0 |
|
| |
|
1-Day USD-SOFR Compounded-OIS |
|
|
1.750 |
|
|
|
Annual |
|
|
|
06/15/2052 |
|
|
| |
|
6,900 |
|
|
|
1,128 |
|
|
|
1,409 |
|
|
|
2,537 |
|
|
|
0 |
|
|
|
(38 |
) |
| |
|
|
|
|
11.823 |
|
|
|
Maturity |
|
|
|
01/04/2027 |
|
|
BRL |
|
|
40,300 |
|
|
|
0 |
|
|
|
294 |
|
|
|
294 |
|
|
|
0 |
|
|
|
(8 |
) |
| |
|
|
|
|
12.047 |
|
|
|
Maturity |
|
|
|
01/04/2027 |
|
|
| |
|
39,700 |
|
|
|
0 |
|
|
|
(251 |
) |
|
|
(251 |
) |
|
|
8 |
|
|
|
0 |
|
| |
|
|
|
|
2.250 |
|
|
|
Annual |
|
|
|
09/17/2030 |
|
|
EUR |
|
|
2,700 |
|
|
|
(39 |
) |
|
|
34 |
|
|
|
(5 |
) |
|
|
0 |
|
|
|
(3 |
) |
| |
|
|
|
|
0.500 |
|
|
|
Annual |
|
|
|
09/21/2052 |
|
|
| |
|
3,500 |
|
|
|
303 |
|
|
|
1,512 |
|
|
|
1,815 |
|
|
|
10 |
|
|
|
0 |
|
| |
|
|
|
|
0.830 |
|
|
|
Annual |
|
|
|
12/09/2052 |
|
|
| |
|
3,700 |
|
|
|
23 |
|
|
|
409 |
|
|
|
432 |
|
|
|
1 |
|
|
|
0 |
|
| |
|
|
|
|
3.500 |
|
|
|
|
|
|
|
06/19/2034 |
|
|
CAD |
|
|
2,000 |
|
|
|
69 |
|
|
|
1 |
|
|
|
70 |
|
|
|
4 |
|
|
|
0 |
|
| |
|
|
|
|
3.500 |
|
|
|
Semi-Annual |
|
|
|
06/20/2044 |
|
|
| |
|
1,300 |
|
|
|
14 |
|
|
|
(46 |
) |
|
|
(32 |
) |
|
|
0 |
|
|
|
(3 |
) |
|
| |
| |
|
|
| |
|
|
| |
|
|
| |
| |
|
|
| |
|
|
|
|
|
|
|
|
|
|
|
|
|
|
|
|
|
|
|
|
| |
| |
|
|
| |
|
|
| |
|
|
| |
| |
|
|
| |
$ |
7,541 |
|
|
$ |
14,531 |
|
|
$ |
22,072 |
|
|
$ |
251 |
|
|
$ |
(551 |
) |
|
| |
| |
|
|
| |
|
|
| |
|
|
| |
| |
|
|
| |
|
|
|
|
|
|
|
|
|
|
|
|
|
|
|
|
|
|
|
| |
|
| |
|
|
| |
|
|
| |
|
|
| |
| |
|
|
| |
|
|
|
|
|
|
|
|
|
|
|
|
|
|
|
|
|
|
|
|
| |
| |
|
|
| |
|
|
| |
|
|
| |
| |
|
|
| |
|
|
|
|
|
|
|
|
|
|
|
|
|
|
|
|
|
|
|
FINANCIAL DERIVATIVE INSTRUMENTS: EXCHANGE-TRADED OR CENTRALLY CLEARED SUMMARY
The following is a summary of the market value and variation margin of Exchange-Traded or Centrally Cleared Financial Derivative Instruments as of June 30, 2025:
|
|
|
|
|
|
|
|
|
|
|
|
|
|
|
|
|
|
|
|
|
|
|
|
|
|
|
|
|
|
|
|
|
|
|
|
| |
| |
|
Financial Derivative Assets |
|
|
|
|
|
Financial Derivative Liabilities |
|
| |
|
|
|
|
|
|
|
|
|
|
|
|
|
|
|
|
Variation Margin
Liability |
|
|
|
|
| |
|
|
|
|
|
|
|
|
|
|
|
|
|
|
|
|
|
|
|
|
|
Total Exchange-Traded or Centrally Cleared |
|
|
|
|
|
|
|
|
|
|
|
|
|
|
|
|
|
|
|
| |
|
|
|
|
|
|
|
|
|
|
|
|
|
|
|
|
| |
|
|
|
|
|
|
|
|
|
|
|
|
|
|
|
|
|
|
| |
|
|
|
|
|
|
|
|
|
|
|
|
|
|
|
Cash of $5,150 has been pledged as collateral for exchange-traded and centrally cleared financial derivative instruments as of June 30, 2025. See Note 8, Master Netting Arrangements, in the Notes to Financial Statements for more information.
|
If the Fund is a buyer of protection and a credit event occurs, as defined under the terms of that particular swap agreement, the Fund will either (i) receive from the seller of protection an amount equal to the notional amount of the swap and deliver the referenced obligation or underlying securities comprising the referenced index or (ii) receive a net settlement amount in the form of cash, securities or other deliverable obligations equal to the notional amount of the swap less the recovery value of the referenced obligation or underlying securities comprising the referenced index. |
|
If the Fund is a seller of protection and a credit event occurs, as defined under the terms of that particular swap agreement, the Fund will either (i) pay to the buyer of protection an amount equal to the notional amount of the swap and take delivery of the referenced obligation or underlying securities comprising the referenced index or (ii) pay a net settlement amount in the form of cash, securities or other deliverable obligations equal to the notional amount of the swap less the recovery value of the referenced obligation or underlying securities comprising the referenced index. |
|
Implied credit spreads, represented in absolute terms, utilized in determining the market value of credit default swap agreements on corporate or sovereign issues as of period end serve as indicators of the current status of the payment/performance risk and represent the likelihood or risk of default for the credit derivative. The implied credit spread of a particular referenced entity reflects the cost of buying/selling protection and may include upfront payments required to be made to enter into the agreement. Wider credit spreads represent a deterioration of the referenced entity’s credit soundness and a greater likelihood or risk of default or other credit event occurring as defined under the terms of the agreement. |
|
The maximum potential amount the Fund could be required to pay as a seller of credit protection or receive as a buyer of credit protection if a credit event occurs as defined under the terms of that particular swap agreement. |
|
The prices and resulting values for credit default swap agreements serve as indicators of the current status of the payment/performance risk and represent the likelihood of an expected liability (or profit) for the credit derivative should the notional amount of the swap agreement be closed/sold as of the period end. Increasing market values, in absolute terms when compared to the notional amount of the swap, represent a deterioration of the underlying referenced instrument’s credit soundness and a greater likelihood or risk of default or other credit event occurring as defined under the terms of the agreement. |
|
This instrument has a forward starting effective date. See Note 2, Securities Transactions and Investment Income, in the Notes to Financial Statements for further information. |
|
|
|
|
|
|
|
|
|
|
|
|
| |
| See Accompanying Notes |
|
|
ANNUAL REPORT |
|
|
| |
|
|
JUNE 30, 2025 |
|
|
61 |
|
|
|
|
|
|
| |
|
|
PIMCO Strategic Income Fund, Inc. |
|
|
|
|
(l) FINANCIAL DERIVATIVE INSTRUMENTS: OVER THE COUNTER
FORWARD FOREIGN CURRENCY CONTRACTS:
|
|
|
|
|
|
|
|
|
|
|
|
|
|
|
|
|
|
|
|
|
|
|
|
| |
|
|
|
|
|
|
|
|
|
|
|
Unrealized Appreciation/
(Depreciation) |
|
| |
|
|
|
|
|
| |
|
|
07/2025 |
|
|
EUR |
|
|
765 |
|
|
$ |
|
|
896 |
|
|
$ |
0 |
|
|
$ |
(5 |
) |
|
| |
|
08/2025 |
|
|
$ |
|
|
897 |
|
|
EUR |
|
|
765 |
|
|
|
5 |
|
|
|
0 |
|
|
|
|
|
|
|
|
| |
| |
|
|
07/2025 |
|
|
DOP |
|
|
6,009 |
|
|
$ |
|
|
101 |
|
|
|
1 |
|
|
|
0 |
|
|
| |
|
07/2025 |
|
|
EUR |
|
|
27,993 |
|
|
| |
|
31,829 |
|
|
|
0 |
|
|
|
(1,145 |
) |
|
| |
|
08/2025 |
|
|
DOP |
|
|
1,258 |
|
|
| |
|
21 |
|
|
|
0 |
|
|
|
0 |
|
|
|
|
|
|
|
|
| |
| |
|
|
07/2025 |
|
|
TRY |
|
|
2,179 |
|
|
| |
|
54 |
|
|
|
0 |
|
|
|
0 |
|
|
| |
|
07/2025 |
|
|
$ |
|
|
126 |
|
|
EUR |
|
|
109 |
|
|
|
2 |
|
|
|
0 |
|
|
|
|
|
|
|
|
| |
| |
|
|
07/2025 |
|
|
EUR |
|
|
2,052 |
|
|
$ |
|
|
2,330 |
|
|
|
0 |
|
|
|
(87 |
) |
|
| |
|
07/2025 |
|
|
TRY |
|
|
4,760 |
|
|
| |
|
115 |
|
|
|
0 |
|
|
|
(2 |
) |
|
| |
|
07/2025 |
|
|
$ |
|
|
272 |
|
|
EUR |
|
|
238 |
|
|
|
9 |
|
|
|
0 |
|
|
| |
|
07/2025 |
|
|
| |
|
7,252 |
|
|
GBP |
|
|
5,330 |
|
|
|
64 |
|
|
|
0 |
|
|
| |
|
07/2025 |
|
|
| |
|
1,380 |
|
|
TRY |
|
|
56,204 |
|
|
|
24 |
|
|
|
0 |
|
|
| |
|
08/2025 |
|
|
GBP |
|
|
5,330 |
|
|
$ |
|
|
7,253 |
|
|
|
0 |
|
|
|
(64 |
) |
|
| |
|
08/2025 |
|
|
$ |
|
|
1,535 |
|
|
TRY |
|
|
63,749 |
|
|
|
13 |
|
|
|
0 |
|
|
|
|
|
|
|
|
| |
| |
|
|
07/2025 |
|
|
EUR |
|
|
295 |
|
|
$ |
|
|
337 |
|
|
|
0 |
|
|
|
(10 |
) |
|
| |
|
07/2025 |
|
|
$ |
|
|
283 |
|
|
GBP |
|
|
209 |
|
|
|
4 |
|
|
|
0 |
|
|
|
|
|
|
|
|
| |
| |
|
|
07/2025 |
|
|
| |
|
31,178 |
|
|
EUR |
|
|
26,875 |
|
|
|
480 |
|
|
|
0 |
|
|
| |
|
08/2025 |
|
|
EUR |
|
|
26,816 |
|
|
$ |
|
|
31,177 |
|
|
|
0 |
|
|
|
(479 |
) |
|
| |
|
09/2025 |
|
|
$ |
|
|
0 |
|
|
MXN |
|
|
4 |
|
|
|
0 |
|
|
|
0 |
|
|
|
|
|
|
|
|
| |
| |
|
|
07/2025 |
|
|
BRL |
|
|
549 |
|
|
$ |
|
|
99 |
|
|
|
0 |
|
|
|
(2 |
) |
|
| |
|
07/2025 |
|
|
$ |
|
|
96 |
|
|
BRL |
|
|
549 |
|
|
|
5 |
|
|
|
0 |
|
|
| |
|
09/2025 |
|
|
MXN |
|
|
3,045 |
|
|
$ |
|
|
156 |
|
|
|
0 |
|
|
|
(5 |
) |
|
| |
|
09/2025 |
|
|
$ |
|
|
99 |
|
|
BRL |
|
|
557 |
|
|
|
2 |
|
|
|
0 |
|
|
|
|
|
|
|
|
| |
| |
|
|
08/2025 |
|
|
DOP |
|
|
55,440 |
|
|
$ |
|
|
867 |
|
|
|
0 |
|
|
|
(50 |
) |
|
| |
|
09/2025 |
|
|
| |
|
13,739 |
|
|
| |
|
219 |
|
|
|
1 |
|
|
|
(8 |
) |
|
|
|
|
|
|
|
| |
| |
|
|
07/2025 |
|
|
CAD |
|
|
102 |
|
|
| |
|
74 |
|
|
|
0 |
|
|
|
(1 |
) |
|
| |
|
07/2025 |
|
|
EUR |
|
|
430 |
|
|
| |
|
494 |
|
|
|
0 |
|
|
|
(13 |
) |
|
| |
|
07/2025 |
|
|
$ |
|
|
74 |
|
|
CAD |
|
|
102 |
|
|
|
1 |
|
|
|
0 |
|
|
| |
|
07/2025 |
|
|
| |
|
3,122 |
|
|
EUR |
|
|
2,713 |
|
|
|
73 |
|
|
|
0 |
|
|
| |
|
08/2025 |
|
|
CAD |
|
|
102 |
|
|
$ |
|
|
74 |
|
|
|
0 |
|
|
|
(1 |
) |
|
| |
|
08/2025 |
|
|
$ |
|
|
130 |
|
|
EUR |
|
|
111 |
|
|
|
1 |
|
|
|
0 |
|
|
|
|
|
|
|
|
| |
| |
|
|
08/2025 |
|
|
| |
|
618 |
|
|
TRY |
|
|
25,806 |
|
|
|
7 |
|
|
|
0 |
|
|
|
|
|
|
|
|
| |
| |
|
|
07/2025 |
|
|
| |
|
1,830 |
|
|
EUR |
|
|
1,600 |
|
|
|
54 |
|
|
|
0 |
|
|
|
|
|
|
|
|
| |
| |
|
|
07/2025 |
|
|
GBP |
|
|
5,539 |
|
|
$ |
|
|
7,500 |
|
|
|
0 |
|
|
|
(103 |
) |
|
| |
|
|
| |
| |
|
|
| |
| |
|
|
| |
|
|
|
|
|
|
|
Total Forward Foreign Currency Contracts |
|
|
|
|
|
|
|
|
|
|
|
| |
|
|
|
|
|
|
|
SWAP AGREEMENTS:
CREDIT DEFAULT SWAPS ON CORPORATE AND SOVEREIGN ISSUES - SELL PROTECTION
(1)
|
|
|
|
|
|
|
|
|
|
|
|
|
|
|
|
|
|
|
|
|
|
|
|
|
|
|
|
|
|
|
|
|
|
|
|
|
|
| |
| Counterparty |
|
Reference Entity |
|
Fixed
Receive Rate |
|
|
Payment
Frequency |
|
|
Maturity
Date |
|
|
Implied Credit Spread at June 30, 2025 (2) |
|
|
|
|
|
Premiums
Paid/(Received) |
|
|
Unrealized
Appreciation/
(Depreciation) |
|
|
Swap Agreements, at Value (4) |
|
| |
|
|
|
|
|
BOA |
|
Panama Government International Bond |
|
|
1.000 |
% |
|
|
Quarterly |
|
|
|
12/20/2028 |
|
|
|
1.421 |
% |
|
|
$ 1,500 |
|
|
$ |
(62 |
) |
|
$ |
42 |
|
|
$ |
0 |
|
|
$ |
(20 |
) |
|
|
|
|
|
|
|
|
|
|
| |
BPS |
|
Romania Government International Bond |
|
|
1.000 |
|
|
|
Quarterly |
|
|
|
12/20/2025 |
|
|
|
0.758 |
|
|
|
500 |
|
|
|
1 |
|
|
|
0 |
|
|
|
1 |
|
|
|
0 |
|
|
|
|
|
|
|
|
|
|
|
| |
BRC |
|
Egypt Government International Bond |
|
|
1.000 |
|
|
|
Quarterly |
|
|
|
12/20/2028 |
|
|
|
4.462 |
|
|
|
700 |
|
|
|
(121 |
) |
|
|
48 |
|
|
|
0 |
|
|
|
(73 |
) |
|
| |
Egypt Government International Bond |
|
|
1.000 |
|
|
|
Quarterly |
|
|
|
06/20/2029 |
|
|
|
4.645 |
|
|
|
400 |
|
|
|
(86 |
) |
|
|
37 |
|
|
|
0 |
|
|
|
(49 |
) |
|
| |
Panama Government International Bond |
|
|
1.000 |
|
|
|
Quarterly |
|
|
|
12/20/2028 |
|
|
|
1.421 |
|
|
|
1,600 |
|
|
|
(66 |
) |
|
|
45 |
|
|
|
0 |
|
|
|
(21 |
) |
|
|
|
|
|
|
|
|
|
|
| |
CBK |
|
Israel Government International Bond |
|
|
1.000 |
|
|
|
Quarterly |
|
|
|
06/20/2027 |
|
|
|
0.603 |
|
|
|
1,100 |
|
|
|
(6 |
) |
|
|
15 |
|
|
|
9 |
|
|
|
0 |
|
|
| |
Israel Government International Bond |
|
|
1.000 |
|
|
|
Quarterly |
|
|
|
06/20/2030 |
|
|
|
0.908 |
|
|
|
100 |
|
|
|
(1 |
) |
|
|
1 |
|
|
|
0 |
|
|
|
0 |
|
|
|
|
|
|
|
|
|
|
|
| |
GST |
|
|
|
|
5.000 |
|
|
|
Quarterly |
|
|
|
06/20/2027 |
|
|
|
0.720 |
|
|
|
500 |
|
|
|
70 |
|
|
|
(28 |
) |
|
|
42 |
|
|
|
0 |
|
|
| |
|
|
|
1.000 |
|
|
|
Quarterly |
|
|
|
06/20/2026 |
|
|
|
1.490 |
|
|
|
2,400 |
|
|
|
(20 |
) |
|
|
9 |
|
|
|
0 |
|
|
|
(11 |
) |
|
|
|
|
|
|
|
|
|
|
| |
JPM |
|
Israel Government International Bond |
|
|
1.000 |
|
|
|
Quarterly |
|
|
|
06/20/2030 |
|
|
|
0.908 |
|
|
|
100 |
|
|
|
(1 |
) |
|
|
1 |
|
|
|
0 |
|
|
|
0 |
|
|
|
|
|
|
|
|
|
|
|
| |
MYC |
|
|
|
|
1.000 |
|
|
|
Quarterly |
|
|
|
12/20/2028 |
|
|
|
3.804 |
|
|
|
200 |
|
|
|
(39 |
) |
|
|
22 |
|
|
|
0 |
|
|
|
(17 |
) |
|
| |
| |
|
|
| |
|
|
| |
|
|
| |
|
|
| |
|
|
| |
|
|
|
|
|
|
|
|
|
|
|
|
|
|
|
| |
|
|
|
| |
|
|
| |
|
|
| |
|
|
| |
|
|
| |
|
|
|
|
|
|
|
|
|
|
|
|
|
|
|
|
| |
| |
|
|
| |
|
|
| |
|
|
| |
|
|
| |
|
|
| |
|
|
|
|
|
|
|
|
|
|
|
|
|
|
|
FINANCIAL DERIVATIVE INSTRUMENTS: OVER THE COUNTER SUMMARY
The following is a summary by counterparty of the market value of OTC financial derivative instruments and collateral pledged/(received) as of June 30, 2025:
|
|
|
|
|
|
|
|
|
|
|
|
|
|
|
|
|
|
|
|
|
|
|
|
|
|
|
|
|
|
|
|
|
|
|
|
|
|
|
|
|
|
|
|
|
|
|
|
| |
| |
|
Financial Derivative Assets |
|
|
|
|
|
Financial Derivative Liabilities |
|
|
|
|
|
|
|
|
|
|
|
|
Forward
Foreign
Currency
Contracts |
|
|
|
|
|
|
|
|
|
|
|
|
|
|
Forward
Foreign
Currency
Contracts |
|
|
|
|
|
|
|
|
|
|
|
Net Market
Value of OTC
Derivatives |
|
|
Collateral
Pledged/
(Received) |
|
|
|
|
| |
|
$ |
5 |
|
|
$ |
0 |
|
|
$ |
0 |
|
|
$ |
5 |
|
|
|
|
| |
$ |
(5 |
) |
|
$ |
0 |
|
|
$ |
0 |
|
|
$ |
(5 |
) |
|
$ |
0 |
|
|
$ |
0 |
|
|
$ |
0 |
|
| |
|
|
1 |
|
|
|
0 |
|
|
|
0 |
|
|
|
1 |
|
|
|
|
| |
|
(1,145 |
) |
|
|
0 |
|
|
|
(20 |
) |
|
|
(1,165 |
) |
|
|
(1,164 |
) |
|
|
1,019 |
|
|
|
(145 |
) |
| |
|
|
2 |
|
|
|
0 |
|
|
|
1 |
|
|
|
3 |
|
|
|
|
| |
|
0 |
|
|
|
0 |
|
|
|
0 |
|
|
|
0 |
|
|
|
3 |
|
|
|
0 |
|
|
|
3 |
|
| |
|
|
110 |
|
|
|
0 |
|
|
|
0 |
|
|
|
110 |
|
|
|
|
| |
|
(153 |
) |
|
|
0 |
|
|
|
(143 |
) |
|
|
(296 |
) |
|
|
(186 |
) |
|
|
307 |
|
|
|
121 |
|
| |
|
|
4 |
|
|
|
0 |
|
|
|
9 |
|
|
|
13 |
|
|
|
|
| |
|
(10 |
) |
|
|
0 |
|
|
|
0 |
|
|
|
(10 |
) |
|
|
3 |
|
|
|
0 |
|
|
|
3 |
|
| |
|
|
480 |
|
|
|
0 |
|
|
|
0 |
|
|
|
480 |
|
|
|
|
| |
|
(479 |
) |
|
|
0 |
|
|
|
0 |
|
|
|
(479 |
) |
|
|
1 |
|
|
|
0 |
|
|
|
1 |
|
| |
|
|
7 |
|
|
|
0 |
|
|
|
0 |
|
|
|
7 |
|
|
|
|
| |
|
(7 |
) |
|
|
0 |
|
|
|
0 |
|
|
|
(7 |
) |
|
|
0 |
|
|
|
0 |
|
|
|
0 |
|
| |
|
|
1 |
|
|
|
0 |
|
|
|
0 |
|
|
|
1 |
|
|
|
|
| |
|
(58 |
) |
|
|
0 |
|
|
|
0 |
|
|
|
(58 |
) |
|
|
(57 |
) |
|
|
0 |
|
|
|
(57 |
) |
| |
|
|
0 |
|
|
|
0 |
|
|
|
42 |
|
|
|
42 |
|
|
|
|
| |
|
0 |
|
|
|
0 |
|
|
|
(11 |
) |
|
|
(11 |
) |
|
|
31 |
|
|
|
0 |
|
|
|
31 |
|
| |
|
|
75 |
|
|
|
0 |
|
|
|
0 |
|
|
|
75 |
|
|
|
|
| |
|
(15 |
) |
|
|
0 |
|
|
|
0 |
|
|
|
(15 |
) |
|
|
60 |
|
|
|
0 |
|
|
|
60 |
|
| |
|
|
0 |
|
|
|
0 |
|
|
|
0 |
|
|
|
0 |
|
|
|
|
| |
|
0 |
|
|
|
0 |
|
|
|
(17 |
) |
|
|
(17 |
) |
|
|
(17 |
) |
|
|
0 |
|
|
|
(17 |
) |
| |
|
|
7 |
|
|
|
0 |
|
|
|
0 |
|
|
|
7 |
|
|
|
|
| |
|
0 |
|
|
|
0 |
|
|
|
0 |
|
|
|
0 |
|
|
|
7 |
|
|
|
0 |
|
|
|
7 |
|
| |
|
|
54 |
|
|
|
0 |
|
|
|
0 |
|
|
|
54 |
|
|
|
|
| |
|
0 |
|
|
|
0 |
|
|
|
0 |
|
|
|
0 |
|
|
|
54 |
|
|
|
0 |
|
|
|
54 |
|
| |
|
|
0 |
|
|
|
0 |
|
|
|
0 |
|
|
|
0 |
|
|
|
|
| |
|
(103 |
) |
|
|
0 |
|
|
|
0 |
|
|
|
(103 |
) |
|
|
(103 |
) |
|
|
0 |
|
|
|
(103 |
) |
|
| |
|
|
|
|
|
|
|
|
|
|
|
|
|
|
|
|
|
|
| |
|
|
|
|
|
|
|
|
|
|
|
|
|
|
|
|
|
|
| |
|
|
| |
|
| |
| |
|
|
|
|
|
|
|
|
|
|
|
|
|
|
|
|
|
|
|
| |
|
|
|
|
|
|
|
|
|
|
|
|
|
|
|
|
|
|
| |
|
|
| |
|
| |
|
| |
|
|
|
|
|
|
|
|
|
|
|
|
|
|
|
|
|
|
| |
|
|
|
|
|
|
|
|
|
|
|
|
|
|
|
|
|
|
| |
|
|
| |
|
| |
|
Securities with an aggregate market value of $1,326 have been pledged as collateral for financial derivative instruments as governed by International Swaps and Derivatives Association, Inc. master agreements as of June 30, 2025. |
|
If the Fund is a seller of protection and a credit event occurs, as defined under the terms of that particular swap agreement, the Fund will either (i) pay to the buyer of protection an amount equal to the notional amount of the swap and take delivery of the referenced obligation or underlying securities comprising the referenced index or (ii) pay a net settlement amount in the form of cash, securities or other deliverable obligations equal to the notional amount of the swap less the recovery value of the referenced obligation or underlying securities comprising the referenced index. |
|
Implied credit spreads, represented in absolute terms, utilized in determining the market value of credit default swap agreements on corporate or sovereign issues as of period end serve as indicators of the current status of the payment/performance risk and represent the likelihood or risk of default for the credit derivative. The implied credit spread of a particular referenced entity reflects the cost of buying/selling protection and may include upfront payments required to be made to enter into the agreement. Wider credit spreads represent a deterioration of the referenced entity’s credit soundness and a greater likelihood or risk of default or other credit event occurring as defined under the terms of the agreement. |
|
The maximum potential amount the Fund could be required to pay as a seller of credit protection or receive as a buyer of credit protection if a credit event occurs as defined under the terms of that particular swap agreement. |
|
The prices and resulting values for credit default swap agreements serve as indicators of the current status of the payment/performance risk and represent the likelihood of an expected liability (or profit) for the credit derivative should the notional amount of the swap agreement be closed/sold as of the period end. Increasing market values, in absolute terms when compared to the notional amount of the swap, represent a deterioration of the underlying referenced instrument’s credit soundness and a greater likelihood or risk of default or other credit event occurring as defined under the terms of the agreement. |
|
Net Exposure represents the net receivable/(payable) that would be due from/to the counterparty in the event of default. Exposure from OTC financial derivative instruments can only be netted across transactions governed under the same master agreement with the same legal entity. See Note 8, Master Netting Arrangements, in the Notes to Financial Statements for more information. |
FAIR VALUE OF FINANCIAL DERIVATIVE INSTRUMENTS
The following is a summary of the fair valuation of the Fund’s derivative instruments categorized by risk exposure. See Note 7, Principal and Other Risks, in the Notes to Financial Statements on risks of the Fund.
Fair Values of Financial Derivative Instruments on the Statements of Assets and Liabilities as of June 30, 2025:
|
|
|
|
|
|
|
|
|
|
|
|
|
|
|
|
|
|
|
|
|
|
|
|
| |
| |
|
Derivatives not accounted for as hedging instruments |
|
| |
|
|
|
|
|
|
|
|
|
|
|
|
|
|
|
|
|
|
Financial Derivative Instruments - Assets |
|
Exchange-traded or centrally cleared |
|
| |
|
$ |
0 |
|
|
$ |
0 |
|
|
$ |
0 |
|
|
$ |
0 |
|
|
$ |
6 |
|
|
$ |
6 |
|
| |
|
|
0 |
|
|
|
1 |
|
|
|
0 |
|
|
|
0 |
|
|
|
251 |
|
|
|
252 |
|
|
| |
|
|
|
|
|
|
|
|
|
|
|
|
|
|
|
|
|
|
|
|
|
|
|
|
| |
$ |
0 |
|
|
$ |
1 |
|
|
$ |
0 |
|
|
$ |
0 |
|
|
$ |
257 |
|
|
$ |
258 |
|
|
| |
|
|
|
|
|
|
|
|
|
|
|
|
|
|
|
|
|
|
|
|
|
|
|
| |
|
Forward Foreign Currency Contracts |
|
$ |
0 |
|
|
$ |
0 |
|
|
$ |
0 |
|
|
$ |
746 |
|
|
$ |
0 |
|
|
$ |
746 |
|
| |
|
|
0 |
|
|
|
52 |
|
|
|
0 |
|
|
|
0 |
|
|
|
0 |
|
|
|
52 |
|
|
| |
|
|
|
|
|
|
|
|
|
|
|
|
|
|
|
|
|
|
|
|
|
|
|
|
| |
$ |
0 |
|
|
$ |
52 |
|
|
$ |
0 |
|
|
$ |
746 |
|
|
$ |
0 |
|
|
$ |
798 |
|
|
| |
|
|
|
|
|
|
|
|
|
|
|
|
|
|
|
|
|
|
|
|
|
|
|
|
| |
$ |
0 |
|
|
$ |
53 |
|
|
$ |
0 |
|
|
$ |
746 |
|
|
$ |
257 |
|
|
$ |
1,056 |
|
|
| |
|
|
|
|
|
|
|
|
|
|
|
|
|
|
|
|
|
|
|
|
|
|
|
|
|
|
|
|
|
|
|
|
|
|
|
| |
See Accompanying Notes |
|
|
|
|
|
| |
|
|
JUNE 30, 2025 |
|
|
|
|
|
|
|
|
|
| |
|
|
PIMCO Strategic Income Fund, Inc. |
|
|
|
|
|
|
|
|
|
|
|
|
|
|
|
|
|
|
|
|
|
|
|
|
|
|
|
|
| |
| |
|
Derivatives not accounted for as hedging instruments |
|
| |
|
Commodity
Contracts |
|
|
Credit
Contracts |
|
|
Equity
Contracts |
|
|
Foreign
Exchange
Contracts |
|
|
Interest
Rate Contracts |
|
|
Total |
|
Financial Derivative Instruments - Liabilities |
|
Exchange-traded or centrally cleared |
|
| |
|
$ |
0 |
|
|
$ |
0 |
|
|
$ |
0 |
|
|
$ |
0 |
|
|
$ |
1 |
|
|
$ |
1 |
|
| |
|
|
0 |
|
|
|
0 |
|
|
|
0 |
|
|
|
0 |
|
|
|
551 |
|
|
|
551 |
|
|
| |
|
|
|
|
|
|
|
|
|
|
|
|
|
|
|
|
|
|
|
|
|
|
|
|
| |
$ |
0 |
|
|
$ |
0 |
|
|
$ |
0 |
|
|
$ |
0 |
|
|
$ |
552 |
|
|
$ |
552 |
|
|
| |
|
|
|
|
|
|
|
|
|
|
|
|
|
|
|
|
|
|
|
|
|
|
|
| |
|
Forward Foreign Currency Contracts |
|
$ |
0 |
|
|
$ |
0 |
|
|
$ |
0 |
|
|
$ |
1,975 |
|
|
$ |
0 |
|
|
$ |
1,975 |
|
| |
|
|
0 |
|
|
|
191 |
|
|
|
0 |
|
|
|
0 |
|
|
|
0 |
|
|
|
191 |
|
|
| |
|
|
|
|
|
|
|
|
|
|
|
|
|
|
|
|
|
|
|
|
|
|
|
|
| |
$ |
0 |
|
|
$ |
191 |
|
|
$ |
0 |
|
|
$ |
1,975 |
|
|
$ |
0 |
|
|
$ |
2,166 |
|
|
| |
|
|
|
|
|
|
|
|
|
|
|
|
|
|
|
|
|
|
|
|
|
|
|
|
| |
$ |
0 |
|
|
$ |
191 |
|
|
$ |
0 |
|
|
$ |
1,975 |
|
|
$ |
552 |
|
|
$ |
2,718 |
|
|
| |
|
|
|
|
|
|
|
|
|
|
|
|
|
|
|
|
|
|
|
|
|
|
|
The effect of Financial Derivative Instruments on the Statements of Operations for the period ended June 30, 2025:
|
|
|
|
|
|
|
|
|
|
|
|
|
|
|
|
|
|
|
|
|
|
|
|
| |
| |
|
Derivatives not accounted for as hedging instruments |
|
| |
|
|
|
|
|
|
|
|
|
|
|
|
|
|
|
|
|
|
Net Realized Gain (Loss) on Financial Derivative Instruments |
|
Exchange-traded or centrally cleared |
|
| |
|
$ |
0 |
|
|
$ |
0 |
|
|
$ |
0 |
|
|
$ |
0 |
|
|
$ |
52 |
|
|
$ |
52 |
|
| |
|
|
0 |
|
|
|
47 |
|
|
|
0 |
|
|
|
0 |
|
|
|
4,266 |
|
|
|
4,313 |
|
|
| |
|
|
|
|
|
|
|
|
|
|
|
|
|
|
|
|
|
|
|
|
|
|
|
|
| |
$ |
0 |
|
|
$ |
47 |
|
|
$ |
0 |
|
|
$ |
0 |
|
|
$ |
4,318 |
|
|
$ |
4,365 |
|
|
| |
|
|
|
|
|
|
|
|
|
|
|
|
|
|
|
|
|
|
|
|
|
|
|
| |
|
Forward Foreign Currency Contracts |
|
$ |
0 |
|
|
$ |
0 |
|
|
$ |
0 |
|
|
$ |
(1,087 |
) |
|
$ |
0 |
|
|
$ |
(1,087 |
) |
| |
|
|
0 |
|
|
|
94 |
|
|
|
0 |
|
|
|
0 |
|
|
|
0 |
|
|
|
94 |
|
|
| |
|
|
|
|
|
|
|
|
|
|
|
|
|
|
|
|
|
|
|
|
|
|
|
|
| |
$ |
0 |
|
|
$ |
94 |
|
|
$ |
0 |
|
|
$ |
(1,087 |
) |
|
$ |
0 |
|
|
$ |
(993 |
) |
|
| |
|
|
|
|
|
|
|
|
|
|
|
|
|
|
|
|
|
|
|
|
|
|
|
|
| |
$ |
0 |
|
|
$ |
141 |
|
|
$ |
0 |
|
|
$ |
(1,087 |
) |
|
$ |
4,318 |
|
|
$ |
3,372 |
|
|
| |
|
|
|
|
|
|
|
|
|
|
|
|
|
|
|
|
|
|
|
|
|
|
|
|
Net Change in Unrealized Appreciation (Depreciation) on Financial Derivative Instruments |
|
Exchange-traded or centrally cleared |
|
| |
|
$ |
0 |
|
|
$ |
0 |
|
|
$ |
0 |
|
|
$ |
0 |
|
|
$ |
(111 |
) |
|
$ |
(111 |
) |
| |
|
|
0 |
|
|
|
9 |
|
|
|
0 |
|
|
|
0 |
|
|
|
(3,544 |
) |
|
|
(3,535 |
) |
|
| |
|
|
|
|
|
|
|
|
|
|
|
|
|
|
|
|
|
|
|
|
|
|
|
|
| |
$ |
0 |
|
|
$ |
9 |
|
|
$ |
0 |
|
|
$ |
0 |
|
|
$ |
(3,655 |
) |
|
$ |
(3,646 |
) |
|
| |
|
|
|
|
|
|
|
|
|
|
|
|
|
|
|
|
|
|
|
|
|
|
|
| |
|
Forward Foreign Currency Contracts |
|
$ |
0 |
|
|
$ |
0 |
|
|
$ |
0 |
|
|
$ |
(1,668 |
) |
|
$ |
0 |
|
|
$ |
(1,668 |
) |
| |
|
|
0 |
|
|
|
145 |
|
|
|
0 |
|
|
|
0 |
|
|
|
0 |
|
|
|
145 |
|
|
| |
|
|
|
|
|
|
|
|
|
|
|
|
|
|
|
|
|
|
|
|
|
|
|
|
| |
$ |
0 |
|
|
$ |
145 |
|
|
$ |
0 |
|
|
$ |
(1,668 |
) |
|
$ |
0 |
|
|
$ |
(1,523 |
) |
|
| |
|
|
|
|
|
|
|
|
|
|
|
|
|
|
|
|
|
|
|
|
|
|
|
|
| |
$ |
0 |
|
|
$ |
154 |
|
|
$ |
0 |
|
|
$ |
(1,668 |
) |
|
$ |
(3,655 |
) |
|
$ |
(5,169 |
) |
|
| |
|
|
|
|
|
|
|
|
|
|
|
|
|
|
|
|
|
|
|
|
|
|
|
FAIR VALUE MEASUREMENTS
The following is a summary of the fair valuations according to the inputs used as of June 30, 2025 in valuing the Fund’s assets and
liabilities:
|
|
|
|
|
|
|
|
|
|
|
|
|
|
|
|
| |
|
|
|
|
|
|
|
|
|
|
|
|
|
Investments in Securities, at Value |
|
Loan Participations and Assignments |
|
$ |
0 |
|
|
$ |
35,456 |
|
|
$ |
5,655 |
|
|
$ |
41,111 |
|
| |
|
| |
|
|
0 |
|
|
|
35,090 |
|
|
|
0 |
|
|
|
35,090 |
|
| |
|
|
1,400 |
|
|
|
47,277 |
|
|
|
8,899 |
|
|
|
57,576 |
|
| |
|
|
0 |
|
|
|
10,642 |
|
|
|
0 |
|
|
|
10,642 |
|
Convertible Bonds & Notes |
|
| |
|
|
0 |
|
|
|
83 |
|
|
|
0 |
|
|
|
83 |
|
| |
|
| |
|
|
0 |
|
|
|
876 |
|
|
|
0 |
|
|
|
876 |
|
| |
|
|
0 |
|
|
|
12 |
|
|
|
0 |
|
|
|
12 |
|
| |
|
|
0 |
|
|
|
2,334 |
|
|
|
0 |
|
|
|
2,334 |
|
| |
|
|
0 |
|
|
|
877 |
|
|
|
0 |
|
|
|
877 |
|
| |
|
|
0 |
|
|
|
2,315 |
|
|
|
0 |
|
|
|
2,315 |
|
| |
|
|
0 |
|
|
|
341,793 |
|
|
|
0 |
|
|
|
341,793 |
|
Non-Agency Mortgage-Backed Securities |
|
|
0 |
|
|
|
45,292 |
|
|
|
0 |
|
|
|
45,292 |
|
|
|
|
|
|
|
|
|
|
|
|
|
|
|
|
|
| |
Category and Subcategory |
|
Level 1 |
|
|
Level 2 |
|
|
Level 3 |
|
|
Fair
Value at
06/30/2025 |
|
| |
|
|
|
| |
|
|
| |
|
|
| |
|
| |
| |
|
$ |
0 |
|
|
$ |
3,278 |
|
|
$ |
0 |
|
|
$ |
3,278 |
|
Manufacturing House ABS Other |
|
|
0 |
|
|
|
1 |
|
|
|
0 |
|
|
|
1 |
|
Manufacturing House Sequential |
|
|
0 |
|
|
|
314 |
|
|
|
0 |
|
|
|
314 |
|
| |
|
|
0 |
|
|
|
3,048 |
|
|
|
3,605 |
|
|
|
6,653 |
|
| |
|
|
0 |
|
|
|
14,437 |
|
|
|
0 |
|
|
|
14,437 |
|
| |
|
| |
|
|
596 |
|
|
|
0 |
|
|
|
632 |
|
|
|
1,228 |
|
| |
|
|
2,752 |
|
|
|
0 |
|
|
|
3,416 |
|
|
|
6,168 |
|
| |
|
|
0 |
|
|
|
0 |
|
|
|
8,694 |
|
|
|
8,694 |
|
| |
|
|
0 |
|
|
|
0 |
|
|
|
4,118 |
|
|
|
4,118 |
|
| |
|
| |
|
|
0 |
|
|
|
0 |
|
|
|
109 |
|
|
|
109 |
|
| |
|
|
0 |
|
|
|
0 |
|
|
|
2 |
|
|
|
2 |
|
| |
|
| |
|
|
0 |
|
|
|
2,306 |
|
|
|
0 |
|
|
|
2,306 |
|
| |
|
|
0 |
|
|
|
637 |
|
|
|
1,009 |
|
|
|
1,646 |
|
|
|
|
|
|
|
| |
64 |
|
PIMCO CLOSED-END FUNDS |
|
|
See Accompanying Notes |
|
|
|
|
|
|
|
|
|
|
|
|
|
|
|
|
|
| |
Category and Subcategory |
|
Level 1 |
|
|
Level 2 |
|
|
Level 3 |
|
|
Fair
Value at
06/30/2025 |
|
Real Estate Investment Trusts |
|
| |
|
$ |
1,325 |
|
|
$ |
0 |
|
|
$ |
0 |
|
|
$ |
1,325 |
|
| |
|
| |
|
|
0 |
|
|
|
2,222 |
|
|
|
0 |
|
|
|
2,222 |
|
| |
|
|
0 |
|
|
|
1,347 |
|
|
|
0 |
|
|
|
1,347 |
|
|
| |
|
|
|
|
|
|
|
|
|
|
|
|
|
|
|
|
| |
$ |
6,073 |
|
|
$ |
549,637 |
|
|
$ |
36,139 |
|
|
$ |
591,849 |
|
|
| |
|
|
|
|
|
|
|
|
|
|
|
|
|
|
|
|
Investments in Affiliates, at Value |
|
| |
|
Central Funds Used for Cash Management Purposes |
|
$ |
7,682 |
|
|
$ |
0 |
|
|
$ |
0 |
|
|
$ |
7,682 |
|
|
| |
|
|
|
|
|
|
|
|
|
|
|
|
|
|
|
|
|
|
|
| |
| |
|
$ |
13,755 |
|
|
$ |
549,637 |
|
|
$ |
36,139 |
|
|
$ |
599,531 |
|
|
| |
|
|
|
|
|
|
|
|
|
|
|
|
|
|
|
|
Short Sales, at Value - Liabilities |
|
| |
|
$ |
0 |
|
|
$ |
(6,286 |
) |
|
$ |
0 |
|
|
$ |
(6,286 |
) |
|
| |
|
|
|
|
|
|
|
|
|
|
|
|
|
|
|
|
|
|
|
|
|
|
|
|
|
|
|
|
|
|
|
| |
|
|
|
|
|
|
|
|
|
|
|
|
|
Financial Derivative Instruments - Assets |
|
Exchange-traded or centrally cleared |
|
$ |
0 |
|
|
$ |
258 |
|
|
$ |
0 |
|
|
$ |
258 |
|
| |
|
|
0 |
|
|
|
798 |
|
|
|
0 |
|
|
|
798 |
|
|
| |
|
|
|
|
|
|
|
|
|
|
|
|
|
|
|
|
| |
$ |
0 |
|
|
$ |
1,056 |
|
|
$ |
0 |
|
|
$ |
1,056 |
|
|
| |
|
|
|
|
|
|
|
|
|
|
|
|
|
|
|
|
Financial Derivative Instruments - Liabilities |
|
Exchange-traded or centrally cleared |
|
|
0 |
|
|
|
(552 |
) |
|
|
0 |
|
|
|
(552 |
) |
| |
|
|
0 |
|
|
|
(2,166 |
) |
|
|
0 |
|
|
|
(2,166 |
) |
|
| |
|
|
|
|
|
|
|
|
|
|
|
|
|
|
|
|
| |
$ |
0 |
|
|
$ |
(2,718 |
) |
|
$ |
0 |
|
|
$ |
(2,718 |
) |
|
| |
|
|
|
|
|
|
|
|
|
|
|
|
|
|
|
|
|
|
|
| |
Total Financial Derivative Instruments |
|
$ |
0 |
|
|
$ |
(1,662 |
) |
|
$ |
0 |
|
|
$ |
(1,662 |
) |
|
| |
|
|
|
|
|
|
|
|
|
|
|
|
|
|
|
|
|
|
|
| |
| |
|
$ |
13,755 |
|
|
$ |
541,689 |
|
|
$ |
36,139 |
|
|
$ |
591,583 |
|
|
| |
|
|
|
|
|
|
|
|
|
|
|
|
|
|
|
The following is a reconciliation of the fair valuations using significant unobservable inputs (Level 3) for the Fund during the period ended June 30, 2025:
|
|
|
|
|
|
|
|
|
|
|
|
|
|
|
|
|
|
|
|
|
|
|
|
|
|
|
|
|
|
|
|
|
|
|
|
|
|
|
|
| |
|
|
Beginning
Balance
at 06/30/2024 |
|
|
|
|
|
|
|
|
Accrued
Discounts/
(Premiums) |
|
|
|
|
|
Net Change in Unrealized Appreciation/ (Depreciation) (1) |
|
|
|
|
|
|
|
|
Ending
Balance
at 06/30/2025 |
|
|
Net Change in Unrealized Appreciation/ (Depreciation) on Investments Held at 06/30/2025 (1) |
|
Investments in Securities, at Value |
|
Loan Participations and Assignments |
|
$ |
7,795 |
|
|
$ |
989 |
|
|
$ |
(3,030 |
) |
|
$ |
9 |
|
|
$ |
182 |
|
|
$ |
(291 |
) |
|
$ |
1 |
|
|
$ |
0 |
|
|
$ |
5,655 |
|
|
$ |
(97 |
) |
| |
|
| |
|
|
4,749 |
|
|
|
0 |
|
|
|
(4,625 |
) |
|
|
0 |
|
|
|
165 |
|
|
|
(289 |
) |
|
|
0 |
|
|
|
0 |
|
|
|
0 |
|
|
|
0 |
|
| |
|
|
9,828 |
|
|
|
7,481 |
|
|
|
(8,533 |
) |
|
|
(16 |
) |
|
|
(2,680 |
) |
|
|
2,117 |
|
|
|
702 |
|
|
|
0 |
|
|
|
8,899 |
|
|
|
715 |
|
Non-Agency Mortgage-Backed Securities |
|
|
908 |
|
|
|
0 |
|
|
|
(223 |
) |
|
|
1 |
|
|
|
0 |
|
|
|
44 |
|
|
|
0 |
|
|
|
(730 |
) |
|
|
0 |
|
|
|
0 |
|
| |
|
|
|
| |
|
|
| |
|
|
| |
|
|
| |
|
|
| |
|
|
| |
|
|
| |
|
|
| |
|
|
| |
|
| |
| |
|
|
114 |
|
|
|
0 |
|
|
|
(34 |
) |
|
|
2 |
|
|
|
5 |
|
|
|
5 |
|
|
|
0 |
|
|
|
(92 |
) |
|
|
0 |
|
|
|
0 |
|
| |
|
|
1,846 |
|
|
|
2,017 |
|
|
|
0 |
|
|
|
(17 |
) |
|
|
0 |
|
|
|
(239 |
) |
|
|
0 |
|
|
|
0 |
|
|
|
3,605 |
|
|
|
(239 |
) |
| |
|
Communication Services (2) |
|
|
521 |
|
|
|
0 |
|
|
|
0 |
|
|
|
0 |
|
|
|
0 |
|
|
|
111 |
|
|
|
0 |
|
|
|
0 |
|
|
|
632 |
|
|
|
110 |
|
Consumer Discretionary (2) |
|
|
4,439 |
|
|
|
0 |
|
|
|
(4,545 |
) |
|
|
0 |
|
|
|
3,487 |
|
|
|
(3,381 |
) |
|
|
0 |
|
|
|
0 |
|
|
|
0 |
|
|
|
0 |
|
| |
|
|
12 |
|
|
|
0 |
|
|
|
(13 |
) |
|
|
0 |
|
|
|
7 |
|
|
|
(6 |
) |
|
|
0 |
|
|
|
0 |
|
|
|
0 |
|
|
|
0 |
|
| |
|
|
3,678 |
|
|
|
11 |
|
|
|
0 |
|
|
|
0 |
|
|
|
0 |
|
|
|
(273 |
) |
|
|
0 |
|
|
|
0 |
|
|
|
3,416 |
|
|
|
(273 |
) |
| |
|
|
9,534 |
|
|
|
0 |
|
|
|
0 |
|
|
|
0 |
|
|
|
0 |
|
|
|
(840 |
) |
|
|
0 |
|
|
|
0 |
|
|
|
8,694 |
|
|
|
(839 |
) |
| |
|
|
147 |
|
|
|
5,919 |
|
|
|
(135 |
) |
|
|
0 |
|
|
|
(212 |
) |
|
|
(1,601 |
) |
|
|
0 |
|
|
|
0 |
|
|
|
4,118 |
|
|
|
(1,803 |
) |
| |
|
| |
|
|
0 |
|
|
|
73 |
|
|
|
0 |
|
|
|
0 |
|
|
|
0 |
|
|
|
36 |
|
|
|
0 |
|
|
|
0 |
|
|
|
109 |
|
|
|
36 |
|
| |
|
|
2 |
|
|
|
0 |
|
|
|
0 |
|
|
|
0 |
|
|
|
0 |
|
|
|
0 |
|
|
|
0 |
|
|
|
0 |
|
|
|
2 |
|
|
|
0 |
|
| |
|
| |
|
|
903 |
|
|
|
121 |
|
|
|
0 |
|
|
|
0 |
|
|
|
0 |
|
|
|
(15 |
) |
|
|
0 |
|
|
|
0 |
|
|
|
1,009 |
|
|
|
(15 |
) |
|
| |
|
|
|
|
|
|
|
|
|
|
|
|
|
|
|
|
|
|
|
|
|
|
|
|
|
|
|
|
|
|
|
|
|
|
|
|
|
|
|
|
|
|
|
|
|
|
|
|
|
| |
| |
|
$ |
44,476 |
|
|
$ |
16,611 |
|
|
$ |
(21,138 |
) |
|
$ |
(21 |
) |
|
$ |
954 |
|
|
$ |
(4,624 |
) |
|
$ |
703 |
|
|
$ |
(822 |
) |
|
$ |
36,139 |
|
|
$ |
(2,405 |
) |
|
| |
|
|
|
|
|
|
|
|
|
|
|
|
|
|
|
|
|
|
|
|
|
|
|
|
|
|
|
|
|
|
|
|
|
|
|
|
|
|
|
The following is a summary of significant unobservable inputs used in the fair valuations of assets and liabilities categorized within Level 3 of the fair value hierarchy:
|
|
|
|
|
|
|
|
|
|
|
|
|
|
|
|
|
|
| |
| Category and Subcategory |
|
Ending
Balance
at 06/30/2025 |
|
|
Valuation Technique |
|
Unobservable Inputs |
|
|
|
(% Unless Noted Otherwise) |
|
| |
|
|
|
Weighted Average |
|
Investments in Securities, at Value |
|
Loan Participations and Assignments |
|
$ |
1,803 |
|
|
Discounted Cash Flow |
|
Discount Rate |
|
| |
|
|
|
|
|
17.630 |
|
|
| |
|
3,852 |
|
|
Comparable Companies |
|
EBITDA Multiple |
|
X |
|
|
16.470 |
|
|
|
— |
|
| |
|
| |
|
|
7,253 |
|
|
Comparable Companies /
Discounted Cash Flow |
|
Revenue
Multiple/Discount Rate |
|
x/% |
|
|
0.900/10.500 |
|
|
|
— |
|
|
| |
|
1,646 |
|
|
Indicative Market Quotation |
|
Broker Quote |
|
| |
|
|
|
|
|
68.249 |
|
|
|
|
|
|
|
|
|
|
|
|
|
| |
| See Accompanying Notes |
|
|
ANNUAL REPORT |
|
|
| |
|
|
JUNE 30, 2025 |
|
|
65 |
|
|
|
|
|
|
| |
|
|
PIMCO Strategic Income Fund, Inc. |
|
|
|
June 30, 2025 |
|
|
|
|
|
|
|
|
|
|
|
|
|
|
|
|
|
|
|
|
| |
| Category and Subcategory |
|
Ending
Balance
at 06/30/2025 |
|
|
Valuation Technique |
|
Unobservable Inputs |
|
|
|
|
(% Unless Noted Otherwise) |
|
| |
Input Value(s)
|
|
|
Weighted Average |
|
| |
|
| |
|
$ |
3,605 |
|
|
Discounted Cash Flow |
|
Discount Rate |
|
|
$ |
|
|
|
|
|
|
|
10.910 |
|
| |
|
| |
|
|
550 |
|
|
Comparable Companies |
|
EBITDA Multiple |
|
|
X |
|
|
|
4.864 |
|
|
|
— |
|
|
| |
|
82 |
|
|
Reference instrument |
|
Stock Price w/
Liquidity Discount |
|
|
|
| |
|
12.000 |
|
|
|
— |
|
| |
|
|
3,412 |
|
|
Comparable Companies |
|
EBITDA Multiple |
|
|
|
| |
|
5.200 |
|
|
|
— |
|
|
| |
|
4 |
|
|
Indicative
Market Quotation |
|
Broker Quote |
|
|
|
| |
|
4.000 |
|
|
|
— |
|
| |
|
|
8,694 |
|
|
Comparable Companies |
|
EBITDA Multiple |
|
|
X |
|
|
|
16.470 |
|
|
|
— |
|
| |
|
|
4,117 |
|
|
Comparable Companies
/Discounted Cash Flow |
|
Revenue Multiple/
Discount Rate |
|
|
|
| |
|
0.900/10.500 |
|
|
|
— |
|
|
| |
|
1 |
|
|
Indicative
Market Quotation |
|
Broker Quote |
|
|
|
| |
|
0.625-2.344 |
|
|
|
2.210 |
|
| |
|
| |
|
|
109 |
|
|
Comparable Companies |
|
EBITDA Multiple |
|
|
X |
|
|
|
4.864 |
|
|
|
— |
|
| |
|
|
2 |
|
|
Option Pricing Model |
|
Volatility |
|
|
|
| |
|
32.500 |
|
|
|
— |
|
| |
|
| |
|
|
1,009 |
|
|
Discounted Cash Flow |
|
Discount Rate |
|
|
|
| |
|
15.314 |
|
|
|
— |
|
|
| |
|
|
|
|
| |
| |
|
|
| |
|
|
| |
|
| |
| |
|
$ |
36,139 |
|
|
| |
| |
|
|
| |
|
|
| |
|
| |
|
| |
|
|
|
|
| |
| |
|
|
| |
|
|
| |
|
| |
|
Any difference between Net Change in Unrealized Appreciation/(Depreciation) and Net Change in Unrealized Appreciation/(Depreciation) on Investments Held at June 30, 2025 may be due to an investment no longer held or categorized as Level 3 at period end. |
|
Sector type updated from Industrials to Communication Services and Consumer Discretionary since prior fiscal year end. |
|
Security type updated from Common Stocks to Preferred Securities Industrials since prior fiscal year end. |
|
|
|
|
|
|
| |
66 |
|
PIMCO CLOSED-END FUNDS |
|
|
See Accompanying Notes |
|
|
|
|
|
|
|
| |
Consolidated Schedule of Investments |
|
|
|
|
|
June 30, 2025 |
(Amounts in thousands*, except number of shares, contracts, units and ounces, if any)
|
|
|
|
|
|
|
|
|
|
|
|
| |
| |
|
|
|
PRINCIPAL
AMOUNT
(000S) |
|
|
|
|
MARKET
VALUE
(000S) |
|
INVESTMENTS IN SECURITIES 155.3% |
|
|
| |
LOAN PARTICIPATIONS AND ASSIGNMENTS 36.4% |
|
|
Aligned Data Centers International LP |
|
| |
|
$ |
|
|
3,400 |
|
|
$ |
|
|
3,409 |
|
|
| |
|
9.756% (TSFR3M + 5.500%) due 08/15/2028 ~ |
|
| |
|
990 |
|
|
| |
|
899 |
|
|
| |
|
9.941% (TSFR1M + 5.500%) due 09/01/2027 ~ |
|
| |
|
1,844 |
|
|
| |
|
1,663 |
|
|
| |
|
10.561% (TSFR1M + 6.250%) due 10/08/2030 ~ |
|
| |
|
2,800 |
|
|
| |
|
2,707 |
|
|
| |
|
7.546% (TSFR3M + 3.250%) due 07/06/2029 ~ |
|
| |
|
5,868 |
|
|
| |
|
4,915 |
|
|
Circor International, Inc. |
|
TBD% - 0.500% due 06/20/2029 «µ |
|
| |
|
166 |
|
|
| |
|
170 |
|
|
| |
|
| |
|
| |
|
846 |
|
|
| |
|
844 |
|
|
| |
|
| |
|
| |
|
215 |
|
|
| |
|
215 |
|
|
| |
|
TBD% (EUR012M + 0.000%) due 03/28/2026 ~ |
|
EUR |
|
|
18,708 |
|
|
| |
|
26,224 |
|
TBD% - 1.138% due 10/16/2031 ~ |
|
| |
|
1,916 |
|
|
| |
|
2,685 |
|
|
CoreWeave Compute Acquisition Co. LLC |
|
TBD% (TSFR3M + 6.000%) due 05/16/2029 «~µ |
|
$ |
|
|
10,000 |
|
|
| |
|
10,234 |
|
10.288% - 13.949% (TSFR3M + 6.000%) due 07/31/2028 « |
|
| |
|
2,712 |
|
|
| |
|
2,874 |
|
|
| |
|
TBD% - 1.000% due 01/03/2031 «µ |
|
| |
|
362 |
|
|
| |
|
366 |
|
8.816% (TSFR1M + 4.500%) due 01/03/2031 «~ |
|
| |
|
1,638 |
|
|
| |
|
1,654 |
|
|
| |
|
| |
|
| |
|
1,555 |
|
|
| |
|
1,539 |
|
| |
|
| |
|
155 |
|
|
| |
|
154 |
|
|
| |
|
7.927% (TSFR1M + 3.500%) due 02/10/2028 «~ |
|
| |
|
2,587 |
|
|
| |
|
1,992 |
|
|
Envision Healthcare Corp. |
|
11.110% (TSFR3M + 6.750%) due 07/20/2026 « |
|
| |
|
99 |
|
|
| |
|
99 |
|
12.235% (TSFR3M + 7.875%) due 11/03/2028 « |
|
| |
|
13,599 |
|
|
| |
|
14,007 |
|
|
Espai Barca Fondo De Titulizacion |
|
| |
|
EUR |
|
|
3,396 |
|
|
| |
|
4,613 |
|
|
| |
|
9.541% (TSFR3M + 5.000%) due 03/30/2027 ~ |
|
$ |
|
|
1,062 |
|
|
| |
|
1,005 |
|
|
| |
|
8.780% (TSFR3M + 4.500%) due 12/19/2030 ~ |
|
| |
|
3,539 |
|
|
| |
|
3,523 |
|
|
| |
|
9.280% - 10.030% (TSFR3M + 5.000%) due 07/31/2030 ~ |
|
| |
|
4,103 |
|
|
| |
|
3,833 |
|
|
Gateway Casinos & Entertainment Ltd. |
|
10.563% (TSFR3M + 6.250%) due 12/18/2030 |
|
| |
|
2,540 |
|
|
| |
|
2,541 |
|
|
| |
|
9.574% (TSFR1M + 5.250%) due 06/04/2029 ~ |
|
| |
|
1,182 |
|
|
| |
|
1,184 |
|
|
| |
|
| |
|
| |
|
2,400 |
|
|
| |
|
2,400 |
|
|
| |
|
TBD% - 9.717% due 03/27/2032 « |
|
GBP |
|
|
2,319 |
|
|
| |
|
3,124 |
|
|
iHeartCommunications, Inc. |
|
10.216% (TSFR1M + 5.775%) due 05/01/2029 ~ |
|
$ |
|
|
2,816 |
|
|
| |
|
2,303 |
|
|
| |
|
|
|
|
|
|
|
|
|
|
|
|
|
| |
| |
|
|
|
PRINCIPAL
AMOUNT
(000S) |
|
|
|
|
MARKET
VALUE
(000S) |
|
TBD% - 10.079% (TSFR3M + 5.750%) due 06/01/2029 ~µ |
|
$ |
|
|
640 |
|
|
$ |
|
|
660 |
|
9.016% (TSFR3M + 4.750%) due 06/01/2029 ~ |
|
| |
|
4,804 |
|
|
| |
|
4,007 |
|
|
| |
|
9.441% (TSFR1M + 5.000%) due 04/26/2028 «~ |
|
| |
|
1,161 |
|
|
| |
|
1,172 |
|
|
| |
|
8.006% (TSFR3M + 3.750%) due 05/19/2031 ~ |
|
| |
|
2,258 |
|
|
| |
|
2,238 |
|
|
| |
|
6.791% (TSFR1M + 2.350%) due 04/15/2030 ~ |
|
| |
|
5,640 |
|
|
| |
|
5,578 |
|
|
MPH Acquisition Holdings LLC |
|
8.030% (TSFR3M + 3.750%) due 12/31/2030 ~ |
|
| |
|
137 |
|
|
| |
|
136 |
|
9.141% (TSFR3M + 4.600%) due 12/31/2030 ~ |
|
| |
|
1,142 |
|
|
| |
|
1,028 |
|
|
| |
|
| |
|
GBP |
|
|
5,550 |
|
|
| |
|
7,605 |
|
|
| |
|
8.177% (TSFR1M + 3.750%) due 02/01/2028 ~ |
|
$ |
|
|
5,687 |
|
|
| |
|
5,037 |
|
|
| |
|
8.291% (TSFR3M + 3.750%) due 06/02/2028 ~ |
|
| |
|
598 |
|
|
| |
|
584 |
|
|
| |
|
6.980% (EUR003M + 5.000%) due 03/13/2030 ~ |
|
EUR |
|
|
3,600 |
|
|
| |
|
2,905 |
|
|
Promotora de Informaciones SA |
|
7.344% (EUR003M + 5.220%) due 06/29/2029 ~ |
|
| |
|
21,112 |
|
|
| |
|
24,993 |
|
7.594% (EUR003M + 5.470%) due 12/31/2029 ~ |
|
| |
|
4,274 |
|
|
| |
|
4,959 |
|
|
| |
|
10.046% - 10.068% (TSFR3M + 5.750%) due 06/30/2031 « |
|
$ |
|
|
1,956 |
|
|
| |
|
1,942 |
|
|
| |
|
7.686% (EUR003M + 5.500%) due 03/29/2030 ~ |
|
EUR |
|
|
2,400 |
|
|
| |
|
2,789 |
|
9.780% (TSFR3M + 5.500%) due 03/29/2030 ~ |
|
$ |
|
|
3,715 |
|
|
| |
|
3,518 |
|
|
| |
|
| |
|
| |
|
2,900 |
|
|
| |
|
2,900 |
|
|
| |
|
TBD% - 0.500% due 01/30/2032 «µ |
|
| |
|
260 |
|
|
| |
|
255 |
|
6.000% (JY0003M + 5.250%) due 01/30/2032 «~ |
|
JPY |
|
|
22,306 |
|
|
| |
|
152 |
|
7.679% (CDOR03 + 5.000%) due 01/30/2032 «~ |
|
CAD |
|
|
209 |
|
|
| |
|
150 |
|
9.131% (TSFR6M + 5.000%) due 01/30/2032 «~ |
|
$ |
|
|
1,152 |
|
|
| |
|
1,131 |
|
|
Steenbok Lux Finco 2 SARL |
|
| |
|
EUR |
|
|
28,303 |
|
|
| |
|
10,564 |
|
|
Stepstone Group MidCo 2 GmbH |
|
6.673% (EUR006M + 4.500%) due 04/26/2032 ~ |
|
| |
|
7,000 |
|
|
| |
|
8,101 |
|
8.608% - 8.651% (TSFR3M + 4.500%) due 12/19/2031 |
|
$ |
|
|
1,300 |
|
|
| |
|
1,264 |
|
|
Strategic Gaming Investments, Inc. |
|
| |
|
| |
|
2,200 |
|
|
| |
|
2,201 |
|
|
| |
|
7.730% (EUR003M + 5.750%) due 08/14/2029 «~ |
|
EUR |
|
|
6,400 |
|
|
| |
|
7,577 |
|
|
| |
|
11.296% (TSFR3M + 7.000%) due 05/13/2027 ~ |
|
$ |
|
|
9,230 |
|
|
| |
|
8,788 |
|
|
Team Health Holdings, Inc. |
|
9.530% (TSFR3M + 5.250%) due 03/02/2027 ~ |
|
| |
|
1,492 |
|
|
| |
|
1,487 |
|
|
| |
|
11.558% (JIBA3M + 4.000%) due 03/02/2028 «~ |
|
ZAR |
|
|
37,343 |
|
|
| |
|
2,092 |
|
|
| |
|
| |
|
$ |
|
|
700 |
|
|
| |
|
682 |
|
|
|
|
|
|
|
|
|
|
|
|
|
| |
| |
|
|
|
PRINCIPAL
AMOUNT
(000S) |
|
|
|
|
MARKET
VALUE
(000S) |
|
10.927% (TSFR1M + 6.500%) due 10/26/2029 ~ |
|
$ |
|
|
9,549 |
|
|
$ |
|
|
9,341 |
|
|
| |
|
9.441% (TSFR1M + 5.000%) due 06/20/2028 ~ |
|
| |
|
21,310 |
|
|
| |
|
20,226 |
|
|
| |
|
| |
|
HKD |
|
|
44,137 |
|
|
| |
|
5,693 |
|
|
| |
| |
|
|
| |
| |
|
|
|
Total Loan Participations and Assignments
(Cost $251,841) |
|
|
|
|
|
| |
|
|
|
|
| |
CORPORATE BONDS & NOTES 28.8% |
|
|
| |
|
|
|
| |
|
8.250% due 12/31/2028 (i) |
|
EUR |
|
|
1,323 |
|
|
| |
|
1,585 |
|
|
| |
|
| |
|
$ |
|
|
300 |
|
|
| |
|
312 |
|
|
| |
|
8.500% due 11/15/2029 (i) |
|
| |
|
4,200 |
|
|
| |
|
4,029 |
|
|
| |
|
7.500% due 02/16/2027 (i) |
|
EUR |
|
|
4,000 |
|
|
| |
|
4,809 |
|
|
| |
|
| |
|
$ |
|
|
800 |
|
|
| |
|
811 |
|
|
| |
|
| |
|
| |
|
1,030 |
|
|
| |
|
1,093 |
|
|
Corestate Capital Holding SA (8.000% Cash or 9.000% PIK) |
|
8.000% due 12/31/2026 (b) |
|
EUR |
|
|
490 |
|
|
| |
|
233 |
|
|
| |
|
| |
|
$ |
|
|
250 |
|
|
| |
|
253 |
|
|
| |
|
| |
|
| |
|
300 |
|
|
| |
|
313 |
|
| |
|
| |
|
300 |
|
|
| |
|
312 |
|
| |
|
| |
|
300 |
|
|
| |
|
311 |
|
|
| |
|
| |
|
| |
|
250 |
|
|
| |
|
250 |
|
|
| |
|
| |
|
| |
|
27 |
|
|
| |
|
12 |
|
|
| |
|
| |
|
| |
|
400 |
|
|
| |
|
418 |
|
| |
|
| |
|
400 |
|
|
| |
|
397 |
|
|
| |
|
| |
|
| |
|
250 |
|
|
| |
|
252 |
|
|
Kennedy Wilson Europe Real Estate Ltd. |
|
3.250% due 11/12/2025 (i) |
|
EUR |
|
|
316 |
|
|
| |
|
370 |
|
|
Long Walk Reinsurance Ltd. |
|
| |
|
$ |
|
|
800 |
|
|
| |
|
811 |
|
|
| |
|
| |
|
| |
|
250 |
|
|
| |
|
251 |
|
|
| |
|
| |
|
| |
|
300 |
|
|
| |
|
309 |
|
| |
|
| |
|
800 |
|
|
| |
|
836 |
|
|
| |
|
| |
|
| |
|
1,815 |
|
|
| |
|
1,044 |
|
|
| |
|
| |
|
GBP |
|
|
45 |
|
|
| |
|
58 |
|
|
| |
|
6.250% due 01/14/2031 (i) |
|
EUR |
|
|
18,731 |
|
|
| |
|
6,507 |
|
|
| |
|
| |
|
$ |
|
|
250 |
|
|
| |
|
258 |
|
| |
|
| |
|
250 |
|
|
| |
|
261 |
|
|
| |
|
6.000% due 01/15/2030 (i) |
|
| |
|
8,400 |
|
|
| |
|
7,878 |
|
6.500% due 02/15/2029 (i) |
|
| |
|
7,325 |
|
|
| |
|
7,087 |
|
8.625% due 06/15/2032 (i) |
|
| |
|
1,200 |
|
|
| |
|
1,213 |
|
10.500% due 02/15/2028 (i) |
|
| |
|
2,004 |
|
|
| |
|
2,126 |
|
|
| |
|
| |
|
| |
|
400 |
|
|
| |
|
402 |
|
| |
|
| |
|
900 |
|
|
| |
|
942 |
|
|
| |
|
| |
|
| |
|
700 |
|
|
| |
|
733 |
|
|
| |
|
| |
|
| |
|
700 |
|
|
| |
|
736 |
|
|
| |
| |
|
|
| |
| |
|
|
|
|
| |
| |
|
|
| |
| |
|
47,212 |
|
|
| |
| |
|
|
| |
| |
|
|
|
|
|
|
|
|
|
|
|
|
|
|
|
| |
See Accompanying Notes |
|
|
|
|
|
| |
|
|
JUNE 30, 2025 |
|
|
|
|
|
|
|
|
|
| |
Consolidated Schedule of Investments |
|
|
|
|
|
|
|
|
|
|
|
|
|
|
|
|
|
|
| |
| |
|
|
|
PRINCIPAL
AMOUNT
(000S) |
|
|
|
|
MARKET
VALUE
(000S) |
|
|
|
|
| |
|
| |
|
$ |
|
|
17,600 |
|
|
$ |
|
|
6,130 |
|
|
| |
|
| |
|
EUR |
|
|
3,600 |
|
|
| |
|
3,561 |
|
| |
|
| |
|
100 |
|
|
| |
|
99 |
|
| |
|
$ |
|
|
200 |
|
|
| |
|
165 |
|
| |
|
| |
|
3,500 |
|
|
| |
|
2,896 |
|
| |
|
| |
|
1,600 |
|
|
| |
|
1,348 |
|
| |
|
| |
|
2,300 |
|
|
| |
|
1,909 |
|
| |
|
| |
|
400 |
|
|
| |
|
360 |
|
|
| |
|
10.500% due 03/30/2029 (i) |
|
EUR |
|
|
3,400 |
|
|
| |
|
4,201 |
|
12.250% due 03/30/2029 (i) |
|
$ |
|
|
3,100 |
|
|
| |
|
3,310 |
|
|
Aston Martin Capital Holdings Ltd. |
|
10.000% due 03/31/2029 (i) |
|
| |
|
1,200 |
|
|
| |
|
1,138 |
|
| |
|
GBP |
|
|
600 |
|
|
| |
|
770 |
|
|
Carvana Co. (14.000% PIK) |
|
14.000% due 06/01/2031 (b)(i) |
|
$ |
|
|
1,937 |
|
|
| |
|
2,231 |
|
|
| |
|
8.000% due 06/15/2029 (i) |
|
| |
|
2,170 |
|
|
| |
|
1,796 |
|
|
| |
|
7.250% due 06/15/2029 (i) |
|
| |
|
2,820 |
|
|
| |
|
2,302 |
|
|
Cheplapharm Arzneimittel GmbH |
|
5.500% due 01/15/2028 (i) |
|
| |
|
3,200 |
|
|
| |
|
3,095 |
|
7.125% due 06/15/2031 (a) |
|
EUR |
|
|
700 |
|
|
| |
|
831 |
|
7.500% due 05/15/2030 (i) |
|
| |
|
1,100 |
|
|
| |
|
1,325 |
|
|
| |
|
| |
|
$ |
|
|
4,820 |
|
|
| |
|
4,383 |
|
| |
|
| |
|
17,600 |
|
|
| |
|
15,268 |
|
|
| |
|
4.625% due 11/02/2031 (i) |
|
| |
|
1,900 |
|
|
| |
|
1,606 |
|
7.750% due 02/01/2032 (i) |
|
| |
|
12,800 |
|
|
| |
|
12,587 |
|
8.375% due 01/19/2036 (i) |
|
| |
|
240 |
|
|
| |
|
232 |
|
8.875% due 01/13/2033 (i) |
|
| |
|
500 |
|
|
| |
|
516 |
|
|
| |
|
3.250% due 07/23/2027 (i) |
|
EUR |
|
|
1,200 |
|
|
| |
|
1,365 |
|
|
| |
|
| |
|
$ |
|
|
2,388 |
|
|
| |
|
2,388 |
|
|
| |
|
6.000% due 01/30/2033 «(h) |
|
| |
|
1,720 |
|
|
| |
|
2,384 |
|
|
Intelsat Jackson Holdings SA |
|
6.500% due 03/15/2030 (i) |
|
| |
|
6,800 |
|
|
| |
|
6,951 |
|
|
| |
|
9.875% due 09/20/2031 (i) |
|
| |
|
2,730 |
|
|
| |
|
2,658 |
|
|
MPH Acquisition Holdings LLC |
|
5.750% due 12/31/2030 (i) |
|
| |
|
4,800 |
|
|
| |
|
3,958 |
|
|
MPH Acquisition Holdings LLC (6.500% Cash and 5.000% PIK) |
|
11.500% due 12/31/2030 (b) |
|
| |
|
3,200 |
|
|
| |
|
3,176 |
|
|
Newfold Digital Holdings Group, Inc. |
|
| |
|
| |
|
4,100 |
|
|
| |
|
2,399 |
|
| |
|
| |
|
765 |
|
|
| |
|
578 |
|
|
| |
|
6.700% due 02/16/2032 (i) |
|
| |
|
1,978 |
|
|
| |
|
1,840 |
|
6.840% due 01/23/2030 (i) |
|
| |
|
800 |
|
|
| |
|
773 |
|
8.750% due 06/02/2029 (i) |
|
| |
|
1,489 |
|
|
| |
|
1,544 |
|
|
Prime Healthcare Services, Inc. |
|
9.375% due 09/01/2029 (i) |
|
| |
|
3,400 |
|
|
| |
|
3,377 |
|
|
| |
|
11.542% due 01/23/2029 ~(i) |
|
| |
|
2,770 |
|
|
| |
|
2,839 |
|
|
Thames Water Super Senior Issuer PLC |
|
| |
|
GBP |
|
|
45 |
|
|
| |
|
68 |
|
|
Thames Water Utilities Finance PLC |
|
| |
|
EUR |
|
|
100 |
|
|
| |
|
76 |
|
| |
|
GBP |
|
|
100 |
|
|
| |
|
90 |
|
| |
|
EUR |
|
|
100 |
|
|
| |
|
77 |
|
| |
|
GBP |
|
|
200 |
|
|
| |
|
184 |
|
| |
|
| |
|
400 |
|
|
| |
|
375 |
|
|
Thames Water Utilities Ltd. |
|
0.000% due 03/22/2027 (e) |
|
| |
|
7 |
|
|
| |
|
8 |
|
|
| |
|
10.625% due 06/28/2028 (i) |
|
$ |
|
|
4,470 |
|
|
| |
|
3,827 |
|
|
|
|
|
|
|
|
|
|
|
|
|
| |
| |
|
|
|
PRINCIPAL
AMOUNT
(000S) |
|
|
|
|
MARKET
VALUE
(000S) |
|
|
| |
|
| |
|
EUR |
|
|
1,800 |
|
|
$ |
|
|
1,914 |
|
|
| |
|
0.000% due 12/29/2049 ~(f) |
|
BRL |
|
|
10,300 |
|
|
| |
|
650 |
|
|
| |
|
9.500% due 02/01/2029 (i) |
|
$ |
|
|
3,008 |
|
|
| |
|
3,279 |
|
9.875% due 02/01/2032 (i) |
|
| |
|
1,580 |
|
|
| |
|
1,707 |
|
|
| |
|
| |
|
EUR |
|
|
2,100 |
|
|
| |
|
2,461 |
|
10.000% due 10/15/2030 (i) |
|
$ |
|
|
1,700 |
|
|
| |
|
1,674 |
|
|
| |
|
7.250% due 10/31/2029 (i) |
|
| |
|
400 |
|
|
| |
|
401 |
|
7.750% due 09/15/2030 (i) |
|
| |
|
200 |
|
|
| |
|
202 |
|
|
| |
|
8.250% due 10/01/2031 (i) |
|
| |
|
2,900 |
|
|
| |
|
3,040 |
|
|
| |
|
13.500% due 04/15/2031 (i) |
|
| |
|
500 |
|
|
| |
|
514 |
|
|
Yinson Boronia Production BV |
|
8.947% due 07/31/2042 (i) |
|
| |
|
1,289 |
|
|
| |
|
1,373 |
|
|
| |
| |
|
|
| |
| |
|
|
|
|
| |
| |
|
|
| |
| |
|
130,209 |
|
|
| |
| |
|
|
| |
| |
|
|
|
|
| |
|
|
|
| |
|
6.250% due 03/15/2030 (i) |
|
| |
|
200 |
|
|
| |
|
203 |
|
|
Oi SA (10.000% Cash or 6.000% PIK and 7.500% Cash or 13.500% PIK) |
|
10.000% due 06/30/2027 (b)(i) |
|
| |
|
16,024 |
|
|
| |
|
10,435 |
|
|
| |
|
8.500% due 12/31/2028 (b) |
|
| |
|
34,306 |
|
|
| |
|
2,316 |
|
|
| |
|
5.375% due 03/22/2030 (i) |
|
| |
|
8,819 |
|
|
| |
|
8,300 |
|
|
Yinson Production Financial Services Pte. Ltd. |
|
| |
|
| |
|
1,600 |
|
|
| |
|
1,663 |
|
|
| |
| |
|
|
| |
| |
|
|
|
|
| |
| |
|
|
| |
| |
|
22,917 |
|
|
| |
| |
|
|
| |
| |
|
|
|
Total Corporate Bonds & Notes (Cost $240,053) |
|
|
|
|
|
| |
|
|
|
|
| |
U.S. GOVERNMENT AGENCIES 5.8% |
|
|
| |
|
4.500% due 02/25/2059 - 11/25/2061 ~(i) |
|
| |
|
14,881 |
|
|
| |
|
13,817 |
|
4.750% due 08/25/2058 ~(i) |
|
| |
|
8,337 |
|
|
| |
|
8,087 |
|
9.805% due 01/25/2034 •(i) |
|
| |
|
900 |
|
|
| |
|
1,065 |
|
11.405% due 01/25/2042 •(i) |
|
| |
|
2,000 |
|
|
| |
|
2,135 |
|
11.805% due 10/25/2041 •(i) |
|
| |
|
7,400 |
|
|
| |
|
7,869 |
|
12.105% due 11/25/2041 •(i) |
|
| |
|
6,229 |
|
|
| |
|
6,669 |
|
12.805% due 02/25/2042 •(i) |
|
| |
|
800 |
|
|
| |
|
874 |
|
|
| |
| |
|
|
| |
| |
|
|
|
Total U.S. Government Agencies (Cost $38,794) |
|
|
|
|
|
| |
|
|
|
|
| |
NON-AGENCY MORTGAGE-BACKED SECURITIES 34.7% |
|
|
| |
|
4.803% due 02/10/2036 ~(i) |
|
| |
|
14,239 |
|
|
| |
|
12,480 |
|
|
| |
|
3.779% due 06/05/2037 ~(i) |
|
| |
|
2,680 |
|
|
| |
|
2,534 |
|
|
Ashford Hospitality Trust |
|
7.584% due 04/15/2035 •(i) |
|
| |
|
14,536 |
|
|
| |
|
14,277 |
|
|
Banc of America Funding Trust |
|
| |
|
| |
|
831 |
|
|
| |
|
639 |
|
|
Barclays Commercial Mortgage Securities Trust |
|
3.811% due 02/15/2053 ~(i) |
|
| |
|
4,785 |
|
|
| |
|
3,461 |
|
|
| |
|
4.715% due 08/10/2033 ~(i) |
|
| |
|
5,370 |
|
|
| |
|
3,318 |
|
|
| |
|
1.034% due 11/27/2036 •(i) |
|
| |
|
38,346 |
|
|
| |
|
8,328 |
|
3.975% due 04/25/2038 ~(i) |
|
| |
|
3,012 |
|
|
| |
|
2,328 |
|
|
| |
|
8.064% due 06/15/2038 •(i) |
|
| |
|
5,500 |
|
|
| |
|
1,107 |
|
|
| |
|
7.876% due 03/15/2036 •(i) |
|
| |
|
6,750 |
|
|
| |
|
2,368 |
|
8.876% due 03/15/2036 •(i) |
|
| |
|
2,500 |
|
|
| |
|
627 |
|
|
|
|
|
|
|
|
|
|
|
|
|
| |
| |
|
|
|
PRINCIPAL
AMOUNT
(000S) |
|
|
|
|
MARKET
VALUE
(000S) |
|
|
| |
|
3.555% due 08/15/2052 ~(i) |
|
$ |
|
|
9,600 |
|
|
$ |
|
|
9,300 |
|
|
| |
|
3.378% due 02/17/2055 ~(i) |
|
| |
|
9,615 |
|
|
| |
|
8,676 |
|
4.070% due 02/17/2055 ~(i) |
|
| |
|
11,000 |
|
|
| |
|
8,027 |
|
|
| |
|
9.812% due 02/15/2037 •(i) |
|
| |
|
8,800 |
|
|
| |
|
1,386 |
|
| |
|
| |
|
1,500 |
|
|
| |
|
142 |
|
|
Colony Mortgage Capital Ltd. |
|
6.701% due 11/15/2038 •(i) |
|
| |
|
2,300 |
|
|
| |
|
2,201 |
|
7.397% due 11/15/2038 •(i) |
|
| |
|
3,400 |
|
|
| |
|
3,089 |
|
|
| |
|
4.683% due 03/25/2067 ~(i) |
|
| |
|
7,200 |
|
|
| |
|
6,815 |
|
|
Connecticut Avenue Securities Trust |
|
9.555% due 03/25/2042 •(i) |
|
| |
|
2,000 |
|
|
| |
|
2,131 |
|
10.305% due 10/25/2041 •(i) |
|
| |
|
4,755 |
|
|
| |
|
4,968 |
|
13.805% due 03/25/2042 •(i) |
|
| |
|
5,200 |
|
|
| |
|
5,796 |
|
|
Countrywide Home Loan Mortgage Pass-Through Trust |
|
6.500% due 01/25/2038 (i) |
|
| |
|
13,941 |
|
|
| |
|
6,013 |
|
|
Credit Suisse Mortgage Capital Mortgage-Backed Trust |
|
7.744% due 07/15/2032 •(i) |
|
| |
|
12,000 |
|
|
| |
|
11,922 |
|
|
| |
|
3.704% due 05/10/2041 ~(i) |
|
| |
|
14,250 |
|
|
| |
|
9,968 |
|
|
Extended Stay America Trust |
|
8.126% due 07/15/2038 •(i) |
|
| |
|
10,010 |
|
|
| |
|
10,027 |
|
|
GS Mortgage Securities Corp. Resecuritization Trust |
|
5.051% due 11/26/2037 (i) |
|
| |
|
12,611 |
|
|
| |
|
11,901 |
|
|
JP Morgan Chase Commercial Mortgage Securities Trust |
|
6.659% due 12/15/2031 •(i) |
|
| |
|
5,025 |
|
|
| |
|
4,875 |
|
6.866% due 06/15/2038 •(i) |
|
| |
|
3,276 |
|
|
| |
|
2,901 |
|
7.526% due 03/15/2036 •(i) |
|
| |
|
2,000 |
|
|
| |
|
904 |
|
| |
|
| |
|
250 |
|
|
| |
|
189 |
|
8.276% due 03/15/2036 •(i) |
|
| |
|
19,256 |
|
|
| |
|
7,331 |
|
| |
|
| |
|
1,325 |
|
|
| |
|
204 |
|
|
| |
|
2.718% due 12/15/2036 (i) |
|
| |
|
16,198 |
|
|
| |
|
9,176 |
|
|
| |
|
7.048% due 04/15/2032 •(i) |
|
| |
|
12,700 |
|
|
| |
|
12,326 |
|
|
New Residential Mortgage Loan Trust |
|
3.846% due 11/25/2059 ~(i) |
|
| |
|
15,500 |
|
|
| |
|
9,128 |
|
|
SFO Commercial Mortgage Trust |
|
| |
|
| |
|
340 |
|
|
| |
|
334 |
|
7.326% due 05/15/2038 •(i) |
|
| |
|
6,500 |
|
|
| |
|
6,258 |
|
|
| |
|
6.237% due 02/25/2053 •(i) |
|
GBP |
|
|
3,800 |
|
|
| |
|
5,156 |
|
6.987% due 02/25/2053 •(i) |
|
| |
|
8,379 |
|
|
| |
|
11,360 |
|
|
| |
|
3.643% due 10/10/2040 •(i) |
|
EUR |
|
|
2,640 |
|
|
| |
|
2,755 |
|
|
WaMu Mortgage Pass-Through Certificates Trust |
|
5.334% due 10/25/2045 •(i) |
|
$ |
|
|
7,384 |
|
|
| |
|
6,392 |
|
|
Wells Fargo Commercial Mortgage Trust |
|
5.092% due 12/15/2039 ~(i) |
|
| |
|
8,600 |
|
|
| |
|
7,803 |
|
|
| |
| |
|
|
| |
| |
|
|
|
Total Non-Agency Mortgage-Backed Securities (Cost $289,368) |
|
|
|
|
|
| |
|
|
|
|
| |
ASSET-BACKED SECURITIES 31.1% |
|
|
| |
AUTOMOBILE ABS OTHER 0.8% |
|
|
Ally Bank Auto Credit-Linked Notes Trust |
|
| |
|
| |
|
308 |
|
|
| |
|
311 |
|
|
Flagship Credit Auto Trust |
|
0.000% due 06/15/2029 «(e) |
|
| |
|
25 |
|
|
| |
|
0 |
|
|
Huntington Bank Auto Credit-Linked Notes |
|
| |
|
| |
|
687 |
|
|
| |
|
690 |
|
|
Santander Bank Auto Credit-Linked Notes |
|
| |
|
| |
|
847 |
|
|
| |
|
854 |
|
| |
|
| |
|
847 |
|
|
| |
|
853 |
|
| |
|
| |
|
1,097 |
|
|
| |
|
1,115 |
|
| |
|
| |
|
1,271 |
|
|
| |
|
1,272 |
|
|
| |
| |
|
|
| |
| |
|
|
|
|
| |
| |
|
|
| |
| |
|
5,095 |
|
|
| |
| |
|
|
| |
| |
|
|
|
|
| |
|
|
|
|
|
|
|
|
|
|
|
|
| |
| |
|
|
|
PRINCIPAL
AMOUNT
(000S) |
|
|
|
|
MARKET
VALUE
(000S) |
|
AUTOMOBILE SEQUENTIAL 0.7% |
|
|
CPS Auto Securitization Trust |
|
| |
|
$ |
|
|
5,000 |
|
|
$ |
|
|
5,082 |
|
|
| |
| |
|
|
| |
| |
|
|
|
|
| |
|
|
|
ACE Securities Corp. Home Equity Loan Trust |
|
4.854% due 04/25/2036 •(i) |
|
| |
|
24,347 |
|
|
| |
|
18,916 |
|
4.874% due 08/25/2036 •(i) |
|
| |
|
20,832 |
|
|
| |
|
4,698 |
|
|
Aegis Asset-Backed Securities Trust |
|
5.409% due 06/25/2035 •(i) |
|
| |
|
4,500 |
|
|
| |
|
1,323 |
|
|
Bear Stearns Asset-Backed Securities Trust |
|
5.484% due 07/25/2034 •(i) |
|
| |
|
4,167 |
|
|
| |
|
4,346 |
|
|
| |
|
4.724% due 05/25/2037 •(i) |
|
| |
|
16,250 |
|
|
| |
|
13,744 |
|
|
Countrywide Asset-Backed Certificates Trust |
|
4.694% due 06/25/2047 •(i) |
|
| |
|
15,083 |
|
|
| |
|
11,884 |
|
4.809% due 06/25/2047 •(i) |
|
| |
|
10,520 |
|
|
| |
|
8,993 |
|
5.404% due 08/25/2047 •(i) |
|
| |
|
2,000 |
|
|
| |
|
1,737 |
|
|
| |
|
4.854% due 05/25/2046 •(i) |
|
| |
|
10,750 |
|
|
| |
|
8,878 |
|
5.379% due 07/25/2045 •(i) |
|
| |
|
15,226 |
|
|
| |
|
11,044 |
|
|
Home Equity Mortgage Loan Asset-Backed Trust |
|
5.349% due 10/25/2035 •(i) |
|
| |
|
11,200 |
|
|
| |
|
9,482 |
|
|
HSI Asset Securitization Corp. Trust |
|
5.244% due 12/25/2035 •(i) |
|
| |
|
13,243 |
|
|
| |
|
9,977 |
|
|
Long Beach Mortgage Loan Trust |
|
6.009% due 02/25/2035 •(i) |
|
| |
|
10,308 |
|
|
| |
|
8,792 |
|
|
Merrill Lynch Mortgage Investors Trust |
|
5.484% due 04/25/2036 •(i) |
|
| |
|
5,984 |
|
|
| |
|
5,027 |
|
|
Saxon Asset Securities Trust |
|
4.724% due 01/25/2047 •(i) |
|
| |
|
1,712 |
|
|
| |
|
1,679 |
|
|
Structured Asset Securities Corp. Mortgage Loan Trust |
|
5.859% due 02/25/2036 •(i) |
|
| |
|
6,876 |
|
|
| |
|
6,641 |
|
|
| |
| |
|
|
| |
| |
|
|
|
|
| |
| |
|
|
| |
| |
|
127,161 |
|
|
| |
| |
|
|
| |
| |
|
|
|
|
| |
WHOLE LOAN COLLATERAL 4.7% |
|
|
First Franklin Mortgage Loan Trust |
|
4.744% due 10/25/2036 •(i) |
|
| |
|
15,000 |
|
|
| |
|
12,252 |
|
|
| |
|
6.170% due 07/25/2051 þ(i) |
|
| |
|
11,780 |
|
|
| |
|
11,777 |
|
|
Securitized Asset-Backed Receivables LLC Trust |
|
5.034% due 11/25/2035 •(i) |
|
| |
|
5,327 |
|
|
| |
|
4,473 |
|
|
Specialty Underwriting & Residential Finance Trust |
|
6.234% due 12/25/2035 •(i) |
|
| |
|
4,678 |
|
|
| |
|
4,364 |
|
|
| |
| |
|
|
| |
| |
|
|
|
|
| |
| |
|
|
| |
| |
|
32,866 |
|
|
| |
| |
|
|
| |
| |
|
|
|
|
| |
|
|
|
College Ave Student Loans Trust |
|
0.000% due 06/25/2054 «(e) |
|
| |
|
5 |
|
|
| |
|
2,608 |
|
| |
|
| |
|
635 |
|
|
| |
|
651 |
|
| |
|
| |
|
914 |
|
|
| |
|
920 |
|
|
Cologix Canadian Issuer LP |
|
| |
|
CAD |
|
|
5,400 |
|
|
| |
|
3,848 |
|
|
| |
|
| |
|
EUR |
|
|
4,000 |
|
|
| |
|
2,786 |
|
|
| |
|
8.000% due 04/08/2039 •(i) |
|
$ |
|
|
125,567 |
|
|
| |
|
9,900 |
|
|
GreenSky Home Improvement Trust |
|
| |
|
| |
|
500 |
|
|
| |
|
520 |
|
|
LendingPoint Pass-Through Trust |
|
0.000% due 04/15/2028 «(e) |
|
| |
|
7,600 |
|
|
| |
|
1,042 |
|
0.000% due 05/15/2028 «(e) |
|
| |
|
7,554 |
|
|
| |
|
986 |
|
|
| |
|
| |
|
| |
|
3,200 |
|
|
| |
|
525 |
|
|
| |
|
| |
|
| |
|
4,000 |
|
|
| |
|
1,623 |
|
| |
|
| |
|
14,600 |
|
|
| |
|
5,163 |
|
|
SMB Private Education Loan Trust |
|
0.000% due 11/16/2054 «(e) |
|
| |
|
9 |
|
|
| |
|
7,526 |
|
0.000% due 02/16/2055 «(e) |
|
| |
|
5 |
|
|
| |
|
4,601 |
|
|
|
|
|
|
|
|
|
|
|
|
|
| |
| |
|
|
|
PRINCIPAL
AMOUNT
(000S) |
|
|
|
|
MARKET
VALUE
(000S) |
|
5.950% due 02/16/2055 (i) |
|
$ |
|
|
3,154 |
|
|
$ |
|
|
3,142 |
|
|
| |
| |
|
|
| |
| |
|
|
|
|
| |
| |
|
|
| |
| |
|
45,841 |
|
|
| |
| |
|
|
| |
| |
|
|
|
Total Asset-Backed Securities
(Cost $261,048) |
|
|
|
|
|
| |
|
|
|
|
| |
|
|
|
Avenir Issuer Ireland DAC |
|
| |
|
| |
|
1,973 |
|
|
| |
|
1,851 |
|
|
Dominican Republic International Bond |
|
10.500% due 03/15/2037 (i) |
|
DOP |
|
|
427,900 |
|
|
| |
|
7,318 |
|
|
Ecuador Government International Bond |
|
0.000% due 07/31/2030 (e)(i) |
|
$ |
|
|
2,700 |
|
|
| |
|
1,968 |
|
6.900% due 07/31/2030 (i) |
|
| |
|
4,100 |
|
|
| |
|
3,567 |
|
|
Egypt Government International Bond |
|
6.375% due 04/11/2031 (i) |
|
EUR |
|
|
1,800 |
|
|
| |
|
1,972 |
|
|
El Salvador Government International Bond |
|
9.250% due 04/17/2030 (i) |
|
$ |
|
|
2,600 |
|
|
| |
|
2,759 |
|
9.650% due 11/21/2054 (i) |
|
| |
|
1,500 |
|
|
| |
|
1,549 |
|
|
Republic of Kenya Government International Bond |
|
| |
|
| |
|
600 |
|
|
| |
|
567 |
|
|
Romania Government International Bond |
|
5.250% due 03/10/2030 (i) |
|
EUR |
|
|
1,700 |
|
|
| |
|
2,047 |
|
| |
|
| |
|
5,600 |
|
|
| |
|
6,663 |
|
| |
|
| |
|
5,800 |
|
|
| |
|
6,901 |
|
|
Russia Government International Bond |
|
| |
|
$ |
|
|
8,800 |
|
|
| |
|
6,160 |
|
| |
|
| |
|
200 |
|
|
| |
|
137 |
|
|
Turkiye Government International Bond |
|
| |
|
TRY |
|
|
240,100 |
|
|
| |
|
5,791 |
|
| |
|
| |
|
27,900 |
|
|
| |
|
680 |
|
|
| |
| |
|
|
| |
| |
|
|
|
Total Sovereign Issues (Cost $44,753) |
|
|
|
|
|
| |
|
|
|
|
| |
| |
|
|
|
SHARES |
|
|
|
|
|
|
|
|
|
| |
COMMUNICATION SERVICES 0.1% |
|
|
|
|
|
| |
| |
|
| |
|
6,837,091 |
|
|
| |
|
805 |
|
|
| |
| |
|
|
| |
| |
|
|
|
|
| |
CONSUMER DISCRETIONARY 0.0% |
|
|
|
|
|
| |
| |
|
| |
|
8,371 |
|
|
| |
|
53 |
|
|
| |
| |
|
|
| |
| |
|
|
|
|
| |
|
|
|
|
|
|
| |
Steinhoff International Holdings NV «(c)(h) |
|
| |
|
39,030,044 |
|
|
| |
|
0 |
|
|
| |
| |
|
|
| |
| |
|
|
|
|
| |
|
|
|
|
|
|
| |
Banca Monte dei Paschi di Siena SpA |
|
| |
|
1,073,500 |
|
|
| |
|
9,132 |
|
|
|
|
|
| |
MNSN Holdings, Inc. «(c)(h) |
|
| |
|
3,863 |
|
|
| |
|
16 |
|
|
| |
| |
|
|
| |
| |
|
|
|
|
| |
| |
|
|
| |
| |
|
9,148 |
|
|
| |
| |
|
|
| |
| |
|
|
|
|
| |
|
|
|
|
|
|
| |
| |
|
| |
|
718,727 |
|
|
| |
|
32,448 |
|
|
| |
| |
|
|
| |
| |
|
|
|
|
| |
|
|
|
|
|
|
| |
Incora New Equity «(c)(h) |
|
| |
|
80,167 |
|
|
| |
|
2,709 |
|
|
| |
| |
|
|
| |
| |
|
|
|
|
| |
| |
|
|
| |
| |
|
2,709 |
|
|
| |
| |
|
|
| |
| |
|
|
|
Total Common Stocks (Cost $36,183) |
|
|
|
|
|
| |
|
|
|
|
| |
|
|
|
| |
CONSUMER DISCRETIONARY 0.0% |
|
|
|
|
|
| |
West Marine - Exp. 09/11/2028 « |
|
| |
|
14,259 |
|
|
| |
|
0 |
|
|
| |
| |
|
|
| |
| |
|
|
|
| |
|
|
|
|
|
| |
|
|
|
|
|
|
|
|
|
|
|
|
|
|
|
| |
| |
|
|
|
|
|
|
|
|
|
|
PREFERRED SECURITIES 2.9% |
|
|
| |
|
|
|
|
|
|
| |
| |
|
| |
|
3,298,852 |
|
|
$ |
|
|
0 |
|
|
| |
| |
|
|
| |
| |
|
|
|
|
| |
|
|
|
|
|
|
| |
| |
|
| |
|
59 |
|
|
| |
|
5,999 |
|
|
| |
|
| |
|
| |
|
12,441 |
|
|
| |
|
220 |
|
|
| |
|
0.000% due 11/07/2032 (e) |
|
| |
|
19,600 |
|
|
| |
|
0 |
|
| |
|
| |
|
4,403 |
|
|
| |
|
2,334 |
|
|
|
|
|
| |
Syniverse Holdings, Inc. «(h) |
|
| |
|
12,036,018 |
|
|
| |
|
11,392 |
|
|
| |
| |
|
|
| |
| |
|
|
|
|
| |
| |
|
|
| |
| |
|
19,945 |
|
|
| |
| |
|
|
| |
| |
|
|
|
Total Preferred Securities (Cost $20,461) |
|
|
|
|
|
| |
|
|
|
|
| |
SHORT-TERM INSTRUMENTS 1.9% |
|
|
| |
|
|
|
State Street Institutional U.S. Government Money Market Fund, Premier Class |
|
| |
|
| |
|
6,265,497 |
|
|
| |
|
6,265 |
|
|
| |
| |
|
|
| |
| |
|
|
|
|
| |
| |
|
|
|
|
|
|
|
|
|
|
|
|
4.327% due 08/14/2025 - 10/21/2025 (d)(e)(k)(m) |
|
$ |
|
|
7,347 |
|
|
| |
|
7,276 |
|
|
| |
| |
|
|
| |
| |
|
|
|
Total Short-Term Instruments
|
|
|
|
|
|
| |
|
|
|
|
|
|
|
| |
|
| |
| |
|
|
| |
| |
|
| |
Total Investments in Securities
|
|
|
|
|
|
| |
|
|
|
|
| |
| |
|
|
|
|
|
|
|
|
|
|
INVESTMENTS IN AFFILIATES 10.7% |
|
|
| |
|
|
|
| |
AFFILIATED INVESTMENTS 1.4% |
|
|
|
|
|
| |
| |
|
| |
|
10,108,628 |
|
|
| |
|
9,950 |
|
|
| |
| |
|
|
| |
| |
|
|
|
Total Common Stocks
(Cost $10,109) |
|
|
|
|
|
| |
|
|
|
|
| |
SHORT-TERM INSTRUMENTS 9.3% |
|
|
| |
CENTRAL FUNDS USED FOR CASH MANAGEMENT PURPOSES 9.3% |
|
|
|
|
| |
PIMCO Short-Term
Floating NAV Portfolio III |
|
|
6,602,628 |
|
|
| |
|
64,290 |
|
|
| |
| |
|
|
| |
| |
|
|
|
Total Short-Term Instruments
(Cost $64,248) |
|
|
|
|
|
| |
|
|
|
|
|
|
|
| |
|
| |
| |
|
|
| |
| |
|
| |
Total Investments in Affiliates |
|
|
|
|
|
| |
|
| |
|
| |
Total Investments 166.0%
(Cost $1,270,399) |
|
|
$ |
|
|
|
|
|
| |
Financial Derivative
Instruments (j)(l) (0.8)% (Cost or Premiums, net $13,203) |
|
|
| |
|
|
|
|
| |
Other Assets and Liabilities, net (65.2)% |
|
|
|
|
|
| |
|
|
|
|
|
|
$ |
|
|
|
|
|
|
| |
| |
|
|
|
|
|
|
|
|
|
|
|
|
|
|
|
| |
See Accompanying Notes |
|
|
|
|
|
| |
|
|
JUNE 30, 2025 |
|
|
|
|
|
|
|
|
|
| |
Consolidated Schedule of Investments |
|
|
|
|
|
|
NOTES TO CONSOLIDATED SCHEDULE OF INVESTMENTS:
|
A zero balance may reflect actual amounts rounding to less than one thousand. |
|
Represents co-investment made with Company’s affiliates in accordance with the terms of the exemptive relief received from the U.S. Securities and Exchange Commission. See Note 10, Related Party Transactions in the Notes to Consolidated Financial Statements. |
|
Security valued using significant unobservable inputs (Level 3). |
|
All or a portion of this amount represents unfunded loan commitments. The interest rate for the unfunded portion will be determined at the time of funding. See Note 4, Securities and Other Investments, in the Notes to Financial Statements for more information regarding unfunded loan commitments. |
|
Variable or Floating rate security. Rate shown is the rate in effect as of period end. Certain variable rate securities are not based on a published reference rate and spread, rather are determined by the issuer or agent and are based on current market conditions. Reference rate is as of reset date, which may vary by security. These securities may not indicate a reference rate and/or spread in their description. |
|
Rate shown is the rate in effect as of period end. The rate may be based on a fixed rate, a capped rate or a floor rate and may convert to a variable or floating rate in the future. These securities do not indicate a reference rate and spread in their description. |
|
Coupon represents a rate which changes periodically based on a predetermined schedule or event. Rate shown is the rate in effect as of period end. |
|
Insurance-Linked Investments. |
|
Payment in-kind security. |
|
Security did not produce income within the last twelve months. |
|
Coupon represents a weighted average yield to maturity. |
|
Perpetual maturity; date shown, if applicable, represents next contractual call date. |
|
Coupon represents a 7-Day Yield. |
(h) RESTRICTED SECURITIES:
|
|
|
|
|
|
|
|
|
|
|
|
|
|
|
|
|
|
|
|
|
|
|
|
| |
|
|
|
|
|
|
|
|
|
|
|
|
|
|
|
|
|
Market Value
as Percentage
of Net Assets |
|
| |
|
|
|
| |
|
|
| |
|
|
|
|
$ |
30,032 |
|
|
$ |
32,448 |
|
|
|
4.67 |
% |
| |
|
|
|
| |
|
|
| |
|
12/09/2024 - 03/10/2025 |
|
|
|
186 |
|
|
|
220 |
|
|
|
0.03 |
|
| |
|
|
|
| |
|
|
| |
|
01/31/2025 |
|
|
|
3,894 |
|
|
|
2,709 |
|
|
|
0.39 |
|
Incora Top Holdco LLC 6.000% due 01/30/2033 |
|
|
|
| |
|
|
| |
|
01/31/2025 |
|
|
|
1,720 |
|
|
|
2,384 |
|
|
|
0.34 |
|
| |
|
|
|
| |
|
|
| |
|
03/16/2023 - 03/29/2023 |
|
|
|
43 |
|
|
|
16 |
|
|
|
0.00 |
|
| |
|
|
|
| |
|
|
| |
|
03/13/2024 |
|
|
|
10,109 |
|
|
|
9,950 |
|
|
|
1.43 |
|
Steinhoff International Holdings NV |
|
|
|
| |
|
|
| |
|
06/30/2023 - 10/30/2023 |
|
|
|
0 |
|
|
|
0 |
|
|
|
0.00 |
|
| |
|
|
|
| |
|
|
| |
|
05/12/2022 - 05/30/2025 |
|
|
|
11,870 |
|
|
|
11,392 |
|
|
|
1.64 |
|
| |
|
|
|
| |
|
|
| |
|
09/12/2023 |
|
|
|
120 |
|
|
|
53 |
|
|
|
0.01 |
|
|
| |
|
|
| |
|
|
| |
|
|
| |
|
|
|
|
|
|
|
|
|
|
|
|
|
| |
$ |
57,974 |
|
|
$ |
59,172 |
|
|
|
8.51 |
% |
|
| |
|
|
| |
|
|
| |
|
|
| |
|
|
|
|
|
|
|
|
|
|
|
BORROWINGS AND OTHER FINANCING TRANSACTIONS
REVERSE REPURCHASE AGREEMENTS:
|
|
|
|
|
|
|
|
|
|
|
|
|
|
|
|
|
|
|
|
|
|
|
|
| |
|
|
|
|
|
|
|
|
|
|
|
|
|
|
Payable for
Reverse
Repurchase
Agreements |
|
| |
|
|
5.590 |
% |
|
|
06/27/2025 |
|
|
|
10/29/2025 |
|
|
|
$ |
|
|
|
(2,406 |
) |
|
$ |
(2,407 |
) |
| |
|
|
4.490 |
|
|
|
03/11/2025 |
|
|
|
TBD |
|
|
|
|
| |
|
(1,630 |
) |
|
|
(1,653 |
) |
|
| |
|
4.730 |
|
|
|
06/16/2025 |
|
|
|
TBD |
|
|
|
|
| |
|
(2,644 |
) |
|
|
(2,650 |
) |
|
| |
|
5.510 |
|
|
|
05/15/2025 |
|
|
|
11/12/2025 |
|
|
|
|
| |
|
(4,867 |
) |
|
|
(4,901 |
) |
|
| |
|
5.590 |
|
|
|
05/15/2025 |
|
|
|
11/12/2025 |
|
|
|
|
| |
|
(6,660 |
) |
|
|
(6,708 |
) |
|
| |
|
5.620 |
|
|
|
04/25/2025 |
|
|
|
10/23/2025 |
|
|
|
|
| |
|
(47,706 |
) |
|
|
(48,195 |
) |
|
| |
|
5.720 |
|
|
|
04/25/2025 |
|
|
|
10/23/2025 |
|
|
|
|
| |
|
(1,578 |
) |
|
|
(1,595 |
) |
| |
|
|
1.000 |
|
|
|
06/11/2025 |
|
|
|
TBD |
|
|
|
EUR |
|
|
|
(1,353 |
) |
|
|
(1,595 |
) |
|
| |
|
1.300 |
|
|
|
06/11/2025 |
|
|
|
TBD |
|
|
|
|
| |
|
(1,978 |
) |
|
|
(2,331 |
) |
|
| |
|
4.250 |
|
|
|
03/03/2025 |
|
|
|
TBD |
|
|
|
$ |
|
|
|
(3,042 |
) |
|
|
(3,085 |
) |
|
| |
|
4.330 |
|
|
|
06/10/2025 |
|
|
|
TBD |
|
|
|
|
| |
|
(1,720 |
) |
|
|
(1,725 |
) |
|
| |
|
5.210 |
|
|
|
04/04/2025 |
|
|
|
10/01/2025 |
|
|
|
|
| |
|
(4,892 |
) |
|
|
(4,954 |
) |
|
| |
|
5.360 |
|
|
|
04/04/2025 |
|
|
|
10/01/2025 |
|
|
|
|
| |
|
(932 |
) |
|
|
(944 |
) |
|
| |
|
5.430 |
|
|
|
04/08/2025 |
|
|
|
07/08/2025 |
|
|
|
|
| |
|
(6,527 |
) |
|
|
(6,610 |
) |
|
| |
|
5.490 |
|
|
|
06/27/2025 |
|
|
|
10/27/2025 |
|
|
|
|
| |
|
(10,684 |
) |
|
|
(10,690 |
) |
|
| |
|
5.520 |
|
|
|
04/22/2025 |
|
|
|
07/22/2025 |
|
|
|
|
| |
|
(2,196 |
) |
|
|
(2,220 |
) |
|
| |
|
5.540 |
|
|
|
06/27/2025 |
|
|
|
10/27/2025 |
|
|
|
|
| |
|
(809 |
) |
|
|
(809 |
) |
|
| |
|
5.590 |
|
|
|
06/06/2025 |
|
|
|
10/07/2025 |
|
|
|
|
| |
|
(4,338 |
) |
|
|
(4,355 |
) |
|
| |
|
5.590 |
|
|
|
06/11/2025 |
|
|
|
10/10/2025 |
|
|
|
|
| |
|
(3,964 |
) |
|
|
(3,976 |
) |
|
| |
|
5.590 |
|
|
|
06/24/2025 |
|
|
|
10/22/2025 |
|
|
|
|
| |
|
(4,661 |
) |
|
|
(4,666 |
) |
|
| |
|
5.590 |
|
|
|
06/27/2025 |
|
|
|
10/27/2025 |
|
|
|
|
| |
|
(21,067 |
) |
|
|
(21,080 |
) |
|
|
|
|
|
|
| |
70 |
|
PIMCO CLOSED-END FUNDS |
|
|
See Accompanying Notes |
|
|
|
|
|
|
|
|
|
|
|
|
|
|
|
|
|
|
|
|
|
|
|
| |
Counterparty |
|
|
|
|
Settlement
Date |
|
|
Maturity
Date |
|
|
|
|
|
Payable for
Reverse
Repurchase
Agreements |
|
| |
|
|
4.890 |
% |
|
|
04/21/2025 |
|
|
|
07/21/2025 |
|
|
$ |
|
|
(21,127 |
) |
|
$ |
(21,328 |
) |
|
| |
|
4.890 |
|
|
|
06/06/2025 |
|
|
|
07/03/2025 |
|
|
| |
|
(8,307 |
) |
|
|
(8,334 |
) |
|
| |
|
4.890 |
|
|
|
06/24/2025 |
|
|
|
07/03/2025 |
|
|
| |
|
(1,960 |
) |
|
|
(1,962 |
) |
|
| |
|
4.890 |
|
|
|
06/30/2025 |
|
|
|
07/21/2025 |
|
|
| |
|
(2,413 |
) |
|
|
(2,414 |
) |
|
| |
|
4.940 |
|
|
|
04/09/2025 |
|
|
|
10/08/2025 |
|
|
| |
|
(2,564 |
) |
|
|
(2,593 |
) |
| |
|
|
5.575 |
|
|
|
04/24/2025 |
|
|
|
10/20/2025 |
|
|
| |
|
(1,484 |
) |
|
|
(1,500 |
) |
| |
|
|
4.650 |
|
|
|
03/12/2025 |
|
|
|
TBD |
|
|
| |
|
(2,179 |
) |
|
|
(2,211 |
) |
|
| |
|
4.650 |
|
|
|
03/24/2025 |
|
|
|
TBD |
|
|
| |
|
(1,210 |
) |
|
|
(1,226 |
) |
|
| |
|
4.700 |
|
|
|
04/10/2025 |
|
|
|
TBD |
|
|
| |
|
(6,406 |
) |
|
|
(6,475 |
) |
|
| |
|
4.870 |
|
|
|
06/27/2025 |
|
|
|
07/25/2025 |
|
|
| |
|
(6,363 |
) |
|
|
(6,363 |
) |
|
| |
|
5.265 |
|
|
|
06/16/2025 |
|
|
|
08/15/2025 |
|
|
| |
|
(3,818 |
) |
|
|
(3,826 |
) |
|
| |
|
5.411 |
|
|
|
06/30/2025 |
|
|
|
08/29/2025 |
|
|
| |
|
(4,066 |
) |
|
|
(4,066 |
) |
|
| |
|
5.420 |
|
|
|
06/24/2025 |
|
|
|
08/22/2025 |
|
|
| |
|
(9,942 |
) |
|
|
(9,952 |
) |
|
| |
|
5.513 |
|
|
|
06/27/2025 |
|
|
|
08/22/2025 |
|
|
| |
|
(7,717 |
) |
|
|
(7,722 |
) |
|
| |
|
5.520 |
|
|
|
06/24/2025 |
|
|
|
08/22/2025 |
|
|
| |
|
(1,266 |
) |
|
|
(1,267 |
) |
|
| |
|
5.820 |
|
|
|
06/24/2025 |
|
|
|
08/22/2025 |
|
|
| |
|
(7,754 |
) |
|
|
(7,763 |
) |
|
| |
|
5.920 |
|
|
|
06/24/2025 |
|
|
|
08/22/2025 |
|
|
| |
|
(8,798 |
) |
|
|
(8,808 |
) |
| |
|
|
5.613 |
|
|
|
10/29/2024 |
|
|
|
07/29/2025 |
|
|
| |
|
(2,853 |
) |
|
|
(2,962 |
) |
| |
|
|
4.790 |
|
|
|
06/04/2025 |
|
|
|
09/04/2025 |
|
|
| |
|
(1,544 |
) |
|
|
(1,549 |
) |
| |
|
|
1.250 |
|
|
|
06/11/2025 |
|
|
|
TBD |
|
|
EUR |
|
|
(316 |
) |
|
|
(373 |
) |
| |
|
|
2.250 |
|
|
|
06/11/2025 |
|
|
|
07/07/2025 |
|
|
| |
|
(3,627 |
) |
|
|
(4,278 |
) |
|
| |
|
2.950 |
|
|
|
03/14/2025 |
|
|
|
07/14/2025 |
|
|
| |
|
(5,250 |
) |
|
|
(6,237 |
) |
|
| |
|
4.680 |
|
|
|
06/26/2025 |
|
|
|
09/26/2025 |
|
|
GBP |
|
|
(2,987 |
) |
|
|
(4,102 |
) |
|
| |
|
4.880 |
|
|
|
06/18/2025 |
|
|
|
08/18/2025 |
|
|
| |
|
(6,101 |
) |
|
|
(8,388 |
) |
| |
|
|
2.604 |
|
|
|
06/12/2025 |
|
|
|
09/18/2025 |
|
|
EUR |
|
|
(1,816 |
) |
|
|
(2,142 |
) |
|
| |
|
5.390 |
|
|
|
06/24/2025 |
|
|
|
12/22/2025 |
|
|
$ |
|
|
(1,986 |
) |
|
|
(1,988 |
) |
|
| |
|
5.440 |
|
|
|
05/19/2025 |
|
|
|
11/19/2025 |
|
|
| |
|
(432 |
) |
|
|
(435 |
) |
|
| |
|
5.490 |
|
|
|
05/06/2025 |
|
|
|
11/03/2025 |
|
|
| |
|
(2,438 |
) |
|
|
(2,458 |
) |
|
| |
|
5.540 |
|
|
|
05/06/2025 |
|
|
|
11/03/2025 |
|
|
| |
|
(7,372 |
) |
|
|
(7,435 |
) |
|
| |
|
5.640 |
|
|
|
05/06/2025 |
|
|
|
11/03/2025 |
|
|
| |
|
(13,055 |
) |
|
|
(13,169 |
) |
| |
|
|
1.250 |
|
|
|
06/11/2025 |
|
|
|
TBD |
|
|
EUR |
|
|
(307 |
) |
|
|
(362 |
) |
|
| |
|
1.300 |
|
|
|
06/11/2025 |
|
|
|
TBD |
|
|
| |
|
(527 |
) |
|
|
(621 |
) |
|
| |
|
1.700 |
|
|
|
06/11/2025 |
|
|
|
TBD |
|
|
| |
|
(807 |
) |
|
|
(952 |
) |
| |
|
|
5.510 |
|
|
|
06/20/2025 |
|
|
|
12/19/2025 |
|
|
$ |
|
|
(61,698 |
) |
|
|
(61,800 |
) |
| |
|
|
5.790 |
|
|
|
06/20/2025 |
|
|
|
12/19/2025 |
|
|
| |
|
(692 |
) |
|
|
(693 |
) |
| |
|
|
4.970 |
|
|
|
06/09/2025 |
|
|
|
10/09/2025 |
|
|
| |
|
(5,249 |
) |
|
|
(5,265 |
) |
|
| |
|
4.990 |
|
|
|
06/09/2025 |
|
|
|
10/09/2025 |
|
|
| |
|
(1,709 |
) |
|
|
(1,714 |
) |
|
| |
|
5.360 |
|
|
|
06/18/2025 |
|
|
|
12/18/2025 |
|
|
| |
|
(9,907 |
) |
|
|
(9,926 |
) |
|
| |
|
5.470 |
|
|
|
06/09/2025 |
|
|
|
10/09/2025 |
|
|
| |
|
(1,862 |
) |
|
|
(1,868 |
) |
|
| |
|
5.490 |
|
|
|
04/30/2025 |
|
|
|
10/30/2025 |
|
|
| |
|
(1,191 |
) |
|
|
(1,203 |
) |
|
| |
|
5.540 |
|
|
|
04/30/2025 |
|
|
|
10/30/2025 |
|
|
| |
|
(1,309 |
) |
|
|
(1,322 |
) |
| |
|
|
2.350 |
|
|
|
04/04/2025 |
|
|
|
07/04/2025 |
|
|
EUR |
|
|
(1,641 |
) |
|
|
(1,943 |
) |
| |
|
|
4.600 |
|
|
|
12/20/2024 |
|
|
|
TBD |
|
|
$ |
|
|
(1,283 |
) |
|
|
(1,315 |
) |
|
| |
|
4.620 |
|
|
|
06/24/2025 |
|
|
|
TBD |
|
|
| |
|
(14,782 |
) |
|
|
(14,795 |
) |
|
| |
|
4.670 |
|
|
|
05/12/2025 |
|
|
|
07/14/2025 |
|
|
| |
|
(190 |
) |
|
|
(191 |
) |
|
| |
|
4.720 |
|
|
|
06/30/2025 |
|
|
|
TBD |
|
|
| |
|
(5,130 |
) |
|
|
(5,131 |
) |
|
| |
|
4.800 |
|
|
|
04/09/2025 |
|
|
|
07/08/2025 |
|
|
| |
|
(847 |
) |
|
|
(856 |
) |
|
| |
|
4.860 |
|
|
|
06/18/2025 |
|
|
|
09/18/2025 |
|
|
| |
|
(2,040 |
) |
|
|
(2,044 |
) |
|
| |
|
5.340 |
|
|
|
06/18/2025 |
|
|
|
12/18/2025 |
|
|
| |
|
(5,076 |
) |
|
|
(5,086 |
) |
|
| |
|
5.390 |
|
|
|
06/18/2025 |
|
|
|
12/18/2025 |
|
|
| |
|
(1,242 |
) |
|
|
(1,244 |
) |
|
| |
|
5.490 |
|
|
|
05/19/2025 |
|
|
|
11/19/2025 |
|
|
| |
|
(3,086 |
) |
|
|
(3,106 |
) |
|
| |
|
5.540 |
|
|
|
05/07/2025 |
|
|
|
11/07/2025 |
|
|
| |
|
(5,805 |
) |
|
|
(5,853 |
) |
| |
|
|
2.130 |
|
|
|
06/11/2025 |
|
|
|
TBD |
|
|
EUR |
|
|
(442 |
) |
|
|
(521 |
) |
|
| |
|
2.150 |
|
|
|
06/11/2025 |
|
|
|
TBD |
|
|
| |
|
(1,457 |
) |
|
|
(1,718 |
) |
|
| |
|
2.400 |
|
|
|
07/02/2025 |
|
|
|
10/02/2025 |
|
|
| |
|
(1,287 |
) |
|
|
(1,516 |
) |
|
| |
|
4.900 |
|
|
|
04/16/2025 |
|
|
|
07/16/2025 |
|
|
$ |
|
|
(3,196 |
) |
|
|
(3,229 |
) |
|
| |
|
5.280 |
|
|
|
04/23/2025 |
|
|
|
07/23/2025 |
|
|
| |
|
(8,387 |
) |
|
|
(8,472 |
) |
|
| |
|
5.340 |
|
|
|
04/16/2025 |
|
|
|
10/16/2025 |
|
|
| |
|
(8,406 |
) |
|
|
(8,501 |
) |
|
| |
|
5.430 |
|
|
|
04/23/2025 |
|
|
|
07/23/2025 |
|
|
| |
|
(4,279 |
) |
|
|
(4,324 |
) |
|
| |
|
5.440 |
|
|
|
04/04/2025 |
|
|
|
10/03/2025 |
|
|
| |
|
(4,990 |
) |
|
|
(5,056 |
) |
|
| |
|
5.460 |
|
|
|
05/19/2025 |
|
|
|
11/19/2025 |
|
|
| |
|
(572 |
) |
|
|
(576 |
) |
|
| |
|
5.590 |
|
|
|
04/04/2025 |
|
|
|
10/03/2025 |
|
|
| |
|
(5,203 |
) |
|
|
(5,274 |
) |
|
| |
|
|
| |
|
|
| |
|
|
| |
| |
|
|
| |
|
|
|
Total Reverse Repurchase Agreements |
|
|
|
|
| |
| |
|
|
| |
|
|
|
|
| |
|
|
| |
|
|
| |
|
|
| |
| |
|
|
| |
|
|
|
|
|
|
|
|
|
|
|
|
|
|
|
| |
See Accompanying Notes |
|
|
|
|
|
| |
|
|
JUNE 30, 2025 |
|
|
|
|
|
|
|
|
|
| |
Consolidated Schedule of Investments |
|
|
|
|
|
|
BORROWINGS AND OTHER FINANCING TRANSACTIONS SUMMARY
The following is a summary by counterparty of the market value of Borrowings and Other Financing Transactions and collateral pledged/(received) as of June 30, 2025:
|
|
|
|
|
|
|
|
|
|
|
|
|
|
|
|
|
|
|
|
|
|
|
|
| |
|
|
Repurchase
Agreement
Proceeds
to be
Received |
|
|
Payable for
Reverse
Repurchase
Agreements |
|
|
Payable for Sale-Buyback Transactions |
|
|
Total
Borrowings and
Other Financing
Transactions |
|
|
Collateral
Pledged/(Received) |
|
|
|
|
Global/Master Repurchase Agreement |
|
| |
|
$ |
0 |
|
|
$ |
(2,407 |
) |
|
$ |
0 |
|
|
$ |
(2,407 |
) |
|
$ |
3,125 |
|
|
$ |
718 |
|
| |
|
|
0 |
|
|
|
(65,702 |
) |
|
|
0 |
|
|
|
(65,702 |
) |
|
|
84,662 |
|
|
|
18,960 |
|
| |
|
|
0 |
|
|
|
(69,040 |
) |
|
|
0 |
|
|
|
(69,040 |
) |
|
|
87,209 |
|
|
|
18,169 |
|
| |
|
|
0 |
|
|
|
(36,631 |
) |
|
|
0 |
|
|
|
(36,631 |
) |
|
|
43,584 |
|
|
|
6,953 |
|
| |
|
|
0 |
|
|
|
(1,500 |
) |
|
|
0 |
|
|
|
(1,500 |
) |
|
|
2,135 |
|
|
|
635 |
|
| |
|
|
0 |
|
|
|
(59,679 |
) |
|
|
0 |
|
|
|
(59,679 |
) |
|
|
76,403 |
|
|
|
16,724 |
|
| |
|
|
0 |
|
|
|
(2,962 |
) |
|
|
0 |
|
|
|
(2,962 |
) |
|
|
4,342 |
|
|
|
1,380 |
|
| |
|
|
0 |
|
|
|
(1,549 |
) |
|
|
0 |
|
|
|
(1,549 |
) |
|
|
1,889 |
|
|
|
340 |
|
| |
|
|
0 |
|
|
|
(373 |
) |
|
|
0 |
|
|
|
(373 |
) |
|
|
371 |
|
|
|
(2 |
) |
| |
|
|
0 |
|
|
|
(23,005 |
) |
|
|
0 |
|
|
|
(23,005 |
) |
|
|
28,585 |
|
|
|
5,580 |
|
| |
|
|
0 |
|
|
|
(27,627 |
) |
|
|
0 |
|
|
|
(27,627 |
) |
|
|
40,253 |
|
|
|
12,626 |
|
| |
|
|
0 |
|
|
|
(1,935 |
) |
|
|
0 |
|
|
|
(1,935 |
) |
|
|
1,889 |
|
|
|
(46 |
) |
| |
|
|
0 |
|
|
|
(61,800 |
) |
|
|
0 |
|
|
|
(61,800 |
) |
|
|
83,741 |
|
|
|
21,941 |
|
| |
|
|
0 |
|
|
|
(693 |
) |
|
|
0 |
|
|
|
(693 |
) |
|
|
1,065 |
|
|
|
372 |
|
| |
|
|
0 |
|
|
|
(21,298 |
) |
|
|
0 |
|
|
|
(21,298 |
) |
|
|
25,814 |
|
|
|
4,516 |
|
| |
|
|
0 |
|
|
|
(1,943 |
) |
|
|
0 |
|
|
|
(1,943 |
) |
|
|
1,783 |
|
|
|
(160 |
) |
| |
|
|
0 |
|
|
|
(39,621 |
) |
|
|
0 |
|
|
|
(39,621 |
) |
|
|
49,989 |
|
|
|
10,368 |
|
| |
|
|
0 |
|
|
|
0 |
|
|
|
0 |
|
|
|
0 |
|
|
|
52,420 |
|
|
|
52,420 |
|
| |
|
|
0 |
|
|
|
(39,187 |
) |
|
|
0 |
|
|
|
(39,187 |
) |
|
|
0 |
|
|
|
(39,187 |
) |
|
| |
|
|
|
|
|
|
|
|
|
|
|
|
|
|
| |
|
|
| |
|
| |
Total Borrowings and Other Financing Transactions |
|
|
|
|
|
|
|
|
|
|
|
|
|
|
|
| |
|
|
| |
|
| |
|
| |
|
|
|
|
|
|
|
|
|
|
|
|
|
|
| |
|
|
| |
|
| |
CERTAIN TRANSFERS ACCOUNTED FOR AS SECURED BORROWINGS
Remaining Contractual Maturity of the Agreements
|
|
|
|
|
|
|
|
|
|
|
|
|
|
|
|
|
|
|
|
| |
| |
|
|
|
|
|
|
|
|
|
|
|
|
|
|
|
Reverse Repurchase Agreements |
|
| |
|
$ |
0 |
|
|
$ |
(48,828 |
) |
|
$ |
(3,593 |
) |
|
$ |
(44,538 |
) |
|
$ |
(96,959 |
) |
| |
|
|
0 |
|
|
|
(4,324 |
) |
|
|
(5,515 |
) |
|
|
(19,698 |
) |
|
|
(29,537 |
) |
Non-Agency Mortgage-Backed Securities |
|
|
0 |
|
|
|
(16,912 |
) |
|
|
(35,952 |
) |
|
|
(123,654 |
) |
|
|
(176,518 |
) |
| |
|
|
0 |
|
|
|
(3,352 |
) |
|
|
(16,571 |
) |
|
|
(110,420 |
) |
|
|
(130,343 |
) |
| |
|
|
0 |
|
|
|
(8,307 |
) |
|
|
0 |
|
|
|
(13,772 |
) |
|
|
(22,079 |
) |
|
| |
|
|
|
|
|
|
|
|
|
|
|
|
|
|
|
|
|
|
|
| |
|
|
|
|
|
|
|
|
|
|
|
|
|
|
|
|
|
|
|
|
|
| |
|
|
|
|
|
|
|
|
|
|
|
|
|
|
|
|
|
|
|
Payable for reverse repurchase agreements (4) |
|
|
|
|
|
|
| |
|
|
| |
|
|
| |
|
|
| |
|
|
| |
|
|
|
|
Securities with an aggregate market value of $592,591 and cash of $2,179 have been pledged as collateral under the terms of the above master agreements as of June 30, 2025. |
|
The average amount of borrowings outstanding during the period ended June 30, 2025 was $(449,608) at a weighted average interest rate of 5.607%. Average borrowings may include reverse repurchase agreements and sale-buyback transactions, if held during the period. |
|
Open maturity reverse repurchase agreement. |
|
Net Exposure represents the net receivable/(payable) that would be due from/to the counterparty in the event of default. Exposure from borrowings and other financing transactions can only be netted across transactions governed under the same master agreement with the same legal entity. See Note 8, Master Netting Arrangements, in the Notes to Financial Statements for more information. |
|
Unsettled reverse repurchase agreements liability of $(1,516) is outstanding at period end. |
(j) FINANCIAL DERIVATIVE INSTRUMENTS: EXCHANGE-TRADED OR CENTRALLY CLEARED
FUTURES CONTRACTS:
SHORT FUTURES CONTRACTS
|
|
|
|
|
|
|
|
|
|
|
|
|
|
|
|
|
|
|
|
|
|
|
|
| |
|
|
|
|
|
|
|
|
|
|
|
Unrealized
Appreciation/
(Depreciation) |
|
|
|
|
| |
|
|
|
|
|
3-Month SOFR Active Contract December Futures |
|
|
03/2026 |
|
|
|
18 |
|
|
$ |
(4,335 |
) |
|
$ |
69 |
|
|
$ |
0 |
|
|
$ |
(1 |
) |
3-Month SOFR Active Contract June Futures |
|
|
09/2025 |
|
|
|
41 |
|
|
|
(9,806 |
) |
|
|
142 |
|
|
|
1 |
|
|
|
0 |
|
3-Month SOFR Active Contract March Futures |
|
|
06/2026 |
|
|
|
16 |
|
|
|
(3,864 |
) |
|
|
49 |
|
|
|
0 |
|
|
|
(1 |
) |
3-Month SOFR Active Contract September Futures |
|
|
12/2025 |
|
|
|
13 |
|
|
|
(3,120 |
) |
|
|
60 |
|
|
|
0 |
|
|
|
0 |
|
|
| |
|
|
| |
|
|
| |
|
|
| |
|
|
|
|
|
|
|
|
|
|
|
| |
|
|
|
|
|
|
|
|
|
|
|
|
|
|
| |
|
|
| |
|
|
| |
|
|
| |
|
|
|
|
|
|
|
|
|
|
|
SWAP AGREEMENTS:
INTEREST RATE SWAPS
|
|
|
|
|
|
|
|
|
|
|
|
|
|
|
|
|
|
|
|
|
|
|
|
|
|
|
|
|
|
|
|
|
|
|
|
|
|
|
|
|
|
| |
| Pay/Receive
Floating Rate |
|
Floating Rate Index |
|
Fixed Rate |
|
|
Payment
Frequency |
|
|
Maturity
Date |
|
|
Notional
Amount |
|
|
Premiums
Paid/(Received) |
|
|
Unrealized
Appreciation/
(Depreciation) |
|
|
Market
Value |
|
|
|
|
| |
|
|
|
|
|
| |
|
1-Day GBP-SONIO Compounded-OIS |
|
|
3.500 |
% |
|
|
Annual |
|
|
|
03/19/2030 |
|
|
|
GBP |
|
|
|
1,600 |
|
|
$ |
(44 |
) |
|
$ |
24 |
|
|
$ |
(20 |
) |
|
$ |
0 |
|
|
$ |
0 |
|
| |
|
1-Day USD-SOFR Compounded-OIS |
|
|
3.250 |
|
|
|
Annual |
|
|
|
06/18/2030 |
|
|
|
|
| |
|
111,900 |
|
|
|
(1,026 |
) |
|
|
115 |
|
|
|
(911 |
) |
|
|
185 |
|
|
|
0 |
|
| |
|
1-Day USD-SOFR Compounded-OIS |
|
|
2.300 |
|
|
|
Annual |
|
|
|
01/17/2026 |
|
|
|
|
| |
|
2,600 |
|
|
|
1 |
|
|
|
50 |
|
|
|
51 |
|
|
|
0 |
|
|
|
0 |
|
| |
|
1-Day USD-SOFR Compounded-OIS |
|
|
3.750 |
|
|
|
Annual |
|
|
|
12/18/2027 |
|
|
|
|
| |
|
239,300 |
|
|
|
2,406 |
|
|
|
(1,442 |
) |
|
|
964 |
|
|
|
145 |
|
|
|
0 |
|
| |
|
1-Day USD-SOFR Compounded-OIS |
|
|
3.750 |
|
|
|
Annual |
|
|
|
12/18/2028 |
|
|
|
|
| |
|
84,900 |
|
|
|
1,218 |
|
|
|
(527 |
) |
|
|
691 |
|
|
|
87 |
|
|
|
0 |
|
| |
|
1-Day USD-SOFR Compounded-OIS |
|
|
3.750 |
|
|
|
Annual |
|
|
|
06/20/2029 |
|
|
|
|
| |
|
1,400 |
|
|
|
(26 |
) |
|
|
8 |
|
|
|
(18 |
) |
|
|
0 |
|
|
|
(2 |
) |
| |
|
1-Day USD-SOFR Compounded-OIS |
|
|
1.750 |
|
|
|
Annual |
|
|
|
06/15/2052 |
|
|
|
|
| |
|
25,600 |
|
|
|
6,320 |
|
|
|
3,091 |
|
|
|
9,411 |
|
|
|
0 |
|
|
|
(140 |
) |
| |
|
1-Day USD-SOFR Compounded-OIS |
|
|
1.750 |
|
|
|
Annual |
|
|
|
12/21/2052 |
|
|
|
|
| |
|
17,400 |
|
|
|
4,191 |
|
|
|
2,483 |
|
|
|
6,674 |
|
|
|
0 |
|
|
|
(96 |
) |
| |
|
1-Day USD-SOFR Compounded-OIS |
|
|
3.400 |
|
|
|
Annual |
|
|
|
12/21/2052 |
|
|
|
|
| |
|
22,900 |
|
|
|
40 |
|
|
|
2,149 |
|
|
|
2,189 |
|
|
|
0 |
|
|
|
(166 |
) |
| |
|
|
|
|
0.500 |
|
|
|
Annual |
|
|
|
09/21/2052 |
|
|
|
|
| |
|
7,800 |
|
|
|
676 |
|
|
|
3,370 |
|
|
|
4,046 |
|
|
|
22 |
|
|
|
0 |
|
| |
|
|
|
|
0.830 |
|
|
|
Annual |
|
|
|
12/09/2052 |
|
|
|
|
| |
|
22,900 |
|
|
|
313 |
|
|
|
2,359 |
|
|
|
2,672 |
|
|
|
9 |
|
|
|
0 |
|
|
| |
| |
|
|
| |
|
|
| |
|
|
| |
|
|
| |
|
|
| |
|
|
|
|
|
|
|
|
|
|
|
|
|
|
|
|
|
|
|
| |
|
|
|
|
|
|
|
|
|
|
|
|
|
|
|
|
|
|
|
|
|
|
| |
| |
|
|
| |
|
|
| |
|
|
| |
|
|
| |
|
|
| |
|
|
|
|
|
|
|
|
|
|
|
|
|
|
|
|
|
|
|
FINANCIAL DERIVATIVE INSTRUMENTS: EXCHANGE-TRADED OR CENTRALLY CLEARED SUMMARY
The following is a summary of the market value and variation margin of Exchange-Traded or Centrally Cleared Financial Derivative Instruments as of June 30, 2025:
|
|
|
|
|
|
|
|
|
|
|
|
|
|
|
|
|
|
|
|
|
|
|
|
|
|
|
|
|
|
|
|
|
|
|
|
| |
| |
|
Financial Derivative Assets |
|
|
|
|
|
Financial Derivative Liabilities |
|
| |
|
|
|
|
|
|
|
|
|
|
|
|
|
|
|
|
Variation Margin
Liability |
|
|
|
|
| |
|
|
|
|
|
|
|
|
|
|
|
|
|
|
|
|
|
|
|
|
|
|
|
|
|
|
|
Total Exchange-Traded or Centrally Cleared |
|
|
|
|
|
|
|
|
|
|
|
|
|
|
|
|
|
|
|
| |
|
|
|
|
|
|
|
|
|
|
|
|
|
|
|
|
| |
|
|
|
|
|
|
|
|
|
|
|
|
|
|
|
|
|
|
| |
|
|
|
|
|
|
|
|
|
|
|
|
|
|
|
|
Securities with an aggregate market value of $586 and cash of $9,143 have been pledged as collateral for exchange-traded and centrally cleared financial derivative instruments as of June 30, 2025. |
|
This instrument has a forward starting effective date. See Note 2, Securities Transactions and Investment Income, in the Notes to Financial Statements for further information. |
(l) FINANCIAL DERIVATIVE INSTRUMENTS: OVER THE COUNTER
FORWARD FOREIGN CURRENCY CONTRACTS:
|
|
|
|
|
|
|
|
|
|
|
|
|
|
|
|
|
|
|
|
|
|
|
|
| |
| Counterparty |
|
Settlement
Month |
|
|
Currency to
be Delivered |
|
|
Currency to
be Received |
|
|
Unrealized Appreciation/
(Depreciation) |
|
| |
|
|
|
|
|
| |
|
|
07/2025 |
|
|
DOP |
|
|
23,688 |
|
|
$ |
|
|
397 |
|
|
$ |
2 |
|
|
$ |
0 |
|
|
| |
|
07/2025 |
|
|
EUR |
|
|
109,572 |
|
|
| |
|
124,623 |
|
|
|
0 |
|
|
|
(4,447 |
) |
|
| |
|
08/2025 |
|
|
DOP |
|
|
4,491 |
|
|
| |
|
75 |
|
|
|
1 |
|
|
|
0 |
|
|
|
|
|
|
|
|
| |
| |
|
|
07/2025 |
|
|
TRY |
|
|
42,728 |
|
|
| |
|
1,065 |
|
|
|
0 |
|
|
|
(5 |
) |
|
| |
|
07/2025 |
|
|
$ |
|
|
397 |
|
|
EUR |
|
|
339 |
|
|
|
2 |
|
|
|
0 |
|
|
| |
|
05/2026 |
|
|
| |
|
149 |
|
|
KWD |
|
|
46 |
|
|
|
0 |
|
|
|
0 |
|
|
| |
|
06/2026 |
|
|
| |
|
107 |
|
|
| |
|
33 |
|
|
|
0 |
|
|
|
0 |
|
|
| |
|
06/2027 |
|
|
| |
|
52 |
|
|
| |
|
16 |
|
|
|
0 |
|
|
|
0 |
|
|
| |
|
05/2029 |
|
|
KWD |
|
|
239 |
|
|
$ |
|
|
820 |
|
|
|
36 |
|
|
|
0 |
|
|
| |
|
07/2029 |
|
|
| |
|
17 |
|
|
| |
|
60 |
|
|
|
3 |
|
|
|
0 |
|
|
| |
|
05/2030 |
|
|
| |
|
163 |
|
|
| |
|
560 |
|
|
|
22 |
|
|
|
0 |
|
|
|
|
|
|
|
|
| |
| |
|
|
07/2025 |
|
|
EUR |
|
|
5,694 |
|
|
| |
|
6,565 |
|
|
|
0 |
|
|
|
(143 |
) |
|
| |
|
07/2025 |
|
|
GBP |
|
|
571 |
|
|
| |
|
766 |
|
|
|
0 |
|
|
|
(17 |
) |
|
| |
|
07/2025 |
|
|
TRY |
|
|
13,022 |
|
|
| |
|
317 |
|
|
|
0 |
|
|
|
(3 |
) |
|
| |
|
07/2025 |
|
|
$ |
|
|
1,079 |
|
|
EUR |
|
|
944 |
|
|
|
33 |
|
|
|
0 |
|
|
| |
|
07/2025 |
|
|
| |
|
16,619 |
|
|
GBP |
|
|
12,220 |
|
|
|
155 |
|
|
|
0 |
|
|
| |
|
07/2025 |
|
|
| |
|
4,776 |
|
|
TRY |
|
|
194,297 |
|
|
|
77 |
|
|
|
0 |
|
|
| |
|
07/2025 |
|
|
ZAR |
|
|
28,968 |
|
|
$ |
|
|
1,603 |
|
|
|
0 |
|
|
|
(31 |
) |
|
| |
|
08/2025 |
|
|
GBP |
|
|
11,625 |
|
|
| |
|
15,819 |
|
|
|
0 |
|
|
|
(140 |
) |
|
| |
|
08/2025 |
|
|
$ |
|
|
5,227 |
|
|
TRY |
|
|
217,536 |
|
|
|
49 |
|
|
|
0 |
|
|
|
|
|
|
|
|
| |
| |
|
|
07/2025 |
|
|
EUR |
|
|
1,982 |
|
|
$ |
|
|
2,275 |
|
|
|
0 |
|
|
|
(60 |
) |
|
|
|
|
|
|
|
| |
| |
|
|
07/2025 |
|
|
$ |
|
|
134,388 |
|
|
EUR |
|
|
115,842 |
|
|
|
2,068 |
|
|
|
0 |
|
|
| |
|
08/2025 |
|
|
EUR |
|
|
115,588 |
|
|
$ |
|
|
134,388 |
|
|
|
0 |
|
|
|
(2,066 |
) |
|
|
|
|
|
|
|
| |
| |
|
|
07/2025 |
|
|
JPY |
|
|
18,571 |
|
|
| |
|
129 |
|
|
|
1 |
|
|
|
0 |
|
|
| |
|
07/2025 |
|
|
$ |
|
|
73 |
|
|
JPY |
|
|
10,606 |
|
|
|
1 |
|
|
|
0 |
|
|
|
|
|
|
|
|
|
|
|
|
|
| |
| See Accompanying Notes |
|
|
ANNUAL REPORT |
|
|
| |
|
|
JUNE 30, 2025 |
|
|
73 |
|
|
|
|
|
|
| |
Consolidated Schedule of Investments |
|
|
|
|
|
|
|
|
|
|
|
|
|
|
|
|
|
|
|
|
|
|
|
|
|
|
|
|
|
|
| |
| Counterparty |
|
Settlement
Month |
|
|
Currency to
be Delivered |
|
|
Currency to
be Received |
|
|
Unrealized Appreciation/
(Depreciation) |
|
| |
Asset |
|
|
Liability |
|
|
| |
|
08/2025 |
|
|
JPY |
|
|
10,567 |
|
|
$ |
|
|
73 |
|
|
$ |
0 |
|
|
$ |
(1 |
) |
|
|
|
|
|
|
|
| |
| |
|
|
07/2025 |
|
|
DOP |
|
|
108,858 |
|
|
| |
|
1,697 |
|
|
|
0 |
|
|
|
(118 |
) |
|
| |
|
08/2025 |
|
|
| |
|
61,317 |
|
|
| |
|
969 |
|
|
|
1 |
|
|
|
(45 |
) |
|
| |
|
09/2025 |
|
|
| |
|
48,516 |
|
|
| |
|
769 |
|
|
|
4 |
|
|
|
(32 |
) |
|
| |
|
11/2025 |
|
|
| |
|
121 |
|
|
| |
|
2 |
|
|
|
0 |
|
|
|
0 |
|
|
|
|
|
|
|
|
| |
| |
|
|
07/2025 |
|
|
$ |
|
|
781 |
|
|
EUR |
|
|
682 |
|
|
|
22 |
|
|
|
0 |
|
|
| |
|
07/2025 |
|
|
ZAR |
|
|
8,214 |
|
|
$ |
|
|
460 |
|
|
|
0 |
|
|
|
(4 |
) |
|
| |
|
08/2025 |
|
|
EUR |
|
|
1,547 |
|
|
| |
|
1,817 |
|
|
|
0 |
|
|
|
(9 |
) |
|
| |
|
08/2025 |
|
|
GBP |
|
|
460 |
|
|
| |
|
630 |
|
|
|
0 |
|
|
|
(2 |
) |
|
|
|
|
|
|
|
| |
| |
|
|
07/2025 |
|
|
CAD |
|
|
5,416 |
|
|
| |
|
3,943 |
|
|
|
0 |
|
|
|
(34 |
) |
|
| |
|
07/2025 |
|
|
EUR |
|
|
3,418 |
|
|
| |
|
3,940 |
|
|
|
0 |
|
|
|
(86 |
) |
|
| |
|
07/2025 |
|
|
GBP |
|
|
2,114 |
|
|
| |
|
2,877 |
|
|
|
1 |
|
|
|
(25 |
) |
|
| |
|
07/2025 |
|
|
HKD |
|
|
40,200 |
|
|
| |
|
5,139 |
|
|
|
11 |
|
|
|
0 |
|
|
| |
|
07/2025 |
|
|
JPY |
|
|
1,542 |
|
|
| |
|
11 |
|
|
|
0 |
|
|
|
0 |
|
|
| |
|
07/2025 |
|
|
$ |
|
|
3,942 |
|
|
CAD |
|
|
5,418 |
|
|
|
37 |
|
|
|
0 |
|
|
| |
|
07/2025 |
|
|
| |
|
1,505 |
|
|
EUR |
|
|
1,312 |
|
|
|
40 |
|
|
|
0 |
|
|
| |
|
08/2025 |
|
|
CAD |
|
|
5,409 |
|
|
$ |
|
|
3,941 |
|
|
|
0 |
|
|
|
(37 |
) |
|
| |
|
08/2025 |
|
|
$ |
|
|
3,106 |
|
|
EUR |
|
|
2,643 |
|
|
|
14 |
|
|
|
0 |
|
|
|
|
|
|
|
|
| |
| |
|
|
08/2025 |
|
|
| |
|
839 |
|
|
TRY |
|
|
35,028 |
|
|
|
10 |
|
|
|
0 |
|
|
|
|
|
|
|
|
| |
| |
|
|
07/2025 |
|
|
| |
|
63 |
|
|
JPY |
|
|
9,100 |
|
|
|
0 |
|
|
|
0 |
|
|
| |
|
08/2025 |
|
|
JPY |
|
|
9,066 |
|
|
$ |
|
|
63 |
|
|
|
0 |
|
|
|
0 |
|
|
|
|
|
|
|
|
| |
| |
|
|
07/2025 |
|
|
GBP |
|
|
12,008 |
|
|
| |
|
16,259 |
|
|
|
0 |
|
|
|
(224 |
) |
|
| |
|
07/2025 |
|
|
$ |
|
|
2,709 |
|
|
GBP |
|
|
2,013 |
|
|
|
54 |
|
|
|
0 |
|
|
| |
|
|
| |
| |
|
|
| |
| |
|
|
| |
|
|
|
|
|
|
|
Total Forward Foreign Currency Contracts |
|
|
|
|
|
|
|
|
|
|
| |
|
|
| |
| |
|
|
| |
| |
|
|
| |
|
|
|
|
|
|
|
SWAP AGREEMENTS:
CREDIT DEFAULT SWAPS ON CORPORATE AND SOVEREIGN ISSUES - SELL PROTECTION
(1)
|
|
|
|
|
|
|
|
|
|
|
|
|
|
|
|
|
|
|
|
|
|
|
|
|
|
|
|
|
|
|
|
|
|
|
|
| |
| Counterparty |
|
Reference Entity |
|
|
|
|
Payment
Frequency |
|
|
|
|
Implied Credit Spread at June 30, 2025 (2) |
|
|
|
|
|
|
|
|
Unrealized
Appreciation/
(Depreciation) |
|
|
Swap Agreements, at Value (4) |
|
| |
|
|
|
|
|
BPS |
|
|
|
|
1.000 |
% |
|
Quarterly |
|
|
12/20/2028 |
|
|
|
3.804 |
% |
|
$ |
900 |
|
|
$ |
(174 |
) |
|
$ |
97 |
|
|
$ |
0 |
|
|
$ |
(77 |
) |
|
|
|
|
|
|
|
|
|
|
| |
BRC |
|
Egypt Government International Bond |
|
|
1.000 |
|
|
Quarterly |
|
|
12/20/2028 |
|
|
|
4.462 |
|
|
|
3,000 |
|
|
|
(521 |
) |
|
|
208 |
|
|
|
0 |
|
|
|
(313 |
) |
|
| |
Egypt Government International Bond |
|
|
1.000 |
|
|
Quarterly |
|
|
06/20/2029 |
|
|
|
4.645 |
|
|
|
800 |
|
|
|
(171 |
) |
|
|
73 |
|
|
|
0 |
|
|
|
(98 |
) |
|
|
|
|
|
|
|
|
|
|
| |
DUB |
|
|
|
|
4.750 |
|
|
Monthly |
|
|
07/06/2026 |
|
|
|
|
|
|
|
1,529 |
|
|
|
0 |
|
|
|
8 |
|
|
|
8 |
|
|
|
0 |
|
|
| |
|
|
|
4.850 |
|
|
Monthly |
|
|
07/06/2026 |
|
|
|
|
|
|
|
2,677 |
|
|
|
0 |
|
|
|
16 |
|
|
|
16 |
|
|
|
0 |
|
|
| |
| |
|
|
| |
| |
|
|
| |
|
|
| |
|
|
| |
|
|
|
|
|
|
|
|
|
|
|
|
|
|
|
|
| |
|
|
| |
| |
|
|
| |
|
|
| |
|
|
| |
$ |
(866 |
) |
|
$ |
402 |
|
|
$ |
24 |
|
|
$ |
(488 |
) |
|
| |
| |
|
|
| |
| |
|
|
| |
|
|
| |
|
|
| |
|
|
|
|
|
|
|
|
|
|
|
|
|
|
|
TOTAL RETURN SWAPS ON LOAN PARTICIPATIONS AND ASSIGNMENTS
|
|
|
|
|
|
|
|
|
|
|
|
|
|
|
|
|
|
|
|
|
|
|
|
|
|
|
|
|
|
| |
| Counterparty |
|
Pay/Receive |
|
Underlying Reference |
|
Financing Rate |
|
Payment
Frequency |
|
Maturity
Date |
|
|
Notional
Amount |
|
Premiums
Paid/(Received) |
|
|
Unrealized
Appreciation/
(Depreciation) |
|
|
|
|
| |
|
|
|
|
|
| |
|
|
|
|
|
1-Day USD-SOFR Compounded-OIS |
|
|
|
|
09/10/2025 |
|
|
204 |
|
|
0 |
|
|
|
(470 |
) |
|
|
0 |
|
|
|
(470 |
) |
|
|
|
|
|
|
|
|
|
|
| |
| |
|
|
|
Clover Holdings SPV III LLC |
|
1-Day USD-SOFR Compounded-OIS |
|
|
|
|
09/10/2025 |
|
|
8 |
|
|
0 |
|
|
|
9 |
|
|
|
9 |
|
|
|
0 |
|
|
|
|
|
|
|
|
|
|
|
| |
| |
|
|
|
|
|
1-Day USD-SOFR Compounded-OIS |
|
|
|
|
09/10/2025 |
|
|
24 |
|
|
0 |
|
|
|
23 |
|
|
|
23 |
|
|
|
0 |
|
|
| |
| |
| |
| |
| |
|
|
| |
| |
|
|
|
|
|
|
|
|
|
|
|
|
|
|
|
|
| |
$ |
0 |
|
|
$ |
(438 |
) |
|
$ |
32 |
|
|
$ |
(470 |
) |
|
| |
| |
| |
| |
| |
|
|
| |
| |
|
|
|
|
|
|
|
|
|
|
|
|
|
|
|
| |
|
|
|
|
|
|
|
|
|
|
|
|
|
|
|
|
|
| |
| |
| |
| |
| |
|
|
| |
| |
|
|
|
|
|
|
|
|
|
|
|
|
|
|
|
FINANCIAL DERIVATIVE INSTRUMENTS: OVER THE COUNTER SUMMARY
The following is a summary by counterparty of the market value of OTC financial derivative instruments and collateral pledged/(received) as of June 30, 2025:
|
|
|
|
|
|
|
|
|
|
|
|
|
|
|
|
|
|
|
|
|
|
|
|
|
|
|
|
|
|
|
|
|
|
|
|
|
|
|
|
|
|
|
|
|
|
|
|
| |
| |
|
Financial Derivative Assets |
|
|
|
|
|
Financial Derivative Liabilities |
|
|
|
|
|
|
|
|
|
|
|
|
Forward
Foreign
Currency
Contracts |
|
|
|
|
|
|
|
|
|
|
|
|
|
|
Forward
Foreign
Currency
Contracts |
|
|
|
|
|
|
|
|
|
|
|
Net Market
Value of OTC
Derivatives |
|
|
Collateral
Pledged/
(Received) |
|
|
|
|
| |
|
$ |
3 |
|
|
$ |
0 |
|
|
$ |
0 |
|
|
$ |
3 |
|
|
|
|
| |
$ |
(4,447 |
) |
|
$ |
0 |
|
|
$ |
0 |
|
|
$ |
(4,447 |
) |
|
$ |
(4,444 |
) |
|
$ |
3,838 |
|
|
$ |
(606 |
) |
| |
|
|
63 |
|
|
|
0 |
|
|
|
32 |
|
|
|
95 |
|
|
|
|
| |
|
(5 |
) |
|
|
0 |
|
|
|
(547 |
) |
|
|
(552 |
) |
|
|
(457 |
) |
|
|
503 |
|
|
|
46 |
|
| |
|
|
314 |
|
|
|
0 |
|
|
|
0 |
|
|
|
314 |
|
|
|
|
| |
|
(334 |
) |
|
|
0 |
|
|
|
(411 |
) |
|
|
(745 |
) |
|
|
(431 |
) |
|
|
436 |
|
|
|
5 |
|
| |
|
|
0 |
|
|
|
0 |
|
|
|
0 |
|
|
|
0 |
|
|
|
|
| |
|
(60 |
) |
|
|
0 |
|
|
|
0 |
|
|
|
(60 |
) |
|
|
(60 |
) |
|
|
0 |
|
|
|
(60 |
) |
| |
|
|
2,068 |
|
|
|
0 |
|
|
|
24 |
|
|
|
2,092 |
|
|
|
|
| |
|
(2,066 |
) |
|
|
0 |
|
|
|
0 |
|
|
|
(2,066 |
) |
|
|
26 |
|
|
|
0 |
|
|
|
26 |
|
| |
|
|
2 |
|
|
|
0 |
|
|
|
0 |
|
|
|
2 |
|
|
|
|
| |
|
(1 |
) |
|
|
0 |
|
|
|
0 |
|
|
|
(1 |
) |
|
|
1 |
|
|
|
0 |
|
|
|
1 |
|
| |
|
|
5 |
|
|
|
0 |
|
|
|
0 |
|
|
|
5 |
|
|
|
|
| |
|
(195 |
) |
|
|
0 |
|
|
|
0 |
|
|
|
(195 |
) |
|
|
(190 |
) |
|
|
232 |
|
|
|
42 |
|
| |
|
|
22 |
|
|
|
0 |
|
|
|
0 |
|
|
|
22 |
|
|
|
|
| |
|
(15 |
) |
|
|
0 |
|
|
|
0 |
|
|
|
(15 |
) |
|
|
7 |
|
|
|
0 |
|
|
|
7 |
|
| |
|
|
103 |
|
|
|
0 |
|
|
|
0 |
|
|
|
103 |
|
|
|
|
| |
|
(182 |
) |
|
|
0 |
|
|
|
0 |
|
|
|
(182 |
) |
|
|
(79 |
) |
|
|
0 |
|
|
|
(79 |
) |
| |
|
|
10 |
|
|
|
0 |
|
|
|
0 |
|
|
|
10 |
|
|
|
|
| |
|
0 |
|
|
|
0 |
|
|
|
0 |
|
|
|
0 |
|
|
|
10 |
|
|
|
0 |
|
|
|
10 |
|
| |
|
|
54 |
|
|
|
0 |
|
|
|
0 |
|
|
|
54 |
|
|
|
|
| |
|
(224 |
) |
|
|
0 |
|
|
|
0 |
|
|
|
(224 |
) |
|
|
(170 |
) |
|
|
0 |
|
|
|
(170 |
) |
|
| |
|
|
|
|
|
|
|
|
|
|
|
|
|
|
|
|
|
|
| |
|
|
|
|
|
|
|
|
|
|
|
|
|
|
|
|
|
|
| |
|
|
| |
|
| |
| |
|
|
|
|
|
|
|
|
|
|
|
|
|
|
|
|
|
|
|
| |
|
|
|
|
|
|
|
|
|
|
|
|
|
|
|
|
|
|
| |
|
|
| |
|
| |
|
| |
|
|
|
|
|
|
|
|
|
|
|
|
|
|
|
|
|
|
| |
|
|
|
|
|
|
|
|
|
|
|
|
|
|
|
|
|
|
| |
|
|
| |
|
| |
|
Securities with an aggregate market value of $5,009 have been pledged as collateral for financial derivative instruments as governed by International Swaps and Derivatives Association, Inc. master agreements as of June 30, 2025. |
|
Implied credit spread is not available due to significant unobservable inputs being used in the fair valuation. |
|
If the Fund is a seller of protection and a credit event occurs, as defined under the terms of that particular swap agreement, the Fund will either (i) pay to the buyer of protection an amount equal to the notional amount of the swap and take delivery of the referenced obligation or underlying securities comprising the referenced index or (ii) pay a net settlement amount in the form of cash, securities or other deliverable obligations equal to the notional amount of the swap less the recovery value of the referenced obligation or underlying securities comprising the referenced index. |
|
Implied credit spreads, represented in absolute terms, utilized in determining the market value of credit default swap agreements on corporate or sovereign issues as of period end serve as indicators of the current status of the payment/performance risk and represent the likelihood or risk of default for the credit derivative. The implied credit spread of a particular referenced entity reflects the cost of buying/selling protection and may include upfront payments required to be made to enter into the agreement. Wider credit spreads represent a deterioration of the referenced entity’s credit soundness and a greater likelihood or risk of default or other credit event occurring as defined under the terms of the agreement. |
|
The maximum potential amount the Fund could be required to pay as a seller of credit protection or receive as a buyer of credit protection if a credit event occurs as defined under the terms of that particular swap agreement. |
|
The prices and resulting values for credit default swap agreements serve as indicators of the current status of the payment/performance risk and represent the likelihood of an expected liability (or profit) for the credit derivative should the notional amount of the swap agreement be closed/sold as of the period end. Increasing market values, in absolute terms when compared to the notional amount of the swap, represent a deterioration of the underlying referenced instrument’s credit soundness and a greater likelihood or risk of default or other credit event occurring as defined under the terms of the agreement. |
|
Net Exposure represents the net receivable/(payable) that would be due from/to the counterparty in the event of default. Exposure from OTC financial derivative instruments can only be netted across transactions governed under the same master agreement with the same legal entity. See Note 8, Master Netting Arrangements, in the Notes to Financial Statements for more information |
FAIR VALUE OF FINANCIAL DERIVATIVE INSTRUMENTS
The following is a summary of the fair valuation of the Fund’s derivative instruments categorized by risk exposure. See Note 7, Principal and Other Risks, in the Notes to Financial Statements on risks of the Fund.
Fair Values of Financial Derivative Instruments on the Consolidated Statements of Assets and Liabilities as of June 30, 2025:
|
|
|
|
|
|
|
|
|
|
|
|
|
|
|
|
|
|
|
|
|
|
|
|
| |
| |
|
Derivatives not accounted for as hedging instruments |
|
| |
|
|
|
|
|
|
|
|
|
|
|
|
|
|
|
|
|
|
Financial Derivative Instruments - Assets |
|
Exchange-traded or centrally cleared |
|
|
|
| |
|
|
| |
|
|
| |
|
|
| |
|
|
| |
|
| |
| |
|
$ |
0 |
|
|
$ |
0 |
|
|
$ |
0 |
|
|
$ |
0 |
|
|
$ |
1 |
|
|
$ |
1 |
|
| |
|
|
0 |
|
|
|
0 |
|
|
|
0 |
|
|
|
0 |
|
|
|
448 |
|
|
|
448 |
|
|
| |
|
|
|
|
|
|
|
|
|
|
|
|
|
|
|
|
|
|
|
|
|
|
|
|
| |
$ |
0 |
|
|
$ |
0 |
|
|
$ |
0 |
|
|
$ |
0 |
|
|
$ |
449 |
|
|
$ |
449 |
|
|
| |
|
|
|
|
|
|
|
|
|
|
|
|
|
|
|
|
|
|
|
|
|
|
|
| |
|
|
|
| |
|
|
| |
|
|
| |
|
|
| |
|
|
| |
|
| |
Forward Foreign Currency Contracts |
|
$ |
0 |
|
|
$ |
0 |
|
|
$ |
0 |
|
|
$ |
2,644 |
|
|
$ |
0 |
|
|
$ |
2,644 |
|
| |
|
|
0 |
|
|
|
24 |
|
|
|
0 |
|
|
|
0 |
|
|
|
32 |
|
|
|
56 |
|
|
| |
|
|
|
|
|
|
|
|
|
|
|
|
|
|
|
|
|
|
|
|
|
|
|
|
| |
$ |
0 |
|
|
$ |
24 |
|
|
$ |
0 |
|
|
$ |
2,644 |
|
|
$ |
32 |
|
|
$ |
2,700 |
|
|
| |
|
|
|
|
|
|
|
|
|
|
|
|
|
|
|
|
|
|
|
|
|
|
|
|
| |
$ |
0 |
|
|
$ |
24 |
|
|
$ |
0 |
|
|
$ |
2,644 |
|
|
$ |
481 |
|
|
$ |
3,149 |
|
|
| |
|
|
|
|
|
|
|
|
|
|
|
|
|
|
|
|
|
|
|
|
|
|
|
|
|
|
|
|
|
|
|
|
|
|
|
| |
See Accompanying Notes |
|
|
|
|
|
| |
|
|
JUNE 30, 2025 |
|
|
|
|
|
|
|
|
|
| |
Consolidated Schedule of Investments |
|
|
|
|
|
|
|
|
|
|
|
|
|
|
|
|
|
|
|
|
|
|
|
|
|
|
|
|
|
|
| |
| |
|
Derivatives not accounted for as hedging instruments |
|
| |
|
Commodity
Contracts |
|
|
Credit
Contracts |
|
|
Equity
Contracts |
|
|
Foreign
Exchange
Contracts |
|
|
Interest
Rate Contracts |
|
|
Total |
|
|
Financial Derivative Instruments - Liabilities |
|
Exchange-traded or centrally cleared |
|
|
|
| |
|
|
| |
|
|
| |
|
|
| |
|
|
| |
|
| |
| |
|
$ |
0 |
|
|
$ |
0 |
|
|
$ |
0 |
|
|
$ |
0 |
|
|
$ |
2 |
|
|
$ |
2 |
|
| |
|
|
0 |
|
|
|
0 |
|
|
|
0 |
|
|
|
0 |
|
|
|
404 |
|
|
|
404 |
|
|
| |
|
|
|
|
|
|
|
|
|
|
|
|
|
|
|
|
|
|
|
|
|
|
|
|
| |
$ |
0 |
|
|
$ |
0 |
|
|
$ |
0 |
|
|
$ |
0 |
|
|
$ |
406 |
|
|
$ |
406 |
|
|
| |
|
|
|
|
|
|
|
|
|
|
|
|
|
|
|
|
|
|
|
|
|
|
|
| |
|
|
|
| |
|
|
| |
|
|
| |
|
|
| |
|
|
| |
|
| |
Forward Foreign Currency Contracts |
|
$ |
0 |
|
|
$ |
0 |
|
|
$ |
0 |
|
|
$ |
7,529 |
|
|
$ |
0 |
|
|
$ |
7,529 |
|
| |
|
|
0 |
|
|
|
488 |
|
|
|
0 |
|
|
|
0 |
|
|
|
470 |
|
|
|
958 |
|
|
| |
|
|
|
|
|
|
|
|
|
|
|
|
|
|
|
|
|
|
|
|
|
|
|
|
| |
$ |
0 |
|
|
$ |
488 |
|
|
$ |
0 |
|
|
$ |
7,529 |
|
|
$ |
470 |
|
|
$ |
8,487 |
|
|
| |
|
|
|
|
|
|
|
|
|
|
|
|
|
|
|
|
|
|
|
|
|
|
|
|
| |
$ |
0 |
|
|
$ |
488 |
|
|
$ |
0 |
|
|
$ |
7,529 |
|
|
$ |
876 |
|
|
$ |
8,893 |
|
|
| |
|
|
|
|
|
|
|
|
|
|
|
|
|
|
|
|
|
|
|
|
|
|
|
The effect of Financial Derivative Instruments on the Consolidated Statements of Operations for the period ended June 30, 2025:
|
|
|
|
|
|
|
|
|
|
|
|
|
|
|
|
|
|
|
|
|
|
|
|
| |
| |
|
Derivatives not accounted for as hedging instruments |
|
| |
|
|
|
|
|
|
|
|
|
|
|
|
|
|
|
|
|
|
Net Realized Gain (Loss) on Financial Derivative Instruments |
|
Exchange-traded or centrally cleared |
|
|
|
| |
|
|
| |
|
|
| |
|
|
| |
|
|
| |
|
| |
| |
|
$ |
0 |
|
|
$ |
0 |
|
|
$ |
0 |
|
|
$ |
0 |
|
|
$ |
490 |
|
|
$ |
490 |
|
| |
|
|
0 |
|
|
|
0 |
|
|
|
0 |
|
|
|
0 |
|
|
|
7,270 |
|
|
|
7,270 |
|
|
| |
|
|
|
|
|
|
|
|
|
|
|
|
|
|
|
|
|
|
|
|
|
|
|
|
| |
$ |
0 |
|
|
$ |
0 |
|
|
$ |
0 |
|
|
$ |
0 |
|
|
$ |
7,760 |
|
|
$ |
7,760 |
|
|
| |
|
|
|
|
|
|
|
|
|
|
|
|
|
|
|
|
|
|
|
|
|
|
|
| |
|
|
|
| |
|
|
| |
|
|
| |
|
|
| |
|
|
| |
|
| |
Forward Foreign Currency Contracts |
|
$ |
0 |
|
|
$ |
0 |
|
|
$ |
0 |
|
|
$ |
(2,701 |
) |
|
$ |
0 |
|
|
$ |
(2,701 |
) |
| |
|
|
0 |
|
|
|
182 |
|
|
|
0 |
|
|
|
0 |
|
|
|
667 |
|
|
|
849 |
|
|
| |
|
|
|
|
|
|
|
|
|
|
|
|
|
|
|
|
|
|
|
|
|
|
|
|
| |
$ |
0 |
|
|
$ |
182 |
|
|
$ |
0 |
|
|
$ |
(2,701 |
) |
|
$ |
667 |
|
|
$ |
(1,852 |
) |
|
| |
|
|
|
|
|
|
|
|
|
|
|
|
|
|
|
|
|
|
|
|
|
|
|
|
| |
$ |
0 |
|
|
$ |
182 |
|
|
$ |
0 |
|
|
$ |
(2,701 |
) |
|
$ |
8,427 |
|
|
$ |
5,908 |
|
|
| |
|
|
|
|
|
|
|
|
|
|
|
|
|
|
|
|
|
|
|
|
|
|
|
|
Net Change in Unrealized Appreciation (Depreciation) on Financial Derivative Instruments |
|
Exchange-traded or centrally cleared |
|
|
|
| |
|
|
| |
|
|
| |
|
|
| |
|
|
| |
|
| |
| |
|
$ |
0 |
|
|
$ |
0 |
|
|
$ |
0 |
|
|
$ |
0 |
|
|
$ |
(466 |
) |
|
$ |
(466 |
) |
| |
|
|
0 |
|
|
|
0 |
|
|
|
0 |
|
|
|
0 |
|
|
|
1,109 |
|
|
|
1,109 |
|
|
| |
|
|
|
|
|
|
|
|
|
|
|
|
|
|
|
|
|
|
|
|
|
|
|
|
| |
$ |
0 |
|
|
$ |
0 |
|
|
$ |
0 |
|
|
$ |
0 |
|
|
$ |
643 |
|
|
$ |
643 |
|
|
| |
|
|
|
|
|
|
|
|
|
|
|
|
|
|
|
|
|
|
|
|
|
|
|
| |
|
|
|
| |
|
|
| |
|
|
| |
|
|
| |
|
|
| |
|
| |
Forward Foreign Currency Contracts |
|
$ |
0 |
|
|
$ |
0 |
|
|
$ |
0 |
|
|
$ |
(6,975 |
) |
|
$ |
0 |
|
|
$ |
(6,975 |
) |
| |
|
|
0 |
|
|
|
329 |
|
|
|
0 |
|
|
|
0 |
|
|
|
(38 |
) |
|
|
291 |
|
|
| |
|
|
|
|
|
|
|
|
|
|
|
|
|
|
|
|
|
|
|
|
|
|
|
|
| |
$ |
0 |
|
|
$ |
329 |
|
|
$ |
0 |
|
|
$ |
(6,975 |
) |
|
$ |
(38 |
) |
|
$ |
(6,684 |
) |
|
| |
|
|
|
|
|
|
|
|
|
|
|
|
|
|
|
|
|
|
|
|
|
|
|
|
| |
$ |
0 |
|
|
$ |
329 |
|
|
$ |
0 |
|
|
$ |
(6,975 |
) |
|
$ |
605 |
|
|
$ |
(6,041 |
) |
|
| |
|
|
|
|
|
|
|
|
|
|
|
|
|
|
|
|
|
|
|
|
|
|
|
FAIR VALUE MEASUREMENTS
The following is a summary of the fair valuations according to the inputs used as of June 30, 2025 in valuing the Fund’s assets and liabilities:
|
|
|
|
|
|
|
|
|
|
|
|
|
|
|
|
| |
|
|
|
|
|
|
|
|
|
|
|
Fair Value at
06/30/2025 |
|
Investments in Securities, at Value |
|
Loan Participations and Assignments |
|
$ |
0 |
|
|
$ |
183,431 |
|
|
$ |
69,500 |
|
|
$ |
252,931 |
|
| |
|
|
|
| |
|
|
| |
|
|
| |
|
| |
| |
|
|
0 |
|
|
|
47,154 |
|
|
|
58 |
|
|
|
47,212 |
|
| |
|
|
0 |
|
|
|
122,460 |
|
|
|
7,749 |
|
|
|
130,209 |
|
| |
|
|
0 |
|
|
|
22,917 |
|
|
|
0 |
|
|
|
22,917 |
|
| |
|
|
0 |
|
|
|
40,516 |
|
|
|
0 |
|
|
|
40,516 |
|
Non-Agency Mortgage-Backed Securities |
|
|
0 |
|
|
|
240,921 |
|
|
|
0 |
|
|
|
240,921 |
|
| |
|
|
|
| |
|
|
| |
|
|
| |
|
| |
| |
|
|
0 |
|
|
|
5,095 |
|
|
|
0 |
|
|
|
5,095 |
|
| |
|
|
0 |
|
|
|
0 |
|
|
|
5,082 |
|
|
|
5,082 |
|
| |
|
|
0 |
|
|
|
127,161 |
|
|
|
0 |
|
|
|
127,161 |
|
| |
|
|
0 |
|
|
|
32,866 |
|
|
|
0 |
|
|
|
32,866 |
|
| |
|
|
0 |
|
|
|
29,078 |
|
|
|
16,763 |
|
|
|
45,841 |
|
|
|
|
|
|
|
|
|
|
|
|
|
|
|
|
|
| |
Category and Subcategory |
|
Level 1 |
|
|
Level 2 |
|
|
Level 3 |
|
|
Fair Value at
06/30/2025 |
|
| |
|
$ |
0 |
|
|
$ |
49,930 |
|
|
$ |
0 |
|
|
$ |
49,930 |
|
| |
|
|
|
| |
|
|
| |
|
|
| |
|
| |
| |
|
|
805 |
|
|
|
0 |
|
|
|
0 |
|
|
|
805 |
|
| |
|
|
0 |
|
|
|
0 |
|
|
|
53 |
|
|
|
53 |
|
| |
|
|
9,132 |
|
|
|
0 |
|
|
|
16 |
|
|
|
9,148 |
|
| |
|
|
0 |
|
|
|
0 |
|
|
|
32,448 |
|
|
|
32,448 |
|
| |
|
|
0 |
|
|
|
0 |
|
|
|
2,709 |
|
|
|
2,709 |
|
| |
|
|
|
| |
|
|
| |
|
|
| |
|
| |
| |
|
|
0 |
|
|
|
2,334 |
|
|
|
17,611 |
|
|
|
19,945 |
|
| |
|
|
|
| |
|
|
| |
|
|
| |
|
| |
| |
|
|
0 |
|
|
|
6,265 |
|
|
|
0 |
|
|
|
6,265 |
|
| |
|
|
0 |
|
|
|
7,276 |
|
|
|
0 |
|
|
|
7,276 |
|
|
| |
|
|
|
|
|
|
|
|
|
|
|
|
|
|
|
|
| |
$ |
9,937 |
|
|
$ |
917,404 |
|
|
$ |
151,989 |
|
|
$ |
1,079,330 |
|
|
| |
|
|
|
|
|
|
|
|
|
|
|
|
|
|
|
|
Investments in Affiliates, at Value |
|
| |
|
|
|
| |
|
|
| |
|
|
| |
|
| |
| |
|
|
0 |
|
|
|
0 |
|
|
|
9,950 |
|
|
|
9,950 |
|
|
|
|
|
|
|
| |
76 |
|
PIMCO CLOSED-END FUNDS |
|
|
See Accompanying Notes |
|
|
|
|
|
|
|
|
|
|
|
|
|
|
|
|
|
| |
Category and Subcategory |
|
Level 1 |
|
|
Level 2 |
|
|
Level 3 |
|
|
Fair Value at
06/30/2025 |
|
| |
|
|
|
| |
|
|
| |
|
|
| |
|
| |
Central Funds Used for Cash Management Purposes |
|
$ |
64,290 |
|
|
$ |
0 |
|
|
$ |
0 |
|
|
$ |
64,290 |
|
|
| |
|
|
|
|
|
|
|
|
|
|
|
|
|
|
|
|
| |
$ |
64,290 |
|
|
$ |
0 |
|
|
$ |
9,950 |
|
|
$ |
74,240 |
|
|
| |
|
|
|
|
|
|
|
|
|
|
|
|
|
|
|
|
|
|
|
| |
| |
|
$ |
74,227 |
|
|
$ |
917,404 |
|
|
$ |
161,939 |
|
|
$ |
1,153,570 |
|
|
| |
|
|
|
|
|
|
|
|
|
|
|
|
|
|
|
|
Financial Derivative Instruments - Assets |
|
Exchange-traded or centrally cleared |
|
|
0 |
|
|
|
449 |
|
|
|
0 |
|
|
|
449 |
|
| |
|
|
0 |
|
|
|
2,676 |
|
|
|
24 |
|
|
|
2,700 |
|
|
| |
|
|
|
|
|
|
|
|
|
|
|
|
|
|
|
|
| |
$ |
0 |
|
|
$ |
3,125 |
|
|
$ |
24 |
|
|
$ |
3,149 |
|
|
| |
|
|
|
|
|
|
|
|
|
|
|
|
|
|
|
|
|
|
|
|
|
|
|
|
|
|
|
|
|
|
|
| |
|
|
|
|
|
|
|
|
|
|
|
Fair Value at
06/30/2025 |
|
|
Financial Derivative Instruments - Liabilities |
|
Exchange-traded or centrally cleared |
|
$ |
0 |
|
|
$ |
(406 |
) |
|
$ |
0 |
|
|
$ |
(406 |
) |
| |
|
|
0 |
|
|
|
(8,487 |
) |
|
|
0 |
|
|
|
(8,487 |
) |
|
| |
|
|
|
|
|
|
|
|
|
|
|
|
|
|
|
|
| |
$ |
0 |
|
|
$ |
(8,893 |
) |
|
$ |
0 |
|
|
$ |
(8,893 |
) |
|
| |
|
|
|
|
|
|
|
|
|
|
|
|
|
|
|
|
|
|
|
| |
Total Financial Derivative Instruments |
|
$ |
0 |
|
|
$ |
(5,768 |
) |
|
$ |
24 |
|
|
$ |
(5,744 |
) |
|
| |
|
|
|
|
|
|
|
|
|
|
|
|
|
|
|
|
|
|
|
| |
| |
|
$ |
74,227 |
|
|
$ |
911,636 |
|
|
$ |
161,963 |
|
|
$ |
1,147,826 |
|
|
| |
|
|
|
|
|
|
|
|
|
|
|
|
|
|
|
The following is a reconciliation of the fair valuations using significant unobservable inputs (Level 3) for the Fund during the period ended June 30, 2025:
|
|
|
|
|
|
|
|
|
|
|
|
|
|
|
|
|
|
|
|
|
|
|
|
|
|
|
|
|
|
|
|
|
|
|
|
|
|
|
|
| |
|
|
Beginning
Balance
at 06/30/2024 |
|
|
|
|
|
|
|
|
Accrued
Discounts/
(Premiums) |
|
|
|
|
|
Net Change in Unrealized Appreciation/ (Depreciation) (2) |
|
|
|
|
|
|
|
|
Ending
Balance
at 06/30/2025 |
|
|
Net Change in Unrealized Appreciation/ (Depreciation) on Investments Held at 06/30/2025 (2) |
|
Investments in Securities, at Value |
|
Loan Participations and Assignments |
|
$ |
64,353 |
|
|
$ |
35,000 |
|
|
$ |
(47,440 |
) |
|
$ |
391 |
|
|
$ |
1,191 |
|
|
$ |
14,063 |
|
|
$ |
1,942 |
|
|
$ |
0 |
|
|
$ |
69,500 |
|
|
$ |
2,046 |
|
| |
|
| |
|
|
17,280 |
|
|
|
55 |
|
|
|
(16,792 |
) |
|
|
0 |
|
|
|
601 |
|
|
|
(1,086 |
) |
|
|
0 |
|
|
|
0 |
|
|
|
58 |
|
|
|
3 |
|
| |
|
|
6,466 |
|
|
|
4,107 |
|
|
|
(5,614 |
) |
|
|
0 |
|
|
|
(735 |
) |
|
|
548 |
|
|
|
2,977 |
|
|
|
0 |
|
|
|
7,749 |
|
|
|
665 |
|
| |
|
|
|
| |
|
|
| |
|
|
| |
|
|
| |
|
|
| |
|
|
| |
|
|
| |
|
|
| |
|
|
| |
|
| |
| |
|
|
0 |
|
|
|
5,000 |
|
|
|
0 |
|
|
|
0 |
|
|
|
0 |
|
|
|
82 |
|
|
|
0 |
|
|
|
0 |
|
|
|
5,082 |
|
|
|
82 |
|
| |
|
|
18,438 |
|
|
|
0 |
|
|
|
0 |
|
|
|
0 |
|
|
|
0 |
|
|
|
(1,675 |
) |
|
|
0 |
|
|
|
0 |
|
|
|
16,763 |
|
|
|
(753 |
) |
| |
|
Consumer Discretionary (3) |
|
|
53 |
|
|
|
0 |
|
|
|
0 |
|
|
|
0 |
|
|
|
0 |
|
|
|
0 |
|
|
|
0 |
|
|
|
0 |
|
|
|
53 |
|
|
|
0 |
|
| |
|
|
0 |
|
|
|
43 |
|
|
|
0 |
|
|
|
0 |
|
|
|
0 |
|
|
|
(27 |
) |
|
|
0 |
|
|
|
0 |
|
|
|
16 |
|
|
|
(27 |
) |
| |
|
|
35,580 |
|
|
|
0 |
|
|
|
0 |
|
|
|
0 |
|
|
|
0 |
|
|
|
(3,132 |
) |
|
|
0 |
|
|
|
0 |
|
|
|
32,448 |
|
|
|
(3,132 |
) |
| |
|
|
0 |
|
|
|
3,894 |
|
|
|
0 |
|
|
|
0 |
|
|
|
0 |
|
|
|
(1,185 |
) |
|
|
0 |
|
|
|
0 |
|
|
|
2,709 |
|
|
|
(1,186 |
) |
| |
|
| |
|
|
10,191 |
|
|
|
7,461 |
|
|
|
0 |
|
|
|
0 |
|
|
|
0 |
|
|
|
(41 |
) |
|
|
0 |
|
|
|
0 |
|
|
|
17,611 |
|
|
|
(41 |
) |
|
| |
|
|
|
|
|
|
|
|
|
|
|
|
|
|
|
|
|
|
|
|
|
|
|
|
|
|
|
|
|
|
|
|
|
|
|
|
|
|
|
|
| |
$ |
152,361 |
|
|
$ |
55,560 |
|
|
$ |
(69,846 |
) |
|
$ |
391 |
|
|
$ |
1,057 |
|
|
$ |
7,547 |
|
|
$ |
4,919 |
|
|
$ |
0 |
|
|
$ |
151,989 |
|
|
$ |
(2,343 |
) |
|
| |
|
|
|
|
|
|
|
|
|
|
|
|
|
|
|
|
|
|
|
|
|
|
|
|
|
|
|
|
|
|
|
|
|
|
|
|
|
|
|
Investments in Affiliates |
|
|
|
| |
|
|
| |
|
|
| |
|
|
| |
|
|
| |
|
|
| |
|
|
| |
|
|
| |
|
|
| |
|
| |
| |
|
|
|
| |
|
|
| |
|
|
| |
|
|
| |
|
|
| |
|
|
| |
|
|
| |
|
|
| |
|
|
| |
|
| |
Affiliated Investments (5) |
|
$ |
18,732 |
|
|
$ |
0 |
|
|
$ |
(8,891 |
) |
|
$ |
0 |
|
|
$ |
0 |
|
|
$ |
109 |
|
|
$ |
0 |
|
|
$ |
0 |
|
|
$ |
9,950 |
|
|
$ |
(16 |
) |
|
| |
|
|
|
|
|
|
|
|
|
|
|
|
|
|
|
|
|
|
|
|
|
|
|
|
|
|
|
|
|
|
|
|
|
|
|
|
|
|
|
|
Financial Derivative Instruments - Assets |
|
| |
|
$ |
0 |
|
|
$ |
14 |
|
|
$ |
0 |
|
|
$ |
0 |
|
|
$ |
0 |
|
|
$ |
10 |
|
|
$ |
0 |
|
|
$ |
0 |
|
|
$ |
24 |
|
|
$ |
10 |
|
|
| |
|
|
|
|
|
|
|
|
|
|
|
|
|
|
|
|
|
|
|
|
|
|
|
|
|
|
|
|
|
|
|
|
|
|
|
|
|
|
|
|
|
|
|
|
|
|
|
|
|
| |
| |
|
$ |
171,093 |
|
|
$ |
55,574 |
|
|
$ |
(78,737 |
) |
|
$ |
391 |
|
|
$ |
1,057 |
|
|
$ |
7,666 |
|
|
$ |
4,919 |
|
|
$ |
0 |
|
|
$ |
161,963 |
|
|
$ |
(2,349 |
) |
|
| |
|
|
|
|
|
|
|
|
|
|
|
|
|
|
|
|
|
|
|
|
|
|
|
|
|
|
|
|
|
|
|
|
|
|
|
|
|
|
|
The following is a summary of significant unobservable inputs used in the fair valuations of assets and liabilities categorized within Level 3 of the fair value hierarchy:
|
|
|
|
|
|
|
|
|
|
|
|
|
|
|
|
|
|
| |
| Category and Subcategory |
|
Ending
Balance
at 06/30/2025 |
|
|
Valuation Technique |
|
Unobservable
Inputs |
|
|
|
(% Unless Noted Otherwise) |
|
| |
|
|
|
|
|
Investments in Securities, at Value |
|
Loan Participations and Assignments |
|
$ |
14,107 |
|
|
|
|
|
|
|
|
|
16.470 |
|
|
|
— |
|
|
| |
|
31,318 |
|
|
|
|
|
|
| |
|
|
|
|
|
8.364 |
|
|
| |
|
15,261 |
|
|
Indicative Market Quotation |
|
|
|
| |
|
|
|
|
|
97.713 |
|
|
| |
|
4,593 |
|
|
|
|
|
|
| |
|
|
|
|
|
99.631 |
|
|
| |
|
2,201 |
|
|
|
|
|
|
| |
|
100.000 |
|
|
|
| |
|
| |
|
2,020 |
|
|
|
|
|
|
| |
|
101.000 |
|
|
|
— |
|
| |
|
|
|
| |
| |
| |
| |
|
|
| |
|
| |
| |
|
|
58 |
|
|
|
|
|
|
| |
|
93.500 |
|
|
|
— |
|
|
|
|
|
|
|
|
|
|
|
|
|
| |
| See Accompanying Notes |
|
|
ANNUAL REPORT |
|
|
| |
|
|
JUNE 30, 2025 |
|
|
77 |
|
|
|
|
|
|
| |
Consolidated Schedule of Investments |
|
|
|
|
|
June 30, 2025 |
|
|
|
|
|
|
|
|
|
|
|
|
|
|
|
|
|
|
| |
| Category and
Subcategory |
|
Ending
Balance
at 06/30/2025 |
|
|
Valuation Technique |
|
Unobservable Inputs |
|
|
|
(% Unless Noted Otherwise) |
|
| |
Input Value(s)
|
|
|
Weighted
Average |
|
| |
|
$ |
4,773 |
|
|
Comparable Companies / Discounted Cash Flow |
|
Revenue Multiple/Discount Rate |
|
|
|
|
0.900/10.500 |
|
|
|
— |
|
|
| |
|
2,976 |
|
|
Indicative Market Quotation |
|
|
|
| |
|
|
|
|
|
61.799 |
|
| |
|
|
|
| |
| |
| |
| |
|
|
| |
|
| |
| |
|
|
5,082 |
|
|
|
|
|
|
| |
|
100.890 |
|
|
|
— |
|
| |
|
|
16,763 |
|
|
|
|
|
|
| |
|
|
|
|
|
13.535 |
|
| |
|
|
|
| |
| |
| |
| |
|
|
| |
|
| |
| |
|
|
53 |
|
|
Comparable Companies / Discounted Cash Flow |
|
Revenue Multiple/Discount Rate |
|
|
|
|
0.500/20.750 |
|
|
|
— |
|
| |
|
|
16 |
|
|
Indicative Market Quotation |
|
|
|
|
|
|
4.000 |
|
|
|
— |
|
| |
|
|
32,448 |
|
|
|
|
|
|
|
|
|
16.470 |
|
|
|
— |
|
| |
|
|
2,709 |
|
|
Comparable Companies / Discounted Cash Flow |
|
Revenue Multiple/Discount Rate |
|
|
|
|
0.900/10.500 |
|
|
|
— |
|
Preferred Securities Industrials |
|
|
220 |
|
|
|
|
|
|
|
|
|
11.250/10.000 |
|
|
|
— |
|
|
| |
|
11,392 |
|
|
|
|
|
|
| |
|
15.314 |
|
|
|
— |
|
|
| |
|
5,999 |
|
|
|
|
|
|
| |
|
4.335 |
|
|
|
— |
|
Investments in Affiliates |
|
|
|
| |
| |
| |
| |
|
|
| |
|
| |
| |
|
|
|
| |
| |
| |
| |
|
|
| |
|
| |
| |
|
|
9,950 |
|
|
|
|
Discount rate/mortality assumption |
|
| |
|
15.323/2015
ANB VBT
Mortality Table |
|
|
|
— |
|
|
Financial Derivative Instruments - Assets |
|
| |
|
|
24 |
|
|
Indicative Market Quotation |
|
|
|
| |
|
|
|
|
|
0.230 |
|
|
| |
|
|
|
|
| |
| |
| |
|
|
| |
|
| |
| |
|
$ |
161,963 |
|
|
| |
| |
| |
|
|
| |
|
| |
|
| |
|
|
|
|
| |
| |
| |
|
|
| |
|
| |
|
Net Purchases and Settlements for Financial Derivative Instruments may include payments made or received upon entering into swap agreements to compensate for differences between the stated terms of the swap agreement and prevailing market conditions. |
|
Any difference between Net Change in Unrealized Appreciation/(Depreciation) and Net Change in Unrealized Appreciation/(Depreciation) on Investments Held at June 30, 2025 may be due to an investment no longer held or categorized as Level 3 at period end. |
|
Sector type updated from Utilities to Consumer Discretionary since prior fiscal year end. |
|
Sector type updated from Common Stocks Industrials to Preferred Securities Industrials since prior fiscal year end. |
|
Sector type updated from Common Stocks Financials to Common Stocks Affiliated Investments since prior fiscal year end. |
|
|
|
|
|
|
| |
78 |
|
PIMCO CLOSED-END FUNDS |
|
|
See Accompanying Notes |
|
|
|
|
|
|
|
| |
Consolidated Schedule of Investments |
|
PIMCO Dynamic Income Fund |
|
|
|
June 30, 2025 |
(Amounts in thousands*, except number of shares, contracts, units and ounces, if any)
|
|
|
|
|
|
|
|
|
|
|
|
| |
| |
|
|
|
PRINCIPAL
AMOUNT
(000S) |
|
|
|
|
MARKET
VALUE
(000S) |
|
INVESTMENTS IN SECURITIES 132.8% |
|
|
| |
LOAN PARTICIPATIONS AND ASSIGNMENTS 35.9% |
|
|
Aligned Data Centers International LP |
|
| |
|
$ |
|
|
30,300 |
|
|
$ |
|
|
30,381 |
|
|
| |
|
5.279% (EUR003M + 3.000%) due 02/02/2026 ~ |
|
EUR |
|
|
2,294 |
|
|
| |
|
2,387 |
|
7.779% (EUR003M + 5.500%) due 08/15/2028 ~ |
|
| |
|
1,493 |
|
|
| |
|
1,587 |
|
9.756% (TSFR3M + 5.500%) due 08/15/2028 ~ |
|
$ |
|
|
59,613 |
|
|
| |
|
54,165 |
|
|
| |
|
9.941% (TSFR1M + 5.500%) due 09/01/2027 ~ |
|
| |
|
2,769 |
|
|
| |
|
2,499 |
|
|
| |
|
8.571% (TSFR1M + 4.250%) due 06/26/2030 ~ |
|
| |
|
4,700 |
|
|
| |
|
4,715 |
|
|
| |
|
10.561% (TSFR1M + 6.250%) due 10/08/2030 ~ |
|
| |
|
36,400 |
|
|
| |
|
35,186 |
|
|
| |
|
7.546% (TSFR3M + 3.250%) due 07/06/2029 ~ |
|
| |
|
68,705 |
|
|
| |
|
57,543 |
|
|
| |
|
| |
|
EUR |
|
|
1,000 |
|
|
| |
|
881 |
|
| |
|
| |
|
1,000 |
|
|
| |
|
882 |
|
|
Circor International, Inc. |
|
TBD% - 0.500% due 06/20/2029 «µ |
|
$ |
|
|
1,066 |
|
|
| |
|
1,095 |
|
|
| |
|
TBD% - 4.000% due 12/10/2029 µ |
|
| |
|
6,575 |
|
|
| |
|
6,561 |
|
8.307% (TSFR3M + 4.000%) due 12/09/2031 ~ |
|
| |
|
28,900 |
|
|
| |
|
28,981 |
|
|
| |
|
| |
|
| |
|
777 |
|
|
| |
|
776 |
|
|
| |
|
TBD% (EUR012M + 0.000%) due 03/28/2026 ~ |
|
EUR |
|
|
83,116 |
|
|
| |
|
116,508 |
|
TBD% - 1.138% due 10/16/2031 ~ |
|
| |
|
6,310 |
|
|
| |
|
8,845 |
|
|
CoreWeave Compute Acquisition Co. LLC |
|
TBD% - 10.330% (TSFR3M + 6.000%) due 05/16/2029 «~µ |
|
$ |
|
|
79,200 |
|
|
| |
|
81,056 |
|
10.288% - 13.949% (TSFR3M + 6.000%) due 07/31/2028 « |
|
| |
|
18,212 |
|
|
| |
|
19,294 |
|
|
| |
|
TBD% - 1.000% due 01/03/2031 «µ |
|
| |
|
2,809 |
|
|
| |
|
2,837 |
|
8.816% (TSFR1M + 4.500%) due 01/03/2031 «~ |
|
| |
|
12,691 |
|
|
| |
|
12,818 |
|
|
| |
|
| |
|
| |
|
13,642 |
|
|
| |
|
13,506 |
|
| |
|
| |
|
1,364 |
|
|
| |
|
1,351 |
|
|
Encina Private Credit LLC |
|
TBD% - 8.524% due 11/30/2025 «µ |
|
| |
|
1,810 |
|
|
| |
|
1,765 |
|
|
| |
|
7.927% (TSFR1M + 3.500%) due 02/10/2028 «~ |
|
| |
|
68,106 |
|
|
| |
|
52,441 |
|
|
Envision Healthcare Corp. |
|
11.110% (TSFR3M + 6.750%) due 07/20/2026 « |
|
| |
|
15,953 |
|
|
| |
|
15,953 |
|
12.235% (TSFR3M + 7.875%) due 11/03/2028 « |
|
| |
|
115,342 |
|
|
| |
|
118,802 |
|
|
Espai Barca Fondo De Titulizacion |
|
| |
|
EUR |
|
|
23,118 |
|
|
| |
|
31,405 |
|
|
| |
|
TBD% - 11.573% (TSFR3M + 7.250%) due 09/13/2029 µ |
|
$ |
|
|
145 |
|
|
| |
|
146 |
|
11.428% (TSFR6M + 7.250%) due 09/13/2029 ~ |
|
| |
|
1,380 |
|
|
| |
|
1,389 |
|
|
| |
|
9.541% (TSFR3M + 5.000%) due 03/30/2027 ~ |
|
| |
|
8,257 |
|
|
| |
|
7,817 |
|
|
| |
|
8.780% (TSFR3M + 4.500%) due 12/19/2030 ~ |
|
| |
|
78,209 |
|
|
| |
|
77,871 |
|
|
|
|
|
|
|
|
|
|
|
|
|
| |
| |
|
|
|
PRINCIPAL
AMOUNT
(000S) |
|
|
|
|
MARKET
VALUE
(000S) |
|
|
| |
|
9.280% - 10.030% (TSFR3M + 5.000%) due 07/31/2030 ~ |
|
$ |
|
|
39,317 |
|
|
$ |
|
|
36,737 |
|
|
Gateway Casinos & Entertainment Ltd. |
|
10.563% (TSFR3M + 6.250%) due 12/18/2030 |
|
| |
|
67,816 |
|
|
| |
|
67,845 |
|
|
| |
|
9.574% (TSFR1M + 5.250%) due 06/04/2029 ~ |
|
| |
|
11,983 |
|
|
| |
|
11,999 |
|
|
Gryphon Debt Merger Sub, Inc. |
|
| |
|
| |
|
5,700 |
|
|
| |
|
5,706 |
|
|
| |
|
TBD% - 9.717% due 03/27/2032 « |
|
GBP |
|
|
19,324 |
|
|
| |
|
26,029 |
|
|
iHeartCommunications, Inc. |
|
10.216% (TSFR1M + 5.775%) due 05/01/2029 ~ |
|
$ |
|
|
15,085 |
|
|
| |
|
12,338 |
|
|
| |
|
9.016% % (TSFR3M + 4.750%) due 06/01/2029 ~ |
|
| |
|
89,364 |
|
|
| |
|
74,535 |
|
10.079% (TSFR3M + 5.750%) due 06/01/2029 ~µ |
|
| |
|
11,913 |
|
|
| |
|
12,285 |
|
|
| |
|
9.441% (TSFR1M + 5.000%) due 04/26/2028 «~ |
|
| |
|
9,300 |
|
|
| |
|
9,385 |
|
|
| |
|
7.441% (TSFR1M + 3.000%) due 06/30/2027 ~ |
|
| |
|
385 |
|
|
| |
|
252 |
|
|
Lealand Finance Co. BV (5.441% Cash and 3.000% PIK) |
|
8.441% (TSFR1M + 1.000%) due 12/31/2027 ~(d) |
|
| |
|
6,509 |
|
|
| |
|
3,417 |
|
|
| |
|
8.006% (TSFR3M + 3.750%) due 05/19/2031 ~ |
|
| |
|
15,240 |
|
|
| |
|
15,102 |
|
|
| |
|
6.791% (TSFR1M + 2.350%) due 04/16/2029 ~ |
|
| |
|
10,000 |
|
|
| |
|
9,894 |
|
6.791% (TSFR1M + 2.350%) due 04/15/2030 ~ |
|
| |
|
14,360 |
|
|
| |
|
14,202 |
|
|
Mercury Aggregator LP (13.500% PIK) |
|
13.500% due 04/03/2026 «(d) |
|
| |
|
10,608 |
|
|
| |
|
7,235 |
|
|
Mercury Aggregator LP (3.500% PIK) |
|
3.500% due 04/03/2026 «(d) |
|
| |
|
5,823 |
|
|
| |
|
3,972 |
|
|
| |
|
8.577% (TSFR1M + 4.250%) due 12/31/2031 ~ |
|
| |
|
4,975 |
|
|
| |
|
4,336 |
|
|
MPH Acquisition Holdings LLC |
|
8.030% (TSFR3M + 3.750%) due 12/31/2030 ~ |
|
| |
|
1,007 |
|
|
| |
|
994 |
|
9.141% (TSFR3M + 4.600%) due 12/31/2030 ~ |
|
| |
|
23,367 |
|
|
| |
|
21,030 |
|
|
| |
|
5.186% (EUR003M + 3.000%) due 07/31/2025 ~ |
|
EUR |
|
|
199 |
|
|
| |
|
207 |
|
9.250% (PRIME + 1.750%) due 07/31/2025 ~ |
|
$ |
|
|
1,995 |
|
|
| |
|
1,741 |
|
|
| |
|
| |
|
GBP |
|
|
43,500 |
|
|
| |
|
59,608 |
|
|
| |
|
8.177% (TSFR1M + 3.750%) due 02/01/2028 ~ |
|
$ |
|
|
52,902 |
|
|
| |
|
46,851 |
|
|
| |
|
8.291% (TSFR3M + 3.750%) due 06/02/2028 ~ |
|
| |
|
5,182 |
|
|
| |
|
5,058 |
|
|
| |
|
6.980% (EUR003M + 5.000%) due 03/13/2030 ~ |
|
EUR |
|
|
77,460 |
|
|
| |
|
62,502 |
|
|
Project Alpha Intermediate Holding, Inc. |
|
9.296% (TSFR3M + 5.000%) due 05/09/2033 |
|
$ |
|
|
3,500 |
|
|
| |
|
3,487 |
|
|
Project Quasar Pledgco SLU |
|
5.161% (EUR001M + 3.250%) due 04/17/2026 «~ |
|
EUR |
|
|
11,459 |
|
|
| |
|
13,025 |
|
|
Promotora de Informaciones SA |
|
7.344% (EUR003M + 5.220%) due 06/29/2029 ~ |
|
| |
|
9,802 |
|
|
| |
|
11,604 |
|
7.594% (EUR003M + 5.470%) due 12/31/2029 ~ |
|
| |
|
147,517 |
|
|
| |
|
171,162 |
|
|
|
|
|
|
|
|
|
|
|
|
|
| |
| |
|
|
|
PRINCIPAL
AMOUNT
(000S) |
|
|
|
|
MARKET
VALUE
(000S) |
|
|
| |
|
10.046% - 10.068% (TSFR3M + 5.750%) due 06/30/2031 « |
|
$ |
|
|
15,106 |
|
|
$ |
|
|
14,996 |
|
|
| |
|
| |
|
GBP |
|
|
15,500 |
|
|
| |
|
21,329 |
|
|
| |
|
9.849% (PRIME + 5.400%) due 04/05/2028 «~ |
|
$ |
|
|
5,000 |
|
|
| |
|
4,988 |
|
|
| |
|
7.686% (EUR003M + 5.500%) due 03/29/2030 ~ |
|
EUR |
|
|
16,200 |
|
|
| |
|
18,823 |
|
9.780% (TSFR3M + 5.500%) due 03/29/2030 ~ |
|
$ |
|
|
61,785 |
|
|
| |
|
58,507 |
|
|
| |
|
| |
|
| |
|
31,100 |
|
|
| |
|
31,100 |
|
| |
|
| |
|
24,557 |
|
|
| |
|
24,557 |
|
|
| |
|
TBD% - 0.500% due 01/30/2032 «µ |
|
| |
|
2,245 |
|
|
| |
|
2,204 |
|
6.000% (JY0003M + 5.250%) due 01/30/2032 «~ |
|
JPY |
|
|
192,883 |
|
|
| |
|
1,314 |
|
7.679% (CDOR03 + 5.000%) due 01/30/2032 «~ |
|
CAD |
|
|
1,804 |
|
|
| |
|
1,300 |
|
9.131% (TSFR6M + 5.000%) due 01/30/2032 «~ |
|
$ |
|
|
9,964 |
|
|
| |
|
9,781 |
|
|
Steenbok Lux Finco 2 SARL |
|
| |
|
EUR |
|
|
276,139 |
|
|
| |
|
103,666 |
|
|
Stepstone Group MidCo 2 GmbH |
|
6.673% (EUR006M + 4.500%) due 04/26/2032 ~ |
|
| |
|
48,100 |
|
|
| |
|
55,668 |
|
8.608% - 8.651% (TSFR3M + 4.500%) due 12/19/2031 |
|
$ |
|
|
9,500 |
|
|
| |
|
9,239 |
|
|
Strategic Gaming Investments, Inc. |
|
| |
|
| |
|
21,000 |
|
|
| |
|
21,008 |
|
|
| |
|
7.730% (EUR003M + 5.750%) due 08/14/2029 «~ |
|
EUR |
|
|
52,304 |
|
|
| |
|
61,920 |
|
|
| |
|
11.296% (TSFR3M + 7.000%) due 05/13/2027 ~ |
|
$ |
|
|
110,488 |
|
|
| |
|
105,194 |
|
|
Thames Water Utilities Ltd. |
|
0.300% - 5.234% due 11/28/2025 |
|
GBP |
|
|
7,235 |
|
|
| |
|
7,275 |
|
|
| |
|
11.558% (JIBA3M + 4.000%) due 03/02/2028 «~ |
|
ZAR |
|
|
176,657 |
|
|
| |
|
9,898 |
|
|
| |
|
| |
|
$ |
|
|
8,050 |
|
|
| |
|
7,839 |
|
10.927% (TSFR1M + 6.500%) due 10/26/2029 ~ |
|
| |
|
88,496 |
|
|
| |
|
86,567 |
|
|
| |
|
9.441% (TSFR1M + 5.000%) due 06/20/2028 ~ |
|
| |
|
162,932 |
|
|
| |
|
154,649 |
|
|
| |
|
3.154% (EUR003M + 1.200%) due 12/21/2025 «~ |
|
EUR |
|
|
7,589 |
|
|
| |
|
8,716 |
|
3.561% (EUR006M + 1.500%) due 12/22/2025 «~(k) |
|
| |
|
5,500 |
|
|
| |
|
6,308 |
|
|
| |
|
| |
|
HKD |
|
|
332,115 |
|
|
| |
|
42,837 |
|
|
| |
|
8.531% - 10.750% (TSFR3M + 3.250%) due 03/25/2027 «~ |
|
$ |
|
|
8,800 |
|
|
| |
|
8,803 |
|
|
| |
|
| |
|
| |
|
7,231 |
|
|
| |
|
2,856 |
|
|
| |
| |
|
|
| |
| |
|
|
|
Total Loan Participations and Assignments
(Cost $2,450,260) |
|
|
|
|
|
| |
|
|
|
|
| |
CORPORATE BONDS & NOTES 27.6% |
|
|
| |
|
|
|
| |
|
8.250% due 12/31/2028 (m) |
|
EUR |
|
|
27,780 |
|
|
| |
|
33,275 |
|
|
|
|
|
|
|
|
|
|
|
|
|
| |
| See Accompanying Notes |
|
|
ANNUAL REPORT |
|
|
| |
|
|
JUNE 30, 2025 |
|
|
79 |
|
|
|
|
|
|
| |
Consolidated Schedule of Investments |
|
PIMCO Dynamic Income Fund |
|
|
|
|
|
|
|
|
|
|
|
|
|
|
|
|
| |
| |
|
|
|
PRINCIPAL
AMOUNT
(000S) |
|
|
|
|
MARKET
VALUE
(000S) |
|
|
| |
|
| |
|
$ |
|
|
1,250 |
|
|
$ |
|
|
1,304 |
|
| |
|
| |
|
1,300 |
|
|
| |
|
1,351 |
|
|
| |
|
5.100% due 12/31/2099 (j) |
|
| |
|
185 |
|
|
| |
|
251 |
|
|
| |
|
8.500% due 11/15/2029 (m) |
|
| |
|
10,500 |
|
|
| |
|
10,073 |
|
|
| |
|
| |
|
| |
|
600 |
|
|
| |
|
601 |
|
| |
|
| |
|
500 |
|
|
| |
|
518 |
|
|
| |
|
| |
|
| |
|
250 |
|
|
| |
|
263 |
|
| |
|
| |
|
250 |
|
|
| |
|
269 |
|
|
| |
|
7.500% due 02/16/2027 (m) |
|
EUR |
|
|
10,000 |
|
|
| |
|
12,023 |
|
|
| |
|
| |
|
$ |
|
|
400 |
|
|
| |
|
339 |
|
|
Bread Financial Holdings, Inc. |
|
8.375% due 06/15/2035 •(m) |
|
| |
|
500 |
|
|
| |
|
504 |
|
|
| |
|
| |
|
| |
|
6,500 |
|
|
| |
|
6,593 |
|
|
| |
|
| |
|
| |
|
250 |
|
|
| |
|
254 |
|
|
| |
|
7.500% due 05/30/2029 (m) |
|
| |
|
600 |
|
|
| |
|
633 |
|
|
CIFI Holdings Group Co. Ltd. |
|
4.375% due 04/12/2027 ^(e) |
|
| |
|
400 |
|
|
| |
|
37 |
|
4.450% due 08/17/2026 ^(e) |
|
| |
|
300 |
|
|
| |
|
28 |
|
5.250% due 05/13/2026 ^(e) |
|
| |
|
200 |
|
|
| |
|
21 |
|
|
| |
|
| |
|
| |
|
2,721 |
|
|
| |
|
68 |
|
|
| |
|
9.500% due 10/15/2031 (m) |
|
| |
|
5,528 |
|
|
| |
|
5,866 |
|
|
| |
|
| |
|
| |
|
950 |
|
|
| |
|
950 |
|
|
Corestate Capital Holding SA (10.000% Cash or 11.000% PIK) |
|
10.000% due 12/31/2026 (d) |
|
EUR |
|
|
466 |
|
|
| |
|
494 |
|
|
Corestate Capital Holding SA (8.000% Cash or 9.000% PIK) |
|
8.000% due 12/31/2026 (d) |
|
| |
|
325 |
|
|
| |
|
155 |
|
|
Country Garden Holdings Co. Ltd. |
|
2.700% due 07/12/2026 ^(e) |
|
$ |
|
|
200 |
|
|
| |
|
16 |
|
3.125% due 10/22/2025 ^(e) |
|
| |
|
1,200 |
|
|
| |
|
91 |
|
3.875% due 10/22/2030 ^(e) |
|
| |
|
800 |
|
|
| |
|
62 |
|
4.800% due 08/06/2030 ^(e) |
|
| |
|
200 |
|
|
| |
|
15 |
|
6.150% due 09/17/2025 ^(e) |
|
| |
|
1,000 |
|
|
| |
|
76 |
|
|
Credicorp Capital Sociedad Titulizadora SA |
|
| |
|
PEN |
|
|
3,500 |
|
|
| |
|
1,032 |
|
|
|
|
|
| |
Credit Suisse AG AT1 Claim |
|
$ |
|
|
5,060 |
|
|
| |
|
607 |
|
|
| |
|
| |
|
| |
|
1,100 |
|
|
| |
|
1,114 |
|
|
| |
|
| |
|
| |
|
4,260 |
|
|
| |
|
4,446 |
|
| |
|
| |
|
4,260 |
|
|
| |
|
4,425 |
|
| |
|
| |
|
4,260 |
|
|
| |
|
4,415 |
|
|
Fairfax India Holdings Corp. |
|
5.000% due 02/26/2028 (m) |
|
| |
|
12,350 |
|
|
| |
|
11,628 |
|
|
| |
|
| |
|
| |
|
1,500 |
|
|
| |
|
1,500 |
|
|
HA Sustainable Infrastructure Capital, Inc. |
|
6.375% due 07/01/2034 (m) |
|
| |
|
1,700 |
|
|
| |
|
1,701 |
|
|
| |
|
| |
|
| |
|
500 |
|
|
| |
|
495 |
|
| |
|
| |
|
500 |
|
|
| |
|
493 |
|
|
Hudson Pacific Properties LP |
|
3.950% due 11/01/2027 (m) |
|
| |
|
200 |
|
|
| |
|
192 |
|
5.950% due 02/15/2028 (m) |
|
| |
|
200 |
|
|
| |
|
195 |
|
|
| |
|
| |
|
| |
|
250 |
|
|
| |
|
251 |
|
| |
|
| |
|
250 |
|
|
| |
|
252 |
|
| |
|
| |
|
800 |
|
|
| |
|
807 |
|
|
| |
|
| |
|
| |
|
3,200 |
|
|
| |
|
3,341 |
|
| |
|
| |
|
3,200 |
|
|
| |
|
3,180 |
|
|
|
|
|
|
|
|
|
|
|
|
|
| |
| |
|
|
|
PRINCIPAL
AMOUNT
(000S) |
|
|
|
|
MARKET
VALUE
(000S) |
|
|
| |
|
| |
|
$ |
|
|
1,400 |
|
|
$ |
|
|
1,410 |
|
|
Jefferson Capital Holdings LLC |
|
6.000% due 08/15/2026 (m) |
|
| |
|
5,293 |
|
|
| |
|
5,284 |
|
|
Kennedy Wilson Europe Real Estate Ltd. |
|
3.250% due 11/12/2025 (m) |
|
EUR |
|
|
2,463 |
|
|
| |
|
2,883 |
|
|
| |
|
| |
|
| |
|
900 |
|
|
| |
|
1,061 |
|
|
Long Walk Reinsurance Ltd. |
|
| |
|
$ |
|
|
5,800 |
|
|
| |
|
5,879 |
|
|
| |
|
| |
|
| |
|
700 |
|
|
| |
|
722 |
|
|
| |
|
| |
|
| |
|
1,200 |
|
|
| |
|
1,205 |
|
| |
|
| |
|
824 |
|
|
| |
|
843 |
|
|
| |
|
| |
|
EUR |
|
|
300 |
|
|
| |
|
353 |
|
|
| |
|
| |
|
$ |
|
|
800 |
|
|
| |
|
802 |
|
| |
|
| |
|
250 |
|
|
| |
|
256 |
|
|
Panama Infrastructure Receivable Purchaser PLC |
|
0.000% due 04/05/2032 (h)(m) |
|
| |
|
4,677 |
|
|
| |
|
3,328 |
|
|
| |
|
| |
|
| |
|
2,300 |
|
|
| |
|
2,373 |
|
| |
|
| |
|
6,500 |
|
|
| |
|
6,791 |
|
|
| |
|
| |
|
| |
|
700 |
|
|
| |
|
716 |
|
|
| |
|
| |
|
EUR |
|
|
300 |
|
|
| |
|
363 |
|
|
| |
|
| |
|
$ |
|
|
300 |
|
|
| |
|
311 |
|
|
| |
|
| |
|
| |
|
11,610 |
|
|
| |
|
6,676 |
|
|
Sunac China Holdings Ltd. (5.000% Cash or 6.000% PIK) |
|
5.000% due 09/30/2026 ^(d)(e) |
|
| |
|
23 |
|
|
| |
|
3 |
|
|
Sunac China Holdings Ltd. (5.250% Cash or 6.250% PIK) |
|
5.250% due 09/30/2027 ^(d)(e) |
|
| |
|
23 |
|
|
| |
|
3 |
|
|
Sunac China Holdings Ltd. (5.500% Cash or 6.500% PIK) |
|
5.500% due 09/30/2027 ^(d)(e) |
|
| |
|
47 |
|
|
| |
|
6 |
|
|
Sunac China Holdings Ltd. (5.750% Cash or 6.750% PIK) |
|
5.750% due 09/30/2028 ^(d)(e) |
|
| |
|
70 |
|
|
| |
|
9 |
|
|
Sunac China Holdings Ltd. (6.000% Cash or 7.000% PIK) |
|
6.000% due 09/30/2029 ^(d)(e) |
|
| |
|
70 |
|
|
| |
|
9 |
|
|
Sunac China Holdings Ltd. (6.250% Cash or 7.250% PIK) |
|
6.250% due 09/30/2030 ^(d)(e) |
|
| |
|
33 |
|
|
| |
|
4 |
|
|
| |
|
| |
|
GBP |
|
|
761 |
|
|
| |
|
977 |
|
|
| |
|
6.250% due 01/14/2031 (m) |
|
EUR |
|
|
57,661 |
|
|
| |
|
20,030 |
|
|
| |
|
| |
|
$ |
|
|
2,200 |
|
|
| |
|
2,272 |
|
| |
|
| |
|
1,300 |
|
|
| |
|
1,357 |
|
| |
|
| |
|
700 |
|
|
| |
|
716 |
|
|
| |
|
6.000% due 01/15/2030 (m) |
|
| |
|
69,751 |
|
|
| |
|
65,416 |
|
6.500% due 02/15/2029 (m) |
|
| |
|
22,715 |
|
|
| |
|
21,977 |
|
8.625% due 06/15/2032 (m) |
|
| |
|
7,900 |
|
|
| |
|
7,987 |
|
10.500% due 02/15/2028 (m) |
|
| |
|
19,753 |
|
|
| |
|
20,954 |
|
|
| |
|
| |
|
| |
|
3,700 |
|
|
| |
|
3,722 |
|
| |
|
| |
|
6,800 |
|
|
| |
|
7,117 |
|
|
|
|
|
|
|
|
|
|
|
|
|
| |
| |
|
|
|
PRINCIPAL
AMOUNT
(000S) |
|
|
|
|
MARKET
VALUE
(000S) |
|
|
| |
|
| |
|
$ |
|
|
300 |
|
|
$ |
|
|
300 |
|
| |
|
| |
|
4,600 |
|
|
| |
|
4,815 |
|
|
Voyager Aviation Holdings LLC |
|
8.500% due 05/09/2026 ^«(e) |
|
| |
|
55,021 |
|
|
| |
|
0 |
|
|
| |
|
| |
|
EUR |
|
|
250 |
|
|
| |
|
297 |
|
|
| |
|
| |
|
$ |
|
|
300 |
|
|
| |
|
305 |
|
|
| |
| |
|
|
| |
| |
|
|
|
|
| |
| |
|
|
| |
| |
|
315,736 |
|
|
| |
| |
|
|
| |
| |
|
|
|
|
| |
|
|
|
| |
|
| |
|
EUR |
|
|
5,125 |
|
|
| |
|
2,162 |
|
| |
|
$ |
|
|
3,300 |
|
|
| |
|
1,172 |
|
| |
|
EUR |
|
|
40,100 |
|
|
| |
|
17,029 |
|
| |
|
$ |
|
|
36,590 |
|
|
| |
|
12,744 |
|
|
| |
|
| |
|
EUR |
|
|
19,500 |
|
|
| |
|
19,290 |
|
| |
|
| |
|
1,300 |
|
|
| |
|
1,288 |
|
| |
|
| |
|
100 |
|
|
| |
|
99 |
|
| |
|
| |
|
14,800 |
|
|
| |
|
14,672 |
|
| |
|
$ |
|
|
6,436 |
|
|
| |
|
5,322 |
|
| |
|
| |
|
54,564 |
|
|
| |
|
45,152 |
|
| |
|
| |
|
9,800 |
|
|
| |
|
8,256 |
|
| |
|
| |
|
18,959 |
|
|
| |
|
15,736 |
|
| |
|
EUR |
|
|
300 |
|
|
| |
|
319 |
|
| |
|
$ |
|
|
20,600 |
|
|
| |
|
18,556 |
|
|
| |
|
10.500% due 03/30/2029 (m) |
|
EUR |
|
|
61,000 |
|
|
| |
|
75,375 |
|
12.250% due 03/30/2029 (m) |
|
$ |
|
|
31,628 |
|
|
| |
|
33,775 |
|
|
Aston Martin Capital Holdings Ltd. |
|
10.000% due 03/31/2029 (m) |
|
| |
|
12,724 |
|
|
| |
|
12,062 |
|
| |
|
GBP |
|
|
5,000 |
|
|
| |
|
6,416 |
|
|
| |
|
| |
|
EUR |
|
|
2,400 |
|
|
| |
|
2,850 |
|
|
Carvana Co. (11.000% Cash or 13.000% PIK) |
|
11.000% due 06/01/2030 (d)(m) |
|
$ |
|
|
4,153 |
|
|
| |
|
4,370 |
|
|
Carvana Co. (14.000% PIK) |
|
14.000% due 06/01/2031 (d)(m) |
|
| |
|
14,143 |
|
|
| |
|
16,287 |
|
|
| |
|
8.000% due 06/15/2029 (m) |
|
| |
|
14,620 |
|
|
| |
|
12,103 |
|
|
| |
|
7.250% due 06/15/2029 (m) |
|
| |
|
11,770 |
|
|
| |
|
9,609 |
|
|
Cheplapharm Arzneimittel GmbH |
|
5.500% due 01/15/2028 (m) |
|
| |
|
20,500 |
|
|
| |
|
19,830 |
|
7.125% due 06/15/2031 (c) |
|
EUR |
|
|
3,500 |
|
|
| |
|
4,155 |
|
7.500% due 05/15/2030 (m) |
|
| |
|
10,543 |
|
|
| |
|
12,698 |
|
|
| |
|
6.750% due 03/15/2033 (m) |
|
$ |
|
|
4,000 |
|
|
| |
|
4,089 |
|
|
Claritev Corp. (6.500% Cash and 0.750% PIK) |
|
7.250% due 03/31/2031 (d) |
|
| |
|
26,062 |
|
|
| |
|
18,373 |
|
|
| |
|
7.507% due 01/10/2032 (m) |
|
| |
|
1,393 |
|
|
| |
|
1,460 |
|
|
| |
|
| |
|
| |
|
91,615 |
|
|
| |
|
83,312 |
|
| |
|
| |
|
91,806 |
|
|
| |
|
79,642 |
|
|
| |
|
4.625% due 11/02/2031 (m) |
|
| |
|
4,800 |
|
|
| |
|
4,058 |
|
7.750% due 02/01/2032 (m) |
|
| |
|
116,310 |
|
|
| |
|
114,377 |
|
8.375% due 01/19/2036 (m) |
|
| |
|
1,890 |
|
|
| |
|
1,825 |
|
8.875% due 01/13/2033 (m) |
|
| |
|
3,500 |
|
|
| |
|
3,613 |
|
|
| |
|
2.875% due 01/29/2026 (m) |
|
EUR |
|
|
2,200 |
|
|
| |
|
2,561 |
|
3.250% due 07/23/2027 (m) |
|
| |
|
7,300 |
|
|
| |
|
8,305 |
|
|
| |
|
| |
|
$ |
|
|
624 |
|
|
| |
|
31 |
|
|
| |
|
6.875% due 07/02/2029 (m) |
|
EUR |
|
|
3,000 |
|
|
| |
|
3,593 |
|
|
Gazprom PJSC Via Gaz Capital SA |
|
| |
|
$ |
|
|
300 |
|
|
| |
|
240 |
|
| |
|
| |
|
1,081 |
|
|
| |
|
946 |
|
|
|
|
|
|
|
| |
80 |
|
PIMCO CLOSED-END FUNDS |
|
|
See Accompanying Notes |
|
|
|
|
|
|
|
|
|
|
|
|
|
| |
| |
|
|
|
PRINCIPAL
AMOUNT
(000S) |
|
|
|
|
MARKET
VALUE
(000S) |
|
|
| |
|
| |
|
$ |
|
|
68,988 |
|
|
$ |
|
|
68,988 |
|
|
| |
|
6.000% due 01/30/2033 «(k) |
|
| |
|
49,687 |
|
|
| |
|
68,890 |
|
|
| |
|
5.625% due 08/15/2030 (m) |
|
EUR |
|
|
1,400 |
|
|
| |
|
1,607 |
|
|
Intelsat Jackson Holdings SA |
|
6.500% due 03/15/2030 (m) |
|
$ |
|
|
91,639 |
|
|
| |
|
93,673 |
|
|
| |
|
9.875% due 09/20/2031 (m) |
|
| |
|
25,352 |
|
|
| |
|
24,680 |
|
|
| |
|
8.375% due 02/15/2032 (m) |
|
| |
|
1,200 |
|
|
| |
|
1,100 |
|
|
MPH Acquisition Holdings LLC |
|
5.750% due 12/31/2030 (m) |
|
| |
|
46,006 |
|
|
| |
|
37,936 |
|
|
MPH Acquisition Holdings LLC (6.500% Cash and 5.000% PIK) |
|
11.500% due 12/31/2030 (d)(m) |
|
|
13,741 |
|
|
| |
|
13,637 |
|
|
Newfold Digital Holdings Group, Inc. |
|
| |
|
| |
|
37,300 |
|
|
| |
|
21,820 |
|
| |
|
| |
|
13,109 |
|
|
| |
|
9,897 |
|
|
| |
|
8.000% due 04/15/2030 (m) |
|
| |
|
2,800 |
|
|
| |
|
2,853 |
|
|
| |
|
6.700% due 02/16/2032 (m) |
|
| |
|
14,345 |
|
|
| |
|
13,340 |
|
6.840% due 01/23/2030 (m) |
|
| |
|
6,700 |
|
|
| |
|
6,477 |
|
8.750% due 06/02/2029 (m) |
|
| |
|
11,420 |
|
|
| |
|
11,839 |
|
|
Prime Healthcare Services, Inc. |
|
9.375% due 09/01/2029 (m) |
|
| |
|
31,100 |
|
|
| |
|
30,889 |
|
|
| |
|
11.542% due 01/23/2029 ~(m) |
|
|
|
|
| |
|
21,660 |
|
|
Russian Railways Via RZD Capital PLC |
|
7.487% due 03/25/2031 ^(e) |
|
GBP |
|
|
200 |
|
|
| |
|
192 |
|
|
| |
|
8.500% due 01/15/2030 (m) |
|
$ |
|
|
1,400 |
|
|
| |
|
1,451 |
|
|
Thames Water Super Senior Issuer PLC |
|
| |
|
GBP |
|
|
756 |
|
|
| |
|
1,142 |
|
|
Thames Water Utilities Finance PLC |
|
| |
|
EUR |
|
|
900 |
|
|
| |
|
675 |
|
| |
|
| |
|
300 |
|
|
| |
|
228 |
|
| |
|
$ |
|
|
400 |
|
|
| |
|
261 |
|
| |
|
GBP |
|
|
100 |
|
|
| |
|
91 |
|
| |
|
| |
|
600 |
|
|
| |
|
538 |
|
| |
|
| |
|
300 |
|
|
| |
|
273 |
|
| |
|
EUR |
|
|
500 |
|
|
| |
|
386 |
|
| |
|
| |
|
1,100 |
|
|
| |
|
848 |
|
| |
|
GBP |
|
|
900 |
|
|
| |
|
812 |
|
| |
|
| |
|
600 |
|
|
| |
|
547 |
|
| |
|
| |
|
300 |
|
|
| |
|
277 |
|
| |
|
| |
|
1,200 |
|
|
| |
|
1,096 |
|
| |
|
| |
|
400 |
|
|
| |
|
370 |
|
| |
|
| |
|
200 |
|
|
| |
|
187 |
|
| |
|
| |
|
400 |
|
|
| |
|
375 |
|
|
Thames Water Utilities Ltd. |
|
0.000% due 03/22/2027 (h) |
|
| |
|
112 |
|
|
| |
|
130 |
|
|
| |
|
| |
|
$ |
|
|
771 |
|
|
| |
|
774 |
|
|
Toll Road Investors Partnership LP |
|
0.000% due 02/15/2043 (h)(m) |
|
|
18,029 |
|
|
| |
|
6,114 |
|
|
| |
|
4.875% due 09/30/2039 (m) |
|
| |
|
13,765 |
|
|
| |
|
12,182 |
|
5.750% due 09/30/2039 (m) |
|
| |
|
46,445 |
|
|
| |
|
45,636 |
|
|
| |
|
| |
|
EUR |
|
|
4,600 |
|
|
| |
|
5,383 |
|
9.500% due 05/15/2030 (m) |
|
$ |
|
|
3,600 |
|
|
| |
|
3,683 |
|
|
| |
|
10.625% due 06/28/2028 (m) |
|
| |
|
13,209 |
|
|
| |
|
11,310 |
|
|
| |
|
| |
|
EUR |
|
|
7,000 |
|
|
| |
|
7,442 |
|
|
| |
|
8.375% due 04/30/2030 (m) |
|
$ |
|
|
6,000 |
|
|
| |
|
6,161 |
|
|
| |
|
0.000% due 12/29/2049 ~(j) |
|
BRL |
|
|
830,470 |
|
|
| |
|
52,409 |
|
|
|
|
|
|
|
|
|
|
|
|
|
| |
| |
|
|
|
PRINCIPAL
AMOUNT
(000S) |
|
|
|
|
MARKET
VALUE
(000S) |
|
|
| |
|
9.500% due 02/01/2029 (m) |
|
$ |
|
|
22,668 |
|
|
$ |
|
|
24,708 |
|
9.875% due 02/01/2032 (m) |
|
| |
|
11,030 |
|
|
| |
|
11,919 |
|
|
| |
|
| |
|
EUR |
|
|
18,500 |
|
|
| |
|
21,676 |
|
10.000% due 10/15/2030 (m) |
|
$ |
|
|
12,700 |
|
|
| |
|
12,507 |
|
|
| |
|
7.250% due 10/31/2029 (m) |
|
| |
|
3,600 |
|
|
| |
|
3,611 |
|
7.750% due 09/15/2030 (m) |
|
| |
|
5,300 |
|
|
| |
|
5,346 |
|
|
| |
|
13.500% due 04/15/2031 (m) |
|
| |
|
2,300 |
|
|
| |
|
2,363 |
|
|
| |
|
| |
|
| |
|
1,108 |
|
|
| |
|
1,093 |
|
|
Yinson Boronia Production BV |
|
8.947% due 07/31/2042 (m) |
|
| |
|
10,199 |
|
|
| |
|
10,868 |
|
|
| |
| |
|
|
| |
| |
|
|
|
|
| |
| |
|
|
| |
| |
|
1,382,102 |
|
|
| |
| |
|
|
| |
| |
|
|
|
|
| |
|
|
|
| |
|
6.250% due 03/15/2030 (m) |
|
| |
|
1,700 |
|
|
| |
|
1,727 |
|
|
| |
|
7.500% due 06/15/2030 (m) |
|
| |
|
2,711 |
|
|
| |
|
2,578 |
|
|
Gazprom PJSC Via Gaz Finance PLC |
|
| |
|
| |
|
200 |
|
|
| |
|
165 |
|
|
| |
|
6.750% due 12/31/2026 (m) |
|
| |
|
4,729 |
|
|
| |
|
4,304 |
|
|
Oi SA (10.000% Cash or 6.000% PIK and 7.500% Cash or 13.500% PIK) |
|
10.000% due 06/30/2027 (d) |
|
| |
|
22,703 |
|
|
| |
|
14,784 |
|
|
Oi SA (10.000% Cash or 6.000% PIK and 7.500% Cash or 13.500% PIK) |
|
10.000% due 06/30/2027 (d)(m) |
|
| |
|
83,079 |
|
|
| |
|
54,099 |
|
|
| |
|
8.500% due 12/31/2028 (d) |
|
| |
|
147,720 |
|
|
| |
|
9,971 |
|
|
| |
|
5.375% due 03/22/2030 (m) |
|
| |
|
39,212 |
|
|
| |
|
36,904 |
|
|
Yinson Production Financial Services Pte. Ltd. |
|
| |
|
| |
|
8,900 |
|
|
| |
|
9,252 |
|
|
| |
| |
|
|
| |
| |
|
|
|
|
| |
| |
|
|
| |
| |
|
133,784 |
|
|
| |
| |
|
|
| |
| |
|
|
|
Total Corporate Bonds & Notes
(Cost $1,994,080) |
|
|
|
|
|
| |
|
|
|
|
| |
CONVERTIBLE BONDS & NOTES 0.1% |
|
|
| |
|
|
|
Corestate Capital Holding SA (8.000% Cash or 9.000% PIK) |
|
8.000% due 11/28/2049 (d) |
|
EUR |
|
|
2,472 |
|
|
| |
|
1,179 |
|
|
| |
|
5.500% due 03/15/2026 (m) |
|
$ |
|
|
7,700 |
|
|
| |
|
7,650 |
|
|
| |
| |
|
|
| |
| |
|
|
|
Total Convertible Bonds & Notes
(Cost $10,547) |
|
|
|
|
|
| |
|
|
|
|
| |
MUNICIPAL BONDS & NOTES 0.5% |
|
|
| |
|
|
|
Maricopa County, Arizona Industrial Development Authority Revenue Notes, Series 2024 |
|
| |
|
| |
|
850 |
|
|
| |
|
881 |
|
|
| |
| |
|
|
| |
| |
|
|
|
|
| |
|
|
|
Michigan Tobacco Settlement Finance Authority Revenue Bonds, Series 2008 |
|
0.000% due 06/01/2046 (h) |
|
| |
|
23,000 |
|
|
| |
|
3,006 |
|
|
| |
| |
|
|
| |
| |
|
|
|
|
| |
|
|
|
Tobacco Settlement Finance Authority, West Virginia Revenue Bonds, Series 2007 |
|
0.000% due 06/01/2047 (h) |
|
| |
|
355,485 |
|
|
| |
|
32,528 |
|
|
| |
| |
|
|
| |
| |
|
|
|
Total Municipal Bonds & Notes
(Cost $50,962) |
|
|
|
|
|
| |
|
|
|
|
| |
|
|
|
|
|
|
|
|
|
|
|
|
| |
| |
|
|
|
|
|
|
|
|
|
|
U.S. GOVERNMENT AGENCIES 1.8% |
|
|
| |
|
0.000% due 10/25/2042 •(m) |
|
$ |
|
|
1,015 |
|
|
$ |
|
|
848 |
|
1.040% due 08/25/2043 ~(a) |
|
| |
|
15,754 |
|
|
| |
|
606 |
|
1.500% due 07/25/2041 •(a)(m) |
|
|
1,312 |
|
|
| |
|
131 |
|
1.580% due 08/25/2038 •(a) |
|
| |
|
328 |
|
|
| |
|
24 |
|
1.630% due 08/25/2049 •(a) |
|
| |
|
137 |
|
|
| |
|
15 |
|
1.630% due 07/25/2059 •(a)(m) |
|
|
5,587 |
|
|
| |
|
681 |
|
1.650% due 10/25/2040 •(a)(m) |
|
|
1,248 |
|
|
| |
|
69 |
|
1.730% due 02/25/2043 •(a)(m) |
|
|
1,243 |
|
|
| |
|
140 |
|
1.930% due 12/25/2037 •(a) |
|
| |
|
28 |
|
|
| |
|
2 |
|
2.100% due 09/25/2037 •(a) |
|
| |
|
215 |
|
|
| |
|
15 |
|
2.180% due 03/25/2040 •(a)(m) |
|
|
581 |
|
|
| |
|
13 |
|
2.220% due 12/25/2036 •(a)(m) |
|
|
905 |
|
|
| |
|
107 |
|
2.230% due 11/25/2036 •(a) |
|
| |
|
31 |
|
|
| |
|
1 |
|
2.300% due 06/25/2037 •(a) |
|
| |
|
135 |
|
|
| |
|
9 |
|
2.340% due 10/25/2060 ~(a)(m) |
|
|
13,702 |
|
|
| |
|
1,090 |
|
2.431% due 01/25/2041 •(m) |
|
| |
|
2,259 |
|
|
| |
|
2,276 |
|
2.560% due 03/25/2038 •(a) |
|
| |
|
595 |
|
|
| |
|
69 |
|
2.580% due 02/25/2038 •(a) |
|
| |
|
359 |
|
|
| |
|
42 |
|
3.000% due 01/25/2042 (a) |
|
| |
|
60 |
|
|
| |
|
1 |
|
3.500% due 08/25/2032 (a) |
|
| |
|
482 |
|
|
| |
|
38 |
|
3.500% due 06/25/2050 (a)(m) |
|
| |
|
14,660 |
|
|
| |
|
2,637 |
|
4.000% due 06/25/2050 (a)(m) |
|
| |
|
1,848 |
|
|
| |
|
361 |
|
4.500% due 04/25/2042 (a) |
|
| |
|
448 |
|
|
| |
|
47 |
|
5.000% due 01/25/2048 (a)(m) |
|
| |
|
3,571 |
|
|
| |
|
800 |
|
|
| |
|
0.000% due 11/15/2048 •(a)(m) |
|
|
29,181 |
|
|
| |
|
970 |
|
0.700% due 11/25/2055 ~(a)(m) |
|
|
253,290 |
|
|
| |
|
15,324 |
|
1.269% due 09/15/2041 •(m) |
|
| |
|
602 |
|
|
| |
|
568 |
|
1.532% due 04/15/2039 •(a)(m) |
|
|
935 |
|
|
| |
|
104 |
|
1.680% due 06/25/2050 •(a)(m) |
|
|
869 |
|
|
| |
|
104 |
|
1.730% due 05/25/2050 •(a) |
|
| |
|
6,034 |
|
|
| |
|
802 |
|
1.732% due 01/15/2047 •(a) |
|
| |
|
213 |
|
|
| |
|
26 |
|
1.782% due 09/15/2042 •(a) |
|
| |
|
319 |
|
|
| |
|
28 |
|
1.882% due 05/15/2037 •(a) |
|
| |
|
633 |
|
|
| |
|
55 |
|
1.992% due 05/15/2037 •(a) |
|
| |
|
36 |
|
|
| |
|
3 |
|
1.995% due 01/25/2051 •(a) |
|
| |
|
5,651 |
|
|
| |
|
969 |
|
1.995% due 01/25/2051 •(a)(m) |
|
|
3,125 |
|
|
| |
|
427 |
|
2.052% due 07/15/2036 •(a)(m) |
|
|
787 |
|
|
| |
|
79 |
|
2.079% due 11/25/2045 ~(a)(m) |
|
|
75,137 |
|
|
| |
|
3,323 |
|
2.162% due 09/15/2036 •(a) |
|
| |
|
263 |
|
|
| |
|
27 |
|
2.182% due 05/15/2041 •(a) |
|
| |
|
519 |
|
|
| |
|
49 |
|
2.282% due 04/15/2036 •(a) |
|
| |
|
112 |
|
|
| |
|
10 |
|
3.000% due 06/25/2050 (a)(m) |
|
| |
|
10,059 |
|
|
| |
|
1,787 |
|
3.362% due 09/15/2036 •(a) |
|
| |
|
411 |
|
|
| |
|
57 |
|
| |
|
| |
|
4,113 |
|
|
| |
|
1,840 |
|
3.500% due 07/25/2050 (a)(m) |
|
| |
|
20,535 |
|
|
| |
|
3,613 |
|
| |
|
| |
|
2,124 |
|
|
| |
|
934 |
|
4.000% due 03/15/2027 (a) |
|
| |
|
19 |
|
|
| |
|
0 |
|
4.000% due 07/25/2050 (a)(m) |
|
| |
|
16,258 |
|
|
| |
|
3,866 |
|
| |
|
| |
|
3,990 |
|
|
| |
|
1,988 |
|
4.223% due 11/25/2061 ~(a) |
|
| |
|
11,066 |
|
|
| |
|
4,413 |
|
4.250% due 09/25/2060 (m) |
|
| |
|
1,645 |
|
|
| |
|
1,581 |
|
4.250% due 03/25/2061 ~(m) |
|
| |
|
700 |
|
|
| |
|
632 |
|
| |
|
| |
|
12,646 |
|
|
| |
|
6,015 |
|
4.500% due 11/25/2061 ~(m) |
|
| |
|
3,900 |
|
|
| |
|
3,476 |
|
5.000% due 05/25/2048 (a)(m) |
|
| |
|
5,379 |
|
|
| |
|
860 |
|
| |
|
| |
|
3,400 |
|
|
| |
|
3,118 |
|
| |
|
| |
|
1,872 |
|
|
| |
|
1,089 |
|
9.055% due 01/25/2051 •(m) |
|
| |
|
3,319 |
|
|
| |
|
3,671 |
|
| |
|
| |
|
488 |
|
|
| |
|
282 |
|
9.805% due 01/25/2034 •(m) |
|
| |
|
2,800 |
|
|
| |
|
3,314 |
|
10.555% due 09/25/2041 •(m) |
|
| |
|
6,400 |
|
|
| |
|
6,678 |
|
| |
|
| |
|
500 |
|
|
| |
|
530 |
|
11.405% due 01/25/2042 •(m) |
|
|
3,800 |
|
|
| |
|
4,056 |
|
11.805% due 10/25/2041 •(m) |
|
| |
|
17,796 |
|
|
| |
|
18,923 |
|
12.105% due 11/25/2041 •(m) |
|
| |
|
8,324 |
|
|
| |
|
8,912 |
|
12.805% due 02/25/2042 •(m) |
|
| |
|
2,350 |
|
|
| |
|
2,569 |
|
| |
|
| |
|
1,584 |
|
|
| |
|
1,166 |
|
| |
|
| |
|
1,179 |
|
|
| |
|
870 |
|
|
| |
|
1.668% due 12/20/2048 •(a)(m) |
|
|
2,364 |
|
|
| |
|
242 |
|
1.688% due 08/20/2042 •(a)(m) |
|
|
1,180 |
|
|
| |
|
132 |
|
1.818% due 12/20/2040 •(a) |
|
| |
|
693 |
|
|
| |
|
34 |
|
2.500% due 09/20/2036 (a)(m) |
|
| |
|
34,173 |
|
|
| |
|
2,771 |
|
3.500% due 06/20/2042 (a) |
|
| |
|
149 |
|
|
| |
|
16 |
|
|
| |
| |
|
|
| |
| |
|
|
|
Total U.S. Government Agencies
(Cost $129,925) |
|
|
|
|
|
| |
|
|
|
|
| |
|
|
|
|
|
|
|
|
|
|
|
|
| |
See Accompanying Notes |
|
|
|
|
|
| |
|
|
JUNE 30, 2025 |
|
|
|
|
|
|
|
|
|
| |
Consolidated Schedule of Investments |
|
PIMCO Dynamic Income Fund |
|
|
|
|
|
|
|
|
|
|
|
|
|
|
|
|
| |
| |
|
|
|
PRINCIPAL
AMOUNT
(000S) |
|
|
|
|
MARKET
VALUE
(000S) |
|
NON-AGENCY MORTGAGE-BACKED SECURITIES 33.1% |
|
|
| |
|
4.803% due 02/10/2036 ~(m) |
|
$ |
|
|
7,541 |
|
|
$ |
|
|
6,634 |
|
|
| |
|
3.779% due 06/05/2037 ~(m) |
|
| |
|
11,361 |
|
|
| |
|
10,659 |
|
|
280 Park Avenue Mortgage Trust |
|
6.148% due 09/15/2034 •(m) |
|
| |
|
12,600 |
|
|
| |
|
12,268 |
|
7.439% due 09/15/2034 •(m) |
|
| |
|
2,500 |
|
|
| |
|
2,403 |
|
|
Adjustable Rate Mortgage Trust |
|
4.694% due 03/25/2036 •(m) |
|
| |
|
2,850 |
|
|
| |
|
1,678 |
|
4.734% due 03/25/2037 •(m) |
|
| |
|
589 |
|
|
| |
|
656 |
|
4.994% due 03/25/2037 ~(m) |
|
| |
|
1,066 |
|
|
| |
|
995 |
|
5.470% due 03/25/2036 ~(m) |
|
| |
|
18,669 |
|
|
| |
|
9,366 |
|
6.051% due 11/25/2037 ~(m) |
|
| |
|
802 |
|
|
| |
|
532 |
|
|
American Home Mortgage Assets Trust |
|
| |
|
| |
|
303 |
|
|
| |
|
290 |
|
5.014% due 08/25/2037 •(m) |
|
| |
|
5,345 |
|
|
| |
|
4,816 |
|
|
American Home Mortgage Investment Trust |
|
| |
|
| |
|
2,476 |
|
|
| |
|
936 |
|
5.034% due 09/25/2045 •(m) |
|
| |
|
2,113 |
|
|
| |
|
1,878 |
|
5.334% due 02/25/2044 •(m) |
|
| |
|
7,146 |
|
|
| |
|
6,712 |
|
| |
|
| |
|
4,653 |
|
|
| |
|
606 |
|
|
| |
|
| |
|
| |
|
2,021 |
|
|
| |
|
0 |
|
|
ASG Resecuritization Trust |
|
3.814% due 01/28/2037 ~(m) |
|
| |
|
7,234 |
|
|
| |
|
6,101 |
|
6.000% due 06/28/2037 ~(m) |
|
| |
|
24,534 |
|
|
| |
|
11,313 |
|
|
Ashford Hospitality Trust |
|
5.884% due 04/15/2035 •(m) |
|
| |
|
10,360 |
|
|
| |
|
10,260 |
|
7.584% due 04/15/2035 •(m) |
|
| |
|
10,939 |
|
|
| |
|
10,744 |
|
|
Atrium Hotel Portfolio Trust |
|
6.259% due 12/15/2036 •(m) |
|
| |
|
1,840 |
|
|
| |
|
1,784 |
|
6.559% due 12/15/2036 •(m) |
|
| |
|
8,800 |
|
|
| |
|
8,307 |
|
| |
|
| |
|
7,500 |
|
|
| |
|
6,934 |
|
|
| |
|
0.000% due 12/28/2049 (b)(h) |
|
GBP |
|
|
11,488 |
|
|
| |
|
12,275 |
|
0.000% due 12/28/2049 (a) |
|
| |
|
9,500 |
|
|
| |
|
0 |
|
7.739% due 12/28/2049 •(m) |
|
| |
|
11,241 |
|
|
| |
|
15,453 |
|
7.989% due 12/28/2049 •(m) |
|
| |
|
8,564 |
|
|
| |
|
11,691 |
|
| |
|
| |
|
2,676 |
|
|
| |
|
3,498 |
|
8.239% due 12/28/2049 •(m) |
|
| |
|
6,951 |
|
|
| |
|
4,356 |
|
|
BAMLL Commercial Mortgage Securities Trust |
|
2.627% due 01/15/2032 (m) |
|
$ |
|
|
18,810 |
|
|
| |
|
16,493 |
|
|
Banc of America Alternative Loan Trust |
|
2.206% due 06/25/2037 •(a) |
|
| |
|
258 |
|
|
| |
|
32 |
|
| |
|
| |
|
240 |
|
|
| |
|
174 |
|
| |
|
| |
|
80 |
|
|
| |
|
68 |
|
| |
|
| |
|
36 |
|
|
| |
|
31 |
|
6.000% due 07/25/2046 (m) |
|
| |
|
552 |
|
|
| |
|
482 |
|
|
Banc of America Funding Corp. |
|
3.560% due 05/26/2036 ~(m) |
|
| |
|
4,326 |
|
|
| |
|
3,621 |
|
|
Banc of America Funding Trust |
|
0.000% due 06/26/2035 ~(m) |
|
| |
|
1,186 |
|
|
| |
|
1,186 |
|
0.000% due 11/26/2036 ~(m) |
|
| |
|
24,670 |
|
|
| |
|
8,611 |
|
| |
|
| |
|
190 |
|
|
| |
|
139 |
|
| |
|
| |
|
321 |
|
|
| |
|
255 |
|
| |
|
| |
|
67 |
|
|
| |
|
57 |
|
4.543% due 08/25/2047 ~(m) |
|
| |
|
2,132 |
|
|
| |
|
1,747 |
|
| |
|
| |
|
254 |
|
|
| |
|
215 |
|
4.717% due 03/20/2036 ~(m) |
|
| |
|
703 |
|
|
| |
|
613 |
|
| |
|
| |
|
134 |
|
|
| |
|
117 |
|
4.852% due 04/20/2047 •(m) |
|
| |
|
3,619 |
|
|
| |
|
3,038 |
|
4.854% due 04/25/2037 •(m) |
|
| |
|
813 |
|
|
| |
|
688 |
|
| |
|
| |
|
71 |
|
|
| |
|
69 |
|
5.107% due 02/20/2035 •(m) |
|
| |
|
2,308 |
|
|
| |
|
2,228 |
|
5.625% due 04/20/2035 ~(m) |
|
| |
|
788 |
|
|
| |
|
732 |
|
6.000% due 10/25/2037 (m) |
|
| |
|
2,549 |
|
|
| |
|
2,247 |
|
| |
|
| |
|
17 |
|
|
| |
|
17 |
|
6.619% due 07/26/2036 ~(m) |
|
| |
|
8,214 |
|
|
| |
|
2,449 |
|
6.878% due 09/20/2046 ~(m) |
|
| |
|
425 |
|
|
| |
|
412 |
|
|
Banc of America Mortgage Trust |
|
5.750% due 10/25/2036 (m) |
|
| |
|
474 |
|
|
| |
|
398 |
|
| |
|
| |
|
519 |
|
|
| |
|
406 |
|
| |
|
| |
|
84 |
|
|
| |
|
82 |
|
| |
|
| |
|
58 |
|
|
| |
|
49 |
|
| |
|
| |
|
15 |
|
|
| |
|
14 |
|
|
|
|
|
|
|
|
|
|
|
|
|
| |
| |
|
|
|
PRINCIPAL
AMOUNT
(000S) |
|
|
|
|
MARKET
VALUE
(000S) |
|
|
Barclays Commercial Mortgage Securities Trust |
|
8.159% due 07/15/2037 •(m) |
|
$ |
|
|
2,600 |
|
|
$ |
|
|
1,898 |
|
|
Bayview Commercial Asset Trust |
|
4.764% due 03/25/2037 •(m) |
|
| |
|
101 |
|
|
| |
|
96 |
|
|
| |
|
4.715% due 08/10/2033 ~(m) |
|
| |
|
7,790 |
|
|
| |
|
5,584 |
|
|
| |
|
2.480% due 02/26/2037 ~(m) |
|
| |
|
6,878 |
|
|
| |
|
5,525 |
|
3.768% due 04/26/2037 ~(m) |
|
| |
|
5,403 |
|
|
| |
|
4,624 |
|
| |
|
| |
|
347 |
|
|
| |
|
308 |
|
4.155% due 05/26/2037 ~(m) |
|
| |
|
1,375 |
|
|
| |
|
1,229 |
|
4.279% due 02/26/2047 •(m) |
|
| |
|
9,729 |
|
|
| |
|
7,967 |
|
4.404% due 05/26/2036 •(m) |
|
| |
|
3,077 |
|
|
| |
|
2,608 |
|
4.443% due 10/26/2037 ~(m) |
|
| |
|
4,303 |
|
|
| |
|
2,757 |
|
4.545% due 02/26/2036 ~(m) |
|
| |
|
2,186 |
|
|
| |
|
1,471 |
|
4.770% due 03/26/2037 ~(m) |
|
| |
|
682 |
|
|
| |
|
561 |
|
4.939% due 05/26/2035 •(m) |
|
| |
|
3,976 |
|
|
| |
|
3,528 |
|
5.172% due 03/27/2037 ~(m) |
|
| |
|
3,805 |
|
|
| |
|
3,266 |
|
5.500% due 12/26/2035 ~(m) |
|
| |
|
7,996 |
|
|
| |
|
4,883 |
|
5.694% due 06/26/2036 ~(m) |
|
| |
|
1,915 |
|
|
| |
|
1,609 |
|
5.710% due 11/26/2035 ~(m) |
|
| |
|
1,864 |
|
|
| |
|
1,585 |
|
6.000% due 06/26/2037 ~(m) |
|
| |
|
1,208 |
|
|
| |
|
1,095 |
|
6.000% due 08/26/2037 ~(m) |
|
| |
|
2,017 |
|
|
| |
|
1,605 |
|
6.000% due 10/26/2037 ~(m) |
|
| |
|
1,513 |
|
|
| |
|
1,030 |
|
6.035% due 01/26/2036 ~(m) |
|
| |
|
23,037 |
|
|
| |
|
7,011 |
|
6.203% due 07/26/2045 ~(m) |
|
| |
|
2,213 |
|
|
| |
|
2,135 |
|
|
| |
|
8.064% due 06/15/2038 •(m) |
|
| |
|
11,850 |
|
|
| |
|
2,385 |
|
|
Bear Stearns Adjustable Rate Mortgage Trust |
|
4.317% due 06/25/2047 ~(m) |
|
| |
|
1,184 |
|
|
| |
|
1,043 |
|
| |
|
| |
|
105 |
|
|
| |
|
93 |
|
| |
|
| |
|
255 |
|
|
| |
|
236 |
|
| |
|
| |
|
14 |
|
|
| |
|
14 |
|
| |
|
| |
|
30 |
|
|
| |
|
29 |
|
| |
|
| |
|
10 |
|
|
| |
|
10 |
|
|
| |
|
| |
|
| |
|
183 |
|
|
| |
|
169 |
|
4.037% due 04/25/2037 ~(m) |
|
| |
|
3,387 |
|
|
| |
|
2,353 |
|
| |
|
| |
|
266 |
|
|
| |
|
122 |
|
4.243% due 11/25/2035 ~(m) |
|
| |
|
8,060 |
|
|
| |
|
4,355 |
|
| |
|
| |
|
99 |
|
|
| |
|
91 |
|
| |
|
| |
|
1,401 |
|
|
| |
|
640 |
|
| |
|
| |
|
183 |
|
|
| |
|
131 |
|
4.525% due 07/25/2036 ~(m) |
|
| |
|
45,313 |
|
|
| |
|
19,509 |
|
| |
|
| |
|
20 |
|
|
| |
|
13 |
|
4.698% due 03/25/2036 ~(m) |
|
| |
|
978 |
|
|
| |
|
565 |
|
4.711% due 08/25/2046 ~(m) |
|
| |
|
3,654 |
|
|
| |
|
2,507 |
|
4.745% due 12/25/2046 ~(m) |
|
| |
|
3,067 |
|
|
| |
|
1,514 |
|
4.754% due 06/25/2046 •(m) |
|
| |
|
970 |
|
|
| |
|
875 |
|
4.774% due 08/25/2036 •(m) |
|
| |
|
12,621 |
|
|
| |
|
11,316 |
|
4.834% due 02/25/2034 •(m) |
|
| |
|
1,430 |
|
|
| |
|
1,315 |
|
4.843% due 05/25/2036 ~(m) |
|
| |
|
6,262 |
|
|
| |
|
2,594 |
|
4.909% due 09/25/2035 ~(m) |
|
| |
|
7,189 |
|
|
| |
|
2,469 |
|
4.934% due 01/25/2036 •(m) |
|
| |
|
2,684 |
|
|
| |
|
2,537 |
|
| |
|
| |
|
86 |
|
|
| |
|
84 |
|
5.559% due 01/25/2035 •(m) |
|
| |
|
725 |
|
|
| |
|
689 |
|
5.559% due 03/25/2035 •(m) |
|
| |
|
5,428 |
|
|
| |
|
4,623 |
|
| |
|
| |
|
162 |
|
|
| |
|
157 |
|
|
| |
|
7.876% due 03/15/2036 •(m) |
|
| |
|
6,000 |
|
|
| |
|
2,105 |
|
|
| |
|
| |
|
| |
|
1,396 |
|
|
| |
|
1,001 |
|
| |
|
| |
|
700 |
|
|
| |
|
36 |
|
3.555% due 08/15/2052 ~(m) |
|
| |
|
7,300 |
|
|
| |
|
6,601 |
|
4.029% due 03/15/2062 ~(m) |
|
| |
|
13,630 |
|
|
| |
|
10,184 |
|
|
BIG Commercial Mortgage Trust |
|
6.652% due 02/15/2039 •(m) |
|
| |
|
485 |
|
|
| |
|
480 |
|
|
| |
|
3.378% due 02/17/2055 ~(m) |
|
| |
|
7,850 |
|
|
| |
|
7,083 |
|
|
| |
|
0.000% due 10/16/2062 ~(m) |
|
GBP |
|
|
39,972 |
|
|
| |
|
50,032 |
|
| |
|
| |
|
20,785 |
|
|
| |
|
8,509 |
|
0.000% due 10/16/2062 (h) |
|
| |
|
5,795 |
|
|
| |
|
0 |
|
10.314% due 10/16/2062 •(m) |
|
| |
|
23,983 |
|
|
| |
|
32,786 |
|
13.314% due 10/16/2062 •(m) |
|
| |
|
11,991 |
|
|
| |
|
19,013 |
|
|
BSREP Commercial Mortgage Trust |
|
5.376% due 08/15/2038 •(m) |
|
$ |
|
|
6,135 |
|
|
| |
|
5,839 |
|
5.776% due 08/15/2038 •(m) |
|
| |
|
426 |
|
|
| |
|
380 |
|
|
|
|
|
|
|
|
|
|
|
|
|
| |
| |
|
|
|
PRINCIPAL
AMOUNT
(000S) |
|
|
|
|
MARKET
VALUE
(000S) |
|
|
| |
|
6.062% due 02/15/2037 •(m) |
|
$ |
|
|
3,300 |
|
|
$ |
|
|
2,219 |
|
|
BX Commercial Mortgage Trust |
|
6.276% due 11/15/2038 •(m) |
|
| |
|
19,182 |
|
|
| |
|
19,159 |
|
6.776% due 04/15/2034 •(m) |
|
| |
|
6,000 |
|
|
| |
|
5,687 |
|
6.776% due 02/15/2038 •(m) |
|
| |
|
1,878 |
|
|
| |
|
1,810 |
|
7.513% due 04/15/2034 •(m) |
|
| |
|
4,000 |
|
|
| |
|
3,694 |
|
|
| |
|
6.671% due 10/15/2036 •(m) |
|
| |
|
12,000 |
|
|
| |
|
11,979 |
|
6.854% due 10/15/2026 •(m) |
|
| |
|
1,212 |
|
|
| |
|
1,211 |
|
|
| |
|
3.957% due 03/10/2039 (m) |
|
| |
|
14,900 |
|
|
| |
|
14,086 |
|
|
CBA Commercial Small Balance Commercial Mortgage |
|
| |
|
| |
|
192 |
|
|
| |
|
184 |
|
|
| |
|
5.688% due 10/15/2048 (m) |
|
| |
|
1,122 |
|
|
| |
|
1,056 |
|
|
Chase Mortgage Finance Trust |
|
4.639% due 01/25/2036 ~(m) |
|
| |
|
2,539 |
|
|
| |
|
2,313 |
|
5.078% due 03/25/2037 ~(m) |
|
| |
|
805 |
|
|
| |
|
782 |
|
| |
|
| |
|
521 |
|
|
| |
|
173 |
|
| |
|
| |
|
503 |
|
|
| |
|
271 |
|
|
Citigroup Commercial Mortgage Trust |
|
| |
|
| |
|
8,111 |
|
|
| |
|
1,941 |
|
|
Citigroup Global Markets Mortgage Securities, Inc. |
|
| |
|
| |
|
87 |
|
|
| |
|
86 |
|
|
Citigroup Mortgage Loan Trust |
|
| |
|
| |
|
1,629 |
|
|
| |
|
60 |
|
3.979% due 07/25/2036 ~(m) |
|
| |
|
1,751 |
|
|
| |
|
1,025 |
|
4.682% due 10/25/2035 ~(m) |
|
| |
|
565 |
|
|
| |
|
535 |
|
4.783% due 09/25/2037 ~(m) |
|
| |
|
2,309 |
|
|
| |
|
2,131 |
|
| |
|
| |
|
238 |
|
|
| |
|
213 |
|
5.000% due 03/25/2037 ~(m) |
|
| |
|
1,562 |
|
|
| |
|
1,393 |
|
5.105% due 08/25/2034 ~(m) |
|
| |
|
4,574 |
|
|
| |
|
4,270 |
|
| |
|
| |
|
356 |
|
|
| |
|
330 |
|
| |
|
| |
|
165 |
|
|
| |
|
155 |
|
5.500% due 12/25/2035 (m) |
|
| |
|
1,875 |
|
|
| |
|
916 |
|
5.531% due 02/25/2036 ~(m) |
|
| |
|
3,663 |
|
|
| |
|
3,510 |
|
6.000% due 07/25/2036 (m) |
|
| |
|
3,913 |
|
|
| |
|
1,805 |
|
| |
|
| |
|
56 |
|
|
| |
|
56 |
|
| |
|
| |
|
816 |
|
|
| |
|
415 |
|
| |
|
| |
|
149 |
|
|
| |
|
152 |
|
|
Colony Mortgage Capital Ltd. |
|
6.352% due 11/15/2038 •(m) |
|
| |
|
2,020 |
|
|
| |
|
1,948 |
|
6.701% due 11/15/2038 •(m) |
|
| |
|
8,005 |
|
|
| |
|
7,661 |
|
7.397% due 11/15/2038 •(m) |
|
| |
|
15,475 |
|
|
| |
|
14,057 |
|
8.093% due 11/15/2038 •(m) |
|
| |
|
24,000 |
|
|
| |
|
20,748 |
|
|
| |
|
4.683% due 03/25/2067 ~(m) |
|
| |
|
4,900 |
|
|
| |
|
4,638 |
|
|
| |
|
2.819% due 01/10/2039 (m) |
|
| |
|
9,131 |
|
|
| |
|
8,689 |
|
8.576% due 12/15/2038 •(m) |
|
| |
|
10,004 |
|
|
| |
|
9,078 |
|
9.426% due 12/15/2038 •(m) |
|
| |
|
5,000 |
|
|
| |
|
4,378 |
|
10.426% due 12/15/2038 •(m) |
|
| |
|
3,360 |
|
|
| |
|
2,830 |
|
|
Connecticut Avenue Securities Trust |
|
9.805% due 12/25/2041 •(m) |
|
| |
|
5,966 |
|
|
| |
|
6,222 |
|
10.305% due 10/25/2041 •(m) |
|
| |
|
16,801 |
|
|
| |
|
17,555 |
|
10.305% due 12/25/2041 •(m) |
|
| |
|
1,100 |
|
|
| |
|
1,156 |
|
|
Countrywide Alternative Loan Resecuritization Trust |
|
| |
|
| |
|
5,021 |
|
|
| |
|
857 |
|
|
Countrywide Alternative Loan Trust |
|
0.825% due 12/25/2035 ~(a) |
|
| |
|
7,136 |
|
|
| |
|
294 |
|
1.809% due 12/25/2035 ~(a) |
|
| |
|
2,513 |
|
|
| |
|
189 |
|
2.716% due 07/25/2036 •(a)(m) |
|
|
6,557 |
|
|
| |
|
1,229 |
|
| |
|
| |
|
66 |
|
|
| |
|
59 |
|
| |
|
| |
|
333 |
|
|
| |
|
286 |
|
| |
|
| |
|
472 |
|
|
| |
|
395 |
|
4.784% due 05/25/2036 •(m) |
|
| |
|
1,158 |
|
|
| |
|
316 |
|
| |
|
| |
|
735 |
|
|
| |
|
293 |
|
4.794% due 05/25/2036 •(m) |
|
| |
|
5,926 |
|
|
| |
|
5,538 |
|
4.814% due 09/25/2046 •(m) |
|
| |
|
4,686 |
|
|
| |
|
4,362 |
|
4.854% due 08/25/2047 •(m) |
|
| |
|
714 |
|
|
| |
|
597 |
|
4.874% due 05/25/2047 •(m) |
|
| |
|
3,269 |
|
|
| |
|
2,450 |
|
4.894% due 03/25/2036 •(m) |
|
| |
|
6,238 |
|
|
| |
|
6,155 |
|
4.934% due 06/25/2037 •(m) |
|
| |
|
4,920 |
|
|
| |
|
4,091 |
|
4.954% due 07/25/2036 •(m) |
|
| |
|
6,714 |
|
|
| |
|
5,787 |
|
| |
|
| |
|
53 |
|
|
| |
|
49 |
|
|
|
|
|
|
|
| |
82 |
|
PIMCO CLOSED-END FUNDS |
|
|
See Accompanying Notes |
|
|
|
|
|
|
|
|
|
|
|
|
|
| |
| |
|
|
|
PRINCIPAL
AMOUNT
(000S) |
|
|
|
|
MARKET
VALUE
(000S) |
|
5.114% due 09/25/2035 •(m) |
|
$ |
|
|
2,352 |
|
|
$ |
|
|
1,533 |
|
| |
|
| |
|
81 |
|
|
| |
|
60 |
|
| |
|
| |
|
393 |
|
|
| |
|
230 |
|
5.249% due 11/25/2046 •(m) |
|
| |
|
2,022 |
|
|
| |
|
1,819 |
|
5.372% due 05/25/2036 ~(m) |
|
| |
|
1,615 |
|
|
| |
|
1,540 |
|
| |
|
| |
|
702 |
|
|
| |
|
355 |
|
| |
|
| |
|
96 |
|
|
| |
|
62 |
|
| |
|
| |
|
1,354 |
|
|
| |
|
747 |
|
5.500% due 11/25/2035 (m) |
|
| |
|
1,221 |
|
|
| |
|
697 |
|
| |
|
| |
|
689 |
|
|
| |
|
347 |
|
| |
|
| |
|
53 |
|
|
| |
|
51 |
|
| |
|
| |
|
807 |
|
|
| |
|
460 |
|
5.500% due 02/25/2036 (m) |
|
| |
|
701 |
|
|
| |
|
476 |
|
5.500% due 05/25/2036 (m) |
|
| |
|
2,896 |
|
|
| |
|
2,364 |
|
5.500% due 04/25/2037 (m) |
|
| |
|
1,447 |
|
|
| |
|
668 |
|
| |
|
| |
|
13 |
|
|
| |
|
11 |
|
5.709% due 07/20/2035 •(m) |
|
| |
|
3,581 |
|
|
| |
|
3,223 |
|
| |
|
| |
|
122 |
|
|
| |
|
60 |
|
| |
|
| |
|
141 |
|
|
| |
|
53 |
|
5.750% due 01/25/2037 (m) |
|
| |
|
7,281 |
|
|
| |
|
3,501 |
|
5.750% due 04/25/2037 (m) |
|
| |
|
821 |
|
|
| |
|
681 |
|
5.894% due 11/25/2035 •(m) |
|
| |
|
6,701 |
|
|
| |
|
6,233 |
|
| |
|
| |
|
282 |
|
|
| |
|
127 |
|
| |
|
| |
|
315 |
|
|
| |
|
45 |
|
| |
|
| |
|
605 |
|
|
| |
|
268 |
|
| |
|
| |
|
214 |
|
|
| |
|
109 |
|
| |
|
| |
|
205 |
|
|
| |
|
109 |
|
| |
|
| |
|
667 |
|
|
| |
|
261 |
|
6.000% due 01/25/2037 (m) |
|
| |
|
728 |
|
|
| |
|
432 |
|
| |
|
| |
|
537 |
|
|
| |
|
445 |
|
| |
|
| |
|
2,107 |
|
|
| |
|
771 |
|
6.000% due 03/25/2037 (m) |
|
| |
|
10,310 |
|
|
| |
|
3,830 |
|
6.000% due 04/25/2037 (m) |
|
| |
|
8,737 |
|
|
| |
|
3,889 |
|
6.000% due 09/25/2037 (m) |
|
| |
|
7,432 |
|
|
| |
|
2,411 |
|
| |
|
| |
|
496 |
|
|
| |
|
204 |
|
| |
|
| |
|
339 |
|
|
| |
|
156 |
|
6.500% due 11/25/2036 (m) |
|
| |
|
8,376 |
|
|
| |
|
2,481 |
|
| |
|
| |
|
49 |
|
|
| |
|
44 |
|
| |
|
| |
|
649 |
|
|
| |
|
548 |
|
|
Countrywide Home Loan Mortgage Pass-Through Trust |
|
| |
|
| |
|
2 |
|
|
| |
|
2 |
|
3.938% due 03/25/2037 ~(m) |
|
| |
|
2,612 |
|
|
| |
|
2,215 |
|
4.627% due 11/20/2035 ~(m) |
|
| |
|
3,971 |
|
|
| |
|
3,705 |
|
4.699% due 05/20/2036 ~(m) |
|
| |
|
287 |
|
|
| |
|
268 |
|
| |
|
| |
|
19 |
|
|
| |
|
18 |
|
| |
|
| |
|
19 |
|
|
| |
|
7 |
|
| |
|
| |
|
146 |
|
|
| |
|
84 |
|
| |
|
| |
|
27 |
|
|
| |
|
4 |
|
5.199% due 11/25/2035 ~(m) |
|
| |
|
651 |
|
|
| |
|
540 |
|
5.313% due 09/25/2047 ~(m) |
|
| |
|
1,569 |
|
|
| |
|
1,236 |
|
5.397% due 09/20/2036 ~(m) |
|
| |
|
1,572 |
|
|
| |
|
1,404 |
|
| |
|
| |
|
38 |
|
|
| |
|
39 |
|
| |
|
| |
|
28 |
|
|
| |
|
15 |
|
| |
|
| |
|
23 |
|
|
| |
|
12 |
|
5.558% due 06/25/2047 ~(m) |
|
| |
|
935 |
|
|
| |
|
920 |
|
| |
|
| |
|
142 |
|
|
| |
|
62 |
|
6.000% due 08/25/2037 (m) |
|
| |
|
2,971 |
|
|
| |
|
1,271 |
|
| |
|
| |
|
1 |
|
|
| |
|
1 |
|
6.304% due 03/25/2046 •(m) |
|
| |
|
14,966 |
|
|
| |
|
11,191 |
|
|
Credit Suisse Commercial Mortgage Trust |
|
| |
|
| |
|
489 |
|
|
| |
|
472 |
|
|
Credit Suisse First Boston Mortgage Securities Corp. |
|
| |
|
| |
|
235 |
|
|
| |
|
138 |
|
| |
|
| |
|
562 |
|
|
| |
|
595 |
|
|
Credit Suisse Mortgage Capital Mortgage-Backed Trust |
|
0.230% due 01/25/2060 ~(a) |
|
| |
|
199,087 |
|
|
| |
|
1,753 |
|
1.198% due 01/25/2060 ~(a) |
|
| |
|
240,873 |
|
|
| |
|
8,058 |
|
1.981% due 02/27/2047 ~(m) |
|
| |
|
29,778 |
|
|
| |
|
10,969 |
|
| |
|
| |
|
12,165 |
|
|
| |
|
5,644 |
|
| |
|
| |
|
7,541 |
|
|
| |
|
4,192 |
|
3.844% due 04/28/2037 ~(m) |
|
| |
|
1,329 |
|
|
| |
|
1,228 |
|
| |
|
| |
|
2,500 |
|
|
| |
|
420 |
|
4.016% due 05/26/2036 ~(m) |
|
| |
|
2,356 |
|
|
| |
|
2,008 |
|
4.144% due 05/27/2036 ~(m) |
|
| |
|
1,031 |
|
|
| |
|
867 |
|
4.308% due 12/29/2037 ~(m) |
|
| |
|
2,600 |
|
|
| |
|
1,350 |
|
4.328% due 09/26/2047 ~(m) |
|
| |
|
15,189 |
|
|
| |
|
6,977 |
|
4.520% due 04/26/2035 ~(m) |
|
| |
|
5,701 |
|
|
| |
|
5,196 |
|
4.752% due 10/26/2036 ~(m) |
|
| |
|
7,962 |
|
|
| |
|
7,432 |
|
4.967% due 07/26/2037 ~(m) |
|
| |
|
4,792 |
|
|
| |
|
4,330 |
|
5.029% due 06/25/2036 ~(m) |
|
| |
|
2,378 |
|
|
| |
|
2,157 |
|
|
|
|
|
|
|
|
|
|
|
|
|
| |
| |
|
|
|
PRINCIPAL
AMOUNT
(000S) |
|
|
|
|
MARKET
VALUE
(000S) |
|
| |
|
$ |
|
|
406 |
|
|
$ |
|
|
62 |
|
5.735% due 01/15/2049 ~(m) |
|
| |
|
10,300 |
|
|
| |
|
8,073 |
|
5.750% due 05/26/2037 (m) |
|
| |
|
10,120 |
|
|
| |
|
4,536 |
|
5.826% due 07/15/2038 •(m) |
|
| |
|
1,000 |
|
|
| |
|
902 |
|
| |
|
| |
|
1,669 |
|
|
| |
|
771 |
|
6.344% due 07/15/2032 •(m) |
|
| |
|
3,121 |
|
|
| |
|
3,104 |
|
6.396% due 04/25/2036 (m) |
|
| |
|
4,044 |
|
|
| |
|
2,110 |
|
| |
|
| |
|
2,662 |
|
|
| |
|
872 |
|
6.500% due 07/26/2036 (m) |
|
| |
|
11,413 |
|
|
| |
|
2,429 |
|
7.000% due 08/26/2036 (m) |
|
| |
|
14,223 |
|
|
| |
|
2,571 |
|
7.000% due 08/27/2036 (m) |
|
| |
|
2,931 |
|
|
| |
|
1,517 |
|
7.326% due 07/15/2038 •(m) |
|
| |
|
15,850 |
|
|
| |
|
6,139 |
|
7.744% due 07/15/2032 •(m) |
|
| |
|
7,454 |
|
|
| |
|
7,406 |
|
8.326% due 07/15/2038 •(m) |
|
| |
|
13,700 |
|
|
| |
|
1,677 |
|
8.794% due 07/15/2032 •(m) |
|
| |
|
15,000 |
|
|
| |
|
14,855 |
|
9.794% due 07/15/2032 •(m) |
|
| |
|
4,000 |
|
|
| |
|
3,887 |
|
27.401% due 11/25/2037 •(m) |
|
| |
|
6,553 |
|
|
| |
|
5,569 |
|
28.561% due 11/27/2037 •(m) |
|
| |
|
8,288 |
|
|
| |
|
7,132 |
|
|
CSAB Mortgage-Backed Trust |
|
5.500% due 05/25/2037 (m) |
|
| |
|
1,800 |
|
|
| |
|
1,200 |
|
|
| |
|
5.204% due 06/15/2033 •(m) |
|
| |
|
1,100 |
|
|
| |
|
1,054 |
|
5.389% due 06/15/2033 •(m) |
|
| |
|
1,600 |
|
|
| |
|
1,483 |
|
5.821% due 10/15/2036 •(m) |
|
| |
|
1,000 |
|
|
| |
|
991 |
|
7.576% due 10/15/2036 •(m) |
|
| |
|
26,404 |
|
|
| |
|
21,891 |
|
|
| |
|
3.791% due 12/10/2036 (m) |
|
| |
|
17,961 |
|
|
| |
|
17,484 |
|
|
Deutsche Alt-A Securities Mortgage Loan Trust |
|
| |
|
| |
|
288 |
|
|
| |
|
162 |
|
|
Deutsche Alt-A Securities, Inc. Mortgage Loan Trust |
|
| |
|
| |
|
392 |
|
|
| |
|
330 |
|
|
Deutsche Alt-B Securities Mortgage Loan Trust |
|
4.734% due 04/25/2037 •(m) |
|
| |
|
3,287 |
|
|
| |
|
2,317 |
|
| |
|
| |
|
32 |
|
|
| |
|
28 |
|
|
Deutsche Mortgage Securities, Inc. Mortgage Loan Trust |
|
| |
|
| |
|
53 |
|
|
| |
|
54 |
|
|
| |
|
3.704% due 05/10/2041 ~(m) |
|
| |
|
29,000 |
|
|
| |
|
22,066 |
|
|
| |
|
| |
|
| |
|
184 |
|
|
| |
|
180 |
|
|
Ellington Financial Mortgage Trust |
|
0.000% due 02/25/2068 ~(a) |
|
| |
|
232,465 |
|
|
| |
|
3,250 |
|
0.250% due 02/25/2068 ~(a) |
|
| |
|
232,465 |
|
|
| |
|
199 |
|
6.746% due 02/25/2068 ~(m) |
|
| |
|
29,973 |
|
|
| |
|
29,222 |
|
|
| |
|
| |
|
GBP |
|
|
6 |
|
|
| |
|
776 |
|
2.793% due 03/13/2045 •(m) |
|
EUR |
|
|
7,067 |
|
|
| |
|
7,206 |
|
5.608% (BP0003M + 1.250%) due 06/13/2045 ~(m) |
|
GBP |
|
|
14,072 |
|
|
| |
|
16,876 |
|
5.958% due 09/13/2045 •(m) |
|
| |
|
15,554 |
|
|
| |
|
19,922 |
|
6.108% (BP0003M + 1.750%) due 06/13/2045 ~(m) |
|
| |
|
8,667 |
|
|
| |
|
9,722 |
|
6.608% due 09/13/2045 •(m) |
|
| |
|
11,113 |
|
|
| |
|
13,595 |
|
7.858% (BP0003M + 3.500%) due 06/13/2045 ~(m) |
|
| |
|
3,082 |
|
|
| |
|
3,206 |
|
8.208% due 09/13/2045 •(m) |
|
| |
|
9,266 |
|
|
| |
|
12,674 |
|
|
Extended Stay America Trust |
|
8.126% due 07/15/2038 •(m) |
|
$ |
|
|
39,370 |
|
|
| |
|
39,437 |
|
|
First Horizon Alternative Mortgage Securities Trust |
|
0.000% due 12/26/2049 (b) |
|
| |
|
2 |
|
|
| |
|
0 |
|
2.666% due 11/25/2036 •(a) |
|
| |
|
720 |
|
|
| |
|
80 |
|
| |
|
| |
|
24 |
|
|
| |
|
17 |
|
| |
|
| |
|
370 |
|
|
| |
|
310 |
|
| |
|
| |
|
355 |
|
|
| |
|
246 |
|
| |
|
| |
|
56 |
|
|
| |
|
3 |
|
| |
|
| |
|
55 |
|
|
| |
|
14 |
|
|
First Horizon Mortgage Pass-Through Trust |
|
| |
|
| |
|
8 |
|
|
| |
|
4 |
|
| |
|
| |
|
177 |
|
|
| |
|
89 |
|
| |
|
| |
|
2,248 |
|
|
| |
|
941 |
|
| |
|
| |
|
213 |
|
|
| |
|
72 |
|
|
GC Pastor Hipotecario FTA |
|
2.206% due 06/21/2046 •(m) |
|
EUR |
|
|
12,068 |
|
|
| |
|
13,093 |
|
|
GMACM Mortgage Loan Trust |
|
| |
|
$ |
|
|
16 |
|
|
| |
|
13 |
|
|
GreenPoint Mortgage Funding Trust |
|
| |
|
| |
|
443 |
|
|
| |
|
406 |
|
4.834% due 12/25/2046 •(m) |
|
| |
|
2,130 |
|
|
| |
|
2,078 |
|
|
|
|
|
|
|
|
|
|
|
|
|
| |
| |
|
|
|
PRINCIPAL
AMOUNT
(000S) |
|
|
|
|
MARKET
VALUE
(000S) |
|
|
GS Mortgage Securities Corp. Trust |
|
5.559% due 07/15/2035 •(m) |
|
$ |
|
|
1,298 |
|
|
$ |
|
|
870 |
|
7.159% due 11/15/2032 •(m) |
|
| |
|
10,358 |
|
|
| |
|
10,240 |
|
|
GS Mortgage Securities Trust |
|
0.533% due 08/10/2043 ~(a) |
|
| |
|
972 |
|
|
| |
|
0 |
|
|
GS Mortgage-Backed Securities Trust |
|
0.000% due 07/25/2059 ~(a) |
|
| |
|
221,918 |
|
|
| |
|
2,114 |
|
3.781% due 07/25/2059 ~(m) |
|
| |
|
20,073 |
|
|
| |
|
13,436 |
|
|
GSC Capital Corp. Mortgage Trust |
|
4.794% due 05/25/2036 •(m) |
|
| |
|
863 |
|
|
| |
|
827 |
|
|
| |
|
| |
|
| |
|
242 |
|
|
| |
|
228 |
|
| |
|
| |
|
228 |
|
|
| |
|
52 |
|
| |
|
| |
|
7 |
|
|
| |
|
7 |
|
| |
|
| |
|
214 |
|
|
| |
|
219 |
|
| |
|
| |
|
591 |
|
|
| |
|
152 |
|
| |
|
| |
|
115 |
|
|
| |
|
60 |
|
|
HarborView Mortgage Loan Trust |
|
| |
|
| |
|
37 |
|
|
| |
|
31 |
|
| |
|
| |
|
896 |
|
|
| |
|
410 |
|
4.812% due 02/19/2046 •(m) |
|
| |
|
618 |
|
|
| |
|
576 |
|
4.852% due 11/19/2036 •(m) |
|
| |
|
476 |
|
|
| |
|
436 |
|
4.912% due 03/19/2036 •(m) |
|
| |
|
5,884 |
|
|
| |
|
5,382 |
|
4.932% due 01/19/2036 •(m) |
|
| |
|
3,932 |
|
|
| |
|
2,555 |
|
| |
|
| |
|
62 |
|
|
| |
|
56 |
|
| |
|
| |
|
92 |
|
|
| |
|
74 |
|
5.407% due 06/20/2035 •(m) |
|
| |
|
3,095 |
|
|
| |
|
2,806 |
|
| |
|
| |
|
714 |
|
|
| |
|
637 |
|
|
| |
|
| |
|
| |
|
1,000 |
|
|
| |
|
850 |
|
|
| |
|
4.705% due 04/25/2037 ~(m) |
|
| |
|
1,925 |
|
|
| |
|
1,739 |
|
4.934% due 03/25/2035 •(m) |
|
| |
|
2,861 |
|
|
| |
|
2,317 |
|
|
HSI Asset Loan Obligation Trust |
|
6.000% due 06/25/2037 (m) |
|
| |
|
1,411 |
|
|
| |
|
1,277 |
|
|
| |
|
2.176% due 03/22/2044 •(m) |
|
EUR |
|
|
15,363 |
|
|
| |
|
16,183 |
|
|
| |
|
2.176% due 03/22/2043 •(m) |
|
| |
|
9,723 |
|
|
| |
|
10,112 |
|
|
| |
|
| |
|
$ |
|
|
72 |
|
|
| |
|
64 |
|
| |
|
| |
|
27 |
|
|
| |
|
26 |
|
|
Impac Secured Assets Corp. |
|
5.294% due 03/25/2036 •(m) |
|
| |
|
807 |
|
|
| |
|
709 |
|
|
Impac Secured Assets Trust |
|
| |
|
| |
|
2 |
|
|
| |
|
1 |
|
|
IndyMac IMSC Mortgage Loan Trust |
|
3.886% due 06/25/2037 ~(m) |
|
| |
|
2,498 |
|
|
| |
|
1,521 |
|
|
IndyMac INDA Mortgage Loan Trust |
|
| |
|
| |
|
13 |
|
|
| |
|
11 |
|
| |
|
| |
|
360 |
|
|
| |
|
279 |
|
|
IndyMac INDX Mortgage Loan Trust |
|
| |
|
| |
|
123 |
|
|
| |
|
100 |
|
| |
|
| |
|
185 |
|
|
| |
|
166 |
|
3.341% due 05/25/2037 ~(m) |
|
| |
|
1,410 |
|
|
| |
|
1,132 |
|
3.961% due 11/25/2035 ~(m) |
|
| |
|
1,987 |
|
|
| |
|
1,884 |
|
4.057% due 06/25/2036 ~(m) |
|
| |
|
476 |
|
|
| |
|
418 |
|
4.170% due 11/25/2036 ~(m) |
|
| |
|
461 |
|
|
| |
|
435 |
|
4.834% due 11/25/2046 •(m) |
|
| |
|
2,872 |
|
|
| |
|
2,725 |
|
| |
|
| |
|
87 |
|
|
| |
|
82 |
|
| |
|
| |
|
29 |
|
|
| |
|
27 |
|
4.934% due 02/25/2037 •(m) |
|
| |
|
1,866 |
|
|
| |
|
1,242 |
|
| |
|
| |
|
285 |
|
|
| |
|
187 |
|
| |
|
| |
|
93 |
|
|
| |
|
85 |
|
| |
|
| |
|
163 |
|
|
| |
|
142 |
|
|
Jefferies Resecuritization Trust |
|
| |
|
| |
|
3,442 |
|
|
| |
|
890 |
|
|
JP Morgan Alternative Loan Trust |
|
| |
|
| |
|
530 |
|
|
| |
|
295 |
|
4.834% due 06/25/2037 •(m) |
|
| |
|
20,793 |
|
|
| |
|
7,751 |
|
4.939% due 06/27/2037 •(m) |
|
| |
|
4,142 |
|
|
| |
|
2,497 |
|
| |
|
| |
|
39 |
|
|
| |
|
48 |
|
| |
|
| |
|
8 |
|
|
| |
|
3 |
|
5.888% due 06/27/2037 ~(m) |
|
| |
|
13,002 |
|
|
| |
|
6,291 |
|
| |
|
| |
|
482 |
|
|
| |
|
322 |
|
6.460% due 12/25/2036 (m) |
|
| |
|
1,341 |
|
|
| |
|
1,349 |
|
|
|
|
|
|
|
|
|
|
|
|
|
| |
| See Accompanying Notes |
|
|
ANNUAL REPORT |
|
|
| |
|
|
JUNE 30, 2025 |
|
|
83 |
|
|
|
|
|
|
| |
Consolidated Schedule of Investments |
|
PIMCO Dynamic Income Fund |
|
|
|
|
|
|
|
|
|
|
|
|
|
|
|
|
| |
| |
|
|
|
PRINCIPAL
AMOUNT
(000S) |
|
|
|
|
MARKET
VALUE
(000S) |
|
|
JP Morgan Chase Commercial Mortgage Securities Trust |
|
| |
|
$ |
|
|
6,660 |
|
|
$ |
|
|
6,032 |
|
2.287% due 03/05/2042 (m) |
|
| |
|
2,210 |
|
|
| |
|
2,041 |
|
| |
|
| |
|
2,850 |
|
|
| |
|
520 |
|
4.128% due 07/05/2031 (m) |
|
| |
|
3,360 |
|
|
| |
|
3,089 |
|
4.248% due 07/05/2033 (m) |
|
| |
|
6,360 |
|
|
| |
|
6,043 |
|
4.379% due 07/05/2031 (m) |
|
| |
|
13,293 |
|
|
| |
|
10,452 |
|
5.158% due 04/15/2037 •(m) |
|
| |
|
976 |
|
|
| |
|
966 |
|
5.669% due 04/15/2037 •(m) |
|
| |
|
1,464 |
|
|
| |
|
1,440 |
|
5.805% due 07/05/2033 •(m) |
|
| |
|
3,000 |
|
|
| |
|
2,615 |
|
| |
|
| |
|
7,905 |
|
|
| |
|
2,034 |
|
6.176% due 03/15/2036 •(m) |
|
| |
|
7,900 |
|
|
| |
|
5,750 |
|
| |
|
| |
|
3,030 |
|
|
| |
|
136 |
|
6.516% due 06/15/2038 •(m) |
|
| |
|
2,000 |
|
|
| |
|
1,825 |
|
| |
|
| |
|
699 |
|
|
| |
|
663 |
|
| |
|
| |
|
4,800 |
|
|
| |
|
46 |
|
7.235% due 10/05/2040 (m) |
|
| |
|
1,000 |
|
|
| |
|
1,065 |
|
7.609% due 02/15/2035 •(m) |
|
| |
|
13,987 |
|
|
| |
|
13,332 |
|
8.091% due 11/15/2038 •(m) |
|
| |
|
9,000 |
|
|
| |
|
8,856 |
|
8.841% due 11/15/2038 •(m) |
|
| |
|
1,500 |
|
|
| |
|
1,469 |
|
9.836% due 11/15/2038 •(m) |
|
| |
|
22,700 |
|
|
| |
|
21,796 |
|
|
| |
|
| |
|
| |
|
217 |
|
|
| |
|
121 |
|
| |
|
| |
|
11 |
|
|
| |
|
8 |
|
| |
|
| |
|
154 |
|
|
| |
|
126 |
|
4.682% due 06/25/2037 ~(m) |
|
| |
|
1,388 |
|
|
| |
|
1,098 |
|
| |
|
| |
|
13 |
|
|
| |
|
12 |
|
| |
|
| |
|
325 |
|
|
| |
|
141 |
|
|
JP Morgan Resecuritization Trust |
|
6.000% due 09/26/2036 ~(m) |
|
| |
|
860 |
|
|
| |
|
659 |
|
6.500% due 04/26/2036 ~(m) |
|
| |
|
3,825 |
|
|
| |
|
1,076 |
|
| |
|
| |
|
214 |
|
|
| |
|
206 |
|
|
Lansdowne Mortgage Securities PLC |
|
2.315% due 09/16/2048 •(m) |
|
EUR |
|
|
4,414 |
|
|
| |
|
4,962 |
|
| |
|
| |
|
900 |
|
|
| |
|
881 |
|
|
| |
|
6.000% due 11/26/2036 (m) |
|
$ |
|
|
5,486 |
|
|
| |
|
5,287 |
|
6.250% due 10/26/2036 (m) |
|
| |
|
3,393 |
|
|
| |
|
1,538 |
|
|
| |
|
| |
|
| |
|
166 |
|
|
| |
|
104 |
|
| |
|
| |
|
414 |
|
|
| |
|
313 |
|
| |
|
| |
|
324 |
|
|
| |
|
149 |
|
| |
|
| |
|
303 |
|
|
| |
|
296 |
|
| |
|
| |
|
3,133 |
|
|
| |
|
1,162 |
|
7.250% due 09/25/2037 (m) |
|
| |
|
30,803 |
|
|
| |
|
8,894 |
|
|
| |
|
4.994% due 07/25/2037 •(m) |
|
| |
|
22,505 |
|
|
| |
|
16,024 |
|
| |
|
| |
|
189 |
|
|
| |
|
169 |
|
5.434% due 07/25/2047 •(m) |
|
| |
|
3,349 |
|
|
| |
|
3,091 |
|
|
MASTR Adjustable Rate Mortgages Trust |
|
| |
|
| |
|
156 |
|
|
| |
|
143 |
|
5.114% due 05/25/2047 •(m) |
|
| |
|
6,573 |
|
|
| |
|
5,366 |
|
|
MASTR Alternative Loan Trust |
|
4.784% due 03/25/2036 •(m) |
|
| |
|
19,917 |
|
|
| |
|
1,844 |
|
4.834% due 03/25/2036 •(m) |
|
| |
|
26,326 |
|
|
| |
|
2,468 |
|
7.000% due 10/25/2047 (m) |
|
| |
|
10,521 |
|
|
| |
|
4,119 |
|
|
Merrill Lynch Alternative Note Asset Trust |
|
6.000% due 05/25/2037 (m) |
|
| |
|
2,167 |
|
|
| |
|
1,676 |
|
|
Merrill Lynch Mortgage Investors Trust |
|
4.448% due 03/25/2036 ~(m) |
|
| |
|
5,350 |
|
|
| |
|
2,652 |
|
5.497% due 05/25/2036 ~(m) |
|
| |
|
817 |
|
|
| |
|
772 |
|
|
| |
|
| |
|
| |
|
475 |
|
|
| |
|
466 |
|
8.532% due 12/15/2034 •(m) |
|
| |
|
2,750 |
|
|
| |
|
2,688 |
|
|
| |
|
4.039% due 04/25/2065 ~(m) |
|
| |
|
14,456 |
|
|
| |
|
13,922 |
|
|
Mill City Mortgage Loan Trust |
|
0.000% due 08/25/2058 ~(a) |
|
| |
|
45,977 |
|
|
| |
|
206 |
|
| |
|
| |
|
45,977 |
|
|
| |
|
3 |
|
0.000% due 08/25/2059 ~(a) |
|
| |
|
29,743 |
|
|
| |
|
596 |
|
0.000% due 11/25/2060 ~(a) |
|
| |
|
123,821 |
|
|
| |
|
3,155 |
|
0.000% due 04/25/2066 ~(a) |
|
| |
|
67,510 |
|
|
| |
|
310 |
|
0.000% due 04/25/2066 (a) |
|
| |
|
67,510 |
|
|
| |
|
17 |
|
0.080% due 08/25/2059 ~(a) |
|
| |
|
26,373 |
|
|
| |
|
142 |
|
3.074% due 04/25/2066 ~(m) |
|
| |
|
7,230 |
|
|
| |
|
4,736 |
|
| |
|
| |
|
5,324 |
|
|
| |
|
2,735 |
|
3.250% due 08/25/2058 ~(m) |
|
| |
|
2,759 |
|
|
| |
|
1,944 |
|
|
|
|
|
|
|
|
|
|
|
|
|
| |
| |
|
|
|
PRINCIPAL
AMOUNT
(000S) |
|
|
|
|
MARKET
VALUE
(000S) |
|
3.250% due 08/25/2059 ~(m) |
|
$ |
|
|
5,987 |
|
|
$ |
|
|
4,730 |
|
3.678% due 08/25/2058 ~(m) |
|
| |
|
2,759 |
|
|
| |
|
1,716 |
|
| |
|
| |
|
2,668 |
|
|
| |
|
1,413 |
|
| |
|
| |
|
3,865 |
|
|
| |
|
2,112 |
|
3.864% due 08/25/2059 ~(m) |
|
| |
|
1,532 |
|
|
| |
|
1,071 |
|
| |
|
| |
|
4,064 |
|
|
| |
|
2,227 |
|
|
Morgan Stanley Capital Trust |
|
3.912% due 09/09/2032 (m) |
|
| |
|
25,312 |
|
|
| |
|
22,483 |
|
5.376% due 12/15/2036 •(m) |
|
| |
|
6,246 |
|
|
| |
|
5,031 |
|
| |
|
| |
|
11,300 |
|
|
| |
|
10,983 |
|
| |
|
| |
|
453 |
|
|
| |
|
87 |
|
| |
|
| |
|
6,000 |
|
|
| |
|
5,795 |
|
6.670% due 12/15/2036 •(m) |
|
| |
|
18,590 |
|
|
| |
|
855 |
|
6.809% due 11/15/2034 •(m) |
|
| |
|
6,183 |
|
|
| |
|
5,914 |
|
8.621% due 12/15/2038 •(m) |
|
| |
|
18,000 |
|
|
| |
|
15,292 |
|
9.520% due 12/15/2038 •(m) |
|
| |
|
19,500 |
|
|
| |
|
16,429 |
|
|
Morgan Stanley Mortgage Capital Holdings Trust |
|
| |
|
| |
|
1,780 |
|
|
| |
|
1,590 |
|
|
Morgan Stanley Mortgage Loan Trust |
|
| |
|
| |
|
1,254 |
|
|
| |
|
479 |
|
| |
|
| |
|
213 |
|
|
| |
|
202 |
|
| |
|
| |
|
138 |
|
|
| |
|
25 |
|
| |
|
| |
|
401 |
|
|
| |
|
330 |
|
| |
|
| |
|
152 |
|
|
| |
|
99 |
|
| |
|
| |
|
1,696 |
|
|
| |
|
450 |
|
| |
|
| |
|
136 |
|
|
| |
|
44 |
|
| |
|
| |
|
134 |
|
|
| |
|
118 |
|
|
Morgan Stanley Re-REMIC Trust |
|
3.262% due 02/26/2037 •(m) |
|
| |
|
1,643 |
|
|
| |
|
1,542 |
|
3.277% due 03/26/2037 (m) |
|
| |
|
997 |
|
|
| |
|
1,037 |
|
5.496% due 07/26/2035 ~(m) |
|
| |
|
3,905 |
|
|
| |
|
3,838 |
|
6.000% due 04/26/2036 (m) |
|
| |
|
5,640 |
|
|
| |
|
5,674 |
|
6.686% due 09/26/2035 ~(m) |
|
| |
|
232 |
|
|
| |
|
223 |
|
|
Morgan Stanley Resecuritization Trust |
|
5.682% due 06/26/2035 ~(m) |
|
| |
|
9,142 |
|
|
| |
|
6,734 |
|
|
Morgan Stanley Residential Mortgage Loan Trust |
|
0.325% due 01/25/2070 ~(a)(m) |
|
|
57,862 |
|
|
| |
|
343 |
|
0.375% due 12/25/2068 ~(a) |
|
| |
|
200,821 |
|
|
| |
|
720 |
|
1.358% due 01/25/2070 ~(a)(m) |
|
|
57,862 |
|
|
| |
|
1,992 |
|
1.560% due 12/25/2068 (a)(m) |
|
| |
|
200,821 |
|
|
| |
|
7,923 |
|
7.151% due 01/25/2070 ~(m) |
|
| |
|
1,900 |
|
|
| |
|
1,817 |
|
7.865% due 12/25/2068 ~(m) |
|
| |
|
4,006 |
|
|
| |
|
3,835 |
|
|
Mortgage Equity Conversion Asset Trust |
|
4.000% due 07/25/2060 (m) |
|
| |
|
1,124 |
|
|
| |
|
1,061 |
|
|
| |
|
7.558% due 03/13/2046 •(m) |
|
GBP |
|
|
1,000 |
|
|
| |
|
1,375 |
|
|
| |
|
| |
|
$ |
|
|
3,700 |
|
|
| |
|
377 |
|
|
| |
|
3.427% due 07/11/2039 ~(m) |
|
| |
|
21,938 |
|
|
| |
|
21,055 |
|
|
Natixis Commercial Mortgage Securities Trust |
|
| |
|
| |
|
10,000 |
|
|
| |
|
9,227 |
|
4.193% due 04/10/2037 ~(m) |
|
| |
|
5,880 |
|
|
| |
|
3,095 |
|
|
| |
|
5.948% due 04/15/2032 •(m) |
|
| |
|
1,200 |
|
|
| |
|
1,169 |
|
6.398% due 04/15/2032 •(m) |
|
| |
|
13,642 |
|
|
| |
|
13,262 |
|
|
New Residential Mortgage Loan Trust |
|
0.250% due 09/25/2064 ~(a) |
|
| |
|
578,980 |
|
|
| |
|
3,459 |
|
2.343% due 09/25/2064 ~(a)(m) |
|
| |
|
578,980 |
|
|
| |
|
24,378 |
|
3.846% due 11/25/2059 ~(m) |
|
| |
|
8,300 |
|
|
| |
|
4,888 |
|
7.674% due 09/25/2064 ~(m) |
|
| |
|
16,143 |
|
|
| |
|
14,485 |
|
|
New York Mortgage Trust Loan Trust |
|
5.250% due 07/25/2062 þ(m) |
|
| |
|
12,046 |
|
|
| |
|
12,041 |
|
6.558% due 08/25/2061 þ(m) |
|
| |
|
1,056 |
|
|
| |
|
1,045 |
|
|
| |
|
3.225% due 12/15/2050 •(m) |
|
EUR |
|
|
916 |
|
|
| |
|
1,049 |
|
3.475% due 12/15/2050 •(m) |
|
| |
|
1,750 |
|
|
| |
|
1,905 |
|
|
Nomura Asset Acceptance Corp. Alternative Loan Trust |
|
4.754% due 10/25/2036 •(m) |
|
$ |
|
|
854 |
|
|
| |
|
719 |
|
|
Nomura Resecuritization Trust |
|
4.464% due 09/26/2035 ~(m) |
|
| |
|
3,035 |
|
|
| |
|
2,671 |
|
|
NovaStar Mortgage Funding Trust |
|
| |
|
| |
|
95 |
|
|
| |
|
86 |
|
|
NYO Commercial Mortgage Trust |
|
5.521% due 11/15/2038 •(m) |
|
| |
|
2,000 |
|
|
| |
|
1,997 |
|
5.971% due 12/15/2038 •(m) |
|
| |
|
2,200 |
|
|
| |
|
2,187 |
|
|
|
|
|
|
|
|
|
|
|
|
|
| |
| |
|
|
|
PRINCIPAL
AMOUNT
(000S) |
|
|
|
|
MARKET
VALUE
(000S) |
|
|
| |
|
0.000% due 04/25/2065 «(h) |
|
$ |
|
|
16,164 |
|
|
$ |
|
|
14,215 |
|
|
| |
|
4.784% due 06/25/2036 •(m) |
|
| |
|
1,137 |
|
|
| |
|
821 |
|
| |
|
| |
|
29 |
|
|
| |
|
28 |
|
|
| |
|
| |
|
| |
|
993 |
|
|
| |
|
999 |
|
|
RBSSP Resecuritization Trust |
|
5.295% due 05/26/2037 ~(m) |
|
| |
|
2,747 |
|
|
| |
|
1,457 |
|
5.541% due 09/26/2035 ~(m) |
|
| |
|
2,932 |
|
|
| |
|
1,579 |
|
5.869% due 07/26/2045 ~(m) |
|
| |
|
8,285 |
|
|
| |
|
8,252 |
|
6.000% due 03/26/2036 ~(m) |
|
| |
|
3,309 |
|
|
| |
|
1,661 |
|
| |
|
| |
|
244 |
|
|
| |
|
218 |
|
|
| |
|
| |
|
| |
|
1 |
|
|
| |
|
1 |
|
|
Residential Accredit Loans, Inc. Trust |
|
| |
|
| |
|
258 |
|
|
| |
|
228 |
|
4.794% due 07/25/2036 •(m) |
|
| |
|
7,571 |
|
|
| |
|
2,457 |
|
4.814% due 05/25/2037 •(m) |
|
| |
|
5,940 |
|
|
| |
|
5,526 |
|
4.854% due 06/25/2037 •(m) |
|
| |
|
584 |
|
|
| |
|
517 |
|
5.399% due 01/25/2046 •(m) |
|
| |
|
2,571 |
|
|
| |
|
2,020 |
|
| |
|
| |
|
37 |
|
|
| |
|
30 |
|
6.000% due 08/25/2035 (m) |
|
| |
|
473 |
|
|
| |
|
420 |
|
6.000% due 12/25/2035 (m) |
|
| |
|
956 |
|
|
| |
|
830 |
|
| |
|
| |
|
123 |
|
|
| |
|
100 |
|
6.000% due 09/25/2036 (m) |
|
| |
|
2,781 |
|
|
| |
|
1,076 |
|
6.000% due 11/25/2036 (m) |
|
| |
|
1,229 |
|
|
| |
|
977 |
|
| |
|
| |
|
179 |
|
|
| |
|
143 |
|
6.250% due 02/25/2037 (m) |
|
| |
|
1,786 |
|
|
| |
|
1,482 |
|
6.500% due 09/25/2037 (m) |
|
| |
|
647 |
|
|
| |
|
540 |
|
7.000% due 10/25/2037 (m) |
|
| |
|
3,981 |
|
|
| |
|
3,182 |
|
|
Residential Asset Mortgage Products Trust |
|
| |
|
| |
|
202 |
|
|
| |
|
131 |
|
|
Residential Asset Securitization Trust |
|
| |
|
| |
|
550 |
|
|
| |
|
319 |
|
| |
|
| |
|
6,248 |
|
|
| |
|
1,622 |
|
| |
|
| |
|
167 |
|
|
| |
|
63 |
|
| |
|
| |
|
2,803 |
|
|
| |
|
843 |
|
6.000% due 07/25/2037 (m) |
|
| |
|
6,206 |
|
|
| |
|
2,284 |
|
| |
|
| |
|
4,048 |
|
|
| |
|
940 |
|
| |
|
| |
|
10,264 |
|
|
| |
|
2,884 |
|
| |
|
| |
|
10,334 |
|
|
| |
|
3,014 |
|
|
Residential Funding Mortgage Securities, Inc. Trust |
|
| |
|
| |
|
89 |
|
|
| |
|
71 |
|
| |
|
| |
|
40 |
|
|
| |
|
28 |
|
| |
|
| |
|
322 |
|
|
| |
|
247 |
|
| |
|
| |
|
144 |
|
|
| |
|
115 |
|
|
| |
|
| |
|
| |
|
2,162 |
|
|
| |
|
1,935 |
|
|
Seasoned Loans Structured Transaction Trust |
|
6.080% due 09/25/2060 «~(m) |
|
| |
|
254,897 |
|
|
| |
|
174,883 |
|
|
| |
|
| |
|
| |
|
70 |
|
|
| |
|
56 |
|
| |
|
| |
|
78 |
|
|
| |
|
15 |
|
| |
|
| |
|
98 |
|
|
| |
|
88 |
|
| |
|
| |
|
68 |
|
|
| |
|
58 |
|
| |
|
| |
|
159 |
|
|
| |
|
154 |
|
|
SFO Commercial Mortgage Trust |
|
5.576% due 05/15/2038 •(m) |
|
| |
|
18,150 |
|
|
| |
|
18,080 |
|
5.926% due 05/15/2038 •(m) |
|
| |
|
2,120 |
|
|
| |
|
2,107 |
|
6.226% due 05/15/2038 •(m) |
|
| |
|
1,760 |
|
|
| |
|
1,737 |
|
|
SG Commercial Mortgage Securities Trust |
|
4.660% due 02/15/2041 ~(m) |
|
| |
|
9,000 |
|
|
| |
|
7,317 |
|
|
SMRT Commercial Mortgage Trust |
|
7.012% due 01/15/2039 •(m) |
|
| |
|
30,200 |
|
|
| |
|
29,730 |
|
|
| |
|
2.786% due 08/10/2038 ~(m) |
|
| |
|
8,160 |
|
|
| |
|
6,380 |
|
| |
|
| |
|
3,500 |
|
|
| |
|
2,412 |
|
|
Starwood Mortgage Residential Trust |
|
| |
|
| |
|
100 |
|
|
| |
|
77 |
|
3.935% due 11/25/2066 ~(m) |
|
| |
|
400 |
|
|
| |
|
295 |
|
|
| |
|
7.576% due 04/15/2034 •(m) |
|
| |
|
13,424 |
|
|
| |
|
13,037 |
|
8.576% due 04/15/2034 •(m) |
|
| |
|
6,612 |
|
|
| |
|
6,591 |
|
|
| |
|
6.237% due 02/25/2053 •(m) |
|
GBP |
|
|
1,967 |
|
|
| |
|
2,669 |
|
|
|
|
|
|
|
| |
84 |
|
PIMCO CLOSED-END FUNDS |
|
|
See Accompanying Notes |
|
|
|
|
|
|
|
|
|
|
|
|
|
| |
| |
|
|
|
PRINCIPAL
AMOUNT
(000S) |
|
|
|
|
MARKET
VALUE
(000S) |
|
6.987% due 02/25/2053 •(m) |
|
GBP |
|
|
4,300 |
|
|
$ |
|
|
5,830 |
|
|
Stratton Mortgage Funding PLC |
|
0.000% due 06/28/2050 (b)(h) |
|
| |
|
3,433 |
|
|
| |
|
3,666 |
|
0.000% due 06/28/2050 (h) |
|
| |
|
0 |
|
|
| |
|
310 |
|
0.000% due 06/20/2060 (b)(h) |
|
| |
|
3,784 |
|
|
| |
|
4,008 |
|
0.000% due 06/20/2060 (h) |
|
| |
|
0 |
|
|
| |
|
2,048 |
|
| |
|
| |
|
7 |
|
|
| |
|
10 |
|
| |
|
| |
|
378 |
|
|
| |
|
514 |
|
| |
|
| |
|
291 |
|
|
| |
|
390 |
|
| |
|
| |
|
378 |
|
|
| |
|
525 |
|
|
Structured Adjustable Rate Mortgage Loan Trust |
|
4.159% due 02/25/2037 ~(m) |
|
$ |
|
|
4,558 |
|
|
| |
|
3,000 |
|
4.361% due 03/25/2036 ~(m) |
|
| |
|
21,347 |
|
|
| |
|
12,148 |
|
| |
|
| |
|
510 |
|
|
| |
|
282 |
|
| |
|
| |
|
2,256 |
|
|
| |
|
387 |
|
| |
|
| |
|
990 |
|
|
| |
|
375 |
|
|
Structured Asset Mortgage Investments Trust |
|
| |
|
| |
|
675 |
|
|
| |
|
59 |
|
4.814% due 07/25/2046 •(m) |
|
| |
|
7,726 |
|
|
| |
|
5,370 |
|
4.854% due 05/25/2036 •(m) |
|
| |
|
1,293 |
|
|
| |
|
902 |
|
4.854% due 08/25/2036 •(m) |
|
| |
|
643 |
|
|
| |
|
525 |
|
| |
|
| |
|
2,610 |
|
|
| |
|
1,132 |
|
| |
|
| |
|
44 |
|
|
| |
|
42 |
|
|
Structured Asset Securities Corp. Mortgage Pass-Through Certificates |
|
| |
|
| |
|
59 |
|
|
| |
|
58 |
|
|
SunTrust Adjustable Rate Mortgage Loan Trust |
|
6.615% due 02/25/2037 ~(m) |
|
| |
|
720 |
|
|
| |
|
664 |
|
|
SunTrust Alternative Loan Trust |
|
2.716% due 04/25/2036 •(a) |
|
| |
|
3,884 |
|
|
| |
|
586 |
|
|
TBW Mortgage-Backed Trust |
|
| |
|
| |
|
204 |
|
|
| |
|
70 |
|
6.500% due 07/25/2036 (m) |
|
| |
|
18,349 |
|
|
| |
|
3,881 |
|
|
| |
|
2.361% due 10/28/2050 •(m) |
|
EUR |
|
|
7,368 |
|
|
| |
|
4,533 |
|
2.559% due 12/28/2050 •(m) |
|
| |
|
4,877 |
|
|
| |
|
5,175 |
|
|
Towd Point Mortgage Trust |
|
0.000% due 12/25/2058 (b)(h) |
|
$ |
|
|
46,198 |
|
|
| |
|
5,748 |
|
0.000% due 12/25/2058 (a) |
|
| |
|
512,064 |
|
|
| |
|
0 |
|
0.000% due 10/25/2059 (a)(k) |
|
| |
|
321,443 |
|
|
| |
|
0 |
|
0.000% due 01/25/2060 (a) |
|
| |
|
65,368 |
|
|
| |
|
533 |
|
| |
|
| |
|
16,331 |
|
|
| |
|
9,145 |
|
| |
|
| |
|
818 |
|
|
| |
|
757 |
|
| |
|
| |
|
5,365 |
|
|
| |
|
4,547 |
|
| |
|
| |
|
3,136 |
|
|
| |
|
2,289 |
|
|
| |
|
6.826% due 03/15/2038 •(m) |
|
| |
|
8,503 |
|
|
| |
|
8,516 |
|
|
| |
|
5.326% due 07/15/2039 •(m) |
|
| |
|
1,000 |
|
|
| |
|
973 |
|
8.326% due 07/15/2039 •(m) |
|
| |
|
4,435 |
|
|
| |
|
3,438 |
|
|
Verus Securitization Trust |
|
| |
|
| |
|
1,000 |
|
|
| |
|
993 |
|
|
| |
|
4.033% due 01/10/2035 ~(m) |
|
| |
|
4,814 |
|
|
| |
|
4,576 |
|
|
WaMu Mortgage Pass-Through Certificates Trust |
|
| |
|
| |
|
203 |
|
|
| |
|
171 |
|
4.036% due 06/25/2037 ~(m) |
|
| |
|
542 |
|
|
| |
|
477 |
|
4.091% due 03/25/2037 ~(m) |
|
| |
|
1,325 |
|
|
| |
|
1,176 |
|
4.093% due 02/25/2037 ~(m) |
|
| |
|
1,327 |
|
|
| |
|
1,137 |
|
| |
|
| |
|
82 |
|
|
| |
|
73 |
|
| |
|
| |
|
432 |
|
|
| |
|
397 |
|
4.407% due 07/25/2037 ~(m) |
|
| |
|
810 |
|
|
| |
|
651 |
|
| |
|
| |
|
78 |
|
|
| |
|
76 |
|
5.077% due 08/25/2036 ~(m) |
|
| |
|
815 |
|
|
| |
|
759 |
|
| |
|
| |
|
1,133 |
|
|
| |
|
926 |
|
| |
|
| |
|
337 |
|
|
| |
|
287 |
|
5.209% due 07/25/2047 •(m) |
|
| |
|
9,484 |
|
|
| |
|
7,961 |
|
| |
|
| |
|
66 |
|
|
| |
|
65 |
|
| |
|
| |
|
184 |
|
|
| |
|
159 |
|
5.359% due 09/25/2046 •(m) |
|
| |
|
2,211 |
|
|
| |
|
1,860 |
|
5.447% due 07/25/2046 •(m) |
|
| |
|
1,992 |
|
|
| |
|
1,806 |
|
| |
|
| |
|
19 |
|
|
| |
|
19 |
|
|
Warwick Finance Residential Mortgages PLC |
|
0.000% due 12/21/2049 (h) |
|
GBP |
|
|
0 |
|
|
| |
|
2,063 |
|
| |
|
| |
|
646 |
|
|
| |
|
882 |
|
| |
|
| |
|
646 |
|
|
| |
|
875 |
|
|
|
|
|
|
|
|
|
|
|
|
|
| |
| |
|
|
|
PRINCIPAL
AMOUNT
(000S) |
|
|
|
|
MARKET
VALUE
(000S) |
|
|
Washington Mutual Mortgage Pass-Through Certificates Trust |
|
2.818% due 06/25/2046 •(m) |
|
$ |
|
|
4,661 |
|
|
$ |
|
|
2,600 |
|
4.914% due 01/25/2047 •(m) |
|
| |
|
6,448 |
|
|
| |
|
5,702 |
|
5.034% due 07/25/2036 •(m) |
|
| |
|
2,743 |
|
|
| |
|
2,002 |
|
| |
|
| |
|
226 |
|
|
| |
|
195 |
|
5.750% due 11/25/2035 (m) |
|
| |
|
675 |
|
|
| |
|
648 |
|
6.000% due 04/25/2037 (m) |
|
| |
|
1,066 |
|
|
| |
|
957 |
|
6.467% due 05/25/2036 (m) |
|
| |
|
2,964 |
|
|
| |
|
2,613 |
|
|
Washington Mutual MSC Mortgage Pass-Through Certificates Trust |
|
| |
|
| |
|
60 |
|
|
| |
|
55 |
|
|
Wells Fargo Alternative Loan Trust |
|
| |
|
| |
|
151 |
|
|
| |
|
132 |
|
6.500% due 07/25/2037 (m) |
|
| |
|
2,540 |
|
|
| |
|
2,234 |
|
6.520% due 07/25/2037 ~(m) |
|
| |
|
1,081 |
|
|
| |
|
1,003 |
|
|
Wells Fargo Mortgage Loan Trust |
|
4.495% due 03/27/2037 ~(m) |
|
| |
|
2,994 |
|
|
| |
|
1,701 |
|
6.140% due 04/27/2036 ~(m) |
|
| |
|
2,550 |
|
|
| |
|
2,404 |
|
|
Wells Fargo Mortgage-Backed Securities Trust |
|
| |
|
| |
|
43 |
|
|
| |
|
39 |
|
| |
|
| |
|
3 |
|
|
| |
|
3 |
|
| |
|
| |
|
3 |
|
|
| |
|
3 |
|
|
| |
|
| |
|
| |
|
8,000 |
|
|
| |
|
795 |
|
|
| |
|
0.341% due 07/05/2037 ~(a) |
|
| |
|
515,000 |
|
|
| |
|
2,332 |
|
7.958% due 07/05/2037 ~(m) |
|
| |
|
11,200 |
|
|
| |
|
11,359 |
|
8.748% due 07/05/2037 ~(m) |
|
| |
|
11,200 |
|
|
| |
|
11,229 |
|
10.174% due 07/05/2037 ~(m) |
|
|
14,010 |
|
|
| |
|
14,212 |
|
|
| |
| |
|
|
| |
| |
|
|
|
Total Non-Agency Mortgage-Backed Securities (Cost $2,322,056) |
|
|
|
|
|
| |
|
|
|
|
| |
ASSET-BACKED SECURITIES 17.8% |
|
|
| |
AUTOMOBILE ABS OTHER 0.5% |
|
|
Ally Bank Auto Credit-Linked Notes Trust |
|
| |
|
| |
|
308 |
|
|
| |
|
311 |
|
| |
|
| |
|
446 |
|
|
| |
|
449 |
|
| |
|
| |
|
670 |
|
|
| |
|
668 |
|
|
Exeter Automobile Receivables Trust |
|
0.000% due 07/15/2033 «(h)(m) |
|
|
27 |
|
|
| |
|
13,023 |
|
0.000% due 12/15/2033 «(h) |
|
| |
|
25 |
|
|
| |
|
1,769 |
|
|
Flagship Credit Auto Trust |
|
0.000% due 12/15/2027 «(h) |
|
| |
|
9 |
|
|
| |
|
384 |
|
0.000% due 06/15/2029 «(h) |
|
| |
|
3 |
|
|
| |
|
0 |
|
|
GLS Auto Select Receivables Trust |
|
5.640% due 08/15/2030 (m) |
|
| |
|
800 |
|
|
| |
|
823 |
|
5.920% due 08/15/2030 (m) |
|
| |
|
1,000 |
|
|
| |
|
1,032 |
|
|
Huntington Bank Auto Credit-Linked Notes |
|
| |
|
| |
|
880 |
|
|
| |
|
896 |
|
| |
|
| |
|
868 |
|
|
| |
|
872 |
|
| |
|
| |
|
506 |
|
|
| |
|
512 |
|
| |
|
| |
|
559 |
|
|
| |
|
561 |
|
|
Santander Bank Auto Credit-Linked Notes |
|
| |
|
| |
|
1,525 |
|
|
| |
|
1,537 |
|
| |
|
| |
|
1,186 |
|
|
| |
|
1,195 |
|
| |
|
| |
|
2,537 |
|
|
| |
|
2,580 |
|
| |
|
| |
|
2,203 |
|
|
| |
|
2,204 |
|
|
SBNA Auto Receivables Trust |
|
| |
|
| |
|
900 |
|
|
| |
|
911 |
|
|
| |
| |
|
|
| |
| |
|
|
|
|
| |
| |
|
|
| |
| |
|
29,727 |
|
|
| |
| |
|
|
| |
| |
|
|
|
|
| |
AUTOMOBILE SEQUENTIAL 0.3% |
|
|
CPS Auto Securitization Trust |
|
| |
|
| |
|
17,100 |
|
|
| |
|
17,379 |
|
|
| |
| |
|
|
| |
| |
|
|
|
|
| |
|
|
|
Aames Mortgage Investment Trust |
|
5.349% due 10/25/2035 •(m) |
|
| |
|
2,200 |
|
|
| |
|
2,073 |
|
|
| |
|
| |
|
| |
|
133 |
|
|
| |
|
131 |
|
5.379% due 07/25/2034 •(m) |
|
| |
|
264 |
|
|
| |
|
264 |
|
|
|
|
|
|
|
|
|
|
|
|
|
| |
| |
|
|
|
PRINCIPAL
AMOUNT
(000S) |
|
|
|
|
MARKET
VALUE
(000S) |
|
5.409% due 06/25/2035 •(m) |
|
$ |
|
|
3,387 |
|
|
$ |
|
|
3,218 |
|
| |
|
| |
|
400 |
|
|
| |
|
390 |
|
5.484% due 03/25/2035 •(m) |
|
| |
|
246 |
|
|
| |
|
216 |
|
| |
|
| |
|
405 |
|
|
| |
|
293 |
|
|
ACE Securities Corp. Home Equity Loan Trust |
|
4.654% due 12/25/2036 •(m) |
|
| |
|
20,631 |
|
|
| |
|
5,166 |
|
5.139% due 05/25/2035 •(m) |
|
| |
|
243 |
|
|
| |
|
241 |
|
5.394% due 08/25/2035 •(m) |
|
| |
|
5,096 |
|
|
| |
|
4,251 |
|
5.424% due 05/25/2035 •(m) |
|
| |
|
886 |
|
|
| |
|
688 |
|
5.529% due 07/25/2035 •(m) |
|
| |
|
17,938 |
|
|
| |
|
17,240 |
|
|
Aegis Asset-Backed Securities Trust |
|
| |
|
| |
|
217 |
|
|
| |
|
214 |
|
| |
|
| |
|
2,225 |
|
|
| |
|
344 |
|
| |
|
| |
|
3,000 |
|
|
| |
|
882 |
|
|
Aegis Asset-Backed Securities Trust Mortgage Pass-Through Certificates |
|
6.534% due 09/25/2034 •(m) |
|
| |
|
740 |
|
|
| |
|
694 |
|
|
Ameriquest Mortgage Securities, Inc. Asset-Backed Pass-Through Certificates |
|
3.515% due 09/25/2032 •(m) |
|
| |
|
1,148 |
|
|
| |
|
1,029 |
|
5.304% due 11/25/2035 •(m) |
|
| |
|
4,300 |
|
|
| |
|
4,053 |
|
5.349% due 09/25/2035 •(m) |
|
| |
|
1,600 |
|
|
| |
|
1,556 |
|
5.379% due 07/25/2035 •(m) |
|
| |
|
160 |
|
|
| |
|
159 |
|
5.379% due 11/25/2035 •(m) |
|
| |
|
1,200 |
|
|
| |
|
1,050 |
|
5.379% due 01/25/2036 •(m) |
|
| |
|
3,996 |
|
|
| |
|
3,701 |
|
5.409% due 05/25/2035 •(m) |
|
| |
|
900 |
|
|
| |
|
873 |
|
5.454% due 01/25/2036 •(m) |
|
| |
|
3,900 |
|
|
| |
|
3,418 |
|
| |
|
| |
|
133 |
|
|
| |
|
131 |
|
6.159% due 08/25/2035 •(m) |
|
| |
|
6,360 |
|
|
| |
|
6,111 |
|
| |
|
| |
|
145 |
|
|
| |
|
153 |
|
|
| |
|
4.584% due 09/25/2036 •(m) |
|
| |
|
7,286 |
|
|
| |
|
2,342 |
|
4.634% due 06/25/2036 •(m) |
|
| |
|
6,338 |
|
|
| |
|
1,728 |
|
| |
|
| |
|
985 |
|
|
| |
|
308 |
|
| |
|
| |
|
3,568 |
|
|
| |
|
973 |
|
4.814% due 03/25/2036 •(m) |
|
| |
|
9,673 |
|
|
| |
|
5,332 |
|
|
Argent Securities, Inc. Asset-Backed Pass-Through Certificates |
|
5.124% due 11/25/2035 •(m) |
|
| |
|
14,851 |
|
|
| |
|
13,066 |
|
5.124% due 01/25/2036 •(m) |
|
| |
|
1,089 |
|
|
| |
|
1,119 |
|
5.194% due 02/25/2036 •(m) |
|
| |
|
19,306 |
|
|
| |
|
15,605 |
|
|
Asset-Backed Securities Corp. Home Equity Loan Trust |
|
5.334% due 11/25/2035 •(m) |
|
| |
|
2,439 |
|
|
| |
|
2,357 |
|
| |
|
| |
|
91 |
|
|
| |
|
97 |
|
5.454% due 05/25/2035 •(m) |
|
| |
|
880 |
|
|
| |
|
869 |
|
5.514% due 04/25/2035 •(m) |
|
| |
|
900 |
|
|
| |
|
820 |
|
|
Bear Stearns Asset-Backed Securities Trust |
|
| |
|
| |
|
79 |
|
|
| |
|
78 |
|
4.714% due 12/25/2036 •(m) |
|
| |
|
7,702 |
|
|
| |
|
7,679 |
|
5.144% due 04/25/2035 •(m) |
|
| |
|
1,311 |
|
|
| |
|
1,309 |
|
5.454% due 10/25/2035 •(m) |
|
| |
|
505 |
|
|
| |
|
504 |
|
5.514% due 12/25/2035 •(m) |
|
| |
|
2,869 |
|
|
| |
|
2,750 |
|
| |
|
| |
|
1 |
|
|
| |
|
4 |
|
|
Carrington Mortgage Loan Trust |
|
| |
|
| |
|
535 |
|
|
| |
|
406 |
|
4.854% due 12/26/2036 •(m) |
|
| |
|
13,201 |
|
|
| |
|
11,398 |
|
|
Citigroup Mortgage Loan Trust |
|
| |
|
| |
|
395 |
|
|
| |
|
259 |
|
4.734% due 12/25/2036 •(m) |
|
| |
|
16,202 |
|
|
| |
|
5,848 |
|
4.754% due 09/25/2036 •(m) |
|
| |
|
9,885 |
|
|
| |
|
7,552 |
|
4.754% due 12/25/2036 •(m) |
|
| |
|
10,498 |
|
|
| |
|
5,754 |
|
4.874% due 12/25/2036 •(m) |
|
| |
|
11,871 |
|
|
| |
|
4,285 |
|
|
Citigroup Mortgage Loan Trust, Inc. |
|
5.409% due 10/25/2035 •(m) |
|
| |
|
2,287 |
|
|
| |
|
1,548 |
|
|
Countrywide Asset-Backed Certificates |
|
4.714% due 03/25/2037 •(m) |
|
| |
|
9,896 |
|
|
| |
|
9,049 |
|
4.824% due 01/25/2046 •(m) |
|
| |
|
36,091 |
|
|
| |
|
28,308 |
|
| |
|
| |
|
256 |
|
|
| |
|
208 |
|
5.334% due 03/25/2047 •(m) |
|
| |
|
880 |
|
|
| |
|
681 |
|
| |
|
| |
|
132 |
|
|
| |
|
131 |
|
| |
|
| |
|
430 |
|
|
| |
|
421 |
|
5.534% due 05/25/2047 •(m) |
|
| |
|
4,397 |
|
|
| |
|
3,657 |
|
|
Countrywide Asset-Backed Certificates Trust |
|
4.388% due 10/25/2032 ~(m) |
|
| |
|
1 |
|
|
| |
|
48 |
|
| |
|
| |
|
807 |
|
|
| |
|
588 |
|
4.834% due 06/25/2037 •(m) |
|
| |
|
16,176 |
|
|
| |
|
16,155 |
|
4.914% due 03/25/2036 •(m) |
|
| |
|
12,575 |
|
|
| |
|
11,315 |
|
4.914% due 05/25/2036 •(m) |
|
| |
|
3,530 |
|
|
| |
|
2,992 |
|
|
|
|
|
|
|
|
|
|
|
|
|
| |
| See Accompanying Notes |
|
|
ANNUAL REPORT |
|
|
| |
|
|
JUNE 30, 2025 |
|
|
85 |
|
|
|
|
|
|
| |
Consolidated Schedule of Investments |
|
PIMCO Dynamic Income Fund |
|
|
|
|
|
|
|
|
|
|
|
|
|
|
|
|
| |
| |
|
|
|
PRINCIPAL
AMOUNT
(000S) |
|
|
|
|
MARKET
VALUE
(000S) |
|
4.934% due 11/25/2047 •(m) |
|
$ |
|
|
3,497 |
|
|
$ |
|
|
3,193 |
|
5.019% due 04/25/2036 •(m) |
|
| |
|
8,762 |
|
|
| |
|
8,259 |
|
5.544% due 08/25/2035 •(m) |
|
| |
|
1,042 |
|
|
| |
|
1,031 |
|
5.604% due 04/25/2036 •(m) |
|
| |
|
3,874 |
|
|
| |
|
3,503 |
|
6.459% due 11/25/2035 •(m) |
|
| |
|
6,296 |
|
|
| |
|
4,489 |
|
6.867% due 09/25/2046 (m) |
|
| |
|
6,151 |
|
|
| |
|
4,324 |
|
|
Credit Suisse First Boston Mortgage Securities Corp. |
|
5.484% due 02/25/2031 •(m) |
|
| |
|
610 |
|
|
| |
|
597 |
|
|
| |
|
7.809% due 04/25/2042 •(m) |
|
| |
|
1,172 |
|
|
| |
|
1,152 |
|
|
Encore Credit Receivables Trust |
|
| |
|
| |
|
249 |
|
|
| |
|
244 |
|
| |
|
| |
|
270 |
|
|
| |
|
252 |
|
| |
|
| |
|
693 |
|
|
| |
|
570 |
|
|
| |
|
5.364% due 09/25/2035 •(m) |
|
| |
|
6,500 |
|
|
| |
|
5,792 |
|
| |
|
| |
|
3,644 |
|
|
| |
|
2,034 |
|
|
Fieldstone Mortgage Investment Trust |
|
4.774% due 07/25/2036 •(m) |
|
| |
|
3,899 |
|
|
| |
|
2,080 |
|
|
| |
|
4.584% due 01/25/2037 •(m) |
|
| |
|
2,688 |
|
|
| |
|
1,227 |
|
| |
|
| |
|
1,073 |
|
|
| |
|
330 |
|
5.109% due 01/25/2036 •(m) |
|
| |
|
4,700 |
|
|
| |
|
3,906 |
|
5.394% due 04/25/2035 •(m) |
|
| |
|
4,300 |
|
|
| |
|
3,707 |
|
| |
|
| |
|
451 |
|
|
| |
|
445 |
|
|
GMACM Home Equity Loan Trust |
|
6.749% due 12/25/2037 (m) |
|
| |
|
494 |
|
|
| |
|
488 |
|
|
| |
|
4.494% due 01/25/2037 •(m) |
|
| |
|
2,389 |
|
|
| |
|
1,440 |
|
| |
|
| |
|
713 |
|
|
| |
|
430 |
|
| |
|
| |
|
750 |
|
|
| |
|
400 |
|
4.684% due 12/25/2036 •(m) |
|
| |
|
3,503 |
|
|
| |
|
1,737 |
|
| |
|
| |
|
393 |
|
|
| |
|
262 |
|
4.834% due 11/25/2036 •(m) |
|
| |
|
3,122 |
|
|
| |
|
1,456 |
|
4.974% due 04/25/2036 •(m) |
|
| |
|
14,023 |
|
|
| |
|
9,481 |
|
| |
|
| |
|
97 |
|
|
| |
|
98 |
|
|
Home Equity Mortgage Loan Asset-Backed Trust |
|
4.594% due 11/25/2036 •(m) |
|
| |
|
2,518 |
|
|
| |
|
2,282 |
|
4.674% due 04/25/2037 •(m) |
|
| |
|
15,436 |
|
|
| |
|
10,452 |
|
4.754% due 04/25/2037 •(m) |
|
| |
|
2,193 |
|
|
| |
|
1,934 |
|
| |
|
| |
|
460 |
|
|
| |
|
297 |
|
| |
|
| |
|
1,026 |
|
|
| |
|
801 |
|
|
HSI Asset Securitization Corp. Trust |
|
4.624% due 01/25/2037 •(m) |
|
| |
|
26,394 |
|
|
| |
|
18,887 |
|
| |
|
| |
|
19,182 |
|
|
| |
|
4,796 |
|
4.754% due 10/25/2036 •(m) |
|
| |
|
6,264 |
|
|
| |
|
2,136 |
|
4.774% due 12/25/2036 •(m) |
|
| |
|
11,749 |
|
|
| |
|
2,811 |
|
|
IXIS Real Estate Capital Trust |
|
5.409% due 09/25/2035 •(m) |
|
| |
|
1,568 |
|
|
| |
|
1,649 |
|
|
JP Morgan Mortgage Acquisition Corp. |
|
5.334% due 09/25/2035 •(m) |
|
| |
|
2,300 |
|
|
| |
|
2,078 |
|
|
JP Morgan Mortgage Acquisition Trust |
|
| |
|
| |
|
5 |
|
|
| |
|
2 |
|
4.734% due 07/25/2036 •(m) |
|
| |
|
2,504 |
|
|
| |
|
1,165 |
|
| |
|
| |
|
926 |
|
|
| |
|
258 |
|
5.462% due 09/25/2029 (m) |
|
| |
|
2,297 |
|
|
| |
|
1,380 |
|
5.888% due 10/25/2036 (m) |
|
| |
|
6,292 |
|
|
| |
|
3,780 |
|
|
Lehman ABS Mortgage Loan Trust |
|
4.524% due 06/25/2037 •(m) |
|
| |
|
3,184 |
|
|
| |
|
2,116 |
|
|
Long Beach Mortgage Loan Trust |
|
4.814% due 02/25/2036 •(m) |
|
| |
|
16,328 |
|
|
| |
|
14,077 |
|
4.974% due 05/25/2046 •(m) |
|
| |
|
7,757 |
|
|
| |
|
2,325 |
|
5.139% due 11/25/2035 •(m) |
|
| |
|
50,025 |
|
|
| |
|
47,190 |
|
5.349% due 08/25/2035 •(m) |
|
| |
|
3,400 |
|
|
| |
|
3,082 |
|
5.559% due 04/25/2035 •(m) |
|
| |
|
6,500 |
|
|
| |
|
6,318 |
|
|
MASTR Asset-Backed Securities Trust |
|
4.654% due 08/25/2036 •(m) |
|
| |
|
2,547 |
|
|
| |
|
934 |
|
4.734% due 03/25/2036 •(m) |
|
| |
|
4,575 |
|
|
| |
|
2,713 |
|
4.774% due 06/25/2036 •(m) |
|
| |
|
3,353 |
|
|
| |
|
3,100 |
|
4.794% due 02/25/2036 •(m) |
|
| |
|
5,779 |
|
|
| |
|
2,108 |
|
| |
|
| |
|
2,479 |
|
|
| |
|
862 |
|
4.974% due 12/25/2035 •(m) |
|
| |
|
14,191 |
|
|
| |
|
11,919 |
|
| |
|
| |
|
112 |
|
|
| |
|
111 |
|
5.334% due 10/25/2035 •(m) |
|
| |
|
1,553 |
|
|
| |
|
1,426 |
|
| |
|
| |
|
184 |
|
|
| |
|
192 |
|
| |
|
| |
|
1,430 |
|
|
| |
|
1,427 |
|
| |
|
| |
|
763 |
|
|
| |
|
597 |
|
|
|
|
|
|
|
|
|
|
|
|
|
| |
| |
|
|
|
PRINCIPAL
AMOUNT
(000S) |
|
|
|
|
MARKET
VALUE
(000S) |
|
5.484% due 05/25/2035 •(m) |
|
$ |
|
|
1,200 |
|
|
$ |
|
|
1,189 |
|
| |
|
| |
|
1,707 |
|
|
| |
|
1,567 |
|
|
Merrill Lynch Mortgage Investors Trust |
|
| |
|
| |
|
538 |
|
|
| |
|
538 |
|
| |
|
| |
|
180 |
|
|
| |
|
172 |
|
|
Morgan Stanley ABS Capital, Inc. Trust |
|
| |
|
| |
|
1,319 |
|
|
| |
|
576 |
|
| |
|
| |
|
3,107 |
|
|
| |
|
1,069 |
|
4.574% due 10/25/2036 •(m) |
|
| |
|
6,861 |
|
|
| |
|
2,994 |
|
| |
|
| |
|
1,094 |
|
|
| |
|
620 |
|
4.654% due 10/25/2036 •(m) |
|
| |
|
3,306 |
|
|
| |
|
1,443 |
|
4.734% due 06/25/2036 •(m) |
|
| |
|
4,223 |
|
|
| |
|
2,100 |
|
| |
|
| |
|
430 |
|
|
| |
|
372 |
|
4.734% due 09/25/2036 •(m) |
|
| |
|
6,243 |
|
|
| |
|
2,146 |
|
4.734% due 11/25/2036 •(m) |
|
| |
|
11,928 |
|
|
| |
|
6,756 |
|
4.764% due 02/25/2037 •(m) |
|
| |
|
4,158 |
|
|
| |
|
1,809 |
|
5.469% due 01/25/2035 •(m) |
|
| |
|
6,379 |
|
|
| |
|
5,686 |
|
5.469% due 03/25/2035 •(m) |
|
| |
|
859 |
|
|
| |
|
765 |
|
5.529% due 01/25/2035 •(m) |
|
| |
|
927 |
|
|
| |
|
819 |
|
|
Morgan Stanley Capital, Inc. Trust |
|
| |
|
| |
|
9 |
|
|
| |
|
8 |
|
|
Morgan Stanley Home Equity Loan Trust |
|
4.664% due 04/25/2037 •(m) |
|
| |
|
19,773 |
|
|
| |
|
10,261 |
|
|
New Century Home Equity Loan Trust |
|
5.079% due 12/25/2035 •(m) |
|
| |
|
983 |
|
|
| |
|
945 |
|
5.109% due 12/25/2035 •(m) |
|
| |
|
2,195 |
|
|
| |
|
1,877 |
|
5.214% due 03/25/2035 •(m) |
|
| |
|
525 |
|
|
| |
|
522 |
|
5.379% due 06/25/2035 •(m) |
|
| |
|
459 |
|
|
| |
|
482 |
|
5.409% due 06/25/2035 •(m) |
|
| |
|
1,067 |
|
|
| |
|
1,051 |
|
5.454% due 06/25/2035 •(m) |
|
| |
|
1,342 |
|
|
| |
|
1,293 |
|
5.559% due 03/25/2035 •(m) |
|
| |
|
813 |
|
|
| |
|
799 |
|
| |
|
| |
|
169 |
|
|
| |
|
145 |
|
|
Nomura Home Equity Loan, Inc. Home Equity Loan Trust |
|
4.994% due 07/25/2036 •(m) |
|
| |
|
3,500 |
|
|
| |
|
2,971 |
|
| |
|
| |
|
4,064 |
|
|
| |
|
901 |
|
5.349% due 05/25/2035 •(m) |
|
| |
|
1,980 |
|
|
| |
|
1,522 |
|
|
NovaStar Mortgage Funding Trust |
|
| |
|
| |
|
1,006 |
|
|
| |
|
308 |
|
5.094% due 01/25/2036 •(m) |
|
| |
|
79 |
|
|
| |
|
79 |
|
|
Option One Mortgage Loan Trust |
|
4.564% due 07/25/2037 •(m) |
|
| |
|
18,369 |
|
|
| |
|
11,840 |
|
| |
|
| |
|
456 |
|
|
| |
|
225 |
|
| |
|
| |
|
238 |
|
|
| |
|
153 |
|
4.714% due 01/25/2037 •(m) |
|
| |
|
7,068 |
|
|
| |
|
4,147 |
|
4.764% due 04/25/2037 •(m) |
|
| |
|
1,878 |
|
|
| |
|
917 |
|
| |
|
| |
|
1,441 |
|
|
| |
|
846 |
|
| |
|
| |
|
1 |
|
|
| |
|
1 |
|
|
Ownit Mortgage Loan Trust |
|
3.136% due 10/25/2035 þ(m) |
|
| |
|
3,238 |
|
|
| |
|
1,814 |
|
|
Park Place Securities, Inc. |
|
5.379% due 09/25/2035 •(m) |
|
| |
|
2,200 |
|
|
| |
|
1,956 |
|
|
Park Place Securities, Inc. Asset-Backed Pass-Through Certificates |
|
5.154% due 05/25/2035 •(m) |
|
| |
|
247 |
|
|
| |
|
245 |
|
| |
|
| |
|
6 |
|
|
| |
|
6 |
|
5.409% due 07/25/2035 •(m) |
|
| |
|
1,600 |
|
|
| |
|
1,352 |
|
6.309% due 10/25/2034 •(m) |
|
| |
|
1,195 |
|
|
| |
|
1,063 |
|
|
People’s Choice Home Loan Securities Trust |
|
5.409% due 05/25/2035 •(m) |
|
| |
|
900 |
|
|
| |
|
599 |
|
|
| |
|
7.059% due 05/25/2046 •(m) |
|
| |
|
17,151 |
|
|
| |
|
16,842 |
|
|
Renaissance Home Equity Loan Trust |
|
| |
|
| |
|
3,152 |
|
|
| |
|
732 |
|
|
Residential Asset Mortgage Products Trust |
|
5.184% due 04/25/2034 •(m) |
|
| |
|
860 |
|
|
| |
|
862 |
|
5.304% due 04/25/2034 •(m) |
|
| |
|
287 |
|
|
| |
|
290 |
|
6.009% due 04/25/2034 •(m) |
|
| |
|
1,002 |
|
|
| |
|
998 |
|
6.414% due 04/25/2034 •(m) |
|
| |
|
1,738 |
|
|
| |
|
1,791 |
|
|
Residential Asset Securities Corp. Trust |
|
4.694% due 11/25/2036 •(m) |
|
| |
|
3,618 |
|
|
| |
|
3,360 |
|
4.774% due 10/25/2036 •(m) |
|
| |
|
2,217 |
|
|
| |
|
2,050 |
|
4.914% due 08/25/2036 •(m) |
|
| |
|
7,716 |
|
|
| |
|
6,817 |
|
4.929% due 04/25/2036 •(m) |
|
| |
|
6,177 |
|
|
| |
|
5,198 |
|
5.094% due 12/25/2035 •(m) |
|
| |
|
5,827 |
|
|
| |
|
5,081 |
|
5.379% due 12/25/2035 •(m) |
|
| |
|
1,771 |
|
|
| |
|
1,293 |
|
|
Saxon Asset Securities Trust |
|
1.540% due 03/25/2035 •(m) |
|
| |
|
5,096 |
|
|
| |
|
2,841 |
|
1.788% due 11/25/2035 •(m) |
|
| |
|
7,747 |
|
|
| |
|
5,730 |
|
|
|
|
|
|
|
|
|
|
|
|
|
| |
| |
|
|
|
PRINCIPAL
AMOUNT
(000S) |
|
|
|
|
MARKET
VALUE
(000S) |
|
|
Securitized Asset-Backed Receivables LLC Trust |
|
| |
|
$ |
|
|
2,554 |
|
|
$ |
|
|
839 |
|
| |
|
| |
|
209 |
|
|
| |
|
93 |
|
| |
|
| |
|
5 |
|
|
| |
|
5 |
|
|
Soundview Home Loan Trust |
|
4.584% due 06/25/2037 •(m) |
|
| |
|
2,010 |
|
|
| |
|
1,324 |
|
4.714% due 06/25/2037 •(m) |
|
| |
|
4,968 |
|
|
| |
|
3,271 |
|
4.794% due 02/25/2037 •(m) |
|
| |
|
6,719 |
|
|
| |
|
1,801 |
|
4.954% due 02/25/2037 •(m) |
|
| |
|
7,797 |
|
|
| |
|
2,098 |
|
5.364% due 11/25/2035 •(m) |
|
| |
|
106 |
|
|
| |
|
106 |
|
5.384% due 10/25/2037 •(m) |
|
| |
|
3,632 |
|
|
| |
|
2,802 |
|
5.409% due 11/25/2035 •(m) |
|
| |
|
1,134 |
|
|
| |
|
1,119 |
|
5.534% due 09/25/2037 •(m) |
|
| |
|
1,380 |
|
|
| |
|
1,154 |
|
|
Structured Asset Securities Corp. |
|
10.434% due 05/25/2032 •(m) |
|
| |
|
3,846 |
|
|
| |
|
3,503 |
|
|
UCFC Home Equity Loan Trust |
|
| |
|
| |
|
271 |
|
|
| |
|
274 |
|
|
Wells Fargo Home Equity Asset-Backed Securities Trust |
|
4.839% due 01/25/2037 •(m) |
|
| |
|
9,609 |
|
|
| |
|
9,430 |
|
|
| |
| |
|
|
| |
| |
|
|
|
|
| |
| |
|
|
| |
| |
|
604,867 |
|
|
| |
| |
|
|
| |
| |
|
|
|
|
| |
HOME EQUITY SEQUENTIAL 0.0% |
|
|
Structured Asset Securities Corp. Mortgage Loan Trust |
|
| |
|
| |
|
9 |
|
|
| |
|
9 |
|
|
| |
| |
|
|
| |
| |
|
|
|
|
| |
MANUFACTURING HOUSE ABS OTHER 0.3% |
|
|
Access Financial Manufactured Housing Contract Trust |
|
| |
|
| |
|
200 |
|
|
| |
|
1 |
|
|
Conseco Finance Securitizations Corp. |
|
| |
|
| |
|
2,914 |
|
|
| |
|
404 |
|
9.163% due 03/01/2033 ~(m) |
|
| |
|
8,085 |
|
|
| |
|
8,168 |
|
9.546% due 12/01/2033 ~(m) |
|
| |
|
4,723 |
|
|
| |
|
4,643 |
|
|
Greenpoint Manufactured Housing |
|
9.230% due 12/15/2029 ~(m) |
|
| |
|
4,188 |
|
|
| |
|
4,223 |
|
|
Mid-State Capital Corp. Trust |
|
6.742% due 10/15/2040 (m) |
|
| |
|
1,827 |
|
|
| |
|
1,851 |
|
|
Oakwood Mortgage Investors, Inc. |
|
| |
|
| |
|
1,129 |
|
|
| |
|
1,105 |
|
|
| |
| |
|
|
| |
| |
|
|
|
|
| |
| |
|
|
| |
| |
|
20,395 |
|
|
| |
| |
|
|
| |
| |
|
|
|
|
| |
MANUFACTURING HOUSE SEQUENTIAL 0.1% |
|
|
Bombardier Capital Mortgage Securitization Corp. |
|
| |
|
| |
|
3,549 |
|
|
| |
|
260 |
|
|
| |
|
| |
|
| |
|
288 |
|
|
| |
|
262 |
|
| |
|
| |
|
1,253 |
|
|
| |
|
1,161 |
|
| |
|
| |
|
5,915 |
|
|
| |
|
1,677 |
|
|
Conseco Finance Securitizations Corp. |
|
| |
|
| |
|
184 |
|
|
| |
|
187 |
|
| |
|
| |
|
1,457 |
|
|
| |
|
292 |
|
8.260% due 12/01/2030 ~(m) |
|
| |
|
4,584 |
|
|
| |
|
814 |
|
8.850% due 12/01/2030 ~(m) |
|
| |
|
5,630 |
|
|
| |
|
720 |
|
|
Oakwood Mortgage Investors, Inc. |
|
| |
|
| |
|
545 |
|
|
| |
|
552 |
|
|
| |
| |
|
|
| |
| |
|
|
|
|
| |
| |
|
|
| |
| |
|
5,925 |
|
|
| |
| |
|
|
| |
| |
|
|
|
|
| |
WHOLE LOAN COLLATERAL 1.1% |
|
|
Bear Stearns Asset-Backed Securities Trust |
|
| |
|
| |
|
111 |
|
|
| |
|
86 |
|
| |
|
| |
|
6 |
|
|
| |
|
6 |
|
| |
|
| |
|
2,323 |
|
|
| |
|
1,037 |
|
| |
|
| |
|
228 |
|
|
| |
|
124 |
|
6.500% due 03/25/2037 (m) |
|
| |
|
8,787 |
|
|
| |
|
7,952 |
|
|
Citigroup Mortgage Loan Trust |
|
5.134% due 11/25/2046 •(m) |
|
| |
|
4,267 |
|
|
| |
|
3,482 |
|
| |
|
| |
|
346 |
|
|
| |
|
125 |
|
| |
|
| |
|
1,316 |
|
|
| |
|
627 |
|
| |
|
| |
|
2,014 |
|
|
| |
|
727 |
|
|
Countrywide Asset-Backed Certificates Trust |
|
| |
|
| |
|
299 |
|
|
| |
|
266 |
|
|
First Franklin Mortgage Loan Trust |
|
5.004% due 02/25/2036 •(m) |
|
| |
|
5,500 |
|
|
| |
|
5,213 |
|
5.379% due 09/25/2035 •(m) |
|
| |
|
5,833 |
|
|
| |
|
5,378 |
|
|
|
|
|
|
|
| |
86 |
|
PIMCO CLOSED-END FUNDS |
|
|
See Accompanying Notes |
|
|
|
|
|
|
|
|
|
|
|
|
|
| |
| |
|
|
|
PRINCIPAL
AMOUNT
(000S) |
|
|
|
|
MARKET
VALUE
(000S) |
|
5.409% due 05/25/2036 •(m) |
|
$ |
|
|
14,012 |
|
|
$ |
|
|
12,568 |
|
5.484% due 03/25/2035 •(m) |
|
| |
|
2,101 |
|
|
| |
|
1,941 |
|
|
| |
|
6.309% due 06/25/2034 •(m) |
|
| |
|
1,253 |
|
|
| |
|
1,168 |
|
|
| |
|
4.255% due 05/25/2037 ~(m) |
|
| |
|
5,595 |
|
|
| |
|
4,755 |
|
| |
|
| |
|
151 |
|
|
| |
|
164 |
|
|
Opteum Mortgage Acceptance Corp. Asset-Backed Pass-Through Certificates |
|
5.484% due 04/25/2035 •(m) |
|
| |
|
527 |
|
|
| |
|
530 |
|
|
| |
|
| |
|
| |
|
2,994 |
|
|
| |
|
2,949 |
|
5.744% due 06/25/2055 þ(c) |
|
| |
|
1,500 |
|
|
| |
|
1,504 |
|
6.170% due 07/25/2051 þ(m) |
|
| |
|
2,133 |
|
|
| |
|
2,132 |
|
7.967% due 09/25/2051 þ(m) |
|
| |
|
4,153 |
|
|
| |
|
4,129 |
|
|
Residential Asset Mortgage Products Trust |
|
| |
|
| |
|
270 |
|
|
| |
|
269 |
|
|
Securitized Asset-Backed Receivables LLC Trust |
|
4.934% due 05/25/2036 •(m) |
|
| |
|
14,015 |
|
|
| |
|
7,225 |
|
5.034% due 11/25/2035 •(m) |
|
| |
|
8,815 |
|
|
| |
|
7,402 |
|
5.094% due 08/25/2035 •(m) |
|
| |
|
1,295 |
|
|
| |
|
963 |
|
5.409% due 12/25/2034 •(m) |
|
| |
|
486 |
|
|
| |
|
413 |
|
|
Specialty Underwriting & Residential Finance Trust |
|
| |
|
| |
|
2,352 |
|
|
| |
|
766 |
|
4.284% due 06/25/2037 •(m) |
|
| |
|
2,827 |
|
|
| |
|
1,410 |
|
| |
|
| |
|
259 |
|
|
| |
|
132 |
|
|
| |
| |
|
|
| |
| |
|
|
|
|
| |
| |
|
|
| |
| |
|
75,443 |
|
|
| |
| |
|
|
| |
| |
|
|
|
|
| |
|
|
|
| |
|
| |
|
| |
|
57,200 |
|
|
| |
|
58,150 |
|
|
| |
|
8.350% due 11/08/2039 •(m) |
|
| |
|
8,674 |
|
|
| |
|
1,904 |
|
|
| |
|
| |
|
| |
|
55 |
|
|
| |
|
56 |
|
|
| |
|
| |
|
EUR |
|
|
1,746 |
|
|
| |
|
476 |
|
|
AIM Aviation Finance Ltd. |
|
6.213% due 02/15/2040 þ(m) |
|
$ |
|
|
975 |
|
|
| |
|
931 |
|
|
| |
|
| |
|
| |
|
20,050 |
|
|
| |
|
9,204 |
|
|
| |
|
| |
|
| |
|
98,373 |
|
|
| |
|
507 |
|
|
Carlyle Global Market Strategies CLO Ltd. |
|
| |
|
| |
|
2,900 |
|
|
| |
|
285 |
|
|
| |
|
| |
|
| |
|
3,390 |
|
|
| |
|
593 |
|
|
College Ave Student Loans Trust |
|
0.000% due 06/25/2054 «(h) |
|
| |
|
21 |
|
|
| |
|
10,870 |
|
| |
|
| |
|
2,647 |
|
|
| |
|
2,715 |
|
| |
|
| |
|
3,811 |
|
|
| |
|
3,835 |
|
|
Cologix Canadian Issuer LP |
|
| |
|
CAD |
|
|
2,000 |
|
|
| |
|
1,425 |
|
|
| |
|
| |
|
EUR |
|
|
1,401 |
|
|
| |
|
197 |
|
|
| |
|
6.000% due 09/04/2038 (m) |
|
$ |
|
|
3,640 |
|
|
| |
|
1,130 |
|
6.081% due 09/04/2038 •(m) |
|
| |
|
22,976 |
|
|
| |
|
6,721 |
|
|
| |
|
| |
|
| |
|
18,900 |
|
|
| |
|
18,900 |
|
|
| |
|
| |
|
| |
|
8,400 |
|
|
| |
|
7,634 |
|
|
| |
|
8.000% due 04/08/2039 •(m) |
|
| |
|
7,546 |
|
|
| |
|
595 |
|
|
| |
|
3.473% due 06/15/2040 (m) |
|
| |
|
579 |
|
|
| |
|
498 |
|
4.947% due 06/15/2040 (m) |
|
| |
|
3,833 |
|
|
| |
|
3,431 |
|
|
| |
|
| |
|
EUR |
|
|
2,651 |
|
|
| |
|
3,011 |
|
|
| |
|
| |
|
GBP |
|
|
15,806 |
|
|
| |
|
4,057 |
|
|
| |
|
0.000% due 09/20/2027 «(h) |
|
$ |
|
|
10 |
|
|
| |
|
12 |
|
|
|
|
|
|
|
|
|
|
|
|
|
| |
| |
|
|
|
PRINCIPAL
AMOUNT
(000S) |
|
|
|
|
MARKET
VALUE
(000S) |
|
|
| |
|
7.770% due 08/04/2035 •(m) |
|
$ |
|
|
31,282 |
|
|
$ |
|
|
2,642 |
|
|
GreenSky Home Improvement Issuer Trust |
|
| |
|
| |
|
500 |
|
|
| |
|
511 |
|
|
GreenSky Home Improvement Trust |
|
| |
|
| |
|
500 |
|
|
| |
|
509 |
|
| |
|
| |
|
500 |
|
|
| |
|
513 |
|
| |
|
| |
|
900 |
|
|
| |
|
935 |
|
|
| |
|
4.445% due 12/10/2039 •(m) |
|
|
32,573 |
|
|
| |
|
5,720 |
|
|
| |
|
| |
|
| |
|
109,166 |
|
|
| |
|
17,874 |
|
| |
|
| |
|
4,871 |
|
|
| |
|
5 |
|
5.016% due 07/05/2041 ^•(e) |
|
|
1,690 |
|
|
| |
|
0 |
|
|
| |
|
1.007% due 04/25/2038 «~(a) |
|
|
536 |
|
|
| |
|
11 |
|
|
Labrador Aviation Finance Ltd. |
|
4.300% due 01/15/2042 (m) |
|
| |
|
2,093 |
|
|
| |
|
2,036 |
|
|
Lendingpoint Asset Securitization Trust |
|
| |
|
| |
|
781 |
|
|
| |
|
757 |
|
|
LendingPoint Pass-Through Trust |
|
0.000% due 03/15/2028 «(h) |
|
|
1,400 |
|
|
| |
|
152 |
|
0.000% due 04/15/2028 «(h) |
|
|
1,700 |
|
|
| |
|
233 |
|
|
Madison Park Funding Ltd. |
|
0.000% due 07/27/2047 ~(m) |
|
|
5,600 |
|
|
| |
|
1,782 |
|
|
| |
|
| |
|
| |
|
6,450 |
|
|
| |
|
3,264 |
|
|
| |
|
| |
|
| |
|
17,150 |
|
|
| |
|
8,259 |
|
|
| |
|
7.830% due 12/04/2044 •(m) |
|
|
14,352 |
|
|
| |
|
2,679 |
|
8.100% due 12/04/2044 ^•(e) |
|
|
4,126 |
|
|
| |
|
0 |
|
|
| |
|
0.000% due 07/16/2029 «(h) |
|
|
16 |
|
|
| |
|
2 |
|
0.000% due 09/17/2029 «(h) |
|
|
35 |
|
|
| |
|
10 |
|
0.000% due 03/15/2030 «(h) |
|
|
33 |
|
|
| |
|
108 |
|
0.000% due 09/16/2030 «(h) |
|
|
9 |
|
|
| |
|
161 |
|
|
National Collegiate Commutation Trust |
|
0.000% due 03/25/2038 •(m) |
|
|
135,030 |
|
|
| |
|
19,987 |
|
|
| |
|
| |
|
| |
|
11 |
|
|
| |
|
3,416 |
|
|
Pagaya AI Debt Grantor Trust |
|
| |
|
| |
|
700 |
|
|
| |
|
455 |
|
| |
|
| |
|
575 |
|
|
| |
|
575 |
|
| |
|
| |
|
779 |
|
|
| |
|
780 |
|
| |
|
| |
|
450 |
|
|
| |
|
449 |
|
| |
|
| |
|
470 |
|
|
| |
|
470 |
|
| |
|
| |
|
580 |
|
|
| |
|
563 |
|
|
Pagaya AI Debt Selection Trust |
|
| |
|
| |
|
360 |
|
|
| |
|
352 |
|
|
| |
|
| |
|
| |
|
5,523 |
|
|
| |
|
5,546 |
|
|
| |
|
8.450% due 07/22/2039 •(m) |
|
|
6,540 |
|
|
| |
|
2,504 |
|
|
Putnam Structured Product Funding Ltd. |
|
5.826% due 10/15/2038 •(m) |
|
|
698 |
|
|
| |
|
388 |
|
|
| |
|
| |
|
| |
|
500 |
|
|
| |
|
503 |
|
| |
|
| |
|
500 |
|
|
| |
|
501 |
|
|
| |
|
0.000% due 10/15/2029 ~(m) |
|
|
11,667 |
|
|
| |
|
2,358 |
|
| |
|
| |
|
4,967 |
|
|
| |
|
784 |
|
| |
|
| |
|
4,967 |
|
|
| |
|
610 |
|
0.000% due 04/20/2034 ~(m) |
|
|
22,000 |
|
|
| |
|
8,441 |
|
|
| |
|
| |
|
EUR |
|
|
1,400 |
|
|
| |
|
542 |
|
|
SLM Student Loan EDC Repackaging Trust |
|
0.000% due 10/28/2029 «(h)(m) |
|
$ |
|
|
36 |
|
|
| |
|
13,090 |
|
|
| |
|
0.000% due 01/25/2042 «(h) |
|
|
31 |
|
|
| |
|
6,076 |
|
|
SMB Private Education Loan Trust |
|
0.000% due 10/15/2048 «(h) |
|
|
8 |
|
|
| |
|
2,045 |
|
0.000% due 09/15/2054 «(h)(m) |
|
| |
|
36,220 |
|
|
| |
|
42,091 |
|
0.000% due 11/16/2054 «(h) |
|
|
5 |
|
|
| |
|
4,498 |
|
|
|
|
|
|
|
|
|
|
|
|
|
| |
| |
|
|
|
PRINCIPAL
AMOUNT
(000S) |
|
|
|
|
MARKET
VALUE
(000S) |
|
0.000% due 02/16/2055 «(h) |
|
$ |
|
|
9 |
|
|
$ |
|
|
8,878 |
|
5.950% due 02/16/2055 (m) |
|
|
6,168 |
|
|
| |
|
6,144 |
|
|
SoFi Professional Loan Program LLC |
|
0.000% due 09/25/2040 «(h) |
|
|
14,219 |
|
|
| |
|
1,090 |
|
|
| |
|
4.866% due 10/07/2037 •(m) |
|
|
17,418 |
|
|
| |
|
14,196 |
|
|
| |
|
0.454% due 01/06/2041 •(m) |
|
|
158,546 |
|
|
| |
|
29,111 |
|
| |
|
|
48 |
|
|
| |
|
9 |
|
0.454% due 01/06/2041 •(m) |
|
|
9,983 |
|
|
| |
|
1,833 |
|
| |
|
|
10,259 |
|
|
| |
|
1 |
|
| |
|
|
2,565 |
|
|
| |
|
0 |
|
| |
|
|
3,678 |
|
|
| |
|
1,161 |
|
|
| |
|
4.089% due 03/15/2044 (m) |
|
|
513 |
|
|
| |
|
508 |
|
|
Stream Innovations Issuer Trust |
|
| |
|
| |
|
353 |
|
|
| |
|
367 |
|
|
Taberna Preferred Funding Ltd. |
|
| |
|
|
2,425 |
|
|
| |
|
2,207 |
|
4.902% due 08/05/2036 •(m) |
|
|
9,756 |
|
|
| |
|
8,878 |
|
|
| |
|
| |
|
|
676 |
|
|
| |
|
103 |
|
|
| |
|
| |
|
|
3,301 |
|
|
| |
|
3,178 |
|
|
| |
|
4.776% due 10/05/2045 •(m) |
|
|
240,688 |
|
|
| |
|
48,322 |
|
|
| |
| |
|
|
| |
| |
|
|
|
|
| |
| |
|
|
| |
| |
|
428,310 |
|
|
| |
| |
|
|
| |
| |
|
|
|
Total Asset-Backed Securities
(Cost $1,704,309) |
|
|
|
|
|
| |
|
|
|
|
| |
|
|
|
Argentina Government International Bond |
|
0.750% due 07/09/2030 þ(m) |
|
| |
|
27,885 |
|
|
| |
|
18,880 |
|
1.000% due 07/09/2029 (m) |
|
| |
|
4,771 |
|
|
| |
|
3,989 |
|
3.500% due 07/09/2041 (m) |
|
| |
|
17,060 |
|
|
| |
|
10,620 |
|
4.125% due 07/09/2035 (m) |
|
| |
|
13,800 |
|
|
| |
|
9,286 |
|
| |
|
| |
|
21,344 |
|
|
| |
|
13,900 |
|
| |
|
| |
|
225 |
|
|
| |
|
147 |
|
5.000% due 01/09/2038 (m) |
|
| |
|
76,360 |
|
|
| |
|
54,397 |
|
|
Avenir Issuer Ireland DAC |
|
| |
|
| |
|
6,938 |
|
|
| |
|
6,508 |
|
|
Dominican Republic International Bond |
|
10.500% due 03/15/2037 (m) |
|
DOP |
|
|
3,862,000 |
|
|
| |
|
66,049 |
|
| |
|
| |
|
84,600 |
|
|
| |
|
1,470 |
|
|
Ecuador Government International Bond |
|
0.000% due 07/31/2030 (h)(m) |
|
$ |
|
|
11,400 |
|
|
| |
|
8,311 |
|
6.900% due 07/31/2030 (m) |
|
| |
|
17,686 |
|
|
| |
|
15,386 |
|
|
Egypt Government International Bond |
|
6.375% due 04/11/2031 (m) |
|
EUR |
|
|
13,100 |
|
|
| |
|
14,352 |
|
|
El Salvador Government International Bond |
|
9.250% due 04/17/2030 (m) |
|
$ |
|
|
20,000 |
|
|
| |
|
21,225 |
|
9.650% due 11/21/2054 (m) |
|
| |
|
9,200 |
|
|
| |
|
9,499 |
|
|
Ghana Government International Bond |
|
0.000% due 07/03/2026 (h)(m) |
|
| |
|
273 |
|
|
| |
|
266 |
|
0.000% due 01/03/2030 (h)(m) |
|
| |
|
609 |
|
|
| |
|
510 |
|
5.000% due 07/03/2029 (m) |
|
| |
|
2,756 |
|
|
| |
|
2,591 |
|
5.000% due 07/03/2035 (m) |
|
| |
|
3,963 |
|
|
| |
|
3,093 |
|
|
Peru Government International Bond |
|
| |
|
PEN |
|
|
100 |
|
|
| |
|
24 |
|
| |
|
| |
|
1 |
|
|
| |
|
0 |
|
| |
|
| |
|
5 |
|
|
| |
|
1 |
|
| |
|
| |
|
15 |
|
|
| |
|
4 |
|
| |
|
| |
|
4 |
|
|
| |
|
1 |
|
|
|
|
|
|
|
|
|
|
|
|
|
| |
| See Accompanying Notes |
|
|
ANNUAL REPORT |
|
|
| |
|
|
JUNE 30, 2025 |
|
|
87 |
|
|
|
|
|
|
| |
Consolidated Schedule of Investments |
|
PIMCO Dynamic Income Fund |
|
|
|
|
|
|
|
|
|
|
|
|
|
|
|
|
| |
| |
|
|
|
PRINCIPAL
AMOUNT
(000S) |
|
|
|
|
MARKET
VALUE
(000S) |
|
|
Republic of Kenya Government International Bond |
|
| |
|
$ |
|
|
1,600 |
|
|
$ |
|
|
1,511 |
|
|
Republic of Uzbekistan International Bond |
|
| |
|
EUR |
|
|
5,000 |
|
|
| |
|
6,037 |
|
|
Romania Government International Bond |
|
5.125% due 09/24/2031 (m) |
|
|
3,090 |
|
|
| |
|
3,598 |
|
5.250% due 03/10/2030 (m) |
|
|
15,000 |
|
|
| |
|
18,063 |
|
| |
|
| |
|
200 |
|
|
| |
|
232 |
|
5.375% due 03/22/2031 (m) |
|
|
2,620 |
|
|
| |
|
3,100 |
|
5.625% due 02/22/2036 (m) |
|
|
1,060 |
|
|
| |
|
1,190 |
|
5.625% due 05/30/2037 (m) |
|
|
3,200 |
|
|
| |
|
3,553 |
|
| |
|
| |
|
21,200 |
|
|
| |
|
25,226 |
|
| |
|
| |
|
53,000 |
|
|
| |
|
63,063 |
|
6.375% due 09/18/2033 (m) |
|
|
2,600 |
|
|
| |
|
3,157 |
|
|
Russia Government International Bond |
|
| |
|
$ |
|
|
600 |
|
|
| |
|
0 |
|
| |
|
| |
|
10,200 |
|
|
| |
|
7,140 |
|
| |
|
| |
|
200 |
|
|
| |
|
137 |
|
|
Turkiye Government International Bond |
|
| |
|
TRY |
|
|
1,484,300 |
|
|
| |
|
35,800 |
|
| |
|
|
1,700 |
|
|
| |
|
43 |
|
| |
|
|
1,300 |
|
|
| |
|
33 |
|
| |
|
|
276,200 |
|
|
| |
|
6,729 |
|
|
Ukraine Government International Bond |
|
0.000% due 02/01/2030 (i) |
|
$ |
|
|
605 |
|
|
| |
|
293 |
|
0.000% due 02/01/2034 (i) |
|
|
2,262 |
|
|
| |
|
878 |
|
0.000% due 02/01/2035 (i) |
|
|
1,912 |
|
|
| |
|
908 |
|
0.000% due 02/01/2036 (i) |
|
|
1,593 |
|
|
| |
|
753 |
|
| |
|
| |
|
3,223 |
|
|
| |
|
1,676 |
|
| |
|
| |
|
3,879 |
|
|
| |
|
1,990 |
|
| |
|
| |
|
3,980 |
|
|
| |
|
1,990 |
|
|
| |
|
8.750% due 05/07/2030 (m) |
|
|
9,550 |
|
|
| |
|
9,844 |
|
|
Venezuela Government International Bond |
|
9.250% due 09/15/2027 ^(e) |
|
|
734 |
|
|
| |
|
150 |
|
|
| |
| |
|
|
| |
| |
|
|
|
Total Sovereign Issues (Cost $420,136) |
|
|
|
|
|
| |
|
|
|
|
| |
| |
|
|
|
SHARES |
|
|
|
|
|
|
|
|
|
| |
COMMUNICATION SERVICES 1.1% |
|
|
|
|
| |
Clear Channel Outdoor Holdings, Inc. (f) |
|
|
4,853,248 |
|
|
| |
|
5,678 |
|
|
|
|
| |
iHeartMedia, Inc. ‘A’ (f) |
|
|
2,021,190 |
|
|
| |
|
3,557 |
|
|
|
|
| |
Promotora de Informaciones SA ‘A’ (f) |
|
|
4,079,279 |
|
|
| |
|
1,826 |
|
|
|
|
| |
Windstream Services LLC «(f) |
|
|
3,155,914 |
|
|
| |
|
61,862 |
|
|
| |
| |
|
|
| |
| |
|
|
|
|
| |
| |
|
|
| |
| |
|
72,923 |
|
|
| |
| |
|
|
| |
| |
|
|
|
|
| |
CONSUMER DISCRETIONARY 0.0% |
|
|
|
|
|
| |
Caesars Entertainment, Inc. (f) |
|
| |
|
2 |
|
|
| |
|
0 |
|
|
|
|
| |
Desarrolladora Homex SAB de CV (f) |
|
|
719,113 |
|
|
| |
|
0 |
|
|
|
|
| |
| |
|
|
43,000 |
|
|
| |
|
272 |
|
|
| |
| |
|
|
| |
| |
|
|
|
|
| |
| |
|
|
| |
| |
|
272 |
|
|
| |
| |
|
|
| |
| |
|
|
|
|
| |
|
|
|
|
|
|
| |
Steinhoff International Holdings NV «(f)(k) |
|
| |
|
299,163,217 |
|
|
| |
|
0 |
|
|
| |
| |
|
|
| |
| |
|
|
|
|
| |
|
|
|
|
|
|
| |
Banca Monte dei Paschi di Siena SpA |
|
| |
|
6,139,000 |
|
|
| |
|
52,225 |
|
|
|
|
|
| |
Corestate Capital Holding SA (f)(k) |
|
| |
|
843,935 |
|
|
| |
|
0 |
|
|
|
|
|
| |
Intelsat Emergence SA «(k) |
|
| |
|
1,755,353 |
|
|
| |
|
60,554 |
|
|
|
|
|
|
|
|
|
|
|
|
|
| |
| |
|
|
|
SHARES |
|
|
|
|
MARKET
VALUE
(000S) |
|
|
|
|
|
| |
MNSN Holdings, Inc. «(f)(k) |
|
| |
|
25,645 |
|
|
$ |
|
|
103 |
|
|
|
|
|
| |
| |
|
| |
|
12,342 |
|
|
| |
|
418 |
|
|
| |
| |
|
|
| |
| |
|
|
|
|
| |
| |
|
|
| |
| |
|
113,300 |
|
|
| |
| |
|
|
| |
| |
|
|
|
|
| |
|
|
|
|
|
|
| |
| |
|
| |
|
263,557 |
|
|
| |
|
5,403 |
|
|
|
|
|
| |
Mcdermott International Ltd. (f) |
|
| |
|
4,683 |
|
|
| |
|
52 |
|
|
|
|
|
| |
Westmoreland Mining Holdings «(f)(k) |
|
| |
|
238,883 |
|
|
| |
|
149 |
|
|
|
|
|
| |
Westmoreland Mining LLC «(f)(k) |
|
| |
|
240,987 |
|
|
| |
|
565 |
|
|
| |
| |
|
|
| |
| |
|
|
|
|
| |
| |
|
|
| |
| |
|
6,169 |
|
|
| |
| |
|
|
| |
| |
|
|
|
Total Common Stocks (Cost $248,831) |
|
|
|
|
|
| |
|
|
|
|
| |
|
|
|
| |
COMMUNICATION SERVICES 0.2% |
|
|
|
|
|
| |
Windstream - Exp. 04/08/2060 « |
|
| |
|
627,561 |
|
|
| |
|
12,301 |
|
|
| |
| |
|
|
| |
| |
|
|
|
|
| |
CONSUMER DISCRETIONARY 0.0% |
|
|
|
|
|
| |
West Marine - Exp. 09/11/2028 |
|
| |
|
5,580 |
|
|
| |
|
0 |
|
|
| |
| |
|
|
| |
| |
|
|
|
|
| |
|
|
|
|
|
|
| |
Intelsat Emergence SA - Exp. 02/17/2027 « |
|
| |
|
13,833 |
|
|
| |
|
28 |
|
|
| |
| |
|
|
| |
| |
|
|
|
Total Warrants (Cost $51,657) |
|
|
|
|
|
| |
|
|
|
|
| |
PREFERRED SECURITIES 2.0% |
|
|
| |
|
|
|
|
|
|
| |
| |
|
| |
|
10,224,514 |
|
|
| |
|
0 |
|
|
| |
|
6.268% (US0003M + 1.750%) due 01/15/2067 ~(m) |
|
| |
|
35,500,000 |
|
|
| |
|
24,818 |
|
|
| |
|
5.250% due 06/15/2026 •(j)(m) |
|
| |
|
10,000,000 |
|
|
| |
|
9,712 |
|
|
| |
|
5.000% due 03/15/2026 •(j)(m) |
|
| |
|
4,300,000 |
|
|
| |
|
4,321 |
|
|
| |
|
4.875% due 08/15/2026 •(j)(m) |
|
| |
|
1,900,000 |
|
|
| |
|
1,848 |
|
|
| |
|
| |
|
| |
|
0 |
|
|
| |
|
770 |
|
| |
|
| |
|
4,645 |
|
|
| |
|
997 |
|
|
| |
| |
|
|
| |
| |
|
|
|
|
| |
| |
|
|
| |
| |
|
42,466 |
|
|
| |
| |
|
|
| |
| |
|
|
|
|
| |
|
|
|
|
|
|
| |
| |
|
| |
|
528 |
|
|
| |
|
53,690 |
|
|
| |
|
| |
|
| |
|
157,800 |
|
|
| |
|
2,790 |
|
|
| |
|
0.000% due 11/07/2032 (h) |
|
| |
|
167,720 |
|
|
| |
|
3 |
|
| |
|
| |
|
29,233 |
|
|
| |
|
15,493 |
|
|
|
|
|
| |
Syniverse Holdings, Inc. «(k) |
|
| |
|
22,170,889 |
|
|
| |
|
20,983 |
|
|
| |
| |
|
|
| |
| |
|
|
|
|
| |
| |
|
|
| |
| |
|
92,959 |
|
|
| |
| |
|
|
| |
| |
|
|
|
Total Preferred Securities
(Cost $137,351) |
|
|
|
|
|
| |
|
|
|
|
| |
|
|
|
|
|
|
|
|
|
|
|
|
| |
| |
|
|
|
|
|
|
|
|
|
|
REAL ESTATE INVESTMENT TRUSTS 0.4% |
|
|
| |
|
|
|
|
|
|
| |
| |
|
| |
|
1,591,211 |
|
|
$ |
|
|
6,874 |
|
|
|
|
|
| |
| |
|
| |
|
711,293 |
|
|
| |
|
23,188 |
|
|
| |
| |
|
|
| |
| |
|
|
|
Total Real Estate Investment Trusts
(Cost $18,729) |
|
|
|
|
|
| |
|
|
|
|
| |
| |
|
|
|
|
|
|
|
|
|
|
SHORT-TERM INSTRUMENTS 3.6% |
|
|
| |
REPURCHASE AGREEMENTS (l) 2.5% |
|
|
| |
| |
|
|
| |
| |
|
166,689 |
|
|
| |
| |
|
|
| |
| |
|
|
|
|
| |
NIGERIA TREASURY BILLS 0.1% |
|
33.141% due 06/11/2026 - 06/12/2026 (g)(h) |
|
NGN |
|
|
6,754,900 |
|
|
| |
|
3,575 |
|
|
| |
| |
|
|
| |
| |
|
|
|
|
| |
|
|
4.329% due 07/10/2025 - 10/21/2025 (g)(h)(o)(q) |
|
$ |
|
|
64,180 |
|
|
| |
|
63,695 |
|
|
| |
| |
|
|
| |
| |
|
|
|
Total Short-Term Instruments
|
|
|
|
|
|
| |
|
|
|
|
|
|
|
| |
|
| |
| |
|
|
| |
| |
|
| |
Total Investments in Securities
|
|
|
|
|
|
| |
|
|
|
|
| |
| |
|
|
|
|
|
|
|
|
|
|
INVESTMENTS IN AFFILIATES 14.4% |
|
|
| |
|
|
|
| |
AFFILIATED INVESTMENTS 4.8% |
|
|
|
|
|
| |
| |
|
| |
|
3,517,243 |
|
|
| |
|
158,792 |
|
|
|
|
|
| |
Incora New Equity «(f)(k) |
|
| |
|
2,316,329 |
|
|
| |
|
78,258 |
|
|
|
|
|
| |
| |
|
| |
|
78,208,859 |
|
|
| |
|
76,985 |
|
|
|
|
|
| |
| |
|
| |
|
24,221,572 |
|
|
| |
|
2,853 |
|
|
|
|
|
| |
Sierra Hamilton Holder LLC «(f)(k) |
|
| |
|
30,337,712 |
|
|
| |
|
3 |
|
|
| |
| |
|
|
| |
| |
|
|
|
|
| |
| |
|
|
| |
| |
|
316,891 |
|
|
| |
| |
|
|
| |
| |
|
|
|
Total Common Stocks (Cost $345,383) |
|
|
|
|
|
| |
|
|
|
|
| |
SHORT-TERM INSTRUMENTS 9.6% |
|
|
| |
CENTRAL FUNDS USED FOR CASH MANAGEMENT PURPOSES 9.6% |
|
|
|
|
|
| |
PIMCO Short-Term Floating NAV Portfolio III |
|
| |
|
65,210,690 |
|
|
| |
|
634,957 |
|
|
| |
| |
|
|
| |
| |
|
|
|
Total Short-Term Instruments
(Cost $634,933) |
|
|
|
|
|
| |
|
|
|
|
|
|
|
| |
|
| |
| |
|
|
| |
| |
|
| |
Total Investments in Affiliates
(Cost $980,316) |
|
|
|
|
|
|
|
|
| |
|
| |
| |
|
|
| |
| |
|
| |
Total Investments 147.2%
(Cost $10,752,896) |
|
|
$ |
|
|
|
|
|
| |
Financial Derivative
Instruments (n)(p) (0.7)% (Cost or Premiums, net $33,850) |
|
|
| |
|
|
|
|
| |
Other Assets and Liabilities, net (46.5)% |
|
|
|
|
|
| |
|
|
|
|
|
|
$ |
|
|
|
|
|
|
| |
| |
|
|
|
NOTES TO CONSOLIDATED SCHEDULE OF INVESTMENTS:
|
A zero balance may reflect actual amounts rounding to less than one thousand. |
|
Represents co-investment made with Company’s affiliates in accordance with the terms of the exemptive relief received from the U.S. Securities and Exchange Commission. See Note 10, Related Party Transactions in the Notes to Consolidated Financial Statements. |
|
Security valued using significant unobservable inputs (Level 3). |
|
All or a portion of this amount represents unfunded loan commitments. The interest rate for the unfunded portion will be determined at the time of funding. See Note 4, Securities and Other Investments, in the Notes to Financial Statements for more information regarding unfunded loan commitments. |
|
Variable or Floating rate security. Rate shown is the rate in effect as of period end. Certain variable rate securities are not based on a published reference rate and spread, rather are determined by the issuer or agent and are based on current market conditions. Reference rate is as of reset date, which may vary by security. These securities may not indicate a reference rate and/or spread in their description. |
|
Rate shown is the rate in effect as of period end. The rate may be based on a fixed rate, a capped rate or a floor rate and may convert to a variable or floating rate in the future. These securities do not indicate a reference rate and spread in their description. |
|
Coupon represents a rate which changes periodically based on a predetermined schedule or event. Rate shown is the rate in effect as of period end. |
|
Insurance-Linked Investments. |
|
Security is an Interest Only (“IO”) or IO Strip. |
|
Payment in-kind security. |
|
Security is not accruing income as of the date of this report. |
|
Security did not produce income within the last twelve months. |
|
Coupon represents a weighted average yield to maturity. |
|
Security becomes interest bearing at a future date. |
|
Perpetual maturity; date shown, if applicable, represents next contractual call date. |
(k) RESTRICTED SECURITIES:
|
|
|
|
|
|
|
|
|
|
|
|
|
|
|
|
| |
|
|
|
|
|
|
|
|
|
|
|
Market Value
as Percentage
of Net Assets |
|
| |
|
|
|
|
|
$ |
146,968 |
|
|
$ |
158,792 |
|
|
|
2.39 |
% |
| |
|
|
12/09/2024 - 03/10/2025 |
|
|
|
2,367 |
|
|
|
2,790 |
|
|
|
0.04 |
|
Corestate Capital Holding SA |
|
|
8/22/2023 |
|
|
|
0 |
|
|
|
0 |
|
|
|
0.00 |
|
| |
|
|
01/31/2025 |
|
|
|
112,516 |
|
|
|
78,258 |
|
|
|
1.18 |
|
Incora Top Holdco LLC 6.000% due 01/30/2033 |
|
|
1/31/2025 |
|
|
|
49,687 |
|
|
|
68,890 |
|
|
|
1.04 |
|
| |
|
|
06/19/2017 - 02/23/2024 |
|
|
|
114,056 |
|
|
|
60,554 |
|
|
|
0.91 |
|
| |
|
|
03/16/2023 - 03/29/2023 |
|
|
|
285 |
|
|
|
103 |
|
|
|
0.00 |
|
| |
|
|
3/13/2024 |
|
|
|
78,209 |
|
|
|
76,985 |
|
|
|
1.16 |
|
Sierra Hamilton Holder LLC |
|
|
7/31/2017 |
|
|
|
7,690 |
|
|
|
3 |
|
|
|
0.00 |
|
Steinhoff International Holdings NV |
|
|
06/30/2023 - 10/30/2023 |
|
|
|
0 |
|
|
|
0 |
|
|
|
0.00 |
|
| |
|
|
05/12/2022 - 05/30/2025 |
|
|
|
21,864 |
|
|
|
20,983 |
|
|
|
0.32 |
|
Towd Point Mortgage Trust 0.000% due 10/25/2059 |
|
|
5/28/2025 |
|
|
|
104 |
|
|
|
0 |
|
|
|
0.00 |
|
Ubisoft Entertainment SA 3.561% due 12/22/2025 |
|
|
3/11/2025 |
|
|
|
5,819 |
|
|
|
6,308 |
|
|
|
0.09 |
|
| |
|
|
9/12/2023 |
|
|
|
618 |
|
|
|
272 |
|
|
|
0.00 |
|
Westmoreland Mining Holdings |
|
|
12/08/2014 - 03/26/2019 |
|
|
|
6,949 |
|
|
|
149 |
|
|
|
0.00 |
|
| |
|
|
6/30/2023 |
|
|
|
1,597 |
|
|
|
565 |
|
|
|
0.01 |
|
|
| |
|
|
|
|
|
|
|
|
|
|
|
|
|
|
|
|
|
| |
$ |
548,729 |
|
|
$ |
474,652 |
|
|
|
7.14 |
% |
|
| |
|
|
| |
|
|
|
|
|
|
|
|
|
|
|
BORROWINGS AND OTHER FINANCING TRANSACTIONS
(l) REPURCHASE AGREEMENTS:
|
|
|
|
|
|
|
|
|
|
|
|
|
|
|
|
|
|
|
|
|
|
|
|
|
|
|
|
|
|
| |
|
|
|
|
|
|
|
|
|
|
|
|
|
|
|
|
|
|
|
Repurchase
Agreements,
at Value |
|
|
Repurchase Agreement Proceeds to be Received (1) |
|
JPS |
|
|
4.400 |
% |
|
|
07/30/2024 |
|
|
|
TBD |
|
|
$ |
166,689 |
|
|
U.S. Treasury Bonds 1.375% - 3.875% due 08/15/2040 - 11/15/2040 |
|
$ |
(167,195 |
) |
|
$ |
166,689 |
|
|
$ |
173,912 |
|
|
| |
|
|
| |
|
|
| |
|
|
| |
|
|
| |
| |
|
|
|
|
|
|
|
|
|
|
|
Total Repurchase Agreements |
|
|
| |
|
|
|
|
|
|
|
|
|
|
|
|
| |
|
|
| |
|
|
| |
|
|
| |
|
|
| |
| |
|
|
|
|
|
|
|
|
|
|
|
|
|
|
|
|
|
|
|
|
|
|
|
| |
See Accompanying Notes |
|
|
|
|
|
| |
|
|
JUNE 30, 2025 |
|
|
|
|
|
|
|
|
|
| |
Consolidated Schedule of Investments |
|
PIMCO Dynamic Income Fund |
|
|
|
|
REVERSE REPURCHASE AGREEMENTS:
|
|
|
|
|
|
|
|
|
|
|
|
|
|
|
|
|
|
|
|
|
|
| |
|
|
|
|
|
|
|
|
|
|
|
|
|
|
Payable for
Reverse
Repurchase
Agreements |
|
| |
|
|
5.490 |
% |
|
|
03/17/2025 |
|
|
|
09/15/2025 |
|
|
$ |
|
|
(2,007 |
) |
|
$ |
(2,039 |
) |
|
| |
|
5.490 |
|
|
|
04/22/2025 |
|
|
|
10/21/2025 |
|
|
| |
|
(81,916 |
) |
|
|
(82,779 |
) |
|
| |
|
5.490 |
|
|
|
05/01/2025 |
|
|
|
11/03/2025 |
|
|
| |
|
(49,614 |
) |
|
|
(50,073 |
) |
|
| |
|
5.490 |
|
|
|
06/11/2025 |
|
|
|
12/09/2025 |
|
|
| |
|
(3,661 |
) |
|
|
(3,672 |
) |
|
| |
|
5.490 |
|
|
|
06/27/2025 |
|
|
|
12/26/2025 |
|
|
| |
|
(18,457 |
) |
|
|
(18,468 |
) |
| |
|
|
5.090 |
|
|
|
06/27/2025 |
|
|
|
10/29/2025 |
|
|
| |
|
(16,142 |
) |
|
|
(16,151 |
) |
|
| |
|
5.390 |
|
|
|
06/27/2025 |
|
|
|
10/29/2025 |
|
|
| |
|
(11,044 |
) |
|
|
(11,051 |
) |
|
| |
|
5.490 |
|
|
|
06/27/2025 |
|
|
|
10/29/2025 |
|
|
| |
|
(3,071 |
) |
|
|
(3,073 |
) |
|
| |
|
5.540 |
|
|
|
06/27/2025 |
|
|
|
10/29/2025 |
|
|
| |
|
(4,055 |
) |
|
|
(4,057 |
) |
|
| |
|
5.590 |
|
|
|
06/27/2025 |
|
|
|
10/29/2025 |
|
|
| |
|
(4,729 |
) |
|
|
(4,732 |
) |
| |
|
|
5.820 |
|
|
|
04/22/2025 |
|
|
|
07/02/2025 |
|
|
| |
|
(4,318 |
) |
|
|
(4,326 |
) |
| |
|
|
2.439 |
|
|
|
05/08/2025 |
|
|
|
09/08/2025 |
|
|
EUR |
|
|
(3,890 |
) |
|
|
(4,599 |
) |
|
| |
|
2.680 |
|
|
|
06/17/2025 |
|
|
|
07/07/2025 |
|
|
| |
|
(2,852 |
) |
|
|
(3,363 |
) |
|
| |
|
4.490 |
|
|
|
03/11/2025 |
|
|
|
TBD |
|
|
$ |
|
|
(4,075 |
) |
|
|
(4,132 |
) |
|
| |
|
4.730 |
|
|
|
06/16/2025 |
|
|
|
TBD |
|
|
| |
|
(12,789 |
) |
|
|
(12,815 |
) |
|
| |
|
4.780 |
|
|
|
04/14/2025 |
|
|
|
07/14/2025 |
|
|
| |
|
(9,302 |
) |
|
|
(9,398 |
) |
|
| |
|
4.870 |
|
|
|
06/10/2025 |
|
|
|
08/11/2025 |
|
|
| |
|
(36,029 |
) |
|
|
(36,131 |
) |
|
| |
|
4.880 |
|
|
|
04/14/2025 |
|
|
|
07/14/2025 |
|
|
| |
|
(1,095 |
) |
|
|
(1,107 |
) |
|
| |
|
4.890 |
|
|
|
06/24/2025 |
|
|
|
09/24/2025 |
|
|
| |
|
(1,168 |
) |
|
|
(1,170 |
) |
|
| |
|
4.940 |
|
|
|
06/10/2025 |
|
|
|
08/11/2025 |
|
|
| |
|
(3,078 |
) |
|
|
(3,087 |
) |
|
| |
|
4.944 |
|
|
|
05/21/2025 |
|
|
|
09/22/2025 |
|
|
GBP |
|
|
(7,653 |
) |
|
|
(10,563 |
) |
|
| |
|
4.970 |
|
|
|
04/14/2025 |
|
|
|
07/14/2025 |
|
|
$ |
|
|
(16,623 |
) |
|
|
(16,802 |
) |
|
| |
|
5.140 |
|
|
|
05/15/2025 |
|
|
|
11/12/2025 |
|
|
| |
|
(18,696 |
) |
|
|
(18,828 |
) |
|
| |
|
5.320 |
|
|
|
04/25/2025 |
|
|
|
10/23/2025 |
|
|
| |
|
(4,905 |
) |
|
|
(4,952 |
) |
|
| |
|
5.470 |
|
|
|
04/25/2025 |
|
|
|
10/23/2025 |
|
|
| |
|
(2,129 |
) |
|
|
(2,150 |
) |
|
| |
|
5.570 |
|
|
|
05/15/2025 |
|
|
|
11/12/2025 |
|
|
| |
|
(1,310 |
) |
|
|
(1,320 |
) |
|
| |
|
5.600 |
|
|
|
04/25/2025 |
|
|
|
10/23/2025 |
|
|
| |
|
(701 |
) |
|
|
(708 |
) |
|
| |
|
5.610 |
|
|
|
05/15/2025 |
|
|
|
11/12/2025 |
|
|
| |
|
(3,990 |
) |
|
|
(4,019 |
) |
|
| |
|
5.620 |
|
|
|
04/25/2025 |
|
|
|
10/23/2025 |
|
|
| |
|
(128,564 |
) |
|
|
(129,882 |
) |
|
| |
|
5.620 |
|
|
|
05/15/2025 |
|
|
|
11/12/2025 |
|
|
| |
|
(28,515 |
) |
|
|
(28,721 |
) |
|
| |
|
5.820 |
|
|
|
04/22/2025 |
|
|
|
07/22/2025 |
|
|
| |
|
(3,374 |
) |
|
|
(3,412 |
) |
| |
|
|
1.000 |
|
|
|
06/11/2025 |
|
|
|
TBD |
|
|
EUR |
|
|
(6,766 |
) |
|
|
(7,974 |
) |
|
| |
|
1.300 |
|
|
|
06/11/2025 |
|
|
|
TBD |
|
|
| |
|
(18,945 |
) |
|
|
(22,332 |
) |
|
| |
|
1.500 |
|
|
|
06/11/2025 |
|
|
|
TBD |
|
|
| |
|
(1,413 |
) |
|
|
(1,665 |
) |
|
| |
|
2.080 |
|
|
|
06/11/2025 |
|
|
|
TBD |
|
|
| |
|
(900 |
) |
|
|
(1,062 |
) |
|
| |
|
4.250 |
|
|
|
03/03/2025 |
|
|
|
TBD |
|
|
$ |
|
|
(9,814 |
) |
|
|
(9,953 |
) |
|
| |
|
4.330 |
|
|
|
06/10/2025 |
|
|
|
TBD |
|
|
| |
|
(2,237 |
) |
|
|
(2,242 |
) |
|
| |
|
4.550 |
|
|
|
04/08/2025 |
|
|
|
TBD |
|
|
| |
|
(3,591 |
) |
|
|
(3,629 |
) |
|
| |
|
4.600 |
|
|
|
12/20/2024 |
|
|
|
TBD |
|
|
| |
|
(1,137 |
) |
|
|
(1,165 |
) |
|
| |
|
4.750 |
|
|
|
06/09/2025 |
|
|
|
TBD |
|
|
| |
|
(27,048 |
) |
|
|
(27,048 |
) |
|
| |
|
4.770 |
|
|
|
06/06/2025 |
|
|
|
07/07/2025 |
|
|
| |
|
(7,788 |
) |
|
|
(7,813 |
) |
|
| |
|
4.770 |
|
|
|
06/12/2025 |
|
|
|
07/14/2025 |
|
|
| |
|
(3,311 |
) |
|
|
(3,319 |
) |
|
| |
|
5.010 |
|
|
|
06/17/2025 |
|
|
|
09/17/2025 |
|
|
| |
|
(19,333 |
) |
|
|
(19,370 |
) |
|
| |
|
5.210 |
|
|
|
04/04/2025 |
|
|
|
10/01/2025 |
|
|
| |
|
(25,591 |
) |
|
|
(25,917 |
) |
|
| |
|
5.260 |
|
|
|
04/04/2025 |
|
|
|
10/01/2025 |
|
|
| |
|
(18,350 |
) |
|
|
(18,586 |
) |
|
| |
|
5.280 |
|
|
|
04/03/2025 |
|
|
|
07/03/2025 |
|
|
| |
|
(348 |
) |
|
|
(352 |
) |
|
| |
|
5.292 |
|
|
|
06/18/2025 |
|
|
|
09/18/2025 |
|
|
GBP |
|
|
(21,016 |
) |
|
|
(28,902 |
) |
|
| |
|
5.300 |
|
|
|
04/10/2025 |
|
|
|
07/10/2025 |
|
|
$ |
|
|
(17,713 |
) |
|
|
(17,927 |
) |
|
| |
|
5.300 |
|
|
|
07/03/2025 |
|
|
|
10/01/2025 |
|
|
| |
|
(335 |
) |
|
|
(335 |
) |
|
| |
|
5.310 |
|
|
|
04/04/2025 |
|
|
|
10/01/2025 |
|
|
| |
|
(19,195 |
) |
|
|
(19,444 |
) |
|
| |
|
5.360 |
|
|
|
04/04/2025 |
|
|
|
10/01/2025 |
|
|
| |
|
(19,407 |
) |
|
|
(19,662 |
) |
|
| |
|
5.390 |
|
|
|
06/30/2025 |
|
|
|
10/28/2025 |
|
|
| |
|
(14,693 |
) |
|
|
(14,695 |
) |
|
| |
|
5.410 |
|
|
|
05/05/2025 |
|
|
|
08/05/2025 |
|
|
| |
|
(1,400 |
) |
|
|
(1,412 |
) |
|
| |
|
5.490 |
|
|
|
06/26/2025 |
|
|
|
10/23/2025 |
|
|
| |
|
(133,862 |
) |
|
|
(133,963 |
) |
|
| |
|
5.490 |
|
|
|
06/27/2025 |
|
|
|
10/27/2025 |
|
|
| |
|
(537 |
) |
|
|
(538 |
) |
|
| |
|
5.530 |
|
|
|
05/27/2025 |
|
|
|
08/27/2025 |
|
|
| |
|
(12,082 |
) |
|
|
(12,147 |
) |
|
| |
|
5.590 |
|
|
|
06/06/2025 |
|
|
|
10/07/2025 |
|
|
| |
|
(2,416 |
) |
|
|
(2,425 |
) |
|
| |
|
5.590 |
|
|
|
06/11/2025 |
|
|
|
10/10/2025 |
|
|
| |
|
(5,599 |
) |
|
|
(5,616 |
) |
|
| |
|
5.590 |
|
|
|
06/24/2025 |
|
|
|
10/22/2025 |
|
|
| |
|
(9,448 |
) |
|
|
(9,458 |
) |
|
| |
|
5.590 |
|
|
|
06/27/2025 |
|
|
|
10/27/2025 |
|
|
| |
|
(37,093 |
) |
|
|
(37,115 |
) |
|
| |
|
5.690 |
|
|
|
06/27/2025 |
|
|
|
10/27/2025 |
|
|
| |
|
(1,226 |
) |
|
|
(1,227 |
) |
| |
|
|
4.780 |
|
|
|
06/06/2025 |
|
|
|
07/03/2025 |
|
|
| |
|
(169 |
) |
|
|
(170 |
) |
| |
|
|
4.700 |
|
|
|
05/19/2025 |
|
|
|
TBD |
|
|
| |
|
(1,322 |
) |
|
|
(1,329 |
) |
|
| |
|
4.890 |
|
|
|
04/10/2025 |
|
|
|
07/10/2025 |
|
|
| |
|
(3,977 |
) |
|
|
(4,022 |
) |
|
| |
|
4.890 |
|
|
|
04/21/2025 |
|
|
|
07/21/2025 |
|
|
| |
|
(31,950 |
) |
|
|
(32,255 |
) |
|
| |
|
4.890 |
|
|
|
06/06/2025 |
|
|
|
07/03/2025 |
|
|
| |
|
(94,205 |
) |
|
|
(94,520 |
) |
|
| |
|
4.940 |
|
|
|
04/09/2025 |
|
|
|
10/08/2025 |
|
|
| |
|
(45,805 |
) |
|
|
(46,320 |
) |
|
| |
|
4.940 |
|
|
|
05/20/2025 |
|
|
|
11/17/2025 |
|
|
| |
|
(21,222 |
) |
|
|
(21,342 |
) |
|
|
|
|
|
|
| |
90 |
|
PIMCO CLOSED-END FUNDS |
|
|
See Accompanying Notes |
|
|
|
|
|
|
|
|
|
|
|
|
|
|
|
|
|
|
|
|
|
|
|
| |
Counterparty |
|
|
|
|
Settlement
Date |
|
|
Maturity
Date |
|
|
|
|
|
Payable for
Reverse
Repurchase
Agreements |
|
| |
|
|
4.790 |
% |
|
|
04/28/2025 |
|
|
|
07/28/2025 |
|
|
$ |
|
|
(10,381 |
) |
|
$ |
(10,470 |
) |
|
| |
|
4.790 |
|
|
|
07/03/2025 |
|
|
|
10/01/2025 |
|
|
| |
|
(5,240 |
) |
|
|
(5,240 |
) |
|
| |
|
4.800 |
|
|
|
04/04/2025 |
|
|
|
07/03/2025 |
|
|
| |
|
(5,277 |
) |
|
|
(5,339 |
) |
|
| |
|
4.890 |
|
|
|
03/18/2025 |
|
|
|
07/16/2025 |
|
|
| |
|
(16,661 |
) |
|
|
(16,894 |
) |
|
| |
|
4.890 |
|
|
|
03/28/2025 |
|
|
|
07/16/2025 |
|
|
| |
|
(3,049 |
) |
|
|
(3,089 |
) |
|
| |
|
4.890 |
|
|
|
04/02/2025 |
|
|
|
07/16/2025 |
|
|
| |
|
(418 |
) |
|
|
(423 |
) |
|
| |
|
4.890 |
|
|
|
06/11/2025 |
|
|
|
10/10/2025 |
|
|
| |
|
(3,878 |
) |
|
|
(3,888 |
) |
|
| |
|
4.890 |
|
|
|
06/20/2025 |
|
|
|
10/17/2025 |
|
|
| |
|
(30,552 |
) |
|
|
(30,597 |
) |
|
| |
|
4.890 |
|
|
|
06/23/2025 |
|
|
|
10/21/2025 |
|
|
| |
|
(32,439 |
) |
|
|
(32,474 |
) |
|
| |
|
5.070 |
|
|
|
05/08/2025 |
|
|
|
07/08/2025 |
|
|
| |
|
(535 |
) |
|
|
(539 |
) |
|
| |
|
5.170 |
|
|
|
05/08/2025 |
|
|
|
07/08/2025 |
|
|
| |
|
(3,927 |
) |
|
|
(3,957 |
) |
|
| |
|
5.190 |
|
|
|
06/11/2025 |
|
|
|
10/10/2025 |
|
|
| |
|
(7,203 |
) |
|
|
(7,223 |
) |
|
| |
|
5.290 |
|
|
|
06/11/2025 |
|
|
|
10/10/2025 |
|
|
| |
|
(11,898 |
) |
|
|
(11,932 |
) |
|
| |
|
5.340 |
|
|
|
06/11/2025 |
|
|
|
10/10/2025 |
|
|
| |
|
(516 |
) |
|
|
(517 |
) |
|
| |
|
5.390 |
|
|
|
06/11/2025 |
|
|
|
10/10/2025 |
|
|
| |
|
(499 |
) |
|
|
(501 |
) |
|
| |
|
5.440 |
|
|
|
06/11/2025 |
|
|
|
10/10/2025 |
|
|
| |
|
(1,556 |
) |
|
|
(1,561 |
) |
| |
|
|
5.575 |
|
|
|
04/24/2025 |
|
|
|
10/20/2025 |
|
|
| |
|
(2,820 |
) |
|
|
(2,849 |
) |
| |
|
|
2.780 |
|
|
|
04/11/2025 |
|
|
|
07/09/2025 |
|
|
EUR |
|
|
(9,101 |
) |
|
|
(10,785 |
) |
|
| |
|
4.650 |
|
|
|
03/12/2025 |
|
|
|
TBD |
|
|
$ |
|
|
(7,684 |
) |
|
|
(7,794 |
) |
|
| |
|
4.650 |
|
|
|
03/24/2025 |
|
|
|
TBD |
|
|
| |
|
(8,925 |
) |
|
|
(9,039 |
) |
|
| |
|
4.700 |
|
|
|
03/12/2025 |
|
|
|
TBD |
|
|
| |
|
(44,075 |
) |
|
|
(44,714 |
) |
|
| |
|
4.700 |
|
|
|
04/10/2025 |
|
|
|
TBD |
|
|
| |
|
(7,860 |
) |
|
|
(7,944 |
) |
|
| |
|
4.870 |
|
|
|
06/27/2025 |
|
|
|
07/25/2025 |
|
|
| |
|
(57,433 |
) |
|
|
(57,472 |
) |
|
| |
|
5.014 |
|
|
|
06/06/2025 |
|
|
|
08/01/2025 |
|
|
| |
|
(2,635 |
) |
|
|
(2,644 |
) |
|
| |
|
5.015 |
|
|
|
06/16/2025 |
|
|
|
08/15/2025 |
|
|
| |
|
(3,904 |
) |
|
|
(3,912 |
) |
|
| |
|
5.020 |
|
|
|
06/24/2025 |
|
|
|
08/22/2025 |
|
|
| |
|
(10,931 |
) |
|
|
(10,942 |
) |
|
| |
|
5.065 |
|
|
|
06/16/2025 |
|
|
|
08/15/2025 |
|
|
| |
|
(10,538 |
) |
|
|
(10,560 |
) |
|
| |
|
5.070 |
|
|
|
06/24/2025 |
|
|
|
08/22/2025 |
|
|
| |
|
(3,562 |
) |
|
|
(3,565 |
) |
|
| |
|
5.115 |
|
|
|
06/16/2025 |
|
|
|
08/15/2025 |
|
|
| |
|
(5,997 |
) |
|
|
(6,009 |
) |
|
| |
|
5.120 |
|
|
|
06/24/2025 |
|
|
|
08/22/2025 |
|
|
| |
|
(11,337 |
) |
|
|
(11,348 |
) |
|
| |
|
5.165 |
|
|
|
06/16/2025 |
|
|
|
08/15/2025 |
|
|
| |
|
(31,369 |
) |
|
|
(31,436 |
) |
|
| |
|
5.170 |
|
|
|
06/24/2025 |
|
|
|
08/22/2025 |
|
|
| |
|
(1,686 |
) |
|
|
(1,688 |
) |
|
| |
|
5.215 |
|
|
|
06/16/2025 |
|
|
|
08/15/2025 |
|
|
| |
|
(5,883 |
) |
|
|
(5,896 |
) |
|
| |
|
5.220 |
|
|
|
06/24/2025 |
|
|
|
08/22/2025 |
|
|
| |
|
(5,316 |
) |
|
|
(5,321 |
) |
|
| |
|
5.265 |
|
|
|
06/16/2025 |
|
|
|
08/15/2025 |
|
|
| |
|
(1,185 |
) |
|
|
(1,188 |
) |
|
| |
|
5.270 |
|
|
|
06/24/2025 |
|
|
|
08/22/2025 |
|
|
| |
|
(8,826 |
) |
|
|
(8,836 |
) |
|
| |
|
5.315 |
|
|
|
06/16/2025 |
|
|
|
08/15/2025 |
|
|
| |
|
(29,917 |
) |
|
|
(29,983 |
) |
|
| |
|
5.320 |
|
|
|
06/24/2025 |
|
|
|
08/22/2025 |
|
|
| |
|
(9,030 |
) |
|
|
(9,040 |
) |
|
| |
|
5.365 |
|
|
|
06/16/2025 |
|
|
|
08/15/2025 |
|
|
| |
|
(5,093 |
) |
|
|
(5,104 |
) |
|
| |
|
5.415 |
|
|
|
06/16/2025 |
|
|
|
08/15/2025 |
|
|
| |
|
(14,130 |
) |
|
|
(14,162 |
) |
|
| |
|
5.415 |
|
|
|
06/27/2025 |
|
|
|
08/15/2025 |
|
|
| |
|
(6,228 |
) |
|
|
(6,232 |
) |
|
| |
|
5.420 |
|
|
|
06/24/2025 |
|
|
|
08/22/2025 |
|
|
| |
|
(31,601 |
) |
|
|
(31,635 |
) |
|
| |
|
5.470 |
|
|
|
06/24/2025 |
|
|
|
08/22/2025 |
|
|
| |
|
(3,058 |
) |
|
|
(3,061 |
) |
|
| |
|
5.520 |
|
|
|
06/24/2025 |
|
|
|
08/22/2025 |
|
|
| |
|
(6,769 |
) |
|
|
(6,776 |
) |
|
| |
|
5.563 |
|
|
|
06/27/2025 |
|
|
|
08/22/2025 |
|
|
| |
|
(4,175 |
) |
|
|
(4,178 |
) |
|
| |
|
5.565 |
|
|
|
06/16/2025 |
|
|
|
08/15/2025 |
|
|
| |
|
(13,660 |
) |
|
|
(13,691 |
) |
|
| |
|
5.570 |
|
|
|
06/24/2025 |
|
|
|
08/22/2025 |
|
|
| |
|
(4,284 |
) |
|
|
(4,288 |
) |
|
| |
|
5.670 |
|
|
|
06/24/2025 |
|
|
|
08/22/2025 |
|
|
| |
|
(15,604 |
) |
|
|
(15,621 |
) |
|
| |
|
5.795 |
|
|
|
06/24/2025 |
|
|
|
08/22/2025 |
|
|
| |
|
(10,598 |
) |
|
|
(10,610 |
) |
|
| |
|
5.820 |
|
|
|
06/24/2025 |
|
|
|
08/22/2025 |
|
|
| |
|
(9,923 |
) |
|
|
(9,934 |
) |
|
| |
|
5.845 |
|
|
|
06/24/2025 |
|
|
|
08/22/2025 |
|
|
| |
|
(9,445 |
) |
|
|
(9,456 |
) |
|
| |
|
5.870 |
|
|
|
06/24/2025 |
|
|
|
08/22/2025 |
|
|
| |
|
(86,471 |
) |
|
|
(86,569 |
) |
|
| |
|
5.920 |
|
|
|
06/24/2025 |
|
|
|
08/22/2025 |
|
|
| |
|
(3,187 |
) |
|
|
(3,190 |
) |
|
| |
|
5.945 |
|
|
|
06/24/2025 |
|
|
|
08/22/2025 |
|
|
| |
|
(10,439 |
) |
|
|
(10,451 |
) |
|
| |
|
5.950 |
|
|
|
06/24/2025 |
|
|
|
08/22/2025 |
|
|
| |
|
(7,241 |
) |
|
|
(7,249 |
) |
|
| |
|
5.970 |
|
|
|
06/24/2025 |
|
|
|
08/22/2025 |
|
|
| |
|
(9,588 |
) |
|
|
(9,599 |
) |
|
| |
|
6.020 |
|
|
|
06/24/2025 |
|
|
|
08/22/2025 |
|
|
| |
|
(27,836 |
) |
|
|
(27,869 |
) |
|
| |
|
6.045 |
|
|
|
06/24/2025 |
|
|
|
08/22/2025 |
|
|
| |
|
(2,561 |
) |
|
|
(2,564 |
) |
| |
|
|
4.820 |
|
|
|
12/20/2024 |
|
|
|
TBD |
|
|
| |
|
(13,260 |
) |
|
|
(13,603 |
) |
|
| |
|
4.820 |
|
|
|
01/09/2025 |
|
|
|
TBD |
|
|
| |
|
(3,276 |
) |
|
|
(3,350 |
) |
|
| |
|
4.870 |
|
|
|
06/30/2025 |
|
|
|
08/22/2025 |
|
|
| |
|
(18,768 |
) |
|
|
(18,770 |
) |
|
| |
|
4.880 |
|
|
|
04/14/2025 |
|
|
|
07/14/2025 |
|
|
| |
|
(10,236 |
) |
|
|
(10,345 |
) |
| |
|
|
5.377 |
|
|
|
06/04/2025 |
|
|
|
03/04/2026 |
|
|
| |
|
(100,664 |
) |
|
|
(101,070 |
) |
|
| |
|
5.427 |
|
|
|
06/04/2025 |
|
|
|
03/04/2026 |
|
|
| |
|
(6,607 |
) |
|
|
(6,634 |
) |
|
| |
|
5.477 |
|
|
|
06/04/2025 |
|
|
|
03/04/2026 |
|
|
| |
|
(4,043 |
) |
|
|
(4,059 |
) |
|
| |
|
5.563 |
|
|
|
10/29/2024 |
|
|
|
07/29/2025 |
|
|
| |
|
(63,461 |
) |
|
|
(65,863 |
) |
|
| |
|
5.610 |
|
|
|
01/27/2025 |
|
|
|
07/29/2025 |
|
|
| |
|
(1,657 |
) |
|
|
(1,697 |
) |
|
| |
|
5.613 |
|
|
|
10/29/2024 |
|
|
|
07/29/2025 |
|
|
| |
|
(8,399 |
) |
|
|
(8,720 |
) |
|
| |
|
5.627 |
|
|
|
06/04/2025 |
|
|
|
03/04/2026 |
|
|
| |
|
(2,677 |
) |
|
|
(2,689 |
) |
|
| |
|
5.663 |
|
|
|
10/29/2024 |
|
|
|
07/29/2025 |
|
|
| |
|
(2,902 |
) |
|
|
(3,014 |
) |
|
|
|
|
|
|
|
|
|
|
|
|
| |
| See Accompanying Notes |
|
|
ANNUAL REPORT |
|
|
| |
|
|
JUNE 30, 2025 |
|
|
91 |
|
|
|
|
|
|
| |
Consolidated Schedule of Investments |
|
PIMCO Dynamic Income Fund |
|
|
|
|
|
|
|
|
|
|
|
|
|
|
|
|
|
|
|
|
|
|
|
|
|
|
| |
Counterparty |
|
|
|
|
Settlement
Date |
|
|
Maturity
Date |
|
|
|
|
|
Payable for
Reverse
Repurchase
Agreements |
|
| |
|
|
4.690 |
% |
|
|
04/28/2025 |
|
|
|
07/28/2025 |
|
|
$ |
|
|
(148 |
) |
|
$ |
(149 |
) |
|
| |
|
4.730 |
|
|
|
06/17/2025 |
|
|
|
09/17/2025 |
|
|
| |
|
(80 |
) |
|
|
(80 |
) |
|
| |
|
4.770 |
|
|
|
06/04/2025 |
|
|
|
09/04/2025 |
|
|
| |
|
(3,138 |
) |
|
|
(3,149 |
) |
|
| |
|
4.880 |
|
|
|
04/11/2025 |
|
|
|
07/11/2025 |
|
|
| |
|
(1,778 |
) |
|
|
(1,797 |
) |
|
| |
|
4.900 |
|
|
|
06/27/2025 |
|
|
|
09/29/2025 |
|
|
| |
|
(143 |
) |
|
|
(144 |
) |
|
| |
|
4.910 |
|
|
|
04/11/2025 |
|
|
|
07/11/2025 |
|
|
| |
|
(673 |
) |
|
|
(681 |
) |
|
| |
|
4.920 |
|
|
|
06/17/2025 |
|
|
|
09/17/2025 |
|
|
| |
|
(1,793 |
) |
|
|
(1,797 |
) |
|
| |
|
4.930 |
|
|
|
06/17/2025 |
|
|
|
09/17/2025 |
|
|
| |
|
(768 |
) |
|
|
(769 |
) |
|
| |
|
4.940 |
|
|
|
05/27/2025 |
|
|
|
10/27/2025 |
|
|
| |
|
(661 |
) |
|
|
(664 |
) |
|
| |
|
4.970 |
|
|
|
06/17/2025 |
|
|
|
09/17/2025 |
|
|
| |
|
(3,436 |
) |
|
|
(3,442 |
) |
|
| |
|
4.980 |
|
|
|
06/17/2025 |
|
|
|
09/17/2025 |
|
|
| |
|
(898 |
) |
|
|
(899 |
) |
|
| |
|
4.990 |
|
|
|
04/28/2025 |
|
|
|
07/28/2025 |
|
|
| |
|
(14,785 |
) |
|
|
(14,916 |
) |
| |
|
|
1.250 |
|
|
|
06/11/2025 |
|
|
|
TBD |
|
|
EUR |
|
|
(9,068 |
) |
|
|
(10,689 |
) |
|
| |
|
4.750 |
|
|
|
05/09/2025 |
|
|
|
08/01/2025 |
|
|
$ |
|
|
(48,094 |
) |
|
|
(48,431 |
) |
|
| |
|
5.050 |
|
|
|
05/09/2025 |
|
|
|
08/01/2025 |
|
|
| |
|
(18,227 |
) |
|
|
(18,363 |
) |
|
| |
|
5.121 |
|
|
|
06/26/2025 |
|
|
|
09/26/2025 |
|
|
GBP |
|
|
(11,259 |
) |
|
|
(15,466 |
) |
|
| |
|
5.500 |
|
|
|
05/09/2025 |
|
|
|
08/01/2025 |
|
|
$ |
|
|
(189 |
) |
|
|
(190 |
) |
| |
|
|
5.000 |
|
|
|
05/08/2025 |
|
|
|
08/08/2025 |
|
|
| |
|
(1,615 |
) |
|
|
(1,627 |
) |
|
| |
|
5.280 |
|
|
|
04/03/2025 |
|
|
|
07/03/2025 |
|
|
| |
|
(1,245 |
) |
|
|
(1,262 |
) |
|
| |
|
5.300 |
|
|
|
05/08/2025 |
|
|
|
08/08/2025 |
|
|
| |
|
(1,495 |
) |
|
|
(1,507 |
) |
|
| |
|
5.400 |
|
|
|
05/08/2025 |
|
|
|
08/08/2025 |
|
|
| |
|
(2,039 |
) |
|
|
(2,055 |
) |
|
| |
|
5.480 |
|
|
|
04/03/2025 |
|
|
|
07/03/2025 |
|
|
| |
|
(2,011 |
) |
|
|
(2,038 |
) |
|
| |
|
5.550 |
|
|
|
05/08/2025 |
|
|
|
08/08/2025 |
|
|
| |
|
(5,128 |
) |
|
|
(5,171 |
) |
|
| |
|
5.580 |
|
|
|
04/03/2025 |
|
|
|
07/03/2025 |
|
|
| |
|
(3,601 |
) |
|
|
(3,651 |
) |
| |
|
|
4.917 |
|
|
|
05/14/2025 |
|
|
|
09/15/2025 |
|
|
GBP |
|
|
(10,579 |
) |
|
|
(14,613 |
) |
|
| |
|
4.967 |
|
|
|
05/14/2025 |
|
|
|
09/15/2025 |
|
|
| |
|
(6,921 |
) |
|
|
(9,561 |
) |
| |
|
|
2.510 |
|
|
|
06/25/2025 |
|
|
|
09/25/2025 |
|
|
EUR |
|
|
(2,041 |
) |
|
|
(2,405 |
) |
|
| |
|
2.560 |
|
|
|
06/11/2025 |
|
|
|
09/11/2025 |
|
|
| |
|
(4,876 |
) |
|
|
(5,752 |
) |
|
| |
|
2.950 |
|
|
|
03/14/2025 |
|
|
|
07/14/2025 |
|
|
| |
|
(16,161 |
) |
|
|
(19,199 |
) |
|
| |
|
4.680 |
|
|
|
06/26/2025 |
|
|
|
09/26/2025 |
|
|
GBP |
|
|
(1,546 |
) |
|
|
(2,124 |
) |
|
| |
|
4.740 |
|
|
|
06/18/2025 |
|
|
|
09/18/2025 |
|
|
| |
|
(798 |
) |
|
|
(1,097 |
) |
|
| |
|
4.880 |
|
|
|
06/18/2025 |
|
|
|
08/18/2025 |
|
|
| |
|
(3,160 |
) |
|
|
(4,346 |
) |
| |
|
|
4.793 |
|
|
|
05/21/2025 |
|
|
|
09/22/2025 |
|
|
| |
|
(4,818 |
) |
|
|
(6,649 |
) |
|
| |
|
4.823 |
|
|
|
05/21/2025 |
|
|
|
09/22/2025 |
|
|
| |
|
(5,941 |
) |
|
|
(8,199 |
) |
|
| |
|
4.853 |
|
|
|
05/21/2025 |
|
|
|
09/22/2025 |
|
|
| |
|
(5,858 |
) |
|
|
(8,084 |
) |
|
| |
|
4.873 |
|
|
|
04/17/2025 |
|
|
|
10/17/2025 |
|
|
| |
|
(17,358 |
) |
|
|
(24,059 |
) |
|
| |
|
4.905 |
|
|
|
06/20/2025 |
|
|
|
12/22/2025 |
|
|
| |
|
(8,740 |
) |
|
|
(12,015 |
) |
|
| |
|
5.290 |
|
|
|
06/24/2025 |
|
|
|
12/22/2025 |
|
|
$ |
|
|
(3,119 |
) |
|
|
(3,122 |
) |
|
| |
|
5.390 |
|
|
|
06/24/2025 |
|
|
|
12/22/2025 |
|
|
| |
|
(9,098 |
) |
|
|
(9,107 |
) |
|
| |
|
5.440 |
|
|
|
04/10/2025 |
|
|
|
10/10/2025 |
|
|
| |
|
(1,866 |
) |
|
|
(1,889 |
) |
|
| |
|
5.440 |
|
|
|
05/19/2025 |
|
|
|
11/19/2025 |
|
|
| |
|
(1,853 |
) |
|
|
(1,865 |
) |
|
| |
|
5.490 |
|
|
|
05/06/2025 |
|
|
|
11/03/2025 |
|
|
| |
|
(23,330 |
) |
|
|
(23,529 |
) |
|
| |
|
5.540 |
|
|
|
04/10/2025 |
|
|
|
10/10/2025 |
|
|
| |
|
(20,619 |
) |
|
|
(20,880 |
) |
|
| |
|
5.540 |
|
|
|
06/24/2025 |
|
|
|
12/22/2025 |
|
|
| |
|
(43,663 |
) |
|
|
(43,709 |
) |
|
| |
|
5.590 |
|
|
|
05/06/2025 |
|
|
|
11/03/2025 |
|
|
| |
|
(6,480 |
) |
|
|
(6,536 |
) |
|
| |
|
5.590 |
|
|
|
06/24/2025 |
|
|
|
12/22/2025 |
|
|
| |
|
(18,422 |
) |
|
|
(18,442 |
) |
| |
|
|
(1.500 |
) |
|
|
05/05/2025 |
|
|
|
TBD |
|
|
| |
|
(1,645 |
) |
|
|
(1,641 |
) |
|
| |
|
1.250 |
|
|
|
06/11/2025 |
|
|
|
TBD |
|
|
| |
|
(3,272 |
) |
|
|
(3,856 |
) |
|
| |
|
1.300 |
|
|
|
06/11/2025 |
|
|
|
TBD |
|
|
| |
|
(8,541 |
) |
|
|
(10,069 |
) |
|
| |
|
1.700 |
|
|
|
06/11/2025 |
|
|
|
TBD |
|
|
| |
|
(5,650 |
) |
|
|
(6,661 |
) |
|
| |
|
1.750 |
|
|
|
06/11/2025 |
|
|
|
TBD |
|
|
| |
|
(4,268 |
) |
|
|
(5,032 |
) |
|
| |
|
2.150 |
|
|
|
06/27/2025 |
|
|
|
07/04/2025 |
|
|
| |
|
(594 |
) |
|
|
(700 |
) |
|
| |
|
2.600 |
|
|
|
04/04/2025 |
|
|
|
07/04/2025 |
|
|
| |
|
(5,860 |
) |
|
|
(6,946 |
) |
| |
|
|
5.510 |
|
|
|
06/20/2025 |
|
|
|
12/19/2025 |
|
|
$ |
|
|
(55,420 |
) |
|
|
(55,512 |
) |
| |
|
|
4.200 |
|
|
|
06/26/2025 |
|
|
|
TBD |
|
|
| |
|
(4,762 |
) |
|
|
(4,765 |
) |
|
| |
|
4.750 |
|
|
|
06/26/2025 |
|
|
|
TBD |
|
|
| |
|
(3,225 |
) |
|
|
(3,228 |
) |
| |
|
|
4.690 |
|
|
|
06/27/2025 |
|
|
|
07/01/2025 |
|
|
| |
|
(3,639 |
) |
|
|
(3,641 |
) |
| |
|
|
5.740 |
|
|
|
06/20/2025 |
|
|
|
12/19/2025 |
|
|
| |
|
(811 |
) |
|
|
(813 |
) |
| |
|
|
2.971 |
|
|
|
04/29/2025 |
|
|
|
10/29/2025 |
|
|
EUR |
|
|
(2,289 |
) |
|
|
(2,711 |
) |
| |
|
|
4.820 |
|
|
|
06/06/2025 |
|
|
|
07/07/2025 |
|
|
$ |
|
|
(3,180 |
) |
|
|
(3,190 |
) |
|
| |
|
4.850 |
|
|
|
05/20/2025 |
|
|
|
07/21/2025 |
|
|
| |
|
(5,861 |
) |
|
|
(5,894 |
) |
| |
|
|
5.660 |
|
|
|
06/20/2025 |
|
|
|
07/02/2025 |
|
|
| |
|
(1,640 |
) |
|
|
(1,642 |
) |
|
| |
|
5.710 |
|
|
|
06/20/2025 |
|
|
|
07/02/2025 |
|
|
| |
|
(2,153 |
) |
|
|
(2,156 |
) |
| |
|
|
4.990 |
|
|
|
06/24/2025 |
|
|
|
09/18/2025 |
|
|
| |
|
(18,284 |
) |
|
|
(18,302 |
) |
|
| |
|
5.160 |
|
|
|
06/09/2025 |
|
|
|
10/09/2025 |
|
|
| |
|
(28,499 |
) |
|
|
(28,588 |
) |
|
| |
|
5.360 |
|
|
|
06/18/2025 |
|
|
|
12/18/2025 |
|
|
| |
|
(6,782 |
) |
|
|
(6,795 |
) |
|
| |
|
5.370 |
|
|
|
06/09/2025 |
|
|
|
10/09/2025 |
|
|
| |
|
(907 |
) |
|
|
(909 |
) |
|
| |
|
5.390 |
|
|
|
05/22/2025 |
|
|
|
11/21/2025 |
|
|
| |
|
(19,126 |
) |
|
|
(19,238 |
) |
|
| |
|
5.390 |
|
|
|
06/04/2025 |
|
|
|
12/04/2025 |
|
|
| |
|
(12,547 |
) |
|
|
(12,597 |
) |
|
| |
|
5.440 |
|
|
|
06/04/2025 |
|
|
|
12/04/2025 |
|
|
| |
|
(2,459 |
) |
|
|
(2,469 |
) |
|
|
|
|
|
|
| |
92 |
|
PIMCO CLOSED-END FUNDS |
|
|
See Accompanying Notes |
|
|
|
|
|
|
|
|
|
|
|
|
|
|
|
|
|
|
|
|
|
|
|
| |
Counterparty |
|
|
|
|
Settlement
Date |
|
|
Maturity
Date |
|
|
|
|
|
Payable for
Reverse
Repurchase
Agreements |
|
|
| |
|
5.440 |
% |
|
|
06/13/2025 |
|
|
|
10/14/2025 |
|
|
$ |
|
|
(2,871 |
) |
|
$ |
(2,878 |
) |
|
| |
|
5.530 |
|
|
|
04/30/2025 |
|
|
|
10/30/2025 |
|
|
| |
|
(28,331 |
) |
|
|
(28,601 |
) |
|
| |
|
5.540 |
|
|
|
06/09/2025 |
|
|
|
10/09/2025 |
|
|
| |
|
(13,709 |
) |
|
|
(13,755 |
) |
|
| |
|
5.540 |
|
|
|
06/24/2025 |
|
|
|
08/08/2025 |
|
|
| |
|
(5,034 |
) |
|
|
(5,040 |
) |
|
| |
|
5.590 |
|
|
|
04/07/2025 |
|
|
|
07/07/2025 |
|
|
| |
|
(6,304 |
) |
|
|
(6,386 |
) |
|
| |
|
5.590 |
|
|
|
06/18/2025 |
|
|
|
12/18/2025 |
|
|
| |
|
(13,364 |
) |
|
|
(13,390 |
) |
|
| |
|
5.600 |
|
|
|
04/30/2025 |
|
|
|
10/30/2025 |
|
|
| |
|
(7,594 |
) |
|
|
(7,668 |
) |
|
| |
|
5.610 |
|
|
|
04/30/2025 |
|
|
|
10/30/2025 |
|
|
| |
|
(21,101 |
) |
|
|
(21,306 |
) |
|
| |
|
5.620 |
|
|
|
06/09/2025 |
|
|
|
10/09/2025 |
|
|
| |
|
(1,144 |
) |
|
|
(1,148 |
) |
|
| |
|
5.640 |
|
|
|
04/30/2025 |
|
|
|
10/30/2025 |
|
|
| |
|
(5,428 |
) |
|
|
(5,481 |
) |
| |
|
|
5.425 |
|
|
|
04/24/2025 |
|
|
|
10/28/2025 |
|
|
| |
|
(24,833 |
) |
|
|
(25,087 |
) |
|
| |
|
5.475 |
|
|
|
04/24/2025 |
|
|
|
10/28/2025 |
|
|
| |
|
(19,612 |
) |
|
|
(19,815 |
) |
|
| |
|
5.525 |
|
|
|
04/24/2025 |
|
|
|
10/28/2025 |
|
|
| |
|
(4,886 |
) |
|
|
(4,937 |
) |
|
| |
|
5.575 |
|
|
|
04/24/2025 |
|
|
|
10/28/2025 |
|
|
| |
|
(2,713 |
) |
|
|
(2,742 |
) |
| |
|
|
2.350 |
|
|
|
04/04/2025 |
|
|
|
07/04/2025 |
|
|
EUR |
|
|
(14,477 |
) |
|
|
(17,147 |
) |
| |
|
|
4.540 |
|
|
|
03/14/2025 |
|
|
|
TBD |
|
|
$ |
|
|
(1,398 |
) |
|
|
(1,417 |
) |
|
| |
|
4.600 |
|
|
|
12/20/2024 |
|
|
|
TBD |
|
|
| |
|
(26,241 |
) |
|
|
(26,888 |
) |
|
| |
|
4.620 |
|
|
|
03/14/2025 |
|
|
|
TBD |
|
|
| |
|
(16,435 |
) |
|
|
(16,665 |
) |
|
| |
|
4.680 |
|
|
|
04/08/2025 |
|
|
|
07/07/2025 |
|
|
| |
|
(601 |
) |
|
|
(607 |
) |
|
| |
|
4.680 |
|
|
|
04/09/2025 |
|
|
|
07/08/2025 |
|
|
| |
|
(1,610 |
) |
|
|
(1,628 |
) |
|
| |
|
4.720 |
|
|
|
06/30/2025 |
|
|
|
TBD |
|
|
| |
|
(66,479 |
) |
|
|
(66,488 |
) |
|
| |
|
4.800 |
|
|
|
04/08/2025 |
|
|
|
07/07/2025 |
|
|
| |
|
(1,616 |
) |
|
|
(1,635 |
) |
|
| |
|
4.800 |
|
|
|
04/09/2025 |
|
|
|
07/08/2025 |
|
|
| |
|
(43,931 |
) |
|
|
(44,418 |
) |
|
| |
|
4.800 |
|
|
|
04/29/2025 |
|
|
|
07/08/2025 |
|
|
| |
|
(1,794 |
) |
|
|
(1,809 |
) |
|
| |
|
4.800 |
|
|
|
05/29/2025 |
|
|
|
07/08/2025 |
|
|
| |
|
(1,456 |
) |
|
|
(1,462 |
) |
|
| |
|
4.850 |
|
|
|
06/24/2025 |
|
|
|
09/24/2025 |
|
|
| |
|
(16,060 |
) |
|
|
(16,076 |
) |
|
| |
|
5.290 |
|
|
|
05/01/2025 |
|
|
|
10/31/2025 |
|
|
| |
|
(9,739 |
) |
|
|
(9,827 |
) |
|
| |
|
5.390 |
|
|
|
06/18/2025 |
|
|
|
12/18/2025 |
|
|
| |
|
(15,815 |
) |
|
|
(15,845 |
) |
|
| |
|
5.490 |
|
|
|
05/01/2025 |
|
|
|
10/31/2025 |
|
|
| |
|
(4,364 |
) |
|
|
(4,404 |
) |
|
| |
|
5.490 |
|
|
|
06/13/2025 |
|
|
|
12/12/2025 |
|
|
| |
|
(3,720 |
) |
|
|
(3,730 |
) |
|
| |
|
5.540 |
|
|
|
05/01/2025 |
|
|
|
10/31/2025 |
|
|
| |
|
(833 |
) |
|
|
(840 |
) |
|
| |
|
5.540 |
|
|
|
05/07/2025 |
|
|
|
11/07/2025 |
|
|
| |
|
(23,272 |
) |
|
|
(23,467 |
) |
|
| |
|
5.590 |
|
|
|
05/01/2025 |
|
|
|
10/31/2025 |
|
|
| |
|
(24,931 |
) |
|
|
(25,166 |
) |
| |
|
|
2.070 |
|
|
|
06/11/2025 |
|
|
|
TBD |
|
|
EUR |
|
|
(2,490 |
) |
|
|
(2,936 |
) |
|
| |
|
2.070 |
|
|
|
06/23/2025 |
|
|
|
TBD |
|
|
| |
|
(2,641 |
) |
|
|
(3,113 |
) |
|
| |
|
2.130 |
|
|
|
06/11/2025 |
|
|
|
TBD |
|
|
| |
|
(3,445 |
) |
|
|
(4,063 |
) |
|
| |
|
2.150 |
|
|
|
06/11/2025 |
|
|
|
TBD |
|
|
| |
|
(8,514 |
) |
|
|
(10,041 |
) |
|
| |
|
2.200 |
|
|
|
06/11/2025 |
|
|
|
TBD |
|
|
| |
|
(8,553 |
) |
|
|
(10,088 |
) |
|
| |
|
2.400 |
|
|
|
07/02/2025 |
|
|
|
10/02/2025 |
|
|
| |
|
(27,029 |
) |
|
|
(31,838 |
) |
|
| |
|
2.774 |
|
|
|
06/27/2025 |
|
|
|
09/25/2025 |
|
|
| |
|
(214 |
) |
|
|
(252 |
) |
|
| |
|
2.832 |
|
|
|
06/18/2025 |
|
|
|
09/17/2025 |
|
|
| |
|
(12,968 |
) |
|
|
(15,291 |
) |
|
| |
|
2.924 |
|
|
|
06/27/2025 |
|
|
|
09/25/2025 |
|
|
| |
|
(3,566 |
) |
|
|
(4,202 |
) |
|
| |
|
4.780 |
|
|
|
04/03/2025 |
|
|
|
07/03/2025 |
|
|
$ |
|
|
(24,404 |
) |
|
|
(24,692 |
) |
|
| |
|
4.796 |
|
|
|
06/18/2025 |
|
|
|
09/17/2025 |
|
|
GBP |
|
|
(2,241 |
) |
|
|
(3,082 |
) |
|
| |
|
4.900 |
|
|
|
04/16/2025 |
|
|
|
07/16/2025 |
|
|
$ |
|
|
(3,724 |
) |
|
|
(3,763 |
) |
|
| |
|
5.260 |
|
|
|
05/19/2025 |
|
|
|
11/19/2025 |
|
|
| |
|
(1,392 |
) |
|
|
(1,400 |
) |
|
| |
|
5.270 |
|
|
|
05/08/2025 |
|
|
|
10/27/2025 |
|
|
| |
|
(5,861 |
) |
|
|
(5,907 |
) |
|
| |
|
5.300 |
|
|
|
06/30/2025 |
|
|
|
09/30/2025 |
|
|
| |
|
(9,948 |
) |
|
|
(9,950 |
) |
|
| |
|
5.310 |
|
|
|
05/19/2025 |
|
|
|
11/19/2025 |
|
|
| |
|
(7,666 |
) |
|
|
(7,715 |
) |
|
| |
|
5.320 |
|
|
|
04/29/2025 |
|
|
|
10/27/2025 |
|
|
| |
|
(12,628 |
) |
|
|
(12,745 |
) |
|
| |
|
5.340 |
|
|
|
04/16/2025 |
|
|
|
10/16/2025 |
|
|
| |
|
(2,794 |
) |
|
|
(2,825 |
) |
|
| |
|
5.370 |
|
|
|
04/29/2025 |
|
|
|
10/27/2025 |
|
|
| |
|
(31,757 |
) |
|
|
(32,055 |
) |
|
| |
|
5.380 |
|
|
|
04/03/2025 |
|
|
|
07/03/2025 |
|
|
| |
|
(31,438 |
) |
|
|
(31,856 |
) |
|
| |
|
5.430 |
|
|
|
04/03/2025 |
|
|
|
07/03/2025 |
|
|
| |
|
(8,341 |
) |
|
|
(8,453 |
) |
|
| |
|
5.460 |
|
|
|
05/19/2025 |
|
|
|
11/19/2025 |
|
|
| |
|
(1,680 |
) |
|
|
(1,691 |
) |
| |
|
|
4.950 |
|
|
|
05/19/2025 |
|
|
|
08/19/2025 |
|
|
| |
|
(5,778 |
) |
|
|
(5,812 |
) |
|
| |
|
4.970 |
|
|
|
05/19/2025 |
|
|
|
08/19/2025 |
|
|
| |
|
(26,968 |
) |
|
|
(27,128 |
) |
|
| |
|
5.020 |
|
|
|
05/19/2025 |
|
|
|
08/19/2025 |
|
|
| |
|
(11,601 |
) |
|
|
(11,670 |
) |
|
| |
|
|
| |
|
|
| |
|
|
| |
| |
|
|
| |
|
|
|
Total Reverse Repurchase Agreements |
|
|
|
|
| |
| |
|
|
| |
|
|
|
|
| |
|
|
| |
|
|
| |
|
|
| |
| |
|
|
| |
|
|
|
BORROWINGS AND OTHER FINANCING TRANSACTIONS SUMMARY
The following is a summary by counterparty of the market value of Borrowings and Other Financing Transactions and collateral pledged/(received) as of June 30, 2025:
|
|
|
|
|
|
|
|
|
|
|
|
|
|
|
|
|
|
|
|
|
|
|
|
| |
|
|
Repurchase Agreement Proceeds to be Received (1) |
|
|
Payable for
Reverse
Repurchase
Agreements |
|
|
Payable for Sale-Buyback Transactions |
|
|
Total
Borrowings and
Other Financing
Transactions |
|
|
Collateral
Pledged/(Received) |
|
|
|
|
Global/Master Repurchase Agreement |
|
| |
|
$ |
0 |
|
|
$ |
(157,031 |
) |
|
$ |
0 |
|
|
$ |
(157,031 |
) |
|
$ |
206,516 |
|
|
$ |
49,485 |
|
| |
|
|
0 |
|
|
|
(39,064 |
) |
|
|
0 |
|
|
|
(39,064 |
) |
|
|
48,552 |
|
|
|
9,488 |
|
|
|
|
|
|
|
|
|
|
|
|
|
| |
| See Accompanying Notes |
|
|
ANNUAL REPORT |
|
|
| |
|
|
JUNE 30, 2025 |
|
|
93 |
|
|
|
|
|
|
| |
Consolidated Schedule of Investments |
|
PIMCO Dynamic Income Fund |
|
|
|
|
|
|
|
|
|
|
|
|
|
|
|
|
|
|
|
|
|
|
|
|
|
|
|
|
| |
Counterparty |
|
Repurchase Agreement Proceeds to be Received (1) |
|
|
Payable for
Reverse
Repurchase
Agreements |
|
|
Payable for Sale-Buyback Transactions |
|
|
Total
Borrowings and
Other Financing
Transactions |
|
|
Collateral
Pledged/(Received) |
|
|
|
|
| |
|
$ |
0 |
|
|
$ |
(4,326 |
) |
|
$ |
0 |
|
|
$ |
(4,326 |
) |
|
$ |
0 |
|
|
$ |
(4,326 |
) |
| |
|
|
0 |
|
|
|
(297,159 |
) |
|
|
0 |
|
|
|
(297,159 |
) |
|
|
378,625 |
|
|
|
81,466 |
|
| |
|
|
0 |
|
|
|
(457,293 |
) |
|
|
0 |
|
|
|
(457,293 |
) |
|
|
585,582 |
|
|
|
128,289 |
|
| |
|
|
0 |
|
|
|
(170 |
) |
|
|
0 |
|
|
|
(170 |
) |
|
|
0 |
|
|
|
(170 |
) |
| |
|
|
0 |
|
|
|
(199,788 |
) |
|
|
0 |
|
|
|
(199,788 |
) |
|
|
232,498 |
|
|
|
32,710 |
|
| |
|
|
0 |
|
|
|
(134,644 |
) |
|
|
0 |
|
|
|
(134,644 |
) |
|
|
157,784 |
|
|
|
23,140 |
|
| |
|
|
0 |
|
|
|
(2,849 |
) |
|
|
0 |
|
|
|
(2,849 |
) |
|
|
4,056 |
|
|
|
1,207 |
|
| |
|
|
0 |
|
|
|
(562,355 |
) |
|
|
0 |
|
|
|
(562,355 |
) |
|
|
733,019 |
|
|
|
170,664 |
|
| |
|
|
0 |
|
|
|
(46,068 |
) |
|
|
0 |
|
|
|
(46,068 |
) |
|
|
53,455 |
|
|
|
7,387 |
|
| |
|
|
0 |
|
|
|
(193,746 |
) |
|
|
0 |
|
|
|
(193,746 |
) |
|
|
228,626 |
|
|
|
34,880 |
|
| |
|
|
0 |
|
|
|
(28,487 |
) |
|
|
0 |
|
|
|
(28,487 |
) |
|
|
33,299 |
|
|
|
4,812 |
|
| |
|
|
0 |
|
|
|
(93,139 |
) |
|
|
0 |
|
|
|
(93,139 |
) |
|
|
109,698 |
|
|
|
16,559 |
|
| |
|
|
173,912 |
|
|
|
(17,311 |
) |
|
|
0 |
|
|
|
156,601 |
|
|
|
(156,494 |
) |
|
|
107 |
|
| |
|
|
0 |
|
|
|
(24,174 |
) |
|
|
0 |
|
|
|
(24,174 |
) |
|
|
29,918 |
|
|
|
5,744 |
|
| |
|
|
0 |
|
|
|
(34,923 |
) |
|
|
0 |
|
|
|
(34,923 |
) |
|
|
43,008 |
|
|
|
8,085 |
|
| |
|
|
0 |
|
|
|
(188,085 |
) |
|
|
0 |
|
|
|
(188,085 |
) |
|
|
250,165 |
|
|
|
62,080 |
|
| |
|
|
0 |
|
|
|
(34,905 |
) |
|
|
0 |
|
|
|
(34,905 |
) |
|
|
33,299 |
|
|
|
(1,606 |
) |
| |
|
|
0 |
|
|
|
(55,512 |
) |
|
|
0 |
|
|
|
(55,512 |
) |
|
|
77,824 |
|
|
|
22,312 |
|
| |
|
|
0 |
|
|
|
(7,993 |
) |
|
|
0 |
|
|
|
(7,993 |
) |
|
|
9,103 |
|
|
|
1,110 |
|
| |
|
|
0 |
|
|
|
(3,641 |
) |
|
|
0 |
|
|
|
(3,641 |
) |
|
|
0 |
|
|
|
(3,641 |
) |
| |
|
|
0 |
|
|
|
(813 |
) |
|
|
0 |
|
|
|
(813 |
) |
|
|
7,106 |
|
|
|
6,293 |
|
| |
|
|
0 |
|
|
|
(2,711 |
) |
|
|
0 |
|
|
|
(2,711 |
) |
|
|
4,533 |
|
|
|
1,822 |
|
| |
|
|
0 |
|
|
|
(9,084 |
) |
|
|
0 |
|
|
|
(9,084 |
) |
|
|
11,147 |
|
|
|
2,063 |
|
| |
|
|
0 |
|
|
|
(3,798 |
) |
|
|
0 |
|
|
|
(3,798 |
) |
|
|
0 |
|
|
|
(3,798 |
) |
| |
|
|
0 |
|
|
|
(194,551 |
) |
|
|
0 |
|
|
|
(194,551 |
) |
|
|
247,974 |
|
|
|
53,423 |
|
| |
|
|
0 |
|
|
|
(52,581 |
) |
|
|
0 |
|
|
|
(52,581 |
) |
|
|
72,960 |
|
|
|
20,379 |
|
| |
|
|
0 |
|
|
|
(17,147 |
) |
|
|
0 |
|
|
|
(17,147 |
) |
|
|
17,792 |
|
|
|
645 |
|
| |
|
|
0 |
|
|
|
(262,372 |
) |
|
|
0 |
|
|
|
(262,372 |
) |
|
|
325,169 |
|
|
|
62,797 |
|
| |
|
|
0 |
|
|
|
0 |
|
|
|
0 |
|
|
|
0 |
|
|
|
245,983 |
|
|
|
245,983 |
|
| |
|
|
0 |
|
|
|
(227,958 |
) |
|
|
0 |
|
|
|
(227,958 |
) |
|
|
0 |
|
|
|
(227,958 |
) |
| |
|
|
0 |
|
|
|
(44,610 |
) |
|
|
0 |
|
|
|
(44,610 |
) |
|
|
51,443 |
|
|
|
6,833 |
|
|
| |
|
|
|
|
|
|
|
|
|
|
|
|
|
|
| |
|
|
| |
|
| |
Total Borrowings and Other Financing Transactions |
|
|
|
|
|
|
|
|
|
|
|
|
|
|
|
| |
|
|
| |
|
| |
|
| |
|
|
|
|
|
|
|
|
|
|
|
|
|
|
| |
|
|
| |
|
| |
CERTAIN TRANSFERS ACCOUNTED FOR AS SECURED BORROWINGS
Remaining Contractual Maturity of the Agreements
|
|
|
|
|
|
|
|
|
|
|
|
|
|
|
|
|
|
|
|
| |
| |
|
|
|
|
|
|
|
|
|
|
|
|
|
|
|
Reverse Repurchase Agreements |
|
| |
|
$ |
0 |
|
|
$ |
(270,091 |
) |
|
$ |
(103,714 |
) |
|
$ |
(408,805 |
) |
|
$ |
(782,610 |
) |
Convertible Bonds & Notes |
|
|
0 |
|
|
|
(6,386 |
) |
|
|
0 |
|
|
|
0 |
|
|
|
(6,386 |
) |
| |
|
|
0 |
|
|
|
(27,427 |
) |
|
|
(46,719 |
) |
|
|
(8,755 |
) |
|
|
(82,901 |
) |
Non-Agency Mortgage-Backed Securities |
|
|
0 |
|
|
|
(93,937 |
) |
|
|
(411,152 |
) |
|
|
(988,381 |
) |
|
|
(1,493,470 |
) |
| |
|
|
0 |
|
|
|
(83,570 |
) |
|
|
(222,942 |
) |
|
|
(385,900 |
) |
|
|
(692,412 |
) |
| |
|
|
0 |
|
|
|
(99,066 |
) |
|
|
(50,901 |
) |
|
|
(116,222 |
) |
|
|
(266,189 |
) |
| |
|
|
(3,641 |
) |
|
|
(24,993 |
) |
|
|
0 |
|
|
|
(8,273 |
) |
|
|
(36,907 |
) |
|
| |
|
|
|
|
|
|
|
|
|
|
|
|
|
|
|
|
|
|
|
| |
|
|
|
|
|
|
|
|
|
|
|
|
|
|
|
|
|
|
|
|
|
| |
|
|
|
|
|
|
|
|
|
|
|
|
|
|
|
|
|
|
|
Payable for reverse repurchase agreements (6) |
|
|
|
|
|
|
| |
|
|
| |
|
|
| |
|
|
| |
|
|
| |
|
|
|
|
Securities with an aggregate market value of $4,226,637 and cash of $23,188 have been pledged as collateral under the terms of the above master agreements as of June 30, 2025. |
|
Includes accrued interest. |
|
Open maturity repurchase agreement. |
|
The average amount of borrowings outstanding during the period ended June 30, 2025 was $(3,032,199) at a weighted average interest rate of 5.460%. Average borrowings may include reverse repurchase agreements and sale-buyback transactions, if held during the period. |
|
Open maturity reverse repurchase agreement. |
|
Net Exposure represents the net receivable/(payable) that would be due from/to the counterparty in the event of default. Exposure from borrowings and other financing transactions can only be netted across transactions governed under the same master agreement with the same legal entity. See Note 8, Master Netting Arrangements, in the Notes to Financial Statements for more information. |
|
Unsettled reverse repurchase agreements liability of $(37,413) is outstanding at period end. |
|
|
|
|
|
|
| |
94 |
|
PIMCO CLOSED-END FUNDS |
|
|
See Accompanying Notes |
|
(n) FINANCIAL DERIVATIVE INSTRUMENTS: EXCHANGE-TRADED OR CENTRALLY CLEARED
FUTURES CONTRACTS:
|
|
|
|
|
|
|
|
|
|
|
|
|
|
|
|
|
|
|
|
|
|
|
|
| |
|
|
|
|
|
|
|
|
|
|
|
|
|
|
|
|
|
|
|
|
|
|
|
|
| |
| Description |
|
Expiration
Month |
|
|
# of
Contracts |
|
|
Notional
Amount |
|
|
Unrealized
Appreciation/
(Depreciation) |
|
|
|
|
| |
|
|
|
|
|
3-Month SOFR Active Contract December Futures |
|
|
03/2026 |
|
|
|
102 |
|
|
$ |
(24,564 |
) |
|
$ |
386 |
|
|
$ |
0 |
|
|
$ |
(5 |
) |
3-Month SOFR Active Contract June Futures |
|
|
09/2025 |
|
|
|
287 |
|
|
|
(68,640 |
) |
|
|
913 |
|
|
|
6 |
|
|
|
0 |
|
3-Month SOFR Active Contract March Futures |
|
|
06/2026 |
|
|
|
95 |
|
|
|
(22,943 |
) |
|
|
290 |
|
|
|
0 |
|
|
|
(7 |
) |
3-Month SOFR Active Contract September Futures |
|
|
12/2025 |
|
|
|
76 |
|
|
|
(18,238 |
) |
|
|
351 |
|
|
|
0 |
|
|
|
(1 |
) |
|
| |
|
|
| |
|
|
| |
|
|
| |
|
|
|
|
|
|
|
|
|
|
|
| |
|
|
|
|
|
|
|
|
|
|
|
|
|
|
| |
|
|
| |
|
|
| |
|
|
| |
|
|
|
|
|
|
|
|
|
|
|
SWAP AGREEMENTS:
INTEREST RATE SWAPS
|
|
|
|
|
|
|
|
|
|
|
|
|
|
|
|
|
|
|
|
|
|
|
|
|
|
|
|
|
|
|
|
|
|
|
|
|
|
| |
| Pay/Receive
Floating Rate |
|
Floating Rate Index |
|
Fixed Rate |
|
|
Payment
Frequency |
|
Maturity
Date |
|
|
Notional
Amount |
|
|
Premiums
Paid/(Received) |
|
|
Unrealized
Appreciation/
(Depreciation) |
|
|
Market
Value |
|
|
|
|
| |
|
|
|
|
|
| |
|
1-Day GBP-SONIO Compounded-OIS |
|
|
3.500 |
% |
|
Annual |
|
|
03/19/2030 |
|
|
GBP |
|
|
150,900 |
|
|
$ |
(4,811 |
) |
|
$ |
2,935 |
|
|
$ |
(1,876 |
) |
|
$ |
0 |
|
|
$ |
(8 |
) |
| |
|
1-Day GBP-SONIO Compounded-OIS |
|
|
0.500 |
|
|
Annual |
|
|
09/16/2030 |
|
|
| |
|
27,000 |
|
|
|
335 |
|
|
|
6,385 |
|
|
|
6,720 |
|
|
|
8 |
|
|
|
0 |
|
| |
|
1-Day GBP-SONIO Compounded-OIS |
|
|
0.750 |
|
|
Annual |
|
|
09/21/2052 |
|
|
| |
|
28,300 |
|
|
|
(2,278 |
) |
|
|
26,271 |
|
|
|
23,993 |
|
|
|
68 |
|
|
|
0 |
|
| |
|
1-Day USD-SOFR Compounded-OIS |
|
|
3.250 |
|
|
Annual |
|
|
06/18/2030 |
|
|
$ |
|
|
1,973,200 |
|
|
|
(18,087 |
) |
|
|
2,030 |
|
|
|
(16,057 |
) |
|
|
3,264 |
|
|
|
0 |
|
| |
|
1-Day USD-SOFR Compounded-OIS |
|
|
2.300 |
|
|
Annual |
|
|
01/17/2026 |
|
|
| |
|
15,100 |
|
|
|
7 |
|
|
|
292 |
|
|
|
299 |
|
|
|
1 |
|
|
|
0 |
|
| |
|
1-Day USD-SOFR Compounded-OIS |
|
|
3.750 |
|
|
Annual |
|
|
12/18/2026 |
|
|
| |
|
1,244,900 |
|
|
|
6,094 |
|
|
|
(8,658 |
) |
|
|
(2,564 |
) |
|
|
381 |
|
|
|
0 |
|
| |
|
1-Day USD-SOFR Compounded-OIS |
|
|
1.360 |
|
|
Semi-Annual |
|
|
02/15/2027 |
|
|
| |
|
13,450 |
|
|
|
(2 |
) |
|
|
545 |
|
|
|
543 |
|
|
|
0 |
|
|
|
(4 |
) |
| |
|
1-Day USD-SOFR Compounded-OIS |
|
|
3.750 |
|
|
Annual |
|
|
12/18/2027 |
|
|
| |
|
1,348,200 |
|
|
|
13,042 |
|
|
|
(7,610 |
) |
|
|
5,432 |
|
|
|
810 |
|
|
|
0 |
|
| |
|
1-Day USD-SOFR Compounded-OIS |
|
|
0.500 |
|
|
Semi-Annual |
|
|
06/16/2028 |
|
|
| |
|
660 |
|
|
|
(31 |
) |
|
|
(29 |
) |
|
|
(60 |
) |
|
|
0 |
|
|
|
0 |
|
| |
|
1-Day USD-SOFR Compounded-OIS |
|
|
3.750 |
|
|
Annual |
|
|
12/18/2028 |
|
|
| |
|
196,000 |
|
|
|
2,649 |
|
|
|
(1,054 |
) |
|
|
1,595 |
|
|
|
200 |
|
|
|
0 |
|
| |
|
1-Day USD-SOFR Compounded-OIS |
|
|
3.750 |
|
|
Annual |
|
|
06/20/2029 |
|
|
| |
|
123,500 |
|
|
|
(2,337 |
) |
|
|
727 |
|
|
|
(1,610 |
) |
|
|
0 |
|
|
|
(151 |
) |
| |
|
1-Day USD-SOFR Compounded-OIS |
|
|
3.750 |
|
|
Annual |
|
|
12/18/2029 |
|
|
| |
|
275,200 |
|
|
|
4,155 |
|
|
|
(1,236 |
) |
|
|
2,919 |
|
|
|
393 |
|
|
|
0 |
|
| |
|
1-Day USD-SOFR Compounded-OIS |
|
|
1.500 |
|
|
Annual |
|
|
12/15/2031 |
|
|
| |
|
98,500 |
|
|
|
(2,199 |
) |
|
|
15,156 |
|
|
|
12,957 |
|
|
|
0 |
|
|
|
(204 |
) |
| |
|
1-Day USD-SOFR Compounded-OIS |
|
|
1.750 |
|
|
Semi-Annual |
|
|
12/15/2031 |
|
|
| |
|
16,600 |
|
|
|
(225 |
) |
|
|
2,182 |
|
|
|
1,957 |
|
|
|
0 |
|
|
|
(35 |
) |
| |
|
1-Day USD-SOFR Compounded-OIS |
|
|
2.000 |
|
|
Annual |
|
|
12/21/2032 |
|
|
| |
|
88,000 |
|
|
|
10,651 |
|
|
|
(517 |
) |
|
|
10,134 |
|
|
|
0 |
|
|
|
(230 |
) |
| |
|
1-Day USD-SOFR Compounded-OIS |
|
|
3.750 |
|
|
Annual |
|
|
12/18/2034 |
|
|
| |
|
1,300 |
|
|
|
28 |
|
|
|
(24 |
) |
|
|
4 |
|
|
|
5 |
|
|
|
0 |
|
| |
|
1-Day USD-SOFR Compounded-OIS |
|
|
3.850 |
|
|
Annual |
|
|
12/21/2038 |
|
|
| |
|
108,200 |
|
|
|
418 |
|
|
|
(117 |
) |
|
|
301 |
|
|
|
0 |
|
|
|
(561 |
) |
| |
|
1-Day USD-SOFR Compounded-OIS |
|
|
2.750 |
|
|
Semi-Annual |
|
|
03/20/2043 |
|
|
| |
|
1,300 |
|
|
|
(4 |
) |
|
|
244 |
|
|
|
240 |
|
|
|
0 |
|
|
|
(7 |
) |
| |
|
1-Day USD-SOFR Compounded-OIS |
|
|
2.750 |
|
|
Semi-Annual |
|
|
12/16/2045 |
|
|
| |
|
3,800 |
|
|
|
(44 |
) |
|
|
853 |
|
|
|
809 |
|
|
|
0 |
|
|
|
(21 |
) |
| |
|
1-Day USD-SOFR Compounded-OIS |
|
|
2.500 |
|
|
|
|
|
06/20/2048 |
|
|
| |
|
3,100 |
|
|
|
256 |
|
|
|
571 |
|
|
|
827 |
|
|
|
0 |
|
|
|
(18 |
) |
| |
|
1-Day USD-SOFR Compounded-OIS |
|
|
2.250 |
|
|
Semi-Annual |
|
|
03/12/2050 |
|
|
| |
|
20,500 |
|
|
|
(367 |
) |
|
|
6,754 |
|
|
|
6,387 |
|
|
|
0 |
|
|
|
(113 |
) |
| |
|
1-Day USD-SOFR Compounded-OIS |
|
|
1.750 |
|
|
Annual |
|
|
06/15/2052 |
|
|
| |
|
68,000 |
|
|
|
16,788 |
|
|
|
8,209 |
|
|
|
24,997 |
|
|
|
0 |
|
|
|
(372 |
) |
| |
|
1-Day USD-SOFR Compounded-OIS |
|
|
1.750 |
|
|
Annual |
|
|
12/21/2052 |
|
|
| |
|
45,800 |
|
|
|
11,031 |
|
|
|
6,537 |
|
|
|
17,568 |
|
|
|
0 |
|
|
|
(252 |
) |
| |
|
1-Day USD-SOFR Compounded-OIS |
|
|
3.500 |
|
|
Annual |
|
|
12/21/2052 |
|
|
| |
|
92,160 |
|
|
|
786 |
|
|
|
6,580 |
|
|
|
7,366 |
|
|
|
0 |
|
|
|
(703 |
) |
| |
|
|
|
|
11.250 |
|
|
Maturity |
|
|
01/04/2027 |
|
|
BRL |
|
|
9,400 |
|
|
|
0 |
|
|
|
(111 |
) |
|
|
(111 |
) |
|
|
2 |
|
|
|
0 |
|
| |
|
|
|
|
11.275 |
|
|
Maturity |
|
|
01/04/2027 |
|
|
| |
|
4,700 |
|
|
|
0 |
|
|
|
(55 |
) |
|
|
(55 |
) |
|
|
1 |
|
|
|
0 |
|
| |
|
|
|
|
11.290 |
|
|
Maturity |
|
|
01/04/2027 |
|
|
| |
|
4,700 |
|
|
|
0 |
|
|
|
(54 |
) |
|
|
(54 |
) |
|
|
1 |
|
|
|
0 |
|
| |
|
|
|
|
11.731 |
|
|
Maturity |
|
|
01/04/2027 |
|
|
| |
|
2,400 |
|
|
|
0 |
|
|
|
(20 |
) |
|
|
(20 |
) |
|
|
0 |
|
|
|
0 |
|
| |
|
|
|
|
11.746 |
|
|
Maturity |
|
|
01/04/2027 |
|
|
| |
|
10,500 |
|
|
|
0 |
|
|
|
(88 |
) |
|
|
(88 |
) |
|
|
2 |
|
|
|
0 |
|
| |
|
|
|
|
11.823 |
|
|
Maturity |
|
|
01/04/2027 |
|
|
| |
|
599,100 |
|
|
|
0 |
|
|
|
4,367 |
|
|
|
4,367 |
|
|
|
0 |
|
|
|
(120 |
) |
| |
|
|
|
|
11.901 |
|
|
Maturity |
|
|
01/04/2027 |
|
|
| |
|
25,100 |
|
|
|
0 |
|
|
|
(183 |
) |
|
|
(183 |
) |
|
|
5 |
|
|
|
0 |
|
| |
|
|
|
|
12.047 |
|
|
Maturity |
|
|
01/04/2027 |
|
|
| |
|
437,000 |
|
|
|
0 |
|
|
|
(2,758 |
) |
|
|
(2,758 |
) |
|
|
88 |
|
|
|
0 |
|
| |
|
|
|
|
0.150 |
|
|
Annual |
|
|
03/18/2030 |
|
|
EUR |
|
|
20,400 |
|
|
|
373 |
|
|
|
2,380 |
|
|
|
2,753 |
|
|
|
21 |
|
|
|
0 |
|
| |
|
|
|
|
0.150 |
|
|
Annual |
|
|
06/17/2030 |
|
|
| |
|
1,200 |
|
|
|
(1 |
) |
|
|
142 |
|
|
|
141 |
|
|
|
1 |
|
|
|
0 |
|
| |
|
|
|
|
0.250 |
|
|
Annual |
|
|
03/18/2050 |
|
|
| |
|
2,500 |
|
|
|
139 |
|
|
|
1,225 |
|
|
|
1,364 |
|
|
|
7 |
|
|
|
0 |
|
| |
|
|
|
|
0.500 |
|
|
Annual |
|
|
06/17/2050 |
|
|
| |
|
500 |
|
|
|
(16 |
) |
|
|
260 |
|
|
|
244 |
|
|
|
2 |
|
|
|
0 |
|
| |
|
|
|
|
0.500 |
|
|
Annual |
|
|
09/21/2052 |
|
|
| |
|
34,600 |
|
|
|
2,992 |
|
|
|
14,954 |
|
|
|
17,946 |
|
|
|
99 |
|
|
|
0 |
|
| |
|
|
|
|
0.830 |
|
|
Annual |
|
|
12/09/2052 |
|
|
| |
|
143,700 |
|
|
|
1,990 |
|
|
|
14,776 |
|
|
|
16,766 |
|
|
|
56 |
|
|
|
0 |
|
| |
|
|
|
|
2.250 |
|
|
Annual |
|
|
09/17/2055 |
|
|
| |
|
14,900 |
|
|
|
1,128 |
|
|
|
696 |
|
|
|
1,824 |
|
|
|
57 |
|
|
|
0 |
|
|
| |
| |
|
|
| |
| |
|
|
| |
| |
|
|
| |
|
|
|
|
|
|
|
|
|
|
|
|
|
|
|
|
|
|
|
| |
|
|
|
|
|
|
|
|
|
|
|
|
|
|
|
|
|
|
|
|
|
|
| |
| |
|
|
| |
| |
|
|
| |
| |
|
|
| |
|
|
|
|
|
|
|
|
|
|
|
|
|
|
|
|
|
|
|
|
|
|
|
|
|
|
|
|
|
|
|
| |
See Accompanying Notes |
|
|
|
|
|
| |
|
|
JUNE 30, 2025 |
|
|
|
|
|
|
|
|
|
| |
Consolidated Schedule of Investments |
|
PIMCO Dynamic Income Fund |
|
|
|
|
FINANCIAL DERIVATIVE INSTRUMENTS: EXCHANGE-TRADED OR CENTRALLY CLEARED SUMMARY
The following is a summary of the market value and variation margin of Exchange-Traded or Centrally Cleared Financial Derivative Instruments as of June 30, 2025:
|
|
|
|
|
|
|
|
|
|
|
|
|
|
|
|
|
|
|
|
|
|
|
|
|
|
|
|
|
|
|
|
|
|
|
|
| |
| |
|
Financial Derivative Assets |
|
|
|
|
|
Financial Derivative Liabilities |
|
| |
|
|
|
|
|
|
|
|
|
|
|
|
|
|
|
|
Variation Margin
Liability |
|
|
|
|
| |
|
|
|
|
|
|
|
|
|
|
|
|
|
|
|
|
|
|
|
|
|
|
|
|
|
|
|
Total Exchange-Traded or Centrally Cleared |
|
|
|
|
|
|
|
|
|
|
|
|
|
|
|
|
|
|
|
| |
|
|
|
|
|
|
|
|
|
|
|
|
|
|
|
|
| |
|
|
|
|
|
|
|
|
|
|
|
|
|
|
|
|
|
|
| |
|
|
|
|
|
|
|
|
|
|
|
|
|
|
|
|
Securities with an aggregate market value of $9,089 and cash of $98,737 have been pledged as collateral for exchange-traded and centrally cleared financial derivative instruments as of June 30, 2025. |
|
This instrument has a forward starting effective date. See Note 2, Securities Transactions and Investment Income, in the Notes to Financial Statements for further information. |
(p) FINANCIAL DERIVATIVE INSTRUMENTS: OVER THE COUNTER
FORWARD FOREIGN CURRENCY CONTRACTS:
|
|
|
|
|
|
|
|
|
|
|
|
|
|
|
|
|
|
|
|
|
|
|
|
| |
| Counterparty |
|
Settlement
Month |
|
|
Currency to
be Delivered |
|
|
Currency to
be Received |
|
|
Unrealized Appreciation/ (Depreciation) |
|
| |
|
|
|
|
|
| |
|
|
07/2025 |
|
|
CNH |
|
|
5,186 |
|
|
$ |
|
|
720 |
|
|
$ |
0 |
|
|
$ |
(5 |
) |
|
| |
|
07/2025 |
|
|
$ |
|
|
288 |
|
|
AUD |
|
|
444 |
|
|
|
4 |
|
|
|
0 |
|
|
| |
|
07/2025 |
|
|
| |
|
1,097,088 |
|
|
EUR |
|
|
936,977 |
|
|
|
6,625 |
|
|
|
0 |
|
|
| |
|
08/2025 |
|
|
AUD |
|
|
444 |
|
|
$ |
|
|
289 |
|
|
|
0 |
|
|
|
(4 |
) |
|
| |
|
08/2025 |
|
|
CNH |
|
|
7,701 |
|
|
| |
|
1,071 |
|
|
|
0 |
|
|
|
(9 |
) |
|
| |
|
08/2025 |
|
|
EUR |
|
|
936,977 |
|
|
| |
|
1,099,492 |
|
|
|
0 |
|
|
|
(6,629 |
) |
|
|
|
|
|
|
|
| |
| |
|
|
07/2025 |
|
|
DOP |
|
|
227,540 |
|
|
| |
|
3,812 |
|
|
|
18 |
|
|
|
0 |
|
|
| |
|
07/2025 |
|
|
PEN |
|
|
3,500 |
|
|
| |
|
963 |
|
|
|
0 |
|
|
|
(24 |
) |
|
| |
|
07/2025 |
|
|
$ |
|
|
1,747 |
|
|
GBP |
|
|
1,287 |
|
|
|
20 |
|
|
|
0 |
|
|
| |
|
08/2025 |
|
|
DOP |
|
|
40,062 |
|
|
$ |
|
|
669 |
|
|
|
5 |
|
|
|
0 |
|
|
|
|
|
|
|
|
| |
| |
|
|
07/2025 |
|
|
EUR |
|
|
4,674 |
|
|
| |
|
5,474 |
|
|
|
0 |
|
|
|
(32 |
) |
|
| |
|
07/2025 |
|
|
$ |
|
|
2,020 |
|
|
EUR |
|
|
1,780 |
|
|
|
77 |
|
|
|
0 |
|
|
| |
|
07/2025 |
|
|
| |
|
33 |
|
|
IDR |
|
|
538,399 |
|
|
|
0 |
|
|
|
0 |
|
|
| |
|
08/2025 |
|
|
CNH |
|
|
2,226 |
|
|
$ |
|
|
312 |
|
|
|
0 |
|
|
|
0 |
|
|
| |
|
08/2025 |
|
|
CZK |
|
|
1,114 |
|
|
| |
|
50 |
|
|
|
0 |
|
|
|
(3 |
) |
|
| |
|
05/2026 |
|
|
$ |
|
|
687 |
|
|
KWD |
|
|
209 |
|
|
|
0 |
|
|
|
(2 |
) |
|
| |
|
06/2026 |
|
|
| |
|
494 |
|
|
| |
|
151 |
|
|
|
0 |
|
|
|
0 |
|
|
| |
|
06/2027 |
|
|
| |
|
239 |
|
|
| |
|
73 |
|
|
|
0 |
|
|
|
(2 |
) |
|
| |
|
05/2029 |
|
|
KWD |
|
|
1,047 |
|
|
$ |
|
|
3,600 |
|
|
|
158 |
|
|
|
0 |
|
|
| |
|
07/2029 |
|
|
| |
|
128 |
|
|
| |
|
440 |
|
|
|
19 |
|
|
|
0 |
|
|
| |
|
05/2030 |
|
|
| |
|
755 |
|
|
| |
|
2,600 |
|
|
|
104 |
|
|
|
0 |
|
|
|
|
|
|
|
|
| |
| |
|
|
07/2025 |
|
|
EUR |
|
|
934,920 |
|
|
| |
|
1,061,994 |
|
|
|
0 |
|
|
|
(39,296 |
) |
|
| |
|
07/2025 |
|
|
GBP |
|
|
4,557 |
|
|
| |
|
6,117 |
|
|
|
0 |
|
|
|
(138 |
) |
|
| |
|
07/2025 |
|
|
TRY |
|
|
48,036 |
|
|
| |
|
1,170 |
|
|
|
0 |
|
|
|
(11 |
) |
|
| |
|
07/2025 |
|
|
$ |
|
|
11,191 |
|
|
EUR |
|
|
9,788 |
|
|
|
339 |
|
|
|
0 |
|
|
| |
|
07/2025 |
|
|
| |
|
244,519 |
|
|
GBP |
|
|
179,732 |
|
|
|
2,189 |
|
|
|
0 |
|
|
| |
|
07/2025 |
|
|
| |
|
59 |
|
|
PLN |
|
|
220 |
|
|
|
2 |
|
|
|
0 |
|
|
| |
|
07/2025 |
|
|
| |
|
43,644 |
|
|
TRY |
|
|
1,778,332 |
|
|
|
732 |
|
|
|
0 |
|
|
| |
|
07/2025 |
|
|
ZAR |
|
|
132,244 |
|
|
$ |
|
|
7,316 |
|
|
|
0 |
|
|
|
(142 |
) |
|
| |
|
08/2025 |
|
|
CZK |
|
|
10,996 |
|
|
| |
|
494 |
|
|
|
0 |
|
|
|
(30 |
) |
|
| |
|
08/2025 |
|
|
GBP |
|
|
177,770 |
|
|
| |
|
241,908 |
|
|
|
0 |
|
|
|
(2,143 |
) |
|
| |
|
08/2025 |
|
|
$ |
|
|
50,024 |
|
|
TRY |
|
|
2,081,625 |
|
|
|
459 |
|
|
|
0 |
|
|
|
|
|
|
|
|
| |
| |
|
|
07/2025 |
|
|
| |
|
979 |
|
|
PEN |
|
|
3,498 |
|
|
|
8 |
|
|
|
0 |
|
|
| |
|
09/2025 |
|
|
PEN |
|
|
3,506 |
|
|
$ |
|
|
979 |
|
|
|
0 |
|
|
|
(8 |
) |
|
|
|
|
|
|
|
| |
| |
|
|
07/2025 |
|
|
EUR |
|
|
13,748 |
|
|
| |
|
15,762 |
|
|
|
0 |
|
|
|
(433 |
) |
|
| |
|
07/2025 |
|
|
$ |
|
|
29,358 |
|
|
EUR |
|
|
25,648 |
|
|
|
854 |
|
|
|
0 |
|
|
| |
|
07/2025 |
|
|
| |
|
60 |
|
|
IDR |
|
|
974,497 |
|
|
|
0 |
|
|
|
0 |
|
|
| |
|
08/2025 |
|
|
CNH |
|
|
1,650 |
|
|
$ |
|
|
230 |
|
|
|
0 |
|
|
|
(2 |
) |
|
|
|
|
|
|
|
| |
| |
|
|
09/2025 |
|
|
MXN |
|
|
42 |
|
|
| |
|
2 |
|
|
|
0 |
|
|
|
0 |
|
|
|
|
|
|
|
|
| |
| |
|
|
07/2025 |
|
|
AUD |
|
|
444 |
|
|
| |
|
286 |
|
|
|
0 |
|
|
|
(6 |
) |
|
| |
|
07/2025 |
|
|
BRL |
|
|
1,027 |
|
|
| |
|
186 |
|
|
|
0 |
|
|
|
(3 |
) |
|
| |
|
07/2025 |
|
|
CNH |
|
|
2,638 |
|
|
| |
|
367 |
|
|
|
0 |
|
|
|
(2 |
) |
|
| |
|
07/2025 |
|
|
JPY |
|
|
1,574 |
|
|
| |
|
11 |
|
|
|
0 |
|
|
|
0 |
|
|
| |
|
07/2025 |
|
|
$ |
|
|
180 |
|
|
BRL |
|
|
1,027 |
|
|
|
9 |
|
|
|
0 |
|
|
| |
|
07/2025 |
|
|
| |
|
21 |
|
|
JPY |
|
|
2,984 |
|
|
|
0 |
|
|
|
0 |
|
|
| |
|
07/2025 |
|
|
| |
|
208 |
|
|
PLN |
|
|
766 |
|
|
|
5 |
|
|
|
0 |
|
|
|
|
|
|
|
| |
96 |
|
PIMCO CLOSED-END FUNDS |
|
|
See Accompanying Notes |
|
|
|
|
|
|
|
|
|
|
|
|
|
|
|
|
|
|
|
|
|
|
|
|
|
| |
| Counterparty |
|
Settlement
Month |
|
|
Currency to
be Delivered |
|
|
Currency to
be Received |
|
|
Unrealized Appreciation/ (Depreciation) |
|
| |
Asset |
|
|
Liability |
|
|
| |
|
08/2025 |
|
|
CNH |
|
|
2,349 |
|
|
$ |
|
|
328 |
|
|
$ |
0 |
|
|
$ |
(1 |
) |
|
| |
|
08/2025 |
|
|
$ |
|
|
11 |
|
|
JPY |
|
|
1,568 |
|
|
|
0 |
|
|
|
0 |
|
|
| |
|
09/2025 |
|
|
| |
|
186 |
|
|
BRL |
|
|
1,043 |
|
|
|
3 |
|
|
|
0 |
|
|
| |
|
09/2025 |
|
|
| |
|
1,818 |
|
|
MXN |
|
|
35,407 |
|
|
|
53 |
|
|
|
0 |
|
|
|
|
|
|
|
|
| |
| |
|
|
07/2025 |
|
|
| |
|
14 |
|
|
IDR |
|
|
230,705 |
|
|
|
0 |
|
|
|
0 |
|
|
| |
|
07/2025 |
|
|
ZAR |
|
|
5,771 |
|
|
$ |
|
|
322 |
|
|
|
0 |
|
|
|
(4 |
) |
|
| |
|
08/2025 |
|
|
DOP |
|
|
1,647,661 |
|
|
| |
|
25,771 |
|
|
|
16 |
|
|
|
(1,491 |
) |
|
| |
|
08/2025 |
|
|
HUF |
|
|
187,576 |
|
|
| |
|
518 |
|
|
|
0 |
|
|
|
(34 |
) |
|
| |
|
09/2025 |
|
|
DOP |
|
|
318,565 |
|
|
| |
|
5,020 |
|
|
|
15 |
|
|
|
(232 |
) |
|
| |
|
11/2025 |
|
|
| |
|
905 |
|
|
| |
|
15 |
|
|
|
0 |
|
|
|
0 |
|
|
|
|
|
|
|
|
| |
| |
|
|
07/2025 |
|
|
CNH |
|
|
4,998 |
|
|
| |
|
693 |
|
|
|
0 |
|
|
|
(6 |
) |
|
| |
|
07/2025 |
|
|
$ |
|
|
1,003 |
|
|
PLN |
|
|
3,745 |
|
|
|
36 |
|
|
|
0 |
|
|
| |
|
07/2025 |
|
|
ZAR |
|
|
37,496 |
|
|
$ |
|
|
2,098 |
|
|
|
0 |
|
|
|
(16 |
) |
|
| |
|
08/2025 |
|
|
CNH |
|
|
7,113 |
|
|
| |
|
989 |
|
|
|
0 |
|
|
|
(8 |
) |
|
| |
|
08/2025 |
|
|
EUR |
|
|
4,674 |
|
|
| |
|
5,492 |
|
|
|
0 |
|
|
|
(26 |
) |
|
|
|
|
|
|
|
| |
| |
|
|
07/2025 |
|
|
CAD |
|
|
4,180 |
|
|
| |
|
3,041 |
|
|
|
0 |
|
|
|
(29 |
) |
|
| |
|
07/2025 |
|
|
CNH |
|
|
2,396 |
|
|
| |
|
333 |
|
|
|
0 |
|
|
|
(3 |
) |
|
| |
|
07/2025 |
|
|
EUR |
|
|
35,338 |
|
|
| |
|
40,825 |
|
|
|
0 |
|
|
|
(802 |
) |
|
| |
|
07/2025 |
|
|
HKD |
|
|
289,036 |
|
|
| |
|
36,952 |
|
|
|
79 |
|
|
|
0 |
|
|
| |
|
07/2025 |
|
|
$ |
|
|
3,042 |
|
|
CAD |
|
|
4,178 |
|
|
|
26 |
|
|
|
0 |
|
|
| |
|
07/2025 |
|
|
| |
|
11,250 |
|
|
EUR |
|
|
9,813 |
|
|
|
310 |
|
|
|
0 |
|
|
| |
|
07/2025 |
|
|
| |
|
2,364 |
|
|
GBP |
|
|
1,720 |
|
|
|
0 |
|
|
|
(3 |
) |
|
| |
|
07/2025 |
|
|
| |
|
12 |
|
|
IDR |
|
|
193,726 |
|
|
|
0 |
|
|
|
0 |
|
|
| |
|
07/2025 |
|
|
| |
|
451 |
|
|
PLN |
|
|
1,689 |
|
|
|
17 |
|
|
|
0 |
|
|
| |
|
08/2025 |
|
|
CNH |
|
|
2,403 |
|
|
$ |
|
|
333 |
|
|
|
0 |
|
|
|
(4 |
) |
|
| |
|
08/2025 |
|
|
$ |
|
|
3,041 |
|
|
CAD |
|
|
4,173 |
|
|
|
29 |
|
|
|
0 |
|
|
| |
|
08/2025 |
|
|
| |
|
41,790 |
|
|
EUR |
|
|
35,556 |
|
|
|
185 |
|
|
|
0 |
|
|
|
|
|
|
|
|
| |
| |
|
|
07/2025 |
|
|
HKD |
|
|
195 |
|
|
$ |
|
|
25 |
|
|
|
0 |
|
|
|
0 |
|
|
| |
|
07/2025 |
|
|
JPY |
|
|
498 |
|
|
| |
|
3 |
|
|
|
0 |
|
|
|
0 |
|
|
| |
|
07/2025 |
|
|
$ |
|
|
1 |
|
|
PLN |
|
|
4 |
|
|
|
0 |
|
|
|
0 |
|
|
| |
|
08/2025 |
|
|
CNH |
|
|
2,395 |
|
|
$ |
|
|
334 |
|
|
|
0 |
|
|
|
(1 |
) |
|
| |
|
08/2025 |
|
|
$ |
|
|
3 |
|
|
JPY |
|
|
496 |
|
|
|
0 |
|
|
|
0 |
|
|
|
|
|
|
|
|
| |
| |
|
|
07/2025 |
|
|
| |
|
169 |
|
|
IDR |
|
|
2,761,318 |
|
|
|
1 |
|
|
|
0 |
|
|
| |
|
08/2025 |
|
|
| |
|
14,916 |
|
|
TRY |
|
|
622,670 |
|
|
|
176 |
|
|
|
0 |
|
|
|
|
|
|
|
|
| |
| |
|
|
07/2025 |
|
|
| |
|
66 |
|
|
IDR |
|
|
1,072,977 |
|
|
|
0 |
|
|
|
0 |
|
|
| |
|
08/2025 |
|
|
CNH |
|
|
4,126 |
|
|
$ |
|
|
578 |
|
|
|
0 |
|
|
|
(1 |
) |
|
|
|
|
|
|
|
| |
| |
|
|
08/2025 |
|
|
HUF |
|
|
8,853 |
|
|
| |
|
24 |
|
|
|
0 |
|
|
|
(2 |
) |
|
|
|
|
|
|
|
| |
| |
|
|
07/2025 |
|
|
GBP |
|
|
176,462 |
|
|
| |
|
238,932 |
|
|
|
0 |
|
|
|
(3,288 |
) |
|
| |
|
|
| |
| |
|
|
| |
| |
|
|
| |
|
|
|
|
|
|
|
Total Forward Foreign Currency Contracts |
|
|
|
|
|
|
|
|
|
|
| |
|
|
| |
| |
|
|
| |
| |
|
|
| |
|
|
|
|
|
|
|
SWAP AGREEMENTS:
CREDIT DEFAULT SWAPS ON CORPORATE AND SOVEREIGN ISSUES - SELL PROTECTION
(1)
|
|
|
|
|
|
|
|
|
|
|
|
|
|
|
|
|
|
|
|
|
|
|
|
|
|
|
|
|
|
|
|
|
|
|
|
|
|
|
|
|
|
| |
| Counterparty |
|
Reference Entity |
|
Fixed
Receive Rate |
|
|
Payment
Frequency |
|
|
Maturity
Date |
|
|
Implied Credit Spread at June 30, 2025 (2) |
|
|
|
|
|
Premiums
Paid/(Received) |
|
|
Unrealized
Appreciation/
(Depreciation) |
|
|
Swap Agreements, |
|
| |
|
|
|
|
|
BPS |
|
|
|
|
1.000 |
% |
|
|
Quarterly |
|
|
|
12/20/2028 |
|
|
|
3.804 |
% |
|
|
$ |
|
|
|
3,000 |
|
|
$ |
(580 |
) |
|
$ |
324 |
|
|
$ |
0 |
|
|
$ |
(256 |
) |
|
|
|
|
|
|
|
|
|
|
|
| |
BRC |
|
Egypt Government International Bond |
|
|
1.000 |
|
|
|
Quarterly |
|
|
|
12/20/2028 |
|
|
|
4.462 |
|
|
|
|
| |
|
22,600 |
|
|
|
(3,907 |
) |
|
|
1,548 |
|
|
|
0 |
|
|
|
(2,359 |
) |
|
| |
Egypt Government International Bond |
|
|
1.000 |
|
|
|
Quarterly |
|
|
|
06/20/2029 |
|
|
|
4.645 |
|
|
|
|
| |
|
6,900 |
|
|
|
(1,476 |
) |
|
|
629 |
|
|
|
0 |
|
|
|
(847 |
) |
|
|
|
|
|
|
|
|
|
|
|
| |
DUB |
|
|
|
|
4.650 |
|
|
|
Quarterly |
|
|
|
06/30/2029 |
|
|
|
— |
|
|
|
|
| |
|
22,100 |
|
|
|
0 |
|
|
|
1,310 |
|
|
|
1,310 |
|
|
|
0 |
|
|
| |
|
|
|
4.750 |
|
|
|
Monthly |
|
|
|
07/06/2026 |
|
|
|
— |
|
|
|
|
| |
|
2,829 |
|
|
|
0 |
|
|
|
15 |
|
|
|
15 |
|
|
|
0 |
|
|
| |
|
|
|
4.850 |
|
|
|
Monthly |
|
|
|
07/06/2026 |
|
|
|
— |
|
|
|
|
| |
|
1,530 |
|
|
|
0 |
|
|
|
9 |
|
|
|
9 |
|
|
|
0 |
|
|
|
|
|
|
|
|
|
|
|
|
| |
GST |
|
|
|
|
5.000 |
|
|
|
Quarterly |
|
|
|
12/20/2025 |
|
|
|
1.048 |
|
|
|
EUR |
|
|
|
400 |
|
|
|
(18 |
) |
|
|
28 |
|
|
|
10 |
|
|
|
0 |
|
|
| |
|
|
|
1.000 |
|
|
|
Quarterly |
|
|
|
06/20/2026 |
|
|
|
1.490 |
|
|
|
$ |
|
|
|
4,800 |
|
|
|
(41 |
) |
|
|
20 |
|
|
|
0 |
|
|
|
(21 |
) |
|
|
|
|
|
|
|
|
|
|
|
| |
MYC |
|
|
|
|
1.000 |
|
|
|
Quarterly |
|
|
|
12/20/2028 |
|
|
|
3.804 |
|
|
|
|
| |
|
3,700 |
|
|
|
(722 |
) |
|
|
407 |
|
|
|
0 |
|
|
|
(315 |
) |
|
| |
| |
|
|
| |
|
|
| |
|
|
| |
|
|
| |
|
|
| |
|
|
| |
|
|
|
|
|
|
|
|
|
|
|
|
|
|
|
|
| |
| |
|
|
| |
|
|
| |
|
|
| |
|
|
| |
|
|
| |
|
|
| |
$ |
(6,744 |
) |
|
$ |
4,290 |
|
|
$ |
1,344 |
|
|
$ |
(3,798 |
) |
|
| |
| |
|
|
| |
|
|
| |
|
|
| |
|
|
| |
|
|
| |
|
|
| |
|
|
|
|
|
|
|
|
|
|
|
|
|
|
|
|
|
|
|
|
|
|
|
|
|
|
|
| |
See Accompanying Notes |
|
|
|
|
|
| |
|
|
JUNE 30, 2025 |
|
|
|
|
|
|
|
|
|
| |
Consolidated Schedule of Investments |
|
PIMCO Dynamic Income Fund |
|
|
|
|
CREDIT DEFAULT SWAPS ON CREDIT INDEXES - SELL PROTECTION
(1)
|
|
|
|
|
|
|
|
|
|
|
|
|
|
|
|
|
|
|
|
|
|
|
|
|
|
|
|
|
|
|
|
|
|
|
|
|
|
| |
| Counterparty |
|
Index/Tranches |
|
Fixed
Receive Rate |
|
|
Payment
Frequency |
|
|
Maturity
Date |
|
|
|
|
|
Premiums
Paid/(Received) |
|
|
Unrealized
Appreciation/
(Depreciation) |
|
|
Swap Agreements, at Value (4) |
|
| |
|
|
|
|
|
GST |
|
|
|
|
0.320 |
% |
|
|
Monthly |
|
|
|
07/25/2045 |
|
|
$ |
|
|
|
|
4,020 |
|
|
$ |
(800 |
) |
|
$ |
500 |
|
|
$ |
0 |
|
|
$ |
(300 |
) |
|
| |
ABX.HE.PENAAA.7-1 Index « |
|
|
0.090 |
|
|
|
Monthly |
|
|
|
08/25/2037 |
|
|
|
|
| |
|
1,124 |
|
|
|
(1,090 |
) |
|
|
1,070 |
|
|
|
0 |
|
|
|
(20 |
) |
UAG |
|
|
|
|
0.170 |
|
|
|
Monthly |
|
|
|
05/25/2046 |
|
|
|
|
| |
|
20,854 |
|
|
|
(1 |
) |
|
|
(3,519 |
) |
|
|
0 |
|
|
|
(3,520 |
) |
|
| |
| |
|
|
| |
|
|
| |
|
|
| |
|
|
| |
|
|
| |
|
|
|
|
|
|
|
|
|
|
|
|
|
|
|
|
| |
|
|
| |
|
|
| |
|
|
| |
|
|
| |
|
|
| |
$ |
(1,891 |
) |
|
$ |
(1,949 |
) |
|
$ |
0 |
|
|
$ |
(3,840 |
) |
|
| |
|
|
| |
|
|
| |
|
|
| |
|
|
| |
|
|
| |
|
|
|
|
|
|
|
|
|
|
|
|
|
|
|
TOTAL RETURN SWAPS ON LOAN PARTICIPATIONS AND ASSIGNMENTS
|
|
|
|
|
|
|
|
|
|
|
|
|
|
|
|
|
|
|
|
|
|
|
|
|
|
|
|
|
|
|
|
|
|
| |
| Counterparty |
|
Pay/Receive |
|
Underlying Reference |
|
Financing Rate |
|
|
Payment
Frequency |
|
Maturity
Date |
|
|
Notional
Amount |
|
|
|
|
|
Unrealized
Appreciation/
(Depreciation) |
|
|
|
|
| |
|
|
|
|
|
| |
|
|
|
|
|
|
1-Day USD-SOFR Compounded-OIS |
|
|
Monthly |
|
|
09/10/2025 |
|
|
$ |
240 |
|
|
$ |
0 |
|
|
$ |
(156 |
) |
|
$ |
0 |
|
|
$ |
(156 |
) |
| |
|
|
|
|
|
|
1-Day USD-SOFR Compounded-OIS |
|
|
Monthly |
|
|
09/10/2025 |
|
|
|
225 |
|
|
|
0 |
|
|
|
(508 |
) |
|
|
0 |
|
|
|
(508 |
) |
| |
|
|
|
Clover Holdings SPV III LLC |
|
|
1-Day USD-SOFR Compounded-OIS |
|
|
Monthly |
|
|
09/10/2025 |
|
|
|
333 |
|
|
|
0 |
|
|
|
331 |
|
|
|
331 |
|
|
|
0 |
|
| |
|
|
|
|
|
|
1-Day USD-SOFR Compounded-OIS |
|
|
Monthly |
|
|
09/10/2025 |
|
|
|
1,028 |
|
|
|
0 |
|
|
|
1,154 |
|
|
|
1,154 |
|
|
|
0 |
|
|
| |
| |
| |
|
|
| |
| |
|
|
| |
|
|
| |
|
|
|
|
|
|
|
|
|
|
|
|
|
|
|
|
|
| |
$ |
0 |
|
|
$ |
821 |
|
|
$ |
1,485 |
|
|
$ |
(664 |
) |
|
| |
| |
| |
|
|
| |
| |
|
|
| |
|
|
| |
|
|
|
|
|
|
|
|
|
|
|
|
|
|
|
TOTAL RETURN SWAPS ON SECURITIES
|
|
|
|
|
|
|
|
|
|
|
|
|
|
|
|
|
|
|
|
|
|
|
|
|
|
|
|
|
|
|
|
|
|
|
|
|
|
|
|
| |
| Counterparty |
|
|
|
Underlying Reference |
|
# of Shares |
|
|
Financing Rate |
|
Payment
Frequency |
|
Maturity
Date |
|
|
Notional
Amount |
|
|
|
|
|
Unrealized
Appreciation/
(Depreciation) |
|
|
Swap Agreements, at Value |
|
| |
|
|
|
|
|
MYC |
|
|
|
Agile Group Holdings Limited « |
|
|
NA |
|
|
0.000% |
|
Maturity |
|
|
01/28/2036 |
|
|
|
CNY |
|
|
|
59,900 |
|
|
$ |
25 |
|
|
$ |
(1,627 |
) |
|
$ |
0 |
|
|
$ |
(1,602 |
) |
|
| |
| |
| |
|
|
| |
| |
| |
|
|
| |
|
|
| |
|
|
| |
|
|
|
|
|
|
|
|
|
|
|
|
|
|
|
| |
|
|
|
|
|
|
|
|
|
|
|
|
|
|
|
|
|
|
| |
| |
| |
|
|
| |
| |
| |
|
|
| |
|
|
| |
|
|
| |
|
|
|
|
|
|
|
|
|
|
|
|
|
|
|
FINANCIAL DERIVATIVE INSTRUMENTS: OVER THE COUNTER SUMMARY
The following is a summary by counterparty of the market value of OTC financial derivative instruments and collateral pledged/(received) as of June 30, 2025:
|
|
|
|
|
|
|
|
|
|
|
|
|
|
|
|
|
|
|
|
|
|
|
|
|
|
|
|
|
|
|
|
|
|
|
|
|
|
|
|
|
|
|
|
|
|
|
|
| |
| |
|
Financial Derivative Assets |
|
|
|
|
|
Financial Derivative Liabilities |
|
|
|
|
|
|
|
|
|
|
|
|
Forward
Foreign
Currency
Contracts |
|
|
|
|
|
|
|
|
|
|
|
|
|
|
Forward
Foreign
Currency
Contracts |
|
|
|
|
|
|
|
|
|
|
|
Net Market
Value of OTC
Derivatives |
|
|
Collateral
Pledged/
(Received) |
|
|
|
|
| |
|
$ |
6,629 |
|
|
$ |
0 |
|
|
$ |
0 |
|
|
$ |
6,629 |
|
|
|
|
| |
$ |
(6,647 |
) |
|
$ |
0 |
|
|
$ |
0 |
|
|
$ |
(6,647 |
) |
|
$ |
(18 |
) |
|
$ |
0 |
|
|
$ |
(18 |
) |
| |
|
|
43 |
|
|
|
0 |
|
|
|
0 |
|
|
|
43 |
|
|
|
|
| |
|
(24 |
) |
|
|
0 |
|
|
|
0 |
|
|
|
(24 |
) |
|
|
19 |
|
|
|
0 |
|
|
|
19 |
|
| |
|
|
358 |
|
|
|
0 |
|
|
|
1,485 |
|
|
|
1,843 |
|
|
|
|
| |
|
(39 |
) |
|
|
0 |
|
|
|
(920 |
) |
|
|
(959 |
) |
|
|
884 |
|
|
|
(558 |
) |
|
|
326 |
|
| |
|
|
3,721 |
|
|
|
0 |
|
|
|
0 |
|
|
|
3,721 |
|
|
|
|
| |
|
(41,760 |
) |
|
|
0 |
|
|
|
(3,206 |
) |
|
|
(44,966 |
) |
|
|
(41,245 |
) |
|
|
35,457 |
|
|
|
(5,788 |
) |
| |
|
|
8 |
|
|
|
0 |
|
|
|
0 |
|
|
|
8 |
|
|
|
|
| |
|
(8 |
) |
|
|
0 |
|
|
|
0 |
|
|
|
(8 |
) |
|
|
0 |
|
|
|
0 |
|
|
|
0 |
|
| |
|
|
854 |
|
|
|
0 |
|
|
|
0 |
|
|
|
854 |
|
|
|
|
| |
|
(435 |
) |
|
|
0 |
|
|
|
0 |
|
|
|
(435 |
) |
|
|
419 |
|
|
|
(340 |
) |
|
|
79 |
|
| |
|
|
0 |
|
|
|
0 |
|
|
|
1,334 |
|
|
|
1,334 |
|
|
|
|
| |
|
0 |
|
|
|
0 |
|
|
|
0 |
|
|
|
0 |
|
|
|
1,334 |
|
|
|
(1,530 |
) |
|
|
(196 |
) |
| |
|
|
70 |
|
|
|
0 |
|
|
|
0 |
|
|
|
70 |
|
|
|
|
| |
|
(12 |
) |
|
|
0 |
|
|
|
0 |
|
|
|
(12 |
) |
|
|
58 |
|
|
|
0 |
|
|
|
58 |
|
| |
|
|
31 |
|
|
|
0 |
|
|
|
0 |
|
|
|
31 |
|
|
|
|
| |
|
(1,761 |
) |
|
|
0 |
|
|
|
0 |
|
|
|
(1,761 |
) |
|
|
(1,730 |
) |
|
|
1,749 |
|
|
|
19 |
|
| |
|
|
0 |
|
|
|
0 |
|
|
|
10 |
|
|
|
10 |
|
|
|
|
| |
|
0 |
|
|
|
0 |
|
|
|
(341 |
) |
|
|
(341 |
) |
|
|
(331 |
) |
|
|
237 |
|
|
|
(94 |
) |
| |
|
|
36 |
|
|
|
0 |
|
|
|
0 |
|
|
|
36 |
|
|
|
|
| |
|
(56 |
) |
|
|
0 |
|
|
|
0 |
|
|
|
(56 |
) |
|
|
(20 |
) |
|
|
0 |
|
|
|
(20 |
) |
| |
|
|
646 |
|
|
|
0 |
|
|
|
0 |
|
|
|
646 |
|
|
|
|
| |
|
(841 |
) |
|
|
0 |
|
|
|
0 |
|
|
|
(841 |
) |
|
|
(195 |
) |
|
|
0 |
|
|
|
(195 |
) |
| |
|
|
0 |
|
|
|
0 |
|
|
|
0 |
|
|
|
0 |
|
|
|
|
| |
|
0 |
|
|
|
0 |
|
|
|
(1,917 |
) |
|
|
(1,917 |
) |
|
|
(1,917 |
) |
|
|
2,175 |
|
|
|
258 |
|
| |
|
|
0 |
|
|
|
0 |
|
|
|
0 |
|
|
|
0 |
|
|
|
|
| |
|
(1 |
) |
|
|
0 |
|
|
|
0 |
|
|
|
(1 |
) |
|
|
(1 |
) |
|
|
0 |
|
|
|
(1 |
) |
| |
|
|
177 |
|
|
|
0 |
|
|
|
0 |
|
|
|
177 |
|
|
|
|
| |
|
0 |
|
|
|
0 |
|
|
|
0 |
|
|
|
0 |
|
|
|
177 |
|
|
|
0 |
|
|
|
177 |
|
| |
|
|
0 |
|
|
|
0 |
|
|
|
0 |
|
|
|
0 |
|
|
|
|
| |
|
(1 |
) |
|
|
0 |
|
|
|
0 |
|
|
|
(1 |
) |
|
|
(1 |
) |
|
|
0 |
|
|
|
(1 |
) |
| |
|
|
0 |
|
|
|
0 |
|
|
|
0 |
|
|
|
0 |
|
|
|
|
| |
|
(2 |
) |
|
|
0 |
|
|
|
0 |
|
|
|
(2 |
) |
|
|
(2 |
) |
|
|
0 |
|
|
|
(2 |
) |
| |
|
|
0 |
|
|
|
0 |
|
|
|
0 |
|
|
|
0 |
|
|
|
|
| |
|
(3,288 |
) |
|
|
0 |
|
|
|
0 |
|
|
|
(3,288 |
) |
|
|
(3,288 |
) |
|
|
3,030 |
|
|
|
(258 |
) |
| |
|
|
0 |
|
|
|
0 |
|
|
|
0 |
|
|
|
0 |
|
|
|
|
| |
|
0 |
|
|
|
0 |
|
|
|
(3,520 |
) |
|
|
(3,520 |
) |
|
|
(3,520 |
) |
|
|
2,352 |
|
|
|
(1,168 |
) |
|
| |
|
|
|
|
|
|
|
|
|
|
|
|
|
|
|
|
|
|
| |
|
|
|
|
|
|
|
|
|
|
|
|
|
|
|
|
|
|
| |
|
|
| |
|
| |
| |
|
|
|
|
|
|
|
|
|
|
|
|
|
|
|
|
|
|
|
| |
|
|
|
|
|
|
|
|
|
|
|
|
|
|
|
|
|
|
| |
|
|
| |
|
| |
|
| |
|
|
|
|
|
|
|
|
|
|
|
|
|
|
|
|
|
|
| |
|
|
|
|
|
|
|
|
|
|
|
|
|
|
|
|
|
|
| |
|
|
| |
|
| |
|
Securities with an aggregate market value of $44,999 have been pledged as collateral for financial derivative instruments as governed by International Swaps and Derivatives Association, Inc. master agreements as of June 30, 2025. |
|
Implied credit spread is not available due to significant unobservable inputs being used in the fair valuation. |
|
If the Fund is a seller of protection and a credit event occurs, as defined under the terms of that particular swap agreement, the Fund will either (i) pay to the buyer of protection an amount equal to the notional amount of the swap and take delivery of the referenced obligation or underlying securities comprising the referenced index or (ii) pay a net settlement amount in the form of cash, securities or other deliverable obligations equal to the notional amount of the swap less the recovery value of the referenced obligation or underlying securities comprising the referenced index. |
|
|
|
|
|
|
| |
98 |
|
PIMCO CLOSED-END FUNDS |
|
|
See Accompanying Notes |
|
|
Implied credit spreads, represented in absolute terms, utilized in determining the market value of credit default swap agreements on corporate or sovereign issues as of period end serve as indicators of the current status of the payment/performance risk and represent the likelihood or risk of default for the credit derivative. The implied credit spread of a particular referenced entity reflects the cost of buying/selling protection and may include upfront payments required to be made to enter into the agreement. Wider credit spreads represent a deterioration of the referenced entity’s credit soundness and a greater likelihood or risk of default or other credit event occurring as defined under the terms of the agreement. |
|
The maximum potential amount the Fund could be required to pay as a seller of credit protection or receive as a buyer of credit protection if a credit event occurs as defined under the terms of that particular swap agreement. |
|
The prices and resulting values for credit default swap agreements serve as indicators of the current status of the payment/performance risk and represent the likelihood of an expected liability (or profit) for the credit derivative should the notional amount of the swap agreement be closed/sold as of the period end. Increasing market values, in absolute terms when compared to the notional amount of the swap, represent a deterioration of the underlying referenced instrument’s credit soundness and a greater likelihood or risk of default or other credit event occurring as defined under the terms of the agreement. |
|
Receive represents that the Fund receives payments for any positive net return on the underlying reference. The Fund makes payments for any negative net return on such underlying reference. Pay represents that the Fund receives payments for any negative net return on the underlying reference. The Fund makes payments for any positive net return on such underlying reference. |
|
Net Exposure represents the net receivable/(payable) that would be due from/to the counterparty in the event of default. Exposure from OTC financial derivative instruments can only be netted across transactions governed under the same master agreement with the same legal entity. See Note 8, Master Netting Arrangements, in the Notes to Financial Statements for more information. |
FAIR VALUE OF FINANCIAL DERIVATIVE INSTRUMENTS
The following is a summary of the fair valuation of the Fund’s derivative instruments categorized by risk exposure. See Note 7, Principal and Other Risks, in the Notes to Financial Statements on risks of the Fund.
Fair Values of Financial Derivative Instruments on the Consolidated Statements of Assets and Liabilities as of June 30, 2025:
|
|
|
|
|
|
|
|
|
|
|
|
|
|
|
|
|
|
|
|
|
|
|
|
| |
| |
|
Derivatives not accounted for as hedging instruments |
|
| |
|
|
|
|
|
|
|
|
|
|
|
|
|
|
|
|
|
|
Financial Derivative Instruments - Assets |
|
Exchange-traded or centrally cleared |
|
| |
|
$ |
0 |
|
|
$ |
0 |
|
|
$ |
0 |
|
|
$ |
0 |
|
|
$ |
6 |
|
|
$ |
6 |
|
| |
|
|
0 |
|
|
|
0 |
|
|
|
0 |
|
|
|
0 |
|
|
|
5,472 |
|
|
|
5,472 |
|
|
| |
|
|
|
|
|
|
|
|
|
|
|
|
|
|
|
|
|
|
|
|
|
|
|
|
| |
$ |
0 |
|
|
$ |
0 |
|
|
$ |
0 |
|
|
$ |
0 |
|
|
$ |
5,478 |
|
|
$ |
5,478 |
|
|
| |
|
|
|
|
|
|
|
|
|
|
|
|
|
|
|
|
|
|
|
|
|
|
|
| |
|
Forward Foreign Currency Contracts |
|
$ |
0 |
|
|
$ |
0 |
|
|
$ |
0 |
|
|
$ |
12,573 |
|
|
$ |
0 |
|
|
$ |
12,573 |
|
| |
|
|
0 |
|
|
|
1,344 |
|
|
|
0 |
|
|
|
0 |
|
|
|
1,485 |
|
|
|
2,829 |
|
|
| |
|
|
|
|
|
|
|
|
|
|
|
|
|
|
|
|
|
|
|
|
|
|
|
|
| |
$ |
0 |
|
|
$ |
1,344 |
|
|
$ |
0 |
|
|
$ |
12,573 |
|
|
$ |
1,485 |
|
|
$ |
15,402 |
|
|
| |
|
|
|
|
|
|
|
|
|
|
|
|
|
|
|
|
|
|
|
|
|
|
|
|
| |
$ |
0 |
|
|
$ |
1,344 |
|
|
$ |
0 |
|
|
$ |
12,573 |
|
|
$ |
6,963 |
|
|
$ |
20,880 |
|
|
| |
|
|
|
|
|
|
|
|
|
|
|
|
|
|
|
|
|
|
|
|
|
|
|
|
Financial Derivative Instruments - Liabilities |
|
Exchange-traded or centrally cleared |
|
| |
|
$ |
0 |
|
|
$ |
0 |
|
|
$ |
0 |
|
|
$ |
0 |
|
|
$ |
13 |
|
|
$ |
13 |
|
| |
|
|
0 |
|
|
|
0 |
|
|
|
0 |
|
|
|
0 |
|
|
|
2,799 |
|
|
|
2,799 |
|
|
| |
|
|
|
|
|
|
|
|
|
|
|
|
|
|
|
|
|
|
|
|
|
|
|
|
| |
$ |
0 |
|
|
$ |
0 |
|
|
$ |
0 |
|
|
$ |
0 |
|
|
$ |
2,812 |
|
|
$ |
2,812 |
|
|
| |
|
|
|
|
|
|
|
|
|
|
|
|
|
|
|
|
|
|
|
|
|
|
|
| |
|
Forward Foreign Currency Contracts |
|
$ |
0 |
|
|
$ |
0 |
|
|
$ |
0 |
|
|
$ |
54,875 |
|
|
$ |
0 |
|
|
$ |
54,875 |
|
| |
|
|
0 |
|
|
|
7,638 |
|
|
|
1,602 |
|
|
|
0 |
|
|
|
664 |
|
|
|
9,904 |
|
|
| |
|
|
|
|
|
|
|
|
|
|
|
|
|
|
|
|
|
|
|
|
|
|
|
|
| |
$ |
0 |
|
|
$ |
7,638 |
|
|
$ |
1,602 |
|
|
$ |
54,875 |
|
|
$ |
664 |
|
|
$ |
64,779 |
|
|
| |
|
|
|
|
|
|
|
|
|
|
|
|
|
|
|
|
|
|
|
|
|
|
|
|
| |
$ |
0 |
|
|
$ |
7,638 |
|
|
$ |
1,602 |
|
|
$ |
54,875 |
|
|
$ |
3,476 |
|
|
$ |
67,591 |
|
|
| |
|
|
|
|
|
|
|
|
|
|
|
|
|
|
|
|
|
|
|
|
|
|
|
The effect of Financial Derivative Instruments on the Consolidated Statements of Operations for the period ended June 30, 2025:
|
|
|
|
|
|
|
|
|
|
|
|
|
|
|
|
|
|
|
|
|
|
|
|
| |
| |
|
Derivatives not accounted for as hedging instruments |
|
| |
|
|
|
|
|
|
|
|
|
|
|
|
|
|
|
|
|
|
Net Realized Gain (Loss) on Financial Derivative Instruments |
|
Exchange-traded or centrally cleared |
|
| |
|
$ |
0 |
|
|
$ |
0 |
|
|
$ |
0 |
|
|
$ |
0 |
|
|
$ |
2,908 |
|
|
$ |
2,908 |
|
| |
|
|
0 |
|
|
|
705 |
|
|
|
0 |
|
|
|
0 |
|
|
|
47,047 |
|
|
|
47,752 |
|
|
| |
|
|
|
|
|
|
|
|
|
|
|
|
|
|
|
|
|
|
|
|
|
|
|
|
| |
$ |
0 |
|
|
$ |
705 |
|
|
$ |
0 |
|
|
$ |
0 |
|
|
$ |
49,955 |
|
|
$ |
50,660 |
|
|
| |
|
|
|
|
|
|
|
|
|
|
|
|
|
|
|
|
|
|
|
|
|
|
|
| |
|
Forward Foreign Currency Contracts |
|
$ |
0 |
|
|
$ |
0 |
|
|
$ |
0 |
|
|
$ |
(24,936 |
) |
|
$ |
0 |
|
|
$ |
(24,936 |
) |
| |
|
|
0 |
|
|
|
22,752 |
|
|
|
0 |
|
|
|
0 |
|
|
|
6,616 |
|
|
|
29,368 |
|
|
| |
|
|
|
|
|
|
|
|
|
|
|
|
|
|
|
|
|
|
|
|
|
|
|
|
| |
$ |
0 |
|
|
$ |
22,752 |
|
|
$ |
0 |
|
|
$ |
(24,936 |
) |
|
$ |
6,616 |
|
|
$ |
4,432 |
|
|
| |
|
|
|
|
|
|
|
|
|
|
|
|
|
|
|
|
|
|
|
|
|
|
|
|
| |
$ |
0 |
|
|
$ |
23,457 |
|
|
$ |
0 |
|
|
$ |
(24,936 |
) |
|
$ |
56,571 |
|
|
$ |
55,092 |
|
|
| |
|
|
|
|
|
|
|
|
|
|
|
|
|
|
|
|
|
|
|
|
|
|
|
|
|
|
|
|
|
|
|
|
|
|
|
| |
See Accompanying Notes |
|
|
|
|
|
| |
|
|
JUNE 30, 2025 |
|
|
|
|
|
|
|
|
|
| |
Consolidated Schedule of Investments |
|
PIMCO Dynamic Income Fund |
|
|
|
|
|
|
|
|
|
|
|
|
|
|
|
|
|
|
|
|
|
|
|
|
|
|
|
|
| |
| |
|
Derivatives not accounted for as hedging instruments |
|
| |
|
Commodity
Contracts |
|
|
Credit
Contracts |
|
|
Equity
Contracts |
|
|
Foreign
Exchange
Contracts |
|
|
Interest
Rate Contracts |
|
|
Total |
|
|
Net Change in Unrealized Appreciation (Depreciation) on Financial Derivative Instruments |
|
Exchange-traded or centrally cleared |
|
| |
|
$ |
0 |
|
|
$ |
0 |
|
|
$ |
0 |
|
|
$ |
0 |
|
|
$ |
(2,538 |
) |
|
$ |
(2,538 |
) |
| |
|
|
0 |
|
|
|
0 |
|
|
|
0 |
|
|
|
0 |
|
|
|
3,285 |
|
|
|
3,285 |
|
|
| |
|
|
|
|
|
|
|
|
|
|
|
|
|
|
|
|
|
|
|
|
|
|
|
|
| |
$ |
0 |
|
|
$ |
0 |
|
|
$ |
0 |
|
|
$ |
0 |
|
|
$ |
747 |
|
|
$ |
747 |
|
|
| |
|
|
|
|
|
|
|
|
|
|
|
|
|
|
|
|
|
|
|
|
|
|
|
| |
|
Forward Foreign Currency Contracts |
|
$ |
0 |
|
|
$ |
0 |
|
|
$ |
0 |
|
|
$ |
(57,273 |
) |
|
$ |
0 |
|
|
$ |
(57,273 |
) |
| |
|
|
0 |
|
|
|
(17,282 |
) |
|
|
1,186 |
|
|
|
0 |
|
|
|
(1,864 |
) |
|
|
(17,960 |
) |
|
| |
|
|
|
|
|
|
|
|
|
|
|
|
|
|
|
|
|
|
|
|
|
|
|
|
| |
$ |
0 |
|
|
$ |
(17,282 |
) |
|
$ |
1,186 |
|
|
$ |
(57,273 |
) |
|
$ |
(1,864 |
) |
|
$ |
(75,233 |
) |
|
| |
|
|
|
|
|
|
|
|
|
|
|
|
|
|
|
|
|
|
|
|
|
|
|
|
| |
$ |
0 |
|
|
$ |
(17,282 |
) |
|
$ |
1,186 |
|
|
$ |
(57,273 |
) |
|
$ |
(1,117 |
) |
|
$ |
(74,486 |
) |
|
| |
|
|
|
|
|
|
|
|
|
|
|
|
|
|
|
|
|
|
|
|
|
|
|
FAIR VALUE MEASUREMENTS
The following is a summary of the fair valuations according to the inputs used as of June 30, 2025 in valuing the Fund’s assets and liabilities:
|
|
|
|
|
|
|
|
|
|
|
|
|
|
|
|
| |
|
|
|
|
|
|
|
|
|
|
|
|
|
Investments in Securities, at Value |
|
Loan Participations and Assignments |
|
$ |
0 |
|
|
$ |
1,690,387 |
|
|
$ |
694,936 |
|
|
$ |
2,385,323 |
|
| |
|
|
|
| |
|
|
| |
|
|
| |
|
| |
| |
|
|
0 |
|
|
|
313,727 |
|
|
|
2,009 |
|
|
|
315,736 |
|
| |
|
|
0 |
|
|
|
1,212,507 |
|
|
|
169,595 |
|
|
|
1,382,102 |
|
| |
|
|
0 |
|
|
|
133,784 |
|
|
|
0 |
|
|
|
133,784 |
|
Convertible Bonds & Notes |
|
|
|
| |
|
|
| |
|
|
| |
|
| |
| |
|
|
0 |
|
|
|
8,829 |
|
|
|
0 |
|
|
|
8,829 |
|
| |
|
|
|
| |
|
|
| |
|
|
| |
|
| |
| |
|
|
0 |
|
|
|
881 |
|
|
|
0 |
|
|
|
881 |
|
| |
|
|
0 |
|
|
|
3,006 |
|
|
|
0 |
|
|
|
3,006 |
|
| |
|
|
0 |
|
|
|
32,528 |
|
|
|
0 |
|
|
|
32,528 |
|
| |
|
|
0 |
|
|
|
122,325 |
|
|
|
0 |
|
|
|
122,325 |
|
Non-Agency Mortgage-Backed Securities |
|
|
0 |
|
|
|
2,001,803 |
|
|
|
195,225 |
|
|
|
2,197,028 |
|
| |
|
|
|
| |
|
|
| |
|
|
| |
|
| |
| |
|
|
0 |
|
|
|
14,551 |
|
|
|
15,176 |
|
|
|
29,727 |
|
| |
|
|
0 |
|
|
|
0 |
|
|
|
17,379 |
|
|
|
17,379 |
|
| |
|
|
0 |
|
|
|
604,867 |
|
|
|
0 |
|
|
|
604,867 |
|
| |
|
|
0 |
|
|
|
9 |
|
|
|
0 |
|
|
|
9 |
|
Manufacturing House ABS Other |
|
|
0 |
|
|
|
20,395 |
|
|
|
0 |
|
|
|
20,395 |
|
Manufacturing House Sequential |
|
|
0 |
|
|
|
5,925 |
|
|
|
0 |
|
|
|
5,925 |
|
| |
|
|
0 |
|
|
|
75,443 |
|
|
|
0 |
|
|
|
75,443 |
|
| |
|
|
0 |
|
|
|
258,641 |
|
|
|
169,669 |
|
|
|
428,310 |
|
| |
|
|
0 |
|
|
|
457,603 |
|
|
|
0 |
|
|
|
457,603 |
|
| |
|
|
|
| |
|
|
| |
|
|
| |
|
| |
| |
|
|
11,061 |
|
|
|
0 |
|
|
|
61,862 |
|
|
|
72,923 |
|
| |
|
|
0 |
|
|
|
0 |
|
|
|
272 |
|
|
|
272 |
|
| |
|
|
52,643 |
|
|
|
0 |
|
|
|
60,657 |
|
|
|
113,300 |
|
| |
|
|
52 |
|
|
|
0 |
|
|
|
6,117 |
|
|
|
6,169 |
|
| |
|
|
|
| |
|
|
| |
|
|
| |
|
| |
| |
|
|
0 |
|
|
|
0 |
|
|
|
12,301 |
|
|
|
12,301 |
|
| |
|
|
0 |
|
|
|
0 |
|
|
|
28 |
|
|
|
28 |
|
| |
|
|
|
| |
|
|
| |
|
|
| |
|
| |
| |
|
|
770 |
|
|
|
41,696 |
|
|
|
0 |
|
|
|
42,466 |
|
| |
|
|
0 |
|
|
|
15,496 |
|
|
|
77,463 |
|
|
|
92,959 |
|
|
|
|
|
|
|
|
|
|
|
|
|
|
|
|
|
| |
Category and Subcategory |
|
Level 1 |
|
|
Level 2 |
|
|
Level 3 |
|
|
Fair
Value at
06/30/2025 |
|
Real Estate Investment Trusts |
|
|
|
| |
|
|
| |
|
|
| |
|
| |
| |
|
$ |
30,062 |
|
|
$ |
0 |
|
|
$ |
0 |
|
|
$ |
30,062 |
|
| |
|
|
|
| |
|
|
| |
|
|
| |
|
| |
| |
|
|
0 |
|
|
|
166,689 |
|
|
|
0 |
|
|
|
166,689 |
|
| |
|
|
0 |
|
|
|
3,575 |
|
|
|
0 |
|
|
|
3,575 |
|
| |
|
|
0 |
|
|
|
63,695 |
|
|
|
0 |
|
|
|
63,695 |
|
|
| |
|
|
|
|
|
|
|
|
|
|
|
|
|
|
|
|
| |
$ |
94,588 |
|
|
$ |
7,248,362 |
|
|
$ |
1,482,689 |
|
|
$ |
8,825,639 |
|
|
| |
|
|
|
|
|
|
|
|
|
|
|
|
|
|
|
|
Investments in Affiliates, at Value |
|
| |
|
| |
|
|
2,853 |
|
|
|
0 |
|
|
|
314,038 |
|
|
|
316,891 |
|
| |
|
Central Funds Used for Cash Management Purposes |
|
|
634,957 |
|
|
|
0 |
|
|
|
0 |
|
|
|
634,957 |
|
|
| |
|
|
|
|
|
|
|
|
|
|
|
|
|
|
|
|
| |
$ |
637,810 |
|
|
$ |
0 |
|
|
$ |
314,038 |
|
|
$ |
951,848 |
|
|
| |
|
|
|
|
|
|
|
|
|
|
|
|
|
|
|
|
|
|
|
| |
| |
|
$ |
732,398 |
|
|
$ |
7,248,362 |
|
|
$ |
1,796,727 |
|
|
$ |
9,777,487 |
|
|
| |
|
|
|
|
|
|
|
|
|
|
|
|
|
|
|
|
Financial Derivative Instruments - Assets |
|
Exchange-traded or centrally cleared |
|
|
0 |
|
|
|
5,478 |
|
|
|
0 |
|
|
|
5,478 |
|
| |
|
|
0 |
|
|
|
14,068 |
|
|
|
1,334 |
|
|
|
15,402 |
|
|
| |
|
|
|
|
|
|
|
|
|
|
|
|
|
|
|
|
| |
$ |
0 |
|
|
$ |
19,546 |
|
|
$ |
1,334 |
|
|
$ |
20,880 |
|
|
| |
|
|
|
|
|
|
|
|
|
|
|
|
|
|
|
|
Financial Derivative Instruments - Liabilities |
|
Exchange-traded or centrally cleared |
|
|
0 |
|
|
|
(2,812 |
) |
|
|
0 |
|
|
|
(2,812 |
) |
| |
|
|
0 |
|
|
|
(59,337 |
) |
|
|
(5,442 |
) |
|
|
(64,779 |
) |
|
| |
|
|
|
|
|
|
|
|
|
|
|
|
|
|
|
|
| |
$ |
0 |
|
|
$ |
(62,149 |
) |
|
$ |
(5,442 |
) |
|
$ |
(67,591 |
) |
|
| |
|
|
|
|
|
|
|
|
|
|
|
|
|
|
|
|
|
|
|
| |
Total Financial Derivative Instruments |
|
$ |
0 |
|
|
$ |
(42,603 |
) |
|
$ |
(4,108 |
) |
|
$ |
(46,711 |
) |
|
| |
|
|
|
|
|
|
|
|
|
|
|
|
|
|
|
|
|
|
|
| |
| |
|
$ |
732,398 |
|
|
$ |
7,205,759 |
|
|
$ |
1,792,619 |
|
|
$ |
9,730,776 |
|
|
| |
|
|
|
|
|
|
|
|
|
|
|
|
|
|
|
|
|
|
|
|
|
| |
100 |
|
PIMCO CLOSED-END FUNDS |
|
|
See Accompanying Notes |
|
The following is a reconciliation of the fair valuations using significant unobservable inputs (Level 3) for the Fund during the period ended June 30, 2025:
|
|
|
|
|
|
|
|
|
|
|
|
|
|
|
|
|
|
|
|
|
|
|
|
|
|
|
|
|
|
|
|
|
|
|
|
|
|
|
|
| |
|
|
Beginning
Balance
at 06/30/2024 |
|
|
|
|
|
|
|
|
Accrued
Discounts/
(Premiums) |
|
|
|
|
|
Net Change in Unrealized Appreciation/ (Depreciation) (2) |
|
|
|
|
|
|
|
|
Ending
Balance
at 06/30/2025 |
|
|
Net Change in Unrealized Appreciation/ (Depreciation) on Investments Held at 06/30/2025 (2) |
|
Investments in Securities, at Value |
|
Loan Participations and Assignments |
|
$ |
568,000 |
|
|
$ |
374,913 |
|
|
$ |
(318,770 |
) |
|
$ |
3,088 |
|
|
$ |
7,456 |
|
|
$ |
42,397 |
|
|
$ |
17,852 |
|
|
$ |
0 |
|
|
$ |
694,936 |
|
|
$ |
7,901 |
|
| |
|
| |
|
|
61,252 |
|
|
|
1,888 |
|
|
|
(62,435 |
) |
|
|
0 |
|
|
|
2,434 |
|
|
|
(833 |
) |
|
|
0 |
|
|
|
(297 |
) |
|
|
2,009 |
|
|
|
121 |
|
| |
|
|
188,223 |
|
|
|
118,848 |
|
|
|
(162,713 |
) |
|
|
(332 |
) |
|
|
(50,671 |
) |
|
|
45,615 |
|
|
|
31,718 |
|
|
|
(1,093 |
) |
|
|
169,595 |
|
|
|
19,203 |
|
Non-Agency Mortgage-Backed Securities (3) |
|
|
8,328 |
|
|
|
193,382 |
|
|
|
(2,116 |
) |
|
|
158 |
|
|
|
189 |
|
|
|
222 |
|
|
|
1,935 |
|
|
|
(6,873 |
) |
|
|
195,225 |
|
|
|
3 |
|
| |
|
| |
|
|
23,922 |
|
|
|
0 |
|
|
|
0 |
|
|
|
0 |
|
|
|
0 |
|
|
|
(8,746 |
) |
|
|
0 |
|
|
|
0 |
|
|
|
15,176 |
|
|
|
(8,745 |
) |
| |
|
|
0 |
|
|
|
17,100 |
|
|
|
0 |
|
|
|
0 |
|
|
|
0 |
|
|
|
279 |
|
|
|
0 |
|
|
|
0 |
|
|
|
17,379 |
|
|
|
279 |
|
| |
|
|
1,367 |
|
|
|
0 |
|
|
|
(362 |
) |
|
|
32 |
|
|
|
37 |
|
|
|
(35 |
) |
|
|
0 |
|
|
|
(1,039 |
) |
|
|
0 |
|
|
|
0 |
|
| |
|
|
670 |
|
|
|
0 |
|
|
|
(141 |
) |
|
|
6 |
|
|
|
19 |
|
|
|
8 |
|
|
|
0 |
|
|
|
(562 |
) |
|
|
0 |
|
|
|
0 |
|
| |
|
|
109,197 |
|
|
|
80,480 |
|
|
|
(6,698 |
) |
|
|
(248 |
) |
|
|
(3,028 |
) |
|
|
(9,667 |
) |
|
|
0 |
|
|
|
(367 |
) |
|
|
169,669 |
|
|
|
(8,548 |
) |
| |
|
Communication Services (4) |
|
|
52,830 |
|
|
|
0 |
|
|
|
0 |
|
|
|
0 |
|
|
|
0 |
|
|
|
9,032 |
|
|
|
0 |
|
|
|
0 |
|
|
|
61,862 |
|
|
|
9,032 |
|
Consumer Discretionary (5) |
|
|
272 |
|
|
|
0 |
|
|
|
0 |
|
|
|
0 |
|
|
|
0 |
|
|
|
0 |
|
|
|
0 |
|
|
|
0 |
|
|
|
272 |
|
|
|
0 |
|
| |
|
|
3,964 |
|
|
|
0 |
|
|
|
(4,288 |
) |
|
|
0 |
|
|
|
4,008 |
|
|
|
(3,684 |
) |
|
|
0 |
|
|
|
0 |
|
|
|
0 |
|
|
|
0 |
|
| |
|
|
65,286 |
|
|
|
285 |
|
|
|
0 |
|
|
|
0 |
|
|
|
0 |
|
|
|
(4,914 |
) |
|
|
0 |
|
|
|
0 |
|
|
|
60,657 |
|
|
|
(4,914 |
) |
| |
|
|
7,740 |
|
|
|
0 |
|
|
|
(15 |
) |
|
|
0 |
|
|
|
0 |
|
|
|
(1,608 |
) |
|
|
0 |
|
|
|
0 |
|
|
|
6,117 |
|
|
|
(1,608 |
) |
| |
|
| |
|
|
0 |
|
|
|
8,158 |
|
|
|
0 |
|
|
|
0 |
|
|
|
0 |
|
|
|
4,143 |
|
|
|
0 |
|
|
|
0 |
|
|
|
12,301 |
|
|
|
4,143 |
|
| |
|
|
34 |
|
|
|
0 |
|
|
|
0 |
|
|
|
0 |
|
|
|
0 |
|
|
|
(6 |
) |
|
|
0 |
|
|
|
0 |
|
|
|
28 |
|
|
|
(6 |
) |
| |
|
| |
|
|
18,773 |
|
|
|
57,699 |
|
|
|
0 |
|
|
|
0 |
|
|
|
0 |
|
|
|
991 |
|
|
|
0 |
|
|
|
0 |
|
|
|
77,463 |
|
|
|
991 |
|
|
| |
|
|
|
|
|
|
|
|
|
|
|
|
|
|
|
|
|
|
|
|
|
|
|
|
|
|
|
|
|
|
|
|
|
|
|
|
|
|
|
|
| |
$ |
1,109,858 |
|
|
$ |
852,753 |
|
|
$ |
(557,538 |
) |
|
$ |
2,704 |
|
|
$ |
(39,556 |
) |
|
$ |
73,194 |
|
|
$ |
51,505 |
|
|
$ |
(10,231 |
) |
|
$ |
1,482,689 |
|
|
$ |
17,852 |
|
|
| |
|
|
|
|
|
|
|
|
|
|
|
|
|
|
|
|
|
|
|
|
|
|
|
|
|
|
|
|
|
|
|
|
|
|
|
|
|
|
|
|
Investments in Affiliates |
|
| |
|
| |
|
|
400,499 |
|
|
|
112,516 |
|
|
|
(152,198 |
) |
|
|
0 |
|
|
|
64,031 |
|
|
|
(110,810 |
) |
|
|
0 |
|
|
|
0 |
|
|
|
314,038 |
|
|
|
(49,704 |
) |
|
| |
|
|
|
|
|
|
|
|
|
|
|
|
|
|
|
|
|
|
|
|
|
|
|
|
|
|
|
|
|
|
|
|
|
|
|
|
|
|
|
|
Financial Derivative Instruments - Assets |
|
| |
|
$ |
1,705 |
|
|
$ |
15 |
|
|
$ |
0 |
|
|
$ |
0 |
|
|
$ |
0 |
|
|
$ |
(386 |
) |
|
$ |
0 |
|
|
$ |
0 |
|
|
$ |
1,334 |
|
|
$ |
(386 |
) |
|
| |
|
|
|
|
|
|
|
|
|
|
|
|
|
|
|
|
|
|
|
|
|
|
|
|
|
|
|
|
|
|
|
|
|
|
|
|
|
|
|
|
Financial Derivative Instruments - Liabilities |
|
| |
|
$ |
(6,737 |
) |
|
$ |
779 |
|
|
$ |
(1,582 |
) |
|
$ |
0 |
|
|
$ |
20,231 |
|
|
$ |
(18,133 |
) |
|
$ |
0 |
|
|
$ |
0 |
|
|
$ |
(5,442 |
) |
|
$ |
(2,273 |
) |
|
| |
|
|
|
|
|
|
|
|
|
|
|
|
|
|
|
|
|
|
|
|
|
|
|
|
|
|
|
|
|
|
|
|
|
|
|
|
|
|
|
|
|
|
|
|
|
|
|
|
|
| |
| |
|
$ |
1,505,325 |
|
|
$ |
966,063 |
|
|
$ |
(711,318 |
) |
|
$ |
2,704 |
|
|
$ |
44,706 |
|
|
$ |
(56,135 |
) |
|
$ |
51,505 |
|
|
$ |
(10,231 |
) |
|
$ |
1,792,619 |
|
|
$ |
(34,511 |
) |
|
| |
|
|
|
|
|
|
|
|
|
|
|
|
|
|
|
|
|
|
|
|
|
|
|
|
|
|
|
|
|
|
|
|
|
|
|
|
|
|
|
The following is a summary of significant unobservable inputs used in the fair valuations of assets and liabilities categorized within Level 3 of the fair value hierarchy:
|
|
|
|
|
|
|
|
|
|
|
|
|
|
|
|
|
|
| |
| Category and Subcategory |
|
Ending
Balance
at 06/30/2025 |
|
|
Valuation
Technique |
|
Unobservable
Inputs |
|
|
|
(% Unless Noted Otherwise) |
|
| |
|
|
|
|
|
Investments in Securities, at Value |
|
Loan Participations and Assignments |
|
$ |
134,755 |
|
|
Comparable Companies |
|
EBITDA Multiple |
|
X |
|
|
16.470 |
|
|
|
— |
|
|
| |
|
295,767 |
|
|
Discounted Cash Flow |
|
Discount Rate |
|
| |
|
|
|
|
|
9.353 |
|
|
| |
|
13,025 |
|
|
Discounted Cash Flow /
Indicative Market
Quotation |
|
Discount Rate/
Broker Quote |
|
%/% |
|
|
7.160 / 90.000 |
|
|
|
— |
|
|
| |
|
157,197 |
|
|
Indicative Market Quotation |
|
Broker Quote |
|
| |
|
|
|
|
|
92.865 |
|
|
| |
|
45,957 |
|
|
Recent Transaction |
|
Purchase Price |
|
| |
|
99.00-100.000 |
|
|
|
99.677 |
|
|
| |
|
21,008 |
|
|
Proxy pricing |
|
Base Price |
|
| |
|
100.000 |
|
|
|
— |
|
|
| |
|
27,227 |
|
|
Third Party Vendor |
|
Broker Quote |
|
| |
|
|
|
|
|
93.428 |
|
| |
|
|
|
| |
| |
| |
| |
|
|
| |
|
| |
| |
|
|
1,032 |
|
|
Proxy pricing |
|
Base Price |
|
| |
|
104.175 |
|
|
|
— |
|
|
| |
|
977 |
|
|
Recent transaction price |
|
Purchase Price |
|
| |
|
93.500 |
|
|
|
— |
|
| |
|
|
137,877 |
|
|
Comparable Companies /
Discounted Cash Flow |
|
Revenue Multiple/
Discount Rate |
|
X/% |
|
|
0.900/10.500 |
|
|
|
— |
|
|
| |
|
31,718 |
|
|
Indicative Market Quotation |
|
Broker Quote |
|
| |
|
|
|
|
|
63.805 |
|
Non-Agency Mortgage-Backed Securities |
|
|
1,935 |
|
|
Other Valuation Techniques (7) |
|
— |
|
| |
|
— |
|
|
|
— |
|
|
| |
|
14,215 |
|
|
Proxy pricing |
|
Base Price |
|
| |
|
87.875 |
|
|
|
— |
|
|
| |
|
179,075 |
|
|
Recent Transaction |
|
Purchase Price |
|
| |
|
|
|
|
|
68.305 |
|
|
|
|
|
|
|
|
|
|
|
|
|
| |
| See Accompanying Notes |
|
|
ANNUAL REPORT |
|
|
| |
|
|
JUNE 30, 2025 |
|
|
101 |
|
|
|
|
|
|
| |
|
|
PIMCO Dynamic Income Fund |
|
|
|
June 30, 2025 |
|
|
|
|
|
|
|
|
|
|
|
|
|
|
|
|
|
|
| |
| Category and Subcategory |
|
Ending
Balance
at 06/30/2025 |
|
|
Valuation
Technique |
|
Unobservable
Inputs |
|
|
|
(% Unless Noted Otherwise) |
|
| |
Input Value(s) |
|
|
Weighted
Average |
|
| |
|
|
|
| |
| |
| |
| |
|
|
| |
|
| |
| |
|
$ |
15,176 |
|
|
Discounted Cash Flow |
|
Discount Rate |
|
| |
|
10.000-18.000 |
|
|
|
11.085 |
|
| |
|
|
17,379 |
|
|
Proxy pricing |
|
Base Price |
|
| |
|
100.890 |
|
|
|
— |
|
| |
|
|
150,769 |
|
|
Discounted Cash Flow |
|
Discount Rate |
|
| |
|
5.661-20.000 |
|
|
|
11.816 |
|
|
| |
|
18,900 |
|
|
Recent Transaction |
|
Purchase Price |
|
| |
|
100.000 |
|
|
|
— |
|
| |
|
|
|
| |
| |
| |
| |
|
|
| |
|
| |
| |
|
|
61,862 |
|
|
Comparable Companies |
|
EBITDA Multiple |
|
X |
|
|
4.864 |
|
|
|
— |
|
| |
|
|
272 |
|
|
Comparable Companies /
Discounted Cash Flow |
|
Revenue Multiple/
Discount Rate |
|
X/% |
|
|
0.500/20.750 |
|
|
|
— |
|
| |
|
|
60,554 |
|
|
Comparable Companies |
|
EBITDA Multiple |
|
X |
|
|
5.200 |
|
|
|
— |
|
|
| |
|
103 |
|
|
Indicative Market Quotation |
|
Broker Quote |
|
$ |
|
|
4.000 |
|
|
|
— |
|
| |
|
|
6,117 |
|
|
Indicative Market Quotation |
|
Broker Quote |
|
| |
|
0.625-20.500 |
|
|
|
18.338 |
|
| |
|
|
|
| |
| |
| |
| |
|
|
| |
|
| |
| |
|
|
12,301 |
|
|
Comparable Companies |
|
EBITDA Multiple |
|
| |
|
4.864 |
|
|
|
— |
|
| |
|
|
28 |
|
|
Option Pricing Model |
|
Volatility |
|
| |
|
32.500 |
|
|
|
— |
|
| |
|
|
|
| |
| |
| |
| |
|
|
| |
|
| |
| |
|
|
2,789 |
|
|
Comparable Companies |
|
EBITDA Multiple |
|
X |
|
|
11.250/10.000 |
|
|
|
— |
|
|
| |
|
20,984 |
|
|
Discounted Cash Flow |
|
Discount Rate |
|
| |
|
15.314 |
|
|
|
— |
|
|
| |
|
53,690 |
|
|
Sum of the Parts |
|
Discount rate |
|
| |
|
4.335 |
|
|
|
— |
|
|
Investments in Affiliates |
|
| |
|
|
|
| |
| |
| |
| |
|
|
| |
|
| |
| |
|
|
158,792 |
|
|
Comparable Companies |
|
EBITDA Multiple |
|
X |
|
|
16.470 |
|
|
|
— |
|
|
| |
|
78,258 |
|
|
Comparable Companies /
Discounted Cash Flow |
|
Revenue Multiple/
Discount Rate |
|
X/% |
|
|
0.900/10.500 |
|
|
|
— |
|
|
| |
|
3 |
|
|
Expected Recovery |
|
Price |
|
$ |
|
|
0.000 |
|
|
|
| |
|
| |
|
76,985 |
|
|
Sum of the Parts |
|
Discount Rate/
Mortality Assumption |
|
| |
|
15.323/2015 ANB VBT
Mortality Table |
|
|
|
— |
|
|
Financial Derivative Instruments - Assets |
|
| |
|
|
1,334 |
|
|
Indicative Market Quotation |
|
Broker Quote |
|
| |
|
0.197-5.914 |
|
|
|
5.874 |
|
|
Financial Derivative Instruments -Liabilities |
|
| |
|
|
(5,442 |
) |
|
Indicative Market Quotation |
|
Broker Quote |
|
| |
|
|
|
|
|
53.513 |
|
|
| |
|
|
|
|
| |
| |
| |
|
|
| |
|
| |
| |
|
$ |
1,792,619 |
|
|
| |
| |
| |
|
|
| |
|
| |
|
| |
|
|
|
|
| |
| |
| |
|
|
| |
|
| |
|
Net Purchases and Settlements for Financial Derivative Instruments may include payments made or received upon entering into swap agreements to compensate for differences between the stated terms of the swap agreement and prevailing market conditions. |
|
Any difference between Net Change in Unrealized Appreciation/(Depreciation) and Net Change in Unrealized Appreciation/(Depreciation) on Investments Held at June 30, 2025 may be due to an investment no longer held or categorized as Level 3 at period end. |
|
Security type updated from Non-Agency Mortgage-Backed Securities to Asset-Backed Securities and since prior fiscal year end. |
|
Sector type updated from Utilities to Communication Services since prior fiscal year end. |
|
Sector type updated from Utilities to Consumer Discretionary since prior fiscal year end. |
|
Security type updated from Common Stocks to Preferred Securities Industrials since prior fiscal year end. |
|
Includes valuation techniques not defined in the Notes to Financial Statements as securities valued using such techniques are not considered significant to the Fund. |
|
|
|
|
|
|
| |
102 |
|
PIMCO CLOSED-END FUNDS |
|
|
See Accompanying Notes |
|
|
|
|
|
|
|
| |
Consolidated Schedule of Investments |
|
PIMCO Dynamic Income Opportunities Fund |
|
|
|
June 30, 2025 |
(Amounts in thousands*, except number of shares, contracts, units and ounces, if any)
|
|
|
|
|
|
|
|
|
|
|
|
| |
| |
|
|
|
PRINCIPAL
AMOUNT
(000S) |
|
|
|
|
MARKET
VALUE
(000S) |
|
INVESTMENTS IN SECURITIES 145.5% |
|
|
| |
LOAN PARTICIPATIONS AND ASSIGNMENTS 35.9% |
|
|
Aligned Data Centers International LP |
|
| |
|
$ |
|
|
8,100 |
|
|
$ |
|
|
8,122 |
|
|
| |
|
7.779% (EUR003M + 5.500%) due 08/15/2028 ~ |
|
EUR |
|
|
99 |
|
|
| |
|
105 |
|
9.756% (TSFR3M + 5.500%) due 08/15/2028 ~ |
|
$ |
|
|
5,741 |
|
|
| |
|
5,217 |
|
|
| |
|
10.561% (TSFR1M + 6.250%) due 10/08/2030 ~ |
|
| |
|
6,700 |
|
|
| |
|
6,476 |
|
|
| |
|
7.546% (TSFR3M + 3.250%) due 07/06/2029 ~ |
|
| |
|
14,025 |
|
|
| |
|
11,746 |
|
|
| |
|
| |
|
| |
|
1,808 |
|
|
| |
|
1,804 |
|
8.307% (TSFR3M + 4.000%) due 12/09/2031 ~ |
|
| |
|
12,900 |
|
|
| |
|
12,936 |
|
|
| |
|
| |
|
| |
|
604 |
|
|
| |
|
603 |
|
|
| |
|
TBD% (EUR012M + 0.000%) due 03/28/2026 ~ |
|
EUR |
|
|
38,951 |
|
|
| |
|
54,599 |
|
|
CoreWeave Compute Acquisition Co. LLC |
|
TBD% (TSFR3M + 6.000%) due 05/16/2029 «~µ |
|
$ |
|
|
21,900 |
|
|
| |
|
22,413 |
|
|
| |
|
TBD% - 1.000% due 01/03/2031 «µ |
|
| |
|
852 |
|
|
| |
|
860 |
|
8.816% (TSFR1M + 4.500%) due 01/03/2031 «~ |
|
| |
|
3,848 |
|
|
| |
|
3,887 |
|
|
| |
|
| |
|
| |
|
3,818 |
|
|
| |
|
3,780 |
|
| |
|
| |
|
382 |
|
|
| |
|
378 |
|
|
| |
|
7.927% (TSFR1M + 3.500%) due 02/10/2028 «~ |
|
| |
|
5,969 |
|
|
| |
|
4,596 |
|
|
Envision Healthcare Corp. |
|
12.235% (TSFR3M + 7.875%) due 11/03/2028 « |
|
| |
|
31,556 |
|
|
| |
|
32,503 |
|
|
Espai Barca Fondo De Titulizacion |
|
| |
|
EUR |
|
|
7,168 |
|
|
| |
|
9,738 |
|
|
| |
|
9.541% (TSFR3M + 5.000%) due 03/30/2027 ~ |
|
$ |
|
|
2,443 |
|
|
| |
|
2,312 |
|
|
| |
|
8.780% (TSFR3M + 4.500%) due 12/19/2030 ~ |
|
| |
|
7,877 |
|
|
| |
|
7,843 |
|
|
| |
|
9.280% - 10.030% (TSFR3M + 5.000%) due 07/31/2030 ~ |
|
| |
|
9,993 |
|
|
| |
|
9,337 |
|
|
Gateway Casinos & Entertainment Ltd. |
|
10.563% (TSFR3M + 6.250%) due 12/18/2030 |
|
| |
|
34,340 |
|
|
| |
|
34,355 |
|
|
| |
|
9.574% (TSFR1M + 5.250%) due 06/04/2029 ~ |
|
| |
|
2,758 |
|
|
| |
|
2,762 |
|
|
| |
|
| |
|
| |
|
5,800 |
|
|
| |
|
5,800 |
|
|
| |
|
TBD% - 9.717% due 03/27/2032 « |
|
GBP |
|
|
5,325 |
|
|
| |
|
7,172 |
|
|
iHeartCommunications, Inc. |
|
10.216% (TSFR1M + 5.775%) due 05/01/2029 ~ |
|
$ |
|
|
6,661 |
|
|
| |
|
5,448 |
|
|
| |
|
TBD% - 10.079% (TSFR3M + 5.750%) due 06/01/2029 ~µ |
|
| |
|
1,514 |
|
|
| |
|
1,561 |
|
9.016% (TSFR3M + 4.750%) due 06/01/2029 ~ |
|
| |
|
11,358 |
|
|
| |
|
9,473 |
|
|
| |
|
9.441% (TSFR1M + 5.000%) due 04/26/2028 «~ |
|
| |
|
2,571 |
|
|
| |
|
2,594 |
|
|
|
|
|
|
|
|
|
|
|
|
|
| |
| |
|
|
|
PRINCIPAL
AMOUNT
(000S) |
|
|
|
|
MARKET
VALUE
(000S) |
|
|
| |
|
8.006% (TSFR3M + 3.750%) due 05/19/2031 ~ |
|
$ |
|
|
5,475 |
|
|
$ |
|
|
5,426 |
|
|
| |
|
6.791% (TSFR1M + 2.350%) due 04/15/2030 ~ |
|
| |
|
13,567 |
|
|
| |
|
13,418 |
|
|
MPH Acquisition Holdings LLC |
|
8.030% (TSFR3M + 3.750%) due 12/31/2030 ~ |
|
| |
|
285 |
|
|
| |
|
282 |
|
9.141% (TSFR3M + 4.600%) due 12/31/2030 ~ |
|
| |
|
2,372 |
|
|
| |
|
2,134 |
|
|
| |
|
9.250% (PRIME + 1.750%) due 07/31/2025 ~ |
|
| |
|
499 |
|
|
| |
|
435 |
|
|
| |
|
7.193% (EUR006M + 5.000%) due 12/31/2028 ~ |
|
EUR |
|
|
6,135 |
|
|
| |
|
7,126 |
|
|
| |
|
| |
|
GBP |
|
|
13,000 |
|
|
| |
|
17,814 |
|
|
| |
|
8.177% (TSFR1M + 3.750%) due 02/01/2028 ~ |
|
$ |
|
|
13,911 |
|
|
| |
|
12,320 |
|
|
| |
|
8.291% (TSFR3M + 3.750%) due 06/02/2028 ~ |
|
| |
|
1,395 |
|
|
| |
|
1,362 |
|
|
| |
|
6.980% (EUR003M + 5.000%) due 03/13/2030 ~ |
|
EUR |
|
|
3,900 |
|
|
| |
|
3,147 |
|
|
Project Quasar Pledgco SLU |
|
5.161% (EUR001M + 3.250%) due 04/17/2026 «~ |
|
| |
|
6,628 |
|
|
| |
|
7,534 |
|
|
Promotora de Informaciones SA |
|
7.594% (EUR003M + 5.470%) due 12/31/2029 ~ |
|
| |
|
39,500 |
|
|
| |
|
45,831 |
|
|
| |
|
10.046% - 10.068% (TSFR3M + 5.750%) due 06/30/2031 « |
|
$ |
|
|
4,203 |
|
|
| |
|
4,173 |
|
|
| |
|
| |
|
GBP |
|
|
17,000 |
|
|
| |
|
23,393 |
|
|
| |
|
9.849% (PRIME + 5.400%) due 04/05/2028 «~ |
|
$ |
|
|
5,000 |
|
|
| |
|
4,988 |
|
|
| |
|
7.686% (EUR003M + 5.500%) due 03/29/2030 ~ |
|
EUR |
|
|
5,200 |
|
|
| |
|
6,042 |
|
9.780% (TSFR3M + 5.500%) due 03/29/2030 ~ |
|
$ |
|
|
7,822 |
|
|
| |
|
7,407 |
|
|
| |
|
| |
|
| |
|
7,000 |
|
|
| |
|
7,000 |
|
| |
|
| |
|
17,523 |
|
|
| |
|
17,523 |
|
|
| |
|
TBD% - 0.500% due 01/30/2032 «µ |
|
| |
|
596 |
|
|
| |
|
585 |
|
6.000% (JY0003M + 5.250%) due 01/30/2032 «~ |
|
JPY |
|
|
51,173 |
|
|
| |
|
349 |
|
7.679% (CDOR03 + 5.000%) due 01/30/2032 «~ |
|
CAD |
|
|
479 |
|
|
| |
|
345 |
|
9.131% (TSFR6M + 5.000%) due 01/30/2032 «~ |
|
$ |
|
|
2,643 |
|
|
| |
|
2,595 |
|
|
Steenbok Lux Finco 2 SARL |
|
| |
|
EUR |
|
|
73,196 |
|
|
| |
|
27,401 |
|
|
Stepstone Group MidCo 2 GmbH |
|
6.673% (EUR006M + 4.500%) due 04/26/2032 ~ |
|
| |
|
16,400 |
|
|
| |
|
18,980 |
|
8.608% - 8.651% (TSFR3M + 4.500%) due 12/19/2031 |
|
$ |
|
|
3,100 |
|
|
| |
|
3,015 |
|
|
Strategic Gaming Investments, Inc. |
|
| |
|
| |
|
5,500 |
|
|
| |
|
5,502 |
|
|
| |
|
7.730% (EUR003M + 5.750%) due 08/14/2029 «~ |
|
EUR |
|
|
14,400 |
|
|
| |
|
17,047 |
|
|
Thames Water Utilities Ltd. |
|
0.300% - 5.234% due 11/28/2025 |
|
GBP |
|
|
2,106 |
|
|
| |
|
2,118 |
|
|
| |
|
11.558% (JIBA3M + 4.000%) due 03/02/2028 «~ |
|
ZAR |
|
|
89,627 |
|
|
| |
|
5,022 |
|
|
|
|
|
|
|
|
|
|
|
|
|
| |
| |
|
|
|
PRINCIPAL
AMOUNT
(000S) |
|
|
|
|
MARKET
VALUE
(000S) |
|
|
| |
|
| |
|
$ |
|
|
1,950 |
|
|
$ |
|
|
1,899 |
|
10.927% (TSFR1M + 6.500%) due 10/26/2029 ~ |
|
| |
|
23,241 |
|
|
| |
|
22,734 |
|
|
| |
|
9.441% (TSFR1M + 5.000%) due 06/20/2028 ~ |
|
| |
|
41,182 |
|
|
| |
|
39,088 |
|
|
| |
|
| |
|
HKD |
|
|
99,590 |
|
|
| |
|
12,845 |
|
|
| |
| |
|
|
| |
| |
|
|
|
Total Loan Participations and Assignments (Cost $623,422) |
|
|
|
|
|
| |
|
|
|
|
| |
CORPORATE BONDS & NOTES 31.7% |
|
|
| |
|
|
|
| |
|
8.250% due 12/31/2028 (l) |
|
EUR |
|
|
17,528 |
|
|
| |
|
20,995 |
|
|
| |
|
| |
|
$ |
|
|
550 |
|
|
| |
|
574 |
|
| |
|
| |
|
250 |
|
|
| |
|
260 |
|
|
| |
|
8.500% due 11/15/2029 (l) |
|
| |
|
2,800 |
|
|
| |
|
2,686 |
|
|
| |
|
| |
|
| |
|
250 |
|
|
| |
|
251 |
|
| |
|
| |
|
250 |
|
|
| |
|
259 |
|
|
| |
|
| |
|
| |
|
1,800 |
|
|
| |
|
1,826 |
|
|
| |
|
| |
|
| |
|
1,088 |
|
|
| |
|
27 |
|
|
| |
|
9.500% due 10/15/2031 (l) |
|
| |
|
2,495 |
|
|
| |
|
2,647 |
|
|
| |
|
| |
|
| |
|
300 |
|
|
| |
|
300 |
|
|
Corestate Capital Holding SA (10.000% Cash or 11.000% PIK) |
|
10.000% due 12/31/2026 (c) |
|
EUR |
|
|
349 |
|
|
| |
|
370 |
|
|
|
|
|
| |
Credit Suisse AG AT1 Claim |
|
$ |
|
|
800 |
|
|
| |
|
96 |
|
|
| |
|
| |
|
| |
|
300 |
|
|
| |
|
304 |
|
|
| |
|
| |
|
| |
|
500 |
|
|
| |
|
522 |
|
| |
|
| |
|
500 |
|
|
| |
|
519 |
|
| |
|
| |
|
500 |
|
|
| |
|
518 |
|
|
Fairfax India Holdings Corp. |
|
5.000% due 02/26/2028 (l) |
|
| |
|
18,350 |
|
|
| |
|
17,278 |
|
|
| |
|
| |
|
| |
|
300 |
|
|
| |
|
300 |
|
|
| |
|
| |
|
| |
|
250 |
|
|
| |
|
247 |
|
| |
|
| |
|
250 |
|
|
| |
|
247 |
|
| |
|
| |
|
67 |
|
|
| |
|
30 |
|
|
| |
|
| |
|
| |
|
400 |
|
|
| |
|
404 |
|
|
| |
|
| |
|
| |
|
900 |
|
|
| |
|
940 |
|
| |
|
| |
|
900 |
|
|
| |
|
894 |
|
|
| |
|
| |
|
| |
|
300 |
|
|
| |
|
302 |
|
|
Kennedy Wilson Europe Real Estate Ltd. |
|
3.250% due 11/12/2025 (l) |
|
EUR |
|
|
695 |
|
|
| |
|
813 |
|
|
Long Walk Reinsurance Ltd. |
|
| |
|
$ |
|
|
1,700 |
|
|
| |
|
1,723 |
|
|
| |
|
| |
|
| |
|
280 |
|
|
| |
|
289 |
|
|
| |
|
| |
|
| |
|
250 |
|
|
| |
|
251 |
|
|
| |
|
| |
|
| |
|
300 |
|
|
| |
|
301 |
|
|
| |
|
| |
|
| |
|
600 |
|
|
| |
|
619 |
|
| |
|
| |
|
1,800 |
|
|
| |
|
1,881 |
|
|
| |
|
| |
|
| |
|
300 |
|
|
| |
|
307 |
|
|
|
|
|
|
|
|
|
|
|
|
|
| |
| See Accompanying Notes |
|
|
ANNUAL REPORT |
|
|
| |
|
|
JUNE 30, 2025 |
|
|
103 |
|
|
|
|
|
|
| |
Consolidated Schedule of Investments |
|
PIMCO Dynamic Income Opportunities Fund |
|
|
|
|
|
|
|
|
|
|
|
|
|
|
|
|
| |
| |
|
|
|
PRINCIPAL
AMOUNT
(000S) |
|
|
|
|
MARKET
VALUE
(000S) |
|
|
| |
|
| |
|
EUR |
|
|
250 |
|
|
$ |
|
|
302 |
|
|
| |
|
| |
|
$ |
|
|
4,164 |
|
|
| |
|
2,394 |
|
|
| |
|
| |
|
GBP |
|
|
174 |
|
|
| |
|
224 |
|
|
| |
|
6.250% due 01/14/2031 (l) |
|
EUR |
|
|
20,125 |
|
|
| |
|
6,991 |
|
|
| |
|
| |
|
$ |
|
|
400 |
|
|
| |
|
413 |
|
| |
|
| |
|
300 |
|
|
| |
|
313 |
|
| |
|
| |
|
300 |
|
|
| |
|
307 |
|
|
| |
|
6.000% due 01/15/2030 (l) |
|
| |
|
21,202 |
|
|
| |
|
19,884 |
|
6.500% due 02/15/2029 (l) |
|
| |
|
26,904 |
|
|
| |
|
26,029 |
|
8.625% due 06/15/2032 (l) |
|
| |
|
3,000 |
|
|
| |
|
3,033 |
|
10.500% due 02/15/2028 (l) |
|
| |
|
4,781 |
|
|
| |
|
5,072 |
|
|
| |
|
| |
|
| |
|
900 |
|
|
| |
|
905 |
|
| |
|
| |
|
2,000 |
|
|
| |
|
2,093 |
|
|
| |
|
| |
|
| |
|
1,600 |
|
|
| |
|
1,675 |
|
|
Voyager Aviation Holdings LLC |
|
8.500% due 05/09/2026 ^«(d) |
|
| |
|
22,146 |
|
|
| |
|
0 |
|
|
| |
|
| |
|
| |
|
250 |
|
|
| |
|
265 |
|
| |
|
| |
|
1,400 |
|
|
| |
|
1,472 |
|
|
| |
| |
|
|
| |
| |
|
|
|
|
| |
| |
|
|
| |
| |
|
130,352 |
|
|
| |
| |
|
|
| |
| |
|
|
|
|
| |
|
|
|
| |
|
| |
|
EUR |
|
|
2,200 |
|
|
| |
|
928 |
|
| |
|
$ |
|
|
700 |
|
|
| |
|
249 |
|
| |
|
EUR |
|
|
16,900 |
|
|
| |
|
7,177 |
|
| |
|
$ |
|
|
22,000 |
|
|
| |
|
7,662 |
|
|
| |
|
| |
|
EUR |
|
|
8,600 |
|
|
| |
|
8,507 |
|
| |
|
| |
|
100 |
|
|
| |
|
99 |
|
| |
|
| |
|
100 |
|
|
| |
|
99 |
|
| |
|
| |
|
100 |
|
|
| |
|
99 |
|
| |
|
$ |
|
|
800 |
|
|
| |
|
662 |
|
| |
|
| |
|
6,421 |
|
|
| |
|
5,313 |
|
| |
|
| |
|
3,800 |
|
|
| |
|
3,202 |
|
| |
|
| |
|
3,000 |
|
|
| |
|
2,490 |
|
| |
|
EUR |
|
|
400 |
|
|
| |
|
425 |
|
| |
|
$ |
|
|
1,900 |
|
|
| |
|
1,711 |
|
|
| |
|
10.500% due 03/30/2029 (l) |
|
EUR |
|
|
8,400 |
|
|
| |
|
10,380 |
|
12.250% due 03/30/2029 (l) |
|
$ |
|
|
7,600 |
|
|
| |
|
8,116 |
|
|
Aston Martin Capital Holdings Ltd. |
|
10.000% due 03/31/2029 (l) |
|
| |
|
3,300 |
|
|
| |
|
3,128 |
|
| |
|
GBP |
|
|
1,400 |
|
|
| |
|
1,796 |
|
|
Carvana Co. (14.000% PIK) |
|
14.000% due 06/01/2031 (c)(l) |
|
$ |
|
|
4,785 |
|
|
| |
|
5,511 |
|
|
| |
|
8.000% due 06/15/2029 (l) |
|
| |
|
5,670 |
|
|
| |
|
4,694 |
|
|
| |
|
7.250% due 06/15/2029 (l) |
|
| |
|
6,600 |
|
|
| |
|
5,388 |
|
|
Cheplapharm Arzneimittel GmbH |
|
| |
|
EUR |
|
|
2,400 |
|
|
| |
|
2,800 |
|
5.500% due 01/15/2028 (l) |
|
$ |
|
|
7,800 |
|
|
| |
|
7,545 |
|
7.125% due 06/15/2031 (b) |
|
EUR |
|
|
1,700 |
|
|
| |
|
2,018 |
|
7.500% due 05/15/2030 (l) |
|
| |
|
2,700 |
|
|
| |
|
3,252 |
|
|
| |
|
| |
|
$ |
|
|
27,800 |
|
|
| |
|
25,281 |
|
| |
|
| |
|
13,400 |
|
|
| |
|
11,625 |
|
|
| |
|
4.625% due 11/02/2031 (l) |
|
| |
|
4,900 |
|
|
| |
|
4,142 |
|
7.750% due 02/01/2032 (l) |
|
| |
|
31,500 |
|
|
| |
|
30,976 |
|
8.375% due 01/19/2036 (l) |
|
| |
|
520 |
|
|
| |
|
502 |
|
8.875% due 01/13/2033 (l) |
|
| |
|
1,000 |
|
|
| |
|
1,032 |
|
|
| |
|
3.250% due 07/23/2027 (l) |
|
EUR |
|
|
2,500 |
|
|
| |
|
2,844 |
|
|
|
|
|
|
|
|
|
|
|
|
|
| |
| |
|
|
|
PRINCIPAL
AMOUNT
(000S) |
|
|
|
|
MARKET
VALUE
(000S) |
|
|
| |
|
| |
|
$ |
|
|
28,206 |
|
|
$ |
|
|
28,206 |
|
|
| |
|
6.000% due 01/30/2033 «(k) |
|
| |
|
20,315 |
|
|
| |
|
28,166 |
|
|
Intelsat Jackson Holdings SA |
|
6.500% due 03/15/2030 (l) |
|
| |
|
19,222 |
|
|
| |
|
19,649 |
|
|
| |
|
9.875% due 09/20/2031 (l) |
|
| |
|
6,804 |
|
|
| |
|
6,624 |
|
|
MPH Acquisition Holdings LLC |
|
5.750% due 12/31/2030 (l) |
|
| |
|
11,200 |
|
|
| |
|
9,235 |
|
|
MPH Acquisition Holdings LLC (6.500% Cash and 5.000% PIK) |
|
11.500% due 12/31/2030 (c)(l) |
|
| |
|
8,550 |
|
|
| |
|
8,486 |
|
|
Newfold Digital Holdings Group, Inc. |
|
| |
|
| |
|
12,400 |
|
|
| |
|
7,254 |
|
| |
|
| |
|
610 |
|
|
| |
|
461 |
|
|
| |
|
6.700% due 02/16/2032 (l) |
|
| |
|
4,206 |
|
|
| |
|
3,911 |
|
6.840% due 01/23/2030 (l) |
|
| |
|
2,000 |
|
|
| |
|
1,933 |
|
8.750% due 06/02/2029 (l) |
|
| |
|
3,253 |
|
|
| |
|
3,372 |
|
|
Prime Healthcare Services, Inc. |
|
9.375% due 09/01/2029 (l) |
|
| |
|
8,300 |
|
|
| |
|
8,244 |
|
|
| |
|
11.542% due 01/23/2029 ~(l) |
|
| |
|
5,953 |
|
|
| |
|
6,102 |
|
|
Thames Water Super Senior Issuer PLC |
|
| |
|
GBP |
|
|
173 |
|
|
| |
|
262 |
|
|
Thames Water Utilities Finance PLC |
|
| |
|
EUR |
|
|
100 |
|
|
| |
|
75 |
|
| |
|
| |
|
200 |
|
|
| |
|
152 |
|
| |
|
GBP |
|
|
370 |
|
|
| |
|
332 |
|
| |
|
| |
|
200 |
|
|
| |
|
180 |
|
| |
|
| |
|
200 |
|
|
| |
|
184 |
|
| |
|
| |
|
300 |
|
|
| |
|
281 |
|
|
Thames Water Utilities Ltd. |
|
0.000% due 03/22/2027 (g) |
|
| |
|
26 |
|
|
| |
|
30 |
|
|
| |
|
| |
|
$ |
|
|
161 |
|
|
| |
|
161 |
|
|
Turkish Airlines Pass-Through Trust |
|
4.200% due 09/15/2028 (l) |
|
| |
|
135 |
|
|
| |
|
131 |
|
|
| |
|
10.625% due 06/28/2028 (l) |
|
| |
|
7,141 |
|
|
| |
|
6,114 |
|
|
| |
|
| |
|
EUR |
|
|
4,400 |
|
|
| |
|
4,678 |
|
|
| |
|
0.000% due 12/29/2049 ~(i) |
|
BRL |
|
|
340,000 |
|
|
| |
|
21,457 |
|
|
| |
|
9.500% due 02/01/2029 (l) |
|
$ |
|
|
6,414 |
|
|
| |
|
6,991 |
|
9.875% due 02/01/2032 (l) |
|
| |
|
3,250 |
|
|
| |
|
3,512 |
|
|
| |
|
| |
|
EUR |
|
|
5,100 |
|
|
| |
|
5,976 |
|
10.000% due 10/15/2030 (l) |
|
$ |
|
|
4,100 |
|
|
| |
|
4,038 |
|
|
| |
|
7.250% due 10/31/2029 (l) |
|
| |
|
1,000 |
|
|
| |
|
1,003 |
|
7.750% due 09/15/2030 (l) |
|
| |
|
400 |
|
|
| |
|
404 |
|
|
| |
|
8.250% due 10/01/2031 (l) |
|
| |
|
8,000 |
|
|
| |
|
8,385 |
|
|
| |
|
13.500% due 04/15/2031 (l) |
|
| |
|
1,200 |
|
|
| |
|
1,233 |
|
|
Yinson Boronia Production BV |
|
8.947% due 07/31/2042 (l) |
|
| |
|
2,874 |
|
|
| |
|
3,063 |
|
|
| |
| |
|
|
| |
| |
|
|
|
|
| |
| |
|
|
| |
| |
|
369,938 |
|
|
| |
| |
|
|
| |
| |
|
|
|
|
| |
|
|
|
| |
|
6.250% due 03/15/2030 (l) |
|
| |
|
500 |
|
|
| |
|
508 |
|
|
Gazprom PJSC Via Gaz Finance PLC |
|
| |
|
| |
|
200 |
|
|
| |
|
165 |
|
|
| |
|
6.750% due 12/31/2026 (l) |
|
| |
|
851 |
|
|
| |
|
775 |
|
|
Oi SA (10.000% Cash or 6.000% PIK and 7.500% Cash or 13.500% PIK) |
|
10.000% due 06/30/2027 (c)(l) |
|
| |
|
31,126 |
|
|
| |
|
20,268 |
|
|
|
|
|
|
|
|
|
|
|
|
|
| |
| |
|
|
|
PRINCIPAL
AMOUNT
(000S) |
|
|
|
|
MARKET
VALUE
(000S) |
|
|
| |
|
8.500% due 12/31/2028 (c) |
|
$ |
|
|
66,194 |
|
|
$ |
|
|
4,468 |
|
|
| |
|
5.375% due 03/22/2030 (l) |
|
| |
|
13,855 |
|
|
| |
|
13,040 |
|
|
Yinson Production Financial Services Pte. Ltd. |
|
| |
|
| |
|
3,800 |
|
|
| |
|
3,950 |
|
|
| |
| |
|
|
| |
| |
|
|
|
|
| |
| |
|
|
| |
| |
|
43,174 |
|
|
| |
| |
|
|
| |
| |
|
|
|
Total Corporate Bonds & Notes (Cost $622,732) |
|
|
|
|
|
| |
|
|
|
|
| |
CONVERTIBLE BONDS & NOTES 1.6% |
|
|
| |
|
|
|
Corestate Capital Holding SA (8.000% Cash or 9.000% PIK) |
|
8.000% due 12/31/2026 (c) |
|
EUR |
|
|
1,823 |
|
|
| |
|
869 |
|
|
| |
|
5.500% due 03/15/2026 (l) |
|
$ |
|
|
24,225 |
|
|
| |
|
24,068 |
|
|
| |
| |
|
|
| |
| |
|
|
|
|
| |
| |
|
|
| |
| |
|
24,937 |
|
|
| |
| |
|
|
| |
| |
|
|
|
|
| |
|
|
|
| |
|
| |
|
| |
|
3,700 |
|
|
| |
|
3,101 |
|
|
| |
| |
|
|
| |
| |
|
|
|
Total Convertible Bonds & Notes (Cost $30,034) |
|
|
|
|
|
| |
|
|
|
|
| |
MUNICIPAL BONDS & NOTES 0.1% |
|
|
| |
|
|
|
Tobacco Settlement Finance Authority, West Virginia Revenue Bonds, Series 2007 |
|
0.000% due 06/01/2047 (g) |
|
| |
|
25,000 |
|
|
| |
|
2,288 |
|
|
| |
| |
|
|
| |
| |
|
|
|
Total Municipal Bonds & Notes (Cost $3,944) |
|
|
|
|
|
| |
|
|
|
|
| |
U.S. GOVERNMENT AGENCIES 5.9% |
|
|
| |
|
2.500% due 04/25/2049 - 02/25/2050 (a)(l) |
|
| |
|
19,224 |
|
|
| |
|
2,760 |
|
3.000% due 12/25/2032 - 01/25/2051 (a)(l) |
|
| |
|
10,897 |
|
|
| |
|
1,703 |
|
3.500% due 05/25/2030 (a)(l) |
|
| |
|
2,301 |
|
|
| |
|
99 |
|
4.000% due 09/25/2051 (a)(l) |
|
| |
|
21,319 |
|
|
| |
|
4,578 |
|
5.000% due 08/25/2043 (a)(l) |
|
| |
|
2,129 |
|
|
| |
|
431 |
|
|
| |
|
1.582% due 07/15/2042 •(a)(l) |
|
| |
|
1,476 |
|
|
| |
|
148 |
|
1.782% due 03/15/2043 •(a)(l) |
|
| |
|
6,754 |
|
|
| |
|
698 |
|
1.782% due 11/15/2047 •(a) |
|
| |
|
185 |
|
|
| |
|
28 |
|
2.000% due 11/25/2050 - 01/25/2051 (a)(l) |
|
| |
|
17,127 |
|
|
| |
|
1,788 |
|
2.445% due 06/25/2057 ~(a) |
|
| |
|
5,324 |
|
|
| |
|
1,013 |
|
3.000% due 11/25/2050 - 09/25/2051 (a)(l) |
|
| |
|
39,752 |
|
|
| |
|
5,995 |
|
3.495% due 05/25/2057 ~(l) |
|
| |
|
18,114 |
|
|
| |
|
8,106 |
|
3.500% due 04/25/2041 (a)(l) |
|
| |
|
6,862 |
|
|
| |
|
817 |
|
4.000% due 11/25/2048 - 06/25/2051 (a)(l) |
|
| |
|
11,992 |
|
|
| |
|
2,511 |
|
4.250% due 09/25/2060 (l) |
|
| |
|
6,896 |
|
|
| |
|
6,630 |
|
| |
|
| |
|
3,263 |
|
|
| |
|
2,947 |
|
4.500% due 12/25/2050 (a)(l) |
|
| |
|
3,726 |
|
|
| |
|
836 |
|
9.055% due 01/25/2051 •(l) |
|
| |
|
1,700 |
|
|
| |
|
1,880 |
|
9.805% due 01/25/2034 •(l) |
|
| |
|
4,000 |
|
|
| |
|
4,735 |
|
11.405% due 01/25/2042 •(l) |
|
| |
|
4,800 |
|
|
| |
|
5,123 |
|
11.805% due 10/25/2041 •(l) |
|
| |
|
23,500 |
|
|
| |
|
24,988 |
|
12.105% due 11/25/2041 •(l) |
|
| |
|
14,300 |
|
|
| |
|
15,310 |
|
12.805% due 02/25/2042 •(l) |
|
| |
|
1,200 |
|
|
| |
|
1,312 |
|
| |
|
| |
|
4,208 |
|
|
| |
|
3,097 |
|
| |
|
| |
|
5,453 |
|
|
| |
|
4,023 |
|
|
| |
| |
|
|
| |
| |
|
|
|
Total U.S. Government Agencies (Cost $101,293) |
|
|
|
|
|
| |
|
|
|
|
| |
NON-AGENCY MORTGAGE-BACKED SECURITIES 28.7% |
|
|
280 Park Avenue Mortgage Trust |
|
7.439% due 09/15/2034 •(l) |
|
| |
|
4,750 |
|
|
| |
|
4,565 |
|
|
|
|
|
|
|
| |
104 |
|
PIMCO CLOSED-END FUNDS |
|
|
See Accompanying Notes |
|
|
|
|
|
|
|
|
|
|
|
|
|
| |
| |
|
|
|
PRINCIPAL
AMOUNT
(000S) |
|
|
|
|
MARKET
VALUE
(000S) |
|
|
Adjustable Rate Mortgage Trust |
|
4.609% due 02/25/2036 ~(l) |
|
$ |
|
|
6,003 |
|
|
$ |
|
|
3,820 |
|
| |
|
| |
|
1,004 |
|
|
| |
|
632 |
|
|
Ashford Hospitality Trust |
|
6.584% due 04/15/2035 •(l) |
|
| |
|
2,500 |
|
|
| |
|
2,467 |
|
7.584% due 04/15/2035 •(l) |
|
| |
|
8,700 |
|
|
| |
|
8,545 |
|
|
Atrium Hotel Portfolio Trust |
|
7.659% due 12/15/2036 •(l) |
|
| |
|
1,111 |
|
|
| |
|
1,027 |
|
|
Banc of America Funding Trust |
|
3.589% due 09/26/2036 ~(l) |
|
| |
|
4,114 |
|
|
| |
|
3,014 |
|
4.674% due 06/26/2036 •(l) |
|
| |
|
2,809 |
|
|
| |
|
2,385 |
|
| |
|
| |
|
266 |
|
|
| |
|
154 |
|
|
Barclays Commercial Mortgage Securities Trust |
|
3.811% due 02/15/2053 ~(l) |
|
| |
|
15,650 |
|
|
| |
|
12,353 |
|
8.159% due 07/15/2037 •(l) |
|
| |
|
2,100 |
|
|
| |
|
1,533 |
|
|
| |
|
4.715% due 08/10/2033 ~(l) |
|
| |
|
16,650 |
|
|
| |
|
10,288 |
|
|
| |
|
6.918% due 06/15/2038 •(l) |
|
| |
|
10,000 |
|
|
| |
|
2,957 |
|
8.064% due 06/15/2038 •(l) |
|
| |
|
5,000 |
|
|
| |
|
1,006 |
|
|
Bear Stearns Commercial Mortgage Securities Trust |
|
| |
|
| |
|
22 |
|
|
| |
|
22 |
|
|
| |
|
7.876% due 03/15/2036 •(l) |
|
| |
|
5,750 |
|
|
| |
|
2,017 |
|
8.876% due 03/15/2036 •(l) |
|
| |
|
7,125 |
|
|
| |
|
1,787 |
|
|
Citigroup Commercial Mortgage Trust |
|
| |
|
| |
|
6,250 |
|
|
| |
|
1,445 |
|
|
Citigroup Mortgage Loan Trust |
|
5.054% due 08/25/2036 ~(l) |
|
| |
|
1,057 |
|
|
| |
|
962 |
|
|
Colony Mortgage Capital Ltd. |
|
7.397% due 11/15/2038 •(l) |
|
| |
|
15,000 |
|
|
| |
|
13,626 |
|
|
| |
|
8.000% due 04/25/2068 ~(l) |
|
| |
|
3,288 |
|
|
| |
|
3,305 |
|
|
| |
|
6.853% due 06/15/2034 •(l) |
|
| |
|
7,400 |
|
|
| |
|
5,291 |
|
|
Connecticut Avenue Securities Trust |
|
9.805% due 12/25/2041 •(l) |
|
| |
|
8,900 |
|
|
| |
|
9,282 |
|
10.305% due 10/25/2041 •(l) |
|
| |
|
7,100 |
|
|
| |
|
7,419 |
|
|
Countrywide Alternative Loan Trust |
|
6.250% due 12/25/2036 (l) |
|
| |
|
4,563 |
|
|
| |
|
1,873 |
|
|
Countrywide Home Loan Mortgage Pass-Through Trust |
|
5.834% due 08/25/2035 •(l) |
|
| |
|
2,203 |
|
|
| |
|
1,724 |
|
|
Credit Suisse Mortgage Capital Mortgage-Backed Trust |
|
0.000% due 02/25/2067 ~(a) |
|
| |
|
351,690 |
|
|
| |
|
263 |
|
0.005% due 02/25/2067 ~(a) |
|
| |
|
351,690 |
|
|
| |
|
131 |
|
3.999% due 01/25/2060 ~(l) |
|
| |
|
8,144 |
|
|
| |
|
6,142 |
|
4.000% due 02/25/2067 ~(l) |
|
| |
|
23,825 |
|
|
| |
|
15,917 |
|
| |
|
| |
|
9,122 |
|
|
| |
|
1,768 |
|
7.744% due 07/15/2032 •(l) |
|
| |
|
19,982 |
|
|
| |
|
19,852 |
|
|
| |
|
7.934% due 04/15/2036 •(l) |
|
| |
|
7,000 |
|
|
| |
|
6,793 |
|
|
| |
|
(0.113%) due 07/25/2050 ~ |
|
| |
|
9,593 |
|
|
| |
|
7,095 |
|
|
Deutsche Mortgage & Asset Receiving Corp. |
|
4.554% due 11/27/2036 •(l) |
|
| |
|
6,221 |
|
|
| |
|
5,985 |
|
|
| |
|
0.665% due 05/10/2041 ~(a)(l) |
|
| |
|
309,500 |
|
|
| |
|
9,249 |
|
3.704% due 05/10/2041 ~(l) |
|
| |
|
32,400 |
|
|
| |
|
23,444 |
|
|
| |
|
7.176% due 10/15/2043 •(l) |
|
| |
|
5,500 |
|
|
| |
|
4,725 |
|
|
Extended Stay America Trust |
|
8.126% due 07/15/2038 •(l) |
|
| |
|
16,125 |
|
|
| |
|
16,153 |
|
|
| |
|
8.208% due 06/18/2039 •(l) |
|
GBP |
|
|
1,940 |
|
|
| |
|
2,604 |
|
|
| |
|
| |
|
$ |
|
|
27,000 |
|
|
| |
|
51 |
|
|
GS Mortgage Securities Corp. Trust |
|
7.159% due 11/15/2032 •(l) |
|
| |
|
10,782 |
|
|
| |
|
10,659 |
|
|
GS Mortgage-Backed Securities Corp. Trust |
|
| |
|
| |
|
142 |
|
|
| |
|
136 |
|
0.000% due 12/25/2060 ~(a) |
|
| |
|
157,575 |
|
|
| |
|
4,527 |
|
0.165% due 12/25/2060 ~(a) |
|
| |
|
136,198 |
|
|
| |
|
913 |
|
3.952% due 12/25/2060 ~(l) |
|
| |
|
34,468 |
|
|
| |
|
23,541 |
|
|
|
|
|
|
|
|
|
|
|
|
|
| |
| |
|
|
|
PRINCIPAL
AMOUNT
(000S) |
|
|
|
|
MARKET
VALUE
(000S) |
|
|
| |
|
6.250% due 08/25/2036 (l) |
|
$ |
|
|
4,064 |
|
|
$ |
|
|
1,127 |
|
|
JP Morgan Alternative Loan Trust |
|
4.714% due 03/25/2037 •(l) |
|
| |
|
10,550 |
|
|
| |
|
9,086 |
|
|
JP Morgan Chase Commercial Mortgage Securities Trust |
|
| |
|
| |
|
1,700 |
|
|
| |
|
154 |
|
6.659% due 02/15/2035 •(l) |
|
| |
|
1,234 |
|
|
| |
|
1,170 |
|
6.805% due 07/05/2033 •(l) |
|
| |
|
5,012 |
|
|
| |
|
3,679 |
|
7.155% due 07/05/2033 •(l) |
|
| |
|
10,000 |
|
|
| |
|
6,325 |
|
7.526% due 03/15/2036 •(l) |
|
| |
|
25,550 |
|
|
| |
|
11,555 |
|
8.276% due 03/15/2036 •(l) |
|
| |
|
9,500 |
|
|
| |
|
3,617 |
|
| |
|
| |
|
700 |
|
|
| |
|
108 |
|
|
JP Morgan Resecuritization Trust |
|
4.463% due 12/27/2046 •(l) |
|
| |
|
10,624 |
|
|
| |
|
8,847 |
|
|
Mill City Mortgage Loan Trust |
|
| |
|
| |
|
131,959 |
|
|
| |
|
4,009 |
|
0.000% due 04/25/2057 ~(a) |
|
| |
|
131,959 |
|
|
| |
|
413 |
|
0.000% due 11/25/2058 ~(a) |
|
| |
|
104,905 |
|
|
| |
|
303 |
|
| |
|
| |
|
104,905 |
|
|
| |
|
400 |
|
3.953% due 11/25/2058 ~(l) |
|
| |
|
16,205 |
|
|
| |
|
10,273 |
|
3.963% due 04/25/2057 ~(l) |
|
| |
|
20,617 |
|
|
| |
|
14,402 |
|
|
Morgan Stanley Capital Trust |
|
6.670% due 12/15/2036 •(l) |
|
| |
|
4,294 |
|
|
| |
|
197 |
|
6.809% due 11/15/2034 •(l) |
|
| |
|
5,370 |
|
|
| |
|
5,136 |
|
7.759% due 11/15/2034 •(l) |
|
| |
|
3,357 |
|
|
| |
|
3,196 |
|
|
Morgan Stanley Re-REMIC Trust |
|
3.277% due 03/26/2037 (l) |
|
| |
|
2,493 |
|
|
| |
|
2,592 |
|
|
| |
|
2.718% due 12/15/2036 (l) |
|
| |
|
28,715 |
|
|
| |
|
16,799 |
|
|
| |
|
| |
|
| |
|
13,000 |
|
|
| |
|
157 |
|
|
| |
|
7.048% due 04/15/2032 •(l) |
|
| |
|
11,978 |
|
|
| |
|
11,625 |
|
|
New Residential Mortgage Loan Trust |
|
3.984% due 07/25/2059 ~(l) |
|
| |
|
5,000 |
|
|
| |
|
3,589 |
|
|
New York Mortgage Trust Loan Trust |
|
5.250% due 07/25/2062 þ(l) |
|
| |
|
1,943 |
|
|
| |
|
1,942 |
|
|
Residential Accredit Loans, Inc. Trust |
|
4.854% due 06/25/2037 •(l) |
|
| |
|
681 |
|
|
| |
|
602 |
|
|
Residential Asset Securitization Trust |
|
6.500% due 08/25/2036 (l) |
|
| |
|
5,384 |
|
|
| |
|
1,513 |
|
|
SFO Commercial Mortgage Trust |
|
7.326% due 05/15/2038 •(l) |
|
| |
|
18,000 |
|
|
| |
|
17,331 |
|
8.076% due 05/15/2038 •(l) |
|
| |
|
8,000 |
|
|
| |
|
6,913 |
|
|
Structured Adjustable Rate Mortgage Loan Trust |
|
5.508% due 03/25/2036 ~(l) |
|
| |
|
3,672 |
|
|
| |
|
3,596 |
|
|
| |
|
0.000% due 07/15/2059 (g) |
|
GBP |
|
|
10 |
|
|
| |
|
2,464 |
|
0.000% due 07/15/2059 (g)(l) |
|
| |
|
7,804 |
|
|
| |
|
8,715 |
|
7.317% due 07/15/2059 ~(l) |
|
| |
|
4,682 |
|
|
| |
|
6,413 |
|
8.067% due 07/15/2059 ~(l) |
|
| |
|
4,682 |
|
|
| |
|
6,386 |
|
9.317% due 07/15/2059 ~(l) |
|
| |
|
6,244 |
|
|
| |
|
9,071 |
|
9.817% due 07/15/2059 ~(l) |
|
| |
|
4,682 |
|
|
| |
|
6,240 |
|
10.317% due 07/15/2059 ~(l) |
|
| |
|
4,991 |
|
|
| |
|
6,869 |
|
|
| |
|
7.576% due 07/15/2039 •(l) |
|
$ |
|
|
10,000 |
|
|
| |
|
8,514 |
|
8.326% due 07/15/2039 •(l) |
|
| |
|
7,000 |
|
|
| |
|
5,427 |
|
|
Verus Securitization Trust |
|
8.093% due 12/25/2068 ~(l) |
|
| |
|
4,538 |
|
|
| |
|
4,593 |
|
|
WaMu Mortgage Pass-Through Certificates Trust |
|
5.209% due 07/25/2047 •(l) |
|
| |
|
1,820 |
|
|
| |
|
1,528 |
|
5.484% due 12/25/2045 •(l) |
|
| |
|
12,182 |
|
|
| |
|
10,626 |
|
|
Wells Fargo Mortgage-Backed Securities Trust |
|
7.414% due 10/25/2036 ~(l) |
|
| |
|
169 |
|
|
| |
|
163 |
|
|
| |
| |
|
|
| |
| |
|
|
|
Total Non-Agency Mortgage-Backed Securities (Cost $628,254) |
|
|
|
|
|
| |
|
|
|
|
| |
ASSET-BACKED SECURITIES 21.3% |
|
|
| |
AUTOMOBILE ABS OTHER 0.9% |
|
|
Carvana Auto Receivables Trust |
|
0.000% due 01/10/2028 «(g) |
|
| |
|
10 |
|
|
| |
|
884 |
|
|
Exeter Automobile Receivables Trust |
|
0.000% due 12/15/2033 «(g) |
|
| |
|
12 |
|
|
| |
|
895 |
|
|
|
|
|
|
|
|
|
|
|
|
|
| |
| |
|
|
|
PRINCIPAL
AMOUNT
(000S) |
|
|
|
|
MARKET
VALUE
(000S) |
|
|
Flagship Credit Auto Trust |
|
0.000% due 04/17/2028 «(g) |
|
$ |
|
|
10 |
|
|
$ |
|
|
445 |
|
|
Huntington Bank Auto Credit-Linked Notes |
|
6.153% due 05/20/2032 (l) |
|
| |
|
1,467 |
|
|
| |
|
1,493 |
|
| |
|
| |
|
723 |
|
|
| |
|
726 |
|
| |
|
| |
|
796 |
|
|
| |
|
805 |
|
| |
|
| |
|
783 |
|
|
| |
|
785 |
|
|
Santander Bank Auto Credit-Linked Notes |
|
6.110% due 06/15/2032 (l) |
|
| |
|
1,864 |
|
|
| |
|
1,879 |
|
7.762% due 06/15/2032 (l) |
|
| |
|
1,356 |
|
|
| |
|
1,365 |
|
10.171% due 06/15/2032 (l) |
|
| |
|
3,143 |
|
|
| |
|
3,196 |
|
| |
|
| |
|
2,773 |
|
|
| |
|
2,775 |
|
|
| |
| |
|
|
| |
| |
|
|
|
|
| |
| |
|
|
| |
| |
|
15,248 |
|
|
| |
| |
|
|
| |
| |
|
|
|
|
| |
AUTOMOBILE SEQUENTIAL 0.5% |
|
|
CPS Auto Securitization Trust |
|
| |
|
| |
|
8,000 |
|
|
| |
|
8,131 |
|
|
| |
| |
|
|
| |
| |
|
|
|
|
| |
|
|
|
Aames Mortgage Investment Trust |
|
7.134% due 01/25/2035 •(l) |
|
| |
|
5,000 |
|
|
| |
|
3,868 |
|
|
ACE Securities Corp. Home Equity Loan Trust |
|
4.809% due 08/25/2036 •(l) |
|
| |
|
25,121 |
|
|
| |
|
19,537 |
|
|
Ameriquest Mortgage Securities, Inc. Asset-Backed Pass-Through Certificates |
|
6.234% due 07/25/2035 •(l) |
|
| |
|
7,500 |
|
|
| |
|
6,374 |
|
|
Argent Securities, Inc. Asset-Backed Pass-Through Certificates |
|
5.124% due 01/25/2036 •(l) |
|
| |
|
21,501 |
|
|
| |
|
22,091 |
|
|
Asset-Backed Securities Corp. Home Equity Loan Trust |
|
4.664% due 05/25/2037 •(l) |
|
| |
|
7,669 |
|
|
| |
|
5,441 |
|
|
Bear Stearns Asset-Backed Securities Trust |
|
4.868% due 01/25/2037 •(l) |
|
| |
|
6,307 |
|
|
| |
|
5,464 |
|
|
| |
|
5.934% due 11/25/2037 •(l) |
|
| |
|
32,783 |
|
|
| |
|
22,955 |
|
|
Countrywide Asset-Backed Certificates Trust |
|
4.809% due 06/25/2037 •(l) |
|
| |
|
5,609 |
|
|
| |
|
4,868 |
|
4.869% due 02/25/2037 •(l) |
|
| |
|
10,471 |
|
|
| |
|
9,002 |
|
|
Encore Credit Receivables Trust |
|
6.189% due 10/25/2035 •(l) |
|
| |
|
6,239 |
|
|
| |
|
5,638 |
|
|
Fieldstone Mortgage Investment Trust |
|
7.359% due 08/25/2034 •(l) |
|
| |
|
2,427 |
|
|
| |
|
1,910 |
|
|
| |
|
5.454% due 12/25/2035 •(l) |
|
| |
|
9,820 |
|
|
| |
|
8,557 |
|
|
| |
|
5.484% due 01/25/2035 •(l) |
|
| |
|
7,147 |
|
|
| |
|
5,812 |
|
|
| |
|
4.884% due 08/25/2036 •(l) |
|
| |
|
16,807 |
|
|
| |
|
14,119 |
|
|
MASTR Asset-Backed Securities Trust |
|
5.019% due 01/25/2036 •(l) |
|
| |
|
6,311 |
|
|
| |
|
4,827 |
|
|
Morgan Stanley ABS Capital, Inc. Trust |
|
5.544% due 07/25/2035 •(l) |
|
| |
|
9,974 |
|
|
| |
|
7,920 |
|
|
Morgan Stanley Home Equity Loan Trust |
|
5.499% due 05/25/2035 •(l) |
|
| |
|
5,341 |
|
|
| |
|
4,911 |
|
|
New Century Home Equity Loan Trust |
|
5.454% due 06/25/2035 •(l) |
|
| |
|
17,591 |
|
|
| |
|
16,952 |
|
|
Saxon Asset Securities Trust |
|
4.914% due 09/25/2036 •(l) |
|
| |
|
11,236 |
|
|
| |
|
8,522 |
|
|
Soundview Home Loan Trust |
|
5.259% due 12/25/2035 •(l) |
|
| |
|
6,312 |
|
|
| |
|
5,797 |
|
|
Structured Asset Investment Loan Trust |
|
5.409% due 07/25/2035 •(l) |
|
| |
|
10,390 |
|
|
| |
|
7,959 |
|
|
Structured Asset Securities Corp. Mortgage Loan Trust |
|
4.734% due 04/25/2036 •(l) |
|
| |
|
19,625 |
|
|
| |
|
16,528 |
|
|
| |
| |
|
|
| |
| |
|
|
|
|
| |
| |
|
|
| |
| |
|
209,052 |
|
|
| |
| |
|
|
| |
| |
|
|
|
|
| |
WHOLE LOAN COLLATERAL 2.6% |
|
|
First Franklin Mortgage Loan Trust |
|
4.744% due 10/25/2036 •(l) |
|
| |
|
6,000 |
|
|
| |
|
4,901 |
|
5.364% due 11/25/2035 •(l) |
|
| |
|
8,078 |
|
|
| |
|
7,307 |
|
|
|
|
|
|
|
|
|
|
|
|
|
| |
| See Accompanying Notes |
|
|
ANNUAL REPORT |
|
|
| |
|
|
JUNE 30, 2025 |
|
|
105 |
|
|
|
|
|
|
| |
Consolidated Schedule of Investments |
|
PIMCO Dynamic Income Opportunities Fund |
|
|
|
|
|
|
|
|
|
|
|
|
|
|
|
|
| |
| |
|
|
|
PRINCIPAL
AMOUNT
(000S) |
|
|
|
|
MARKET
VALUE
(000S) |
|
|
| |
|
7.967% due 09/25/2051 þ(l) |
|
$ |
|
|
19,061 |
|
|
$ |
|
|
18,953 |
|
|
Residential Asset Mortgage Products Trust |
|
5.709% due 02/25/2035 •(l) |
|
| |
|
5,312 |
|
|
| |
|
4,560 |
|
|
Securitized Asset-Backed Receivables LLC Trust |
|
4.934% due 03/25/2036 •(l) |
|
| |
|
1,378 |
|
|
| |
|
861 |
|
|
Specialty Underwriting & Residential Finance Trust |
|
4.734% due 09/25/2037 •(l) |
|
| |
|
21,506 |
|
|
| |
|
7,363 |
|
|
| |
| |
|
|
| |
| |
|
|
|
|
| |
| |
|
|
| |
| |
|
43,945 |
|
|
| |
| |
|
|
| |
| |
|
|
|
|
| |
|
|
|
| |
|
7.870% due 12/08/2045 •(l) |
|
| |
|
25,992 |
|
|
| |
|
6,568 |
|
|
College Ave Student Loans Trust |
|
0.000% due 06/25/2054 «(g)(l) |
|
| |
|
11 |
|
|
| |
|
5,623 |
|
6.610% due 06/25/2054 (l) |
|
| |
|
1,369 |
|
|
| |
|
1,404 |
|
8.660% due 06/25/2054 (l) |
|
| |
|
1,971 |
|
|
| |
|
1,984 |
|
|
College Avenue Student Loans LLC |
|
4.120% due 07/25/2051 (l) |
|
| |
|
830 |
|
|
| |
|
781 |
|
|
Duke Funding High Grade Ltd. |
|
0.090% due 08/02/2049 (a) |
|
| |
|
840,370 |
|
|
| |
|
127 |
|
| |
|
| |
|
29,910 |
|
|
| |
|
192 |
|
|
| |
|
0.000% due 09/20/2027 «(g) |
|
| |
|
4 |
|
|
| |
|
5 |
|
|
GreenSky Home Improvement Trust |
|
| |
|
| |
|
1,100 |
|
|
| |
|
1,143 |
|
|
| |
|
0.000% due 04/15/2031 ~(l) |
|
| |
|
27,000 |
|
|
| |
|
5,295 |
|
|
| |
|
0.000% due 04/20/2034 ~(l) |
|
| |
|
10,000 |
|
|
| |
|
4,048 |
|
|
Madison Park Funding Ltd. |
|
0.000% due 07/27/2047 ~(l) |
|
| |
|
5,600 |
|
|
| |
|
1,782 |
|
|
| |
|
0.000% due 09/16/2030 «(g) |
|
| |
|
38 |
|
|
| |
|
693 |
|
|
| |
|
7.810% due 04/06/2046 •(l) |
|
| |
|
327,058 |
|
|
| |
|
9,368 |
|
7.815% due 10/06/2042 •(l) |
|
| |
|
213,556 |
|
|
| |
|
20,822 |
|
| |
|
| |
|
4,400 |
|
|
| |
|
0 |
|
|
| |
|
| |
|
| |
|
13,000 |
|
|
| |
|
4,046 |
|
|
| |
|
| |
|
| |
|
500 |
|
|
| |
|
501 |
|
|
Sierra Madre Funding Ltd. |
|
| |
|
| |
|
913 |
|
|
| |
|
552 |
|
|
SMB Private Education Loan Trust |
|
0.000% due 02/16/2055 «(g) |
|
| |
|
5 |
|
|
| |
|
4,771 |
|
|
Stream Innovations Issuer Trust |
|
| |
|
| |
|
353 |
|
|
| |
|
367 |
|
|
Structured Finance Advisors ABS CDO Ltd. |
|
7.500% due 07/02/2037 •(l) |
|
| |
|
41,770 |
|
|
| |
|
5,547 |
|
|
| |
|
4.827% due 12/06/2045 •(l) |
|
| |
|
56,060 |
|
|
| |
|
12,496 |
|
|
| |
| |
|
|
| |
| |
|
|
|
|
| |
| |
|
|
| |
| |
|
88,115 |
|
|
| |
| |
|
|
| |
| |
|
|
|
Total Asset-Backed Securities (Cost $461,603) |
|
|
|
|
|
| |
|
|
|
|
| |
|
|
|
Argentina Government International Bond |
|
3.500% due 07/09/2041 (l) |
|
| |
|
5,233 |
|
|
| |
|
3,258 |
|
|
Avenir Issuer Ireland DAC |
|
| |
|
| |
|
4,710 |
|
|
| |
|
4,418 |
|
|
Ecuador Government International Bond |
|
0.000% due 07/31/2030 (g)(l) |
|
| |
|
6,200 |
|
|
| |
|
4,520 |
|
5.500% due 07/31/2035 (l) |
|
| |
|
2,570 |
|
|
| |
|
1,877 |
|
6.900% due 07/31/2030 (l) |
|
| |
|
10,657 |
|
|
| |
|
9,271 |
|
|
Egypt Government International Bond |
|
6.375% due 04/11/2031 (l) |
|
EUR |
|
|
3,700 |
|
|
| |
|
4,054 |
|
| |
|
EGP |
|
|
877,000 |
|
|
| |
|
17,443 |
|
|
El Salvador Government International Bond |
|
9.250% due 04/17/2030 (l) |
|
$ |
|
|
5,700 |
|
|
| |
|
6,049 |
|
9.650% due 11/21/2054 (l) |
|
| |
|
3,500 |
|
|
| |
|
3,614 |
|
|
|
|
|
|
|
|
|
|
|
|
|
| |
| |
|
|
|
PRINCIPAL
AMOUNT
(000S) |
|
|
|
|
MARKET
VALUE
(000S) |
|
|
Republic of Kenya Government International Bond |
|
| |
|
$ |
|
|
1,500 |
|
|
$ |
|
|
1,417 |
|
|
Romania Government International Bond |
|
5.250% due 03/10/2030 (l) |
|
EUR |
|
|
4,100 |
|
|
| |
|
4,937 |
|
| |
|
| |
|
16,000 |
|
|
| |
|
19,039 |
|
| |
|
| |
|
11,900 |
|
|
| |
|
14,159 |
|
|
Russia Government International Bond |
|
| |
|
$ |
|
|
200 |
|
|
| |
|
0 |
|
| |
|
| |
|
4,200 |
|
|
| |
|
2,940 |
|
|
Turkiye Government International Bond |
|
| |
|
TRY |
|
|
396,200 |
|
|
| |
|
9,556 |
|
| |
|
| |
|
600 |
|
|
| |
|
15 |
|
| |
|
| |
|
400 |
|
|
| |
|
10 |
|
| |
|
| |
|
79,200 |
|
|
| |
|
1,929 |
|
|
Ukraine Government International Bond |
|
0.000% due 02/01/2030 (h) |
|
$ |
|
|
271 |
|
|
| |
|
131 |
|
0.000% due 02/01/2034 (h) |
|
| |
|
1,014 |
|
|
| |
|
393 |
|
0.000% due 02/01/2035 (h) |
|
| |
|
856 |
|
|
| |
|
407 |
|
0.000% due 02/01/2036 (h) |
|
| |
|
714 |
|
|
| |
|
337 |
|
| |
|
| |
|
1,614 |
|
|
| |
|
839 |
|
| |
|
| |
|
1,738 |
|
|
| |
|
892 |
|
| |
|
| |
|
1,614 |
|
|
| |
|
807 |
|
|
| |
| |
|
|
| |
| |
|
|
|
Total Sovereign Issues (Cost $104,546) |
|
|
|
|
|
| |
|
|
|
|
| |
| |
|
|
|
SHARES |
|
|
|
|
|
|
|
|
|
| |
COMMUNICATION SERVICES 0.1% |
|
|
|
|
|
| |
| |
|
| |
|
11,034,637 |
|
|
| |
|
1,300 |
|
|
|
|
| |
Promotora de Informaciones SA ‘A’ (e) |
|
|
1,623,357 |
|
|
| |
|
726 |
|
|
| |
| |
|
|
| |
| |
|
|
|
|
| |
| |
|
|
| |
| |
|
2,026 |
|
|
| |
| |
|
|
| |
| |
|
|
|
|
| |
|
|
|
|
|
|
| |
Steinhoff International Holdings NV «(e)(k) |
|
| |
|
115,240,755 |
|
|
| |
|
0 |
|
|
| |
| |
|
|
| |
| |
|
|
|
|
| |
|
|
|
|
|
|
| |
Banca Monte dei Paschi di Siena SpA |
|
| |
|
2,274,000 |
|
|
| |
|
19,345 |
|
|
|
|
|
| |
Corestate Capital Holding SA «(e)(k) |
|
| |
|
632,951 |
|
|
| |
|
0 |
|
|
|
|
| |
Intelsat Emergence SA «(k) |
|
|
652,149 |
|
|
| |
|
22,497 |
|
|
|
|
| |
MNSN Holdings, Inc. «(e)(k) |
|
|
8,417 |
|
|
| |
|
34 |
|
|
|
|
|
| |
| |
|
| |
|
5,143 |
|
|
| |
|
174 |
|
|
| |
| |
|
|
| |
| |
|
|
|
|
| |
| |
|
|
| |
| |
|
42,050 |
|
|
| |
| |
|
|
| |
| |
|
|
|
|
| |
|
|
|
|
|
|
| |
| |
|
| |
|
1,571,862 |
|
|
| |
|
70,964 |
|
|
| |
| |
|
|
| |
| |
|
|
|
|
| |
|
|
|
|
|
|
| |
Incora New Equity «(e)(k) |
|
| |
|
947,048 |
|
|
| |
|
31,997 |
|
|
| |
| |
|
|
| |
| |
|
|
|
|
| |
| |
|
|
| |
| |
|
31,997 |
|
|
| |
| |
|
|
| |
| |
|
|
|
Total Common Stocks (Cost $155,990) |
|
|
|
|
|
| |
|
|
|
|
| |
PREFERRED SECURITIES 1.6% |
|
|
| |
|
|
|
|
|
|
| |
| |
|
| |
|
3,588,226 |
|
|
| |
|
0 |
|
|
| |
| |
|
|
| |
| |
|
|
|
|
| |
|
|
|
|
|
|
| |
| |
|
| |
|
140 |
|
|
| |
|
14,236 |
|
|
| |
|
| |
|
| |
|
27,610 |
|
|
| |
|
488 |
|
|
| |
|
0.000% due 11/07/2032 (g) |
|
| |
|
51,680 |
|
|
| |
|
1 |
|
| |
|
| |
|
9,596 |
|
|
| |
|
5,086 |
|
|
|
|
|
|
|
|
|
|
|
|
|
| |
| |
|
|
|
SHARES |
|
|
|
|
MARKET
VALUE
(000S) |
|
|
|
|
| |
Syniverse Holdings, Inc. «(k) |
|
|
8,566,268 |
|
|
$ |
|
|
8,107 |
|
|
| |
| |
|
|
| |
| |
|
|
|
|
| |
| |
|
|
| |
| |
|
27,918 |
|
|
| |
| |
|
|
| |
| |
|
|
|
Total Preferred Securities (Cost $28,337) |
|
|
|
|
|
| |
|
|
|
|
| |
REAL ESTATE INVESTMENT TRUSTS 1.1% |
|
|
| |
|
|
|
|
|
|
| |
Annaly Capital Management, Inc. |
|
| |
|
609,500 |
|
|
| |
|
11,471 |
|
|
|
|
|
| |
PennyMac Mortgage Investment Trust |
|
| |
|
556,200 |
|
|
| |
|
7,153 |
|
|
| |
| |
|
|
| |
| |
|
|
|
Total Real Estate Investment Trusts (Cost $26,500) |
|
|
|
|
|
| |
|
|
|
|
| |
SHORT-TERM INSTRUMENTS 2.4% |
|
|
| |
|
|
|
State Street Institutional U.S. Government Money Market Fund, Premier Class |
|
| |
|
| |
|
13,910,099 |
|
|
| |
|
13,910 |
|
|
| |
| |
|
|
| |
| |
|
|
|
|
| |
| |
|
|
|
PRINCIPAL
AMOUNT
(000S) |
|
|
|
|
|
|
|
|
4.339% due 07/03/2025 - 10/21/2025 (f)(g)(n)(p) |
|
| |
|
26,712 |
|
|
| |
|
26,553 |
|
|
| |
| |
|
|
| |
| |
|
|
|
Total Short-Term Instruments (Cost $40,463) |
|
|
|
|
|
| |
|
|
|
|
|
|
|
| |
|
| |
| |
|
|
| |
| |
|
| |
Total Investments in Securities (Cost $2,827,118) |
|
|
|
|
|
| |
|
|
|
|
| |
| |
|
|
|
SHARES |
|
|
|
|
|
|
INVESTMENTS IN AFFILIATES 9.8% |
|
|
| |
|
|
|
| |
AFFILIATED INVESTMENTS 1.3% |
|
|
|
|
|
| |
| |
|
| |
|
22,345,388 |
|
|
| |
|
21,996 |
|
|
| |
| |
|
|
| |
| |
|
|
|
Total Common Stocks (Cost $22,346) |
|
|
|
|
|
| |
|
|
|
|
| |
SHORT-TERM INSTRUMENTS 8.5% |
|
|
| |
CENTRAL FUNDS USED FOR CASH MANAGEMENT PURPOSES 8.5% |
|
|
|
|
|
| |
PIMCO Short-Term Floating NAV Portfolio III |
|
| |
|
14,971,672 |
|
|
| |
|
145,779 |
|
|
| |
| |
|
|
| |
| |
|
|
|
Total Short-Term Instruments (Cost $145,689) |
|
|
|
|
|
| |
|
|
|
|
|
|
|
| |
|
| |
| |
|
|
| |
| |
|
| |
Total Investments in Affiliates (Cost $168,035) |
|
|
|
|
|
| |
|
| |
|
| |
Total Investments 155.3% (Cost $2,995,153) |
|
|
$ |
|
|
|
|
|
| |
Financial Derivative
Instruments (m)(o) (0.6)% (Cost or Premiums, net $26,733) |
|
|
| |
|
|
|
|
| |
Other Assets and Liabilities, net (54.7)% |
|
|
|
|
|
| |
|
|
|
|
|
|
$ |
|
|
|
|
|
|
| |
| |
|
|
|
NOTES TO CONSOLIDATED SCHEDULE OF INVESTMENTS:
|
A zero balance may reflect actual amounts rounding to less than one thousand. |
|
Represents co-investment made with Company’s affiliates in accordance with the terms of the exemptive relief received from the U.S. Securities and Exchange Commission. See Note 10, Related Party Transactions in the Notes to Consolidated Financial Statements. |
|
Security valued using significant unobservable inputs (Level 3). |
|
All or a portion of this amount represents unfunded loan commitments. The interest rate for the unfunded portion will be determined at the time of funding. See Note 4, Securities and Other Investments, in the Notes to Financial Statements for more information regarding unfunded loan commitments. |
|
Variable or Floating rate security. Rate shown is the rate in effect as of period end. Certain variable rate securities are not based on a published reference rate and spread, rather are determined by the issuer or agent and are based on current market conditions. Reference rate is as of reset date, which may vary by security. These securities may not indicate a reference rate and/or spread in their description. |
|
Rate shown is the rate in effect as of period end. The rate may be based on a fixed rate, a capped rate or a floor rate and may convert to a variable or floating rate in the future. These securities do not indicate a reference rate and spread in their description. |
|
Coupon represents a rate which changes periodically based on a predetermined schedule or event. Rate shown is the rate in effect as of period end. |
|
Insurance-Linked Investments. |
|
Security is an Interest Only (“IO”) or IO Strip. |
|
Payment in-kind security. |
|
Security is not accruing income as of the date of this report. |
|
Security did not produce income within the last twelve months. |
|
Coupon represents a weighted average yield to maturity. |
|
Security becomes interest bearing at a future date. |
|
Perpetual maturity; date shown, if applicable, represents next contractual call date. |
|
Coupon represents a 7-Day Yield. |
(k) RESTRICTED SECURITIES:
|
|
|
|
|
|
|
|
|
|
|
|
|
|
|
|
| |
|
|
|
|
|
|
|
|
|
|
|
Market Value
as Percentage
of Net Assets |
|
| |
|
|
|
|
|
$ |
65,680 |
|
|
$ |
70,964 |
|
|
|
4.14 |
% |
| |
|
|
12/09/2024 |
|
|
|
414 |
|
|
|
488 |
|
|
|
0.03 |
|
Corestate Capital Holding SA |
|
|
08/22/2023 |
|
|
|
0 |
|
|
|
0 |
|
|
|
0.00 |
|
| |
|
|
01/31/2025 |
|
|
|
46,003 |
|
|
|
31,997 |
|
|
|
1.87 |
|
Incora Top Holdco LLC 6.000% due 01/30/2033 |
|
|
01/31/2025 |
|
|
|
20,315 |
|
|
|
28,166 |
|
|
|
1.64 |
|
| |
|
|
01/29/2021 - 02/23/2024 |
|
|
|
38,680 |
|
|
|
22,497 |
|
|
|
1.31 |
|
| |
|
|
03/13/2024 |
|
|
|
22,345 |
|
|
|
21,996 |
|
|
|
1.29 |
|
| |
|
|
03/16/2023 - 03/29/2023 |
|
|
|
94 |
|
|
|
34 |
|
|
|
0.00 |
|
Steinhoff International Holdings NV |
|
|
06/30/2023 - 10/30/2023 |
|
|
|
0 |
|
|
|
0 |
|
|
|
0.00 |
|
| |
|
|
05/12/2022 - 05/30/2025 |
|
|
|
8,448 |
|
|
|
8,107 |
|
|
|
0.47 |
|
|
| |
|
|
| |
|
|
|
|
|
|
|
|
|
|
|
|
|
| |
$ |
201,979 |
|
|
$ |
184,249 |
|
|
|
10.75 |
% |
|
|
| |
|
|
|
|
|
|
|
|
|
|
|
BORROWINGS AND OTHER FINANCING TRANSACTIONS
REVERSE REPURCHASE AGREEMENTS:
|
|
|
|
|
|
|
|
|
|
|
|
|
|
|
|
|
|
|
|
|
|
|
|
| |
|
|
|
|
|
|
|
|
|
|
|
|
|
|
Payable for
Reverse
Repurchase
Agreements |
|
| |
|
|
5.490 |
% |
|
|
05/01/2025 |
|
|
|
11/03/2025 |
|
|
|
$ |
|
|
|
(12,854 |
) |
|
$ |
(12,973 |
) |
|
| |
|
5.490 |
|
|
|
06/02/2025 |
|
|
|
12/02/2025 |
|
|
|
|
| |
|
(8,940 |
) |
|
|
(8,980 |
) |
|
| |
|
5.490 |
|
|
|
06/27/2025 |
|
|
|
12/26/2025 |
|
|
|
|
| |
|
(4,272 |
) |
|
|
(4,274 |
) |
| |
|
|
4.880 |
|
|
|
06/06/2025 |
|
|
|
07/02/2025 |
|
|
|
|
| |
|
(1,233 |
) |
|
|
(1,237 |
) |
|
| |
|
5.080 |
|
|
|
06/06/2025 |
|
|
|
07/02/2025 |
|
|
|
|
| |
|
(1,464 |
) |
|
|
(1,469 |
) |
|
| |
|
5.240 |
|
|
|
06/06/2025 |
|
|
|
07/03/2025 |
|
|
|
|
| |
|
(2,642 |
) |
|
|
(2,652 |
) |
|
| |
|
5.440 |
|
|
|
06/06/2025 |
|
|
|
07/03/2025 |
|
|
|
|
| |
|
(924 |
) |
|
|
(928 |
) |
|
| |
|
5.640 |
|
|
|
06/06/2025 |
|
|
|
07/03/2025 |
|
|
|
|
| |
|
(1,968 |
) |
|
|
(1,975 |
) |
| |
|
|
4.490 |
|
|
|
03/11/2025 |
|
|
|
TBD |
|
|
|
|
| |
|
(4,319 |
) |
|
|
(4,380 |
) |
|
| |
|
4.730 |
|
|
|
06/16/2025 |
|
|
|
TBD |
|
|
|
|
| |
|
(5,178 |
) |
|
|
(5,188 |
) |
|
| |
|
4.750 |
|
|
|
02/03/2025 |
|
|
|
TBD |
|
|
|
|
| |
|
(3,744 |
) |
|
|
(3,813 |
) |
|
| |
|
4.880 |
|
|
|
04/14/2025 |
|
|
|
07/14/2025 |
|
|
|
|
| |
|
(10,280 |
) |
|
|
(10,388 |
) |
|
| |
|
4.890 |
|
|
|
06/24/2025 |
|
|
|
09/24/2025 |
|
|
|
|
| |
|
(10,789 |
) |
|
|
(10,799 |
) |
|
| |
|
5.490 |
|
|
|
05/15/2025 |
|
|
|
11/12/2025 |
|
|
|
|
| |
|
(4,461 |
) |
|
|
(4,493 |
) |
|
| |
|
5.590 |
|
|
|
05/15/2025 |
|
|
|
11/12/2025 |
|
|
|
|
| |
|
(5,002 |
) |
|
|
(5,038 |
) |
|
|
|
|
|
|
|
|
|
|
|
|
| |
| See Accompanying Notes |
|
|
ANNUAL REPORT |
|
|
| |
|
|
JUNE 30, 2025 |
|
|
107 |
|
|
|
|
|
|
| |
Consolidated Schedule of Investments |
|
PIMCO Dynamic Income Opportunities Fund |
|
|
|
|
|
|
|
|
|
|
|
|
|
|
|
|
|
|
|
|
|
|
|
|
|
|
|
|
| |
Counterparty |
|
|
|
|
Settlement
Date |
|
|
Maturity
Date |
|
|
|
|
|
Payable for
Reverse
Repurchase
Agreements |
|
|
| |
|
5.620 |
% |
|
|
04/25/2025 |
|
|
|
10/23/2025 |
|
|
|
$ |
|
|
|
(87,326 |
) |
|
$ |
(88,222 |
) |
|
| |
|
5.620 |
|
|
|
05/15/2025 |
|
|
|
11/12/2025 |
|
|
|
|
| |
|
(14,241 |
) |
|
|
(14,344 |
) |
|
| |
|
5.820 |
|
|
|
04/22/2025 |
|
|
|
07/22/2025 |
|
|
|
|
| |
|
(15,996 |
) |
|
|
(16,177 |
) |
| |
|
|
1.000 |
|
|
|
06/11/2025 |
|
|
|
TBD |
|
|
|
EUR |
|
|
|
(3,123 |
) |
|
|
(3,680 |
) |
|
| |
|
1.300 |
|
|
|
06/11/2025 |
|
|
|
TBD |
|
|
|
|
| |
|
(208 |
) |
|
|
(245 |
) |
|
| |
|
1.500 |
|
|
|
06/11/2025 |
|
|
|
TBD |
|
|
|
|
| |
|
(5,205 |
) |
|
|
(6,136 |
) |
|
| |
|
4.250 |
|
|
|
03/03/2025 |
|
|
|
TBD |
|
|
|
$ |
|
|
|
(1,865 |
) |
|
|
(1,891 |
) |
|
| |
|
4.330 |
|
|
|
06/10/2025 |
|
|
|
TBD |
|
|
|
|
| |
|
(1,892 |
) |
|
|
(1,897 |
) |
|
| |
|
4.770 |
|
|
|
06/06/2025 |
|
|
|
07/07/2025 |
|
|
|
|
| |
|
(5,729 |
) |
|
|
(5,748 |
) |
|
| |
|
4.770 |
|
|
|
06/12/2025 |
|
|
|
07/14/2025 |
|
|
|
|
| |
|
(12,102 |
) |
|
|
(12,132 |
) |
|
| |
|
5.310 |
|
|
|
04/04/2025 |
|
|
|
10/01/2025 |
|
|
|
|
| |
|
(12,091 |
) |
|
|
(12,248 |
) |
|
| |
|
5.330 |
|
|
|
04/03/2025 |
|
|
|
07/03/2025 |
|
|
|
|
| |
|
(3,564 |
) |
|
|
(3,611 |
) |
|
| |
|
5.350 |
|
|
|
07/03/2025 |
|
|
|
10/01/2025 |
|
|
|
|
| |
|
(3,578 |
) |
|
|
(3,578 |
) |
|
| |
|
5.360 |
|
|
|
04/04/2025 |
|
|
|
10/01/2025 |
|
|
|
|
| |
|
(11,151 |
) |
|
|
(11,297 |
) |
|
| |
|
5.390 |
|
|
|
06/30/2025 |
|
|
|
10/28/2025 |
|
|
|
|
| |
|
(4,500 |
) |
|
|
(4,501 |
) |
|
| |
|
5.430 |
|
|
|
04/08/2025 |
|
|
|
07/08/2025 |
|
|
|
|
| |
|
(1,891 |
) |
|
|
(1,915 |
) |
|
| |
|
5.460 |
|
|
|
06/10/2025 |
|
|
|
09/10/2025 |
|
|
|
|
| |
|
(12,052 |
) |
|
|
(12,090 |
) |
|
| |
|
5.490 |
|
|
|
06/06/2025 |
|
|
|
10/07/2025 |
|
|
|
|
| |
|
(6,394 |
) |
|
|
(6,418 |
) |
|
| |
|
5.510 |
|
|
|
06/10/2025 |
|
|
|
09/10/2025 |
|
|
|
|
| |
|
(5,050 |
) |
|
|
(5,067 |
) |
|
| |
|
5.520 |
|
|
|
04/22/2025 |
|
|
|
07/22/2025 |
|
|
|
|
| |
|
(1,288 |
) |
|
|
(1,302 |
) |
|
| |
|
5.530 |
|
|
|
05/27/2025 |
|
|
|
08/27/2025 |
|
|
|
|
| |
|
(10,553 |
) |
|
|
(10,610 |
) |
|
| |
|
5.540 |
|
|
|
06/06/2025 |
|
|
|
10/07/2025 |
|
|
|
|
| |
|
(8,559 |
) |
|
|
(8,591 |
) |
|
| |
|
5.560 |
|
|
|
02/05/2025 |
|
|
|
08/04/2025 |
|
|
|
|
| |
|
(14,149 |
) |
|
|
(14,468 |
) |
|
| |
|
5.590 |
|
|
|
06/06/2025 |
|
|
|
10/07/2025 |
|
|
|
|
| |
|
(33,024 |
) |
|
|
(33,150 |
) |
|
| |
|
5.590 |
|
|
|
06/11/2025 |
|
|
|
10/10/2025 |
|
|
|
|
| |
|
(5,115 |
) |
|
|
(5,130 |
) |
|
| |
|
5.590 |
|
|
|
06/24/2025 |
|
|
|
10/22/2025 |
|
|
|
|
| |
|
(3,151 |
) |
|
|
(3,154 |
) |
|
| |
|
5.590 |
|
|
|
06/27/2025 |
|
|
|
10/27/2025 |
|
|
|
|
| |
|
(7,746 |
) |
|
|
(7,751 |
) |
|
| |
|
5.640 |
|
|
|
06/06/2025 |
|
|
|
10/07/2025 |
|
|
|
|
| |
|
(10,777 |
) |
|
|
(10,818 |
) |
|
| |
|
5.640 |
|
|
|
06/30/2025 |
|
|
|
10/28/2025 |
|
|
|
|
| |
|
(660 |
) |
|
|
(660 |
) |
| |
|
|
4.890 |
|
|
|
04/21/2025 |
|
|
|
07/21/2025 |
|
|
|
|
| |
|
(24,885 |
) |
|
|
(25,122 |
) |
|
| |
|
4.890 |
|
|
|
06/06/2025 |
|
|
|
07/03/2025 |
|
|
|
|
| |
|
(27,748 |
) |
|
|
(27,841 |
) |
|
| |
|
4.890 |
|
|
|
06/30/2025 |
|
|
|
07/21/2025 |
|
|
|
|
| |
|
(5,187 |
) |
|
|
(5,187 |
) |
|
| |
|
4.940 |
|
|
|
04/09/2025 |
|
|
|
10/08/2025 |
|
|
|
|
| |
|
(14,589 |
) |
|
|
(14,754 |
) |
|
| |
|
4.940 |
|
|
|
05/20/2025 |
|
|
|
11/17/2025 |
|
|
|
|
| |
|
(11,060 |
) |
|
|
(11,123 |
) |
|
| |
|
4.940 |
|
|
|
06/24/2025 |
|
|
|
11/17/2025 |
|
|
|
|
| |
|
(4,673 |
) |
|
|
(4,677 |
) |
| |
|
|
4.890 |
|
|
|
03/18/2025 |
|
|
|
07/16/2025 |
|
|
|
|
| |
|
(5,490 |
) |
|
|
(5,566 |
) |
|
| |
|
4.890 |
|
|
|
06/11/2025 |
|
|
|
10/10/2025 |
|
|
|
|
| |
|
(3,080 |
) |
|
|
(3,088 |
) |
|
| |
|
4.890 |
|
|
|
06/20/2025 |
|
|
|
10/17/2025 |
|
|
|
|
| |
|
(4,434 |
) |
|
|
(4,441 |
) |
|
| |
|
5.440 |
|
|
|
03/10/2025 |
|
|
|
07/08/2025 |
|
|
|
|
| |
|
(2,800 |
) |
|
|
(2,847 |
) |
| |
|
|
5.525 |
|
|
|
04/24/2025 |
|
|
|
10/20/2025 |
|
|
|
|
| |
|
(3,609 |
) |
|
|
(3,647 |
) |
|
| |
|
5.575 |
|
|
|
04/24/2025 |
|
|
|
10/20/2025 |
|
|
|
|
| |
|
(3,562 |
) |
|
|
(3,599 |
) |
| |
|
|
4.650 |
|
|
|
03/12/2025 |
|
|
|
TBD |
|
|
|
|
| |
|
(5,424 |
) |
|
|
(5,502 |
) |
|
| |
|
4.650 |
|
|
|
03/24/2025 |
|
|
|
TBD |
|
|
|
|
| |
|
(3,175 |
) |
|
|
(3,215 |
) |
|
| |
|
4.700 |
|
|
|
03/12/2025 |
|
|
|
TBD |
|
|
|
|
| |
|
(3,045 |
) |
|
|
(3,089 |
) |
|
| |
|
4.700 |
|
|
|
04/10/2025 |
|
|
|
TBD |
|
|
|
|
| |
|
(3,007 |
) |
|
|
(3,039 |
) |
|
| |
|
5.120 |
|
|
|
06/24/2025 |
|
|
|
08/22/2025 |
|
|
|
|
| |
|
(7,665 |
) |
|
|
(7,672 |
) |
|
| |
|
5.265 |
|
|
|
06/16/2025 |
|
|
|
08/15/2025 |
|
|
|
|
| |
|
(4,540 |
) |
|
|
(4,551 |
) |
|
| |
|
5.313 |
|
|
|
06/27/2025 |
|
|
|
08/22/2025 |
|
|
|
|
| |
|
(4,083 |
) |
|
|
(4,085 |
) |
|
| |
|
5.411 |
|
|
|
06/30/2025 |
|
|
|
08/29/2025 |
|
|
|
|
| |
|
(19,248 |
) |
|
|
(19,251 |
) |
|
| |
|
5.415 |
|
|
|
06/16/2025 |
|
|
|
08/15/2025 |
|
|
|
|
| |
|
(12,198 |
) |
|
|
(12,225 |
) |
|
| |
|
5.513 |
|
|
|
06/27/2025 |
|
|
|
08/22/2025 |
|
|
|
|
| |
|
(2,424 |
) |
|
|
(2,425 |
) |
|
| |
|
5.620 |
|
|
|
06/24/2025 |
|
|
|
08/22/2025 |
|
|
|
|
| |
|
(1,012 |
) |
|
|
(1,014 |
) |
|
| |
|
5.770 |
|
|
|
06/24/2025 |
|
|
|
08/22/2025 |
|
|
|
|
| |
|
(1,925 |
) |
|
|
(1,927 |
) |
|
| |
|
5.795 |
|
|
|
06/24/2025 |
|
|
|
08/22/2025 |
|
|
|
|
| |
|
(14,585 |
) |
|
|
(14,602 |
) |
|
| |
|
5.820 |
|
|
|
06/24/2025 |
|
|
|
08/22/2025 |
|
|
|
|
| |
|
(5,687 |
) |
|
|
(5,693 |
) |
|
| |
|
5.870 |
|
|
|
06/24/2025 |
|
|
|
08/22/2025 |
|
|
|
|
| |
|
(16,805 |
) |
|
|
(16,824 |
) |
|
| |
|
5.950 |
|
|
|
06/24/2025 |
|
|
|
08/22/2025 |
|
|
|
|
| |
|
(2,168 |
) |
|
|
(2,171 |
) |
| |
|
|
5.377 |
|
|
|
06/04/2025 |
|
|
|
03/04/2026 |
|
|
|
|
| |
|
(511 |
) |
|
|
(513 |
) |
|
| |
|
5.563 |
|
|
|
10/29/2024 |
|
|
|
07/29/2025 |
|
|
|
|
| |
|
(2,227 |
) |
|
|
(2,311 |
) |
|
| |
|
5.663 |
|
|
|
10/29/2024 |
|
|
|
07/29/2025 |
|
|
|
|
| |
|
(13,319 |
) |
|
|
(13,832 |
) |
| |
|
|
4.770 |
|
|
|
06/04/2025 |
|
|
|
09/04/2025 |
|
|
|
|
| |
|
(896 |
) |
|
|
(900 |
) |
|
| |
|
4.790 |
|
|
|
06/04/2025 |
|
|
|
09/04/2025 |
|
|
|
|
| |
|
(331 |
) |
|
|
(333 |
) |
| |
|
|
1.250 |
|
|
|
06/11/2025 |
|
|
|
TBD |
|
|
|
EUR |
|
|
|
(738 |
) |
|
|
(870 |
) |
|
| |
|
4.950 |
|
|
|
05/09/2025 |
|
|
|
08/01/2025 |
|
|
|
$ |
|
|
|
(1,233 |
) |
|
|
(1,242 |
) |
|
| |
|
5.050 |
|
|
|
05/09/2025 |
|
|
|
08/01/2025 |
|
|
|
|
| |
|
(6,959 |
) |
|
|
(7,011 |
) |
| |
|
|
2.950 |
|
|
|
03/14/2025 |
|
|
|
07/14/2025 |
|
|
|
EUR |
|
|
|
(5,641 |
) |
|
|
(6,701 |
) |
|
| |
|
4.350 |
|
|
|
06/23/2025 |
|
|
|
08/01/2025 |
|
|
|
$ |
|
|
|
(2,623 |
) |
|
|
(2,626 |
) |
| |
|
|
4.820 |
|
|
|
06/12/2025 |
|
|
|
09/18/2025 |
|
|
|
GBP |
|
|
|
(3,441 |
) |
|
|
(4,735 |
) |
|
| |
|
4.850 |
|
|
|
06/12/2025 |
|
|
|
09/18/2025 |
|
|
|
|
| |
|
(3,219 |
) |
|
|
(4,430 |
) |
|
| |
|
4.880 |
|
|
|
06/12/2025 |
|
|
|
09/18/2025 |
|
|
|
|
| |
|
(1,382 |
) |
|
|
(1,902 |
) |
|
| |
|
4.950 |
|
|
|
06/12/2025 |
|
|
|
09/18/2025 |
|
|
|
|
| |
|
(4,190 |
) |
|
|
(5,766 |
) |
|
|
|
|
|
|
| |
108 |
|
PIMCO CLOSED-END FUNDS |
|
|
See Accompanying Notes |
|
|
|
|
|
|
|
|
|
|
|
|
|
|
|
|
|
|
|
|
|
|
|
|
|
| |
Counterparty |
|
|
|
|
Settlement
Date |
|
|
Maturity
Date |
|
|
|
|
|
Payable for
Reverse
Repurchase
Agreements |
|
|
| |
|
5.100 |
% |
|
|
06/12/2025 |
|
|
|
09/18/2025 |
|
|
|
GBP |
|
|
|
(3,386 |
) |
|
$ |
(4,660 |
) |
|
| |
|
5.300 |
|
|
|
06/12/2025 |
|
|
|
09/18/2025 |
|
|
|
|
| |
|
(4,153 |
) |
|
|
(5,717 |
) |
|
| |
|
5.490 |
|
|
|
05/06/2025 |
|
|
|
11/03/2025 |
|
|
|
$ |
|
|
|
(2,886 |
) |
|
|
(2,910 |
) |
|
| |
|
5.540 |
|
|
|
05/06/2025 |
|
|
|
11/03/2025 |
|
|
|
|
| |
|
(3,363 |
) |
|
|
(3,392 |
) |
|
| |
|
5.540 |
|
|
|
06/24/2025 |
|
|
|
12/22/2025 |
|
|
|
|
| |
|
(28,582 |
) |
|
|
(28,612 |
) |
|
| |
|
5.590 |
|
|
|
06/24/2025 |
|
|
|
12/22/2025 |
|
|
|
|
| |
|
(6,162 |
) |
|
|
(6,169 |
) |
| |
|
|
(1.500 |
) |
|
|
05/05/2025 |
|
|
|
TBD |
|
|
|
|
| |
|
(1,548 |
) |
|
|
(1,544 |
) |
|
| |
|
1.250 |
|
|
|
06/11/2025 |
|
|
|
TBD |
|
|
|
EUR |
|
|
|
(818 |
) |
|
|
(964 |
) |
|
| |
|
1.300 |
|
|
|
06/11/2025 |
|
|
|
TBD |
|
|
|
|
| |
|
(1,265 |
) |
|
|
(1,492 |
) |
|
| |
|
1.700 |
|
|
|
06/11/2025 |
|
|
|
TBD |
|
|
|
|
| |
|
(1,715 |
) |
|
|
(2,022 |
) |
|
| |
|
1.750 |
|
|
|
06/11/2025 |
|
|
|
TBD |
|
|
|
|
| |
|
(104 |
) |
|
|
(123 |
) |
|
| |
|
1.750 |
|
|
|
06/27/2025 |
|
|
|
TBD |
|
|
|
|
| |
|
(3,751 |
) |
|
|
(4,420 |
) |
| |
|
|
5.510 |
|
|
|
06/20/2025 |
|
|
|
12/19/2025 |
|
|
|
$ |
|
|
|
(10,476 |
) |
|
|
(10,493 |
) |
|
| |
|
5.710 |
|
|
|
06/20/2025 |
|
|
|
12/19/2025 |
|
|
|
|
| |
|
(6,907 |
) |
|
|
(6,919 |
) |
| |
|
|
4.820 |
|
|
|
06/06/2025 |
|
|
|
07/07/2025 |
|
|
|
|
| |
|
(992 |
) |
|
|
(996 |
) |
| |
|
|
4.970 |
|
|
|
06/09/2025 |
|
|
|
10/09/2025 |
|
|
|
|
| |
|
(6,629 |
) |
|
|
(6,649 |
) |
|
| |
|
5.070 |
|
|
|
06/09/2025 |
|
|
|
10/09/2025 |
|
|
|
|
| |
|
(8,835 |
) |
|
|
(8,861 |
) |
|
| |
|
5.160 |
|
|
|
06/09/2025 |
|
|
|
10/09/2025 |
|
|
|
|
| |
|
(16,482 |
) |
|
|
(16,533 |
) |
|
| |
|
5.440 |
|
|
|
06/04/2025 |
|
|
|
12/04/2025 |
|
|
|
|
| |
|
(6,530 |
) |
|
|
(6,557 |
) |
|
| |
|
5.440 |
|
|
|
06/13/2025 |
|
|
|
10/14/2025 |
|
|
|
|
| |
|
(12,850 |
) |
|
|
(12,884 |
) |
|
| |
|
5.470 |
|
|
|
06/09/2025 |
|
|
|
10/09/2025 |
|
|
|
|
| |
|
(3,029 |
) |
|
|
(3,039 |
) |
|
| |
|
5.520 |
|
|
|
06/09/2025 |
|
|
|
10/09/2025 |
|
|
|
|
| |
|
(11,892 |
) |
|
|
(11,931 |
) |
|
| |
|
5.540 |
|
|
|
06/04/2025 |
|
|
|
12/04/2025 |
|
|
|
|
| |
|
(12,992 |
) |
|
|
(13,046 |
) |
|
| |
|
5.540 |
|
|
|
06/09/2025 |
|
|
|
10/09/2025 |
|
|
|
|
| |
|
(15,547 |
) |
|
|
(15,598 |
) |
|
| |
|
5.550 |
|
|
|
06/09/2025 |
|
|
|
10/09/2025 |
|
|
|
|
| |
|
(3,930 |
) |
|
|
(3,943 |
) |
|
| |
|
5.590 |
|
|
|
06/09/2025 |
|
|
|
08/11/2025 |
|
|
|
|
| |
|
(20,034 |
) |
|
|
(20,101 |
) |
| |
|
|
5.375 |
|
|
|
04/24/2025 |
|
|
|
10/24/2025 |
|
|
|
|
| |
|
(3,245 |
) |
|
|
(3,278 |
) |
| |
|
|
2.350 |
|
|
|
04/04/2025 |
|
|
|
07/04/2025 |
|
|
|
EUR |
|
|
|
(3,957 |
) |
|
|
(4,687 |
) |
| |
|
|
4.600 |
|
|
|
12/20/2024 |
|
|
|
TBD |
|
|
|
$ |
|
|
|
(7,640 |
) |
|
|
(7,829 |
) |
|
| |
|
4.610 |
|
|
|
12/20/2024 |
|
|
|
TBD |
|
|
|
|
| |
|
(390 |
) |
|
|
(399 |
) |
|
| |
|
4.620 |
|
|
|
06/10/2025 |
|
|
|
TBD |
|
|
|
|
| |
|
(16,338 |
) |
|
|
(16,382 |
) |
|
| |
|
4.620 |
|
|
|
06/24/2025 |
|
|
|
TBD |
|
|
|
|
| |
|
(3,907 |
) |
|
|
(3,910 |
) |
|
| |
|
4.680 |
|
|
|
04/10/2025 |
|
|
|
07/08/2025 |
|
|
|
|
| |
|
(470 |
) |
|
|
(475 |
) |
|
| |
|
4.720 |
|
|
|
06/30/2025 |
|
|
|
TBD |
|
|
|
|
| |
|
(11,891 |
) |
|
|
(11,893 |
) |
|
| |
|
4.748 |
|
|
|
06/12/2025 |
|
|
|
09/12/2025 |
|
|
|
GBP |
|
|
|
(3,644 |
) |
|
|
(5,014 |
) |
|
| |
|
4.800 |
|
|
|
04/08/2025 |
|
|
|
07/07/2025 |
|
|
|
$ |
|
|
|
(2,620 |
) |
|
|
(2,649 |
) |
|
| |
|
4.800 |
|
|
|
04/29/2025 |
|
|
|
07/08/2025 |
|
|
|
|
| |
|
(936 |
) |
|
|
(944 |
) |
|
| |
|
5.490 |
|
|
|
05/01/2025 |
|
|
|
10/31/2025 |
|
|
|
|
| |
|
(4,021 |
) |
|
|
(4,058 |
) |
|
| |
|
5.490 |
|
|
|
06/13/2025 |
|
|
|
12/12/2025 |
|
|
|
|
| |
|
(8,509 |
) |
|
|
(8,532 |
) |
| |
|
|
2.130 |
|
|
|
06/11/2025 |
|
|
|
TBD |
|
|
|
EUR |
|
|
|
(972 |
) |
|
|
(1,146 |
) |
|
| |
|
2.150 |
|
|
|
06/11/2025 |
|
|
|
TBD |
|
|
|
|
| |
|
(2,994 |
) |
|
|
(3,531 |
) |
|
| |
|
2.400 |
|
|
|
07/02/2025 |
|
|
|
10/02/2025 |
|
|
|
|
| |
|
(17,054 |
) |
|
|
(20,089 |
) |
|
| |
|
4.780 |
|
|
|
04/03/2025 |
|
|
|
07/03/2025 |
|
|
|
$ |
|
|
|
(708 |
) |
|
|
(716 |
) |
|
| |
|
4.900 |
|
|
|
04/16/2025 |
|
|
|
07/16/2025 |
|
|
|
|
| |
|
(5,105 |
) |
|
|
(5,158 |
) |
|
| |
|
5.430 |
|
|
|
04/23/2025 |
|
|
|
07/23/2025 |
|
|
|
|
| |
|
(9,368 |
) |
|
|
(9,465 |
) |
| |
|
|
4.970 |
|
|
|
05/19/2025 |
|
|
|
08/19/2025 |
|
|
|
|
| |
|
(8,182 |
) |
|
|
(8,230 |
) |
|
| |
|
|
| |
|
|
| |
|
|
| |
|
|
| |
|
|
| |
|
|
|
Total Reverse Repurchase Agreements |
|
|
|
|
| |
|
|
| |
|
|
|
|
| |
|
|
| |
|
|
| |
|
|
| |
|
|
| |
|
|
| |
|
|
|
BORROWINGS AND OTHER FINANCING TRANSACTIONS SUMMARY
The following is a summary by counterparty of the market value of Borrowings and Other Financing Transactions and collateral pledged/(received) as of June 30, 2025:
|
|
|
|
|
|
|
|
|
|
|
|
|
|
|
|
|
|
|
|
|
|
|
|
| |
|
|
Repurchase
Agreement
Proceeds
to be
Received |
|
|
Payable for
Reverse
Repurchase
Agreements |
|
|
Payable for Sale-Buyback Transactions |
|
|
Total
Borrowings and
Other Financing
Transactions |
|
|
Collateral
Pledged/(Received) |
|
|
|
|
Global/Master Repurchase Agreement |
|
| |
|
$ |
0 |
|
|
$ |
(26,227 |
) |
|
$ |
0 |
|
|
$ |
(26,227 |
) |
|
$ |
36,458 |
|
|
$ |
10,231 |
|
| |
|
|
0 |
|
|
|
(8,261 |
) |
|
|
0 |
|
|
|
(8,261 |
) |
|
|
11,780 |
|
|
|
3,519 |
|
| |
|
|
0 |
|
|
|
(162,842 |
) |
|
|
0 |
|
|
|
(162,842 |
) |
|
|
214,199 |
|
|
|
51,357 |
|
| |
|
|
0 |
|
|
|
(188,088 |
) |
|
|
0 |
|
|
|
(188,088 |
) |
|
|
238,852 |
|
|
|
50,764 |
|
| |
|
|
0 |
|
|
|
(88,704 |
) |
|
|
0 |
|
|
|
(88,704 |
) |
|
|
101,667 |
|
|
|
12,963 |
|
| |
|
|
0 |
|
|
|
(15,942 |
) |
|
|
0 |
|
|
|
(15,942 |
) |
|
|
18,826 |
|
|
|
2,884 |
|
| |
|
|
0 |
|
|
|
(7,246 |
) |
|
|
0 |
|
|
|
(7,246 |
) |
|
|
9,906 |
|
|
|
2,660 |
|
| |
|
|
0 |
|
|
|
(107,285 |
) |
|
|
0 |
|
|
|
(107,285 |
) |
|
|
155,046 |
|
|
|
47,761 |
|
| |
|
|
0 |
|
|
|
(16,656 |
) |
|
|
0 |
|
|
|
(16,656 |
) |
|
|
22,147 |
|
|
|
5,491 |
|
| |
|
|
0 |
|
|
|
(1,233 |
) |
|
|
0 |
|
|
|
(1,233 |
) |
|
|
1,436 |
|
|
|
203 |
|
| |
|
|
0 |
|
|
|
(9,123 |
) |
|
|
0 |
|
|
|
(9,123 |
) |
|
|
10,753 |
|
|
|
1,630 |
|
|
|
|
|
|
|
|
|
|
|
|
|
| |
| See Accompanying Notes |
|
|
ANNUAL REPORT |
|
|
| |
|
|
JUNE 30, 2025 |
|
|
109 |
|
|
|
|
|
|
| |
Consolidated Schedule of Investments |
|
PIMCO Dynamic Income Opportunities Fund |
|
|
|
|
|
|
|
|
|
|
|
|
|
|
|
|
|
|
|
|
|
|
|
|
|
|
|
|
| |
Counterparty |
|
Repurchase
Agreement
Proceeds
to be
Received |
|
|
Payable for
Reverse
Repurchase
Agreements |
|
|
Payable for Sale-Buyback Transactions |
|
|
Total
Borrowings and
Other Financing
Transactions |
|
|
Collateral
Pledged/(Received) |
|
|
|
|
| |
|
$ |
0 |
|
|
$ |
(9,327 |
) |
|
$ |
0 |
|
|
$ |
(9,327 |
) |
|
$ |
11,313 |
|
|
$ |
1,986 |
|
| |
|
|
0 |
|
|
|
(68,293 |
) |
|
|
0 |
|
|
|
(68,293 |
) |
|
|
97,907 |
|
|
|
29,614 |
|
| |
|
|
0 |
|
|
|
(10,565 |
) |
|
|
0 |
|
|
|
(10,565 |
) |
|
|
10,481 |
|
|
|
(84 |
) |
| |
|
|
0 |
|
|
|
(17,412 |
) |
|
|
0 |
|
|
|
(17,412 |
) |
|
|
26,742 |
|
|
|
9,330 |
|
| |
|
|
0 |
|
|
|
0 |
|
|
|
0 |
|
|
|
0 |
|
|
|
(70 |
) |
|
|
(70 |
) |
| |
|
|
0 |
|
|
|
(996 |
) |
|
|
0 |
|
|
|
(996 |
) |
|
|
1,146 |
|
|
|
150 |
|
| |
|
|
0 |
|
|
|
(119,142 |
) |
|
|
0 |
|
|
|
(119,142 |
) |
|
|
153,649 |
|
|
|
34,507 |
|
| |
|
|
0 |
|
|
|
(3,278 |
) |
|
|
0 |
|
|
|
(3,278 |
) |
|
|
4,363 |
|
|
|
1,085 |
|
| |
|
|
0 |
|
|
|
(4,687 |
) |
|
|
0 |
|
|
|
(4,687 |
) |
|
|
4,856 |
|
|
|
169 |
|
| |
|
|
0 |
|
|
|
(62,085 |
) |
|
|
0 |
|
|
|
(62,085 |
) |
|
|
76,860 |
|
|
|
14,775 |
|
| |
|
|
0 |
|
|
|
0 |
|
|
|
0 |
|
|
|
0 |
|
|
|
26,476 |
|
|
|
26,476 |
|
| |
|
|
0 |
|
|
|
(40,105 |
) |
|
|
0 |
|
|
|
(40,105 |
) |
|
|
0 |
|
|
|
(40,105 |
) |
| |
|
|
0 |
|
|
|
(8,230 |
) |
|
|
0 |
|
|
|
(8,230 |
) |
|
|
9,495 |
|
|
|
1,265 |
|
|
| |
|
|
|
|
|
|
|
|
|
|
|
|
|
|
| |
|
|
| |
|
| |
Total Borrowings and Other Financing Transactions |
|
|
|
|
|
|
|
|
|
|
|
|
|
|
|
| |
|
|
| |
|
| |
|
| |
|
|
|
|
|
|
|
|
|
|
|
|
|
|
| |
|
|
| |
|
| |
CERTAIN TRANSFERS ACCOUNTED FOR AS SECURED BORROWINGS
Remaining Contractual Maturity of the Agreements
|
|
|
|
|
|
|
|
|
|
|
|
|
|
|
|
|
|
|
|
| |
| |
|
|
|
|
|
|
|
|
|
|
|
|
|
|
|
Reverse Repurchase Agreements |
|
| |
|
$ |
0 |
|
|
$ |
(90,749 |
) |
|
$ |
(19,042 |
) |
|
$ |
(131,345 |
) |
|
$ |
(241,136 |
) |
Convertible Bonds & Notes |
|
|
0 |
|
|
|
0 |
|
|
|
(20,101 |
) |
|
|
0 |
|
|
|
(20,101 |
) |
| |
|
|
0 |
|
|
|
(39,703 |
) |
|
|
(8,141 |
) |
|
|
(15,974 |
) |
|
|
(63,818 |
) |
Non-Agency Mortgage-Backed Securities |
|
|
0 |
|
|
|
(18,547 |
) |
|
|
(108,215 |
) |
|
|
(227,473 |
) |
|
|
(354,235 |
) |
| |
|
|
0 |
|
|
|
(20,345 |
) |
|
|
(58,774 |
) |
|
|
(147,716 |
) |
|
|
(226,835 |
) |
| |
|
|
0 |
|
|
|
(4,687 |
) |
|
|
(3,868 |
) |
|
|
(37,380 |
) |
|
|
(45,935 |
) |
|
| |
|
|
|
|
|
|
|
|
|
|
|
|
|
|
|
|
|
|
|
| |
|
|
|
|
|
|
|
|
|
|
|
|
|
|
|
|
|
|
|
|
|
| |
|
|
|
|
|
|
|
|
|
|
|
|
|
|
|
|
|
|
|
Payable for reverse repurchase agreements (4) |
|
|
|
|
|
|
| |
|
|
| |
|
|
| |
|
|
| |
|
|
| |
|
|
|
|
Securities with an aggregate market value of $1,248,392 and cash of $8,082 have been pledged as collateral under the terms of the above master agreements as of June 30, 2025. |
|
The average amount of borrowings outstanding during the period ended June 30, 2025 was $(954,512) at a weighted average interest rate of 5.619%. Average borrowings may include reverse repurchase agreements and sale-buyback transactions, if held during the period. |
|
Open maturity reverse repurchase agreement. |
|
Net Exposure represents the net receivable/(payable) that would be due from/to the counterparty in the event of default. Exposure from borrowings and other financing transactions can only be netted across transactions governed under the same master agreement with the same legal entity. See Note 8, Master Netting Arrangements, in the Notes to Financial Statements for more information. |
|
Unsettled reverse repurchase agreements liability of $(23,667) is outstanding at period end. |
(m) FINANCIAL DERIVATIVE INSTRUMENTS: EXCHANGE-TRADED OR CENTRALLY CLEARED
FUTURES CONTRACTS:
SHORT FUTURES CONTRACTS
|
|
|
|
|
|
|
|
|
|
|
|
|
|
|
|
|
|
|
|
|
|
|
|
| |
|
|
|
|
|
|
|
|
|
|
|
Unrealized
Appreciation/
(Depreciation) |
|
|
|
|
| |
|
|
|
|
|
3-Month SOFR Active Contract December Futures |
|
|
03/2026 |
|
|
|
38 |
|
|
$ |
(9,151 |
) |
|
$ |
144 |
|
|
$ |
0 |
|
|
$ |
(2 |
) |
3-Month SOFR Active Contract June Futures |
|
|
09/2025 |
|
|
|
88 |
|
|
|
(21,046 |
) |
|
|
301 |
|
|
|
1 |
|
|
|
0 |
|
3-Month SOFR Active Contract March Futures |
|
|
06/2026 |
|
|
|
36 |
|
|
|
(8,694 |
) |
|
|
110 |
|
|
|
0 |
|
|
|
(3 |
) |
3-Month SOFR Active Contract September Futures |
|
|
12/2025 |
|
|
|
29 |
|
|
|
(6,959 |
) |
|
|
134 |
|
|
|
0 |
|
|
|
0 |
|
|
| |
|
|
| |
|
|
| |
|
|
| |
|
|
|
|
|
|
|
|
|
|
|
| |
|
|
|
|
|
|
|
|
|
|
|
|
|
|
| |
|
|
| |
|
|
| |
|
|
| |
|
|
|
|
|
|
|
|
|
|
|
SWAP AGREEMENTS:
INTEREST RATE SWAPS
|
|
|
|
|
|
|
|
|
|
|
|
|
|
|
|
|
|
|
|
|
|
|
|
|
|
|
|
|
|
|
|
|
|
|
|
|
|
|
|
|
|
| |
Pay/Receive
Floating Rate |
|
|
|
|
|
|
|
|
|
|
|
|
|
|
|
|
|
|
Unrealized
Appreciation/
(Depreciation) |
|
|
|
|
|
|
|
| |
|
|
|
|
|
| |
|
|
|
|
3.500 |
% |
|
|
Annual |
|
|
|
03/19/2030 |
|
|
|
GBP |
|
|
|
25,100 |
|
|
$ |
(685 |
) |
|
$ |
373 |
|
|
$ |
(312 |
) |
|
$ |
0 |
|
|
$ |
(1 |
) |
| |
|
|
|
|
0.750 |
|
|
|
Annual |
|
|
|
09/21/2052 |
|
|
|
|
| |
|
9,800 |
|
|
|
286 |
|
|
|
8,023 |
|
|
|
8,309 |
|
|
|
24 |
|
|
|
0 |
|
| |
|
|
|
|
3.250 |
|
|
|
Annual |
|
|
|
06/18/2030 |
|
|
|
$ |
|
|
|
172,300 |
|
|
|
(1,579 |
) |
|
|
177 |
|
|
|
(1,402 |
) |
|
|
285 |
|
|
|
0 |
|
| |
|
|
|
|
3.750 |
|
|
|
Annual |
|
|
|
12/18/2026 |
|
|
|
|
| |
|
58,100 |
|
|
|
289 |
|
|
|
(409 |
) |
|
|
(120 |
) |
|
|
18 |
|
|
|
0 |
|
| |
|
|
|
|
3.750 |
|
|
|
Annual |
|
|
|
12/18/2027 |
|
|
|
|
| |
|
673,000 |
|
|
|
5,966 |
|
|
|
(3,258 |
) |
|
|
2,708 |
|
|
|
437 |
|
|
|
0 |
|
| |
|
|
|
|
3.750 |
|
|
|
Annual |
|
|
|
12/18/2028 |
|
|
|
|
| |
|
53,800 |
|
|
|
769 |
|
|
|
(333 |
) |
|
|
436 |
|
|
|
53 |
|
|
|
0 |
|
| |
|
|
|
|
3.750 |
|
|
|
Annual |
|
|
|
06/20/2029 |
|
|
|
|
| |
|
49,800 |
|
|
|
(924 |
) |
|
|
272 |
|
|
|
(652 |
) |
|
|
0 |
|
|
|
(62 |
) |
| |
|
|
|
|
3.750 |
|
|
|
Annual |
|
|
|
12/18/2029 |
|
|
|
|
| |
|
159,500 |
|
|
|
2,399 |
|
|
|
(707 |
) |
|
|
1,692 |
|
|
|
227 |
|
|
|
0 |
|
| |
|
|
|
|
3.750 |
|
|
|
Annual |
|
|
|
12/18/2034 |
|
|
|
|
| |
|
48,600 |
|
|
|
1,057 |
|
|
|
(891 |
) |
|
|
166 |
|
|
|
184 |
|
|
|
0 |
|
| |
|
|
|
|
1.750 |
|
|
|
Annual |
|
|
|
06/15/2052 |
|
|
|
|
| |
|
40,100 |
|
|
|
9,900 |
|
|
|
4,841 |
|
|
|
14,741 |
|
|
|
0 |
|
|
|
(220 |
) |
| |
|
|
|
|
1.750 |
|
|
|
Annual |
|
|
|
12/21/2052 |
|
|
|
|
| |
|
27,100 |
|
|
|
6,527 |
|
|
|
3,868 |
|
|
|
10,395 |
|
|
|
0 |
|
|
|
(149 |
) |
| |
|
|
|
|
3.500 |
|
|
|
Annual |
|
|
|
12/21/2052 |
|
|
|
|
| |
|
81,300 |
|
|
|
(245 |
) |
|
|
6,743 |
|
|
|
6,498 |
|
|
|
0 |
|
|
|
(620 |
) |
| |
|
|
|
|
2.250 |
|
|
|
Annual |
|
|
|
09/17/2030 |
|
|
|
EUR |
|
|
|
46,690 |
|
|
|
(551 |
) |
|
|
469 |
|
|
|
(82 |
) |
|
|
0 |
|
|
|
(51 |
) |
| |
|
|
|
|
0.250 |
|
|
|
Annual |
|
|
|
09/21/2032 |
|
|
|
|
| |
|
50,200 |
|
|
|
4,740 |
|
|
|
4,149 |
|
|
|
8,889 |
|
|
|
72 |
|
|
|
0 |
|
| |
|
|
|
|
1.750 |
|
|
|
Annual |
|
|
|
03/15/2033 |
|
|
|
|
| |
|
5,700 |
|
|
|
448 |
|
|
|
(95 |
) |
|
|
353 |
|
|
|
9 |
|
|
|
0 |
|
| |
|
|
|
|
0.830 |
|
|
|
Annual |
|
|
|
12/09/2052 |
|
|
|
|
| |
|
29,900 |
|
|
|
182 |
|
|
|
3,307 |
|
|
|
3,489 |
|
|
|
12 |
|
|
|
0 |
|
|
| |
| |
|
|
| |
|
|
| |
|
|
| |
|
|
| |
|
|
| |
|
|
|
|
|
|
|
|
|
|
|
|
|
|
|
|
|
|
|
| |
|
|
|
|
| |
|
|
|
|
|
|
|
|
|
|
|
|
|
|
|
|
|
|
|
|
| |
| |
|
|
| |
|
|
| |
|
|
| |
|
|
| |
|
|
| |
|
|
|
|
|
|
|
|
|
|
|
|
|
|
|
|
|
|
|
FINANCIAL DERIVATIVE INSTRUMENTS: EXCHANGE-TRADED OR CENTRALLY CLEARED SUMMARY
The following is a summary of the market value and variation margin of Exchange-Traded or Centrally Cleared Financial Derivative Instruments as of June 30, 2025:
|
|
|
|
|
|
|
|
|
|
|
|
|
|
|
|
|
|
|
|
|
|
|
|
|
|
|
|
|
|
|
|
|
|
|
|
| |
| |
|
Financial Derivative Assets |
|
|
|
|
|
Financial Derivative Liabilities |
|
| |
|
|
|
|
|
|
|
|
|
|
|
|
|
|
|
|
Variation Margin
Liability |
|
|
|
|
| |
|
|
|
|
|
|
|
|
|
|
|
|
|
|
|
|
|
|
|
|
|
|
|
|
|
|
|
Total Exchange-Traded or Centrally Cleared |
|
|
|
|
|
|
|
|
|
|
|
|
|
|
|
|
|
|
|
| |
|
|
|
|
|
|
|
|
|
|
|
|
|
|
|
|
| |
|
|
|
|
|
|
|
|
|
|
|
|
|
|
|
|
|
|
| |
|
|
|
|
|
|
|
|
|
|
|
|
|
|
|
|
Securities with an aggregate market value of $1,023 and cash of $25,890 have been pledged as collateral for exchange-traded and centrally cleared financial derivative instruments as of June 30, 2025. |
|
This instrument has a forward starting effective date. See Note 2, Securities Transactions and Investment Income, in the Notes to Financial Statements for further information. |
(o) FINANCIAL DERIVATIVE INSTRUMENTS: OVER THE COUNTER
FORWARD FOREIGN CURRENCY CONTRACTS:
|
|
|
|
|
|
|
|
|
|
|
|
|
|
|
|
|
|
|
|
|
|
|
|
| |
| Counterparty |
|
Settlement
Month |
|
|
Currency to
be Delivered |
|
|
Currency to
be Received |
|
|
Unrealized Appreciation/
(Depreciation) |
|
| |
|
|
|
|
|
| |
|
|
07/2025 |
|
|
EUR |
|
|
217,544 |
|
|
$ |
|
|
247,367 |
|
|
$ |
0 |
|
|
$ |
(8,890 |
) |
|
| |
|
07/2025 |
|
|
$ |
|
|
1,369 |
|
|
EUR |
|
|
1,198 |
|
|
|
42 |
|
|
|
0 |
|
|
|
|
|
|
|
|
| |
| |
|
|
07/2025 |
|
|
EUR |
|
|
6,077 |
|
|
$ |
|
|
7,057 |
|
|
|
0 |
|
|
|
(101 |
) |
|
| |
|
07/2025 |
|
|
$ |
|
|
8 |
|
|
IDR |
|
|
133,052 |
|
|
|
0 |
|
|
|
0 |
|
|
| |
|
05/2026 |
|
|
| |
|
348 |
|
|
KWD |
|
|
106 |
|
|
|
0 |
|
|
|
(1 |
) |
|
| |
|
06/2026 |
|
|
| |
|
250 |
|
|
| |
|
76 |
|
|
|
0 |
|
|
|
0 |
|
|
| |
|
06/2027 |
|
|
| |
|
121 |
|
|
| |
|
37 |
|
|
|
0 |
|
|
|
(1 |
) |
|
| |
|
05/2029 |
|
|
KWD |
|
|
518 |
|
|
$ |
|
|
1,780 |
|
|
|
78 |
|
|
|
0 |
|
|
| |
|
07/2029 |
|
|
| |
|
78 |
|
|
| |
|
270 |
|
|
|
12 |
|
|
|
0 |
|
|
| |
|
05/2030 |
|
|
| |
|
379 |
|
|
| |
|
1,304 |
|
|
|
52 |
|
|
|
0 |
|
|
|
|
|
|
|
|
| |
| |
|
|
07/2025 |
|
|
EUR |
|
|
50,610 |
|
|
| |
|
58,190 |
|
|
|
0 |
|
|
|
(1,426 |
) |
|
| |
|
07/2025 |
|
|
JPY |
|
|
1,018 |
|
|
| |
|
7 |
|
|
|
0 |
|
|
|
0 |
|
|
| |
|
07/2025 |
|
|
TRY |
|
|
108,530 |
|
|
| |
|
2,689 |
|
|
|
0 |
|
|
|
(36 |
) |
|
| |
|
07/2025 |
|
|
$ |
|
|
1,732 |
|
|
EUR |
|
|
1,515 |
|
|
|
53 |
|
|
|
0 |
|
|
| |
|
07/2025 |
|
|
| |
|
70,197 |
|
|
GBP |
|
|
51,592 |
|
|
|
621 |
|
|
|
0 |
|
|
| |
|
07/2025 |
|
|
| |
|
12,454 |
|
|
TRY |
|
|
505,677 |
|
|
|
191 |
|
|
|
0 |
|
|
| |
|
07/2025 |
|
|
ZAR |
|
|
86,227 |
|
|
$ |
|
|
4,770 |
|
|
|
0 |
|
|
|
(93 |
) |
|
| |
|
08/2025 |
|
|
GBP |
|
|
51,592 |
|
|
| |
|
70,206 |
|
|
|
0 |
|
|
|
(622 |
) |
|
| |
|
08/2025 |
|
|
$ |
|
|
17,299 |
|
|
TRY |
|
|
720,102 |
|
|
|
167 |
|
|
|
0 |
|
|
|
|
|
|
|
|
| |
| |
|
|
07/2025 |
|
|
EUR |
|
|
4,484 |
|
|
$ |
|
|
5,154 |
|
|
|
0 |
|
|
|
(128 |
) |
|
| |
|
07/2025 |
|
|
$ |
|
|
10,781 |
|
|
EUR |
|
|
9,409 |
|
|
|
302 |
|
|
|
0 |
|
|
| |
|
07/2025 |
|
|
| |
|
31 |
|
|
IDR |
|
|
509,216 |
|
|
|
0 |
|
|
|
0 |
|
|
|
|
|
|
|
|
|
|
|
|
|
| |
| See Accompanying Notes |
|
|
ANNUAL REPORT |
|
|
| |
|
|
JUNE 30, 2025 |
|
|
111 |
|
|
|
|
|
|
| |
Consolidated Schedule of Investments |
|
PIMCO Dynamic Income Opportunities Fund |
|
|
|
|
|
|
|
|
|
|
|
|
|
|
|
|
|
|
|
|
|
|
|
|
|
|
|
|
| |
| Counterparty |
|
Settlement
Month |
|
|
Currency to
be Delivered |
|
|
Currency to
be Received |
|
|
Unrealized Appreciation/
(Depreciation) |
|
| |
Asset |
|
|
Liability |
|
|
| |
|
08/2025 |
|
|
$ |
|
|
20,185 |
|
|
EUR |
|
|
17,177 |
|
|
$ |
93 |
|
|
$ |
0 |
|
|
|
|
|
|
|
|
| |
| |
|
|
07/2025 |
|
|
| |
|
297,249 |
|
|
| |
|
256,227 |
|
|
|
4,574 |
|
|
|
0 |
|
|
| |
|
08/2025 |
|
|
EUR |
|
|
255,665 |
|
|
$ |
|
|
297,249 |
|
|
|
0 |
|
|
|
(4,569 |
) |
|
|
|
|
|
|
|
| |
| |
|
|
07/2025 |
|
|
BRL |
|
|
8,862 |
|
|
| |
|
1,604 |
|
|
|
0 |
|
|
|
(27 |
) |
|
| |
|
07/2025 |
|
|
CHF |
|
|
89 |
|
|
| |
|
108 |
|
|
|
0 |
|
|
|
(4 |
) |
|
| |
|
07/2025 |
|
|
JPY |
|
|
46,191 |
|
|
| |
|
322 |
|
|
|
1 |
|
|
|
0 |
|
|
| |
|
07/2025 |
|
|
$ |
|
|
1,550 |
|
|
BRL |
|
|
8,862 |
|
|
|
81 |
|
|
|
0 |
|
|
| |
|
07/2025 |
|
|
| |
|
111 |
|
|
CHF |
|
|
89 |
|
|
|
1 |
|
|
|
0 |
|
|
| |
|
07/2025 |
|
|
| |
|
181 |
|
|
JPY |
|
|
26,378 |
|
|
|
2 |
|
|
|
0 |
|
|
| |
|
08/2025 |
|
|
CHF |
|
|
89 |
|
|
$ |
|
|
111 |
|
|
|
0 |
|
|
|
(1 |
) |
|
| |
|
08/2025 |
|
|
JPY |
|
|
26,281 |
|
|
| |
|
181 |
|
|
|
0 |
|
|
|
(2 |
) |
|
| |
|
09/2025 |
|
|
$ |
|
|
1,604 |
|
|
BRL |
|
|
8,997 |
|
|
|
26 |
|
|
|
0 |
|
|
|
|
|
|
|
|
| |
| |
|
|
07/2025 |
|
|
| |
|
7 |
|
|
IDR |
|
|
120,779 |
|
|
|
0 |
|
|
|
0 |
|
|
| |
|
07/2025 |
|
|
ZAR |
|
|
3,007 |
|
|
$ |
|
|
168 |
|
|
|
0 |
|
|
|
(2 |
) |
|
|
|
|
|
|
|
| |
| |
|
|
07/2025 |
|
|
EUR |
|
|
13,532 |
|
|
| |
|
15,339 |
|
|
|
0 |
|
|
|
(601 |
) |
|
| |
|
07/2025 |
|
|
GBP |
|
|
860 |
|
|
| |
|
1,154 |
|
|
|
0 |
|
|
|
(26 |
) |
|
| |
|
07/2025 |
|
|
HKD |
|
|
93,801 |
|
|
| |
|
11,989 |
|
|
|
23 |
|
|
|
0 |
|
|
| |
|
07/2025 |
|
|
JPY |
|
|
1,703 |
|
|
| |
|
12 |
|
|
|
0 |
|
|
|
0 |
|
|
| |
|
07/2025 |
|
|
$ |
|
|
1,586 |
|
|
EUR |
|
|
1,369 |
|
|
|
26 |
|
|
|
0 |
|
|
| |
|
07/2025 |
|
|
| |
|
142 |
|
|
JPY |
|
|
20,516 |
|
|
|
1 |
|
|
|
0 |
|
|
| |
|
08/2025 |
|
|
JPY |
|
|
20,441 |
|
|
$ |
|
|
142 |
|
|
|
0 |
|
|
|
(1 |
) |
|
|
|
|
|
|
|
| |
| |
|
|
07/2025 |
|
|
EUR |
|
|
385 |
|
|
| |
|
443 |
|
|
|
0 |
|
|
|
(10 |
) |
|
| |
|
07/2025 |
|
|
$ |
|
|
34 |
|
|
IDR |
|
|
561,753 |
|
|
|
0 |
|
|
|
0 |
|
|
| |
|
07/2025 |
|
|
| |
|
16 |
|
|
JPY |
|
|
2,305 |
|
|
|
0 |
|
|
|
0 |
|
|
| |
|
08/2025 |
|
|
EUR |
|
|
21,541 |
|
|
$ |
|
|
25,311 |
|
|
|
0 |
|
|
|
(118 |
) |
|
| |
|
08/2025 |
|
|
JPY |
|
|
2,296 |
|
|
| |
|
16 |
|
|
|
0 |
|
|
|
0 |
|
|
|
|
|
|
|
|
| |
| |
|
|
07/2025 |
|
|
GBP |
|
|
50,732 |
|
|
| |
|
68,692 |
|
|
|
0 |
|
|
|
(945 |
) |
|
|
|
|
|
|
|
| |
| |
|
|
07/2025 |
|
|
JPY |
|
|
1,112 |
|
|
| |
|
8 |
|
|
|
0 |
|
|
|
0 |
|
|
| |
|
07/2025 |
|
|
$ |
|
|
1,571 |
|
|
EUR |
|
|
1,374 |
|
|
|
48 |
|
|
|
0 |
|
|
| |
|
|
| |
| |
|
|
| |
| |
|
|
| |
|
|
|
|
|
|
|
Total Forward Foreign Currency Contracts |
|
|
|
|
|
|
|
|
|
|
|
| |
|
|
|
|
|
|
|
SWAP AGREEMENTS:
CREDIT DEFAULT SWAPS ON CORPORATE AND SOVEREIGN ISSUES - SELL PROTECTION
(1)
|
|
|
|
|
|
|
|
|
|
|
|
|
|
|
|
|
|
|
|
|
|
|
|
|
|
|
|
|
|
|
|
|
|
|
|
| |
|
|
|
|
|
|
|
|
|
|
|
|
Implied Credit Spread at June 30, 2025 (2) |
|
|
|
|
|
|
|
|
Unrealized
Appreciation/
(Depreciation) |
|
|
Swap Agreements, at Value (4) |
|
| |
|
|
|
|
|
BRC |
|
Egypt Government International Bond |
|
|
1.000 |
% |
|
Quarterly |
|
|
12/20/2028 |
|
|
|
4.462 |
% |
|
$ |
6,200 |
|
|
$ |
(1,070 |
) |
|
$ |
422 |
|
|
$ |
0 |
|
|
$ |
(648 |
) |
|
| |
Egypt Government International Bond |
|
|
1.000 |
|
|
Quarterly |
|
|
06/20/2029 |
|
|
|
4.645 |
|
|
|
1,900 |
|
|
|
(405 |
) |
|
|
172 |
|
|
|
0 |
|
|
|
(233 |
) |
MYC |
|
|
|
|
1.000 |
|
|
Quarterly |
|
|
12/20/2028 |
|
|
|
3.804 |
|
|
|
1,900 |
|
|
|
(371 |
) |
|
|
209 |
|
|
|
0 |
|
|
|
(162 |
) |
|
| |
| |
|
|
| |
| |
|
|
| |
|
|
| |
|
|
| |
|
|
|
|
|
|
|
|
|
|
|
|
|
|
|
|
| |
|
|
| |
| |
|
|
| |
|
|
| |
|
|
| |
$ |
(1,846 |
) |
|
$ |
803 |
|
|
$ |
0 |
|
|
$ |
(1,043 |
) |
|
| |
|
|
| |
| |
|
|
| |
|
|
| |
|
|
| |
|
|
|
|
|
|
|
|
|
|
|
|
|
|
|
TOTAL RETURN SWAPS ON LOAN PARTICIPATIONS AND ASSIGNMENTS
|
|
|
|
|
|
|
|
|
|
|
|
|
|
|
|
|
|
|
|
|
|
|
|
|
|
|
|
|
|
|
|
| |
|
|
|
|
|
|
|
|
|
|
|
|
|
|
|
|
|
|
|
Unrealized
Appreciation/
(Depreciation) |
|
|
|
|
| |
|
|
|
|
|
BPS |
|
|
|
|
|
1-Day USD-SOFR Compounded-OIS |
|
|
|
|
09/10/2025 |
|
|
$ |
30 |
|
|
$ |
0 |
|
|
$ |
(68 |
) |
|
$ |
0 |
|
|
$ |
(68 |
) |
|
| |
|
|
|
|
1-Day USD-SOFR Compounded-OIS |
|
|
|
|
09/10/2025 |
|
|
|
3,968 |
|
|
|
0 |
|
|
|
1,840 |
|
|
|
1,840 |
|
|
|
0 |
|
|
| |
| |
| |
| |
| |
|
|
| |
|
|
| |
|
|
|
|
|
|
|
|
|
|
|
|
|
|
|
|
|
| |
$ |
0 |
|
|
$ |
1,772 |
|
|
$ |
1,840 |
|
|
$ |
(68 |
) |
|
|
| |
|
|
|
|
|
|
|
|
|
|
|
|
|
|
|
| |
|
|
|
|
|
|
|
|
|
|
|
|
|
|
|
|
|
|
|
| |
|
|
|
|
|
|
|
|
|
|
|
|
|
|
|
FINANCIAL DERIVATIVE INSTRUMENTS: OVER THE COUNTER SUMMARY
The following is a summary by counterparty of the market value of OTC financial derivative instruments and collateral pledged/(received) as of June 30, 2025:
|
|
|
|
|
|
|
|
|
|
|
|
|
|
|
|
|
|
|
|
|
|
|
|
|
|
|
|
|
|
|
|
|
|
|
|
|
|
|
|
|
|
|
|
|
|
|
|
| |
| |
|
Financial Derivative Assets |
|
|
|
|
|
Financial Derivative Liabilities |
|
|
|
|
|
|
|
|
|
|
|
|
Forward
Foreign
Currency
Contracts |
|
|
|
|
|
|
|
|
|
|
|
|
|
|
Forward
Foreign
Currency
Contracts |
|
|
|
|
|
|
|
|
|
|
|
Net Market
Value of OTC
Derivatives |
|
|
Collateral
Pledged/
(Received) |
|
|
|
|
| |
|
$ |
42 |
|
|
$ |
0 |
|
|
$ |
0 |
|
|
$ |
42 |
|
|
|
|
| |
$ |
(8,890 |
) |
|
$ |
0 |
|
|
$ |
0 |
|
|
$ |
(8,890 |
) |
|
$ |
(8,848 |
) |
|
$ |
7,641 |
|
|
$ |
(1,207 |
) |
| |
|
|
142 |
|
|
|
0 |
|
|
|
1,840 |
|
|
|
1,982 |
|
|
|
|
| |
|
(103 |
) |
|
|
0 |
|
|
|
(68 |
) |
|
|
(171 |
) |
|
|
1,811 |
|
|
|
(1,990 |
) |
|
|
(179 |
) |
| |
|
|
1,032 |
|
|
|
0 |
|
|
|
0 |
|
|
|
1,032 |
|
|
|
|
| |
|
(2,177 |
) |
|
|
0 |
|
|
|
(881 |
) |
|
|
(3,058 |
) |
|
|
(2,026 |
) |
|
|
1,864 |
|
|
|
(162 |
) |
| |
|
|
395 |
|
|
|
0 |
|
|
|
0 |
|
|
|
395 |
|
|
|
|
| |
|
(128 |
) |
|
|
0 |
|
|
|
0 |
|
|
|
(128 |
) |
|
|
267 |
|
|
|
0 |
|
|
|
267 |
|
| |
|
|
4,574 |
|
|
|
0 |
|
|
|
0 |
|
|
|
4,574 |
|
|
|
|
| |
|
(4,569 |
) |
|
|
0 |
|
|
|
0 |
|
|
|
(4,569 |
) |
|
|
5 |
|
|
|
0 |
|
|
|
5 |
|
| |
|
|
111 |
|
|
|
0 |
|
|
|
0 |
|
|
|
111 |
|
|
|
|
| |
|
(34 |
) |
|
|
0 |
|
|
|
0 |
|
|
|
(34 |
) |
|
|
77 |
|
|
|
0 |
|
|
|
77 |
|
| |
|
|
0 |
|
|
|
0 |
|
|
|
0 |
|
|
|
0 |
|
|
|
|
| |
|
(2 |
) |
|
|
0 |
|
|
|
0 |
|
|
|
(2 |
) |
|
|
(2 |
) |
|
|
0 |
|
|
|
(2 |
) |
| |
|
|
0 |
|
|
|
0 |
|
|
|
0 |
|
|
|
0 |
|
|
|
|
| |
|
0 |
|
|
|
0 |
|
|
|
(162 |
) |
|
|
(162 |
) |
|
|
(162 |
) |
|
|
394 |
|
|
|
232 |
|
| |
|
|
50 |
|
|
|
0 |
|
|
|
0 |
|
|
|
50 |
|
|
|
|
| |
|
(628 |
) |
|
|
0 |
|
|
|
0 |
|
|
|
(628 |
) |
|
|
(578 |
) |
|
|
280 |
|
|
|
(298 |
) |
| |
|
|
0 |
|
|
|
0 |
|
|
|
0 |
|
|
|
0 |
|
|
|
|
| |
|
(128 |
) |
|
|
0 |
|
|
|
0 |
|
|
|
(128 |
) |
|
|
(128 |
) |
|
|
0 |
|
|
|
(128 |
) |
| |
|
|
0 |
|
|
|
0 |
|
|
|
0 |
|
|
|
0 |
|
|
|
|
| |
|
(945 |
) |
|
|
0 |
|
|
|
0 |
|
|
|
(945 |
) |
|
|
(945 |
) |
|
|
967 |
|
|
|
22 |
|
| |
|
|
48 |
|
|
|
0 |
|
|
|
0 |
|
|
|
48 |
|
|
|
|
| |
|
0 |
|
|
|
0 |
|
|
|
0 |
|
|
|
0 |
|
|
|
48 |
|
|
|
0 |
|
|
|
48 |
|
|
| |
|
|
|
|
|
|
|
|
|
|
|
|
|
|
|
|
|
|
| |
|
|
|
|
|
|
|
|
|
|
|
|
|
|
|
|
|
|
| |
|
|
| |
|
| |
| |
|
|
|
|
|
|
|
|
|
|
|
|
|
|
|
|
|
|
|
| |
|
|
|
|
|
|
|
|
|
|
|
|
|
|
|
|
|
|
| |
|
|
| |
|
| |
|
| |
|
|
|
|
|
|
|
|
|
|
|
|
|
|
|
|
|
|
| |
|
|
|
|
|
|
|
|
|
|
|
|
|
|
|
|
|
|
| |
|
|
| |
|
| |
|
Securities with an aggregate market value of $11,146 has been pledged as collateral for financial derivative instruments as governed by International Swaps and Derivatives Association, Inc. master agreements as of June 30, 2025. |
|
If the Fund is a seller of protection and a credit event occurs, as defined under the terms of that particular swap agreement, the Fund will either (i) pay to the buyer of protection an amount equal to the notional amount of the swap and take delivery of the referenced obligation or underlying securities comprising the referenced index or (ii) pay a net settlement amount in the form of cash, securities or other deliverable obligations equal to the notional amount of the swap less the recovery value of the referenced obligation or underlying securities comprising the referenced index. |
|
Implied credit spreads, represented in absolute terms, utilized in determining the market value of credit default swap agreements on corporate or sovereign issues as of period end serve as indicators of the current status of the payment/performance risk and represent the likelihood or risk of default for the credit derivative. The implied credit spread of a particular referenced entity reflects the cost of buying/selling protection and may include upfront payments required to be made to enter into the agreement. Wider credit spreads represent a deterioration of the referenced entity’s credit soundness and a greater likelihood or risk of default or other credit event occurring as defined under the terms of the agreement. |
|
The maximum potential amount the Fund could be required to pay as a seller of credit protection or receive as a buyer of credit protection if a credit event occurs as defined under the terms of that particular swap agreement. |
|
The prices and resulting values for credit default swap agreements serve as indicators of the current status of the payment/performance risk and represent the likelihood of an expected liability (or profit) for the credit derivative should the notional amount of the swap agreement be closed/sold as of the period end. Increasing market values, in absolute terms when compared to the notional amount of the swap, represent a deterioration of the underlying referenced instrument’s credit soundness and a greater likelihood or risk of default or other credit event occurring as defined under the terms of the agreement. |
|
Net Exposure represents the net receivable/(payable) that would be due from/to the counterparty in the event of default. Exposure from OTC derivatives can only be netted across transactions governed under the same master agreement with the same legal entity. See Note 8, Master netting Arrangements, in the Notes to Financial Statements for more information. |
FAIR VALUE OF FINANCIAL DERIVATIVE INSTRUMENTS
The following is a summary of the fair valuation of the Fund’s derivative instruments categorized by risk exposure. See Note 7, Principal and Other Risks, in the Notes to Financial Statements on risks of the Fund.
Fair Values of Financial Derivative Instruments on the Consolidated Statements of Assets and Liabilities as of June 30, 2025:
|
|
|
|
|
|
|
|
|
|
|
|
|
|
|
|
|
|
|
|
|
|
|
|
| |
| |
|
Derivatives not accounted for as hedging instruments |
|
| |
|
|
|
|
|
|
|
|
|
|
|
|
|
|
|
|
|
|
Financial Derivative Instruments - Assets |
|
Exchange-traded or centrally cleared |
|
| |
|
$ |
0 |
|
|
$ |
0 |
|
|
$ |
0 |
|
|
$ |
0 |
|
|
$ |
1 |
|
|
$ |
1 |
|
| |
|
|
0 |
|
|
|
0 |
|
|
|
0 |
|
|
|
0 |
|
|
|
1,321 |
|
|
|
1,321 |
|
|
| |
|
|
|
|
|
|
|
|
|
|
|
|
|
|
|
|
|
|
|
|
|
|
|
|
| |
$ |
0 |
|
|
$ |
0 |
|
|
$ |
0 |
|
|
$ |
0 |
|
|
$ |
1,322 |
|
|
$ |
1,322 |
|
|
| |
|
|
|
|
|
|
|
|
|
|
|
|
|
|
|
|
|
|
|
|
|
|
|
| |
|
Forward Foreign Currency Contracts |
|
$ |
0 |
|
|
$ |
0 |
|
|
$ |
0 |
|
|
$ |
6,394 |
|
|
$ |
0 |
|
|
$ |
6,394 |
|
| |
|
|
0 |
|
|
|
0 |
|
|
|
0 |
|
|
|
0 |
|
|
|
1,840 |
|
|
|
1,840 |
|
|
| |
|
|
|
|
|
|
|
|
|
|
|
|
|
|
|
|
|
|
|
|
|
|
|
|
| |
$ |
0 |
|
|
$ |
0 |
|
|
$ |
0 |
|
|
$ |
6,394 |
|
|
$ |
1,840 |
|
|
$ |
8,234 |
|
|
| |
|
|
|
|
|
|
|
|
|
|
|
|
|
|
|
|
|
|
|
|
|
|
|
|
| |
$ |
0 |
|
|
$ |
0 |
|
|
$ |
0 |
|
|
$ |
6,394 |
|
|
$ |
3,162 |
|
|
$ |
9,556 |
|
|
| |
|
|
|
|
|
|
|
|
|
|
|
|
|
|
|
|
|
|
|
|
|
|
|
|
|
|
|
|
|
|
|
|
|
|
|
| |
See Accompanying Notes |
|
|
|
|
|
| |
|
|
JUNE 30, 2025 |
|
|
|
|
|
|
|
|
|
| |
Consolidated Schedule of Investments |
|
PIMCO Dynamic Income Opportunities Fund |
|
|
|
|
|
|
|
|
|
|
|
|
|
|
|
|
|
|
|
|
|
|
|
|
|
|
|
|
| |
| |
|
Derivatives not accounted for as hedging instruments |
|
| |
|
Commodity
Contracts |
|
|
Credit
Contracts |
|
|
Equity
Contracts |
|
|
Foreign
Exchange
Contracts |
|
|
Interest
Rate Contracts |
|
|
Total |
|
Financial Derivative Instruments - Liabilities |
|
Exchange-traded or centrally cleared |
|
| |
|
$ |
0 |
|
|
$ |
0 |
|
|
$ |
0 |
|
|
$ |
0 |
|
|
$ |
5 |
|
|
$ |
5 |
|
| |
|
|
0 |
|
|
|
0 |
|
|
|
0 |
|
|
|
0 |
|
|
|
1,103 |
|
|
|
1,103 |
|
|
| |
|
|
|
|
|
|
|
|
|
|
|
|
|
|
|
|
|
|
|
|
|
|
|
|
| |
$ |
0 |
|
|
$ |
0 |
|
|
$ |
0 |
|
|
$ |
0 |
|
|
$ |
1,108 |
|
|
$ |
1,108 |
|
|
| |
|
|
|
|
|
|
|
|
|
|
|
|
|
|
|
|
|
|
|
|
|
|
|
| |
|
Forward Foreign Currency Contracts |
|
$ |
0 |
|
|
$ |
0 |
|
|
$ |
0 |
|
|
$ |
17,604 |
|
|
$ |
0 |
|
|
$ |
17,604 |
|
| |
|
|
0 |
|
|
|
1,043 |
|
|
|
0 |
|
|
|
0 |
|
|
|
68 |
|
|
|
1,111 |
|
|
| |
|
|
|
|
|
|
|
|
|
|
|
|
|
|
|
|
|
|
|
|
|
|
|
|
| |
$ |
0 |
|
|
$ |
1,043 |
|
|
$ |
0 |
|
|
$ |
17,604 |
|
|
$ |
68 |
|
|
$ |
18,715 |
|
|
| |
|
|
|
|
|
|
|
|
|
|
|
|
|
|
|
|
|
|
|
|
|
|
|
|
| |
$ |
0 |
|
|
$ |
1,043 |
|
|
$ |
0 |
|
|
$ |
17,604 |
|
|
$ |
1,176 |
|
|
$ |
19,823 |
|
|
| |
|
|
|
|
|
|
|
|
|
|
|
|
|
|
|
|
|
|
|
|
|
|
|
The effect of Financial Derivative Instruments on the Consolidated Statements of Operations for the period ended June 30, 2025:
|
|
|
|
|
|
|
|
|
|
|
|
|
|
|
|
|
|
|
|
|
|
|
|
| |
| |
|
Derivatives not accounted for as hedging instruments |
|
| |
|
|
|
|
|
|
|
|
|
|
|
|
|
|
|
|
|
|
Net Realized Gain (Loss) on Financial Derivative Instruments |
|
Exchange-traded or centrally cleared |
|
| |
|
$ |
0 |
|
|
$ |
0 |
|
|
$ |
0 |
|
|
$ |
0 |
|
|
$ |
1,047 |
|
|
$ |
1,047 |
|
| |
|
|
0 |
|
|
|
0 |
|
|
|
0 |
|
|
|
0 |
|
|
|
22,727 |
|
|
|
22,727 |
|
|
| |
|
|
|
|
|
|
|
|
|
|
|
|
|
|
|
|
|
|
|
|
|
|
|
|
| |
$ |
0 |
|
|
$ |
0 |
|
|
$ |
0 |
|
|
$ |
0 |
|
|
$ |
23,774 |
|
|
$ |
23,774 |
|
|
| |
|
|
|
|
|
|
|
|
|
|
|
|
|
|
|
|
|
|
|
|
|
|
|
| |
|
Forward Foreign Currency Contracts |
|
$ |
0 |
|
|
$ |
0 |
|
|
$ |
0 |
|
|
$ |
(7,699 |
) |
|
$ |
0 |
|
|
$ |
(7,699 |
) |
| |
|
|
0 |
|
|
|
223 |
|
|
|
0 |
|
|
|
0 |
|
|
|
5,437 |
|
|
|
5,660 |
|
|
| |
|
|
|
|
|
|
|
|
|
|
|
|
|
|
|
|
|
|
|
|
|
|
|
|
| |
$ |
0 |
|
|
$ |
223 |
|
|
$ |
0 |
|
|
$ |
(7,699 |
) |
|
$ |
5,437 |
|
|
$ |
(2,039 |
) |
|
| |
|
|
|
|
|
|
|
|
|
|
|
|
|
|
|
|
|
|
|
|
|
|
|
|
| |
$ |
0 |
|
|
$ |
223 |
|
|
$ |
0 |
|
|
$ |
(7,699 |
) |
|
$ |
29,211 |
|
|
$ |
21,735 |
|
|
| |
|
|
|
|
|
|
|
|
|
|
|
|
|
|
|
|
|
|
|
|
|
|
|
|
Net Change in Unrealized Appreciation (Depreciation) on Financial Derivative Instruments |
|
Exchange-traded or centrally cleared |
|
| |
|
$ |
0 |
|
|
$ |
0 |
|
|
$ |
0 |
|
|
$ |
0 |
|
|
$ |
(991 |
) |
|
$ |
(991 |
) |
| |
|
|
0 |
|
|
|
0 |
|
|
|
0 |
|
|
|
0 |
|
|
|
(1,966 |
) |
|
|
(1,966 |
) |
|
| |
|
|
|
|
|
|
|
|
|
|
|
|
|
|
|
|
|
|
|
|
|
|
|
|
| |
$ |
0 |
|
|
$ |
0 |
|
|
$ |
0 |
|
|
$ |
0 |
|
|
$ |
(2,957 |
) |
|
$ |
(2,957 |
) |
|
| |
|
|
|
|
|
|
|
|
|
|
|
|
|
|
|
|
|
|
|
|
|
|
|
| |
|
Forward Foreign Currency Contracts |
|
$ |
0 |
|
|
$ |
0 |
|
|
$ |
0 |
|
|
$ |
(15,243 |
) |
|
$ |
0 |
|
|
$ |
(15,243 |
) |
| |
|
|
0 |
|
|
|
649 |
|
|
|
0 |
|
|
|
0 |
|
|
|
(3,543 |
) |
|
|
(2,894 |
) |
|
| |
|
|
|
|
|
|
|
|
|
|
|
|
|
|
|
|
|
|
|
|
|
|
|
|
| |
$ |
0 |
|
|
$ |
649 |
|
|
$ |
0 |
|
|
$ |
(15,243 |
) |
|
$ |
(3,543 |
) |
|
$ |
(18,137 |
) |
|
| |
|
|
|
|
|
|
|
|
|
|
|
|
|
|
|
|
|
|
|
|
|
|
|
|
| |
$ |
0 |
|
|
$ |
649 |
|
|
$ |
0 |
|
|
$ |
(15,243 |
) |
|
$ |
(6,500 |
) |
|
$ |
(21,094 |
) |
|
| |
|
|
|
|
|
|
|
|
|
|
|
|
|
|
|
|
|
|
|
|
|
|
|
FAIR VALUE MEASUREMENTS
The following is a summary of the fair valuations according to the inputs used as of June 30, 2025 in valuing the Fund’s assets and
liabilities:
|
|
|
|
|
|
|
|
|
|
|
|
|
|
|
|
| |
|
|
|
|
|
|
|
|
|
|
|
|
|
Investments in Securities, at Value |
|
Loan Participations and Assignments |
|
$ |
0 |
|
|
$ |
433,749 |
|
|
$ |
181,551 |
|
|
$ |
615,300 |
|
| |
|
| |
|
|
0 |
|
|
|
130,128 |
|
|
|
224 |
|
|
|
130,352 |
|
| |
|
|
0 |
|
|
|
305,851 |
|
|
|
64,087 |
|
|
|
369,938 |
|
| |
|
|
0 |
|
|
|
43,174 |
|
|
|
0 |
|
|
|
43,174 |
|
Convertible Bonds & Notes |
|
| |
|
|
0 |
|
|
|
24,937 |
|
|
|
0 |
|
|
|
24,937 |
|
| |
|
|
0 |
|
|
|
3,101 |
|
|
|
0 |
|
|
|
3,101 |
|
| |
|
| |
|
|
0 |
|
|
|
2,288 |
|
|
|
0 |
|
|
|
2,288 |
|
| |
|
|
0 |
|
|
|
101,556 |
|
|
|
0 |
|
|
|
101,556 |
|
Non-Agency Mortgage-Backed Securities |
|
|
0 |
|
|
|
490,504 |
|
|
|
608 |
|
|
|
491,112 |
|
| |
|
| |
|
|
0 |
|
|
|
13,024 |
|
|
|
2,224 |
|
|
|
15,248 |
|
| |
|
|
0 |
|
|
|
0 |
|
|
|
8,131 |
|
|
|
8,131 |
|
| |
|
|
0 |
|
|
|
209,052 |
|
|
|
0 |
|
|
|
209,052 |
|
|
|
|
|
|
|
|
|
|
|
|
|
|
|
|
|
| |
Category and Subcategory |
|
Level 1 |
|
|
Level 2 |
|
|
Level 3 |
|
|
Fair
Value at
06/30/2025 |
|
| |
|
$ |
0 |
|
|
$ |
43,945 |
|
|
$ |
0 |
|
|
$ |
43,945 |
|
| |
|
|
0 |
|
|
|
72,977 |
|
|
|
15,138 |
|
|
|
88,115 |
|
| |
|
|
0 |
|
|
|
112,312 |
|
|
|
0 |
|
|
|
112,312 |
|
| |
|
| |
|
|
2,026 |
|
|
|
0 |
|
|
|
0 |
|
|
|
2,026 |
|
| |
|
|
19,519 |
|
|
|
0 |
|
|
|
22,531 |
|
|
|
42,050 |
|
| |
|
|
0 |
|
|
|
0 |
|
|
|
70,964 |
|
|
|
70,964 |
|
| |
|
|
0 |
|
|
|
0 |
|
|
|
31,997 |
|
|
|
31,997 |
|
| |
|
| |
|
|
0 |
|
|
|
5,087 |
|
|
|
22,831 |
|
|
|
27,918 |
|
Real Estate Investment Trusts |
|
| |
|
|
18,624 |
|
|
|
0 |
|
|
|
0 |
|
|
|
18,624 |
|
| |
|
| |
|
|
0 |
|
|
|
13,910 |
|
|
|
0 |
|
|
|
13,910 |
|
| |
|
|
0 |
|
|
|
26,553 |
|
|
|
0 |
|
|
|
26,553 |
|
|
| |
|
|
|
|
|
|
|
|
|
|
|
|
|
|
|
|
| |
$ |
40,169 |
|
|
$ |
2,032,148 |
|
|
$ |
420,286 |
|
|
$ |
2,492,603 |
|
|
| |
|
|
|
|
|
|
|
|
|
|
|
|
|
|
|
|
|
|
|
|
|
|
|
|
|
|
|
|
|
|
|
| |
Category and Subcategory |
|
Level 1 |
|
|
Level 2 |
|
|
Level 3 |
|
|
Fair
Value at
06/30/2025 |
|
Investments in Affiliates, at Value |
|
| |
|
| |
|
$ |
0 |
|
|
$ |
0 |
|
|
$ |
21,996 |
|
|
$ |
21,996 |
|
| |
|
Central Funds Used for Cash Management Purposes |
|
|
145,779 |
|
|
|
0 |
|
|
|
0 |
|
|
|
145,779 |
|
|
| |
|
|
|
|
|
|
|
|
|
|
|
|
|
|
|
|
| |
$ |
145,779 |
|
|
$ |
0 |
|
|
$ |
21,996 |
|
|
$ |
167,775 |
|
|
| |
|
|
|
|
|
|
|
|
|
|
|
|
|
|
|
|
|
|
|
| |
| |
|
$ |
185,948 |
|
|
$ |
2,032,148 |
|
|
$ |
442,282 |
|
|
$ |
2,660,378 |
|
|
| |
|
|
|
|
|
|
|
|
|
|
|
|
|
|
|
|
Financial Derivative Instruments - Assets |
|
Exchange-traded or centrally cleared |
|
|
0 |
|
|
|
1,322 |
|
|
|
0 |
|
|
|
1,322 |
|
| |
|
|
0 |
|
|
|
8,234 |
|
|
|
0 |
|
|
|
8,234 |
|
|
| |
|
|
|
|
|
|
|
|
|
|
|
|
|
|
|
|
| |
$ |
0 |
|
|
$ |
9,556 |
|
|
$ |
0 |
|
|
$ |
9,556 |
|
|
| |
|
|
|
|
|
|
|
|
|
|
|
|
|
|
|
|
|
|
|
|
|
|
|
|
|
|
|
|
|
|
|
| |
|
|
|
|
|
|
|
|
|
|
|
|
|
Financial Derivative Instruments - Liabilities |
|
Exchange-traded or centrally cleared |
|
$ |
0 |
|
|
$ |
(1,108 |
) |
|
$ |
0 |
|
|
$ |
(1,108 |
) |
| |
|
|
0 |
|
|
|
(18,715 |
) |
|
|
0 |
|
|
|
(18,715 |
) |
|
| |
|
|
|
|
|
|
|
|
|
|
|
|
|
|
|
|
| |
$ |
0 |
|
|
$ |
(19,823 |
) |
|
$ |
0 |
|
|
$ |
(19,823 |
) |
|
| |
|
|
|
|
|
|
|
|
|
|
|
|
|
|
|
|
|
|
|
| |
Total Financial Derivative Instruments |
|
$ |
0 |
|
|
$ |
(10,267 |
) |
|
$ |
0 |
|
|
$ |
(10,267 |
) |
|
| |
|
|
|
|
|
|
|
|
|
|
|
|
|
|
|
|
|
|
|
| |
| |
|
$ |
185,948 |
|
|
$ |
2,021,881 |
|
|
$ |
442,282 |
|
|
$ |
2,650,111 |
|
|
| |
|
|
|
|
|
|
|
|
|
|
|
|
|
|
|
The following is a reconciliation of the fair valuations using significant unobservable inputs (Level 3) for the Fund during the period ended June 30, 2025:
|
|
|
|
|
|
|
|
|
|
|
|
|
|
|
|
|
|
|
|
|
|
|
|
|
|
|
|
|
|
|
|
|
|
|
|
|
|
|
|
| |
|
|
Beginning
Balance
at 06/30/2024 |
|
|
|
|
|
|
|
|
Accrued
Discounts/
(Premiums) |
|
|
|
|
|
Net Change in Unrealized Appreciation/ (Depreciation) (1) |
|
|
|
|
|
|
|
|
Ending
Balance
at 06/30/2025 |
|
|
Net Change in Unrealized Appreciation/ (Depreciation) on Investments Held at 06/30/2025 (1) |
|
Investments in Securities, at Value |
|
Loan Participations and Assignments |
|
$ |
171,394 |
|
|
$ |
86,393 |
|
|
$ |
(105,819 |
) |
|
$ |
655 |
|
|
$ |
1,791 |
|
|
$ |
22,964 |
|
|
$ |
4,173 |
|
|
$ |
0 |
|
|
$ |
181,551 |
|
|
$ |
6,020 |
|
| |
|
| |
|
|
21,785 |
|
|
|
212 |
|
|
|
(22,440 |
) |
|
|
0 |
|
|
|
884 |
|
|
|
(217 |
) |
|
|
0 |
|
|
|
0 |
|
|
|
224 |
|
|
|
12 |
|
| |
|
|
76,380 |
|
|
|
49,126 |
|
|
|
(66,318 |
) |
|
|
(136 |
) |
|
|
(20,831 |
) |
|
|
18,612 |
|
|
|
7,254 |
|
|
|
0 |
|
|
|
64,087 |
|
|
|
7,706 |
|
Non-Agency Mortgage-Backed Securities |
|
|
277 |
|
|
|
0 |
|
|
|
(3 |
) |
|
|
2 |
|
|
|
0 |
|
|
|
86 |
|
|
|
400 |
|
|
|
(154 |
) |
|
|
608 |
|
|
|
84 |
|
| |
|
| |
|
|
3,877 |
|
|
|
0 |
|
|
|
0 |
|
|
|
0 |
|
|
|
0 |
|
|
|
(1,653 |
) |
|
|
0 |
|
|
|
0 |
|
|
|
2,224 |
|
|
|
(1,653 |
) |
| |
|
|
0 |
|
|
|
8,000 |
|
|
|
0 |
|
|
|
0 |
|
|
|
0 |
|
|
|
131 |
|
|
|
0 |
|
|
|
0 |
|
|
|
8,131 |
|
|
|
131 |
|
| |
|
|
18,890 |
|
|
|
0 |
|
|
|
(147 |
) |
|
|
336 |
|
|
|
0 |
|
|
|
(3,575 |
) |
|
|
0 |
|
|
|
(366 |
) |
|
|
15,138 |
|
|
|
(3,589 |
) |
| |
|
| |
|
|
24,255 |
|
|
|
94 |
|
|
|
0 |
|
|
|
0 |
|
|
|
0 |
|
|
|
(1,818 |
) |
|
|
0 |
|
|
|
0 |
|
|
|
22,531 |
|
|
|
(1,818 |
) |
| |
|
|
77,814 |
|
|
|
0 |
|
|
|
0 |
|
|
|
0 |
|
|
|
0 |
|
|
|
(6,850 |
) |
|
|
0 |
|
|
|
0 |
|
|
|
70,964 |
|
|
|
(6,850 |
) |
| |
|
|
7,091 |
|
|
|
46,003 |
|
|
|
(6,561 |
) |
|
|
0 |
|
|
|
(2,189 |
) |
|
|
(12,347 |
) |
|
|
0 |
|
|
|
0 |
|
|
|
31,997 |
|
|
|
(14,006 |
) |
| |
|
| |
|
|
7,254 |
|
|
|
15,392 |
|
|
|
0 |
|
|
|
0 |
|
|
|
0 |
|
|
|
185 |
|
|
|
0 |
|
|
|
0 |
|
|
|
22,831 |
|
|
|
186 |
|
|
| |
|
|
|
|
|
|
|
|
|
|
|
|
|
|
|
|
|
|
|
|
|
|
|
|
|
|
|
|
|
|
|
|
|
|
|
|
|
|
|
|
| |
$ |
409,017 |
|
|
$ |
205,220 |
|
|
$ |
(201,288 |
) |
|
$ |
857 |
|
|
$ |
(20,345 |
) |
|
$ |
15,518 |
|
|
$ |
11,827 |
|
|
$ |
(520 |
) |
|
$ |
420,286 |
|
|
$ |
(13,777 |
) |
|
| |
|
|
|
|
|
|
|
|
|
|
|
|
|
|
|
|
|
|
|
|
|
|
|
|
|
|
|
|
|
|
|
|
|
|
|
|
|
|
|
|
Investments in Affiliates |
|
| |
|
Affiliated Investments (4) |
|
|
41,407 |
|
|
|
0 |
|
|
|
(19,654 |
) |
|
|
0 |
|
|
|
0 |
|
|
|
243 |
|
|
|
0 |
|
|
|
0 |
|
|
|
21,996 |
|
|
|
(34 |
) |
|
| |
|
|
|
|
|
|
|
|
|
|
|
|
|
|
|
|
|
|
|
|
|
|
|
|
|
|
|
|
|
|
|
|
|
|
|
|
|
|
|
|
|
|
|
|
|
|
|
|
|
| |
| |
|
$ |
450,424 |
|
|
$ |
205,220 |
|
|
$ |
(220,942 |
) |
|
$ |
857 |
|
|
$ |
(20,345 |
) |
|
$ |
15,761 |
|
|
$ |
11,827 |
|
|
$ |
(520 |
) |
|
$ |
442,282 |
|
|
$ |
(13,811 |
) |
|
| |
|
|
|
|
|
|
|
|
|
|
|
|
|
|
|
|
|
|
|
|
|
|
|
|
|
|
|
|
|
|
|
|
|
|
|
|
|
|
|
The following is a summary of significant unobservable inputs used in the fair valuations of assets and liabilities categorized within Level 3 of the fair value hierarchy:
|
|
|
|
|
|
|
|
|
|
|
|
|
|
|
|
|
|
| |
|
|
Ending
Balance
at 06/30/2025 |
|
|
|
|
|
|
|
|
(% Unless Noted Otherwise) |
|
| |
|
|
|
|
|
|
|
Investments in Securities, at Value |
|
Loan Participations and Assignments |
|
$ |
32,503 |
|
|
|
|
|
|
X |
|
|
16.470 |
|
|
|
— |
|
|
| |
|
85,619 |
|
|
|
|
|
|
| |
|
6.182-11.518 |
|
|
|
7.996 |
|
|
| |
|
7,534 |
|
|
Discounted Cash Flow / Indicative Market Quotation |
|
Discount Rate / Broker Quote |
|
%/% |
|
|
7.160/90.000 |
|
|
|
— |
|
|
| |
|
34,488 |
|
|
Indicative Market Quotation |
|
|
|
| |
|
|
|
|
|
97.648 |
|
|
| |
|
5,502 |
|
|
|
|
|
|
| |
|
100.000 |
|
|
|
— |
|
|
| |
|
11,158 |
|
|
|
|
|
|
| |
|
99.000-100.000 |
|
|
|
99.627 |
|
|
| |
|
4,747 |
|
|
|
|
|
|
| |
|
101.000 |
|
|
|
— |
|
|
|
|
|
|
|
|
|
|
|
|
|
| |
| See Accompanying Notes |
|
|
ANNUAL REPORT |
|
|
| |
|
|
JUNE 30, 2025 |
|
|
115 |
|
|
|
|
|
|
| |
Consolidated Schedule of Investments |
|
PIMCO Dynamic Income Opportunities Fund |
|
|
|
June 30, 2025 |
|
|
|
|
|
|
|
|
|
|
|
|
|
|
|
|
|
|
|
|
| |
Category and Subcategory |
|
Ending
Balance
at 06/30/2025 |
|
|
Valuation
Technique |
|
Unobservable
Inputs |
|
|
|
|
(% Unless Noted Otherwise) |
|
| |
|
|
|
Input Value(s)
|
|
|
Weighted
Average |
|
| |
|
| |
|
$ |
224 |
|
|
|
|
|
|
|
|
| |
|
93.500 |
|
|
|
— |
|
| |
|
|
56,372 |
|
|
Comparable Companies / Discounted Cash Flow |
|
Revenue Multiple/Discount Rate |
|
|
X/% |
|
|
|
0.900/10.500 |
|
|
|
— |
|
|
| |
|
7,715 |
|
|
Indicative Market Quotation |
|
|
|
|
|
| |
|
58.500-75.500 |
|
|
|
59.515 |
|
Non-Agency Mortgage-Backed Securities |
|
|
208 |
|
|
|
|
|
|
|
|
| |
|
28.000-38.000 |
|
|
|
35.543 |
|
|
| |
|
400 |
|
|
Other Valuation Techniques (5) |
|
|
|
|
|
| |
|
— |
|
|
|
— |
|
| |
|
| |
|
|
2,224 |
|
|
|
|
|
|
|
|
| |
|
10.000-18.000 |
|
|
|
16.000 |
|
| |
|
|
8,131 |
|
|
|
|
|
|
|
|
| |
|
100.890 |
|
|
|
— |
|
| |
|
|
15,138 |
|
|
|
|
|
|
|
|
| |
|
12.000-38.000 |
|
|
|
19.264 |
|
| |
|
| |
|
|
22,497 |
|
|
|
|
|
|
|
X |
|
|
|
5.200 |
|
|
|
— |
|
|
| |
|
34 |
|
|
Indicative Market Quotation |
|
|
|
|
$ |
|
|
|
4.000 |
|
|
|
— |
|
| |
|
|
70,964 |
|
|
|
|
|
|
|
X |
|
|
|
16.470 |
|
|
|
— |
|
| |
|
|
31,997 |
|
|
Comparable Companies / Discounted Cash Flow |
|
Revenue Multiple/Discount Rate |
|
|
X/% |
|
|
|
0.900/10.500 |
|
|
|
— |
|
| |
|
| |
|
|
488 |
|
|
|
|
|
|
|
X |
|
|
|
11.250/10.000 |
|
|
|
— |
|
|
| |
|
8,107 |
|
|
|
|
|
|
|
|
| |
|
15.314 |
|
|
|
— |
|
|
| |
|
14,236 |
|
|
|
|
|
|
|
|
| |
|
4.335 |
|
|
|
— |
|
|
Investments in Affiliates |
|
| |
|
| |
|
|
21,996 |
|
|
|
|
Discount rate/Mortality assumption |
|
|
|
| |
|
15.323/2015 ANB VBT
Mortality Table |
|
|
|
— |
|
|
| |
|
|
|
|
| |
| |
|
|
| |
|
|
| |
|
| |
| |
|
$ |
442,282 |
|
|
| |
| |
|
|
| |
|
|
| |
|
| |
|
| |
|
|
|
|
| |
| |
|
|
| |
|
|
| |
|
| |
|
Any difference between Net Change in Unrealized Appreciation/(Depreciation) and Net Change in Unrealized Appreciation/(Depreciation) on Investments Held at June 30, 2025 may be due to an investment no longer held or categorized as Level 3 at period end. |
|
Sector type updated from Financials to Industrials since prior fiscal year end. |
|
Security type updated from Common Stocks to Preferred Securities Industrials since prior fiscal year end. |
|
Security type updated from Common Stock Securities to Common Stock Affiliated Investments. |
|
Includes valuation techniques not defined in the Notes to Financial Statements as securities valued using such techniques are not considered significant to the Fund. |
|
|
|
|
|
|
| |
116 |
|
PIMCO CLOSED-END FUNDS |
|
|
See Accompanying Notes |
|
|
|
|
|
|
|
| |
Consolidated Schedule of Investments |
|
PIMCO Dynamic Income Strategy Fund |
|
|
|
June 30, 2025 |
(Amounts in thousands*, except number of shares, contracts, units and ounces, if any)
|
|
|
|
|
|
|
|
|
|
|
|
| |
| |
|
|
|
PRINCIPAL
AMOUNT
(000S) |
|
|
|
|
MARKET
VALUE
(000S) |
|
INVESTMENTS IN SECURITIES 99.2% |
|
|
| |
LOAN PARTICIPATIONS AND ASSIGNMENTS 20.0% |
|
|
| |
|
7.827% (TSFR1M + 3.500%) due 08/17/2028 ~ |
|
$ |
|
|
2,978 |
|
|
$ |
|
|
2,988 |
|
|
Aligned Data Centers International LP |
|
| |
|
| |
|
8,000 |
|
|
| |
|
8,021 |
|
|
| |
|
7.779% (EUR003M + 5.500%) due 08/15/2028 ~ |
|
EUR |
|
|
100 |
|
|
| |
|
106 |
|
9.756% (TSFR3M + 5.500%) due 08/15/2028 ~ |
|
$ |
|
|
598 |
|
|
| |
|
544 |
|
|
| |
|
8.061% (TSFR1M + 3.750%) due 07/09/2031 ~ |
|
| |
|
4,960 |
|
|
| |
|
4,954 |
|
|
Aspire Bakeries Holdings LLC |
|
8.572% (TSFR1M + 4.250%) due 12/23/2030 ~ |
|
| |
|
990 |
|
|
| |
|
995 |
|
|
| |
|
| |
|
| |
|
3,300 |
|
|
| |
|
3,210 |
|
|
| |
|
9.316% (TSFR1M + 5.000%) due 08/31/2028 «~ |
|
| |
|
4,467 |
|
|
| |
|
4,482 |
|
|
Beach Acquisition Bidco LLC |
|
| |
|
| |
|
700 |
|
|
| |
|
704 |
|
|
| |
|
8.077% (TSFR1M + 3.750%) due 12/29/2028 ~ |
|
| |
|
2,985 |
|
|
| |
|
2,829 |
|
|
| |
|
7.546% (TSFR3M + 3.250%) due 07/06/2029 ~ |
|
| |
|
7,059 |
|
|
| |
|
5,913 |
|
|
| |
|
6.827% (TSFR1M + 2.500%) due 10/25/2027 ~ |
|
| |
|
2,955 |
|
|
| |
|
2,969 |
|
|
| |
|
| |
|
| |
|
2,900 |
|
|
| |
|
2,933 |
|
|
| |
|
TBD% (EUR012M + 0.000%) due 03/28/2026 ~ |
|
EUR |
|
|
1,025 |
|
|
| |
|
1,436 |
|
TBD% - 1.138% due 10/16/2031 ~ |
|
| |
|
565 |
|
|
| |
|
792 |
|
|
CoreWeave Compute Acquisition Co. LLC |
|
TBD% (TSFR3M + 6.000%) due 05/16/2029 «~µ |
|
$ |
|
|
5,400 |
|
|
| |
|
5,527 |
|
|
| |
|
7.074% (TSFR1M + 2.750%) due 05/01/2031 ~ |
|
| |
|
2,963 |
|
|
| |
|
2,952 |
|
|
| |
|
TBD% - 1.000% due 01/03/2031 «µ |
|
| |
|
1,069 |
|
|
| |
|
1,080 |
|
10.000% - 1.000% (TSFR1M + 4.500%) due 01/03/2031 «~ |
|
| |
|
4,831 |
|
|
| |
|
4,879 |
|
|
| |
|
6.066% (TSFR1M + 1.750%) due 03/04/2032 ~ |
|
| |
|
200 |
|
|
| |
|
199 |
|
|
| |
|
| |
|
| |
|
2,273 |
|
|
| |
|
2,250 |
|
| |
|
| |
|
227 |
|
|
| |
|
225 |
|
|
| |
|
8.646% (TSFR3M + 4.250%) due 04/11/2031 ~ |
|
| |
|
2,374 |
|
|
| |
|
2,397 |
|
|
| |
|
7.927% (TSFR1M + 3.500%) due 02/10/2028 «~ |
|
| |
|
2,388 |
|
|
| |
|
1,838 |
|
|
| |
|
7.256% (TSFR3M + 3.000%) due 10/15/2031 ~(i) |
|
| |
|
2,990 |
|
|
| |
|
3,004 |
|
|
Fastlane Parent Co., Inc. |
|
8.796% (TSFR3M + 4.500%) due 09/29/2028 ~ |
|
| |
|
3,681 |
|
|
| |
|
3,399 |
|
|
Frontier Communications Corp. |
|
6.792% (TSFR6M + 2.500%) due 07/01/2031 ~ |
|
| |
|
2,687 |
|
|
| |
|
2,691 |
|
|
Gateway Casinos & Entertainment Ltd. |
|
10.563% (TSFR3M + 6.250%) due 12/18/2030 |
|
| |
|
2,646 |
|
|
| |
|
2,647 |
|
|
|
|
|
|
|
|
|
|
|
|
|
| |
| |
|
|
|
PRINCIPAL
AMOUNT
(000S) |
|
|
|
|
MARKET
VALUE
(000S) |
|
|
| |
|
6.783% (TSFR3M + 2.500%) due 07/28/2031 ~ |
|
$ |
|
|
3,980 |
|
|
$ |
|
|
3,992 |
|
|
| |
|
6.824% (TSFR3M + 2.500%) due 03/03/2032 ~ |
|
| |
|
2,700 |
|
|
| |
|
2,705 |
|
|
Global Medical Response, Inc. (9.079% Cash and 0.750% PIK) |
|
9.829% due 10/31/2028 (d) |
|
| |
|
2,375 |
|
|
| |
|
2,381 |
|
|
| |
|
8.561% (TSFR1M + 4.250%) due 12/04/2031 ~ |
|
| |
|
3,970 |
|
|
| |
|
3,994 |
|
|
| |
|
TBD% - 9.717% due 03/27/2032 « |
|
GBP |
|
|
3,865 |
|
|
| |
|
5,206 |
|
|
| |
|
7.327% (TSFR1M + 3.000%) due 12/31/2029 ~ |
|
$ |
|
|
3,283 |
|
|
| |
|
3,297 |
|
|
| |
|
7.052% (TSFR1M + 2.725%) due 10/11/2030 ~ |
|
| |
|
975 |
|
|
| |
|
979 |
|
|
| |
|
7.327% (TSFR1M + 3.000%) due 05/01/2031 ~ |
|
| |
|
7,955 |
|
|
| |
|
7,960 |
|
|
| |
|
8.577% (TSFR1M + 4.250%) due 03/27/2032 ~ |
|
| |
|
200 |
|
|
| |
|
202 |
|
|
| |
|
8.006% (TSFR3M + 3.750%) due 05/19/2031 ~ |
|
| |
|
6,633 |
|
|
| |
|
6,573 |
|
|
| |
|
7.327% (TSFR1M + 3.000%) due 03/28/2031 ~ |
|
| |
|
2,475 |
|
|
| |
|
2,483 |
|
|
| |
|
8.780% (TSFR3M + 4.500%) due 07/01/2031 ~ |
|
| |
|
4,975 |
|
|
| |
|
4,804 |
|
|
| |
|
| |
|
GBP |
|
|
5,000 |
|
|
| |
|
6,852 |
|
|
| |
|
8.177% (TSFR1M + 3.750%) due 02/01/2028 ~ |
|
$ |
|
|
2,760 |
|
|
| |
|
2,445 |
|
|
| |
|
6.827% (TSFR1M + 2.500%) due 02/21/2031 ~ |
|
| |
|
3,970 |
|
|
| |
|
3,988 |
|
|
| |
|
8.291% (TSFR3M + 3.750%) due 06/02/2028 ~ |
|
| |
|
4,949 |
|
|
| |
|
4,829 |
|
|
| |
|
6.980% (EUR003M + 5.000%) due 03/13/2030 ~ |
|
EUR |
|
|
4,700 |
|
|
| |
|
3,792 |
|
|
| |
|
6.546% (TSFR3M + 2.250%) due 03/31/2028 ~ |
|
$ |
|
|
3,950 |
|
|
| |
|
3,969 |
|
|
Project Alpha Intermediate Holding, Inc. |
|
7.546% (TSFR3M + 3.250%) due 10/26/2030 ~ |
|
| |
|
3,950 |
|
|
| |
|
3,973 |
|
|
Promotora de Informaciones SA |
|
7.594% (EUR003M + 5.470%) due 12/31/2029 ~ |
|
EUR |
|
|
3,198 |
|
|
| |
|
3,710 |
|
|
| |
|
| |
|
$ |
|
|
100 |
|
|
| |
|
100 |
|
TBD% (TSFR1M + 3.000%) due 08/31/2028 ~ |
|
| |
|
6,069 |
|
|
| |
|
6,080 |
|
|
| |
|
6.577% (TSFR1M + 2.250%) due 02/10/2032 ~ |
|
| |
|
1,696 |
|
|
| |
|
1,696 |
|
|
Raising Cane’s Restaurants LLC |
|
6.327% (TSFR1M + 2.000%) due 09/18/2031 ~ |
|
| |
|
2,992 |
|
|
| |
|
3,014 |
|
|
Raven Acquisition Holdings LLC |
|
TBD% - 3.250% due 11/19/2031 µ |
|
| |
|
193 |
|
|
| |
|
193 |
|
TBD% - 3.250% (TSFR1M + 3.250%) due 11/19/2031 ~ |
|
| |
|
2,700 |
|
|
| |
|
2,701 |
|
|
| |
|
9.780% (TSFR3M + 5.500%) due 03/29/2030 ~ |
|
| |
|
1,980 |
|
|
| |
|
1,875 |
|
|
|
|
|
|
|
|
|
|
|
|
|
| |
| |
|
|
|
PRINCIPAL
AMOUNT
(000S) |
|
|
|
|
MARKET
VALUE
(000S) |
|
|
| |
|
| |
|
$ |
|
|
1,000 |
|
|
$ |
|
|
1,000 |
|
|
Specialty Building Products Holdings LLC |
|
8.177% (TSFR1M + 3.750%) due 10/15/2028 ~ |
|
| |
|
2,900 |
|
|
| |
|
2,779 |
|
|
| |
|
TBD% - 0.500% due 01/30/2032 «µ |
|
| |
|
458 |
|
|
| |
|
450 |
|
TBD% - 0.500% (JY0003M + 5.250%) due 01/30/2032 «~ |
|
JPY |
|
|
39,364 |
|
|
| |
|
268 |
|
TBD% - 0.500% (CDOR03 + 5.000%) due 01/30/2032 «~ |
|
CAD |
|
|
368 |
|
|
| |
|
265 |
|
TBD% - 0.500% (TSFR6M + 5.000%) due 01/30/2032 «~ |
|
$ |
|
|
2,033 |
|
|
| |
|
1,996 |
|
|
| |
|
8.296% (TSFR3M + 4.000%) due 09/27/2030 ~ |
|
| |
|
4,950 |
|
|
| |
|
4,908 |
|
|
Steenbok Lux Finco 2 SARL |
|
| |
|
EUR |
|
|
10,084 |
|
|
| |
|
4,295 |
|
|
Stonepeak Nile Parent LLC |
|
9.250% (PRIME + 1.750%) due 04/09/2032 ~ |
|
$ |
|
|
2,100 |
|
|
| |
|
2,109 |
|
|
| |
|
7.730% (EUR003M + 5.750%) due 08/14/2029 «~ |
|
EUR |
|
|
3,338 |
|
|
| |
|
3,952 |
|
|
| |
|
11.296% (TSFR3M + 7.000%) due 05/13/2027 ~ |
|
$ |
|
|
5,522 |
|
|
| |
|
5,257 |
|
|
| |
|
9.077% (TSFR1M + 4.750%) due 03/13/2031 ~ |
|
| |
|
2,271 |
|
|
| |
|
2,296 |
|
|
| |
|
7.677% (TSFR1M + 3.250%) due 06/29/2028 ~ |
|
| |
|
4,037 |
|
|
| |
|
3,636 |
|
|
Tidal Waste & Recycling Holdings LLC |
|
7.296% (TSFR3M + 3.000%) due 10/24/2031 ~ |
|
| |
|
2,893 |
|
|
| |
|
2,913 |
|
|
Truist Insurance Holdings LLC |
|
7.046% (TSFR3M + 2.750%) due 05/06/2031 ~ |
|
| |
|
3,700 |
|
|
| |
|
3,706 |
|
|
| |
|
10.927% (TSFR1M + 6.500%) due 10/26/2029 ~ |
|
| |
|
10,066 |
|
|
| |
|
9,847 |
|
|
| |
|
9.441% (TSFR1M + 5.000%) due 06/20/2028 ~ |
|
| |
|
4,346 |
|
|
| |
|
4,125 |
|
|
| |
|
| |
|
HKD |
|
|
26,372 |
|
|
| |
|
3,401 |
|
|
| |
|
7.830% (TSFR3M + 3.500%) due 08/26/2031 ~ |
|
$ |
|
|
6,284 |
|
|
| |
|
6,291 |
|
|
Vista Management Holding, Inc. |
|
8.048% (TSFR3M + 3.750%) due 04/01/2031 ~ |
|
| |
|
2,000 |
|
|
| |
|
2,008 |
|
|
WaterBridge Midstream Operating LLC |
|
8.300% (TSFR3M + 4.000%) due 05/10/2029 ~ |
|
| |
|
2,973 |
|
|
| |
|
2,976 |
|
|
WIN Waste Innovations Holdings, Inc. |
|
8.191% (TSFR1M + 3.750%) due 03/24/2028 ~ |
|
| |
|
1,496 |
|
|
| |
|
1,506 |
|
|
| |
| |
|
|
| |
| |
|
|
|
Total Loan Participations and Assignments (Cost $241,855) |
|
|
|
|
|
| |
|
|
|
|
| |
CORPORATE BONDS & NOTES 22.7% |
|
|
| |
|
|
|
| |
|
6.150% due 10/01/2034 (i)(l) |
|
| |
|
3,600 |
|
|
| |
|
3,600 |
|
|
Burford Capital Global Finance LLC |
|
9.250% due 07/01/2031 (l) |
|
| |
|
4,100 |
|
|
| |
|
4,320 |
|
|
| |
|
| |
|
| |
|
1,900 |
|
|
| |
|
1,934 |
|
|
| |
|
6.000% due 01/23/2030 (h) |
|
| |
|
300 |
|
|
| |
|
310 |
|
|
|
|
|
|
|
|
|
|
|
|
|
| |
| See Accompanying Notes |
|
|
ANNUAL REPORT |
|
|
| |
|
|
JUNE 30, 2025 |
|
|
117 |
|
|
|
|
|
|
| |
Consolidated Schedule of Investments |
|
PIMCO Dynamic Income Strategy Fund |
|
|
|
|
|
|
|
|
|
|
|
|
|
|
|
|
| |
| |
|
|
|
PRINCIPAL
AMOUNT
(000S) |
|
|
|
|
MARKET
VALUE
(000S) |
|
|
Credit Opportunities Partners LLC |
|
6.740% due 03/20/2030 «(j) |
|
$ |
|
|
300 |
|
|
$ |
|
|
303 |
|
|
Fortress Transportation & Infrastructure Investors LLC |
|
7.000% due 05/01/2031 (l) |
|
| |
|
5,000 |
|
|
| |
|
5,181 |
|
|
| |
|
| |
|
| |
|
650 |
|
|
| |
|
679 |
|
| |
|
| |
|
650 |
|
|
| |
|
646 |
|
|
Ladder Capital Finance Holdings LLLP |
|
7.000% due 07/15/2031 (l) |
|
| |
|
3,000 |
|
|
| |
|
3,139 |
|
|
MPT Operating Partnership LP |
|
8.500% due 02/15/2032 (h) |
|
| |
|
600 |
|
|
| |
|
628 |
|
|
Panama Infrastructure Receivable Purchaser PLC |
|
0.000% due 04/05/2032 (g)(l) |
|
| |
|
8,298 |
|
|
| |
|
5,905 |
|
|
Piedmont Operating Partnership LP |
|
3.150% due 08/15/2030 (l) |
|
| |
|
3,600 |
|
|
| |
|
3,232 |
|
6.875% due 07/15/2029 (l) |
|
| |
|
4,000 |
|
|
| |
|
4,215 |
|
|
Sixth Street Lending Partners |
|
6.125% due 07/15/2030 (l) |
|
| |
|
3,600 |
|
|
| |
|
3,668 |
|
|
Starwood Property Trust, Inc. |
|
7.250% due 04/01/2029 (l) |
|
| |
|
2,700 |
|
|
| |
|
2,843 |
|
|
| |
|
| |
|
GBP |
|
|
331 |
|
|
| |
|
425 |
|
|
| |
|
| |
|
$ |
|
|
250 |
|
|
| |
|
250 |
|
|
| |
|
| |
|
| |
|
250 |
|
|
| |
|
254 |
|
| |
|
| |
|
1,000 |
|
|
| |
|
1,058 |
|
| |
|
| |
|
1,000 |
|
|
| |
|
1,052 |
|
|
| |
| |
|
|
| |
| |
|
|
|
|
| |
| |
|
|
| |
| |
|
43,642 |
|
|
| |
| |
|
|
| |
| |
|
|
|
|
| |
|
|
|
| |
|
4.875% due 07/15/2032 (l) |
|
| |
|
5,300 |
|
|
| |
|
5,091 |
|
|
| |
|
| |
|
EUR |
|
|
1,800 |
|
|
| |
|
764 |
|
| |
|
$ |
|
|
2,400 |
|
|
| |
|
836 |
|
|
| |
|
| |
|
| |
|
2,500 |
|
|
| |
|
2,075 |
|
|
| |
|
7.250% due 04/01/2030 (m) |
|
| |
|
1,000 |
|
|
| |
|
1,033 |
|
|
Ascent Resources Utica Holdings LLC |
|
6.625% due 10/15/2032 (l) |
|
| |
|
4,500 |
|
|
| |
|
4,583 |
|
|
| |
|
| |
|
| |
|
500 |
|
|
| |
|
515 |
|
| |
|
| |
|
400 |
|
|
| |
|
413 |
|
|
| |
|
5.250% due 09/15/2027 (l) |
|
| |
|
3,200 |
|
|
| |
|
2,917 |
|
|
| |
|
| |
|
GBP |
|
|
4,500 |
|
|
| |
|
6,415 |
|
|
Caesars Entertainment, Inc. |
|
6.500% due 02/15/2032 (l) |
|
$ |
|
|
3,000 |
|
|
| |
|
3,080 |
|
|
Champion Iron Canada, Inc. |
|
7.875% due 07/15/2032 (c) |
|
| |
|
3,500 |
|
|
| |
|
3,551 |
|
|
Cheplapharm Arzneimittel GmbH |
|
7.125% due 06/15/2031 (c) |
|
EUR |
|
|
700 |
|
|
| |
|
831 |
|
|
| |
|
| |
|
$ |
|
|
1,400 |
|
|
| |
|
1,431 |
|
|
Clydesdale Acquisition Holdings, Inc. |
|
| |
|
| |
|
1,000 |
|
|
| |
|
1,027 |
|
8.750% due 04/15/2030 (l) |
|
| |
|
5,500 |
|
|
| |
|
5,629 |
|
|
Community Health Systems, Inc. |
|
5.625% due 03/15/2027 (l) |
|
| |
|
5,700 |
|
|
| |
|
5,618 |
|
|
| |
|
6.500% due 01/10/2031 (c) |
|
| |
|
200 |
|
|
| |
|
202 |
|
|
| |
|
7.750% due 11/15/2029 (l) |
|
| |
|
3,600 |
|
|
| |
|
3,650 |
|
|
Diversified Gas & Oil Corp. |
|
| |
|
| |
|
2,625 |
|
|
| |
|
2,579 |
|
|
| |
|
8.625% due 04/15/2029 (l) |
|
| |
|
2,500 |
|
|
| |
|
2,618 |
|
|
| |
|
| |
|
EUR |
|
|
800 |
|
|
| |
|
931 |
|
|
|
|
|
|
|
|
|
|
|
|
|
| |
| |
|
|
|
PRINCIPAL
AMOUNT
(000S) |
|
|
|
|
MARKET
VALUE
(000S) |
|
| |
|
EUR |
|
|
3,500 |
|
|
$ |
|
|
3,982 |
|
| |
|
| |
|
1,800 |
|
|
| |
|
2,032 |
|
|
| |
|
| |
|
| |
|
2,500 |
|
|
| |
|
2,994 |
|
|
| |
|
| |
|
$ |
|
|
2,700 |
|
|
| |
|
2,903 |
|
|
| |
|
4.625% due 05/01/2029 (l) |
|
| |
|
4,300 |
|
|
| |
|
4,313 |
|
|
Howard Midstream Energy Partners LLC |
|
7.375% due 07/15/2032 (l) |
|
| |
|
3,700 |
|
|
| |
|
3,894 |
|
8.875% due 07/15/2028 (l) |
|
| |
|
800 |
|
|
| |
|
840 |
|
|
| |
|
| |
|
| |
|
3,900 |
|
|
| |
|
3,722 |
|
|
| |
|
6.500% due 04/01/2033 (l) |
|
| |
|
5,100 |
|
|
| |
|
5,321 |
|
|
Intelligent Packaging Ltd. Finco, Inc. |
|
| |
|
| |
|
4,000 |
|
|
| |
|
4,000 |
|
|
IRB Infrastructure Developers Ltd. |
|
| |
|
| |
|
2,400 |
|
|
| |
|
2,409 |
|
|
| |
|
9.875% due 09/20/2031 (l) |
|
| |
|
5,700 |
|
|
| |
|
5,549 |
|
|
| |
|
4.750% due 09/30/2028 (l) |
|
| |
|
1,270 |
|
|
| |
|
1,223 |
|
|
| |
|
7.250% due 02/15/2029 (l) |
|
| |
|
2,000 |
|
|
| |
|
2,070 |
|
|
Kraken Oil & Gas Partners LLC |
|
7.625% due 08/15/2029 (l) |
|
| |
|
5,700 |
|
|
| |
|
5,605 |
|
|
| |
|
6.250% due 04/15/2033 (l) |
|
| |
|
4,000 |
|
|
| |
|
3,980 |
|
|
Miter Brands Acquisition Holdco, Inc. |
|
6.750% due 04/01/2032 (l) |
|
| |
|
2,500 |
|
|
| |
|
2,566 |
|
|
| |
|
| |
|
| |
|
3,484 |
|
|
| |
|
3,371 |
|
|
Newfold Digital Holdings Group, Inc. |
|
| |
|
| |
|
500 |
|
|
| |
|
293 |
|
| |
|
| |
|
3,800 |
|
|
| |
|
2,869 |
|
|
| |
|
8.000% due 04/15/2030 (l) |
|
| |
|
5,600 |
|
|
| |
|
5,707 |
|
|
| |
|
| |
|
| |
|
3,200 |
|
|
| |
|
3,123 |
|
|
Primo Water Holdings, Inc. |
|
6.250% due 04/01/2029 (l) |
|
| |
|
2,500 |
|
|
| |
|
2,520 |
|
|
| |
|
| |
|
| |
|
2,200 |
|
|
| |
|
2,264 |
|
|
Raising Cane’s Restaurants LLC |
|
| |
|
| |
|
3,000 |
|
|
| |
|
3,170 |
|
|
| |
|
8.500% due 02/15/2030 (l) |
|
| |
|
5,000 |
|
|
| |
|
5,025 |
|
|
Raven Acquisition Holdings LLC |
|
| |
|
| |
|
2,100 |
|
|
| |
|
2,105 |
|
|
Sitio Royalties Operating Partnership LP |
|
7.875% due 11/01/2028 (h)(l) |
|
| |
|
6,000 |
|
|
| |
|
6,286 |
|
|
| |
|
| |
|
| |
|
600 |
|
|
| |
|
616 |
|
|
Stonepeak Nile Parent LLC |
|
| |
|
| |
|
500 |
|
|
| |
|
530 |
|
|
Thames Water Super Senior Issuer PLC |
|
| |
|
GBP |
|
|
329 |
|
|
| |
|
498 |
|
|
Thames Water Utilities Finance PLC |
|
| |
|
EUR |
|
|
2,100 |
|
|
| |
|
1,596 |
|
| |
|
GBP |
|
|
1,430 |
|
|
| |
|
1,281 |
|
| |
|
EUR |
|
|
3,900 |
|
|
| |
|
3,007 |
|
|
Thames Water Utilities Ltd. |
|
0.000% due 03/22/2027 (g) |
|
GBP |
|
|
49 |
|
|
| |
|
56 |
|
|
| |
|
9.125% due 07/15/2030 (c) |
|
$ |
|
|
300 |
|
|
| |
|
309 |
|
|
| |
|
| |
|
| |
|
700 |
|
|
| |
|
716 |
|
|
| |
|
8.000% due 02/01/2027 (l) |
|
| |
|
4,500 |
|
|
| |
|
4,436 |
|
|
| |
|
| |
|
EUR |
|
|
5,400 |
|
|
| |
|
5,741 |
|
|
|
|
|
|
|
|
|
|
|
|
|
| |
| |
|
|
|
PRINCIPAL
AMOUNT
(000S) |
|
|
|
|
MARKET
VALUE
(000S) |
|
|
| |
|
6.875% due 02/01/2031 (l) |
|
$ |
|
|
4,000 |
|
|
$ |
|
|
4,153 |
|
|
Univision Communications, Inc. |
|
| |
|
| |
|
3,000 |
|
|
| |
|
3,006 |
|
|
| |
|
8.375% due 04/30/2030 (l) |
|
| |
|
7,850 |
|
|
| |
|
8,060 |
|
|
| |
|
3.625% due 06/15/2031 (l) |
|
| |
|
4,200 |
|
|
| |
|
3,806 |
|
|
| |
|
| |
|
| |
|
2,700 |
|
|
| |
|
2,910 |
|
|
Vmed O2 U.K. Financing PLC |
|
7.750% due 04/15/2032 (l) |
|
| |
|
7,600 |
|
|
| |
|
7,907 |
|
|
| |
|
| |
|
| |
|
400 |
|
|
| |
|
416 |
|
|
Weatherford International Ltd. |
|
| |
|
| |
|
100 |
|
|
| |
|
103 |
|
|
| |
|
| |
|
| |
|
3,700 |
|
|
| |
|
3,276 |
|
|
Yorkshire Water Finance PLC |
|
| |
|
GBP |
|
|
2,000 |
|
|
| |
|
2,732 |
|
|
| |
| |
|
|
| |
| |
|
|
|
|
| |
| |
|
|
| |
| |
|
205,080 |
|
|
| |
| |
|
|
| |
| |
|
|
|
|
| |
|
|
|
Anglian Water Services Financing PLC |
|
| |
|
| |
|
2,000 |
|
|
| |
|
2,863 |
|
|
| |
|
| |
|
$ |
|
|
600 |
|
|
| |
|
610 |
|
|
Mong Duong Finance Holdings BV |
|
| |
|
| |
|
2,236 |
|
|
| |
|
2,186 |
|
|
Northumbrian Water Finance PLC |
|
| |
|
GBP |
|
|
2,000 |
|
|
| |
|
2,644 |
|
|
| |
|
7.375% due 09/15/2055 •(l) |
|
$ |
|
|
3,500 |
|
|
| |
|
3,647 |
|
|
| |
|
6.690% due 06/15/2055 «(j) |
|
| |
|
8,000 |
|
|
| |
|
7,905 |
|
|
Yinson Production Financial Services Pte. Ltd. |
|
| |
|
| |
|
3,000 |
|
|
| |
|
3,119 |
|
|
| |
| |
|
|
| |
| |
|
|
|
|
| |
| |
|
|
| |
| |
|
22,974 |
|
|
| |
| |
|
|
| |
| |
|
|
|
Total Corporate Bonds & Notes (Cost $264,802) |
|
|
|
|
|
| |
|
|
|
|
| |
MUNICIPAL BONDS & NOTES 0.0% |
|
|
| |
|
|
|
Detroit, Michigan General Obligation Bonds, Series 2014 |
|
| |
|
| |
|
497 |
|
|
| |
|
389 |
|
|
| |
| |
|
|
| |
| |
|
|
|
Total Municipal Bonds & Notes (Cost $398) |
|
|
|
|
|
| |
|
|
|
|
| |
U.S. GOVERNMENT AGENCIES 2.2% |
|
|
| |
|
0.000% due 08/25/2056 (b)(g) |
|
| |
|
3,185 |
|
|
| |
|
500 |
|
0.075% due 08/25/2056 ~(a) |
|
| |
|
126,163 |
|
|
| |
|
411 |
|
1.476% due 08/25/2056 ~(a) |
|
| |
|
32,611 |
|
|
| |
|
3,880 |
|
| |
|
| |
|
4,898 |
|
|
| |
|
2,192 |
|
| |
|
| |
|
17,330 |
|
|
| |
|
7,617 |
|
| |
|
| |
|
10,425 |
|
|
| |
|
5,194 |
|
| |
|
| |
|
10,211 |
|
|
| |
|
4,861 |
|
| |
|
| |
|
2,502 |
|
|
| |
|
1,109 |
|
| |
|
| |
|
591 |
|
|
| |
|
344 |
|
|
| |
| |
|
|
| |
| |
|
|
|
Total U.S. Government Agencies (Cost $25,345) |
|
|
|
|
|
| |
|
|
|
|
| |
NON-AGENCY MORTGAGE-BACKED SECURITIES 9.5% |
|
|
| |
|
| |
|
| |
|
238 |
|
|
| |
|
238 |
|
|
American Home Mortgage Assets Trust |
|
| |
|
| |
|
2,581 |
|
|
| |
|
2,304 |
|
|
| |
|
4.800% due 11/25/2067 þ(l) |
|
| |
|
853 |
|
|
| |
|
848 |
|
|
|
|
|
|
|
| |
118 |
|
PIMCO CLOSED-END FUNDS |
|
|
See Accompanying Notes |
|
|
|
|
|
|
|
|
|
|
|
|
|
| |
| |
|
|
|
PRINCIPAL
AMOUNT
(000S) |
|
|
|
|
MARKET
VALUE
(000S) |
|
|
APS Resecuritization Trust |
|
| |
|
$ |
|
|
6,722 |
|
|
$ |
|
|
1,913 |
|
|
| |
|
| |
|
| |
|
1,161 |
|
|
| |
|
773 |
|
|
Bear Stearns Mortgage Funding Trust |
|
4.794% due 10/25/2036 •(l) |
|
| |
|
14,052 |
|
|
| |
|
12,509 |
|
|
BX Commercial Mortgage Trust |
|
7.352% due 01/17/2039 •(l) |
|
| |
|
3,000 |
|
|
| |
|
2,933 |
|
|
| |
|
7.029% due 05/15/2035 •(l) |
|
| |
|
5,000 |
|
|
| |
|
4,941 |
|
|
ChaseFlex Trust Multi-Class Mortgage Pass-Through Certificates |
|
| |
|
| |
|
3,332 |
|
|
| |
|
2,784 |
|
| |
|
| |
|
1,480 |
|
|
| |
|
1,255 |
|
|
| |
|
| |
|
| |
|
276 |
|
|
| |
|
275 |
|
|
Citigroup Mortgage Loan Trust, Inc. |
|
3.000% due 09/25/2064 ~(l) |
|
| |
|
19,267 |
|
|
| |
|
17,464 |
|
|
Colony Mortgage Capital Ltd. |
|
| |
|
| |
|
3,115 |
|
|
| |
|
3,034 |
|
7.397% due 11/15/2038 •(l) |
|
| |
|
2,500 |
|
|
| |
|
2,271 |
|
|
Countrywide Alternative Loan Trust |
|
| |
|
| |
|
1,486 |
|
|
| |
|
1,158 |
|
| |
|
| |
|
981 |
|
|
| |
|
582 |
|
|
Credit Suisse Mortgage Capital Mortgage-Backed Trust |
|
1.115% due 01/25/2060 ~(l) |
|
| |
|
2,537 |
|
|
| |
|
2,146 |
|
| |
|
| |
|
5,200 |
|
|
| |
|
874 |
|
|
CSAB Mortgage-Backed Trust |
|
| |
|
| |
|
2,749 |
|
|
| |
|
770 |
|
|
| |
|
4.250% due 05/25/2067 ~(l) |
|
| |
|
877 |
|
|
| |
|
834 |
|
|
GS Mortgage Securities Corp. Trust |
|
| |
|
| |
|
998 |
|
|
| |
|
670 |
|
|
GS Mortgage-Backed Securities Trust |
|
3.750% due 10/25/2057 (l) |
|
| |
|
2,126 |
|
|
| |
|
2,077 |
|
|
HarborView Mortgage Loan Trust |
|
4.952% due 03/19/2036 •(l) |
|
| |
|
19,529 |
|
|
| |
|
13,053 |
|
|
JP Morgan Chase Commercial Mortgage Securities Trust |
|
| |
|
| |
|
976 |
|
|
| |
|
966 |
|
| |
|
| |
|
5,000 |
|
|
| |
|
4,555 |
|
| |
|
| |
|
5,000 |
|
|
| |
|
3,328 |
|
7.609% due 02/15/2035 •(l) |
|
| |
|
987 |
|
|
| |
|
941 |
|
|
| |
|
| |
|
| |
|
1,827 |
|
|
| |
|
1,610 |
|
|
MASTR Adjustable Rate Mortgages Trust |
|
| |
|
| |
|
4,838 |
|
|
| |
|
3,604 |
|
| |
|
| |
|
768 |
|
|
| |
|
307 |
|
|
| |
|
6.105% due 12/25/2068 þ(l) |
|
| |
|
659 |
|
|
| |
|
663 |
|
|
Mill City Mortgage Loan Trust |
|
3.250% due 08/25/2059 ~(l) |
|
| |
|
2,850 |
|
|
| |
|
2,448 |
|
3.750% due 05/25/2058 ~(l) |
|
| |
|
2,596 |
|
|
| |
|
2,282 |
|
|
Morgan Stanley Mortgage Loan Trust |
|
| |
|
| |
|
2,564 |
|
|
| |
|
432 |
|
|
Nomura Asset Acceptance Corp. Alternative Loan Trust |
|
| |
|
| |
|
7,924 |
|
|
| |
|
2,096 |
|
|
| |
|
6.465% due 10/25/2063 þ(l) |
|
| |
|
677 |
|
|
| |
|
683 |
|
|
| |
|
7.401% due 11/15/2040 •(l) |
|
| |
|
129 |
|
|
| |
|
129 |
|
|
| |
|
7.225% due 11/25/2058 þ(l) |
|
| |
|
723 |
|
|
| |
|
734 |
|
|
| |
|
4.000% due 11/25/2053 þ(l) |
|
| |
|
368 |
|
|
| |
|
361 |
|
|
| |
|
6.221% due 11/25/2068 þ(l) |
|
| |
|
764 |
|
|
| |
|
769 |
|
|
Residential Accredit Loans, Inc. Trust |
|
| |
|
| |
|
2,338 |
|
|
| |
|
1,897 |
|
| |
|
| |
|
4,348 |
|
|
| |
|
3,659 |
|
|
Residential Asset Securitization Trust |
|
| |
|
| |
|
5,448 |
|
|
| |
|
2,494 |
|
| |
|
| |
|
996 |
|
|
| |
|
426 |
|
|
|
|
|
|
|
|
|
|
|
|
|
| |
| |
|
|
|
PRINCIPAL
AMOUNT
(000S) |
|
|
|
|
MARKET
VALUE
(000S) |
|
|
SMRT Commercial Mortgage Trust |
|
5.312% due 01/15/2039 •(l) |
|
$ |
|
|
500 |
|
|
$ |
|
|
498 |
|
|
Towd Point Mortgage Trust |
|
3.000% due 06/25/2058 ~(l) |
|
| |
|
1,607 |
|
|
| |
|
1,524 |
|
|
Verus Securitization Trust |
|
6.259% due 12/25/2068 þ(l) |
|
| |
|
614 |
|
|
| |
|
620 |
|
6.876% due 11/25/2068 ~(l) |
|
| |
|
780 |
|
|
| |
|
792 |
|
|
| |
| |
|
|
| |
| |
|
|
|
Total Non-Agency Mortgage-Backed Securities (Cost $114,986) |
|
|
|
|
|
| |
|
|
|
|
| |
ASSET-BACKED SECURITIES 25.2% |
|
|
| |
|
|
|
| |
|
| |
|
| |
|
500 |
|
|
| |
|
498 |
|
|
| |
|
| |
|
| |
|
500 |
|
|
| |
|
500 |
|
6.055% due 03/19/2039 •(l) |
|
| |
|
9,000 |
|
|
| |
|
9,038 |
|
|
| |
|
6.144% due 09/17/2039 •(l) |
|
| |
|
441 |
|
|
| |
|
442 |
|
|
| |
| |
|
|
| |
| |
|
|
|
|
| |
| |
|
|
| |
| |
|
10,478 |
|
|
| |
| |
|
|
| |
| |
|
|
|
|
| |
|
|
|
Aames Mortgage Investment Trust |
|
7.134% due 01/25/2035 •(l) |
|
| |
|
3,500 |
|
|
| |
|
2,708 |
|
|
ACE Securities Corp. Home Equity Loan Trust |
|
| |
|
| |
|
2,105 |
|
|
| |
|
668 |
|
4.834% due 12/25/2036 •(l) |
|
| |
|
17,203 |
|
|
| |
|
4,307 |
|
| |
|
| |
|
1,553 |
|
|
| |
|
628 |
|
|
Bear Stearns Asset-Backed Securities Trust |
|
4.839% due 01/25/2037 •(l) |
|
| |
|
22,785 |
|
|
| |
|
21,494 |
|
4.944% due 10/25/2036 •(l) |
|
| |
|
3,264 |
|
|
| |
|
3,102 |
|
5.199% due 09/25/2035 •(l) |
|
| |
|
18,532 |
|
|
| |
|
17,558 |
|
|
Centex Home Equity Loan Trust |
|
4.989% due 06/25/2036 •(l) |
|
| |
|
17,000 |
|
|
| |
|
14,938 |
|
| |
|
| |
|
429 |
|
|
| |
|
426 |
|
|
| |
|
7.059% due 10/25/2037 •(l) |
|
| |
|
71,686 |
|
|
| |
|
69,421 |
|
|
Citigroup Mortgage Loan Trust |
|
| |
|
| |
|
2,496 |
|
|
| |
|
1,680 |
|
|
Citigroup Mortgage Loan Trust Asset-Backed Pass-Through Certificates |
|
| |
|
| |
|
1,894 |
|
|
| |
|
1,469 |
|
|
Countrywide Asset-Backed Certificates Trust |
|
3.387% due 04/25/2036 •(l) |
|
| |
|
7,200 |
|
|
| |
|
5,914 |
|
| |
|
| |
|
553 |
|
|
| |
|
538 |
|
|
Credit-Based Asset Servicing & Securitization LLC |
|
| |
|
| |
|
19 |
|
|
| |
|
16 |
|
|
| |
|
4.179% due 03/25/2036 ~(l) |
|
| |
|
4,858 |
|
|
| |
|
2,893 |
|
| |
|
| |
|
8,458 |
|
|
| |
|
1,525 |
|
4.794% due 12/25/2046 •(l) |
|
| |
|
12,619 |
|
|
| |
|
3,656 |
|
| |
|
| |
|
2,179 |
|
|
| |
|
847 |
|
4.914% due 10/25/2036 •(l) |
|
| |
|
12,639 |
|
|
| |
|
4,096 |
|
|
| |
|
5.054% due 12/25/2035 •(l) |
|
| |
|
4,280 |
|
|
| |
|
4,179 |
|
| |
|
| |
|
734 |
|
|
| |
|
667 |
|
|
| |
|
4.754% due 04/25/2036 •(l) |
|
| |
|
13,045 |
|
|
| |
|
9,697 |
|
5.004% due 02/25/2036 •(l) |
|
| |
|
9,042 |
|
|
| |
|
9,081 |
|
| |
|
| |
|
1,898 |
|
|
| |
|
1,852 |
|
|
| |
|
4.914% due 08/25/2036 •(l) |
|
| |
|
3,400 |
|
|
| |
|
3,347 |
|
|
HSI Asset Securitization Corp. Trust |
|
| |
|
| |
|
107 |
|
|
| |
|
70 |
|
|
JP Morgan Mortgage Acquisition Trust |
|
4.694% due 12/25/2036 •(l) |
|
| |
|
5,123 |
|
|
| |
|
3,212 |
|
| |
|
| |
|
3,406 |
|
|
| |
|
2,190 |
|
| |
|
| |
|
1,980 |
|
|
| |
|
1,190 |
|
5.829% due 07/25/2036 •(l) |
|
| |
|
5,000 |
|
|
| |
|
4,291 |
|
| |
|
| |
|
1,168 |
|
|
| |
|
691 |
|
|
Long Beach Mortgage Loan Trust |
|
| |
|
| |
|
1,639 |
|
|
| |
|
652 |
|
| |
|
| |
|
1,094 |
|
|
| |
|
1,070 |
|
|
|
|
|
|
|
|
|
|
|
|
|
| |
| |
|
|
|
PRINCIPAL
AMOUNT
(000S) |
|
|
|
|
MARKET
VALUE
(000S) |
|
|
Merrill Lynch First Franklin Mortgage Loan Trust |
|
| |
|
$ |
|
|
1,508 |
|
|
$ |
|
|
1,504 |
|
|
Merrill Lynch Mortgage Investors Trust |
|
6.309% due 04/25/2035 •(l) |
|
| |
|
1,286 |
|
|
| |
|
1,245 |
|
|
Morgan Stanley ABS Capital, Inc. Trust |
|
| |
|
| |
|
777 |
|
|
| |
|
267 |
|
| |
|
| |
|
1,741 |
|
|
| |
|
1,530 |
|
|
New Century Home Equity Loan Trust |
|
| |
|
| |
|
441 |
|
|
| |
|
442 |
|
|
NovaStar Mortgage Funding Trust |
|
| |
|
| |
|
4,695 |
|
|
| |
|
1,826 |
|
|
Park Place Securities, Inc. Asset-Backed Pass-Through Certificates |
|
5.394% due 08/25/2035 •(l) |
|
| |
|
5,619 |
|
|
| |
|
4,771 |
|
|
Popular ABS Mortgage Pass-Through Trust |
|
4.714% due 01/25/2037 •(l) |
|
| |
|
11,280 |
|
|
| |
|
9,293 |
|
|
Renaissance Home Equity Loan Trust |
|
| |
|
| |
|
1,239 |
|
|
| |
|
1,163 |
|
|
Residential Asset Securities Corp. Trust |
|
5.229% due 02/25/2036 •(l) |
|
| |
|
4,100 |
|
|
| |
|
3,315 |
|
| |
|
| |
|
2,097 |
|
|
| |
|
2,098 |
|
|
Saxon Asset Securities Trust |
|
| |
|
| |
|
503 |
|
|
| |
|
367 |
|
| |
|
| |
|
1,370 |
|
|
| |
|
1,331 |
|
|
Securitized Asset-Backed Receivables LLC Trust |
|
| |
|
| |
|
1,497 |
|
|
| |
|
998 |
|
|
Soundview Home Loan Trust |
|
| |
|
| |
|
1,302 |
|
|
| |
|
1,283 |
|
| |
|
| |
|
7,233 |
|
|
| |
|
1,968 |
|
| |
|
| |
|
256 |
|
|
| |
|
243 |
|
5.384% due 10/25/2037 •(l) |
|
| |
|
7,538 |
|
|
| |
|
5,816 |
|
|
Structured Asset Securities Corp. Mortgage Loan Trust |
|
| |
|
| |
|
100 |
|
|
| |
|
97 |
|
| |
|
| |
|
1,117 |
|
|
| |
|
1,069 |
|
| |
|
| |
|
1,004 |
|
|
| |
|
834 |
|
6.684% due 04/25/2031 •(l) |
|
| |
|
2,772 |
|
|
| |
|
2,792 |
|
7.809% due 11/25/2035 •(l) |
|
| |
|
8,316 |
|
|
| |
|
7,357 |
|
|
Wells Fargo Home Equity Asset-Backed Securities Trust |
|
| |
|
| |
|
1,686 |
|
|
| |
|
1,742 |
|
|
| |
| |
|
|
| |
| |
|
|
|
|
| |
| |
|
|
| |
| |
|
253,424 |
|
|
| |
| |
|
|
| |
| |
|
|
|
|
| |
HOME EQUITY SEQUENTIAL 0.3% |
|
|
Structured Asset Securities Corp. Mortgage Loan Trust |
|
4.754% due 10/25/2036 •(l) |
|
| |
|
3,806 |
|
|
| |
|
3,312 |
|
|
| |
| |
|
|
| |
| |
|
|
|
|
| |
WHOLE LOAN COLLATERAL 1.5% |
|
|
First Franklin Mortgage Loan Trust |
|
4.674% due 10/25/2036 •(l) |
|
| |
|
11,214 |
|
|
| |
|
7,257 |
|
| |
|
| |
|
1,500 |
|
|
| |
|
1,299 |
|
| |
|
| |
|
196 |
|
|
| |
|
173 |
|
|
Residential Asset Mortgage Products Trust |
|
| |
|
| |
|
288 |
|
|
| |
|
284 |
|
|
Securitized Asset-Backed Receivables LLC Trust |
|
| |
|
| |
|
20,454 |
|
|
| |
|
9,212 |
|
|
| |
| |
|
|
| |
| |
|
|
|
|
| |
| |
|
|
| |
| |
|
18,225 |
|
|
| |
| |
|
|
| |
| |
|
|
|
|
| |
|
|
|
| |
|
| |
|
| |
|
2,900 |
|
|
| |
|
2,948 |
|
|
| |
|
| |
|
| |
|
5,100 |
|
|
| |
|
2,341 |
|
|
College Ave Student Loans Trust |
|
0.000% due 06/25/2054 «(g) |
|
| |
|
5 |
|
|
| |
|
2,572 |
|
| |
|
| |
|
626 |
|
|
| |
|
642 |
|
| |
|
| |
|
902 |
|
|
| |
|
908 |
|
|
| |
|
| |
|
| |
|
3,000 |
|
|
| |
|
2,726 |
|
|
Residential Asset Mortgage Products Trust |
|
5.985% due 01/25/2034 •(l) |
|
| |
|
3,623 |
|
|
| |
|
3,709 |
|
|
| |
| |
|
|
| |
| |
|
|
|
|
| |
| |
|
|
| |
| |
|
15,846 |
|
|
| |
| |
|
|
| |
| |
|
|
|
Total Asset-Backed Securities (Cost $301,586) |
|
|
|
|
|
| |
|
|
|
|
| |
|
|
|
|
|
|
|
|
|
|
|
|
| |
See Accompanying Notes |
|
|
|
|
|
| |
|
|
JUNE 30, 2025 |
|
|
|
|
|
|
|
|
|
| |
Consolidated Schedule of Investments |
|
PIMCO Dynamic Income Strategy Fund |
|
|
|
|
|
|
|
|
|
|
|
|
|
|
|
|
| |
| |
|
|
|
PRINCIPAL
AMOUNT
(000S) |
|
|
|
|
MARKET
VALUE
(000S) |
|
|
|
|
Avenir Issuer Ireland DAC |
|
| |
|
$ |
|
|
1,400 |
|
|
$ |
|
|
1,313 |
|
|
Colombia Government International Bond |
|
| |
|
| |
|
1,900 |
|
|
| |
|
1,913 |
|
| |
|
| |
|
2,500 |
|
|
| |
|
2,482 |
|
|
Romania Government International Bond |
|
| |
|
EUR |
|
|
2,500 |
|
|
| |
|
2,958 |
|
| |
|
| |
|
2,500 |
|
|
| |
|
2,807 |
|
|
Turkiye Government International Bond |
|
| |
|
TRY |
|
|
46,200 |
|
|
| |
|
1,165 |
|
| |
|
| |
|
4,500 |
|
|
| |
|
110 |
|
|
| |
| |
|
|
| |
| |
|
|
|
Total Sovereign Issues (Cost $12,861) |
|
|
|
|
|
| |
|
|
|
|
| |
| |
|
|
|
SHARES |
|
|
|
|
|
|
|
|
|
| |
|
|
|
|
|
|
| |
| |
|
| |
|
794,800 |
|
|
| |
|
36,041 |
|
|
|
|
|
| |
Hess Midstream LP ‘A’ (m) |
|
| |
|
206,870 |
|
|
| |
|
7,967 |
|
|
|
|
|
| |
New Fortress Energy, Inc. (e) |
|
| |
|
18,327 |
|
|
| |
|
61 |
|
|
|
|
|
| |
| |
|
| |
|
370,700 |
|
|
| |
|
18,097 |
|
|
| |
| |
|
|
| |
| |
|
|
|
|
| |
| |
|
|
| |
| |
|
62,166 |
|
|
| |
| |
|
|
| |
| |
|
|
|
|
| |
|
|
|
|
|
|
| |
Intelsat Emergence SA «(j) |
|
| |
|
21,303 |
|
|
| |
|
735 |
|
|
| |
| |
|
|
| |
| |
|
|
|
Total Common Stocks (Cost $55,751) |
|
|
|
|
|
| |
|
|
|
|
| |
|
|
|
|
|
|
|
|
|
|
|
|
| |
| |
|
|
|
|
|
|
|
|
|
|
MASTER LIMITED PARTNERSHIPS 12.3% |
|
|
| |
|
|
|
|
|
|
| |
| |
|
| |
|
2,415,999 |
|
|
$ |
|
|
43,802 |
|
|
|
|
|
| |
Enterprise Products Partners LP |
|
| |
|
1,148,687 |
|
|
| |
|
35,621 |
|
|
|
|
|
| |
| |
|
| |
|
915,636 |
|
|
| |
|
47,164 |
|
|
|
|
|
| |
| |
|
| |
|
146,300 |
|
|
| |
|
7,840 |
|
|
|
|
|
| |
Western Midstream Partners LP (m) |
|
| |
|
336,678 |
|
|
| |
|
13,030 |
|
|
| |
| |
|
|
| |
| |
|
|
|
Total Master Limited Partnerships (Cost $107,620) |
|
|
|
|
|
| |
|
|
|
|
| |
| |
|
|
|
|
|
|
|
|
|
|
SHORT-TERM INSTRUMENTS 0.9% |
|
|
| |
REPURCHASE AGREEMENTS (k) 0.2% |
|
|
| |
| |
|
|
| |
| |
|
2,200 |
|
|
| |
| |
|
|
| |
| |
|
|
|
|
| |
|
|
4.323% due 07/03/2025 - 10/21/2025 (f)(g)(p) |
|
$ |
|
|
8,862 |
|
|
| |
|
8,788 |
|
|
| |
| |
|
|
| |
| |
|
|
|
Total Short-Term Instruments (Cost $10,988) |
|
|
|
|
|
| |
|
|
|
|
|
|
|
| |
|
| |
| |
|
|
| |
| |
|
| |
Total Investments in Securities (Cost $1,136,192) |
|
|
|
|
|
| |
|
|
|
|
| |
|
|
|
|
|
|
|
|
|
|
|
|
| |
| |
|
|
|
|
|
|
|
|
|
|
INVESTMENTS IN AFFILIATES 31.8% |
|
|
| |
|
|
|
| |
AFFILIATED INVESTMENTS 20.4% |
|
|
|
|
|
| |
Venture Global Holdings ‘A’ (j) |
|
| |
|
15,699,112 |
|
|
$ |
|
|
244,592 |
|
|
| |
| |
|
|
| |
| |
|
|
|
Total Common Stocks (Cost $22,361) |
|
|
|
|
|
| |
|
|
|
|
| |
SHORT-TERM INSTRUMENTS 11.4% |
|
|
| |
CENTRAL FUNDS USED FOR CASH MANAGEMENT PURPOSES 11.4% |
|
|
|
|
| |
PIMCO Short-Term Floating NAV Portfolio III |
|
|
13,993,843 |
|
|
| |
|
136,258 |
|
|
| |
| |
|
|
| |
| |
|
|
|
Total Short-Term Instruments (Cost $136,201) |
|
|
|
|
|
| |
|
|
|
|
|
|
|
| |
|
| |
| |
|
|
| |
| |
|
| |
Total Investments in Affiliates (Cost $158,562) |
|
|
|
|
|
| |
|
| |
|
| |
Total Investments 131.0% (Cost $1,294,754) |
|
|
$ |
|
|
|
|
|
| |
Financial Derivative Instruments (n)(o) (0.3)% (Cost or Premiums, net $(1)) |
|
|
|
| |
| |
|
|
|
|
| |
Other Assets and Liabilities, net (30.7)% |
|
|
|
|
|
| |
|
|
|
Net Assets Applicable to Common Shareholders 100.0% |
|
|
$ |
|
|
|
|
|
|
| |
| |
|
|
|
NOTES TO CONSOLIDATED SCHEDULE OF INVESTMENTS:
|
A zero balance may reflect actual amounts rounding to less than one thousand. |
|
Security valued using significant unobservable inputs (Level 3). |
|
All or a portion of this amount represents unfunded loan commitments. The interest rate for the unfunded portion will be determined at the time of funding. See Note 4, Securities and Other Investments, in the Notes to Financial Statements for more information regarding unfunded loan commitments. |
|
Variable or Floating rate security. Rate shown is the rate in effect as of period end. Certain variable rate securities are not based on a published reference rate and spread, rather are determined by the issuer or agent and are based on current market conditions. Reference rate is as of reset date, which may vary by security. These securities may not indicate a reference rate and/or spread in their description. |
|
Rate shown is the rate in effect as of period end. The rate may be based on a fixed rate, a capped rate or a floor rate and may convert to a variable or floating rate in the future. These securities do not indicate a reference rate and spread in their description. |
|
Coupon represents a rate which changes periodically based on a predetermined schedule or event. Rate shown is the rate in effect as of period end. |
|
Security is an Interest Only (“IO”) or IO Strip. |
|
Payment in-kind security. |
|
Security did not produce income within the last twelve months. |
|
Coupon represents a weighted average yield to maturity. |
|
Comprises of a debt issuance of a qualified publicly-traded partnership (“QPTP”). |
|
This Company is structured like a Master Limited Partnership, but is not treated as a QPTP for required regulated investment company (“RIC”) asset diversification purposes. |
(j) RESTRICTED SECURITIES:
|
|
|
|
|
|
|
|
|
|
|
|
|
|
|
|
| |
|
|
|
|
|
|
|
|
|
|
|
Market Value
as Percentage
of Net Assets
Applicable to
Common
Shareholders |
|
Credit Opportunities Partners LLC 6.740% due 03/20/2030 |
|
|
02/20/2025 |
|
|
$ |
300 |
|
|
$ |
303 |
|
|
|
0.03 |
% |
| |
|
|
|
|
|
|
1,699 |
|
|
|
735 |
|
|
|
0.06 |
|
Venture Global Holdings ‘A’ |
|
|
06/27/2019 - 09/07/2022 |
|
|
|
22,361 |
|
|
|
244,592 |
|
|
|
20.44 |
|
WEC Energy Group, Inc. 6.690% due 06/15/2055 |
|
|
12/13/2024 |
|
|
|
8,000 |
|
|
|
7,905 |
|
|
|
0.66 |
|
|
| |
|
|
| |
|
|
|
|
|
|
|
|
|
|
|
|
|
| |
$ |
32,360 |
|
|
$ |
253,535 |
|
|
|
21.19 |
% |
|
|
| |
|
|
|
|
|
|
|
|
|
|
|
BORROWINGS AND OTHER FINANCING TRANSACTIONS
(k) REPURCHASE AGREEMENTS:
|
|
|
|
|
|
|
|
|
|
|
|
|
|
|
|
|
|
|
|
|
|
|
|
|
|
|
|
|
|
| |
|
|
|
|
|
|
|
|
|
|
|
|
|
|
|
|
|
|
|
Repurchase
Agreements,
at Value |
|
|
Repurchase Agreement Proceeds to be Received (1) |
|
DEU |
|
|
4.600 |
% |
|
|
06/30/2025 |
|
|
|
07/01/2025 |
|
|
$ |
2,200 |
|
|
U.S. Treasury Bonds 4.000% due 11/15/2052 |
|
$ |
(2,245 |
) |
|
$ |
2,200 |
|
|
$ |
2,200 |
|
|
| |
|
|
| |
|
|
| |
|
|
| |
|
|
| |
| |
|
|
|
|
|
|
|
|
|
|
|
Total Repurchase Agreements |
|
|
| |
|
|
|
|
|
|
|
|
|
|
|
|
|
| |
| |
|
|
|
|
|
|
|
|
|
|
|
REVERSE REPURCHASE AGREEMENTS:
|
|
|
|
|
|
|
|
|
|
|
|
|
|
|
|
|
|
|
|
|
|
|
|
| |
|
|
|
|
|
|
|
|
|
|
|
|
|
|
Payable for
Reverse
Repurchase
Agreements |
|
| |
|
|
4.330 |
% |
|
|
06/10/2025 |
|
|
|
TBD |
|
|
|
$ |
|
|
|
(2,409 |
) |
|
$ |
(2,415 |
) |
| |
|
|
4.700 |
|
|
|
05/19/2025 |
|
|
|
TBD |
|
|
|
|
| |
|
(10,838 |
) |
|
|
(10,899 |
) |
|
| |
|
4.890 |
|
|
|
05/14/2025 |
|
|
|
08/14/2025 |
|
|
|
|
| |
|
(4,910 |
) |
|
|
(4,941 |
) |
| |
|
|
4.940 |
|
|
|
06/09/2025 |
|
|
|
09/09/2025 |
|
|
|
|
| |
|
(4,380 |
) |
|
|
(4,393 |
) |
| |
|
|
4.650 |
|
|
|
03/24/2025 |
|
|
|
TBD |
|
|
|
|
| |
|
(7,188 |
) |
|
|
(7,280 |
) |
|
| |
|
4.820 |
|
|
|
04/10/2025 |
|
|
|
07/10/2025 |
|
|
|
|
| |
|
(14,513 |
) |
|
|
(14,672 |
) |
| |
|
|
4.710 |
|
|
|
05/05/2025 |
|
|
|
08/05/2025 |
|
|
|
|
| |
|
(3,953 |
) |
|
|
(3,983 |
) |
|
| |
|
4.860 |
|
|
|
05/05/2025 |
|
|
|
08/05/2025 |
|
|
|
|
| |
|
(12,140 |
) |
|
|
(12,234 |
) |
| |
|
|
4.730 |
|
|
|
06/17/2025 |
|
|
|
09/17/2025 |
|
|
|
|
| |
|
(4,099 |
) |
|
|
(4,107 |
) |
|
| |
|
4.880 |
|
|
|
06/16/2025 |
|
|
|
09/16/2025 |
|
|
|
|
| |
|
(894 |
) |
|
|
(896 |
) |
|
| |
|
4.900 |
|
|
|
06/27/2025 |
|
|
|
09/29/2025 |
|
|
|
|
| |
|
(17,586 |
) |
|
|
(17,596 |
) |
|
| |
|
4.930 |
|
|
|
06/16/2025 |
|
|
|
09/16/2025 |
|
|
|
|
| |
|
(1,101 |
) |
|
|
(1,103 |
) |
| |
|
|
(0.500 |
) |
|
|
06/23/2025 |
|
|
|
08/01/2025 |
|
|
|
|
| |
|
(2,517 |
) |
|
|
(2,516 |
) |
| |
|
|
5.340 |
|
|
|
06/24/2025 |
|
|
|
12/22/2025 |
|
|
|
|
| |
|
(50,422 |
) |
|
|
(50,474 |
) |
|
| |
|
5.440 |
|
|
|
01/13/2025 |
|
|
|
07/14/2025 |
|
|
|
|
| |
|
(21,743 |
) |
|
|
(22,291 |
) |
|
| |
|
5.440 |
|
|
|
05/19/2025 |
|
|
|
11/19/2025 |
|
|
|
|
| |
|
(2,415 |
) |
|
|
(2,430 |
) |
| |
|
|
5.440 |
|
|
|
01/13/2025 |
|
|
|
07/14/2025 |
|
|
|
|
| |
|
(6,756 |
) |
|
|
(6,926 |
) |
| |
|
|
5.415 |
|
|
|
05/27/2025 |
|
|
|
11/28/2025 |
|
|
|
|
| |
|
(26,704 |
) |
|
|
(26,841 |
) |
|
| |
|
5.440 |
|
|
|
05/09/2025 |
|
|
|
11/10/2025 |
|
|
|
|
| |
|
(23,688 |
) |
|
|
(23,874 |
) |
| |
|
|
4.620 |
|
|
|
04/10/2025 |
|
|
|
07/09/2025 |
|
|
|
|
| |
|
(12,703 |
) |
|
|
(12,836 |
) |
|
| |
|
4.740 |
|
|
|
04/10/2025 |
|
|
|
07/09/2025 |
|
|
|
|
| |
|
(17,850 |
) |
|
|
(18,042 |
) |
|
| |
|
4.800 |
|
|
|
04/08/2025 |
|
|
|
07/07/2025 |
|
|
|
|
| |
|
(7,689 |
) |
|
|
(7,776 |
) |
|
| |
|
4.860 |
|
|
|
06/18/2025 |
|
|
|
09/18/2025 |
|
|
|
|
| |
|
(16,508 |
) |
|
|
(16,537 |
) |
|
| |
|
5.440 |
|
|
|
04/11/2025 |
|
|
|
10/10/2025 |
|
|
|
|
| |
|
(19,589 |
) |
|
|
(19,830 |
) |
|
| |
|
5.440 |
|
|
|
06/23/2025 |
|
|
|
12/23/2025 |
|
|
|
|
| |
|
(42,765 |
) |
|
|
(42,816 |
) |
| |
|
|
2.500 |
|
|
|
12/20/2024 |
|
|
|
TBD |
|
|
|
|
| |
|
(3,102 |
) |
|
|
(3,144 |
) |
| |
|
|
4.980 |
|
|
|
05/23/2025 |
|
|
|
08/25/2025 |
|
|
|
|
| |
|
(17,355 |
) |
|
|
(17,448 |
) |
|
| |
|
|
| |
|
|
| |
|
|
| |
|
|
| |
|
|
| |
|
|
|
Total Reverse Repurchase Agreements |
|
|
|
|
| |
|
|
| |
|
|
| |
|
|
|
|
| |
|
|
| |
|
|
| |
|
|
| |
|
|
| |
|
|
| |
|
|
|
BORROWINGS AND OTHER FINANCING TRANSACTIONS SUMMARY
The following is a summary by counterparty of the market value of Borrowings and Other Financing Transactions and collateral pledged/(received) as of June 30, 2025:
|
|
|
|
|
|
|
|
|
|
|
|
|
|
|
|
|
|
|
|
|
|
|
|
| |
|
|
Repurchase Agreement Proceeds to be Received (1) |
|
|
Payable for
Reverse
Repurchase
Agreements |
|
|
Payable for Sale-Buyback Transactions |
|
|
Total
Borrowings and
Other Financing
Transactions |
|
|
Collateral
Pledged/(Received) |
|
|
|
|
Global/Master Repurchase Agreement |
|
| |
|
$ |
0 |
|
|
$ |
(2,415 |
) |
|
$ |
0 |
|
|
$ |
(2,415 |
) |
|
$ |
2,726 |
|
|
$ |
311 |
|
| |
|
|
0 |
|
|
|
(15,840 |
) |
|
|
0 |
|
|
|
(15,840 |
) |
|
|
17,856 |
|
|
|
2,016 |
|
| |
|
|
0 |
|
|
|
(4,393 |
) |
|
|
0 |
|
|
|
(4,393 |
) |
|
|
4,723 |
|
|
|
330 |
|
| |
|
|
0 |
|
|
|
(21,952 |
) |
|
|
0 |
|
|
|
(21,952 |
) |
|
|
25,567 |
|
|
|
3,615 |
|
| |
|
|
2,200 |
|
|
|
(16,217 |
) |
|
|
0 |
|
|
|
(14,017 |
) |
|
|
15,292 |
|
|
|
1,275 |
|
| |
|
|
0 |
|
|
|
(23,702 |
) |
|
|
0 |
|
|
|
(23,702 |
) |
|
|
26,171 |
|
|
|
2,469 |
|
| |
|
|
0 |
|
|
|
(2,516 |
) |
|
|
0 |
|
|
|
(2,516 |
) |
|
|
2,917 |
|
|
|
401 |
|
| |
|
|
0 |
|
|
|
(75,195 |
) |
|
|
0 |
|
|
|
(75,195 |
) |
|
|
97,139 |
|
|
|
21,944 |
|
| |
|
|
0 |
|
|
|
(6,926 |
) |
|
|
0 |
|
|
|
(6,926 |
) |
|
|
9,293 |
|
|
|
2,367 |
|
| |
|
|
0 |
|
|
|
(50,715 |
) |
|
|
0 |
|
|
|
(50,715 |
) |
|
|
67,306 |
|
|
|
16,591 |
|
| |
|
|
0 |
|
|
|
(117,837 |
) |
|
|
0 |
|
|
|
(117,837 |
) |
|
|
147,575 |
|
|
|
29,738 |
|
| |
|
|
0 |
|
|
|
(3,144 |
) |
|
|
0 |
|
|
|
(3,144 |
) |
|
|
3,216 |
|
|
|
72 |
|
| |
|
|
0 |
|
|
|
(17,448 |
) |
|
|
0 |
|
|
|
(17,448 |
) |
|
|
19,314 |
|
|
|
1,866 |
|
|
| |
|
|
|
|
|
|
|
|
|
|
|
|
|
|
| |
|
|
| |
|
| |
Total Borrowings and Other Financing Transactions |
|
|
|
|
|
|
|
|
|
|
|
|
|
|
|
| |
|
|
| |
|
| |
|
| |
|
|
|
|
|
|
|
|
|
|
|
|
|
|
| |
|
|
| |
|
| |
|
|
|
|
|
|
|
|
|
|
|
|
| |
See Accompanying Notes |
|
|
|
|
|
| |
|
|
JUNE 30, 2025 |
|
|
|
|
|
|
|
|
|
| |
Consolidated Schedule of Investments |
|
PIMCO Dynamic Income Strategy Fund |
|
|
|
|
CERTAIN TRANSFERS ACCOUNTED FOR AS SECURED BORROWINGS
Remaining Contractual Maturity of the Agreements
|
|
|
|
|
|
|
|
|
|
|
|
|
|
|
|
|
|
|
|
| |
| |
|
|
|
|
|
|
|
|
|
|
|
|
|
|
|
Reverse Repurchase Agreements |
|
| |
|
$ |
0 |
|
|
$ |
(53,326 |
) |
|
$ |
(44,317 |
) |
|
$ |
(23,738 |
) |
|
$ |
(121,381 |
) |
Non-Agency Mortgage-Backed Securities |
|
|
0 |
|
|
|
(6,012 |
) |
|
|
(14,184 |
) |
|
|
(39,094 |
) |
|
|
(59,290 |
) |
| |
|
|
0 |
|
|
|
(23,205 |
) |
|
|
(9,657 |
) |
|
|
(144,767 |
) |
|
|
(177,629 |
) |
|
| |
|
|
|
|
|
|
|
|
|
|
|
|
|
|
|
|
|
|
|
| |
|
|
|
|
|
|
|
|
|
|
|
|
|
|
|
|
|
|
|
|
|
| |
|
|
|
|
|
|
|
|
|
|
|
|
|
|
|
|
|
|
|
Payable for reverse repurchase agreements |
|
|
|
|
|
|
| |
|
|
| |
|
|
| |
|
|
| |
|
|
| |
|
|
|
|
Securities with an aggregate market value of $443,555 and cash of $1,160 have been pledged as collateral under the terms of the above master agreements as of June 30, 2025. |
|
Securities with an aggregate market value of $17,325 and cash of $447 have been pledged as collateral as of June 30, 2025 for equity short sales and equity options as governed by prime brokerage agreements and agreements governing listed equity option transactions. |
|
Includes accrued interest. |
|
The average amount of borrowings outstanding during the period ended June 30, 2025 was $(341,859) at a weighted average interest rate of 5.251%. Average borrowings may include reverse repurchase agreements and sale-buyback transactions, if held during the period. |
|
Open maturity reverse repurchase agreement. |
|
Net Exposure represents the net receivable/(payable) that would be due from/to the counterparty in the event of default. Exposure from borrowings and other financing transactions can only be netted across transactions governed under the same master agreement with the same legal entity. See Note 8, Master Netting Arrangements, in the Notes to Financial Statements for more information. |
(n) FINANCIAL DERIVATIVE INSTRUMENTS: EXCHANGE-TRADED OR CENTRALLY CLEARED
FUTURES CONTRACTS:
LONG FUTURES CONTRACTS
|
|
|
|
|
|
|
|
|
|
|
|
|
|
|
|
|
|
|
|
|
|
|
|
| |
|
|
|
|
|
|
|
|
|
|
|
Unrealized
Appreciation/
(Depreciation) |
|
|
|
|
| |
|
|
|
|
|
California Carbon Allowance December Futures |
|
|
12/2025 |
|
|
|
182 |
|
|
$ |
5,167 |
|
|
$ |
(1,357 |
) |
|
$ |
56 |
|
|
$ |
0 |
|
California Carbon Allowance Vintage December Futures |
|
|
12/2026 |
|
|
|
1,102 |
|
|
|
33,225 |
|
|
|
(1,644 |
) |
|
|
309 |
|
|
|
0 |
|
|
| |
|
|
| |
|
|
| |
|
|
| |
|
|
|
|
|
|
|
|
|
|
|
| |
|
|
|
|
|
|
|
|
|
|
|
|
|
|
| |
|
|
| |
|
|
| |
|
|
| |
|
|
|
|
|
|
|
|
|
|
|
SWAP AGREEMENTS:
INTEREST RATE SWAPS
|
|
|
|
|
|
|
|
|
|
|
|
|
|
|
|
|
|
|
|
|
|
|
|
|
|
|
|
|
|
|
|
|
|
|
|
|
|
|
|
| |
Pay/Receive
Floating Rate |
|
|
|
|
|
|
|
|
|
|
|
|
|
|
|
|
|
Unrealized
Appreciation/
(Depreciation) |
|
|
|
|
|
|
|
| |
|
|
|
|
|
| |
|
1-Day USD-SOFR Compounded-OIS |
|
|
3.750 |
% |
|
Annual |
|
|
06/20/2034 |
|
|
$ |
|
|
|
|
100 |
|
|
$ |
(1 |
) |
|
$ |
2 |
|
|
$ |
1 |
|
|
$ |
0 |
|
|
$ |
0 |
|
|
| |
| |
|
|
| |
| |
|
|
| |
|
|
| |
|
|
| |
|
|
|
|
|
|
|
|
|
|
|
|
|
|
|
|
|
|
|
| |
|
|
| |
|
|
| |
|
|
| |
|
|
| |
|
|
|
|
|
|
|
|
|
|
|
|
|
|
|
|
|
|
|
|
| |
| |
|
|
| |
| |
|
|
| |
|
|
| |
|
|
| |
|
|
|
|
|
|
|
|
|
|
|
|
|
|
|
|
|
|
|
FINANCIAL DERIVATIVE INSTRUMENTS: EXCHANGE-TRADED OR CENTRALLY CLEARED SUMMARY
The following is a summary of the market value and variation margin of Exchange-Traded or Centrally Cleared Financial Derivative Instruments as of June 30, 2025:
|
|
|
|
|
|
|
|
|
|
|
|
|
|
|
|
|
|
|
|
|
|
|
|
|
|
|
|
|
|
|
|
|
|
|
|
| |
| |
|
Financial Derivative Assets |
|
|
|
|
|
Financial Derivative Liabilities |
|
| |
|
|
|
|
|
|
|
|
|
|
|
|
|
|
|
|
Variation Margin
Liability |
|
|
|
|
| |
|
|
|
|
|
|
|
|
|
|
|
|
|
|
|
|
|
|
|
|
|
Total Exchange-Traded or Centrally Cleared |
|
|
|
|
|
|
|
|
|
|
|
|
|
|
|
|
|
|
|
| |
|
|
|
|
|
|
|
|
|
|
|
|
|
|
|
|
| |
|
|
|
|
|
|
|
|
|
|
|
|
|
|
|
|
|
|
| |
|
|
|
|
|
|
|
|
|
|
|
|
|
|
|
Cash of $3,347 has been pledged as collateral for exchange-traded and centrally cleared financial derivative instruments as of June 30, 2025.
|
|
|
|
|
|
| |
122 |
|
PIMCO CLOSED-END FUNDS |
|
|
See Accompanying Notes |
|
(o) FINANCIAL DERIVATIVE INSTRUMENTS: OVER THE COUNTER
FORWARD FOREIGN CURRENCY CONTRACTS:
|
|
|
|
|
|
|
|
|
|
|
|
|
|
|
|
|
|
|
|
|
|
|
|
| |
|
|
|
|
|
|
|
|
|
|
|
Unrealized Appreciation/ (Depreciation) |
|
| |
|
|
|
|
|
| |
|
|
07/2025 |
|
|
EUR |
|
|
38,808 |
|
|
$ |
|
|
44,127 |
|
|
$ |
0 |
|
|
$ |
(1,587 |
) |
|
| |
|
07/2025 |
|
|
$ |
|
|
1,332 |
|
|
EUR |
|
|
1,171 |
|
|
|
48 |
|
|
|
0 |
|
|
|
|
|
|
|
|
| |
| |
|
|
07/2025 |
|
|
BRL |
|
|
116 |
|
|
$ |
|
|
20 |
|
|
|
0 |
|
|
|
(1 |
) |
|
| |
|
07/2025 |
|
|
TRY |
|
|
8,813 |
|
|
| |
|
216 |
|
|
|
0 |
|
|
|
(2 |
) |
|
| |
|
07/2025 |
|
|
$ |
|
|
21 |
|
|
BRL |
|
|
116 |
|
|
|
0 |
|
|
|
0 |
|
|
| |
|
07/2025 |
|
|
| |
|
627 |
|
|
EUR |
|
|
535 |
|
|
|
4 |
|
|
|
0 |
|
|
| |
|
08/2025 |
|
|
TRY |
|
|
123,875 |
|
|
$ |
|
|
2,993 |
|
|
|
0 |
|
|
|
(31 |
) |
|
|
|
|
|
|
|
| |
| |
|
|
07/2025 |
|
|
| |
|
18,705 |
|
|
| |
|
462 |
|
|
|
0 |
|
|
|
(5 |
) |
|
| |
|
07/2025 |
|
|
$ |
|
|
1,333 |
|
|
EUR |
|
|
1,174 |
|
|
|
50 |
|
|
|
0 |
|
|
| |
|
07/2025 |
|
|
| |
|
27,499 |
|
|
GBP |
|
|
20,211 |
|
|
|
243 |
|
|
|
0 |
|
|
| |
|
07/2025 |
|
|
| |
|
255 |
|
|
TRY |
|
|
10,504 |
|
|
|
5 |
|
|
|
0 |
|
|
| |
|
08/2025 |
|
|
GBP |
|
|
20,211 |
|
|
$ |
|
|
27,503 |
|
|
|
0 |
|
|
|
(244 |
) |
|
| |
|
08/2025 |
|
|
$ |
|
|
2,856 |
|
|
TRY |
|
|
118,627 |
|
|
|
39 |
|
|
|
0 |
|
|
|
|
|
|
|
|
| |
| |
|
|
07/2025 |
|
|
DKK |
|
|
14,645 |
|
|
$ |
|
|
2,230 |
|
|
|
0 |
|
|
|
(82 |
) |
|
|
|
|
|
|
|
| |
| |
|
|
07/2025 |
|
|
CAD |
|
|
33 |
|
|
| |
|
24 |
|
|
|
0 |
|
|
|
0 |
|
|
| |
|
07/2025 |
|
|
$ |
|
|
1,354 |
|
|
EUR |
|
|
1,183 |
|
|
|
39 |
|
|
|
0 |
|
|
|
|
|
|
|
|
| |
| |
|
|
07/2025 |
|
|
| |
|
1,731 |
|
|
DKK |
|
|
11,022 |
|
|
|
9 |
|
|
|
0 |
|
|
| |
|
07/2025 |
|
|
| |
|
43,649 |
|
|
EUR |
|
|
37,625 |
|
|
|
672 |
|
|
|
0 |
|
|
| |
|
08/2025 |
|
|
DKK |
|
|
10,995 |
|
|
$ |
|
|
1,731 |
|
|
|
0 |
|
|
|
(9 |
) |
|
| |
|
08/2025 |
|
|
EUR |
|
|
37,542 |
|
|
| |
|
43,649 |
|
|
|
0 |
|
|
|
(671 |
) |
|
|
|
|
|
|
|
| |
| |
|
|
07/2025 |
|
|
BRL |
|
|
53,978 |
|
|
| |
|
9,763 |
|
|
|
0 |
|
|
|
(172 |
) |
|
| |
|
07/2025 |
|
|
JPY |
|
|
35,240 |
|
|
| |
|
246 |
|
|
|
1 |
|
|
|
0 |
|
|
| |
|
07/2025 |
|
|
$ |
|
|
9,442 |
|
|
BRL |
|
|
53,978 |
|
|
|
493 |
|
|
|
0 |
|
|
| |
|
07/2025 |
|
|
| |
|
2,354 |
|
|
DKK |
|
|
14,980 |
|
|
|
11 |
|
|
|
0 |
|
|
| |
|
07/2025 |
|
|
| |
|
138 |
|
|
JPY |
|
|
20,126 |
|
|
|
2 |
|
|
|
0 |
|
|
| |
|
08/2025 |
|
|
DKK |
|
|
14,944 |
|
|
$ |
|
|
2,354 |
|
|
|
0 |
|
|
|
(11 |
) |
|
| |
|
08/2025 |
|
|
JPY |
|
|
20,051 |
|
|
| |
|
138 |
|
|
|
0 |
|
|
|
(2 |
) |
|
| |
|
09/2025 |
|
|
$ |
|
|
9,763 |
|
|
BRL |
|
|
54,804 |
|
|
|
170 |
|
|
|
0 |
|
|
| |
|
09/2025 |
|
|
| |
|
9,284 |
|
|
MXN |
|
|
180,775 |
|
|
|
272 |
|
|
|
0 |
|
|
|
|
|
|
|
|
| |
| |
|
|
07/2025 |
|
|
DKK |
|
|
11,348 |
|
|
$ |
|
|
1,719 |
|
|
|
0 |
|
|
|
(73 |
) |
|
| |
|
07/2025 |
|
|
$ |
|
|
11,625 |
|
|
CAD |
|
|
15,878 |
|
|
|
35 |
|
|
|
0 |
|
|
| |
|
07/2025 |
|
|
| |
|
613 |
|
|
EUR |
|
|
539 |
|
|
|
22 |
|
|
|
0 |
|
|
| |
|
08/2025 |
|
|
| |
|
2,365 |
|
|
| |
|
2,013 |
|
|
|
11 |
|
|
|
0 |
|
|
|
|
|
|
|
|
| |
| |
|
|
07/2025 |
|
|
CAD |
|
|
76,382 |
|
|
$ |
|
|
55,612 |
|
|
|
0 |
|
|
|
(478 |
) |
|
| |
|
07/2025 |
|
|
HKD |
|
|
22,968 |
|
|
| |
|
2,936 |
|
|
|
6 |
|
|
|
0 |
|
|
| |
|
07/2025 |
|
|
JPY |
|
|
2,130 |
|
|
| |
|
15 |
|
|
|
0 |
|
|
|
0 |
|
|
| |
|
07/2025 |
|
|
$ |
|
|
44,056 |
|
|
CAD |
|
|
60,559 |
|
|
|
416 |
|
|
|
0 |
|
|
| |
|
07/2025 |
|
|
| |
|
1,194 |
|
|
EUR |
|
|
1,052 |
|
|
|
45 |
|
|
|
0 |
|
|
| |
|
08/2025 |
|
|
CAD |
|
|
60,458 |
|
|
$ |
|
|
44,056 |
|
|
|
0 |
|
|
|
(417 |
) |
|
|
|
|
|
|
|
| |
| |
|
|
07/2025 |
|
|
JPY |
|
|
796 |
|
|
| |
|
5 |
|
|
|
0 |
|
|
|
0 |
|
|
| |
|
07/2025 |
|
|
$ |
|
|
44 |
|
|
JPY |
|
|
6,370 |
|
|
|
1 |
|
|
|
0 |
|
|
| |
|
08/2025 |
|
|
JPY |
|
|
6,346 |
|
|
$ |
|
|
44 |
|
|
|
0 |
|
|
|
(1 |
) |
|
|
|
|
|
|
|
| |
| |
|
|
08/2025 |
|
|
$ |
|
|
1,737 |
|
|
EUR |
|
|
1,478 |
|
|
|
8 |
|
|
|
0 |
|
|
|
|
|
|
|
|
| |
| |
|
|
07/2025 |
|
|
| |
|
77 |
|
|
JPY |
|
|
11,170 |
|
|
|
0 |
|
|
|
0 |
|
|
| |
|
08/2025 |
|
|
JPY |
|
|
11,129 |
|
|
$ |
|
|
77 |
|
|
|
0 |
|
|
|
0 |
|
|
|
|
|
|
|
|
| |
| |
|
|
07/2025 |
|
|
CAD |
|
|
22 |
|
|
| |
|
16 |
|
|
|
0 |
|
|
|
0 |
|
|
| |
|
07/2025 |
|
|
GBP |
|
|
20,211 |
|
|
| |
|
27,366 |
|
|
|
0 |
|
|
|
(377 |
) |
|
| |
|
08/2025 |
|
|
$ |
|
|
16 |
|
|
CAD |
|
|
22 |
|
|
|
0 |
|
|
|
0 |
|
|
| |
|
08/2025 |
|
|
| |
|
1,150 |
|
|
EUR |
|
|
979 |
|
|
|
6 |
|
|
|
0 |
|
|
|
|
|
|
|
|
| |
| |
|
|
09/2025 |
|
|
MXN |
|
|
216 |
|
|
$ |
|
|
11 |
|
|
|
0 |
|
|
|
0 |
|
|
| |
|
|
| |
| |
|
|
| |
| |
|
|
| |
|
|
|
|
|
|
|
Total Forward Foreign Currency Contracts |
|
|
| |
|
|
| |
|
|
|
|
|
|
|
|
| |
|
|
| |
| |
|
|
| |
| |
|
|
| |
|
|
|
|
|
|
|
SWAP AGREEMENTS:
TOTAL RETURN SWAPS ON SECURITIES
|
|
|
|
|
|
|
|
|
|
|
|
|
|
|
|
|
|
|
|
|
|
|
|
|
|
|
|
|
|
|
|
|
|
|
|
|
|
|
|
|
|
| |
|
|
|
|
|
|
|
|
|
|
|
|
|
|
|
|
|
|
|
|
|
|
|
Unrealized
Appreciation/
(Depreciation) |
|
|
|
|
| |
|
|
|
|
|
BOA |
|
|
|
Plains All American Pipeline LP |
|
|
170,000 |
|
|
4.930% (FEDL01 plus a specified spread) |
|
|
Monthly |
|
|
|
11/05/2025 |
|
|
$ |
|
|
|
|
3,114 |
|
|
$ |
0 |
|
|
$ |
(11 |
) |
|
$ |
0 |
|
|
$ |
(11 |
) |
|
|
|
|
|
|
|
|
|
|
|
|
| |
| See Accompanying Notes |
|
|
ANNUAL REPORT |
|
|
| |
|
|
JUNE 30, 2025 |
|
|
123 |
|
|
|
|
|
|
| |
Consolidated Schedule of Investments |
|
PIMCO Dynamic Income Strategy Fund |
|
|
|
|
|
|
|
|
|
|
|
|
|
|
|
|
|
|
|
|
|
|
|
|
|
|
|
|
|
|
|
|
|
|
|
|
|
|
|
|
|
|
|
|
|
|
| |
Counterparty |
|
|
|
Underlying Reference |
|
# of Shares |
|
|
Financing Rate |
|
Payment
Frequency |
|
|
Maturity
Date |
|
|
Notional
Amount |
|
|
Premiums
Paid/(Received) |
|
|
Unrealized
Appreciation/
(Depreciation) |
|
|
Swap Agreements,
at Value |
|
| |
Asset |
|
|
Liability |
|
FAR |
|
|
|
Plains All American Pipeline LP |
|
|
706,000 |
|
|
4.930% (FEDL01 plus a specified spread) |
|
|
Maturity |
|
|
|
11/05/2025 |
|
|
$ |
|
|
|
|
12,306 |
|
|
$ |
0 |
|
|
$ |
760 |
|
|
$ |
760 |
|
|
$ |
0 |
|
|
| |
|
|
|
|
|
410,000 |
|
|
4.930% (FEDL01 plus a specified spread) |
|
|
Maturity |
|
|
|
11/05/2025 |
|
|
|
|
| |
|
15,797 |
|
|
|
0 |
|
|
|
282 |
|
|
|
282 |
|
|
|
0 |
|
|
|
|
|
|
|
|
|
|
|
|
|
| |
GST |
|
|
|
|
|
|
938,239 |
|
|
|
|
|
Maturity |
|
|
|
04/15/2026 |
|
|
|
|
| |
|
17,770 |
|
|
|
0 |
|
|
|
(704 |
) |
|
|
0 |
|
|
|
(704 |
) |
|
| |
|
|
Enterprise Product Partners LP |
|
|
398,000 |
|
|
|
|
|
Maturity |
|
|
|
04/15/2026 |
|
|
|
|
| |
|
13,532 |
|
|
|
0 |
|
|
|
(1,169 |
) |
|
|
0 |
|
|
|
(1,169 |
) |
|
| |
|
|
|
|
|
399,000 |
|
|
|
|
|
Maturity |
|
|
|
04/15/2026 |
|
|
|
|
| |
|
21,686 |
|
|
|
0 |
|
|
|
(1,058 |
) |
|
|
0 |
|
|
|
(1,058 |
) |
|
| |
|
|
Plains All American Pipeline LP |
|
|
274,000 |
|
|
|
|
|
Maturity |
|
|
|
04/15/2026 |
|
|
|
|
| |
|
5,532 |
|
|
|
0 |
|
|
|
(487 |
) |
|
|
0 |
|
|
|
(487 |
) |
|
| |
|
|
|
|
|
117,425 |
|
|
|
|
|
Maturity |
|
|
|
04/15/2026 |
|
|
|
|
| |
|
4,913 |
|
|
|
0 |
|
|
|
(331 |
) |
|
|
0 |
|
|
|
(331 |
) |
|
| |
| |
| |
|
|
| |
| |
|
|
| |
|
|
| |
|
|
| |
|
|
| |
|
|
|
|
|
|
|
|
|
|
|
|
|
|
|
| |
|
|
|
| |
|
|
| |
|
|
| |
|
|
| |
|
|
|
|
|
|
|
|
|
|
|
|
|
|
|
|
| |
| |
| |
|
|
| |
| |
|
|
| |
|
|
| |
|
|
| |
|
|
| |
|
|
|
|
|
|
|
|
|
|
|
|
|
|
|
FINANCIAL DERIVATIVE INSTRUMENTS: OVER THE COUNTER SUMMARY
The following is a summary by counterparty of the market value of OTC financial derivative instruments and collateral pledged/(received) as of June 30, 2025:
|
|
|
|
|
|
|
|
|
|
|
|
|
|
|
|
|
|
|
|
|
|
|
|
|
|
|
|
|
|
|
|
|
|
|
|
|
|
|
|
|
|
|
|
|
|
|
|
| |
| |
|
Financial Derivative Assets |
|
|
|
|
|
Financial Derivative Liabilities |
|
|
|
|
|
|
|
|
|
|
|
|
Forward
Foreign
Currency
Contracts |
|
|
|
|
|
|
|
|
|
|
|
|
|
|
Forward
Foreign
Currency
Contracts |
|
|
|
|
|
|
|
|
|
|
|
Net Market
Value of OTC
Derivatives |
|
|
Collateral
Pledged/
(Received) |
|
|
|
|
| |
|
$ |
48 |
|
|
$ |
0 |
|
|
$ |
0 |
|
|
$ |
48 |
|
|
|
|
| |
$ |
(1,587 |
) |
|
$ |
0 |
|
|
$ |
(11 |
) |
|
$ |
(1,598 |
) |
|
$ |
(1,550 |
) |
|
$ |
1,030 |
|
|
$ |
(520 |
) |
| |
|
|
4 |
|
|
|
0 |
|
|
|
0 |
|
|
|
4 |
|
|
|
|
| |
|
(34 |
) |
|
|
0 |
|
|
|
0 |
|
|
|
(34 |
) |
|
|
(30 |
) |
|
|
0 |
|
|
|
(30 |
) |
| |
|
|
337 |
|
|
|
0 |
|
|
|
0 |
|
|
|
337 |
|
|
|
|
| |
|
(249 |
) |
|
|
0 |
|
|
|
0 |
|
|
|
(249 |
) |
|
|
88 |
|
|
|
0 |
|
|
|
88 |
|
| |
|
|
0 |
|
|
|
0 |
|
|
|
0 |
|
|
|
0 |
|
|
|
|
| |
|
(82 |
) |
|
|
0 |
|
|
|
0 |
|
|
|
(82 |
) |
|
|
(82 |
) |
|
|
0 |
|
|
|
(82 |
) |
| |
|
|
39 |
|
|
|
0 |
|
|
|
0 |
|
|
|
39 |
|
|
|
|
| |
|
0 |
|
|
|
0 |
|
|
|
0 |
|
|
|
0 |
|
|
|
39 |
|
|
|
0 |
|
|
|
39 |
|
| |
|
|
681 |
|
|
|
0 |
|
|
|
0 |
|
|
|
681 |
|
|
|
|
| |
|
(680 |
) |
|
|
0 |
|
|
|
0 |
|
|
|
(680 |
) |
|
|
1 |
|
|
|
0 |
|
|
|
1 |
|
| |
|
|
949 |
|
|
|
0 |
|
|
|
1,042 |
|
|
|
1,991 |
|
|
|
|
| |
|
(185 |
) |
|
|
0 |
|
|
|
0 |
|
|
|
(185 |
) |
|
|
1,806 |
|
|
|
(290 |
) |
|
|
1,516 |
|
| |
|
|
0 |
|
|
|
0 |
|
|
|
0 |
|
|
|
0 |
|
|
|
|
| |
|
0 |
|
|
|
0 |
|
|
|
(3,749 |
) |
|
|
(3,749 |
) |
|
|
(3,749 |
) |
|
|
3,826 |
|
|
|
77 |
|
| |
|
|
68 |
|
|
|
0 |
|
|
|
0 |
|
|
|
68 |
|
|
|
|
| |
|
(73 |
) |
|
|
0 |
|
|
|
0 |
|
|
|
(73 |
) |
|
|
(5 |
) |
|
|
0 |
|
|
|
(5 |
) |
| |
|
|
467 |
|
|
|
0 |
|
|
|
0 |
|
|
|
467 |
|
|
|
|
| |
|
(895 |
) |
|
|
0 |
|
|
|
0 |
|
|
|
(895 |
) |
|
|
(428 |
) |
|
|
381 |
|
|
|
(47 |
) |
| |
|
|
1 |
|
|
|
0 |
|
|
|
0 |
|
|
|
1 |
|
|
|
|
| |
|
(1 |
) |
|
|
0 |
|
|
|
0 |
|
|
|
(1 |
) |
|
|
0 |
|
|
|
0 |
|
|
|
0 |
|
| |
|
|
8 |
|
|
|
0 |
|
|
|
0 |
|
|
|
8 |
|
|
|
|
| |
|
0 |
|
|
|
0 |
|
|
|
0 |
|
|
|
0 |
|
|
|
8 |
|
|
|
0 |
|
|
|
8 |
|
| |
|
|
6 |
|
|
|
0 |
|
|
|
0 |
|
|
|
6 |
|
|
|
|
| |
|
(377 |
) |
|
|
0 |
|
|
|
0 |
|
|
|
(377 |
) |
|
|
(371 |
) |
|
|
392 |
|
|
|
21 |
|
|
| |
|
|
|
|
|
|
|
|
|
|
|
|
|
|
|
|
|
|
| |
|
|
|
|
|
|
|
|
|
|
|
|
|
|
|
|
|
|
| |
|
|
| |
|
| |
| |
|
|
|
|
|
|
|
|
|
|
|
|
|
|
|
|
|
|
|
| |
|
|
|
|
|
|
|
|
|
|
|
|
|
|
|
|
|
|
| |
|
|
| |
|
| |
|
| |
|
|
|
|
|
|
|
|
|
|
|
|
|
|
|
|
|
|
| |
|
|
|
|
|
|
|
|
|
|
|
|
|
|
|
|
|
|
| |
|
|
| |
|
| |
|
Securities with an aggregate market value of $5,629 have been pledged as collateral for financial derivative instruments as governed by International Swaps and Derivatives Association, Inc. master agreements as of June 30, 2025. |
|
Receive represents that the Fund receives payments for any positive net return on the underlying reference. The Fund makes payments for any negative net return on such underlying reference. Pay represents that the Fund receives payments for any negative net return on the underlying reference. The Fund makes payments for any positive net return on such underlying reference. |
|
Net Exposure represents the net receivable/(payable) that would be due from/to the counterparty in the event of default. Exposure from OTC financial derivative instruments can only be netted across transactions governed under the same master agreement with the same legal entity. See Note 8, Master Netting Arrangements, in the Notes to Financial Statements for more information. |
FAIR VALUE OF FINANCIAL DERIVATIVE INSTRUMENTS
The following is a summary of the fair valuation of the Fund’s derivative instruments categorized by risk exposure. See Note 7, Principal and Other Risks, in the Notes to Financial Statements on risks of the Fund.
Fair Values of Financial Derivative Instruments on the Consolidated Statements of Assets and Liabilities as of June 30, 2025:
|
|
|
|
|
|
|
|
|
|
|
|
|
|
|
|
|
|
|
|
|
|
|
|
| |
| |
|
Derivatives not accounted for as hedging instruments |
|
| |
|
|
|
|
|
|
|
|
|
|
|
|
|
|
|
|
|
|
Financial Derivative Instruments - Assets |
|
Exchange-traded or centrally cleared |
|
| |
|
$ |
365 |
|
|
$ |
0 |
|
|
$ |
0 |
|
|
$ |
0 |
|
|
$ |
0 |
|
|
$ |
365 |
|
|
| |
|
|
|
|
|
|
|
|
|
|
|
|
|
|
|
|
|
|
|
|
|
|
|
| |
|
Forward Foreign Currency Contracts |
|
$ |
0 |
|
|
$ |
0 |
|
|
$ |
0 |
|
|
$ |
2,608 |
|
|
$ |
0 |
|
|
$ |
2,608 |
|
| |
|
|
0 |
|
|
|
0 |
|
|
|
1,042 |
|
|
|
0 |
|
|
|
0 |
|
|
|
1,042 |
|
|
| |
|
|
|
|
|
|
|
|
|
|
|
|
|
|
|
|
|
|
|
|
|
|
|
|
| |
$ |
0 |
|
|
$ |
0 |
|
|
$ |
1,042 |
|
|
$ |
2,608 |
|
|
$ |
0 |
|
|
$ |
3,650 |
|
|
| |
|
|
|
|
|
|
|
|
|
|
|
|
|
|
|
|
|
|
|
|
|
|
|
|
| |
$ |
365 |
|
|
$ |
0 |
|
|
$ |
1,042 |
|
|
$ |
2,608 |
|
|
$ |
0 |
|
|
$ |
4,015 |
|
|
| |
|
|
|
|
|
|
|
|
|
|
|
|
|
|
|
|
|
|
|
|
|
|
|
|
|
|
|
|
|
|
|
|
|
|
|
|
|
|
|
|
|
|
|
|
|
|
|
| |
| |
|
Derivatives not accounted for as hedging instruments |
|
| |
|
Commodity
Contracts |
|
|
Credit
Contracts |
|
|
Equity
Contracts |
|
|
Foreign
Exchange
Contracts |
|
|
Interest
Rate Contracts |
|
|
Total |
|
Financial Derivative Instruments - Liabilities |
|
| |
|
Forward Foreign Currency Contracts |
|
$ |
0 |
|
|
$ |
0 |
|
|
$ |
0 |
|
|
$ |
4,163 |
|
|
$ |
0 |
|
|
$ |
4,163 |
|
| |
|
|
0 |
|
|
|
0 |
|
|
|
3,760 |
|
|
|
0 |
|
|
|
0 |
|
|
|
3,760 |
|
|
| |
|
|
|
|
|
|
|
|
|
|
|
|
|
|
|
|
|
|
|
|
|
|
|
|
| |
$ |
0 |
|
|
$ |
0 |
|
|
$ |
3,760 |
|
|
$ |
4,163 |
|
|
$ |
0 |
|
|
$ |
7,923 |
|
|
| |
|
|
|
|
|
|
|
|
|
|
|
|
|
|
|
|
|
|
|
|
|
|
|
The effect of Financial Derivative Instruments on the Consolidated Statements of Operations for the period ended June 30, 2025:
|
|
|
|
|
|
|
|
|
|
|
|
|
|
|
|
|
|
|
|
|
|
|
|
| |
| |
|
Derivatives not accounted for as hedging instruments |
|
| |
|
|
|
|
|
|
|
|
|
|
|
|
|
|
|
|
|
|
Net Realized Gain (Loss) on Financial Derivative Instruments |
|
Exchange-traded or centrally cleared |
|
| |
|
$ |
(9,512 |
) |
|
$ |
0 |
|
|
$ |
0 |
|
|
$ |
0 |
|
|
$ |
0 |
|
|
$ |
(9,512 |
) |
| |
|
|
0 |
|
|
|
0 |
|
|
|
0 |
|
|
|
0 |
|
|
|
(1 |
) |
|
|
(1 |
) |
|
| |
|
|
|
|
|
|
|
|
|
|
|
|
|
|
|
|
|
|
|
|
|
|
|
|
| |
$ |
(9,512 |
) |
|
$ |
0 |
|
|
$ |
0 |
|
|
$ |
0 |
|
|
$ |
(1 |
) |
|
$ |
(9,513 |
) |
|
| |
|
|
|
|
|
|
|
|
|
|
|
|
|
|
|
|
|
|
|
|
|
|
|
| |
|
Forward Foreign Currency Contracts |
|
$ |
0 |
|
|
$ |
0 |
|
|
$ |
0 |
|
|
$ |
2,008 |
|
|
$ |
0 |
|
|
$ |
2,008 |
|
| |
|
|
0 |
|
|
|
0 |
|
|
|
59,914 |
|
|
|
0 |
|
|
|
0 |
|
|
|
59,914 |
|
|
| |
|
|
|
|
|
|
|
|
|
|
|
|
|
|
|
|
|
|
|
|
|
|
|
|
| |
$ |
0 |
|
|
$ |
0 |
|
|
$ |
59,914 |
|
|
$ |
2,008 |
|
|
$ |
0 |
|
|
$ |
61,922 |
|
|
| |
|
|
|
|
|
|
|
|
|
|
|
|
|
|
|
|
|
|
|
|
|
|
|
|
| |
$ |
(9,512 |
) |
|
$ |
0 |
|
|
$ |
59,914 |
|
|
$ |
2,008 |
|
|
$ |
(1 |
) |
|
$ |
52,409 |
|
|
| |
|
|
|
|
|
|
|
|
|
|
|
|
|
|
|
|
|
|
|
|
|
|
|
|
Net Change in Unrealized Appreciation (Depreciation) on Financial Derivative Instruments |
|
Exchange-traded or centrally cleared |
|
| |
|
$ |
(2,849 |
) |
|
$ |
0 |
|
|
$ |
0 |
|
|
$ |
0 |
|
|
$ |
0 |
|
|
$ |
(2,849 |
) |
| |
|
|
0 |
|
|
|
0 |
|
|
|
0 |
|
|
|
0 |
|
|
|
3 |
|
|
|
3 |
|
|
| |
|
|
|
|
|
|
|
|
|
|
|
|
|
|
|
|
|
|
|
|
|
|
|
|
| |
$ |
(2,849 |
) |
|
$ |
0 |
|
|
$ |
0 |
|
|
$ |
0 |
|
|
$ |
3 |
|
|
$ |
(2,846 |
) |
|
| |
|
|
|
|
|
|
|
|
|
|
|
|
|
|
|
|
|
|
|
|
|
|
|
| |
|
Forward Foreign Currency Contracts |
|
$ |
0 |
|
|
$ |
0 |
|
|
$ |
0 |
|
|
$ |
(1,812 |
) |
|
$ |
0 |
|
|
$ |
(1,812 |
) |
| |
|
|
0 |
|
|
|
0 |
|
|
|
(35,510 |
) |
|
|
0 |
|
|
|
0 |
|
|
|
(35,510 |
) |
|
| |
|
|
|
|
|
|
|
|
|
|
|
|
|
|
|
|
|
|
|
|
|
|
|
|
| |
$ |
0 |
|
|
$ |
0 |
|
|
$ |
(35,510 |
) |
|
$ |
(1,812 |
) |
|
$ |
0 |
|
|
$ |
(37,322 |
) |
|
| |
|
|
|
|
|
|
|
|
|
|
|
|
|
|
|
|
|
|
|
|
|
|
|
|
| |
$ |
(2,849 |
) |
|
$ |
0 |
|
|
$ |
(35,510 |
) |
|
$ |
(1,812 |
) |
|
$ |
3 |
|
|
$ |
(40,168 |
) |
|
| |
|
|
|
|
|
|
|
|
|
|
|
|
|
|
|
|
|
|
|
|
|
|
|
FAIR VALUE MEASUREMENTS
The following is a summary of the fair valuations according to the inputs used as of June 30, 2025 in valuing the Fund’s assets and
liabilities:
|
|
|
|
|
|
|
|
|
|
|
|
|
|
|
|
| |
|
|
|
|
|
|
|
|
|
|
|
|
|
Investments in Securities, at Value |
|
Loan Participations and Assignments |
|
$ |
0 |
|
|
$ |
194,197 |
|
|
$ |
45,544 |
|
|
$ |
239,741 |
|
| |
|
| |
|
|
0 |
|
|
|
42,914 |
|
|
|
728 |
|
|
|
43,642 |
|
| |
|
|
0 |
|
|
|
201,918 |
|
|
|
3,162 |
|
|
|
205,080 |
|
| |
|
|
0 |
|
|
|
15,069 |
|
|
|
7,905 |
|
|
|
22,974 |
|
| |
|
| |
|
|
0 |
|
|
|
389 |
|
|
|
0 |
|
|
|
389 |
|
| |
|
|
0 |
|
|
|
26,108 |
|
|
|
0 |
|
|
|
26,108 |
|
Non-Agency Mortgage-Backed Securities |
|
|
0 |
|
|
|
113,524 |
|
|
|
0 |
|
|
|
113,524 |
|
| |
|
| |
|
|
0 |
|
|
|
10,478 |
|
|
|
0 |
|
|
|
10,478 |
|
| |
|
|
0 |
|
|
|
253,424 |
|
|
|
0 |
|
|
|
253,424 |
|
| |
|
|
0 |
|
|
|
3,312 |
|
|
|
0 |
|
|
|
3,312 |
|
| |
|
|
0 |
|
|
|
18,225 |
|
|
|
0 |
|
|
|
18,225 |
|
| |
|
|
0 |
|
|
|
10,326 |
|
|
|
5,520 |
|
|
|
15,846 |
|
| |
|
|
0 |
|
|
|
12,748 |
|
|
|
0 |
|
|
|
12,748 |
|
| |
|
| |
|
|
62,105 |
|
|
|
61 |
|
|
|
0 |
|
|
|
62,166 |
|
| |
|
|
0 |
|
|
|
0 |
|
|
|
735 |
|
|
|
735 |
|
Master Limited Partnerships |
|
| |
|
|
147,457 |
|
|
|
0 |
|
|
|
0 |
|
|
|
147,457 |
|
|
|
|
|
|
|
|
|
|
|
|
|
|
|
|
|
| |
Category and Subcategory |
|
Level 1 |
|
|
Level 2 |
|
|
Level 3 |
|
|
Fair
Value at
06/30/2025 |
|
| |
|
| |
|
$ |
0 |
|
|
$ |
2,200 |
|
|
$ |
0 |
|
|
$ |
2,200 |
|
| |
|
|
0 |
|
|
|
8,788 |
|
|
|
0 |
|
|
|
8,788 |
|
|
| |
|
|
|
|
|
|
|
|
|
|
|
|
|
|
|
|
| |
$ |
209,562 |
|
|
$ |
913,681 |
|
|
$ |
63,594 |
|
|
$ |
1,186,837 |
|
|
| |
|
|
|
|
|
|
|
|
|
|
|
|
|
|
|
|
Investments in Affiliates, at Value |
|
| |
|
| |
|
|
0 |
|
|
|
244,592 |
|
|
|
0 |
|
|
|
244,592 |
|
| |
|
Central Funds Used for Cash Management Purposes |
|
|
136,258 |
|
|
|
0 |
|
|
|
0 |
|
|
|
136,258 |
|
|
| |
|
|
|
|
|
|
|
|
|
|
|
|
|
|
|
|
| |
$ |
136,258 |
|
|
$ |
244,592 |
|
|
$ |
0 |
|
|
$ |
380,850 |
|
|
| |
|
|
|
|
|
|
|
|
|
|
|
|
|
|
|
|
|
|
|
| |
| |
|
$ |
345,820 |
|
|
$ |
1,158,273 |
|
|
$ |
63,594 |
|
|
$ |
1,567,687 |
|
|
| |
|
|
|
|
|
|
|
|
|
|
|
|
|
|
|
|
Financial Derivative Instruments - Assets |
|
Exchange-traded or centrally cleared |
|
|
365 |
|
|
|
0 |
|
|
|
0 |
|
|
|
365 |
|
| |
|
|
0 |
|
|
|
3,650 |
|
|
|
0 |
|
|
|
3,650 |
|
|
| |
|
|
|
|
|
|
|
|
|
|
|
|
|
|
|
|
| |
$ |
365 |
|
|
$ |
3,650 |
|
|
$ |
0 |
|
|
$ |
4,015 |
|
|
| |
|
|
|
|
|
|
|
|
|
|
|
|
|
|
|
|
|
|
|
|
|
|
|
|
|
|
|
| |
See Accompanying Notes |
|
|
|
|
|
| |
|
|
JUNE 30, 2025 |
|
|
|
|
|
|
|
|
|
| |
Consolidated Schedule of Investments |
|
PIMCO Dynamic Income Strategy Fund |
|
|
|
June 30, 2025 |
|
|
|
|
|
|
|
|
|
|
|
|
|
|
|
|
| |
Category and Subcategory |
|
Level 1 |
|
|
Level 2 |
|
|
Level 3 |
|
|
Fair
Value at
06/30/2025 |
|
Financial Derivative Instruments - Liabilities |
|
| |
|
$ |
0 |
|
|
$ |
(7,923 |
) |
|
$ |
0 |
|
|
$ |
(7,923 |
) |
|
| |
|
|
|
|
|
|
|
|
|
|
|
|
|
|
|
|
|
|
|
| |
Total Financial Derivative Instruments |
|
$ |
365 |
|
|
$ |
(4,273 |
) |
|
$ |
0 |
|
|
$ |
(3,908 |
) |
|
| |
|
|
|
|
|
|
|
|
|
|
|
|
|
|
|
|
|
|
|
| |
| |
|
$ |
346,185 |
|
|
$ |
1,154,000 |
|
|
$ |
63,594 |
|
|
$ |
1,563,779 |
|
|
| |
|
|
|
|
|
|
|
|
|
|
|
|
|
|
|
The following is a reconciliation of the fair valuations using significant unobservable inputs (Level 3) for the Fund during the period ended June 30, 2025:
|
|
|
|
|
|
|
|
|
|
|
|
|
|
|
|
|
|
|
|
|
|
|
|
|
|
|
|
|
|
|
|
|
|
|
|
|
|
|
|
| |
|
|
Beginning
Balance
at 06/30/2024 |
|
|
|
|
|
|
|
|
Accrued
Discounts/
(Premiums) |
|
|
|
|
|
Net Change in Unrealized Appreciation/ (Depreciation) (1) |
|
|
|
|
|
|
|
|
Ending
Balance
at 06/30/2025 |
|
|
Net Change in Unrealized Appreciation/ (Depreciation) on Investments Held at 06/30/2025 (1) |
|
Investments in Securities, at Value |
|
Loan Participations and Assignments |
|
$ |
23,053 |
|
|
$ |
42,482 |
|
|
$ |
(16,227 |
) |
|
$ |
172 |
|
|
$ |
71 |
|
|
$ |
947 |
|
|
$ |
0 |
|
|
$ |
(4,954 |
) |
|
$ |
45,544 |
|
|
$ |
1,092 |
|
| |
|
| |
|
|
0 |
|
|
|
702 |
|
|
|
0 |
|
|
|
0 |
|
|
|
0 |
|
|
|
26 |
|
|
|
0 |
|
|
|
0 |
|
|
|
728 |
|
|
|
26 |
|
| |
|
|
0 |
|
|
|
0 |
|
|
|
0 |
|
|
|
0 |
|
|
|
0 |
|
|
|
0 |
|
|
|
3,162 |
|
|
|
0 |
|
|
|
3,162 |
|
|
|
0 |
|
| |
|
|
0 |
|
|
|
8,000 |
|
|
|
0 |
|
|
|
0 |
|
|
|
0 |
|
|
|
(95 |
) |
|
|
0 |
|
|
|
0 |
|
|
|
7,905 |
|
|
|
(95 |
) |
| |
|
| |
|
|
74 |
|
|
|
0 |
|
|
|
(8 |
) |
|
|
2 |
|
|
|
3 |
|
|
|
(1 |
) |
|
|
0 |
|
|
|
(70 |
) |
|
|
0 |
|
|
|
0 |
|
| |
|
|
2,127 |
|
|
|
2,925 |
|
|
|
0 |
|
|
|
(24 |
) |
|
|
0 |
|
|
|
492 |
|
|
|
0 |
|
|
|
0 |
|
|
|
5,520 |
|
|
|
493 |
|
| |
|
| |
|
|
792 |
|
|
|
0 |
|
|
|
0 |
|
|
|
0 |
|
|
|
0 |
|
|
|
(57 |
) |
|
|
0 |
|
|
|
0 |
|
|
|
735 |
|
|
|
(57 |
) |
Investments in Securities, at Value |
|
| |
|
Affiliated Investments (2) |
|
$ |
212,794 |
|
|
$ |
0 |
|
|
$ |
0 |
|
|
$ |
0 |
|
|
$ |
0 |
|
|
$ |
31,798 |
|
|
$ |
0 |
|
|
$ |
(244,592 |
) |
|
$ |
0 |
|
|
$ |
0 |
|
|
| |
|
|
|
|
|
|
|
|
|
|
|
|
|
|
|
|
|
|
|
|
|
|
|
|
|
|
|
|
|
|
|
|
|
|
|
|
|
|
|
|
|
|
|
|
|
|
|
|
|
| |
| |
|
$ |
238,840 |
|
|
$ |
54,109 |
|
|
$ |
(16,235 |
) |
|
$ |
150 |
|
|
$ |
74 |
|
|
$ |
33,110 |
|
|
$ |
3,162 |
|
|
$ |
(249,616 |
) |
|
$ |
63,594 |
|
|
$ |
1,459 |
|
|
| |
|
|
|
|
|
|
|
|
|
|
|
|
|
|
|
|
|
|
|
|
|
|
|
|
|
|
|
|
|
|
|
|
|
|
|
|
|
|
|
The following is a summary of significant unobservable inputs used in the fair valuations of assets and liabilities categorized within Level 3 of the fair value hierarchy:
|
|
|
|
|
|
|
|
|
|
|
|
|
|
|
|
|
|
|
|
| |
|
|
Ending
Balance
at 06/30/2025 |
|
|
|
|
|
|
|
|
|
(% Unless Noted Otherwise) |
|
| |
|
|
|
|
|
|
|
|
Investments in Securities, at Value |
|
Loan Participations and Assignments |
|
$ |
26,215 |
|
|
|
|
|
|
|
|
| |
|
|
|
|
|
8.403 |
|
|
| |
|
9,191 |
|
|
Indicative Market Quotation |
|
|
|
|
|
| |
|
|
|
|
|
96.077 |
|
|
| |
|
3,475 |
|
|
|
|
|
|
|
|
| |
|
99.000-100.000 |
|
|
|
99.288 |
|
|
| |
|
6,663 |
|
|
|
|
|
|
|
|
| |
|
|
|
|
|
100.960 |
|
| |
|
|
|
| |
| |
| |
|
|
| |
|
|
| |
|
| |
| |
|
|
303 |
|
|
|
|
|
|
|
|
| |
|
6.624 |
|
|
|
— |
|
|
| |
|
425 |
|
|
|
|
|
|
|
|
| |
|
93.500 |
|
|
|
— |
|
| |
|
|
3,162 |
|
|
Indicative Market Quotation |
|
|
|
|
|
| |
|
|
|
|
|
73.927 |
|
| |
|
|
7,905 |
|
|
|
|
|
|
|
|
| |
|
7.532 |
|
|
|
— |
|
| |
|
| |
|
|
5,520 |
|
|
|
|
|
|
|
|
| |
|
9.860-12.000 |
|
|
|
10.857 |
|
| |
|
| |
|
|
735 |
|
|
|
|
|
|
|
|
| |
|
5.200 |
|
|
|
— |
|
|
| |
|
|
|
|
| |
| |
|
|
| |
|
|
| |
|
| |
| |
|
$ |
63,594 |
|
|
| |
| |
|
|
| |
|
|
| |
|
| |
|
| |
|
|
|
|
| |
| |
|
|
| |
|
|
| |
|
| |
|
Any difference between Net Change in Unrealized Appreciation/(Depreciation) and Net Change in Unrealized Appreciation/(Depreciation) on Investments Held at June 30, 2025 may be due to an investment no longer held or categorized as Level 3 at period end. |
|
Sector type updated from Energy to Affiliated Investments since prior fiscal year end. |
|
|
|
|
|
|
| |
126 |
|
PIMCO CLOSED-END FUNDS |
|
|
See Accompanying Notes |
|
|
|
|
|
| |
Notes to Financial Statements |
|
|
|
June 30, 2025 |
1. ORGANIZATION
PCM Fund, Inc., PIMCO Global StocksPLUS
& Income Fund, PIMCO Strategic Income Fund, Inc., PIMCO Access Income Fund, PIMCO Dynamic Income Fund, PIMCO Dynamic Income Opportunities Fund and PIMCO Dynamic Income Strategy Fund (each, a “Fund” and collectively, the “Funds”) are organized as
closed-end
management investment companies registered under the Investment Company Act of 1940, as amended, and the rules and regulations thereunder (the “Act”). PIMCO Global StocksPLUS
& Income Fund, PIMCO Access Income Fund, PIMCO Dynamic Income Fund, and PIMCO Dynamic Income Opportunities Fund were organized as Massachusetts business trusts on the dates shown in the table below. PCM Fund, Inc. and PIMCO Strategic Income Fund, Inc. were organized as Maryland corporations on the dates shown in the table below. Pacific Investment Management Company LLC (“PIMCO” or the “Manager”) serves as the Funds’ investment manager.
|
|
|
|
|
|
|
|
| |
|
|
|
|
|
|
|
|
|
| |
| PCM Fund, Inc. |
|
|
|
| |
|
June 23, 1993 |
|
|
|
| |
PIMCO Global StocksPLUS & Income Fund |
|
|
|
| |
|
February 16, 2005 |
|
|
|
| |
| PIMCO Strategic Income Fund, Inc. |
|
|
|
| |
|
December 9, 1993 |
|
|
|
| |
| PIMCO Access Income Fund |
|
|
|
| |
|
October 1, 2021 |
|
|
|
| |
| PIMCO Dynamic Income Fund |
|
|
|
| |
|
January 19, 2011 |
|
|
|
| |
| PIMCO Dynamic Income Opportunities Fund |
|
|
|
| |
|
December 23, 2019 |
|
|
|
| |
| PIMCO Dynamic Income Strategy Fund |
|
|
|
| |
|
October 25, 2018 |
|
PIMCO Access Income Fund, PIMCO Dynamic Income Fund, and PIMCO Dynamic Income Opportunities Fund have established wholly-owned subsidiaries in Delaware. PIMCO Dynamic Income Strategy Fund has established wholly-owned subsidiaries in Cayman Islands and Delaware. See Note 14, Basis for Consolidation in the Notes to Financial Statements for more information regarding the treatment of each Fund’s subsidiaries in the financial statements.
Hereinafter, the Board of Trustees of the Funds shall be collectively referred to as the “Board.”
Each Fund has adopted the Financial Accounting Standards Board (“FASB”) Accounting Standards Update (“ASU”)
2023-07,
Segment Reporting (Topic 280) — Improvements to Reportable Segment Disclosures. Adoption of the new standard impacted financial statement disclosures only and did not affect the Funds’ financial position or the results of its operations. An operating segment is defined in Topic 280 as a component of a public entity that engages in business activities from which it may recognize revenues and incur expenses, has operating results that are regularly reviewed by the public entity’s chief operating decision maker (“CODM”) to make decisions about resources to be allocated to the segment and to assess its performance, and has discrete financial information available. The Officers of the Funds, as listed in the Management of the Funds section
of the most recent annual report, act as the Funds’ CODM. Each Fund represents a single operating segment, as the CODM monitors the operating results of the Funds as a whole and each Fund’s long-term strategic asset allocation is
pre-determined
in accordance with the terms of its prospectus, based on a defined investment strategy which is executed by the Funds’ portfolio managers as a team. The financial information in the form of each Fund’s portfolio composition, total returns, expense ratios and changes in net assets (i.e., changes in net assets resulting from operations, subscriptions and redemptions), which are used by the CODM to assess the segment’s performance versus each Fund’s comparative benchmarks and to make resource allocation decisions for each Fund’s single segment, is consistent with that presented within the Funds’ financial statements. Segment assets are reflected on the accompanying Statements of Assets and Liabilities as “total assets” and significant segment expenses are listed on the accompanying Statements of Operations.
2. SIGNIFICANT ACCOUNTING POLICIES
The following is a summary of significant accounting policies consistently followed by each Fund in the preparation of its financial statements in conformity with accounting principles generally accepted in the United States of America (“U.S. GAAP”). Each Fund is treated as an investment company under the reporting requirements of U.S. GAAP, including but not limited to ASC 946. The functional and reporting currency for the Funds is the U.S. dollar. The preparation of financial statements in accordance with U.S. GAAP requires management to make estimates and assumptions that affect the reported amounts of assets and liabilities and disclosure of contingent assets and liabilities at the date of the financial statements and the reported amounts of increases and decreases in net assets from operations during the reporting period. Actual results could differ from those estimates.
(a) Securities Transactions and Investment Income
Securities transactions are recorded as of the trade date for financial reporting purposes. Securities purchased or sold on a when-issued or delayed-delivery basis may be settled beyond a standard settlement period for the security after the trade date. Realized gains (losses) from securities sold are recorded on the identified cost basis. Dividend income is recorded on the
ex-dividend
date, except certain dividends from foreign securities where the
ex-dividend
date may have passed, which are recorded as soon as a Fund is informed of the
ex-dividend
date. Interest income, adjusted for the accretion of discounts and amortization of premiums, is recorded on the accrual basis from settlement date, with the exception of securities with a forward starting effective date, where interest income is recorded on the accrual basis from effective date. For convertible securities, premiums attributable to the conversion feature are not amortized. Estimated tax liabilities on
|
|
|
|
|
|
|
|
|
|
|
|
| |
| |
|
|
ANNUAL REPORT |
|
|
| |
|
|
JUNE 30, 2025 |
|
|
127 |
|
|
|
|
| |
Notes to Financial Statements |
|
|
|
|
certain foreign securities are recorded on an accrual basis and are reflected as components of interest income or net change in unrealized appreciation (depreciation) on investments on the Statements of Operations, as appropriate. Tax liabilities realized as a result of such security sales are reflected as a component of net realized gain (loss) on investments on the Statements of Operations. Paydown gains (losses) on mortgage-related and other asset-backed securities, if any, are recorded as components of interest income on the Statements of Operations. Income or short-term capital gain distributions received from registered investment companies, if any, are recorded as dividend income. Long-term capital gain distributions received from registered investment companies, if any, are recorded as realized gains.
Debt obligations may be placed on
non-accrual
status and related interest income may be reduced by ceasing current accruals and writing off interest receivable when the collection of all or a portion of interest has become doubtful based on consistently applied procedures. A debt obligation is removed from
non-accrual
status when the issuer resumes interest payments or when collectability of interest is probable. A debt obligation may be granted, in certain situations, a contractual or
non-contractual
forbearance for interest payments that are expected to be paid after agreed upon pay dates.
(b) Foreign Taxes
A Fund may be subject to foreign taxes on income, stock dividends, capital gains on investments or certain foreign currency transactions. All foreign taxes are recorded in accordance with the applicable foreign tax regulations and rates that exist in the foreign jurisdictions in which a Fund invests. These foreign taxes, if any, are paid by a Fund and are reflected in its Statement of Operations as follows: foreign taxes withheld at source are presented as a reduction of income, foreign taxes on securities lending income are presented as a reduction of securities lending income, foreign taxes on stock dividends are presented as “other foreign taxes”, and foreign taxes on capital gains from sales of investments and foreign taxes on foreign currency transactions are included in their respective net realized gain (loss) categories. Foreign taxes payable as of June 30, 2025, if any, are disclosed in the Statements of Assets and Liabilities.
(c) Foreign Currency Translation
The market values of foreign securities, currency holdings and other assets and liabilities denominated in foreign currencies are translated into U.S. dollars based on the current exchange rates each business day. Purchases and sales of securities and income and expense items denominated in foreign currencies, if any, are translated into U.S. dollars at the exchange rate in effect on the transaction date. The Funds do not separately report the effects of changes in foreign exchange rates from changes in market prices on securities held. Such changes are included in net realized gain (loss) and net change in unrealized appreciation (depreciation) from investments on the Statements of Operations. The
Funds may invest in foreign currency-denominated securities and may engage in foreign currency transactions either on a spot (cash) basis at the rate prevailing in the currency exchange market at the time or through a forward foreign currency contract. Realized foreign exchange gains (losses) arising from sales of spot foreign currencies, currency gains (losses) realized between the trade and settlement dates on securities transactions and the difference between the recorded amounts of dividends, interest and foreign withholding taxes and the U.S. dollar equivalent of the amounts actually received or paid are included in net realized gain (loss) on foreign currency transactions on the Statements of Operations. Net unrealized foreign exchange gains (losses) arising from changes in foreign exchange rates on foreign denominated assets and liabilities other than investments in securities held at the end of the reporting period are included in net change in unrealized appreciation (depreciation) on foreign currency assets and liabilities on the Statements of Operations.
(d) Distributions — Common Shares
The following table shows the anticipated frequency of distributions from net investment income to common shareholders.
|
|
|
|
|
|
|
|
|
|
|
|
| |
| |
|
|
|
|
|
|
|
| |
|
|
|
|
|
|
|
|
|
|
|
|
|
| |
| PCM Fund, Inc. |
|
|
|
| |
|
Monthly |
|
|
|
Monthly |
|
|
|
|
| |
PIMCO Global StocksPLUS & Income Fund |
|
|
|
| |
|
Monthly |
|
|
|
Monthly |
|
|
|
|
| |
| PIMCO Strategic Income Fund, Inc. |
|
|
|
| |
|
Monthly |
|
|
|
Monthly |
|
|
|
|
| |
| PIMCO Access Income Fund |
|
|
|
| |
|
Monthly |
|
|
|
Monthly |
|
|
|
|
| |
| PIMCO Dynamic Income Fund |
|
|
|
| |
|
Monthly |
|
|
|
Monthly |
|
|
|
|
| |
| PIMCO Dynamic Income Opportunities Fund |
|
|
|
| |
|
Monthly |
|
|
|
Monthly |
|
|
|
|
| |
| PIMCO Dynamic Income Strategy Fund |
|
|
|
| |
|
Monthly |
|
|
|
Monthly |
|
Each Fund other than PIMCO Global StocksPLUS
& Income Fund and PIMCO Strategic Income Fund, Inc. generally distributes each year all of its net investment income and net short-term capital gains. PIMCO Global StocksPLUS
& Income Fund and PIMCO Strategic Income Fund, Inc. intend to distribute all or substantially all of their net investment income and net short-term capital gains over time. In addition, at least annually, each Fund generally distributes net realized long-term capital gains not previously distributed, if any. A Fund may revise its distribution policy or postpone the payment of distributions at any time.
Certain Funds may invest in one or more wholly-owned subsidiaries (each a “Subsidiary” and collectively the “Subsidiaries”) that are treated as disregarded entities for U.S. federal income tax purposes. In the case of a subsidiary that is so treated, for U.S. federal income tax purposes, (i) the Fund is treated as owning the subsidiary’s assets directly; (ii) any income, gain, loss, deduction or other tax items arising in respect of the subsidiary’s assets will be treated as if they are realized or incurred, as applicable, directly by the Fund; and (iii) distributions, if any, the Fund receives from the subsidiary will have no effect on a Fund’s U.S. federal income tax liability.
|
|
|
|
|
|
| |
128 |
|
PIMCO CLOSED-END FUNDS |
|
|
|
|
PIMCO Cayman Commodity Fund IX, Ltd., a Subsidiary of PIMCO Dynamic Income Strategy Fund organized under the laws of the Cayman Islands (the “Cayman Subsidiary”), will be treated as a controlled foreign corporation. As a result, the Fund will be required to include in gross income for U.S. federal income tax purposes all of its Cayman Subsidiary’s “subpart F income,” whether or not such income is distributed by such Cayman Subsidiary. It is expected that all of the Cayman Subsidiary’s income and realized gains and
gains will be “subpart F income.” The Fund’s recognition of its Cayman Subsidiary’s “subpart F income” will increase such Fund’s tax basis in its Cayman Subsidiary. Distributions by the Cayman Subsidiary to its Fund will be
tax-free,
to the extent of its previously undistributed “subpart F income,” and will correspondingly reduce the Fund’s tax basis in its Cayman Subsidiary. “Subpart F income” is generally treated by the Fund as ordinary income, regardless of the character of the Cayman Subsidiary’s underlying income or gains. If a net loss is realized by the Cayman Subsidiary, such loss is not generally available to offset the income earned by the Cayman Subsidiary’s parent Fund, and such loss cannot be carried forward to offset taxable income of the parent Fund or the Cayman Subsidiary in future periods.
As of the end of the fiscal year ended June 30, 2025, none of the Funds were in default on long-term debt or had any accumulated dividend in arrears.
A Fund may engage in investment strategies, including those that employ the use of derivatives, to, among other things, seek to generate current, distributable income without regard to possible declines in the Fund’s net asset value (“NAV”). A Fund’s income and gain generating strategies, including certain derivatives strategies, may generate current income and gains taxable as ordinary income sufficient to support monthly distributions even in situations when the Fund has experienced a decline in net assets due to, for example, adverse changes in the broad U.S. or
non-U.S.
equity markets or the Fund’s debt investments, or arising from its use of derivatives. A Fund may enter into opposite sides of interest rate swap and other derivatives for the principal purpose of generating distributable gains on the one side (characterized as ordinary income for tax purposes) that are not part of the Fund’s duration or yield curve management strategies, and with a substantial possibility that the Fund will experience a corresponding capital loss and decline in NAV with respect to the opposite side transaction (to the extent it does not have corresponding offsetting capital gains). Consequently, common shareholders may receive distributions and owe tax on amounts that are effectively a taxable return of the shareholder’s investment in the Fund at a time when their investment in a Fund has declined in value, which may be taxed at ordinary income rates. The tax treatment of certain derivatives in which a Fund invests may be unclear and thus subject to recharacterization.
Any recharacterization of payments made or received by a Fund pursuant to derivatives potentially could affect the amount, timing or character of Fund distributions. In addition, the tax treatment of such investment strategies may be changed by regulation or otherwise.
More generally, sales of a Fund’s portfolio holdings may result in short-term capital gains (which are generally taxed to shareholders at ordinary income tax rates when distributed net of short-term capital losses and net of long-term capital losses), potentially subjecting shareholders of the Fund to adverse tax consequences.
Income distributions and capital gain distributions are determined in accordance with income tax regulations which may differ from U.S. GAAP. Differences between tax regulations and U.S. GAAP may cause timing differences between income and capital gain recognition. Further, the character of investment income and capital gains may be different for certain transactions under the two methods of accounting. As a result, income distributions and capital gain distributions declared during a fiscal period may differ significantly from the net investment income (loss) and realized gains (losses) reported on each Fund’s annual financial statements presented under U.S. GAAP.
Separately, if a Fund determines or estimates, as applicable, that a portion of a distribution may be comprised of amounts from sources other than net investment income in accordance with its policies, accounting records (if applicable) and accounting practices, the Fund will notify shareholders of the estimated composition of such distribution through a Section 19 Notice. For these purposes, a Fund determines or estimates, as applicable, the source or sources from which a distribution is paid, to the close of the period as of which it is paid, in reference to its internal accounting records and related accounting practices. If, based on such accounting records and practices, it is determined or estimated, as applicable, that a particular distribution does not include capital gains or
paid-in
surplus or other capital sources, a Section 19 Notice generally would not be issued. It is important to note that differences exist between a Fund’s daily internal accounting records and practices, a Fund’s financial statements presented in accordance with U.S. GAAP, and recordkeeping practices under income tax regulations. For instance, a Fund’s internal accounting records and practices may take into account, among other factors,
tax-related
characteristics of certain sources of distributions that differ from treatment under U.S. GAAP. Examples of such differences may include, but are not limited to, for certain Funds, the treatment of periodic payments under interest rate swap contracts. Accordingly, among other consequences, it is possible that a Fund may not issue a Section 19 Notice in situations where the Fund’s financial statements prepared later and in accordance with U.S. GAAP and/or the final tax character of those distributions might later report that the sources of those distributions included capital gains and/or a return of
|
|
|
|
|
|
|
|
|
|
|
|
| |
| |
|
|
ANNUAL REPORT |
|
|
| |
|
|
JUNE 30, 2025 |
|
|
129 |
|
|
|
|
| |
Notes to Financial Statements |
|
|
|
|
capital. Please visit www.pimco.com for the most recent Section 19 Notice, if applicable, for additional information regarding the estimated composition of distributions. Final determination of a distribution’s tax character will be provided to shareholders when such information is available.
Distributions classified as a tax basis return of capital at a Fund’s fiscal year end, if any, are reflected on the Statements of Changes in Net Assets and have been recorded to paid in capital on the Statements of Assets and Liabilities. In addition, other amounts have been reclassified between distributable earnings (accumulated loss) and paid in capital on the Statements of Assets and Liabilities to more appropriately conform U.S. GAAP to tax characterizations of distributions.
(e) New Accounting Pronouncements and Regulatory Updates
In September 2023, the U.S. Securities and Exchange Commission (“SEC”) adopted amendments to Rule
35d-1
under the Act, the rule governing fund naming conventions (the “Names Rule”). In general, the Names Rule requires funds with certain types of names to adopt a policy to invest at least 80% of their assets in the type of investment suggested by the name. The amendments expand the scope of the current rule to include any term used in a fund name that suggests the fund makes investments that have, or whose issuers have, particular characteristics. Additionally, the amendments modify the circumstances under which a fund may deviate from its 80% investment policy and address the calculation methodology of derivatives instruments for purposes of the rule. Changes to a fund’s calculation methodology for derivatives instruments for purposes of Rule
35d-1
consistent with such amendments and applicable regulatory interpretations thereof will not constitute a change to a fund’s policy adopted pursuant to Rule
35d-1
and will not require notice or shareholder approval. The amendments became effective December 11, 2023. On March 14, 2025, the SEC extended the compliance date from December 11, 2025 to June 11, 2026 for fund groups with $1 billion or more in net assets and modified the operation of the compliance dates to allow for compliance based on the timing of certain annual disclosure and reporting obligations that are tied to a fund’s fiscal
year-end.
At this time, management is evaluating the implications of these changes on the financial statements.
In November 2023, the FASB issued ASU
2023-07,
“Segment Reporting (Topic 280)”. ASU
2023-07
requires public entities to provide disclosure of significant segment expenses that are regularly provided to the CODM. ASU
2023-07,
among other things, (i) requires a single segment public entity to provide all necessary disclosures required by Topic 280, (ii) mandates the disclosure of the title and position of the CODM and an explanation of how the CODM uses the reported measure(s) of segment profit and loss to assess segment performance and to decide how to allocate resources and (iii) provides
the ability for a public entity to elect more than one performance measure. ASU
2023-07
is effective for fiscal years beginning after December 15, 2023, and interim periods within fiscal years beginning after December 15, 2024. Management has implemented changes in connection with the amendments and has determined that there was no material impact to the Funds’ financial statements.
In December 2023, FASB issued ASU
2023-09,
which amends quantitative and qualitative income tax disclosure requirements in order to increase disclosure consistency, bifurcate income tax information by jurisdiction and remove information that is no longer beneficial. The ASU is effective for annual periods beginning after December 15, 2024, and early adoption is permitted. At this time, management is evaluating the implications of these changes on the financial statements.
3. INVESTMENT VALUATION AND FAIR VALUE MEASUREMENTS
(a) Investment Valuation Policies
The NAV of a Fund’s shares, or each of its share classes, as applicable, is determined by dividing the total value of portfolio investments and other assets attributable to the Fund or class, less any liabilities, as applicable, by the total number of shares outstanding.
On each day that the New York Stock Exchange (“NYSE”) is open, each Fund’s shares are ordinarily valued as of the close of regular trading (normally 4:00 p.m., Eastern time) (“NYSE Close”). Information that becomes known to the Fund or its agents after the time as of which NAV has been calculated on a particular day will not generally be used to retroactively adjust the price of a security or the NAV determined earlier that day. If regular trading on the NYSE closes earlier than scheduled, each Fund may calculate its NAV as of the earlier closing time or calculate its NAV as of the NYSE Close for that day. Each Fund generally does not calculate its NAV on days on which the NYSE is not open for business. If the NYSE is closed on a day it would normally be open for business, each Fund may calculate its NAV as of the NYSE Close for such day or such other time that each Fund may determine.
For purposes of calculating NAV, portfolio securities and other assets for which market quotations are readily available are valued at market value. A market quotation is readily available only when that quotation is a quoted price (unadjusted) in active markets for identical investments that a Fund can access at the measurement date, provided that a quotation will not be readily available if it is not reliable. Market value is generally determined on the basis of official closing prices or the last reported sales prices. The Funds will normally use pricing data for domestic equity securities received shortly after the NYSE Close and do not normally take into account trading, clearances or settlements that take place after the NYSE Close. A foreign
(non-U.S.)
equity
|
|
|
|
|
|
| |
130 |
|
PIMCO CLOSED-END FUNDS |
|
|
|
|
security traded on a foreign exchange or on more than one exchange is typically valued using pricing information from the exchange considered by PIMCO to be the primary exchange. If market value pricing is used, a foreign
(non-U.S.)
equity security will be valued as of the close of trading on the foreign exchange, or the NYSE Close, if the NYSE Close occurs before the end of trading on the foreign exchange.
Investments for which market quotations are not readily available are valued at fair value as determined in good faith pursuant to Rule
2a-5
under the Act. As a general principle, the fair value of a security or other asset is the price that would be received to sell an asset or paid to transfer a liability in an orderly transaction between market participants at the measurement date. Pursuant to Rule
2a-5,
the Board has designated PIMCO as the valuation designee (“Valuation Designee”) for each Fund to perform the fair value determination relating to all Fund investments. PIMCO may carry out its designated responsibilities as Valuation Designee through various teams and committees. The Valuation Designee’s policies and procedures govern the Valuation Designee’s selection and application of methodologies for determining and calculating the fair value of Fund portfolio investments. The Valuation Designee may value Fund portfolio securities for which market quotations are not readily available and other Fund assets utilizing inputs from pricing services, quotation reporting systems, valuation agents and other third-party sources (together, “Pricing Sources”).
Domestic and foreign
(non-U.S.)
fixed income securities,
non-exchange
traded derivatives, and equity options are normally valued on the basis of quotes obtained from brokers and dealers or Pricing Sources using data reflecting the earlier closing of the principal markets for those securities. Prices obtained from Pricing Sources may be based on, among other things, information provided by market makers or estimates of market values obtained from yield data relating to investments or securities with similar characteristics. Certain fixed income securities purchased on a delayed-delivery basis are marked to market daily until settlement at the forward settlement date. Common stocks, exchange-traded funds (“ETFs”), exchange-traded notes and financial derivative instruments, such as futures contracts, rights and warrants, or options on futures that are traded on a national securities exchange, are stated at the last reported sale or settlement price on the day of valuation. Exchange traded options, except equity options, futures and options on futures, are valued at the settlement price determined by the relevant exchange. Swap agreements and swaptions are valued on the basis of bid quotes obtained from brokers and dealers or market-based prices supplied by Pricing Sources. With respect to any portion of a Fund’s assets that are invested in one or more
open-end
management investment companies (other than ETFs), a Fund’s NAV will be calculated based on the NAVs of such
investments.
Open-end
management investment companies may include affiliated funds.
If a foreign
(non-U.S.)
equity security’s value has materially changed after the close of the security’s primary exchange or principal market but before the NYSE Close, the security may be valued at fair value. Foreign
(non-U.S.)
equity securities that do not trade when the NYSE is open are also valued at fair value. With respect to foreign
(non-U.S.)
equity securities, a Fund may determine the fair value of investments based on information provided by Pricing Sources, which may recommend fair value or adjustments with reference to other securities, indexes or assets. In considering whether fair valuation is required and in determining fair values, the Valuation Designee may, among other things, consider significant events (which may be considered to include changes in the value of U.S. securities or securities indexes) that occur after the close of the relevant market and before the NYSE Close. A Fund may utilize modeling tools provided by third-party vendors to determine fair values of foreign
(non-U.S.)
securities. For these purposes, unless otherwise determined by the Valuation Designee, any movement in the applicable reference index or instrument (“zero trigger”) between the earlier close of the applicable foreign market and the NYSE Close may be deemed to be a significant event, prompting the application of the pricing model (effectively resulting in daily fair valuations). Foreign exchanges may permit trading in foreign
(non-U.S.)
equity securities on days when a Fund is not open for business, which may result in a Fund’s portfolio investments being affected when shareholders are unable to buy or sell shares.
Investments valued in currencies other than the U.S. dollar are converted to the U.S. dollar using exchange rates obtained from Pricing Sources. As a result, the value of such investments and, in turn, the NAV of a Fund’s shares may be affected by changes in the value of currencies in relation to the U.S. dollar. The value of investments traded in markets outside the United States or denominated in currencies other than the U.S. dollar may be affected significantly on a day that a Fund is not open for business. As a result, to the extent that a Fund holds foreign
(non-U.S.)
investments, the value of those investments may change at times when shareholders are unable to buy or sell shares and the value of such investments will be reflected in each Fund’s next calculated NAV. An alternative exchange rate may be obtained from a Pricing Source or an exchange rate may otherwise be determined if believed to be more reflective of the rates at which a Fund may transact.
Whole loans may be fair valued using inputs that take into account borrower- or loan-level data (e.g., credit risk of the borrower) that is updated periodically throughout the life of each individual loan; any new borrower- or loan-level data received in written reports periodically by a Fund normally will be taken into account in calculating the NAV. A
|
|
|
|
|
|
|
|
|
|
|
|
| |
| |
|
|
ANNUAL REPORT |
|
|
| |
|
|
JUNE 30, 2025 |
|
|
131 |
|
|
|
|
| |
Notes to Financial Statements |
|
|
|
|
Fund’s whole loan investments, including those originated by the Fund or through an alternative lending platform, generally are fair valued in accordance with procedures approved by the Board.
Fair valuation may require subjective determinations about the value of a security. While the Funds’ and Valuation Designee’s policies and procedures are intended to result in a calculation of a Fund’s NAV that fairly reflects security values as of the time of pricing, a Fund cannot ensure that fair values accurately reflect the price that a Fund could obtain for a security if it were to dispose of that security as of the time of pricing (for instance, in a forced or distressed sale). The prices used by a Fund may differ from the value that would be realized if the securities were sold.
(b) Fair Value Hierarchy
U.S. GAAP describes fair value as the price that a Fund would receive to sell an asset or pay to transfer a liability in an orderly transaction between market participants at the measurement date. It establishes a fair value hierarchy that prioritizes inputs to valuation methods and requires disclosure of the fair value hierarchy, separately for each major category of assets and liabilities, that segregates fair value measurements into levels (Level 1, 2 or 3). The inputs or methodology used for valuing securities are not necessarily an indication of the risks associated with investing in those securities. Levels 1, 2 and 3 of the fair value hierarchy are defined as follows:
|
|
Level 1 — Quoted prices (unadjusted) in active markets or exchanges for identical assets and liabilities. |
|
|
Level 2 — Significant other observable inputs, which may include, but are not limited to, quoted prices for similar assets or liabilities in markets that are active, quoted prices for identical or similar assets or liabilities in markets that are not active, inputs other than quoted prices that are observable for the assets or liabilities (such as interest rates, yield curves, volatilities, prepayment speeds, loss severities, credit risks and default rates) or other market corroborated inputs. |
|
|
Level 3 — Significant unobservable inputs based on the best information available in the circumstances, to the extent observable inputs are not available, which may include assumptions made by the Valuation Designee that are used in determining the fair value of investments. |
Assets or liabilities categorized as Level 2 or 3 as of period end have been transferred between Levels 2 and 3 since the prior period due to changes in the method utilized in valuing the investments. Transfers from Level 2 to Level 3 are a result of a change, in the normal course of business, from the use of methods used by Pricing Sources (Level 2) to the use of a Broker Quote or valuation technique which utilizes significant unobservable inputs due to an absence of current or reliable market-based data (Level 3). Transfers from Level 3 to Level 2 are a
result of the availability of current and reliable market-based data provided by Pricing Sources or other valuation techniques which utilize significant observable inputs. In accordance with the requirements of U.S. GAAP, the amounts of transfers into and out of Level 3, if material, are disclosed in the Notes to Schedule of Investments for each respective Fund.
For fair valuations using significant unobservable inputs, U.S. GAAP requires a reconciliation of the beginning to ending balances for reported fair values that presents changes attributable to realized gain (loss), unrealized appreciation (depreciation), purchases and sales, accrued discounts (premiums), and transfers into and out of the Level 3 category during the period. The end of period value is used for the transfers between fair value Levels of a Fund’s assets and liabilities. Additionally, U.S. GAAP requires quantitative information regarding the significant unobservable inputs used in the determination of fair value of assets or liabilities categorized as Level 3 in the fair value hierarchy. In accordance with the requirements of U.S. GAAP, a fair value hierarchy and, if material, a Level 3 reconciliation and details of significant unobservable inputs, have been included in the Notes to Schedule of Investments for each respective Fund.
(c) Valuation Techniques and the Fair Value Hierarchy
Level 1, Level 2 and Level 3 trading assets and trading liabilities, at fair value
The valuation methods (or “techniques”) and significant inputs used in determining the fair values of portfolio securities or other assets and liabilities categorized as Level 1, Level 2 and Level 3 of the fair value hierarchy are as follows:
Common stocks, ETFs, exchange-traded notes and financial derivative instruments, such as futures contracts, rights and warrants, or options on futures that are traded on a national securities exchange, are stated at the last reported sale or settlement price on the day of valuation. To the extent these securities are actively traded and valuation adjustments are not applied, they are categorized as Level 1 of the fair value hierarchy.
Investments in registered
open-end
investment companies (other than ETFs) will be valued based upon the NAVs of such investments and are categorized as Level 1 of the fair value hierarchy. Investments in unregistered
open-end
investment companies will be calculated based upon the NAVs of such investments and are considered Level 1 provided that the NAVs are observable, calculated daily and are the value at which both purchases and sales will be conducted.
Fixed income securities including corporate, convertible and municipal bonds and notes, U.S. government agencies, U.S. treasury obligations, sovereign issues, bank loans, convertible preferred securities,
non-U.S.
bonds and short-term debt instruments (such as commercial paper,
|
|
|
|
|
|
| |
132 |
|
PIMCO CLOSED-END FUNDS |
|
|
|
|
time deposits and certificates of deposit) are normally valued on the basis of quotes obtained from brokers and dealers or Pricing Sources that use broker-dealer quotations, reported trades or valuation estimates from their internal pricing models. The Pricing Sources’ internal models use inputs that are observable such as issuer details, interest rates, yield curves, prepayment speeds, credit risks/spreads, default rates and quoted prices for similar assets. Securities that use similar valuation techniques and inputs as described above are categorized as Level 2 of the fair value hierarchy.
Fixed income securities purchased on a delayed-delivery basis or as a repurchase commitment in a sale-buyback transaction are marked to market daily until settlement at the forward settlement date and are categorized as Level 2 of the fair value hierarchy.
Mortgage-related and asset-backed securities are usually issued as separate tranches, or classes, of securities within each deal. These securities are also normally valued by Pricing Sources that use broker-dealer quotations, reported trades or valuation estimates from their internal pricing models. The pricing models for these securities usually consider tranche-level attributes, current market data, estimated cash flows and market-based yield spreads for each tranche, and incorporate deal collateral performance, as available. Mortgage-related and asset-backed securities that use similar valuation techniques and inputs as described above are categorized as Level 2 of the fair value hierarchy.
Valuation adjustments may be applied to certain securities that are solely traded on a foreign exchange to account for the market movement between the close of the foreign market and the NYSE Close. These securities are valued using Pricing Sources that consider the correlation of the trading patterns of the foreign security to the intraday trading in the U.S. markets for investments. Securities using these valuation adjustments are categorized as Level 2 of the fair value hierarchy. Preferred securities and other equities traded on inactive markets or valued by reference to similar instruments are also categorized as Level 2 of the fair value hierarchy.
Valuation adjustments may be applied to certain exchange traded futures and options to account for market movement between the exchange settlement and the NYSE Close. These securities are valued using quotes obtained from a quotation reporting system, established market makers or Pricing Sources. Financial derivatives using these valuation adjustments are categorized as Level 2 of the fair value hierarchy.
Equity exchange-traded options and over the counter financial derivative instruments, such as forward foreign currency contracts and options contracts derive their value from underlying asset prices, indexes, reference rates and other inputs or a combination of these
factors. These contracts are normally valued on the basis of quotes obtained from a quotation reporting system, established market makers or Pricing Sources (normally determined as of the NYSE Close). Depending on the product and the terms of the transaction, financial derivative instruments can be valued by Pricing Sources using a series of techniques, including simulation pricing models. The pricing models use inputs that are observed from actively quoted markets such as quoted prices, issuer details, indexes, bid/ask spreads, interest rates, implied volatilities, yield curves, dividends and exchange rates. Financial derivative instruments that use similar valuation techniques and inputs as described above are categorized as Level 2 of the fair value hierarchy.
Centrally cleared swaps and over the counter swaps derive their value from underlying asset prices, indexes, reference rates and other inputs or a combination of these factors. They are valued using a broker-dealer bid quotation or on market-based prices provided by Pricing Sources (normally determined as of the NYSE Close). Centrally cleared swaps and over the counter swaps can be valued by Pricing Sources using a series of techniques, including simulation pricing models. The pricing models may use inputs that are observed from actively quoted markets such as the overnight index swap rate, interest rates, yield curves and credit spreads. These securities are categorized as Level 2 of the fair value hierarchy.
Proxy pricing procedures set the base price of a fixed income security and subsequently adjust the price proportionally to market value changes of a
pre-determined
security deemed to be comparable in duration, generally a U.S. Treasury or sovereign note based on country of issuance. The base price may be a broker-dealer quote, transaction price or an internal value as derived by analysis of market data. The base price of the security may be reset on a periodic basis based on the availability of market data and procedures approved by the Valuation Oversight Committee. Significant changes in the unobservable inputs of the proxy pricing process (the base price) would result in direct and proportional changes in the fair value of the security. These securities are categorized as Level 3 of the fair value hierarchy.
If third-party evaluated vendor pricing is not available or not deemed to be indicative of fair value, the Manager may elect to obtain Broker Quotes directly from the broker-dealer or passed through from a third-party vendor. In the event that fair value is based upon a single sourced Broker Quote, these securities are categorized as Level 3 of the fair value hierarchy. Broker Quotes are typically received from established market participants. Although independently received, the Manager does not have the transparency to view the underlying inputs which support the market quotation. Significant changes in the Broker Quote would have direct and proportional changes in the fair value of the security.
|
|
|
|
|
|
|
|
|
|
|
|
| |
| |
|
|
ANNUAL REPORT |
|
|
| |
|
|
JUNE 30, 2025 |
|
|
133 |
|
|
|
|
| |
Notes to Financial Statements |
|
|
|
|
Reference instrument valuation estimates fair value by utilizing the correlation of the security to one or more broad-based securities, market indexes, and/or other financial instruments, whose pricing information is readily available. Unobservable inputs may include those used in algorithms based on percentage change in the reference instruments and/or weights of each reference instrument. Significant changes in the unobservable inputs would result in direct and proportional changes in the fair value of the security. These securities are categorized as Level 2 or Level 3 of the fair value hierarchy depending on the source or input of the reference instrument.
Expected recovery valuation estimates that the fair value of an existing asset can be recovered, net of any liability. Significant changes in the unobservable inputs would result in direct and proportional changes in the fair value of the security. These securities are categorized as Level 3 of the fair value hierarchy.
The Discounted Cash Flow model is based on future cash flows generated by the investment and may be normalized based on expected investment performance. Future cash flows are discounted to present value using an appropriate rate of return, typically calibrated to the initial transaction date and adjusted based on Capital Asset Pricing Model and/or other market-based inputs. Significant changes in the unobservable inputs would result in direct and proportional changes in the fair value of the security. These securities are categorized as Level 3 of the fair value hierarchy.
The Comparable Companies model is based on application of valuation multiples from publicly traded comparable companies to the financials of the subject company. Adjustments may be made to the market-derived valuation multiples based on differences between the comparable companies and the subject company. Significant changes in the unobservable inputs would result in direct and proportional changes in the fair value of the security. These securities are categorized as Level 3 of the fair value hierarchy.
The Option Pricing Model is a commonly accepted method of allocating enterprise value across a capital structure. The method may be utilized when a capital structure includes multiple instruments with varying rights and preferences, there is no short term exit horizon, the nature of an exit event is unknown, or if the enterprise value is not sufficient to cover outstanding debt and preferred claims. The Option Pricing Model can also be used as a method to estimate enterprise value by ‘back-solving’ if there are recent indicative transactions for securities with the same issuer. The Option Pricing Model uses Black-Scholes option pricing, a generally accepted option model typically used to value call options, puts, warrants, and convertible preferred securities. Significant changes in unobservable inputs would result in direct changes in the fair value of the security. These securities are categorized as level 3 of the fair value hierarchy.
The
model is typically used when an investment or subject company has two or more separate and distinct assets that would each require its own valuation methodology, typically an income or market approach. Significant changes in the unobservable inputs would result in direct and proportional changes in the fair value of the security. These securities are categorized as Level 3 of the fair value hierarchy.
Securities may be valued based on purchase prices of privately negotiated transactions. Significant changes in the unobservable inputs would result in direct and proportional changes in the fair value of the security. These securities are categorized as Level 3 of the fair value hierarchy.
Short-term debt instruments (such as commercial paper, time deposits and certificates of deposit) having a remaining maturity of 60 days or less may be valued at amortized cost, so long as the amortized cost value of such short-term debt instruments is approximately the same as the fair value of the instrument as determined without the use of amortized cost valuation. These securities are categorized as Level 2 or Level 3 of the fair value hierarchy depending on the source of the base price.
When a fair valuation method is applied by PIMCO that uses significant unobservable inputs, investments will be priced by a method that the Valuation Designee believes reflects fair value and are categorized as Level 3 of the fair value hierarchy.
4. SECURITIES AND OTHER INVESTMENTS
(a) Investments in Affiliates
Each Fund may invest in the PIMCO Short Asset Portfolio and the PIMCO Short-Term Floating NAV Portfolio III (“Central Funds”) to the extent permitted by the Act, rules thereunder or exemptive relief therefrom. The Central Funds are registered investment companies created for use solely by the series of the Trust and other series of registered investment companies advised by the Adviser, in connection with their cash management activities. The main investments of the Central Funds are money market and short maturity fixed income instruments. The Central Funds may incur expenses related to their investment activities, but do not pay Investment Advisory Fees or Supervisory and Administrative Fees to the Adviser. The Central Funds are considered to be affiliated with the Funds. A complete schedule of portfolio holdings for each affiliate fund is filed with the SEC for the first and third quarters of each fiscal year on Form
N-PORT
and is available at the SEC’s website at www.sec.gov. A copy of each affiliate fund’s shareholder report is also available at the SEC’s website at www.sec.gov, on the Funds’ website at www.pimco.com, or upon
|
|
|
|
|
|
| |
134 |
|
PIMCO CLOSED-END FUNDS |
|
|
|
|
request, as applicable. The tables below show the Funds’ transactions in and earnings from investments in the affiliated funds for the period ended June 30, 2025 (amounts in thousands
):
|
|
|
|
|
|
|
|
|
|
|
|
|
|
|
|
|
|
|
|
|
|
|
|
|
|
|
|
|
|
|
|
|
|
|
|
| |
Investments in PIMCO Short-Term Floating NAV Portfolio III |
|
|
|
|
|
|
|
|
|
|
|
|
|
|
|
|
|
|
|
|
|
|
|
|
|
|
|
|
|
|
|
|
|
Change in
Unrealized
Appreciation
(Depreciation) |
|
|
|
|
|
|
|
|
Realized Net Capital Gain Distributions (1) |
|
|
|
|
|
|
|
|
|
|
| |
| PCM Fund, Inc. |
|
|
|
| |
$ |
8,525 |
|
|
$ |
44,106 |
|
|
$ |
(45,500 |
) |
|
$ |
3 |
|
|
$ |
3 |
|
|
$ |
7,137 |
|
|
$ |
408 |
|
|
$ |
0 |
|
|
|
|
|
|
|
|
|
|
| |
PIMCO Global StocksPLUS & Income Fund |
|
|
|
| |
|
19,770 |
|
|
|
99,288 |
|
|
|
(108,900 |
) |
|
|
16 |
|
|
|
0 |
|
|
|
10,174 |
|
|
|
796 |
|
|
|
0 |
|
|
|
|
|
|
|
|
|
|
| |
| PIMCO Strategic Income Fund, Inc. |
|
|
|
| |
|
24,159 |
|
|
|
213,506 |
|
|
|
(230,000 |
) |
|
|
17 |
|
|
|
0 |
|
|
|
7,682 |
|
|
|
615 |
|
|
|
0 |
|
|
|
|
|
|
|
|
|
|
| |
| PIMCO Access Income Fund |
|
|
|
| |
|
73,519 |
|
|
|
496,332 |
|
|
|
(505,600 |
) |
|
|
22 |
|
|
|
17 |
|
|
|
64,290 |
|
|
|
3,557 |
|
|
|
0 |
|
|
|
|
|
|
|
|
|
|
| |
| PIMCO Dynamic Income Fund |
|
|
|
| |
|
619,008 |
|
|
|
4,376,898 |
|
|
|
(4,361,400 |
) |
|
|
626 |
|
|
|
(175 |
) |
|
|
634,957 |
|
|
|
30,409 |
|
|
|
0 |
|
|
|
|
|
|
|
|
|
|
| |
| PIMCO Dynamic Income Opportunities Fund |
|
|
|
| |
|
138,654 |
|
|
|
1,036,132 |
|
|
|
(1,029,100 |
) |
|
|
57 |
|
|
|
36 |
|
|
|
145,779 |
|
|
|
8,380 |
|
|
|
0 |
|
|
|
|
|
|
|
|
|
|
| |
| PIMCO Dynamic Income Strategy Fund |
|
|
|
| |
|
107,084 |
|
|
|
939,814 |
|
|
|
(910,700 |
) |
|
|
22 |
|
|
|
38 |
|
|
|
136,258 |
|
|
|
4,240 |
|
|
|
0 |
|
|
A zero balance may reflect actual amounts rounding to less than one thousand. |
|
The tax characterization of distributions is determined in accordance with Federal income tax regulations and may contain a return of capital. The actual tax characterization of distributions received is determined at the end of the fiscal year of the affiliated fund. See Note 2, Distributions to Shareholders, in the Notes to Financial Statements for more information. |
An affiliate includes any company in which a Fund owns 5% or more of the company’s outstanding voting shares. The table below represents transactions in and earnings from these affiliated issuers for the period ended June 30, 2025 (amounts in thousands
, except number of shares).
|
|
|
|
|
|
|
|
|
|
|
|
|
|
|
|
|
|
|
|
|
|
|
|
|
|
|
|
|
|
|
|
|
|
|
|
| |
|
|
|
|
|
|
|
|
|
|
|
|
|
|
|
|
|
|
|
|
|
|
Market Value
at 06/30/2024 |
|
|
|
|
|
|
|
|
|
|
|
Change in
Unrealized
Appreciation
(Depreciation) |
|
|
Market Value
at 06/30/2025 |
|
|
|
|
|
|
|
|
|
|
|
|
|
|
|
|
| |
| Market Garden Dogwood LLC |
|
|
|
| |
$ |
18,732 |
|
|
$ |
0 |
|
|
$ |
(8,892 |
) |
|
$ |
0 |
|
|
$ |
110 |
|
|
$ |
9,950 |
|
|
$ |
0 |
|
|
|
10,108,628 |
|
|
|
|
|
|
|
|
|
|
|
|
|
|
|
|
|
|
|
|
|
|
|
|
|
|
|
|
|
|
|
|
|
|
|
|
|
| |
PIMCO Dynamic Income Fund |
|
|
|
|
|
|
|
|
|
|
|
|
|
|
|
|
|
|
|
|
|
Market Value
at 06/30/2024 |
|
|
|
|
|
|
|
|
|
|
|
Change in
Unrealized
Appreciation
(Depreciation) |
|
|
Market Value
at 06/30/2025 |
|
|
|
|
|
|
|
|
|
|
|
|
|
|
|
|
| |
| Amsurg Equity |
|
|
|
| |
$ |
174,118 |
|
|
$ |
0 |
|
|
$ |
0 |
|
|
$ |
0 |
|
|
$ |
(15,326 |
) |
|
$ |
158,792 |
|
|
$ |
0 |
|
|
|
3,517,243 |
|
|
|
|
|
|
|
|
|
|
| |
| Incora New Equity |
|
|
|
| |
|
0 |
|
|
|
112,515 |
|
|
|
0 |
|
|
|
0 |
|
|
|
(34,257 |
) |
|
|
78,258 |
|
|
|
0 |
|
|
|
2,316,329 |
|
|
|
|
|
|
|
|
|
|
| |
| Market Garden Dogwood LLC |
|
|
|
| |
|
144,925 |
|
|
|
0 |
|
|
|
(68,791 |
) |
|
|
0 |
|
|
|
851 |
|
|
|
76,985 |
|
|
|
0 |
|
|
|
78,208,859 |
|
|
|
|
|
|
|
|
|
|
| |
| Neiman Marcus Group Ltd. LLC |
|
|
|
| |
|
81,453 |
|
|
|
0 |
|
|
|
(83,406 |
) |
|
|
64,031 |
|
|
|
(62,078 |
) |
|
|
0 |
|
|
|
0 |
|
|
|
0 |
|
|
|
|
|
|
|
|
|
|
| |
| Oi SA |
|
|
|
| |
|
0 |
|
|
|
0 |
|
|
|
0 |
|
|
|
0 |
|
|
|
2,853 |
|
|
|
2,853 |
|
|
|
0 |
|
|
|
24,221,572 |
|
|
|
|
|
|
|
|
|
|
| |
| Sierra Hamilton Holder LLC |
|
|
|
| |
|
3 |
|
|
|
0 |
|
|
|
0 |
|
|
|
0 |
|
|
|
0 |
|
|
|
3 |
|
|
|
0 |
|
|
|
30,337,712 |
|
|
|
|
|
|
|
|
|
|
|
|
|
|
|
|
|
|
|
|
|
|
|
|
|
|
|
|
|
|
|
|
|
|
|
|
|
| |
PIMCO Dynamic Income Opportunities Fund |
|
|
|
|
|
|
|
|
|
|
|
|
|
|
|
|
|
|
|
|
|
Market Value
at 06/30/2024 |
|
|
|
|
|
|
|
|
|
|
|
Change in
Unrealized
Appreciation
(Depreciation) |
|
|
Market Value
at 06/30/2025 |
|
|
|
|
|
|
|
|
|
|
|
|
|
|
|
|
| |
| Market Garden Dogwood LLC |
|
|
|
| |
$ |
41,407 |
|
|
$ |
0 |
|
|
$ |
(19,654 |
) |
|
$ |
0 |
|
|
$ |
243 |
|
|
$ |
21,996 |
|
|
$ |
0 |
|
|
|
22,345,388 |
|
|
|
|
|
|
|
|
|
|
|
|
|
|
|
|
|
|
|
|
|
|
|
|
|
|
|
|
|
|
|
|
|
|
|
|
|
| |
PIMCO Dynamic Income Strategy Fund |
|
|
|
|
|
|
|
|
|
|
|
|
|
|
|
|
|
|
|
|
|
Market Value
at 06/30/2024 |
|
|
|
|
|
|
|
|
|
|
|
Change in
Unrealized
Appreciation
(Depreciation) |
|
|
Market Value
at 06/30/2025 |
|
|
|
|
|
|
|
|
|
|
|
|
|
|
|
|
| |
| Venture Global Holdings ‘A’ |
|
|
|
| |
$ |
212,794 |
|
|
$ |
0 |
|
|
$ |
0 |
|
|
$ |
0 |
|
|
$ |
31,798 |
|
|
$ |
244,592 |
|
|
$ |
0 |
|
|
|
15,699,112 |
|
|
A zero balance may reflect actual amounts rounding to less than one thousand. |
|
|
|
|
|
|
|
|
|
|
|
|
| |
| |
|
|
ANNUAL REPORT |
|
|
| |
|
|
JUNE 30, 2025 |
|
|
135 |
|
|
|
|
| |
Notes to Financial Statements |
|
|
|
|
(b) Investments in Securities
The Funds may utilize the investments and strategies described below to the extent permitted by each Fund’s respective investment policies.
Delayed-Delivery Transactions
involve a commitment by a Fund to purchase or sell securities for a predetermined price or yield, with payment and delivery taking place beyond the customary settlement period. When delayed-delivery transactions are outstanding, a Fund will designate or receive as collateral liquid assets in an amount sufficient to meet the purchase price or respective obligations. When purchasing a security on a delayed-delivery basis, a Fund assumes the rights and risks of ownership of the security, including the risk of price and yield fluctuations, and takes such fluctuations into account when determining its NAV. A Fund may dispose of or renegotiate a delayed-delivery transaction after it is entered into, which may result in a realized gain (loss). When a Fund has sold a security on a delayed-delivery basis, the Fund does not participate in future gains (losses) with respect to the security.
Loans and Other Indebtedness, Loan Participations and Assignments
are direct debt instruments which are interests in amounts owed to lenders or lending syndicates by corporate, governmental or other borrowers. A Fund’s investments in loans may be in the form of direct investments, participations in loans or assignments of all or a portion of loans from third parties or exposure to investments in loans through investments in a mutual fund or other pooled investment vehicle. A loan is often administered by a bank or other financial institution (the “agent”) that acts as agent for all holders. The agent administers the terms of the loan, as specified in the loan agreement. A Fund may invest in multiple series or tranches of a loan, which may have varying terms and carry different associated risks. A Fund generally has no right to enforce compliance with the terms of the loan agreement with the borrower. As a result, a Fund may be subject to the credit risk of both the borrower and the agent that is selling the loan agreement.
In the event of the insolvency of the agent selling a participation, a Fund may be treated as a general creditor of the agent and may not benefit from any
set-off
between the agent and the borrower. When a Fund purchases assignments from agents it acquires direct rights against the borrowers of the loans. These loans may include participations in bridge loans, which are loans taken out by borrowers for a short period (typically less than one year) pending arrangement of more permanent financing through, for example, the issuance of bonds, frequently high yield bonds issued for the purpose of acquisitions.
Investments in loans are generally subject to risks similar to those of investments in other types of debt obligations, including, among
others, credit risk, interest rate risk, variable and floating rate securities risk, and risks associated with mortgage-related securities. In addition, in many cases loans are subject to the risks associated with below-investment grade securities. The Funds may be subject to heightened or additional risks and potential liabilities and costs by investing in mezzanine and other subordinated loans, including those arising under bankruptcy, fraudulent conveyance, equitable subordination, environmental and other laws and regulations, and risks and costs associated with debt servicing and taking foreclosure actions associated with the loans.
Additionally, because loans are not ordinarily registered with the SEC or any state securities commission or listed on any securities exchange, there is usually less publicly available information about such instruments. In addition, loans may not be considered “securities” for purposes of the anti-fraud provisions under the federal securities laws and, as a result, as a purchaser of these instruments, a Fund may not be entitled to the anti-fraud protections of the federal securities laws. In the course of investing in such instruments, a Fund may come into possession of material nonpublic information and, because of prohibitions on trading in securities of issuers while in possession of such information, the Fund may be unable to enter into a transaction in a publicly-traded security of that issuer when it would otherwise be advantageous for the Fund to do so. Alternatively, a Fund may choose not to receive material nonpublic information about an issuer of such loans, with the result that the Fund may have less information about such issuers than other investors who transact in such assets.
The types of loans and related investments in which a Fund may invest include, among others, senior loans, subordinated loans (including second lien loans,
B-Notes
and mezzanine loans), whole loans, commercial real estate and other commercial loans and structured loans. The Funds may acquire direct interests in loans through primary loan distributions and/or in private transactions. In the case of subordinated loans, there may be significant indebtedness ranking ahead of the borrower’s obligation to the holder of such a loan, including in the event of the borrower’s insolvency. Mezzanine loans are typically secured by a pledge of an equity interest in the mortgage borrower that owns the real estate rather than an interest in a mortgage.
Investments in loans may include unfunded loan commitments, which are contractual obligations for future funding. Unfunded loan commitments may include revolving credit facilities, which may obligate a Fund to supply additional cash to the borrower on demand. Unfunded loan commitments represent a future obligation in full, even though a percentage of the committed amount may not be utilized by the borrower. When investing in a loan participation, a Fund has the right to receive payments of principal, interest and any fees to which it is entitled only from the agent selling the loan agreement and only
|
|
|
|
|
|
| |
136 |
|
PIMCO CLOSED-END FUNDS |
|
|
|
|
upon receipt of payments by the agent from the borrower. A Fund may receive a commitment fee based on the undrawn portion of the underlying line of credit portion of a loan. In certain circumstances, a Fund may receive a penalty fee upon the prepayment of a loan by a borrower. Fees earned or paid are recorded as a component of interest income or interest expense, respectively, on the Statements of Operations. Unfunded loan commitments, if any, are reflected as a liability on the Statements of Assets and Liabilities.
Master Limited Partnerships
(“MLPs”) are generally publicly traded entities that are organized as limited partnerships or limited liability companies and are treated as partnerships under the Internal Revenue Code. Currently, most MLPs operate in the energy and/or natural resources sectors. The only asset of an MLP is most commonly the ownership of the limited liability company or limited partnership known as the operating entity, which in turn owns subsidiaries and operating assets. The ownership of an MLP is split between the public and a sponsor. Interests in MLPs (“units”) are often traded on securities exchanges like shares of corporate stock. An MLP consists of a general partner and limited partners (or in the case of MLPs organized as limited liability companies, a managing member and members). The general partner or managing member typically controls the operations and management of the MLP and has an ownership stake in the MLP. The limited partners or members, through their ownership of limited partner or member interests, provide capital to the entity, and are intended to receive cash distributions and to have no role in the operation and management of the entity. MLP cash distributions are not guaranteed and depend on each partnership’s or limited liability company’s ability to generate adequate cash flow. The partnership or operating agreements of MLPs determine how cash distributions will be made to general partners and limited partners or to managing members and members, as applicable.
Mortgage-Related and Other Asset-Backed Securities
directly or indirectly represent a participation in, or are secured by and payable from, loans on real property. Mortgage-related securities are interests in pools of residential or commercial mortgage loans, including mortgage loans made by savings and loan institutions, mortgage bankers, commercial banks and others. These securities typically provide a monthly payment which consists of both principal and interest payments. Interest may be determined by fixed or adjustable rates. In times of declining interest rates, there is a greater likelihood that a Fund’s higher yielding securities will be
pre-paid
with the Fund being unable to reinvest the proceeds in an investment with as great a yield. The rate of prepayments on underlying mortgages will affect the price and volatility of a mortgage-related security, and may have the effect of shortening or extending the effective duration of the security relative to what was anticipated at the time of purchase. Interest-only
and principal-only securities are especially sensitive to interest rate changes, which can affect not only their prices but can also change the income flows and repayment assumptions about those investments. The timely payment of principal and interest of certain mortgage-related securities is guaranteed with the full faith and credit of the U.S. Government. Pools created and guaranteed by
non-governmental
issuers, including government-sponsored corporations, may be supported by various forms of insurance or guarantees, but there can be no assurance that private insurers or guarantors can meet their obligations under the insurance policies or guarantee arrangements. Many of the risks of investing in mortgage-related securities secured by commercial mortgage loans reflect the effects of local and other economic conditions on real estate markets, the ability of tenants to make lease payments, and the ability of a property to attract and retain tenants. These securities may be less liquid and may exhibit greater price volatility than other types of mortgage-related or other asset-backed securities. Other asset-backed securities are created from many types of assets, including, but not limited to, auto loans, accounts receivable such as credit card receivables and hospital account receivables, home equity loans, student loans, boat loans, mobile home loans, recreational vehicle loans, manufactured housing loans, aircraft leases, computer leases, syndicated bank loans, peer to peer loans and litigation finance loans. The Funds may invest in any level of the capital structure of an issuer of mortgage-backed or asset-backed securities, including the equity or “first loss” tranche.
Collateralized Debt Obligations
(“CDOs”) include Collateralized Bond Obligations (“CBOs”), Collateralized Loan Obligations (“CLOs”) and other similarly structured securities. CBOs, CLOs and other CDOs are types of asset-backed securities. A CBO is a trust which is typically backed by a diversified pool of high risk, below investment grade fixed income securities. A CLO is a trust typically collateralized by a pool of loans, which may include, among others, domestic and foreign senior secured loans, senior unsecured loans, and subordinate corporate loans, including loans that may be rated below investment grade or equivalent unrated loans. Other CDOs are trusts backed by other types of assets representing obligations of various parties. For both CBOs and CLOs, the cash flows from the trust are split into two or more portions, called tranches, varying in risk and yield. The riskiest portion is the “equity” tranche which bears the bulk of defaults from the bonds or loans in the trust and serves to protect the other, more senior tranches from default in all but the most severe circumstances. Since it is partially protected from defaults, a senior tranche from a CBO trust or CLO trust typically has higher ratings and lower yields than the underlying securities, and can be rated investment grade. Despite the protection from the equity tranche, CBO or CLO tranches can experience substantial losses due to actual defaults, increased sensitivity to defaults due to collateral default and disappearance of
|
|
|
|
|
|
|
|
|
|
|
|
| |
| |
|
|
ANNUAL REPORT |
|
|
| |
|
|
JUNE 30, 2025 |
|
|
137 |
|
|
|
|
| |
Notes to Financial Statements |
|
|
|
|
protecting tranches, market anticipation of defaults and aversion to CBO or CLO securities as a class. The risks of an investment in a CDO depend largely on the type of the collateral securities and the class of the CDO in which a Fund invests. CDOs carry additional risks including, but not limited to; (i) the possibility that distributions from collateral securities will not be adequate to make interest or other payments, (ii) the collateral may decline in value or default, (iii) risks related to the capability of the servicer of the securitized assets, (iv) the risk that a Fund may invest in CBOs, CLOs, or other CDOs that are subordinate to other classes, (v) the structure and complexity of the transaction and the legal documents may not be fully understood at the time of investment and could lead to disputes with the issuer or among investors regarding the characterization of proceeds or unexpected investment results, and (vi) the CDO’s manager may perform poorly.
Collateralized Mortgage Obligations
(“CMOs”) are debt obligations of a legal entity that are collateralized by whole mortgage loans or private mortgage bonds and divided into classes. CMOs are structured into multiple classes, often referred to as “tranches,” with each class bearing a different stated maturity and entitled to a different schedule for payments of principal and interest, including prepayments. CMOs may be less liquid and may exhibit greater price volatility than other types of mortgage-related or asset-backed securities.
As CMOs have evolved, some classes of CMO bonds have become more common. For example, a Fund may invest in
parallel-pay
and planned amortization class (“PAC”) CMOs and multi-class pass-through certificates.
Parallel-pay
CMOs and multi-class pass-through certificates are structured to provide payments of principal on each payment date to more than one class. These simultaneous payments are taken into account in calculating the stated maturity date or final distribution date of each class, which, as with other CMO and multi-class pass-through structures, must be retired by its stated maturity date or final distribution date but may be retired earlier. PACs generally require payments of a specified amount of principal on each payment date. PACs are
parallel-pay
CMOs with the required principal amount on such securities having the highest priority after interest has been paid to all classes. Any CMO or multi-class pass-through structure that includes PAC securities must also have support tranches — known as support bonds, companion bonds or
non-PAC
bonds — which lend or absorb principal cash flows to allow the PAC securities to maintain their stated maturities and final distribution dates within a range of actual prepayment experience. These support tranches are subject to a higher level of maturity risk compared to other mortgage-related securities, and usually provide a higher yield to compensate investors. If principal cash flows are received in amounts outside a
pre-determined
range such that the support bonds cannot lend or absorb sufficient cash flows to the PAC securities as intended, the PAC securities are
subject to heightened maturity risk. A Fund may invest in various tranches of CMO bonds, including support bonds and equity or “first loss” tranches (see “Collateralized Debt Obligations” above).
Insurance-Linked Investments
include, for example, insurance-linked instruments and similar investments, such as reinsurance contracts, sidecars and event-linked bonds, such as catastrophe and resilience bonds, and securities relating to life insurance policies, annuity contracts and premium finance loans. The aforementioned instruments may include life settlement contracts and longevity and mortality investments. In a life settlement contract, a life insurance policy owner transfers his or her policy at a discount to its face value (the amount that is payable upon the death of the insured) in return for an immediate cash settlement. The longer the insured lives, the lower the Fund’s rate of return on the policy. The terms of a longevity bond typically provide that the investor in the bond will receive less than the bond’s par amount at maturity if the actual average longevity (life span) of a specified population of people observed over a specified period of time (typically measured by a longevity index) is higher than a specified level. If longevity is higher than expected, the bond will return less than its par amount at maturity. A mortality bond, in contrast to a longevity bond, typically provides that the investor in the bond will receive less than the bond’s par amount at maturity if the mortality rate of a specified population of people observed over a specified period of time (typically measured by a mortality index) is higher than a specified level. During their term, both longevity bonds and mortality bonds typically pay a floating rate of interest to investors.
Stripped Mortgage-Backed Securities
(“SMBS”) are derivative multi-class mortgage securities. SMBS are usually structured with two classes that receive different proportions of the interest and principal distributions on a pool of mortgage assets. An SMBS will have one class that will receive all of the interest (the interest-only or “IO” class), while the other class will receive the entire principal (the principal-only or “PO” class). IOs and POs can be extremely volatile in response to changes in interest rates. As interest rates rise and fall, the value of IOs tends to move in the same direction as interest rates. POs perform best when prepayments on the underlying mortgages rise since this increases the rate at which the principal is returned and the yield to maturity on the PO. When payments on mortgages underlying a PO are slower than anticipated, the life of the PO is lengthened and the yield to maturity is reduced. The yield to maturity on an IO class is extremely sensitive to the rate of principal payments (including prepayments) on the related underlying mortgage assets, and a rapid rate of principal payments may have a material adverse effect on a Fund’s yield to maturity from these securities. If the underlying mortgage assets experience greater than anticipated prepayments of principal, the Funds may fail to recoup some or all of its initial investment in these securities even if the security is in one of the highest rating categories.
|
|
|
|
|
|
| |
138 |
|
PIMCO CLOSED-END FUNDS |
|
|
|
|
Payments received for IOs are included in interest income on the Statements of Operations. Because no principal will be received at the maturity of an IO class, adjustments are made to the cost of the security on a monthly basis until maturity. These adjustments are included in interest income on the Statements of Operations. Payments received for POs are treated as reductions to the cost and par value of the securities.
Payment
In-Kind
Securities
may give the issuer the option at each interest payment date of making interest payments in either cash and/or additional debt securities. Those additional debt securities usually have the same terms, including maturity dates and interest rates, and associated risks as the original bonds. The daily market quotations of the original bonds may include the accrued interest (referred to as a dirty price) and require a pro rata adjustment from the unrealized appreciation (depreciation) on investments to interest receivable on the Statements of Assets and Liabilities.
Perpetual Bonds
are fixed income securities with no maturity date but pay a coupon in perpetuity (with no specified ending or maturity date). Unlike typical fixed income securities, there is no obligation for perpetual bonds to repay principal. The coupon payments, however, are mandatory. While perpetual bonds have no maturity date, they may have a callable date in which the perpetuity is eliminated and the issuer may return the principal received on the specified call date. Additionally, a perpetual bond may have additional features, such as interest rate increases at periodic dates or an increase as of a predetermined point in the future.
Real Estate Investment Trusts
(“REITs”)
are pooled investment vehicles that own, and typically operate, income-producing real estate. If a REIT meets certain requirements, including distributing to shareholders substantially all of its taxable income (other than net capital gains), then it is not taxed on the income distributed to shareholders. Distributions received from REITs may be characterized as income, capital gain or a return of capital. A return of capital is recorded by a Fund as a reduction to the cost basis of its investment in the REIT. REITs are subject to management fees and other expenses, and so the Funds that invest in REITs will bear their proportionate share of the costs of the REITs’ operations.
Restricted Investments
are subject to legal or contractual restrictions on resale and may generally be sold privately, but may be required to be registered or exempted from such registration before being sold to the public. Private placement securities are generally considered to be restricted except for those securities traded between qualified institutional investors under the provisions of Rule 144A of the Securities Act of 1933, as amended. Disposal of restricted investments may involve time-consuming negotiations and expenses, and prompt
sale at an acceptable price may be difficult to achieve. Restricted investments held by the Funds as of June 30, 2025, as applicable, are disclosed in the Notes to Schedules of Investments.
Securities Issued by U.S. Government Agencies or Government-Sponsored Enterprises
are obligations of and, in certain cases, guaranteed by, the U.S. Government, its agencies or instrumentalities. Some U.S. Government securities, such as Treasury bills, notes and bonds, and securities guaranteed by the Government National Mortgage Association, are supported by the full faith and credit of the U.S. Government; others, such as those of the Federal Home Loan Banks, are supported by the right of the issuer to borrow from the U.S. Department of the Treasury (the “U.S. Treasury”); and others, such as those of the Federal National Mortgage Association (“FNMA” or “Fannie Mae”), are supported by the discretionary authority of the U.S. Government to purchase the agency’s obligations. U.S. Government securities may include zero coupon securities which do not distribute interest on a current basis and tend to be subject to a greater risk than interest-paying securities of similar maturities.
Government-related guarantors (i.e., not backed by the full faith and credit of the U.S. Government) include FNMA and the Federal Home Loan Mortgage Corporation (“FHLMC” or “Freddie Mac”). FNMA is a government-sponsored corporation. FNMA purchases conventional (i.e., not insured or guaranteed by any government agency) residential mortgages from a list of approved seller/servicers which include state and federally chartered savings and loan associations, mutual savings banks, commercial banks and credit unions and mortgage bankers. Pass-through securities issued by FNMA are guaranteed as to timely payment of principal and interest by FNMA, but are not backed by the full faith and credit of the U.S. Government. FHLMC is a government sponsored corporation that issues Participation Certificates (“PCs”), which are pass-through securities, each representing an undivided interest in a pool of residential mortgages. FHLMC guarantees the timely payment of interest and ultimate collection of principal, but PCs are not backed by the full faith and credit of the U.S. Government. Instead, they are supported only by the discretionary authority of the U.S. Government to purchase the agency’s obligations.
In June 2019, FNMA and FHLMC started issuing Uniform Mortgage-Backed Securities in place of their current offerings of
TBA-eligible
securities (the “Single Security Initiative”). The Single Security Initiative seeks to support the overall liquidity of the TBA market and aligns the characteristics of FNMA and FHLMC certificates. The long-term effects that the Single Security Initiative may have on the market for TBA and other mortgage-backed securities are uncertain.
Roll-timing strategies can be used where a Fund seeks to extend the expiration or maturity of a position, such as a TBA security on an
|
|
|
|
|
|
|
|
|
|
|
|
| |
| |
|
|
ANNUAL REPORT |
|
|
| |
|
|
JUNE 30, 2025 |
|
|
139 |
|
|
|
|
| |
Notes to Financial Statements |
|
|
|
|
underlying asset, by closing out the position before expiration and contemporaneously opening a new position with respect to substantially the same underlying asset with a later expiration date. TBA securities purchased or sold are reflected on the Statements of Assets and Liabilities as an asset or liability, respectively. Recently finalized FINRA rules include mandatory margin requirements for the TBA market that require the Funds to post collateral in connection with their TBA transactions. There is no similar requirement applicable to the Funds’ TBA counterparties. The required collateralization of TBA trades could increase the cost of TBA transactions to the Funds and impose added operational complexity.
Warrants
are securities that are usually issued together with a debt security or preferred security and that give the holder the right to buy a proportionate amount of common stock at a specified price. Warrants normally have a life that is measured in years and entitle the holder to buy common stock of a company at a price that is usually higher than the market price at the time the warrant is issued. Warrants may entail greater risks than certain other types of investments. Generally, warrants do not carry the right to receive dividends or exercise voting rights with respect to the underlying securities, and they do not represent any rights in the assets of the issuer. In addition, their value does not necessarily change with the value of the underlying securities, and they cease to have value if they are not exercised on or before their expiration date. If the market price of the underlying stock does not exceed the exercise price during the life of the warrant, the warrant will expire worthless. Warrants may increase the potential profit or loss to be realized from the investment as compared with investing the same amount in the underlying securities. Similarly, the percentage increase or decrease in the value of an equity security warrant may be greater than the percentage increase or decrease in the value of the underlying common stock. Warrants may relate to the purchase of equity or debt securities. Debt obligations with warrants attached to purchase equity securities have many characteristics of convertible securities and their prices may, to some degree, reflect the performance of the underlying stock. Debt obligations also may be issued with warrants attached to purchase additional debt securities at the same coupon rate. A decline in interest rates would permit a Fund to sell such warrants at a profit. If interest rates rise, these warrants would generally expire with no value.
When-Issued Transactions
are purchases or sales made on a when-issued basis. These transactions are made conditionally because a security, although authorized, has not yet been issued in the market. Transactions to purchase or sell securities on a when-issued basis involve a commitment by a Fund to purchase or sell these securities for a predetermined price or yield, with payment and delivery taking place beyond the customary settlement period. A Fund may sell when-issued securities before they are delivered, which may result in a realized gain (loss).
5. BORROWINGS AND OTHER FINANCING TRANSACTIONS
The Funds may enter into the borrowings and other financing transactions described below to the extent permitted by each Fund’s respective investment policies.
The following disclosures contain information on a Fund’s ability to lend or borrow cash or securities to the extent permitted under the Act, which may be viewed as borrowing or financing transactions by a Fund. The location of these instruments in each Fund’s financial statements is described below.
(a) Repurchase Agreements
Under the terms of a typical repurchase agreement, a Fund purchases an underlying debt obligation (collateral) subject to an obligation of the seller to repurchase, and a Fund to resell, the obligation at an agreed-upon price and time. In an open maturity repurchase agreement, there is no
pre-determined
repurchase date and the agreement can be terminated by a Fund or counterparty at any time. The underlying securities for all repurchase agreements are held by a Fund’s custodian or designated subcustodians (in the case of
tri-party
repurchase agreements). Traditionally, a Fund has used bilateral repurchase agreements wherein the underlying securities will be held by a Fund’s custodian. The market value of the collateral must be equal to or exceed the total amount of the repurchase obligations, including interest. Repurchase agreements, if any, including accrued interest, are included on the Statements of Assets and Liabilities. Interest earned is recorded as a component of interest income on the Statements of Operations. In periods of increased demand for collateral, a Fund may pay a fee for the receipt of collateral, which may result in interest expense to the Fund.
(b) Reverse Repurchase Agreements
In a reverse repurchase agreement, a Fund delivers a security in exchange for cash to a financial institution, the counterparty, with a simultaneous agreement to repurchase the same or substantially the same security at an agreed-upon price and date. In an open maturity reverse repurchase agreement, there is no
pre-determined
repurchase date and the agreement can be terminated by a Fund or counterparty at any time. A Fund is entitled to receive principal and interest payments, if any, made on the security delivered to the counterparty during the term of the agreement. Cash received in exchange for securities delivered plus accrued interest payments to be made by a Fund to counterparties are reflected as a liability on the Statements of Assets and Liabilities. Interest payments made by a Fund to counterparties are recorded as a component of interest expense on the Statements of Operations. In periods of increased demand for the security, a Fund may receive a fee for use of the security by the counterparty, which may result in interest income to the Fund. In the event the buyer of securities under a reverse
|
|
|
|
|
|
| |
140 |
|
PIMCO CLOSED-END FUNDS |
|
|
|
|
repurchase agreement files for bankruptcy or becomes insolvent, a Fund’s use of the proceeds of the agreement may be restricted pending a determination by the other party, or its trustee or receiver, whether to enforce a Fund’s obligation to repurchase the securities. Reverse repurchase agreements involve leverage risk and also the risk that the market value of the securities to be repurchased may decline below the repurchase price.
(c) Short Sales
Short sales are transactions in which a Fund sells a security that it does not own in anticipation that the market price of that security will decline. A Fund may make short sales of securities to (i) offset potential declines in long positions in similar securities, (ii) to increase the flexibility of a Fund, (iii) for investment return, (iv) as part of a risk arbitrage strategy, and (v) as part of its overall portfolio management strategies involving the use of derivative instruments. When a Fund makes a short sale, it will often borrow the security sold short and deliver it to the counterparty. A Fund will ordinarily have to pay a fee or premium to borrow a security and be obligated to repay the lender of the security any dividend or interest that accrues on the security during the period of the loan. Securities sold in short sale transactions and the dividend or interest payable on such securities, if any, are reflected as payable for short sales on the Statements of Assets and Liabilities. Short sales expose a Fund to the risk that it will be required to cover its short position at a time when the security or other asset has appreciated in value, thus resulting in losses to a Fund. A short sale is “against the box” if a Fund holds in its portfolio or has the right to acquire the security sold short, or securities identical to the security sold short, at no additional cost. A Fund will be subject to additional risks to the extent that it engages in short sales that are not “against the box.” A Fund’s loss on a short sale could theoretically be unlimited in cases where the Fund is unable, for whatever reason, to close out its short position.
6. FINANCIAL DERIVATIVE INSTRUMENTS
The Funds may enter into the financial derivative instruments described below to the extent permitted by each Fund’s respective investment policies.
The following disclosures contain information on how and why the Funds use financial derivative instruments, and how financial derivative instruments affect the Funds’ financial position, results of operations and cash flows. The location and fair value amounts of these instruments on the Statements of Assets and Liabilities and the net realized gain (loss) and net change in unrealized appreciation (depreciation) on the Statements of Operations, each categorized by type of financial derivative contract and related risk exposure, are included in a table in the Notes to Schedules of Investments. The financial derivative instruments outstanding as of period end and the
amounts of net realized gain (loss) and net change in unrealized appreciation (depreciation) on financial derivative instruments during the period, as disclosed in the Notes to Schedules of Investments, serve as indicators of the volume of financial derivative activity for the Funds.
PIMCO Global StocksPLUS
& Income Fund and PIMCO Dynamic Income Strategy Fund are subject to regulation as commodity pools under the Commodity Exchange Act by the Commodity Futures Trading Commission (the “CFTC”). The Manager has registered with the CFTC as a Commodity Pool Operator and a Commodity Trading Adviser with respect to the Funds, and is a member of the National Futures Association. As a result, additional CFTC-mandated disclosure, reporting and recordkeeping obligations apply to PIMCO Global StocksPLUS
& Income Fund and PIMCO Dynamic Income Strategy Fund.
(a) Forward Foreign Currency Contracts
may be engaged, in connection with settling planned purchases or sales of securities, to hedge the currency exposure associated with some or all of a Fund’s securities or as part of an investment strategy. A forward foreign currency contract is an agreement between two parties to buy and sell a currency at a set price on a future date. The market value of a forward foreign currency contract fluctuates with changes in foreign currency exchange rates. Forward foreign currency contracts are marked to market daily, and the change in value is recorded by a Fund as an unrealized gain (loss). Realized gains (losses) are equal to the difference between the value of the contract at the time it was opened and the value at the time it was closed and are recorded upon delivery or receipt of the currency. These contracts may involve market risk in excess of the unrealized gain (loss) reflected on the Statements of Assets and Liabilities. In addition, a Fund could be exposed to risk if the counterparties are unable to meet the terms of the contracts or if the value of the currency changes unfavorably to the U.S. dollar. To mitigate such risk, cash or securities may be exchanged as collateral pursuant to the terms of the underlying contracts.
(b) Futures Contracts
are agreements to buy or sell a security or other asset for a set price on a future date and are traded on an exchange. A Fund may use futures contracts to manage its exposure to the securities markets or to movements in interest rates and currency values. The primary risks associated with the use of futures contracts are the imperfect correlation between the change in market value of the securities held by a Fund and the prices of futures contracts and the possibility of an illiquid market. Futures contracts are valued based upon their quoted daily settlement prices. Upon entering into a futures contract, a Fund is required to deposit with its futures broker an amount of cash, U.S. Government and Agency Obligations, or select sovereign debt, in accordance with the initial margin requirements of the broker or exchange. Futures contracts are marked to market daily
|
|
|
|
|
|
|
|
|
|
|
|
| |
| |
|
|
ANNUAL REPORT |
|
|
| |
|
|
JUNE 30, 2025 |
|
|
141 |
|
|
|
|
| |
Notes to Financial Statements |
|
|
|
|
and based on such movements in the price of the contracts, an appropriate payable or receivable for the change in value may be posted or collected by the Fund (“Futures Variation Margin”). Futures Variation Margins, if any, are disclosed within centrally cleared financial derivative instruments on the Statements of Assets and Liabilities. Gains (losses) are recognized but not considered realized until the contracts expire or close. Futures contracts involve, to varying degrees, risk of loss in excess of the Futures Variation Margin included within exchange-traded or centrally cleared financial derivative instruments on the Statements of Assets and Liabilities.
(c) Options Contracts
may be written or purchased to enhance returns or to hedge an existing position or future investment.
A Fund may write call and put options on securities and financial derivative instruments it owns or in which it may invest. Writing put options tends to increase a Fund’s exposure to the underlying instrument. Writing call options tends to decrease a Fund’s exposure to the underlying instrument. When a Fund writes a call or put, an amount equal to the premium received is recorded and subsequently marked to market to reflect the current value of the option written. These amounts are included on the Statements of Assets and Liabilities. Premiums received from writing options which expire are treated as realized gains. Premiums received from writing options which are exercised or closed are added to the proceeds or offset against amounts paid on the underlying futures, swap, security or currency transaction to determine the realized gain (loss). Certain options may be written with premiums to be determined on a future date. The premiums for these options are based upon implied volatility parameters at specified terms. A Fund as a writer of an option has no control over whether the underlying instrument may be sold (“call”) or purchased (“put”) and as a result bears the market risk of an unfavorable change in the price of the instrument underlying the written option. There is the risk a Fund may not be able to enter into a closing transaction because of an illiquid market.
Purchasing call options tends to increase a Fund’s exposure to the underlying instrument. Purchasing put options tends to decrease a Fund’s exposure to the underlying instrument. A Fund pays a premium which is included as an asset on the Statements of Assets and Liabilities and subsequently marked to market to reflect the current value of the option. Premiums paid for purchasing options which expire are treated as realized losses. Certain options may be purchased with premiums to be determined on a future date. The premiums for these options are based upon implied volatility parameters at specified terms. The risk associated with purchasing put and call options is limited to the premium paid. Premiums paid for purchasing options which are exercised or closed are added to the amounts paid or offset against the proceeds on the underlying investment transaction to determine the realized gain (loss) when the underlying transaction is executed.
Options on Exchange-Traded Funds
use a specified exchange-traded fund as the underlying instrument for the option contract. A Fund may write or purchase options to enhance returns or to hedge an existing position or future investment.
Options on Exchange-Traded Futures Contracts
(“Futures Option”) may be written or purchased to hedge an existing position or future investment, for speculative purposes or to manage exposure to market movements. A Futures Option is an option contract in which the underlying instrument is a single futures contract.
Options on Indexes
(“Index Option”) use a specified index as the underlying instrument for the option contract. The exercise for an Index Option will not include physical delivery of the underlying index but will result in a cash transfer of the amount of the difference between the settlement price of the underlying index and the strike price.
(d) Swap Agreements
are bilaterally negotiated agreements between a Fund and a counterparty to exchange or swap investment cash flows, assets, foreign currencies or market-linked returns at specified, future intervals. Swap agreements may be privately negotiated in the over the counter market (“OTC swaps”) or may be cleared through a third party, known as a central counterparty or derivatives clearing organization (“Centrally Cleared Swaps”). A Fund may enter into asset, credit default, cross-currency, interest rate, total return, variance and other forms of swap agreements to manage its exposure to credit, currency, interest rate, commodity, equity and inflation risk. In connection with these agreements, securities or cash may be identified as collateral or margin in accordance with the terms of the respective swap agreements to provide assets of value and recourse in the event of default or bankruptcy/insolvency.
Centrally Cleared Swaps are marked to market daily based upon valuations as determined from the underlying contract or in accordance with the requirements of the central counterparty or derivatives clearing organization. Changes in market value, if any, are reflected as a component of net change in unrealized appreciation (depreciation) on the Statements of Operations. Daily changes in valuation of centrally cleared swaps, if any, are disclosed within centrally cleared financial derivative instruments on the Statements of Assets and Liabilities. Centrally Cleared and OTC swap payments received or paid at the beginning of the measurement period are included on the Statements of Assets and Liabilities and represent premiums paid or received upon entering into the swap agreement to compensate for differences between the stated terms of the swap agreement and prevailing market conditions (credit spreads, currency exchange rates, interest rates and other relevant factors). Upfront premiums received (paid) are initially recorded as liabilities (assets) and subsequently marked to market to reflect the current value of the swap. These upfront
|
|
|
|
|
|
| |
142 |
|
PIMCO CLOSED-END FUNDS |
|
|
|
|
premiums are recorded as realized gain (loss) on the Statements of Operations upon termination or maturity of the swap. A liquidation payment received or made at the termination of the swap is recorded as realized gain (loss) on the Statements of Operations. Net periodic payments received or paid by a Fund are included as part of realized gain (loss) on the Statements of Operations.
For purposes of a Fund’s investment policy adopted pursuant to Rule
35d-1
under the Act (if any), the Fund will account for derivative instruments at market value. For purposes of applying a Fund’s other investment policies and restrictions, swap agreements, like other derivative instruments, may be valued by a Fund at market value, notional value or full exposure value. In the case of a credit default swap, in applying certain of a Fund’s investment policies and restrictions, a Fund will value the credit default swap at its notional value or its full exposure value (i.e., the sum of the notional amount for the contract plus the market value), but may value the credit default swap at market value for purposes of applying certain of a Fund’s other investment policies and restrictions. For example, a Fund may value credit default swaps at full exposure value for purposes of a Fund’s credit quality guidelines (if any) because such value in general better reflects a Fund’s actual economic exposure during the term of the credit default swap agreement. As a result, a Fund may, at times, have notional exposure to an asset class (before netting) that is greater or lesser than the stated limit or restriction noted in a Fund’s prospectus. In this context, both the notional amount and the market value may be positive or negative depending on whether a Fund is selling or buying protection through the credit default swap. The manner in which certain securities or other instruments are valued by a Fund for purposes of applying investment policies and restrictions may differ from the manner in which those investments are valued by other types of investors.
Entering into swap agreements involves, to varying degrees, elements of interest, credit, market and documentation risk in excess of the amounts recognized on the Statements of Assets and Liabilities. Such risks involve the possibility that there will be no liquid market for these agreements, that the counterparty to the agreements may fail to perform or meet an obligation or disagree as to the meaning of contractual terms in the agreements and that there may be unfavorable changes in interest rates or the values of the asset upon which the swap is based.
A Fund’s maximum risk of loss from counterparty credit risk is the discounted net value of the cash flows to be received from the counterparty over the contract’s remaining life, to the extent that amount is positive. The risk may be mitigated by having a master netting arrangement between a Fund and the counterparty and by the posting of collateral to a Fund to cover a Fund’s exposure to the counterparty.
To the extent a Fund has a policy to limit the net amount owed to or to be received from a single counterparty under existing swap agreements, such limitation only applies to counterparties to OTC swaps and does not apply to centrally cleared swaps where the counterparty is a central counterparty or derivatives clearing organization.
Asset Swap Agreements
convert the cash flows from an underlying security from fixed coupon to floating coupon, floating coupon to fixed coupon, or from one currency to another. The terms and conditions of the asset swap are the same as for an interest rate swap. However, an asset swap is unique in that one interest payment is tied to cash flows from an investment, such as corporate bonds or sovereign issues. The other payment is typically tied to an alternative index, such as a floating rate or a rate denominated in a different currency.
Credit Default Swap Agreements
on corporate, loan, sovereign, U.S. municipal or U.S. Treasury issues are entered into to provide a measure of protection against defaults of the issuers (i.e., to reduce risk where a Fund owns or has exposure to the referenced obligation) or to take an active long or short position with respect to the likelihood of a particular issuer’s default. Credit default swap agreements involve one party making a stream of payments (referred to as the buyer of protection) to another party (the seller of protection) in exchange for the right to receive a specified return in the event that the referenced entity, obligation or index, as specified in the swap agreement, undergoes a certain credit event. As a seller of protection on credit default swap agreements, a Fund will generally receive from the buyer of protection a fixed rate of income throughout the term of the swap provided that there is no credit event. As the seller, a Fund would effectively add leverage to its portfolio because, in addition to its total net assets, a Fund would be subject to investment exposure on the notional amount of the swap.
If a Fund is a seller of protection and a credit event occurs, as defined under the terms of that particular swap agreement, a Fund will either (i) pay to the buyer of protection an amount equal to the notional amount of the swap and take delivery of the referenced obligation, other deliverable obligations or underlying securities comprising the referenced index or (ii) pay a net settlement amount in the form of cash, securities or other deliverable obligations equal to the notional amount of the swap less the recovery value of the referenced obligation or underlying securities comprising the referenced index. If a Fund is a buyer of protection and a credit event occurs, as defined under the terms of that particular swap agreement, a Fund will either (i) receive from the seller of protection an amount equal to the notional amount of the swap and deliver the referenced obligation, other deliverable obligations or underlying securities comprising the referenced index or (ii) receive a net settlement amount in the form of cash, securities or other deliverable obligations equal to the notional amount of the swap
|
|
|
|
|
|
|
|
|
|
|
|
| |
| |
|
|
ANNUAL REPORT |
|
|
| |
|
|
JUNE 30, 2025 |
|
|
143 |
|
|
|
|
| |
Notes to Financial Statements |
|
|
|
|
less the recovery value of the referenced obligation or underlying securities comprising the referenced index. Recovery values are estimated by market makers considering either industry standard recovery rates or entity specific factors and considerations until a credit event occurs. If a credit event has occurred, the recovery value is determined by a facilitated auction whereby a minimum number of allowable broker bids, together with a specified valuation method, are used to calculate the settlement value. The ability to deliver other obligations may result in a
option (the buyer of protection’s right to choose the deliverable obligation with the lowest value following a credit event).
Credit default swap agreements on corporate or sovereign issues involve one party making a stream of payments to another party in exchange for the right to receive a specified return in the event of a default or other credit event. If a credit event occurs and cash settlement is not elected, a variety of other deliverable obligations may be delivered in lieu of the specific referenced obligation. The ability to deliver other obligations may result in a
option (the buyer of protection’s right to choose the deliverable obligation with the lowest value following a credit event).
Credit default swap agreements on asset-backed securities involve one party making a stream of payments to another party in exchange for the right to receive a specified return in the event that the referenced entity, obligation or index, as specified in the agreement, undergoes a certain credit event. Unlike credit default swaps on corporate, loan, sovereign, U.S. municipal or U.S. Treasury issues, deliverable obligations in most instances would be limited to the specific referenced obligation, or in some cases, specific tranches of the specified reference obligation, as performance for asset-backed securities can vary across deals. Prepayments, principal paydowns, and other writedown or loss events on the underlying mortgage loans will reduce the outstanding principal balance of the referenced obligation. These reductions may be temporary or permanent as defined under the terms of the swap agreement and the notional amount for the swap agreement will be adjusted by corresponding amounts. A Fund may use credit default swaps on asset-backed securities to provide a measure of protection against defaults of the referenced obligation or to take an active long or short position with respect to the likelihood of a particular referenced obligation’s default.
Credit default swap agreements on credit indexes involve one party making a stream of payments to another party in exchange for the right to receive a specified return in the event of a write-down, principal shortfall, interest shortfall or default of all or part of the referenced entities comprising the credit index. A credit index is a basket of credit instruments or exposures designed to be representative of some part of the credit market as a whole. These indexes are made up of reference
credits that are judged by a poll of dealers to be the most liquid entities in the credit default swap market based on the sector of the index. Components of the indexes may include, but are not limited to, investment grade securities, high yield securities, asset-backed securities, emerging markets, and/or various credit ratings within each sector. Credit indexes are traded using credit default swaps with standardized terms including a fixed spread and standard maturity dates. An index credit default swap references all the names in the index, and if there is a default, the credit event is settled based on that name’s weight in the index. The composition of the indexes changes periodically, usually every six months, and for most indexes, each name has an equal weight in the index. Credit default swaps on credit indexes may be used to hedge a portfolio of credit default swaps or bonds, which is less expensive than it would be to buy many credit default swaps to achieve a similar effect. Credit default swaps on indexes are instruments for protecting investors owning bonds against default, and traders use them to speculate on changes in credit quality.
Implied credit spreads, represented in absolute terms, utilized in determining the market value of credit default swap agreements on corporate, loan, sovereign, U.S. municipal or U.S. Treasury issues as of period end, if any, are disclosed in the Notes to Schedules of Investments. They serve as an indicator of the current status of payment/performance risk and represent the likelihood or risk of default for the reference entity. The implied credit spread of a particular referenced entity reflects the cost of buying/selling protection and may include upfront payments required to be made to enter into the agreement. Wider credit spreads represent a deterioration of the referenced entity’s credit soundness and a greater likelihood or risk of default or other credit event occurring as defined under the terms of the agreement. For credit default swap agreements on asset-backed securities and credit indexes, the quoted market prices and resulting values serve as the indicator of the current status of the payment/performance risk. Increasing market values, in absolute terms when compared to the notional amount of the swap, represent a deterioration of the referenced entity’s credit soundness and a greater likelihood or risk of default or other credit event occurring as defined under the terms of the agreement.
The maximum potential amount of future payments (undiscounted) that a Fund as a seller of protection could be required to make under a credit default swap agreement equals the notional amount of the agreement. Notional amounts of each individual credit default swap agreement outstanding as of period end for which a Fund is the seller of protection are disclosed in the Notes to Schedules of Investments. These potential amounts would be partially offset by any recovery values of the respective referenced obligations, upfront payments received upon entering into the agreement, or net amounts received
|
|
|
|
|
|
| |
144 |
|
PIMCO CLOSED-END FUNDS |
|
|
|
|
from the settlement of buy protection credit default swap agreements entered into by a Fund for the same referenced entity or entities.
Interest Rate Swap Agreements
may be entered into to help hedge against interest rate risk exposure and to maintain a Fund’s ability to generate income at prevailing market rates. The value of the fixed rate bonds that the Funds hold may decrease if interest rates rise. To help hedge against this risk and to maintain its ability to generate income at prevailing market rates, a Fund may enter into interest rate swap agreements. Interest rate swap agreements involve the exchange by a Fund with another party for their respective commitment to pay or receive interest on the notional amount of principal. Certain forms of interest rate swap agreements may include: (i) interest rate caps, under which, in return for a premium, one party agrees to make payments to the other to the extent that interest rates exceed a specified rate, or “cap”, (ii) interest rate floors, under which, in return for a premium, one party agrees to make payments to the other to the extent that interest rates fall below a specified rate, or “floor”, (iii) interest rate collars, under which a party sells a cap and purchases a floor or vice versa in an attempt to protect itself against interest rate movements exceeding given minimum or maximum levels, (iv) callable interest rate swaps, under which the buyer pays an upfront fee in consideration for the right to early terminate the swap transaction in whole, at zero cost
and at a predetermined date and time prior to the maturity date, (v) spreadlocks, which allow the interest rate swap users to lock in the forward differential (or spread) between the interest rate swap rate and a specified benchmark, or (vi) basis swaps, under which two parties can exchange variable interest rates based on different segments of money markets.
Total Return Swap Agreements
are entered into to gain or mitigate exposure to the underlying reference asset. Total return swap agreements involve commitments where single or multiple cash flows are exchanged based on the price of an underlying reference asset and on a fixed or variable interest rate. Total return swap agreements may involve commitments to pay interest in exchange for a market-linked return. One counterparty pays out the total return of a specific underlying reference asset, which may include a single security, a basket of securities or an index, and in return receives a fixed or variable rate. At the maturity date, a net cash flow is exchanged where the total return is equivalent to the return of the underlying reference asset less a financing rate, if any. As a receiver, a Fund would receive payments based on any net positive total return and would owe payments in the event of a net negative total return. As the payer, a Fund would owe payments on any net positive total return and would receive payments in the event of a net negative total return.
7. PRINCIPAL AND OTHER RISKS
In the normal course of business, the Funds trade financial instruments and enter into financial transactions where risk of potential loss exists due to such things as changes in the market (market risk) or failure or inability of the other party to a transaction to perform (credit and counterparty risk). See below for a summary of select principal risks. For a complete list of the principal risks the Funds may be subject to, please see the Principal Risks of the Funds section of this report.
|
|
|
|
|
|
|
|
|
|
|
|
|
|
|
|
|
|
| |
| |
|
|
|
|
PCM Fund,
Inc. (PCM) |
|
PIMCO Global StocksPLUS & Income Fund (PGP) |
|
PIMCO Strategic
Income Fund,
Inc. (RCS) |
|
PIMCO Access
Income
Fund (PAXS) |
|
PIMCO Dynamic
Income
Fund (PDI) |
|
PIMCO Dynamic
Income
Opportunities
Fund (PDO) |
|
PIMCO Dynamic
Income
Strategy
Fund (PDX) |
|
|
|
|
|
|
|
|
| |
| Asset Allocation |
|
|
|
| |
X |
|
X |
|
X |
|
X |
|
X |
|
X |
|
X |
|
|
|
|
|
|
|
|
| |
| Call |
|
|
|
| |
X |
|
X |
|
X |
|
X |
|
X |
|
X |
|
X |
|
|
|
|
|
|
|
|
| |
| Collateralized Bond Obligations, Collateralized Loan Obligations and Collateralized Debt Obligations |
|
|
|
| |
X |
|
X |
|
X |
|
X |
|
X |
|
X |
|
X |
|
|
|
|
|
|
|
|
| |
| Commodity |
|
|
|
| |
— |
|
— |
|
— |
|
— |
|
— |
|
— |
|
X |
|
|
|
|
|
|
|
|
| |
| Confidential Information Access |
|
|
|
| |
X |
|
X |
|
X |
|
X |
|
X |
|
X |
|
X |
|
|
|
|
|
|
|
|
| |
| Contingent Convertible Securities |
|
|
|
| |
X |
|
X |
|
X |
|
X |
|
X |
|
X |
|
X |
|
|
|
|
|
|
|
|
| |
| Convertible Securities |
|
|
|
| |
X |
|
X |
|
X |
|
X |
|
X |
|
X |
|
X |
|
|
|
|
|
|
|
|
| |
| Corporate Debt |
|
|
|
| |
— |
|
X |
|
X |
|
X |
|
X |
|
X |
|
X |
|
|
|
|
|
|
|
|
| |
| Counterparty |
|
|
|
| |
X |
|
X |
|
X |
|
X |
|
X |
|
X |
|
X |
|
|
|
|
|
|
|
|
| |
| “Covenant-lite” Obligations |
|
|
|
| |
X |
|
X |
|
X |
|
X |
|
X |
|
X |
|
X |
|
|
|
|
|
|
|
|
| |
| Credit Default Swaps |
|
|
|
| |
X |
|
X |
|
X |
|
X |
|
X |
|
X |
|
X |
|
|
|
|
|
|
|
|
| |
| Credit |
|
|
|
| |
X |
|
X |
|
X |
|
X |
|
X |
|
X |
|
X |
|
|
|
|
|
|
|
|
| |
| Currency |
|
|
|
| |
X |
|
X |
|
X |
|
X |
|
X |
|
X |
|
X |
|
|
|
|
|
|
|
|
| |
| Cyber Security |
|
|
|
| |
X |
|
X |
|
X |
|
X |
|
X |
|
X |
|
X |
|
|
|
|
|
|
|
|
| |
| Debt Securities |
|
|
|
| |
X |
|
X |
|
X |
|
X |
|
X |
|
X |
|
X |
|
|
|
|
|
|
|
|
| |
| Derivatives |
|
|
|
| |
X |
|
X |
|
X |
|
X |
|
X |
|
X |
|
X |
|
|
|
|
|
|
|
|
|
|
|
|
| |
| |
|
|
ANNUAL REPORT |
|
|
| |
|
|
JUNE 30, 2025 |
|
|
145 |
|
|
|
|
| |
Notes to Financial Statements |
|
|
|
|
|
|
|
|
|
|
|
|
|
|
|
|
|
|
|
|
|
|
| |
| |
|
|
|
|
PCM Fund,
Inc. (PCM) |
|
PIMCO Global StocksPLUS & Income Fund (PGP) |
|
PIMCO Strategic
Income Fund,
Inc. (RCS) |
|
PIMCO Access
Income
Fund (PAXS) |
|
PIMCO Dynamic
Income
Fund (PDI) |
|
PIMCO Dynamic
Income
Opportunities
Fund (PDO) |
|
PIMCO Dynamic
Income
Strategy
Fund (PDX) |
|
|
|
|
|
|
|
|
| |
| Distressed and Defaulted Securities |
|
|
|
| |
X |
|
X |
|
X |
|
X |
|
X |
|
X |
|
X |
|
|
|
|
|
|
|
|
| |
| Distribution Rate |
|
|
|
| |
X |
|
X |
|
X |
|
X |
|
X |
|
X |
|
X |
|
|
|
|
|
|
|
|
| |
| Emerging Markets |
|
|
|
| |
X |
|
X |
|
X |
|
X |
|
X |
|
X |
|
X |
|
|
|
|
|
|
|
|
| |
| Energy Sector |
|
|
|
| |
— |
|
— |
|
— |
|
— |
|
— |
|
— |
|
X |
|
|
|
|
|
|
|
|
| |
| Equity Securities and Related Market |
|
|
|
| |
X |
|
X |
|
X |
|
X |
|
X |
|
X |
|
X |
|
|
|
|
|
|
|
|
| |
| Focused Investment |
|
|
|
| |
X |
|
X |
|
X |
|
X |
|
X |
|
X |
|
X |
|
|
|
|
|
|
|
|
| |
Foreign (Non-U.S.) Government Securities |
|
|
|
| |
X |
|
X |
|
X |
|
X |
|
X |
|
X |
|
X |
|
|
|
|
|
|
|
|
| |
| Foreign (Non·U.S.) Investment |
|
|
|
| |
X |
|
X |
|
X |
|
X |
|
X |
|
X |
|
X |
|
|
|
|
|
|
|
|
| |
| Foreign Loan Originations |
|
|
|
| |
— |
|
— |
|
— |
|
X |
|
X |
|
X |
|
X |
|
|
|
|
|
|
|
|
| |
| High Yield Securities |
|
|
|
| |
X |
|
X |
|
X |
|
X |
|
X |
|
X |
|
X |
|
|
|
|
|
|
|
|
| |
| Industry Specific |
|
|
|
| |
X |
|
X |
|
X |
|
X |
|
X |
|
X |
|
X |
|
|
|
|
|
|
|
|
| |
| Inflation/Deflation |
|
|
|
| |
X |
|
X |
|
X |
|
X |
|
X |
|
X |
|
X |
|
|
|
|
|
|
|
|
| |
| Inflation-Indexed Security |
|
|
|
| |
X |
|
X |
|
X |
|
X |
|
X |
|
X |
|
X |
|
|
|
|
|
|
|
|
| |
| Insurance-Linked and Other Instruments |
|
|
|
| |
X |
|
X |
|
X |
|
X |
|
X |
|
X |
|
X |
|
|
|
|
|
|
|
|
| |
| Interest Rate |
|
|
|
| |
X |
|
X |
|
X |
|
X |
|
X |
|
X |
|
X |
|
|
|
|
|
|
|
|
| |
| Investments in REITS |
|
|
|
| |
— |
|
— |
|
— |
|
X |
|
X |
|
— |
|
— |
|
|
|
|
|
|
|
|
| |
| Issuer |
|
|
|
| |
X |
|
X |
|
X |
|
X |
|
X |
|
X |
|
X |
|
|
|
|
|
|
|
|
| |
| Leverage |
|
|
|
| |
X |
|
X |
|
X |
|
X |
|
X |
|
X |
|
X |
|
|
|
|
|
|
|
|
| |
| Limited Term |
|
|
|
| |
— |
|
— |
|
— |
|
X |
|
— |
|
X |
|
X |
|
|
|
|
|
|
|
|
| |
| Liquidity |
|
|
|
| |
X |
|
X |
|
X |
|
X |
|
X |
|
X |
|
X |
|
|
|
|
|
|
|
|
| |
| Loan Origination |
|
|
|
| |
— |
|
— |
|
— |
|
X |
|
X |
|
X |
|
X |
|
|
|
|
|
|
|
|
| |
| Loans and Other Indebtedness; Loan Acquisitions, Participations and Assignments |
|
|
|
| |
X |
|
X |
|
X |
|
X |
|
X |
|
X |
|
X |
|
|
|
|
|
|
|
|
| |
| Management |
|
|
|
| |
X |
|
X |
|
X |
|
X |
|
X |
|
X |
|
X |
|
|
|
|
|
|
|
|
| |
| Market Discount |
|
|
|
| |
X |
|
X |
|
X |
|
X |
|
X |
|
X |
|
X |
|
|
|
|
|
|
|
|
| |
| Market Disruptions |
|
|
|
| |
X |
|
X |
|
X |
|
X |
|
X |
|
X |
|
X |
|
|
|
|
|
|
|
|
| |
| Market |
|
|
|
| |
X |
|
X |
|
X |
|
X |
|
X |
|
X |
|
X |
|
|
|
|
|
|
|
|
| |
| Mortgage-Related and Other Asset-Backed Securities |
|
|
|
| |
X |
|
X |
|
X |
|
X |
|
X |
|
X |
|
X |
|
|
|
|
|
|
|
|
| |
| Mortgage-Related Derivative Instruments |
|
|
|
| |
X |
|
X |
|
X |
|
X |
|
X |
|
X |
|
X |
|
|
|
|
|
|
|
|
| |
| Municipal Bond |
|
|
|
| |
— |
|
— |
|
— |
|
— |
|
— |
|
— |
|
X |
|
|
|
|
|
|
|
|
| |
| Non-Diversification |
|
|
|
| |
— |
|
— |
|
— |
|
— |
|
— |
|
— |
|
X |
|
|
|
|
|
|
|
|
| |
| Operational |
|
|
|
| |
X |
|
X |
|
X |
|
X |
|
X |
|
X |
|
X |
|
|
|
|
|
|
|
|
| |
| Other Investment Companies |
|
|
|
| |
X |
|
X |
|
X |
|
— |
|
— |
|
— |
|
X |
|
|
|
|
|
|
|
|
| |
| Other Pooled Investment Vehicles Risk |
|
|
|
| |
— |
|
— |
|
— |
|
X |
|
X |
|
X |
|
— |
|
|
|
|
|
|
|
|
| |
| Platform |
|
|
|
| |
— |
|
— |
|
— |
|
X |
|
X |
|
X |
|
X |
|
|
|
|
|
|
|
|
| |
| Portfolio Turnover |
|
|
|
| |
X |
|
X |
|
X |
|
X |
|
X |
|
X |
|
X |
|
|
|
|
|
|
|
|
| |
| Potential Conflicts of Interest Risk-Allocation of Investment Opportunities |
|
|
|
| |
X |
|
X |
|
X |
|
X |
|
X |
|
X |
|
X |
|
|
|
|
|
|
|
|
| |
| Preferred Securities |
|
|
|
| |
X |
|
X |
|
X |
|
X |
|
X |
|
X |
|
X |
|
|
|
|
|
|
|
|
| |
| Privacy and Data Security |
|
|
|
| |
X |
|
X |
|
X |
|
X |
|
X |
|
X |
|
X |
|
|
|
|
|
|
|
|
| |
| Private Commercial Real Estate |
|
|
|
| |
— |
|
— |
|
— |
|
— |
|
X |
|
— |
|
— |
|
|
|
|
|
|
|
|
| |
| Private Placement and Restricted Securities |
|
|
|
| |
X |
|
X |
|
X |
|
X |
|
X |
|
X |
|
X |
|
|
|
|
|
|
|
|
| |
| Privately-Issued Mortgage-Related Securities |
|
|
|
| |
X |
|
X |
|
X |
|
X |
|
X |
|
X |
|
X |
|
|
|
|
|
|
|
|
| |
| Real Estate |
|
|
|
| |
X |
|
X |
|
X |
|
X |
|
X |
|
X |
|
X |
|
|
|
|
|
|
|
|
| |
| Real Estate Joint Venture |
|
|
|
| |
— |
|
— |
|
— |
|
— |
|
X |
|
— |
|
— |
|
|
|
|
|
|
|
|
| |
| Regulation S Securities |
|
|
|
| |
X |
|
X |
|
X |
|
X |
|
— |
|
— |
|
— |
|
|
|
|
|
|
|
|
| |
| Regulatory Changes |
|
|
|
| |
X |
|
X |
|
X |
|
X |
|
X |
|
X |
|
X |
|
|
|
|
|
|
|
|
| |
| Regulatory Risk-Commodity Pool Operator |
|
|
|
| |
X |
|
X |
|
X |
|
X |
|
X |
|
X |
|
X |
|
|
|
|
|
|
|
|
| |
| Reinvestment |
|
|
|
| |
X |
|
X |
|
X |
|
X |
|
X |
|
X |
|
X |
|
|
|
|
|
|
|
|
| |
| REIT |
|
|
|
| |
— |
|
— |
|
— |
|
X |
|
X |
|
— |
|
— |
|
|
|
|
|
|
|
|
| |
| REIT Subsidiary |
|
|
|
| |
— |
|
— |
|
— |
|
— |
|
X |
|
— |
|
— |
|
|
|
|
|
|
|
|
| |
| Repurchase Agreements |
|
|
|
| |
X |
|
X |
|
X |
|
X |
|
X |
|
X |
|
X |
|
|
|
|
|
|
|
|
| |
| Risks of Equity Securities of MLPs, Risks of Debt Securities of MLPs, and Risks of MLP General Partner and Managing Member Interests |
|
|
|
| |
— |
|
— |
|
— |
|
— |
|
— |
|
— |
|
X |
|
|
|
|
|
|
| |
146 |
|
PIMCO CLOSED-END FUNDS |
|
|
|
|
|
|
|
|
|
|
|
|
|
|
|
|
|
|
|
|
|
|
| |
| |
|
|
|
|
PCM Fund,
Inc. (PCM) |
|
PIMCO Global StocksPLUS & Income Fund (PGP) |
|
PIMCO Strategic
Income Fund,
Inc. (RCS) |
|
PIMCO Access
Income
Fund (PAXS) |
|
PIMCO Dynamic
Income
Fund (PDI) |
|
PIMCO Dynamic
Income
Opportunities
Fund (PDO) |
|
PIMCO Dynamic
Income
Strategy
Fund (PDX) |
|
|
|
|
|
|
|
|
| |
| Risks of ETNs |
|
|
|
| |
— |
|
— |
|
— |
|
— |
|
— |
|
— |
|
X |
|
|
|
|
|
|
|
|
| |
| Risk Retention Investment |
|
|
|
| |
X |
|
X |
|
X |
|
X |
|
X |
|
X |
|
X |
|
|
|
|
|
|
|
|
| |
| Securities Lending |
|
|
|
| |
— |
|
— |
|
— |
|
— |
|
X |
|
— |
|
— |
|
|
|
|
|
|
|
|
| |
| Senior Debt |
|
|
|
| |
X |
|
X |
|
X |
|
X |
|
X |
|
X |
|
X |
|
|
|
|
|
|
|
|
| |
| Short Exposure |
|
|
|
| |
X |
|
X |
|
X |
|
X |
|
X |
|
X |
|
X |
|
|
|
|
|
|
|
|
| |
| Smaller Company |
|
|
|
| |
X |
|
X |
|
X |
|
X |
|
X |
|
X |
|
X |
|
|
|
|
|
|
|
|
| |
| Sovereign Debt |
|
|
|
| |
X |
|
X |
|
X |
|
X |
|
X |
|
X |
|
X |
|
|
|
|
|
|
|
|
| |
| Special Purpose Acquisition Companies (“SPACs”) |
|
|
|
| |
— |
|
— |
|
— |
|
— |
|
X |
|
— |
|
— |
|
|
|
|
|
|
|
|
| |
| Structured Investments |
|
|
|
| |
X |
|
X |
|
X |
|
X |
|
X |
|
X |
|
X |
|
|
|
|
|
|
|
|
| |
| Subprime |
|
|
|
| |
X |
|
X |
|
X |
|
X |
|
X |
|
X |
|
X |
|
|
|
|
|
|
|
|
| |
| Subsidiary |
|
|
|
| |
— |
|
— |
|
— |
|
X |
|
X |
|
X |
|
X |
|
|
|
|
|
|
|
|
| |
| Synthetic Convertible Securities |
|
|
|
| |
X |
|
X |
|
X |
|
X |
|
X |
|
X |
|
X |
|
|
|
|
|
|
|
|
| |
| Tax |
|
|
|
| |
X |
|
X |
|
X |
|
X |
|
X |
|
X |
|
X |
|
|
|
|
|
|
|
|
| |
| Total Return Swap |
|
|
|
| |
X |
|
X |
|
X |
|
X |
|
X |
|
X |
|
X |
|
|
|
|
|
|
|
|
| |
| U.S. Government Securities |
|
|
|
| |
X |
|
X |
|
X |
|
X |
|
X |
|
X |
|
X |
|
|
|
|
|
|
|
|
| |
| Valuation |
|
|
|
| |
X |
|
X |
|
X |
|
X |
|
X |
|
X |
|
X |
|
|
|
|
|
|
|
|
| |
Zero-Coupon Bond, Step-Ups and Securities |
|
|
|
| |
— |
|
— |
|
— |
|
X |
|
X |
|
X |
|
X |
Asset Allocation Risk
is the risk that a Fund could experience losses as a result of less than optimal or poor asset allocation decisions. A Fund could miss attractive investment opportunities by underweighting markets that subsequently experience significant returns and could lose value by overweighting markets that subsequently experience significant declines.
Call Risk
is the risk that an issuer may exercise its right to redeem a fixed income security earlier than expected (a call). Issuers may call outstanding securities prior to their maturity for a number of reasons including declining interest rates, changes in credit spreads and improvements in the issuer’s credit quality. If an issuer calls a security that a Fund has invested in, the Fund may not recoup the full amount of its initial investment or may not realize the full anticipated earnings from the investment and may be forced to reinvest in lower- yielding securities, securities with greater credit risks or securities with other, less favorable features.
Collateralized Bond Obligations, Collateralized Loan Obligations and Collateralized Debt Obligations Risk
is the risk that an investment in a CLO, CBO or other CDO depends largely on the type of the collateral securities and the class/tranche of the instrument in which a Fund invests. In addition to the normal risks associated with debt instruments (e.g., interest rate risk and credit risk), CLOs, CBOs and CDOs carry additional risks including, but not limited to: (i) the possibility that distributions from the collateral will not be adequate to make interest or other payments; (ii) the risk that the quality of the collateral may decline in value or default; (iii) the risk that a Fund may invest in CBOs, CLOs or other CDOs that are subordinate to other classes; and (iv) the risk that the complex structure of the security may
not be fully understood at the time of investment and may produce disputes with the issuer or others and may produce unexpected investment results.
Commodity Risk
is the risk that investing in commodity-linked derivative instruments and commodities, either directly or indirectly through a subsidiary, may subject a Fund to greater volatility than investments in traditional securities. The value of commodity-linked derivative instruments or commodities may be affected by changes in overall market movements, foreign currency exchange rates, commodity index volatility, changes in inflation, interest rates, or supply and demand factors affecting a particular industry or commodity market, such as drought, floods, weather, livestock disease, pandemics and public health emergencies, embargoes, taxation, war, terrorism, cyber hacking, economic and political developments, environmental proceedings, tariffs, changes in storage costs, availability of transportation systems, and international economic, political and regulatory developments. Investments in commodities can also present risks associated with transportation and delivery, custody, storage and maintenance, illiquidity, and the unavailability of accurate market valuations of the commodity.
Confidential Information Access Risk
is the risk that, in managing a Fund (and other PIMCO clients), PIMCO may from time to time have the opportunity to receive material,
non-public
information (“Confidential Information”) about the issuers of certain investments, including, without limitation, senior floating rate loans, other loans and related investments being considered for acquisition by a Fund or held in the Fund’s portfolio. If PIMCO intentionally or unintentionally comes into possession of Confidential Information, it may be unable,
|
|
|
|
|
|
|
|
|
|
|
|
| |
| |
|
|
ANNUAL REPORT |
|
|
| |
|
|
JUNE 30, 2025 |
|
|
147 |
|
|
|
|
| |
Notes to Financial Statements |
|
|
|
|
potentially for a substantial period of time, to purchase or sell investments to which such Confidential Information relates.
Contingent Convertible Securities Risk
is the risk of investing in contingent convertible securities, including the risk that interest payments will be cancelled by the issuer or a regulatory authority, the risk of ranking junior to other creditors in the event of a liquidation or other bankruptcy-related event as a result of holding subordinated debt, the risk of a Fund’s investment becoming further subordinated as a result of conversion from debt to equity, the risk of the Fund’s investment receiving less favorable treatment than equity of the issuer in certain situations, such as during financial distress or regulatory intervention, the risk that the principal amount due can be written down to a lesser amount (including potentially to zero), and the general risks applicable to fixed income investments, including interest rate risk, credit risk, market risk and liquidity risk, any of which could result in losses to the Fund.
Convertible Securities Risk
is the risk that the market values of convertible securities may decline as interest rates increase and, conversely, may increase as interest rates decline. A convertible security’s market value, however, tends to reflect the market price of the common stock of the issuing company when that stock price approaches or is greater than the convertible security’s “conversion price.” The conversion price is defined as the predetermined price at which the convertible security could be exchanged for the associated stock. As the market price of the underlying common stock declines, the price of the convertible security tends to be influenced more by the yield of the convertible security. Thus, it may not decline in price to the same extent as the underlying common stock. In the event of a liquidation of the issuing company, holders of convertible securities may be paid before the company’s common stockholders but after holders of any senior debt obligations of the company. Consequently, the issuer’s convertible securities generally entail less risk than its common stock but more risk than its debt obligations. Convertible securities are often rated below investment grade or not rated.
Corporate Debt Securities Risk
is the risk that the market value of a corporate debt security may be affected by factors directly relating to the issuer and that the issuers of corporate debt securities may not be able to meet their obligations on interest or principal payments at the time called for by an instrument. The market value of corporate debt securities generally may be expected to rise and fall inversely with interest rates. In addition, certain corporate debt securities may be highly customized and as a result may be subject to, among others, liquidity and valuation/pricing transparency risks.
Counterparty Risk
is the risk that a Fund will be subject to credit risk with respect to the counterparties to the derivative contracts and other
instruments entered into by the Fund or held by special purpose or structured vehicles in which the Fund invests. If a counterparty becomes bankrupt or otherwise fails to perform its obligations under a derivative contract due to financial difficulties, the Fund may experience significant delays in obtaining any recovery (including recovery of any collateral it has provided to the counterparty) in a dissolution, assignment for the benefit of creditors, liquidation,
winding-up,
bankruptcy, or other analogous proceeding. Counterparty credit risk also includes the related risk of having concentrated exposure to a single counterparty, which may increase potential losses if the counterparty were to become insolvent.
“Covenant-Lite” Obligations Risk
is the risk that covenant-lite obligations contain fewer maintenance covenants than other obligations, or no maintenance covenants, and may not include terms that allow the lender to monitor the performance of the borrower and declare a default if certain criteria are breached, which would allow the lender to restructure the loan or take other action intended to help mitigate losses. Covenant-lite loans may carry more risk than traditional loans as they allow individuals and corporations to engage in activities that would otherwise be difficult or impossible under a covenant-heavy loan agreement. In the event of default, covenant-lite loans may exhibit diminished recovery values as the lender may not have the opportunity to negotiate with the borrower prior to default.
Credit Default Swaps Risk
is the risk of investing in credit default swaps, including illiquidity risk, counterparty risk, leverage risk and credit risk. A buyer generally also will lose its investment and recover nothing should no credit event occur and the swap is held to its termination date. If a credit event were to occur, the value of any deliverable obligation received by the seller (if any), coupled with the upfront or periodic payments previously received, may be less than the full notional value it pays to the buyer, resulting in a loss of value to the seller. When a Fund acts as a seller of a credit default swap, it is exposed to many of the same risks of leverage described herein. As the seller, a Fund would receive a stream of payments over the term of the swap agreement provided that no event of default has occurred with respect to the referenced debt obligation upon which the swap is based. A Fund would effectively add leverage to its portfolio because, if a default occurs, the stream of payments may stop and, in addition to its total net assets, the Fund would be subject to investment exposure on the notional amount of the swap. In addition, selling credit default swaps may not be profitable for a Fund if no secondary market exists or the Fund is otherwise unable to close out these transactions at advantageous times.
Credit Risk
is the risk that a Fund could experience losses if the issuer or guarantor of a fixed income security (including a security purchased with securities lending collateral), the counterparty to a derivatives
|
|
|
|
|
|
| |
148 |
|
PIMCO CLOSED-END FUNDS |
|
|
|
|
contract, or the issuer or guarantor of collateral, repurchase agreement or a loan of portfolio securities, is unable or unwilling, or is perceived (whether by market participants, rating agencies, pricing services or otherwise) as unable or unwilling, to make timely principal and/or interest payments or to otherwise honor its obligations. Credit risk also includes credit spread risk, which is the risk that credit spreads (i.e., the difference in yield between securities that is due to the difference in their actual or perceived credit quality) may increase when the market believes that investments generally have a greater risk of default.
Currency Risk
is the risk that investments denominated in foreign
(non-U.S.)
currencies or in securities that trade in and receive revenues in, foreign
(non-U.S.)
currencies, or derivatives or other instruments that provide exposure to foreign
(non-U.S.)
currencies may decline in value, due to the risk that those currencies will decline in value relative to the U.S. dollar, or, in the case of hedging positions, that the U.S. dollar will decline in value relative to the currency being hedged. Currency risk may be particularly high to the extent that a Fund invests in foreign
(non-U.S.)
currencies or engages in foreign currency transactions that are economically tied to emerging market countries.
Cyber Security Risk
is the risk that, as the use of technology, including cloud-based technology, has become more prevalent and interconnected in the course of business, the Funds have become potentially more susceptible to operational and information security risks resulting from breaches in cyber security despite the efforts of PIMCO, a Fund, or their service providers to adopt technologies, processes, and practices intended to mitigate these risks. A breach in cyber security refers to both intentional and unintentional cyber events that may, among other things, cause a Fund to lose proprietary information, suffer data corruption and/or destruction or lose operational capacity, result in the unauthorized release or other misuse of confidential information or otherwise disrupt normal business operations. Geopolitical tensions can increase the scale and sophistication of deliberate cybersecurity attacks, particularly those from nation-states or from entities with nation-state backing, who may desire to use cybersecurity attacks to cause damage or create leverage against geopolitical rivals. Cyber security failures or breaches may result in financial losses to a Fund and its shareholders.
These failures or breaches may also result in disruptions to business operations, potentially resulting in financial losses; interference with a Fund’s ability to calculate its net asset value, process shareholder transactions or otherwise transact business with shareholders; impediments to trading; violations of applicable privacy and other laws; regulatory fines; penalties; third-party claims in litigation; reputational damage; reimbursement or other compensation costs; additional compliance and cyber security risk management costs and other
adverse consequences. In addition, substantial costs may be incurred in order to prevent any cyber incidents in the future. There is also a risk that cyber security breaches may not be detected. A Fund and its shareholders may suffer losses as a result of a cyber security breach related to the Fund, its service providers, trading counterparties or the issuers in which the Fund invests.
Debt Securities Risk
is the risk that prices of bonds and other fixed income securities will generally increase as interest rates fall and decrease as interest rates rise. Income from a Fund’s portfolio may decline if the Fund invests the proceeds from matured, traded or called fixed income securities at market interest rates that are below the portfolio’s current earnings rate. The value of most bond funds and fixed income securities are impacted by changes in interest rates. Bonds and bond funds with longer durations tend to be more sensitive and more volatile than securities with shorter durations; bond prices generally fall as interest rates rise.
Derivatives Risk
is the risk of investing in derivative instruments (such as forwards, futures, options, swaps and structured securities) and other similar investments, including leverage, liquidity, interest rate, market, counterparty (including credit), operational, legal and management risks and valuation complexity. Changes in the value of a derivative or other similar instrument may not correlate perfectly with, and may be more sensitive to market events than, the underlying asset, rate or index, and a Fund could lose more than the initial amount invested. In addition, the use of derivatives may cause a Fund’s investment returns to be impacted by the performance of assets the Fund does not own, potentially resulting in the Fund’s total investment exposure exceeding the value of its portfolio.
Changes in the value of a derivative or other similar instruments may also create margin delivery or settlement payment obligations for a Fund. A Fund’s use of derivatives or other similar investments may result in losses to the Fund, a reduction in the Fund’s returns and/or increased volatility.
Non-centrally
cleared
(“OTC”) derivatives or other similar investments are also subject to the risk that a counterparty to the transaction will not fulfill its contractual obligations to the other party, as many of the protections afforded to centrally-cleared derivative transactions might not be available for
non-centrally
cleared OTC derivatives or other similar investments. The primary credit risk on derivatives or other similar investments that are exchange-traded or traded through a central clearing counterparty resides with a Fund’s clearing broker, or the clearinghouse. Changes in regulation relating to a registered fund’s use of derivatives and related instruments could potentially limit or impact a Fund’s ability to invest in derivatives, limit a Fund’s ability to employ certain strategies that use derivatives or
|
|
|
|
|
|
|
|
|
|
|
|
| |
| |
|
|
ANNUAL REPORT |
|
|
| |
|
|
JUNE 30, 2025 |
|
|
149 |
|
|
|
|
| |
Notes to Financial Statements |
|
|
|
|
other similar instruments and/or adversely affect the value of derivatives or other similar investments and a Fund’s performance.
Distressed and Defaulted Securities Risk
is the risk of investing in the securities of financially distressed issuers, including the risk of default. These securities may fluctuate more in price and are typically less liquid. Distressed securities generally trade significantly below “par” or fall value. A Fund also will be subject to significant uncertainty as to when, and in what manner, and for what value obligations evidenced by securities of financially distressed issuers will eventually be satisfied.
Distribution Rate Risk
is the risk that, although a Fund may seek to maintain level distributions, the Fund’s distribution rates may be affected by numerous factors, including but not limited to changes in realized and projected market returns, fluctuations in market interest rates, Fund performance and other factors. There can be no assurance that a change in market conditions or other factors will not result in a change in a Fund’s distribution rate or that the rate will be sustainable in the future.
Emerging Markets Risk
is the risk of investing in emerging market securities. The risks primarily associated with foreign
(non-U.S.)
investments may be particularly high to the extent a Fund invests in securities of issuers based or doing business in emerging markets countries or in securities denominated in the currencies of emerging market countries.
Energy Sector Risk
is the risk that applies to a Fund’s investments in MLPs and other companies which operate natural gas, natural gas liquids, crude oil, refined products, coal or other facilities within the energy sector. A Fund’s performance will be susceptible to fluctuations in commodity prices, changes in the supply of or demand for energy commodities, an inability to acquire additional energy deposits sufficient to replace the natural depletion of existing reserves, environmental and safety regulations, seasonal and extreme weather, catastrophic events or accidents, acquisition costs and erroneous assumptions regarding new acquisitions and the cyclical fluctuation and intense price competition inherent to the energy industry. Additionally, MLPs and other entities operating in the energy sector are subject to industry-specific risks related to infrastructure, which includes transportation via pipeline, the gathering, processing and midstream storage of resources, variations in upstream and downstream demand, and the effects of land, weather and unforeseen events on oil, oilfields, coal stockpiles, power infrastructure and marine transportation.
Equity Securities and Related Market Risk
is the risk that the value of equity securities, such as common stocks and preferred securities, or equity-related securities may decline due to general market conditions which are not specifically related to a particular company or to factors
affecting a particular industry or industries. Equity securities generally have greater price volatility than fixed income securities.
Focused Investment Risk
is the risk that, to the extent that a Fund focuses its investments in a particular industry, country or geographic region, the NAV of its common shares will be more susceptible to events or factors affecting companies in that industry, country or geographic region.
Foreign
(Non-U.S.)
Government Securities Risk
is the risk that investments in fixed income instruments issued by sovereign entities may decline in value as a result of default or other adverse credit event resulting from an issuer’s inability or unwillingness to make principal or interest payments in a timely fashion.
Foreign
(Non-U.S.)
Investment Risk
is the risk that investing in foreign
(non-U.S.)
securities may result in a Fund experiencing more rapid and extreme changes in value than a fund that invests exclusively in securities of U.S. companies due to smaller markets, differing reporting, accounting, legal, corporate governance and auditing standards, increased risk of delayed settlement of portfolio transactions or loss of certificates of portfolio securities, and the risk of unfavorable U.S. or foreign government actions, including nationalization, expropriation or confiscatory taxation, currency blockage, political changes, diplomatic developments, trade restrictions (including tariffs) or the imposition of sanctions and other similar measures. Foreign securities may also be less liquid and more difficult to value than securities of U.S. issuers.
Foreign Loan Originations Risk
is the risk associated with a Fund originating loans to foreign entities and individuals, including foreign
(non-U.S.)
and emerging market entities and individuals, which may involve risks not ordinarily associated with exposure to loans to U.S. entities and individuals due to more or less governmental supervision and regulation than exists in the U.S. Due to differences in legal systems, there may be difficulty in obtaining or enforcing a court judgment outside the U.S. In addition, to the extent that investments are made in a limited number of countries, events in those countries will have a more significant impact on the Fund. The Fund’s loans to foreign entities and individuals may be subject to risks of increased transaction costs, potential delays in settlement or unfavorable differences between the U.S. economy and foreign economies.
High Yield Securities Risk
is the risk that high yield securities and unrated securities of similar credit quality (commonly known as “junk bonds”) are subject to greater levels of market, credit, call and liquidity risks, including the risk that a court will subordinate high yield senior debt to other debt of the issuer or take other actions detrimental to holders of the senior debt. High yield securities are considered primarily speculative by rating agencies with respect to the issuer’s continuing
|
|
|
|
|
|
| |
150 |
|
PIMCO CLOSED-END FUNDS |
|
|
|
|
ability to make principal and interest payments, and their values and may be more volatile than higher- rated securities of similar maturity.
Industry Specific Risks
are the risks that MLPs and other entities operating in a specific sector that are specific to the industry within that sector they serve.
Inflation/Deflation Risk
is the risk that the value of assets or income from a Fund’s investments will be worth less in the future as inflation decreases the value of payments at future dates. As inflation increases, the real value of the Fund’s portfolio could decline. Inflation rates may change frequently and significantly as a result of various factors, including unexpected shifts in the domestic or global economy or changes in fiscal or monetary policies. Deflation risk is the risk that prices throughout the economy decline over time. Deflation may have an adverse effect on the creditworthiness of issuers and may make issuer default more likely, which may result in a decline in the value of the Fund’s portfolio and common shares.
Inflation-Indexed Security Risk
is the risk that inflation-indexed debt securities are subject to the effects of actual or anticipated changes in market interest rates caused by factors other than inflation (real interest rates). In general, the value of an inflation-indexed security, including Treasury Inflation- Protected Securities (“TIPS”), tends to decrease when real interest rates increase and can increase when real interest rates decrease. Interest payments on inflation-indexed securities are unpredictable and will fluctuate as the principal and interest are adjusted for inflation. There can be no assurance that the inflation index used will accurately measure the real rate of inflation in the prices of goods and services. Any increase in the principal amount of an inflation-indexed debt security will be considered taxable ordinary income for the amount of the increase in the calendar year, even though the Fund will not receive the principal until maturity.
Insurance-Linked and Other Instruments Risk
is the risk that a Fund could lose a portion or all of the principal it has invested in insurance- linked instruments and similar investments (which may include, for example, exposure to reinsurance contracts (through sidecars or otherwise), reinsurance contracts, sidecars and event-linked bonds, such as catastrophe and resilience bonds, and securities relating to life insurance policies, annuity contracts and premium finance loans).
Interest Rate Risk
is the risk that fixed income securities and other instruments in a Fund’s portfolio will fluctuate in value because of a change in interest rates; a fund with a longer average portfolio duration will be more sensitive to changes in interest rates than a fund with a shorter average portfolio duration. Factors such as government policy, inflation, the economy, and market for bonds can impact interest rates and yields.
Investments in REITs Risk
is the risk that an investment in a REIT, or in a real estate linked derivative instrument linked to the value of a REIT, is subject to the risks that impact the value of the underlying properties of the REIT. These risks include loss to casualty or condemnation, and changes in supply and demand, interest rates, zoning laws, regulatory limitations on rents, property taxes and operating expenses. Other factors that may adversely affect REITs include poor performance by management of the REIT, changes to the tax laws, or failure by the REIT to qualify for favorable tax treatment.
Issuer Risk
is the risk that the value of a security may decline for reasons directly related to the issuer, such as management performance, major litigation, investigations or other controversies, changes in the issuer’s financial condition or credit rating, changes in government regulations affecting the issuer or its competitive environment and strategic initiatives such as mergers, acquisitions or dispositions and the market response to any such initiatives, financial leverage, reputation or reduced demand for the issuer’s goods or services.
Leverage Risk
is the risk that certain transactions of a Fund, such as direct borrowing from banks, reverse repurchase agreements, loans of portfolio securities, and the use of when-issued, delayed delivery or forward commitment transactions, or derivative instruments, may give rise to leverage, magnifying gains and losses and causing a Fund to be more volatile than if it had not been leveraged. This means that leverage entails a heightened risk of loss. The use of leverage may also increase the Fund’s sensitivity to interest rate risks. When a Fund reduces or discontinues its use of leverage (“deleveraging”), which it may be required to do at inopportune times, it may be required to sell portfolio securities at inopportune times to repay leverage obligations, which could result in realized losses and a decrease in the Fund’s net asset value. The use of leverage may also increase a Fund’s sensitivity to interest rate risks.
Limited Term Risk
is the risk that unless the limited term provision of the Fund’s Declaration of Trust is amended by shareholders in accordance with the Declaration of Trust, or unless the Fund completes an Eligible Tender Offer and converts to perpetual existence, the Fund will terminate on or about a date specified in the Fund’s Prospectus.
Liquidity Risk
is the risk that a particular investment may be difficult to purchase or sell and that a Fund may be unable to sell investments at an advantageous time or price or possibly require a Fund to dispose of other investments at unfavorable times or prices in order to satisfy its obligations, which could prevent the Fund from taking advantage of other investment opportunities. Additionally, the market for certain investments may become illiquid under adverse market or economic conditions independent of any specific adverse changes in the
|
|
|
|
|
|
|
|
|
|
|
|
| |
| |
|
|
ANNUAL REPORT |
|
|
| |
|
|
JUNE 30, 2025 |
|
|
151 |
|
|
|
|
| |
Notes to Financial Statements |
|
|
|
|
conditions of a particular issuer, such as during political events (including periods of rapid interest rate changes). There can be no assurance that an investment that is deemed to be liquid when purchased will continue to be liquid while it is held by the Fund and/or when the Fund wishes to dispose of it.
Loan Origination Risk
is the risk associated with the fact that a Fund may also seek to originate loans, including, without limitation, residential and/or commercial real estate or mortgage-related loans, consumer loans or other types of loans, which may be in the form of whole loans, secured and unsecured notes, senior and second lien loans, mezzanine loans, bridge loans or similar investments. A Fund may originate loans to corporations and/or other legal entities and individuals, including foreign
(non-U.S.)
entities and individuals. Such borrowers may have credit ratings that are determined by one or more NRSROs or PIMCO to be below investment grade. This may include loans to public or private firms or individuals, such as in connection with housing development projects. The loans a Fund invests in or originates may vary in maturity and/or duration. A Fund is not limited in the amount, size or type of loans it may invest in and/or originate, including with respect to a single borrower or with respect to borrowers that are determined to be below investment grade, other than pursuant to any applicable law. A Fund’s investment in or origination of loans may also be limited by the requirements the Fund intends to observe under Subchapter M of the Code in order to qualify as a RIC. A Fund may subsequently offer such investments for sale to third parties, provided that there is no assurance that a Fund will complete the sale of such an investment. If a Fund is unable to sell, assign or successfully close transactions for the loans that it originates, the Fund will be forced to hold its interest in such loans for an indeterminate period of time.
This could result in a Fund’s investments having high exposure to certain borrowers. A Fund will be responsible for the expenses associated with originating a loan (whether or not consummated). This may include significant legal and due diligence expenses, which will be indirectly borne by a Fund and Common Shareholders.
Loans and Other Indebtedness; Loan Acquisitions, Participations and Assignments Risk
is the risk that scheduled interest or principal payments will not be made in a timely manner or at all, either of which may adversely affect the values of a loan. Additionally, there is a risk that the collateral underlying a loan may be unavailable or insufficient to satisfy a borrower’s obligation, and a Fund could become part owner of any collateral if a loan is foreclosed, subjecting a Fund to costs associated with owning and disposing of the collateral. In the event of the insolvency of the lender selling a participation, there is a risk that a Fund may be treated as a general creditor of the lender and may not benefit from any
set-off
between the lender and the borrower. If a loan
is foreclosed, a Fund may become owner of the loan’s collateral. A Fund may bear the costs and liabilities associated with owning and holding or disposing of the collateral. There is the risk that a Fund may have difficulty disposing of loans and loan participations due to the lack of a liquid secondary market for loans and loan participations. To the extent a Fund invests in loans or originates loans, including bank loans, the Fund may be subject to greater levels of credit risk, call risk, settlement risk, risk of subordination to other creditors, insufficient or lack of protection under federal securities laws and liquidity risk than funds that do not acquire such instruments.
Management Risk
is the risk that the investment techniques and risk analyses applied by PIMCO, including the use of quantitative models or methods, will not produce the desired results and that actual or perceived conflicts of interest, legislative, regulatory or tax restrictions, policies or developments may affect the investment techniques available to PIMCO and the individual portfolio managers in connection with managing the Fund and may cause PIMCO to restrict or prohibit participation in certain investments. There is no guarantee that the investment objective of the Fund will be achieved.
Market Discount Risk
is the risk that the price of a Fund’s common shares of beneficial interest will fluctuate with market conditions and other factors. Shares of
closed-end
management investment companies frequently trade at a discount from their net asset value.
Market Disruptions Risk
is the risk of investment and operational risks associated with financial, economic and other global market developments and disruptions, including those arising from war, military conflicts, terrorism, social unrest, recessions, supply chain disruptions, market manipulation, government interventions, defaults and shutdowns, political changes or diplomatic developments, public health emergencies (such as the spread of infectious diseases, pandemics and epidemics), bank failures and natural/environmental disasters, which can all negatively impact the securities markets and cause a Fund to lose value. These events can also impair the technology and other operational systems upon which a Fund’s service providers, including PIMCO as a Fund’s investment adviser, rely, and could otherwise disrupt a Fund’s service providers’ ability to fulfill their obligations to a Fund.
Market Risk
is the risk that the value of securities owned by a Fund may fluctuate, sometimes rapidly or unpredictably, due to factors affecting securities markets generally or particular industries or companies.
Mortgage-Related and Other Asset-Backed Securities Risk
is the risk of investing in mortgage-related and other asset-backed securities, including interest rate risk, extension risk, prepayment risk and credit risk. A Fund may invest in any tranche of mortgage-related and other
|
|
|
|
|
|
| |
152 |
|
PIMCO CLOSED-END FUNDS |
|
|
|
|
asset-backed securities, including junior and/or equity tranches (to the extent consistent with the Fund’s guidelines), which generally carry higher levels of the foregoing risks.
Mortgage-Related Derivative Instruments Risk
is the risk of investing in derivative mortgage-backed securities, including call risk and extension risk. Small changes in mortgage prepayments can significantly impact the cash flows and the market value of these derivative instruments. In addition, particular derivative instruments may be leveraged such that their exposure (i.e., price sensitivity) to interest rate risk and/or prepayment risk is magnified.
Municipal Bond Risk
is the risk that by investing in Municipal Bonds the Fund may be affected significantly by the economic, regulatory, social, environmental, public health or political developments affecting the ability of issuers of debt securities whose interest is, in the opinion of bond counsel for the issuer at the time of issuance, exempt from federal income tax (“Municipal Bonds”) to pay interest or repay principal.
is the risk of focusing investments in a small number of issuers, including being more susceptible to risks associated with a single economic, political or regulatory occurrence than a more diversified portfolio might be. Funds that are
“non-diversified”
may invest a greater percentage of their assets in the securities of a single issuer (such as bonds issued by a particular state) than funds that
Operational Risk
is the risk arising from factors such as processing errors, human errors, inadequate or failed internal or external processes, failures in systems and technology, changes in personnel and errors caused by third-party service providers. The occurrence of any of these failures, errors or breaches could result in a loss of information, regulatory scrutiny, reputational damage or other events, any of which could have a material adverse effect on a Fund. While a Fund seeks to minimize such events through controls and oversight, there may still be failures that could cause losses to the Fund.
Other Investment Companies Risk
is the risk that Common Shareholders may be subject to duplicative expenses to the extent a Fund invests in other investment companies. In addition, these other investment companies may utilize leverage, in which case an investment would subject the Fund to additional risks associated with leverage.
Other Pooled Investment Vehicles Risk
is associated with the risks relating to the Fund’s investment in other pooled investment vehicles, including investment companies, private funds or other pooled investment vehicles that would qualify as “investment companies” under the Act but for an applicable exemption or exclusion, including but not limited to Sections 3(c)(1) or 3(c)(7) of the Act (“Private
Funds”). In addition to the risks discussed above in “Other Investment Companies Risk,” to the extent the Fund invests through one or more Private Funds, the Fund would be exposed to the risks associated with such Private Fund’s investments. The Fund’s investments in Private Funds would not be subject to the protections afforded to shareholders under the Act. By investing in Private Funds indirectly through the Fund, a shareholder would bear two layers of asset-based fees and expenses — at the Fund level and the Private Fund level — in addition to indirectly bearing any performance fees charged by the Private Fund.
Platform Risk
is the risk resulting from the fact that the Alt Lending ABS in which a Fund invests are typically not listed on any securities exchange and not registered under the Securities Act. In addition, the Fund anticipates that these instruments may only be sold to a limited number of investors and may have a limited or
non-existent
secondary market. Accordingly, the Fund currently expects that certain of the investments in Alt Lending ABS will face heightened levels of liquidity risk. Although currently there is generally no active, reliable secondary market for certain Alt Lending ABS, a secondary market for these Alt Lending ABS may develop. If the Fund purchases Alt Lending ABS on an alternative lending platform, the Fund will have the right to receive principal and interest payments due on loans underlying the Alt Lending ABS only if the platform servicing the loans receives the borrower’s payments on such loans and passes such payments through to the Fund. If a borrower is unable or fails to make payments on a loan for any reason, the Fund may be greatly limited in its ability to recover any outstanding principal or interest due, as (among other reasons) the Fund may not have direct recourse against the borrower or may otherwise be limited in its ability to directly enforce its rights under the loan, whether through the borrower or the platform through which such loan was originated. For example, the loan may be unsecured or under-collateralized and/or it may be impracticable to commence a legal proceeding against the defaulting borrower.
Portfolio Turnover Risk
is the risk that a high portfolio turnover will result in greater expenses to a Fund, including brokerage commissions or dealer
mark-ups
and other transaction costs on the sale of securities and reinvestments in other securities. The higher the rate of portfolio turnover of a Fund, the higher these transaction costs borne by the Fund generally will be. Such sales may result in realization of taxable capital gains (including short-term capital gains, which are generally taxed to shareholders at ordinary income tax rates when distributed net of short-term capital losses and net long-term capital losses) and may adversely affect the Fund’s
after-tax
returns. The realization of short-term capital gains may also cause adverse tax consequences for the Fund’s shareholders.
Potential Conflicts of Interest Risk — Allocation of Investment Opportunities
is the risk that PIMCO’s or any of its affiliate’s interests
|
|
|
|
|
|
|
|
|
|
|
|
| |
| |
|
|
ANNUAL REPORT |
|
|
| |
|
|
JUNE 30, 2025 |
|
|
153 |
|
|
|
|
| |
Notes to Financial Statements |
|
|
|
|
or the interests of its clients may conflict with those of the Funds and the results of a Fund’s investment activities may differ from those of the Fund’s affiliates, or another account managed by PIMCO or its affiliates, and it is possible that a Fund could sustain losses during periods in which one or more of the Fund’s affiliates and/or other accounts managed by PIMCO or its affiliates, including proprietary accounts, achieve profits on their trading.
Preferred Securities Risk
is the risk that certain preferred securities contain provisions that allow an issuer under certain conditions to skip or defer distributions which may require the Fund to include the amount of the deferred distribution in its taxable income for tax purposes although it does not currently receive such amount in cash. Additionally, preferred securities are subordinated to bonds and other debt securities in an issuer’s capital structure in terms of priority for corporate income and liquidation payments, and therefore will be subject to greater credit risk than those debt securities. Preferred securities may trade less frequently and in a more limited volume and may be subject to more abrupt or erratic price movements than many other securities, such as common stocks, corporate debt securities and U.S. Government securities.
Privacy and Data Security Risk
is the risk resulting from the fact that the Gramm-Leach-Bliley Act (“GLBA”) and other laws limit the disclosure of certain
non-public
personal information about a consumer to
non-affiliated
third parties and require financial institutions to disclose certain privacy policies and practices with respect to information sharing with both affiliates and
non-affiliated
third parties. Many states and a number of
non-U.S.
jurisdictions have enacted privacy and data security laws requiring safeguards on the privacy and security of consumers’ personally identifiable information. Other laws deal with obligations to safeguard and dispose of private information in a manner designed to avoid its dissemination. Privacy rules adopted by the U.S. Federal Trade Commission and the SEC implement GLBA and other requirements and govern the disclosure of consumer financial information by certain financial institutions, ranging from banks to private investment funds. U.S. platforms following certain models generally are required to have privacy policies that conform to these GLBA and other requirements. In addition, such platforms typically have policies and procedures intended to maintain platform participants’ personal information securely and dispose of it properly.
Private Placement and Restricted Securities Risk
is the risk that securities received in a private placement may be subject to strict restrictions on resale, and there may be no liquid secondary market or ready purchaser for such securities and the risk that a Fund’s investment in securities that have not been registered for public sale, but that are eligible for purchase and sale pursuant to Rule 144A under the Securities Act, may be relatively less liquid than registered securities
traded on established securities markets. A Fund may be unable to dispose of such securities when it desires to do so, or at the most favorable time or price. Private placements may also raise valuation risks.
Private Commercial Real Estate Risk
is the risk that exposure to private commercial real estate comes with a variety of risks, including lease defaults, terminations by one or more tenants or landlord-tenant disputes that may reduce the revenues and net income from investments in U.S. and
non-U.S.
real estate investments through one or more controlled subsidiaries structured as real estate investment trusts (each a “REIT Subsidiary”), which would reduce the amount of income payable by the REIT Subsidiary to the Fund. Any of these situations may result in extended periods during which there is a significant decline in revenues or no revenues generated by a property. If this occurred, it could adversely affect a Fund’s performance.
Privately-Issued Mortgage-Related Securities Risk
is the risk of nonpayment because there are no direct or indirect government or agency guarantees of payments in the pools created by
non-governmental
issuers. Additionally, privately-issued mortgage-related securities generally are exempt from registration under the Securities Act of 1933 and, as such, are not subject to the same disclosure requirements as publicly-issued mortgage-related securities.
Real Estate Risk
is the risk associated with investing in real estate investments, including investments in equity or debt securities issued by private and public real estate investment trusts (“REITs”), real estate operating companies (“REOCs”), private or public real estate-related loans, real estate-linked derivative instruments and pooled investment vehicles (including registered investment companies and private funds or other pooled investment vehicles that would qualify as “investment companies” under the Act but for an applicable exemption or exclusion) that invest in real estate investments, as applicable. The Fund will be subject to the risks associated with owning real estate and with the real estate industry generally.
Real Estate Joint Venture Risk
is the risk that in joint ventures with third parties to make investments, the investments in U.S. and
non-U.S.
real estate investments through one or more controlled subsidiaries structured as real estate investment trusts (each a “REIT Subsidiary”) would generally share control with the third-party partner (for example, the REIT Subsidiary may have approval rights over some or all of the joint venture’s activities, and in limited circumstances that do not amount to primary control of the joint venture, may have the ability to require that the joint venture take specific actions), even though the REIT Subsidiary may hold a majority of the economic interests of a joint venture.
|
|
|
|
|
|
| |
154 |
|
PIMCO CLOSED-END FUNDS |
|
|
|
|
Regulation S Securities Risk
is the risk that Regulation S securities may be less liquid than publicly traded securities and may not be subject to the disclosure and other investor protection requirements that would be applicable if they were publicly traded. Accordingly, Regulation S Securities may involve a high degree of business and financial risk and may result in substantial losses.
Regulatory Changes Risk
is the risk that is associated with the fact that financial entities, such as investment companies and investment advisers, are generally subject to extensive government regulation and intervention. Government regulation and/or intervention may change the way a Fund is regulated, affect the expenses incurred directly by the Fund and the value of its investments, and limit and /or preclude the Fund’s ability to achieve its investment objectives. Government regulation may change frequently and may have significant adverse consequences. The Fund and PIMCO have historically been eligible for exemptions from certain regulations.
However, there is no assurance that the Fund and PIMCO will continue to be eligible for such exemptions. Moreover, government regulation may have unpredictable and unintended effects.
Regulatory Risk — Commodity Pool Operator
is the risk associated with the CFTC’s adopted regulations that subject registered investment companies and their investment advisers to regulation by the CFTC if the registered investment company invests more than a prescribed level of its liquidation value in futures, options on futures or commodities, swaps or other financial instruments regulated under the Commodity Exchange Act (“CEA”) and the rules thereunder (“commodity interests”), or if the Fund markets itself as providing investment exposure to such instruments. PIMCO is registered with the CFTC as a Commodity Pool Operator.
Reinvestment Risk
is the risk that income from a Fund’s portfolio will decline if and when the Fund invests the proceeds from matured, traded or called debt obligations at market interest rates that are below the portfolio’s current earnings rate. The Fund also may choose to sell higher yielding portfolio securities and to purchase lower yielding securities to achieve greater portfolio diversification, because the portfolio managers believe the current holdings are overvalued or for other investment-related reasons.
REIT Risk
is the risk associated with investing in REITs, which are pooled investment vehicles that own, and usually operate, income- producing real estate. Some REITs also finance real estate. If a REIT meets certain requirements, including distributing to shareholders substantially all of its taxable income (other than net capital gains), then it is not typically taxed on the income distributed to shareholders. Therefore, REITs may pay higher dividends than other issuers.
REIT Subsidiary Risk
is the risk that investments in U.S. and
non-U.S.
real estate investments through one or more controlled subsidiaries structured as real estate investment trusts (each a “REIT Subsidiary”) are subject to risks associated with the direct ownership of real estate. REIT Subsidiaries may be affected by changes in the real estate markets generally as well as changes in the values of any properties owned by the REIT Subsidiaries or securing any mortgages owned by the REIT Subsidiaries (which changes in value could be influenced by market conditions for real estate in general or fluctuations in the value of rights to natural resources appurtenant to the properties held by the REIT Subsidiaries).
Repurchase Agreements Risk
is the risk that, if the party agreeing to repurchase a security should default, a Fund will seek to sell the securities which it holds, which could involve procedural costs or delays in addition to a loss on the securities if their value should fall below their repurchase price.
Risks of Equity Securities of MLPs, Risks of Debt Securities of MLPs, and Risks of MLP General Partner and Managing Member Interests
is the risk that investments in equity and debt securities of MLPs and/or their affiliates are subject to risks in addition to those risks associated with investments in all equity and debt securities. Holders of MLP units have more limited rights for voting and control than shareholders of common stock in a corporation, additional tax risks and additional potential conflicts of interest among unit holders and partners. MLP subordinated units generally entail greater risk than MLP common units as a result of more limited distribution rights. Additionally, distributions by certain MLPs may be affected by the failure of an affiliated party to satisfy its obligations to an MLP or by an MLP’s loss of customers or suppliers. A Fund’s investment in MLPs or other entities that hold a general partner or managing member interest and IDRs in MLPs may be subject to additional liability greater than the investment amount and may have higher distribution prospects which would decline at a greater rate than the decline rate in and MLP’s distributions or be eliminated if the MLP unit holders choose to remove the general partner or managing member.
Risks of ETNs
is the risk that the value of exchange-traded notes (“ETNs”) may be influenced by time to maturity, level of supply and demand for the ETN, volatility, and lack of liquidity in underlying markets, changes in the applicable interest rates and underlying reference asset values, changes in the issuer’s credit rating, and economic, legal, political, or geographic events that may affect the referenced index.
Risk Retention Investment Risk
is the risk associated with a Fund’s investments in risk retention tranches of commercial mortgage-backed securities (“CMBS”) or other eligible securitizations, if any (“risk
|
|
|
|
|
|
|
|
|
|
|
|
| |
| |
|
|
ANNUAL REPORT |
|
|
| |
|
|
JUNE 30, 2025 |
|
|
155 |
|
|
|
|
| |
Notes to Financial Statements |
|
|
|
|
retention tranches”), which are eligible residual interests typically held by the sponsors of such securitizations pursuant to the final rules implementing the credit risk retention requirements of Section 941 of the Dodd-Frank Act (the “U.S. Risk Retention Rules”). There can be no assurance that the applicable federal agencies charged with the implementation of the final U.S. Risk Retention Rules (the Federal Deposit Insurance Corporation, the Comptroller of the Currency, the Federal Reserve Board, the SEC, the Department of Housing and Urban Development, and the Federal Housing Finance Agency) could not take positions in the future that differ from the interpretation of such rules taken or embodied in such securitizations, or that the final U.S. Risk Retention Rules will not change. Furthermore, if the Fund breaches any undertakings in any risk retention agreement, it will be exposed to claims by the other parties thereto, including for any losses incurred as a result of such breach, which could be significant and exceed the value of the Fund’s investments.
Securities Lending Risk
is the risk that, when a Fund lends portfolio securities, its investment performance will continue to reflect changes in the value of the securities loaned and lose rights in the collateral or delay in recovery of the collateral if the borrower fails to return the security loaned or becomes insolvent. The Fund may pay lending fees to a party arranging the loan, which may be an affiliate of the Fund.
Senior Debt Risk
is the risk that a Fund may be subject to greater levels of credit risk than funds that do not invest in below investment grade senior debt. The Fund may also be subject to greater levels of liquidity risk than funds that do not invest in senior debt. Restrictions on transfers in loan agreements, a lack of publicly available information and other factors may, in certain instances, make senior debt more difficult to sell at an advantageous time or price than other types of securities or instruments.
Short Exposure Risk
is the risk of entering into short sales, or other short positions, including the potential loss of more money than the actual cost of the investment, and the risk that the third party to the short sale or other short position will not fulfill its contractual obligations, causing a loss to a Fund.
Smaller Company Risk
is the risk that the value of securities issued by a smaller company fluctuate, sometimes rapidly and unpredictably as compared to more widely held securities, due to narrow markets and limited resources of smaller companies. Investments in smaller companies generally are subject it to greater levels of credit, market and issuer risk.
Sovereign Debt Risk
is the risk that investments in fixed income instruments issued by sovereign entities may decline in value as a result of default or other adverse credit event resulting from an issuer’s inability or unwillingness to make principal or interest payments in a timely fashion.
Special Purpose Acquisition Companies (“SPACs”) Risk
is the risk that, because SPACs and similar entities are in essence “blank check” companies without operating history or ongoing business other than seeking acquisitions, the value of their securities is particularly dependent on the ability of the entity’s management to identify and complete a profitable acquisition. A SPAC’s structure may result in significant dilution of a stockholder’s share value immediately upon the completion of a business combination due to, among other reasons, interests held by the SPAC sponsor, conversion of warrants into additional shares, shares issued in connection with a business combination and/or certain embedded costs. There is no guarantee that the SPACs in which the Fund invests will complete an acquisition or that any acquisitions that are completed will be profitable. Some SPACs may pursue acquisitions only within certain industries or regions, which may increase the volatility of their prices. In addition, these securities, which are typically traded in the
market, may be considered illiquid and/or be subject to restrictions on resale.
Structured Investments Risk
is the risk that a Fund’s investment in structured products, including structured notes, credit-linked notes and other types of structured products bear the risks of the underlying investments, index or reference obligation and are subject to counterparty risk. The Fund may have the right to receive payments only from the structured product, and generally does not have direct rights against the issuer or the entity that sold the assets to be securitized. Structured products generally entail risks associated with derivative instruments.
Subprime Risk
is the risk that loans, and debt instruments collateralized by loans (including Alt Lending ABS), acquired by a Fund may be subprime in quality, or may become subprime in quality. Although there is no specific legal or market definition of “subprime,” subprime loans are generally understood to refer to loans made to borrowers that display poor credit histories and other characteristics that correlate with a higher default risk. Accordingly, subprime loans, and debt instruments secured by such loans, have speculative characteristics and are subject to heightened risks, including the risk of nonpayment of interest or repayment of principal, and the risks associated with investments in high yield securities. In addition, these instruments could be subject to increased regulatory scrutiny. The Fund is not restricted by any particular borrower credit criteria when acquiring loans or debt instruments collateralized by loans.
Subsidiary Risk
is the risk that, by investing in a Fund’s Subsidiary, the Fund is indirectly exposed to the risks associated with a Subsidiary’s investments. Each Subsidiary is not registered under the Act and may not be subject to all the investor protections of the Act. There is no guarantee that the investment objective of a Subsidiary will be achieved.
|
|
|
|
|
|
| |
156 |
|
PIMCO CLOSED-END FUNDS |
|
|
|
|
Synthetic Convertible Securities Risk
is the risk that the values of synthetic convertible securities will respond differently to market fluctuations than a traditional convertible security because a synthetic convertible is composed of two or more separate securities or instruments, (such as a debt security and a warrant or option to purchase another security), each with its own market value. Synthetic convertible securities are also subject to the risks associated with derivatives. In addition, if the value of the underlying common stock or the level of the index involved in the convertible element falls below the strike price of the warrant or option, the warrant or option may lose all value.
Tax Risk
is the risk that if, in any year, a Fund were to fail to qualify for treatment as a regulated investment company under the Tax Code, and were ineligible to or did not otherwise cure such failure, the Fund would be subject to tax on its taxable income at corporate rates and, when such income is distributed, shareholders would be subject to a further tax to the extent of the Fund’s current or accumulated earnings and profits.
Total Return Swap Risk
is the risk that total return swaps could result in losses if the underlying asset or reference does not perform as anticipated, that they add leverage to a Fund’s portfolio and the risk that the counterparty might default on the contract. Total return swaps can have the potential for unlimited losses. Total return swaps are also subject to certain other risks applicable to derivatives transactions generally.
U.S. Government Securities Risk
is the risk that the obligations supported by (i) the full faith and credit of the United States, (ii) the right of the issuer to borrow from the U.S. Treasury, (iii) the discretionary authority of the U.S. Government to purchase the agency’s obligations (iv) or only by the credit of the agency, instrumentality or corporation will not be satisfied in full, or that such obligations will decrease in value or default. U.S. government securities are subject to market risk, interest rate risk and credit risk.
Valuation Risk
is the risk that fair value pricing used when market quotations are not readily available may not result in adjustments to the prices of securities or other assets, or that fair value pricing may not reflect actual market value. It is possible that the fair value determined in good faith for a security or other asset will be materially different from quoted or published prices, from the prices used by others for the same security or other asset and/or from the value that actually could be or is realized upon the sale of that security or other asset.
Zero-Coupon Bond,
Step-Ups
and
Securities Risk
is the risk presented by the market prices of
zero-coupon,
step ups and
securities generally being more volatile than the prices
of securities that pay interest periodically and in cash and being likely to respond to changes in interest rates to a greater degree than other types of debt securities with similar maturities and credit quality. In addition, as these securities may not pay cash interest, the Fund’s investment exposure to these securities and their risks, including credit risk, will increase during the time these securities are held in the Fund’s portfolio.
In general, a Fund may be subject to additional risks, including, but not limited to, risks related to government regulation and intervention in financial markets, operational risks, risks associated with financial, economic and global market disruptions, and cyber security risks. Please see a Fund’s then-currently effective prospectus and statement of additional information for a more detailed description of the risks of investing in the Fund. Please see the Important Information section of this report for additional discussion of certain regulatory and market developments that may impact a Fund’s performance.
8. MASTER NETTING ARRANGEMENTS
A Fund may be subject to various netting arrangements (“Master Agreements”) with select counterparties. Master Agreements govern the terms of certain transactions, and are intended to reduce the counterparty risk associated with relevant transactions by specifying credit protection mechanisms and providing standardization that is intended to improve legal certainty. Each type of Master Agreement governs certain types of transactions. Different types of transactions may be traded out of different legal entities or affiliates of a particular organization, resulting in the need for multiple agreements with a single counterparty. As the Master Agreements are specific to unique operations of different asset types, they allow a Fund to close out and net its total exposure to a counterparty in the event of a default with respect to all the transactions governed under a single Master Agreement with a counterparty. For financial reporting purposes, the Statements of Assets and Liabilities generally present derivative assets and liabilities on a gross basis, which reflects the full risks and exposures prior to netting.
Master Agreements can also help limit counterparty risk by specifying collateral posting arrangements at
pre-arranged
exposure levels. Under most Master Agreements, collateral is routinely transferred if the total net exposure to certain transactions (net of existing collateral already in place) governed under the relevant Master Agreement with a counterparty in a given account exceeds a specified threshold, which typically ranges from zero to $250,000 depending on the counterparty and the type of Master Agreement. United States Treasury Bills and U.S. dollar cash are generally the preferred forms of collateral, although other securities may be used depending on the terms outlined in the
|
|
|
|
|
|
|
|
|
|
|
|
| |
| |
|
|
ANNUAL REPORT |
|
|
| |
|
|
JUNE 30, 2025 |
|
|
157 |
|
|
|
|
| |
Notes to Financial Statements |
|
|
|
|
applicable Master Agreement. Securities and cash pledged as collateral are reflected as assets on the Statements of Assets and Liabilities as either a component of Investments at value (securities) or Deposits with counterparty. Cash collateral received is not typically held in a segregated account and as such is reflected as a liability on the Statements of Assets and Liabilities as Deposits from counterparty. The market value of any securities received as collateral is not reflected as a component of NAV. A Fund’s overall exposure to counterparty risk can change substantially within a short period, as it is affected by each transaction subject to the relevant Master Agreement.
Master Repurchase Agreements and Global Master Repurchase Agreements (individually and collectively “Master Repo Agreements”) govern repurchase, reverse repurchase and certain sale-buyback transactions between a Fund and select counterparties. Master Repo Agreements maintain provisions for, among other things, initiation, income payments, events of default and maintenance of collateral. The market value of transactions under the Master Repo Agreement, collateral pledged or received, and the net exposure by counterparty as of period end are disclosed in the Notes to Schedules of Investments.
Master Securities Forward Transaction Agreements (“Master Forward Agreements”) govern certain forward settling transactions, such as TBA securities, delayed-delivery or certain sale-buyback transactions by and between a Fund and select counterparties. The Master Forward Agreements maintain provisions for, among other things, transaction initiation and confirmation, payment and transfer, events of default, termination and maintenance of collateral. The market value of forward settling transactions, collateral pledged or received, and the net exposure by counterparty as of period end is disclosed in the Notes to Schedules of Investments.
Customer Account Agreements and related addenda govern cleared derivatives transactions such as futures, options on futures, and cleared OTC derivatives. Such transactions require posting of initial margin as determined by each relevant clearing agency which is segregated in an account at a futures commission merchant (“FCM”) registered with the CFTC. In the United States, counterparty risk may be reduced as creditors of an FCM cannot have a claim to Fund assets in the segregated account. FCM customers, such as the Funds, are permitted to transfer their customer account (and cleared derivative transactions held in such customer account) from one FCM to another FCM. Upon completion of the transfer, the customer maintains the same economic position with respect to the outstanding exposure. As such, these transfers are not recognized as dispositions and reacquisitions of the affected derivative positions. Portability of exposure reduces risk to the Funds. Variation margin, which reflects changes in market value, is generally exchanged daily, but may not be netted between futures and cleared OTC derivatives unless the parties have agreed to a separate
arrangement in respect of portfolio margining. The porting of exposure between FCMs has no impact on the market value or accumulated unrealized appreciation (depreciation), initial margin posted, and any unsettled variation margin. These values as of period end are disclosed in the Notes to Schedules of Investments.
Prime Broker Arrangements may be entered into to facilitate execution and/or clearing of listed equity option transactions or short sales of equity securities between a Fund and selected counterparties. The arrangements provide guidelines surrounding the rights, obligations and other events, including, but not limited to, margin, execution and settlement. These agreements maintain provisions for, among other things, payments, maintenance of collateral, events of default and termination. Margin and other assets delivered as collateral are typically in the possession of the prime broker and would offset any obligations due to the prime broker. The market values of listed options and securities sold short and related collateral are disclosed in the Notes to Schedules of Investments.
International Swaps and Derivatives Association, Inc. Master Agreements and Credit Support Annexes (“ISDA Master Agreements”) govern bilateral OTC derivative transactions entered into by a Fund with select counterparties. ISDA Master Agreements maintain provisions for general obligations, representations, agreements, collateral posting and events of default or termination. Events of termination include conditions that may entitle counterparties to elect to terminate early and cause settlement of all outstanding transactions under the applicable ISDA Master Agreement. Any election to terminate early could be material to the financial statements. The ISDA Master Agreement may contain additional provisions that add counterparty protection beyond coverage of existing daily exposure if the counterparty has a decline in credit quality below a predefined level or as required by regulation. Similarly, if required by regulation, a Fund may be required to post additional collateral beyond coverage of daily exposure. These amounts, if any, may (or if required by law, will) be segregated with a third-party custodian. To the extent a Fund is required by regulation to post additional collateral beyond coverage of daily exposure, they could potentially incur costs, including in procuring eligible assets to meet collateral requirements, associated with such posting. The market value of OTC financial derivative instruments, collateral received or pledged, and net exposure by counterparty as of period end are disclosed in the Notes to Schedules of Investments.
9. FEES AND EXPENSES
(a) Management Fee
PIMCO is a majority-owned subsidiary of Allianz Asset Management of America LLC (“Allianz Asset Management”) and serves as the Manager to the Funds, pursuant to an investment management agreement.
|
|
|
|
|
|
| |
158 |
|
PIMCO CLOSED-END FUNDS |
|
|
|
|
Pursuant to the Investment Management Agreements with PIMCO (the “Agreement”), and subject to the supervision of the Board, PIMCO is responsible for providing to each Fund investment guidance and policy direction in connection with the management of the Fund, including oral and written research, analysis, advice, and statistical and economic data and information. In addition, pursuant to the Agreement and subject to the general supervision of the Board, PIMCO, at its expense, provides or causes to be furnished most other supervisory and administrative services the Funds require, including but not limited to, expenses of most third-party service providers (e.g., audit, custodial, legal, transfer agency, printing) and other expenses, such as those associated with insurance, proxy solicitations and mailings for shareholder meetings, NYSE listing and related fees, tax services, valuation services and other services the Funds require for their daily operations. Pursuant to the Agreements, PIMCO receives an annual fee, payable monthly, at the annual rates shown in the table below:
|
|
|
|
|
|
|
|
| |
|
|
|
|
|
|
|
|
|
| |
| PCM Fund, Inc. |
|
|
|
| |
|
0.900% |
|
|
|
| |
PIMCO Global StocksPLUS & Income Fund |
|
|
|
| |
|
1.105% |
|
|
|
| |
| PIMCO Strategic Income Fund, Inc. |
|
|
|
| |
|
0.955% |
|
|
|
| |
| PIMCO Access Income Fund |
|
|
|
| |
|
1.250% |
|
|
|
| |
| PIMCO Dynamic Income Fund |
|
|
|
| |
|
1.100% |
|
|
|
| |
| PIMCO Dynamic Income Opportunities Fund |
|
|
|
| |
|
1.150% |
|
|
|
| |
| PIMCO Dynamic Income Strategy Fund |
|
|
|
| |
|
1.250% |
|
|
Management fees calculated based on the Fund’s average daily “total managed assets”. Total managed assets refer to the total assets of the Fund (including assets attributable to any reverse repurchase agreements, borrowings and preferred shares that may be outstanding) minus accrued liabilities (other than liabilities representing reverse repurchase agreements and borrowings). |
|
Management fees calculated based on the Fund’s average daily “total managed assets”. Total managed assets refer to the total assets of the Fund (including assets attributable to any preferred shares and borrowings that may be outstanding) minus accrued liabilities (other than liabilities representing borrowings). |
|
Management fees calculated based on the Fund’s average daily net asset value (including daily net assets attributable to any preferred shares of the Fund that may be outstanding). |
|
Management fees calculated based on the Fund’s average daily “total managed assets”. Total managed assets refer to the total assets of the Fund (including any assets attributable to any reverse repurchase agreements, dollar rolls/buybacks, borrowings and preferred shares that may be outstanding) minus accrued liabilities (other than liabilities representing reverse repurchase agreements, dollar rolls/buybacks and borrowings). |
|
Management fees calculated based on the Fund’s average daily “total managed assets.” Total managed assets include total assets of the Fund (including assets attributable to any reverse repurchase agreements, dollar rolls, borrowings and preferred shares that may be outstanding) minus accrued liabilities (other than liabilities representing reverse repurchase agreements, dollar rolls and borrowings). |
In rendering investment advisory services to each Fund, PIMCO may use the resources of one or more foreign
(non-U.S.)
affiliates that are not registered under the Investment Advisers Act of 1940, as amended (the “Advisers Act”) (the “PIMCO Overseas Affiliates”), to provide portfolio management, research and trading services to a Fund under the Memorandums of Understanding (“MOUs”). Each of the PIMCO
Overseas Affiliates are Participating Affiliates of PIMCO as that term is used in relief granted by the staff of the SEC allowing U.S. registered advisers to use investment advisory and trading resources of unregistered advisory affiliates subject to the regulatory supervision of the registered adviser. Each PIMCO Overseas Affiliate and any of their respective employees who provide services to the Funds are considered under the MOUs to be “associated persons” of PIMCO as that term is defined in the Advisers Act for purposes of PIMCO’s required supervision.
(b) Fund Expenses
With respect to each Fund other than PIMCO Access Income Fund, PIMCO Dynamic Income Opportunities Fund and PIMCO Dynamic Income Strategy Fund each Fund bears other expenses, which may vary and affect the total level of expenses paid by shareholders, such as (i) salaries and other compensation or expenses, including travel expenses of any of the Fund’s executive officers and employees, if any, who are not officers, directors, shareholders, members, partners or employees of PIMCO or its subsidiaries or affiliates; (ii) taxes and governmental fees, if any, levied against the Fund; (iii) brokerage fees and commissions and other portfolio transaction expenses incurred by or for the Fund (including, without limitation, fees and expenses of outside legal counsel or third-party consultants retained in connection with reviewing, negotiating and structuring specialized loans and other investments made by the Fund, subject to specific or general authorization by the Fund’s Board (for example,
so-called
“broken-deal costs” (e.g., fees, costs, expenses and liabilities, including, for example, due diligence-related fees, costs, expenses and liabilities, with respect to unconsummated investments))); (iv) expenses of the Fund’s securities lending (if any), including any securities lending agent fees, as governed by a separate securities lending agreement; (v) costs, including interest expenses, of borrowing money or engaging in other types of leverage financing, including, without limitation, through the use by the Fund of reverse repurchase agreements, tender option bonds, bank borrowings and credit facilities; (vi) costs, including dividend and/or interest expenses and other costs (including, without limitation, offering and related legal costs, fees to brokers, fees to auction agents, fees to transfer agents, fees to ratings agencies and fees to auditors associated with satisfying ratings agency requirements for preferred shares or other securities issued by the Fund and other related requirements in the Fund’s organizational documents) associated with the Fund’s issuance, offering, redemption and maintenance of preferred shares, commercial paper or other senior securities for the purpose of incurring leverage; (vii) fees and expenses of any underlying funds or other pooled vehicles in which the Fund invests; (viii) dividend and interest expenses on short positions taken by the Fund; (ix) fees and expenses, including travel expenses, and fees and expenses of legal counsel retained for their benefit, of Trustees who are not officers, employees, partners, shareholders or members of PIMCO or its subsidiaries or affiliates; (x) extraordinary expenses,
|
|
|
|
|
|
|
|
|
|
|
|
| |
| |
|
|
ANNUAL REPORT |
|
|
| |
|
|
JUNE 30, 2025 |
|
|
159 |
|
|
|
|
| |
Notes to Financial Statements |
|
|
|
|
including extraordinary legal expenses, that may arise, including expenses incurred in connection with litigation, proceedings, other claims, and the legal obligations of the Fund to indemnify its Trustees, officers, employees, shareholders, distributors, and agents with respect thereto; (xi) organizational and offering expenses of the Fund, including with respect to share offerings, such as rights offerings and shelf offerings, following the Fund’s initial offering, and expenses associated with tender offers and other share repurchases and redemptions; and (xii) expenses of the Fund which are capitalized in accordance with U.S. GAAP.
With respect to PIMCO Access Income Fund, the Fund bears other expenses, which may vary and affect the total level of expenses paid by shareholders, such as (i) salaries and other compensation or expenses, including travel expenses, of any of the Fund’s executive officers and employees, if any, who are not officers, directors, shareholders, members, partners or employees of PIMCO or its subsidiaries or affiliates; (ii) taxes and governmental fees, if any, levied against the Fund; (iii) brokerage fees and commissions, and other portfolio transaction expenses incurred by or for the Fund (including, without limitation, fees and expenses of outside legal counsel or third-party consultants retained in connection with reviewing, negotiating, structuring, acquiring, disposing of and/or terminating specialized loans and other investments made by the Fund, any costs associated with originating loans, asset securitizations, alternative lending-related strategies and
so-called
“broker-deal costs” (e.g., fees, costs, expenses and liabilities, including, for example, due diligence-related fees, costs, expenses and liabilities, with respect to unconsummated investments))( for these purposes, it is understood that “portfolio transaction expenses” shall be interpreted broadly to include, by way of example and without limitation, any expenses relating to the Fund’s investments (including those made by a subsidiary of the Fund) in commercial and residential real estate, including
for-sale
and
for-rent
housing, office, hotel, retail and industrial investments, and/or any other expenses incurred by a direct or indirect portfolio investment of the Fund, such as expenses paid directly by a portfolio investment and other expenses that are capitalized or otherwise embedded into the cost basis of a portfolio investment); (iv) expenses of the Fund’s securities lending (if any), including any securities lending agent fees, as governed by a separate securities lending agreement; (v) costs, including interest expenses, of borrowing money or engaging in other types of leverage financing including, without limitation, through the use by the Fund of reverse repurchase agreements, dollar rolls/buybacks, bank borrowings, credit facilities and tender option bonds; (vi) costs, including dividend and/or interest expenses and other costs (including, without limitation, offering and related legal costs, fees to brokers, fees to auction agents, fees to transfer agents, fees to ratings agencies and fees to auditors associated with satisfying ratings agency requirements for preferred
shares or other securities issued by the Fund and other related requirements in the Fund’s organizational documents) associated with the Fund’s issuance, offering, redemption and maintenance of preferred shares, commercial paper or other instruments (such as the use of reverse repurchase agreements, dollar rolls/buybacks, bank borrowings, credit facilities and tender option bonds) for the purpose of incurring leverage; (vii) fees and expenses of any underlying funds or other pooled vehicles in which the Fund invests (except as otherwise agreed to between PIMCO and any such fund or vehicle); (viii) dividend and interest expenses on short positions taken by the Fund; (ix) fees and expenses, including travel expenses, and fees and expenses of legal counsel retained for their benefit, of Trustees who are not officers, employees, partners, shareholders or members of PIMCO or its subsidiaries or affiliates; (x) extraordinary expenses, including extraordinary legal expenses, as may arise, including, without limitation, expenses incurred in connection with litigation, proceedings, other claims, and the legal obligations of the Fund to indemnify its Trustees, officers, employees, shareholders, distributors, and agents with respect thereto; (xi) fees and expenses, including legal, printing and mailing, solicitation and other fees and expenses associated with and incident to shareholder meetings and proxy solicitations involving contested elections of Trustees, shareholder proposals or other
non-routine
matters that are not initiated or proposed by Fund management; (xii) organizational and offering expenses of the Fund, including registration (including share registration fees), legal, marketing, printing, accounting and other expenses, associated with organizing the Fund in its state of jurisdiction and in connection with the initial registration of the Fund under the Act and the initial registration of its Shares under the Securities Act of 1933, as amended (the “Securities Act”), and with respect to share offerings, such as rights offerings and shelf offerings, following the Fund’s initial offering, expenses associated with tender offers and other Share repurchases and redemptions; (xiii) fees and expenses associated with seeking, applying for and obtaining formal exemptive,
no-action
and/or other relief from the SEC in connection with the operation of a managed distribution plan (xiv) expenses of the Fund which are capitalized in accordance with U.S. GAAP.
With respect to PIMCO Dynamic Income Opportunities Fund, the Fund bears other expenses, which may vary and affect the total level of expenses paid by shareholders, such as (i) salaries and other compensation or expenses, including travel expenses, of any of the Fund’s executive officers and employees, if any, who are not officers, directors, shareholders, members, partners or employees of PIMCO or its subsidiaries or affiliates; (ii) taxes and governmental fees, if any, levied against the Fund; (iii) brokerage fees and commissions, and other portfolio transaction expenses incurred by or for the Fund (including, without limitation, fees and expenses of outside legal
|
|
|
|
|
|
| |
160 |
|
PIMCO CLOSED-END FUNDS |
|
|
|
|
counsel or third-party consultants retained in connection with reviewing, negotiating and structuring specialized loans and other investments made by the Fund, and any costs associated with originating loans, asset securitizations, alternative lending-related strategies and
so-called
“broken-deal costs” (e.g., fees, costs, expenses and liabilities, including, for example, due diligence-related fees, costs, expenses and liabilities, with respect to unconsummated investments)); (iv) expenses of the Fund’s securities lending (if any), including any securities lending agent fees, as governed by a separate securities lending agreement; (v) costs, including interest expenses, of borrowing money or engaging in other types of leverage financing including, without limitation, through the use by the Fund of reverse repurchase agreements, dollar rolls, tender option bonds, bank borrowings and credit facilities; (vi) costs, including dividend and/or interest expenses and other costs (including, without limitation, offering and related legal costs, fees to brokers, fees to auction agents, fees to transfer agents, fees to ratings agencies and fees to auditors associated with satisfying ratings agency requirements for preferred shares or other securities issued by the Fund and other related requirements in the Fund’s organizational documents) associated with the Fund’s issuance, offering, redemption and maintenance of preferred shares, commercial paper or other instruments (such as the use of reverse repurchase agreements, dollar rolls, bank borrowings, credit facilities and tender option bonds) for the purpose of incurring leverage; (vii) fees and expenses of any underlying funds or other pooled vehicles in which the Fund invests; (viii) dividend and interest expenses on short positions taken by the Fund; (ix) fees and expenses, including travel expenses, and fees and expenses of legal counsel retained for their benefit, of Trustees who are not officers, employees, partners, shareholders or members of PIMCO or its subsidiaries or affiliates; (x) extraordinary expenses, including extraordinary legal expenses, as may arise, including, without limitation, expenses incurred in connection with litigation, proceedings, other claims, and the legal obligations of the Fund to indemnify its trustees, officers, employees, shareholders, distributors, and agents with respect thereto; (xi) fees and expenses, including legal, printing and mailing, solicitation and other fees and expenses associated with and incident to shareholder meetings and proxy solicitations involving contested elections of trustees, shareholder proposals or other
non-routine
matters that are not initiated or proposed by Fund management; (xii) organizational and offering expenses of the Fund, including registration (including registration fees), legal, marketing, printing, accounting and other expenses, associated with organizing the Fund in its state of jurisdiction and in connection with the initial registration of the Fund under the Act, and the rules and regulations thereunder, and the initial registration of its Shares under the Securities Act of 1933, as amended, and with respect to Share offerings, such as rights offerings and shelf offerings, following the Fund’s initial offering, expenses associated with tender
offers and other repurchases and redemptions, and fees and expenses associated with seeking, applying for and obtaining formal exemptive,
no-action
and/or other relief from the SEC in connection with the operation of a managed distribution plan; and (xiii) expenses of the Fund which are capitalized in accordance with U.S. GAAP Without limiting the generality or scope of the foregoing, it is understood that the Funds may bear such expenses either directly or indirectly through contracts or arrangements with PIMCO or an affiliated or unaffiliated third party.
With respect to PIMCO Dynamic Income Strategy Fund, the Fund bears other expenses, which may vary and affect the total level of expenses paid by shareholders, such as (i) salaries and other compensation or expenses, including travel expenses, of any of the Fund’s executive officers and employees, if any, who are not officers, directors, shareholders, members, partners or employees of PIMCO or its subsidiaries or affiliates; (ii) taxes and governmental fees, if any, levied against the Fund; (iii) brokerage fees and commissions and other portfolio transaction expenses incurred by or for the Fund (including, without limitation, fees and expenses of outside legal counsel or thirdparty consultants retained in connection with reviewing, negotiating and structuring specialized loans and other investments made by the Fund, and any costs associated with originating loans, asset securitizations, alternative lending-related strategies and
so-called
“broken-deal costs” (e.g., fees, costs, expenses and liabilities, including, for example, due diligence-related fees, costs, expenses and liabilities, with respect to unconsummated investments)); (iv) expenses of the Fund’s securities lending (if any), including any securities lending agent fees, as governed by a separate securities lending agreement; (v) costs, including interest expenses, of borrowing money or engaging in other types of leverage financing, including, without limitation, through the use by the Fund of reverse repurchase agreements, dollar rolls, bank borrowings, credit facilities and tender option bonds and; (vi) costs, including dividend and/or interest expenses and other costs (including, without limitation, offering and related legal costs, fees to brokers, fees to auction agents, fees to transfer agents, fees to ratings agencies and fees to auditors associated with satisfying ratings agency requirements for preferred shares or other securities issued by the Fund and other related requirements in the Fund’s organizational documents) associated with the Fund’s issuance, offering, redemption and maintenance of preferred shares, commercial paper or other instruments (such as the use of reverse repurchase agreements, dollar rolls, bank borrowings, credit facilities and tender option bonds) for the purpose of incurring leverage; (vii) fees and expenses of any underlying funds or other pooled vehicles in which the Fund invests; (viii) dividend and interest expenses on short positions taken by the Fund; (ix) fees and expenses, including travel expenses, and fees and expenses of legal counsel retained for their benefit, of Trustees who are not officers,
|
|
|
|
|
|
|
|
|
|
|
|
| |
| |
|
|
ANNUAL REPORT |
|
|
| |
|
|
JUNE 30, 2025 |
|
|
161 |
|
|
|
|
| |
Notes to Financial Statements |
|
|
|
|
employees, partners, shareholders or members of PIMCO or its subsidiaries or affiliates; (x) extraordinary expenses, including extraordinary legal expenses, as may arise, including, without limitation expenses incurred in connection with litigation, proceedings, other claims, and the legal obligations of the Fund to indemnify its Trustees, officers, employees, shareholders, distributors, and agents with respect thereto; (xi) fees and expenses, including legal, printing and mailing, solicitation and other fees and expenses associated with and incident to shareholder meetings and proxy solicitations involving contested elections of trustees, shareholder proposals or other
non-routine
matters that are not initiated or proposed by Fund management; (xii) organizational and offering expenses of the Fund; (xiii) expenses associated with tender offers and other share repurchases and redemptions; (xiv) fees and expenses associated with seeking, applying for and obtaining formal exemptive,
no-action
and/or other relief from the SEC in connection with the operation of a managed distribution plan; and (xv) expenses of the Fund that are capitalized in accordance with U.S. GAAP. Without limiting the generality or scope of the foregoing, it is understood that the Fund may bear such expenses either directly or indirectly through contracts or arrangements with PIMCO or an affiliated or unaffiliated third-party.
Each of the Trustees of the Funds who is not an interested person under Section 2(a)(19) of the Act, (the “Independent Trustees”), also serves as a trustee of a number of other
closed-end
funds for which PIMCO serves as investment manager (together with the Funds, the “PIMCO
Closed-End
Funds”), as well as PIMCO California Flexible Municipal Income Fund, PIMCO Flexible Emerging Markets Income Fund, PIMCO Flexible Credit Income Fund and PIMCO Flexible Municipal Income Fund, each a closed end management investment company managed by PIMCO that is operated as an “interval fund” and PIMCO Managed Accounts Trust, an
open-end
management investment company with multiple series for which PIMCO serves as investment adviser and administrator.
The Funds pay no compensation directly to any Trustee or any other officer who is affiliated with the Manager, all of whom receive remuneration for their services to the Funds from the Manager or its affiliates.
(c) Acquired Fund Fees and Expenses The Cayman Subsidiary has entered into a separate contract with PIMCO for the management of the Cayman Subsidiary’s portfolio pursuant to which the Cayman Subsidiary pays PIMCO a management fee at the annual rate of 0.69% of its average daily net assets. PIMCO has contractually agreed to waive the PIMCO Dynamic Income Strategy Fund’s management fee in an amount equal to the management fee paid by the Cayman Subsidiary to PIMCO. This waiver may not be terminated by PIMCO and will remain in effect for as long as PIMCO’s contract with the Subsidiary
is in place. PIMCO may not seek reimbursement from a Fund with respect to the management fees waived. The waiver is reflected on the Consolidated Statement of Operations as a component of Waiver and/or Reimbursement by PIMCO. For the period ended June 30, 2025, the amount was $49,724. See Note 14, Basis for Consolidation in the Notes to Financial Statements for more information regarding the Cayman Subsidiary.
10. RELATED PARTY TRANSACTIONS
The Manager is a related party. Fees payable to this party are disclosed in Note 9, Fees and Expenses, and the accrued related party fee amounts are disclosed on the Statements of Assets and Liabilities.
The Funds have received exemptive relief from the SEC that, to the extent the Funds rely on such relief, permits it to (among other things)
co-invest
with certain other persons, including certain affiliates of the Advisor and certain public or private funds managed by the Advisor and its affiliates, subject to certain terms and conditions. The exemptive relief from the SEC with respect to
co-investments
imposes extensive conditions on any
co-investments
made in reliance on such relief.
11. GUARANTEES AND INDEMNIFICATIONS
Under the organizational documents of PIMCO Global StocksPLUS
& Income Fund, PIMCO Access Income Fund, PIMCO Dynamic Income Fund, PIMCO Dynamic Income Opportunities Fund and PIMCO Dynamic Income Strategy Fund, each Trustee and officer is indemnified, to the extent permitted by the Act, against certain liabilities that may arise out of performance of their duties to the Funds. Under the organizational documents of PCM Fund, Inc., and PIMCO Strategic Income Fund, Inc., each Director and officer is indemnified to the fullest extent permitted by Maryland law and the Act. For PCM Fund, Inc., employees and agents of the Fund are indemnified to the maximum extent permitted by Maryland law and the Act. For PIMCO Strategic Income Fund, Inc.,
employees and agents of the Fund may be indemnified to the extent determined by the Board and subject to the limitations of the Act. Additionally, in the normal course of business, the Funds enter into contracts that contain a variety of indemnification clauses. The Funds’ maximum exposure under these arrangements is unknown as this would involve future claims that may be made against the Funds that have not yet occurred. However, the Funds have not had prior claims or losses pursuant to these contracts.
12. PURCHASES AND SALES OF SECURITIES
The length of time a Fund has held a particular security is not generally a consideration in investment decisions. A change in the securities held by a Fund is known as “portfolio turnover.” Each Fund may engage in frequent and active trading of portfolio securities to achieve its investment objective(s), particularly during periods of volatile market
|
|
|
|
|
|
| |
162 |
|
PIMCO CLOSED-END FUNDS |
|
|
|
|
movements. High portfolio turnover may involve correspondingly greater transaction costs, including brokerage commissions or dealer
mark-ups
and other transaction costs on the sale of securities and reinvestments in other securities, which are borne by a Fund. Frequent and active trading of a Fund’s portfolio holdings may cause adverse tax
consequences for shareholders due to an increase in short-term capital gains and may also adversely impact a Fund’s
after-tax
returns. The transaction costs and tax effects associated with portfolio turnover may adversely affect a Fund’s performance. The portfolio turnover rates are reported in the Financial Highlights.
Purchases and sales of securities (excluding short-term investments) for the period ended June 30, 2025 were as follows (amounts in thousands
):
|
|
|
|
|
|
|
|
|
|
|
|
|
|
|
|
|
|
|
|
| |
| |
|
|
|
|
|
|
|
|
|
|
|
| |
|
|
|
|
|
|
|
|
|
|
|
|
|
|
|
|
|
|
|
| |
| PCM Fund, Inc. |
|
|
|
| |
$ |
0 |
|
|
$ |
269 |
|
|
$ |
14,804 |
|
|
$ |
20,985 |
|
|
|
|
|
|
| |
PIMCO Global StocksPLUS & Income Fund |
|
|
|
| |
|
706,548 |
|
|
|
715,632 |
|
|
|
54,579 |
|
|
|
34,440 |
|
|
|
|
|
|
| |
| PIMCO Strategic Income Fund, Inc. |
|
|
|
| |
|
5,454,357 |
|
|
|
5,454,398 |
|
|
|
125,623 |
|
|
|
107,853 |
|
|
|
|
|
|
| |
| PIMCO Access Income Fund |
|
|
|
| |
|
4,514 |
|
|
|
4,703 |
|
|
|
249,417 |
|
|
|
284,247 |
|
|
|
|
|
|
| |
| PIMCO Dynamic Income Fund |
|
|
|
| |
|
207,116 |
|
|
|
69,355 |
|
|
|
3,497,523 |
|
|
|
2,285,061 |
|
|
|
|
|
|
| |
| PIMCO Dynamic Income Opportunities Fund |
|
|
|
| |
|
11,188 |
|
|
|
1,876 |
|
|
|
634,376 |
|
|
|
515,667 |
|
|
|
|
|
|
| |
| PIMCO PIMCO Dynamic Income Strategy Fund |
|
|
|
| |
|
7,799 |
|
|
|
0 |
|
|
|
869,969 |
|
|
|
751,450 |
|
|
| |
|
|
| |
|
|
| |
|
|
| |
|
|
| |
|
| |
|
A zero balance may reflect actual amounts rounding to less than one thousand. |
13. COMMON SHARES OFFERING
PCM Fund, Inc. has the authority to issue 300 million shares of $0.001 par value common stock. PIMCO Strategic Income Fund, Inc. has the authority to issue 500 million shares of $0.00001 par value common stock. Each of PIMCO Global StocksPLUS
& Income Fund, PIMCO Dynamic Income Fund (“PDI”), PIMCO Dynamic Income Opportunities Fund (“PDO”), PIMCO Dynamic Income Strategy Fund and PIMCO Access Income Fund (“PAXS”) has been authorized to issue an unlimited number of Common Shares at a par value of $0.00001 per share (each of the foregoing Fund’s shares as the context requires, “Common Shares”).
As of the end of the reporting period, PDI had an effective registration statement on file with the SEC authorizing the Fund to issue shares through the “shelf” registration process pursuant to Rule 415 under the Securities Act (each, a “Shelf Registration Statement”). Pursuant to such Shelf Registration Statement, PDI may offer and sell Common Shares having an aggregate offering value of up to $2,000,000,000. PDI may have had one or more prior Shelf Registration Statements in effect during this and/or previous fiscal periods authorizing the sale of additional Common Shares.
As of the end of the reporting period, PDO had an effective registration statement on file with the SEC authorizing the Fund to issue shares
through the “shelf” registration process pursuant to Rule 415 under the Securities Act. Pursuant to such Shelf Registration Statement, PDO may offer and sell Common Shares having an aggregate offering value of up to $500,000,000.
As of the end of the reporting period, PAXS had an effective registration statement on file with the SEC authorizing the Fund to issue shares through the “shelf” registration process pursuant to Rule 415 under the Securities Act. Pursuant to such Shelf Registration Statement, PAXS may offer and sell Common Shares having an aggregate offering value of up to $250,000,000.
PDI, PDO and PAXS have each entered into a sales agreement (a “Sales Agreement”) with JonesTrading Institutional Services LLC (“JonesTrading”), pursuant to which each respective Fund may offer and sell its Common Shares offered by an applicable prospectus supplement through JonesTrading as its agent in negotiated transactions or transactions that are deemed to be “at the market” as defined in Rule 415 under the Securities Act, including sales made directly on the NYSE or sales made to or through a market maker other than on an exchange, at prices related to the prevailing market prices or at negotiated prices. Each Fund will pay JonesTrading compensation of up to 1.00% of the gross proceeds with respect to sales of the Common Shares actually effected by JonesTrading under its respective Sales Agreement.
|
|
|
|
|
|
|
|
|
|
|
|
| |
| |
|
|
ANNUAL REPORT |
|
|
| |
|
|
JUNE 30, 2025 |
|
|
163 |
|
|
|
|
| |
Notes to Financial Statements |
|
|
|
|
The aggregate dollar amount of Common Shares registered under PDI’s, PDO’s and PAXS’ Shelf Registration Statement as of the end of the periods described below, as well as the number of Common Shares sold and the total amount of offering proceeds (net of offering costs, if any) received by the Fund under one or more Shelf Registration Statements during the Fund’s most recent and prior fiscal periods were as follows:
|
|
|
|
|
|
|
|
|
|
|
|
|
|
|
|
|
|
|
|
|
|
|
|
| |
| |
|
|
|
|
|
|
|
|
|
|
| |
|
|
|
|
Year Ended 06/30/2025 |
|
|
Year Ended 06/30/2024 |
|
|
Year Ended 06/30/2025 |
|
|
Year Ended 06/30/2024 |
|
|
Year Ended 06/30/2025 |
|
|
|
|
|
|
|
| |
| Common Shares registered (aggregate $) |
|
|
|
| |
$ |
2,000,000,000 |
|
|
$ |
2,000,000,000 |
|
|
$ |
500,000,000 |
|
|
$ |
500,000,000 |
|
|
$ |
250,000,000 |
|
|
|
|
|
|
|
| |
| Common Shares sold |
|
|
|
| |
|
70,782,993 |
|
|
|
45,079,303 |
|
|
|
14,025,159 |
|
|
|
3,299,482 |
|
|
|
1,088,574 |
|
|
|
|
|
|
|
| |
| Offering proceeds (net of offering costs) |
|
|
|
| |
|
1,354,689,532 |
|
|
|
836,642,598 |
|
|
|
190,692,420 |
|
|
|
42,968,462 |
|
|
|
17,340,178 |
|
A Fund may not sell any Common Shares at a price below the NAV of such Common Shares, exclusive of any distributing commission or discount. Sales of the Common Shares, if any, may be made in negotiated transactions or transactions that are deemed to be “at the market”, including sales made directly on the NYSE or sales made to or through a market maker other than on an exchange, at prices related to the prevailing market prices or at negotiated prices.
14. BASIS FOR CONSOLIDATION
PIMCO Access Income Fund’s, PIMCO Dynamic Income Fund’s, PIMCO Dynamic Income Opportunities Fund’s and PIMCO Dynamic Income Strategy Fund’s subsidiaries were each formed as a wholly owned subsidiary acting as an investment vehicle for the Fund in order to effect certain investments for the Fund consistent with the Fund’s investment objectives and policies in effect from time to time. Each Fund’s investment portfolio has been consolidated and includes the portfolio holdings of the Fund and its subsidiaries. Accordingly, the consolidated financial statements include the accounts of each Fund and its subsidiaries. All inter-company transactions and balances have been eliminated. This structure was established so that certain investments could be held by a separate legal entity from the Fund. See the table below for details regarding the structure, incorporation and relationship as of period end of the subsidiaries.
|
|
|
|
|
|
|
|
|
|
|
|
|
|
| |
|
|
|
|
|
|
|
|
|
|
Subsidiary % of Consolidated |
|
|
|
|
|
| |
| PIMCO Access Income Fund |
|
|
|
| |
PAXSLS I LLC |
|
|
12/13/2021 |
|
|
|
0.0% |
|
|
|
|
|
| |
| PIMCO Access Income Fund |
|
|
|
| |
RLM 4355 LLC |
|
|
12/13/2021 |
|
|
|
0.0% |
|
|
|
|
|
| |
| PIMCO Dynamic Income Fund |
|
|
|
| |
PCILS I LLC |
|
|
03/07/2013 |
|
|
|
0.0% |
|
|
|
|
|
| |
| PIMCO Dynamic Income Fund |
|
|
|
| |
|
|
|
03/12/2013 |
|
|
|
0.0% |
|
|
|
|
|
| |
| PIMCO Dynamic Income Opportunities Fund |
|
|
|
| |
PDOLS I LLC |
|
|
01/15/2021 |
|
|
|
0.0% |
|
|
|
|
|
| |
| PIMCO Dynamic Income Opportunities Fund |
|
|
|
| |
RLM 4365 LLC |
|
|
01/15/2021 |
|
|
|
0.0% |
|
|
|
|
|
| |
| PIMCO Dynamic Income Strategy Fund |
|
|
|
| |
Cayman Commodity Fund IX Ltd. |
|
|
12/14/2018 |
|
|
|
0.5% |
|
|
|
|
|
| |
| PIMCO Dynamic Income Strategy Fund |
|
|
|
| |
NRGX SPV I LLC |
|
|
11/07/2022 |
|
|
|
0.0% |
|
|
|
|
|
| |
| PIMCO Dynamic Income Strategy Fund |
|
|
|
| |
NRGX SPV II LLC |
|
|
11/07/2022 |
|
|
|
0.0% |
|
|
A zero balance may reflect actual amounts rounding to less than 0.01%. |
15. REGULATORY AND LITIGATION MATTERS
The Funds are not named as defendants in any material litigation or arbitration proceedings and are not aware of any material litigation or claim pending or threatened against them.
The foregoing speaks only as of the date of this report.
16. FEDERAL INCOME TAX MATTERS
Each Fund intends to qualify as a regulated investment company under Subchapter M of the Internal Revenue Code (the “Code”) and distribute all of its taxable income and net realized gains, if applicable,
to shareholders. Accordingly, no provision for Federal income taxes has been made.
A Fund may be subject to local withholding taxes, including those imposed on realized capital gains. Any applicable foreign capital gains tax is accrued daily based upon net unrealized gains, and may be payable following the sale of any applicable investments.
In accordance with U.S. GAAP, the Manager has reviewed the Funds’ tax positions for all open tax years. As of June 30, 2025, the Funds have recorded no liability for net unrecognized tax benefits relating to uncertain income tax positions they have taken or expect to take in future tax returns.
|
|
|
|
|
|
| |
164 |
|
PIMCO CLOSED-END FUNDS |
|
|
|
|
The Funds file U.S. federal, state and local tax returns as required. The Funds’ tax returns are subject to examination by relevant tax authorities until expiration of the applicable statute of limitations, which is generally three years after the filing of the tax return but which can be extended to six years in certain circumstances. Tax returns for open years have incorporated no uncertain tax positions that require a provision for income taxes.
As of June 30, 2025, the components of distributable taxable earnings are as follows (amounts in thousands
):
|
|
|
|
|
|
|
|
|
|
|
|
|
|
|
|
|
|
|
|
|
|
|
|
|
|
|
|
|
|
|
|
|
|
|
|
| |
| |
|
|
|
|
Undistributed Ordinary Income (1) |
|
|
Undistributed
Long-Term
Capital Gains |
|
|
Net Tax Basis Unrealized Appreciation/ (Depreciation) (2) |
|
|
Other Accounting Differences (3) |
|
|
Accumulated Capital Losses (4) |
|
|
Qualified Late-Year Loss Deferral - Capital (5) |
|
|
Qualified Late-Year Loss Deferral - Ordinary (6) |
|
|
Total
Components of
Distributable
Earnings |
|
|
|
|
|
|
|
|
|
|
| |
| PCM Fund, Inc. |
|
|
|
| |
$ |
0 |
|
|
$ |
0 |
|
|
$ |
(13,888 |
) |
|
$ |
(786 |
) |
|
$ |
(18,672 |
) |
|
$ |
0 |
|
|
$ |
0 |
|
|
$ |
(33,346 |
) |
|
|
|
|
|
|
|
|
|
| |
PIMCO Global StocksPLUS & Income Fund |
|
|
|
| |
|
0 |
|
|
|
0 |
|
|
|
(7,695 |
) |
|
|
(797 |
) |
|
|
(32,532 |
) |
|
|
0 |
|
|
|
(449 |
) |
|
|
(41,473 |
) |
|
|
|
|
|
|
|
|
|
| |
| PIMCO Strategic Income Fund, Inc. |
|
|
|
| |
|
0 |
|
|
|
0 |
|
|
|
(32,633 |
) |
|
|
(1,869 |
) |
|
|
(93,767 |
) |
|
|
0 |
|
|
|
(2,414 |
) |
|
|
(130,683 |
) |
|
|
|
|
|
|
|
|
|
| |
| PIMCO Access Income Fund |
|
|
|
| |
|
0 |
|
|
|
0 |
|
|
|
(108,550 |
) |
|
|
(6,808 |
) |
|
|
(65,875 |
) |
|
|
0 |
|
|
|
(8,612 |
) |
|
|
(189,845 |
) |
|
|
|
|
|
|
|
|
|
| |
| PIMCO Dynamic Income Fund |
|
|
|
| |
|
0 |
|
|
|
0 |
|
|
|
(904,320 |
) |
|
|
(85,793 |
) |
|
|
(988,726 |
) |
|
|
0 |
|
|
|
(84,067 |
) |
|
|
(2,062,906 |
) |
|
|
|
|
|
|
|
|
|
| |
| PIMCO Dynamic Income Opportunities Fund |
|
|
|
| |
|
0 |
|
|
|
0 |
|
|
|
(300,332 |
) |
|
|
(16,840 |
) |
|
|
(379,159 |
) |
|
|
0 |
|
|
|
(23,765 |
) |
|
|
(720,096 |
) |
|
|
|
|
|
|
|
|
|
| |
| PIMCO Dynamic Income Strategy Fund |
|
|
|
| |
|
64,944 |
|
|
|
78,664 |
|
|
|
277,438 |
|
|
|
(5,964 |
) |
|
|
0 |
|
|
|
0 |
|
|
|
0 |
|
|
|
415,082 |
|
|
A zero balance may reflect actual amounts rounding to less than one thousand. |
|
Includes undistributed short-term capital gains, if any. |
|
Adjusted for open wash sale loss deferrals and the accelerated recognition of unrealized gain or loss on certain futures, options, and/or forward contracts for federal income tax purposes. Also adjusted for differences between book and tax realized and unrealized gain (loss) on hyperinflationary investments, swap contracts, straddle loss deferrals, passive foreign investment companies (PFICs), interest accrued on defaulted securities, return of capital distributions from underlying funds, short positions, grantor trusts, constructive sales, controlled foreign corporation (CFC) transactions, and partnerships. |
|
Represents differences in income tax regulations and financial accounting principles generally accepted in the United States of America, mainly for distributions payable at fiscal year-end. |
|
Capital losses available to offset future net capital gains as shown below. |
|
Capital losses realized during the period November 1, 2024 through June 30, 2025 which the Funds elected to defer to the following taxable year pursuant to income tax regulations. |
|
Specified losses realized during the period November 1, 2024 through June 30, 2025 and Ordinary losses realized during the period January 1, 2025 through June 30, 2025 which the Funds elected to defer to the following taxable year pursuant to income tax regulations. |
Under the Regulated Investment Company Modernization Act of 2010, a fund is permitted to carry forward any new capital losses for an unlimited period. Additionally, such capital losses that are carried forward will retain their character as either short-term or long-term capital losses rather than being considered all short-term under previous law. As of June 30, 2025, the Funds had the following post-effective capital losses with no expiration (amounts in thousands
):
|
|
|
|
|
|
|
|
|
|
|
|
| |
| |
|
|
|
|
|
|
|
|
|
|
|
|
| |
| PCM Fund, Inc. |
|
|
|
| |
$ |
2,759 |
|
|
$ |
15,913 |
|
|
|
|
| |
PIMCO Global StocksPLUS & Income Fund |
|
|
|
| |
|
28,041 |
|
|
|
4,491 |
|
|
|
|
| |
| PIMCO Strategic Income Fund, Inc. |
|
|
|
| |
|
27,074 |
|
|
|
66,693 |
|
|
|
|
| |
| PIMCO Access Income Fund |
|
|
|
| |
|
37,875 |
|
|
|
28,000 |
|
|
|
|
| |
| PIMCO Dynamic Income Fund* |
|
|
|
| |
|
257,419 |
|
|
|
731,307 |
|
|
|
|
| |
| PIMCO Dynamic Income Opportunities Fund |
|
|
|
| |
|
3,309 |
|
|
|
375,850 |
|
|
|
|
| |
| PIMCO Dynamic Income Strategy Fund |
|
|
|
| |
|
0 |
|
|
|
0 |
|
|
A zero balance may reflect actual amounts rounding to less than one thousand. |
* |
Portion of amount represents realized loss and recognized built-in loss under IRC sections 382-83, which is carried forward to future years to offset future realized gain subject to certain limitations. |
|
|
|
|
|
|
|
|
|
|
|
|
| |
| |
|
|
ANNUAL REPORT |
|
|
| |
|
|
JUNE 30, 2025 |
|
|
165 |
|
|
|
|
| |
Notes to Financial Statements |
|
|
|
June 30, 2025 |
As of June 30, 2025, the aggregate cost and the net unrealized appreciation/(depreciation) of investments for federal income tax purposes are as follows (amounts in thousands
):
|
|
|
|
|
|
|
|
|
|
|
|
|
|
|
|
|
|
|
|
| |
| |
|
|
|
|
|
|
|
|
|
|
|
|
|
Net Unrealized Appreciation/ (Depreciation) (7) |
|
|
|
|
|
|
| |
| PCM Fund, Inc. |
|
|
|
| |
$ |
128,681 |
|
|
$ |
11,784 |
|
|
$ |
(25,690 |
) |
|
$ |
(13,906 |
) |
|
|
|
|
|
| |
PIMCO Global StocksPLUS & Income Fund |
|
|
|
| |
|
170,565 |
|
|
|
22,929 |
|
|
|
(30,578 |
) |
|
|
(7,649 |
) |
|
|
|
|
|
| |
| PIMCO Strategic Income Fund, Inc. |
|
|
|
| |
|
646,475 |
|
|
|
44,861 |
|
|
|
(77,265 |
) |
|
|
(32,404 |
) |
|
|
|
|
|
| |
| PIMCO Access Income Fund |
|
|
|
| |
|
1,280,870 |
|
|
|
75,041 |
|
|
|
(182,008 |
) |
|
|
(106,967 |
) |
|
|
|
|
|
| |
| PIMCO Dynamic Income Fund |
|
|
|
| |
|
10,767,204 |
|
|
|
788,693 |
|
|
|
(1,679,744 |
) |
|
|
(891,051 |
) |
|
|
|
|
|
| |
| PIMCO Dynamic Income Opportunities Fund |
|
|
|
| |
|
3,003,911 |
|
|
|
174,013 |
|
|
|
(471,546 |
) |
|
|
(297,533 |
) |
|
|
|
|
|
| |
| PIMCO Dynamic Income Strategy Fund |
|
|
|
| |
|
1,282,973 |
|
|
|
305,778 |
|
|
|
(28,338 |
) |
|
|
277,440 |
|
|
A zero balance may reflect actual amounts rounding to less than one thousand. |
|
Adjusted for open wash sale loss deferrals and the accelerated recognition of unrealized gain or loss on certain futures, options, and/or forward contracts for federal income tax purposes. Also adjusted for differences between book and tax realized and unrealized gain (loss) on hyperinflationary investments, swap contracts, straddle loss deferrals, passive foreign investment companies (PFICs), interest accrued on defaulted securities, return of capital distributions from underlying funds, short positions, grantor trusts, constructive sales, controlled foreign corporation (CFC), and partnerships. |
For the fiscal years ended June 30, 2025 and June 30, 2024, respectively, the Funds made the following tax basis distributions (amounts in thousands
):
|
|
|
|
|
|
|
|
|
|
|
|
|
|
|
|
|
|
|
|
|
|
|
|
|
|
|
|
| |
| |
|
|
|
|
June 30, 2025 |
|
|
|
|
|
|
|
|
|
|
|
| |
| |
|
|
|
|
Ordinary Income Distributions (8) |
|
|
Long-Term
Capital Gain
Distributions |
|
|
|
|
|
Ordinary Income Distributions (8) |
|
|
Long-Term
Capital Gain
Distributions |
|
|
|
|
|
|
|
|
|
|
|
| |
| PCM Fund, Inc. |
|
|
|
| |
$ |
8,280 |
|
|
$ |
0 |
|
|
$ |
2,238 |
|
|
$ |
6,853 |
|
|
$ |
0 |
|
|
$ |
4,659 |
|
|
|
|
|
|
|
|
| |
PIMCO Global StocksPLUS & Income Fund |
|
|
|
| |
|
9,383 |
|
|
|
0 |
|
|
|
155 |
|
|
|
7,573 |
|
|
|
0 |
|
|
|
1,873 |
|
|
|
|
|
|
|
|
| |
| PIMCO Strategic Income Fund, Inc. |
|
|
|
| |
|
25,038 |
|
|
|
0 |
|
|
|
332 |
|
|
|
19,691 |
|
|
|
0 |
|
|
|
8,388 |
|
|
|
|
|
|
|
|
| |
| PIMCO Access Income Fund |
|
|
|
| |
|
74,206 |
|
|
|
0 |
|
|
|
5,940 |
|
|
|
64,934 |
|
|
|
0 |
|
|
|
14,011 |
|
|
|
|
|
|
|
|
| |
| PIMCO Dynamic Income Fund |
|
|
|
| |
|
753,252 |
|
|
|
0 |
|
|
|
185,588 |
|
|
|
394,343 |
|
|
|
0 |
|
|
|
369,848 |
|
|
|
|
|
|
|
|
| |
| PIMCO Dynamic Income Opportunities Fund |
|
|
|
| |
|
184,112 |
|
|
|
0 |
|
|
|
6,947 |
|
|
|
122,934 |
|
|
|
0 |
|
|
|
50,758 |
|
|
|
|
|
|
|
|
| |
| PIMCO Dynamic Income Strategy Fund |
|
|
|
| |
|
80,929 |
|
|
|
1,788 |
|
|
|
0 |
|
|
|
46,493 |
|
|
|
0 |
|
|
|
0 |
|
|
| |
|
|
| |
|
|
| |
|
|
| |
|
|
| |
|
|
| |
|
|
| |
|
| |
|
A zero balance may reflect actual amounts rounding to less than one thousand. |
|
Includes short-term capital gains distributed, if any. |
|
A portion of the distributions made represents a tax return of capital. Return of capital distributions have been reclassified from undistributed net investment income to paid-in capital to more appropriately conform financial accounting to tax accounting. |
17. SUBSEQUENT EVENTS
In preparing these financial statements, the Funds’ management has evaluated events and transactions for potential recognition or disclosure through the date the financial statements were issued.
On July 01, 2025, the following distributions were declared to common shareholders payable August 01, 2025 to shareholders of record on July 11, 2025:
|
|
|
|
|
|
|
|
| |
|
|
| |
| PCM Fund, Inc. |
|
|
|
| |
$ |
0.064240 per common share |
|
|
|
| |
PIMCO Global StocksPLUS & Income Fund |
|
|
|
| |
$ |
0.069000 per common share |
|
|
|
| |
| PIMCO Strategic Income Fund, Inc. |
|
|
|
| |
$ |
0.040000 per common share |
|
|
|
| |
| PIMCO Access Income Fund |
|
|
|
| |
$ |
0.149400 per common share |
|
|
|
| |
| PIMCO Dynamic Income Fund |
|
|
|
| |
$ |
0.220500 per common share |
|
|
|
| |
| PIMCO Dynamic Income Opportunities Fund |
|
|
|
| |
$ |
0.127900 per common share |
|
|
|
| |
| PIMCO Dynamic Income Strategy Fund |
|
|
|
| |
$ |
0.133400 per common share |
|
On August 01, 2025, the following distributions were declared to common shareholders payable September 02, 2025 to shareholders of record on August 11, 2025:
|
|
|
|
|
|
|
|
| |
|
|
| |
| PCM Fund, Inc. |
|
|
|
| |
$ |
0.064240 per common share |
|
|
|
| |
PIMCO Global StocksPLUS & Income Fund |
|
|
|
| |
$ |
0.069000 per common share |
|
|
|
| |
| PIMCO Strategic Income Fund, Inc. |
|
|
|
| |
$ |
0.040000 per common share |
|
|
|
| |
| PIMCO Access Income Fund |
|
|
|
| |
$ |
0.149400 per common share |
|
|
|
| |
| PIMCO Dynamic Income Fund |
|
|
|
| |
$ |
0.220500 per common share |
|
|
|
| |
| PIMCO Dynamic Income Opportunities Fund |
|
|
|
| |
$ |
0.127900 per common share |
|
|
|
| |
| PIMCO Dynamic Income Strategy Fund |
|
|
|
| |
$ |
0.133400 per common share |
|
There were no other subsequent events identified that require recognition or disclosure.
|
|
|
|
|
|
| |
166 |
|
PIMCO CLOSED-END FUNDS |
|
|
|
|
|
|
|
|
| |
Report of Independent Registered Public Accounting Firm |
|
|
|
|
To the Board of Directors and Shareholders of PCM Fund, Inc. and PIMCO Strategic Income Fund, Inc. and the Board of Trustees and Shareholders of PIMCO Global StocksPLUS & Income Fund, PIMCO Access Income Fund, PIMCO Dynamic Income Fund, PIMCO Dynamic Income Opportunities Fund, and PIMCO Dynamic Income Strategy Fund
Opinions on the Financial Statements
We have audited the accompanying statements of assets and liabilities, including the schedules of investments, of each of the funds listed in the table below (hereafter collectively referred to as the “Funds”) as of June 30, 2025, the related statements of operations and cash flows for the year ended June 30, 2025, the statements of changes in net assets for each of the two years in the period ended June 30, 2025, including the related notes, and the financial highlights for each of the years or periods ended June 30, 2025, 2024, 2023, 2022 and 2021 as indicated therein (collectively referred to as the “financial statements”). In our opinion, the financial statements present fairly, in all material respects, the financial position of each of the Funds listed in the table below as of June 30, 2025, the results of each of their operations and each of their cash flows for the year then ended, the changes in each of their net assets for each of the two years in the period ended June 30, 2025 and each of the financial highlights for each of the years or periods ended June 30, 2025, 2024, 2023, 2022 and 2021 as indicated therein in conformity with accounting principles generally accepted in the United States of America.
PIMCO Global StocksPLUS & Income Fund
PIMCO Strategic Income Fund, Inc.
PIMCO Access Income Fund*
PIMCO Dynamic Income Fund*
PIMCO Dynamic Income Opportunities Fund*
PIMCO Dynamic Income Strategy Fund*
* |
The financial statements for PIMCO Access Income Fund, PIMCO Dynamic Income Fund, PIMCO Dynamic Income Opportunities Fund, and PIMCO Dynamic Income Strategy Fund are presented on a consolidated basis |
Basis for Opinions
These financial statements are the responsibility of the Funds’ management. Our responsibility is to express an opinion on the Funds’ financial statements based on our audits. We are a public accounting firm registered with the Public Company Accounting Oversight Board (United States) (PCAOB) and are required to be independent with respect to the Funds in accordance with the U.S. federal securities laws and the applicable rules and regulations of the Securities and Exchange Commission and the PCAOB.
We conducted our audits of these financial statements in accordance with the standards of the PCAOB. Those standards require that we plan and perform the audit to obtain reasonable assurance about whether the financial statements are free of material misstatement, whether due to error or fraud.
Our audits included performing procedures to assess the risks of material misstatement of the financial statements, whether due to error or fraud, and performing procedures that respond to those risks. Such procedures included examining, on a test basis, evidence regarding the amounts and disclosures in the financial statements. Our audits also included evaluating the accounting principles used and significant estimates made by management, as well as evaluating the overall presentation of the financial statements. Our procedures included confirmation of securities owned as of June 30, 2025 by correspondence with the custodian, transfer agent, brokers and agent banks; when replies were not received from brokers or agent banks, we performed other auditing procedures. We believe that our audits provide a reasonable basis for our opinions.
/s/ PricewaterhouseCoopers LLP
We have served as the auditor of one or more investment companies in PIMCO Taxable Closed-End Funds since 1995.
|
|
|
|
|
|
|
|
|
|
|
|
| |
| |
|
|
ANNUAL REPORT |
|
|
| |
|
|
JUNE 30, 2025 |
|
|
167 |
|
|
|
|
|
|
| |
|
|
(abbreviations that may be used in the preceding statements) |
|
|
|
(Unaudited) |
|
|
|
|
|
|
|
|
|
|
| |
|
|
|
|
| |
Counterparty Abbreviations: |
|
|
|
|
|
|
|
|
|
|
|
|
|
| |
|
|
Australia and New Zealand Banking Group |
|
|
|
Wells Fargo Bank National Association |
|
|
|
|
|
|
|
|
|
| |
|
|
|
|
|
|
|
|
|
|
|
|
|
|
|
|
| |
|
|
|
|
|
|
Goldman Sachs International |
|
|
|
Royal Bank of Canada Europe Limited |
|
|
|
|
|
| |
|
|
|
|
|
|
Crédit Agricole Corporate and Investment Bank S.A. |
|
|
|
|
|
|
|
|
|
| |
|
|
BNP Paribas Securities Corp. |
|
|
|
|
|
|
|
|
|
|
|
|
|
| |
|
|
|
|
|
|
JP Morgan Chase Bank N.A. |
|
|
|
RBC (Barbados) Trading Bank Corp. |
|
|
|
|
|
| |
|
|
|
|
|
|
J.P. Morgan Securities LLC |
|
|
|
|
|
|
|
|
|
| |
|
|
Banco Santander S.A. - New York Branch |
|
|
|
|
|
|
|
Citigroup Global Markets Ltd. |
|
|
|
|
|
| |
|
|
The Bank of Nova Scotia - Toronto |
|
|
|
Merrill Lynch International |
|
|
|
Standard Chartered Bank, London |
|
|
|
|
|
| |
|
|
The Bank of Nova Scotia - Toronto |
|
|
|
|
|
|
|
|
|
|
|
|
|
| |
|
|
|
|
|
|
Morgan Stanley & Co. LLC. |
|
|
|
State Street Bank and Trust Co. |
|
|
|
|
|
| |
|
|
Natixis Securities Americas LLC |
|
|
|
Morgan Stanley Capital Services LLC |
|
|
|
|
|
|
|
|
|
| |
|
|
Canadian Imperial Bank of Commerce World Markets |
|
|
|
Morgan Stanley & Co. International PLC |
|
|
|
|
|
|
|
|
|
| |
|
|
Canadian Imperial Bank of Commerce |
|
|
|
Mizuho Securities USA LLC |
|
|
|
|
|
|
|
|
|
| |
|
|
|
|
|
|
Nomura Global Financial Products, Inc. |
|
|
|
|
|
|
|
|
|
| |
|
|
Deutsche Bank Securities, Inc. |
|
|
|
Nomura Securities International, Inc. |
|
|
|
Wells Fargo Securities, LLC |
|
|
|
|
|
| |
|
|
|
|
| |
| |
| |
|
|
|
|
|
| |
| |
|
|
|
|
|
|
|
|
|
|
|
|
|
| |
|
|
|
|
|
|
|
|
|
|
|
|
|
|
|
|
| |
|
|
|
|
|
|
|
|
|
|
|
|
|
|
|
|
| |
|
|
|
|
|
|
|
|
|
|
|
|
|
|
|
|
| |
|
|
|
|
|
|
|
|
|
|
|
|
|
|
|
|
| |
|
|
Chinese Renminbi (Offshore) |
|
|
|
|
|
|
|
|
|
|
|
|
|
| |
|
|
Chinese Renminbi (Mainland) |
|
|
|
|
|
|
|
|
|
|
|
|
|
| |
|
|
|
|
|
|
|
|
|
|
|
|
|
|
|
|
| |
|
|
|
|
|
|
|
|
|
|
|
|
|
|
|
| |
| |
|
|
|
|
|
|
|
|
|
|
|
|
|
| |
|
|
Chicago Mercantile Exchange |
|
|
|
|
|
| |
|
|
|
|
|
| |
Index/Spread Abbreviations: |
|
|
|
|
|
|
|
|
|
|
|
|
|
| |
|
|
Asset-Backed Securities Index - Home Equity |
|
|
|
|
|
|
|
Standard & Poor’s 500 Index |
|
|
|
|
|
| |
|
|
|
|
|
|
Federal funds effective rate |
|
|
|
Secured Overnight Financing Rate |
|
|
|
|
|
| |
|
|
Canadian Overnight Repo Rate Average |
|
|
|
|
|
|
|
Sterling Overnight Interbank Average Rate |
|
|
|
|
|
| |
|
|
|
|
|
|
|
|
|
|
|
|
|
|
|
|
| |
|
|
|
|
|
|
|
|
|
|
|
|
|
|
|
|
| |
|
|
|
|
|
|
Penultimate AAA Sub-Index |
|
|
|
|
|
|
|
|
|
| |
|
|
|
|
|
|
|
|
|
|
|
|
|
|
|
| |
Municipal Bond or Agency Abbreviations: |
|
|
|
|
|
|
|
|
|
|
|
|
|
| |
|
|
American Capital Access Holding Ltd. |
|
| |
| |
| |
|
|
|
|
|
| |
| |
|
|
|
|
|
|
|
|
|
|
|
|
|
| |
|
|
|
|
|
|
Collateralized Loan Obligation |
|
|
|
|
|
|
|
|
|
| |
|
|
|
|
|
|
Collateralized Mortgage-Backed Security |
|
|
|
|
|
|
|
|
|
| |
|
|
|
|
|
|
Designated Activity Company |
|
|
|
Real Estate Mortgage Investment Conduit |
|
|
|
|
|
| |
|
|
Brazil Interbank Deposit Rate |
|
|
|
Earnings before Interest, Taxes, Depreciation and Amoritization |
|
|
|
|
|
|
|
|
|
| |
|
|
Collateralized Bond Obligation |
|
|
|
Euro Interbank Offered Rate |
|
|
|
|
|
|
|
|
|
| |
|
|
Collateralized Debt Obligation |
|
|
|
|
|
|
|
Interest rate to be determined when loan settles or at the time of funding |
|
|
|
|
|
|
| |
168 |
|
PIMCO CLOSED-END FUNDS |
|
|
|
|
For purposes of Section 19 of the Investment Company Act of 1940 (the “Act”), the Funds estimated the periodic sources of any dividends paid during the period covered by this report in accordance with good accounting practice. Pursuant to Rule
19a-1(e)
under the Act, the table below sets forth the actual source information for dividends paid during the six month period ended June 30, 2025 calculated as of each distribution period pursuant to Section 19 of the Act. The information below is not provided for U.S. federal income tax reporting purposes. The tax character of all dividends and distributions is reported on Form
1099-DIV
(for shareholders who receive U.S. federal tax reporting) at the end of each calendar year. See the Financial Highlights section of this report for the tax characterization of distributions determined in accordance with federal income tax regulations for the fiscal year.
|
|
|
|
|
|
|
|
|
|
|
|
|
|
|
|
|
|
|
|
| |
|
|
|
|
|
|
|
|
Net Realized
Capital Gains* |
|
|
Paid-in Surplus or Other Capital Sources** |
|
|
|
|
|
|
|
|
|
| |
| January 2025 |
|
|
|
| |
$ |
0.0581 |
|
|
$ |
0.0000 |
|
|
$ |
0.0061 |
|
|
$ |
0.0642 |
|
|
|
|
|
|
| |
| February 2025 |
|
|
|
| |
$ |
0.0500 |
|
|
$ |
0.0000 |
|
|
$ |
0.0142 |
|
|
$ |
0.0642 |
|
|
|
|
|
|
| |
| March 2025 |
|
|
|
| |
$ |
0.0447 |
|
|
$ |
0.0000 |
|
|
$ |
0.0195 |
|
|
$ |
0.0642 |
|
|
|
|
|
|
| |
| April 2025 |
|
|
|
| |
$ |
0.0516 |
|
|
$ |
0.0000 |
|
|
$ |
0.0126 |
|
|
$ |
0.0642 |
|
|
|
|
|
|
| |
| May 2025 |
|
|
|
| |
$ |
0.0493 |
|
|
$ |
0.0000 |
|
|
$ |
0.0149 |
|
|
$ |
0.0642 |
|
|
|
|
|
|
| |
| June 2025 |
|
|
|
| |
$ |
0.0446 |
|
|
$ |
0.0000 |
|
|
$ |
0.0196 |
|
|
$ |
0.0642 |
|
|
|
|
|
|
| |
PIMCO Global StocksPLUS & Income Fund |
|
|
|
|
|
|
|
Net Realized
Capital Gains* |
|
|
Paid-in Surplus or Other Capital Sources** |
|
|
|
|
|
|
|
|
|
| |
| January 2025 |
|
|
|
| |
$ |
0.0690 |
|
|
$ |
0.0000 |
|
|
$ |
0.0000 |
|
|
$ |
0.0690 |
|
|
|
|
|
|
| |
| February 2025 |
|
|
|
| |
$ |
0.0544 |
|
|
$ |
0.0000 |
|
|
$ |
0.0146 |
|
|
$ |
0.0690 |
|
|
|
|
|
|
| |
| March 2025 |
|
|
|
| |
$ |
0.0476 |
|
|
$ |
0.0000 |
|
|
$ |
0.0214 |
|
|
$ |
0.0690 |
|
|
|
|
|
|
| |
| April 2025 |
|
|
|
| |
$ |
0.0690 |
|
|
$ |
0.0000 |
|
|
$ |
0.0000 |
|
|
$ |
0.0690 |
|
|
|
|
|
|
| |
| May 2025 |
|
|
|
| |
$ |
0.0690 |
|
|
$ |
0.0000 |
|
|
$ |
0.0000 |
|
|
$ |
0.0690 |
|
|
|
|
|
|
| |
| June 2025 |
|
|
|
| |
$ |
0.0690 |
|
|
$ |
0.0000 |
|
|
$ |
0.0000 |
|
|
$ |
0.0690 |
|
|
|
|
|
|
| |
PIMCO Strategic Income Fund, Inc. |
|
|
|
|
|
|
|
Net Realized
Capital Gains* |
|
|
Paid-in Surplus or Other Capital Sources** |
|
|
|
|
|
|
|
|
|
| |
| January 2025 |
|
|
|
| |
$ |
0.0400 |
|
|
$ |
0.0000 |
|
|
$ |
0.0000 |
|
|
$ |
0.0400 |
|
|
|
|
|
|
| |
| February 2025 |
|
|
|
| |
$ |
0.0339 |
|
|
$ |
0.0000 |
|
|
$ |
0.0061 |
|
|
$ |
0.0400 |
|
|
|
|
|
|
| |
| March 2025 |
|
|
|
| |
$ |
0.0373 |
|
|
$ |
0.0000 |
|
|
$ |
0.0027 |
|
|
$ |
0.0400 |
|
|
|
|
|
|
| |
| April 2025 |
|
|
|
| |
$ |
0.0400 |
|
|
$ |
0.0000 |
|
|
$ |
0.0000 |
|
|
$ |
0.0400 |
|
|
|
|
|
|
| |
| May 2025 |
|
|
|
| |
$ |
0.0400 |
|
|
$ |
0.0000 |
|
|
$ |
0.0000 |
|
|
$ |
0.0400 |
|
|
|
|
|
|
| |
| June 2025 |
|
|
|
| |
$ |
0.0400 |
|
|
$ |
0.0000 |
|
|
$ |
0.0000 |
|
|
$ |
0.0400 |
|
|
|
|
|
|
| |
|
|
|
|
|
|
|
|
Net Realized
Capital Gains* |
|
|
Paid-in Surplus or Other Capital Sources** |
|
|
|
|
|
|
|
|
|
| |
| January 2025 |
|
|
|
| |
$ |
0.1494 |
|
|
$ |
0.0000 |
|
|
$ |
0.0000 |
|
|
$ |
0.1494 |
|
|
|
|
|
|
| |
| February 2025 |
|
|
|
| |
$ |
0.0842 |
|
|
$ |
0.0000 |
|
|
$ |
0.0652 |
|
|
$ |
0.1494 |
|
|
|
|
|
|
| |
| March 2025 |
|
|
|
| |
$ |
0.1197 |
|
|
$ |
0.0000 |
|
|
$ |
0.0297 |
|
|
$ |
0.1494 |
|
|
|
|
|
|
| |
| April 2025 |
|
|
|
| |
$ |
0.1494 |
|
|
$ |
0.0000 |
|
|
$ |
0.0000 |
|
|
$ |
0.1494 |
|
|
|
|
|
|
| |
| May 2025 |
|
|
|
| |
$ |
0.1331 |
|
|
$ |
0.0000 |
|
|
$ |
0.0163 |
|
|
$ |
0.1494 |
|
|
|
|
|
|
| |
| June 2025 |
|
|
|
| |
$ |
0.1494 |
|
|
$ |
0.0000 |
|
|
$ |
0.0000 |
|
|
$ |
0.1494 |
|
|
|
|
|
|
| |
PIMCO Dynamic Income Fund |
|
|
|
|
|
|
|
Net Realized
Capital Gains* |
|
|
Paid-in Surplus or Other Capital Sources** |
|
|
|
|
|
|
|
|
|
| |
| January 2025 |
|
|
|
| |
$ |
0.1863 |
|
|
$ |
0.0000 |
|
|
$ |
0.0342 |
|
|
$ |
0.2205 |
|
|
|
|
|
|
| |
| February 2025 |
|
|
|
| |
$ |
0.1364 |
|
|
$ |
0.0000 |
|
|
$ |
0.0841 |
|
|
$ |
0.2205 |
|
|
|
|
|
|
| |
| March 2025 |
|
|
|
| |
$ |
0.1302 |
|
|
$ |
0.0000 |
|
|
$ |
0.0903 |
|
|
$ |
0.2205 |
|
|
|
|
|
|
| |
| April 2025 |
|
|
|
| |
$ |
0.2097 |
|
|
$ |
0.0000 |
|
|
$ |
0.0108 |
|
|
$ |
0.2205 |
|
|
|
|
|
|
| |
| May 2025 |
|
|
|
| |
$ |
0.1889 |
|
|
$ |
0.0000 |
|
|
$ |
0.0316 |
|
|
$ |
0.2205 |
|
|
|
|
|
|
| |
| June 2025 |
|
|
|
| |
$ |
0.1968 |
|
|
$ |
0.0000 |
|
|
$ |
0.0237 |
|
|
$ |
0.2205 |
|
|
|
|
|
|
|
|
|
|
|
|
|
| |
| |
|
|
ANNUAL REPORT |
|
|
| |
|
|
JUNE 30, 2025 |
|
|
169 |
|
|
|
|
|
|
|
|
|
|
|
|
|
|
|
|
|
|
|
|
| |
PIMCO Dynamic Income Opportunities Fund |
|
|
|
|
Net Investment
Income* |
|
|
Net Realized
Capital Gains* |
|
|
Paid-in Surplus or Other Capital Sources** |
|
|
Total (per
common share) |
|
|
|
|
|
|
| |
| January 2025 |
|
|
|
| |
$ |
0.1279 |
|
|
$ |
0.0000 |
|
|
$ |
0.0000 |
|
|
$ |
0.1279 |
|
|
|
|
|
|
| |
| February 2025 |
|
|
|
| |
$ |
0.0749 |
|
|
$ |
0.0000 |
|
|
$ |
0.0530 |
|
|
$ |
0.1279 |
|
|
|
|
|
|
| |
| March 2025 |
|
|
|
| |
$ |
0.0837 |
|
|
$ |
0.0000 |
|
|
$ |
0.0442 |
|
|
$ |
0.1279 |
|
|
|
|
|
|
| |
| April 2025 |
|
|
|
| |
$ |
0.1107 |
|
|
$ |
0.0000 |
|
|
$ |
0.0172 |
|
|
$ |
0.1279 |
|
|
|
|
|
|
| |
| May 2025 |
|
|
|
| |
$ |
0.1257 |
|
|
$ |
0.0000 |
|
|
$ |
0.0022 |
|
|
$ |
0.1279 |
|
|
|
|
|
|
| |
| June 2025 |
|
|
|
| |
$ |
0.1245 |
|
|
$ |
0.0000 |
|
|
$ |
0.0034 |
|
|
$ |
0.1279 |
|
|
|
|
|
|
| |
PIMCO Dynamic Income Strategy Fund |
|
|
|
|
Net Investment
Income* |
|
|
Net Realized
Capital Gains* |
|
|
Paid-in Surplus or Other Capital Sources** |
|
|
Total (per
common share) |
|
|
|
|
|
|
| |
| January 2025 |
|
|
|
| |
$ |
0.1334 |
|
|
$ |
0.0000 |
|
|
$ |
0.0000 |
|
|
$ |
0.1334 |
|
|
|
|
|
|
| |
| February 2025 |
|
|
|
| |
$ |
0.1334 |
|
|
$ |
0.0000 |
|
|
$ |
0.0000 |
|
|
$ |
0.1334 |
|
|
|
|
|
|
| |
| March 2025 |
|
|
|
| |
$ |
0.1334 |
|
|
$ |
0.0000 |
|
|
$ |
0.0000 |
|
|
$ |
0.1334 |
|
|
|
|
|
|
| |
| April 2025 |
|
|
|
| |
$ |
0.1334 |
|
|
$ |
0.0000 |
|
|
$ |
0.0000 |
|
|
$ |
0.1334 |
|
|
|
|
|
|
| |
| May 2025 |
|
|
|
| |
$ |
0.1334 |
|
|
$ |
0.0000 |
|
|
$ |
0.0000 |
|
|
$ |
0.1334 |
|
|
|
|
|
|
| |
| June 2025 |
|
|
|
| |
$ |
0.1334 |
|
|
$ |
0.0000 |
|
|
$ |
0.0000 |
|
|
$ |
0.1334 |
|
* |
The source of dividends provided in the table differs, in some respects, from information presented in this report prepared in accordance with generally accepted accounting principles, or U.S. GAAP. For example, net earnings from certain interest rate swap contracts are included as a source of net investment income for purposes of Section 19(a). Accordingly, the information in the table may differ from information in the accompanying financial statements that are presented on the basis of U.S. GAAP and may differ from tax information presented in the footnotes. Amounts shown may include accumulated, as well as fiscal period net income and net profits. |
** |
Occurs when a Fund distributes an amount greater than its accumulated net income and net profits. Amounts are not reflective of a Fund’s net income, yield, earnings or investment performance. |
|
|
|
|
|
|
| |
170 |
|
PIMCO CLOSED-END FUNDS |
|
|
|
|
|
|
|
|
| |
Federal Income Tax Information |
|
| |
(Unaudited) |
As required by the Internal Revenue Code (“Code”) and Treasury Regulations, if applicable, shareholders must be notified within 60 days of the Funds’ fiscal year end regarding the status of qualified dividend income and the dividend received deduction.
Dividend Received Deduction.
Corporate shareholders are generally entitled to take the dividend received deduction on the portion of a fund’s dividend distribution that qualifies under tax law. The percentage of the following Funds’ fiscal 2025 ordinary income dividend that qualifies for the corporate dividend received deduction is set forth below.
Qualified Dividend Income.
Under the Jobs and Growth Tax Relief Reconciliation Act of 2003, the following percentage of ordinary dividends paid during the fiscal year ended June 30, 2025 was designated as ‘‘qualified dividend income’’ as defined in the Jobs and Growth Tax Relief Reconciliation Act of 2003 subject to reduced tax rates in 2025.
Qualified Interest Income and Qualified Short-Term Capital Gain (for
non-U.S.
resident shareholders only). Under the American Jobs Creation Act of 2004, the following amounts of ordinary dividends paid during the fiscal year ended June 30, 2025 are considered to be derived from “qualified interest income,” as defined in Section 871(k)(1)(E) of the Code, and therefore are designated as interest-related dividends, as defined in Section 871(k)(1)(C) of the Code. Further, the following amounts of ordinary dividends paid during the fiscal year ended June 30, 2025 are considered to be derived from “qualified short-term capital gain,” as defined in Section 871(k)(2)(D) of the Code, and therefore are designated as qualified short-term gain dividends, as defined by Section 871(k)(2)(C) of the Code.
Section 163(j) Interest Dividends.
The Funds intend to pass through the maximum amount allowable as Section 163(j) Interest defined in Proposed Treasury
Section 1.163(j)-1(b).
Section 199A Dividends.
The Funds intend to pass through the maximum amount allowable as Section 199A Dividends defined in Proposed Treasury
Section 199A-3(d).
|
|
|
|
|
|
|
|
|
|
|
|
|
|
|
|
|
|
|
|
| |
| |
|
|
|
|
Dividend
Received
Deduction
% |
|
|
|
|
|
Qualified Interest Income (000s) |
|
|
Qualified Short-Term Capital Gains (000s) |
|
|
|
|
|
|
| |
| PCM Fund, Inc. |
|
|
|
| |
|
0.00% |
|
|
|
1.05% |
|
|
$ |
8,007 |
|
|
$ |
0 |
|
|
|
|
|
|
| |
PIMCO Global StocksPLUS & Income Fund |
|
|
|
| |
|
0.00% |
|
|
|
5.61% |
|
|
|
4,338 |
|
|
|
0 |
|
|
|
|
|
|
| |
| PIMCO Strategic Income Fund, Inc. |
|
|
|
| |
|
0.00% |
|
|
|
4.81% |
|
|
|
9,534 |
|
|
|
0 |
|
|
|
|
|
|
| |
| PIMCO Access Income Fund |
|
|
|
| |
|
0.00% |
|
|
|
7.20% |
|
|
|
35,321 |
|
|
|
0 |
|
|
|
|
|
|
| |
| PIMCO Dynamic Income Fund |
|
|
|
| |
|
0.00% |
|
|
|
6.08% |
|
|
|
326,050 |
|
|
|
0 |
|
|
|
|
|
|
| |
| PIMCO Dynamic Income Opportunities Fund |
|
|
|
| |
|
0.00% |
|
|
|
7.93% |
|
|
|
90,272 |
|
|
|
0 |
|
|
|
|
|
|
| |
| PIMCO Dynamic Income Strategy Fund |
|
|
|
| |
|
0.00% |
|
|
|
7.68% |
|
|
|
44,015 |
|
|
|
14,753 |
|
|
A zero balance may reflect actual amounts rounding to less than one thousand. |
Shareholders are advised to consult their own tax advisor with respect to the tax consequences of their investment in the Trust. In January 2026, you will be advised on IRS Form
1099-DIV
as to the federal tax status of the dividends and distributions received by you in calendar year 2025.
|
|
|
|
|
|
|
|
|
|
|
|
| |
| |
|
|
ANNUAL REPORT |
|
|
| |
|
|
JUNE 30, 2025 |
|
|
171 |
|
|
|
|
| |
Shareholder Meeting Results |
|
| |
|
Annual Shareholder Meeting Results
PCM Fund, Inc., and PIMCO Dynamic Income Opportunities Fund and PIMCO Access Income Fund held their annual meetings of shareholders on April 25, 2025. Shareholders voted as indicated below:
PCM Fund, Inc. — PCM
The Common Shareholders of PCM, voting as a single class, voted as indicated below with respect to the election of David Flattum and the
re-election
of Libby D. Cantrill, Sarah E. Cogan and E. Grace Vandecruze as Directors of PCM.
|
|
|
|
|
|
|
|
|
|
|
|
| |
| |
|
|
|
|
|
|
|
|
|
|
|
|
| |
Election of David Flattum — Class II to serve until the annual meeting held during the 2025-2026 fiscal year |
|
|
|
| |
|
7,705,967 |
|
|
|
774,483 |
|
|
|
|
| |
Re-election of Libby D. Cantrill — Class I to serve until the annual meeting held during the 2027-2028 fiscal year |
|
|
|
| |
|
7,645,647 |
|
|
|
834,802 |
|
|
|
|
| |
Re-election of Sarah E. Cogan — Class I to serve until the annual meeting held during the 2027-2028 fiscal year |
|
|
|
| |
|
7,671,265 |
|
|
|
809,183 |
|
|
|
|
| |
Re-election of E. Grace Vandecruze — Class I to serve until the annual meeting held during the 2027-2028 fiscal year |
|
|
|
| |
|
7,672,453 |
|
|
|
807,995 |
|
The other members of the Board of Directors at the time of the meeting, namely, Mses. Deborah A. DeCotis and Kathleen A. McCartney and Mr. Alan Rappaport continue to serve as Directors of the Fund.
PIMCO Dynamic Income Opportunities Fund — PDO
The Common Shareholders of PDO, voting as a single class, voted as indicated below with respect to the election of David Flattum and the
re-election
of Deborah A. DeCotis as Trustees of PDO.
|
|
|
|
|
|
|
|
|
|
|
|
| |
| |
|
|
|
|
|
|
|
|
|
|
|
|
| |
Election of David Flattum — Class I to serve until the annual meeting held during the 2027-2028 fiscal year |
|
|
|
| |
|
84,611,522 |
|
|
|
4,954,039 |
|
|
|
|
| |
Re-election of Deborah A. DeCotis — Class I to serve until the annual meeting held during the 2027-2028 fiscal year |
|
|
|
| |
|
87,364,446 |
|
|
|
2,201,113 |
|
The other members of the Board of Trustees at the time of the meeting, namely, Mses. Libby D. Cantrill, Sarah E. Cogan, Kathleen A. McCartney and E. Grace Vandecruze and Mr. Alan Rappaport continue to serve as Trustees of the Fund.
PIMCO Access Income Fund — PAXS
The Common Shareholders of PAXS, voting as a single class, voted as indicated below with respect to the election of David Flattum and the
re-election
of Sarah E. Cogan, Kathleen A. McCartney and E. Grace Vandecruze as Trustees of PAXS.
|
|
|
|
|
|
|
|
|
|
|
|
| |
| |
|
|
|
|
|
|
|
|
|
|
|
|
| |
Election of David Flattum — Class I to serve until the annual meeting held during the 2025-2026 fiscal year |
|
|
|
| |
|
26.729,703 |
|
|
|
2,845,392 |
|
|
|
|
| |
Re-election of Sarah E. Cogan — Class III to serve until the annual meeting held during the 2027-2028 fiscal year |
|
|
|
| |
|
29,575,407 |
|
|
|
532,186 |
|
|
|
|
| |
Re-election of Kathleen A. McCartney — Class III to serve until the annual meeting held during the 2027-2028 fiscal year |
|
|
|
| |
|
28,904,795 |
|
|
|
670,301 |
|
|
|
|
| |
Re-election of E. Grace Vandecruze — Class III to serve until the annual meeting held during the 2027-2028 fiscal year |
|
|
|
| |
|
29,440,511 |
|
|
|
667,083 |
|
The other members of the Board of Trustees at the time of the meeting, namely, Mses. Libby D. Cantrill and Deborah A. DeCotis and Mr. Alan Rappaport continue to serve as Trustees of the Fund.
PIMCO Strategic Income Fund, Inc., PIMCO Global StocksPLUS & Income Fund, PIMCO Dynamic Income Fund and PIMCO Dynamic Income Strategy Fund held their annual meetings of shareholders on June 27, 2025.
|
|
|
|
|
|
| |
172 |
|
PIMCO CLOSED-END FUNDS |
|
|
|
|
PIMCO Strategic Income Fund, Inc. — RCS
The Common Shareholders of RCS, voting as a single class, voted as indicated below with respect to the election of David Flattum and the
re-election
of Libby D. Cantrill and Sarah E. Cogan as Directors of RCS.
|
|
|
|
|
|
|
|
|
|
|
|
| |
| |
|
|
|
|
|
|
|
|
|
|
|
|
| |
Election of David Flattum — Class III to serve until the annual meeting held during the 2026-2027 fiscal year |
|
|
|
| |
|
29,958,552 |
|
|
|
1,866,633 |
|
|
|
|
| |
Re-election of Libby D. Cantrill — Class I to serve until the annual meeting held during the 2027-2028 fiscal year |
|
|
|
| |
|
30,385,616 |
|
|
|
1,439,567 |
|
|
|
|
| |
Re-election of Sarah E. Cogan — Class I to serve until the annual meeting held during the 2027-2028 fiscal year |
|
|
|
| |
|
30,402,513 |
|
|
|
1,422,671 |
|
The other members of the Board of Directors at the time of the meeting, namely, Mses. Deborah A. DeCotis Kathleen A. McCartney and E. Grace Vandecruze and Mr. Alan Rappaport continue to serve as Directors of the Fund.
PIMCO Global StocksPLUS & Income Fund — PGP
The Common Shareholders of PGP, voting as a single class, voted as indicated below with respect to the election of Deborah A. DeCotis and David Flattum and
the re-election Libby
D. Cantrill and E. Grace Vandecruze as Trustees of PGP.
|
|
|
|
|
|
|
|
|
|
|
|
| |
| |
|
|
|
|
|
|
|
|
|
|
|
|
| |
| Election of Deborah A. DeCotis — Class II to serve until the annual meeting held during the 2027-2028 fiscal year |
|
|
|
| |
|
7,593,524 |
|
|
|
406,420 |
|
|
|
|
| |
Election of David Flattum — Class I to serve until the annual meeting held during the 2026-2027 fiscal year |
|
|
|
| |
|
7,050,471 |
|
|
|
949,475 |
|
|
|
|
| |
Re-election of Libby D. Cantrill — Class II to serve until the annual meeting held during the 2027-2028 fiscal year |
|
|
|
| |
|
7,600,488 |
|
|
|
399,456 |
|
|
|
|
| |
Re-election of E. Grace Vandecruze — Class II to serve until the annual meeting held during the 2027-2028 fiscal year |
|
|
|
| |
|
7,587,245 |
|
|
|
412,698 |
|
The other members of the Board of Trustees at the time of the meeting, Mses. Sarah E. Cogan and Kathleen A. McCartney and Mr. Alan Rappaport continue to serve as Trustees of the Fund.
PIMCO Dynamic Income Fund — PDI
The Common Shareholders of PDI, voting as a single class, voted as indicated below with respect to the election of David Flattum and the
re-election
of Kathleen A. McCartney and Alan Rappaport as Trustees of PDI.
|
|
|
|
|
|
|
|
|
|
|
|
| |
| |
|
|
|
|
|
|
|
|
|
|
|
|
| |
Election of David Flattum — Class II to serve until the annual meeting held during the 2025-2026 fiscal year |
|
|
|
| |
|
259,378,303 |
|
|
|
9,616,056 |
|
|
|
|
| |
Re-election of Kathleen A. McCartney — Class I to serve until the annual meeting held during the 2027-2028 fiscal year |
|
|
|
| |
|
261,234,438 |
|
|
|
7,759,926 |
|
|
|
|
| |
Re-election of Alan Rappaport — Class I to serve until the annual meeting held during the 2027-2028 fiscal year |
|
|
|
| |
|
261,430,768 |
|
|
|
7,563,588 |
|
The other members of the Board of Trustees at the time of the meeting, Mses. Libby D. Cantrill, Sarah E. Cogan, Deborah A. DeCotis and E. Grace Vandecruze continue to serve as Trustees of the Fund.
PIMCO Dynamic Income Strategy Fund — PDX
The Common Shareholders of PDX, voting as a single class, voted as indicated below with respect to the election of Deborah A. DeCotis and David Flattum and the
re-election
of Alan Rappaport and E. Grace Vandecruze as Trustees of PDX.
|
|
|
|
|
|
|
|
|
|
|
|
| |
| |
|
|
|
|
|
|
|
|
|
|
|
|
| |
| Election of Deborah A. DeCotis — Class III to serve until the annual meeting held during the 2027-2028 fiscal year |
|
|
|
| |
|
38,064,731 |
|
|
|
823,530 |
|
|
|
|
| |
Election of David Flattum — Class II to serve until the annual meeting held during the 2026-2027 fiscal year |
|
|
|
| |
|
37,916,292 |
|
|
|
971,968 |
|
|
|
|
| |
Re-election of Alan Rappaport — Class III to serve until the annual meeting held during the 2027-2028 fiscal year |
|
|
|
| |
|
38,070,165 |
|
|
|
818,096 |
|
|
|
|
| |
Re-election of E. Grace Vandecruze — Class III to serve until the annual meeting held during the 2027-2028 fiscal year |
|
|
|
| |
|
37,499,573 |
|
|
|
1,388,689 |
|
The other members of the Board of Trustees at the time of the meeting, namely, Mses. Libby D. Cantrill, Sarah E. Cogan and Kathleen A. McCartney continue to serve as Trustees of the Fund.
|
|
|
|
|
|
|
|
|
|
|
|
| |
| |
|
|
ANNUAL REPORT |
|
|
| |
|
|
JUNE 30, 2025 |
|
|
173 |
|
|
|
|
| |
Changes to Board of Trustees |
|
| |
(Unaudited) |
Effective December 1, 2024, Mr. David Fisher retired from his position as Trustee of the Funds.
Effective December 1, 2024, the Board of Trustees appointed Mr. David Flattum as a Class III Trustee of PIMCO Strategic Income Fund, Inc., a Class I Trustee of PIMCO Global StocksPLUS
& Income Fund, PIMCO Dynamic Income Opportunities Fund and PIMCO Access Income Fund, and a Class II Trustee of PIMCO Dynamic Income Fund and PCM Fund, Inc.
Effective February 20, 2025, Ms. DeCotis, who was previously a Class II Trustee of PIMCO Dynamic Income Strategy Fund and a Class III Trustee of PIMCO Global StocksPLUS
& Income Fund, became a Class III Trustee of PIMCO Dynamic Income Strategy Fund and a Class II Trustee of PIMCO Global StocksPLUS
& Income Fund.
|
|
|
|
|
|
| |
174 |
|
PIMCO CLOSED-END FUNDS |
|
|
|
|
|
|
|
|
| |
Dividend Reinvestment Plan |
|
| |
(Unaudited) |
Each Fund has adopted a Dividend Reinvestment Plan (the “Plan”) which allows common shareholders to reinvest Fund distributions in additional common shares of the Fund. American Stock Transfer & Trust Company, LLC (the “Plan Agent”) serves as agent for common shareholders in administering the Plan. It is important to note that participation in the Plan and automatic reinvestment of Fund distributions does not ensure a profit, nor does it protect against losses in a declining market.
Automatic enrollment/voluntary participation
Under the Plan, common shareholders whose shares are registered with the Plan Agent (“registered shareholders”) are automatically enrolled as participants in the Plan and will have all Fund distributions of income, capital gains and returns of capital (together, “distributions”) reinvested by the Plan Agent in additional common shares of a Fund, unless the shareholder elects to receive cash. Registered shareholders who elect not to participate in the Plan will receive all distributions in cash paid by check and mailed directly to the shareholder of record (or if the shares are held in street or other nominee name, to the nominee) by the Plan Agent. Participation in the Plan is voluntary. Participants may terminate or resume their enrollment in the Plan at any time without penalty by notifying the Plan Agent online at www.astfinancial.com, by calling (844) 33-PIMCO, by writing to the Plan Agent, American Stock Transfer & Trust Company, LLC, at P.O. Box 922, Wall Street Station, New York, NY 10269-0560, or, as applicable, by completing and returning the transaction form attached to a Plan statement. A proper notification will be effective immediately and apply to each Fund’s next distribution if received by the Plan Agent at least three (3) days prior to the record date for the distribution; otherwise, a notification will be effective shortly following the Fund’s next distribution and will apply to the Fund’s next succeeding distribution thereafter. If you withdraw from the Plan and so request, the Plan Agent will arrange for the sale of your shares and send you the proceeds, minus a transaction fee and brokerage commissions.
How shares are purchased under the Plan
For each Fund distribution, the Plan Agent will acquire common shares for participants either (i) through receipt of newly issued common shares from each Fund (“newly issued shares”) or (ii) by purchasing common shares of the Fund on the open market (“open market purchases”). If, on a distribution payment date, the net asset value per common share of a Fund (“NAV”) is equal to or less than the market price per common share plus estimated brokerage commissions (often referred to as a “market premium”), the Plan Agent will invest the distribution amount on behalf of participants in newly issued shares at a price equal to the greater of (i) NAV or (ii) 95% of the market price per common share on the payment date. If the NAV is greater than the
market price per common shares plus estimated brokerage commissions (often referred to as a “market discount”) on a distribution payment date, the Plan agent will instead attempt to invest the distribution amount through open market purchases. If the Plan Agent is unable to invest the full distribution amount in open market purchases, or if the market discount shifts to a market premium during the purchase period, the Plan Agent will invest any un-invested portion of the distribution in newly issued shares at a price equal to the greater of (i) NAV or (ii) 95% of the market price per share as of the last business day immediately prior to the purchase date (which, in either case, may be a price greater or lesser than the NAV per common shares on the distribution payment date). No interest will be paid on distributions awaiting reinvestment. Under the Plan, the market price of common shares on a particular date is the last sales price on the exchange where the shares are listed on that date or, if there is no sale on the exchange on that date, the mean between the closing bid and asked quotations for the shares on the exchange on that date.
The NAV per common share on a particular date is the amount calculated on that date (normally at the close of regular trading on the New York Stock Exchange) in accordance with each Fund’s then current policies.
Fees and expenses
No brokerage charges are imposed on reinvestments in newly issued shares under the Plan. However, all participants will pay a pro rata share of brokerage commissions incurred by the Plan Agent when it makes open market purchases. There are currently no direct service charges imposed on participants in the Plan, although each Fund reserves the right to amend the Plan to include such charges. The Plan Agent imposes a transaction fee (in addition to brokerage commissions that are incurred) if it arranges for the sale of your common shares held under the Plan.
Shares held through nominees
In the case of a registered shareholder such as a broker, bank or other nominee (together, a “nominee”) that holds common shares for others who are the beneficial owners, the Plan Agent will administer the Plan on the basis of the number of common shares certified by the nominee/record shareholder as representing the total amount registered in such shareholder’s name and held for the account of beneficial owners who are to participate in the Plan. If your common shares are held through a nominee and are not registered with the Plan Agent, neither you nor the nominee will be participants in or have distributions reinvested under the Plan. If you are a beneficial owner of common shares and wish to participate in the Plan, and your nominee is unable or unwilling to become a registered shareholder and a Plan participant on your behalf, you may request that your nominee arrange to have all or a portion of your shares re-registered with the Plan Agent in your
|
|
|
|
|
|
|
|
|
|
|
|
| |
| |
|
|
ANNUAL REPORT |
|
|
| |
|
|
JUNE 30, 2025 |
|
|
175 |
|
|
|
|
| |
Dividend Reinvestment Plan |
|
|
|
(Unaudited) |
name so that you may be enrolled as a participant in the Plan. Please contact your nominee for details or for other possible alternatives. Participants whose shares are registered with the Plan Agent in the name of one nominee firm may not be able to transfer the shares to another firm and continue to participate in the Plan.
Tax consequences
Automatically reinvested dividends and distributions are taxed in the same manner as cash dividends and distributions — i.e., automatic reinvestment in additional shares does not relieve shareholders of, or defer the need to pay, any income tax that may be payable (or that is required to be withheld) on Fund dividends and distributions. The Funds and the Plan Agent reserve the right to amend or terminate the Plan. Additional information about the Plan, as well as a copy of the full Plan itself, may be obtained from the Plan Agent, Equiniti Trust Company, LLC, at P.O. Box 922, Wall Street Station, New York, NY 10269-0560; telephone number: (844) 33-PIMCO; www.equiniti.com/us/ast-access
|
|
|
|
|
|
| |
176 |
|
PIMCO CLOSED-END FUNDS |
|
|
|
|
|
|
|
|
| |
Additional Information Regarding the Funds |
|
| |
(Unaudited) |
CHANGES OCCURRING SINCE THE PRIOR ANNUAL REPORT
Unresolved Staff Comments
None. (The Funds do not believe that there are any material unresolved written comments received 180 days or more before June 30, 2025 from the Staff of the SEC regarding any of the Funds’ periodic or current reports under the Securities Exchange Act or the Act, or their registration statements.)
The aggregate amounts of brokerage commissions paid by the Funds during the fiscal year ended June 30, 2025 were as follows:
|
|
|
|
|
|
|
|
|
|
|
|
| |
|
|
|
|
|
|
|
|
Commissions Paid
to Affiliated Brokers |
|
|
|
|
| |
PCM Fund, Inc. |
|
|
|
| |
$ |
5 |
|
|
|
0 |
|
|
|
|
| |
PIMCO Global StocksPLUS & Income Fund |
|
|
|
| |
$ |
11,844 |
|
|
|
0 |
|
|
|
|
| |
PIMCO Strategic Income Fund, Inc. |
|
|
|
| |
$ |
228 |
|
|
|
0 |
|
|
|
|
| |
PIMCO Dynamic Income Fund |
|
|
|
| |
$ |
2,103 |
|
|
|
0 |
|
|
|
|
| |
PIMCO Dynamic Income Opportunities Fund |
|
|
|
| |
$ |
606 |
|
|
|
0 |
|
|
|
|
| |
PIMCO Access Income Fund |
|
|
|
| |
$ |
279 |
|
|
|
0 |
|
|
|
|
| |
PIMCO Dynamic Income Strategy Fund |
|
|
|
| |
$ |
127,891 |
|
|
|
0 |
|
|
|
|
|
|
|
|
|
|
|
|
|
| |
| |
|
|
ANNUAL REPORT |
|
|
| |
|
|
JUNE 30, 2025 |
|
|
177 |
|
|
|
|
| |
Principal Investment Strategies |
|
| |
|
The Funds’ Investment Objectives and Strategies
Unless otherwise noted, the information in this section is as of June 30, 2025.
The term “invest” includes both direct investing and indirect investing and the term “investments” includes both direct investments and indirect investments. For example, a Fund may invest indirectly by investing in derivatives or through its wholly-owned subsidiaries (“Subsidiaries”), if applicable. The allocation of a Fund’s assets to a Subsidiary, if applicable, will vary over time and will likely not include all of the different types of investments described herein at any given time.
The Fund’s primary investment objective is to achieve high current income. Capital gain from the disposition of investments is a secondary objective of the Fund.
The Fund seeks to achieve its investment objectives by utilizing a dynamic asset allocation strategy among multiple fixed income sectors in the global credit markets, including corporate debt (including, among other things, fixed-, variable- and floating-rate bonds, loans (including, but not limited to, bank and/or other syndicated loans and
non-syndicated
(private direct) loans), convertible securities and stressed debt securities issued by U.S. or foreign
(non-U.S.)
corporations or other business entities, including emerging market issuers), mortgage-related and other asset-backed securities, government and sovereign debt, taxable municipal bonds and other fixed-, variable- and floating-rate income-producing securities of U.S. and foreign issuers, including emerging market issuers. The Fund may invest in investment grade debt securities and below investment grade debt securities (commonly referred to as “high yield” securities or “junk bonds”), including securities of stressed, distressed and defaulted issuers. The Fund cannot assure you that it will achieve its investment objectives or that the Fund’s investment program will be successful, and you could lose all of your investment in the Fund.
Portfolio Management Strategies
Dynamic Allocation Strategy.
In managing the Fund, the Fund’s investment manager, Pacific Investment Management Company LLC (“PIMCO” or the “Investment Manager”), employs an active approach to allocation among multiple fixed income sectors based on, among other things, market conditions, valuation assessments, economic outlook, credit market trends and other economic factors. With PIMCO’s macroeconomic analysis as the basis for
top-down
investment decisions, including geographic and credit sector emphasis, the Fund focuses on seeking income generating investment ideas across multiple fixed income sectors, with an emphasis on seeking opportunities in developed and emerging global credit markets.
PIMCO
may choose to focus on particular countries/regions, asset classes, industries and sectors to the exclusion of others at any time and from time to time based on market conditions and other factors. The relative value assessment within fixed income sectors draws on PIMCO’s regional and sector specialist insights. As a matter of fundamental policy, the Fund will normally invest at least 25% of its total assets (i.e., concentrate) in privately-issued (commonly known as
“non-agency”)
mortgage-related securities. The Fund will observe other investment guidelines as summarized below.
Investment Selection Strategies.
Once the Fund’s
top-down,
portfolio positioning decisions have been made as described above, PIMCO selects particular investments for the Fund by employing a
bottom-up,
disciplined credit approach which is driven by fundamental, independent research within each sector/asset class represented in the Fund, with a focus on seeking to identify securities and other instruments with solid and/or improving fundamentals.
PIMCO utilizes strategies that focus on credit quality analysis, duration management and other risk management techniques. PIMCO attempts to identify, through fundamental research driven by independent credit analysis and proprietary analytical tools, debt obligations and other income-producing securities that provide current income and/or opportunities for capital appreciation based on its analysis of the issuer’s credit characteristics and the position of the security in the issuer’s capital structure.
Consideration of yield is only one component of the portfolio managers’ approach in managing the Fund. PIMCO also attempts to identify investments that may appreciate in value based on PIMCO’s assessment of the issuer’s credit characteristics, forecast for interest rates and outlook for particular countries/regions, currencies, industries, sectors and the global economy and bond markets generally.
The Fund may invest without limitation in debt instruments that are, at the time of purchase, rated below investment grade (below Baa3 by Moody’s Ratings (“Moody’s”) or below
BBB-
by either S&P Global Ratings (“S&P”) or Fitch Ratings, Inc. (“Fitch”)), or unrated but determined by PIMCO to be of comparable quality to securities so rated, and may invest without limit in securities of any rating. Debt instruments of below investment grade quality are regarded as having predominantly speculative characteristics with respect to capacity to pay interest and to repay principal, and are commonly referred to as “high yield” securities or “junk bonds”. Debt instruments in the lowest investment grade category also may be considered to possess some speculative characteristics. The Fund may, for hedging, investing or leveraging purposes, make use of credit default swaps (which includes buying and/or selling credit default swaps), which are contracts whereby one party makes periodic
|
|
|
|
|
|
| |
178 |
|
PIMCO CLOSED-END FUNDS |
|
|
|
|
payments to a counterparty in exchange for the right to receive from the counterparty a payment equal to the par (or other agreed-upon) value of a referenced debt obligation in the event of a default or other credit event by the issuer of the debt obligation.
Independent Credit Analysis.
PIMCO relies primarily on its own analysis of the credit quality and risks associated with individual debt instruments considered for the Fund, rather than relying exclusively on rating agencies or third-party research. The Fund’s portfolio managers utilize this information in an attempt to manage credit risk and identify issuers, industries or sectors that are undervalued or that offer attractive yields relative to PIMCO’s assessment of their credit characteristics. This aspect of PIMCO’s capabilities will be particularly important to the extent that the Fund invests in high yield securities and in securities of emerging market issuers.
The Fund normally invests in a portfolio of debt obligations and other income-producing securities of any type and credit quality with varying maturities, including, among other investments, mortgage-related and other asset-backed securities, as well as related derivative instruments. The Fund expects to invest in mortgage-related and other asset-backed securities issued or sponsored by various public and private entities, which may include securities issued or guaranteed by the U.S. Government, its agencies or instrumentalities (“U.S. Government securities”), residential and commercial mortgage-backed securities (some of which may be U.S. Government securities), privately-issued mortgage-related securities and any other type of mortgage-related or asset-backed securities issued on a public or private basis, including collateralized mortgage obligations (“CMOs”), adjustable rate mortgage-backed securities, stripped mortgage-backed securities, CMO residuals and mortgage pass-through securities. The Fund may invest in various levels of the capital structure of an issuer of mortgage-backed or asset-backed securities (including collateralized bond obligations, collateralized loan obligations (“CLOs”) and other collateralized debt obligations), including the equity or “first loss” tranche. The Fund may invest in unsecured loans and subordinated or mezzanine obligations, including second and lower lien loans and the mezzanine and equity (or “first loss”) tranches of CLO issues. For the avoidance of doubt, equity or “first loss” tranches of mortgage-backed or asset-backed securities do not constitute equity interests for purposes of the Fund’s 20% limit on investments in equity interests described below. The Fund may also invest, as a third-party purchaser, in risk retention tranches of commercial mortgage-backed securities or other eligible securitizations, which are eligible residual interests typically held by the sponsors of such securitizations pursuant to the final rules implementing the credit risk retention requirements of Section 941 of the Dodd-Frank Act.
The Fund’s portfolio of income-producing securities may also include, without limitation, bonds, debentures, notes, and other debt securities of U.S. and foreign
(non-U.S.)
corporate and other issuers, including commercial paper; asset-backed securities issued on a public or private basis; U.S. Government securities; obligations of foreign governments or their
sub-divisions,
agencies and government sponsored enterprises and obligations of international agencies and supranational entities; municipal securities and other debt securities issued by states or local governments and their agencies, authorities and other government-sponsored enterprises, including taxable municipal securities (such as Build America Bonds);
securities;
step-ups;
zero-coupon
bonds; covenant-lite obligations; inflation-indexed bonds issued by both governments and corporations; structured notes, including hybrid or indexed securities; insurance-linked investments, catastrophe bonds and other event-linked bonds; credit-linked notes; credit-linked trust instruments; structured credit products; loans (including, among others, and without limitation as to a loan’s level of seniority within a capital structure, senior loans, subordinated loans, mezzanine loans, delayed draw and delayed funding loans, revolving credit facilities and loan participations and assignments); preferred securities; convertible debt securities (i.e., debt securities that may be converted at either a stated price or stated rate into underlying shares of common stock), including synthetic convertible debt securities (i.e., instruments created through a combination of separate securities that possess the two principal characteristics of a traditional convertible security, such as an income-producing security and the right to acquire an equity security and contingent convertible securities); collateralized bond obligations, collateralized loan obligations and other collateralized debt obligations; bank capital securities; and bank certificates of deposit, fixed time deposits and bankers’ acceptances. The rate of interest on an income-producing security may be fixed, floating or variable, and may move in the opposite direction to interest rates generally or the interest rate on another security or index (i.e., inverse floaters). For tax or other structuring reasons, the Fund may purchase a loan or debt investment structured as an equity interest (e.g., a joint venture interest). At any given time and from time to time substantially all of the Fund’s portfolio may consist of below investment grade securities. The Fund may invest in debt securities of stressed issuers and in debtor-in-possession financing.
The Fund may invest without limitation in securities of U.S. issuers and without limitation in securities of foreign
(non-U.S.)
issuers, including in securities of issuers economically tied to emerging market countries, securities traded principally outside of the United States, and securities denominated in currencies other than the U.S. dollar. The Fund may also invest directly in foreign currencies, including local emerging market currencies, including local emerging market currencies.
|
|
|
|
|
|
|
|
|
|
|
|
| |
| |
|
|
ANNUAL REPORT |
|
|
| |
|
|
JUNE 30, 2025 |
|
|
179 |
|
|
|
|
| |
Principal Investment Strategies |
|
|
|
|
As a matter of fundamental policy, the Fund normally invests at least 25% of its total assets (i.e., concentrates) in privately-issued (commonly known as
“non-agency”)
mortgage-related securities.
The Fund may, but is not required to, utilize various derivative strategies (both long and short positions) involving the purchase or sale of futures and forward contracts (including foreign currency exchange contracts), call and put options, credit default swaps, total return swaps, basis swaps and other swap agreements and other derivative instruments for investment purposes, leveraging purposes or in an attempt to hedge against market, credit, interest rate, currency and other risks in the portfolio. The Fund may use various derivatives strategies to manage (increase or decrease) the dollar-weighted average effective duration of the Fund’s portfolio. The Fund may purchase and sell securities on a when-issued, delayed delivery or forward commitment basis and may engage in short sales to the extent that short positions do not represent more than 25% of the Fund’s total assets.
The Fund may invest up to 20% of its total assets in common stocks and other equity securities from time to time, including those it has received through the conversion of a convertible security held by the Fund or in connection with the restructuring of a debt security. The Fund may invest in securities that have not been registered for public sale in the U.S. or relevant
non-U.S.
jurisdiction, including without limitation securities eligible for purchase and sale pursuant to Rule 144A under the Securities Act of 1933, as amended (the “Securities Act”), or relevant provisions of applicable
non-U.S.
law, and other securities issued in private placements. The Fund may invest in securities of other open- or
closed-end
investment companies (including those advised by PIMCO), including, without limitation, exchange-traded funds, to the extent that such investments are consistent with the Fund’s investment objectives, strategies and policies and permissible under the 1940 Act. The Fund may invest in other investment companies to gain broad market or sector exposure or for cash management purposes, including during periods when it has large amounts of uninvested cash or when PIMCO believes share prices of other investment companies offer attractive values. The Fund may invest in certain money market funds and/or short-term bond funds (“Central Funds”), to the extent permitted by the 1940 Act, the rules thereunder or exemptive relief therefrom. The Central Funds are registered investment companies created for use by certain registered investment companies advised by PIMCO in connection with their cash management activities. The Fund treats its investments in other investment companies that invest primarily in types of securities in which the Fund may invest directly as investments in such types of securities for purposes of the Fund’s investment policies (e.g., the Fund’s investment in an investment company that invests primarily in debt securities will be treated by the Fund as an investment in a debt
security). As a shareholder in an investment company, the Fund would bear its ratable share of that investment company’s expenses and would remain subject to payment of the Fund’s management fees and other expenses with respect to assets so invested. Common Shareholders would therefore be subject to duplicative expenses to the extent the Fund invests in other investment companies. The securities of other investment companies may be leveraged, in which case the net asset value (“NAV”) and/or market value of the investment company’s shares will be more volatile than unleveraged investments. The Fund may invest in real estate investment trusts (“REITs”). The Fund may invest in securities of companies with any market capitalization, including small and medium capitalizations.
The Fund may invest without limitation in illiquid investments (i.e., investments that the Fund reasonably expects cannot be sold or disposed of in current market conditions in seven calendar days or less without the sale or disposition significantly changing the market value of the securities).
The Fund may enter into repurchase agreements, in which the Fund purchases a security from a bank or broker-dealer and the bank or broker-dealer agrees to repurchase the security at the Fund’s cost plus interest within a specified time.
For the purpose of achieving income, the Fund may lend its portfolio securities to brokers, dealers or other financial institutions provided a number of conditions are satisfied, including that the loan is fully collateralized.
The length of time the Fund has held a particular security is not generally a consideration in investment decisions. A change in the securities held by the Fund is known as “portfolio turnover.” The Fund may engage in frequent and active trading of portfolio securities to achieve its investment objectives, particularly during periods of volatile market movements. Frequent and active trading of the Fund’s portfolio holdings may cause adverse tax consequences for shareholders due to an increase in short-term capital gains and may also adversely impact the Fund’s
after-tax
returns.
There have been no significant changes in the Fund’s portfolio turnover rates over the last two fiscal years, and no significant change to the portfolio turnover rates of the Fund described in the Financial Highlights can currently be predicted.
The Fund has received exemptive relief from the SEC that, to the extent the Fund relies on such relief, permits it to (among other things)
co-invest
with certain other persons, including certain affiliates of the Investment Manager and certain public or private funds managed by the Investment Manager and its affiliates, subject to certain terms and conditions. The exemptive relief from the SEC with respect to
co-investments
imposes extensive conditions on any
co-investments
made in reliance on such relief.
|
|
|
|
|
|
| |
180 |
|
PIMCO CLOSED-END FUNDS |
|
|
|
|
Temporary Defensive Investments.
The Fund may make short-term investments when attempting to respond to adverse market, economic, political, or other conditions, as determined by PIMCO. Upon PIMCO’s recommendation, for temporary defensive purposes or in order to keep its cash fully invested, the Fund may deviate from its investment strategy by investing some or all of its total assets in investments such as high grade debt securities, including high quality, short-term debt securities, and cash and cash equivalents. The Fund may not achieve its investment objectives when it does so.
The Fund may obtain leverage through reverse repurchase agreements, dollar rolls/buybacks or borrowings, such as through bank loans or commercial paper or other credit facilities. The Fund may also determine to issue preferred shares or other types of senior securities to add leverage to its portfolio. The Fund’s Board of Trustees may authorize the issuance of preferred shares without the approval of Common Shareholders. If the Fund issues preferred shares in the future, all costs and expenses relating to the issuance and ongoing maintenance of the preferred shares will be borne by the Common Shareholders, and these costs and expenses may be significant. Leveraging transactions pursued by the Fund may increase its duration and sensitivity to interest rate movements. Leveraging is a speculative technique and there are special risks and costs involved. There can be no assurance that a leveraging strategy will be used or that it will be successful during any period in which it is employed.
The Fund may also enter into transactions other than those noted above that may give rise to a form of leverage including, among others, futures and forward contracts (including foreign currency exchange contracts), total return swaps and other derivative transactions, loans of portfolio securities, short sales, when-issued, delayed delivery and forward commitment transactions, and selling credit default swaps.
The Fund may also determine to issue preferred shares or other types of senior securities to add leverage to its portfolio.
The Fund utilizes certain kinds of leverage, such as reverse repurchase agreements and selling credit default swaps, opportunistically and may choose to increase or decrease, or eliminate entirely, its use of such leverage over time and from time to time based on PIMCO’s assessment of the yield curve environment, interest rate trends, market conditions and other factors.
The Fund also may borrow money in order to repurchase its shares or as a temporary measure for extraordinary or emergency purposes, including for the payment of dividends or the settlement of securities transactions which otherwise might require untimely dispositions of portfolio securities held by the Fund.
PIMCO Global StocksPLUS
& Income Fund (“PGP”)
The Fund’s investment objective is to seek total return comprised of current income, current gains and long-term capital appreciation.
The portfolio managers build a global equity and debt portfolio by investing, under normal circumstances, at least 80% of the Fund’s net assets (plus any borrowings for investment purposes) in a combination of securities and instruments that provide exposure to stocks and/or produce income (the “80% policy”). The 80% policy is not considered to be fundamental by the Fund and can be changed without a vote of the Fund’s shareholders. The 80% policy may be changed by the Fund’s Board of Trustees following the provision of 60 days’ prior written notice to the Fund’s shareholders.
The Fund’s stock exposure (including for purposes of the 80% policy) may be obtained through stock holdings and/or through index and other derivative instruments that have economic characteristics similar to U.S. and
non-U.S.
stocks. Exposure to income-producing instruments may be obtained through the use of fixed income and other derivative instruments. The Fund cannot assure you that it will achieve its investment objective or that the Fund’s investment program will be successful, and you could lose all of your investment in the Fund.
Asset Allocation and Periodic Rebalancing
The Fund’s equity index exposure generally is expected to equal 100% of its net assets (generally approximately 50% U.S. and 50%
non-U.S.).
The Fund’s equity index exposure will be rebalanced on a periodic basis (so that the U.S. and
non-U.S.
equity index exposure each will represent approximately 50% at the time of rebalance). It is anticipated that each periodic rebalancing will coincide with the settlement of relevant derivatives. These periodic rebalancings may result in additional transaction costs for the Fund and may increase the amount of capital gains (including short-term capital gains) realized by the Fund on which shareholders pay tax. Although the portfolio will be rebalanced periodically, it is expected that the relative percentage of the Fund’s equity derivatives exposure represented by U.S. and
non-U.S.
equity index exposure will vary during interim periods in relation to market fluctuations and other factors. Therefore, the Fund’s assets attributable to U.S. and
non-U.S.
equity exposure may be materially higher or lower than the initial 50%/50% allocation described above, and the risk/return profile of the Fund (taken as a whole) will vary accordingly.
Portfolio Management Strategies
Equity Derivatives Strategies.
The Fund generally expects to gain substantially all of its equity index exposure by investing in equity index derivatives based on the S&P 500 Index (i.e., the U.S. equity
|
|
|
|
|
|
|
|
|
|
|
|
| |
| |
|
|
ANNUAL REPORT |
|
|
| |
|
|
JUNE 30, 2025 |
|
|
181 |
|
|
|
|
| |
Principal Investment Strategies |
|
|
|
|
exposure) and the MSCI EAFE Index (i.e., the
non-U.S.
equity exposure). In the case of equity index swaps and futures contracts, the Fund seeks to receive a return that approximates total return (price appreciation or depreciation plus any dividends) of the relevant index while bearing implicit or explicit interest and transactional costs, including certain tax withholdings, if applicable. Any increase in return attributable to dividends will not be eligible for treatment to holders of the Fund’s common shares of beneficial interest as “qualified dividend income” and the Fund will not be able to recover any withholding taxes on foreign dividends. The Fund also may invest directly in common stocks, other equity instruments and other types of derivative instruments, such as options contracts and options on futures contracts, to gain equity exposure. In implementing the Fund’s derivatives strategies, PIMCO may use a variety of techniques designed to minimize transaction costs and to provide greater investment flexibility, such as utilizing multiple derivative counterparties, negotiating the terms of derivative instruments in which the Fund invests and analyzing the costs associated with different derivative instruments. The Fund is neither sponsored by nor affiliated with either index.
The Fund may hedge the foreign currency risk associated with its exposure to
non-U.S.
equities depending upon market conditions and other factors. The Fund reserves the flexibility to change its U.S. and
non-U.S.
benchmark indexes and related derivatives strategies.
Global Debt Securities Selection / Dynamic Allocation Strategy.
The Fund’s actively managed collateral portfolio (the “Debt Portfolio”) will back the Fund’s equity index positions and will consist of income-producing debt securities having varying maturities and debt-related derivatives securities, including but not limited to interest rate swaps (including swaps that are paired) and other interest rate derivatives. In managing the Debt Portfolio, PIMCO employs an active approach to allocation among multiple fixed income sectors based on, among other things, market conditions, valuation assessments, economic outlook, credit market trends and other economic factors. With PIMCO’s macroeconomic analysis as the basis for
top-down
investment decisions, including geographic and credit sector emphasis, PIMCO manages the Debt Portfolio with a focus on seeking income generating investment ideas across multiple fixed income sectors, with an emphasis on seeking opportunities in developed and emerging global credit markets. PIMCO may choose to focus on particular countries/regions, asset classes, industries and sectors to the exclusion of others at any time and from time to time based on market conditions and other factors. The relative value assessment within fixed income sectors draws on PIMCO’s regional and sector specialist insights.
Fund Current Distribution Strategies.
The Fund’s monthly distributions are expected to include, among other possible sources,
interest income from the Debt Portfolio and payments and premiums (characterized as capital for financial accounting purposes and as ordinary income for tax purposes) generated by certain types of interest rate derivatives. Strategies involving interest rate derivatives (including swaps that are paired) may attempt to capitalize on differences between short-term and long-term interest rates as part of the Fund’s duration and yield curve active management strategies. For instance, in the event that long-term interest rates are higher than short-term interest rates, the Fund may elect to pay a floating short-term interest rate and to receive a long-term fixed interest rate for a stipulated period of time, thereby generating payments as a function of the difference between current short-term interest rates and long-term interest rates, so long as the floating short-term interest rate (which may rise) is lower than the fixed long-term interest rate.
The Fund may enter into opposite sides of multiple interest rate swaps or other derivatives with respect to the same underlying reference instrument (e.g., a
10-year
U.S. treasury) that have different effective dates with respect to interest accrual time periods also for the principal purpose of generating distributable gains (characterized as ordinary income for tax purposes) that are not part of the Fund’s duration or yield curve management strategies. In such a “paired swap transaction”, the Fund would generally enter into one or more interest rate swap agreements whereby the Fund agrees to make regular payments starting at the time the Fund enters into the agreements equal to a floating interest rate in return for payments equal to a fixed interest rate (the “initial leg”). The Fund would also enter into one or more interest rate swap agreements on the same underlying instrument, but take the opposite position (i.e., in this example, the Fund would make regular payments equal to a fixed interest rate in return for receiving payments equal to a floating interest rate) with respect to a contract whereby the payment obligations do not commence until a date following the commencement of the initial leg (the “forward leg”).
The Fund may engage in investment strategies, including those investment strategies that employ the use of paired swaps transactions, the use of interest rate swaps to seek to capitalize on differences between short-term and long-term interest rates and other derivatives transactions, to, among other things, seek to generate current, distributable income, even if such strategies could potentially result in declines in the Fund’s NAV. The Fund’s income and gain-generating strategies, including certain derivatives strategies, may seek to generate current income and gains taxable as ordinary income sufficient to support monthly distributions even in situations when the Fund has experienced a decline in net assets due to, for example, adverse changes in the broad U.S. or
non-U.S.
equity markets or the Fund’s debt investments, or arising from its use of derivatives. For instance, a significant portion of the Fund’s monthly distributions may
|
|
|
|
|
|
| |
182 |
|
PIMCO CLOSED-END FUNDS |
|
|
|
|
be sourced from paired swap transactions utilized to produce current distributable ordinary income for tax purposes on the initial leg, with a substantial possibility that the Fund will later realize a corresponding capital loss and potential decline in its NAV with respect to the forward leg (to the extent there are not corresponding offsetting capital gains being generated from other sources). Because some or all of these transactions may generate capital losses without corresponding offsetting capital gains, portions of the Fund’s distributions recognized as ordinary income for tax purposes (such as from paired swap transactions) may be economically similar to a taxable return of capital when considered together with such capital losses.
The Fund’s index option strategy, to the extent utilized, seeks to generate payments and premiums from writing options that may offset some or all of the capital losses incurred as a result of paired swaps transactions. However, the Fund may use paired swap transactions to support monthly distributions where the index option strategy does not produce an equivalent amount of offsetting gains, including without limitation when such strategy is not being used to a significant extent. In addition, gains (if any) generated from the index option strategy may be offset by the Fund’s realized capital losses, including any available capital loss carryforwards.
The Fund generally will not include in its monthly distributions any gain that is derived from gains that are characterized as long-term capital gain for tax purposes (and is limited in its ability to do so by the 1940 Act). The notional exposure of the interest rate derivatives in the Debt Portfolio may vary widely as a function of market conditions, including differences between short-term and longer-term interest rates and the Fund’s current investment strategies. (The notional amount of a derivative is the hypothetical underlying quantity upon which interest rate or other payment obligations are computed.) While the yield curve (a graph of bond yields available at a given moment in time) generally slopes upward (indicating that long-term interest rates are higher than short-term interest rates), there can be no assurance that this always will be the case and has not always recently been the case, and it is anticipated that the slope of the yield curve will vary to a significant degree across different market environments. In market environments in which the differences between short-term, intermediate-term and long-term interest rates are smaller than is typically the case (a flatter yield curve environment), the Fund may increase the notional exposure of its interest rate derivative positions. In certain market conditions, it is anticipated that the notional exposure of interest rate derivatives in the Debt Portfolio could be a multiple of the Fund’s total net assets. The Fund is required to identify any portion of its monthly distributions that are characterized as gains (for financial accounting purposes) or that otherwise are derived from any sources other than net income. The Fund cannot assure you as to
any level of distributions that will be treated as ordinary income, cannot assure you as to any level of capital gains distributions and cannot assure you as to any ratio of monthly distributions to capital gain distributions.
Index Option Strategy.
In implementing the Fund’s index option strategy, PIMCO may sell (“write”) call options on the S&P 500 Index and on futures on the S&P 500 Index. PIMCO does not intend to write index call options when the underlying notional value of the index call option positions exceeds the Fund’s net U.S. equity exposure —generally approximately 50% of the Fund’s net assets (i.e., the Fund does not intend to write “naked” positions) at each rebalance. The index option writing strategy is designed to produce gains from index option premiums.
The Fund expects that it normally will write call options whose terms to expiration range from one month to one year, although the Fund may write call options with both longer and shorter terms. PIMCO ordinarily will not write call options on individual equity securities but may write call options on exchange-traded funds and other similar instruments designed to correlate with the performance of the underlying equity index. PIMCO will actively manage the Fund’s index option positions using quantitative and statistical analysis that focuses on relative value and a weighing of risk versus return.
The Fund generally will write equity index call options that are
or
at the time of sale. The Fund generally will write
equity index call options with strike prices no more than 10% higher than the cash value of the index at the time of sale. The Fund reserves the flexibility to write equity index call options that are more or less
as it deems appropriate depending upon market conditions and other factors. The Fund also reserves the flexibility to write equity index call options that are
In addition to writing call options, the Fund also may purchase put options on the S&P 500 Index and on futures on the S&P 500 Index in an effort to protect against significant market declines affecting the U.S. equity markets as measured by the S&P 500 Index. However, because the Fund generally will purchase put options that are
the Fund will not be fully covered against any market decline.
In addition to listed options, the Fund may write and purchase
over-the
counter options, which are not originated and standardized by the Office of the Comptroller of the Currency or listed and traded on an options exchange (such as the Chicago Board Options Exchange or the International Securities Exchange).
Credit Quality.
The Fund may invest without limitation in debt instruments that are, at the time of purchase, rated below investment
|
|
|
|
|
|
|
|
|
|
|
|
| |
| |
|
|
ANNUAL REPORT |
|
|
| |
|
|
JUNE 30, 2025 |
|
|
183 |
|
|
|
|
| |
Principal Investment Strategies |
|
|
|
|
grade (below Baa3 by Moody’s Ratings or below
BBB-
by either S&P Global Ratings or Fitch Ratings, Inc.) or that are unrated but determined by PIMCO to be of comparable quality to securities so rated. The Fund normally will attempt to maintain in its Debt Portfolio debt securities with what PIMCO believes have an average credit quality that is at least investment grade. The Fund may invest in securities of stressed, distressed and defaulted issuers, which include securities at risk of being in default as to the repayment of principal and/or interest at the time of acquisition by the Fund or that are rated in the lower rating categories by one or more nationally recognized statistical rating organizations or, if unrated, are determined by PIMCO to be of comparable quality, and in debtor-in-posession financing. Debt instruments of below investment grade quality are regarded as having predominantly speculative characteristics with respect to capacity to pay interest and to repay principal and are commonly referred to as “high yield” securities or “junk bonds.” Debt instruments in the lowest investment grade category also may be considered to possess some speculative characteristics. The Fund may, for hedging, investing or leveraging purposes, make use of credit default swaps (which includes buying and/or selling credit default swaps), which are contracts whereby one party makes periodic payments to a counterparty in exchange for the right to receive from the counterparty a payment equal to the par (or other agreed-upon) value of a referenced debt obligation in the event of a default or other credit event by the issuer of the debt obligation.
Independent Credit Analysis. PIMCO relies primarily on its own analysis of the credit quality and risks associated with individual debt instruments considered for the Fund, rather than relying exclusively on rating agencies or third-party research. The Fund’s portfolio managers utilize this information in an attempt to manage credit risk and identify issuers, industries or sectors that are undervalued or that offer attractive yields relative to PIMCO’s assessment of their credit characteristics. This aspect of PIMCO’s capabilities will be particularly important to the extent that the Fund invests in high yield securities and in securities of emerging market issuers.
Duration Management.
The Debt Portfolio’s debt securities will generally have a
low-
to intermediate- average portfolio duration, ranging from one year to a duration that is two years above the duration of the Bloomberg Capital U.S. Aggregate Index, although it may be shorter or longer at any time or from time to time depending on market conditions and other factors. While the Fund seeks to maintain a
low-
to intermediate- average portfolio duration, there is no limit on the maturity or duration of any individual security in which the Fund may invest. Duration is a measure used to determine the sensitivity of a security’s price to changes in interest rates. The Fund’s duration strategy may entail maintaining a negative average portfolio duration from time to time, which would potentially benefit the
portfolio in an environment of rising market interest rates but would generally adversely impact the portfolio in an environment of falling or neutral market interest rates. The Fund may use various derivatives strategies to manage (increase or decrease) the dollar-weighted average effective duration of the Fund’s portfolio. PIMCO may also utilize certain strategies, including without limitation investments in structured notes or interest rate futures contracts or swap, cap, floor or collar transactions, for the purpose of reducing the interest rate sensitivity of the Fund’s portfolio, although there is no assurance that it will do so or that such strategies will be successful. The foregoing is a description of interest rate duration management only. The credit spread duration of the Fund’s portfolio may vary, in some cases significantly, from its interest rate duration.
Substantially all of the Fund’s assets ordinarily will be invested in the Debt Portfolio to back the Fund’s equity index positions. The types of debt securities (and related instruments) in which the Fund may invest include mortgage-related and other types of asset-backed securities (including collateralized loan obligations, collateralized debt obligations and collateralized mortgage obligations) issued on a public or private basis; government securities, including U.S. Government securities, sovereign debt and other obligations of
non-U.S.
governments or their
sub-divisions,
agencies and government sponsored enterprises, and obligations of international agencies and supranational entities, as well as municipal securities; bonds, debentures, notes, and other debt securities of U.S. and
non-U.S.
corporations and other issuers, issued publicly or through private placements, including convertible securities, covenant-lite obligations, contingent convertible securities, synthetic convertible securities and commercial paper, event-linked securities, inflation-indexed bonds,
securities,
step-ups,
zero-coupon
bonds, senior floating-rate loans (“Senior Loans”) and other secured and/or unsecured loans (including, but not limited to, bank and/or other syndicated loans and
non-syndicated
(private direct) loans) and loan assignments and participations, bank capital securities, bank certificates of deposit, fixed time deposits and bankers’ acceptances. The Fund also may invest in preferred stock, structured notes and other hybrid instruments, credit-linked trust certificates, delayed draw and delayed funding loans, revolving credit facilities and REITs, and may use credit default swaps, other debt-related derivatives, interest rate swaps, forwards, futures and other interest rate derivatives. The rate of interest on the Fund’s debt security investments may be fixed, floating or variable, and may move in the opposite direction to interest rates generally or the interest rate on another security or index (i.e., inverse floaters). The Fund may invest in debt securities issued by companies with small and medium market capitalizations. The Fund may invest in various levels of the capital structure of an issuer of
|
|
|
|
|
|
| |
184 |
|
PIMCO CLOSED-END FUNDS |
|
|
|
|
mortgage-backed or asset-backed securities (including collateralized bond obligations, collateralized loan obligations (“CLOs”) and other collateralized debt obligations), including the equity or “first loss” tranche. The Fund may invest in unsecured loans and subordinated or mezzanine obligations, including second and lower lien loans and the mezzanine and equity (or “first loss”) tranches of CLO issues. The Fund may also invest, as a third-party purchaser, in risk retention tranches of CMBS or other eligible securitizations, which are eligible residual interests typically held by the sponsors of such securitizations pursuant to the final rules implementing the credit risk retention requirements of Section 941 of the Dodd-Frank Act. For tax or other structuring reasons, the Fund may purchase a loan or debt investment structured as an equity interest (e.g., a joint venture interest).
The Fund will actively manage the duration and yield curve exposure of the Debt Portfolio, in part through the use of a variety of interest rate derivatives, including but not limited to interest rate swaps, forwards and futures. These interest rate derivatives also may be used for other investment or risk management purposes, including to provide synthetic exposure to fixed or floating rate debt instruments, and to attempt to generate current income and gains. It currently is anticipated that the duration and yield curve active management strategies using interest rate derivatives will result in the generation of payments arising primarily from differences between short-term and long-term interest rates. As that difference gets smaller, the Fund would need to increase its notional exposure to interest rate derivatives in order to generate the same income for the Fund. These payments will be characterized as gain for financial accounting purposes and as ordinary income for tax purposes. In the event that long-term interest rates are higher than short-term interest rates, for example, the Fund may elect to pay a floating short-term interest rate and to receive a long-term fixed interest rate for a stipulated period of time, thereby generating return as a function of the difference between current short-term interest rates and long-term interest rates, so long as the floating short-term interest rate (which may rise) is lower than the fixed long-term interest rate. The notional exposure of the interest rate derivatives in the Debt Portfolio may vary widely as a function of market conditions, including differences between short-term and longer-term interest rates, and the Fund’s current investment strategies.
The Fund may invest without limitation in securities of U.S. issuers and without limitation in securities of foreign
(non-U.S.)
issuers, securities traded principally outside of the United States and securities denominated in currencies other than the U.S. dollar. The Fund normally will have exposure to investments that are tied economically to at least three countries other than the United States. The Fund may invest up to 40% of its total assets in securities and instruments that are economically tied to emerging market countries, except the Fund
may invest without limit in investment grade sovereign debt denominated in the relevant country’s local currency with less than 1 year remaining to maturity issued by emerging market issuers.
The Fund may invest up to 30% of its total assets in Senior Loans made to corporations, partnerships and other business entities. Senior Loans typically pay interest at rates that are
re-determined
periodically on the basis of a floating base lending rate plus a premium. Senior Loans generally hold the most senior position in the capital structure of a borrower and often are secured with collateral but may be of below investment grade quality and may involve significant credit risk.
The Fund may invest without limitation in illiquid investments (i.e., investments that the Fund reasonably expects cannot be sold or disposed of in current market conditions in seven calendar days or less without the sale or disposition significantly changing the market value of the securities).
The Fund may purchase securities that it is eligible to purchase on a when-issued basis, may purchase and sell such securities for delayed delivery, may make contracts to purchase such securities for a fixed price at a future date beyond normal settlement time (forward commitments) and may engage in short sales.
The Fund may invest in securities that have not been registered for public sale in the U.S. or relevant
non-U.S.
jurisdiction, including without limitation securities eligible for purchase and sale pursuant to Rule 144A under the Securities Act, or relevant provisions of applicable
non-U.S.
law, and other securities issued in private placements. The Fund may invest in securities of other open- or
closed-end
investment companies (including those advised by PIMCO), including, without limitation, exchange-traded funds, to the extent that such investments are consistent with the Fund’s investment objectives, strategies and policies and permissible under the 1940 Act. The Fund may invest in other investment companies to gain broad market or sector exposure or for cash management purposes, including during periods when it has large amounts of uninvested cash or when PIMCO believes share prices of other investment companies offer attractive values. The Fund may invest in certain money market funds and/or short-term bond funds (“Central Funds”), to the extent permitted by the 1940 Act, the rules thereunder or exemptive relief therefrom. The Central Funds are registered investment companies created for use by certain registered investment companies advised by PIMCO in connection with their cash management activities. The Fund treats its investments in other investment companies that invest primarily in types of securities in which the Fund may invest directly as investments in such types of securities for purposes of the Fund’s investment policies (e.g., the Fund’s investment in an investment company that invests primarily in debt securities will be treated by the Fund as an investment in a debt security). As a shareholder in an
|
|
|
|
|
|
|
|
|
|
|
|
| |
| |
|
|
ANNUAL REPORT |
|
|
| |
|
|
JUNE 30, 2025 |
|
|
185 |
|
|
|
|
| |
Principal Investment Strategies |
|
|
|
|
investment company, the Fund would bear its ratable share of that investment company’s expenses and would remain subject to payment of the Fund’s management fees and other expenses with respect to assets so invested. Common Shareholders would therefore be subject to duplicative expenses to the extent the Fund invests in other investment companies. The securities of other investment companies may be leveraged, in which case the NAV and/or market value of the investment company’s shares will be more volatile than unleveraged investments. The Fund may invest in REITs. The Fund may invest in securities of companies with any market capitalization, including small and medium capitalizations.
The Fund may enter into repurchase agreements, in which the Fund purchases a security from a bank or broker-dealer and the bank or broker-dealer agrees to repurchase the security at the Fund’s cost plus interest within a specified time.
For the purpose of achieving income, the Fund may lend its portfolio securities to brokers, dealers or other financial institutions provided a number of conditions are satisfied, including that the loan is fully collateralized.
The length of time the Fund has held a particular security is not generally a consideration in investment decisions. A change in the securities held by the Fund is known as “portfolio turnover.” The Fund may engage in frequent and active trading of portfolio securities to achieve its investment objectives, particularly during periods of volatile market movements. Frequent and active trading of the Fund’s portfolio holdings may cause adverse tax consequences for shareholders due to an increase in short-term capital gains and may also adversely impact the Fund’s
after-tax
returns.
There have been no significant changes in the Fund’s portfolio turnover rates over the last two fiscal years, and no significant change to the portfolio turnover rates of the Fund described in the Financial Highlights can currently be predicted.
The Fund has received exemptive relief from the SEC that, to the extent the Fund relies on such relief, permits it to (among other things)
co-invest
with certain other persons, including certain affiliates of the Investment Manager and certain public or private funds managed by the Investment Manager and its affiliates, subject to certain terms and conditions. The exemptive relief from the SEC with respect to
co-investments
imposes extensive conditions on any
co-investments
made in reliance on such relief.
Temporary Defensive Investments.
The Fund may make short-term investments when attempting to respond to adverse market, economic, political or other conditions, as determined by PIMCO. Upon PIMCO’s recommendation, for temporary defensive purposes or in order to keep its cash fully invested, the Fund may deviate from its
investment strategy by investing some or all of its total assets in investments such as high grade debt securities, including high quality, short-term debt securities, and cash and cash equivalents. The Fund may not achieve its investment objective when it does so.
The Fund may obtain leverage through reverse repurchase agreements, dollar rolls/buybacks or borrowings, such as through bank loans or commercial paper or other credit facilities. The Fund may also enter into transactions other than those noted above that may give rise to a form of leverage including, among others, futures and forward contracts (including foreign currency exchange contracts), total return swaps and other derivative transactions, loans of portfolio securities, short sales, when-issued, delayed delivery and forward commitment transactions and selling credit default swaps. The Fund may also determine to issue preferred shares or other types of senior securities to add leverage to its portfolio. The Fund’s Board of Trustees may authorize the issuance of preferred shares without the approval of Common Shareholders. If the Fund issues preferred shares in the future, all costs and expenses relating to the issuance and ongoing maintenance of the preferred shares will be borne by the Common Shareholders, and these costs and expenses may be significant. Leveraging transactions pursued by the Fund may increase its duration and sensitivity to interest rate movements. Leveraging is a speculative technique and there are special risks and costs involved. There can be no assurance that a leveraging strategy will be used or that it will be successful during any period in which it is employed.
The Fund utilizes certain kinds of leverage, such as reverse repurchase agreements and credit default swaps, opportunistically and may choose to increase or decrease, or eliminate entirely, its use of such leverage over time and from time to time based on PIMCO’s assessment of the yield curve environment, interest rate trends, market conditions and other factors.
The Fund also may borrow money in order to repurchase its shares or as a temporary measure for extraordinary or emergency purposes, including for the payment of dividends or the settlement of securities transactions which otherwise might require untimely dispositions of portfolio securities held by the Fund.
The Fund also may enter into transactions that may give rise to a form of financial leverage, such as, among others, reverse repurchase agreements, loans of portfolio securities, selling credit default swap contracts and engaging in other derivatives transactions, as well as when-issued, delayed delivery or forward commitment transactions.
PIMCO Strategic Income Fund, Inc. (“RCS”)
The Fund’s primary investment objective is to generate a level of income that is higher than that generated by high quality,
|
|
|
|
|
|
| |
186 |
|
PIMCO CLOSED-END FUNDS |
|
|
|
|
intermediate-term U.S. debt securities. The Fund also seeks capital appreciation to the extent consistent with this objective.
Leveraging PIMCO’s core analytical and risk management capabilities, the Fund’s portfolio managers can select what they believe to be attractive issues across the full range of fixed income sectors including corporate debt, government and sovereign debt, mortgage-related and other asset-backed securities and other income-producing securities of varying maturities.
The Fund normally invests at least 80% of its net assets (plus any borrowings for investment purposes) in a combination of income-producing securities of
non-corporate
issuers, such as securities issued or guaranteed by the U.S. or foreign governments, mortgage-related and other asset-backed securities issued on a public or private basis, corporate debt obligations and other income-producing securities of varying maturities issued by U.S. or foreign
(non-U.S.)
corporations or other business entities, including emerging market issuers, and municipal securities (the “80% policy”). Because the Fund’s 80% policy is not required by Rule
35d-1
under the Investment Company Act of 1940, as amended, the Fund may change the 80% policy without providing shareholders notice in the manner required by
Rule 35d-1.
Portfolio Management Strategies
Dynamic Allocation Strategy.
In managing the Fund, the Fund’s investment manager, PIMCO, employs an active approach to allocation among multiple fixed income sectors based on, among other things, market conditions, valuation assessments, economic outlook, credit market trends and other economic factors. With PIMCO’s macroeconomic analysis as the basis for
top-down
investment decisions, including geographic and credit sector emphasis, the Fund focuses on seeking income generating investment ideas across multiple fixed income sectors, with an emphasis on seeking opportunities in developed and emerging global credit markets. PIMCO may choose to focus on particular countries/regions, asset classes, industries and sectors to the exclusion of others at any time and from time to time based on market conditions and other factors. The relative value assessment within fixed income sectors draws on PIMCO’s regional and sector specialist insights.
Investment Selection Strategies.
Once the Fund’s
top-down,
portfolio positioning decisions have been made as described above, PIMCO selects particular investments for the Fund by employing a
bottom-up,
disciplined credit approach which is driven by fundamental, independent research within each sector/asset class represented in the Fund, with a focus on seeking to identify securities and other instruments with solid and/or improving fundamentals.
PIMCO utilizes strategies that focus on credit quality analysis, duration management and other risk management techniques. PIMCO attempts to identify, through fundamental research driven by independent credit analysis and proprietary analytical tools, debt obligations and other income-producing securities that provide current income and/or opportunities for capital appreciation based on its analysis of the issuer’s credit characteristics and the position of the security in the issuer’s capital structure.
Consideration of yield is only one component of the portfolio managers’ approach in managing the Fund. PIMCO also attempts to identify investments that may appreciate in value based on PIMCO’s assessment of the issuer’s credit characteristics, forecast for interest rates and outlook for particular countries/regions, currencies, industries, sectors and the global economy and bond markets generally.
Credit Quality.
The Fund may invest up to 20% of its total assets in debt instruments that are, at the time of purchase, rated below investment grade (below Baa3 by Moody’s Ratings or below
BBB-
by either S&P Global Ratings or Fitch Ratings, Inc.), or unrated but determined by PIMCO to be of comparable quality to securities so rated. Debt instruments of below investment grade quality are regarded as having predominantly speculative characteristics with respect to capacity to pay interest and to repay principal, and are commonly referred to as “high yield” securities or “junk bonds.” Debt instruments in the lowest investment grade category also may be considered to possess some speculative characteristics. The Fund may, for hedging, investing or leveraging purposes, make use of credit default swaps (which includes buying and/or selling credit default swaps), which are contracts whereby one party makes periodic payments to a counterparty in exchange for the right to receive from the counterparty a payment equal to the par (or other agreed-upon) value of a referenced debt obligation in the event of a default or other credit event by the issuer of the debt obligation.
Independent Credit Analysis.
PIMCO relies primarily on its own analysis of the credit quality and risks associated with individual debt instruments considered for the Fund, rather than relying exclusively on rating agencies or third-party research. The Fund’s portfolio managers utilize this information in an attempt to manage credit risk and identify issuers, industries or sectors that are undervalued or that offer attractive yields relative to PIMCO’s assessment of their credit characteristics. This aspect of PIMCO’s capabilities will be particularly important to the extent that the Fund invests in high yield securities and in securities of emerging market issuers.
For purposes of the Fund’s 80% policy, income-producing securities may include, without limitation, bonds, debentures, notes and other
|
|
|
|
|
|
|
|
|
|
|
|
| |
| |
|
|
ANNUAL REPORT |
|
|
| |
|
|
JUNE 30, 2025 |
|
|
187 |
|
|
|
|
| |
Principal Investment Strategies |
|
|
|
|
debt securities of U.S. and foreign
(non-U.S.)
corporate and other issuers, including commercial paper; asset-backed securities issued on a public or private basis; U.S. Government securities; obligations of foreign governments or their
sub-divisions,
agencies and government sponsored enterprises and obligations of international agencies and supranational entities; municipal securities and other debt securities issued by states or local governments and their agencies, authorities and other government-sponsored enterprises, including taxable municipal securities (such as Build America Bonds);
securities;
step-ups;
zero-coupon
bonds; inflation-indexed bonds issued by both governments and corporations; structured notes, including hybrid or indexed securities; credit-linked notes; covenant-lite obligations; credit-linked trust instruments; structured credit products; preferred securities; convertible debt securities (i.e., debt securities that may be converted at either a stated price or stated rate into underlying shares of common stock), including synthetic convertible debt securities (i.e., instruments created through a combination of separate securities that possess the two principal characteristics of a traditional convertible security, such as an income-producing security and the right to acquire an equity security and contingent convertible securities); collateralized mortgage obligations; bank capital securities; and bank certificates of deposit, fixed time deposits and bankers’ acceptances. The rate of interest on an income-producing security may be fixed, floating or variable, and may move in the opposite direction to interest rates generally or the interest rate on another security or index (i.e., inverse floaters). For tax or other structuring reasons, the Fund may purchase a loan or debt investment structured as an equity interest (e.g., a joint venture interest). At any given time and from time to time substantially all of the Fund’s portfolio may consist of below investment grade securities. The Fund may invest in debt securities of stressed issuers and in debtor-in-possession financing. The Fund may invest in various levels of the capital structure of an issuer of mortgage-backed or asset-backed securities (including collateralized bond obligations, collateralized loan obligations (“CLOs”) and other collateralized debt obligations), including the equity or “first loss” tranche. The Fund may invest in unsecured loans and subordinated or mezzanine obligations, including second and lower lien loans and the mezzanine and equity (or “first loss”) tranches of CLO issues. For the avoidance of doubt, equity or “first loss” tranches of mortgage-backed or asset-backed securities do not constitute equity interests for purposes of the Fund’s 20% limit on investments in equity interests described below. The Fund may also invest, as a third-party purchaser, in risk retention tranches of CMBS or other eligible securitizations, which are eligible residual interests typically held by the sponsors of such securitizations pursuant to the final rules implementing the credit risk retention requirements of Section 941 of the Dodd-Frank Act.
In addition, the Fund will invest a minimum of 33% of its net assets in U.S. debt securities and may not invest more than 67% of its total assets in foreign debt instruments, including a maximum of 40% of its total assets in securities and instruments that are economically tied to emerging market countries (this limitation does not apply to investment grade sovereign debt denominated in the relevant country’s local currency with less than 1 year remaining to maturity). Further, the Fund may invest up to 45% of its total assets in the securities of governmental or corporate issuers located in a single foreign country, subject to the 67% of total assets limitation on foreign securities holdings. The Fund may invest without limitation in investment grade sovereign debt denominated in the relevant country’s local currency with less than 1 year remaining to maturity, subject to applicable law and any other restrictions.
The Fund may, but is not required to, utilize various derivative strategies (both long and short positions) involving the purchase or sale of futures and forward contracts (including foreign currency exchange contracts), call and put options, credit default swaps, total return swaps, basis swaps and other swap agreements and other derivative instruments for investment purposes, leveraging purposes or in an attempt to hedge against market, credit, interest rate, currency and other risks in the portfolio. The Fund may use various derivatives strategies to manage (increase or decrease) the dollar-weighted average effective duration of the Fund’s portfolio. The Fund may purchase and sell securities on a when-issued, delayed delivery or forward commitment basis and may engage in short sales to the extent that short sales do not represent more than 25% of the Fund’s total assets.
The Fund may invest up to 20% of its total assets in common stocks and other equity securities from time to time, including those it has received through the conversion of a convertible security held by the Fund or in connection with the restructuring of a debt security. The Fund may invest up to 15% of its total assets in any combination of interest-only or inverse floating rate obligations and residual interests of real estate mortgage investment conduits. The weighted average life of the Fund’s investments, under normal market conditions, is expected to be less than 10 years. The Fund may invest up to 20% of its total assets in commercial mortgage-related securities.
The Fund may invest in securities that have not been registered for public sale in the U.S. or relevant
non-U.S.
jurisdiction, including without limitation securities eligible for purchase and sale pursuant to Rule 144A under the Securities Act, or relevant provisions of applicable
non-U.S.
law, and other securities issued in private placements. The Fund may invest in securities of other open- or
closed-end
investment companies (including those advised by PIMCO), including, without limitation, exchange-traded funds, to the extent
|
|
|
|
|
|
| |
188 |
|
PIMCO CLOSED-END FUNDS |
|
|
|
|
that such investments are consistent with the Fund’s investment objectives, strategies and policies and permissible under the 1940 Act. The Fund may invest in other investment companies to gain broad market or sector exposure or for cash management purposes, including during periods when it has large amounts of uninvested cash or when PIMCO believes share prices of other investment companies offer attractive values. The Fund may invest in certain money market funds and/or short-term bond funds (“Central Funds”), to the extent permitted by the 1940 Act, the rules thereunder or exemptive relief therefrom. The Central Funds are registered investment companies created for use by certain registered investment companies advised by PIMCO in connection with their cash management activities. The Fund treats its investments in other investment companies that invest primarily in types of securities in which the Fund may invest directly as investments in such types of securities for purposes of the Fund’s investment policies (e.g., the Fund’s investment in an investment company that invests primarily in debt securities will be treated by the Fund as an investment in a debt security). As a shareholder in an investment company, the Fund would bear its ratable share of that investment company’s expenses and would remain subject to payment of the Fund’s management fees and other expenses with respect to assets so invested. Common Shareholders would therefore be subject to duplicative expenses to the extent the Fund invests in other investment companies. The securities of other investment companies may be leveraged, in which case the NAV and/or market value of the investment company’s shares will be more volatile than unleveraged investments. The Fund may invest in REITs. The Fund may invest in securities of companies with any market capitalization, including small and medium capitalizations.
The Fund may invest without limitation in illiquid investments (i.e., investments that the Fund reasonably expects cannot be sold or disposed of in current market conditions in seven calendar days or less without the sale or disposition significantly changing the market value of the securities).
The Fund may enter into repurchase agreements, in which the Fund purchases a security from a bank or broker-dealer and the bank or broker-dealer agrees to repurchase the security at the Fund’s cost plus interest within a specified time.
For the purpose of achieving income, the Fund may lend its portfolio securities to brokers, dealers or other financial institutions provided a number of conditions are satisfied, including that the loan is fully collateralized.
The length of time the Fund has held a particular security is not generally a consideration in investment decisions. A change in the securities held by the Fund is known as “portfolio turnover.” The Fund may engage in frequent and active trading of portfolio securities to
achieve its investment objectives, particularly during periods of volatile market movements. Frequent and active trading of the Fund’s portfolio holdings may cause adverse tax consequences for shareholders due to an increase in short-term capital gains and may also adversely impact the Fund’s
after-tax
returns.
There have been no significant changes in the Fund’s portfolio turnover rates over the last two fiscal years, and no significant change to the portfolio turnover rates of the Fund described in the Financial Highlights can currently be predicted.
The Fund has received exemptive relief from the SEC that, to the extent the Fund relies on such relief, permits it to (among other things)
co-invest
with certain other persons, including certain affiliates of the Investment Manager and certain public or private funds managed by the Investment Manager and its affiliates, subject to certain terms and conditions. The exemptive relief from the SEC with respect to
co-investments
imposes extensive conditions on any
co-investments
made in reliance on such relief.
Temporary Defensive Investments.
The Fund may make short-term investments when attempting to respond to adverse market, economic, political, or other conditions, as determined by PIMCO. Upon PIMCO’s recommendation, for temporary defensive purposes or in order to keep its cash fully invested, the Fund may deviate from its investment strategy by investing some or all of its total assets in investments such as high grade debt securities, including high-quality, short-term debt instruments, and cash and cash equivalents. The Fund may not achieve its investment objectives when it does so.
The Fund may obtain leverage through reverse repurchase agreements, dollar rolls/buybacks or borrowings, such as through bank loans or commercial paper or other credit facilities. The Fund may also enter into transactions other than those noted above that may give rise to a form of leverage including, among others, futures and forward contracts (including foreign currency exchange contracts), total return swaps and other derivative transactions, loans of portfolio securities, short sales, when-issued, delayed delivery and forward commitment transactions and selling credit default swaps. The Fund may also determine to issue preferred shares or other types of senior securities to add leverage to its portfolio. The Fund’s Board of Trustees may authorize the issuance of preferred shares without the approval of Common Shareholders. If the Fund issues preferred shares in the future, all costs and expenses relating to the issuance and ongoing maintenance of the preferred shares will be borne by the Common Shareholders, and these costs and expenses may be significant. Leveraging transactions pursued by the Fund may increase its duration and sensitivity to interest rate movements. Leveraging is a speculative
|
|
|
|
|
|
|
|
|
|
|
|
| |
| |
|
|
ANNUAL REPORT |
|
|
| |
|
|
JUNE 30, 2025 |
|
|
189 |
|
|
|
|
| |
Principal Investment Strategies |
|
|
|
|
technique and there are special risks and costs involved. There can be no assurance that a leveraging strategy will be used or that it will be successful during any period in which it is employed.
The Fund utilizes certain kinds of leverage, such as reverse repurchase agreements and selling credit default swaps, opportunistically and may choose to increase or decrease, or eliminate entirely, its use of such leverage over time and from time to time based on PIMCO’s assessment of the yield curve environment, interest rate trends, market conditions and other factors.
The Fund also may borrow money in order to repurchase its shares or as a temporary measure for extraordinary or emergency purposes, including for the payment of dividends or the settlement of securities transactions which otherwise might require untimely dispositions of portfolio securities held by the Fund.
PIMCO Dynamic Income Fund (“PDI”)
The Fund seeks current income as a primary objective and capital appreciation as a secondary objective.
The Fund seeks to achieve its investment objectives by utilizing a dynamic asset allocation strategy among multiple fixed income sectors in the global credit markets, including corporate debt (including, among other things, fixed-, variable- and floating-rate bonds, loans (including, but not limited to, bank and/or other syndicated loans and
non-syndicated
(private direct) loans), convertible securities and stressed debt securities issued by U.S. or foreign
(non-U.S.
and emerging market) corporations or other business entities), mortgage-related and other asset-backed securities, government and sovereign debt, taxable municipal bonds and other fixed-, variable- and floating-rate income-producing securities of U.S. and foreign issuers, including emerging market issuers. The Fund may invest in investment grade debt securities and below investment grade debt securities (commonly referred to as “high yield” securities or “junk bonds”), including securities of defaulted, distressed and stressed issuers. The Fund cannot assure you that it will achieve its investment objectives or that the Fund’s investment program will be successful, and you could lose all of your investment in the Fund.
Portfolio Management Strategies
Dynamic Allocation Strategy.
In managing the Fund, PIMCO employs an active approach to allocation among multiple fixed income sectors based on, among other things, market conditions, valuation assessments, economic outlook, credit market trends and other economic factors. With PIMCO’s macroeconomic analysis as the basis for
top-down
investment decisions, including geographic and credit sector emphasis, PIMCO manages the Fund with a focus on seeking income generating investment ideas across multiple fixed income sectors, with an emphasis on seeking opportunities in developed and
emerging global credit markets. PIMCO may choose to focus on particular countries/regions, asset classes, industries and sectors to the exclusion of others at any time and from time to time based on market conditions and other factors. The relative value assessment within fixed income sectors draws on PIMCO’s regional and sector specialist insights. As a matter of fundamental policy, the Fund will normally invest at least 25% of its total assets in privately-issued (commonly known as
“non-agency”)
mortgage-related securities. The Fund will observe various investment guidelines as summarized below.
Investment Selection Strategies.
Once the Fund’s
top-down,
portfolio positioning decisions have been made as described above, PIMCO selects particular investments for the Fund by employing a
bottom-up,
disciplined credit approach which is driven by fundamental, independent research within each sector/asset class represented in the Fund, with a focus on seeking to identify securities and other instruments with solid and/or improving fundamentals.
PIMCO utilizes strategies that focus on credit quality analysis, duration management and other risk management techniques. PIMCO attempts to identify, through fundamental research driven by independent credit analysis and proprietary analytical tools, debt obligations and other income-producing securities that provide current income and/or opportunities for capital appreciation based on its analysis of the issuer’s credit characteristics and the position of the security in the issuer’s capital structure.
Consideration of yield is only one component of the portfolio managers’ approach in managing the Fund. PIMCO also attempts to identify investments that may appreciate in value based on PIMCO’s assessment of the issuer’s credit characteristics, forecast for interest rates and outlook for particular countries/regions, currencies, industries, sectors and the global economy and bond markets generally.
The Fund may invest in debt instruments that are, at the time of purchase, rated below investment grade, or that are unrated but determined by PIMCO to be of comparable quality. However, the Fund will not normally invest more than 20% of its total assets in debt instruments, other than mortgage-related and other asset-backed securities, that are, at the time of purchase, rated CCC+ or lower by S&P Global Ratings (“S&P”) and Fitch Ratings, Inc. (“Fitch”) and Caa1 or lower by Moody’s Ratings (“Moody’s”), or that are unrated but determined by PIMCO to be of comparable quality to securities so rated. The Fund may invest without limitation in mortgage-related and other asset-backed securities regardless of rating —
of any credit quality. For purposes of applying the foregoing policies, in the case of securities with split ratings (
a security receiving two different ratings from two different rating agencies), the Fund will apply the higher of the applicable ratings.
|
|
|
|
|
|
| |
190 |
|
PIMCO CLOSED-END FUNDS |
|
|
|
|
Subject to the aforementioned investment restrictions, the Fund may invest in securities of stressed issuers, which include securities at risk of being in default as to the repayment of principal and/or interest at the time of acquisition by the Fund or that are rated in the lower rating categories by one or more nationally recognized statistical rating organizations (for example, Ca or lower by Moody’s or CC or lower by S&P or Fitch) or, if unrated, are determined by PIMCO to be of comparable quality and in debtor-in-possession financing. Debt instruments of below investment grade quality are regarded as having predominantly speculative characteristics with respect to capacity to pay interest and to repay principal, and are commonly referred to as “high yield” securities or “junk bonds.” Debt instruments in the lowest investment grade category also may be considered to possess some speculative characteristics. The Fund may, for hedging, investing or leveraging purposes, make use of credit default swaps (which includes buying and/or selling credit default swaps), which are contracts whereby one party makes periodic payments to a counterparty in exchange for the right to receive from the counterparty a payment equal to the par (or other agreed-upon) value of a referenced debt obligation in the event of a default or other credit event by the issuer of the debt obligation.
Independent Credit Analysis.
PIMCO relies primarily on its own analysis of the credit quality and risks associated with individual debt instruments considered for the Fund, rather than relying exclusively on rating agencies or third-party research. The Fund’s portfolio managers utilize this information in an attempt to manage credit risk and identify issuers, industries or sectors that are undervalued or that offer attractive yields relative to PIMCO’s assessment of their credit characteristics. This aspect of PIMCO’s capabilities will be particularly important to the extent that the Fund invests in high yield securities and in securities of emerging market issuers.
Duration Management.
It is expected that the Fund normally will have a short to intermediate average portfolio duration (i.e., within a zero to eight (0 to 8) year range), as calculated by PIMCO, although it may be shorter or longer at any time or from time to time depending on market conditions and other factors. While the Fund seeks to maintain a short to intermediate average portfolio duration, there is no limit on the maturity or duration of any individual security in which the Fund may invest. Duration is a measure used to determine the sensitivity of a security’s price to changes in interest rates. For example, if the Fund has an average portfolio duration of eight years, a 1% increase in interest rates would tend to correspond to an 8% decrease in the value of the Fund’s debt portfolio. The Fund’s duration strategy may entail maintaining a negative average portfolio duration from time to time, meaning the portfolio would tend to increase in value in response to an increase in interest rates. If the Fund has a negative average portfolio duration, a 1% increase in interest rates
would tend to correspond to a 1% increase in the value of the Fund’s debt portfolio for every year of negative duration. A negative average portfolio duration would potentially benefit the Fund’s portfolio in an environment of rising market interest rates, but would generally adversely impact the portfolio in an environment of falling or neutral market interest rates. The Fund may use various derivatives strategies to manage (increase or decrease) the dollar-weighted average effective duration of the Fund’s portfolio. PIMCO may also utilize certain strategies, including without limitation investments in structured notes or interest rate futures contracts or swap, cap, floor or collar transactions, for the purpose of reducing the interest rate sensitivity of the Fund’s portfolio, although there is no assurance that it will do so or that such strategies will be successful. The foregoing is a description of interest rate duration management only. The credit spread duration of the Fund’s portfolio may vary, in some cases significantly, from its interest rate duration.
The Fund normally invests worldwide in a portfolio of debt obligations and other income-producing securities of any type and credit quality and with varying maturities and related derivative instruments. The Fund’s portfolio of debt obligations and income-producing securities may include, without limitation, bonds, debentures, notes and other debt securities of U.S. and foreign
(non-U.S.)
corporate and other issuers, including commercial paper; mortgage-related and other asset-backed securities issued by government agencies or other governmental entities or by private originators or issuers; U.S. Government securities; obligations of foreign governments or their
sub-divisions,
agencies and government sponsored enterprises and obligations of international agencies and supranational entities; municipal securities and other debt securities issued by states or local governments and their agencies, authorities and other government-sponsored enterprises, including taxable municipal securities (such as Build America Bonds);
securities;
step-ups;
zero-coupon
bonds; inflation indexed bonds issued by both governments and corporations; structured notes, including hybrid or indexed securities; insurance-linked investments, catastrophe bonds and other event-linked bonds; credit-linked notes; credit-linked trust instruments; structured credit products; loans (including, among others, and without limitation as to a loan’s level of seniority within a capital structure, senior loans, subordinated loans, mezzanine loans, delayed draw and delayed funding loans, covenant-lite obligations, revolving credit facilities and loan participations and assignments); preferred securities; convertible debt securities (i.e., debt securities that may be converted at either a stated price or stated rate into underlying shares of common stock), including synthetic convertible debt securities (i.e., instruments created through a combination of separate securities that possess the two principal characteristics of a
|
|
|
|
|
|
|
|
|
|
|
|
| |
| |
|
|
ANNUAL REPORT |
|
|
| |
|
|
JUNE 30, 2025 |
|
|
191 |
|
|
|
|
| |
Principal Investment Strategies |
|
|
|
|
traditional convertible security, such as an income producing security and the right to acquire an equity security) and contingent convertible securities; and bank certificates of deposit, fixed time deposits and bankers’ acceptances. The rate of interest on an income producing security may be fixed, floating or variable, and may move in the opposite direction to interest rates generally or the interest rate on another security or index (i.e., inverse floaters). Certain corporate income-producing securities, such as convertible bonds, also may include the right to participate in equity appreciation. The Fund may invest in debt securities of stressed issuers and in debtor-in-possession financing. Subject to the investment limitations described under “Credit Quality” above, at any given time and from time to time, substantially all of the Fund’s portfolio may consist of below investment grade securities and/or mortgage-related or other types of asset backed securities. The Fund may invest in various levels of the capital structure of an issuer of mortgage-backed or asset-backed securities (including collateralized bond obligations, collateralized loan obligations (“CLOs”) and other collateralized debt obligations), including the equity or “first loss” tranche. The Fund may invest in unsecured loans and subordinated or mezzanine obligations, including second and lower lien loans and the mezzanine and equity (or “first loss”) tranches of CLO issues. The Fund may also invest, as a third-party purchaser, in risk retention tranches of CMBS or other eligible securitizations, which are eligible residual interests typically held by the sponsors of such securitizations pursuant to the final rules implementing the credit risk retention requirements of Section 941 of the Dodd-Frank Act. For tax or other structuring reasons, the Fund may purchase a loan or debt investment structured as an equity interest (e.g., a joint venture interest).
The Fund may invest without limitation in securities of U.S. issuers. Subject to the limit described below on investments in securities and instruments that are economically tied to “emerging market” countries, the Fund may invest without limitation in securities of foreign
(non-U.S.)
issuers, securities traded principally outside of the United States, and securities denominated in currencies other than the U.S. dollar. The Fund may invest without limitation in investment grade sovereign debt denominated in the relevant country’s local currency with less than one year remaining to maturity (“short-term investment grade sovereign debt”), including short-term investment grade sovereign debt issued by emerging market issuers. The Fund may invest up to 40% of its total assets in securities and instruments that are economically tied to emerging market countries, other than investments in short-term investment grade sovereign debt issued by emerging market issuers, where as noted above there is no limit. The Fund may also invest directly in foreign currencies, including local emerging market currencies.
The Fund may normally invest up to 40% of its total assets in bank loans (including, among others, and without limitation as to a loan’s
level of seniority within a capital structure, senior loans, subordinated loans, mezzanine loans, delayed draw and delayed funding loans, covenant-lite obligations, revolving credit facilities and loan participations and assignments). The Fund will not normally invest more than 10% of its total assets in convertible debt securities (i.e., debt securities that may be converted at either a stated price or stated rate into underlying shares of common stock), including synthetic convertible debt securities (i.e., instruments created through a combination of separate securities that possess the two principal characteristics of a traditional convertible security, i.e., an income-producing security and the right to acquire an equity security). The Fund may also invest in preferred securities.
As a matter of fundamental policy, the Fund normally invests at least 25% of its total assets in privately-issued (commonly known as
“non-agency”)
mortgage-related securities.
The Fund may, but is not required to, utilize various derivative strategies (both long and short positions) involving the purchase or sale of futures and forward contracts (including foreign currency exchange contracts), call and put options, credit default swaps, total return swaps, basis swaps and other swap agreements and other derivative instruments for investment purposes, leveraging purposes or in an attempt to hedge against market, credit, interest rate, currency and other risks in the portfolio. The Fund may purchase and sell securities on a when-issued, delayed delivery or forward commitment basis and may engage in short sales.
The Fund will not normally invest directly in common stocks of operating companies. However, the Fund may own and hold common stocks in its portfolio from time to time in connection with a corporate action or the restructuring of a debt instrument, or through the conversion of a convertible security held by the Fund. Common stocks include common shares and other common equity interest issued by public or private issuers. For these purposes, operating companies do not include holding companies or companies or other entities whose primary business is to own and manage investment assets such as securities, commodities or real estate.
The Fund may invest indirectly in U.S. and
non-U.S.
real estate investments through one or more Subsidiaries structured as real estate investment trusts (each a “REIT Subsidiary”) and/or through joint ventures with affiliated or unaffiliated third parties. A REIT Subsidiary acts as an investment vehicle for the Fund in order to effect certain investments on behalf of the Fund, consistent with the Fund’s investment objectives and policies.
The Fund’s investments may utilize property-level debt financing (mortgages on properties held indirectly through a REIT Subsidiary that are not recourse to the Fund except in extremely limited circumstances). Property-level debt will be incurred by special purpose
|
|
|
|
|
|
| |
192 |
|
PIMCO CLOSED-END FUNDS |
|
|
|
|
entities (entities established to own a real estate investment) or operating entities (entities that hold and operate real estate investments) held by a REIT Subsidiary or by joint ventures entered into by a REIT Subsidiary. Such entities or joint ventures would solely own real estate assets and would borrow from a lender using the owned property as mortgage collateral. Joint ventures entered into by the REIT Subsidiary (including through wholly-owned special purpose companies) would only include arrangements in which the REIT Subsidiary does not primarily control the joint venture. If such an entity or joint venture were to default on a loan, the lender’s recourse would be to the mortgaged property and the lender would typically not have a claim to other assets of the Fund or its subsidiaries.
The Fund’s investments in the REIT Subsidiary could cause the Fund to recognize income in excess of cash received from the REIT Subsidiary and, as a result, the Fund may be required to sell portfolio securities, including when it is not advantageous to do so, in order to make distributions (to the extent distributions are paid in cash and are not part of the Fund’s automatic dividend reinvestment plan).
The Fund may invest in securities that have not been registered for public sale in the U.S. or relevant
non-U.S.
jurisdiction, including without limitation securities eligible for purchase and sale pursuant to Rule 144A under the Securities Act, or relevant provisions of applicable
non-U.S.
law, and other securities issued in private placements. The Fund may invest in securities of other investment companies (including those advised by PIMCO), including, without limitation, domestic and foreign ETFs. The Fund may invest in real estate investment trusts (“REITs”). The Fund may invest in securities of companies with any market capitalization, including small and medium capitalizations.
The Fund may invest in investment companies to gain broad market or sector exposure or for cash management purposes, including during periods when it has large amounts of uninvested cash or when PIMCO believes share prices of other investment companies offer attractive values. The Fund may invest in certain money market funds and/or short-term bond funds (“Central Funds”), to the extent permitted by the 1940 Act, the rules thereunder or exemptive relief therefrom. The Central Funds are registered investment companies created for use by certain registered investment companies advised by PIMCO in connection with their cash management activities. The Fund treats its investments in other investment companies that invest primarily in types of securities in which the Fund may invest directly as investments in such types of securities for purposes of the Fund’s investment policies (e.g., the Fund’s investment in an investment company that invests primarily in debt securities will be treated by the Fund as an investment in a debt security). As a shareholder in an investment company, the Fund would bear its ratable share of that investment
company’s expenses and would remain subject to payment of the Fund’s management fees and other expenses with respect to assets so invested. Common Shareholders would therefore be subject to duplicative expenses to the extent the Fund invests in other investment companies. The securities of other investment companies may be leveraged, in which case the NAV and/or market value of the investment company’s shares will be more volatile than unleveraged investments.
The Fund may invest without limitation in illiquid investments (i.e., investments that the Fund reasonably expects cannot be sold or disposed of in current market conditions in seven calendar days or less without the sale or disposition significantly changing the market value of the security).
The Fund may make investments in debt instruments and other securities or instruments directly or through one or more Subsidiaries. Each Subsidiary, for example, may invest in or originate loans or invest in shares, certificates, notes or other securities representing the right to receive principal and interest payments due on fractions of whole loans or pools of whole loans, risk retention investments or any other security or other instrument that the Fund may hold directly. References herein to the Fund include references to a Subsidiary in respect of the Fund’s investment exposure. The allocation of the Fund’s assets to a Subsidiary will vary over time and will likely not include all of the different types of investments described herein at any given time. The Fund will treat the assets of its Subsidiaries as assets of the Fund for purposes of determining compliance with various provisions of the 1940 Act applicable to the Fund, including those relating to investment policies (Section 8), capital structure and leverage (Section 18) and affiliated transactions and custody (Section 17).
The Fund may seek to originate loans, including, without limitation, residential and/or commercial real estate or mortgage-related loans, consumer loans or other types of loans, which may be in the form of whole loans, secured and unsecured notes, senior and second lien loans, mezzanine loans, bridge loans or similar investments. When investing in or originating loans, the Fund is not restricted by any particular credit risk criteria and/or qualifications. The loans the Fund invests in and/or originates may vary in maturity and/or duration. The Fund is not limited in the amount, size or type of loans it may invest in and/or originate, including with respect to a single borrower or with respect to borrowers that are determined to be below investment grade, other than pursuant to any applicable law. The Fund’s investments in and/or origination of loans may also be limited by the Fund’s intention to qualify as a regulated investment company.
The Fund may seek to originate loans through its Subsidiaries (and for purposes of this disclosure, references to the Fund originating loans
|
|
|
|
|
|
|
|
|
|
|
|
| |
| |
|
|
ANNUAL REPORT |
|
|
| |
|
|
JUNE 30, 2025 |
|
|
193 |
|
|
|
|
| |
Principal Investment Strategies |
|
|
|
|
also shall refer to a loan originated by any applicable Subsidiary-accordingly, the Fund intends to “look through” any Subsidiary for purposes of determining compliance of loan-related investments with any applicable investment guidelines or covenants of any borrowings or preferred shares of the Fund, if any).
Borrowers of loans may be, but are not limited to, corporations and/or other legal entities and individuals, including foreign
(non-U.S.)
and emerging market entities and individuals. Direct loans between the Fund and a borrower may not be administered by an underwriter or agent bank. The Fund may provide financing to borrowers directly or through companies acquired (or created) and owned by or otherwise affiliated with the Fund. The terms of the direct loans, including the duration of the loan, may be negotiated with borrowers in private transactions. A loan may be secured or unsecured.
In making a direct loan, the Fund is exposed to the risk that the borrower may default or become insolvent and, consequently, that the Fund will lose money on the loan. Furthermore, direct loans may subject the Fund to liquidity and interest rate risk and certain direct loans may be deemed illiquid. Direct loans are not publicly traded and may not have a secondary market. The lack of a secondary market for direct loans may have an adverse impact on the ability of the Fund to dispose of a direct loan and/or to value the direct loan.
When engaging in direct lending, the Fund’s performance may depend, in part, on the ability of the Fund to originate loans on advantageous terms. In originating and purchasing loans, the Fund will often compete with a broad spectrum of lenders. Increased competition for, or a diminishment in the available supply of, qualifying loans could result in lower yields on and/or less advantageous terms of such loans, which could reduce Fund performance. As part of its lending activities, the Fund may originate loans to entities that are experiencing significant financial or business difficulties, including entities involved in bankruptcy or other reorganization and liquidation proceedings or that are rated “below investment grade” by an NRSRO or not rated at all. Although the terms of such financing may result in significant financial returns to the Fund, they involve a substantial degree of risk. The level of analytical sophistication, both financial and legal, necessary for successful financing to entities experiencing significant business and financial difficulties is unusually high. Different types of assets may be used as collateral for the Fund’s loans and, accordingly, the valuation of and risks associated with such collateral will vary by loan. There is no assurance that the Fund will correctly evaluate the value of the assets collateralizing the Fund’s loans or the prospects for a successful reorganization or similar action. In any reorganization or liquidation proceeding relating to a company that the Fund funds, the Fund may lose all or part of the amounts advanced to the borrower or may be
required to accept collateral with a value less than the amount of the loan advanced by the Fund or its affiliates to the borrower. Furthermore, in the event of a default by a borrower, the Fund may have difficulty disposing of the assets used as collateral for a loan.
Various state licensing requirements could apply to the Fund with respect to the origination, acquisition, holding, servicing, foreclosure and/or disposition of, loans and similar assets. The licensing requirements could apply depending on the location of the borrower, the location of the collateral securing the loan, or the location where the Fund or PIMCO operates or has offices. In states in which it is licensed, the Fund or PIMCO will be required to comply with applicable laws and regulations, including consumer protection and anti-fraud laws, which could impose restrictions on the Fund’s or PIMCO’s ability to take certain actions to protect the value of its holdings in such assets and impose compliance costs. Failure to comply with such laws and regulations could lead to, among other penalties, a loss of the Fund’s or PIMCO’s license, which in turn could require the Fund to divest assets located in or secured by real property located in that state. These risks will also apply to issuers and entities in which the Fund invests that hold similar assets, as well as any origination company or servicer in which the Fund owns an interest. Loan origination and servicing companies are routinely involved in legal proceedings concerning matters that arise in the ordinary course of their business. These legal proceedings range from actions involving a single plaintiff to class action lawsuits with potentially tens of thousands of class members. In addition, a number of participants in the loan origination and servicing industry (including control persons of industry participants) have been the subject of regulatory actions by state regulators, including state Attorneys General, and by the federal government. Governmental investigations, examinations or regulatory actions, or private lawsuits, including purported class action lawsuits, may adversely affect such companies’ financial results. To the extent the Fund seeks to engage in origination and/or servicing directly, or has a financial interest in, or is otherwise affiliated with, an origination or servicing company, the Fund will be subject to enhanced risks of litigation, regulatory actions and other proceedings. As a result, the Fund may be required to pay legal fees, settlement costs, damages, penalties or other charges, any or all of which could materially adversely affect the Fund and its holdings.
In addition to laws governing the activities of lenders and servicers, certain states may require, or may in the future require, purchasers or holders of certain loans, including residential mortgage loans and unsecured consumer loans, to be licensed or registered in order to purchase, hold or foreclose such loans, or, in certain states, to collect a rate of interest above a specified rate. To the extent required or determined to be necessary or advisable by the Fund, the Fund will take appropriate steps intended to address any applicable state
|
|
|
|
|
|
| |
194 |
|
PIMCO CLOSED-END FUNDS |
|
|
|
|
licensing requirements, which may include acquiring and holding such loans through structures designed to preempt state licensing laws, in order to pursue its objectives and strategies. To the extent the Fund (or a fully-owned Subsidiary) obtains licenses or is required to comply with related regulatory requirements as a result of its investments, the Fund could be subject to increased costs and regulatory oversight by governmental authorities, which may have an adverse effect on its results or operations.
The Fund may invest, either directly or indirectly through its Subsidiaries, in Alt Lending ABS backed by consumer, residential or other loans, issued by an SPE sponsored by an online or alternative lending platform or an affiliate thereof.
When acquiring and/or originating loans or purchasing Alt Lending ABS, the Fund is not restricted by any particular borrower credit risk criteria and/or qualifications. Accordingly, certain loans acquired or originated by the Fund or underlying any Alt Lending ABS purchased by the Fund may be subprime in quality, or may become subprime in quality.
The Fund may enter into repurchase agreements, in which the Fund purchases a security from a bank or broker-dealer and the bank or broker-dealer agrees to repurchase the security at the Fund’s cost plus interest within a specified time.
For the purpose of achieving income, the Fund may lend its portfolio securities to brokers, dealers or other financial institutions provided a number of conditions are satisfied, including that the loan is fully collateralized.
The length of time the Fund has held a particular security is not generally a consideration in investment decisions. A change in the securities held by the Fund is known as “portfolio turnover.” The Fund may engage in frequent and active trading of portfolio securities to achieve its investment objectives, particularly during periods of volatile market movements. Frequent and active trading of the Fund’s portfolio holdings may cause adverse tax consequences for shareholders due to an increase in short-term capital gains and may also adversely impact the Fund’s
after-tax
returns.
There have been no significant changes in the Fund’s portfolio turnover rates over the last two fiscal years, and no significant change to the portfolio turnover rates of the Fund described in the Financial Highlights can currently be predicted.
The Fund has received exemptive relief from the SEC that, to the extent the Fund relies on such relief, permits it to (among other things)
co-invest
with certain other persons, including certain affiliates of the Investment Manager and certain public or private funds managed by the Investment Manager and its affiliates, subject to certain terms and
conditions. The exemptive relief from the SEC with respect to
co-investments
imposes extensive conditions on any
co-investments
made in reliance on such relief.
Temporary Defensive Investments.
The Fund may make short-term investments when attempting to respond to adverse market, economic, political or other conditions, as determined by PIMCO. Upon PIMCO’s recommendation, for temporary defensive purposes or in order to keep its cash fully invested, the Fund may deviate from its investment strategy by investing some or all of its total assets in investments such as high grade debt securities, including high quality, short-term debt securities, and cash and cash equivalents. The Fund may not achieve its investment objectives when it does so.
The Fund may obtain leverage through reverse repurchase agreements, dollar rolls/buy backs or borrowings, such as through bank loans or commercial paper or other credit facilities. The Fund may also enter into transactions other than those noted above that may give rise to a form of leverage including, among others, futures and forward contracts (including foreign currency exchange contracts), total return swaps and other derivative transactions, loans of portfolio securities, short sales and when-issued, delayed delivery and forward commitment transactions and selling credit default swaps. The Fund may also determine to issue preferred shares or other types of senior securities to add leverage to its portfolio. The Fund’s Board of Trustees may authorize the issuance of preferred shares without the approval of Common Shareholders. If the Fund issues preferred shares in the future, all costs and expenses relating to the issuance and ongoing maintenance of the preferred shares will be borne by the Common Shareholders, and these costs and expenses may be significant. Leveraging transactions pursued by the Fund may increase its duration and sensitivity to interest rate movements. Leveraging is a speculative technique and there are special risks and costs involved. There can be no assurance that a leveraging strategy will be used or that it will be successful during any period in which it is employed.
Under normal market conditions, subject to the limitations set forth in the 1940 Act, the Fund will limit its use of leverage from any combination of (i) reverse repurchase agreements or dollar roll/buyback transactions, (ii) borrowings (i.e., loans or lines of credit from banks or other credit facilities), (iii) any future issuance of preferred shares, and (iv) to the extent described below, credit default swaps, other swap agreements and futures contracts (whether or not these instruments are covered as discussed below) such that the assets attributable to the use of such leverage will not exceed 50% of the Fund’s total assets (including, for purposes of the 50% limit, the amounts of leverage obtained through the use of such instruments) (the “50% policy”). For these purposes, assets attributable to the use
|
|
|
|
|
|
|
|
|
|
|
|
| |
| |
|
|
ANNUAL REPORT |
|
|
| |
|
|
JUNE 30, 2025 |
|
|
195 |
|
|
|
|
| |
Principal Investment Strategies |
|
|
|
|
of leverage from credit default swaps, other swap agreements and futures contracts will be determined based on the current market value of the instrument if it is cash settled or based on the notional value of the instrument if it is not cash settled. In addition, assets attributable to credit default swaps, other swap agreements or futures contracts will not be counted towards the 50% policy to the extent that the Fund owns offsetting positions or enters into offsetting transactions.
The Fund also may borrow money in order to repurchase its shares or as a temporary measure for extraordinary or emergency purposes, including for the payment of dividends or the settlement of securities transactions which otherwise might require untimely dispositions of portfolio securities held by the Fund.
PIMCO Dynamic Income Opportunities Fund (“PDO”)
The Fund’s investment objective is to seek current income as a primary objective and capital appreciation as a secondary objective.
The Fund seeks to achieve its investment objectives by utilizing a dynamic asset allocation strategy among multiple fixed income sectors in the global credit markets, including corporate debt (including, among other things, fixed-, variable- and floating-rate bonds, loans, convertible securities and stressed, distressed and defaulted debt securities issued by U.S. or foreign
(non-U.S.)
corporations or other business entities, including emerging market issuers), mortgage-related and other asset-backed instruments, government and sovereign debt, taxable municipal bonds, and other fixed-, variable- and floating-rate income-producing securities of U.S. and foreign issuers, including emerging market issuers. The Fund may invest without limitation in investment grade debt obligations and below investment grade debt obligations (commonly referred to as “high yield” securities or “junk bonds”), including securities of stressed, distressed or defaulted issuers. The Fund cannot assure you that it will achieve its investment objectives or that the Fund’s investment program will be successful, and you could lose all of your investment in the Fund.
Portfolio Management Strategies
Dynamic Allocation Strategy.
In managing the Fund, the Fund’s investment manager, PIMCO, employs an active approach to allocation among multiple fixed income sectors based on, among other things, market conditions, valuation assessments, economic outlook, credit market trends and other economic factors. With PIMCO’s macroeconomic analysis as the basis for
top-down
investment decisions, including geographic and credit sector emphasis, PIMCO manages the Fund with a focus on seeking income generating investment ideas across multiple fixed income sectors, with an emphasis on seeking opportunities in developed and emerging global credit markets. PIMCO may choose to focus on particular countries/
regions, asset classes, industries and sectors to the exclusion of others at any time and from time to time based on market conditions and other factors. The relative value assessment within fixed income sectors will draw on PIMCO’s regional and sector specialist insights.
As a matter of fundamental policy, the Fund will normally invest at least 25% of its total assets (i.e., concentrate) in mortgage-related assets issued by government agencies or other governmental entities or by private originators or issuers. The Fund will observe various other investment guidelines as summarized below.
Investment Selection Strategies.
Once the Fund’s
top-down,
portfolio positioning decisions have been made as described above, PIMCO selects particular investments for the Fund by employing a
bottom-up,
disciplined credit approach which is driven by fundamental, independent research within each sector/asset class represented in the Fund, with a focus on seeking to identify securities and other instruments with solid and/or improving fundamentals.
PIMCO utilizes strategies that focus on credit quality analysis, duration management and other risk management techniques. PIMCO attempts to identify, through fundamental research driven by independent credit analysis and proprietary analytical tools, debt obligations and other income-producing securities that provide current income and/or opportunities for capital appreciation based on its analysis of the issuer’s credit characteristics and the position of the security in the issuer’s capital structure.
Consideration of yield is only one component of the portfolio managers’ approach in managing the Fund. PIMCO attempts to identify investments that may appreciate in value based on PIMCO’s assessment of the issuer’s credit characteristics, forecast for interest rates and outlook for particular countries/regions, currencies, industries, sectors and the global economy and bond markets generally.
Credit Quality.
The Fund may invest without limitation in debt instruments that are, at the time of purchase, rated below investment grade (below Baa3 by Moody’s or below
BBB-
by either S&P or Fitch), or that are unrated but determined by PIMCO to be of comparable quality. However, the Fund will not normally invest more than 20% of its total assets in debt instruments, other than mortgage-related and other asset-backed securities, that are, at the time of purchase, rated CCC+ or lower by S&P and Fitch and Caa1 or lower by Moody’s, or that are unrated but determined by PIMCO to be of comparable quality to securities so rated. The Fund may invest without limitation in mortgage-related and other asset-backed securities regardless of rating (i.e., of any credit quality). For purposes of applying the foregoing policies, in the case of securities with split ratings (i.e., a security receiving two different ratings from two different rating agencies), the Fund will apply the higher of the applicable ratings.
|
|
|
|
|
|
| |
196 |
|
PIMCO CLOSED-END FUNDS |
|
|
|
|
Subject to the aforementioned investment guidelines, the Fund may invest in securities of stressed, distressed and defaulted issuers, which include securities in default or at risk of being in default as to the repayment of principal and/or interest at the time of acquisition by the Fund or that are rated in the lower rating categories by one or more nationally recognized statistical rating organizations (for example, Ca or lower by Moody’s or CC or lower by S&P or Fitch) or, if unrated, are determined by PIMCO to be of comparable quality. Debt instruments of below investment grade quality, and in debtor-in-possession financings are regarded as having predominantly speculative characteristics with respect to capacity to pay interest and to repay principal, and are commonly referred to as “high yield” securities or “junk bonds.” Debt instruments in the lowest investment grade category also may be considered to possess some speculative characteristics. The Fund may, for hedging, investing or leveraging purposes, make use of credit default swaps (which includes buying and/or selling credit default swaps), which are contracts whereby one party makes periodic payments to a counterparty in exchange for the right to receive from the counterparty a payment equal to the par (or other agreed-upon) value of a referenced debt obligation in the event of a default or other credit event by the issuer of the debt obligation.
Independent Credit Analysis.
PIMCO relies primarily on its own analysis of the credit quality and risks associated with individual debt instruments considered for the Fund, rather than relying exclusively on rating agencies or third-party research. The Fund’s portfolio managers utilize this information in an attempt to manage credit risk and identify issuers, industries or sectors that are undervalued and/or that offer attractive yields relative to PIMCO’s assessment of their credit characteristics. This aspect of PIMCO’s capabilities will be particularly important to the extent that the Fund invests in high yield securities and in securities of emerging market issuers.
Duration Management.
It is expected that the Fund normally will have a short to intermediate average portfolio duration (i.e., within a zero to eight year (0 to 8) range), as calculated by PIMCO, although it may be shorter or longer at any time or from time to time depending on market conditions and other factors. While the Fund seeks to maintain a short to intermediate average portfolio duration, there is no limit on the maturity or duration of any individual security in which the Fund may invest. Duration is a measure used to determine the sensitivity of a security’s price to changes in interest rates. For example, if the Fund has an average portfolio duration of eight years, a 1% increase in interest rates would tend to correspond to an 8% decrease in the value of the Fund’s debt portfolio. The Fund’s duration strategy may entail maintaining a negative average portfolio duration from time to time, meaning the portfolio would tend to increase in value in response to an increase in interest rates. If the Fund has a negative average portfolio duration, a 1% increase in interest rates
would tend to correspond to a 1% increase in the value of the Fund’s debt portfolio for every year of negative duration. A negative average portfolio duration would potentially benefit the Fund’s portfolio in an environment of rising market interest rates, but would generally adversely impact the portfolio in an environment of falling or neutral market interest rates. The Fund may use various derivatives strategies to manage (increase or decrease) the dollar-weighted average effective duration of the Fund’s portfolio. PIMCO may also utilize certain strategies, including without limitation investments in structured notes or interest rate futures contracts or swap, cap, floor or collar transactions, for the purpose of reducing the interest rate sensitivity of the Fund’s portfolio, although there is no assurance that it will do so or that such strategies will be successful. The foregoing is a description of interest rate duration management only. The credit spread duration of the Fund’s portfolio may vary, in some cases significantly, from its interest rate duration.
The Fund normally invests worldwide in a portfolio of debt obligations and other income-producing securities and instruments of any type and credit quality and with varying maturities and related derivative instruments. The Fund’s portfolio of debt obligations and other income producing securities and instruments may include, without limitation, bonds, debentures, notes, and other debt securities and similar instruments of varying maturities issued by various U.S. and foreign
(non-U.S.)
corporate and other issuers, including corporate debt securities; commercial paper; securitizations and mortgage-related and other asset-backed instruments issued by government agencies or other governmental entities or by private originators or issuers (including agency and non-agency RMBS, CMBS, CBOs, CMOs, CLOs, other CDOs and other similarly structured securities, including the residual or equity tranches thereof); derivatives on mortgage-related instruments; U.S. Government securities; obligations of foreign governments or their
sub-divisions,
agencies and government sponsored enterprises and obligations of international agencies and supranational entities; municipal securities and other debt securities issued by states or local governments and their agencies, authorities and other government-sponsored enterprises, including taxable municipal securities (such as Build America Bonds);
securities;
step-ups;
zero-coupon
bonds; inflation-indexed bonds issued by both governments and corporations; structured notes, including hybrid or indexed securities; insurance-linked investments, catastrophe bonds and other event-linked bonds; credit-linked notes; credit-linked trust instruments; structured credit products; loans (including, among others, and without limitation as to a loan’s level of seniority within a capital structure, bank loans, whole loans, senior loans, subordinated loans, mezzanine loans, delayed draw and delayed funding loans, covenant-lite obligations, revolving credit
|
|
|
|
|
|
|
|
|
|
|
|
| |
| |
|
|
ANNUAL REPORT |
|
|
| |
|
|
JUNE 30, 2025 |
|
|
197 |
|
|
|
|
| |
Principal Investment Strategies |
|
|
|
|
facilities and loan participations and assignments, loans held and/or originated by private financial institutions, including commercial and residential mortgage loans, corporate loans and consumer loans (such as credit card receivables, automobile loans and student loans)); preferred securities; convertible debt securities (i.e., debt securities that may be converted at either a stated price or stated rate into underlying shares of common stock), including synthetic convertible debt securities (i.e., instruments created through a combination of separate securities that possess the two principal characteristics of a traditional convertible security, such as an income-producing security and the right to acquire an equity security) and CoCos; bank capital securities; and bank certificates of deposit, fixed time deposits and bankers’ acceptances. The rate of interest on an income-producing security may be fixed, floating or variable, and may move in the opposite direction to interest rates generally or the interest rate on another security or index. Certain corporate income-producing securities, such as convertible bonds, also may include the right to participate in equity appreciation, and PIMCO will generally evaluate those instruments based primarily on their debt characteristics.
The Fund may invest in debt securities of stressed or distressed issuers as well as in defaulted securities and
financings. For tax or other structuring reasons, the Fund may purchase a loan or debt investment structured as an equity interest (e.g., a joint venture interest). At any given time and from time to time, all of the Fund’s portfolio may consist of below investment grade securities and/or mortgage-related or other types of asset-backed securities. The Fund may invest in various levels of the capital structure of an issuer of mortgage-backed or asset-backed securities (including collateralized bond obligations, collateralized loan obligations (“CLOs”) and other collateralized debt obligations), including the equity or “first loss” tranche. The Fund may invest in unsecured loans and subordinated or mezzanine obligations, including second and lower lien loans and the mezzanine and equity (or “first loss”) tranches of CLO issues. For the avoidance of doubt, equity or “first loss” tranches of mortgage-backed or asset-backed securities do not constitute equity interests for purposes of the Fund’s 20% limit on investments in equity interests described below. The Fund may invest without limitation in investment grade debt securities and below investment grade debt securities (commonly referred to as “high yield” securities or “junk bonds”), including securities of stressed, distressed or defaulted issuers.
The Fund may invest without limitation in securities of U.S. issuers. Subject to the limit described below on investments in securities and instruments that are economically tied to emerging market countries, the Fund may invest without limitation in securities of foreign
(non-U.S.)
issuers, securities traded principally outside of the United States and securities denominated in currencies other than the U.S. dollar. The Fund may invest without limitation in investment grade
sovereign debt denominated in the relevant country’s local currency with less than one year remaining to maturity (“short-term investment grade sovereign debt”), including short-term investment grade sovereign debt issued by emerging market issuers. The Fund may invest up to 30% of its total assets in securities and instruments that are economically tied to emerging market countries other than investments in short-term investment grade sovereign debt issued by emerging market issuers, where, as noted above, there is no limit. The Fund may also invest directly in foreign currencies, including local emerging market currencies. The Fund may normally invest up to 40% of its total assets in bank loans (including, among others, and without limitation as to a loan’s level of seniority within a capital structure, senior loans, subordinated loans, mezzanine loans, delayed draw and delayed funding loans, covenant-lite obligations, revolving credit facilities and loan participations and assignments). The Fund will not normally invest more than 10% of its total assets in convertible debt securities (i.e., debt securities that may be converted at either a stated price or stated rate into underlying shares of common stock).
As a matter of fundamental policy, the Fund will normally invest at least 25% of its total assets (i.e., concentrate) in mortgage-related assets issued by government agencies or other governmental entities or by private originators or issuers.
The Fund may, but is not required to, utilize various derivative strategies (both long and short positions) involving the purchase or sale of futures and forward contracts (including foreign currency exchange contracts), call and put options, credit default swaps, total return swaps, basis swaps and other swap agreements and other derivative instruments for investment purposes, leveraging purposes or in an attempt to hedge against market, credit, interest rate, currency and other risks in the portfolio. The Fund may purchase and sell securities on a when-issued, delayed delivery or forward commitment basis and may engage in short sales.
The Fund may invest to a limited degree (typically no more than 20% of its total assets) in equity interests, such as shares of other investment companies (including those advised by PIMCO), including
open-end
or
closed-end
management investment companies and exchange-traded funds (“ETFs”), and REITs, except that the Fund may invest without limitation in preferred securities. Such equity interests may be issued by public or private issuers. For these purposes, common stocks or other equity interests the Fund has received through the conversion of a convertible security held by the Fund or in connection with the restructuring of a debt security will not count towards this 20% limit.
The Fund may invest in securities that have not been registered for public sale in the U.S. or relevant
non-U.S.
jurisdiction, including without limitation securities eligible for purchase and sale pursuant to
|
|
|
|
|
|
| |
198 |
|
PIMCO CLOSED-END FUNDS |
|
|
|
|
Rule 144A under the Securities Act, or relevant provisions of applicable
non-U.S.
law, and other securities issued in private placements. The Fund may invest in securities of other open- or
closed-end
investment companies (including those advised by PIMCO), including, without limitation, ETFs, to the extent that such investments are consistent with the Fund’s investment objectives, strategies and policies and permissible under the 1940 Act. The Fund may invest in other investment companies to gain broad market or sector exposure or for cash management purposes, including during periods when it has large amounts of uninvested cash or when PIMCO believes share prices of other investment companies offer attractive values. The Fund may invest in certain money market funds and/or short-term bond funds (“Central Funds”), to the extent permitted by the 1940 Act, the rules thereunder or exemptive relief therefrom. The Central Funds are registered investment companies created for use by certain registered investment companies advised by PIMCO in connection with their cash management activities. The Fund treats its investments in other investment companies that invest primarily in types of securities in which the Fund may invest directly as investments in such types of securities for purposes of the Fund’s investment policies (e.g., the Fund’s investment in an investment company that invests primarily in debt securities will be treated by the Fund as an investment in a debt security). As a shareholder in an investment company, the Fund would bear its ratable share of that investment company’s expenses and would remain subject to payment of the Fund’s management fees and other expenses with respect to assets so invested. Common Shareholders would therefore be subject to duplicative expenses to the extent the Fund invests in other investment companies. The securities of other investment companies may be leveraged, in which case the NAV and/or market value of the investment company’s shares will be more volatile than unleveraged investments. The Fund may invest in REITs. The Fund may invest in securities of companies with any market capitalization, including small and medium capitalizations.
The Fund may invest without limitation in illiquid investments (i.e., investments that the Fund reasonably expects cannot be sold or disposed of in current market conditions in seven calendar days or less without the sale or disposition significantly changing the market value of the investment).
The Fund may make investments in debt instruments and other securities or instruments directly or through one or more Subsidiaries. Each Subsidiary, for example, may invest in or originate loans or invest in shares, certificates, notes or other securities representing the right to receive principal and interest payments due on fractions of whole loans or pools of whole loans, risk retention investments or any other security or other instrument that the Fund may hold directly. References herein to the Fund include references to a Subsidiary in respect of the Fund’s investment exposure. The allocation of the
Fund’s assets to a Subsidiary will vary over time and will likely not include all of the different types of investments described herein at any given time. The Fund will treat a Subsidiary’s assets as assets of the Fund for purposes of determining compliance with various provisions of the 1940 Act applicable to the Fund, including those relating to investment policies (Section 8), affiliated transactions and custody (Section 17) and capital structure and leverage (Section 18). In addition, PIMCO and the Fund’s Board of Trustees will comply with the provisions of Section 15 of the 1940 Act with respect to a Subsidiary’s investment advisory contract.
The Fund may invest, either directly or indirectly through its Subsidiaries, in shares, certificates, notes or other securities issued by a special purpose entity (“SPE”) sponsored by an alternative lending platform or its affiliates (the “Sponsor”) that represent the right to receive principal and interest payments due on pools of whole loans or fractions of whole loans, which may (but may not) be issued by the Sponsor, held by the SPE (“Alt Lending ABS”). Any such Alt Lending ABS may be backed by consumer, commercial, residential or other loans, including those issued by an SPE sponsored by an online or alternative lending platform or an affiliate thereof.
The Fund may seek to originate loans, including, without limitation, residential and/or commercial real estate or mortgage-related loans, corporate loans, consumer loans or other types of loans, which may be in the form of whole loans, secured and unsecured notes, senior and second lien loans, mezzanine loans, bridge loans or similar investments. When investing in or originating loans, the Fund is not restricted by any particular credit risk criteria and/or qualifications. The Fund also is not limited in the amount, size or type of loans it may invest in or originate, including with respect to a single borrower, other than pursuant to any applicable law. The loans the Fund invests in and/or originates may vary in maturity and/or duration. The Fund’s investments in and/or origination of loans may also be limited by the Fund’s intention to qualify as a regulated investment company. The Fund may seek to originate loans through its Subsidiaries (and for purposes of this disclosure, references to the Fund originating loans also shall refer to a loan originated by any applicable Subsidiary-accordingly, the Fund intends to “look through” any Subsidiary for purposes of determining compliance of loan-related investments with any applicable investment guidelines or covenants of any borrowings or preferred shares of the Fund, if any).
Borrowers of loans may be, but are not limited to, corporations and/or other legal entities and individuals, including foreign
(non-U.S.)
and emerging market entities and individuals. Direct loans between the Fund and a borrower may not be administered by an underwriter or agent bank. The Fund may provide financing to borrowers directly or through companies acquired (or created) and owned by or otherwise
|
|
|
|
|
|
|
|
|
|
|
|
| |
| |
|
|
ANNUAL REPORT |
|
|
| |
|
|
JUNE 30, 2025 |
|
|
199 |
|
|
|
|
| |
Principal Investment Strategies |
|
|
|
|
affiliated with the Fund. The terms of the direct loans, including the duration of the loan, may be negotiated with borrowers in private transactions. A loan may be secured or unsecured.
In making a direct loan, the Fund is exposed to the risk that the borrower may default or become insolvent and, consequently, that the Fund will lose money on the loan. Furthermore, direct loans may subject the Fund to liquidity and interest rate risk and certain direct loans may be deemed illiquid. Direct loans are not publicly traded and may not have a secondary market. The lack of a secondary market for direct loans may have an adverse impact on the ability of the Fund to dispose of a direct loan and/or to value the direct loan.
When engaging in direct lending, the Fund’s performance may depend, in part, on the ability of the Fund to originate loans on advantageous terms. In originating and purchasing loans, the Fund will often compete with a broad spectrum of lenders. Increased competition for, or a diminishment in the available supply of, qualifying loans could result in lower yields on and/or less advantageous terms of such loans, which could reduce Fund performance.
As part of its lending activities, the Fund may originate loans to entities that are experiencing significant financial or business difficulties, including entities involved in bankruptcy or other reorganization and liquidation proceedings or that are rated “below investment grade” by an NRSRO or not rated at all. Although the terms of such financing may result in significant financial returns to the Fund, they involve a substantial degree of risk. The level of analytical sophistication, both financial and legal, necessary for successful financing to entities experiencing significant business and financial difficulties is unusually high. Different types of assets may be used as collateral for the Fund’s loans and, accordingly, the valuation of and risks associated with such collateral will vary by loan. There is no assurance that the Fund will correctly evaluate the value of the assets collateralizing the Fund’s loans or the prospects for a successful reorganization or similar action. In any reorganization or liquidation proceeding relating to a company that the Fund funds, the Fund may lose all or part of the amounts advanced to the borrower or may be required to accept collateral with a value less than the amount of the loan advanced by the Fund or its affiliates to the borrower. Furthermore, in the event of a default by a borrower, the Fund may have difficulty disposing of the assets used as collateral for a loan.
Various state licensing requirements could apply to the Fund with respect to the origination, acquisition, holding, servicing, foreclosure and/or disposition of, loans and similar assets. The licensing requirements could apply depending on the location of the borrower, the location of the collateral securing the loan, or the location where the Fund or PIMCO operates or has offices. In states in which it is
licensed, the Fund or PIMCO will be required to comply with applicable laws and regulations, including consumer protection and anti-fraud laws, which could impose restrictions on the Fund’s or PIMCO’s ability to take certain actions to protect the value of its holdings in such assets and impose compliance costs. Failure to comply with such laws and regulations could lead to, among other penalties, a loss of the Fund’s or PIMCO’s license, which in turn could require the Fund to divest assets located in or secured by real property located in that state. These risks will also apply to issuers and entities in which the Fund invests that hold similar assets, as well as any origination company or servicer in which the Fund owns an interest. Loan origination and servicing companies are routinely involved in legal proceedings concerning matters that arise in the ordinary course of their business. These legal proceedings range from actions involving a single plaintiff to class action lawsuits with potentially tens of thousands of class members. In addition, a number of participants in the loan origination and servicing industry (including control persons of industry participants) have been the subject of regulatory actions by state regulators, including state Attorneys General, and by the federal government. Governmental investigations, examinations or regulatory actions, or private lawsuits, including purported class action lawsuits, may adversely affect such companies’ financial results. To the extent the Fund seeks to engage in origination and/or servicing directly, or has a financial interest in, or is otherwise affiliated with, an origination or servicing company, the Fund will be subject to enhanced risks of litigation, regulatory actions and other proceedings. As a result, the Fund may be required to pay legal fees, settlement costs, damages, penalties or other charges, any or all of which could materially adversely affect the Fund and its holdings.
In addition to laws governing the activities of lenders and servicers, certain states may require, or may in the future require, purchasers or holders of certain loans, including residential mortgage loans and unsecured consumer loans, to be licensed or registered in order to purchase, hold or foreclose such loans, or, in certain states, to collect a rate of interest above a specified rate. To the extent required or determined to be necessary or advisable by the Fund, the Fund will take appropriate steps intended to address any applicable state licensing requirements, which may include acquiring and holding such loans through structures designed to preempt state licensing laws, in order to pursue its objectives and strategies. To the extent the Fund (or a Subsidiary) obtains licenses or is required to comply with related regulatory requirements as a result of its investments, the Fund could be subject to increased costs and regulatory oversight by governmental authorities, which may have an adverse effect on its results or operations.
|
|
|
|
|
|
| |
200 |
|
PIMCO CLOSED-END FUNDS |
|
|
|
|
The Fund may invest, either directly or indirectly through its Subsidiaries, in Alt Lending ABS backed by consumer, residential or other loans, issued by an SPE sponsored by an online or alternative lending platform or an affiliate thereof.
When acquiring and/or originating loans, or purchasing Alt Lending ABS, the Fund is not restricted by any particular borrower credit risk criteria and/or qualifications. Accordingly, certain loans acquired or originated by the Fund or underlying any Alt Lending ABS purchased by the Fund may be subprime in quality, or may become subprime in quality.
The Fund may enter into repurchase agreements, in which the Fund purchases a security from a bank or broker-dealer and the bank or broker-dealer agrees to repurchase the security at the Fund’s cost plus interest within a specified time.
For the purpose of achieving income, the Fund may lend its portfolio securities to brokers, dealers or other financial institutions provided a number of conditions are satisfied, including that the loan is fully collateralized.
The length of time the Fund has held a particular security is not generally a consideration in investment decisions. A change in the securities held by the Fund is known as “portfolio turnover.” The Fund may engage in frequent and active trading of portfolio securities to achieve its investment objectives, particularly during periods of volatile market movements.
There have been no significant changes in the Fund’s portfolio turnover rates over the last two fiscal years, and no significant change to the portfolio turnover rates of the Fund described in the Financial Highlights can currently be predicted.
The Fund has received exemptive relief from the SEC that, to the extent the Fund relies on such relief, permits it to (among other things)
co-invest
with certain other persons, including certain affiliates of the Investment Manager and certain public or private funds managed by the Investment Manager and its affiliates, subject to certain terms and conditions. The exemptive relief from the SEC with respect to
co-investments
imposes extensive conditions on any
co-investments
made in reliance on such relief.
Temporary Defensive Investments.
The Fund may make short-term investments when attempting to respond to adverse market, economic, political, or other conditions, as determined by PIMCO. Upon PIMCO’s recommendation, for temporary defensive purposes or in order to keep its cash fully invested, the Fund may deviate from its investment strategy by investing some or all of its total assets in investments such as high grade debt securities, including high quality, short-term debt securities, and cash and cash equivalents. The Fund may not achieve its investment objectives when it does so.
The Fund may obtain leverage through reverse repurchase agreements, dollar rolls/buybacks or borrowings, such as bank loans, commercial paper, credit facilities and/or other transactions. The Fund may also enter into other transactions that may give rise to a form of leverage including, among others, selling credit default swaps, futures and forward contracts (including foreign currency exchange contracts), total return swaps and other derivative transactions, loans of portfolio securities, short sales and when-issued, delayed-delivery and forward commitment transactions. The Fund may also determine to issue preferred shares or other types of senior securities to add leverage to its portfolio. The Fund’s Board may authorize the issuance of preferred shares without the approval of Common Shareholders. If the Fund issues preferred shares in the future, all costs and expenses relating to the issuance and ongoing maintenance of the preferred shares will be borne by the Common Shareholders, and these costs and expenses may be significant. Leveraging transactions pursued by the Fund may increase its duration and sensitivity to interest rate movements. Leveraging is a speculative technique and there are special risks and costs involved. There can be no assurance that a leveraging strategy will be used or that it will be successful during any period in which it is employed.
Under normal market conditions, the Fund will limit its use of leverage, subject to the limitations set forth in the 1940 Act, from any combination of (i) reverse repurchase agreements or dollar roll/buyback transactions, (ii) borrowings (i.e., loans or lines of credit from banks or other credit facilities), (iii) any future issuance of preferred shares, and (iv) to the extent described below, credit default swaps, other swap agreements and futures contracts (whether or not these instruments are covered with segregated assets as discussed below), subject to the 50% policy. For these purposes, assets attributable to the use of leverage from credit default swaps, other swap agreements and futures contracts will be determined based on the current market value of the instrument if it is cash settled or based on the notional value of the instrument if it is not cash settled. In addition, assets attributable to credit default swaps, other swap agreements or futures contracts will not be counted towards the 50% policy to the extent that the Fund owns offsetting positions or enters into offsetting transactions.
The Fund intends to utilize certain kinds of leverage, such as reverse repurchase agreements and selling credit default swaps, opportunistically and may choose to increase or decrease, or eliminate entirely, its use of such leverage over time and from time to time based on PIMCO’s assessment of the yield curve environment, interest rate trends, market conditions and other factors.
|
|
|
|
|
|
|
|
|
|
|
|
| |
| |
|
|
ANNUAL REPORT |
|
|
| |
|
|
JUNE 30, 2025 |
|
|
201 |
|
|
|
|
| |
Principal Investment Strategies |
|
|
|
|
The Fund also may borrow money in order to repurchase its shares or as a temporary measure for extraordinary or emergency purposes, including for the payment of dividends or the settlement of securities transactions which otherwise might require untimely dispositions of portfolio securities held by the Fund.
PIMCO Access Income Fund (“PAXS”)
The Fund’s investment objective is to seek current income as a primary objective and capital appreciation as a secondary objective.
The Fund seeks to achieve its investment objectives by utilizing a dynamic asset allocation strategy among multiple sectors in the global public and private credit markets, including corporate debt (including, among other things, fixed-, variable- and floating-rate bonds, loans (including, but not limited to, bank and/or other syndicated loans and
non-syndicated
(private direct) loans), convertible securities and stressed, distressed and defaulted debt securities issued by U.S. or foreign
(non-U.S.)
corporations or other business entities, including emerging market issuers), mortgage-related and other asset-backed instruments, government and sovereign debt, taxable municipal bonds and other fixed-, variable- and floating-rate income-producing securities of U.S. and foreign issuers, including emerging market issuers and real estate-related investments (such real estate-related investments, collectively, “real estate investments”). Real estate related investments include, but are not limited to, CMBS, commercial real estate CLOs, preferred equity issued by real estate investment trusts or companies that develop, own and operate commercial real estate assets, mezzanine loans backed by commercial real estate assets, and securities issued by publicly-traded real estate investment trusts. The Fund may invest without limitation in investment grade debt securities and below investment grade debt securities (commonly referred to as “high yield” securities or “junk bonds”), including securities of stressed, distressed or defaulted issuers. However, the Fund will not normally invest more than 20% of its total assets in debt instruments, other than mortgage-related and other asset-backed securities (“ABS”), that are, at the time of purchase, rated CCC+ or lower by S&P Global Ratings (“S&P”) and Fitch, Inc. (“Fitch”) and Caa1 or lower by Moody’s Ratings (“Moody’s”), or that are unrated but determined by PIMCO to be of comparable quality to securities so rated. The types of securities and instruments in which the Fund may invest are described under “Portfolio Contents — Principal Investments” below. The Fund cannot assure you that it will achieve its investment objectives or that the Fund’s investment program will be successful, and you could lose all of your investment in the Fund.
Portfolio Management Strategies
Dynamic Allocation Strategy.
In managing the Fund, the Fund’s investment manager, PIMCO, employs an active approach to
allocation among multiple fixed income sectors based on, among other things, market conditions, valuation assessments, economic outlook, credit market trends and other economic factors. With PIMCO’s macroeconomic analysis as the basis for
top-down
investment decisions, including geographic and credit sector emphasis, PIMCO manages the Fund with a focus on seeking income generating investment ideas across multiple fixed income sectors, including opportunities in developed and emerging global credit markets. PIMCO may choose to focus on particular countries/regions, asset classes, industries and sectors to the exclusion of others at any time and from time to time based on market conditions and other factors. The relative value assessment within fixed income sectors draws on PIMCO’s regional and sector specialist insights.
As a matter of fundamental policy, the Fund will normally invest at least 25% of its total assets (i.e., concentrate) in real estate investments and mortgage-related assets issued by government agencies or other governmental entities or by private originators or issuers. The Fund will observe various other investment guidelines as summarized below.
Investment Selection Strategies.
Once the Fund’s
top-down,
portfolio positioning decisions have been made as described above, PIMCO selects particular investments for the Fund by employing a
bottom-up,
disciplined credit approach which is driven by fundamental, independent research within each sector/asset class represented in the Fund, with a focus on identifying securities and other instruments with solid and/or improving fundamentals.
PIMCO utilizes strategies that focus on credit quality analysis, duration management and other risk management techniques. PIMCO attempts to identify, through fundamental research driven by independent credit analysis and proprietary analytical tools, debt obligations and other income-producing securities that provide current income and/or opportunities for capital appreciation based on its analysis of the issuer’s credit characteristics and the position of the security in the issuer’s capital structure.
Consideration of yield is only one component of the portfolio managers’ approach in managing the Fund. PIMCO also attempts to identify investments that may appreciate in value based on PIMCO’s assessment of the issuer’s credit characteristics, forecast for interest rates and outlook for particular countries/regions, currencies, industries, sectors and the global economy and bond markets generally. In selecting investments for the Fund, PIMCO may use proprietary quantitative models that are developed and maintained by PIMCO, and which are subject to change over time without notice in PIMCO’s discretion.
|
|
|
|
|
|
| |
202 |
|
PIMCO CLOSED-END FUNDS |
|
|
|
|
Credit Quality.
The Fund may invest without limitation in debt instruments that are, at the time of purchase, rated below investment grade (below Baa3 by Moody’s Ratings (“Moody’s”) or below
BBB-
by either S&P Global Ratings (“S&P”) or Fitch Ratings, Inc. (“Fitch”)), or that are unrated but determined by PIMCO to be of comparable quality to securities so rated. However, the Fund will not normally invest more than 20% of its total assets in debt instruments, other than mortgage-related and other ABS, that are, at the time of purchase, rated CCC+ or lower by S&P and Fitch and Caa1 or lower by Moody’s, or that are unrated but determined by PIMCO to be of comparable quality to securities so rated. The Fund may invest without limitation in mortgage-related and other ABS regardless of rating (i.e., of any credit quality). For purposes of applying the foregoing policies, in the case of securities with split ratings (i.e., a security receiving two different ratings from two different rating agencies), the Fund will apply the higher of the applicable ratings. Subject to the aforementioned investment guidelines, the Fund may invest in securities of stressed, distressed or defaulted issuers, which include securities in default or at risk of being in default as to the repayment of principal and/or interest at the time of acquisition by the Fund or that are rated in the lower rating categories by one or more nationally recognized statistical rating organizations (“NRSROs”) (for example, Ca or lower by Moody’s or CC or lower by S&P or Fitch) or, if unrated, are determined by PIMCO to be of comparable quality. Debt instruments of below investment grade quality are regarded as having predominantly speculative characteristics with respect to capacity to pay interest and to repay principal, and are commonly referred to as “high yield” securities or “junk bonds.” Debt instruments in the lowest investment grade category also may be considered to possess some speculative characteristics. The Fund may, for hedging, investing or leveraging purposes, make use of credit default swaps (which includes buying and/or selling credit default swaps), which are contracts whereby one party makes periodic payments to a counterparty in exchange for the right to receive from the counterparty a payment equal to the par (or other agreed-upon) value of a referenced debt obligation in the event of a default or other credit event by the issuer of the debt obligation.
Independent Credit Analysis.
PIMCO relies primarily on its own analysis of the credit quality and risks associated with individual debt instruments considered for the Fund, rather than relying exclusively on rating agencies or third-party research. The Fund’s portfolio managers utilize this information in an attempt to manage credit risk and identify issuers, industries or sectors that are undervalued and/or that offer attractive yields relative to PIMCO’s assessment of their credit characteristics. This aspect of PIMCO’s capabilities will be particularly important to the extent that the Fund invests in high yield securities and in securities of emerging market issuers.
Duration Management.
It is expected that the Fund normally will have a short to intermediate average portfolio
duration
(i.e., within a zero to eight (0 to 8) year range), as calculated by PIMCO, although it may be shorter or longer at any time depending on market conditions and other factors. While the Fund seeks to maintain a short to intermediate average portfolio duration, there is no limit on the maturity or duration of any individual security in which the Fund may invest. Duration is a measure used to determine the sensitivity of a security’s price to changes in interest rates. For example, if the Fund has an average portfolio duration of eight years, a 1% increase in interest rates would tend to correspond to an 8% decrease in the value of the Fund’s portfolio. The Fund’s duration strategy may entail maintaining a negative average portfolio duration from time to time, meaning the portfolio would tend to increase in value in response to an increase in interest rates. For example, if the Fund has a negative average portfolio duration, a 1% increase in interest rates would tend to correspond to a 1% increase in the value of the Fund’s portfolio for every year of negative duration. A negative average portfolio duration would potentially benefit the Fund’s portfolio in an environment of rising market interest rates, but would generally adversely impact the portfolio in an environment of falling or neutral market interest rates. The Fund may use various derivatives strategies to manage (increase or decrease) the dollar-weighted average effective duration of the Fund’s portfolio. PIMCO may also utilize certain strategies, including without limitation investments in structured notes or interest rate futures contracts or swap, cap, floor or collar transactions, for the purpose of reducing the interest rate sensitivity of the Fund’s portfolio, although there is no assurance that it will do so or that such strategies will be successful. The foregoing is a description of interest rate duration management only. The credit spread duration of the Fund’s portfolio may vary, in some cases significantly, from its interest rate duration.
The Fund normally invests worldwide in a portfolio of debt obligations and other income-producing securities and instruments of any type and credit quality and with varying maturities and related derivative instruments.
The Fund’s portfolio of debt obligations and other income producing securities and instruments may include, without limitation, bonds, debentures, notes, and other debt securities and similar instruments of varying maturities issued by various U.S. and foreign
(non-U.S.)
corporate and other issuers, including corporate debt securities; commercial paper; securitizations and mortgage-related and other asset-backed instruments issued by government agencies or other governmental entities or by private originators or issuers (including agency and
non-agency
residential mortgage-backed securities
|
|
|
|
|
|
|
|
|
|
|
|
| |
| |
|
|
ANNUAL REPORT |
|
|
| |
|
|
JUNE 30, 2025 |
|
|
203 |
|
|
|
|
| |
Principal Investment Strategies |
|
|
|
|
(“RMBS”) and commercial mortgage-backed securities (“CMBS”), collateralized bond obligations (“CBOs”), collateralized mortgage obligations (“CMOs”), collateralized loan obligations (“CLOs”), other collateralized debt obligations (“CDOs”) and other similarly structured securities, including the residual or equity tranches thereof); derivatives on mortgage-related instruments; U.S. government securities; obligations of foreign governments or their
sub-divisions,
agencies and government sponsored enterprises and obligations of international agencies and supranational entities; municipal securities and other debt securities issued by states or local governments and their agencies, authorities and other government-sponsored enterprises, including taxable municipal securities (such as Build America Bonds);
securities (“PIKs”);
step-ups;
zero-coupon
bonds; inflation-indexed bonds issued by both governments and corporations; structured notes, including hybrid or indexed securities; insurance-linked investments, catastrophe bonds and other event-linked bonds; credit-linked notes; credit-linked trust instruments; structured credit products; loans (including, among others, and without limitation as to a loan’s level of seniority within a capital structure, bank loans, whole loans, senior loans, subordinated loans, mezzanine loans, delayed draw and delayed funding loans, covenant-lite obligations, revolving credit facilities and loan participations and assignments, loans held and/or originated by private financial institutions, including commercial and residential mortgage loans, corporate loans and consumer loans (such as credit card receivables, automobile loans and student loans)); preferred securities; convertible debt securities (i.e., debt securities that may be converted at either a stated price or stated rate into underlying shares of common stock), including synthetic convertible debt securities (i.e., instruments created through a combination of separate securities that possess the two principal characteristics of a traditional convertible security, such as an income-producing security and the right to acquire an equity security)and contingent convertible securities (“CoCos”); bank capital securities; and bank certificates of deposit, fixed time deposits and bankers’ acceptances. The rate of interest on an income-producing security may be fixed, floating or variable, and may move in the opposite direction to interest rates generally or the interest rate on another security or index. Certain corporate income-producing securities, such as convertible bonds, also may include the right to participate in equity appreciation.
The Fund may invest in debt securities of stressed, distressed or defaulted issuers as well as in defaulted or unrated investments and
financings. For tax or other structuring reasons, the Fund may purchase a loan or debt investment structured as an equity interest (e.g., a joint venture interest). At any given time and from time to time, all of the Fund’s portfolio may consist of below investment grade securities and/or mortgage-related or other types of
ABS. The Fund may invest in securitization risk retention tranches in the capacity of a third-party purchaser with respect to securitizations sponsored by others. The Fund may invest without limitation in investment grade debt securities and below investment grade debt securities (commonly referred to as “high yield” securities or “junk bonds”), including securities of stressed, distressed or defaulted issuers. For tax or other structuring reasons, the Fund may purchase loan or debt investment structured as an equity interest (e.g., a joint venture interest). The Fund may invest in any level of the capital structure of an issuer of mortgage-backed or asset-backed instruments (including CBOs, CLOs and other CDOs), including the equity or “first loss” tranche. The Fund may invest in unsecured loans and subordinated or mezzanine obligations, including second and lower lien loans and the mezzanine and equity (or “first loss”) tranches of CLO issues.
The Fund may invest in U.S. and
non-U.S.
(including emerging markets) real estate investments, including equity or debt securities issued by private and public real estate investment trusts (“REITs”) or real estate operating companies (“REOCs”), private or public real estate-related loans and real estate-linked derivative instruments.
The Fund may invest in and/or originate loans, including, without limitation, to corporations and/or other legal entities and individuals (including foreign
(non-U.S.)
and emerging market entities and individuals) and/or residential and/or commercial real estate or mortgage-related loans, consumer loans or other types of loans, which may be in the form of, and without limitation as to a loan’s level of seniority within a capital structure, whole loans, assignments, participations, secured and unsecured notes, senior and second lien loans, mezzanine loans, bridge loans or similar investments. Such borrowers may have credit ratings that are determined by one or more NRSROs and/or PIMCO to be below investment grade. This may include loans to public or private firms or individuals, such as in connection with housing development projects. The loans the Fund invests in or originates may vary in maturity and/or duration. The Fund will not normally invest more than 25% of its total assets in whole loans that the Fund has directly originated; however, otherwise, the Fund is not limited in the amount, size or type of loans it may invest in and/or originate, including with respect to a single borrower or with respect to borrowers that are determined to be below investment grade, other than pursuant to any applicable law. The Fund’s investment in or origination of loans may also be limited by the requirements the Fund intends to observe under Subchapter M of the Internal Revenue Code of 1986, as amended (the “Code”), in order to qualify as a regulated investment company (“RIC”). The Fund may invest in securitization risk retention tranches in the capacity of a third-party purchaser with respect to securitizations sponsored by others. The Fund may seek to originate loans, including through its
|
|
|
|
|
|
| |
204 |
|
PIMCO CLOSED-END FUNDS |
|
|
|
|
Subsidiaries (and for purposes of this disclosure, references to the Fund originating loans also shall refer to a loan originated by any applicable Subsidiary — accordingly, the Fund intends to “look through” any Subsidiary for purposes of determining compliance of loan-related investments with any applicable investment guidelines or covenants of any borrowings or preferred shares of the Fund, if any).
Borrowers of loans may be, but are not limited to, corporations and/or other legal entities and individuals, including foreign
(non-U.S.)
and emerging market entities and individuals. Direct loans between the Fund and a borrower may not be administered by an underwriter or agent bank. The Fund may provide financing to borrowers directly or through companies acquired (or created) and owned by or otherwise affiliated with the Fund. The terms of the direct loans, including the duration of the loan, may be negotiated with borrowers in private transactions. A loan may be secured or unsecured.
In making a direct loan, the Fund is exposed to the risk that the borrower may default or become insolvent and, consequently, that the Fund will lose money on the loan. Furthermore, direct loans may subject the Fund to liquidity and interest rate risk and certain direct loans may be deemed illiquid. Direct loans are not publicly traded and may not have a secondary market. The lack of a secondary market for direct loans may have an adverse impact on the ability of the Fund to dispose of a direct loan and/or to value the direct loan.
When engaging in direct lending, the Fund’s performance may depend, in part, on the ability of the Fund to originate loans on advantageous terms. In originating and purchasing loans, the Fund will often compete with a broad spectrum of lenders. Increased competition for, or a diminishment in the available supply of, qualifying loans could result in lower yields on and/or less advantageous terms of such loans, which could reduce Fund performance.
As part of its lending activities, the Fund may originate loans to entities that are experiencing significant financial or business difficulties, including entities involved in bankruptcy or other reorganization and liquidation proceedings or that are rated “below investment grade” by an NRSRO or not rated at all. Although the terms of such financing may result in significant financial returns to the Fund, they involve a substantial degree of risk. The level of analytical sophistication, both financial and legal, necessary for successful financing to entities experiencing significant business and financial difficulties is unusually high. Different types of assets may be used as collateral for the Fund’s loans and, accordingly, the valuation of and risks associated with such collateral will vary by loan. There is no assurance that the Fund will correctly evaluate the value of the assets collateralizing the Fund’s loans or the prospects for a successful reorganization or similar action. In any reorganization or liquidation
proceeding relating to a company that the Fund funds, the Fund may lose all or part of the amounts advanced to the borrower or may be required to accept collateral with a value less than the amount of the loan advanced by the Fund or its affiliates to the borrower. Furthermore, in the event of a default by a borrower, the Fund may have difficulty disposing of the assets used as collateral for a loan.
Various state licensing requirements could apply to the Fund with respect to the origination, acquisition, holding, servicing, foreclosure and/or disposition of, loans and similar assets. The licensing requirements could apply depending on the location of the borrower, the location of the collateral securing the loan, or the location where the Fund or PIMCO operates or has offices. In states in which it is licensed, the Fund or PIMCO will be required to comply with applicable laws and regulations, including consumer protection and anti-fraud laws, which could impose restrictions on the Fund’s or PIMCO’s ability to take certain actions to protect the value of its holdings in such assets and impose compliance costs. Failure to comply with such laws and regulations could lead to, among other penalties, a loss of the Fund’s or PIMCO’s license, which in turn could require the Fund to divest assets located in or secured by real property located in that state. These risks will also apply to issuers and entities in which the Fund invests that hold similar assets, as well as any origination company or servicer in which the Fund owns an interest. Loan origination and servicing companies are routinely involved in legal proceedings concerning matters that arise in the ordinary course of their business. These legal proceedings range from actions involving a single plaintiff to class action lawsuits with potentially tens of thousands of class members. In addition, a number of participants in the loan origination and servicing industry (including control persons of industry participants) have been the subject of regulatory actions by state regulators, including state Attorneys General, and by the federal government. Governmental investigations, examinations or regulatory actions, or private lawsuits, including purported class action lawsuits, may adversely affect such companies’ financial results. To the extent the Fund seeks to engage in origination and/or servicing directly, or has a financial interest in, or is otherwise affiliated with, an origination or servicing company, the Fund will be subject to enhanced risks of litigation, regulatory actions and other proceedings. As a result, the Fund may be required to pay legal fees, settlement costs, damages, penalties or other charges, any or all of which could materially adversely affect the Fund and its holdings.
In addition to laws governing the activities of lenders and servicers, certain states may require, or may in the future require, purchasers or holders of certain loans, including residential mortgage loans and unsecured consumer loans, to be licensed or registered in order to purchase, hold or foreclose such loans, or, in certain states, to collect a rate of interest above a specified rate. To the extent required or
|
|
|
|
|
|
|
|
|
|
|
|
| |
| |
|
|
ANNUAL REPORT |
|
|
| |
|
|
JUNE 30, 2025 |
|
|
205 |
|
|
|
|
| |
Principal Investment Strategies |
|
|
|
|
determined to be necessary or advisable by the Fund, the Fund will take appropriate steps intended to address any applicable state licensing requirements, which may include acquiring and holding such loans through structures designed to preempt state licensing laws, in order to pursue its objectives and strategies. To the extent the Fund (or a fully-owned Subsidiary) obtains licenses or is required to comply with related regulatory requirements as a result of its investments, the Fund could be subject to increased costs and regulatory oversight by governmental authorities, which may have an adverse effect on its results or operations.
The Fund may invest either directly or indirectly through its Subsidiaries in shares, certificates, notes or other securities issued by a special purpose entity (“SPE”) sponsored by an alternative lending platform (i.e., an online lending marketplace or lender that is not a traditional banker, such as a bank) or its affiliates (the “Sponsor”) that represent the right to receive principal and interest payments due on pools of whole loans or fractions of whole loans, which may (but may not) be issued by the Sponsor, held by the SPE (“Alt Lending ABS”). Any such Alt Lending ABS may be backed by consumer, commercial, residential or other loans, including those issued by an SPE sponsored by an online or alternative lending platform or an affiliate thereof.
When acquiring and/or originating loans or purchasing Alt Lending ABS, the Fund is not restricted by any particular borrower credit risk criteria and/or qualifications. Accordingly, certain loans acquired by the Fund or underlying any Alt Lending ABS purchased by the Fund may be subprime in quality, or may become subprime in quality.
The Fund may normally invest up to 40% of its total assets in bank loans (including, among others, senior loans, delayed draw and delayed funding loans, covenant-lite obligations, revolving credit facilities and loan participations and assignments). The Fund will not normally invest more than 10% of its total assets in convertible debt securities (i.e., debt securities that may be converted at either a stated price or stated rate into underlying shares of common stock).
The Fund may invest without limitation in securities of U.S. issuers. Subject to the limit described below on investments in securities and instruments that are economically tied to emerging market countries, the Fund may invest without limitation in securities of foreign
(non-U.S.)
issuers, securities traded principally outside of the United States and securities denominated in currencies other than the U.S. dollar. The Fund may invest without limitation in investment grade sovereign debt denominated in the relevant country’s local currency with less than one year remaining to maturity (“short-term investment grade sovereign debt”), including short-term investment grade sovereign debt issued by emerging market issuers. The Fund may invest up to 30% of its total assets in securities and instruments that are economically tied to emerging market countries other than
investments in short-term investment grade sovereign debt issued by emerging market issuers, where, as noted above, there is no limit. The Fund may also invest directly in foreign currencies, including local emerging market currencies.
As a matter of fundamental policy, the Fund will normally invest at least 25% of its total assets (i.e., concentrate) in real estate investments and mortgage-related assets issued by government agencies or other governmental entities or by private originators or issuers.
The Fund may, but is not required to, utilize various derivative strategies (both long and short positions) involving the purchase or sale of futures and forward contracts (including foreign currency exchange contracts), call and put options, credit default swaps, total return swaps, basis swaps and other swap agreements and other derivative instruments for investment purposes, leveraging purposes or in an attempt to hedge against market, credit, interest rate, currency and other risks in the portfolio. The Fund may purchase and sell securities on a when-issued, delayed delivery or forward commitment basis and may engage in short sales. The Fund may use derivative instruments for other purposes, including to seek to increase liquidity, provide efficient portfolio management, broaden investment opportunities (including taking short or negative positions), implement a tax or cash management strategy, gain exposure to a particular security or segment of the market, modify the effective duration of the Fund’s portfolio investments and/or enhance total return.
The Fund may invest in equity interests, such as shares of other investment companies (including those advised by PIMCO), including
open-end
or
closed-end
management investment companies and exchange-traded funds (“ETFs”) and exchange-traded REITs. The Fund may invest in pooled investment vehicles other than registered investment companies that rely on exemptions from registration pursuant to Section 3(c) of the 1940 Act, including, for example, real estate-related companies relying on Section 3(c)(5). The Fund will not invest more than 15% of its net assets in pooled investment vehicles that would be investment companies, as defined in Section 3 of the 1940 Act, but for Section 3(c)(1) or 3(c)(7) of the 1940 Act, provided however, that such limitation does not apply to REITs and asset-backed issuers, including, without limitation, CLOs, CBOs and other CDOs, residential mortgage-backed securities (“RMBS”), CMBS, CMOs and tender option bonds. The Fund may also invest without limitation in preferred securities. Equity interests may be issued by public or private issuers. The Fund may invest in securities of companies with any market capitalization, including small, medium and large capitalizations.
The Fund may invest in securities that have not been registered for public sale in the United States or relevant
non-U.S.
jurisdictions,
|
|
|
|
|
|
| |
206 |
|
PIMCO CLOSED-END FUNDS |
|
|
|
|
including without limitation securities eligible for purchase and sale pursuant to Rule 144A under the Securities Act, or relevant provisions of applicable
non-U.S.
law, and other securities issued in private placements. The Fund may invest in securities of other open- or
closed-end
investment companies (including those advised by PIMCO), including, without limitation, ETFs, to the extent that such investments are consistent with the Fund’s investment objectives, strategies and policies and permissible under the 1940 Act. The Fund may invest in securities of companies of any market capitalization, including small and medium capitalizations. The Fund may also invest without limitation in preferred securities. The Fund may seek to gain exposure to certain newly-issued Regulation S securities through investments in a Cayman Subsidiary. Regulation S securities are securities of U.S. and
non-U.S.
issuers that are issued through private offerings without registration with the SEC pursuant to Regulation S under the Securities Act. Any Cayman Subsidiary will be advised by PIMCO, and shall have the same investment objectives as the Fund. . A Cayman Subsidiary (unlike the Fund) may invest without limitation in Regulation S securities. The Fund may invest without limitation in illiquid investments (i.e., investments that the Fund reasonably expects cannot be sold or disposed of in current market conditions in seven calendar days or less without the sale or disposition significantly changing the market value of the investment).
The Fund may make investments in debt instruments and other securities or instruments directly or through one or more Subsidiaries. Each Subsidiary, for example, may invest in or originate loans or invest in shares, certificates, notes or other securities representing the right to receive principal and interest payments due on fractions of whole loans or pools of whole loans, risk retention investments or any other security or other instrument that the Fund may hold directly. References herein to the Fund include references to a Subsidiary in respect of the Fund’s investment exposure. The allocation of the Fund’s assets to a Subsidiary will vary over time and will likely not include all of the different types of investments described herein at any given time. The Fund will treat a Subsidiary’s assets as assets of the Fund for purposes of determining compliance with various provisions of the 1940 Act applicable to the Fund, including those relating to investment policies (Section 8), affiliated transactions and custody (Section 17) and capital structure and leverage (Section 18). In addition, PIMCO and the Fund’s Board of Trustees will comply with the provisions of Section 15 of the 1940 Act with respect to such a Subsidiary’s investment advisory contract.
There have been no significant changes in the Fund’s portfolio turnover rates over the last two fiscal years, and no significant change to the portfolio turnover rates of the Fund described in the Financial Highlights can currently be predicted.
The Fund has received exemptive relief from the SEC that, to the extent the Fund relies on such relief, permits it to, among other things,
co-invest
with certain other persons, including certain affiliates of PIMCO and certain public or private funds managed by the PIMCO and its affiliates, subject to certain terms and conditions. The exemptive relief from the SEC with respect to
co-investments
imposes extensive conditions on any
co-investments
made in reliance on such relief.
Temporary Defensive Investments.
The Fund may make short-term investments when attempting to respond to adverse market, economic, political, or other conditions, as determined by PIMCO. Upon PIMCO’s recommendation, for temporary defensive purposes or in order to keep its cash fully invested, the Fund may deviate from its investment strategy by investing some or all of its total assets in investments such as high grade debt securities, including high quality, short-term debt securities, and cash and cash equivalents. The Fund may not achieve its investment objectives when it does so.
The Fund currently utilizes leverage principally through reverse repurchase agreements. The Fund may also enter into transactions other than through reverse repurchase agreements that may give rise to a form of leverage including, among others, (i) selling credit default swaps, (ii) dollar rolls/buy backs, (iii) borrowings, such as through bank loans or commercial paper and/or other credit facilities, (iv) futures and forward contracts (including foreign currency exchange contracts), (v) total return swaps, (vi) other derivative transactions, (vii) loans of portfolio securities, (viii) short sales and (ix) when-issued, delayed delivery and forward commitment transactions. The Fund may also determine to issue preferred shares or other types of senior securities to add leverage to its portfolio. By using leverage, the Fund will seek to obtain a higher return for holders of common shares than if the Fud did not use leverage. The Fund’s Board may authorize the issuance of preferred shares without the approval of Common Shareholders. If the Fund issues preferred shares in the future, all costs and expenses relating to the issuance and ongoing maintenance of the preferred shares will be borne by the Common Shareholders, and these costs and expenses may be significant.
Under normal market conditions, the Fund will limit its use of leverage, subject to the limitations set forth in the 1940 Act, from any combination of (i) reverse repurchase agreements, (ii) borrowings (i.e., loans or lines of credit from banks or other credit facilities), (iii) any future issuance of preferred shares, and (iv) to the extent described below, credit default swaps, other swap agreements and futures contracts such that the assets attributable to the use of such leverage will not exceed 50% of the Fund’s total assets (including, for purposes of the 50% limit, the amount of assets obtained through the use of such instruments). For these purposes, assets attributable to the
|
|
|
|
|
|
|
|
|
|
|
|
| |
| |
|
|
ANNUAL REPORT |
|
|
| |
|
|
JUNE 30, 2025 |
|
|
207 |
|
|
|
|
| |
Principal Investment Strategies |
|
|
|
|
use of leverage from credit default swaps, other swap agreements and futures contracts will be determined based on the current market value of the instrument if it is cash settled or based on the notional value of the instrument if it is not cash settled. In addition, assets attributable to credit default swaps, other swap agreements or futures contracts will not be counted towards the 50% policy to the extent that the Fund owns offsetting positions or enters into offsetting transactions. Depending upon market conditions and other factors, the Fund may or may not determine to add leverage following an offering to maintain or increase the total amount of leverage (as a percentage of the Fund’s total assets) that the Fund currently maintains, taking into account the additional assets raised through the issuance of Common Shares in such offering.
The Fund intends to utilize certain kinds of leverage, such as reverse repurchase agreements and selling credit default swaps, opportunistically and may choose to increase or decrease, or eliminate entirely, its use of such leverage over time and from time to time based on PIMCO’s assessment of the yield curve environment, interest rate trends, market conditions and other factors.
The Fund also may borrow money in order to repurchase its shares or as a temporary measure for extraordinary or emergency purposes, including for the payment of dividends or the settlement of securities transactions which otherwise might require untimely dispositions of portfolio securities held by the Fund.
PIMCO Dynamic Income Strategy Fund (“PDX”)
The Fund seeks current income as a primary objective and capital appreciation as a secondary objective.
The Fund seeks to achieve its investment objectives by utilizing a dynamic asset allocation strategy among multiple sectors in the global public and private credit markets, including corporate debt (including, among other things, fixed-, variable- and floating-rate bonds, loans, convertible securities and stressed, distressed and defaulted debt securities issued by U.S. or
foreign (non-U.S.) corporations
or other business entities, including emerging market issuers), mortgage-related and other asset-backed instruments, government and sovereign debt, taxable municipal bonds and other fixed-, variable- and floating-rate income-producing securities of U.S. and foreign issuers, including emerging market issuers and real estate-related investments (such real estate-related investments, collectively, “real estate investments”). The Fund may invest without limitation in investment grade debt securities and below investment grade debt securities (commonly referred to as “high yield” securities or “junk bonds”), including securities of stressed, distressed or defaulted issuers. The Fund may also invest without limit in common stocks and other common equity securities issued by public or private issuers. The
Fund cannot assure you that it will achieve its investment objectives or that the Fund’s investment program will be successful, and you could lose all of your investment in the Fund.
Portfolio Management Strategies
Dynamic Allocation Strategy
In managing the Fund, the Fund’s investment manager, PIMCO, employs an active approach to allocation among multiple fixed income sectors based on, among other things, market conditions, valuation assessments, economic outlook, credit market trends and other economic factors. With PIMCO’s macroeconomic analysis as the basis
for top-down investment
decisions, including geographic and credit sector emphasis, PIMCO manages the Fund with a focus on seeking income generating investment ideas across multiple fixed income sectors, including opportunities in developed and emerging global credit markets. PIMCO may choose to focus on particular countries/regions, asset classes, industries and sectors to the exclusion of others at any time and from time to time based on market conditions and other factors. The relative value assessment within fixed income sectors draws on PIMCO’s regional and sector specialist insights.
As a matter of fundamental policy, the Fund normally invests at least 25% of its total assets (i.e., concentrates) in the energy industry. PIMCO will, on behalf of the Fund, make reasonable determinations as to the appropriate industry classification to assign to each security or instrument in which the Fund invests. The Fund will observe various other investment guidelines as summarized below.
Investment Selection Strategies
Once the
Fund’s top-down, portfolio
positioning decisions have been made as described above, PIMCO selects particular investments for the Fund by employing
a bottom-up, disciplined
credit approach which is driven by fundamental, independent research within each sector/asset class represented in the Fund, with a focus on seeking to identify securities and other instruments with solid and/or improving fundamentals.
PIMCO utilizes strategies that focus on credit quality analysis, duration management and other risk management techniques. PIMCO attempts to identify, through fundamental research driven by independent credit analysis and proprietary analytical tools, debt obligations and other income-producing securities that provide current income and/or opportunities for capital appreciation based on its analysis of the issuer’s credit characteristics and the position of the security in the issuer’s capital structure.
Consideration of yield is only one component of the portfolio managers’ approach in managing the Fund. PIMCO also attempts to identify investments that may appreciate in value based on PIMCO’s
|
|
|
|
|
|
| |
208 |
|
PIMCO CLOSED-END FUNDS |
|
|
|
|
assessment of the issuer’s credit characteristics, forecast for interest rates and outlook for particular countries/regions, currencies, industries, sectors and the global economy and bond markets generally.
The Fund may invest without limitation in debt instruments that are, at the time of purchase, rated below investment grade (below Baa3 by Moody’s Ratings (“Moody’s”) or
below BBB- by
either S&P Global Ratings (“S&P”) or Fitch Ratings, Inc. (“Fitch”)), or that are unrated but determined by PIMCO to be of comparable quality to securities so rated. However, the Fund will not normally invest more than 20% of its total assets in debt instruments, other than mortgage-related and other asset-backed securities (“ABS”), that are, at the time of purchase, rated CCC+ or lower by S&P and Fitch and Caa1 or lower by Moody’s, or that are unrated but determined by PIMCO to be of comparable quality to securities so rated. The Fund may invest without limitation in mortgage-related and other ABS regardless of rating (i.e., of any credit quality). For purposes of applying the foregoing policies, in the case of securities with split ratings (i.e., a security receiving two different ratings from two different rating agencies), the Fund will apply the higher of the applicable ratings. Subject to the aforementioned investment guidelines, the Fund may invest in securities of stressed, distressed or defaulted issuers, which include securities in default or at risk of being in default as to the repayment of principal and/or interest at the time of acquisition by the Fund or that are rated in the lower rating categories by one or more nationally recognized statistical rating organizations (“NRSROs”) (for example, Ca or lower by Moody’s or CC or lower by S&P or Fitch) or, if unrated, are determined by PIMCO to be of comparable quality. Debt instruments of below investment grade quality are regarded as having predominantly speculative characteristics with respect to capacity to pay interest and to repay principal, and are commonly referred to as “high yield” securities or “junk bonds.” Debt instruments in the lowest investment grade category also may be considered to possess some speculative characteristics. The Fund may, for hedging, investing or leveraging purposes, make use of credit default swaps (which includes buying and/or selling credit default swaps), which are contracts whereby one party makes periodic payments to a counterparty in exchange for the right to receive from the counterparty a payment equal to the par (or other agreed-upon) value of a referenced debt obligation in the event of a default or other credit event by the issuer of the debt obligation.
Independent credit analysis
PIMCO relies primarily on its own analysis of the credit quality and risks associated with individual debt instruments considered for the Fund, rather than relying exclusively on rating agencies or third-party
research. The Fund’s portfolio managers utilize this information in an attempt to minimize credit risk and identify issuers, industries or sectors that are undervalued or that offer attractive yields relative to PIMCO’s assessment of their credit characteristics. This aspect of PIMCO’s capabilities will be particularly important to the extent that the Fund invests in high yield securities and in securities of emerging market issuers.
The Fund normally invests worldwide in a portfolio of debt obligations and other income-producing securities and instruments of any type and credit quality and with varying maturities and related derivative instruments. The Fund may also invest without limit in common stocks and other common equity securities issued by public or private issuers.
The Fund’s portfolio of debt obligations and other income producing securities and instruments may include, without limitation, bonds, debentures, notes, and other debt securities and similar instruments of varying maturities issued by various U.S. and
foreign (non-U.S.)
corporate and other issuers, including corporate debt securities; commercial paper; securitizations and mortgage-related and other asset-backed instruments issued by government agencies or other governmental entities or by private originators or issuers (including agency
and non-agency residential
mortgage-backed securities and commercial mortgage-backed securities, collateralized bond obligations, collateralized mortgage obligations, collateralized loan obligations, other collateralized debt obligations and other similarly structured securities, including the residual or equity tranches thereof); derivatives on mortgage-related instruments; U.S. government securities; obligations of foreign governments or their sub-divisions, agencies and government sponsored enterprises and obligations of international agencies and supranational entities; municipal securities and other debt securities issued by states or local governments and their agencies, authorities and other government-sponsored enterprises, including taxable municipal securities (such as Build America
Bonds); payment-in-kind securities; zero-coupon bonds;
inflation-indexed bonds issued by both governments and corporations; structured notes, including hybrid or indexed securities; insurance-linked instruments, catastrophe bonds and other event-linked bonds; credit-linked notes; credit-linked trust instruments; structured credit products; loans (including, among others, and without limitation as to a loan’s level of seniority within a capital structure, bank loans, whole loans, senior loans, subordinated loans, mezzanine loans, delayed draw and delayed funding loans, covenant-lite obligations, revolving credit facilities and loan participations and assignments, loans held and/or originated by private financial institutions, including commercial and residential mortgage loans, corporate loans and consumer loans (such as credit card receivables, automobile loans and
|
|
|
|
|
|
|
|
|
|
|
|
| |
| |
|
|
ANNUAL REPORT |
|
|
| |
|
|
JUNE 30, 2025 |
|
|
209 |
|
|
|
|
| |
Principal Investment Strategies |
|
|
|
|
student loans)); preferred securities; convertible debt securities (i.e., debt securities that may be converted at either a stated price or stated rate into underlying shares), including synthetic convertible debt securities (i.e., instruments created through a combination of separate securities that possess the two principal characteristics of a traditional convertible security, such as an income-producing security and the right to acquire an equity security); contingent convertible securities; bank capital securities; and bank certificates of deposit, fixed time deposits and bankers’ acceptances. The rate of interest on an income-producing security may be fixed, floating or variable, and may move in the opposite direction to interest rates generally or the interest rate on another security or index. Certain corporate income-producing securities, such as convertible bonds, also may include the right to participate in equity appreciation, and PIMCO will generally evaluate those instruments based primarily on their debt characteristics.
The Fund may invest in debt securities of stressed or distressed issuers as well as in defaulted securities
and debtor-in-possession financings.
For tax or other structuring reasons, the Fund may purchase a loan or debt investment structured as an equity interest (e.g., a joint venture interest). At any given time and from time to time, all of the Fund’s portfolio may consist of below investment grade securities and/or mortgage-related or other types of ABS. The Fund may invest in any level of the capital structure of an issuer of mortgage-backed or ABS (including collateralized bond obligations, collateralized loan obligations (“CLOs”) and other collateralized debt obligations), including the equity or “first loss” tranche. The Fund may invest in unsecured loans and subordinated or mezzanine obligations, including second and lower lien loans and the mezzanine and equity (or “first loss”) tranches of CLO issues. The Fund may invest in securitization risk retention tranches in the capacity of a third-party purchaser with respect to securitizations sponsored by others. The Fund may invest without limitation in investment grade debt securities and below investment grade debt securities (commonly referred to as “high yield” securities or “junk bonds”), including securities of stressed, distressed or defaulted issuers.
As a matter of fundamental policy, the Fund normally invests at least 25% of its total assets (i.e., concentrate) in the energy industry. PIMCO will, on behalf of the Fund, make reasonable determinations as to the appropriate industry classification to assign to each security or instrument in which the Fund invests. The Fund’s investments in the energy sector may include, but are not limited to, investments in equity and debt securities, warrants, rights issues, and restricted securities (including securities that are eligible for purchase and sale pursuant to Rule 144A under the Securities Act of 1933, as amended (the “Securities Act”)) of public and private issuers. The Fund may invest in the energy sector through the secondary market or during an initial public offering and in companies of any capitalization size. To
the extent the Fund invests in master limited partnerships and limited liability companies that are treated as partnerships for U.S. federal income tax purposes (“MLPs”), the extent and manner in which the Fund makes such investments will be limited by its intention to continue qualifying as a regulated investment company for U.S. federal income tax purposes. Under normal circumstances, at the close of any quarter of its taxable year, the Fund will invest no more than 25% of its total assets in the securities of one or more MLPs that are treated as “qualified publicly traded partnerships” within the meaning of Section 851(h) of the Internal Revenue Code of 1986, as amended (the “Code”), in accordance with the requirements of Subchapter M of the Code.
The Fund may obtain exposure to MLPs through the use of total return swaps.
The Fund may invest in U.S.
and non-U.S. (including
emerging markets) real estate investments, including equity or debt securities issued by private and public real estate investment trusts or real estate operating companies, private or public real estate-related loans and real estate-linked derivative instruments.
The Fund may invest in and/or originate loans, including, without limitation, to corporations and/or other legal entities and individuals (including
foreign (non-U.S.) and
emerging market entities and individuals) and/or residential and/or commercial real estate or mortgage-related loans, consumer loans or other types of loans, which may be in the form of whole loans, secured and unsecured notes, senior and second lien loans, mezzanine loans, bridge loans or similar investments. When investing in or originating loans, the Fund is not restricted by any particular credit risk criteria and/or qualifications. The Fund also is not limited in the amount, size or type of loans it may invest in and/or originate, including with respect to a single borrower, other than pursuant to any applicable law. The loans the Fund invests in and/or originates may vary in maturity and/or duration. The Fund’s investments in and/or origination of loans may also be limited by the requirements the Fund intends to observe under Subchapter M of the Code in order to qualify as a regulated investment company. The Fund may invest in securitization risk retention tranches in the capacity of a third party purchaser with respect to securitizations sponsored by others.
Borrowers of loans may be, but are not limited to, corporations and/or other legal entities and individuals, including
foreign (non-U.S.) and
emerging market entities and individuals. Direct loans between the Fund and a borrower may not be administered by an underwriter or agent bank. The Fund may provide financing to borrowers directly or through companies acquired (or created) and owned by or otherwise affiliated with the Fund. The terms of the direct loans, including the duration of the loan, may be negotiated with borrowers in private transactions. A loan may be secured or unsecured.
|
|
|
|
|
|
| |
210 |
|
PIMCO CLOSED-END FUNDS |
|
|
|
|
In making a direct loan, the Fund is exposed to the risk that the borrower may default or become insolvent and, consequently, that the Fund will lose money on the loan. Furthermore, direct loans may subject the Fund to liquidity and interest rate risk and certain direct loans may be deemed illiquid. Direct loans are not publicly traded and may not have a secondary market. The lack of a secondary market for direct loans may have an adverse impact on the ability of the Fund to dispose of a direct loan and/or to value the direct loan. When engaging in direct lending, the Fund’s performance may depend, in part, on the ability of the Fund to originate loans on advantageous terms. In originating and purchasing loans, the Fund will often compete with a broad spectrum of lenders. Increased competition for, or a diminishment in the available supply of, qualifying loans could result in lower yields on and/or less advantageous terms of such loans, which could reduce Fund performance.
As part of its lending activities, the Fund may originate loans to entities that are experiencing significant financial or business difficulties, including entities involved in bankruptcy or other reorganization and liquidation proceedings or that are rated “below investment grade” by an NRSRO or not rated at all. Although the terms of such financing may result in significant financial returns to the Fund, they involve a substantial degree of risk. The level of analytical sophistication, both financial and legal, necessary for successful financing to entities experiencing significant business and financial difficulties is unusually high. Different types of assets may be used as collateral for the Fund’s loans and, accordingly, the valuation of and risks associated with such collateral will vary by loan. There is no assurance that the Fund will correctly evaluate the value of the assets collateralizing the Fund’s loans or the prospects for a successful reorganization or similar action. In any reorganization or liquidation proceeding relating to a company that the Fund funds, the Fund may lose all or part of the amounts advanced to the borrower or may be required to accept collateral with a value less than the amount of the loan advanced by the Fund or its affiliates to the borrower. Furthermore, in the event of a default by a borrower, the Fund may have difficulty disposing of the assets used as collateral for a loan. Various state licensing requirements could apply to the Fund with respect to the origination, acquisition, holding, servicing, foreclosure and/or disposition of, loans and similar assets. The licensing requirements could apply depending on the location of the borrower, the location of the collateral securing the loan, or the location where the Fund or PIMCO operates or has offices. In states in which it is licensed, the Fund or PIMCO will be required to comply with applicable laws and regulations, including consumer protection and anti-fraud laws, which could impose restrictions on the Fund’s or PIMCO’s ability to take certain actions to protect the value of its holdings in such assets and impose compliance costs. Failure to
comply with such laws and regulations could lead to, among other penalties, a loss of the Fund’s or PIMCO’s license, which in turn could require the Fund to divest assets located in or secured by real property located in that state. These risks will also apply to issuers and entities in which the Fund invests that hold similar assets, as well as any origination company or servicer in which the Fund owns an interest. Loan origination and servicing companies are routinely involved in legal proceedings concerning matters that arise in the ordinary course of their business. These legal proceedings range from actions involving a single plaintiff to class action lawsuits with potentially tens of thousands of class members. In addition, a number of participants in the loan origination and servicing industry (including control persons of industry participants) have been the subject of regulatory actions by state regulators, including state Attorneys General, and by the federal government. Governmental investigations, examinations or regulatory actions, or private lawsuits, including purported class action lawsuits, may adversely affect such companies’ financial results. To the extent the Fund seeks to engage in origination and/or servicing directly, or has a financial interest in, or is otherwise affiliated with, an origination or servicing company, the Fund will be subject to enhanced risks of litigation, regulatory actions and other proceedings. As a result, the Fund may be required to pay legal fees, settlement costs, damages, penalties or other charges, any or all of which could materially adversely affect the Fund and its holdings.
In addition to laws governing the activities of lenders and servicers, certain states may require, or may in the future require, purchasers or holders of certain loans, including residential mortgage loans and unsecured consumer loans, to be licensed or registered in order to purchase, hold or foreclose such loans, or, in certain states, to collect a rate of interest above a specified rate. To the extent required or determined to be necessary or advisable by the Fund, the Fund will take appropriate steps intended to address any applicable state licensing requirements, which may include acquiring and holding such loans through structures designed to preempt state licensing laws, in order to pursue its objectives and strategies. To the extent the Fund (or a Subsidiary) obtains licenses or is required to comply with related regulatory requirements as a result of its investments, the Fund could be subject to increased costs and regulatory oversight by governmental authorities, which may have an adverse effect on its results or operations.
The Fund may invest either directly or indirectly through its Subsidiaries in shares, certificates, notes or other securities issued by a special purpose entity (“SPE”) sponsored by an alternative lending platform (i.e., an online lending marketplace or lender that is not a traditional banker, such as a bank) or its affiliates (the “Sponsor”) that represent the right to receive principal and interest payments due on pools of whole loans or fractions of whole loans, which may (but may
|
|
|
|
|
|
|
|
|
|
|
|
| |
| |
|
|
ANNUAL REPORT |
|
|
| |
|
|
JUNE 30, 2025 |
|
|
211 |
|
|
|
|
| |
Principal Investment Strategies |
|
|
|
|
not) be issued by the Sponsor, held by the SPE (“Alt Lending ABS”). Any such Alt Lending ABS may be backed by consumer, commercial, residential or other loans, including those issued by an SPE sponsored by an online or alternative lending platform or an affiliate thereof.
When acquiring and/or originating loans, or purchasing Alt Lending ABS, the Fund is not restricted by any particular borrower credit risk criteria and/or qualifications. Accordingly, certain loans acquired or originated by the Fund or underlying any Alt Lending ABS purchased by the Fund may be subprime in quality, or may become subprime in quality.
The Fund may invest without limit in securities of U.S. issuers and without limit in securities
of non-U.S. issuers,
securities traded principally outside the United States, and securities denominated in currencies other than the U.S. Dollar. Additionally, the Fund may invest up to 30% of its total assets in securities and instruments that are economically tied to emerging market countries; however the Fund may invest without limit in short term investment grade sovereign debt, including short term investment grade sovereign debt issued by emerging market issuers.
The Fund may, but is not required to, utilize various derivative strategies (both long and short positions) involving the purchase or sale of futures and forward contracts (including foreign currency exchange contracts), call and put options, credit default swaps, total return swaps, basis swaps and other swap agreements and other derivative instruments for investment purposes, leveraging purposes or in an attempt to hedge against market, credit, interest rate, currency and other risks in the portfolio. The Fund may purchase and sell securities on a when-issued, delayed delivery or forward commitment basis and may engage in short sales.
The Fund may also invest without limit in common stocks and other common equity securities issued by public or private issuers. The Fund may invest in securities that have not been registered for public sale in the U.S. or
relevant non-U.S. jurisdictions,
including without limitation securities eligible for purchase and sale pursuant to Rule 144A under the Securities Act, or relevant provisions of
applicable non-U.S. law,
and other securities issued in private placements. The Fund may invest in securities of other open-
or closed-end investment
companies (including those advised by PIMCO), including, without limitation, exchange-traded funds, to the extent that such investments are consistent with the Fund’s investment objectives, strategies and policies and permissible under the 1940 Act. The Fund may invest in other investment companies to gain broad market or sector exposure or for cash management purposes, including during periods when it has large amounts of uninvested cash or when PIMCO believes share prices of other investment companies offer attractive values. The Fund may invest in certain money market funds and/or short-term bond
funds (“Central Funds”), to the extent permitted by the 1940 Act, the rules thereunder or exemptive relief therefrom. The Central Funds are registered investment companies created for use by certain registered investment companies advised by PIMCO in connection with their cash management activities. The Fund treats its investments in other investment companies that invest primarily in types of securities in which the Fund may invest directly as investments in such types of securities for purposes of the Fund’s investment policies (e.g., the Fund’s investment in an investment company that invests primarily in debt securities will be treated by the Fund as an investment in a debt security). As a shareholder in an investment company, the Fund would bear its ratable share of that investment company’s expenses and would remain subject to payment of the Fund’s management fees and other expenses with respect to assets so invested. The Fund’s common shareholders (the “Common Shareholders”) would therefore be subject to duplicative expenses to the extent the Fund invests in other investment companies. The securities of other investment companies may be leveraged, in which case the NAV and/or market value of the investment company’s shares will be more volatile than unleveraged investments.
The Fund may invest in commodities and seek to gain exposure to commodities through investments in swap agreements, futures and options or a Cayman Subsidiary. The Fund may also invest in physical commodities pursuant to the policies described herein, including through warehouse receipts providing proof of ownership of such commodities, and may, in its sole discretion, obtain property insurance to cover the risk of loss or damage thereto. Under normal circumstances, the Fund will invest no more than 25% of its total assets in commodities on a net basis.
The Fund may seek to gain exposure to, among other types of investments, certain newly-issued Regulation S securities through investments in a Cayman Subsidiary. Regulation S securities are securities of U.S.
and non-U.S. issuers
that are issued
through off-shore (non-U.S.) offerings
without registration with the SEC pursuant to Regulation S under the Securities Act. Offerings of Regulation S securities may be conducted outside of the U.S. A Cayman Subsidiary (unlike the Fund) may invest without limitation in Regulation S securities. While a Cayman Subsidiary may be considered similar to an investment company, it is not registered under the 1940 Act and is not subject to all of the investor protections of the 1940 Act. In addition, changes in the laws of the U.S. and/or the Cayman Islands could result in the inability of the Fund and/or a Cayman Subsidiary to operate as described herein and could adversely affect the Fund, the performance of the Fund and/or a Cayman Subsidiary.
The Fund may invest without limit in illiquid securities (i.e., securities that the Fund reasonably expects cannot be disposed of in current
|
|
|
|
|
|
| |
212 |
|
PIMCO CLOSED-END FUNDS |
|
|
|
|
market conditions within seven calendar days without the disposition significantly changing the market value of the securities).
The Fund may make investments in debt instruments and other securities or instruments directly or through one or more Subsidiaries. Each Subsidiary, for example, may invest in or originate loans or invest in shares, certificates, notes or other securities representing the right to receive principal and interest payments due on fractions of whole loans or pools of whole loans, risk retention investments or any other security or other instrument that the Fund may hold directly. References herein to the Fund include references to a Subsidiary in respect of the Fund’s investment exposure. The allocation of the Fund’s assets to a Subsidiary will vary from time to time and the Fund’s portfolio may include some or all the investments described herein.
The Fund may enter into repurchase agreements, in which the Fund purchases a security from a bank or broker-dealer and the bank or broker-dealer agrees to repurchase the security at the Fund’s cost plus interest within a specified time.
For the purpose of achieving income, the Fund may lend its portfolio securities to brokers, dealers or other financial institutions provided a number of conditions are satisfied, including that the loan is fully collateralized.
The length of time the Fund has held a particular security is not generally a consideration in investment decisions. A change in the securities held by the Fund is known as “portfolio turnover.” The Fund may engage in frequent and active trading of portfolio securities to achieve its investment objectives, particularly during periods of volatile market movements. Frequent and active trading of the Fund’s portfolio holdings may cause adverse tax consequences for shareholders due to an increase in short-term capital gains and may also adversely impact the Fund’s
after-tax
returns.
The Fund has received exemptive relief from the SEC that, to the extent the Fund relies on such relief, permits it to (among other things)
co-invest
with certain other persons, including certain affiliates of the Investment Manager and certain public or private funds managed by the Investment Manager and its affiliates, subject to certain terms and conditions. The exemptive relief from the SEC with respect to
co-
investments imposes extensive conditions on any
co-investments
made in reliance on such relief.
Temporary Defensive Investments.
The Fund may make short-term investments when attempting to respond to adverse market, economic, political, or other conditions, as determined by PIMCO. Upon PIMCO’s recommendation, for temporary defensive purposes, the Fund may deviate from its investment strategy by investing some or all of its total assets in investments such as high-grade debt
securities, including high quality, short-term debt securities and cash and cash equivalents. The Fund may not achieve its investment objectives when it does so.
The Fund currently utilizes leverage principally through reverse repurchase agreements. The Fund may also enter into transactions other than through reverse repurchase agreements that may give rise to a form of leverage including, among others, (i) selling credit default swaps, (ii) dollar rolls/buy backs, (iii) borrowings, such as through bank loans or commercial paper and/or other credit facilities, (iv) futures and forward contracts (including foreign currency exchange contracts), (v) total return swaps, (vi) other derivative transactions, (vii) loans of portfolio securities, (viii) short sales and (ix) when-issued, delayed delivery and forward commitment transactions. The Fund may also determine to issue preferred shares or other types of senior securities to add leverage to its portfolio. The Fund’s Board may authorize the issuance of preferred shares without the approval of Common Shareholders. If the Fund issues preferred shares in the future, all costs and expenses relating to the issuance and ongoing maintenance of the preferred shares will be borne by the Common Shareholders, and these costs and expenses may be significant. Leveraging transactions pursued by the Fund may increase its duration and sensitivity to interest rate movements. Leveraging is a speculative technique and there are special risks and costs involved. There can be no assurance that a leveraging strategy will be used or that it will be successful during any period in which it is employed.
Under normal market conditions, the Fund will limit its use of leverage, subject to the limitations set forth in the 1940 Act, from any combination of (i) reverse repurchase agreements; (ii) borrowings (i.e., loans or lines of credit from banks or other credit facilities); (iii) any future issuance of preferred shares; (iv) to the extent described below, credit default swaps, other swap agreements and futures contracts (whether or not these instruments are covered as described below), but excluding, for the purposes of this calculation, (a) such instruments entered into to obtain exposure to commodities, and (b) total return swaps entered into to obtain exposure to assets in which the Fund may invest in accordance with its investment policies and restrictions, such that the assets attributable to the use of such leverage in (i) through (iv) above will not exceed 50% of the Fund’s total assets (including, for purposes of the 50% limit, the amount of assets obtained through the use of such instruments). For these purposes, assets attributable to the use of leverage from swap agreements and futures contracts will be determined based on the current market value of the instrument if it is cash settled or based on the notional value of the instrument if it is not cash settled. In addition, assets attributable to swap agreements or futures contracts
|
|
|
|
|
|
|
|
|
|
|
|
| |
| |
|
|
ANNUAL REPORT |
|
|
| |
|
|
JUNE 30, 2025 |
|
|
213 |
|
|
|
|
| |
Principal Investment Strategies |
|
|
|
(Unaudited) |
will not be counted towards the 50% leverage policy to the extent that the Fund owns offsetting positions or enters into offsetting transactions. The Fund intends to utilize certain kinds of leverage, such as reverse repurchase agreements and selling credit default swaps, opportunistically and may choose to increase or decrease, or eliminate entirely, its use of such leverage over time and from time to time based on PIMCO’s assessment of the yield curve environment, interest rate trends, market conditions and other factors.
The Fund also may borrow money in order to repurchase its shares or as a temporary measure for extraordinary or emergency purposes, including for the payment of dividends or the settlement of securities transactions which otherwise might require untimely dispositions of portfolio securities held by the Fund.
|
|
|
|
|
|
| |
214 |
|
PIMCO CLOSED-END FUNDS |
|
|
|
|
|
|
|
|
| |
Principal Risks of the Funds |
|
| |
(Unaudited) |
The factors that are most likely to have a material effect on a particular Fund’s portfolio as a whole are called “principal risks.” Each Fund is subject to the principal risks indicated below, as applicable, whether through direct investments, investments by a subsidiary (if applicable) or derivative positions. Each Fund may be subject to additional risks other than those described below because the types of investments made by a Fund can change over time.
Anti-Takeover Provisions
The Fund’s Amended and Restated Agreement and Declaration of Trust or Articles of Incorporation (collectively, the “Organizational Documents”), as applicable, includes provisions that could limit the ability of other entities or persons to acquire control of the Fund or to convert the Fund to
open-end
status. These provisions in the Organizational Documents could have the effect of depriving the holders (“Common Shareholders”) of the Fund’s common shares of beneficial interest (“Common Shares”) of opportunities to sell their Common Shares at a premium over the then-current market price of the Common Shares or at NAV.
Asset Allocation Risk
The Fund’s investment performance depends upon how its assets are allocated and reallocated. A principal risk of investing in the Fund is that PIMCO may make less than optimal or poor asset allocation decisions. PIMCO employs an active approach to allocation among multiple fixed income sectors within a Fund’s investment objectives and strategies, but there is no guarantee that such allocation techniques will produce the desired results. It is possible that PIMCO will focus on an investment that performs poorly, underperforms other investments under various market conditions, or underperforms as compared to funds with similar investment objectives and strategies. A Fund could experience losses as a result of these allocation decisions.
Autonomous/Electric Vehicle Risk
Autonomous and/or electric vehicles are relatively new, could fail to be successful with consumers in a meaningful way and could suffer technical problems, supply or demand shortfalls, or be supplanted by other technologies. Vehicles, applications, hardware, software or services could become obsolete before they are fully embraced or deployed, or may use technologies, systems and software that are unproven, defective, malfunctioning, and are subject to cybersecurity threats; any of these factors could cause them to become obsolete more rapidly than traditional technologies and software. Autonomous and/or electric vehicles may rely on fuel sources that are more sensitive to commodities market activity than traditional vehicle fuels and could be adversely affected by underlying commodity market activity. Some autonomous and/or electric vehicle projects may rely on government subsidies that could be reduced or eliminated. These risks could adversely affect the value of companies in which the Fund invests.
Call Risk
Call risk refers to the possibility that an issuer may exercise its right to redeem a fixed income security earlier than expected (a call). Issuers may call outstanding securities prior to their maturity for a number of reasons (e.g., declining interest rates, changes in credit spreads and improvements in the issuer’s credit quality). If an issuer calls a security in which the Fund has invested, the Fund may not recoup the full amount of its initial investment or may not realize the full anticipated earnings from the investment and may be forced to reinvest in lower-yielding securities, securities with greater credit risks or securities with other, less favorable features.
Certain Affiliations
Certain broker-dealers may be considered to be affiliated persons of the Fund and/or the Investment Manager due to their possible affiliations with Allianz SE, the ultimate parent of the Investment Manager, or another Allianz entity. Allianz Asset Management of America LP merged with Allianz Asset Management of America LLC (“Allianz Asset Management”), with the latter being the surviving entity, effective January 1, 2023. Following the merger, Allianz Asset Management is PIMCO LLC’s managing member and direct parent entity. Absent an exemption from the SEC or other regulatory relief, the Fund is generally precluded from effecting certain principal transactions with affiliated brokers, and its ability to purchase securities being underwritten by an affiliated broker or a syndicate including an affiliated broker, or to utilize affiliated brokers for agency transactions, is subject to restrictions. This could limit the Fund’s ability to engage in securities transactions and take advantage of market opportunities.
The 1940 Act imposes significant limits on
co-investment
with affiliates of the Fund. The Fund has received exemptive relief from the SEC that, to the extent a fund relies on such relief, permits it to (among other things)
co-invest
alongside certain other persons in privately negotiated investments, including certain affiliates of the Investment Manager and certain public or private funds managed by the Investment Manager and its affiliates, subject to certain terms and conditions. The exemptive relief from the SEC with respect to
co-investments
imposes a number of conditions on any
co-investments
made in reliance on such relief that may limit or restrict a fund’s ability to participate in an investment or require it to participate in an investment to a lesser extent, which could negatively impact a fund’s ability to execute its desired investment strategy and its returns. Subject to applicable law, the Fund may also invest alongside other PIMCO managed funds and accounts, including private funds and affiliates of the Investment Manager, without relying on the exemptive relief. Pursuant to
co-investment
exemptive relief, to the extent a fund relies on such relief, the fund will be able to invest in opportunities in
|
|
|
|
|
|
|
|
|
|
|
|
| |
| |
|
|
ANNUAL REPORT |
|
|
| |
|
|
JUNE 30, 2025 |
|
|
215 |
|
|
|
|
| |
Principal Risks of the Funds |
|
|
|
|
which PIMCO and/or its affiliates has an investment, and PIMCO and/or its affiliates will be able to invest in opportunities in which a fund has made an investment.
Collateralized Bond Obligations, Collateralized Loan Obligations and Collateralized Debt Obligations Risk
CBOs, CLOs and CDOs may charge management fees and administrative expenses. For CBOs, CLOs, and CDOs, the cash flows from the trust are split into two or more portions, called tranches, varying in risk and yield. The riskiest portion is the equity tranche which generally bears losses in connection with the first defaults, if any, on the bonds or loans in the trust. A senior tranche from a CLO, CBO and CDO trust typically has higher credit ratings and lower yields than the underlying securities. CLO, CBO and CDO tranches, even senior ones, can experience substantial losses due to actual defaults, increased sensitivity to defaults due to collateral default and disappearance of protecting tranches, market anticipation of defaults and aversion to CLO, CBO or other CDO securities. The risks of an investment in a CLO, CBO or other CDO depend largely on the type of the collateral securities and the class/tranche of the instrument in which the Fund invests, among other factors. Normally, CLOs, CBOs and other CDOs are privately offered and sold, and thus are not registered under the securities laws. Investments in CLOs, CBOs and CDOs may be or become illiquid. In addition to the normal risks associated with debt instruments (e.g., interest rate risk and credit risk), CLOs, CBOs and CDOs carry additional risks including, but not limited to: (i) the possibility that distributions from the collateral will not be adequate to make interest or other payments; (ii) the risk that the quality of the collateral may decline in value or default; (iii) the risk that the Fund may invest in CBOs, CLOs or other CDOs that are subordinate to other classes; and (iv) the risk that the complex structure of the security may not be fully understood at the time of investment and may produce disputes with the issuer or others and may produce unexpected investment results.
Commodities Risk
Commodities are generally subject to greater price volatility than traditional securities, such as stocks and bonds. General market uncertainty and consequent repricing risk have led, and may again lead, to market imbalances of sellers and buyers, which in turn have resulted, or may result, in significant reductions in values of a variety of commodities and natural resources.
The commodities markets may be influenced by, among other things: governmental, agricultural, trade, fiscal, monetary and exchange control programs and policies; travel restrictions; disease and political turmoil; changing market and economic conditions; market liquidity; weather and climate conditions; changing supply and demand relationships and levels of domestic production and imported
commodities; the availability of local, intrastate and interstate transportation systems; energy conservation; changes in international balances of payments and trade; domestic and foreign rates of inflation; currency devaluations and revaluations; domestic and foreign political and economic events; domestic and foreign interest rates and/or investor expectations concerning interest rates; foreign currency/exchange rates; domestic and foreign governmental regulation and taxation; war, acts of terrorism and other political upheaval and conflicts; governmental expropriation; investment and trading activities of mutual funds, hedge funds and commodities funds; changes in philosophies and emotions of market participants. The frequency and magnitude of such changes cannot be predicted. Prices of various commodities and natural resources may also be affected by factors such as drought, floods, weather, livestock disease, changes in storage costs, embargoes, tariffs and other regulatory developments. Many of these factors are very unpredictable. The prices of commodities and natural resources can also fluctuate widely due to supply and demand disruptions in major producing or consuming regions. Certain commodities or natural resources may be produced in a limited number of countries and may be controlled by a small number of producers or groups of producers. As a result, political, economic and supply related events in such countries could have a disproportionate impact on the prices of such commodities and natural resources.
Fluctuations in energy commodity prices can result from changes in general economic conditions or political circumstances (especially of key energy producing and consuming countries); market conditions; weather patterns; domestic production levels; volume of imports; energy conservation; domestic and foreign governmental regulation; international politics; policies of the OPEC; taxation; tariffs; and the availability and costs of local, intrastate and interstate transportation methods. The energy sector as a whole may also be impacted by the perception that the performance of energy sector companies is directly linked to commodity prices. High commodity prices may drive further energy conservation efforts, and a slowing economy may adversely impact energy consumption, which may adversely affect the performance of MLPs and other companies operating in the energy sector.
The commodity markets are subject to temporary distortions and other disruptions due to, among other factors, lack of liquidity, the participation of speculators, and government regulation and other actions. U.S. futures exchanges and some foreign exchanges limit the amount of fluctuation in futures contract prices which may occur in a single business day (generally referred to as “daily price fluctuation limits”). The maximum or minimum price of a contract as a result of these limits is referred to as a “limit price.” If the limit price has been
|
|
|
|
|
|
| |
216 |
|
PIMCO CLOSED-END FUNDS |
|
|
|
|
reached in a particular contract, no trades may be made beyond the limit price. Limit prices have the effect of precluding trading in a particular contract or forcing the liquidation of contracts at disadvantageous times or prices.
There are risks and costs of physical storage and insurance associated with purchasing a commodity that would not be directly associated with a futures or other derivative contract for the same commodity. These risks include substandard quality, infestation, degradation, spoilage and shrinkage, for example, as well as fraud, documentation errors, storage, transportation, and insurance. To the extent the Fund obtains property insurance for its physical commodity holdings, the Fund will bear such expenses, which will detract from the performance of those assets. Such property insurance may also not be adequate to cover any losses incurred and would not insure against changes in market prices.
Confidential Information Access Risk
In managing the Fund (and other PIMCO clients), PIMCO may from time to time have the opportunity to receive material,
non-public
information (“Confidential Information”) about the issuers of certain investments, including, without limitation, senior floating rate loans, other loans and related investments being considered for acquisition by the Fund or held in the Fund’s portfolio. For example, an issuer of privately placed loans considered by the Fund may offer to provide PIMCO with financial information and related documentation regarding the issuer that is not publicly available. Pursuant to applicable policies and procedures, PIMCO may (but is not required to) seek to avoid receipt of Confidential Information from the issuer so as to avoid possible restrictions on its ability to purchase and sell investments on behalf of the Fund and other clients to which such Confidential Information relates. In such circumstances, the Fund (and other PIMCO clients) may be disadvantaged in comparison to other investors, including with respect to the price the Fund pays or receives when it buys or sells an investment. Further, PIMCO’s and the Fund’s abilities to assess the desirability of proposed consents, waivers or amendments with respect to certain investments may be compromised if they are not privy to available Confidential Information. PIMCO may also determine to receive such Confidential Information in certain circumstances under its applicable policies and procedures. If PIMCO intentionally or unintentionally comes into possession of Confidential Information, it may be unable, potentially for a substantial period of time, to purchase or sell investments to which such Confidential Information relates.
Contingent Convertible Securities Risk
Contingent convertible securities (“CoCos”) have no stated maturity, have fully discretionary coupons and are typically issued in the form of subordinated debt instruments. CoCos generally either convert into
equity or have their principal written down (including potentially to zero) upon the occurrence of certain triggering events (“triggers”) linked to regulatory capital thresholds or regulatory actions relating to the issuer’s continued viability. As a result, an investment by the Fund in CoCos is subject to the risk that coupon (i.e., interest) payments may be cancelled by the issuer or a regulatory authority in order to help the issuer absorb losses and the risk of total loss. An investment by the Fund in CoCos is also subject to the risk that, in the event of the liquidation, dissolution or
winding-up
of an issuer prior to a trigger event, the Fund’s rights and claims will generally rank junior to the claims of holders of the issuer’s other debt obligations and CoCos may also be treated as junior to an issuer’s other obligations and securities. In addition, if CoCos held by the Fund are converted into the issuer’s underlying equity securities following a trigger event, the Fund’s holding may be further subordinated due to the conversion from a debt to equity instrument. Further, the value of an investment in CoCos is unpredictable and will be influenced by many factors and risks, including interest rate risk, credit risk, market risk and liquidity risk. An investment by the Fund in CoCos may result in losses to the Fund.
Convertible Securities Risk
Convertible securities are fixed income securities, preferred securities or other securities that are convertible into or exercisable for common stock of the issuer (or cash or securities of equivalent value) at either a stated price or a stated rate. Convertible debt securities pay interest and convertible preferred stocks generally pay dividends until they mature or are converted, exchanged or redeemed. The market values of convertible securities may decline as interest rates increase and, conversely, may increase as interest rates decline. A convertible security’s market value, however, tends to reflect the market price of the common stock of the issuing company when that stock price approaches or is greater than the convertible security’s “conversion price.” The conversion price is defined as the predetermined price at which the convertible security could be exchanged for the associated stock. Certain types of convertible securities may decline in value or lose their value entirely in the event the issuer’s financial condition becomes significantly impaired. As the market price of the underlying common stock declines, the price of the convertible security tends to be influenced more by the yield of the convertible security. Thus, it may not decline in price to the same extent as the underlying common stock. In the event of a liquidation of the issuing company, holders of convertible securities may be paid before the company’s common stockholders but after holders of any senior debt obligations of the company. Consequently, the issuer’s convertible securities generally entail less risk than its common stock but more risk than its other debt obligations. Convertible securities are often rated below investment grade or not rated.
|
|
|
|
|
|
|
|
|
|
|
|
| |
| |
|
|
ANNUAL REPORT |
|
|
| |
|
|
JUNE 30, 2025 |
|
|
217 |
|
|
|
|
| |
Principal Risks of the Funds |
|
|
|
|
Corporate Debt Securities Risk
The market value of corporate debt securities generally may be expected to rise and fall inversely with interest rates. The value of intermediate- and longer-term corporate debt securities normally fluctuates more in response to changes in interest rates. The market value of a corporate debt security also may be affected by factors directly relating to the issuer. There is a risk that the issuers of corporate debt securities may not be able to meet their obligations on interest or principal payments at the time called for by an instrument. High yield corporate bonds are often high risk and have speculative characteristics. High yield corporate bonds may be particularly susceptible to adverse issuer-specific developments. In addition, certain corporate debt securities may be highly customized and as a result may be subject to, among others, liquidity and valuation/pricing transparency risks.
Counterparty Risk
The Fund will be subject to credit risk with respect to the counterparties to the derivative contracts and other instruments entered into by the Fund or held by special purpose or structured vehicles in which the Fund invests. For example, if a bank at which the Fund or issuer has an account fails, any cash or other assets in bank or custody accounts, which may be substantial in size, could be temporarily inaccessible or permanently lost by the Fund or issuer. In the event that the Fund enters into a derivative transaction with a counterparty that subsequently becomes insolvent or becomes the subject of a bankruptcy case, the derivative transaction may be terminated in accordance with its terms and the Fund’s ability to realize its rights under the derivative instrument and its ability to distribute the proceeds could be adversely affected. If a counterparty becomes bankrupt or otherwise fails to perform its obligations under a derivative contract due to financial difficulties, the Fund may experience significant delays in obtaining any recovery (including recovery of any collateral it has provided to the counterparty) in a dissolution, assignment for the benefit of creditors, liquidation,
winding-up,
bankruptcy or other analogous proceeding. In addition, in the event of the insolvency of a counterparty to a derivative transaction, the derivative transaction would typically be terminated at its fair market value. If the Fund is owed this fair market value in the termination of the derivative transaction and its claim is unsecured, the Fund will be treated as a general creditor of such counterparty and will not have any claim with respect to any underlying security or asset. The Fund may obtain only a limited recovery or may obtain no recovery in such circumstances. Counterparty credit risk also includes the related risk of having concentrated exposure to a single counterparty, which may increase potential losses if the counterparty were to become insolvent. While the Fund may seek to manage its counterparty risk by transacting with a number of counterparties,
concerns about the solvency of, or a default by, one large market participant could lead to significant impairment of liquidity and other adverse consequences for other counterparties.
“Covenant-Lite” Obligations Risk
Covenant-lite obligations contain fewer maintenance covenants than other obligations, or no maintenance covenants, and may not include terms that allow the lender to monitor the performance of the borrower and declare a default if certain criteria are breached, which would allow the lender to restructure the loan or take other action intended to help mitigate losses. Covenant-lite loans carry a risk that the borrower could transfer or encumber its assets, which could reduce the amount of assets that can be used to satisfy debts and result in losses for debtholders. Covenant-lite loans may carry more risk than traditional loans as they allow individuals and corporations to engage in activities that would otherwise be difficult or impossible under a covenant-heavy loan agreement. In the event of default, covenant-lite loans may exhibit diminished recovery values as the lender may not have the opportunity to negotiate with the borrower prior to default.
Credit Default Swaps Risk
Credit default swap agreements may involve greater risks than if the Fund had invested in the reference obligation directly since, in addition to general market risks, credit default swaps are subject to leverage risk, illiquidity risk, counterparty risk and credit risk. A buyer generally also will lose its investment and recover nothing should no credit event occur and the swap is held to its termination date. If a credit event were to occur, the value of any deliverable obligation received by the seller (if any), coupled with the upfront or periodic payments previously received, may be less than the full notional value it pays to the buyer, resulting in a loss of value to the seller. When the Fund acts as a seller of a credit default swap, it is exposed to many of the same risks of leverage described herein. As the seller, the Fund would receive a stream of payments over the term of the swap agreement provided that no event of default has occurred with respect to the referenced debt obligation upon which the swap is based. The Fund would effectively add leverage to its portfolio because, if a default occurs, the stream of payments may stop and, in addition to its total net assets, the Fund would be subject to investment exposure on the notional amount of the swap.
Although the Fund may seek to realize gains by selling credit default swaps that increase in value, to realize gains on selling credit default swaps, an active secondary market for such instruments must exist or the Fund must otherwise be able to close out these transactions at advantageous times. In addition to the risk of losses described above, if no such secondary market exists or the Fund is otherwise unable to close out these transactions at advantageous times, selling credit default swaps may not be profitable for the Fund.
|
|
|
|
|
|
| |
218 |
|
PIMCO CLOSED-END FUNDS |
|
|
|
|
The market for credit default swaps has become more volatile as the creditworthiness of certain counterparties has been questioned and/or downgraded. The Fund will be subject to credit risk with respect to the counterparties to the credit default swap contract (whether a clearing corporation or another third party). If a counterparty’s credit becomes significantly impaired, multiple requests for collateral posting in a short period of time could increase the risk that the Fund may not receive adequate collateral. The Fund may exit its obligations under a credit default swap only by terminating the contract and paying applicable breakage fees, or by entering into an offsetting credit default swap position, which may cause the Fund to incur more losses.
Credit Risk
The Fund could experience losses if the issuer or guarantor of a fixed income security (including a security purchased with securities lending collateral), or the counterparty to a derivatives contract, or the issuer or guarantor of collateral, repurchase agreement or a loan of portfolio securities is unable or unwilling, or is perceived (whether by market participants, rating agencies, pricing services or otherwise) as unable or unwilling, to make timely principal and/or interest payments or to otherwise honor its obligations. The risk that such issuer, guarantor or counterparty is less willing or able to do so is heightened in market environments where interest rates are changing, notably when rates are rising. The downgrade of the credit rating of a security or of the issuer of a security held by the Fund may decrease its value. Measures such as average credit quality may not accurately reflect the true credit risk of the Fund. This is especially the case if the Fund consists of securities with widely varying credit ratings. Securities are subject to varying degrees of credit risk, which are often reflected in credit ratings. Credit risk is greater to the extent the Fund uses leverage or derivatives in connection with the management of the Fund, which would be magnified in the event that initial or variation margin is not provided by the counterparty to such transaction (or not provided below a certain threshold amount). Rising or high interest rates may deteriorate the credit quality of an issuer or counterparty, particularly if an issuer or counterparty faces challenges rolling or refinancing its obligations. The Fund’s investments may be adversely affected if any of the issuers it is invested in are subject to an actual or perceived (whether by market participants, rating agencies, pricing services or otherwise) deterioration to their credit quality.
Credit risk includes credit spread risk, which is the risk that credit spreads (i.e., the difference in yield between securities that is due to differences in their actual or perceived credit quality) may increase when the market believes that investments generally have a greater risk of default. Increasing credit spreads may reduce the market values of the Fund’s investments. Credit spreads often increase more for lower rated and unrated securities than for investment grade
securities. In addition, when credit spreads increase, reductions in market value will generally be greater for longer-maturity securities. Further, credit spread duration (a measure of credit spread risk) can vary significantly from interest rate duration (e.g., for floating rate debt securities, credit spread duration typically will be higher than interest rate duration). The Fund may add credit spread duration to its portfolio, for example through the use of derivatives (e.g., credit default swaps), even while it has lower interest rate duration. The credit spread duration of the Fund’s portfolio may vary, in some cases significantly, from its interest rate duration.
CSDR Related Risk
The European Union has adopted a settlement discipline regime under Regulation (EU) No 909/2014 and the Settlement Discipline RTS as they may be modified from time to time (“CSDR”), which will have phased compliance dates. It aims to reduce the number of settlement fails that occur in EEA central securities depositories (“CSDs”) and address settlement fails where they occur. The key elements of the regime are: (i) mandatory
buy-ins
— if a settlement fail continues for a specified period of time after the intended settlement date, a
buy-in
process must be initiated to effect the settlement; (ii) cash penalties — EEA CSDs are required to impose cash penalties on participants that cause settlement fails and distribute these to receiving participants; and (iii) allocations and confirmations — EEA investment firms are required to take measures to prevent settlement fails, including putting in place arrangements with their professional clients to communicate securities allocations and transaction confirmations. These requirements apply to transactions in transferable securities (e.g., shares and bonds), money market instruments, units in funds and emission allowances that are to be settled via an EEA CSD and, in the case of cash penalties and
buy-in
requirements only, are admitted to trading or traded on an EEA trading venue or cleared by an EEA central counterparty. If the Fund enters into
in-scope
transactions, the CSDR settlement discipline regime may result in increased operational and compliance costs being borne directly or indirectly by the Fund. CSDR may also affect liquidity and increase trading costs associated with relevant securities. If
in-scope
transactions are subject to additional expenses and penalties as a consequence of the CSDR settlement discipline regime, such expenses and penalties may be charged to the relevant Fund.
Currency Risk
If the Fund invests directly in foreign
(non-U.S.)
currencies or in securities that trade in, and receive revenues in, foreign
(non-U.S.)
currencies, or in derivatives or other instruments that provide exposure to foreign
(non-U.S.)
currencies, it will be subject to the risk that those currencies will decline in value relative to the U.S. dollar, or, in the case of hedging positions, that the U.S. dollar will decline in value
|
|
|
|
|
|
|
|
|
|
|
|
| |
| |
|
|
ANNUAL REPORT |
|
|
| |
|
|
JUNE 30, 2025 |
|
|
219 |
|
|
|
|
| |
Principal Risks of the Funds |
|
|
|
|
relative to the currency being hedged. Although the Fund may attempt to hedge its currency exposure into the U.S. dollar, it may not be successful in reducing the effects of currency fluctuations. The Fund may also hedge from one foreign currency to another. In addition, the Fund’s use of currency hedging may not be successful and the use of such strategies may lower the Fund’s potential returns.
Investments denominated in foreign
(non-U.S.)
currencies or that trade in and receive revenues in, foreign
(non-U.S.)
currencies, derivatives or other instruments that provide exposure to foreign
(non-U.S.)
currencies, are subject to the risk that those currencies will decline in value relative to the U.S. dollar, or, in the case of hedging positions, that the U.S. dollar will decline in value relative to the currency being hedged.
Currency rates in foreign
(non-U.S.)
countries may fluctuate significantly over short periods of time for a number of reasons, including changes in interest or inflation rates, balance of payments and governmental surpluses or deficits, intervention (or the failure to intervene) by U.S. or foreign
(non-U.S.)
governments, central banks or supranational entities such as the International Monetary Fund, the imposition of currency controls or other political developments in the U.S. or abroad. As a result, the Fund’s investments in or exposure to foreign
(non-U.S.)
currencies and/or foreign
(non-U.S.)
currency-denominated securities may reduce the returns of the Fund. Currency risk may be particularly high to the extent that the Fund invests in foreign
(non-U.S.)
currencies or engages in foreign currency transactions that are economically tied to emerging market countries. These currency transactions may present market, credit, currency, liquidity, legal, political and other risks different from, or greater than, the risks of investing in developed foreign
(non-U.S.)
currencies or engaging in foreign currency transactions that are economically tied to developed foreign countries. Devaluation of a currency by a country’s government or banking authority can significantly impact the value of any investments denominated in that currency. These fluctuations may have a significant adverse impact on the value of the Fund’s portfolio and/or the level of Fund distributions made to Common Shareholders. There is no assurance that a hedging strategy, if used, will be successful.
The Fund may also be adversely impacted by expenses incurred by converting between currencies to purchase and sell securities not valued in the U.S. dollar, as well as by currency restrictions, exchange control regulation, or governmental restrictions that limit or otherwise delay the Fund’s ability to convert currencies.
Moreover, currency hedging techniques may be unavailable with respect to emerging market currencies. As a result, the Fund’s investments in foreign currency-denominated, and especially emerging market-currency denominated, securities may reduce the returns of the Fund.
The local emerging market currencies in which the Fund may be invested from time to time may experience substantially greater volatility against the U.S. dollar than the major convertible currencies of developed countries. Some of the local currencies in which the Fund may invest are neither freely convertible into one of the major currencies nor internationally traded. The local currencies may be convertible into other currencies only inside the relevant emerging market where the limited availability of such other currencies may tend to inflate their values relative to the local currency in question. Such internal exchange markets can therefore be said to be neither liquid nor competitive. In addition, many of the currencies of emerging market countries in which the Fund may invest have experienced steady devaluation relative to freely convertible currencies.
There can be no assurance that if the Fund earns income or capital gains in a
non-U.S.
country or PIMCO otherwise seeks to withdraw the Fund’s investments from a given country, capital controls imposed by such country will not prevent, or cause significant expense in, doing so.
Cyber Security Risk
As the use of technology, including cloud-based technology, has become more prevalent in the course of business, the Fund is potentially more susceptible to operational and information security risks resulting from breaches in cyber security. A breach in cyber security refers to both intentional and unintentional cyber events from outside threat actors or internal resources that may, among other things, cause the Fund to lose proprietary information, suffer data corruption and/or destruction, lose operational capacity, result in the unauthorized release or other misuse of confidential information, or otherwise disrupt normal business operations. Geopolitical tensions can increase the scale and sophistication of deliberate cybersecurity attacks, particularly those from nation-states or from entities with nation-state backing, who may desire to use cybersecurity attacks to cause damage or create leverage against geopolitical rivals. Cyber security breaches may involve unauthorized access to the Fund’s digital information systems (e.g., through “hacking” or malicious software coding), and may come from multiple sources, including outside attacks such as
attacks (i.e., efforts to make network services unavailable to intended users) or cyber extortion, including exfiltration of data held for ransom and/or “ransomware” attacks that renders systems inoperable until ransom is paid, or insider actions (e.g., intentionally or unintentionally harmful acts of PIMCO personnel). In addition, cyber security breaches involving the Fund’s third party service providers (including but not limited to advisers,
sub-advisers,
administrators, transfer agents, custodians, vendors, suppliers, distributors and other third parties), trading counterparties or issuers in which the Fund invests can also subject the Fund to many of the same risks associated with direct cyber security breaches or
|
|
|
|
|
|
| |
220 |
|
PIMCO CLOSED-END FUNDS |
|
|
|
|
extortion of company data. PIMCO’s use of cloud-based service providers could heighten or change these risks. In addition, work-from-home arrangements by the Fund, the Investment Manager or their service providers could increase all of the above risks, create additional data and information accessibility concerns, and make the Fund, the Investment Manager or their service providers susceptible to operational disruptions, any of which could adversely impact their operations.
Cyber security failures or breaches may result in financial losses to the Fund and its shareholders. For example, cyber security failures or breaches involving trading counterparties or issuers in which the Fund invests could adversely impact such counterparties or issuers and cause the Fund’s investment to lose value. These failures or breaches may also result in disruptions to business operations, potentially resulting in financial losses; interference with the Fund’s ability to calculate its NAV, process shareholder transactions or otherwise transact business with shareholders; impediments to trading; violations of applicable privacy and other laws; regulatory fines; penalties; third-party claims in litigation; reputational damage; reimbursement or other compensation costs; additional compliance and cyber security risk management costs and other adverse consequences. In addition, substantial costs may be incurred in order to prevent any cyber incidents in the future.
Like with operational risk in general, the Fund has established business continuity plans and risk management systems designed to reduce the risks associated with cyber security. However, there are inherent limitations in these plans and systems, including that certain risks may not have been identified, in large part because different or unknown threats may emerge in the future. As such, there is no guarantee that such efforts will succeed, especially because the Fund does not directly control the cyber security systems of issuers in which the Fund may invest, trading counterparties or third-party service providers to the Fund. Such entities have experienced cyber attacks and other attempts to gain unauthorized access to systems from time to time, and there is no guarantee that efforts to prevent or mitigate the effects of such attacks or other attempts to gain unauthorized access will be successful. There is also a risk that cyber security breaches may not be detected. The Fund and its shareholders may suffer losses as a result of a cyber security breach related to the Fund, its service providers, trading counterparties or the issuers in which the Fund invests.
Debt Securities Risk
Debt securities are generally subject to the risks described below and further herein:
Issuer risk
. The value of fixed income securities may decline for a number of reasons related to the issuer, such as management
performance, financial leverage, reduced demand for the issuer’s goods and services, historical and prospective earnings of the issuer and the value of the assets of the issuer.
Interest rate risk
. The market value of debt securities changes in response to interest rate changes and other factors. Interest rate risk is the risk that prices of debt securities will increase as interest rates fall and decrease as interest rates rise, which would be reflected in the Fund’s NAV. Factors including central bank monetary policy, rising inflation rates, and changes in general economic conditions may cause interest rates to rise, which could cause the value of the Fund’s investments to decline. The Fund may experience loss if short-term or long-term interest rates rise sharply in a manner not anticipated by the Fund’s management. Moreover, because rates on certain floating rate debt securities typically reset only periodically, changes in prevailing interest rates (and particularly sudden and significant changes) can be expected to cause some fluctuations in the NAV of the Fund to the extent that it invests in floating rate debt securities.
Prepayment risk
. During periods of declining interest rates, borrowers may prepay principal. This may force the Fund to reinvest in lower yielding securities, resulting in a possible decline in the Fund’s income and distributions.
Credit risk
. Credit risk is the risk that one or more debt securities in the Fund’s portfolio will decline in price or fail to pay interest or principal when due because the issuer of the security experiences a decline in its financial status. Credit risk is increased when a portfolio security is downgraded or the perceived creditworthiness of the issuer deteriorates.
Reinvestment risk
. Reinvestment risk is the risk that income from the Fund’s portfolio will decline if the Fund invests the proceeds from matured, traded or called fixed income securities at market interest rates that are below the portfolio’s current earnings rate.
Duration and maturity risk.
The Fund may seek to adjust the duration or maturity of its investments in debt securities based on its assessment of current and projected market conditions. The Fund may incur costs in seeking to adjust the average duration or maturity of its portfolio of debt securities. There can be no assurances that the Fund’s assessment of current and projected market conditions will be correct or that any strategy to adjust duration or maturity will be successful.
In addition, from time to time, uncertainty regarding the status of negotiations in the U.S. government to increase the statutory debt ceiling could impact the creditworthiness of the United States and could impact the liquidity and value of U.S. Government and other securities and ultimately the Fund.
|
|
|
|
|
|
|
|
|
|
|
|
| |
| |
|
|
ANNUAL REPORT |
|
|
| |
|
|
JUNE 30, 2025 |
|
|
221 |
|
|
|
|
| |
Principal Risks of the Funds |
|
|
|
|
Derivatives Risk
The Fund may, but is not required to, utilize a variety of derivative instruments (both long and short positions) for investment or risk management purposes. Derivatives or other similar instruments (referred to collectively as “derivatives”) are financial contracts whose value depends on, or is derived from, the value of an underlying asset, reference rate or index. For example, the Fund may use derivative instruments for purposes of increasing liquidity, providing efficient portfolio management, broadening investment opportunities (including taking short or negative positions), implementing a tax or cash management strategy, gaining exposure to a particular security or segment of the market, modifying the effective duration of the Fund’s portfolio investments and/or enhancing total return. Investments in derivatives may take the form of buying and/or writing (selling) derivatives, and/or the Fund may otherwise become an obligor under a derivatives transaction. These transactions may produce current income or short-term capital gain in the form of premiums or other returns for the Fund (which may support, constitute and/or increase the distributions paid by, or the yield of, the Fund) but create the risk of losses that can significantly exceed such current income or other returns. For example, the premium received for writing a put option may be dwarfed by the losses the Fund may incur if the put option is exercised, and derivative transactions where the Fund is an obligor can produce an
up-front
benefit, but the potential for leveraged losses. The distributions, or distribution rate, paid by the Fund should not be viewed as the total returns or overall performance of the Fund. These strategies may also produce adverse tax consequences (for example, the Fund’s income and gain-generating strategies may generate current income and gains, including short-term capital gains, taxable as ordinary income) and limit the Fund’s opportunity to profit or otherwise benefit from certain gains. The Fund may enter into opposing derivative transactions, or otherwise take opposing positions. Such transactions can generate distributable gains (which, as noted elsewhere, may be taxed as ordinary income) and create the risk of losses and NAV declines.
The Fund may engage in investment strategies, including the use of derivatives, to, among other things, generate current, distributable income, even if such strategies could potentially result in declines in the Fund’s net asset value. The Fund’s income and gain-generating strategies, including certain derivatives strategies, may generate current income and gains, including short-term capital gains, taxable as ordinary income sufficient to support distributions, even in situations when the Fund has experienced a decline in net assets due to, for example, adverse changes in the broad U.S. or
non-U.S.
securities markets or the Fund’s portfolio of investments, or arising from its use of derivatives. Consequently, Fund shareholders may receive distributions subject to tax at ordinary income rates at a time
when their investment in the Fund has declined in value, which may be economically similar to a taxable return of capital.
The use of derivatives involves risks different from, or possibly greater than, the risks associated with investing directly in securities and other traditional investments. Derivatives, which may increase market exposure, are subject to a number of risks, including leverage risk, liquidity risk (which may be heightened for highly-customized derivatives), interest rate risk, market risk, counterparty (including credit) risk, operational risk (such as documentation issues, settlement issues and systems failures), legal risk (such as insufficient documentation, insufficient capacity or authority of a counterparty, and issues with the legality or enforceability of a contract), counterparty risk, tax risk and management risk, as well as risks arising from changes in applicable requirements, risks arising from margin requirements, risks arising from mispricing or valuation complexity. They also involve the risk that changes in the value of a derivative instrument may not correlate perfectly with the underlying asset, rate or index. By investing in a derivative instrument, the Fund could lose more than the initial amount invested, and derivatives may increase the volatility of the Fund, especially in unusual or extreme market conditions. In addition, the use of derivatives may cause the Fund’s investment returns to be impacted by the performance of assets the Fund does not own, potentially resulting in the Fund’s total investment exposure exceeding the value of its portfolio. Certain derivatives have the potential for unlimited loss, regardless of the size of the initial investment. The 1940 Act and related rules no longer require asset segregation for derivatives transactions, however asset segregation and posting of collateral may still be utilized for risk management or other purposes. The Fund may be required to hold additional cash or sell other investments in order to obtain cash to close out a position and changes in the value of a derivative may also create margin delivery or settlement payment obligations for the Fund. Also, suitable derivative transactions may not be available in all circumstances and there can be no assurance that the Fund will engage in these transactions to reduce exposure to other risks when that would be beneficial or that, if used, such strategies will be successful. The Fund’s use of derivatives may increase or accelerate the amount of taxes payable by Common Shareholders.
Non-centrally-cleared
over-the
counter (“OTC”) derivatives are also subject to the risk that a counterparty to the transaction will not fulfill its contractual obligations to the other party, as many of the protections afforded to centrally-cleared derivative transactions might not be available for
non-centrally-cleared
OTC derivatives. The primary credit risk on derivatives that are exchange-traded or traded through a central clearing counterparty resides with the Fund’s clearing broker, or the clearinghouse.
|
|
|
|
|
|
| |
222 |
|
PIMCO CLOSED-END FUNDS |
|
|
|
|
Derivatives that are cleared by a central clearing organization can still be subject to different risks, including the creditworthiness of the central clearing organization and its members.
In addition, derivatives that are traded on an exchange are subject to the risk that an exchange may limit the maximum daily price fluctuation of a derivative contract and restrict or suspend trading of a contract that has reached a limit. Such limit governs only price movements of a contract during a particular trading day and therefore does not limit potential losses because the limit may work to prevent the liquidation of unfavorable positions. A daily limit may be reached for several consecutive days with little or no trading.
Participation in the markets for derivative instruments involves investment risks and transaction costs to which the Fund may not be subject absent the use of these strategies. The skills needed to successfully execute derivative strategies may be different from those needed for other types of transactions. If the Fund incorrectly forecasts the value and/or credit-worthiness of securities, currencies, interest rates, counterparties or other economic factors involved in a derivative transaction, the Fund might have been in a better position if the Fund had not entered into such derivative transaction. In evaluating the risks and contractual obligations associated with particular derivative instruments or other similar investments, it is important to consider that certain derivative transactions, absent a default or termination event, may only be modified or terminated by mutual consent of the Fund and its counterparty.
Therefore, it may not be possible for the Fund to modify, terminate, or offset the Fund’s obligations or the Fund’s exposure to the risks associated with a derivative transaction prior to its scheduled termination or maturity date, which may create a possibility of increased volatility and/or decreased liquidity to the Fund. Hedges are sometimes subject to imperfect matching between the derivative and the underlying instrument, and there can be no assurance that the Fund’s hedging transactions will be effective. Derivatives used for hedging or risk management may not operate as intended and may expose the Fund to additional risks. In such cases, the Fund may experience losses.
Because the markets for certain derivative instruments (including markets located in foreign countries) are relatively new and still developing, appropriate derivative transactions may not be available in all circumstances for risk management or other purposes. Upon the expiration of a particular contract, the Fund may wish to retain the Fund’s position in the derivative instrument by entering into a similar contract, but may be unable to do so if the counterparty to the original contract is unwilling to enter into the new contract and no other
appropriate counterparty can be found. When such markets are unavailable, the Fund will be subject to increased liquidity and investment risk.
The Fund may enter into opposite sides of interest rate swap and other derivatives for the principal purpose of generating distributable gains on the one side (characterized as ordinary income for tax purposes) that are not part of the Fund’s duration or yield curve management strategies (“paired swap transactions”), and with a substantial possibility that the Fund will experience a corresponding capital loss and decline in NAV with respect to the opposite side transaction (to the extent it does not have corresponding offsetting capital gains). Consequently, Common Shareholders may receive distributions and owe tax on amounts that are effectively a taxable return of the shareholder’s investment in the Fund, at a time when their investment in the Fund has declined in value, which tax may be at ordinary income rates. In addition, the Fund’s use of derivatives may cause the Fund to realize higher amounts of short-term capital gains (generally taxed at ordinary income tax rates), potentially subjecting shareholders of the Fund to adverse tax consequences. The tax treatment of certain derivatives in which the Fund invests may be unclear and thus subject to recharacterization. Any recharacterization of payments made or received by the Fund pursuant to derivatives potentially could affect the amount, timing or character of Fund distributions. In addition, the tax treatment of such investment strategies may be changed by regulation or otherwise.
More generally, sales of the Fund’s portfolio holdings may result in short-term capital gains (which are generally taxed to shareholders at ordinary income tax rates when distributed net of short-term capital losses and net of long-term capital losses), potentially subjecting shareholders of the Fund to adverse tax consequences.
When a derivative is used as a hedge against a position that the Fund holds, any loss generated by the derivative generally should be substantially offset by gains on the hedged investment, and vice versa. Although hedging can reduce or eliminate losses, it can also reduce or eliminate gains. Hedges are sometimes subject to imperfect matching between the derivative and the underlying instrument, and there can be no assurance that the Fund’s hedging transactions will be effective. Derivatives used for hedging or risk management may not operate as intended or may expose the Fund to additional risks. In addition, derivatives used for hedging may partially protect the Fund from the risks they were intended to hedge yet not fully mitigate the impact of such risks. The regulation of the derivatives markets has increased over the past several years, and additional future regulation of the derivatives markets may make derivatives more costly, may limit the availability or reduce the liquidity of derivatives, or may otherwise
|
|
|
|
|
|
|
|
|
|
|
|
| |
| |
|
|
ANNUAL REPORT |
|
|
| |
|
|
JUNE 30, 2025 |
|
|
223 |
|
|
|
|
| |
Principal Risks of the Funds |
|
|
|
|
adversely affect the value or performance of derivatives. Any such adverse future developments could impair the effectiveness or raise the costs of the Fund’s derivative transactions, impede the employment of the Fund’s derivatives strategies, or adversely affect the Fund’s performance and cause the Fund to lose value.
Distressed and Defaulted Securities Risk
Investments in the securities of financially distressed issuers involve substantial risks, including the risk of default. Distressed securities generally trade significantly below “par” or full value because investments in such securities and debt of distressed issuers or issuers in default are considered speculative and involve substantial risks in addition to the risks of investing in high-yield bonds. Such investments may be in default at the time of investment. In addition, these securities may fluctuate more in price, and are typically less liquid. The Fund also will be subject to significant uncertainty as to when, and in what manner, and for what value obligations evidenced by securities of financially distressed issuers will eventually be satisfied. Defaulted obligations might be repaid only after lengthy workout or bankruptcy proceedings, during which the issuer might not make any interest or other payments. In any such proceeding relating to a defaulted obligation, the Fund may lose its entire investment or may be required to accept cash or securities with a value substantially less than its original investment. Moreover, any securities received by the Fund upon completion of a workout or bankruptcy proceeding may be less liquid, speculative or restricted as to resale. Similarly, if the Fund participates in negotiations with respect to any exchange offer or plan of reorganization with respect to the securities of a distressed issuer, the Fund may be restricted from disposing of such securities. To the extent that the Fund becomes involved in such proceedings, the Fund may have a more active participation in the affairs of the issuer than that assumed generally by an investor. The Fund may incur additional expenses to the extent it is required to seek recovery upon a default in the payment of principal or interest on its portfolio holdings.
Also among the risks inherent in investments in a troubled issuer is that it frequently may be difficult to obtain information as to the true financial condition of such issuer. PIMCO’s judgments about the credit quality of a financially distressed issuer and the relative value of its securities may prove to be wrong.
Distribution Rate Risk
The Fund’s distribution rate may be affected by numerous factors, including but not limited to changes in realized and projected market returns, fluctuations in market interest rates, Fund performance, and other factors. The Fund’s distributions may be comprised of a return of capital. In general terms, a return of capital would occur where a Fund distribution (or portion thereof) represents a return of a portion of your investment, rather than net income or capital gains generated from
your investment during a particular period. There can be no assurance that a change in market conditions or other factors will not result in a change in the Fund’s distribution rate or that the rate will be sustainable in the future. Additionally, the distribution rate is not indicative of the Fund’s performance and may not correlate with the actual returns generated by the Fund’s investments.
For instance, during periods of low or declining interest rates, the Fund’s distributable income and dividend levels may decline for many reasons. For example, the Fund may have to deploy uninvested assets (whether from sales of Fund shares, proceeds from matured, traded or called debt obligations or other sources) in new, lower yielding instruments. Additionally, payments from certain instruments that may be held by the Fund (such as variable and floating rate securities) may be negatively impacted by declining interest rates, which may also lead to a decline in the Fund’s distributable income and dividend levels.
Emerging Markets Risk
Foreign
(non-U.S.)
investment risk may be particularly high to the extent that the Fund invests in securities of issuers based in or doing business in emerging market countries or invests in securities denominated in the currencies of emerging market countries. Investing in securities of issuers based in or doing business in emerging markets entails all of the risks of investing in foreign securities noted above, but to a heightened degree.
Investments in emerging market countries pose a greater degree of systemic risk (i.e., the risk of a cascading collapse of multiple institutions within a country, and even multiple national economies). The inter-relatedness of economic and financial institutions within and among emerging market economies has deepened over the years, with the effect that institutional failures and/or economic difficulties that are of initially limited scope may spread throughout a country, a region or all or most emerging market countries. This may undermine any attempt by the Fund to reduce risk through geographic diversification of its portfolio.
There is a heightened possibility of imposition of withholding taxes on interest or dividend income generated from emerging market securities. Governments of emerging market countries may engage in confiscatory taxation or expropriation of income and/or assets to raise revenues or to pursue a domestic political agenda. In the past, emerging market countries have nationalized assets, companies and even entire sectors, including the assets of foreign investors, with inadequate or no compensation to the prior owners. There can be no assurance that the Fund will not suffer a loss of any or all of its investments, or interest or dividends thereon, due to adverse fiscal or other policy changes in emerging market countries.
|
|
|
|
|
|
| |
224 |
|
PIMCO CLOSED-END FUNDS |
|
|
|
|
There is also a greater risk that an emerging market government may take action that impedes or prevents the Fund from taking income and/or capital gains earned in the local currency and converting into U.S. dollars (i.e., “repatriating” local currency investments or profits). Certain emerging market countries have sought to maintain foreign exchange reserves and/or address the economic volatility and dislocations caused by the large international capital flows by controlling or restricting the conversion of the local currency into other currencies. This risk tends to become more acute when economic conditions otherwise worsen. There can be no assurance that if the Fund earns income or capital gains in an emerging market currency or PIMCO otherwise seeks to withdraw the Fund’s investments from a given emerging market country, capital controls imposed by such country will not prevent, or cause significant expense, or delay in, doing so.
Bankruptcy law and creditor reorganization processes may differ substantially from those in the United States, resulting in greater uncertainty as to the rights of creditors, the enforceability of such rights, reorganization timing and the classification, seniority and treatment of claims. In certain emerging market countries, although bankruptcy laws have been enacted, the process for reorganization remains highly uncertain. In addition, it may be impossible to seek legal redress against an issuer that is a sovereign state.
Emerging market countries typically have less established regulatory, disclosure, legal, accounting, recordkeeping and financial reporting systems than those in more developed markets, which may reduce the scope or quality of financial information available to investors. Governments in emerging market countries are often less stable and more likely to take extra-legal action with respect to companies, industries, assets, or foreign ownership than those in more developed markets. Moreover, it can be more difficult for investors to bring litigation or enforce judgments against issuers in emerging markets or for U.S. regulators to bring enforcement actions against such issuers. In addition, foreign companies with securities listed on U.S. exchanges may be delisted if they do not meet U.S. accounting standards and auditor oversight requirements, which may decrease the liquidity and value of the securities. The Fund may also be subject to emerging markets risk if it invests in derivatives or other securities or instruments whose value or return are related to the value or returns of emerging markets securities.
Other heightened risks associated with emerging markets investments include without limitation (i) risks due to less social, political and economic stability; (ii) the smaller size of the market for such securities and a lower volume of trading, resulting in a lack of liquidity and in price volatility; (iii) certain national policies which may restrict the Fund’s investment opportunities, including sanctions and restrictions
on investing in issuers or industries deemed sensitive to relevant national interests and requirements that government approval be obtained prior to investment by foreign persons; (iv) certain national policies that may restrict the Fund’s repatriation of investment income, capital or the proceeds of sales of securities, including temporary restrictions on foreign capital remittances; (v) the lack of uniform accounting and auditing standards and/or standards that may be significantly different from the standards required in the United States; (vi) less publicly available financial and other information regarding issuers; (vii) potential difficulties in enforcing contractual obligations; and (viii) higher rates of inflation, higher interest rates and other economic concerns. The Fund may invest to a substantial extent in emerging market securities that are denominated in local currencies, subjecting the Fund to a greater degree of foreign currency risk. Also, investing in emerging market countries may entail purchases of securities of issuers that are insolvent, bankrupt or otherwise of questionable ability to satisfy their payment obligations as they become due, subjecting the Fund to a greater amount of credit risk and/or high yield risk. The economy of some emerging markets may be particularly exposed to or affected by a certain industry or sector, and therefore issuers and/or securities of such emerging markets may be more
affected
by the performance of such industries or sectors.
Energy Sector Risk
Many MLPs and other companies in which the Fund may invest operate natural gas, natural gas liquids, crude oil, refined products, coal or other facilities within the energy sector. The Fund will be susceptible to adverse economic, environmental or regulatory occurrences affecting that sector. A downturn in the energy sector could have a larger impact on the Fund than on funds that are broadly diversified across many sectors and industries. At times, the performance of securities of companies in the energy sector may lag behind the performance of other sectors or industries or the broader market as a whole. MLPs and other companies operating in the energy sector are subject to specific risks, including, but not limited to, the following:
Commodity price risk
. MLPs and other entities in the energy sector may be heavily affected by fluctuations in the prices of energy commodities. Fluctuations in energy commodity prices would directly impact companies that own such energy commodities and could indirectly impact companies that engage in transportation, storage, processing, distribution, or marketing of such energy commodities. Fluctuations in energy commodity prices can result from changes in general economic conditions or political circumstances (especially of key energy producing and consuming countries); market conditions; weather patterns; domestic production levels; volume of imports; energy conservation; domestic and
foreign
governmental regulation;
|
|
|
|
|
|
|
|
|
|
|
|
| |
| |
|
|
ANNUAL REPORT |
|
|
| |
|
|
JUNE 30, 2025 |
|
|
225 |
|
|
|
|
| |
Principal Risks of the Funds |
|
|
|
|
international politics or geopolitical conflict; policies of OPEC; taxation; tariffs; and the availability and costs of local, intrastate and interstate transportation methods. High commodity prices may drive further energy conservation efforts, and a slowing economy may adversely impact energy consumption, which may adversely affect the performance of MLPs and other companies operating in the energy sector. Recent economic and market events have fueled concerns regarding potential liquidations of commodity futures and options positions.
Supply and demand risk.
MLPs and other entities operating in the energy sector could be adversely affected by reductions in the supply of or demand for energy commodities. The volume of production of energy commodities and the volume of energy commodities available for transportation, storage, processing or distribution could be affected by a variety of factors, including depletion of resources; depressed commodity prices; catastrophic events; labor relations; increased environmental or other governmental regulation; equipment malfunctions and maintenance difficulties; import volumes; international politics; policies of OPEC and increased competition from alternative energy sources. A decline in demand for energy commodities could result from factors such as adverse economic conditions (especially in key energy-consuming countries); increased taxation; increased environmental or other governmental regulation; increased fuel economy; pandemic; political turmoil; increased energy conservation or use of alternative energy sources; legislation intended to promote the use of alternative energy sources; or increased commodity prices. In addition, MLPs and other entities operating in the energy sector could be adversely affected by increases in the supply of energy commodities if there is not a corresponding increase in demand. The adverse impact of these events could lead to a reduction in the distributions paid by MLPs and other entities operating in the energy sector.
Depletion risk
. Energy reserves naturally deplete as they are consumed. MLPs and other companies operating in the energy sector rely on the expansion of reserves through exploration of new sources of supply or the development of existing sources in order to grow or maintain their revenues. The financial performance of MLPs and other companies operating in the energy sector may be adversely affected if they, or the companies to which they provide services, are unable to cost-effectively acquire additional energy deposits sufficient to replace the natural decline of existing reserves. If an energy company is not able to raise capital on favorable terms, it may not be able to add or maintain its reserves.
Environmental and regulatory risk.
The energy sector and entities operating in it are subject to significant regulation, including with respect to how facilities are constructed, maintained and operated;
environmental and safety controls and the prices they may charge for the products and services they provide. Such regulation can change over time in both scope and intensity. For example, a particular input or
by-product
may be declared hazardous by a regulatory agency and unexpectedly increase production costs. Various governmental authorities have the power to enforce compliance with these regulations and the permits issued under them, and violators are subject to administrative, civil and criminal penalties, including civil fines and/or injunctions. Stricter laws, regulations or enforcement policies could be enacted in the future which would likely increase compliance costs and adversely affect the financial performance of MLPs and other entities operating in the energy sector.
Specifically, the operations of wells, gathering systems, pipelines, refineries and other facilities are subject to stringent and complex laws and regulations. These include, for example, the federal Clean Air Act and comparable state laws and regulations that impose obligations related to air emissions; the federal Clean Water Act and comparable state laws and regulations that impose obligations related to discharges of pollutants into regulated bodies of water; Resource Conservation and Recovery Act (“RCRA”) and comparable state laws and regulations that impose requirements for the handling and disposal of waste from facilities; and Federal Comprehensive Environmental Response, Compensation and Liability Act of 1980 (“CERCLA”) and comparable state laws and regulations that regulate the cleanup of hazardous substances that may have been released at properties currently or previously owned or operated by energy companies or at locations to which they have sent waste for disposal.
Certain environmental statutes, including RCRA, CERCLA, the federal Oil Pollution Act and analogous state laws and regulations impose strict, joint and several liability for costs required to clean up and restore sites where hazardous substances have been disposed of or otherwise released. Moreover, it is not uncommon for neighboring landowners and other third parties to file claims for personal injury and property damage allegedly caused by the release of hazardous substances or other waste products into the environment.
There is an inherent risk that MLPs and other entities operating in the energy sector may incur environmental costs and liabilities due to the nature of their businesses and the substances they handle. For example, an accidental release from wells or gathering pipelines could subject them to substantial liabilities for environmental cleanup and restoration costs, claims made by neighboring landowners and other third parties for personal injury and property damage and fines or penalties for related violations of environmental laws or regulations. Moreover, the possibility exists that stricter laws, regulations or enforcement policies could significantly increase the compliance costs
|
|
|
|
|
|
| |
226 |
|
PIMCO CLOSED-END FUNDS |
|
|
|
|
of MLPs and other entities operating in the energy sector, and the cost of any remediation that may become necessary. MLPs and other entities operating in the energy sector may not be able to recover these costs from insurance.
Voluntary initiatives and mandatory controls have been adopted or are being discussed both in the U.S. and worldwide to reduce emissions of “greenhouse gases” such as carbon dioxide, a
by-product
of burning fossil fuels, and methane, the major constituent of natural gas, which many scientists and policymakers believe contribute to global climate change. These measures and future measures could result in increased costs to certain companies in which the Fund may invest to operate and maintain facilities and administer and manage a greenhouse gas emissions program and may reduce demand for fuels that generate greenhouse gases and that are managed or produced by companies in which the Fund may invest.
Weather risk.
Weather plays a role in the seasonality of some MLPs’ cash flows. MLPs in the propane industry, for example, rely on the winter season to generate almost all their earnings. In an unusually warm winter season, MLPs in the propane industry experience decreased demand for their product. Although most MLPs can reasonably predict seasonal weather demand based on normal weather patterns, extreme weather conditions, such as the hurricanes that severely damaged cities along the U.S. Gulf Coast in recent years, demonstrate that no amount of preparation can protect an MLP from the unpredictability of the weather or possible climate change. The damage done by extreme weather also may serve to increase many MLPs’ insurance premiums and could adversely affect such companies’ financial condition and ability to pay distributions. Other companies operating in the energy sector may be subject to similar risks. Catastrophic event risk. MLPs and other entities operating in the energy sector are subject to many dangers inherent in the production, exploration, management, transportation, processing, and distribution of natural gas, natural gas liquids (including propane), crude oil, refined petroleum and petroleum products and other hydrocarbons. These dangers include leaks, fires, explosions, damage to facilities and equipment resulting from natural disasters, inadvertent damage to facilities and equipment and terrorist acts. Since the September 11 terrorist attacks, the U.S. government has issued warnings that energy assets, specifically U.S. pipeline infrastructure, may be targeted in future terrorist attacks. These dangers give rise to risks of substantial losses as a result of loss or destruction of commodity reserves; damage to or destruction of property, facilities and equipment; pollution and environmental damage; and personal injury or loss of life. As a result of the
COVID-19
pandemic, demand for commodities fell sharply and commodity prices experienced significant disruptions. The economic turmoil was exacerbated by disagreement between Russia and Saudi
Arabia on the reduction of oil production, and the resulting glut in supply and price war cratered commodity prices to historic lows. Any occurrence of such catastrophic events could bring about a limitation, suspension or discontinuation of the operations of MLPs and other entities operating in the energy sector. MLPs and other entities operating in the energy sector may not be fully insured against all risks inherent in their business operations and therefore accidents and catastrophic events could adversely affect such companies’ financial condition and ability to pay distributions to shareholders.
Acquisition risk.
MLPs may depend on their ability to make acquisitions that increase adjusted operating surplus per unit in order to increase distributions to unit holders. The ability of MLPs to make future acquisitions is dependent on their ability to identify suitable targets, negotiate favorable purchase contracts, obtain acceptable financing and outbid competing potential acquirers. To the extent that MLPs are unable to make future acquisitions, or such future acquisitions fail to increase the adjusted operating surplus per unit, their growth and ability to make distributions to investors will be limited. There are risks inherent in any acquisition, including erroneous assumptions regarding revenues, acquisition expenses, operating expenses, cost savings and synergies, assumption of liabilities, indemnification, customer losses, key employee defections, distraction from other business operations and unanticipated difficulties in operating or integrating new product areas and geographic regions, among others. Other companies operating in the energy sector may be subject to similar risks. Furthermore, even if an MLP or another company operating in the energy sector does consummate an acquisition that it believes will be accretive, the acquisition may instead result in a decrease in free cash flow.
Cyclical industry risk.
The energy industry is cyclical and from time to time may experience a shortage of drilling rigs, equipment, supplies or qualified personnel, or due to significant demand, such services may not be available on commercially reasonable terms. An MLP’s ability to successfully and timely complete capital improvements to existing or other capital projects is contingent upon many variables. Should any such efforts be unsuccessful, an MLP could be subject to additional costs and/or the
write-off
of its investment in the project or improvement. The marketability of oil and gas production depends in large part on the availability, proximity and capacity of pipeline systems owned by third parties. Oil and gas properties are subject to royalty interests, liens and other burdens, encumbrances, easements or restrictions, all of which could impact the production of a particular MLP. Oil and gas MLPs operate in a highly competitive and cyclical industry with intense price competition. A significant portion of their revenues may depend on a relatively small number of customers, including governmental entities and utilities.
|
|
|
|
|
|
|
|
|
|
|
|
| |
| |
|
|
ANNUAL REPORT |
|
|
| |
|
|
JUNE 30, 2025 |
|
|
227 |
|
|
|
|
| |
Principal Risks of the Funds |
|
|
|
|
Equity Securities and Related Market Risk
The market price of common stocks and other equity or equity-related securities may go up or down, sometimes rapidly or unpredictably. Equity securities may decline in value due to factors affecting equity securities markets generally, particular industries represented in those markets, or the issuer itself. The values of equity securities may decline due to real or perceived adverse economic conditions, changes in the general outlook for corporate earnings, changes in interest or currency rates, adverse changes to credit markets or adverse investor sentiment generally. They may also decline due to labor shortages or increased production costs and competitive conditions within an industry. Equity securities generally have greater price volatility than bonds and other debt securities.
Different types of equity securities provide different voting and dividend rights and priority in the event of the bankruptcy and/or insolvency of the issuer. In addition to common stock, equity securities may include preferred securities, convertible securities and warrants. Equity securities other than common stock are subject to many of the same risks as common stock, although possibly to different degrees. The risks of equity securities are generally magnified in the case of equity investments in distressed companies.
Focused Investment Risk
To the extent that the Fund focuses its investments in a particular sector, it may be susceptible to loss due to adverse developments affecting that sector, including (but not limited to): governmental regulation; inflation; rising interest rates; cost increases in raw materials, fuel and other operating expenses; technological innovations that may render existing products and equipment obsolete; competition from new entrants; high research and development costs; increased costs associated with compliance with environmental or other governmental regulations; and other economic, business or political developments specific to that sector. Furthermore, the Fund may invest a substantial portion of its assets in companies in related sectors that may share common characteristics, are often subject to similar business risks and regulatory burdens, and whose securities may react similarly to the types of developments described above, which will subject the Fund to greater risk. The Fund also will be subject to focused investment risk to the extent that it invests a substantial portion of its assets in a particular issuer, market, asset class, country or geographic region.
Foreign
(Non-U.S.)
Government Securities Risk
Investments in foreign government securities involve a high degree of risk. The foreign governmental entity that controls the repayment of debt may not be able or willing to repay the principal and/or interest when due. A governmental entity’s willingness or ability to timely repay principal and interest may be affected by, among other factors,
its cash flow situation, the extent of its foreign reserves, the availability of sufficient foreign exchange on the date a payment is due, the relative size of the debt service burden to the economy as a whole, the governmental entity’s policy towards the International Monetary Fund and the political constraints to which a governmental entity may be subject. Foreign governmental entities also may be dependent on expected disbursements from other governments, multilateral agencies and others abroad to reduce principal and interest arrearages on their debt. The commitment on the part of these governments, agencies and others to make such disbursements may be conditioned on the implementation of economic reforms and/or economic performance and the timely service of such debtor’s obligations. Failure to implement such reforms, achieve such levels of economic performance or repay principal or interest when due may result in the cancellation of such third parties’ commitments to lend funds to the foreign governmental entity, which may further impair such debtor’s ability or willingness to timely service its debts. Consequently, foreign governmental entities may default on their debt. Holders of Foreign Government Securities may be requested to participate in the rescheduling of such debt and to extend further loans to governmental entities. In the event of a default by a governmental entity, there may be few or no effective legal remedies for collecting on such debt. These risks are particularly severe with respect to investments in Foreign Government Securities of emerging market countries. Among other risks, if the Fund’s investments in Foreign Government Securities issued by an emerging market country need to be liquidated quickly, the Fund could sustain significant transaction costs. Also, governments in many emerging market countries participate to a significant degree in their economies and securities markets, which may impair investment and economic growth, and which may in turn diminish the value of the Fund’s holdings in emerging market Foreign Government Securities and the currencies in which they are denominated and/or pay revenues.
Foreign
(Non-U.S.)
Investment Risk
Foreign
(non-U.S.)
securities may experience more rapid and extreme changes in value than securities of U.S. issuers or securities that trade exclusively in U.S. markets. The securities markets of many foreign countries are relatively small, with a limited number of companies representing a small number of industries. Additionally, issuers of foreign
(non-U.S.)
securities are usually not subject to the same degree of regulation as U.S. issuers. Reporting, legal, corporate governance, accounting, auditing and custody standards of foreign countries differ, in some cases significantly, from U.S. standards. Global economies and financial markets are becoming increasingly interconnected, and conditions and events in one country, region or financial market may adversely impact issuers in a different country, region or financial market. Foreign
(non-U.S.)
market trading hours, clearance and
|
|
|
|
|
|
| |
228 |
|
PIMCO CLOSED-END FUNDS |
|
|
|
|
settlement procedures, and holiday schedules may limit the Fund’s ability to buy and sell securities. Investments in foreign
(non-U.S.)
markets may also be adversely affected by governmental actions such as the imposition of capital controls, nationalization of companies or industries, expropriation of assets or the imposition of punitive taxes. The governments of certain countries may prohibit or impose substantial restrictions on foreign
(non-U.S.)
investing in their capital markets or in certain sectors or industries. In addition, a foreign
(non-U.S.)
government may limit or cause delay in the convertibility or repatriation of its currency which would adversely affect the U.S. dollar value and/or liquidity of investments denominated in that currency. Certain foreign
(non-U.S.)
investments may become less liquid in response to market developments or adverse investor perceptions, or become illiquid after purchase by the Fund, particularly during periods of market turmoil. A reduction in trading in securities of issuers located in countries whose economies are heavily dependent upon trading with key partners may have an adverse impact on a Fund’s investments.
Also, nationalization, expropriation or confiscatory taxation, unstable governments, decreased market liquidity, currency blockage, market disruptions, political changes, security suspensions or diplomatic developments, trade restrictions (including tariffs) or the imposition of sanctions or other similar measures could adversely affect the Fund’s investments in a foreign
(non-U.S.)
country, and may render holdings in that foreign
(non-U.S.)
country illiquid or even worthless. In the event of nationalization, expropriation or other confiscation, the Fund could lose its entire investment in foreign
(non-U.S.)
securities. The type and severity of sanctions and other similar measures, including counter sanctions and other retaliatory actions, that may be imposed could vary broadly in scope, and their impact is difficult to ascertain. These types of measures may include, but are not limited to, banning a sanctioned country or certain persons or entities associated with such country from global payment systems that facilitate cross-border payments, restricting securities transactions , restricting dealings with entities that are critical to the infrastructure of securities and related transactions in specific jurisdictions, restricting transactions in specified sectors of certain countries, and freezing the assets of particular countries, entities or persons. The imposition of sanctions and other similar measures could, among other things, result in a decline in the value and/or liquidity of securities issued by the sanctioned country or companies located in or economically tied to the sanctioned country, downgrades in the credit ratings of the sanctioned country’s securities or those of companies located in or economically tied to the sanctioned country, currency devaluation or volatility, and increased market volatility and disruption in the sanctioned country and throughout the world. Sanctions and other similar measures could directly or indirectly limit or prevent a Fund from buying and selling
securities (in the sanctioned country and other markets), significantly delay or prevent the settlement of securities transactions, and adversely impact a Fund’s liquidity and performance. Adverse conditions in a certain region can adversely affect securities of other countries whose economies appear to be unrelated. To the extent that the Fund invests a significant portion of its assets in a specific geographic region or in securities denominated in a particular foreign
(non-U.S.)
currency, the Fund will generally have more exposure to regional economic risks, including weather emergencies and natural disasters, associated with foreign
(non-U.S.)
investments. Foreign
(non-U.S.)
securities may also be less liquid (particularly during market closures due to local holidays or other reasons) and more difficult to value than securities of U.S. issuers.
The Fund may invest in securities and instruments that are economically tied to Russia. Investments in Russia are subject to various risks such as, but not limited to political, economic, legal, market and currency risks. The risks include uncertain political and economic policies, short-term market volatility, poor accounting standards, corruption and crime, an inadequate regulatory system, regional armed conflict and unpredictable taxation. Investments in Russia are particularly subject to the risk that further economic sanctions, export and import controls, and other similar measures may be imposed by the United States and/or other countries. Other similar measures may include, but are not limited to, banning or expanding bans on Russia or certain persons or entities associated with Russia from global payment systems that facilitate cross-border payments, restricting the settlement of securities transactions by certain investors, and freezing Russian assets or those of particular countries, entities or persons with ties to Russia (e.g., Belarus). Such sanctions and other similar measures — which may impact companies in many sectors, including energy, financial services, technology, accounting, quantum computing, shipping, aviation, metals and mining, defense, architecture, engineering, construction, manufacturing and transportation, among others — and Russia’s countermeasures may negatively impact the Fund’s performance and/or ability to achieve its investment objectives. For example, certain investments may be prohibited and/or existing investments may become illiquid (e.g., in the event that transacting in certain existing investments is prohibited, securities markets close, or market participants cease transacting in certain investments in light of geopolitical events, sanctions or related considerations), which could render any such securities held by the Fund unmarketable for an indefinite period of time and/or cause the Fund to sell portfolio holdings at a disadvantageous time or price or to continue to hold investments that the Fund no longer seeks to hold. In addition, such sanctions or other similar measures, and the Russian government’s response, could result in a downgrade of Russia’s credit rating or of securities of issuers located in or economically tied to
|
|
|
|
|
|
|
|
|
|
|
|
| |
| |
|
|
ANNUAL REPORT |
|
|
| |
|
|
JUNE 30, 2025 |
|
|
229 |
|
|
|
|
| |
Principal Risks of the Funds |
|
|
|
|
Russia, devaluation of Russia’s currency and/or increased volatility with respect to Russian securities and the ruble. Moreover, disruptions caused by Russian military action or other actions (including cyberattacks, espionage or other asymmetric measures) or resulting actual or threatened responses to such activity may impact Russia’s economy and Russian and other issuers of securities in which the Fund is invested. Such resulting actual or threatened responses may include, but are not limited to, purchasing and financing restrictions, withdrawal of financial intermediaries, boycotts or changes in consumer or purchaser preferences, sanctions, export and import controls, tariffs or cyberattacks on the Russian government, Russian companies or Russian individuals, including politicians. Any actions by Russia made in response to such sanctions or retaliatory measures could further impair the value and liquidity of Fund investments. Sanctions and other similar measures have resulted in defaults on debt obligations by certain corporate issuers and the Russian Federation that could lead to cross-defaults or cross-accelerations on other obligations of these issuers. The Russian securities market is characterized by limited volume of trading, resulting in difficulty in obtaining accurate prices and trading. These issues can be magnified as a result of sanctions and other similar measures that may be imposed and the Russian government’s response. The Russian securities market, as compared to U.S. markets, has significant price volatility, less liquidity, a smaller market capitalization and a smaller number of traded securities. There may be little publicly available information about issuers. Settlement, clearing and registration of securities transactions are subject to risks. Prior to the implementation of the National Settlement Depository (“NSD”), a recognized central securities depository, there was no central registration system for equity share registration in Russia, and registration was carried out by either the issuers themselves or by registrars located throughout Russia. Title to Russian equities held through the NSD is now based on the records of the NSD and not the registrars. Although the implementation of the NSD has enhanced the efficiency and transparency of the Russian securities market, issues resulting in loss can still occur. In addition, sanctions by the European Union against the NSD, as well as the potential for sanctions by other governments, could make it more difficult to conduct or confirm transactions involving Russian securities. Ownership of securities issued by Russian companies that are not held through depositories such as the NSD may be recorded by companies themselves and by registrars. Moreover, changes in Russian laws and regulations could require the transfer of securities or other parties outside of standard custodial arrangements. In such cases, the risk is increased that the Fund could lose ownership rights through fraud, negligence or oversight. While applicable Russian regulations impose liability on registrars for losses resulting from their errors, it may be difficult for the Fund to enforce
any rights it may have against the registrar or issuer of the securities in the event of loss of share registration. In addition, issuers and registrars are still prominent in the validation and approval of documentation requirements for corporate action processing in Russia. Because the documentation requirements and approval criteria vary between registrars and issuers, there remain unclear and inconsistent market standards in the Russian market with respect to the completion and submission of corporate action elections. In addition, sanctions or Russian countermeasures may prohibit or limit a Fund’s ability to participate in corporate actions, and therefore require the Fund to forego voting on or receiving funds that would otherwise be beneficial to the Fund. To the extent that the
Fund
suffers a loss relating to title or corporate actions relating to its portfolio securities, it may be difficult for the Fund to enforce its rights or otherwise remedy the loss. Russian securities laws may not recognize foreign nominee accounts held with a custodian bank, and therefore the custodian may be considered the ultimate owner of securities they hold for their clients. Adverse currency exchange rates are a risk and there may be a lack of available currency hedging instruments. Investments in Russia may be subject to the risk of nationalization or expropriation of assets. Oil, natural gas, metals, minerals and timber account for a significant portion of Russia’s exports, leaving the country vulnerable to swings in world prices and to sanctions or other actions that may be directed at the Russian economy as a whole or at Russian oil, natural gas, metals, minerals or timber industries.
Foreign Loan Originations Risk
PDX, PDI, PAXS and PDO may originate loans to foreign entities and individuals, including foreign
(non-U.S.)
and emerging market entities and individuals. Such loans may involve risks not ordinarily associated with exposure to loans to U.S. entities and individuals. The foreign lending industry may be subject to less governmental supervision and regulation than exists in the United States; conversely, foreign regulatory regimes applicable to the lending industry may be more complex and more restrictive than those in the U.S., resulting in higher costs associated with such investments, and such regulatory regimes may be subject to interpretation or change without prior notice to investors, such as the Fund. Foreign lending may not be subject to accounting, auditing, and financial reporting standards and practices comparable to those in the United States. Due to differences in legal systems, there may be difficulty in obtaining or enforcing a court judgment outside the United States. In addition, to the extent that investments are made in a limited number of countries, events in those countries will have a more significant impact on the Fund. The Fund’s loans to foreign entities and individuals may be subject to risks of increased transaction costs, potential delays in settlement or unfavorable differences between the U.S. economy and foreign
economies
.
|
|
|
|
|
|
| |
230 |
|
PIMCO CLOSED-END FUNDS |
|
|
|
|
The Fund’s exposure to loans to foreign entities and individuals may be subject to withholding and other foreign taxes, which may adversely affect the net return on such investments. In addition, fluctuations in foreign currency exchange rates and exchange controls may adversely affect the market value of the Fund’s exposure to loans to foreign entities and individuals. The Fund is unlikely to be able to pass through to its shareholders foreign income tax credits in respect of any foreign income taxes it pays.
High Yield Securities Risk
To the extent that the Fund invests in high yield securities and unrated securities of similar credit quality (commonly known as “high yield securities” or “junk bonds”), the Fund may be subject to greater levels of market risk, credit risk, call risk and liquidity risk than funds that do not invest in such securities, which could have a negative effect on the NAV of the Fund’s Common Shares or Common Share dividends. These securities are considered predominantly speculative by rating agencies with respect to an issuer’s continuing ability to make principal and interest payments, and their value may be more volatile than other types of securities. An economic downturn or individual issuer developments could adversely affect the market for these securities and reduce the Fund’s ability to sell these securities at an advantageous time or price. An economic downturn could also lead to a higher
non-payment
rate and, a high yield security may lose significant market value before a default occurs. The Fund may purchase distressed securities that are in default or the issuers of which are in bankruptcy, which involve heightened risks.
High yield securities structured as
zero-coupon
bonds or
securities tend to be especially volatile as they are particularly sensitive to downward pricing pressures from rising interest rates or widening spreads and may require the Fund to make taxable distributions of imputed income without receiving the actual cash currency. Issuers of high yield securities may have the right to “call” or redeem the issue prior to maturity, which may result in the Fund having to reinvest the proceeds in other high yield securities or similar instruments that may pay lower interest rates. The Fund may also be subject to greater levels of liquidity risk than funds that do not invest in high yield securities. Consequently, transactions in high yield securities may involve greater costs than transactions in more actively traded securities.
A lack of publicly-available information, irregular trading activity and wide bid/ask spreads among other factors, may, in certain circumstances, make high yield debt more difficult to sell at an advantageous time or price than other types of securities or instruments. These factors may result in the Fund being unable to realize full value for these securities and/or may result in the Fund not receiving the proceeds from a sale of a high yield security for an extended period after such sale, each of which could result in losses to
the Fund. Because of the risks involved in investing in high yield securities, an investment in the Fund should be considered speculative.
In general, lower rated debt securities carry a greater degree of risk that the issuer will lose its ability to make interest and principal payments, which could have a negative effect on the Fund. Securities of below investment grade quality are regarded as having predominantly speculative characteristics with respect to capacity to pay interest and repay principal and are commonly referred to as “high yield” securities or “junk bonds.” High yield securities involve a greater risk of default and their prices are generally more volatile and sensitive to actual or perceived negative developments. Debt securities in the lowest investment grade category also may be considered to possess some speculative characteristics by certain rating agencies. The Fund may purchase stressed or distressed securities that are in default or the issuers of which are in bankruptcy, which involve heightened risks.
An economic downturn could severely affect the ability of issuers (particularly those that are highly leveraged) to service or repay their debt obligations. Lower-rated securities are generally less liquid than higher-rated securities, which may have an adverse effect on a Fund’s ability to dispose of them. For example, under adverse market or economic conditions, the secondary market for below investment grade securities could contract further, independent of any specific adverse changes in the condition of a particular issuer, and certain securities in a Fund’s portfolio may become illiquid or less liquid. As a result, a Fund could find it more difficult to sell these securities or may be able to sell these securities only at prices lower than if such securities were widely traded.
To the extent the Fund focuses on below investment grade debt obligations, PIMCO’s capabilities in analyzing credit quality and associated risks will be particularly important, and there can be no assurance that PIMCO will be successful in this regard.
The Fund’s credit quality policies apply only at the time a security is purchased, and the Fund is not required to dispose of a security in the event that a rating agency or PIMCO downgrades its assessment of the credit characteristics of a particular issue. In determining whether to retain or sell such a security, PIMCO may consider factors including, but not limited to, PIMCO’s assessment of the credit quality of the issuer of such security, the price at which such security could be sold and the rating, if any, assigned to such security by other rating agencies. Analysis of creditworthiness may be more complex for issuers of high yield securities than for issuers of higher quality debt securities.
|
|
|
|
| |
Principal Risks of the Funds |
|
|
|
|
Industry Specific Risks
MLPs and other entities operating in the energy sector are also subject to risks that are specific to the industry within that sector they serve.
Pipelines.
Pipeline companies are subject to the demand for natural gas, natural gas liquids, crude oil or refined products in the markets they serve, changes in the availability of products for gathering, transportation, processing or sale due to natural declines in reserves and production in the supply areas serviced by the companies’ facilities, sharp decreases in crude oil or natural gas prices that cause producers to curtail production or reduce capital spending for exploration activities, and environmental regulation. Demand for gasoline, which accounts for a substantial portion of refined product transportation, depends on price, prevailing economic conditions in the markets served and demographic and seasonal factors. Companies that own interstate pipelines that transport natural gas, natural gas liquids, crude oil or refined petroleum products are subject to regulation by the Federal Energy Regulatory Commission (“FERC”) with respect to the tariff rates they may charge for transportation services. An adverse determination by FERC with respect to the tariff rates of such a company could have a material adverse effect on its business, financial condition, results of operations and cash flows and its ability to pay cash distributions or dividends. In addition, FERC has a tax allowance policy, which permits such companies to include in their cost of service an income tax allowance to the extent that their owners have an actual or potential tax liability on the income generated by them. If FERC’s income tax allowance policy were to change in the future to disallow a material portion of the income tax allowance taken by such interstate pipeline companies, it would adversely impact the maximum tariff rates that such companies are permitted to charge for their transportation services, which would in turn could adversely affect such companies’ financial condition and ability to pay distributions to shareholders.
Gathering and processing.
Gathering and processing companies are subject to natural declines in the production of oil and natural gas fields, which utilize their gathering and processing facilities as a way to market their production, prolonged declines in the price of natural gas or crude oil, which curtails drilling activity and therefore production, and declines in the prices of natural gas liquids and refined petroleum products, which cause lower processing margins. In addition, some gathering and processing contracts subject the gathering or processing company to direct commodities price risk.
Midstream.
Midstream MLPs collect, gather, transport and store natural resources and their byproducts (primarily crude oil, refined petroleum products and natural gas), generally without taking ownership of the physical commodity. Midstream MLPs may also operate ancillary businesses including the marketing of the products
and logistical services. Midstream MLPs and other entities that provide crude oil, refined product and natural gas services are subject to supply and demand fluctuations in the markets they serve, which may be impacted by a wide range of factors including fluctuating commodity prices, weather, increased conservation or use of alternative fuel sources, increased governmental or environmental regulation, depletion, rising interest rates, declines in domestic or foreign production, accidents or catastrophic events and economic conditions, among others.
Upstream.
Exploration, development and production companies are particularly vulnerable to declines in the demand for and prices of crude oil and natural gas. Reductions in prices for crude oil and natural gas can cause a given reservoir to become uneconomic for continued production earlier than it would if prices were higher, resulting in the plugging and abandonment of, and cessation of production from, that reservoir. In addition, lower commodity prices not only reduce revenues but also can result in substantial downward adjustments in reserve estimates. The accuracy of any reserve estimate is a function of the quality of available data, the accuracy of assumptions regarding future commodity prices and future exploration and development costs and engineering and geological interpretations and judgments. Different reserve engineers may make different estimates of reserve quantities and related revenue based on the same data. Actual oil and gas prices, development expenditures and operating expenses will vary from those assumed in reserve estimates, and these variances may be significant. Any significant variance from the assumptions used could result in the actual quantity of reserves and future net cash flow being materially different from those estimated in reserve reports. In addition, results of drilling, testing and production and changes in prices after the date of reserve estimates may result in downward revisions to such estimates. Substantial downward adjustments in reserve estimates could have a material adverse effect on a given exploration and production company’s financial position and results of operations. In addition, due to natural declines in reserves and production, exploration and production companies must economically find or acquire and develop additional reserves in order to maintain and grow their revenues and distributions.
Downstream.
Downstream companies are businesses engaged in refining, marketing and other
“end-customer”
distribution activities relating to refined energy sources, such as: customer-ready natural gas, propane and gasoline; the production and manufacturing of petrochemicals including olefins, polyolefins, ethylene and similar
co-products
as well as intermediates and derivatives; and the generation, transmission and distribution of power and electricity. In addition to the other risks described herein, downstream companies
|
|
|
|
|
|
| |
232 |
|
PIMCO CLOSED-END FUNDS |
|
|
|
|
may be more susceptible to risks associated with reduced customer demand for the products and services they provide.
Oil.
In addition to the risks applicable to pipeline companies described above, gathering and processing companies and exploration and production companies, companies involved in the transportation, gathering, processing, exploration, development or production of crude oil or refined petroleum products may be adversely affected by increased regulations, increased operating costs and reductions in the supply of and/or demand for crude oil and refined petroleum products. Increased regulation may result in a decline in production and/or increased cost associated with offshore oil exploration in the U.S. and around the world, which may adversely affect certain companies and the oil industry in general.
Oilfield services.
The oilfield services business involves a variety of operating risks, including the risk of fire, explosions, blow-outs, pipe failure, abnormally pressured formations and environmental hazards such as oil spills, natural gas leaks, ruptures or discharges of toxic gases. If any of these should occur, such companies could incur legal defense costs and could suffer substantial losses due to injury or loss of life, severe damage to or destruction of property, natural resources and equipment, pollution or other environmental damage,
clean-up
responsibilities, regulatory investigation and penalties and suspension of operations. Any horizontal and deep drilling activities involve greater risk of mechanical problems than vertical and shallow drilling operations. Adverse developments affecting the oil and natural gas industry or drilling activity, including sustained low natural gas prices, a decline in oil or natural gas liquids prices, reduced demand for oil and natural gas products and increased regulation of drilling and production, could have a material adverse effect on a company’s business, financial condition and results of operations.
Propane.
Propane MLPs are subject to earnings variability based upon weather conditions in the markets they serve, fluctuating commodity prices, increased use of alternative fuels, increased governmental or environmental regulation and accidents or catastrophic events, among others.
Coal.
MLP entities and other entities with coal assets are subject to supply and demand fluctuations in the markets they serve, which may be impacted by a wide range of factors including fluctuating commodity prices, the level of their customers’ coal stockpiles, weather, increased conservation or use of alternative fuel sources, increased governmental or environmental regulation, depletion, rising interest rates, declines in domestic or foreign production, mining accidents or catastrophic events, health claims and economic conditions, among others.
Power infrastructure.
Power infrastructure companies are subject to many risks, including earnings variability based upon weather patterns in the locations where the company operates, the change in the demand for electricity, the cost to produce power and the regulatory environment. Further, share prices are partly based on the interest rate environment, the sustainability and potential growth of the dividend and the outcome of various rate cases undertaken by the company or a regulatory body.
Marine transportation.
Marine transportation (or “tanker”) companies are exposed to many of the same risks as other energy companies. In addition, the highly cyclical nature of the tanker industry may lead to volatile changes in charter rates and vessel values, which may adversely affect the earnings of tanker companies in our portfolio. Fluctuations in charter rates and vessel values result from changes in the supply and demand for tanker capacity and changes in the supply and demand for oil and oil products. Historically, the tanker markets have been volatile because many conditions and factors can affect the supply and demand for tanker capacity. Changes in demand for transportation of oil over longer distances and supply of tankers to carry that oil may materially affect revenues, profitability and cash flows of tanker companies. The successful operation of vessels in the charter market depends upon, among other things, obtaining profitable spot charters and minimizing time spent waiting for charters and traveling unladen to pick up cargo. The value of tanker vessels may fluctuate and could adversely affect the value of tanker company securities in our portfolio. Declining tanker values could affect the ability of tanker companies to raise cash, thereby adversely impacting tanker company liquidity. Tanker company vessels are at risk of damage or loss because of events such as mechanical failure, collision, human error, war, terrorism, piracy, cargo loss and bad weather. In addition, changing economic, regulatory and political conditions in some countries, including political and military conflicts, have from time to time resulted in attacks on vessels, mining of waterways, piracy, terrorism, labor strikes, boycotts and government requisitioning of vessels. These sorts of events could interfere with shipping lanes and result in market disruptions and a significant loss of tanker company earnings.
Inflation/Deflation Risk
Inflation risk is the risk that the value of assets or income from the Fund’s investments will be worth less in the future as inflation decreases the value of payments at future dates. As inflation increases, the real value of the Fund’s portfolio could decline. Inflation rates may change frequently and significantly as a result of various factors, including unexpected shifts in the domestic or global economy or changes in fiscal or monetary policies. Deflation risk is the risk that prices throughout the economy decline over time. Deflation may
have
|
|
|
|
|
|
|
|
|
|
|
|
| |
| |
|
|
ANNUAL REPORT |
|
|
| |
|
|
JUNE 30, 2025 |
|
|
233 |
|
|
|
|
| |
Principal Risks of the Funds |
|
|
|
|
an adverse effect on the creditworthiness of issuers and may make issuer default more likely, which may result in a decline in the value of the Fund’s portfolio and Common Shares.
Inflation-Indexed Security Risk
Inflation-indexed debt securities are subject to the effects of actual or anticipated changes in market interest rates caused by factors other than inflation (e.g., real interest rates). In general, the value of an inflation-indexed security, including Treasury Inflation-Protected Securities (“TIPS”), tends to decrease when real interest rates increase and can increase when real interest rates decrease. Thus generally, during periods of rising inflation, the value of inflation-indexed securities will tend to increase and during periods of deflation, their value will tend to decrease. Interest payments on inflation-indexed securities are unpredictable and will fluctuate as the principal and interest are adjusted for inflation. There can be no assurance that the inflation index used (i.e., the Consumer Price Index (“CPI”)), which is calculated and published by a third-party, will accurately measure the real rate of inflation in the prices of goods and services. Increases in the principal value of TIPS due to inflation are considered taxable ordinary income for the amount of the increase in the calendar year. Any increase in the principal amount of an inflation-indexed debt security will be considered taxable ordinary income, even though the Fund will not receive the principal until maturity. Additionally, a CPI swap can potentially lose value if the realized rate of inflation over the life of the swap is less than the fixed market implied inflation rate (fixed breakeven rate) that the investor agrees to pay at the initiation of the swap. With municipal inflation-indexed securities, the inflation adjustment is integrated into the coupon payment, which is federally tax exempt (and may be state tax exempt). For municipal inflation-indexed securities, there is no adjustment to the principal value. Because municipal inflation-indexed securities are a small component of the municipal bond market, they may be less liquid than conventional municipal bonds.
Insurance-Linked and Other Instruments Risk
The Fund may invest in insurance-linked instruments and similar investments (which may include, for example, exposure to reinsurance contracts (through sidecars or otherwise), event-linked bonds, such as catastrophe and resilience bonds, and securities relating to life insurance policies, annuity contracts and premium finance loans). The Fund could lose a portion or all of the principal it has invested in these types of investments, and the right to additional interest and/or dividend payments with respect to the investments, upon the occurrence of one or more trigger events, as defined within the terms of an investment. Trigger events may include natural or other perils of a specific size or magnitude that occur in a designated geographic region during a specified time period, and/or that involve losses or other metrics that exceed a specific amount. The Fund may also invest
in insurance-linked instruments that are subject to “indemnity triggers,” which are tied to losses of the issuer. Insurance-linked instruments subject to indemnity triggers are often regarded as being subject to potential moral hazard, since such insurance-linked investments are triggered by actual losses of the ceding sponsor and the ceding sponsor may have an incentive to take actions and/or risks that would have an adverse effect on the Fund. There is no way to accurately predict whether a trigger event will occur and, accordingly, insurance-linked instruments and similar investments carry significant risk. In addition to the specified trigger events, these types of investments may expose the Fund to other risks, including but not limited to issuer (credit) default, adverse regulatory or jurisdictional interpretations and adverse tax consequences. Each Fund may also gain exposure to reinsurance contracts (through insurance-linked securities, sidecars or otherwise). This exposure may include “excess of loss” contracts, wherein liability arises only if and when losses exceed a specified amount, and proportional reinsurance, wherein a pro rata portion of the premiums and liabilities of the cedant associated with a specified business or a portfolio of insurance contracts are linked to the investment. Investments linked to reinsurance transactions may involve significant insurance brokerage fees, fronting fees and other transaction costs.
A series of major triggering events could cause the failure of a reinsurer. Similarly, to the extent a Fund invests in reinsurance-related securities for which a triggering event occurs, losses associated with such event will result in losses to the Fund and a series of major triggering events affecting a large portion of the reinsurance-related securities held by the Fund may result in substantial losses to the Fund. In addition, unexpected events such as natural disasters or terrorist attacks could lead to government intervention. Political, judicial and legal developments affecting the reinsurance industry could also create new and expanded theories of liability or regulatory or other requirements; such changes could have a material adverse effect on a Fund. In addition, the litigation environment in catastrophe-exposed states or regions could impact the frequency and severity of insurance claims, and litigation costs could decrease the value of a Fund’s investment in products linked to reinsurance contracts. In recent years, capital market participants have been increasingly active in the reinsurance market and markets for related risks. Increased competition could result in fewer submissions, lower premium rates and less favorable policy terms and conditions.
Certain insurance-linked instruments and similar investments may have limited liquidity, or may be illiquid. The Fund has limited transparency into the individual contracts underlying certain insurance-linked instruments and similar investments, which may make the risk assessment of them more difficult. These types of investments may be difficult to value.
|
|
|
|
|
|
| |
234 |
|
PIMCO CLOSED-END FUNDS |
|
|
|
|
The aforementioned instruments may include longevity and mortality investments, including indirect investment in pools of insurance-related longevity and mortality investments, including life insurance policies, annuity contracts and premium finance loans. Such investments are subject to “longevity risk” and/or “mortality risk.” Longevity risk is the risk that members of a reference population will live longer, on average, than anticipated. Mortality risk is the risk that members of a reference population will live shorter, on average, than anticipated. Changes in these rates can significantly affect the liabilities and cash needs of life insurers, annuity providers and pension funds. The terms of a longevity bond typically provide that the investor in the bond will receive less than the bond’s par amount at maturity if the actual average longevity (life span) of a specified population of people observed over a specified period of time (typically measured by a longevity index) is higher than a specified level. If longevity is higher than expected, the bond will return less than its par amount at maturity. A mortality bond, in contrast to a longevity bond, typically provides that the investor in the bond will receive less than the bond’s par amount at maturity if the mortality rate of a specified population of people observed over a specified period of time (typically measured by a mortality index) is higher than a specified level.
During their term, both longevity bonds and mortality bonds typically pay a floating rate of interest to investors. Longevity and mortality investments purchased by the Fund involve the risk of incorrectly predicting the actual level of longevity or mortality, as applicable, for the reference population of people. With respect to mortality investments held by the Fund, there is also the risk that an epidemic or other catastrophic event could strike the reference population, resulting in mortality rates exceeding expectations. The Fund may also gain this type of exposure through event-linked derivative instruments, such as swaps, that are contingent on or formulaically related to longevity or mortality risk.
Interest Rate Risk
Interest rate risk is the risk that fixed income securities and other instruments in the Fund’s portfolio will fluctuate in value because of a change in interest rates. Factors including central bank monetary policy, rising inflation rates, and changes in general economic conditions may cause interest rates to rise, which could cause the value of the Fund’s investments to decline. For example, as nominal interest rates rise, the value of certain fixed income securities held by the Fund is likely to decrease. A nominal interest rate can be described as the sum of a real interest rate and an expected inflation rate. Interest rate changes can be sudden and unpredictable, and the Fund may experience losses as a result of movements in interest rates. The Fund may not be able to effectively hedge against changes in interest rates or may choose not to do so for cost or other reasons.
A wide variety of factors can cause interest rates or yields of U.S. Treasury securities (or yields of other types of bonds) to rise, including, but not limited to, central bank monetary policies, changing inflation or real growth rates, general economic conditions, increasing bond issuances or reduced market demand for low yielding investments. In addition, changes in monetary policy may exacerbate the risks associated with changing interest rates. Further, in market environments where interest rates are rising, issuers may be less willing or able to make principal and interest payments on fixed income investments when due. Actions by governments and central banking authorities can result in increases or decreases in interest rates. Periods of higher inflation could cause such authorities to raise interest rates, which may adversely affect a Fund and its investments.
Further, fixed income securities with longer durations tend to be more sensitive to changes in interest rates, usually making them more volatile. Duration is a measure used to determine the sensitivity of a security’s price to changes in interest rates that incorporates a security’s yield, coupon, final maturity and call features, among other characteristics. Duration is useful primarily as a measure of the sensitivity of a fixed income security’s market price to interest rate (i.e., yield) movements. All other things remaining equal, for each one percentage point increase in interest rates, the value of a portfolio of fixed income investments would generally be expected to decline by one percent for every year of the portfolio’s average duration above zero. For example, the value of a portfolio of fixed income securities with an average duration of eight years would generally be expected to decline by approximately 8% if interest rates rose by one percentage point.
Dividend-paying equity securities, particularly those whose market price is closely related to their yield, may be more sensitive to changes in interest rates. During periods of rising interest rates, the values of such securities may decline and may result in losses to the Fund. Variable and floating rate securities may decline in value if their interest rates do not rise as much, or as quickly, as interest rates in general. Conversely, floating rate securities will not generally increase in value if interest rates decline. Inverse floating rate securities may decrease in value if interest rates increase. Inverse floating rate securities may also exhibit greater price volatility than a fixed rate obligation with similar credit quality. When the Fund holds variable or floating rate securities, a decrease (or, in the case of inverse floating rate securities, an increase) in market interest rates will adversely affect the income received from such securities and the NAV of the Fund’s shares.
Variable and floating rate securities generally are less sensitive to interest rate changes but may decline in value if their interest rates do not rise as much, or as quickly, as interest rates in general. Conversely,
|
|
|
|
|
|
|
|
|
|
|
|
| |
| |
|
|
ANNUAL REPORT |
|
|
| |
|
|
JUNE 30, 2025 |
|
|
235 |
|
|
|
|
| |
Principal Risks of the Funds |
|
|
|
|
floating rate securities will not generally increase in value if interest rates decline. Inverse floating rate securities may decrease in value if interest rates increase. Inverse floating rate securities may also exhibit greater price volatility than a fixed rate obligation with similar credit quality. When the Fund holds variable or floating rate securities, a decrease (or, in the case of inverse floating rate securities, an increase) in market interest rates will adversely affect the income received from such securities and the NAV of the Fund’s shares.
During periods of very low or negative interest rates, the Fund may be unable to maintain positive returns. Very low or negative interest rates may magnify interest rate risk. Changing interest rates, including rates that fall below zero, may have unpredictable effects on markets, may result in heightened market volatility and may detract from Fund performance to the extent the Fund is exposed to such interest rates.
Measures such as average duration may not accurately reflect the true interest rate sensitivity of the Fund. This is especially the case if the Fund consists of securities with widely varying durations. Therefore, if the Fund has an average duration that suggests a certain level of interest rate risk, the Fund may in fact be subject to greater interest rate risk than the average would suggest. This risk is greater to the extent the Fund uses leverage or derivatives in connection with the management of the Fund.
Convexity is an additional measure used to understand a security’s or the Fund’s interest rate sensitivity. Convexity measures the rate of change of duration in response to changes in interest rates. With respect to a security’s price, a larger convexity (positive or negative) may imply more dramatic price changes in response to changing interest rates. Convexity may be positive or negative. Negative convexity implies that interest rate increases result in increased duration, and that interest rate decreases result in declining duration (i.e., increased sensitivity in prices in response to rising and/or declining interest rates). Thus, securities with negative convexity, which may include bonds with traditional call features and certain mortgage-backed securities, may experience greater losses in periods of rising interest rates. Accordingly, if the Fund holds such securities, the Fund may be subject to a greater risk of losses in periods of rising interest rates.
Rising interest rates may result in periods of volatility and a decline in value of the Fund’s fixed income investments. Also, when interest rates rise, issuers are less likely to refinance existing debt securities, causing the average life of such securities to extend. Further, while U.S. bond markets have steadily grown over the past three decades, dealer “market making” ability has remained relatively stagnant. As a result, dealer inventories of certain types of bonds and similar instruments, which provide a core indication of the ability of financial
intermediaries to “make markets,” are at or near
historic
lows in relation to market size. Because market makers provide stability to a market through their intermediary services, a significant reduction in dealer inventories could potentially lead to decreased liquidity and increased volatility in the fixed income markets. Such issues may be exacerbated during periods of economic uncertainty. All of these factors, collectively and/or individually, could cause the Fund to lose value.
Issuer Risk
The value of a security may decline for a number of reasons that directly relate to the issuer, such as management performance, major litigation, investigations or other controversies, changes in the issuer’s financial condition or credit rating, changes in government regulations affecting the issuer or its competitive environment and strategic initiatives such as mergers, acquisitions or dispositions and the market response to any such initiatives, financial leverage, reputation or reduced demand for the issuer’s goods or services, as well as the historical and prospective earnings of the issuer and the value of its assets. A change in the financial condition of a single issuer may affect one or more other issuers or securities markets as a whole. These risks can apply to the Common Shares issued by the Fund and to the issuers of securities and other instruments in which the Fund invests.
Leverage Risk
The Fund’s use of leverage, if any, creates the opportunity for increased Common Share net income, but also creates special risks for Common Shareholders (including an increased risk of loss). To the extent used, there is no assurance that the Fund’s leveraging strategies will be successful. Leverage is a speculative technique that may expose the Fund to greater risk and increased costs. The Fund’s assets attributable to leverage, if any, will be invested in accordance with the Fund’s investment objectives and policies. Interest expense payable by the Fund with respect to derivatives and other forms of leverage, and dividends payable with respect to preferred shares outstanding, if any, will generally be based on shorter-term interest rates that would be periodically reset. So long as the Fund’s portfolio investments provide a higher rate of return (net of applicable Fund expenses) than the interest expenses and other costs to the Fund of such leverage, the investment of the proceeds thereof will generate more income than will be needed to pay the costs of the leverage. If so, and all other things being equal, the excess may be used to pay higher dividends to Common Shareholders than if the Fund were not so leveraged. There can be no assurance these circumstances will occur. If, however, shorter-term interest rates rise relative to the rate of return on the Fund’s portfolio, the interest and other costs to the Fund of leverage could exceed the rate of return on the debt obligations and other investments held by the Fund, thereby reducing return to Common Shareholders. When the Fund reduces or
|
|
|
|
|
|
| |
236 |
|
PIMCO CLOSED-END FUNDS |
|
|
|
|
discontinues its use of leverage (“deleveraging”), which it may be required to do at inopportune times, it may be required to sell portfolio securities at inopportune times to repay leverage obligations, which could result in realized losses and a decrease in the Fund’s net asset value. Deleveraging involves complex operational processes, including the coordination of asset sales, repayment of debt, and potential restructuring of the Fund’s capital and may involve significant costs, including transaction costs associated with the sale of portfolio securities, prepayment penalties on borrowed funds, and, if applicable, fees related to the redemption of preferred shares. Leveraging transactions pursued by the Fund may increase its duration and sensitivity to interest rate movements. The Fund may continue to use leverage even if available financing rates are higher than anticipated returns, including, for example, in cases where deleveraging, including any expenses related thereto, might be viewed as detrimental to the Fund’s portfolio. In addition, fees and expenses of any form of leverage used by the Fund will be borne entirely by the Common Shareholders (and not by preferred shareholders, if any) and will reduce the investment return of the Common Shares. Therefore, there can be no assurance that the Fund’s use of leverage will result in a higher yield on the Common Shares, and it may result in losses. In addition, any preferred shares issued by the Fund are expected to pay cumulative dividends, which may tend to increase leverage risk. Leverage creates several major types of risks for Common Shareholders, including:
|
|
the likelihood of greater volatility of NAV and market price of Common Shares, and of the investment return to Common Shareholders, than a comparable portfolio without leverage; |
|
|
the possibility either that Common Share dividends will fall if the interest and other costs of leverage rise, or that dividends paid on Common Shares will fluctuate because such costs vary over time; and |
|
|
the effects of leverage in a declining market or a rising interest rate environment, as leverage is likely to cause a greater decline in the NAV of the Common Shares than if the Fund were not leveraged. |
In addition, the counterparties to the Fund’s leveraging transactions and any preferred shareholders of the Fund will have priority of payment over the Fund’s Common Shareholders.
Reverse repurchase agreements involve the risks that the interest income earned on the investment of the proceeds will be less than the interest expense and Fund expenses associated with the repurchase agreement, that the market value of the securities sold by the Fund may decline below the price at which the Fund is obligated to repurchase such securities and that the securities may not be returned to the Fund. There is no assurance that reverse repurchase agreements
can be successfully employed. Dollar roll/buy back transactions involve the risk that the market value of the securities the Fund is required to purchase may decline below the agreed upon repurchase price of those securities. Successful use of dollar rolls/buy backs may depend upon the Investment Manager’s ability to correctly predict interest rates and prepayments. There is no assurance that dollar rolls/buy backs can be successfully employed. In connection with reverse repurchase agreements and dollar rolls/buy backs, the Fund will also be subject to counterparty risk with respect to the purchaser of the securities. If the broker/dealer to whom the Fund sells securities becomes insolvent, the Fund’s right to purchase or repurchase securities may be restricted.
The Fund may engage in total return swaps, reverse repurchases, loans of portfolio securities, short sales and when-issued, delayed delivery and forward commitment transactions, credit default swaps, basis swaps and other swap agreements, purchases or sales of futures and forward contracts (including foreign currency exchange contracts), call and put options or other derivatives. The Fund’s use of such transactions gives rise to associated leverage risks described above, and may adversely affect the Fund’s income, distributions and total returns to Common Shareholders. To the extent that any offsetting positions do not behave in relation to one another as expected, the Fund may perform as if it is leveraged through use of these derivative strategies.
Any total return swaps, reverse repurchases, loans of portfolio securities, short sales and when-issued, delayed delivery and forward commitment transactions, credit default swaps, basis swaps and other swap agreements, purchases or sales of futures and forward contracts (including foreign currency exchange contracts), call and put options or other derivatives by the Fund or counterparties to the Fund’s other leveraging transactions, if any, would have seniority over the Fund’s Common Shares.
Because the fees received by the Investment Manager may increase depending on the types of leverage utilized by the Fund, the Investment Manager has a financial incentive for the Fund to use certain forms of leverage, which may create a conflict of interest between the Investment Manager, on the one hand, and the Common Shareholders, on the other hand.
Limited Term Risk
With respect to each of PDX, PDO and PAXS, unless the limited term provision of the Fund’s Restated Agreement and Declaration of Trust (the “Declaration”) is amended by shareholders in accordance with the Declaration, or unless the Fund completes a tender offer, as of a date within twelve months preceding the fund’s dissolution date, to all Common Shareholders to purchase 100% of the then outstanding
|
|
|
|
|
|
|
|
|
|
|
|
| |
| |
|
|
ANNUAL REPORT |
|
|
| |
|
|
JUNE 30, 2025 |
|
|
237 |
|
|
|
|
| |
Principal Risks of the Funds |
|
|
|
|
Common Shares of the Fund at a price equal to the net asset value per Common Share on the expiration date of the tender offer (an “Eligible Tender Offer”) and converts to perpetual existence, the Fund will terminate on or about January 29, 2031 with respect to PIMCO Dynamic Income Strategy Fund, January 27, 2033, with respect to PIMCO Dynamic Income Opportunities Fund, and January 27, 2034, with respect to PIMCO Access Income Fund (the “Dissolution Date”). The Fund is not a
so-called
“target date” or “life cycle” fund whose asset allocation becomes more conservative over time as its target date, often associated with retirement, approaches. In addition, the Fund is not a “target term” fund whose investment objective is to return its original NAV on the Dissolution Date or in an Eligible Tender Offer. The Fund’s investment objectives and policies are not designed to seek to return to investors that purchase shares in this offering their initial investment on the Dissolution Date or in an Eligible Tender Offer, and such investors and investors that purchase shares after the completion of this offering may receive more or less than their original investment upon dissolution or in an Eligible Tender Offer.
Because the assets of the Fund will be liquidated in connection with the dissolution, the Fund will incur transaction costs in connection with dispositions of portfolio securities. The Fund does not limit its investments to securities having a maturity date prior to the Dissolution Date and may be required to sell portfolio securities when it otherwise would not, including at times when market conditions are not favorable, which may cause the Fund to lose money. In particular, the Fund’s portfolio may still have large exposures to illiquid securities as the Dissolution Date approaches, and losses due to portfolio liquidation may be significant. Beginning one year before the Dissolution Date (the “Wind-Down Period”), the Fund may begin liquidating all or a portion of the Fund’s portfolio, and the Fund may deviate from its investment strategy and may not achieve its investment objectives. As a result, during the Wind-Down Period, the Fund’s distributions may decrease, and such distributions may include a return of capital. It is expected that Common Shareholders will receive cash in any liquidating distribution from the Fund, regardless of their participation in the Fund’s automatic dividend reinvestment plan. However, if on the Dissolution Date the Fund owns securities for which no market exists or securities that are trading at depressed prices, such securities may be placed in a liquidating trust. Any such liquidating trust or other similar vehicle is not expected to be a registered investment company. The Fund cannot predict the amount, if any, of securities that will be required to be placed in a liquidating trust. The Fund’s investment objectives and policies are not designed to seek to return investors’ original investment upon termination of the Fund, and investors may receive more or less than their original investment upon termination of the Fund. As the assets of the Fund will be liquidated in connection with its termination, the Fund may be
required to sell portfolio securities when it otherwise would not, including at times when market conditions are not favorable, which may cause the Fund to lose money. The Fund may receive proceeds from the disposition of portfolio investments that are less than the valuations of such investments by the Fund and, in particular, losses from the disposition of illiquid securities may be significant. The disposition of portfolio investments by the Fund could also cause market prices of such instruments, and hence the NAV and market price of the Common Shares, to decline. In addition, disposition of portfolio investments will cause the Fund to incur increased brokerage and related transaction expenses.
Moreover, in conducting such portfolio transactions, the Fund may need to deviate from its investment policies and may not achieve its investment objectives. The Fund’s portfolio composition may change as its portfolio holdings mature or are called or sold in anticipation of an Eligible Tender Offer or the Dissolution Date. During such period(s), it is possible that the Fund will hold a greater percentage of its total assets in shorter term and lower yielding securities and cash and cash equivalents than it would otherwise, which may impede the Fund’s ability to achieve its investment objectives and adversely impact the Fund’s performance and distributions to Common Shareholders, which may in turn adversely impact the market value of the Common Shares.
In addition, the Fund may be required to reduce its leverage, which could also adversely impact its performance. The additional cash or cash equivalents held by the Fund could be obtained through reducing the Fund’s distributions to Common Shareholders and/or holding cash in lieu of reinvesting, which could limit the ability of the Fund to participate in new investment opportunities. The Fund does not limit its investments to securities having a maturity date prior to or around the Dissolution Date, which may exacerbate the foregoing risks and considerations. A Common Shareholder may be subject to the foregoing risks over an extended period of time, particularly if the Fund conducts an Eligible Tender Offer and is also subsequently terminated by or around the Dissolution Date.
If the Fund conducts an Eligible Tender Offer, the Fund anticipates that funds to pay the aggregate purchase price of shares accepted for purchase pursuant to the tender offer will be first derived from any cash on hand and then from the proceeds from the sale of portfolio investments held by the Fund. In addition, the Fund may be required to dispose of portfolio investments in connection with any reduction in the Fund’s outstanding leverage necessary in order to maintain the Fund’s desired leverage ratios following a tender offer. The risks related to the disposition of securities in connection with the Fund’s dissolution also would be present in connection with the disposition of securities in connection with an Eligible Tender Offer. It is likely that during the pendency of a tender offer, and possibly for a time
|
|
|
|
|
|
| |
238 |
|
PIMCO CLOSED-END FUNDS |
|
|
|
|
thereafter, the Fund will hold a greater than normal percentage of its total assets in cash and cash equivalents, which may impede the Fund’s ability to achieve its investment objectives and decrease returns to shareholders. The tax effect of any such dispositions of portfolio investments will depend on the difference between the price at which the investments are sold and the tax basis of the Fund in the investments. Any capital gains recognized on such dispositions, as reduced by any capital losses the Fund realizes in the year of such dispositions and by any available capital loss carryforwards, will be distributed to shareholders as capital gain dividends (to the extent of net long-term capital gains over net short-term capital losses) or ordinary dividends (to the extent of net short-term capital gains over net long-term capital losses) during or with respect to such year, and such distributions will generally be taxable to Common Shareholders. If the Fund’s tax basis for the investments sold is less than the sale proceeds, the Fund will recognize capital gains, which the Fund will be required to distribute to Common Shareholders. In addition, the Fund’s purchase of tendered Common Shares pursuant to a tender offer would have tax consequences for tendering Common Shareholders and may have tax consequences for
non-tendering
Common Shareholders.
The purchase of Common Shares by the Fund pursuant to a tender offer will have the effect of increasing the proportionate interest in the Fund of
non-tendering
Common Shareholders. All Common Shareholders remaining after a tender offer may be subject to proportionately higher expenses due to the reduction in the Fund’s total assets resulting from payment for the tendered Common Shares. Such reduction in the Fund’s total assets may result in less investment flexibility, reduced diversification and greater volatility for the Fund, and may have an adverse effect on the Fund’s investment performance. Such reduction in the Fund’s total assets may also cause Common Shares to become thinly traded or otherwise negatively impact secondary trading of Common Shares. A reduction in net assets, and the corresponding increase in the Fund’s expense ratio, could result in lower returns and put the Fund at a disadvantage relative to its peers and potentially cause the Fund’s Common Shares to trade at a wider discount to NAV than it otherwise would. Furthermore, the portfolio of the Fund following an Eligible Tender Offer could be significantly different and, therefore, Common Shareholders retaining an investment in the Fund could be subject to greater risk. For example, the Fund may be required to sell its more liquid, higher quality portfolio investments to purchase Common Shares that are tendered in an Eligible Tender Offer, which would leave a less liquid, lower quality portfolio for remaining shareholders. The prospects of an Eligible Tender Offer may attract arbitrageurs who would purchase the Common Shares prior to the tender offer for the sole purpose of tendering those shares which could have the effect of
exacerbating the risks described herein for shareholders retaining an investment in the Fund following an Eligible Tender Offer.
The Fund is not required to conduct an Eligible Tender Offer. If the Fund conducts an Eligible Tender Offer, there can be no assurance that the number of tendered Common Shares would not result in the Fund having aggregate net assets below the Dissolution Threshold, in which case the Eligible Tender Offer would be canceled, no Common Shares would be repurchased pursuant to the Eligible Tender Offer and the Fund will dissolve on the Dissolution Date (subject to possible extensions). Following the completion of an Eligible Tender Offer in which the number of tendered Common Shares would result in the Fund having aggregate net assets greater than or equal to the Dissolution Threshold, the Board may, by a Board Action Vote, eliminate the Dissolution Date without shareholder approval. Thereafter, the Fund will have a perpetual existence. The Investment Manager may have a conflict of interest in recommending to the Board that the Dissolution Date be eliminated and the Fund have a perpetual existence. The Fund is not required to conduct additional tender offers following an Eligible Tender Offer and conversion to perpetual existence. Therefore, remaining Common Shareholders may not have another opportunity to participate in a tender offer. Shares of
closed-end
management investment companies frequently trade at a discount from their NAV, and as a result remaining Common Shareholders may only be able to sell their Shares at a discount to NAV.
Liquidity Risk
Liquidity risk exists when particular investments are difficult to purchase or sell. Illiquid investments are investments that the Fund reasonably expects cannot be sold or disposed of in current market conditions in seven calendar days or less without the sale or disposition significantly changing the market value of the investment. Illiquid investments may become harder to value, especially in changing markets. The Fund’s investments in illiquid investments may reduce the returns of the Fund because it may be unable to sell the illiquid investments at an advantageous time or price or possibly require the Fund to dispose of other investments at unfavorable times or prices in order to satisfy its obligations, which could prevent the Fund from taking advantage of other investment opportunities. Illiquidity can be caused by, among other things, a drop in overall market trading volume, an inability to find a willing buyer, or legal restrictions on the securities’ resale. Additionally, the market for certain investments may become illiquid under adverse market or economic conditions independent of any specific adverse changes in the conditions of a particular issuer, such as during political events (including periods of rapid interest rate changes). There can be no assurance that an investment that is deemed to be liquid when purchased will continue to be liquid while it is held by the Fund and/or
|
|
|
|
|
|
|
|
|
|
|
|
| |
| |
|
|
ANNUAL REPORT |
|
|
| |
|
|
JUNE 30, 2025 |
|
|
239 |
|
|
|
|
| |
Principal Risks of the Funds |
|
|
|
|
when the Fund wishes to dispose of it. Bond markets have consistently grown over the past three decades while the capacity for traditional dealer counterparties to engage in fixed income trading has not kept pace and in some cases has decreased. As a result, dealer inventories of corporate bonds, which provide a core indication of the ability of financial intermediaries to “make markets,” are at or near historic lows in relation to market size. Because market makers seek to provide stability to a market through their intermediary services, the significant reduction in dealer inventories could potentially lead to decreased liquidity and increased volatility in the fixed income markets. Such issues may be exacerbated during periods of economic uncertainty.
In such cases, the Fund, due to regulatory limitations on investments in illiquid investments and the difficulty in purchasing and selling such securities or instruments, may be unable to achieve its desired level of exposure to a certain sector. To the extent that the Fund’s principal investment strategies involve securities of companies with smaller market capitalizations, foreign
(non-U.S.)
securities, Rule 144A securities, illiquid sectors of fixed income securities, derivatives or securities with substantial market and/or credit risk, the Fund will tend to have the greatest exposure to liquidity risk.
Further, fixed income securities with longer durations until maturity face heightened levels of liquidity risk as compared to fixed income securities with shorter durations until maturity. The risks associated with illiquid instruments may be particularly acute in situations in which the Fund’s operations require cash (such as in connection with repurchase offers) and could result in the Fund borrowing to meet its short-term needs or incurring losses on the sale of illiquid instruments. It may also be the case that other market participants may be attempting to liquidate fixed income holdings at the same time as the Fund, causing increased supply in the market and contributing to liquidity risk and downward pricing pressure.
To the extent the Fund invests in Alt Lending ABS, the Alt Lending ABS in which the Fund invests are typically not listed on any securities exchange and not registered under the Securities Act. In addition, the Fund anticipates that these instruments may only be sold to a limited number of investors and may have a limited or
non-existent
secondary market. Accordingly, the Fund currently expects that certain of its investments in Alt Lending ABS will face heightened levels of liquidity risk. Although currently, there is generally no reliable, active secondary market for certain Alt Lending ABS, a secondary market for these alternative lending-related instruments may develop.
Liquidity risk also refers to the risk that the Fund may be required to hold additional cash or sell other investments in order to obtain cash to close out derivatives or meet the liquidity demands that derivatives
can create to make payments of margin, collateral, or settlement payments to counterparties. The Fund may have to sell a security at a disadvantageous time or price to meet such obligations.
The current direction of governments and regulators may have the effect of reducing market liquidity, market resiliency and money supply, such as through higher rates, tighter financial regulations and proposals related to
open-end
fund liquidity that may prevent mutual funds and exchange-traded funds from participating in certain markets.
Loan Origination Risk
PDX, PDI, PAXS and PDO may seek to originate loans, including, without limitation, residential and/or commercial real estate or mortgage-related loans, consumer loans or other types of loans, which may be in the form of whole loans, assignments, participations, secured and unsecured notes, senior and second lien loans, mezzanine loans, bridge loans or similar investments. Each Fund may originate loans to corporations and/or other legal entities and individuals, including foreign
(non-U.S.)
and emerging market entities and individuals. Loans may carry significant credit risks (for example, a borrower may not have a credit rating or score or may have a rating or score that indicates significant credit risk). This may include loans to public or private firms or individuals, such as in connection with housing development projects. The loans the Fund invests in or originates may vary in maturity and/or duration. The Fund is not limited in the amount, size or type of loans it may invest in and/or originate, including with respect to a single borrower or with respect to borrowers that are determined to be below investment grade, other than pursuant to any applicable law. The Fund’s investment in or origination of loans may also be limited by the requirements the Fund intends to observe under Subchapter M of the Code in order to qualify as a RIC. The Fund may subsequently offer such investments for sale to third parties; provided, that there is no assurance that the Fund will complete the sale of such an investment. If the Fund is unable to sell, assign or successfully close transactions for the loans that it originates, the Fund will be forced to hold its interest in such loans for an indeterminate period of time. This could result in the Fund’s investments having high exposure to certain borrowers. The Fund will be responsible for the expenses associated with originating a loan (whether or not consummated). This may include significant legal and due diligence expenses, which will be indirectly borne by the Fund and Common Shareholders.
Bridge loans are generally made with the expectation that the borrower will be able to obtain permanent financing in the near future. Any delay in obtaining permanent financing subjects the bridge loan investor to increased risk. A borrower’s use of bridge loans also
|
|
|
|
|
|
| |
240 |
|
PIMCO CLOSED-END FUNDS |
|
|
|
|
involves the risk that the borrower may be unable to locate permanent financing to replace the bridge loan, which may impair the borrower’s perceived creditworthiness.
Loan origination and servicing companies are routinely involved in legal proceedings concerning matters that arise in the ordinary course of their business. In addition, a number of participants in the loan origination and servicing industry (including control persons of industry participants) have been the subject of regulatory actions by state regulators, including state attorneys general, and by the federal government. Governmental investigations, examinations or regulatory actions, or private lawsuits, including purported class action lawsuits, may adversely affect such companies’ financial results. To the extent the Fund engages in origination and/or servicing directly, or has a financial interest in, or is otherwise affiliated with, an origination or servicing company, the Fund will be subject to enhanced risks of litigation, regulatory actions and other proceedings. As a result, the Fund may be required to pay legal fees, settlement costs, damages, penalties or other charges, any or all of which could materially adversely affect the Fund and its holdings.
Loans and Other Indebtedness; Loan Acquisitions, Participations and Assignments Risk
Loan interests may take the form of (i) direct interests acquired during a primary distribution or other purchase of a loan, (ii) loans originated by the fund or (iii) assignments of, novations of or participations in all or a portion of a loan acquired in secondary markets. In addition to credit risk and interest rate risk, the Fund’s exposure to loan interests may be subject to additional risks. For example, purchasers of loans and other forms of direct indebtedness depend primarily upon the creditworthiness of the borrower for payment of principal and interest. Loans are subject to the risk that scheduled interest or principal payments will not be made in a timely manner or at all, either of which may adversely affect the value of the loan. If the Fund does not receive scheduled interest or principal payments on such indebtedness, the Fund’s share price and yield could be adversely affected. Loans that are fully secured may offer the Fund more protection than an unsecured loan in the event of
non-payment
of scheduled interest or principal if the Fund is able to access and monetize the collateral. However, the collateral underlying a loan, if any, may be unavailable or insufficient to satisfy a borrower’s obligation. If the Fund becomes owner, whole or in part, of any collateral after a loan is foreclosed, the Fund may incur costs associated with owning and/or monetizing its ownership of the collateral.
During periods of deteriorating economic conditions, such as recessions or periods of rising unemployment, or changing interest rates (notably increases), delinquencies and losses generally increase, sometimes dramatically, with respect to obligations under such loans.
An economic downturn or individual corporate developments could adversely affect the market for these instruments and reduce a Fund’s ability to sell these instruments at an advantageous time or price. An economic downturn could also generally lead to a higher nonpayment rate and, a loan may lose significant market value before a default occurs.
Investments in loans through a purchase of a loan, loan origination or a direct assignment of a financial institution’s interests with respect to a loan may involve additional risks to a Fund. For example, if a loan is foreclosed, the Fund could become owner, in whole or in part, of any collateral, which could include, among other assets, real estate or other real or personal property, and would bear the costs and liabilities associated with owning and holding or disposing of the collateral.
Moreover, the purchaser of an assignment typically succeeds to all the rights and obligations under the loan agreement with the same rights and obligations as the assigning lender. Assignments may, however, be arranged through private negotiations between potential assignees and potential assignors, and the rights and obligations acquired by the purchaser of an assignment may differ from, and be more limited than, those held by the assigning lender. The Fund may also invest in loans that are not secured by collateral which typically present greater risks than collateralized loans.
A Fund may obtain exposure to loans made to private investment vehicles, including private funds that are not registered under the 1940 Act. Such loans may be for various purposes, including but not limited to, subscription line or
“sub-line”
credit facilities secured by the uncalled capital commitments of such private investment vehicles’ investors. Although such capital commitments are typically subject to legally binding agreements, there can be no assurance that the investors will meet their funding obligations when called. As a result, a Fund may be subject to the risk of delay or default in repayment of the loan, which could negatively impact the Fund’s performance. Additionally, a Fund may face liquidity risks if the private investment vehicle is unable to draw on capital commitments in a timely manner .
In connection with purchasing loan participations, the Fund generally will have no right to enforce compliance by the borrower with the terms of the loan agreement relating to the loan, nor any rights of
set-off
against the borrower, and the Fund may not directly benefit from any collateral supporting the loan in which it has purchased the loan participation. As a result, the Fund will be subject to the credit risk of both the borrower and the lender that is selling the participation. In the event of the insolvency of the lender selling a participation, the Fund may be treated as a general creditor of the lender and may not benefit from any
set-off
between the lender and
|
|
|
|
|
|
|
|
|
|
|
|
| |
| |
|
|
ANNUAL REPORT |
|
|
| |
|
|
JUNE 30, 2025 |
|
|
241 |
|
|
|
|
| |
Principal Risks of the Funds |
|
|
|
|
the borrower. Certain loan participations may be structured in a manner designed to prevent purchasers of participations from being subject to the credit risk of the lender, but even under such a structure, in the event of the lender’s insolvency, the lender’s servicing of the participation may be delayed and the assignability of the participation impaired.
The Fund may have difficulty disposing of loans and loan participations. Because there may not be a liquid market for many such investments, the Fund anticipates that such investments could be sold only to a limited number of institutional investors. The lack of a liquid secondary market may have an adverse impact on the value of such investments and the Fund’s ability to dispose of particular loans and loan participations when that would be desirable, including in response to a specific economic event such as a deterioration in the creditworthiness of the borrower. The lack of a liquid secondary market for loans and loan participations also may make it more difficult for the Fund to assign a value to these securities for purposes of valuing the Fund’s portfolio.
Investments in loans may include participations in bridge loans, which are loans taken out by borrowers for a short period (typically less than one year) pending arrangement of more permanent financing through, for example, the issuance of bonds, frequently high yield bonds issued for the purpose of acquisitions.
Investments in loans may include acquisitions of, or participation in, delayed draw and delayed funding loans and revolving credit facilities. These commitments may have the effect of requiring the Fund to increase its investment in a borrower at a time when it might not otherwise decide to do so (including at a time when the company’s financial condition makes it unlikely that such amounts will be repaid). Delayed draw and delayed funding loans and revolving credit facilities may be subject to restrictions on transfer, and only limited opportunities may exist to resell such instruments. As a result, the Fund may be unable to sell such investments at an opportune time or may have to resell them at less than fair market value. Further, the Fund may need to hold liquid assets in order to provide funding for these types of commitments, meaning the Fund may not be able to invest in other attractive investments, or the Fund may need to liquidate existing assets in order to provide such funding.
Each Fund may invest in loans used to finance the cost of construction, acquisition, development, and/ or rehabilitation of a property including, but not limited to, development of single-family
for-sale
homes, multi-family rentals and/or commercial facilities. Such construction lending may expose the Fund to increased risk of
non-payment
and loss because the loan is not backed by a finished project. Such risk may depend on the nature of the construction and
the relevant counterparty or counterparties, which may include, but not be limited to, homebuilders, private developers and/or entities with limited capital. Repayment of these types of loans may depend on the borrower’s ability to secure permanent
“take-out”
financing, which requires the successful completion of the project, or operation of the property with an income stream sufficient to meet operating and loan expenses. In addition, these types of loans are subject to the risk of errors in estimations of the property’s value at completion of construction and the estimated cost of construction, as well as the risk that the projects may not be completed and have limited liquidity.
The Fund may invest in debtor-in-possession financings (commonly known as “DIP financings”). DIP financings are arranged when an entity seeks the protections of the bankruptcy court under Chapter 11 of the U.S. Bankruptcy Code. These financings allow the entity to continue its business operations while reorganizing under Chapter 11. Such financings constitute senior liens on unencumbered security (i.e., security not subject to other creditors’ claims). There is a risk that the entity will not emerge from Chapter 11 and be forced to liquidate its assets under Chapter 7 of the U.S. Bankruptcy Code. In the event of liquidation, the Fund’s only recourse will be against the property securing the DIP financing.
To the extent the Fund invests in loans or originates loans, including, but not limited to, bank loans,
non-syndicated
loans, the residual or equity tranches of mortgage-related and other asset-backed securities, which may be referred to as subordinate mortgage-backed or asset-backed securities and interest-only mortgage-backed or asset-backed securities, and other investments, the Fund may be subject to greater levels of credit risk, call risk, settlement risk, risk of subordination to other creditors, insufficient or lack of protection under federal securities laws and liquidity risk. These instruments are considered predominantly speculative with respect to an issuer’s continuing ability to make principal and interest payments and may be more volatile than other types of securities. The Fund may also be subject to greater levels of liquidity risk than funds that do not invest in loans. In addition, the loans in which the Fund invests may not be listed on any exchange and a secondary market for such loans may be comparatively illiquid relative to markets for other more liquid fixed income securities. Consequently, transactions in loans may involve greater costs than transactions in more actively traded securities. In connection with certain loan transactions, transaction costs that are borne by the Fund may include the expenses of third parties that are retained to assist with reviewing and conducting diligence, negotiating, structuring and servicing a loan transaction, and/or providing other services in connection therewith. Furthermore, the Fund may incur such costs in connection with loan transactions that are pursued by the Fund but not ultimately consummated
(so-called
“broken deal costs”).
|
|
|
|
|
|
| |
242 |
|
PIMCO CLOSED-END FUNDS |
|
|
|
|
Restrictions on transfers in loan agreements, a lack of publicly available information, irregular trading activity and wide bid/ask spreads, among other factors, may, in certain circumstances, make loans more difficult to sell at an advantageous time or price than other types of securities or instruments. These factors may result in the Fund being unable to realize full value for the loans and/or may result in the Fund not receiving the proceeds from a sale of a loan for an extended period after such sale, each of which could result in losses to the Fund. Some loans may have extended trade settlement periods, including settlement periods of greater than seven days, which may result in cash not being immediately available to the Fund. If an issuer of a loan prepays or redeems the loan prior to maturity, the Fund may have to reinvest the proceeds in other loans or similar instruments that may pay lower interest rates. Because of such risks involved in investing in loans, an investment in the Fund should be considered speculative.
The Fund’s investments in subordinated and unsecured loans generally are subject to similar risks as those associated with investments in secured loans. Subordinated or unsecured loans are lower in priority of payment to secured loans and are subject to the additional risk that the cash flow of the borrower and property securing the loan or debt, if any, may be insufficient to meet scheduled payments after giving effect to the senior secured obligations of the borrower. This risk is generally higher for subordinated unsecured loans or debt, which are not backed by a security interest in any specific collateral. Subordinated and unsecured loans generally have greater price volatility than secured loans and may be less liquid. There is also a possibility that originators will not be able to sell participations in subordinated or unsecured loans, which would create greater credit risk exposure for the holders of such loans. Subordinate and unsecured loans share the same risks as other below investment grade securities.
There may be less readily available information about most loans and the underlying borrowers than is the case for many other types of securities. Loans may be issued by borrowers that are not subject to SEC reporting requirements and therefore may not be required to file reports with the SEC or may file reports that are not required to comply with SEC form requirements. In addition, such borrowers may be subject to a less stringent liability disclosure regime than companies subject to SEC reporting requirements. Loans may not be considered “securities,” and purchasers, such as the Fund, therefore may not be entitled to rely on the anti-fraud protections of the federal securities laws. Because there is limited public information available regarding loan investments, the Fund is particularly dependent on the analytical abilities of the Fund’s portfolio managers.
Economic exposure to loan interests through the use of derivative transactions may involve greater risks than if the Fund had invested in the loan interest directly during a primary distribution, through direct
originations or through assignments of, novations of or participations in a loan acquired in secondary markets since, in addition to the risks described above, certain derivative transactions may be subject to leverage risk and greater illiquidity risk, counterparty risk, valuation risk and other risks.
The risks described in the principal risk titled “Loans and Other Indebtedness; Loan Participations and Assignments Risk” also apply to loans originated by PIMCO Dynamic Income Fund, PIMCO Access Income Fund and PIMCO Dynamic Income Opportunities Fund.
Management Risk
The Fund is subject to management risk because it is an actively managed investment portfolio. PIMCO and each individual portfolio manager will apply investment techniques and risk analysis and will, in some cases, rely partially or entirely upon or be informed by one or more quantitative models in making investment decisions for the Fund, or may determine that certain factors are more significant than others. There can be no guarantee that these decisions will produce the desired results or that the due diligence conducted by PIMCO, or such other investment adviser or
sub-adviser,
as applicable, and individual portfolio managers will expose all material risks associated with an investment. Additionally, PIMCO, or such other investment adviser or
sub-adviser,
as applicable, and individual portfolio managers may not be able to identify suitable investment opportunities and may face competition from other investment managers when identifying and consummating certain investments. Certain securities or other instruments in which the Fund seeks to invest may not be available in the quantities desired, including in circumstances where other funds for which PIMCO acts as investment adviser, including funds with names, investment objectives and policies, and/or portfolio management teams, similar to the Fund, are seeking to invest in the same or similar securities or instruments. In addition, regulatory restrictions, actual or perceived conflicts of interest or other considerations may cause PIMCO to restrict or prohibit participation in certain investments. In such circumstances, PIMCO or the individual portfolio managers may determine to purchase other securities or instruments as substitutes. Such substitute securities or instruments may not perform as intended, which could result in losses to the Fund. To the extent the Fund employs strategies targeting perceived pricing inefficiencies, arbitrage strategies or similar strategies, it is subject to the risk that the pricing or valuation of the securities and instruments involved in such strategies may change unexpectedly, which may result in reduced returns or losses to the Fund. The Fund is also subject to the risk that deficiencies in the internal systems or controls of PIMCO or another service provider will cause losses for the Fund or hinder Fund operations. For example, trading delays or errors (both human and systemic) could prevent the Fund from purchasing a security expected to appreciate in value.
|
|
|
|
|
|
|
|
|
|
|
|
| |
| |
|
|
ANNUAL REPORT |
|
|
| |
|
|
JUNE 30, 2025 |
|
|
243 |
|
|
|
|
| |
Principal Risks of the Funds |
|
|
|
|
Additionally, legislative, regulatory, or tax restrictions, policies or developments may affect the investment techniques available to PIMCO and each individual portfolio manager in connection with managing the Fund and may also adversely affect the ability of the Fund to achieve its investment objectives. There also can be no assurance that all of the personnel of PIMCO will continue to be associated with PIMCO for any length of time. The loss of services of one or more key employees of PIMCO could have an adverse impact on the Fund’s ability to realize its investment objectives.
In addition, the Fund may rely on various third-party sources to calculate its NAV. As a result, the Fund is subject to certain operational risks associated with reliance on service providers and service providers’ data sources. In particular, errors or systems failures and other technological issues may adversely impact the Fund’s calculations of its NAV, and such NAV calculation issues may result in inaccurately calculated NAVs, delays in NAV calculation and/or the inability to calculate NAVs over extended periods. The Fund may be unable to recover any losses associated with such failures.
Market Discount Risk
The price of the Fund’s Common Shares will fluctuate with market conditions and other factors. If you sell your Common Shares, the price received may be more or less than your original investment. The Common Shares are designed for long-term investors and should not be treated as trading vehicles. Shares of
closed-end
management investment companies frequently trade at a discount from their NAV. The Common Shares may trade at a price that is less than the offering price for Common Shares issued pursuant to an offering. This risk may be greater for investors who sell their Common Shares relatively shortly after completion of an offering. The sale of Common Shares by a Fund (or the perception that such sales may occur), particularly if sold at a discount to the then current market price of the Common Shares, may have an adverse effect on the market price of the Common Shares.
Market Disruptions Risk
The Fund is subject to investment and operational risks associated with financial, economic and other global market developments and disruptions, including those arising from war, military conflicts, terrorism, social unrest, recessions, supply chain disruptions, market manipulation, government interventions, defaults and shutdowns, political changes or diplomatic developments, public health emergencies (such as the spread of infectious diseases, pandemics and epidemics), bank failures and natural/environmental disasters, which can all negatively impact the securities markets, interest rates, auctions, secondary trading, ratings, credit risk, inflation, deflation and other factors relating to the Fund’s investments or the Investment Manager’s operations and the value of an investment in the Fund, its
distributions and its returns. These events can also impair the technology and other operational systems upon which the Fund’s service providers, including PIMCO as the Fund’s investment adviser, rely, and could otherwise disrupt the Fund’s service providers’ ability to fulfill their obligations to the Fund. Furthermore, events involving limited liquidity, defaults,
non-performance
or other adverse developments that affect financial institutions or the financial services industry generally, or concerns or rumors about any events of these kinds or other similar risks, have in the past and may in the future lead to market-wide liquidity problems.
Market Risk
The market price of securities owned by the Fund may fluctuate, sometimes rapidly or unpredictably. Securities may decline in value due to factors affecting securities markets generally or particular industries or companies represented in the securities markets. The value of a security may decline due to general market conditions that are not specifically related to a particular company, such as real or perceived adverse economic conditions, changes in the general outlook for corporate earnings, changes in inflation, interest or currency rates, financial system instability, adverse changes to credit markets or adverse investor sentiment generally. The value of a security may also decline due to factors that affect a particular industry or industries, such as labor shortages or increased production costs and competitive conditions within an industry. During a general downturn in the securities markets, multiple asset classes may decline in value simultaneously even if the performance of those asset classes is not otherwise historically correlated. Investments may also be negatively impacted by market disruptions and by attempts by other market participants to manipulate the prices of particular instruments. Equity securities generally have greater price volatility than fixed income securities. Credit ratings downgrades may also negatively affect securities held by the Fund. Even when markets perform well, there is no assurance that the investments held by the Fund will increase in value along with the broader market.
In addition, market risk includes the risk that geopolitical and other events will disrupt the economy on a national or global level. For instance, actual or threatened war or military conflict, terrorism, social unrest, recessions, supply chain disruptions, market manipulation, government defaults, government shutdowns, political and regulatory changes, diplomatic developments or the imposition of sanctions and other similar measures, including the imposition of tariffs, or other U.S. economic policies and any related public health emergencies (such as the spread of infectious diseases, pandemics and epidemics) and natural/environmental disasters can all negatively impact the securities markets, which could cause the Fund to lose value. These events could reduce consumer demand or economic output, result in
|
|
|
|
|
|
| |
244 |
|
PIMCO CLOSED-END FUNDS |
|
|
|
|
market closures, changes in interest rates, inflation/deflation, travel restrictions or quarantines, and significantly adversely impact the economy.
As computing technology and data analytics continually advance, there has been an increasing trend towards machine driven and artificially intelligent trading systems, particularly providing such systems with increasing levels of autonomy in trading decisions. Regulators of financial markets have become increasingly focused on the potential impact of artificial intelligence on investment activities and may issue regulations that are intended to affect the use of artificial technology in trading activities. Any such regulations may not have the intended effect on financial markets. Moreover, advancements in artificial intelligence and other technologies may suffer from the introduction of errors, defects or security vulnerabilities which can go undetected. The potential speed of such trading and technologies may exacerbate the impact of any such flaws, particularly where such flaws are exploited by other artificially intelligent systems and may act to impair or prevent the intervention of a human control.
The domestic political environment, as well as political and diplomatic events within the United States and abroad, such as the U.S. government’s inability at times to agree on a long-term budget and deficit reduction plan, has resulted, and may in the future result, in a government shutdown or otherwise adversely affect the U.S. regulatory landscape, the general market environment and/or investor sentiment, which could have an adverse impact on the Fund’s investments and operations. Additional and/or prolonged U.S. federal government shut-downs may affect investor and consumer confidence and may adversely impact financial markets and the broader economy, perhaps suddenly and to a significant degree. Governmental and quasi-governmental authorities and regulators throughout the world have previously responded to serious economic disruptions with a variety of significant fiscal and monetary policy changes, including but not limited to, direct capital infusions into companies, new monetary programs and dramatically lower interest rates. An unexpected or sudden reversal of these policies, or the ineffectiveness of these policies, could increase volatility in securities markets, which could adversely affect the Fund’s investments. Any market disruptions could also prevent the Fund from executing advantageous investment decisions in a timely manner. To the extent that a Fund has focused its investments in a region enduring geopolitical market disruption will face higher risks of loss, although the increasing interconnectivity between global economies and financial markets can lead to events or conditions in one country, region or financial market adversely impacting a different country, region or financial market. Thus, investors should closely monitor current market conditions to determine whether the Fund meets their individual financial needs and tolerance for risk.
During inflationary price movements, fixed income securities markets may experience heightened levels of interest rate, volatility and liquidity risk. Interest rate increases in the future could cause the value of the Fund, that invests in fixed income securities to decrease.
Interest rate increases and other market events have the potential to adversely impact real estate values and real estate-related assets, which could, by extension, adversely impact the value of other investments as well (such as loans, securitized debt and other fixed income securities). Such an impact could materialize in one real estate sector and not another, or in a different manner in different real estate sectors. Examples of the current risks faced by real estate-related assets include: tenant vacancy rates, increased tenant turnover and tenant concentration; general real estate headwinds, including delinquencies and difficulties in collecting rents and other payments (which increases the risk of owners being unable to pay or otherwise defaulting on their own borrowings and obligations); decreases in property values; increases in inflation, upkeep costs and other expenses; fluctuations in rents; and increased concentration in ownership of certain types of properties.
Exchanges and securities markets may close early, close late or issue trading halts on specific securities, which may result in, among other things, the Fund being unable to buy or sell certain securities or financial instruments at an advantageous time or accurately price its portfolio
investments
.
Mortgage-Related and Other Asset-Backed Instruments Risk
The mortgage-related assets in which the Fund may invest include, but are not limited to, any security, instrument or other asset that is related to U.S. or
non-U.S.
mortgages, including those issued by private originators or issuers, or issued or guaranteed as to principal or interest by the U.S. government or its agencies or instrumentalities or by
non-U.S.
governments or authorities, such as, without limitation, assets representing interests in, collateralized or backed by, or whose values are determined in whole or in part by reference to any number of mortgages or pools of mortgages or the payment experience of such mortgages or pools of mortgages, including REMICs, which could include
Re-REMICs,
mortgage pass-through securities, inverse floaters, CMOs, CLOs, multiclass pass-through securities, private mortgage pass-through securities, stripped mortgage securities (generally interest-only and principal-only securities), mortgage-related asset backed securities and mortgage-related loans (including through participations, assignments, originations and whole loans), including commercial and residential mortgage loans. Exposures to mortgage-related assets through derivatives or other financial instruments will be considered investments in mortgage-related assets.
The Fund may also invest in other types of ABS, including CDOs, CBOs and CLOs and other similarly structured securities.
|
|
|
|
|
|
|
|
|
|
|
|
| |
| |
|
|
ANNUAL REPORT |
|
|
| |
|
|
JUNE 30, 2025 |
|
|
245 |
|
|
|
|
| |
Principal Risks of the Funds |
|
|
|
|
Mortgage-related and other asset-backed instruments represent interests in “pools” of mortgages or other assets such as consumer loans or receivables held in trust and often involve risks that are different from or possibly more acute than risks associated with other types of debt instruments. Generally, rising interest rates tend to extend the duration of fixed rate mortgage-related assets, making them more sensitive to changes in interest rates. Compared to other fixed income investments with similar maturity and credit, mortgage-related securities may increase in value to a lesser extent when interest rates decline and may decline in value to a similar or greater extent when interest rates rise. As a result, in a period of rising interest rates, the Fund may exhibit additional volatility since individual mortgage holders are less likely to exercise prepayment options, thereby putting additional downward pressure on the value of these securities and potentially causing the Fund to experience losses. This is known as extension risk. Mortgage-backed securities can be highly sensitive to rising interest rates, such that even small movements can cause the Fund to lose value. Mortgage-backed securities, and in particular those not backed by a government guarantee, are subject to credit risk. When interest rates decline, borrowers may pay off their mortgages sooner than expected. This can reduce the returns of the Fund because the Fund may have to reinvest that money at the lower prevailing interest rates.
In addition, the creditworthiness, servicing practices, and financial viability of the servicers of the underlying mortgage pools present significant risks. For instance, a servicer may be required to make advances in respect of delinquent loans underlying the mortgage-related securities; however, servicers experiencing financial difficulties may not be able to perform these obligations. Additionally, both mortgage-related securities and asset-backed securities are subject to risks associated with fraud or negligence by, or defalcation of, their servicers. These securities are also subject to the risks of the underlying loans. In some circumstances, a servicer’s or originator’s mishandling of documentation related to the underlying collateral (e.g., failure to properly document a security interest in the underlying collateral) may affect the rights of security holders in and to the underlying collateral. In addition, the underlying loans may have been extended pursuant to inappropriate underwriting guidelines, to no underwriting guidelines at all, or to fraudulent origination practices. The owner of a mortgage-backed security’s ability to recover against the sponsor, servicer or originator is uncertain and is often limited.
The Fund’s investments in other asset-backed instruments are subject to risks similar to those associated with mortgage-related assets, as well as additional risks associated with the nature of the assets and the servicing of those assets. Payment of principal and interest on asset-backed instruments may be largely dependent upon the cash flows
generated by the assets backing the instruments, and asset-backed instruments may not have the benefit of any security interest in the related assets. The Fund may invest in any tranche of mortgage-related and other asset-backed securities, including junior and/or equity tranches (to the extent consistent with investment guidelines), which generally carry higher levels of the foregoing risks. Direct investments in mortgages and other types of collateral are subject to risks similar (and in some cases to a greater degree) to those described above.
Subordinate mortgage-backed or asset-backed instruments are paid interest only to the extent that there are funds available to make payments. To the extent the collateral pool includes a large percentage of delinquent loans, there is a risk that interest payments on subordinate mortgage-backed or asset-backed instruments will not be fully paid.
There are multiple tranches of mortgage-backed and asset-backed instruments, offering investors various maturity and credit risk characteristics. For example, tranches may be categorized as senior, mezzanine, and subordinated/equity or “first loss.” The most senior tranche of a mortgage-backed or asset-backed instrument generally has the greatest collateralization and generally pays the lowest interest rate. If there are defaults or the collateral otherwise underperforms, scheduled payments to senior tranches generally take precedence over those of mezzanine tranches, and scheduled payments to mezzanine tranches take precedence over those to subordinated/equity tranches. Lower tranches represent lower degrees of credit quality and pay higher interest rates intended to compensate for the attendant risks. The return on the lower tranches is especially sensitive to the rate of defaults in the collateral pool. The lowest tranche (i.e., the “equity” or “residual” tranche) generally specifically receives the residual interest payments (i.e., money that is left over after the higher tranches have been paid and expenses of the issuing entities have been paid) rather than a fixed interest rate. The Fund may also invest in the residual or equity tranches of mortgage-related and other asset-backed instruments, which may be referred to as subordinate mortgage-backed or asset-backed instruments and interest-only mortgage-backed or asset-backed instruments. The Fund expects that investments in subordinate mortgage-backed and other asset-backed instruments will be subject to risks arising from delinquencies and foreclosures, thereby exposing its investment portfolio to potential losses. Subordinate securities of mortgage-backed and other asset-backed instruments are also subject to greater credit risk than those mortgage-backed or other asset-backed instruments that are more highly rated.
The mortgage markets in the United States and in various foreign countries have experienced extreme difficulties in the past that adversely affected the performance and market value of certain of
|
|
|
|
|
|
| |
246 |
|
PIMCO CLOSED-END FUNDS |
|
|
|
|
the Fund’s mortgage-related investments. Delinquencies and losses on residential and commercial mortgage loans (especially subprime and second-lien mortgage loans) may increase, and a decline in or flattening of housing and other real property values may exacerbate such delinquencies and losses. In addition, reduced investor demand for mortgage loans and mortgage-related securities and increased investor yield requirements have caused limited liquidity in the secondary market for mortgage-related securities, which can adversely affect the market value of mortgage-related securities. It is possible that such limited liquidity in such secondary markets could continue or worsen.
With respect to risk retention tranches (i.e., eligible residual interests initially held by the sponsors of CMBS and other eligible securitizations pursuant to the U.S. Risk Retention Rules), a third-party purchaser, such as the Fund, must hold its retained interest, unhedged, for at least five year following the closing of the CMBS transaction, after which it is entitled to transfer its interest in the securitization to another person that meets the requirements for a third-party purchaser. Even after the required holding period has expired, due to the generally illiquid nature of such investments, no assurance can be given as to what, if any, exit strategies will ultimately be available for any given position.
In addition, there is limited guidance on the application of the Final U.S. Risk Retention Rules to specific securitization structures. There can be no assurance that the applicable federal agencies charged with the implementation of the Final U.S. Risk Retention Rules (the FDIC, the Comptroller of the Currency, the Federal Reserve Board, the SEC, the Department of Housing and Urban Development, and the Federal Housing Finance Agency) could not take positions in the future that differ from the interpretation of such rules taken or embodied in such securitizations, or that the Final U.S. Risk Retention Rules will not change.
Furthermore, in situations where the Fund invests in risk retention tranches of securitizations structured by third parties, the Fund may be required to execute one or more letters or other agreements, the exact form and nature of which will vary (each, a “Risk Retention Agreement”) under which it will make certain undertakings designed to ensure such securitization complies with the U.S. Risk Retention Rules. Such Risk Retention Agreements may include a variety of representations, warranties, covenants and other indemnities, each of which may run to various transaction parties. If the Fund breaches any undertakings in any Risk Retention Agreement, it will be exposed to claims by the other parties thereto, including for any losses incurred as a result of such breach, which could be significant and exceed the value of the Fund’s investments.
Mortgage-Related Derivative Instruments Risk
The Fund may engage in derivative transactions related to mortgage-backed securities, including purchasing and selling exchange-listed and OTC put and call options, futures and forwards on mortgages and mortgage-backed securities. The Fund may also invest in mortgage-backed securities credit default swaps, which include swaps the reference obligation for which is a mortgage-backed security or related index, such as the CMBX Index (a tradeable index referencing a basket of commercial mortgage-backed securities), the TRX Index (a tradeable index referencing total return swaps based on commercial mortgage-backed securities) or the ABX (a tradeable index referencing a basket of
sub-prime
mortgage-backed securities). The Fund may invest in newly developed mortgage related derivatives that may hereafter become available.
Derivative mortgage-backed securities (such as principal-only (“POs”), interest-only (“IOs”) or inverse floating rate securities) are particularly exposed to call and extension risks. Small changes in mortgage prepayments can significantly impact the cash flows and the market value of these derivative instruments. In general, the risk of faster than anticipated prepayments adversely affects IOs, super floaters and premium priced mortgage-backed securities. The risk of slower than anticipated prepayments generally affects POs, floating-rate securities subject to interest rate caps, support tranches and discount priced mortgage-backed securities. In addition, particular derivative instruments may be leveraged such that their exposure (i.e., price sensitivity) to interest rate and/or prepayment risk is magnified.
Mortgage-related derivative instruments involve risks associated with mortgage-related and other asset-backed instruments, privately-issued mortgage-related securities, the mortgage market, the real estate industry, derivatives and credit default swaps.
Municipal Bond Risk
Investing in municipal bonds involves the risks of investing in debt securities generally and certain other risks. The amount of public information available about municipal bonds is generally less than that for corporate equities or bonds, and the investment performance of the Fund’s investment in municipal bonds may therefore be more dependent on the analytical abilities of PIMCO. The secondary market for municipal bonds, particularly below investment grade bonds in which the Fund may invest, also tends to be less well developed or liquid which may adversely affect the Fund’s ability to sell municipal bonds at attractive prices.
The ability of municipal issuers to make timely payments of interest and principal may be diminished during general economic downturns, by litigation, legislation or political events, or by the bankruptcy of the issuer. Laws, referenda, ordinances or regulations enacted in the
|
|
|
|
|
|
|
|
|
|
|
|
| |
| |
|
|
ANNUAL REPORT |
|
|
| |
|
|
JUNE 30, 2025 |
|
|
247 |
|
|
|
|
| |
Principal Risks of the Funds |
|
|
|
|
future by Congress or state legislatures or the applicable governmental entity could extend the time for payment of principal and/or interest, or impose other constraints on enforcement of such obligations, or on the ability of municipal issuers to levy taxes. Issuers of municipal securities also might seek protection under the bankruptcy laws. In the event of bankruptcy of such an issuer, the Fund could experience delays in collecting principal and interest and the Fund may not, in all circumstances, be able to collect all principal and interest to which it is entitled. To enforce its rights in the event of a default in the payment of interest or repayment of principal, or both, the Fund may take possession of and manage the assets securing the issuer’s obligations on such securities, which may increase the Fund’s operating expenses. Adverse economic, business, legal or political developments might affect all or a substantial portion of the Fund’s municipal bonds in the same manner. The Fund will be particularly subject to these risks to the extent that it focuses its investments in municipal bonds in a particular state or geographic region.
The Fund may invest in trust certificates issued in tender option bond programs. In these programs, a trust typically issues two classes of certificates and uses the proceeds to purchase municipal securities having relatively long maturities and bearing interest at a fixed interest rate substantially higher than prevailing short-term
tax-exempt
rates. There is a risk that the Fund will not be considered the owner of a tender option bond for federal income tax purposes, and thus will not be entitled to treat such interest as exempt from federal income tax. Certain tender option bonds may be illiquid or may become illiquid as a result of, among other things, a credit rating downgrade, a payment default or a disqualification from
tax-exempt
status. The Fund’s investment in the securities issued by a tender option bond trust may involve greater risk and volatility than an investment in a fixed rate bond, and the value of such securities may decrease significantly when market interest rates increase. Tender option bond trusts could be terminated due to market, credit or other events beyond the Fund’s control, which could require the Fund to dispose of portfolio investments at inopportune times and prices. The Fund may use a tender option bond program as a way of achieving leverage in its portfolio, in which case the Fund will be subject to leverage risk.
The Fund may invest in revenue bonds, which are typically issued to fund a wide variety of capital projects including electric, gas, water and sewer systems; highways, bridges and tunnels; port and airport facilities; colleges and universities; and hospitals. Because the principal security for a revenue bond is generally the net revenues derived from a particular facility or group of facilities or, in some cases, from the proceeds of a special excise or other specific revenue source, there is no guarantee that the particular project will generate enough revenue to pay its obligations, in which case the Fund’s performance may be adversely affected.
The Fund may invest in
pre-refunded
municipal bonds.
Pre-refunded
Municipal Bonds are
tax-exempt
bonds that have been refunded to a call date prior to the final maturity of principal, or, in the case of
pre-refunded
Municipal Bonds commonly referred to as
bonds,” to the final maturity of principal, and remain outstanding in the municipal market. The payment of principal and interest of the
pre-refunded
Municipal Bonds held by the Fund is funded from securities in a designated escrow account that holds U.S. Treasury securities or other obligations of the U.S. Government (including its agencies and instrumentalities (“Agency Securities”)). As the payment of principal and interest is generated from securities held in an escrow account established by the municipality and an independent escrow agent, the pledge of the municipality has been fulfilled and the original pledge of revenue by the municipality is no longer in place.
Pre-refunded
and/or escrowed to maturity Municipal Bonds may bear an investment grade rating (for example, if
re-rated
by a rating service or, if not
re-rated,
determined by PIMCO to be of comparable quality) because they are backed by U.S. Treasury securities, Agency Securities or other investment grade securities. For the avoidance of any doubt, PIMCO’s determination of an issue’s credit rating will generally be used for compliance with the Fund’s investment parameters when an issue either loses its rating or is not
re-rated
upon
pre-refunding.
The escrow account securities pledged to pay the principal and interest of the
pre-refunded
municipal bond do not guarantee the price movement of the bond before maturity. Issuers of municipal bonds refund in advance of maturity the outstanding higher cost debt and issue new, lower cost debt, placing the proceeds of the lower cost issuance into an escrow account to
pre-refund
the older, higher cost debt. Investment in
pre-refunded
municipal bonds held by the Fund may subject the Fund to interest rate risk and market risk. In addition, while a secondary market exists for
pre-refunded
municipal bonds, if the Fund sells
pre-refunded
municipal bonds prior to maturity, the price received may be more or less than the original cost, depending on market conditions at the time of sale.
The treatment of municipalities in bankruptcy is more uncertain, and potentially more adverse to debt holders, than for corporate issues.
In addition to general municipal market risks, different municipal sectors may face different risks. For instance, general obligation bonds are secured by the full faith, credit, and taxing power of the municipality issuing the obligation. As such, timely payment depends on the municipality’s ability to raise tax revenue and maintain a fiscally sound budget. The timely payments may also be influenced by any unfunded pension liabilities or other post-employee benefit plan (OPEB) liabilities. Budgetary constraints of local, state, and federal governments upon which the issuers
may
be relying for funding may also impact municipal bonds.
|
|
|
|
|
|
| |
248 |
|
PIMCO CLOSED-END FUNDS |
|
|
|
|
Revenue bonds are secured by special tax revenues or other revenue sources. If the specified revenues do not materialize, then the bonds may not be repaid.
Private activity bonds are yet another type of municipal security. Municipalities use private activity bonds to finance the development of industrial facilities for use by private enterprise. Principal and interest payments are to be made by the private enterprise benefitting from the development, which means that the holder of the bond is exposed to the risk that the private issuer may default on the bond.
Moral obligation bonds are usually issued by special purpose public entities. If the public entity defaults, repayment becomes a “moral obligation” instead of a legal one. The lack of a legally enforceable right to payment in the event of default poses a special risk for a holder of the bond because it has little or no ability to seek recourse in the event of default.
In addition, a significant restructuring of federal income tax rates, such as the changes to federal income tax rates that occurred in 2017, or even serious discussion on the topic in Congress could cause municipal bond prices to fall. The demand for municipal securities is strongly influenced by the value of
tax-exempt
income to investors relative to taxable income. Lower income tax rates potentially reduce the advantage of owning municipal securities. Similarly, changes to state or federal regulation tied to a specific sector, such as the hospital sector, could have an impact on the revenue stream for a given subset of the market.
Municipal notes are similar to general municipal debt obligations, but they generally possess shorter terms. Municipal notes can be used to provide interim financing and may not be repaid if anticipated revenues are not realized.
PDX is
“non-diversified,”
which means that the Fund may invest a significant portion of its assets in the securities of a smaller number of issuers than a diversified fund. Focusing investments in a small number of issuers increases risk. A fund that invests in a relatively smaller number of issuers is more susceptible to risks associated with a single economic, political or regulatory occurrence than a diversified fund might be. Some of those issuers also may present substantial credit or other risks. Similarly, the Fund may be subject to increased economic, business or political risk to the extent that it invests a substantial portion of its assets in a particular currency, in a group of related industries, in a particular issuer, in the bonds of similar projects or in a narrowly defined geographic area outside the U.S. Notwithstanding the Fund’s status as a
“non-diversified”
investment company under the 1940 Act, the Fund intends to qualify as a regulated investment
company accorded special tax treatment under the Code, which imposes its own diversification requirements.
Operational Risk
An investment in the Fund, like any fund, can involve operational risks arising from factors such as processing errors, human errors, inadequate or failed internal or external processes, failures in systems and technology, changes in personnel and errors caused by third-party service providers. The occurrence of any of these failures, errors or breaches could result in a loss of information, regulatory scrutiny, reputational damage or other events, any of which could have a material adverse effect on the Fund. While the Fund seeks to minimize such events through controls and oversight, there may still be failures that could cause losses to the Fund.
Other Investment Companies Risk
When investing in an investment company, the Fund will generally bear its ratable share of that investment company’s expenses and would remain subject to payment of the Fund’s investment management fees and other expenses with respect to assets so invested. Common Shareholders would therefore be subject to duplicative expenses to the extent the Fund invests in other investment companies. In addition, other investment companies may utilize leverage, in which case an investment would subject a Fund to additional risks associated with leverage. Due to its own financial interest or other business considerations, the Investment Manager may choose to invest a portion of a Fund’s assets in investment companies sponsored or managed by the Investment Manager or its related parties in lieu of investments by a Fund directly in portfolio securities, or may choose to invest in such investment companies over investment companies sponsored or managed by others. Participation in a cash sweep program where the Fund’s uninvested cash balance is used to purchase shares of affiliated or unaffiliated money market funds or cash management pooled investment vehicles at the end of each day subjects the Fund to the risks associated with the underlying money market funds or cash management pooled investment vehicles, including liquidity risk. As a shareholder of a money market fund or cash management pooled investment vehicle, the Fund would indirectly bear the fees and expenses of the underlying fund or account which are in addition to the fees the Fund pays its service providers. Applicable law may limit a Fund’s ability to invest in other investment companies.
Other Pooled Investment Vehicles Risk
Subject to applicable limits under the 1940 Act, each of PAXS, PDO, and PDI may invest in other pooled investment vehicles, including investment companies, private funds or other pooled investment vehicles that would qualify as “investment companies” under the 1940 Act but for an applicable exemption or exclusion, including but
|
|
|
|
|
|
|
|
|
|
|
|
| |
| |
|
|
ANNUAL REPORT |
|
|
| |
|
|
JUNE 30, 2025 |
|
|
249 |
|
|
|
|
| |
Principal Risks of the Funds |
|
|
|
|
not limited to Sections 3(c)(1) or 3(c)(7) of the 1940 Act (“Private Funds”).When investing in an investment company, a Fund will generally bear its ratable share of that investment company’s expenses and would remain subject to payment of the Fund’s investment management fees and other expenses with respect to assets so invested. Common Shareholders would therefore be subject to duplicative expenses to the extent the Fund invests in other investment companies. In addition, other investment companies may utilize leverage, in which case an investment would subject the Fund to additional risks associated with leverage. Due to its own financial interest or other business considerations, PIMCO may choose to invest a portion of a Fund’s assets in investment companies sponsored or managed by PIMCO or its related parties in lieu of investments by the Fund directly in portfolio securities, or may choose to invest in such investment companies over investment companies sponsored or managed by others. Participation in a cash sweep program where a Fund’s uninvested cash balance is used to purchase shares of affiliated or unaffiliated money market funds or cash management pooled investment vehicles at the end of each day subjects the Fund to the risks associated with the underlying money market funds or cash management pooled investment vehicles, including liquidity risk. Applicable law may limit a Fund’s ability to invest in other investment companies.
To the extent a Fund invests through one or more Private Funds, the Fund would be exposed to the risks associated with such Private Fund’s investments. The Fund’s investments in Private Funds would not be subject to the protections afforded to shareholders under the 1940 Act. These protections include, among others, certain corporate governance standards, such as the requirement of having a certain percentage of the directors serving on a board as independent directors, statutory protections against self-dealing by Private Fund managers, and leverage limitations. By investing in Private Funds indirectly through the Fund, a shareholder would bear two layers of asset-based fees and expenses — at the Fund level and the Private Fund level — in addition to indirectly bearing any performance fees charged by the Private Fund.
Platform Risk
The Alt Lending ABS in which the Fund may invest are typically not listed on any securities exchange and not registered under the Securities Act. In addition, the Fund anticipates that these instruments may only be sold to a limited number of investors and may have a limited or
non-existent
secondary market. Accordingly, the Fund currently expects that certain of the investments it may make in Alt Lending ABS will face heightened levels of liquidity risk. Although currently there is generally no reliable, active secondary market for certain Alt Lending ABS, a secondary market for these Alt Lending ABS may develop. If the Fund purchases Alt Lending ABS on an alternative
lending platform, the Fund will have the right to receive principal and interest payments due on loans underlying the Alt Lending ABS only if the platform servicing the loans receives the borrower’s payments on such loans and passes such payments through to the Fund. If a borrower is unable or fails to make payments on a loan for any reason, the Fund may be greatly limited in its ability to recover any outstanding principal or interest due, as (among other reasons) the Fund may not have direct recourse against the borrower or may otherwise be limited in its ability to directly enforce its rights under the loan, whether through the borrower or the platform through which such loan was originated, the loan may be unsecured or under-collateralized and/or it may be impracticable to commence a legal proceeding against the defaulting borrower.
The Fund may have limited knowledge about the underlying loans and is dependent upon the platform for information regarding underlying loans. Although PIMCO may conduct diligence on the platforms, the Fund generally does not have the ability to independently verify the information provided by the platforms, other than payment information regarding loans underlying the Alt Lending ABS owned by the Fund, which the Fund observes directly as payments are received. With respect to Alt Lending ABS that the Fund purchases in the secondary market (i.e., not directly from an alternative lending platform), the Fund may not perform the same level of diligence on such platform or at all. The Fund may not review the particular characteristics of the loans collateralizing an Alt Lending ABS, but rather negotiate in advance with platforms the general criteria of the underlying loans. As a result, the Fund is dependent on the platforms’ ability to collect, verify and provide information to the Fund about each loan and borrower.
The Fund relies on the borrower’s credit information, which is provided by the platforms. However, such information may be out of date, incomplete or inaccurate and may, therefore, not accurately reflect the borrower’s actual creditworthiness. Platforms may not have an obligation to update borrower information, and, therefore, the Fund may not be aware of any impairment in a borrower’s creditworthiness subsequent to the making of a particular loan. The platforms’ credit decisions and scoring models may be based on algorithms that could potentially contain programming or other errors or prove to be ineffective or otherwise flawed. This could adversely affect loan pricing data and approval processes and could cause loans to be mispriced or misclassified, which could ultimately have a negative impact on the Fund’s performance.
In addition, the underlying loans, in some cases, may be affected by the success of the platforms through which they are facilitated. Therefore, disruptions in the businesses of such platforms may also negatively impact the value of the Fund’s investments. In addition,
|
|
|
|
|
|
| |
250 |
|
PIMCO CLOSED-END FUNDS |
|
|
|
|
disruption in the business of a platform could limit or eliminate the ability of the Fund to invest in loans originated by that platform, and therefore the Fund could lose some or all of the benefit of its diligence effort with respect to that platform.
Platforms are
for-profit
businesses that, as a general matter, generate revenue by collecting fees on funded loans from borrowers and by assessing a loan servicing fee on investors, which may be a fixed annual amount or a percentage of the loan or amounts collected. This business could be disrupted in multiple ways; for example, a platform could file for bankruptcy or a platform might suffer reputational harm from negative publicity about the platform or alternative lending more generally and the loss of investor confidence in the event that a loan facilitated through the platform is not repaid and the investor loses money on its investment. Many platforms and/or their affiliates have incurred operating losses since their inception and may continue to incur net losses in the future, particularly as their businesses grow and they incur additional operating expenses. Platforms may also be forced to defend legal action taken by regulators or governmental bodies. Alternative lending is a newer industry operating in an evolving legal environment. Platforms may be subject to risk of litigation alleging violations of law and/or regulations, including, for example, consumer protection laws, whether in the U.S. or in foreign jurisdictions. Platforms may be unsuccessful in defending against such lawsuits or other actions and, in addition to the costs incurred in fighting any such actions, platforms may be required to pay money in connection with the judgments, settlements or fines or may be forced to modify the terms of its borrower loans, which could cause the platform to realize a loss or receive a lower return on a loan than originally anticipated. Platforms may also be parties to litigation or other legal action in an attempt to protect or enforce their rights or those of affiliates, including intellectual property rights, and may incur similar costs in connection with any such efforts.
The Fund’s investments in Alt Lending ABS may expose the Fund to the credit risk of the issuer. Generally, such instruments are unsecured obligations of the issuer; an issuer that becomes subject to bankruptcy proceedings may be unable to make full and timely payments on its obligations to the Fund, even if the payments on the underlying loan or loans continue to be made timely and in full. In addition, when the Fund owns Alt Lending ABS, the Fund and its custodian generally do not have a contractual relationship with, or personally identifiable information regarding, individual borrowers, so the Fund will not be able to enforce underlying loans directly against borrowers and may not be able to appoint an alternative servicing agent in the event that a platform or third-party servicer, as applicable, ceases to service the underlying loans. Therefore, the Fund is more dependent on the platform for servicing than if the Fund had owned whole loans
through the platform. Where such interests are secured, the Fund relies on the platform to perfect the Fund’s security interest. In addition, there may be a delay between the time the Fund commits to purchase an instrument issued by a platform, its affiliate or a special purpose entity sponsored by the platform or its affiliate and the issuance of such instrument and, during such delay, the funds committed to such an investment will not earn interest on the investment nor will they be available for investment in other alternative lending-related instruments, which will reduce the effective rate of return on the investment. The Fund’s investments in Alt Lending ABS may be illiquid.
Portfolio Turnover Risk
The Investment Manager manages the Fund without regard generally to restrictions on portfolio turnover. The use of futures contracts and other derivative instruments with relatively short maturities may tend to exaggerate the portfolio turnover rate for the Fund. Trading in fixed income securities does not generally involve the payment of brokerage commissions but does involve indirect transaction costs. The use of futures contracts and other derivative instruments may involve the payment of commissions to futures commission merchants or other intermediaries. Higher portfolio turnover involves correspondingly greater expenses to the Fund, including brokerage commissions or dealer
mark-ups
and other transaction costs on the sale of securities and reinvestments in other securities. The higher the rate of portfolio turnover of the Fund, the higher these transaction costs borne by the Fund generally will be. Such sales may result in realization of taxable capital gains (including short-term capital gains, which are generally taxed to shareholders at ordinary income tax rates when distributed net of short-term capital losses and net long-term capital losses), and may adversely impact the Fund’s
after-tax
returns. The realization of short-term capital gains may also cause adverse tax consequences for the Fund’s shareholders.
Potential Conflicts of Interest Risk — Allocation of Investment Opportunities
The Investment Manager and its affiliates are involved worldwide with a broad spectrum of financial services and asset management activities and may engage in the ordinary course of business in activities in which its interests or the interests of its clients may conflict with those of the Fund. The Investment Manager may provide investment management services to other funds and discretionary managed accounts that follow an investment program similar to that of the Fund. Subject to the requirements of the 1940 Act, the Investment Manager intends to engage in such activities and may receive compensation from third parties for its services. The results of the Fund’s investment activities may differ from those of the Fund’s affiliates, or another account managed by the Investment Manager or its affiliates, and it is possible that the Fund could sustain losses
|
|
|
|
|
|
|
|
|
|
|
|
| |
| |
|
|
ANNUAL REPORT |
|
|
| |
|
|
JUNE 30, 2025 |
|
|
251 |
|
|
|
|
| |
Principal Risks of the Funds |
|
|
|
|
during periods in which one or more of the Fund’s affiliates and/or other accounts managed by the Investment Manager or its affiliates, including proprietary accounts, achieve profits on their trading.
Preferred Securities Risk
In addition to equity securities risk, credit risk and possibly high yield risk, investment in preferred securities involves certain other risks. Certain preferred securities contain provisions that allow an issuer under certain conditions to skip or defer distributions. If the Fund owns a preferred security that is deferring its distribution, the Fund may be required to include the amount of the deferred distribution in its taxable income for tax purposes although it does not currently receive such amount in cash. In order to receive the special treatment accorded to regulated investment companies and their shareholders under the Internal Revenue Code of 1986, as amended (the “Code”) and to avoid U.S. federal income and/or excise taxes at the Fund level, the Fund may be required to distribute this income to shareholders in the tax year in which the income is recognized (without a corresponding receipt of cash). Therefore, the Fund may be required to pay out as an income distribution in any such tax year an amount greater than the total amount of cash income the Fund actually received and to sell portfolio securities, including at potentially disadvantageous times or prices, to obtain cash needed for these income distributions. Preferred securities often are subject to legal provisions that allow for redemption in the event of certain tax or legal changes or at the issuer’s call. In the event of redemption, the Fund may not be able to reinvest the proceeds at comparable rates of return. Preferred securities are subordinated to bonds and other debt securities in an issuer’s capital structure in terms of priority for corporate income and liquidation payments, and therefore will be subject to greater credit risk than those debt securities. Preferred securities may trade less frequently and in a more limited volume and may be subject to more abrupt or erratic price movements than many other securities.
Prepayment Risk
During periods of declining interest rates or for other purposes, issuers may exercise their option to prepay principal earlier than scheduled, forcing the Fund to reinvest in lower yielding instruments. For premium bonds purchased by the Fund, prepayment risk may be increased.
Privacy and Data Security Risk
The Gramm-Leach-Bliley Act (“GLBA”) and other laws limit the disclosure of certain
non-public
personal information about a consumer to
non-
affiliated third parties and require financial institutions to disclose certain privacy policies and practices with respect to information sharing with both affiliates and
non-
affiliated third parties. Many states and a number of
non-U.S.
jurisdictions have enacted privacy and data security laws requiring safeguards on the privacy and security of consumers’ personally identifiable information.
Other laws deal with obligations to safeguard and dispose of private information in a manner designed to avoid its dissemination. Privacy rules adopted by the U.S. Federal Trade Commission and SEC implement the GLBA and other requirements and govern the disclosure of consumer financial information by certain financial institutions, ranging from banks to private investment funds. U.S. platforms following certain models generally are required to have privacy policies that conform to these GLBA and other requirements. In addition, such platforms typically have policies and procedures intended to maintain platform participants’ personal information securely and dispose of it properly.
The Fund generally does not intend to obtain or hold borrowers’
non-public
personal information, and the Fund has implemented procedures reasonably designed to prevent the disclosure of borrowers’
non-public
personal information to the Fund. However, service providers to the Fund or its direct or indirect fully-owned subsidiaries, including their custodians and the platforms acting as loan servicers for the Fund or its direct or indirect fully-owned subsidiaries, may obtain, hold or process such information. The Fund cannot guarantee the security of
non-public
personal information in the possession of such a service provider and cannot guarantee that service providers have been and will continue to comply with the GLBA, other data security and privacy laws and any other related regulatory requirements. Violations of the GLBA and other laws could subject the Fund to litigation and/or fines, penalties or other regulatory action, which, individually or in the aggregate, could have an adverse effect on the Fund. The Fund may also face regulations related to privacy and data security in the other jurisdictions in which the Fund invests.
Private Funds Risk — Tax Risk
Special tax risks are associated with an investment in each of PAXS, PDO, and PDI to the extent they invest in Private Funds. Each of PAXS, PDO, and PDI intends to qualify and elect to be treated as a RIC under Subchapter M of the Code. As such, each Fund must satisfy, among other requirements, diversification and 90% gross income requirements, and a requirement that it distribute at least 90% of its ordinary income and net short-term gains in the form of deductible dividends.
Each of the aforementioned ongoing requirements for qualification for the favorable tax treatment available to RICs requires that each Fund obtain information from or about the Private Funds in which the Fund is invested. However, Private Funds generally are not obligated to disclose the contents of their portfolios. This lack of transparency may make it difficult for PIMCO to monitor the sources of each Fund’s income and the diversification of its assets, and otherwise to comply with Subchapter M of the Code. Ultimately this may limit the universe
|
|
|
|
|
|
| |
252 |
|
PIMCO CLOSED-END FUNDS |
|
|
|
|
of Private Funds in which each Fund can invest and may adversely bear on the Fund’s ability to qualify as a RIC under Subchapter M of the Code. Each Fund expects to receive information from each Private Fund regarding its investment performance on a regular basis.
Private Funds and other entities classified as partnerships for U.S. federal income tax purposes may generate income allocable to each Fund that is not qualifying income for purposes of the 90% gross income test. In order to meet the 90% gross income test, each Fund may structure its investments in a manner that potentially increases the taxes imposed thereon or in respect thereof. Because each Fund may not have timely or complete information concerning the amount or sources of such a Private Fund’s income until such income has been earned by the Private Fund or until a substantial amount of time thereafter, it may be difficult for each Fund to satisfy the 90% gross income test.
In the event that each Fund believes that it is possible that it will fail the asset diversification requirement at the end of any quarter of a taxable year, it may seek to take certain actions to avert such failure, including by acquiring additional investments to come into compliance with the asset diversification tests or by disposing of
non-diversified
assets. Although the Code affords the Fund the opportunity, in certain circumstances, to cure a failure to meet the asset diversification test, including by disposing of
non-diversified
assets within six months, there may be constraints on a Fund’s ability to dispose of its interest in a Private Fund that limit utilization of this cure period.
Each Fund must distribute at least 90% of its investment company taxable income, in a manner qualifying for the dividends-paid deduction, to qualify as a RIC, and must distribute substantially all of its income in order to avoid a fund-level tax. In addition, if a Fund were to fail to distribute in a calendar year a sufficient amount of its income for such year, it would be subject to an excise tax. The determination of the amount of distributions sufficient to qualify as a RIC and avoid a fund-level income or excise tax will depend on income and gain information that must be obtained from the underlying Private Funds. Each Fund’s investment in Private Funds may make it difficult to estimate the Fund’s income and gains in a timely fashion, which may increase the likelihood that the Fund will be liable for the excise tax with respect to certain undistributed amounts.
Private Placements and Restricted Securities Risk
A private placement involves the sale of securities that have not been registered under the 1933 Act, or relevant provisions of applicable
non-U.S.
law, to certain institutional and qualified individual purchasers, such as the Fund. In addition to the general risks to which all securities are subject, securities received in a private placement generally are subject to strict restrictions on resale, and there may be
no liquid secondary market or ready purchaser for such securities. Therefore, the Fund may be unable to dispose of such securities when it desires to do so, or at the most favorable time or price. Private placements may also raise valuation risks.
Restricted securities are often purchased at a discount from the market price of unrestricted securities of the same issuer reflecting the fact that such securities may not be readily marketable without some time delay. Such securities are often more difficult to value and the sale of such securities often requires more time and results in higher brokerage charges or dealer discounts and other selling expenses than does the sale of securities trading on national securities exchanges or in the
markets. Until the Fund can sell such securities into the public markets, its holdings may be less liquid and any sales will need to be made pursuant to an exemption under the Securities Act.
Private Real Estate Investments Risk
PDI may invest in private real estate investments directly or indirectly, including through one or more REIT Subsidiaries. Exposure to private commercial real estate comes with a variety of risks. Lease defaults, terminations by one or more tenants or landlord-tenant disputes may reduce the REIT Subsidiary’s revenues and net income, which would reduce the amount of income payable by the REIT Subsidiary to the Fund. Any of these situations may result in extended periods during which there is a significant decline in revenues or no revenues generated by a property. If this occurred, it could adversely affect the Fund’s performance.
A private real estate investment’s financial position and its ability to make distributions may also be adversely affected by financial difficulties experienced by any major tenants, including bankruptcy, insolvency or a general downturn in the business, or in the event any major tenants do not renew or extend their relationship as their lease terms expire. A tenant in bankruptcy may be able to restrict the ability to collect unpaid rents or interest during the bankruptcy proceeding. Furthermore, dealing with a tenant’s bankruptcy or other default may divert management’s attention and cause the investment and/or Fund to incur substantial legal and other costs.
The Fund’s investments in real estate will be pressured in challenging economic and rental market conditions. If a private real estate investment is unable to
re-let
or renew leases for all or substantially all of the space at these properties, if the rental rates upon such renewal or
re-letting
are significantly lower than expected, or if the private real estate investment’s reserves for these purposes prove inadequate, the private real estate investment will experience a reduction in net income and may be required to reduce or eliminate cash distributions, which would reduce the amount of income payable by the private real
|
|
|
|
|
|
|
|
|
|
|
|
| |
| |
|
|
ANNUAL REPORT |
|
|
| |
|
|
JUNE 30, 2025 |
|
|
253 |
|
|
|
|
| |
Principal Risks of the Funds |
|
|
|
|
estate investment to the Fund and, as a result, negatively impact the Fund’s performance.
The Fund may seek to gain exposure to transactions involving the acquisition or financing of undeveloped land for residential or commercial land banking purposes. The ability to acquire land parcels for new projects may be adversely affected by changes in the general availability of land parcels, the willingness of land sellers to sell land parcels at reasonable prices, competition for available land parcels, availability of financing to acquire land parcels, zoning and other market conditions.
In addition to risks associated with real estate development generally, due to the long-term investment holding period often associated with land banking investments, entitlement and other regulatory risks may be heightened. Further, until the disposition or development of such undeveloped land, no income would be realized from such land banking investment. Undeveloped land is also a highly illiquid investment that may not be able to be disposed of when desired due to various changes in market conditions.
Privately Issued Mortgage-Related Securities Risk
There are no direct or indirect government or agency guarantees of payments in pools created by
non-governmental
issuers. Privately-issued mortgage-related securities are also not subject to the same underwriting requirements for the underlying mortgages that are applicable to those mortgage-related securities that have a government or government-sponsored entity guarantee.
Privately-issued mortgage-related securities are not traded on an exchange and there may be a limited market for the securities, especially when there is a perceived weakness in the mortgage and real estate market sectors. Without an active trading market, mortgage-related securities held in the Fund’s portfolio may be particularly difficult to value because of the complexities involved in assessing the value of the underlying mortgage loans. Additionally, privately-issued mortgage-related securities, such as privately-held or
non-traded
REITs, may bear higher fees than publicly-traded REITs. Privately-held REITs generally are exempt from registration under the Securities Act and, as such, are not subject to the same disclosure requirements as REITs registered under the Securities Act, which may make privately-held REITs more difficult to evaluate from an investment perspective.
Real Estate Risk
To the extent that the Fund invests directly or indirectly in real estate investments, including investments in equity or debt securities issued by private and public REITs, real estate operating companies (“REOCs”), private or public real estate-related loans, real estate-linked derivative instruments and, for PAXS, PDO, and PDI, pooled
investment vehicles (including registered investment companies and private funds or other pooled investment vehicles that would qualify as “investment companies” under the 1940 Act but for an applicable exemption or exclusion) that invest in real estate investments, it will be subject to the risks associated with owning real estate and with the real estate industry generally. These investments carry increased risks, which include, but are not limited to: the burdens of ownership of real property; general and local economic conditions (such as an oversupply of space or a reduction in demand for space); the supply and demand for properties (including competition based on rental rates); energy and supply shortages; fluctuations in average occupancy and room rates; the attractiveness, type and location of the properties and changes in the relative popularity of commercial properties as an investment; the financial condition and resources of tenants, buyers and sellers of properties; increased mortgage defaults; the quality of maintenance, insurance and management services; changes in the availability of debt financing which may render the sale or refinancing of properties difficult or impracticable; changes in building, environmental and other laws and/or regulations (including those governing usage and improvements), fiscal policies and zoning laws; changes in real property tax rates; changes in interest rates and the availability of mortgage funds which may render the sale or refinancing of properties difficult or impracticable; changes in operating costs and expenses; energy and supply shortages; uninsured losses or delays from casualties or condemnation; negative developments in the economy that depress travel or leasing activity; environmental liabilities; contingent liabilities on disposition of assets; uninsured or uninsurable casualties; acts of God, including earthquakes, hurricanes and other natural disasters; social unrest and civil disturbances, epidemics, pandemics or other public crises; terrorist attacks and war; risks and operating problems arising out of the presence of certain construction materials, structural or property level latent defects, work stoppages, shortages of labor, strikes, union relations and contracts, fluctuating prices and supply of labor and/or other labor-related factor; and other factors which are beyond the control of PIMCO and its affiliates.
In addition, the Fund’s investments will be subject to various risks which could cause fluctuations in occupancy, rental rates, operating income and expenses or which could render the sale or financing of its properties difficult or unattractive. For example, following the termination or expiration of a tenant’s lease, there may be a period of time before receiving rental payments under a replacement lease. During that period, the Fund would continue to bear fixed expenses such as interest, real estate taxes, maintenance and other operating expenses. In addition, declining economic conditions may impair the ability to attract replacement tenants and achieve rental rates equal to or greater than the rents paid under previous leases. Increased competition for tenants
|
|
|
|
|
|
| |
254 |
|
PIMCO CLOSED-END FUNDS |
|
|
|
|
may require capital improvements to properties which would not have otherwise been planned.
Ultimately, to the extent it is not possible to renew leases or
re-let
space as leases expire, decreased cash flow from tenants will result, which could adversely impact the Fund’s operating results.
Real estate values have historically been cyclical. As the general economy grows, demand for real estate increases and occupancies and rents may increase. As occupancies and rents increase, property values increase, and new development occurs. As development may occur, occupancies, rents and property values may decline. Because leases are usually entered into for long periods and development activities often require extended times to complete, the real estate value cycle often lags the general business cycle. Because of this cycle, real estate companies may incur large swings in their profits and the prices of their securities. Developments following the onset of
COVID-19
have adversely impacted certain commercial real estate markets, causing the deferral of mortgage payments, renegotiated commercial mortgage loans, commercial real estate vacancies or outright mortgage defaults, and potential acceleration of macro trends such as work from home and online shopping which may negatively impact certain industries, such as
retail.
The total returns available from investments in real estate generally depend on the amount of income and capital appreciation generated by the related properties. The performance of real estate, and thereby the Fund, will be reduced by any related expenses, such as expenses paid directly at the property level and other expenses that are capitalized or otherwise embedded into the cost basis of the real estate.
Separately, certain service providers to the Fund and/or its subsidiaries, as applicable, with respect to its real state or real estate-related investments are expected to be, or are owned by, employed by, or otherwise related to, PIMCO, Allianz SE, their affiliates and/or their respective employees, consultants and other personnel. PIMCO may, in its sole discretion, determine to provide, or engage or recommend an affiliate of PIMCO to provide, certain services to the Fund, instead of engaging or recommending one or more third parties to provide such services. Subject to the governance requirements of a particular fund and applicable law, PIMCO or its affiliates, as applicable, will receive compensation in connection with the provision of such services. As a result, PIMCO faces a conflict of interest when selecting or recommending service providers for the Fund. Fees paid to an affiliated service provider will be determined in PIMCO’s commercially reasonable discretion. Although PIMCO has adopted various policies and procedures intended to mitigate or otherwise manage conflicts of interest with respect to affiliated service providers, there can be no guarantee that
such policies and procedures (which may be modified or terminated at any time in PIMCO’s sole discretion) will be successful.
PAXS, PDO, and PDI may seek to gain exposure to transactions involving the acquisition or financing of undeveloped land for residential or commercial land banking purposes. The ability to acquire land parcels for new projects may be adversely affected by changes in the general availability of land parcels, the willingness of land sellers to sell land parcels at reasonable prices, competition for available land parcels, availability of financing to acquire land parcels, zoning and other market conditions.
In addition to risks associated with real estate development generally, due to the long-term investment holding period often associated with land banking investments, entitlement and other regulatory risks may be heightened. Further, until the disposition or development of such undeveloped land, no income would be realized from such land banking investment. Undeveloped land is also a highly illiquid investment that may not be able to be disposed of when desired due to various changes in market conditions.
Each of PAXS’, PDO’s, and PDI’s investments in real estate (including indirectly through Private Funds treated as partnerships for U.S. federal income tax purposes) will potentially be limited by each Fund’s intention to qualify as a RIC, and will potentially limit the Fund’s ability to so qualify. Income and gains from direct investments in real estate do not constitute qualifying income to a RIC for purposes of the 90% gross income test described below. See “Private Funds Risk — Tax Risk.” If a Fund were to treat income or gain from a particular investment as qualifying income and the income or gain were later determined not to constitute qualifying income and, together with any other nonqualifying income, caused the Fund’s nonqualifying income to exceed 10% of its gross income in any taxable year, or the Fund’s nonqualifying income in any taxable year otherwise exceeded 10% of its gross income, the Fund would fail to qualify as a RIC unless it is eligible to and does pay a tax at the Fund level.
Regulation S Securities Risk
Regulation S securities are offered through
off-shore
(non-U.S.)
offerings without registration with the SEC pursuant to Regulation S of the Securities Act. Because Regulation S securities are subject to legal or contractual restrictions on resale, Regulation S securities may be considered illiquid. Furthermore, because Regulation S securities are generally less liquid than registered securities, a Fund may take longer to liquidate these positions than would be the case for publicly traded securities. Although Regulation S securities may be resold in privately negotiated transactions, the price realized from these sales could be less than
off-shore
transactions or in those originally paid by the Fund. Further, companies whose securities are not publicly traded may not be subject to the disclosure and other investor protection requirements
|
|
|
|
|
|
|
|
|
|
|
|
| |
| |
|
|
ANNUAL REPORT |
|
|
| |
|
|
JUNE 30, 2025 |
|
|
255 |
|
|
|
|
| |
Principal Risks of the Funds |
|
|
|
|
that would be applicable if their securities were publicly traded. Accordingly, Regulation S securities may involve a high degree of business and financial risk and may result in substantial losses.
Regulatory Changes Risk
Financial entities, such as investment companies and investment advisers, are generally subject to extensive government regulation and intervention. Government regulation and/or intervention may change the way the Fund is regulated, affect the expenses incurred directly by the Fund and the value of its investments, and limit and/or preclude the Fund’s ability to achieve its investment objectives. Government regulation may change frequently and may have significant adverse consequences. The Fund and the Investment Manager have historically been eligible for exemptions from certain regulations. However, there is no assurance that the Fund and the Investment Manager will continue to be eligible for such exemptions.
Moreover, government regulation may have unpredictable and unintended effects. Legislative or regulatory actions to address perceived liquidity or other issues in fixed income markets generally, or in particular markets such as the municipal securities market, may alter or impair the Fund’s ability to pursue its investment objectives or utilize certain investment strategies and techniques.
While there continues to be uncertainty about the full impact of these and other regulatory changes, it is the case that the Fund will be subject to a more complex regulatory framework, and may incur additional costs to comply with new requirements as well as to monitor for compliance in the future. Actions by governmental entities may also impact certain instruments in which the Fund invests and reduce market liquidity and resiliency.
Regulatory Risk — Commodity Pool Operator
The Commodities Futures Trading Commission (“CFTC”) has adopted regulations that subject registered investment companies and their investment advisers to regulation by the CFTC if the registered investment company invests more than a prescribed level of its liquidation value in futures, options on futures or commodities, swaps, or other financial instruments regulated under the Commodity Exchange Act, as amended, and the rules thereunder (“commodity interests”), or if the Fund markets itself as providing investment exposure to such instruments. The Investment Manager is registered with the CFTC as a Commodity Pool Operator (“CPO”). However, with respect to the Fund, the Investment Manager has claimed an exclusion from registration as a CPO pursuant to CFTC Rule 4.5. For the Investment Manager to remain eligible for this exclusion, the Fund must comply with certain limitations, including limits on its ability to use any commodity interests and limits on the manner in which the Fund holds out its use of such commodity interests. These limitations
may restrict the Fund’s ability to pursue its investment objectives and strategies, increase the costs of implementing its strategies, result in higher expenses for the Fund, and/or adversely affect the Fund’s total return. To the extent the Investment Manager becomes ineligible for this exclusion from CFTC regulation, the Fund may consider steps in order to continue to qualify for exemption from CFTC regulation, or may determine to operate subject to CFTC regulation.
Reinvestment Risk
Income from the Fund’s portfolio will decline if and when the Fund invests the proceeds from matured, traded or called debt obligations at market interest rates that are below the portfolio’s current earnings rate. For instance, during periods of declining interest rates, an issuer of debt obligations may exercise an option to redeem securities prior to maturity, forcing the Fund to invest in lower-yielding securities. The Fund also may choose to sell higher yielding portfolio securities and to purchase lower yielding securities to achieve greater portfolio diversification, because the portfolio managers believe the current holdings are overvalued or for other investment-related reasons. A decline in income received by the Fund from its investments is likely to have a negative effect on dividend levels and the market price, NAV and/or overall return of the Common Shares.
REIT Risk
REITs are pooled investment vehicles that own, and usually operate, income-producing real estate. Some REITs also finance real estate. If a REIT meets certain requirements, including distributing to shareholders substantially all of its taxable income (other than net capital gains), then it is not typically taxed on the income distributed to shareholders.
REITs are sometimes informally characterized as: Equity REITs, Mortgage REITs and Hybrid REITs. Equity REITs invest the majority of their assets directly in real property. They derive their income primarily from rents received and any profits on the sale of their properties. Equity REITs can also realize capital gains by selling properties that have appreciated in value. Mortgage REITs invest the majority of their assets in real estate mortgages and derive most of their income from mortgage interest payments. As its name suggests, Hybrid REITs combine characteristics of both Equity REITs and Mortgage REITs.
An investment in a REIT, or in a real estate linked derivative instrument linked to the value of a REIT, is subject to the risks that impact the value of the underlying properties of the REIT. These risks include loss to casualty or condemnation, and changes in supply and demand, interest rates, zoning laws, regulatory limitations on rents, property taxes and operating expenses. Other factors that may adversely affect REITs include poor performance by management of the REIT, changes to the tax laws, or failure by the REIT to qualify for favorable tax treatment. The securities of REITs involve greater risks
|
|
|
|
|
|
| |
256 |
|
PIMCO CLOSED-END FUNDS |
|
|
|
|
than those associated with larger, more established companies and may be subject to more abrupt or erratic price movements because of interest rate changes, economic conditions and other factors. For example, the value of these securities may decline when interest rates rise and will also be affected by the real estate market and by the management or development of the underlying properties. The underlying properties may be subject to mortgage loans, which may also be subject to the risks of default. REITs are also subject to default by borrowers and self-liquidation, and are heavily dependent on cash flow. Some REITs lack diversification because they invest in a limited number of properties, a narrow geographic area, or a single type of property. Mortgage REITs may be impacted by the quality of the credit extended.
Repurchase Agreements Risk
The Fund may enter into repurchase agreements, in which the Fund purchases a security from a bank or broker-dealer, which agrees to repurchase the security at the Fund’s cost plus interest within a specified time. If the party agreeing to repurchase should default, the Fund would seek to sell the securities which it holds. This could involve costs or delays in addition to a loss on the securities if their value should fall below their repurchase price. The security subject to a repurchase agreement may be or become illiquid. These events could also trigger adverse tax consequences for the Fund.
In December 2023, the U.S. Securities and Exchange Commission adopted rule amendments that are expected to result in the Fund being required to clear all or substantially all of its repurchase agreements collateralized by U.S. Treasury securities as of June 30, 2027 where a direct participant in any covered clearing agency is the counterparty. The Fund may incur costs in connection with entering into new agreements (or amending existing agreements) with counterparties who are direct participants of a covered clearing agency and potentially other market participants and taking other actions to comply with the new requirements. In addition, upon the compliance date, the costs and benefits of entering into repurchase agreements collateralized by U.S. Treasury securities to the Fund may be impacted as compared to such repurchase agreements prior to the compliance date.
Risks of Debt Securities of MLPs
Debt securities issued by MLPs are subject to the risks associated with all debt investments, including interest rate risk, prepayment risk, credit risk, and, as applicable, high yield securities risk and distressed and defaulted securities risk.
Risks of Equity Securities of MLPs
General equity securities risk.
MLP common units and other equity securities issued by MLPs are subject to the risks associated with all equity investments. Equity securities may be particularly sensitive to
equity market movements. In addition, equity securities of MLPs and MLP affiliates may decline in price if the issuer fails to make anticipated distributions or dividend payments if, for example, the issuer experiences a decline in its financial condition. Cash available for distribution by MLPs will vary widely from quarter to quarter due to various factors.
Limited partner risk.
An investment in MLP equity securities involves risks that differ from a similar investment in equity securities, such as common stock, of a corporation. Holders of MLP units have the rights typically afforded to limited partners in a limited partnership. As compared to common stockholders of a corporation, holders of MLP units generally have more limited control and limited rights to vote on matters affecting the MLP. There are certain tax risks associated with an investment in MLP units. Additionally, conflicts of interest may exist among common unit holders, subordinated unit holders, and the general partner or managing member of an MLP; for example, a conflict may arise as a result of incentive distribution payments.
Risks of MLP subordinated units.
MLP subordinated units typically are convertible to MLP common units at a
ratio. Convertible subordinated units generally are not entitled to distributions until holders of common units have received specified minimum quarterly distributions, plus any arrearages, and may receive less in distributions upon liquidation. Convertible subordinated unit holders generally are entitled to a minimum distribution prior to the payment of incentive distributions to the general partner or managing member but are not entitled to distributions in arrears. In the event of liquidation, common units have preference over subordinated units, but do not have a preference over debt or preferred units. Therefore, MLP subordinated units generally entail greater risk than MLP common units. MLP subordinated units are usually convertible into common units after the passage of a specified period of time or upon the achievement by the MLP of specified financial goals.
Certain MLPs depend upon their parent or sponsor entities for the majority of their revenues. If their parent or sponsor entities fail to make such payments or satisfy their obligations, the revenues and cash flows of such MLPs and the ability of such MLPs to make distributions to unit holders would be adversely affected.
Lack of diversification of MLP customers and suppliers.
Certain MLPs depend upon a limited number of customers for substantially all their revenue. Similarly, certain MLPs depend upon a limited number of suppliers of goods or services to continue their operations. The loss of any such customers or suppliers, including through bankruptcy, could materially adversely affect such MLPs’ operations and cash flow, and their ability to make distributions to unit holders would therefore be materially adversely affected.
|
|
|
|
|
|
|
|
|
|
|
|
| |
| |
|
|
ANNUAL REPORT |
|
|
| |
|
|
JUNE 30, 2025 |
|
|
257 |
|
|
|
|
| |
Principal Risks of the Funds |
|
|
|
|
MLP General Partner and Managing Member Interests.
General partner and managing member interests are generally not traded. A holder of general partner or managing member interests can be liable in certain circumstances for amounts greater than the amount of its investment in such interests. In addition, while a general partner or managing member’s incentive distribution rights can mean that general partners and managing members have higher distribution prospects than the limited partners or members of the underlying MLPs, these incentive distribution payments would decline at a greater rate than the decline rate in distributions to common or subordinated unit holders if there is a reduction in the MLP’s distribution. A general partner or managing member interest can generally be redeemed by the MLP if the MLP unit holders choose to remove the general partner, typically by a supermajority vote of the limited partners or members, which can be difficult to accomplish.
Risks of ETNs
The value of exchange-traded notes (“ETNs”) may be influenced by time to maturity, level of supply and demand for the ETN, volatility, and lack of liquidity in underlying markets, changes in the applicable interest rates and underlying reference asset values, changes in the issuer’s credit rating, and economic, legal, political, or geographic events that may affect the referenced index. There may be restrictions on the Fund’s right to liquidate its investment in an ETN prior to maturity and there may be limited availability of a secondary market. The Fund will have no claim on the underlying reference assets. ETNs are also subject to credit risk and counterparty risk.
Risk of Investing in China
Investments in securities of companies domiciled in the People’s Republic of China (“China” or the “PRC”) involve a high degree of risk and special considerations not typically associated with investing in the U.S. securities markets. Such heightened risks include, among others, an authoritarian government, popular unrest associated with demands for improved political, economic and social conditions, the impact of regional conflict on the economy and hostile relations with neighboring countries. Escalation of
China-U.S.
tensions and retaliatory countermeasures that national and state governments have taken and may take (including U.S. sanctions and anti-sanction laws in China), as well as other economic, social or political unrest in the future, could have a material adverse effect on or could limit the activities of PIMCO, a Fund or the companies in which a Fund has invested.
Military conflicts, either in response to internal social unrest or conflicts with other countries, could disrupt economic development. The Chinese economy is vulnerable to the long-running disagreements with Hong Kong related to integration. China has a complex territorial dispute regarding the sovereignty of Taiwan; Taiwan-based companies
and individuals are significant investors in China. Potential military conflict between China and Taiwan may adversely affect securities of Chinese and Taiwan issuers. In addition, China has strained international relations with Japan, India, Russia and other neighbors due to territorial disputes, historical animosities and other defense concerns. China could be affected by military events on the Korean peninsula or internal instability within North Korea. These situations may cause uncertainty in the Chinese market and may adversely affect the performance of the Chinese economy.
The Chinese government has implemented significant economic reforms in order to liberalize trade policy, promote foreign investment in the economy, reduce government control of the economy and develop market mechanisms. But there can be no assurance that these reforms will continue or that they will be effective. Despite reforms and privatizations of companies in certain sectors, the Chinese government still exercises substantial influence over many aspects of the private sector and may own or control many companies. The Chinese government continues to maintain a major role in economic policy making and investing in China involves risks of losses due to expropriation, nationalization, confiscation of assets and property, and the imposition of restrictions on foreign investments and on repatriation of capital invested.
The Chinese government may intervene in the Chinese financial markets, such as by the imposition of trading restrictions, a ban on “naked” short selling or the suspension of short selling for certain stocks. This may affect market price and liquidity of these stocks, and may have an unpredictable impact on the investment activities of a Fund. Furthermore, such market interventions may have a negative impact on market sentiment which may in turn affect the performance of the securities markets and as a result the performance of a Fund.
In addition, there is less regulation and monitoring of the securities markets and the activities of investors, brokers and other participants in China than in the United States. Accordingly, issuers of securities in China are not subject to the same degree of regulation as those in the United States with respect to such matters as insider trading rules, tender offer regulation, stockholder proxy requirements and the requirements mandating timely and accurate disclosure of information. Stock markets in China are in the process of change and further development. This may lead to trading volatility, and difficulties in the settlement and recording of transactions and interpretation and application of the relevant regulations. Custodians may not be able to offer the level of service and safe-keeping in relation to the settlement and administration of securities in China that is customary in more developed markets. In particular, there is a risk that a Fund may not be recognized as the owner of securities that are held on behalf of the Fund by a
sub-custodian.
|
|
|
|
|
|
| |
258 |
|
PIMCO CLOSED-END FUNDS |
|
|
|
|
The Renminbi (“RMB”) is currently not a freely convertible currency and is subject to foreign exchange control policies and repatriation restrictions imposed by the Chinese government. The imposition of currency controls may negatively impact performance and liquidity of a Fund as capital may become trapped in the PRC. A Fund could be adversely affected by delays in, or a refusal to grant, any required governmental approval for repatriation of capital, as well as by the application to the Fund of any restrictions on investments. Investing in entities either in, or which have a substantial portion of their operations in, the PRC may require a Fund to adopt special procedures, seek local government approvals or take other actions, each of which may involve additional costs and delays to the Fund.
Chinese economic growth is not guaranteed. China may experience substantial rates of inflation or economic recessions, causing a negative effect on the economy and securities market. China’s economy is heavily dependent on export growth. Reduction in spending on Chinese products and services, institution of tariffs or other trade barriers or a downturn in any of the economies of China’s key trading partners may have an adverse impact on the securities of Chinese issuers.
The tax laws and regulations in the PRC are subject to change, including the issuance of authoritative guidance or enforcement, possibly with retroactive effect. The interpretation, applicability and enforcement of such laws by the PRC tax authorities are not as consistent and transparent as those of more developed nations, and may vary over time and from region to region. The application and enforcement of the PRC tax rules could have a significant adverse effect on a Fund and its investors, particularly in relation to capital gains withholding tax imposed upon
non-residents.
In addition, the accounting, auditing and financial reporting standards and practices applicable to Chinese companies may be less rigorous, and may result in significant differences between financial statements prepared in accordance with PRC accounting standards and practices and those prepared in accordance with international accounting standards.
Certain U.S. states have proposed, enacted or are in the process of adopting new legislation that restricts the ability of a wide range of governmental bodies and persons or entities from or domiciled in foreign countries of concern, as defined in the applicable U.S. state’s laws (e.g., the PRC) (any such direct or indirect investor, a “Covered Investor”) to directly or indirectly own or acquire interests in “real property” (e.g., land, buildings, fixtures, and all other improvements to land) located in the relevant states, subject to certain limited exceptions (such laws as in effect from time to time, the “State Real Estate Laws”). Certain investments made by a Fund may constitute investments in “real property” for purposes of these laws (such investments, “Restricted Investments”). The State Real Estate Laws
may impose different thresholds on the ownership of Restricted Investments by Covered Investors. Each Fund intends to comply with the State Real Estate Laws to the extent applicable to their shareholder base, and may, to comply with such laws, request and report confidential information about a shareholder if required by the State Real Estate Laws and, if applicable, any underlying beneficial ownership, to applicable authorities if PIMCO determines that it is in the best interests of the Fund in light of the relevant laws or regulations or upon the request of regulators.
The U.S. Treasury’s Outbound Investment Screening Rule went into effect on January 2, 2025. The Outbound Investment Screening Rule implements Executive Order 14105, which directed the U.S. Treasury to issue regulations to address the national security threat posed by certain U.S investments that may accelerate the development of sensitive technologies and products in “countries of concern,” defined as China and the Special Administrative Regions of Hong Kong and Macau. The rule establishes a regulatory framework for either prohibiting or requiring notifications to the U.S. Treasury for certain U.S. investments in companies related to the countries of concern that conduct activities involving certain semiconductor technologies, AI systems for military or surveillance use, or quantum computing. A Fund may face restrictions on investing in certain Chinese or Chinese-owned companies involved in the covered sectors. A Fund must also implement due diligence processes for identifying covered transactions and may need to report notifiable transactions to the U.S. Treasury, potentially affecting investment timelines.
From time to time, China has experienced outbreaks of infectious illnesses, and the country may be subject to other public health threats, infectious illnesses, diseases or similar issues in the future. Any spread of an infectious illness, public health threat or similar issue could reduce consumer demand or economic output, result in market closures, travel restrictions or quarantines, and generally have a significant impact on the Chinese economy, which in turn could adversely affect a Fund’s investments and could result in increased premiums or discounts to the Fund’s NAV.
In recent years, various governmental bodies have considered and, in some cases, imposed sanctions, trade and investment restrictions and/or notification requirements targeting the PRC (inclusive of Hong Kong and Macau), and it is possible that additional restrictions may be imposed in the future. Given the complex and evolving relationship between the PRC and certain other countries, it is difficult to predict the impact of such restrictions on market conditions. Further, complying with such restrictions may prevent a Fund from pursuing certain investments, cause delays or other impediments with respect to consummating such investments, require notification of such investments to government authorities, require divestment or freezing
|
|
|
|
|
|
|
|
|
|
|
|
| |
| |
|
|
ANNUAL REPORT |
|
|
| |
|
|
JUNE 30, 2025 |
|
|
259 |
|
|
|
|
| |
Principal Risks of the Funds |
|
|
|
|
of investments on unfavorable terms, render divestment of underperforming investments impracticable, negatively impact a Fund’s ability to achieve its investment objective, prevent a Fund from receiving payments otherwise due it, require a Fund to obtain information about underlying investors, increase diligence and other similar costs to a Fund, render valuation of China-related investments challenging, or require a fund to consummate an investment on terms that are less advantageous than would be the case absent such restrictions.
Risk Retention Investment Risk
The Fund may invest in risk retention tranches of commercial mortgage-backed securities (“CMBS”) or other eligible securitizations, if any (“risk retention tranches”), which are eligible residual interests held by the sponsors of such securitizations pursuant to the final rules implementing the credit risk retention requirements of Section 941 of the Dodd-Frank Act (the “U.S. Risk Retention Rules”). In the case of CMBS transactions, for example, the U.S. Risk Retention Rules permit all or a portion of the retained credit risk associated with certain securitizations (i.e., retained risk) to be held by an unaffiliated “third party purchaser,” such as the Fund, if, among other requirements, the third-party purchaser holds its retained interest, unhedged, for at least five years following the closing of the CMBS transaction, after which it is entitled to transfer its interest in the securitization to another person that meets the requirements for a third-party purchaser. Even after the required holding period has expired, due to the generally illiquid nature of such investments, no assurance can be given as to what, if any, exit strategies will ultimately be available for any given position.
In addition, there is limited guidance on the application of the final U.S. Risk Retention Rules to specific securitization structures. There can be no assurance that the applicable federal agencies charged with the implementation of the final U.S. Risk Retention Rules (the Federal Deposit Insurance Corporation, the Comptroller of the Currency, the Federal Reserve Board, the SEC, the Department of Housing and Urban Development, and the Federal Housing Finance Agency) could not take positions in the future that differ from the interpretation of such rules taken or embodied in such securitizations, or that the final U.S. Risk Retention Rules will not change.
Furthermore, in situations where the Fund invests in risk retention tranches of securitizations structured by third parties, the Fund may be required to execute one or more letters or other agreements, the exact form and nature of which will vary (each, a “Risk Retention Agreement”) under which it will make certain undertakings designed to ensure such securitization complies with the U.S. Risk Retention Rules. Such Risk Retention Agreements may include a variety of representations, warranties, covenants and other indemnities, each of which may run to various transaction parties. If the Fund breaches any undertakings in any Risk Retention Agreement, it will be exposed to
claims by the other parties thereto, including for any losses incurred as a result of such breach, which could be significant and exceed the value of the Fund’s investments.
Securities Lending Risk
For the purpose of achieving income, the Fund may lend its portfolio securities to brokers, dealers, and other financial institutions provided a number of conditions are satisfied, including that the loan is fully collateralized. When the Fund lends portfolio securities, its investment performance will continue to reflect changes in the value of the securities loaned, and the Fund will also receive a fee or interest on the collateral. Securities lending involves the risk of loss of rights in the collateral or delay in recovery of the collateral if the borrower fails to return the security loaned or becomes insolvent. The Fund may pay lending fees to a party arranging the loan. Cash collateral received by the Fund in securities lending transactions may be invested in short-term liquid fixed income instruments or in money market or short-term mutual funds, or similar investment vehicles, including affiliated money market or short-term mutual funds. The Fund bears the risk of such investments.
Senior Debt Risk
The Fund may be subject to greater levels of credit risk than funds that do not invest in below investment grade senior debt. The Fund may also be subject to greater levels of liquidity risk than funds that do not invest in senior debt. Restrictions on transfers in loan agreements, a lack of publicly available information and other factors may, in certain instances, make senior debt more difficult to sell at an advantageous time or price than other types of securities or instruments.
Additionally, if the issuer of senior debt prepays, the Fund will have to consider reinvesting the proceeds in other senior debt or similar instruments that may pay lower interest rates.
Short Exposure Risk
The Fund’s short sales and short positions, if any, are subject to special risks. A short sale involves the sale by the Fund of a security that it does not own with the hope of purchasing the same security at a later date at a lower price. The Fund may also enter into a short position through a forward commitment or a short derivative position through a futures contract or swap agreement. If the price of the security or derivative has increased during this time, then the Fund will incur a loss equal to the increase in price from the time that the short sale was entered into plus any transaction costs (i.e., premiums and interest) paid to the broker-dealer to borrow securities. Therefore, short sales involve the risk that losses may be exaggerated, potentially losing more money than the actual cost of the investment. By contrast, a loss on a long position arises from decreases in the value of the security and is limited by the fact that a security’s value cannot decrease below zero.
|
|
|
|
|
|
| |
260 |
|
PIMCO CLOSED-END FUNDS |
|
|
|
|
By investing the proceeds received from selling securities short, the Fund could be deemed to be employing a form of leverage, which creates special risks. The use of leverage may increase the Fund’s exposure to long security positions and make any change in the Fund’s NAV greater than it would be without the use of leverage. This could result in increased volatility of returns. There is no guarantee that any leveraging strategy the Fund employs will be successful during any period in which it is employed.
In times of unusual or adverse market, economic, regulatory, environmental or political conditions, the Fund may not be able, fully or partially, to implement its short selling strategy. Periods of unusual or adverse market, economic, regulatory, environmental or political conditions generally may exist for long periods of time. In response to market events, the SEC and regulatory authorities in other jurisdictions may adopt (and in certain cases, have adopted) bans on, and/or reporting requirements for, short sales of certain securities, including short positions on such securities acquired through swaps. Also, there is the risk that the third party to the short sale or short position will not fulfill its contractual obligations, causing a loss to the Fund.
Special Purpose Acquisition Companies (“SPACs”) Risk
The Fund may invest in securities of SPACs or similar special purpose entities that pool funds to seek potential acquisition opportunities. Unless and until an acquisition is completed, a SPAC generally invests its assets (less a portion retained to cover expenses) in US government securities, money market securities or holds cash; if an acquisition that meets the requirements for the SPAC is not completed within a
pre-established
period of time, the invested funds are returned to the entity’s shareholders unless shareholders approve alternative options. Because SPACs and similar entities are in essence blank check companies without operating history or ongoing business other than seeking acquisitions, the value of their securities is particularly dependent on the ability of the entity’s management to identify and complete a profitable acquisition. A SPAC’s structure may result in significant dilution of a stockholder’s share value immediately upon the completion of a business combination due to, among other reasons, interests held by the SPAC sponsor, conversion of warrants into additional shares, shares issued in connection with a business combination and/or certain embedded costs. There is no guarantee that the SPACs in which the Fund invests will complete an acquisition or that any acquisitions that are completed will be profitable. Some SPACs may pursue acquisitions only within certain industries or regions, which may increase the volatility of their prices. In addition, these securities, which are typically traded in the
market, may be considered illiquid and/or be subject to restrictions on resale.
Smaller Company Risk
The general risks associated with debt instruments or equity securities are particularly pronounced for securities issued by companies with small market capitalizations. Small capitalization companies involve certain special risks. They are more likely than larger companies to have limited product lines, markets or financial resources, or to depend on a small, inexperienced management group. Securities of smaller companies may trade less frequently and in lesser volume than more widely held securities and their values may fluctuate more sharply than other securities. They may also have limited liquidity. These securities may therefore be more vulnerable to adverse developments than securities of larger companies, and the Fund may have difficulty purchasing or selling securities positions in smaller companies at prevailing market prices. Also, there may be less publicly available information about smaller companies or less market interest in their securities as compared to larger companies. Companies with
medium-sized
market capitalizations may have risks similar to those of smaller companies.
Sovereign Debt Risk
In addition to the other risks applicable to debt investments, sovereign debt may decline in value as a result of default or other adverse credit event resulting from an issuer’s inability or unwillingness to make principal or interest payments in a timely fashion. A sovereign entity’s failure to make timely payments on its debt can result from many factors, including, without limitation, insufficient foreign
(non-U.S.)
currency reserves or an inability to sufficiently manage fluctuations in relative currency valuations, an inability or unwillingness to satisfy the demands of creditors and/or relevant supranational entities regarding debt service or economic reforms, the size of the debt burden relative to economic output and tax revenues, cash flow difficulties, and other political and social considerations. The risk of loss to the Fund in the event of a sovereign debt default or other adverse credit event is heightened by the unlikelihood of any formal recourse or means to enforce its rights as a holder of the sovereign debt. In addition, sovereign debt restructurings, which may be shaped by entities and factors beyond the Fund’s control, may result in a loss in value of the Fund’s sovereign debt holdings.
Structured Investments Risk
Holders of structured products, including structured notes, credit-linked notes and other types of structured products, bear the risks of the underlying investments, index or reference obligation and are subject to counterparty risk. The Fund may have the right to receive payments only from the structured product, and generally does not have direct rights against the issuer or the entity that sold the assets to be securitized. While certain structured products enable the investor to acquire interests in a pool of securities without the brokerage and other expenses associated with directly holding the same securities,
|
|
|
|
|
|
|
|
|
|
|
|
| |
| |
|
|
ANNUAL REPORT |
|
|
| |
|
|
JUNE 30, 2025 |
|
|
261 |
|
|
|
|
| |
Principal Risks of the Funds |
|
|
|
|
investors in structured products generally pay their share of the structured product’s administrative and other expenses. Although it is difficult to predict whether the prices of indices and securities underlying structured products will rise or fall, these prices (and, therefore, the prices of structured products) are generally influenced by the same types of political and economic events that affect issuers of securities and capital markets generally. If the issuer of a structured product uses shorter term financing to purchase longer term securities, the issuer may be forced to sell its securities at below market prices if it experiences difficulty in obtaining such financing, which may adversely affect the value of the structured products owned by the Fund. Structured products generally entail risks associated with derivative instruments.
Subprime Risk
Loans, and debt instruments collateralized by loans (including shares, certificates, notes or other securities issued by a special purpose entity (“SPE”) sponsored by an alternative lending platform (i.e., an online lending marketplace or lender that is not a traditional banker, such as a bank) or its affiliates (the “Sponsor”) that represent the right to receive principal and interest payments due on pools of whole loans or fractions of whole loans, which may (but may not) be issued by the Sponsor, held by the SPE (“Alt Lending ABS”)), acquired by the Fund may be subprime in quality, or may become subprime in quality. Although there is no specific legal or market definition of “subprime,” subprime loans are generally understood to refer to loans made to borrowers that display poor credit histories and other characteristics that correlate with a higher default risk. Accordingly, subprime loans, and debt instruments secured by such loans (including Alt Lending ABS), have speculative characteristics and are subject to heightened risks, including the risk of nonpayment of interest or repayment of principal, and the risks associated with investments in high yield securities. In addition, these instruments could be subject to increased regulatory scrutiny. The Fund is not restricted by any particular borrower credit risk criteria and/or qualifications when acquiring loans or debt instruments collateralized by loans.
Subsidiary Risk
To the extent the Fund invests through one or more of its subsidiaries, the Fund would be exposed to the risks associated with such subsidiary’s investments. Such subsidiaries would likely not be registered as investment companies under the 1940 Act and therefore would not be subject to all of the investor protections of the 1940 Act. Changes in the laws of the United States and/or the jurisdiction in which a subsidiary is organized could result in the inability of the Fund and/or the subsidiary to operate as intended and could adversely affect the Fund.
Synthetic Convertible Securities Risk
Synthetic convertible securities involve the combination of separate securities that possess the two principal characteristics of a traditional
convertible security (i.e., an income-producing component and a right to acquire an equity security). Synthetic convertible securities are often achieved, in part, through investments in warrants or options to buy common stock (or options on a stock index), and therefore are subject to the risks associated with derivatives. The value of a synthetic convertible security will respond differently to market fluctuations than a traditional convertible security because a synthetic convertible is composed of two or more separate securities or instruments, each with its own market value. Because the convertible component is typically achieved by investing in warrants or options to buy common stock at a certain exercise price, or options on a stock index, synthetic convertible securities are subject to the risks associated with derivatives. In addition, if the value of the underlying common stock or the level of the index involved in the convertible component falls below the exercise price of the warrant or option, the warrant or option may lose all value.
Tax Risk
The Fund has elected to be treated as a regulated investment company (“RIC”) under the Code and intends each year to qualify and be eligible to be treated as such, so that it generally will not be subject to U.S. federal income tax on its net investment income or net short-term or long-term capital gains, that are timely distributed (or deemed distributed, as described below) to shareholders. In order to qualify and be eligible for such treatment, the Fund must meet certain asset diversification tests, derive at least 90% of its gross income for such year from certain types of qualifying income, and distribute to its shareholders at least 90% of the sum of its “investment company taxable income” as that term is defined in the Code (which includes, among other things, dividends, taxable interest and the excess of any net short-term capital gains over net long-term capital losses, as reduced by certain deductible expenses) and net
tax-exempt
income, for such year.
The Fund’s investment strategy will potentially be limited by its intention to continue qualifying for treatment as a RIC, and can limit the Fund’s ability to continue qualifying as such. The tax treatment of certain of the Fund’s investments under one or more of the qualification or distribution tests applicable to RICs is uncertain. An adverse determination or future guidance by the IRS or a change in law might affect the Fund’s ability to qualify or be eligible for treatment as a RIC.
Income and gains from certain of the Fund’s activities may not constitute qualifying income to a RIC for purposes of the 90% gross income test. If the Fund were to treat income or gain from a particular investment or activity as qualifying income and the income or gain were later determined not to constitute qualifying income and, together with any other nonqualifying income, caused the Fund’s
|
|
|
|
|
|
| |
262 |
|
PIMCO CLOSED-END FUNDS |
|
|
|
|
nonqualifying income to exceed 10% of its gross income in any taxable year, the Fund would fail to qualify as a RIC unless it is eligible to and does pay a tax at the Fund level.
If, in any year, the Fund were to fail to qualify for treatment as a RIC under the Code and were ineligible to or did not otherwise cure such failure, the Fund would be subject to tax on its taxable income at corporate rates and, when such income is distributed, shareholders would be subject to further tax on such distributions to the extent of the Fund’s current or accumulated earnings and profits.
To qualify to pay exempt-interest dividends, at least 50% of the value of the total assets of the Fund must consist of obligations exempt from federal income tax as of the close of each quarter of the Fund’s taxable year. Fund distributions reported as exempt-interest dividends are not generally taxable to Fund shareholders for regular U.S. federal income tax purposes, but they may be subject to state and local taxes and/or federal alternative minimum tax. If the proportion of taxable investments held by the Fund exceeds 50% of the Fund’s total assets as of the close of any quarter of the Fund’s taxable year, the Fund will not for that taxable year satisfy the general eligibility test that otherwise permits it to pay exempt-interest dividends.
The value of the Fund’s investments and its net asset value may be adversely affected by changes in tax rates and policies. Because interest income from municipal securities is normally not subject to regular federal
in-come
taxation, the attractiveness of municipal securities in relation to other investment alternatives is affected by changes in federal income tax rates or changes in the
tax-exempt
status of interest income from municipal securities. Any proposed or actual changes in such rates or exempt status, therefore, can significantly affect the demand for and supply, liquidity and marketability of municipal securities. This could in turn affect the Fund’s net asset value and ability to acquire and dispose of municipal securities at desirable yield and price levels. Additionally, the Fund is not a suitable investment for individual retirement accounts, for other
tax-exempt
or
tax-deferred
accounts or for investors who are not sensitive to the federal income tax consequences of their investments.
Total Return Swap Risk
Total return swaps could result in losses if the underlying asset or reference does not perform as anticipated. Total return swaps may effectively add leverage to the Fund’s portfolio. Total return swaps entail the risk that the counterparty might default on the contract. If the counterparty defaults, the Fund may lose any contractual payments to which the Fund is entitled. Total return swaps can have the potential for unlimited losses. Total return swaps are subject to certain other risks applicable to derivatives transactions generally. Investing in total return swaps on certain securities, including MLP
securities, may be relatively novel strategy and may be treated in a manner bearing adversely on the Fund’s ability to qualify as a regulated investment company for U.S. federal income tax purposes. If the Fund were to fail to qualify as a regulated investment company, the Fund may be required to change its investment strategies, pay a Fund level tax, back taxes and/or tax penalties and sell securities or other instruments at a time or in a manner unfavorable to the Fund. Any such sales may cause the Fund to sell securities or instruments that otherwise may be favorable for the Fund, bear other adverse consequences (such as incurring short term capital gain on sales or unwinding of positions that were intended to be held for longer periods) and/or incur transaction costs. As such, such a failure to qualify for regulated investment company status could, among other things, negatively affect the Fund’s share price, before and
after-tax
performance, distribution rate (including a reduction in dividends) and/or its ability to achieve its investment objectives and could cause losses to the Fund (including, but not limited to, circumstances where the Fund is required to pay a Fund level tax, back taxes and/or tax penalties).
U.S. Government Securities Risk
Certain U.S. government securities such as U.S. Treasury bills, notes and bonds and mortgage-related securities guaranteed by the GNMA, are supported by the full faith and credit of the United States; others, such as those of Federal Home Loan Banks (“FHLBs”) or the Federal Home Loan Mortgage Corporation (“FHLMC”), are supported by the right of the issuer to borrow from the U.S. Treasury; others, such as those of the FNMA, are supported by the discretionary authority of the U.S. government to purchase the agency’s obligations; and still others are supported only by the credit of the agency, instrumentality or corporation. U.S. government securities are subject to market risk, interest rate risk and credit risk. Although legislation has been enacted to support certain government sponsored entities, including the FHLBs, FHLMC and FNMA, there is no assurance that the obligations of such entities will be satisfied in full, or that such obligations will not decrease in value or default. It is difficult, if not impossible, to predict the future political, regulatory or economic changes that could impact the government sponsored entities and the values of their related securities or obligations. In addition, certain governmental entities, including FNMA and FHLMC, have been subject to regulatory scrutiny regarding their accounting policies and practices and other concerns that may result in legislation, changes in regulatory oversight and/or other consequences that could adversely affect the credit quality, availability or investment character of securities issued by these entities. Yields available from U.S. government debt securities are generally lower than the yields available from such other securities. The values of U.S. government securities change as interest rates fluctuate.
|
|
|
|
|
|
|
|
|
|
|
|
| |
| |
|
|
ANNUAL REPORT |
|
|
| |
|
|
JUNE 30, 2025 |
|
|
263 |
|
|
|
|
| |
Principal Risks of the Funds |
|
|
|
(Unaudited) |
Periodically, uncertainty regarding the status of negotiations in the U.S. government to increase the statutory debt ceiling could increase the risk that the U.S. government may default on payments on certain U.S. government securities, cause the credit rating of the U.S. government to be downgraded, increase volatility in the stock and bond markets, result in higher interest rates, reduce prices of U.S. Treasury and other securities, and/or increase the costs of various kinds of debt. If a government-sponsored entity is negatively impacted by legislative or regulatory action (or lack thereof), is unable to meet its obligations, or its creditworthiness declines, the performance of a fund that holds securities of the entity will be adversely impacted.
Valuation Risk
Certain securities in which the Fund invests may be less liquid and more difficult to value than other types of securities. Investments for which market quotations are not readily available are valued at fair value as determined in good faith pursuant to Rule
2a-5
under the 1940 Act. Fair value pricing may require subjective determinations about the value of a security or other asset. As a result, there can be no assurance that fair value pricing will result in adjustments to the prices of securities or other assets or that fair value pricing will reflect actual market value, and it is possible that the fair value determined for a security or other asset will be materially different from quoted or published prices, from the prices used by others for the same security or other asset and/or from the value that actually could be or is realized upon the sale of that security or other asset.
Zero-Coupon Bond,
Step-Ups
and
Securities Risk
The market prices of
zero-coupon,
step-ups
and
securities are generally more volatile than the prices of securities that pay interest periodically and in cash, and are likely to respond to changes in interest rates to a greater degree than other types of debt securities with similar maturities and credit quality. Because
zero-coupon
securities bear no interest, their prices are especially volatile, and because
zero-coupon
bondholders do not receive interest payments, the prices of
zero-coupon
securities generally fall more dramatically than those of bonds that pay interest on a current basis when interest rates rise. The market for
zero-coupon
and
securities may suffer decreased liquidity. In addition, as these securities may not pay cash interest, the Fund’s investment exposure to these securities and their risks, including credit risk, will increase during the time these securities are held in the Fund’s portfolio. Further, to maintain its qualification for treatment as a RIC and to avoid Fund-level U.S. federal income and/or excise taxes, the Fund is required to distribute to its shareholders any income it is deemed to have received in respect of such investments, notwithstanding that cash has not been received currently, and the value of
interest. Consequently, the Fund may have to
dispose of portfolio securities under disadvantageous circumstances to generate the cash, or may have to leverage itself by borrowing the cash to satisfy this distribution requirement. The required distributions, if any, would result in an increase in the Fund’s exposure to these securities. Zero coupon bonds,
step-ups
and
securities allow an issuer to avoid or delay the need to generate cash to meet current interest payments and, as a result, may involve greater credit risk than bonds that pay interest currently or in cash. The Fund would be required to distribute the income on these instruments as it accrues, even though the Fund will not receive the income on a current basis or in cash. Thus, the Fund may sell other investments, including when it may not be advisable to do so, to make income distributions to its shareholders.
Use of Derivatives
A Fund may use derivative instruments for other purposes, including to seek to increase liquidity, provide efficient portfolio management, broaden investment opportunities (including taking short or negative positions), implement a tax or cash management strategy, gain exposure to a particular security or segment of the market, modify the effective duration of the Fund’s portfolio investments and/or enhance total return.
|
|
|
|
|
|
| |
264 |
|
PIMCO CLOSED-END FUNDS |
|
|
|
|
|
|
|
|
| |
Risk Management Strategies 1 |
|
| |
(Unaudited) |
A Fund may (but is not required to) use various investment strategies to attempt to hedge exposure to
reduce
the risk of price fluctuations of its portfolio securities, the risk of loss, and to preserve capital. Derivatives strategies and instruments that a Fund may use include, among others, reverse repurchase agreements; interest rate swaps; total return swaps; credit default swaps; basis swaps; other types of swap agreements or options thereon; dollar rolls/buybacks; futures and forward contracts (including foreign currency exchange contracts); short sales; options on financial futures; options based on either an index of municipal securities or taxable debt securities whose prices, PIMCO believes, correlate with the prices of the Fund’s investments; other derivative transactions; loans of portfolio securities and when-issued, delayed delivery and forward commitment transactions. Income earned by a Fund from its hedging and related transactions may be subject to one or more special U.S. federal income tax rules that can affect the amount, timing and/or character of distributions to holders of the Fund’s Common Shares. For instance, many hedging activities will be treated as capital gain and, if not offset by net realized capital loss, will be distributed to shareholders in taxable distributions. If effectively used, hedging strategies will offset in varying percentages losses incurred on a Fund’s investments due to adverse interest rate changes. There is no assurance that these hedging strategies will be available at any time or that PIMCO will determine to use them for a Fund or, if used, that the strategies will be successful. PIMCO may determine not to engage in hedging strategies or to do so only in unusual circumstances or market conditions. In addition, a Fund may be subject to certain restrictions on its use of hedging strategies imposed by guidelines of one or more ratings agencies that may issue ratings on any preferred shares issued by the Fund.
A Fund may take certain actions if short-term interest rates increase or market conditions otherwise change (or the Fund anticipates such an increase or change) and the Fund’s leverage begins (or is expected) to adversely affect holders of its Common Shares. In order to attempt to offset such a negative impact of leverage on holders of Common Shares, a Fund may shorten the average maturity or duration of its investment portfolio (by investing in short-term, high quality securities or implementing certain hedging strategies). Should a Fund issue preferred shares, the Fund also may attempt to reduce leverage by redeeming or otherwise purchasing preferred shares or by reducing any holdings in other instruments that create leverage. The success of any such attempt to limit leverage risk depends on PIMCO’s ability to accurately predict interest rate or other market changes. Because of the difficulty of making such predictions, a Fund may not be successful in managing its interest rate exposure in the manner described above. In addition, each Fund has adopted certain investment limitations designed to limit investment risk. See “Fundamental Investment Restrictions” below for a description of these limitations.
1
Defined terms used and not otherwise defined in this section have the meanings set forth in the Principal Investment Strategies and Principal Risks of the Funds sections.
|
|
|
|
|
|
|
|
|
|
|
|
| |
| |
|
|
ANNUAL REPORT |
|
|
| |
|
|
JUNE 30, 2025 |
|
|
265 |
The following table is furnished in response to requirements of the SEC. It is designed to illustrate the effects of
leverage
through the use of senior securities, as that term is defined under Section 18 of the 1940 Act, on Common Share total return, assuming investment portfolio total returns (consisting of income and changes in the value of investments held in a Fund’s portfolio) of
-10%,
-5%,
0%, 5% and 10%. The table below reflects each Fund’s continued use of reverse repurchase agreements as of June 30, 2025 as a percentage of total average managed assets (including assets attributable to such leverage), the estimated annual effective interest expense rate payable by the Fund on such instruments (based on market conditions, as applicable, averaged over the fiscal year ended June 30, 2025, and the annual return that the Fund’s portfolio must experience (net of expenses) in order to cover such costs of the reverse repurchase agreements based on such estimated annual effective interest expense rate. The information below does not reflect any Fund’s use of certain other forms of economic leverage achieved through the use of other
instruments or transactions not considered to be senior securities under the 1940 Act, such as covered credit default swaps or other derivative instruments.
The assumed investment portfolio returns in the table below are hypothetical figures and are not necessarily indicative of the investment portfolio returns experienced or expected to be experienced by the Fund. Your actual returns may be greater or less than those appearing below. In addition, actual borrowing expenses associated with reverse repurchase agreements (or dollar rolls/buybacks or borrowings, if any) used by the Fund may vary frequently and may be significantly higher or lower than the rate used for the example below.
The information below does not reflect a Fund’s use of certain other forms of economic leverage achieved through the use of other instruments or transactions not considered to be senior securities under the 1940 Act, such as total return swaps or other derivative instruments.
|
|
|
|
|
|
|
|
|
|
|
|
|
|
|
|
|
|
|
|
|
|
|
|
|
|
|
|
|
|
|
|
| |
| |
|
|
|
|
|
|
|
PIMCO Global StocksPLUS & Income Fund (PGP) |
|
|
PIMCO
Strategic
Income
Fund,
Inc.
(RCS) |
|
|
PIMCO
Access
Income
Fund
(PAXS) |
|
|
PIMCO
Dynamic
Income
Fund
(PDI) |
|
|
PIMCO
Dynamic
Income
Opportunities
Fund (PDO) |
|
|
PIMCO
Dynamic
Income
Strategy
fund
(PDX) |
|
|
|
|
|
|
|
|
|
| |
Reverse Repurchase Agreements as a Percentage of Total Managed Assets (Including Assets Attributable to Reverse Repurchase Agreements) |
|
|
|
| |
|
36.17 |
% |
|
|
16.21 |
% |
|
|
32.20 |
% |
|
|
39.75 |
% |
|
|
33.48 |
% |
|
|
37.18 |
% |
|
|
22.60 |
% |
|
|
|
|
|
|
|
|
| |
Estimated Annual Effective Interest Expense Rate Payable by Fund on Reverse Repurchase Agreements |
|
|
|
| |
|
5.80 |
% |
|
|
5.35 |
% |
|
|
5.16 |
% |
|
|
5.61 |
% |
|
|
5.46 |
% |
|
|
5.62 |
% |
|
|
5.25 |
% |
|
|
|
|
|
|
|
|
| |
Annual Return Fund Portfolio Must Experience (net of expenses) to Cover Estimated Annual Effective Interest Expense Rate on Reverse Repurchase Agreements |
|
|
|
| |
|
2.10 |
% |
|
|
0.87 |
% |
|
|
1.66 |
% |
|
|
2.23 |
% |
|
|
1.83 |
% |
|
|
2.09 |
% |
|
|
1.19 |
% |
|
|
|
|
|
|
|
|
| |
Common Share Total Return for (10.00)% Assumed Portfolio Total Return |
|
|
|
| |
|
(18.95 |
)% |
|
|
(12.97 |
)% |
|
|
(17.20 |
)% |
|
|
(20.29 |
)% |
|
|
(17.78 |
)% |
|
|
(19.24 |
)% |
|
|
(14.45 |
)% |
|
|
|
|
|
|
|
|
| |
Common Share Total Return for (5.00)% Assumed Portfolio Total Return |
|
|
|
| |
|
(11.12 |
)% |
|
|
(7.00 |
)% |
|
|
(9.83 |
)% |
|
|
(12.00 |
)% |
|
|
(10.26 |
)% |
|
|
(11.28 |
)% |
|
|
(7.99 |
)% |
|
|
|
|
|
|
|
|
| |
Common Share Total Return for 0.00% Assumed Portfolio Total Return |
|
|
|
| |
|
(3.29 |
)% |
|
|
(1.03 |
)% |
|
|
(2.45 |
)% |
|
|
(3.70 |
)% |
|
|
(2.75 |
)% |
|
|
(3.32 |
)% |
|
|
(1.53 |
)% |
|
|
|
|
|
|
|
|
| |
Common Share Total Return for 5.00% Assumed Portfolio Total Return |
|
|
|
| |
|
4.55 |
% |
|
|
4.93 |
% |
|
|
4.92 |
% |
|
|
4.60 |
% |
|
|
4.77 |
% |
|
|
4.64 |
% |
|
|
4.93 |
% |
|
|
|
|
|
|
|
|
| |
Common Share Total Return for 10.00% Assumed Portfolio Total Return |
|
|
|
| |
|
12.38 |
% |
|
|
10.90 |
% |
|
|
12.30 |
% |
|
|
12.90 |
% |
|
|
12.29 |
% |
|
|
12.59 |
% |
|
|
11.39 |
% |
Common Share total return is composed of two elements - the distributions paid by a Fund to holders of Common Shares (the amount of which is largely determined by the net investment income of the Fund after paying dividends on preferred shares, if any, and expenses on any forms of leverage outstanding, including TOBs) and gains or losses on the value of the securities and other instruments the Fund owns. As required by SEC rules, the table assumes that a Fund is more likely to suffer capital losses than to enjoy capital appreciation. For example, to assume a portfolio total return of 0%, a Fund must assume that the income it receives on its investments is entirely offset by losses in the value of those investments. This table reflects hypothetical performance of a Fund’s portfolio and not the actual performance of the Fund’s Common Shares, the value of which is determined by market forces and other factors.
Should a Fund elect to add additional leverage to its portfolio, any benefits of
such
additional leverage cannot be fully achieved until the proceeds resulting from the use of such leverage have been received by the Fund and invested in accordance with the Fund’s investment objectives and policies. As noted above, a Fund’s willingness to use additional leverage, and the extent to which leverage is used at any time, will depend on many factors, including, among other things, PIMCO’s assessment of the yield curve environment, interest rate trends, market conditions and other factors.
2
Defined terms used and not otherwise defined in this section have the meanings set forth in the Principal Investment Strategies and Principal Risks of the Funds sections.
|
|
|
|
|
|
| |
266 |
|
PIMCO CLOSED-END FUNDS |
|
|
|
|
|
|
|
|
| |
Fundamental Investment Restrictions 3 |
|
| |
(Unaudited) |
For purposes of this section, “majority of the outstanding,” when used with respect to particular shares of a Fund (whether voting together as a single class or voting as separate classes), has the meaning set forth in the 1940 Act.
PCM Fund, Inc.
The Fund’s investment objectives and the following investment restrictions are fundamental policies, and, except as described below, the Fund may not, without the approval of the holders of a majority of the Fund’s outstanding Common Shares and, if issued, preferred shares voting together as a single class, and of the holders of a majority of the outstanding preferred shares voting as a separate class, change its investment objectives or:
(1) |
Issue senior securities (including borrowing money for other than temporary purposes) in excess of the limits set forth in the 1940 Act; or pledge its assets other than to secure such issuances or borrowings or in connection with permitted transactions involving derivative instruments, when-issued and forward commitment transactions and other permitted investment strategies. |
(2) |
Make investments for the purpose of exercising control or management. |
(3) |
Purchase or sell real estate, commodities or commodity contracts; provided that the Fund may invest in securities secured by real estate or interests therein or issued by companies that invest in real estate or interests therein, and the Fund may purchase and sell financial futures contracts and options thereon and other derivative instruments. |
(4) |
Underwrite securities of other issuers except insofar as the Fund may be deemed an underwriter under the Securities Act of 1933 in selling portfolio securities. |
(5) |
Make loans to other persons, except (i) to the extent that the Fund may be deemed to be making loans by purchasing debt securities and entering into repurchase agreements in accordance with its investment objectives, policies and limitations and (ii) the Fund may lend its portfolio securities. |
(6) |
Purchase any securities on margin, except that the Fund may obtain such short-term credit as may be necessary for the clearance of purchases and sales of portfolio securities, and may make margin deposits in connection with the entry into of positions in financial future contracts and options thereon and other derivative instruments. |
(7) |
Make short sales of securities in a manner inconsistent with the 1940 Act, as it may be interpreted from time to time, or in excess of 25% of the value of the Fund’s total assets. |
In addition, as a matter of fundamental policy:
(8) |
The Fund, under normal circumstances, will invest at least 25% of its total assets (i.e., concentrate) in privately-issued mortgage-related securities not issued or guaranteed as to principal or interest by the U.S. Government or its agencies or instrumentalities. The Fund may not purchase any security if as a result 25% or more of the Fund’s total assets (taken at current value at the time of investment) (i.e., concentrate) would be invested in a single industry (for purposes of this restriction, investment companies are not considered to be part of any industry). |
In addition, the Fund will not, with respect to 75% of its total assets, purchase the securities of any issuer, except securities issued or guaranteed by the U.S. Government or any of its agencies or instrumentalities or securities issued by other investment companies, if, as a result, (i) more than 5% of the Fund’s total assets would be invested in the securities of that issuer, or (ii) the Fund would hold more than 10% of the outstanding voting securities of that issuer.
PIMCO Global StocksPLUS
& Income Fund
Except as described below, the Fund, as a fundamental policy, may not, without the approval of the holders of a majority of the outstanding Common Shares, voting together as a single class:
(1) |
Concentrate its investments in a particular “industry,” as that term is used in the 1940 Act, as interpreted, modified or otherwise permitted from time to time by regulatory authority having jurisdiction. |
(2) |
Purchase or sell real estate, although it may purchase securities secured by real estate or interests therein, or securities issued by companies that invest in real estate, or interests therein. |
(3) |
Purchase or sell commodities or commodities contracts or oil, gas or mineral programs. This restriction shall not prohibit the Fund, subject to certain restrictions, from purchasing, selling or entering into futures contracts, options on futures contracts, forward contracts, or any interest rate, securities-related or other derivative instrument, including swap agreements and other derivative instruments, subject to compliance with any applicable provisions of the federal securities or commodities laws. |
(4) |
Borrow money or issue any senior security, except to the extent permitted under the 1940 Act, as interpreted, modified or otherwise permitted from time to time by regulatory authority having jurisdiction. |
(5) |
Make loans, except to the extent permitted under the 1940 Act, as interpreted, modified or otherwise permitted from time to time by regulatory authority having jurisdiction. |
|
|
|
|
|
|
|
|
|
|
|
|
| |
| |
|
|
ANNUAL REPORT |
|
|
| |
|
|
JUNE 30, 2025 |
|
|
267 |
|
|
|
|
| |
Fundamental Investment Restrictions 3 |
|
|
|
|
(6) |
Act as an underwriter of securities of other issuers, except to the extent that in connection with the disposition of portfolio securities, it may be deemed to be an underwriter under the federal securities laws. |
In addition, the Fund will not, with respect to 75% of its total assets, purchase the securities of any issuer, except securities issued or guaranteed by the U.S. Government or any of its agencies or instrumentalities or securities issued by other investment companies, if, as a result, (i) more than 5% of the Fund’s total assets would be invested in the securities of that issuer, or (ii) the Fund would hold more than 10% of the outstanding voting securities of that issuer.
PIMCO Strategic Income Fund, Inc.
Except as described below, the Fund, as a fundamental policy, may not, without the approval of the holders of a majority of the outstanding Common Shares, voting together as a single class:
(1) |
Purchase securities on margin, except that the Fund may obtain any short-term credits necessary for the clearance of purchases and sales of securities. For purposes of this restriction, the deposit or payment of initial or variation margin in connection with futures contracts or related options will not be deemed to be a purchase of securities on margin. |
(2) |
Borrow money, except that the Fund may engage in reverse repurchase agreements and dollar roll transactions and may borrow in an amount not exceeding 33 1/3% of the value of the Fund’s total assets (including the amount borrowed) valued at market, less liabilities (not including the amount borrowed) at the time the borrowing is made, and may use the proceeds of such borrowing for investment purposes. In addition, the Fund may borrow money for temporary or emergency purposes in an amount not exceeding 5% of the value of the Fund’s total assets (not including the amount borrowed) provided that the total amount borrowed by the Fund for any purpose does not exceed 33 1/3% of its total assets. |
(3) |
Pledge, hypothecate, mortgage, or otherwise encumber its assets except to secure borrowings and as margin or collateral for financial futures, swaps and other negotiable transactions in the market. |
(4) |
Underwrite the securities of other issuers, except insofar as the Fund may be deemed an underwriter in the course of disposing of portfolio securities. |
(5) |
Purchase or sell real estate or interests in real estate, except that the Fund may purchase and sell securities that are secured by real estate or interests in real estate and may purchase securities by companies that invest or deal in real estate. |
(6) |
Invest in commodities, except that the Fund may invest in futures contracts and options thereon, and options on currencies. |
(7) |
Make loans to others, except through the purchase of qualified debt obligations, the entry into repurchase agreements and loans of portfolio securities consistent with the Fund’s investment objectives and policies. |
(8) |
Invest in securities of other investment companies registered or required to be registered under the 1940 Act, except as they may be acquired as part of a merger, consolidation, reorganization, acquisition of assets or an offer of exchange, or to the extent permitted by the 1940 Act. |
(9) |
Purchase any securities which would cause more than 25% of the value of the Fund’s total assets at the time of purchase to be invested in the securities of issuers conducting their principal securities business activities in the same industry; provided that there shall be no limit on the purchase of U.S. government securities, including securities issued by any agency or instrumentality of the U.S. government, and related repurchase agreements. |
In addition, the Fund will not, with respect to 75% of its total assets, purchase the securities of any issuer, except securities issued or guaranteed by the U.S. Government or any of its agencies or instrumentalities or securities issued by other investment companies, if, as a result, (i) more than 5% of the Fund’s total assets would be invested in the securities of that issuer, or (ii) the Fund would hold more than 10% of the outstanding voting securities of that issuer.
PIMCO Dynamic Income Fund
The investment restrictions set forth below are each a fundamental policy of the Fund that may not be changed without the approval of the holders of a majority of the outstanding Common Shares, any outstanding preferred shares of beneficial interest voting together as a single class, and of the holders of a majority of any outstanding preferred shares of beneficial interest voting as a separate class. The Fund may not:
(1) |
Purchase any security if as a result 25% or more of the Fund’s total assets (taken at current value at the time of investment) would be invested in a single industry (for purposes of this restriction, investment companies are not considered to be part of any industry). As a fundamental policy, the Fund, under normal circumstances, will invest at least 25% of its total assets in mortgage-related securities not issued or guaranteed as to principal or interest by the U.S. Government or its agencies or instrumentalities and other investments that the Fund’s investment adviser or sub-adviser determines have the same primary economic characteristics. |
|
|
|
|
|
|
| |
268 |
|
PIMCO CLOSED-END FUNDS |
|
|
|
|
(2) |
Purchase or sell real estate, although it may purchase securities secured by real estate or interests therein, or securities issued by companies that invest in real estate, or interests therein. |
(3) |
Purchase or sell commodities or commodities contracts or oil, gas or mineral programs. This restriction shall not prohibit the Fund, subject to certain restrictions, from purchasing, selling or entering into futures contracts, options on futures contracts, forward contracts, or any interest rate, securities-related or other derivative instrument, including swap agreements and other derivative instruments, subject to compliance with any applicable provisions of the federal securities or commodities laws. |
(4) |
Borrow money or issue any senior security, except to the extent permitted under the 1940 Act and as interpreted, modified, or otherwise permitted from time to time by regulatory authority having jurisdiction. |
(5) |
Make loans, except to the extent permitted under the Investment Company Act of 1940, as amended, and as interpreted, modified, or otherwise permitted by regulatory authority having jurisdiction. |
(6) |
Act as an underwriter of securities of other issuers, except to the extent that in connection with the disposition of portfolio securities, it may be deemed to be an underwriter under the federal securities laws. |
In addition, the Fund will not, with respect to 75% of its total assets, purchase the securities of any issuer, except securities issued or guaranteed by the U.S. Government or any of its agencies or instrumentalities or securities issued by other investment companies, if, as a result, (i) more than 5% of the Fund’s total assets would be invested in the securities of that issuer, or (ii) the Fund would hold more than 10% of the outstanding voting securities of that issuer.
PIMCO Dynamic Income Opportunities Fund
The investment restrictions set forth below are each a fundamental policy of the Fund that may not, be changed without the approval of the holders of a majority of the Fund’s outstanding Common Shares and, if issued, preferred shares voting together as a single class, and of the holders of a majority of the outstanding preferred shares voting as a separate class. The Fund may not:
(1) |
Except for mortgage-related assets as described in the next sentence, purchase any security if as a result 25% or more of the Fund’s total assets (taken at current value at the time of investment) would be invested in a single industry (for purposes of this restriction, investment companies are not considered to be part of any industry). As a fundamental policy, the Fund will normally invest at least 25% of its total assets (i.e., concentrate) in mortgage-related assets issued by government agencies or |
| |
other governmental entities or by private originators or issuers, which for purposes of this investment restriction the Fund treats collectively as an industry or group of related industries. |
(2) |
Purchase or sell real estate, except to the extent permitted under the 1940 Act, as interpreted, modified, or otherwise permitted from time to time by regulatory authority having jurisdiction. |
(3) |
Purchase or sell commodities or commodities contracts or oil, gas or mineral programs, except to the extent permitted under the 1940 Act, as interpreted, modified, or otherwise permitted from time to time by regulatory authority having jurisdiction. This restriction shall not prohibit the Fund from purchasing, selling or entering into futures contracts, options on futures contracts, forward contracts, or any interest rate, securities-related or other derivative instrument, including swap agreements and other derivative instruments, subject to compliance with any applicable provisions of the federal securities or commodities laws. |
(4) |
Borrow money or issue any senior security, except to the extent permitted under the 1940 Act, as interpreted, modified, or otherwise permitted from time to time by regulatory authority having jurisdiction. |
(5) |
Make loans, except to the extent permitted under the 1940 Act, as interpreted, modified, or otherwise permitted from time to time by regulatory authority having jurisdiction. |
(6) |
Act as an underwriter of securities of other issuers, except to the extent that in connection with the disposition of portfolio securities, it may be deemed to be an underwriter under the federal securities laws. |
PIMCO Access Income Fund
The investment restrictions set forth below are each a fundamental policy of the Fund that may not be changed without the approval of the holders of a majority of the Fund’s outstanding Common Shares and, if issued, preferred shares voting together as a single class, and of the holders of a majority of any outstanding preferred shares voting as a separate class. The Fund may not:
(1) |
Except for real estate investments and mortgage-related assets as described in the next sentence, purchase any security if as a result 25% or more of the Fund’s total assets (taken at current value at the time of investment) would be invested in a single industry (for purposes of this restriction, investment companies are not considered to be part of any industry). As a fundamental policy, the Fund will normally invest at least 25% of its total assets (i.e., concentrate) in real estate investments and mortgage-related assets issued by government agencies or other governmental entities or by private originators or issuers, which for purposes of this investment restriction the Fund treats collectively as an industry or group of related industries. |
|
|
|
|
|
|
|
|
|
|
|
|
| |
| |
|
|
ANNUAL REPORT |
|
|
| |
|
|
JUNE 30, 2025 |
|
|
269 |
|
|
|
|
| |
Fundamental Investment Restrictions 3 |
|
|
|
|
(2) |
Purchase or sell real estate, except to the extent permitted under the 1940 Act, as interpreted, modified, or otherwise permitted from time to time by regulatory authority having jurisdiction. |
(3) |
Purchase or sell commodities or commodities contracts or oil, gas or mineral programs, except to the extent permitted under the 1940 Act, as interpreted, modified, or otherwise permitted from time to time by regulatory authority having jurisdiction. This restriction shall not prohibit the Fund, subject to restrictions described in the Prospectus and the Statement of Additional Information, from purchasing, selling or entering into futures contracts, options on futures contracts, forward contracts, or any interest rate, securities-related or other derivative instrument, including swap agreements and other derivative instruments, subject to compliance with any applicable provisions of the federal securities or commodities laws. |
(4) |
Borrow money or issue any senior security, except to the extent permitted under the 1940 Act, as interpreted, modified, or otherwise permitted from time to time by regulatory authority having jurisdiction. |
(5) |
Make loans, except to the extent permitted under the 1940 Act, as interpreted, modified, or otherwise permitted from time to time by regulatory authority having jurisdiction. |
(6) |
Act as an underwriter of securities of other issuers, except to the extent that in connection with the disposition of portfolio securities, it may be deemed to be an underwriter under the federal securities laws. |
PIMCO Dynamic Income Strategy Fund
For purposes of this section, “majority of the outstanding,” when used with respect to particular shares of the Fund (whether voting together as a single class or voting as separate classes), has the meaning set forth in the 1940 Act.
Except as described below, the Fund, as a fundamental policy, may not, without the approval of the holders of a majority of the Fund’s outstanding Common Shares and, if issued, preferred shares voting together as a single class, and of the holders of a majority of the outstanding preferred shares voting as a separate class:
(1) |
Concentrate its investments in a particular industry, as that term is used in the 1940 Act and as interpreted, modified or otherwise permitted by regulatory authority having jurisdiction, from time to time; except that the Fund will invest at least 25% of its total assets in the energy industry. |
(2) |
Purchase or sell real estate, although it may purchase securities (including municipal bonds) secured by real estate or interests therein, or securities issued by companies that invest in real estate, or interests therein. |
(3) |
Purchase or sell commodities or commodities contracts, except as permitted by the 1940 Act. This restriction shall not prohibit the Fund, subject to certain restrictions, from purchasing, selling, investing in or entering into currency and financial instruments and contracts in accordance with its investment objectives and policies, including, without limitation, structured notes, futures contracts, options on futures contracts, forward contracts, options on commodities, currencies, swaps and futures and any interest rate, securities-related or other derivative instruments, exchange-traded funds, investment pools and other instruments, regardless of whether such instrument is considered to be a commodity, subject to compliance with any applicable provisions of the federal securities or commodities laws. |
(4) |
Borrow money or issue any senior security, except to the extent permitted under the 1940 Act and as interpreted, modified, or otherwise permitted from time to time by regulatory authority having jurisdiction. |
(5) |
Make loans, except to the extent permitted under the 1940 Act, as interpreted, modified, or otherwise permitted from time to time by regulatory authority having jurisdiction. |
(6) |
Act as an underwriter of securities of other issuers, except to the extent that in connection with the disposition of portfolio securities, it may be deemed to be an underwriter under the federal securities laws. |
1 |
Defined terms used and not otherwise defined in this section have the meanings set forth in the Principal Investment Strategies and Principal Risks of the Fund sections. |
Other Information
Unless otherwise indicated, all limitations applicable to each Fund’s investments (as stated in this or other sections) apply only at the time a transaction is entered into. For example, any subsequent change in a rating assigned by any rating service to a security (or, if unrated, deemed by PIMCO to be of comparable quality), or change in the percentage of a Fund’s assets invested in certain securities or other instruments, or change in the average maturity or duration of a Fund’s investment portfolio, resulting from market fluctuations or other changes in a Fund’s total assets will not require the Fund to dispose of an investment.
From time to time, a Fund may voluntarily participate in actions (for example, rights offerings, conversion privileges, exchange offers, credit event settlements, etc.) including, but not limited to, where the issuer or counterparty offers securities or instruments to holders or counterparties, such as the Fund, and the acquisition is determined to be beneficial to Fund shareholders (“Voluntary Action”). Notwithstanding any percentage investment limitation listed under the “Fundamental Investment Restrictions” section or any percentage investment limitation of the 1940 Act or rules thereunder, if a Fund
|
|
|
|
|
|
| |
270 |
|
PIMCO CLOSED-END FUNDS |
|
|
|
|
has the opportunity to acquire a permitted security or instrument through a Voluntary Action, and the Fund will exceed a percentage investment limitation following the acquisition, it will not constitute a violation if, prior to the receipt of the securities or instruments and after announcement of the offering, the Fund sells an offsetting amount of assets that are subject to the investment limitation in question at a price at least equal to the value of the securities or instruments to be acquired.
Unless otherwise indicated, all percentage limitations on Fund investments (as stated herein) that are not: (i) specifically included in the “Fundamental Investment Restrictions” section; or (ii) imposed by the 1940 Act, rules thereunder, the Code or related regulations (the “Elective Investment Restrictions”), will apply only at the time of investment unless the acquisition is a Voluntary Action. For the avoidance of doubt, unless otherwise stated, all percentage limitations on Fund investments that are (i) specifically included in the “Fundamental Investment Restrictions” section; or (ii) Elective Investment Restrictions, will apply at the time of investment. In addition, and notwithstanding the foregoing, for purposes of this policy, certain
Non-Fundamental
Investment Restrictions, as noted above, are also considered Elective Investment Restrictions. The percentage limitations and absolute prohibitions with respect to Elective Investment Restrictions are not applicable to the Fund’s acquisition of securities or instruments through a Voluntary Action. Certain percentage limitations or absolute prohibitions stated in certain Elective Investment Restrictions by their terms apply only with respect to specific securities or instruments as opposed to asset classes or economic exposures represented by such securities or instruments; for purposes of applying such limitations or prohibitions, a Fund may not count investments in derivatives or other instruments that are not the specific securities or instruments limited or prohibited by the express terms of the Elective Investment Restriction. In such cases, a Fund may obtain greater economic exposure to asset classes represented by such specific securities or instruments because such exposure is not restricted by the express terms of the Elective Investment Restriction.
A Fund may engage in roll-timing strategies where the Fund seeks to extend the expiration or maturity of a position, such as a forward contract, futures contract or
transaction, on an underlying asset by closing out the position before expiration and contemporaneously opening a new position with respect to the same underlying asset that has substantially similar terms except for a later expiration date. Such “rolls” enable the Fund to maintain continuous investment exposure to an underlying asset beyond the expiration of the initial position without delivery of the underlying asset. Similarly, as certain standardized swap agreements transition from OTC trading to mandatory exchange-trading and clearing due to the implementation of Dodd-Frank Act regulatory
requirements, the Fund may “roll” an existing OTC swap agreement by closing out the position before expiration and contemporaneously entering into a new exchange-traded and cleared swap agreement on the same underlying asset with substantially similar terms except for a later expiration date. These types of new positions opened contemporaneous with the closing of an existing position on the same underlying asset with substantially similar terms are collectively referred to as “Roll Transactions.” Elective Investment Restrictions (defined in the preceding paragraph), which normally apply at the time of investment, do not apply to Roll Transactions (although Elective Investment Restrictions will apply to the Fund’s entry into the initial position). In addition and notwithstanding the foregoing, for purposes of this policy, those
Non-Fundamental
Investment Restrictions that are considered Elective Investment Restrictions for purposes of the policy on Voluntary Actions (described in the preceding paragraph) are also Elective Investment Restrictions for purposes of this policy on Roll Transactions. The Fund will test for compliance with Elective Investment Restrictions at the time of the Fund’s initial entry into a position, but the percentage limitations and absolute prohibitions set forth in the Elective Investment Restrictions are not applicable to the Fund’s subsequent acquisition of securities or instruments through a Roll Transaction.
PIMCO employs and/or relies on algorithms, models or other systems in connection with many of its investment activities, including research, forecasting, selection, optimization, order routing, execution, and allocation processes (together, “Systems”). These Systems, which may be employed together and operate without human intervention, rely heavily on the use of proprietary and nonproprietary data, software, hardware, and intellectual property, including data, software and hardware that may be licensed or otherwise obtained from third parties. The use of such Systems has inherent limitations and risks. Although PIMCO seeks to develop and use Systems appropriately and effectively, there can be no assurance that it will successfully do so. The Systems are extremely complex and may involve the use of financial, economic, econometric and statistical theories, research and modeling and related translation into computer code. Errors may occur in the design, writing, testing, monitoring, and/or implementation of Systems, including in the manner in which Systems function together. The effectiveness of Systems may diminish over time, including as a result of market changes and changes in the behavior of market participants. The quality of the resulting analysis, investment selections, portfolio construction, asset allocations, proposed trades, risk management, allocations of investment opportunities and trading strategies depends on a number of factors including the accuracy and quality of data inputs into the Systems, including through automated and manual integration of completed transactions, the mathematical and analytical assumptions and underpinnings of the Systems’ coding, the accuracy in translating those analytics into program code or
|
|
|
|
|
|
|
|
|
|
|
|
| |
| |
|
|
ANNUAL REPORT |
|
|
| |
|
|
JUNE 30, 2025 |
|
|
271 |
|
|
|
|
| |
Fundamental Investment Restrictions 3 |
|
|
|
(Unaudited) |
interpreting the output of a System by another System in order to facilitate a transaction, change in market conditions, the successful integration of the various Systems into the portfolio selection and trading process and whether actual market events correspond to one or more assumptions underlying the Systems. Accordingly, Systems are subject to errors and/or mistakes (“System Incidents”) that may adversely impact the Fund.
PIMCO relies on quantitative models, data, and trading algorithms supplied by third parties for certain funds. Such models, data and algorithms are used to construct sets of transactions and investments, to implement investment decisions, and to provide risk management insights. When the third-party models, data or algorithms prove to be incorrect or incomplete, any decisions or investments made in reliance thereon expose applicable funds to additional risks. For these reasons, and subject to PIMCO satisfying its standard of care, PIMCO generally will not compensate applicable funds for any losses associated with third-party models, data, or algorithms, and applicable funds will bear all such losses. PIMCO, subject to satisfying its standard of care, generally does not expect to disclose certain such events to applicable funds.
The Systems rely heavily on appropriate data inputs, and it is impossible and impracticable to factor all relevant, available data into the Systems. PIMCO will use its discretion to determine what data to gather and what subset of data the Systems utilize. PIMCO has full discretion to select the data it utilizes and may elect to use or may refrain from using any specific data or type of data in the Systems. The data used in the development of Systems may not be the most accurate data available or free of errors. Most Systems require continual monitoring and enhancements, and there is no guarantee that such monitoring and enhancements will be successful or that Systems will operate as intended. PIMCO has adopted policies and procedures that it believes are reasonably designed to prevent, detect, escalate and remediate System Incidents. PIMCO will address System Incidents in accordance with this policy but there is no guarantee that measures taken to address a System Incident will be successful.
PIMCO has policies and procedures that address identification and correction of errors that may occur in connection with PIMCO’s management of the Funds and other client accounts (“Trade Errors”). PIMCO generally does not classify System Incidents to be Trade Errors and applicable funds generally will bear all losses associated with System Incidents, subject to PIMCO satisfying its standard of care. Further, PIMCO generally does not expect to disclose System Incidents to the Funds.
Where applicable, PIMCO considers relevant Environmental, Social and Governance (“ESG”) factors in its investment research process with
the goal of enhancing risk-adjusted returns. Integrating relevant factors into the evaluation process does not mean that ESG related information is the sole or primary consideration for an investment decision. PIMCO’s portfolio managers and analyst teams consider a variety of factors including the materiality of those factors to make investment decisions. Where material, ESG factors can be important considerations when evaluating long-term investment opportunities and risks for asset classes, where applicable. The materiality of ESG considerations to investment decisions typically varies across asset classes, strategies, products and valuations.
3
Defined terms used and not otherwise defined in this section have the meanings set forth in the Principal Investment Strategies and Principal Risks of the Fund sections.
|
|
|
|
|
|
| |
272 |
|
PIMCO CLOSED-END FUNDS |
|
|
|
|
The charts below identify the Trustees and Officers of the Funds. Unless otherwise indicated, the business address of all persons below is c/o Pacific Investment Management Company LLC, 1633 Broadway, New York, New York 10019.
A list of officers and trustees of PIMCO containing information as to any business, profession, vocation, or employment of a substantial nature engaged in by such officers and directors during the past two years is included in the most recent Form ADV filed by PIMCO pursuant to the Investment Advisers Act of 1940.
A Fund’s Statement of Additional Information includes more information about the Trustees and Officers. To request a free copy, call PIMCO at (844)
33-PIMCO.
|
|
|
|
|
|
|
|
|
|
| |
|
|
Position(s)
Held
with the
Fund |
|
Term of
Office and
Length of
Time Served** |
|
Principal Occupation(s)
During the Past 5 Years |
|
Number
of Portfolios
in Fund
Complex
Overseen by
Trustee*** |
|
Other
Directorships
Held by
Trustee
During the
Past 5 Years |
|
|
|
|
|
|
|
| |
| |
|
Chair of the Board, Trustee/Director |
|
Trustee/Director of PCM, PGP and RCS since 2011, Trustee of PDI since 2012, Trustee of PDX since 2019, Trustee of PDO since 2021 and Trustee of PAXS since 2022, expected to stand for re-election at the annual meeting of shareholders held during the 2025-2026 fiscal year for PAXS, 2026-2027 fiscal year for PCM, PDI and RCS, and the 2027-2028 fiscal year for PGP, PDO, and PDX. |
|
Advisory Director, Morgan Stanley & Co., Inc. (since 1996); Member, Circle Financial Group (since 2009); Member, Council on Foreign Relations (since 2013); Trustee, Smith College (since 2017); Director, Watford Re (since 2017); and Director, Cadre Inc., a manufacturer of safety equipment (since 2022). Formerly, Co-Chair Special Projects Committee, Memorial Sloan Kettering (2005-2015); Trustee, Stanford University (2010-2015); Principal, LaLoop LLC, a retail accessories company (1999-2014); Director, Helena Rubenstein Foundation (1997-2010); and Director, Armor Holdings (2002-2010). |
|
30 |
|
Trustee, Allianz Funds (2011-2021); Trustee, Virtus Funds
(2021-Present). |
|
|
|
|
|
| |
| |
|
Trustee/Director |
|
Trustee/Director of PCM, PDI, PDX, PGP and RCS since 2019, Trustee of PDO since 2021 and Trustee of PAXS since 2022, expected to stand for re-election at the annual meeting of shareholders held during the 2027-2028 fiscal year for PAXS, RCS and PCM, the 2026-2027 fiscal year for PDO, and the 2025-2026 fiscal year for PGP and PDX. |
|
Retired Partner, Simpson Thacher & Bartlett LLP (law firm)(1989-2018); Director, Girl Scouts of Greater New York, Inc. (since 2016); and Trustee, Natural Resources Defense Council, Inc. (since 2013). |
|
30 |
|
Trustee, Allianz Funds (2019-2021); Trustee, Virtus Funds (2021-Present). |
|
|
|
|
|
| |
| |
|
Trustee/Director |
|
Trustee/Director since 2022, expected to stand for re-election at the annual meeting of shareholders held during the 2026-2027 fiscal year for PGP and PDX, the 2027-2028 fiscal year for PDI and PAXS, and the 2025-2026 fiscal year for PCM, PDO, and RCS. |
|
Director (since 2013) and President (since 2020), Five Colleges, Inc., consortium of liberal arts colleges and universities; President Emerita, Smith College (since 2023). Formerly, President, Smith College (2013-2023); Director, American Council on Education Board of Directors, (2015-2019); Director, Consortium on Financing Higher Education Board of Directors (2015-2019); Director, edX Board of Directors, online course provider (2012-2013); Director, Bellwether Education Partners Board, national nonprofit organization (2010-2013); Dean, Harvard Graduate School of Education (2006-2013); and Trustee, Tufts University (2007-2013). |
|
30 |
|
None |
|
|
|
|
|
|
|
|
|
|
|
|
| |
| |
|
|
ANNUAL REPORT |
|
|
| |
|
|
JUNE 30, 2025 |
|
|
273 |
|
|
|
|
|
|
|
|
|
|
| |
|
|
Position(s)
Held
with the
Fund |
|
Term of
Office and
Length of
Time Served** |
|
Principal Occupation(s)
During the Past 5 Years |
|
Number
of Portfolios
in Fund
Complex
Overseen by
Trustee*** |
|
Other
Directorships
Held by
Trustee
During the
Past 5 Years |
|
|
|
|
|
| |
| |
|
Trustee/Director |
|
Trustee/Director of RCS, PCM and PGP since 2010, Trustee of PDI since 2012, Trustee of PDX since 2019, Trustee of PDO since 2021 and Trustee of PAXS since 2022, expected to stand for re-election at the annual meeting of shareholders held during the 2026-2027 fiscal year for PCM, PAXS, PDO and RCS, the 2027-2028 fiscal year for PDI and PDX, and the 2025-2026 fiscal year for PGP. |
|
Director, Victory Capital Holdings, Inc., an asset management firm (since 2013). Formerly, Adjunct Professor, New York University Stern School of Business (2011-2020); Lecturer, Stanford University Graduate School of Business (2013-2020); Advisory Director (formerly Vice Chairman), Roundtable Investment Partners (2009-2018); Member of Board of Overseers, NYU Langone Medical Center (2015-2016); Trustee, American Museum of Natural History (2005-2015); Trustee, NYU Langone Medical Center (2007-2015); and Vice Chairman (formerly, Chairman and President), U.S. Trust (formerly, Private Bank of Bank of America, the predecessor entity of U.S. Trust) (2001-2008). |
|
30 |
|
Trustee, Allianz Funds (2010-2021); Chairman of the Board of Trustees, Virtus Closed-End Funds (2021-2023). |
|
|
|
|
|
| |
| |
|
Trustee/Director |
|
Trustee/Director of PDI, PDX, PFN, PGP and RCS since 2021 and Trustee of PCM, PAXS and PDO since 2022, expected to stand for re-election at the annual meeting of shareholders held during the 2027-2028 fiscal year for PCM, PAXS, PDX and PGP and the 2025-2026 fiscal year for PDI, PDO and RCS. |
|
Founder and Managing Director, Grace Global Capital LLC, a strategic advisory firm to the insurance industry (since 2006); Director, The Doctors Company, a medical malpractice insurance company (since 2020); Director, Link Logistics REIT, a real estate company (since 2021); Director and Member of the Investment & Risk Committee, Resolution Life Group Holdings, a global life insurance group (since 2021); Director, Wharton Graduate Executive Board; Director, Blackstone Private Equity Strategies Fund L.P. (since 2023); and Director, Blackstone Infrastructure Strategies Fund, L.P. (since 2024). Formerly, Chief Financial Officer, ShoulderUp Technology Acquisition Corp, a special purpose acquisition company (2021-2023); Director, Resolution Holdings (2015-2019); Director and Member of the Audit Committee and the Wealth Solutions Advisory Committee, M Financial Group, a life insurance company (2015-2021); Chief Financial Officer, Athena Technology Acquisition Corp, a special purpose acquisition company (2021-2022); and Director, SBLI USA, a life insurance company (2015-2018). |
|
30 |
|
None |
|
|
|
|
|
|
|
| |
| |
|
Trustee/Director |
|
Trustee since 2023; expected to stand for election at the annual meeting of shareholders held during the 2027-2028 fiscal year for PCM, PGP, and RCS and during 2026-2027 for PAXS, PDI, PDO, and during 2025-2026 for PDX. |
|
Managing Director, Head of Public Policy, PIMCO (since 2007); Institutional Account Manager, PIMCO (2007-2010); Legislative Aide, House of Representatives (2003-2005); and Investment Banking Analyst, Morgan Stanley (2000-2003). |
|
30 |
|
Member of the Board of Directors, Covenant House New York (2021-Present); Member of the Board, Securities Industry and Financial Markets Association (2022-Present) |
|
|
|
|
|
| |
| |
|
Trustee/Director |
|
Trustee/Director since 2024, expected to stand for re-election at the annual meeting of shareholders held during the 2025-2026 fiscal year for PCM, PAXS, and PDI, during the 2026-2027 fiscal year for PGP, RCS, and PDX, and during the 2027-2028 fiscal year for PDO. |
|
Consultant, PIMCO (2023-present); Global General Counsel, PIMCO (2006-2023); General Counsel and Chief Operating Officer, Allianz Asset Management of America (2001-2006). |
|
30 |
|
None |
* |
“Independent Trustees” are those Trustees who are not “interested persons” (as defined in Section 2(a)(19) of the 1940 Act). |
** |
Under each Fund’s Amended and Restated Agreement and Declaration of Trust, a Trustee serves until his or her retirement, resignation or replacement. |
*** |
The Term “Fund Complex” as used herein includes the Funds and any other registered investment company (i) that holds itself out to investors as a related company for purposes of investment and investor services; or (ii) for which PIMCO or an affiliate of PIMCO serves as primary investment adviser. |
**** |
Ms. Cantrill and Mr. Flattum are each an “interested person” of the Funds, as defined in Section 2(a)(19) of the Act, due to their affiliation with PIMCO and its affiliates. Their business address is c/o Pacific Investment Management Company LLC, 650 Newport Center Drive, Newport Beach, CA 92660. |
|
|
|
|
|
|
| |
274 |
|
PIMCO CLOSED-END FUNDS |
|
|
|
|
|
|
|
|
|
|
| |
| |
|
|
|
|
Term of
Office and
Length of
Time Served |
|
Principal Occupation(s) During the Past 5 Years |
|
|
|
| |
| |
|
President |
|
Since 2024 |
|
Executive Vice President and Head of Americas Operations – Client, Legal and Funds; Deputy General Counsel, PIMCO. President, PIMCO-Managed Funds, PIMCO Funds, PIMCO Variable Insurance Trust, PIMCO ETF Trust, PIMCO Equity Series, PIMCO Equity Series VIT and PIMCO Flexible Real Estate Income Fund. |
|
|
|
| |
| |
|
Chief Compliance Officer |
|
Since 2018 |
|
Executive Vice President and Deputy Chief Compliance Officer, PIMCO. Chief Compliance Officer, PIMCO-Managed Funds, PIMCO Funds, PIMCO Variable Insurance Trust, PIMCO ETF Trust, PIMCO Equity Series, PIMCO Equity Series VIT, PIMCO Flexible Real Estate Income Fund and PIMCO Capital Solutions BDC Corp. |
|
|
|
| |
| |
|
Chief Legal Officer and Secretary |
|
Chief Legal Officer - Since 2019 |
|
Executive Vice President and Deputy General Counsel, PIMCO. Chief Legal Officer and Secretary, PIMCO-Managed Funds, PIMCO Flexible Real Estate Income Fund and PIMCO Capital Solutions BDC Corp. Chief Legal Officer and Secretary, PIMCO Funds, PIMCO Variable Insurance Trust, PIMCO ETF Trust, PIMCO Equity Series and PIMCO Equity Series VIT. |
|
|
|
| |
| |
|
Senior Vice President |
|
Since 2019 |
|
Managing Director and Co-Chief Operating Officer, PIMCO. Senior Vice President, PIMCO-Managed Funds, PIMCO Funds, PIMCO Variable Insurance Trust, PIMCO ETF Trust, PIMCO Equity Series and PIMCO Equity Series VIT. Formerly, Chief Administrative Officer, PIMCO. |
|
|
|
| |
| |
|
Vice President |
|
Since 2022 |
|
Senior Vice President, PIMCO. Vice President, PIMCO-Managed Funds, PIMCO Funds, PIMCO Variable Insurance Trust, PIMCO ETF Trust, PIMCO Equity Series, PIMCO Equity Series VIT, PIMCO Flexible Real Estate Income Fund and PIMCO Capital Solutions BDC Corp. |
|
|
|
| |
| |
|
Vice President |
|
Since 2024 |
|
Senior Vice President, PIMCO. Vice President, PIMCO-Managed Funds, PIMCO Funds, PIMCO Variable Insurance Trust, PIMCO ETF Trust, PIMCO Equity Series, PIMCO Equity Series VIT and PIMCO Flexible Real Estate Income Fund. |
|
|
|
| |
| |
|
Vice President |
|
Since 2024 |
|
Senior Vice President, PIMCO. Vice President, PIMCO-Managed Funds, PIMCO Funds, PIMCO Variable Insurance Trust, PIMCO ETF Trust, PIMCO Equity Series, PIMCO Equity Series VIT, PIMCO Flexible RealEstate Income Fund and PIMCO Capital Solutions BDC Corp. |
|
|
|
| |
| |
|
Vice President |
|
Since 2024 |
|
Vice President Since 2023 Senior Vice President, PIMCO. Vice President, PIMCO-Managed Funds, PIMCO Funds, PIMCO Variable Insurance Trust, PIMCO ETF Trust, PIMCO Equity Series, and PIMCO Equity Series VIT. |
|
|
|
| |
| |
|
Vice President |
|
Since 2024 |
|
Vice President, PIMCO. Vice President, PIMCO-Managed Funds, PIMCO Funds, PIMCO Variable Insurance Trust, PIMCO ETF Trust, PIMCO Equity Series, PIMCO Equity Series VIT and PIMCO Flexible Real Estate Income Fund. |
|
|
|
| |
| |
|
Vice President |
|
Since 2022 |
|
Senior Vice President, PIMCO. Vice President, PIMCO-Managed Funds, PIMCO Funds, PIMCO Variable Insurance Trust, PIMCO ETF Trust, PIMCO Equity Series, PIMCO Equity Series VIT, PIMCO Flexible Real Estate Income Fund and PIMCO Capital Solutions BDC Corp. |
|
|
|
| |
| |
|
Vice President |
|
Since 2023 |
|
Senior Vice President, PIMCO. Vice President, PIMCO-Managed Funds, PIMCO Funds, PIMCO Variable Insurance Trust, PIMCO ETF Trust, PIMCO Equity Series, PIMCO Equity Series VIT and PIMCO Flexible Real Estate Income Fund. |
|
|
|
| |
| |
|
Vice President |
|
Since 2024 |
|
Senior Vice President, PIMCO. Vice President, PIMCO-Managed Funds, PIMCO Funds, PIMCO Variable Insurance Trust, PIMCO ETF Trust, PIMCO Equity Series, PIMCO Equity Series VIT, and PIMCO Flexible Real Estate Income Fund. |
|
|
|
| |
| |
|
Vice President |
|
Since 2024 |
|
Executive Vice President, PIMCO. Vice President, PIMCO-Managed Funds, PIMCO Funds, PIMCO Variable Insurance Trust, PIMCO ETF Trust, PIMCO Equity Series, PIMCO Equity Series VIT and PIMCO Flexible Real Estate Income Fund. |
|
|
|
| |
| |
|
Vice President |
|
Since 2022 |
|
Executive Vice President, PIMCO. Vice President, PIMCO-Managed Funds, PIMCO Funds, PIMCO Variable Insurance Trust, PIMCO ETF Trust, PIMCO Equity Series, PIMCO Equity Series VIT, PIMCO Flexible Real Estate Income Fund and PIMCO Capital Solutions BDC Corp. |
|
|
|
| |
| |
|
Vice President |
|
Since 2024 |
|
Vice President, PIMCO, Vice President, PIMCO-Managed Funds, PIMCO Funds, PIMCO Variable Insurance Trust, PIMCO ETF Trust, PIMCO Equity Series, PIMCO Equity Series VIT and PIMCO Flexible Real Estate Income Fund. |
|
|
|
| |
| |
|
Treasurer |
|
Since 2021 |
|
Executive Vice President, PIMCO. Treasurer, PIMCO-Managed Funds, PIMCO Funds, PIMCO Variable Insurance Trust, PIMCO ETF Trust, PIMCO Equity Series, PIMCO Equity Series VIT and PIMCO Flexible Real Estate Income Fund. |
|
|
|
| |
| |
|
Deputy Treasurer |
|
Since 2022 |
|
Senior Vice President, PIMCO. Deputy Treasurer, PIMCO-Managed Funds, PIMCO Funds, PIMCO Variable Insurance Trust, PIMCO ETF Trust, PIMCO Equity Series, PIMCO Equity Series VIT and PIMCO Flexible Real Estate Income Fund. |
|
|
|
| |
| |
|
Assistant Treasurer |
|
Since 2015 |
|
Executive Vice President, PIMCO. Assistant Treasurer, PIMCO-Managed Funds, PIMCO Funds, PIMCO Variable Insurance Trust, PIMCO ETF Trust, PIMCO Equity Series, PIMCO Equity Series VIT, PIMCO Flexible Real Estate Income Fund and PIMCO Capital Solutions BDC Corp. |
|
|
|
|
|
|
|
|
|
|
|
|
| |
| |
|
|
ANNUAL REPORT |
|
|
| |
|
|
JUNE 30, 2025 |
|
|
275 |
|
|
|
|
|
|
| |
|
|
|
|
Term of
Office and
Length of
Time Served |
|
Principal Occupation(s) During the Past 5 Years |
|
|
|
| |
| |
|
Assistant Treasurer |
|
Since 2024 |
|
Vice President, PIMCO. Assistant Treasurer, PIMCO-Managed Funds, PIMCO Funds, PIMCO Variable Insurance Trust, PIMCO ETF Trust, PIMCO Equity Series, PIMCO Equity Series VIT and PIMCO Flexible Real Estate Income Fund. |
|
|
|
| |
| |
|
Assistant Treasurer |
|
Since 2024 |
|
Vice President, PIMCO. Assistant Treasurer, PIMCO-Managed Funds, PIMCO Funds, PIMCO Variable Insurance Trust, PIMCO ETF Trust, PIMCO Equity Series, PIMCO Equity Series VIT and PIMCO Flexible Real Estate Income Fund. |
|
|
|
| |
| |
|
Assistant Treasurer |
|
Since 2024 |
|
Vice President, PIMCO. Assistant Treasurer, PIMCO-Managed Funds, PIMCO Funds, PIMCO Variable Insurance Trust, PIMCO ETF Trust, PIMCO Equity Series, PIMCO Equity Series VIT and PIMCO Flexible Real Estate Income Fund. |
|
|
|
| |
| |
|
Assistant Secretary |
|
Since 2024 |
|
Senior Vice President and Senior Counsel, PIMCO. Assistant Secretary, PIMCO-Managed Funds, PIMCO Funds, PIMCO Variable Insurance Trust, PIMCO ETF Trust, PIMCO Equity Series and PIMCO Equity Series VIT. |
|
|
|
| |
| |
|
Assistant Secretary |
|
Since 2024 |
|
Vice President and Counsel, PIMCO. Assistant Secretary, PIMCO-Managed Funds, PIMCO Flexible Real Estate Income Fund and PIMCO Capital Solutions BDC Corp. |
|
The business address of these officers is c/o Pacific Investment Management Company LLC, 650 Newport Center Drive, Newport Beach, California 92660. |
|
The business address of these officers is c/o Pacific Investment Management Company LLC, 401 Congress Ave., Austin, Texas 78701. |
|
|
|
|
|
|
| |
276 |
|
PIMCO CLOSED-END FUNDS |
|
|
|
|
|
|
|
|
| |
Approval of Investment Management Agreements |
|
| |
(Unaudited) |
PCM, PGP, RCS, PDI, PDO, PAXS, PDX
The Investment Company Act of 1940, as amended (the “
1940 Act
”), requires that the Board of Trustees/Directors (the “
Board
” or the “
Trustees
”), including a majority of the Trustees who are not “interested persons,” as that term is defined in the 1940 Act (the “
Independent Trustees
”), of each of PCM Fund, Inc. (“
PCM
”), PIMCO Global StocksPLUS
& Income Fund (“
PGP
”), PIMCO Strategic Income Fund, Inc. (“
RCS
”), PIMCO Dynamic Income Fund (“
PDI
”), PIMCO Dynamic Income Opportunities Fund (“
PDO
”), PIMCO Access Income Fund (“
PAXS
”), and PIMCO Dynamic Income Strategy Fund (“
PDX
”) (each, a “
Fund
” and, collectively, the “
Funds
”), voting separately, annually approve the continuation of the Investment Management Agreement between each Fund and Pacific Investment Management Company LLC (“
PIMCO
”) (each, an “
Investment Management Agreement
”). At an
in-person
meeting held on June 25, 2025 (the “
Approval Meeting
”), the Board, including the Independent Trustees, considered and unanimously approved the continuation of each Investment Management Agreement for an additional
one-year
period commencing on August 1, 2025. In addition, the Board considered and unanimously approved the continuation of the investment management agreements between PIMCO and any wholly-owned subsidiaries of each Fund (each such subsidiary, a “
Subsidiary
” and, together, the “
Subsidiaries
”) (such agreements, collectively, the “
Subsidiary Agreements
” and together with each Investment Management Agreement, the “
Agreements
”), for the same additional
one-year
period.
In addition to the Approval Meeting, the Contracts Committee and the Performance Committee of the Board held a joint meeting on May 27, 2025 to discuss materials provided by PIMCO in connection with the Trustees’ review of the Agreements. The annual contract review process also involved multiple discussions and meetings with members of the Contracts Committee and the full Contracts Committee (the Approval Meeting, together with such discussions and meetings, the “
Contract Renewal Meetings
”). Throughout the process, the Independent Trustees received legal advice from independent legal counsel that is experienced in 1940 Act matters and independent of PIMCO (“
Independent Counsel
”), and with whom they met separately from PIMCO during the Contract Renewal Meetings. Representatives from PIMCO attended portions of the Contract Renewal Meetings and responded to questions from the Independent Trustees. The Contracts Committee also received and reviewed a memorandum from Independent Counsel regarding the Trustees’ responsibilities in considering the Agreements and the fees paid thereunder.
In connection with their deliberations regarding the proposed continuation of the Agreements, the Board, including the Independent Trustees, considered such information and factors as they believed, in light of the legal advice furnished to them and their own business
judgment, to reasonably be necessary to evaluate the terms of the Agreements. The Trustees also considered the nature, quality and extent of the various investment management, administrative and other services performed by PIMCO under the Agreements.
In evaluating the Agreements, the Board, including the Independent Trustees, reviewed extensive materials provided by PIMCO in response to questions, inclusive of any
follow-up
inquiries, submitted by the Independent Trustees and Independent Counsel. The Board also met with senior representatives of PIMCO regarding its personnel, operations, and estimated profitability as they relate to the Funds. The Trustees also considered the broad range of information relevant to the annual contract review that is provided to the Board (including its various standing committees) at meetings throughout the year, including reports on investment performance based on net asset value (“
NAV
”), market value and distribution yield (both absolute and compared against an appropriate peer group); use of leverage (if applicable); information regarding share price premiums and/or discounts; investment, operational and other relevant risks for the Funds; and other portfolio information, including any use of derivatives. The Trustees also received periodic reports on, among other matters, pricing and valuation, quality and cost of portfolio trade execution, compliance, and shareholder and other services provided by PIMCO and its affiliates. To assist with their review, the Trustees reviewed summaries prepared by PIMCO that analyzed each Fund based on a number of factors, including fees/expenses, performance, distribution yield (which may be comprised of ordinary income, net capital gains, and/or a return of capital), and risk-based factors, as of December 31, 2024. They also considered, among other information, performance based on NAV and market value, investment objective and strategy, portfolio managers, assets under management, outstanding leverage, share price premium and/or discount information, annual fund operating expenses, total expense ratio and management fee comparisons between each Fund and its Broadridge Expense Group (as defined below), and estimated profitability to PIMCO from its relationship with each Fund. In considering the Broadridge Performance Universe and Broadridge Expense Group (both as defined below), the Trustees requested that PIMCO comment on whether the peer funds selected for each Fund by Broadridge Financial Solutions, Inc. (“
Broadridge
”) provided an appropriate comparison, and if not, whether PIMCO believes another peer group would provide a more appropriate comparison.
With respect to the Subsidiary Agreements, the Trustees considered that those Funds with Subsidiaries may utilize their Subsidiaries to execute their investment strategies, and that PIMCO provides investment advisory and administrative services to the Subsidiaries pursuant to the Subsidiary Agreements in the same manner as it does for a Fund under its Investment Management Agreement. The Trustees
|
|
|
|
|
|
|
|
|
|
|
|
| |
| |
|
|
ANNUAL REPORT |
|
|
| |
|
|
JUNE 30, 2025 |
|
|
277 |
|
|
|
|
| |
Approval of Investment Management Agreements |
|
|
|
|
noted that, to the extent PIMCO charges a management fee under a Subsidiary Agreement, PIMCO has entered into an expense limitation agreement with the applicable Subsidiary pursuant to which PIMCO waives any fees that the Subsidiary pays to PIMCO. Accordingly, PIMCO either does not collect or retain a separate advisory or other fee from the Subsidiary, and PIMCO’s profitability with respect to a Fund is not impacted as a result of the Subsidiary Agreements. The Trustees determined, therefore, that it was appropriate to consider the approval of the Subsidiary Agreements collectively with their consideration of the Investment Management Agreements.
The Trustees’ conclusions as to the continuation of the Agreements were based on a comprehensive consideration of all information provided to the Trustees during the Contract Renewal Meetings and throughout the year and were not the result of any single factor. Some of the factors that figured particularly in the Trustees’ deliberations are described below, although individual Trustees may have evaluated the information presented differently from one another, attributing different weights to various factors. The Trustees evaluated information available to them on a
basis, and their determinations were made separately in respect of each Fund.
Nature, Extent and Quality of Services
As part of their review, the Trustees received and considered descriptions of various functions performed by PIMCO for the Funds, such as portfolio management, compliance monitoring, portfolio trading practices, and oversight of third-party service providers. They also considered information regarding the overall organization and business functions of PIMCO, including, without limitation, information regarding senior management, portfolio managers and other personnel providing investment management, administrative, and/or other services, and general corporate ownership and business operations unrelated to the Funds. The Trustees examined PIMCO’s abilities to provide high-quality investment management and other services to the Funds, noting PIMCO’s long history and experience in managing
closed-end
funds, such as the Funds, including experience monitoring discounts and premiums. Among other information, the Trustees considered the investment philosophy and research and decision-making processes of PIMCO; the experience of key advisory personnel of PIMCO responsible for portfolio management of the Funds; information regarding the Funds’ use of leverage; the ability of PIMCO to attract and retain capable personnel; the background and capabilities of the senior management and staff of PIMCO; the general process or philosophy for determining employee compensation; and the operational infrastructure, including technology and systems and cybersecurity measures, of PIMCO.
In addition, the Trustees noted the extensive range of services that PIMCO provides to the Funds beyond investment management services.
In this regard, the Trustees reviewed the extent and quality of PIMCO’s services with respect to regulatory compliance and its ability to comply with the investment policies of the Funds; the compliance programs and risk controls of PIMCO (including the implementation of new policies and programs); the specific contractual obligations of PIMCO pursuant to the Agreements; the nature, extent, and quality of the supervisory and administrative services PIMCO is responsible for providing to the Funds; PIMCO’s risk management function; and the time and resources PIMCO expends monitoring the leverage employed by the Funds. The Trustees considered conditions that might affect PIMCO’s ability to provide high-quality services to the Funds in the future under the Agreements, including, but not limited to, PIMCO’s financial condition and operational stability. The Trustees also took into account the entrepreneurial, business and other risks that PIMCO has undertaken as investment manager and sponsor of the Funds. Specifically, the Trustees considered that PIMCO’s responsibilities include continual management of investment, operational, enterprise, legal, regulatory, and compliance risks as they relate to the Funds. The Trustees also noted PIMCO’s activities under its contractual obligation to coordinate, oversee and supervise the Funds’ various outside service providers, including its negotiation of certain service providers’ fees and its due diligence and evaluation of service providers’ infrastructure, cybersecurity programs, compliance programs, and business continuity programs, among other matters. The Trustees also considered PIMCO’s ongoing development of its own infrastructure and information technology, including its proprietary software and applications, to support the Funds through, among other things, cybersecurity, business continuity planning, and risk management. The Trustees considered PIMCO’s strategic managed service arrangement (“
Managed Services
”) with a third-party consultant for various services provided to the Funds and requested information from PIMCO regarding PIMCO’s retained responsibility and oversight over the Managed Services.
After their review and deliberations, the Trustees concluded that the nature, extent, and quality of the overall services provided by PIMCO under each Agreement were appropriate.
Fee and Expense Information
In assessing the reasonableness of each Fund’s fees and expenses under its Investment Management Agreement, the Trustees requested and considered, among other information, the Fund’s management fee and its total expenses as a percentage of average net assets attributable to common shares and as a percentage of average total managed assets (including assets attributable both to common shares and specified leverage outstanding), in comparison to the management fees and other expenses of a group of industry peer funds identified by Broadridge as pursuing investment strategies with classifications/objectives similar to the Fund (for each Fund, its “
Broadridge
Expense
|
|
|
|
|
|
| |
278 |
|
PIMCO CLOSED-END FUNDS |
|
|
|
|
Group
”) as well as of a broader universe of peer funds identified by Broadridge (for each Fund, its “
Broadridge
Expense Universe
”). In each case, the total expense ratio information was provided both inclusive and exclusive of interest and borrowing expenses. The Fund-specific fee and expense results discussed below were prepared and provided by Broadridge and were not independently verified by the Trustees. The Trustees noted that PDX continues to transition its portfolio in light of the investment objective and guideline changes effective November 21, 2023. The Trustees also noted that only leveraged
closed-end
funds were considered for inclusion in the Broadridge Expense Groups and Broadridge Expense Universes.
The Trustees considered information regarding the investment performance and fees for other funds and accounts managed by PIMCO, if any, including funds and accounts with comparable investment programs and/or principal investment strategies to those of the Funds, as well as certain other funds requested by the Trustees with broadly similar strategies and/or investment types. The Trustees considered information provided by PIMCO indicating that, in comparison to certain other products managed by PIMCO, including any
open-end
funds and exchange-traded funds with broadly similar strategies and/or investment types, there are additional portfolio management challenges in managing
closed-end
funds such as the Funds. For example, the challenges associated with managing
closed-end
funds may include investing in
non-traditional
and less liquid holdings, a greater use of leverage, issues relating to trading on a national securities exchange and managing a fund’s dividend practices. In addition, the Independent Trustees considered information provided by PIMCO as to the generally broader and more extensive services provided to the Funds in comparison to those provided to private funds or institutional or separate accounts; the higher demands placed on PIMCO to provide considerable shareholder services due to the volume of investors; the greater entrepreneurial, enterprise, and reputational risk in managing registered
closed-end
funds; and the expenses, and impact on PIMCO, associated with the more extensive regulatory and compliance requirements to which the Funds are subject in comparison to private funds or institutional or separate accounts. The Trustees were advised by PIMCO that, in light of these additional challenges and additional services, different pricing structures between
closed-end
funds and other products managed by PIMCO are to be expected, and that comparisons of pricing structures across these products may not always be apt comparisons, even where other products have comparable investment objectives and strategies to those of the Funds.
The Trustees also took into account that the Funds, with the exception of RCS, pay management fees on assets attributable to types of leverage that they use (such as reverse repurchase agreements), which increases the amount of management fees payable by each Fund under
its Investment Management Agreement because each Fund’s fees, except those of RCS, are calculated based on total managed assets, including assets attributable to any reverse repurchase agreements, preferred shares and/or certain other forms of leverage outstanding. They noted that RCS’s management fees are based on daily net assets, including net assets attributable to any preferred shares that may be outstanding, but that RCS does not have any preferred shares outstanding. In this regard, the Trustees took into account that PIMCO has a financial incentive for the Funds to use or continue to use leverage on which management fees are charged and that PIMCO may increase the Funds’ use of leverage in the future, which may create a conflict of interest between PIMCO, on one hand, and the Funds’ common shareholders, on the other. Therefore, the Trustees noted that the total fees paid by each Fund to PIMCO under the Fund’s unified fee arrangement would therefore vary more with increases and decreases in leverage (only with respect to any preferred shares issued by RCS) than under a
non-unified
fee arrangement, all other things being equal. The Trustees considered information provided by PIMCO and related presentations as to why each Fund’s use of leverage continues to be appropriate and in the best interests of the respective Fund under current market conditions. The Trustees noted that each quarter they receive information from PIMCO regarding the Funds’ use of leverage. The Trustees also considered PIMCO’s representation that it will use leverage for the Funds solely as it determines to be in the best interests of the Funds from an investment perspective and without regard to the level of compensation PIMCO receives. The Trustees noted that RCS does not pay fees on assets attributable to the types of leverage that the Fund currently employs.
The Trustees noted that, for each of PGP, PDI, PDO, PAXS, PCM and PDX the contractual and actual management fee rates for the Fund under its unified fee arrangement were above the median contractual and actual management fees of the other funds in their Broadridge Expense Groups, calculated both on average net assets and on average total managed assets. For RCS, the contractual management fee rate for the Fund under its unified fee arrangement was above the median of the other funds in its Broadridge Expense Group calculated both on average net assets and on average total managed assets, while the actual management fee rate for the Fund under its unified fee arrangement was below the median actual management fees of the other funds in its Broadridge Expense Group calculated on average net assets and above the median actual management fees of the other funds in its Broadridge Expense Group calculated on total managed assets. In this regard, the Trustees took into account that each Fund’s unified fee arrangement covers substantially all of the Fund’s operating fees and expenses (“
Operating Expenses
”), and therefore, all other things being equal, would tend to be higher than the contractual management fee rates of other funds in the Broadridge Expense Group,
|
|
|
|
|
|
|
|
|
|
|
|
| |
| |
|
|
ANNUAL REPORT |
|
|
| |
|
|
JUNE 30, 2025 |
|
|
279 |
|
|
|
|
| |
Approval of Investment Management Agreements |
|
|
|
|
which generally do not have a unified fee structure and instead incur Operating Expenses directly and in addition to the management fee. The Trustees determined that a comparison of each Fund’s total expense ratio with the total expense ratios of its Broadridge Expense Group would generally provide more meaningful comparisons than comparing contractual and actual management fee rates in isolation.
In this regard, the Trustees noted PIMCO’s view that the unified fee arrangements have benefited and will continue to benefit common shareholders because they provide an expense structure (including Operating Expenses) that is essentially fixed for the duration of the contractual period as a percentage of either total managed assets (including assets attributable to any reverse repurchase agreements, preferred shares and/or certain other forms of leverage outstanding) or net assets (including assets attributable to preferred shares), as applicable, making it more predictable under ordinary circumstances in comparison to other fee and expense structures, under which the Funds’ Operating Expenses (including certain third-party fees and expenses) could vary significantly over time. The Trustees also considered that the unified fee arrangements generally insulate the Funds and common shareholders from increases in applicable third-party and certain other expenses because PIMCO, rather than the Funds, would bear the risk of such increases (though the Trustees also noted that PIMCO would benefit from any reductions in such expenses).
Performance Information
Fund-specific comparative performance results for the Funds reviewed by the Trustees are discussed below. With respect to investment performance, the Trustees considered information regarding each Fund’s performance based on NAV and market value, as applicable, net of the Fund’s fees and expenses, both on an absolute basis and relative to the performance of its Broadridge Performance Universe (as defined below). The Trustees requested information provided by Broadridge regarding the investment performance of a broad universe of funds within the same investment classification/category that Broadridge determined are comparable to those of each Fund (for each Fund, its “
Broadridge
Performance Universe
”). The comparative performance information was prepared and provided by Broadridge and was not independently verified by the Trustees. The Trustees also considered information regarding the Funds’ comparative yields and risk-adjusted returns. The Trustees recognized that the performance data reflects a snapshot of a period as of a particular date and that selecting a different performance period could produce significantly different results. They further acknowledged that long-term performance could be impacted by even one period of significant outperformance or underperformance. The Trustees noted that PDX continues to transition its portfolio in light of the investment objective and guideline changes
effective November 21, 2023. The Trustees considered information from PIMCO regarding the risks undertaken by each Fund, including the use of leverage, and PIMCO’s management and oversight of the Fund’s risk profile.
In addition, the Trustees considered matters bearing on the Funds and their advisory arrangements at their meetings throughout the year, including a review of performance data at each regular meeting (by both the Board and its Performance Committee).
Profitability, Economies of Scale, and
Fall-out
Benefits
The Trustees considered estimated profitability analyses provided by PIMCO, which included, among other information, (i) PIMCO’s estimated
pre-
and post-distribution operating margin for each Fund, as well as PIMCO’s aggregate estimated
pre-
and post-distribution operating margin for all of the
closed-end
funds advised by PIMCO, including the Funds (collectively, the “
Estimated Margins
”), in each case for the
one-year
period ended December 31, 2024; and (ii) a year-over-year comparison of PIMCO’s Estimated Margins for the
one-year
periods ended December 31, 2024 and December 31, 2023. The Trustees also took into account explanations from PIMCO regarding how certain of PIMCO’s corporate and shared expenses were allocated among the Funds and other funds and accounts managed by PIMCO for purposes of developing profitability estimates. The Trustees also requested information from PIMCO regarding the impact of the Managed Services on PIMCO’s profitability with respect to the Funds. The Trustees also considered that PIMCO is entitled to earn a reasonable level of profits for the services that it provides to the Funds. Based on the profitability analyses provided by PIMCO, the Trustees determined, taking into account the various assumptions made, that such profitability did not appear to be excessive.
The Trustees also considered information regarding possible economies of scale in the operation of the Funds, including in connection with
offerings conducted by certain of the Funds. The Trustees noted that the Funds do not currently have any breakpoints in their management fees. The Trustees considered that, as
closed-end
investment companies, the Funds do not continually offer new shares to raise additional assets (as does a typical
open-end
investment company), but may raise additional assets through
follow-on
offerings (including any
offerings) and dividend reinvestments and may also experience asset growth through investment performance and/or the increased use of leverage. The Trustees noted PIMCO’s assertion that it may share the benefits of potential economies of scale, if any, with the Funds and their shareholders in a number of ways, including investing in portfolio and trade operations management, firm technology and cybersecurity measures, firm proprietary systems and applications, middle and back office support, legal and compliance, and fund administration logistics; senior management supervision and
|
|
|
|
|
|
| |
280 |
|
PIMCO CLOSED-END FUNDS |
|
|
|
|
governance of those services; and the enhancement of services provided to the Funds in return for fees paid. The Trustees also considered that the unified fee arrangements provide inherent economies of scale because a Fund maintains competitive fixed unified fees even if the particular Fund’s assets decline and/or operating costs increase. The Trustees further considered that, in contrast, breakpoints may be used as a proxy for charging higher fees on lower asset levels and that when a fund’s assets decline, breakpoints may reverse, which causes expense ratios to increase. The Trustees also considered that, unlike the Funds’ unified fee arrangements, funds with “pass through” administrative fee structures may experience increased expense ratios when fixed dollar fees are charged against declining fund assets. The Trustees also considered that the unified fee arrangements protect shareholders, during the contractual period, from a rise in operating costs that may result from, among other things, PIMCO’s investments in various business enhancements and infrastructure. The Trustees noted that PIMCO has made extensive investments in these areas.
Additionally, the Trustees considered
so-called
“fall-out
benefits” to PIMCO, such as reputational value derived from serving as investment manager to the Funds, the use of service providers with which PIMCO has a relationship where it receives some economic benefit, and research, statistical and quotation services that PIMCO may receive from broker-dealers executing the Funds’ portfolio transactions on an agency basis.
With regard to the investment performance of each Fund and the fees charged to each Fund, the Board considered the following information. With respect to performance quintile rankings for a Fund compared to its Broadridge Performance Universe, the first quintile represents the highest (best) performance and the fifth quintile represents the lowest performance. The Board considered each Fund’s performance and fees in light of the limitations inherent in the methodology for determining such comparative groups.
PGP
With respect to the Fund’s common share total return performance (based on NAV) relative to its respective Broadridge Performance Universe, the Trustees noted that the Fund had third quintile performance for the
one-year
period, fifth quintile performance for the three-year period, fourth quintile performance for the five-year period and second quintile performance for the
ten-year
period ended December 31, 2024.
The Trustees noted that the Fund’s total expense ratio (including interest and borrowing expenses) calculated on both average total managed assets and average net assets was above the median total expense ratio (including interest and borrowing expenses) of the funds
in its Broadridge Expense Group and Broadridge Expense Universe. The Trustees noted that the Fund’s total expense ratio (excluding interest and borrowing expenses) calculated on both average total managed assets and average net assets was below the median total expense ratio (excluding interest and borrowing expenses) of the funds in its Broadridge Expense Group and Broadridge Expense Universe.
PCM
With respect to the Fund’s common share total return performance (based on NAV) relative to its respective Broadridge Performance Universe, the Trustees noted that the Fund had second quintile performance for the
one-
and
ten-year
periods, fifth quintile performance for the three-year period, and fourth quintile performance for the five-year period ended December 31, 2024.
The Trustees noted that the Fund’s total expense ratio (including interest and borrowing expenses) calculated on both average total managed assets and average net assets was above the median total expense ratio (including interest and borrowing expenses) of the funds in its Broadridge Expense Group and Broadridge Expense Universe. The Trustees noted that the Fund’s total expense ratio (excluding interest and borrowing expenses) calculated on average total managed assets was below the median total expense ratio (excluding interest and borrowing expenses) of the funds in its Broadridge Expense Group, but above the median total expense ratio (excluding interest and borrowing expenses) of the funds in its Broadridge Expense Universe. The Trustees noted that the Fund’s total expense ratio (excluding interest and borrowing expenses) calculated on average net assets was above the median total expense ratio (excluding interest and borrowing expenses) of the funds in its Broadridge Expense Group and Broadridge Expense Universe.
RCS
With respect to the Fund’s common share total return performance (based on NAV) relative to its respective Broadridge Performance Universe, the Trustees noted that the Fund had first quintile performance for the
one-
and
ten-
year periods and fourth quintile performance for the three- and five-year periods ended December 31, 2024.
The Trustees noted that the Fund’s total expense ratio (including interest and borrowing expenses) calculated on both average total managed assets and average net assets was above the median total expense ratio (including interest and borrowing expenses) of the funds in its Broadridge Expense Group and Broadridge Expense Universe. The Trustees noted that the Fund’s total expense ratio (excluding interest and borrowing expenses) calculated on both average total managed assets and average net assets was below the median total expense ratio (excluding interest and borrowing expenses) of the funds in its Broadridge Expense Group and Broadridge Expense Universe.
|
|
|
|
|
|
|
|
|
|
|
|
| |
| |
|
|
ANNUAL REPORT |
|
|
| |
|
|
JUNE 30, 2025 |
|
|
281 |
|
|
|
|
| |
Approval of Investment Management Agreements |
|
|
|
|
PDI
With respect to the Fund’s common share total return performance (based on NAV) relative to its respective Broadridge Performance Universe, the Trustees noted that the Fund had first quintile performance for the
one-
and
ten-year
periods and third quintile performance for the three- and five-year periods ended December 31, 2024.
The Trustees noted that the Fund’s total expense ratio (including interest and borrowing expenses) calculated on both average total managed assets and average net assets was above the median total expense ratio (including interest and borrowing expenses) of the funds in its Broadridge Expense Group and Broadridge Expense Universe. The Trustees noted that the Fund’s total expense ratio (excluding interest and borrowing expenses) calculated on average total managed assets was at the median total expense ratio (excluding interest and borrowing expenses) of the funds in its Broadridge Expense Group and Broadridge Expense Universe. The Trustees noted that the Fund’s total expense ratio (excluding interest and borrowing expenses) calculated on average net assets was above the median total expense ratio (excluding interest and borrowing expenses) of the funds in its Broadridge Expense Group and Broadridge Expense Universe.
PDO
With respect to the Fund’s common share total return performance (based on NAV) relative to its respective Broadridge Performance Universe, the Trustees noted that the Fund had first quintile performance for the
one-year
period and fourth quintile performance for the three-year period ended December 31, 2024.
The Trustees noted that the Fund’s total expense ratio (including interest and borrowing expenses) calculated on both average total managed assets and average net assets was above the median total expense ratio (including interest and borrowing expenses) of the funds in its Broadridge Expense Group and Broadridge Expense Universe. The Trustees noted that the Fund’s total expense ratio (excluding interest and borrowing expenses) calculated on average total managed assets was at the median total expense ratio (excluding interest and borrowing expenses) of the funds in its Broadridge Expense Group but above the median total expense ratio (excluding interest and borrowing expenses) of the funds in its Broadridge Expense Universe. The Trustees noted that the Fund’s total expense ratio (excluding interest and borrowing expenses) calculated on average net assets was above the median total expense ratio (excluding interest and borrowing expenses) of the funds in its Broadridge Expense Group and Broadridge Expense Universe.
PAXS
With respect to the Fund’s common share total return performance (based on NAV) relative to its respective Broadridge Performance Universe, the Trustees noted that the Fund had first quintile performance for the
one-year
period ended December 31, 2024.
The Trustees noted that the Fund’s total expense ratio (including interest and borrowing expenses) calculated on both average total managed assets and average net assets was above the median total expense ratio (including interest and borrowing expenses) of the funds in its Broadridge Expense Group and Broadridge Expense Universe. The Trustees noted that the Fund’s total expense ratio (excluding interest and borrowing expenses) calculated on both average total managed assets and average net assets was above the median total expense ratio (excluding interest and borrowing expenses) of the funds in its Broadridge Expense Group and Broadridge Expense Universe.
PDX
With respect to the Fund’s common share total return performance (based on NAV) relative to its Broadridge Performance Universe, the Trustees noted that the Fund had first quintile performance for the
one-,
three-, and five-year periods ended December 31, 2024.
The Trustees noted that the Fund’s total expense ratio (including interest and borrowing expenses) calculated on both average total managed assets and average net assets was below the median total expense ratio (including interest and borrowing expenses) of the funds in its Broadridge Expense Group and Broadridge Expense Universe. The Trustees noted that the Fund’s total expense ratio (excluding interest and borrowing expenses) calculated on average total managed assets was above the median total expense ratio (excluding interest and borrowing expenses) of the funds in its Broadridge Expense Group and Broadridge Expense Universe. The Trustees noted that the Fund’s total expense ratio (excluding interest and borrowing expenses) calculated on average net assets was below the median total expense ratio (excluding interest and borrowing expenses) of the funds in its Broadridge Expense Group and Broadridge Expense Universe.
Conclusion
After reviewing these and other factors described herein, the Trustees concluded, with respect to each Fund, within the context of their overall conclusions regarding the Agreements, and based on the information provided and related representations made by management, and in their business judgment, that they were satisfied with PIMCO’s responses and efforts relating to the investment performance of the Funds. The Trustees also concluded that the fees payable under the Agreements represent reasonable compensation in light of the nature, extent, and quality of the services provided by
|
|
|
|
|
|
| |
282 |
|
PIMCO CLOSED-END FUNDS |
|
|
|
|
PIMCO. Based on their evaluation of factors that they deemed to be material, including, but not limited to, those factors described above, the Board, including the Independent Trustees, unanimously concluded that the continuation of the Agreements was in the interests of each Fund and its shareholders, and should be approved.
|
|
|
|
|
|
|
|
|
|
|
|
| |
| |
|
|
ANNUAL REPORT |
|
|
| |
|
|
JUNE 30, 2025 |
|
|
283 |
The Funds
2,3
consider customer privacy to be a fundamental aspect of their relationships with shareholders and are committed to maintaining the confidentiality, integrity and security of their current, prospective and former shareholders’
non-public
personal information. The Funds have developed policies that are designed to protect this confidentiality, while allowing shareholder needs to be served.
OBTAINING
NON-PUBLIC
PERSONAL INFORMATION
In the course of providing shareholders with products and services, the Funds and certain service providers to the Funds, such as the Funds’ investment advisers or
sub-advisers
(“Advisers”), may obtain
non-public
personal information about shareholders, which may come from sources such as account applications and other forms, from other written, electronic or verbal correspondence, from shareholder transactions, from a shareholder’s brokerage or financial advisory firm, financial professional or consultant, and/or from information captured on applicable websites.
As a matter of policy, the Funds do not disclose any
non-public
personal information provided by shareholders or gathered by the Funds to
non-affiliated
third parties, except as required or permitted by law or as necessary for such third parties to perform their agreements with respect to the Funds. As is common in the industry,
non-affiliated
companies may from time to time be used to provide certain services, such as preparing and mailing prospectuses, reports, account statements and other information, conducting research on shareholder satisfaction and gathering shareholder proxies. The Funds or their affiliates may also retain
non-affiliated
companies to market Fund shares or products which use Fund shares and enter into joint marketing arrangements with them and other companies. These companies may have access to a shareholder’s personal and account information, but are permitted to use this information solely to provide the specific service or as otherwise permitted by law. In most cases, the shareholders will be clients of a third-party, but the Funds may also provide a shareholder’s personal and account information to the shareholder’s respective brokerage or financial advisory firm and/or financial professional or consultant.
SHARING INFORMATION WITH THIRD PARTIES
The Funds reserve the right to disclose or report personal or account information to
non-affiliated
third parties in limited circumstances where the Funds believe in good faith that disclosure is required under law, to cooperate with regulators or law enforcement authorities, to protect their rights or property, or upon reasonable request by any Fund in which a shareholder has invested. In addition, the Funds may
disclose information about a shareholder or a shareholder’s accounts to a
non-affiliated
third-party at the shareholder’s request or with the consent of the shareholder.
SHARING INFORMATION WITH AFFILIATES
The Funds may share shareholder information with their affiliates in connection with servicing shareholders’ accounts, and subject to applicable law may provide shareholders with information about products and services that the Funds or their Advisers, distributors or their affiliates (“Service Affiliates”) believe may be of interest to such shareholders. The information that the Funds may share may include, for example, a shareholder’s participation in the Funds or in other investment programs sponsored by a Service Affiliate, a shareholder’s ownership of certain types of accounts (such as IRAs), information about the Funds’ experiences or transactions with a shareholder, information captured on applicable websites, or other data about a shareholder’s accounts, subject to applicable law. The Funds’ Service Affiliates, in turn, are not permitted to share shareholder information with
non-affiliated
entities, except as required or permitted by law.
PROCEDURES TO SAFEGUARD PRIVATE INFORMATION
The Funds take seriously the obligation to safeguard shareholder
non-public
personal information. In addition to this policy, the Funds have implemented procedures that are designed to restrict access to a shareholder’s
non-public
personal information to internal personnel who need to know that information to perform their jobs, such as servicing shareholder accounts or notifying shareholders of new products or services. Physical, electronic and procedural safeguards are in place to guard a shareholder’s
non-public
personal information.
INFORMATION COLLECTED FROM WEBSITES
The Funds or their service providers and partners may collect information from shareholders via websites they maintain. The information collected via websites maintained by the Funds or their service providers includes client
non-public
personal information.
CHANGES TO THE PRIVACY POLICY
From time to time, the Funds may update or revise this privacy policy. If there are changes to the terms of this privacy policy, documents containing the revised policy on the relevant website will be updated.
1
Amended as of June 25, 2020.
2
PIMCO Investments LLC (“PI”) serves as the Funds’ distributor and does not provide brokerage services or any financial advice to investors in the Funds solely because it distributes the Funds. This Privacy Policy applies to the activities of PI to the extent that PI regularly effects or engages in transactions with or for a shareholder of a series of a Trust who is the record owner of such shares. For purposes of this Privacy Policy, references to “the Funds” shall include PI when acting in this capacity.
3
When distributing this Policy, a Fund may combine the distribution with any similar distribution of its investment adviser’s privacy policy. The distributed, combined, policy may be written in the first person (i.e. by using “we” instead of “the Funds”).
|
|
|
|
|
|
| |
284 |
|
PIMCO CLOSED-END FUNDS |
|
|
|
|
General Information
Pacific Investment Management Company LLC
650 Newport Center Drive,
State Street Bank and Trust Company
2323 Grand Boulevard, 5th Floor
Transfer Agent, Dividend Paying Agent and Registrar
Equiniti Trust Company, LLC (“EQ”)
Independent Registered Public Accounting Firm
PricewaterhouseCoopers LLP
1100 Walnut Street, Suite 1300
This report is submitted for the general information of the shareholders of the Funds listed on the Report cover.
As of the end of the period covered by this report, the Registrant has adopted a code of ethics (the “Code”) that applies to the Registrant’s principal executive officer and principal financial officer. The Registrant did not grant any waivers, including implicit waivers, from any provisions of the Code to the principal executive officer or principal financial officer during the period covered by this report.
A copy of the Code is included as an exhibit to this report.
| Item 3. |
Audit Committee Financial Expert. |
The Board of Trustees has determined that E. Grace Vandecruze, who serves on the Board’s Audit Oversight Committee, qualifies as an “audit committee financial expert” as such term is defined in the instructions to this Item 3. The Board has also determined that Ms. Vandecruze is “independent” as such term is interpreted under this Item 3.
| Item 4. |
Principal Accountant Fees and Services. |
|
|
|
|
|
|
|
|
| |
| |
|
(a) |
|
Fiscal Year Ended |
|
Audit Fees |
|
|
|
| |
| |
June 30, 2025 |
|
$ 107,014 |
|
|
|
| |
| |
June 30, 2024 |
|
$ 105,159 |
|
|
|
|
|
|
| |
|
| |
(b) |
|
Fiscal Year Ended |
|
Audit-Related Fees |
|
|
|
| |
| |
June 30, 2025 |
|
$ 52,180 |
|
|
|
| |
| |
June 30, 2024 |
|
$ — |
|
|
|
|
|
|
| |
|
| |
(c) |
|
Fiscal Year Ended |
|
Tax Fees (1) |
|
|
|
| |
| |
June 30, 2025 |
|
$ — |
|
|
|
| |
| |
June 30, 2024 |
|
$ — |
|
|
|
|
|
|
| |
|
| |
(d) |
|
Fiscal Year Ended |
|
All Other Fees (2) |
|
|
|
| |
| |
June 30, 2025 |
|
$ — |
|
|
|
| |
| |
June 30, 2024 |
|
$ — |
|
|
“Audit Fees” represents fees billed for each of the last two fiscal years for professional services rendered for the audit and review of the Registrant’s annual financial statements for those fiscal years or services that are normally provided by the accountant in connection with statutory or regulatory filings or engagements for those fiscal years.
“Audit-Related Fees” represents fees billed for each of the last two fiscal years for assurance and related services that are reasonably related to the performance of the audit or review of the Registrant’s financial statements, but not reported under “Audit Fees” above, and that include accounting consultations, agreed-upon procedure reports (inclusive of annual review of basic maintenance testing associated with the Preferred Shares), attestation reports and comfort letters for those fiscal years.
“Tax Fees” represents fees billed for each of the last two fiscal years for professional services related to tax compliance, tax advice and tax planning, including services relating to the filing or amendment of federal, state or local income tax returns, regulated investment company qualification reviews, and tax distribution and analysis reviews.
“All Other Fees” represents fees, if any, billed for other products and services rendered by the principal accountant to the Registrant other than those reported above under “Audit Fees,” “Audit-Related Fees” and “Tax Fees” for the last two fiscal years.
(1) There were no “Tax Fees” for the last two fiscal years.
(2) There were no “All Other Fees” for the last two fiscal years.
| |
(e) |
Pre-approval policies and procedures |
(1) The Registrant’s Audit Oversight Committee has adopted pre-approval policies and procedures (the “Procedures”) to govern the Audit Oversight Committee’s pre-approval of (i) all audit services and permissible non-audit services to be provided to the Registrant by its independent accountant, and (ii) all permissible non-audit services to be provided by such independent accountant to the Registrant’s investment adviser and to any entity controlling, controlled by, or under common control with the investment adviser that provides ongoing services to the Registrant (collectively, the “Service Affiliates”) if the services provided directly relate to the Registrant’s operations and financial reporting. In accordance with the Procedures, the Audit Oversight Committee is responsible for the engagement of the independent accountant to certify the Registrant’s financial statements for each fiscal year. With respect to the pre-approval of non-audit services provided to the Registrant and its Service Affiliates, the Procedures provide that the Audit Oversight Committee may annually pre-approve a list of types or categories of non-audit services that may be provided to the Registrant or its Service Affiliates, or the Audit Oversight Committee may pre-approve such services on a project-by-project basis as they arise. Unless a type of service has received general pre-approval, it will require specific pre-approval by the Audit Oversight Committee if it is to be provided by the independent accountant. The Procedures also permit the Audit Oversight Committee to delegate authority to one or more of its members to pre-approve any proposed non-audit services that have not been previously pre-approved by the Audit Oversight Committee, subject to the ratification by the full Audit Oversight Committee no later than its next scheduled meeting.
(2) With respect to the services described in paragraphs (b) through (d) of this Item 4, no amount was approved by the Audit Oversight Committee pursuant to paragraph (c)(7)(i)(C) of Rule 2-01 of Regulation S-X.
|
|
|
|
|
|
|
|
|
|
|
|
| |
| |
|
|
|
|
Aggregate Non-Audit Fees Billed to Entity |
|
|
| |
|
|
|
| Entity |
|
|
|
|
June 30, 2025 |
|
|
June 30, 2024 |
|
| |
|
|
|
|
|
| PIMCO Access Income Fund |
|
$ |
|
|
|
|
52,180 |
|
|
$ |
— |
|
| Pacific Investment Management Company LLC (“PIMCO”) |
|
|
|
| |
|
37,929,836 |
|
|
|
23,072,979 |
|
|
| |
|
|
|
| Totals |
|
$ |
|
|
|
|
37,982,016 |
|
|
$ |
23,072,979 |
|
|
| |
|
|
|
|
|
|
|
| |
(h) |
The Registrant’s Audit Oversight Committee has considered whether the provision of non-audit services that were rendered to the Registrant’s investment adviser, and any entity controlling, controlled by, or under common control with the investment adviser that provides ongoing services to the Registrant which were not pre-approved (not requiring pre-approval) is compatible with maintaining the principal accountant’s independence. |
| Item 5. |
Audit Committee of Listed Registrants. |
The Registrant has a separately-designated standing audit committee (known as the Audit Oversight Committee) established in accordance with Section 3(a)(58)(A) of the Securities Exchange Act of 1934, as amended. The Audit Oversight Committee is comprised of:
E. Grace Vandecruze (Chair)
Sarah E. Cogan
Deborah A. DeCotis
Kathleen A. McCartney
Alan Rappaport
The information required by this Item 6 is included as part of the annual report to shareholders filed under Item 1 of this Form N-CSR.
| Item 7. |
Financial Statements and Financial Highlights for Open-End Management Investment Companies. |
| |
(a) |
Not applicable to closed-end investment companies. |
| |
(b) |
Not applicable to closed-end investment companies. |
| Item 8. |
Changes in and Disagreements with Accountant for Open-End Management Investment Companies. |
Not applicable to closed-end investment companies.
| Item 9. |
Proxy Disclosures for Open-End Management Investment Companies. |
Not applicable to closed-end investment companies.
| Item 10. |
Remuneration Paid to Directors, Officers, and Others of Open-End Management Investment Companies. |
Not applicable to closed-end investment companies.
| Item 11. |
Statement Regarding Basis for Approval of Investment Advisory Contract. |
The information required by this Item 11 is included as part of the annual report to shareholders filed under Item 1 of this Form N-CSR.
| Item 12. |
Disclosure of Proxy Voting Policies and Procedures for Closed-End Management Investment Companies. |
Policy Statement: The proxy voting policy is intended to foster PIMCO’s compliance with its fiduciary obligations and applicable law; the policy applies to any voting or consent rights with respect to securities held in accounts over which PIMCO has discretionary voting authority. The Policy is designed in a manner reasonably expected to ensure that voting and consent rights are exercised in the best interests of PIMCO’s clients.
Overview: PIMCO has adopted a written proxy voting1 policy (“Proxy Policy”) as required by Rule 206(4)-6 under the Advisers Act. As a general matter, when PIMCO has proxy voting authority, PIMCO has a fiduciary obligation to monitor corporate events and to take appropriate action on client proxies that come to its attention. Each proxy is voted on a case-by-case basis, taking into account relevant facts and circumstances. When considering client proxies, PIMCO may determine not to vote a proxy in limited circumstances.
Equity Securities.2 PIMCO has retained an Industry Service Provider (“ISP”) to provide research and voting recommendations for proxies relating to equity securities in accordance with the ISP’s guidelines. By following the guidelines of an independent third party, PIMCO seeks to mitigate potential conflicts of interest PIMCO may have with respect to proxies covered by the ISP. PIMCO will follow the recommendations of the ISP unless: (i) the ISP does not provide a voting recommendation; or (ii) a portfolio manager decides to override the ISP’s voting recommendation. In either such case as described above, the Legal and Compliance department will review the proxy to determine whether a material conflict of interest, or the appearance of one, exists.
Fixed-Income Securities. Fixed income securities can be processed as proxy ballots or corporate action-consents3 at the discretion of the issuer/ custodian. When processed as proxy ballots, the ISP generally does not provide a voting recommendation and their role is limited to election processing and recordkeeping. When processed as corporate action-consents, the Legal and Compliance department will review all election forms to determine whether a conflict of interest, or the appearance of one, exists with respect to the PM’s consent election. PIMCO’s Credit Research and Portfolio Management Groups are responsible for issuing recommendations on how to vote proxy ballots and corporation action-consents with respect to fixed income securities.
Resolution of Potential Conflicts of Interest. The Proxy Policy permits PIMCO to seek to resolve material conflicts of interest by pursuing any one of several courses of action. With respect to material conflicts of interest between PIMCO and a client account, the Proxy Policy permits PIMCO to either: (i) convene a working group to assess and resolve the conflict (the “Proxy Working Group”); or (ii) vote in accordance with protocols previously established by the Proxy Policy, the Proxy Working Group and/or other relevant procedures approved by PIMCO’s Legal and Compliance department with respect to specific types of conflicts.
PIMCO will supervise and periodically review its proxy voting activities and the implementation of the Proxy Policy.
Sub-Adviser Engagement: As an investment manager, PIMCO may exercise its discretion to engage a Sub-Adviser to provide
portfolio management services to the Fund. Consistent with its management responsibilities, the Sub-Adviser would assume the authority for voting proxies on behalf of PIMCO for the Fund. Sub-Advisers may utilize third parties to perform certain services related to their portfolio management responsibilities. As a fiduciary, PIMCO will maintain oversight of the investment management responsibilities (which may include proxy voting) performed by the Sub-Adviser and contracted third parties.
1 Proxies generally describe corporate action consent rights (relative to fixed income securities) and proxy voting ballots (relative to fixed income or equity securities) as determined by the issuer or custodian.
2 The term “Equity Securities” means common and preferred stock, including common and preferred shares issued by investment companies; it does not include debt securities convertible into equity securities.
3 Voting or consent rights shall not include matters which are primarily decisions to buy or sell investments, such as tender offers, exchange offers, conversions, put options, redemptions, and Dutch auctions.
| Item 13. |
Portfolio Managers of Closed-End Management Investment Companies. |
(a)(1)
As of September 2, 2025, the following individuals have primary responsibility for the day-to-day management of the PIMCO Access Income Fund (the “Fund”):
Daniel J. Ivascyn
Mr. Ivascyn has been the lead portfolio manager of the Fund since its inception in January 2022. Mr. Ivascyn is Group Chief Investment Officer and a managing director in the Newport Beach office. Prior to joining PIMCO in 1998, he worked at Bear Stearns in the asset-backed securities group, as well as T. Rowe Price and Fidelity Investments.
Alfred T. Murata
Mr. Murata has been a portfolio manager of the Fund since its inception in January 2022. Mr. Murata is a managing director and portfolio manager in the Newport Beach office, managing income-oriented, multisector credit, opportunistic and securitized strategies. Prior to joining PIMCO in 2001, he researched and implemented exotic equity and interest rate derivatives at Nikko Financial Technologies.
Joshua Anderson
Mr. Anderson has been a portfolio manager of the Fund since its inception in January 2022. Mr. Anderson is a managing director and portfolio manager in the Newport Beach office. He also oversees global ABS (asset-backed securities) portfolio management team and supports the firm’s opportunistic strategies. Prior to joining PIMCO in 2003, he was an analyst at Merrill Lynch covering both the residential ABS and collateralized debt obligation sectors.
Sonali Pier
Ms. Pier has been a portfolio manager of the Fund since its inception in January 2022. Ms. Pier is a managing director and portfolio manager in the Newport Beach office, focusing on multi-sector credit opportunities. She is the lead portfolio manager for diversified income and is a senior member of the leveraged finance team. Prior to joining PIMCO in 2013, she was a senior credit trader at J.P. Morgan, trading cash, recovery, and credit default swaps across various sectors.
Jing Yang
Ms. Yang has been a portfolio manager of the Fund since its inception in January 2022. Ms. Yang is a managing director and a portfolio manager in the Newport Beach office. She oversees the asset-back securities portfolio management team and focuses on StocksPLUS, multi-sector credit and securitized strategies. Prior to joining PIMCO in 2006, she worked in home equity loan structuring at Morgan Stanley in New York.
Jamie Weinstein
Mr. Weinstein has been a portfolio manager of the Fund since its inception in January 2022. Mr. Weinstein is a managing director and portfolio manager in the Newport Beach office and leads corporate special situations, focusing on PIMCO’s opportunistic and alternative strategies within corporate credit. Prior to joining PIMCO in 2019, he worked for KKR as a portfolio manager for the firm’s special situations funds and portfolios, which he managed since their inception in 2009.
(a)(2)
The following summarizes information regarding each of the accounts, excluding the Fund, managed by the Portfolio Managers as of June 30, 2025, including accounts managed by a team, committee, or other group that includes a Portfolio
Manager. Unless mentioned otherwise, the advisory fee charged for managing each of the accounts listed below is not based on performance.
|
|
|
|
|
|
|
|
|
|
|
|
|
|
| |
| |
|
Registered Investment Companies |
|
Other Pooled Investment Vehicles |
|
Other Accounts |
|
|
| Portfolio Manager |
|
# |
|
AUM($million) |
|
# |
|
AUM($million) |
|
# |
|
AUM($million) |
|
|
| Daniel J. Ivascyn1 |
|
22 |
|
$244,604.47 |
|
26 |
|
$136,421.55 |
|
27 |
|
$41,954.94 |
|
|
| Alfred T. Murata2 |
|
25 |
|
$259,372.32 |
|
22 |
|
$63,668.43 |
|
5 |
|
$2,471.18 |
|
|
| Joshua Anderson3 |
|
8 |
|
$215,740.25 |
|
17 |
|
$17,442.85 |
|
0 |
|
$0.00 |
|
|
| Sonali Pier4 |
|
10 |
|
$14,392.56 |
|
22 |
|
$21,466.52 |
|
27 |
|
$69,855.50 |
|
|
| Jing Yang5 |
|
17 |
|
$25,558.50 |
|
8 |
|
$6,797.25 |
|
8 |
|
$63,150.53 |
|
|
| Jamie Weinstein6 |
|
3 |
|
$5,622.57 |
|
9 |
|
$16,517.49 |
|
1 |
|
$729.28 |
|
|
1 Of these Other Pooled Investment Vehicles, 12 accounts totaling $23,021.47 million in assets pay an advisory fee that is based in part on the performance of the accounts. Of these Other Accounts, 1 account totaling $304.90 million in assets pays an advisory fee that is based in part on the performance of the accounts.
2 Of these Other Pooled Investment Vehicles, 6 accounts totaling $15,475.92 million in assets pay an advisory fee that is based in part on the performance of the accounts.
3 Of these Other Pooled Investment Vehicles, 10 accounts totaling $12,892.38 million in assets pay an advisory fee that is based in part on the performance of the accounts.
4 Of these Other Pooled Investment Vehicles, 1 account totaling $4,692.13 million in assets pays an advisory fee that is based in part on the performance of the accounts.
5 Of these Other Pooled Investment Vehicles, 5 account totaling $3,545.44 million in assets pays an advisory fee that is based in part on the performance of the accounts. Of these Other Accounts, 2 account totaling $69.24 million in assets pays an advisory fee that is based in part on the performance of the accounts.
6 Of these Other Pooled Investment Vehicles, 5 accounts totaling $11,981.11 million in assets pay(s) an advisory fee that is based in part on the performance of the accounts.
From time to time, potential and actual conflicts of interest may arise between a portfolio manager’s management of the investments of the Fund, on the one hand, and the management of other accounts, on the other. Potential and actual conflicts of interest may also arise as a result of PIMCO’s other business activities and PIMCO’s possession of material non-public information (“MNPI”) about an issuer. Other accounts managed by a portfolio manager might have similar investment objectives or strategies as the Fund, track the same index the Fund tracks or otherwise hold, purchase, or sell securities that are eligible to be held, purchased or sold by the Fund. The other accounts might also have different investment objectives or strategies than the Fund. Investors should be aware that investments made by the Fund and the results achieved by the Fund at any given time, including for the same or similar instruments, are not expected to be the same as those made by other funds for which PIMCO acts as investment adviser, including funds with names, investment objectives and policies, and/or portfolio management teams, similar to the Fund. This may be attributable to a wide variety of factors, including, but not limited to, the use of a different strategy or portfolio management team, the execution venue(s) used for a given strategy or fund, when a particular fund commenced operations or the size of a particular fund, in each case as compared to other similar funds. Potential and actual conflicts of interest may also arise as a result of PIMCO serving as investment adviser to accounts that invest in the Fund or to accounts in which the Fund invests. In this case, such conflicts of interest could in theory give rise to incentives for PIMCO to, among other things, vote proxies, purchase or redeem shares of the underlying account, or take other actions with respect to the underlying account, in a manner beneficial to the investing account and/or PIMCO but detrimental to the underlying account. Such conflicts of interest could similarly in theory give rise to incentives for PIMCO
to, among other things, vote proxies or purchase or redeem shares of the underlying account, or take other actions with respect to the underlying account, in a manner beneficial to the underlying account and/or PIMCO and that may or may not be detrimental to the investing account. For example, even if there is a fee waiver or reimbursement in place relating to the Fund’s investment in an underlying account, or relating to an investing account’s investment in the Fund, this will not necessarily eliminate all conflicts of interest, as PIMCO could nevertheless have a financial incentive to favor investments in PIMCO-affiliated funds and managers (for example, to increase the assets under management of PIMCO or a fund, product or line of business, or otherwise provide support to, certain funds, products or lines of business), which could also impact the manner in which certain transaction fees are set. Conversely, PIMCO’s duties to the Fund, as well as regulatory or other limitations applicable to the Fund, may affect the courses of action available to PIMCO-advised accounts (including the Fund) that invest in the Fund in a manner that is detrimental to such investing accounts. In addition, regulatory restrictions, actual or potential conflicts of interest or other considerations may cause PIMCO to restrict or prohibit participation in certain investments.
Because PIMCO is affiliated with Allianz SE, a large multi-national financial institution (together with its affiliates, “Allianz”), conflicts similar to those described below may occur between the Fund or other accounts managed by PIMCO and PIMCO’s affiliates or accounts managed by those affiliates. Those affiliates (or their clients), which generally operate autonomously from PIMCO, may take actions that are adverse to the Fund or other accounts managed by PIMCO. In many cases, PIMCO will not be in a position to mitigate those actions or address those conflicts, which could adversely affect the performance of the Fund or other accounts managed by PIMCO (each, a “Client,” and collectively, the “Clients”). In addition, because certain Clients are affiliates of PIMCO or have investors who are affiliates or employees of PIMCO, PIMCO may have incentives to resolve conflicts of interest in favor of these Clients over other Clients.
Knowledge and Timing of Fund Trades. A potential conflict of interest may arise as a result of a portfolio manager’s day-to-day management of the Fund. Because of their positions with the Fund, the portfolio managers know the size, timing and possible market impact of the Fund’s trades. It is theoretically possible that the portfolio managers could use this information to the advantage of other accounts they manage and to the possible detriment of the Fund.
Cross Trades. A potential conflict of interest may arise in instances where the Fund buys an instrument from a Client or sells an instrument to a Client (each, a “cross trade”). Such conflicts of interest may arise, among other reasons, as a result of PIMCO representing the interests of both the buying party and the selling party in the cross trade or because the price at which the instrument is bought or sold through a cross trade may not be as favorable as the price that might have been obtained had the trade been executed in the open market. PIMCO effects cross trades when appropriate pursuant to procedures adopted under applicable rules and SEC guidance. Among other things, such procedures require that the cross trade is consistent with the respective investment policies and investment restrictions of both parties and is in the best interests of both the buying and selling accounts.
Selection of Service Providers. PIMCO, its affiliates and its employees may have relationships with service providers that recommend, or engage in transactions with or for, the Fund, and these relationships may influence PIMCO’s selection of these service providers for the Fund. Additionally, as a result of these relationships, service providers may have conflicts that create incentives for them to promote the Fund over other funds or financial products. In such circumstances, there is a conflict of interest between PIMCO and the Fund if the Fund determines not to engage or continue to engage these service providers.
Investment Opportunities. A potential conflict of interest may arise as a result of a portfolio manager’s management of a number of accounts with varying investment guidelines. Often, an investment opportunity may be suitable for one or more Clients, including Clients with similar names, investment objectives and policies, and/or portfolio management teams, but may not be available in sufficient quantities for all accounts to participate fully. In addition, regulatory issues applicable to PIMCO or the Fund or other accounts may result in the Fund not receiving securities that may otherwise be appropriate for it. Similarly, there may be limited opportunity to sell an investment held by the Fund and another Client. In addition, regulatory issues applicable to PIMCO or the Fund or other accounts may result in the Fund not receiving securities that may otherwise be appropriate for it. Similarly, there may be limited opportunity to sell an investment held by the Fund and another Client. PIMCO has adopted policies and procedures reasonably designed to allocate investment opportunities on a fair and equitable basis over time. In addition, regulatory issues applicable to PIMCO or one or more Clients may result in certain Clients, not receiving securities that may otherwise be appropriate for them.
PIMCO seeks to allocate orders across eligible Client accounts with similar investment guidelines and investment styles fairly and equitably, taking into consideration relevant factors including, among others, applicable investment restrictions and guidelines, including regulatory restrictions; Client account-specific investment objectives, restrictions and other Client instructions, as applicable; risk tolerances; amounts of available cash; the need to rebalance a Client account’s portfolio (e.g., due to investor contributions and redemptions); whether the allocation would result in a Client account receiving a trivial amount or an amount below the established minimum quantity; regulatory requirements; the origin of the investment; the
bases for an issuer’s allocation to PIMCO; and other Client account-specific factors. As part of PIMCO’s trade allocation process, portions of new fixed income investment opportunities are distributed among Client account categories where the relevant portfolio managers seek to participate in the investment. Those portions are then further allocated among the Client accounts within such categories pursuant to PIMCO’s trade allocation policy. Portfolio managers managing quantitative strategies and specialized accounts, such as those focused on international securities, mortgage-backed securities, bank loans, or other specialized asset classes, will likely receive an increased distribution of new fixed income investment opportunities where the investment involves a quantitative strategy or specialized asset class that matches the investment objectives or focus of the Client account category. PIMCO seeks to allocate fixed income investments to Client accounts with the general purpose of maintaining consistent concentrations across similar accounts and achieving, as nearly as possible, portfolio characteristic parity among such accounts. Client accounts furthest from achieving portfolio characteristic parity typically receive priority in allocations. With respect to an order to buy or sell an equity security in the secondary market, PIMCO seeks to allocate the order across Client accounts with similar investment guidelines and investment styles fairly and equitably over time, taking into consideration the relevant factors discussed above.
Any particular allocation decision among Client accounts may be more or less advantageous to any one Client or group of Clients, including the Fund, and certain allocations will, to the extent consistent with PIMCO’s fiduciary obligations, deviate from a pro rata basis among Clients in order to address for example, differences in legal, tax, regulatory, risk management, concentration, exposure, Client guideline limitations and/or mandate or strategy considerations for the relevant Clients. PIMCO may determine that an investment opportunity or particular purchases or sales are appropriate for one or more Clients, but not appropriate for other Clients, including clients with similar names, investment objectives and policies, and/or portfolio management teams, or are appropriate or suitable for, or available to, Clients but in different sizes, terms, or timing than is appropriate or suitable for other Clients. For example, some Clients have higher risk tolerances than other Clients, such as private funds, which, in turn, allows PIMCO to allocate a wider variety and/or greater percentage of certain types of investments (which may or may not outperform other types of investments) to such Clients. Further, the respective risk tolerances of different types of Clients may change over time as market conditions change. Those Clients receiving an increased allocation as a result of the effect of their respective risk tolerance may be Clients that pay higher investment management fees or that pay incentive fees. In addition, certain Client account categories focusing on certain types of investments or asset classes will be given priority in new issue distribution and allocation with respect to the investments or asset classes that are the focus of their investment mandate. Similarly, portfolio managers who are responsible for structuring or monitoring certain investments may be given priority in the allocation process for the accounts they manage. PIMCO may also take into account the bases for an issuer’s allocation to PIMCO, for example, by giving priority allocations to Client accounts holding existing positions in the issuer’s debt if the issuer’s allocation to PIMCO is based on such holdings. PIMCO also may determine not to allocate to or purchase or sell for certain Clients all investments for which all Clients may be eligible.
Legal, contractual, or regulatory issues and/or related expenses applicable to PIMCO or one or more Clients may result in certain Clients not receiving securities that may otherwise be appropriate for them or may result in PIMCO selling securities out of Client accounts even if it might otherwise be beneficial to continue to hold them. Additional factors that are taken into account in the distribution and allocation of investment opportunities to Client accounts include, without limitation: ability to utilize leverage and risk tolerance of the Client account; the amount of discretion and trade authority given to PIMCO by the Client; availability of other similar investment opportunities; the Client account’s investment horizon and objectives; hedging, cash and liquidity needs of the portfolio; minimum increments and lot sizes; and underlying benchmark factors. Given all of the foregoing factors, the amount, timing, structuring, or terms of an investment by a Client, including the Fund, may differ from, and performance may be lower than, investments and performance of other Clients, including those that may provide greater fees or other compensation (including performance-based fees or allocations) to PIMCO. PIMCO has also adopted additional procedures to complement the general trade allocation policy that are designed to address potential conflicts of interest due to the side-by-side management of the Fund and certain pooled investment vehicles, including investment opportunity allocation issues.
From time to time, PIMCO may take an investment position or action for one or more Clients that may be different from, or inconsistent with, an action or position taken for one or more other Clients having similar or differing investment objectives. These positions and actions may adversely impact, or in some instances may benefit, one or more affected Clients (including Clients that are PIMCO affiliates) in which PIMCO has an interest, or which pays PIMCO higher fees or a performance fee. For example, a Client may buy a security and another Client may establish a short position in that same security. The subsequent short sale may result in a decrease in the price of the security that the other Client holds. Similarly, transactions or investments by one or more Clients may have the effect of diluting or otherwise disadvantaging the values, prices or investment strategies of another Client.
When PIMCO implements for one Client a portfolio decision or strategy ahead of, or contemporaneously with, similar portfolio decisions or strategies of another Client, market impact, liquidity constraints or other factors could result in one or more Clients receiving less favorable trading results, the costs of implementing such portfolio decisions or strategies could be increased or such Clients could otherwise be disadvantaged. On the other hand, potential conflicts may also arise because portfolio decisions regarding a Client may benefit other Clients. For example, the sale of a long position or establishment of a short position for a Client may decrease the price of the same security sold short by (and therefore benefit) other Clients, and the purchase of a security or covering of a short position in a security for a Client may increase the price of the same security held by (and therefore benefit) other Clients.
Under certain circumstances, a Client may invest in a transaction in which one or more other Clients are expected to participate, or already have made or will seek to make, an investment. In addition, to the extent permitted by applicable law, a Client may also engage in investment transactions that may result in other Clients being relieved of obligations, or that may cause other Clients to divest certain investments (e.g., a Client may make a loan to, or directly or indirectly acquire securities or indebtedness of, a company that uses the proceeds to refinance or reorganize its capital structure, which could result in repayment of debt held by another Client). Such Clients (or groups of Clients) may have conflicting interests and objectives in connection with such investments, including with respect to views on the operations or activities of the issuer involved, the targeted returns from the investment and the timeframe for, and method of, exiting the investment. When making such investments, PIMCO may do so in a way that favors one Client over another Client, even if both Clients are investing in the same security at the same time. Certain Clients may invest on a “parallel” basis (i.e., proportionately in all transactions at substantially the same time and on substantially the same terms and conditions). In addition, other accounts may expect to invest in many of the same types of investments as another account. However, there may be investments in which one or more of such accounts does not invest (or invests on different terms or on a non-pro rata basis) due to factors such as legal, tax, regulatory, business, contractual or other similar considerations or due to the provisions of a Client’s governing documents. Decisions as to the allocation of investment opportunities among such Clients present numerous conflicts of interest, which may not be resolved in a manner that is favorable to a Client’s interests. To the extent an investment is not allocated pro rata among such entities, a Client could incur a disproportionate amount of income or loss related to such investment relative to such other Client.
In addition, Clients may invest alongside one another in the same underlying investments or otherwise pursuant to a substantially similar investment strategy as one or more other Clients. In such cases, certain Clients may have preferential liquidity and information rights relative to other Clients holding the same investments, with the result that such Clients will be able to withdraw/redeem their interests in underlying investments in priority to Clients who may have more limited access to information or more restrictive withdrawal/redemption rights. Clients with more limited information rights or more restrictive liquidity may therefore be adversely affected in the event of a downturn in the markets.
Further, potential conflicts may be inherent in PIMCO’s use of multiple strategies. For example, conflicts will arise in cases where different Clients invest in different parts of an issuer’s capital structure, including circumstances in which one or more Clients may own private securities or obligations of an issuer and other Clients may own or seek to acquire private securities of the same issuer. For example, a Client may acquire a loan, loan participation or a loan assignment of a particular borrower in which one or more other Clients have an equity investment, or may invest in senior debt obligations of an issuer for one Client and junior debt obligations or equity of the same issuer for another Client.
PIMCO may also, for example, direct a Client to invest in a tranche of a structured finance vehicle, such as a CLO or CDO, where PIMCO is also, at the same or different time, directing another Client to make investments in a different tranche of the same vehicle, which tranche’s interests may be adverse to other tranches. PIMCO may also cause a Client to purchase from, or sell assets to, an entity, such as a structured finance vehicle, in which other Clients may have an interest, potentially in a manner that will have an adverse effect on the other Clients. There may also be conflicts where, for example, a Client holds certain debt or equity securities of an issuer, and that same issuer has issued other debt, equity or other instruments that are owned by other Clients or by an entity, such as a structured finance vehicle, in which other Clients have an interest.
In each of the situations described above, PIMCO may take actions with respect to the assets held by one Client that are adverse to the other Clients, for example, by foreclosing on loans, by putting an issuer into default, or by exercising rights to purchase or sell to an issuer, causing an issuer to take actions adverse to certain classes of securities, or otherwise. In negotiating the terms and conditions of any such investments, or any subsequent amendments or waivers or taking any other actions, PIMCO may find that the interests of a Client and the interests of one or more other Clients could conflict. In these situations, decisions over items such as whether to make the investment or take an action, proxy voting, corporate reorganization, how to exit an investment, or bankruptcy or similar matters (including, for example, whether to trigger an event of default or the terms of any workout) may result in conflicts of interest. Similarly, if an issuer in which a Client and one or more other Clients directly or indirectly hold different classes of securities (or other assets, instruments or obligations
issued by such issuer or underlying investments of such issuer) encounters financial problems, decisions over the terms of any workout will raise conflicts of interests (including, for example, conflicts over proposed waivers and amendments to debt covenants). For example, a debt holder may be better served by a liquidation of the issuer in which it may be paid in full, whereas an equity or junior bond holder might prefer a reorganization that holds the potential to create value for the equity holders. In some cases PIMCO may refrain from taking certain actions or making certain investments on behalf of Clients in order to avoid or mitigate certain conflicts of interest or to prevent adverse regulatory or other effects on PIMCO, or may sell investments for certain Clients (in each case potentially disadvantaging the Clients on whose behalf the actions are not taken, investments not made, or investments sold). In other cases, PIMCO may not refrain from taking actions or making investments on behalf of certain Clients that have the potential to disadvantage other Clients. In addition, PIMCO may take actions or refrain from taking actions in order to mitigate legal risks to PIMCO or its affiliates or its Clients even if disadvantageous to a Client’s account. Moreover, a Client may invest in a transaction in which one or more other Clients are expected to participate, or already have made or will seek to make, an investment.
Additionally, certain conflicts may exist with respect to portfolio managers who make investment decisions on behalf of several different types of Clients. Such portfolio managers may have an incentive to allocate trades, time or resources to certain Clients, including those Clients who pay higher investment management fees or that pay incentive fees or allocations, over other Clients. These conflicts may be heightened with respect to portfolio managers who are eligible to receive a performance allocation under certain circumstances as part of their compensation.
From time to time, PIMCO personnel may come into possession of MNPI which, if disclosed, might affect an investor’s decision to buy, sell or hold a security. Should a PIMCO employee come into possession of MNPI with respect to an issuer, he or she generally will be prohibited from communicating such information to, or using such information for the benefit of, Clients, which could limit the ability of Clients to buy, sell or hold certain investments, thereby limiting the investment opportunities or exit strategies available to Clients. In addition, holdings in the securities or other instruments of an issuer by PIMCO or its affiliates may affect the ability of a Client to make certain acquisitions of or enter into certain transactions with such issuer. PIMCO has no obligation or responsibility to disclose such information to, or use such information for the benefit of, any person (including Clients). Moreover, restrictions imposed by or through third-party automated trading platforms could affect a Client’s ability to transact through, or the quality of execution achieved through, such platforms.
PIMCO maintains one or more restricted lists of companies whose securities are subject to certain trading prohibitions due to PIMCO’s business activities. PIMCO may restrict trading in an issuer’s securities if the issuer is on a restricted list or if PIMCO has MNPI about that issuer. In some situations, PIMCO may restrict Clients from trading in a particular issuer’s securities in order to allow PIMCO to receive MNPI on behalf of other Clients. A Client may be unable to buy or sell certain securities until the restriction is lifted, which could disadvantage the Client. PIMCO may also be restricted from making (or divesting of) investments in respect of some Clients but not others. In some cases, PIMCO may not initiate or recommend certain types of transactions, or may otherwise restrict or limit its advice relating to certain securities if a security is restricted due to MNPI or if PIMCO is seeking to limit receipt of MNPI.
PIMCO may conduct litigation or engage in other legal actions on behalf of one or more Clients. In such cases, Clients may be required to bear certain fees, costs, expenses and liabilities associated with the litigation. Other Clients that are or were investors in, or otherwise involved with, the subject investments may or may not (depending on the circumstances) be parties to such litigation actions, with the result that certain Clients may participate in litigation actions in which not all Clients with similar investments may participate, and such non-participating Clients may benefit from the results of such litigation actions without bearing or otherwise being subject to the associated fees, costs, expenses and liabilities. PIMCO, for example, typically does not pursue legal claims on behalf of its separate accounts. Furthermore, in certain situations, litigation or other legal actions pursued by PIMCO on behalf of a Client may be brought against or be otherwise adverse to a portfolio company or other investment held by a Client.
Co-Investments. The 1940 Act imposes significant limits on co-investment with affiliates of the Fund. The Fund has received exemptive relief from the SEC that, to the extent the Fund relies on such relief, permits it to (among other things) co-invest with certain other persons, including certain affiliates of the Investment Manager and certain public or private funds managed by the Investment Manager and its affiliates, subject to certain terms and conditions. Co-investment transactions may give rise to conflicts of interest or perceived conflicts of interest among the Fund and its affiliates. The exemptive relief from the SEC with respect to co-investments imposes extensive conditions on any co-investments made in reliance on such relief that may limit or restrict the Fund’s ability to participate in an investment or participate in an investment to a lesser extent. An inability to receive the desired allocation to potential investments may affect the Fund’s ability to achieve the desired investment returns. In the event investment opportunities are allocated among the Fund and its affiliates pursuant to co-investment exemptive relief, the Fund may not be able to structure its investment portfolio in the manner desired. Although PIMCO will endeavor to allocate investment opportunities in a fair and equitable manner, the Fund will generally not be
permitted to co-invest in any issuer in which a fund managed by PIMCO or any of its downstream affiliates (other than the Fund and its downstream affiliates) currently has an investment. However, the Fund would be able to co-invest with funds managed by PIMCO or any of its downstream affiliates, subject to compliance with existing regulatory guidance, applicable regulations and its allocation procedures. Pursuant to co-investment exemptive relief, the Fund will be able to invest in opportunities in which PIMCO and/or its affiliates has an investment, and PIMCO and/or its affiliates will be able to invest in opportunities in which the Fund has made an investment. From time to time, the Fund and its affiliates may make investments at different levels of an issuer’s capital structure or otherwise in different classes of an issuer’s securities. Such investments inherently give rise to conflicts of interest or perceived conflicts of interest between or among the various classes of securities that may be held by such entities. PIMCO has adopted procedures governing the co-investment in securities acquired in private placements with certain clients of PIMCO.
The foregoing is not a complete list of conflicts to which PIMCO or Clients may be subject. PIMCO seeks to review conflicts on a case-by-case basis as they arise. Any review will take into consideration the interests of the relevant Clients, the circumstances giving rise to the conflict, applicable PIMCO policies and procedures, and applicable laws. Clients (and investors in the Fund) should be aware that conflicts will not necessarily be resolved in favor of their interests and may in fact be resolved in a manner adverse to their interests. PIMCO will attempt to resolve such matters fairly, but even so, matters may be resolved in favor of other Clients which pay PIMCO higher fees or performance fees or in which PIMCO or its affiliates have a significant proprietary interest. Clients (and investors in the Fund) should also be aware that the Fund may experience losses associated with decisions or actions directly or indirectly attributable to PIMCO, and PIMCO may determine whether compensation to the Fund for such losses is appropriate in view of its standard of care. PIMCO will attempt to resolve such matters fairly subject to applicable PIMCO policies and procedures, and applicable laws, but even so, such matters may not be resolved in favor of Clients’ (and Fund investors’) interests and may in fact be resolved in a manner adverse to their interests. There can be no assurance that any actual or potential conflicts of interest will not result in a particular Client or group of Clients receiving less favorable investment terms in or returns from certain investments than if such conflicts of interest did not exist.
Conflicts like those described above may also occur between Clients, on the one hand, and PIMCO or its affiliates, on the other. These conflicts will not always be resolved in favor of the Client. In addition, because PIMCO is affiliated with Allianz, a large multi-national financial institution, conflicts similar to those described above may occur between clients of PIMCO and PIMCO’s affiliates or accounts managed by those affiliates. Those affiliates (or their clients), which generally operate autonomously from PIMCO, may take actions that are adverse to PIMCO’s Clients. In many cases, PIMCO will have limited or no ability to mitigate those actions or address those conflicts, which could adversely affect Client performance. In addition, certain regulatory or internal restrictions may prohibit PIMCO from using certain brokers or investing in certain companies (even if such companies are not affiliated with Allianz) because of the applicability of certain laws and regulations or internal Allianz policies applicable to PIMCO, Allianz SE or their affiliates. An account’s willingness to negotiate terms or take actions with respect to an investment may also be, directly or indirectly, constrained or otherwise impacted to the extent Allianz SE, PIMCO, and/or their affiliates, directors, partners, managers, members, officers or personnel are also invested therein or otherwise have a connection to the subject investment (e.g., serving as a trustee or board member thereof).
Certain service providers to the Fund are expected to be owned by or otherwise related to or affiliated with a Client, and in certain cases, such service providers are expected to be, or are owned by, employed by, or otherwise related to, PIMCO, Allianz SE, their affiliates and/or their respective employees, consultants and other personnel. PIMCO may, in its sole discretion, determine to provide, or engage or recommend an affiliate of PIMCO to provide, certain services to the Fund, instead of engaging or recommending one or more third parties to provide such services. Subject to the governance requirements of a particular fund and applicable law, PIMCO or its affiliates, as applicable, will receive compensation in connection with the provision of such services. As a result, PIMCO faces a conflict of interest when selecting or recommending service providers for the Fund. Fees paid to an affiliated service provider will be determined in PIMCO’s commercially reasonable discretion, taking into account the relevant facts and circumstances, and consistent with PIMCO’s responsibilities. Although PIMCO has adopted various policies and procedures intended to mitigate or otherwise manage conflicts of interest with respect to affiliated service providers, there can be no guarantee that such policies and procedures (which may be modified or terminated at any time in PIMCO’s sole discretion) will be successful.
Performance Fees. A portfolio manager may advise certain accounts with respect to which the management fee is based entirely or partially on performance. Performance fee arrangements may create a conflict of interest for the portfolio manager in that the portfolio manager may have an incentive to allocate the investment opportunities that he or she believes might be the most profitable to such other accounts instead of allocating them to the Fund. PIMCO has adopted policies and procedures reasonably designed to allocate investment opportunities between the Fund and such other accounts on a fair and equitable basis over time.
(a)(3)
As of June 30, 2025, the following explains the compensation structure of the individuals who have primary responsibility for day-to-day portfolio management of the Fund:
Portfolio Manager Compensation
PIMCO’s and its affiliates’ approach to compensation seeks to provide professionals with a compensation process that is driven by values of collaboration, openness, responsibility and excellence.
Generally, compensation packages consist of three components. The compensation program for portfolio managers is designed to align with clients’ interests, emphasizing each portfolio manager’s ability to generate long-term investment success for clients, among other factors. A portfolio manager’s compensation is not based solely on the performance of the Fund or any other account managed by that portfolio manager:
Base Salary – Base salary is determined based on core job responsibilities, positions/levels and market factors. Base salary levels are reviewed annually, when there is a significant change in job responsibilities or position, or a significant change in market levels.
Variable Compensation – In addition to a base salary, portfolio managers have a variable component of their compensation, which is based on a combination of individual and company performance and includes both qualitative and quantitative factors. The following non-exhaustive list of qualitative and quantitative factors is considered when determining total compensation for portfolio managers:
| |
• |
|
Performance measured over a variety of longer- and shorter-term periods, including 5- year, 4-year, 3-year, 2- year and 1-year dollar-weighted and account-weighted, pre-tax total and risk-adjusted investment performance as judged against the applicable benchmarks (which may include internal investment performance-related benchmarks) for each account managed by a portfolio manager (including the Fund) and relative to applicable industry peer groups; and |
| |
• |
|
Amount and nature of assets managed by the portfolio manager. |
The variable compensation component of an employee’s compensation may include a deferred component. The deferred portion will generally be subject to vesting and may appreciate or depreciate based on the performance of PIMCO and/or its affiliates. PIMCO’s Long-Term Incentive Plan provides participants with deferred cash awards that appreciate or depreciate based on PIMCO’s operating earnings over a rolling three-year period. Additionally, PIMCO’s Carried Interest Plan provides eligible participants (i.e. those who provide services to PIMCO’s alternative funds) a percentage of the carried interest otherwise payable to PIMCO if the applicable performance measurements described in the alternative fund’s partnership agreements are achieved.
Portfolio managers who are Managing Directors of PIMCO receive compensation from a non-qualified profit sharing plan consisting of a portion of PIMCO’s net profits. Portfolio managers who are Managing Directors receive an amount determined by the Partner Compensation Committee, based upon an individual’s overall contribution to the firm.
(a)(4)
The following summarizes the dollar range of securities of the Fund the Portfolio Managers beneficially owned as of June 30, 2025:
|
|
| |
| Portfolio Manager |
|
Dollar Range of Equity Securities of the Fund Owned as of June 30, 2025 |
| Daniel J. Ivascyn |
|
Over $1,000,000 |
| Alfred T. Murata |
|
$100,001-$500,000 |
| Joshua Anderson |
|
$100,001-$500,000 |
| Sonali Pier |
|
None |
| Jing Yang |
|
None |
| Jamie Weinstein |
|
$100,001-$500,000 |
| Item 14. |
Purchases of Equity Securities by Closed-End Management Investment Company and Affiliated Purchasers. |
None.
| Item 15. |
Submission of Matters to a Vote of Security Holders. |
There have been no material changes to the procedures by which shareholders may recommend nominees to the Fund’s Board of Trustees since the Fund last provided disclosure in response to this item.
| Item 16. |
Controls and Procedures. |
| |
(a) |
The principal executive officer and principal financial & accounting officer have concluded as of a date within 90 days of the filing date of this report, based on their evaluation of the Registrant’s disclosure controls and procedures (as defined in Rule 30a-3(c) under the 1940 Act (17 CFR 270.30a-3(c))), that the design of such procedures is effective to provide reasonable assurance that material information required to be disclosed by the Registrant on Form N-CSR is recorded, processed, summarized and reported within the time periods specified in the Commission’s rules and forms. |
| |
(b) |
There were no changes in the Registrant’s internal control over financial reporting (as defined in Rule 30a-3(d) under the 1940 Act (17 CFR 270.30a-3(d))) that occurred during the period covered by this report that have materially affected, or are reasonably likely to materially affect, the Registrant’s internal control over financial reporting. |
| Item 17. |
Disclosure of Securities Lending Activities for Closed-End Management Investment Companies. |
None.
| Item 18. |
Recovery of Erroneously Awarded Compensation. |
Signatures
Pursuant to the requirements of the Securities Exchange Act of 1934 and the Investment Company Act of 1940, the registrant has duly caused this report to be signed on its behalf by the undersigned, thereunto duly authorized.
|
|
| |
| PIMCO Access Income Fund |
|
| |
| By: |
|
/s/ Joshua D. Ratner |
|
| |
Joshua D. Ratner |
|
| |
President (Principal Executive Officer) |
|
| |
| Date: |
|
September 5, 2025 |
Pursuant to the requirements of the Securities Exchange Act of 1934 and the Investment Company Act of 1940, this report has been signed below by the following persons on behalf of the registrant and in the capacities and on the dates indicated.
|
|
| |
| By: |
|
/s/ Joshua D. Ratner |
|
| |
Joshua D. Ratner |
|
| |
President (Principal Executive Officer) |
|
| |
| Date: |
|
September 5, 2025 |
|
| |
| By: |
|
/s/ Bijal Y. Parikh |
|
| |
Bijal Y. Parikh |
|
| |
Treasurer (Principal Financial & Accounting Officer) |
|
| |
| Date: |
|
September 5, 2025 |