Exhibit (c)(3)
DRAFT | Confidential Preliminary | Subject to Further Review and
Evaluation November 2024 Project Alpha Discussion Materials
Echo Proposal Overview
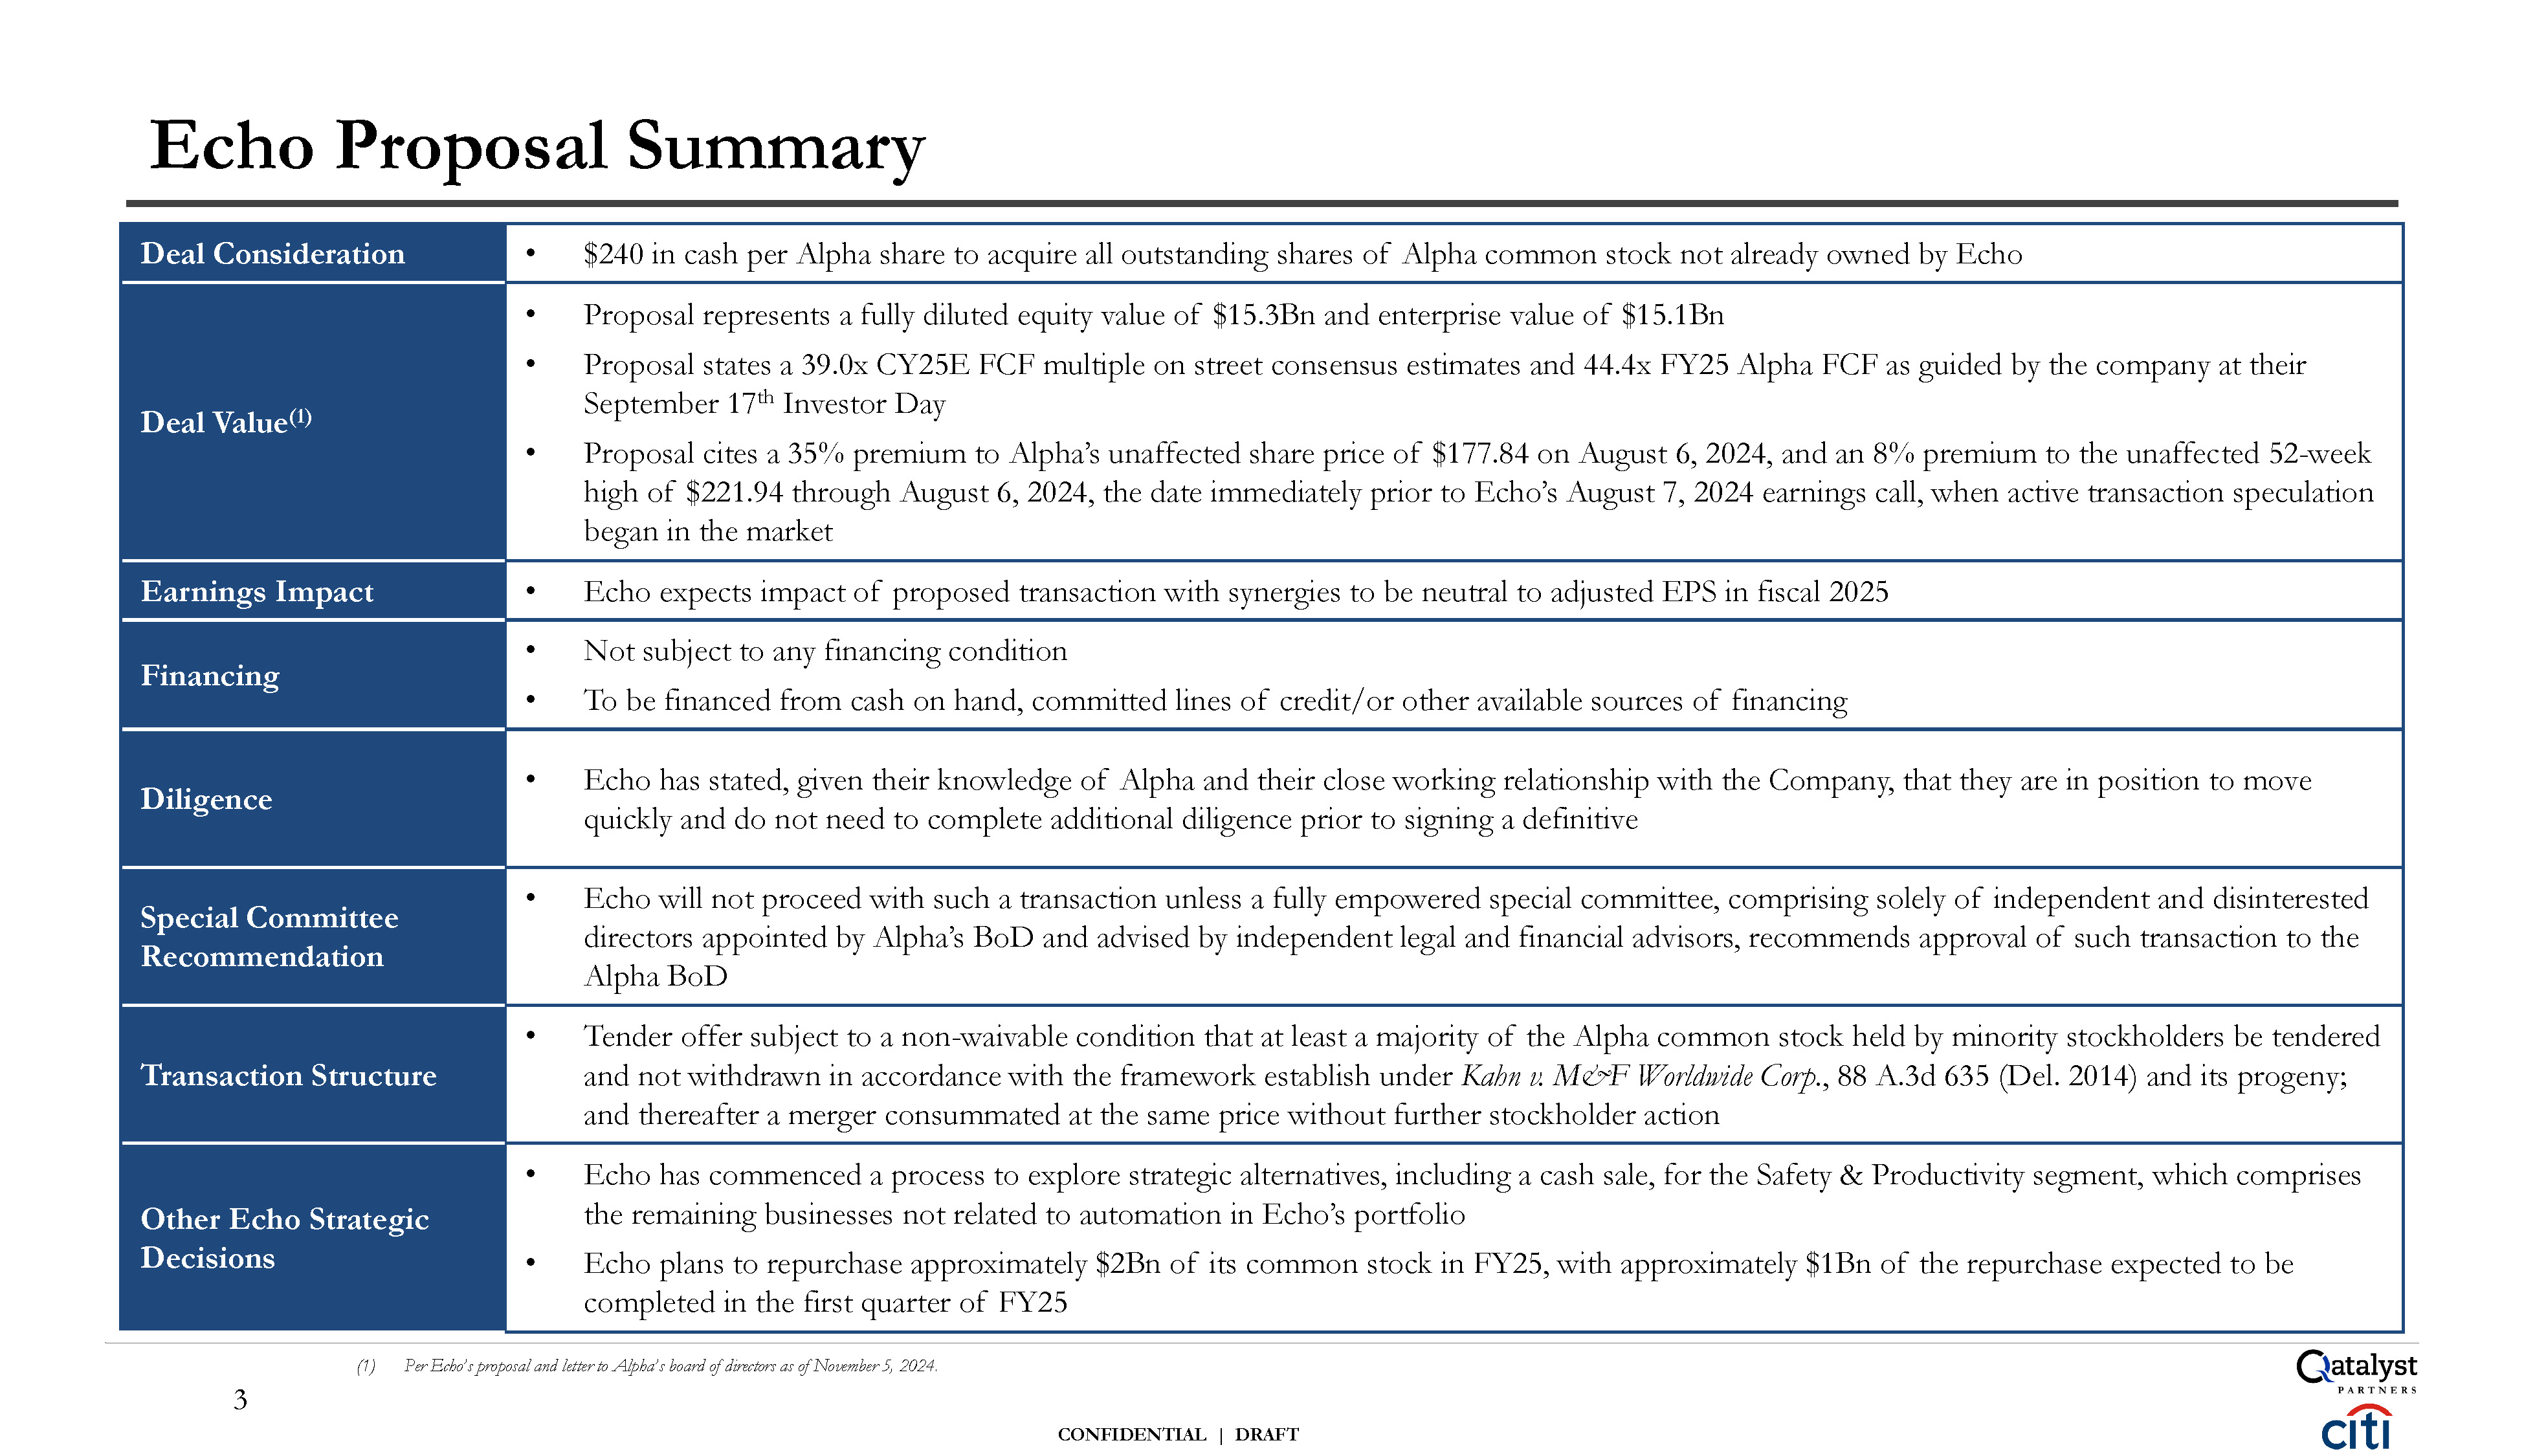
CONFIDENTIAL | DRAFT 3 Deal Consideration $240 in cash per Alpha share to
acquire all outstanding shares of Alpha common stock not already owned by Echo Deal Value(1) Proposal represents a fully diluted equity value of $15.3Bn and enterprise value of $15.1Bn Proposal states a 39.0x CY25E FCF multiple on street
consensus estimates and 44.4x FY25 Alpha FCF as guided by the company at their September 17th Investor Day Proposal cites a 35% premium to Alpha’s unaffected share price of $177.84 on August 6, 2024, and an 8% premium to the unaffected
52-week high of $221.94 through August 6, 2024, the date immediately prior to Echo’s August 7, 2024 earnings call, when active transaction speculation began in the market Earnings Impact Echo expects impact of proposed transaction with
synergies to be neutral to adjusted EPS in fiscal 2025 Financing Not subject to any financing condition To be financed from cash on hand, committed lines of credit/or other available sources of financing Diligence Echo has stated, given
their knowledge of Alpha and their close working relationship with the Company, that they are in position to move quickly and do not need to complete additional diligence prior to signing a definitive Special Committee Recommendation Echo
will not proceed with such a transaction unless a fully empowered special committee, comprising solely of independent and disinterested directors appointed by Alpha’s BoD and advised by independent legal and financial advisors, recommends
approval of such transaction to the Alpha BoD Transaction Structure Tender offer subject to a non-waivable condition that at least a majority of the Alpha common stock held by minority stockholders be tendered and not withdrawn in accordance
with the framework establish under Kahn v. M&F Worldwide Corp., 88 A.3d 635 (Del. 2014) and its progeny; and thereafter a merger consummated at the same price without further stockholder action Other Echo Strategic Decisions Echo has
commenced a process to explore strategic alternatives, including a cash sale, for the Safety & Productivity segment, which comprises the remaining businesses not related to automation in Echo’s portfolio Echo plans to repurchase
approximately $2Bn of its common stock in FY25, with approximately $1Bn of the repurchase expected to be completed in the first quarter of FY25 Echo Proposal Summary (1) Per Echo’s proposal and letter to Alpha’s board of directors as of
November 5, 2024.
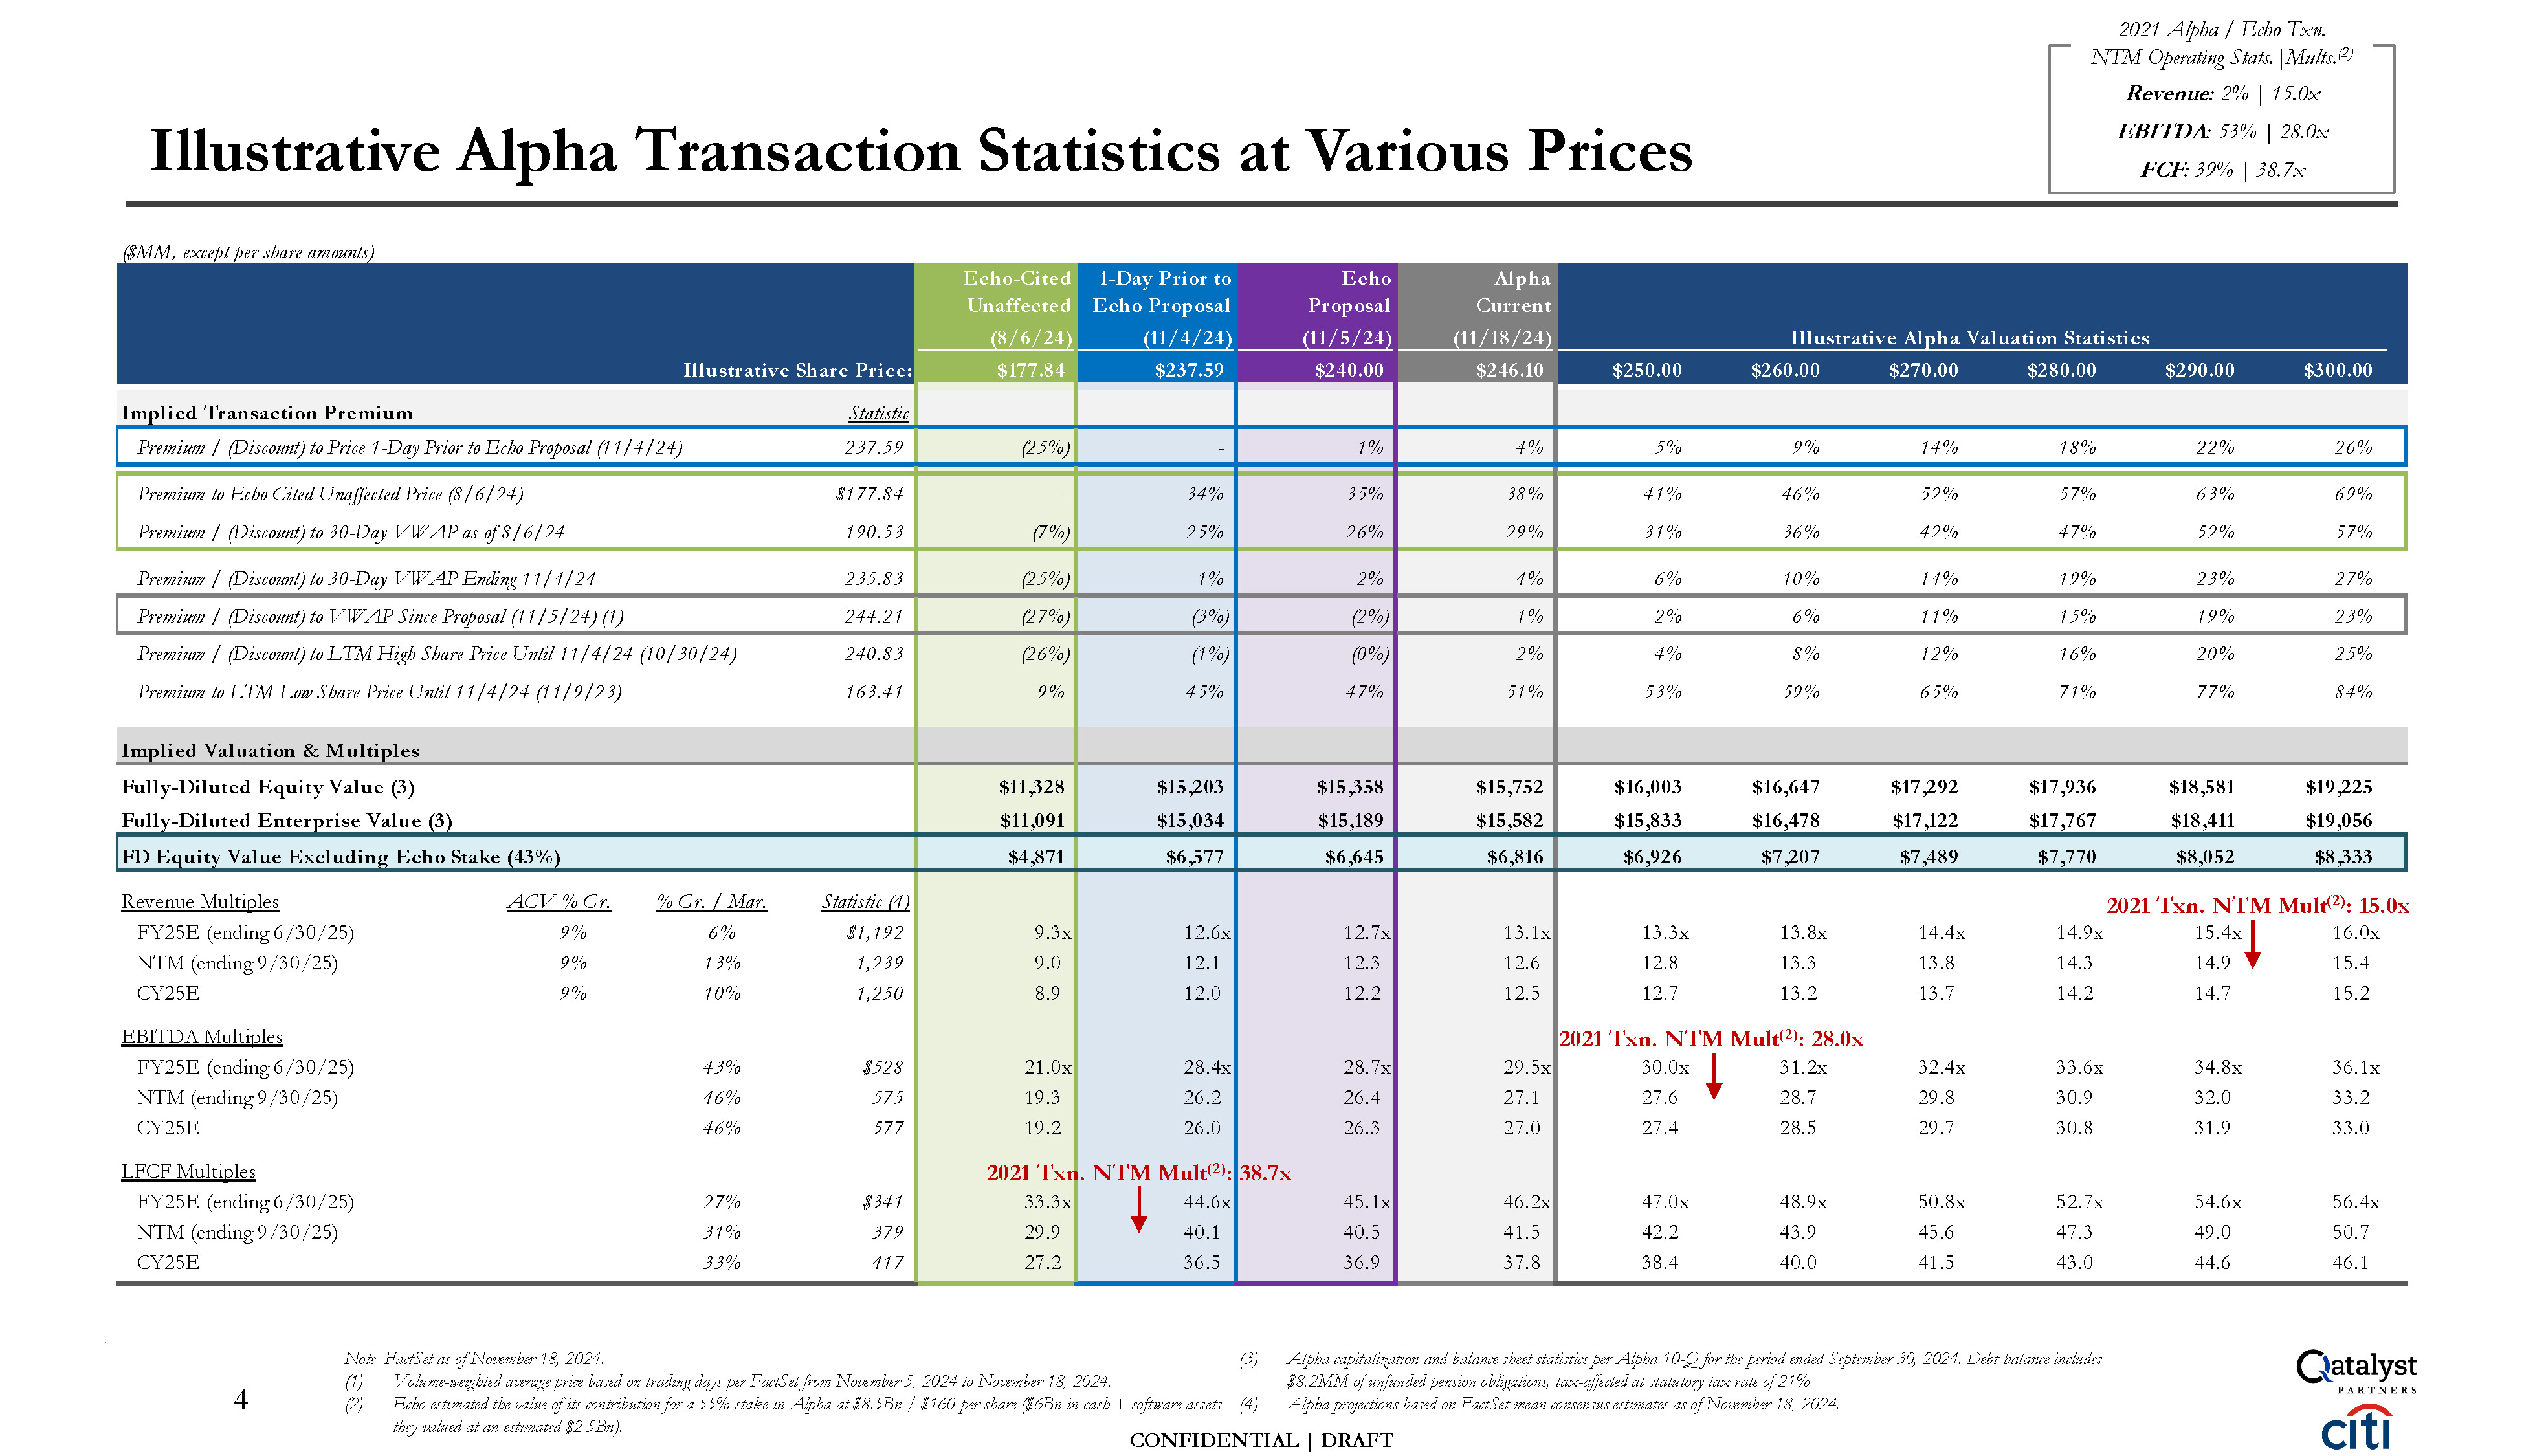
CONFIDENTIAL | DRAFT LFCF Multiples FY25E (ending 6/30/25) NTM (ending 9/30/25)
CY25E 27% 31% 33% $341 379 417 33.3x 29.9 27.2 44.6x 40.1 36.5 45.1x 40.5 36.9 46.2x 41.5 37.8 47.0x 42.2 38.4 48.9x 43.9 40.0 50.8x 45.6 41.5 52.7x 47.3 43.0 54.6x 49.0 44.6 56.4x 50.7 46.1 Illustrative
Alpha Transaction Statistics at Various Prices Note: FactSet as of November 18, 2024. (1) Volume-weighted average price based on trading days per FactSet from November 5, 2024 to November 18, 2024. (2) they valued at an estimated
$2.5Bn). (3) Alpha capitalization and balance sheet statistics per Alpha 10-Q for the period ended September 30, 2024. Debt balance includes $8.2MM of unfunded pension obligations, tax-affected at statutory tax rate of 21%. Echo estimated
the value of its contribution for a 55% stake in Alpha at $8.5Bn / $160 per share ($6Bn in cash + software assets (4) Alpha projections based on FactSet mean consensus estimates as of November 18, 2024. 2021 Txn. NTM Mult(2): 38.7x ($MM,
except per share amounts) Echo-Cited Unaffected (8/6/24) 1-Day Prior to Echo Proposal (11/4/24) Echo Proposal (11/5/24) Alpha Current (11/18/24) Illustrative Alpha Valuation Statistics Illustrative Share
Price: $177.84 $237.59 $240.00 $246.10 $250.00 $260.00 $270.00 $280.00 $290.00 $300.00 Implied Transaction Premium Statistic Premium / (Discount) to Price 1-Day Prior to Echo Proposal
(11/4/24) 237.59 (25%) - 1% 4% 5% 9% 14% 18% 22% 26% Premium to Echo-Cited Unaffected Price (8/6/24) $177.84 - 34% 35% 38% 41% 46% 52% 57% 63% 69% Premium / (Discount) to 30-Day VWAP as of
8/6/24 190.53 (7%) 25% 26% 29% 31% 36% 42% 47% 52% 57% Premium / (Discount) to 30-Day VWAP Ending 11/4/24 235.83 (25%) 1% 2% 4% 6% 10% 14% 19% 23% 27% Premium / (Discount) to VWAP Since Proposal (11/5/24)
(1) 244.21 (27%) (3%) (2%) 1% 2% 6% 11% 15% 19% 23% Premium / (Discount) to LTM High Share Price Until 11/4/24 (10/30/24) 240.83 (26%) (1%) (0%) 2% 4% 8% 12% 16% 20% 25% Premium to LTM Low Share Price Until 11/4/24
(11/9/23) 163.41 9% 45% 47% 51% 53% 59% 65% 71% 77% 84% Implied Valuation & Multiples Fully-Diluted Equity Value (3) $11,328 $15,203 $15,358 $15,752 $16,003 $16,647 $17,292 $17,936 $18,581 $19,225 Fully-Diluted
Enterprise Value (3) $11,091 $15,034 $15,189 $15,582 $15,833 $16,478 $17,122 $17,767 $18,411 $19,056 FD Equity Value Excluding Echo Stake (43%) $4,871 $6,577 $6,645 $6,816 $6,926 $7,207 $7,489 $7,770 $8,052 $8,333 Revenue
Multiples ACV % Gr. % Gr. / Mar. Statistic (4) 2021 Txn. NTM Mult(2): 15.0x FY25E (ending 6/30/25) 9% 6% $1,192 9.3x 12.6x 12.7x 13.1x 13.3x 13.8x 14.4x 14.9x 15.4x 16.0x NTM (ending
9/30/25) 9% 13% 1,239 9.0 12.1 12.3 12.6 12.8 13.3 13.8 14.3 14.9 15.4 CY25E 9% 10% 1,250 8.9 12.0 12.2 12.5 12.7 13.2 13.7 14.2 14.7 15.2 EBITDA Multiples 2021 Txn. NTM Mult(2): 28.0x FY25E (ending
6/30/25) 43% $528 21.0x 28.4x 28.7x 29.5x 30.0x 31.2x 32.4x 33.6x 34.8x 36.1x NTM (ending
9/30/25) 46% 575 19.3 26.2 26.4 27.1 27.6 28.7 29.8 30.9 32.0 33.2 CY25E 46% 577 19.2 26.0 26.3 27.0 27.4 28.5 29.7 30.8 31.9 33.0 2021 Alpha / Echo Txn. NTM Operating Stats.|Mults.(2) Revenue: 2% | 15.0x EBITDA: 53%
| 28.0x FCF: 39% | 38.7x 4
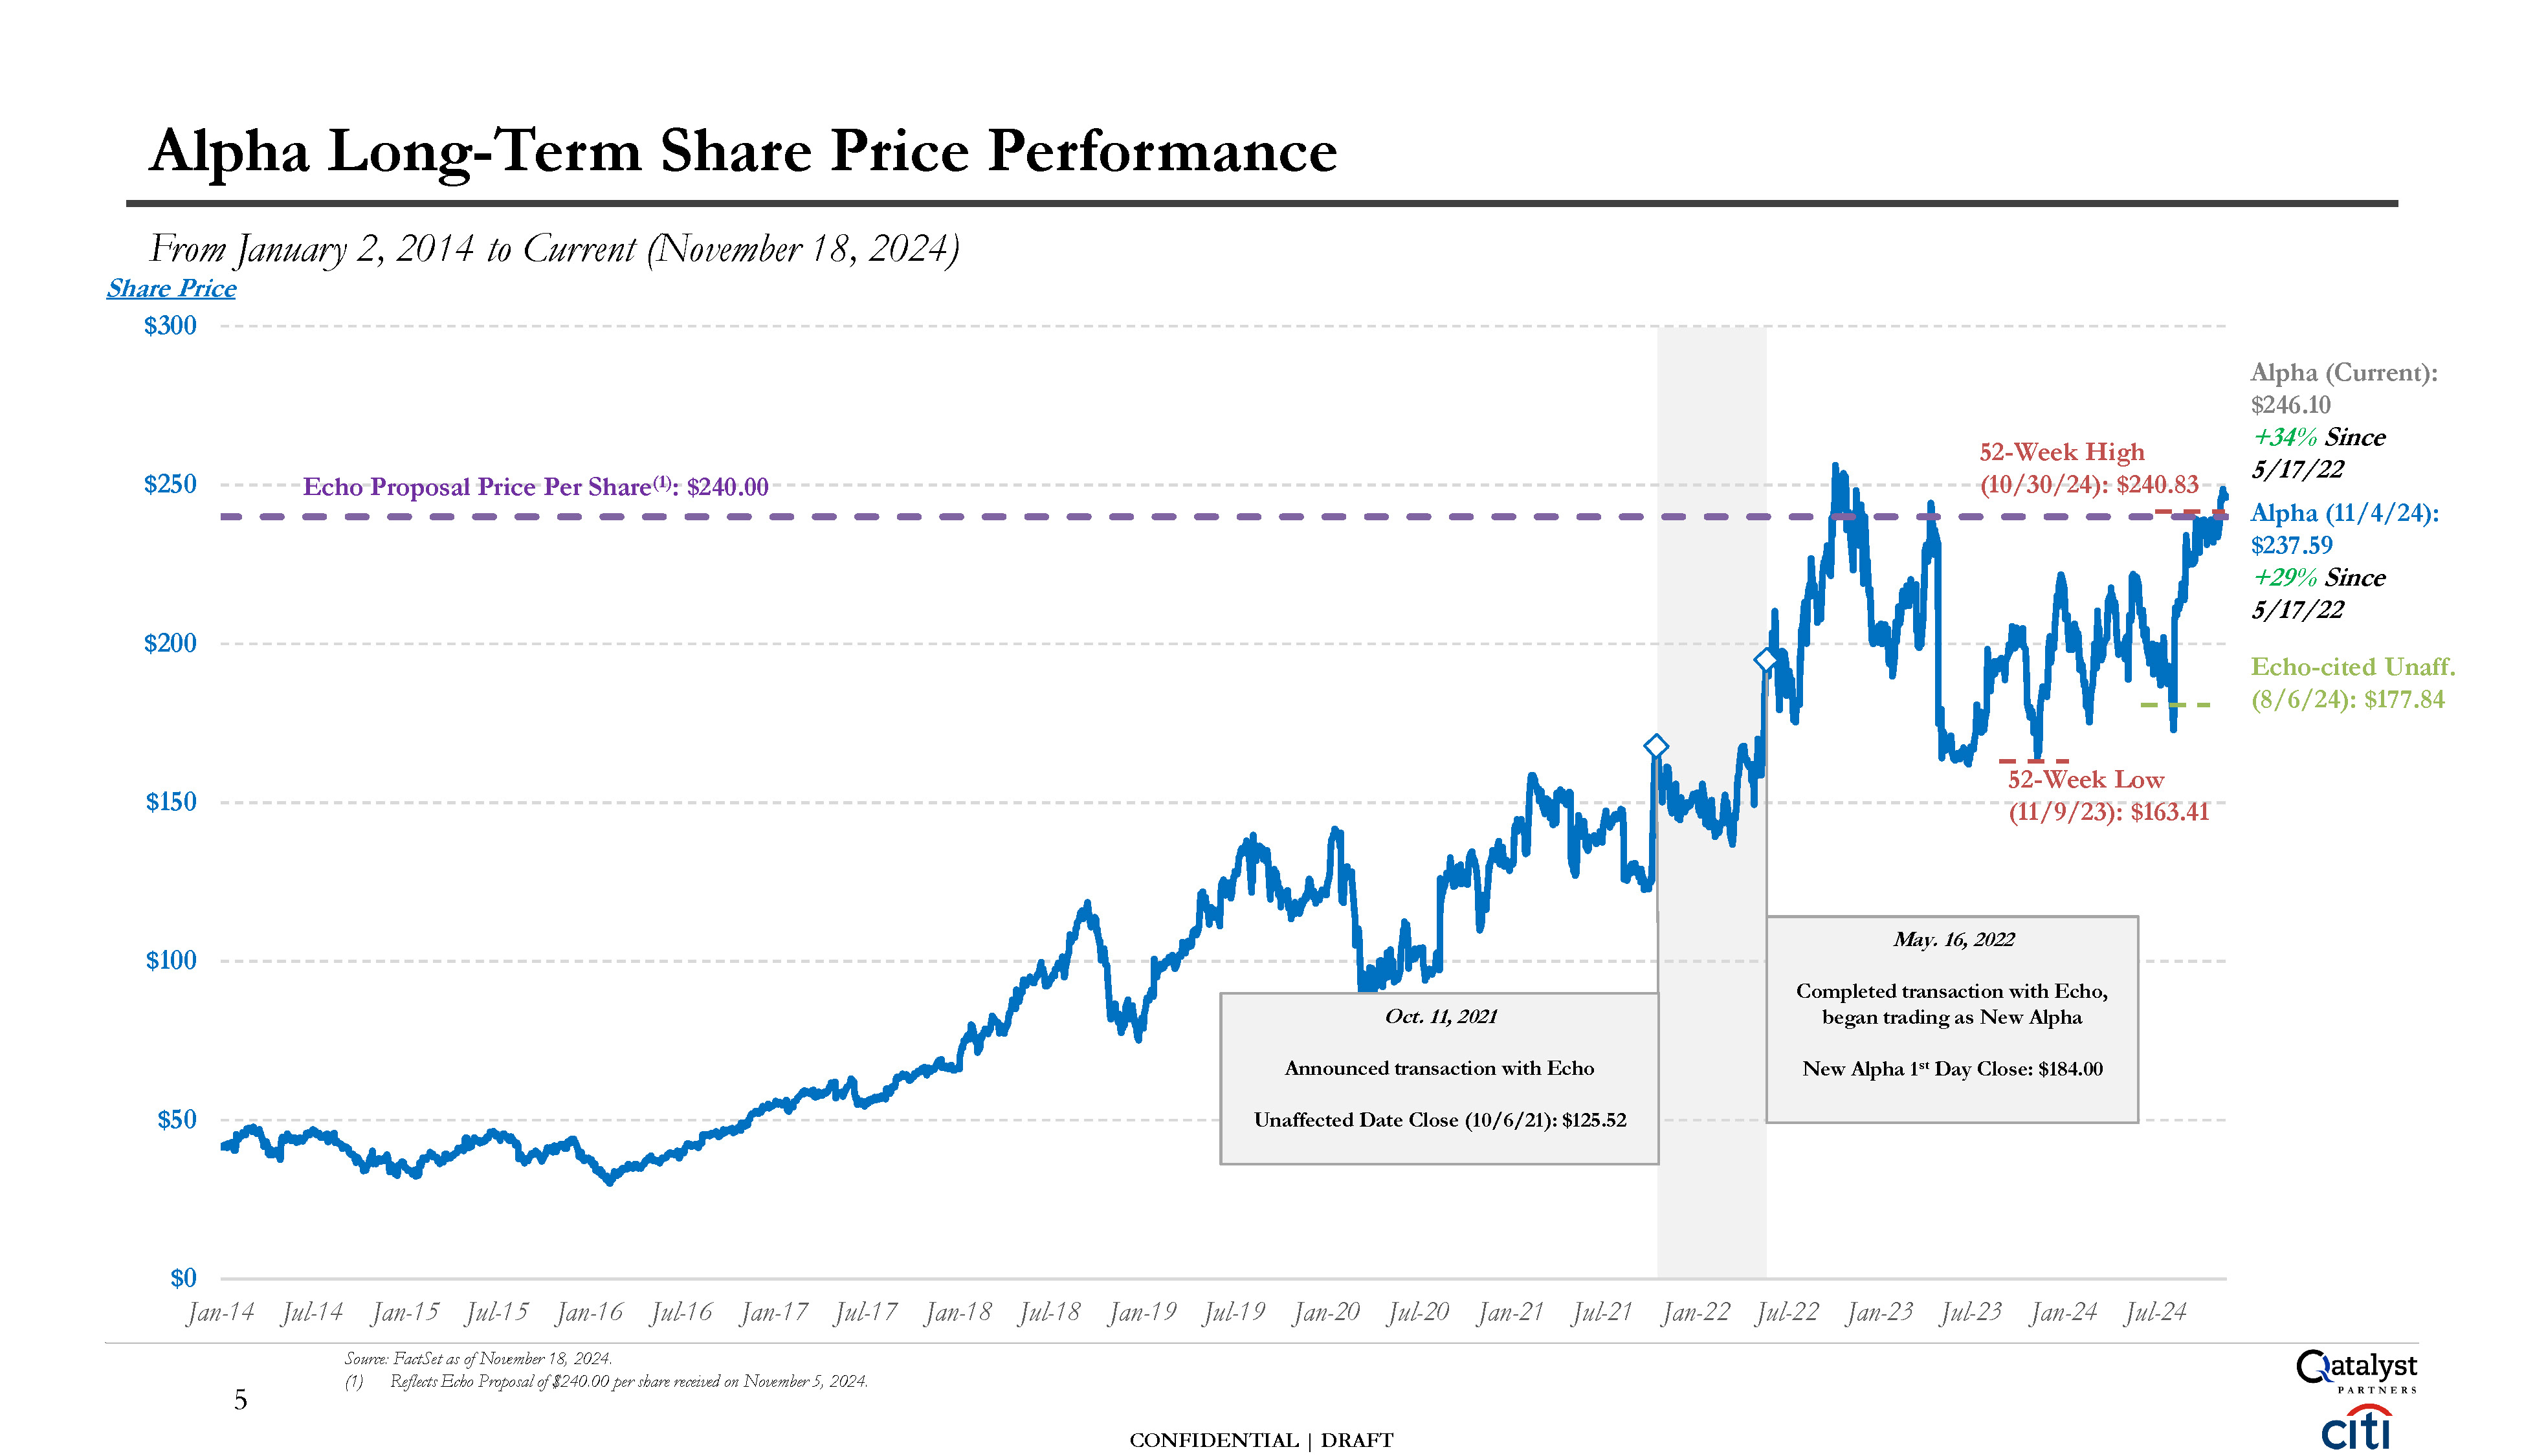
$0 $50 $100 $150 $200 $250 From January 2, 2014 to Current (November 18,
2024) Share Price $300 Jan-14 Jul-14 Jan-15 Jul-15 Jan-16 Jul-16 Jan-17 Jul-17 Jan-18 Source: FactSet as of November 18, 2024. (1) Reflects Echo Proposal of $240.00 per share received on November 5, 2024. Jul-18 Jan-19 Jul-19 Jan-20
Jul-20 Jan-21 Jul-21 Jan-22 Jul-22 Jan-23 Jul-23 Jan-24 Jul-24 Alpha Long-Term Share Price Performance Echo Proposal Price Per Share(1): $240.00 Oct. 11, 2021 Announced transaction with Echo Unaffected Date Close (10/6/21): $125.52 May.
16, 2022 Completed transaction with Echo, began trading as New Alpha New Alpha 1st Day Close: $184.00 52-Week High (10/30/24): $240.83 5 CONFIDENTIAL | DRAFT 52-Week Low (11/9/23): $163.41 Alpha (Current): $246.10 +34% Since
5/17/22 Alpha (11/4/24): $237.59 +29% Since 5/17/22 Echo-cited Unaff. (8/6/24): $177.84
60 6 February 15, 2024, the last unaffected trading date prior to announcement
of a transaction with Renesas. Includes Altair until 10/21/2024, the last unaffected trading date prior to announcement of a transaction with Siemens. (2) Reflects Echo Proposal of $240.00 per share received on November 5, 2024. CONFIDENTIAL
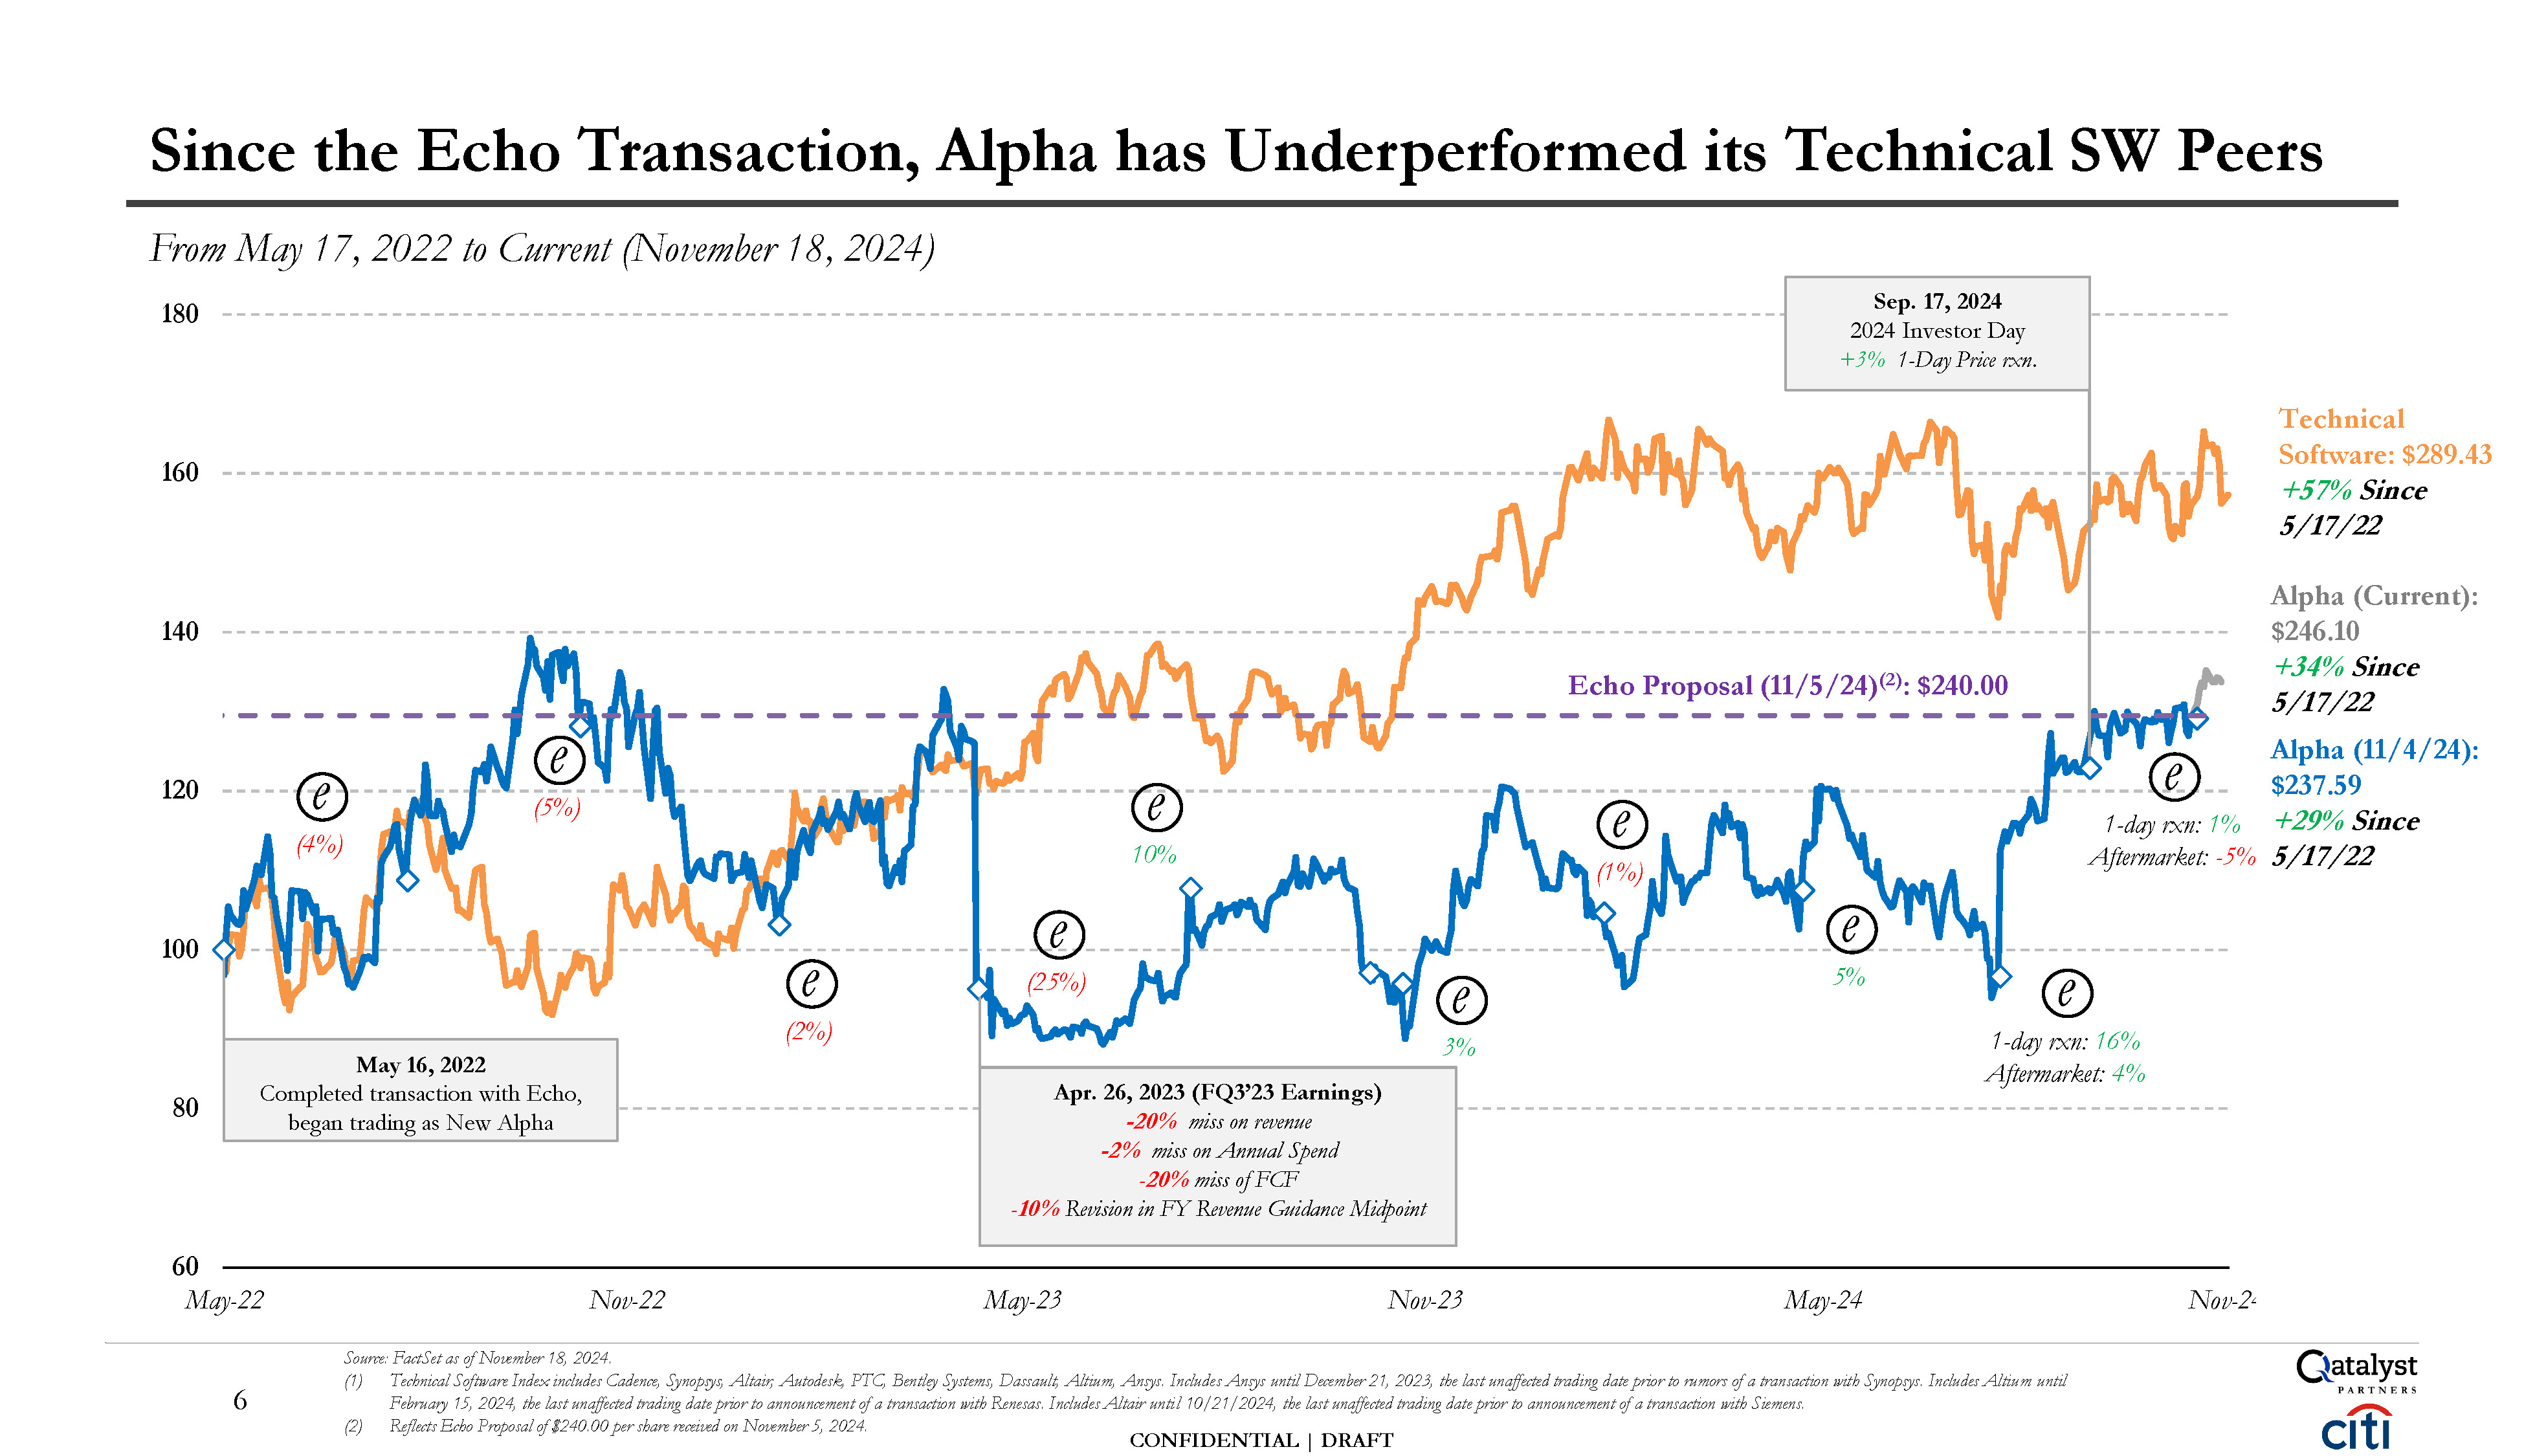
| DRAFT 80 100 120 140 160 180 May-22 Nov-22 May-23 Nov-23 May-24 Source: FactSet as of November 18, 2024. (1) Technical Software Index includes Cadence, Synopsys, Altair, Autodesk, PTC, Bentley Systems, Dassault, Altium, Ansys.
Includes Ansys until December 21, 2023, the last unaffected trading date prior to rumors of a transaction with Synopsys. Includes Altium until Nov-2 Since the Echo Transaction, Alpha has Underperformed its Technical SW Peers From May 17,
2022 to Current (November 18, 2024) Technical Software: $289.43 +57% Since 5/17/22 e 5% e (1%) e 3% e 10% e (25%) e (2%) e (5%) e (4%) May 16, 2022 Completed transaction with Echo, began trading as New Alpha e 1-day rxn:
16% Aftermarket: 4% e 1-day rxn: 1% Echo Proposal (11/5/24)(2): $240.00 Sep. 17, 2024 2024 Investor Day +3% 1-Day Price rxn. Apr. 26, 2023 (FQ3’23 Earnings) -20% miss on revenue -2% miss on Annual Spend -20% miss of FCF -10%
Revision in FY Revenue Guidance Midpoint Alpha (Current): $246.10 +34% Since 5/17/22 Alpha (11/4/24): $237.59 +29% Since Aftermarket: -5% 5/17/22
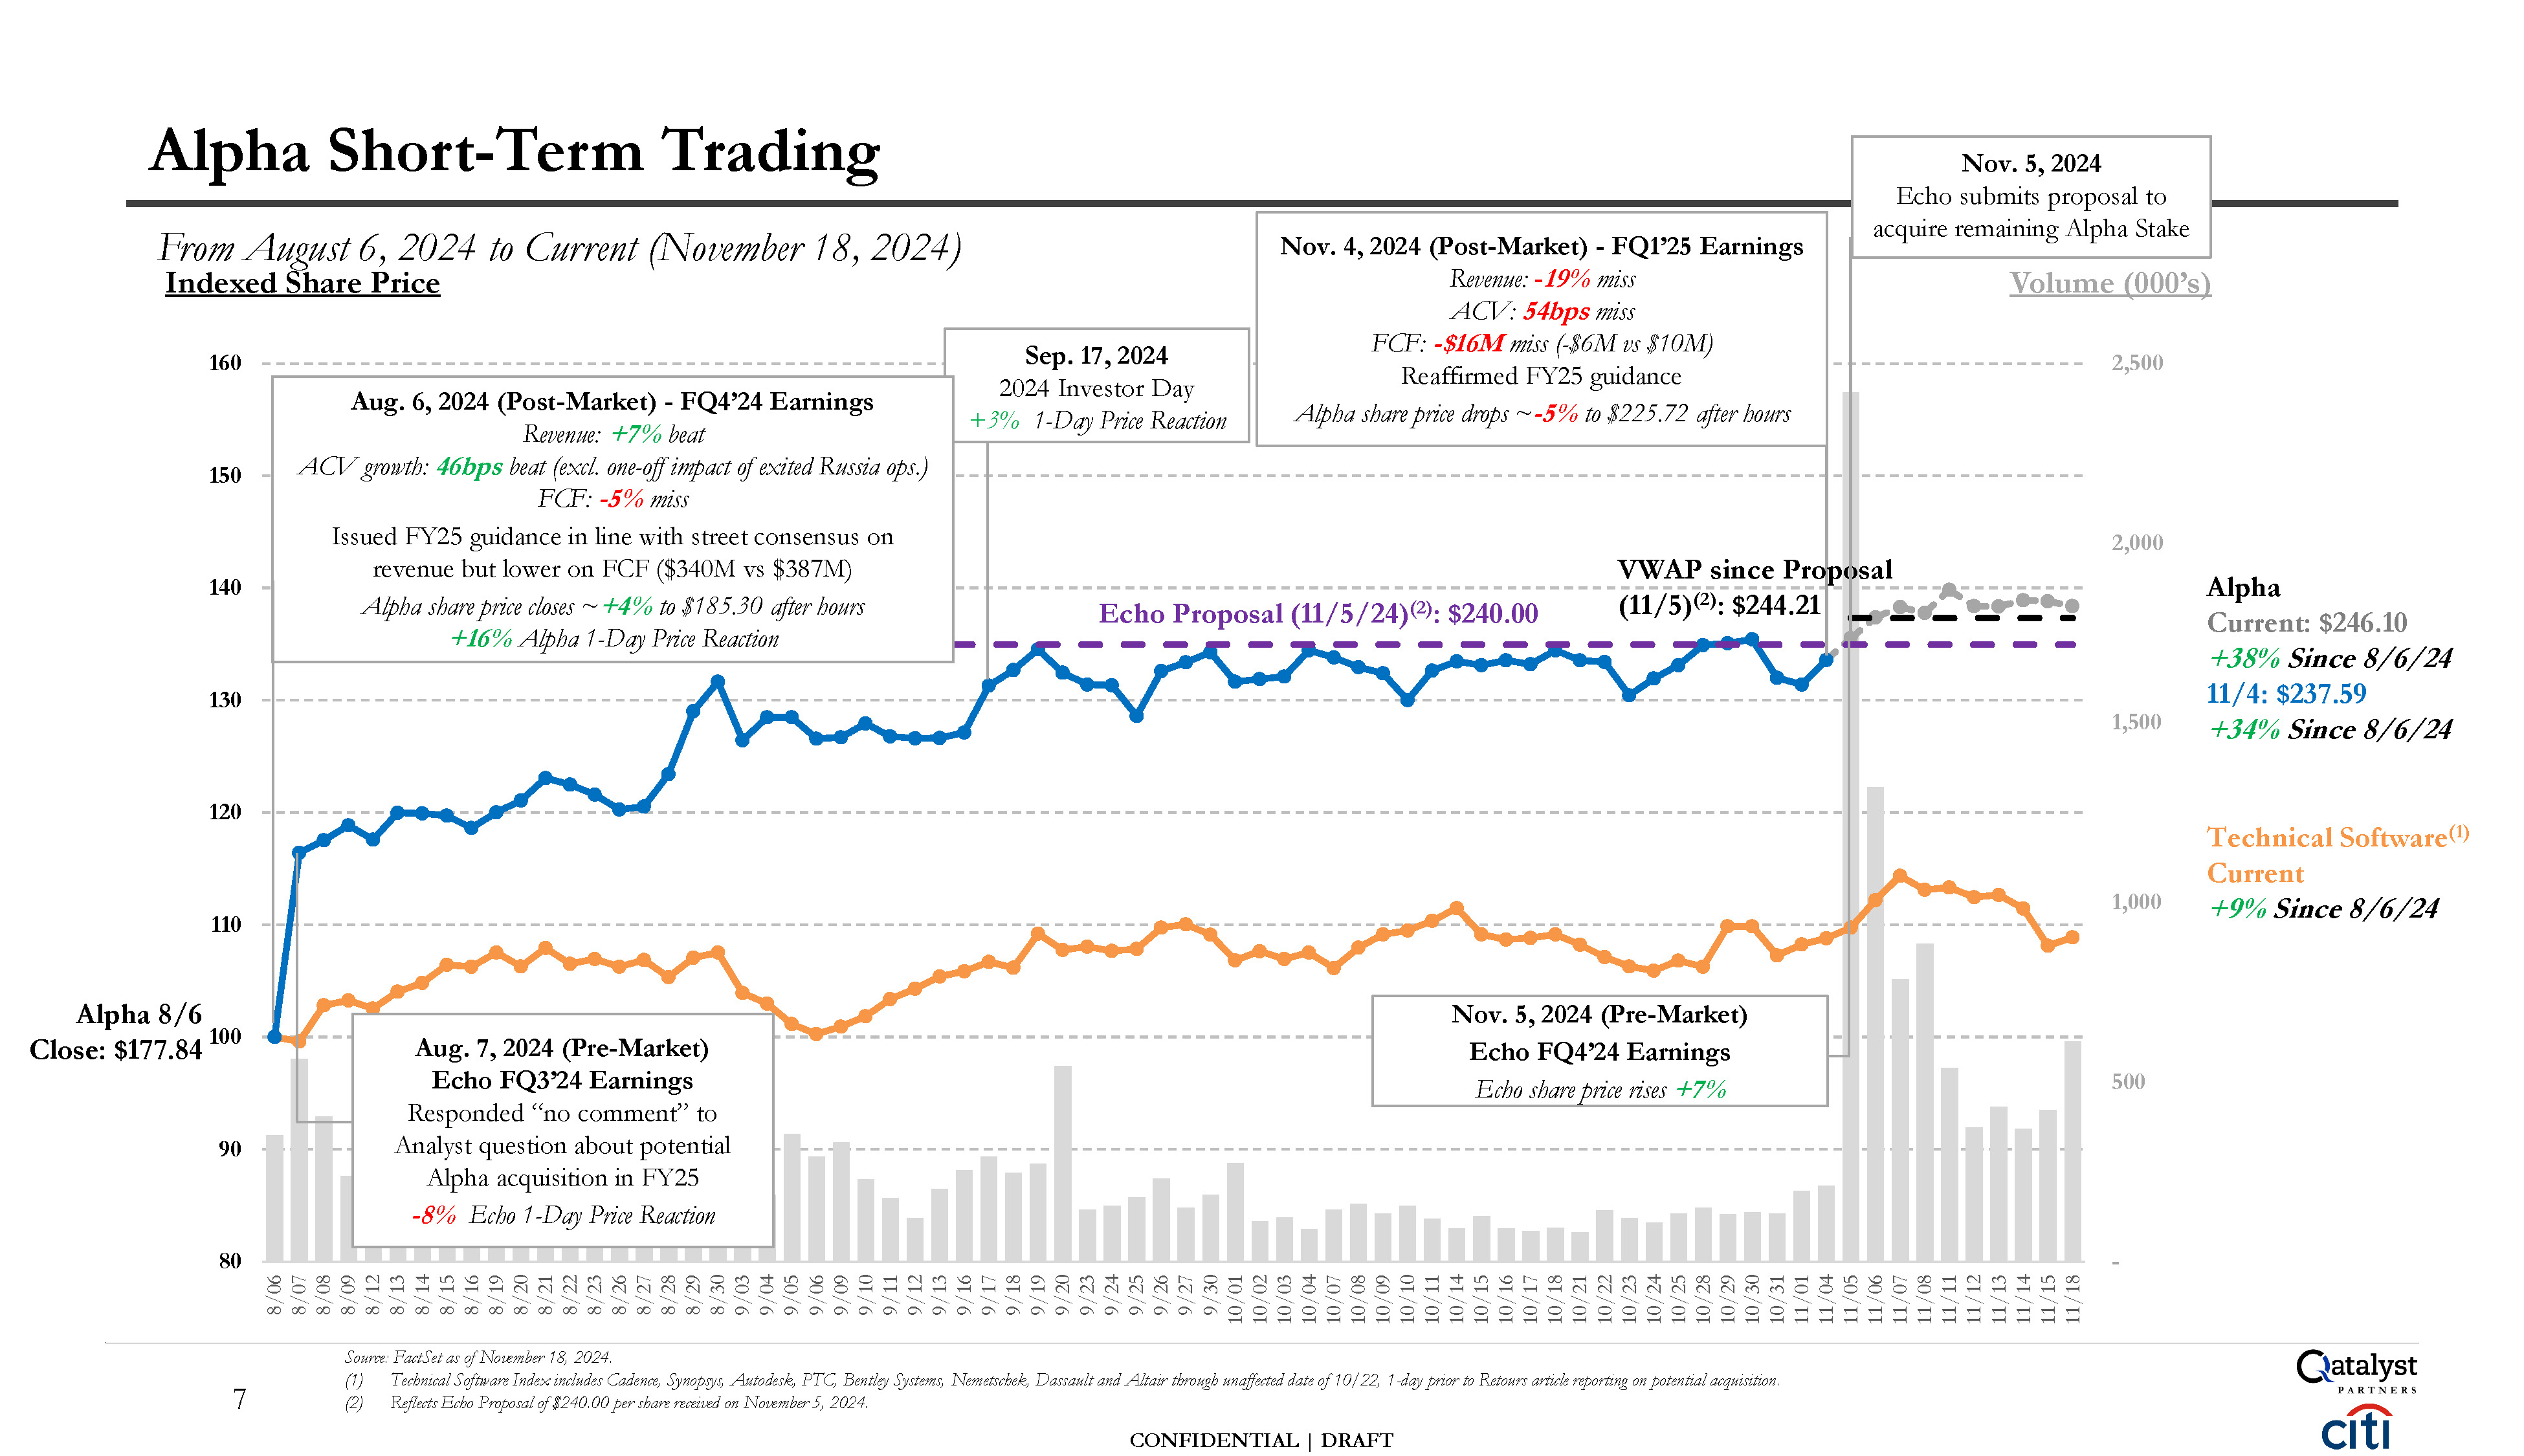
- 500 1,000 1,500 2,000 2,500 80 90 Alpha 8/6 Close: $177.84
100 110 120 130 140 150 160 8/06 8/07 8/08 8/09 8/12 8/13 8/14 8/15 8/16 8/19 8/20 8/21 8/22 8/23 8/26 8/27 8/28 8/29 8/30 9/03 9/04 9/05 9/06 9/09 9/10 9/11 9/12 9/13 9/16 9/17 9/18 9/19 9/20 9/23 9/24 9/25 9/26 9/27 9/30 10/01 10/02 10/03 10/04 10/07 10/08 10/09 10/10 10/11 10/14 10/15 10/16 10/17 10/18 10/21 10/22 10/23 10/24 10/25 10/28 10/29 10/30 10/31 11/01 11/04 11/05 11/06 11/07 11/08 11/11 11/12 11/13 11/14 11/15 11/18 Source:
FactSet as of November 18, 2024. (1) Technical Software Index includes Cadence, Synopsys, Autodesk, PTC, Bentley Systems, Nemetschek, Dassault and Altair through unaffected date of 10/22, 1-day prior to Retours article reporting on potential
acquisition. Alpha Short-Term Trading Volume (000’s) Echo Proposal (11/5/24)(2): $240.00 From August 6, 2024 to Current (November 18, 2024) Indexed Share Price Alpha Current: $246.10 +38% Since 8/6/24 11/4: $237.59 +34% Since
8/6/24 Sep. 17, 2024 2024 Investor Day +3% 1-Day Price Reaction Nov. 4, 2024 (Post-Market) - FQ1’25 Earnings Revenue: -19% miss ACV: 54bps miss FCF: -$16M miss (-$6M vs $10M) Reaffirmed FY25 guidance Alpha share price drops ~-5% to
$225.72 after hours Aug. 6, 2024 (Post-Market) - FQ4’24 Earnings Revenue: +7% beat ACV growth: 46bps beat (excl. one-off impact of exited Russia ops.) FCF: -5% miss Issued FY25 guidance in line with street consensus on revenue but lower on
FCF ($340M vs $387M) Alpha share price closes ~+4% to $185.30 after hours +16% Alpha 1-Day Price Reaction Aug. 7, 2024 (Pre-Market) Echo FQ3’24 Earnings Responded “no comment” to Analyst question about potential Alpha acquisition in
FY25 -8% Echo 1-Day Price Reaction Nov. 5, 2024 (Pre-Market) Echo FQ4’24 Earnings Echo share price rises +7% Technical Software(1) Current +9% Since 8/6/24 VWAP since Proposal (11/5)(2): $244.21 Nov. 5, 2024 Echo submits proposal to
acquire remaining Alpha Stake 7 (2) Reflects Echo Proposal of $240.00 per share received on November 5, 2024. CONFIDENTIAL | DRAFT
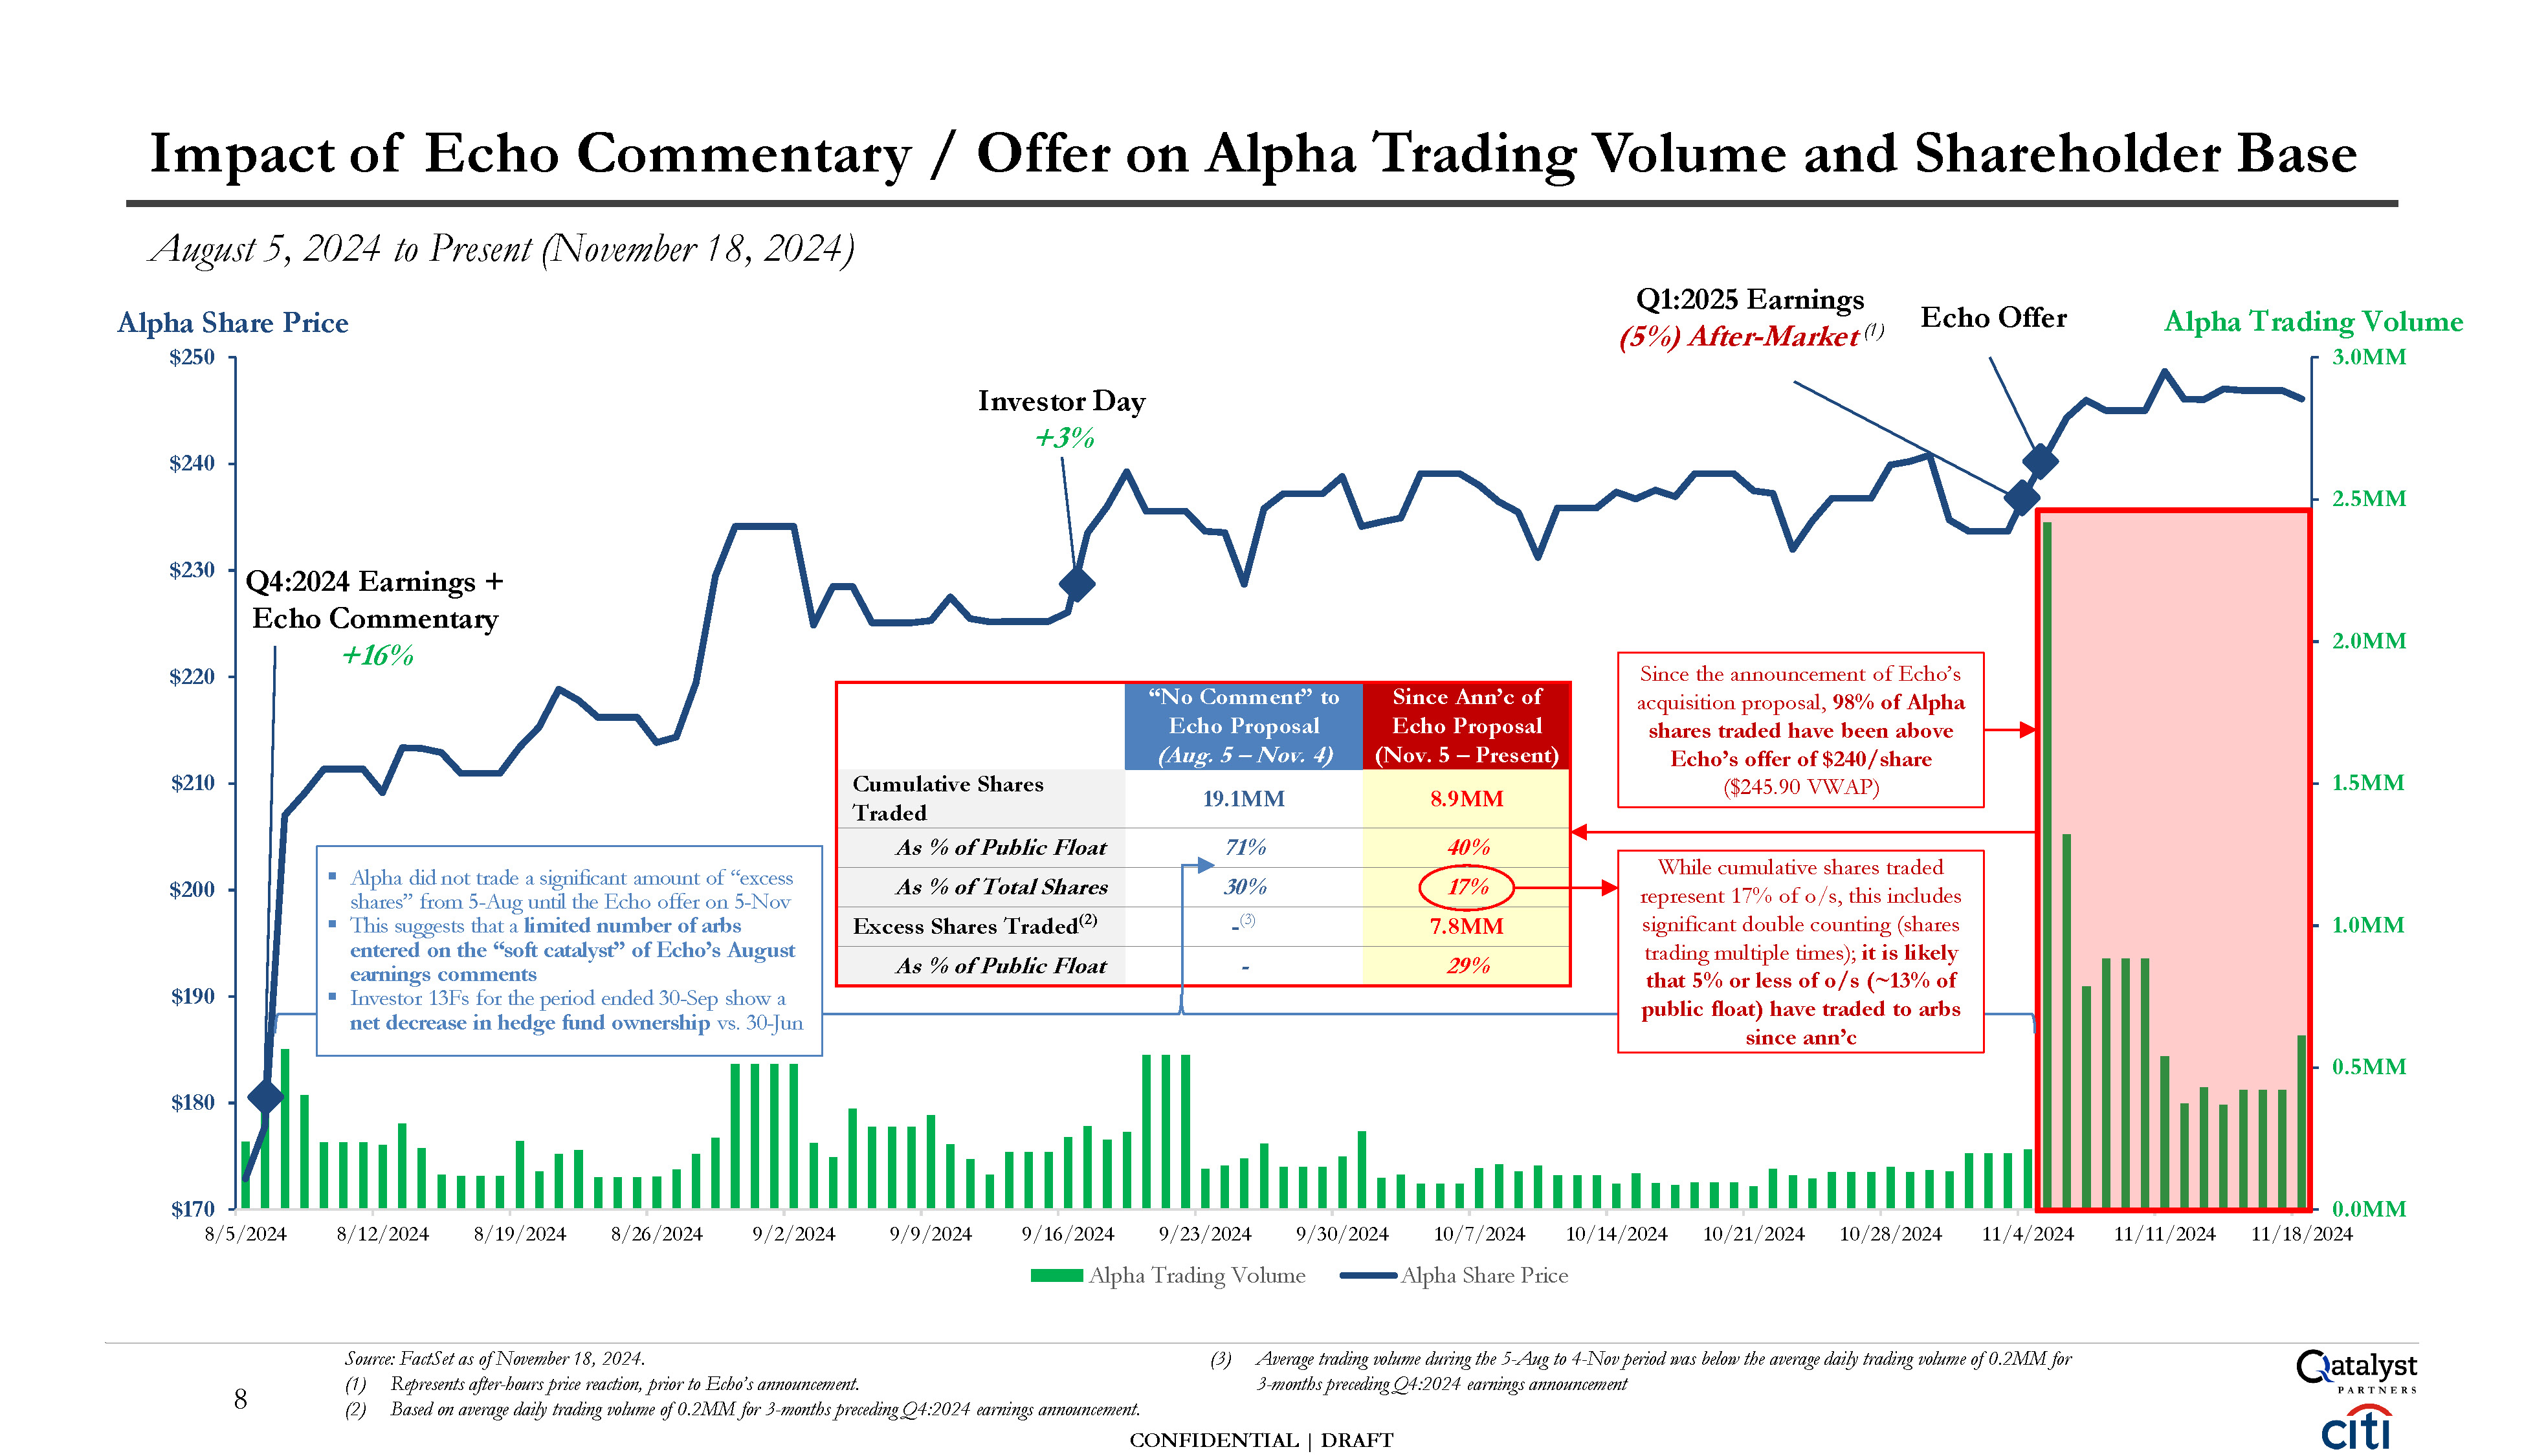
0.0MM 0.5MM 1.0MM 1.5MM 2.0MM 2.5MM 3.0MM $170 $180 $190 $200 $210 $220 $230 $240 $250 8/5/2024 8/12/2024 8/19/2024 8/26/2024 9/2/2024 9/9/2024 9/16/2024
9/23/2024 9/30/2024 10/7/2024 10/14/2024 10/21/2024 10/28/2024 11/4/2024 11/11/2024 11/18/2024 Alpha Trading Volume Alpha Share Price Impact of Echo Commentary / Offer on Alpha Trading Volume and Shareholder Base August 5, 2024 to
Present (November 18, 2024) Alpha Share Price Source: FactSet as of November 18, 2024. (1) Represents after-hours price reaction, prior to Echo’s announcement. (3) Average trading volume during the 5-Aug to 4-Nov period was below the
average daily trading volume of 0.2MM for 3-months preceding Q4:2024 earnings announcement Q4:2024 Earnings + Echo Commentary +16% “No Comment” to Echo Proposal (Aug. 5 – Nov. 4) Since Ann’c of Echo Proposal (Nov. 5 –
Present) Cumulative Shares Traded 19.1MM 8.9MM As % of Public Float 71% 40% As % of Total Shares 30% 17% Excess Shares Traded(2) -(3) 7.8MM As % of Public Float - 29% Q1:2025 Earnings (5%) After-Market (1) Echo Offer Alpha
Trading Volume Investor Day +3% Since the announcement of Echo’s acquisition proposal, 98% of Alpha shares traded have been above Echo’s offer of $240/share ($245.90 VWAP) While cumulative shares traded represent 17% of o/s, this includes
significant double counting (shares trading multiple times); it is likely that 5% or less of o/s (~13% of public float) have traded to arbs since ann’c Alpha did not trade a significant amount of “excess shares” from 5-Aug until the Echo
offer on 5-Nov This suggests that a limited number of arbs entered on the “soft catalyst” of Echo’s August earnings comments Investor 13Fs for the period ended 30-Sep show a net decrease in hedge fund ownership vs. 30-Jun 8 (2) Based on
average daily trading volume of 0.2MM for 3-months preceding Q4:2024 earnings announcement. CONFIDENTIAL | DRAFT
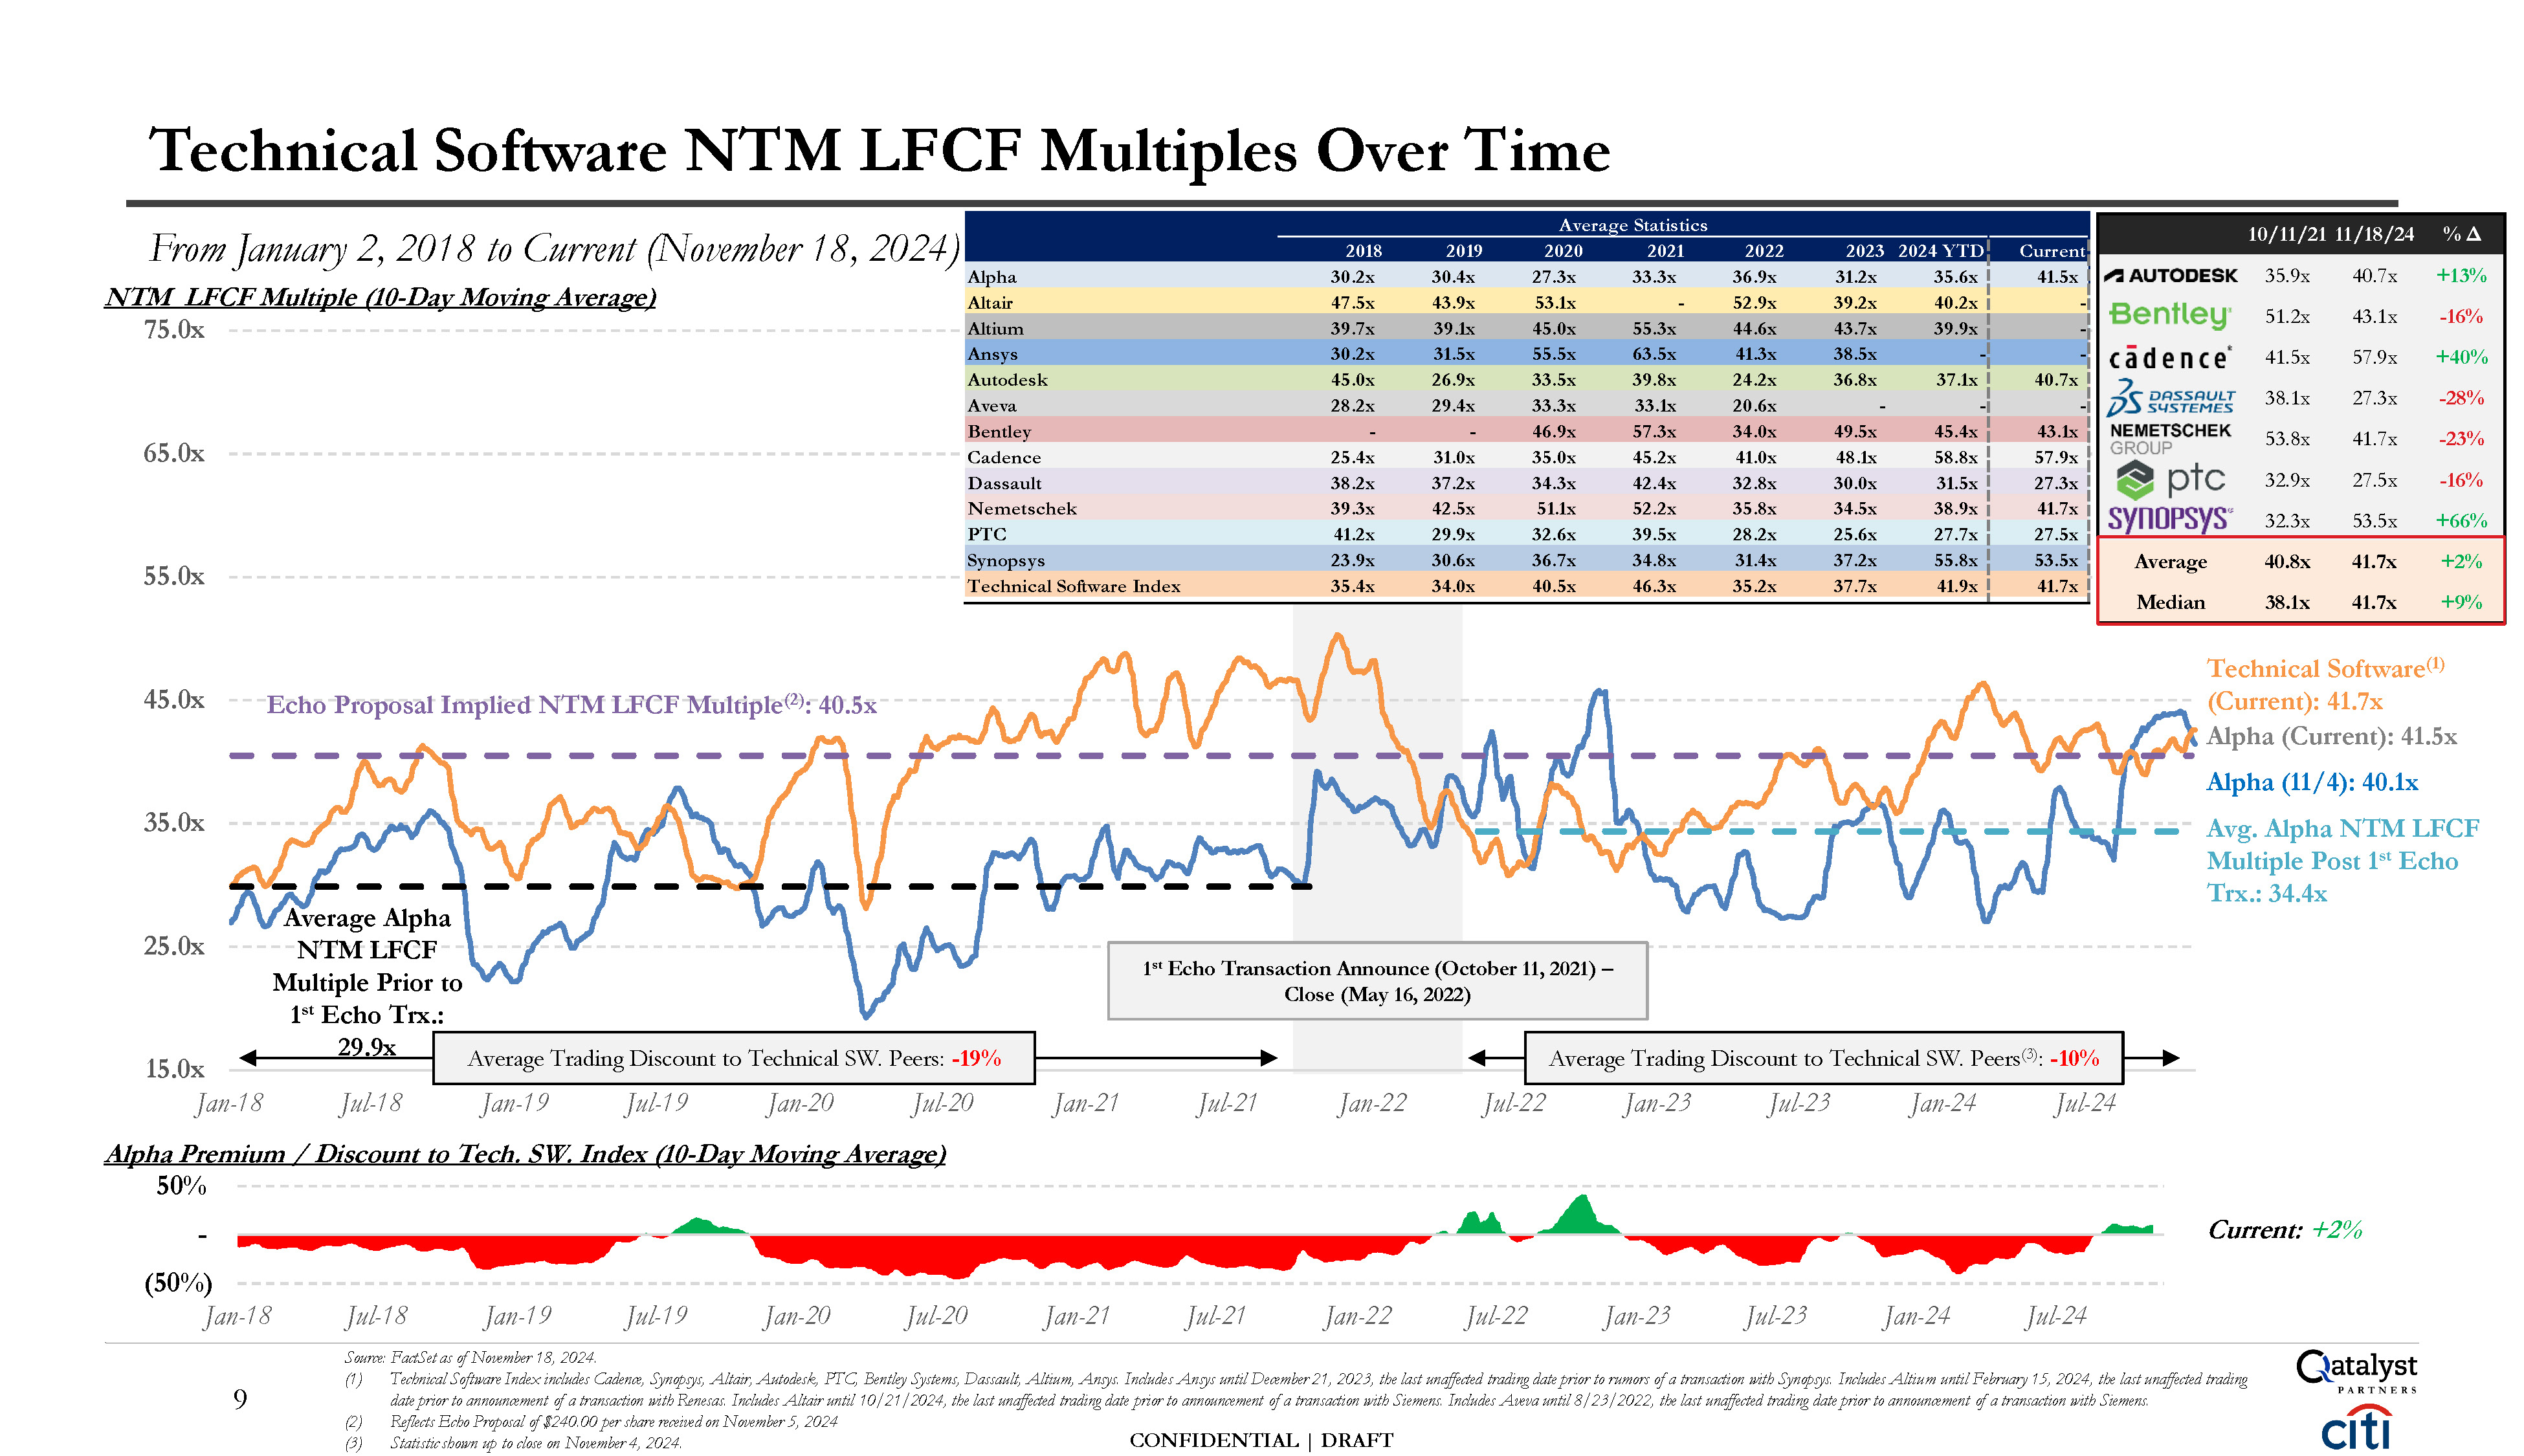
CONFIDENTIAL | DRAFT 15.0x 25.0x 35.0x 45.0x Jan-18 Jul-18 Jan-19 Jul-19
Jan-20 Jul-20 Jan-21 Jul-21 Jan-22 Jul-22 Technical Software NTM LFCF Multiples Over Time 9 Source: FactSet as of November 18, 2024. Technical Software Index includes Cadence, Synopsys, Altair, Autodesk, PTC, Bentley Systems, Dassault,
Altium, Ansys. Includes Ansys until December 21, 2023, the last unaffected trading date prior to rumors of a transaction with Synopsys. Includes Altium until February 15, 2024, the last unaffected trading date prior to announcement of a
transaction with Renesas. Includes Altair until 10/21/2024, the last unaffected trading date prior to announcement of a transaction with Siemens. Includes Aveva until 8/23/2022, the last unaffected trading date prior to announcement of a
transaction with Siemens. Reflects Echo Proposal of $240.00 per share received on November 5, 2024 (3) Statistic shown up to close on November 4, 2024. N 1st Echo Transaction Announce (October 11, 2021) – Close (May 16, 2022) Echo
Proposal Implied NTM LFCF Multiple(2): 40.5x Average Alpha NTM LFCF Multiple Prior to 1st Echo Trx.: 29.9x Technical Software(1) (Current): 41.7x Alpha (Current): 41.5x Alpha (11/4): 40.1x Avg. Alpha NTM LFCF Multiple Post 1st Echo Trx.:
34.4x Average Trading Discount to Technical SW. Peers: -19% Average Trading Discount to Technical SW. Peers(3): -10% Jan-23 Jul-23 Jan-24 Jul-24 Average Statistics From January 2, 2018 to Current (November 18, 2024) 2018 2019 2020 2021
2022 2023 2024 YTD Current 10/11/21 11/18/24 % Δ Alpha 30.2x 30.4x 27.3x 33.3x 36.9x 31.2x 35.6x 41.5x 35.9x 40.7x +13% TM LFCF Multiple (10-Day Moving Average) Altair
Altium 47.5x 39.7x 43.9x 39.1x 53.1x 45.0x 55.3x - 52.9x 44.6x 39.2x 43.7x 40.2x 39.9x - - 51.2x 43.1x -16% Ansys 30.2x 31.5x 55.5x 63.5x 41.3x 38.5x - - 41.5x 57.9x +40% Autodesk 45.0x 26.9x 33.5x 39.8x 24.2x 36.8x 37.1x 40.7x Aveva 28.2x 29.4x 33.3x 33.1x 20.6x - - - 38.1x 27.3x -28% Bentley - - 46.9x 57.3x 34.0x 49.5x 45.4x 43.1x 53.8x 41.7x -23% Cadence 25.4x 31.0x 35.0x 45.2x 41.0x 48.1x 58.8x 57.9x Dassault 38.2x 37.2x 34.3x 42.4x 32.8x 30.0x 31.5x 27.3x 32.9x 27.5x -16% Nemetschek
PTC 39.3x 41.2x 42.5x 29.9x 51.1x 32.6x 52.2x 39.5x 35.8x 28.2x 34.5x 25.6x 38.9x 27.7x 41.7x 27.5x 32.3x 53.5x +66% Synopsys 23.9x 30.6x 36.7x 34.8x 31.4x 37.2x 55.8x 53.5x Average 40.8x 41.7x +2% Technical
Software Index 35.4x 34.0x 40.5x 46.3x 35.2x 37.7x 41.9x 41.7x Median 38.1x 41.7x +9% Alpha Premium / Discount to Tech. SW. Index (10-Day Moving Average) 50% - Current:
+2% (50%) Jan-18 Jul-18 Jan-19 Jul-19 Jan-20 Jul-20 Jan-21 Jul-21 Jan-22 Jul-22 Jan-23 Jul-23 Jan-24 Jul-24
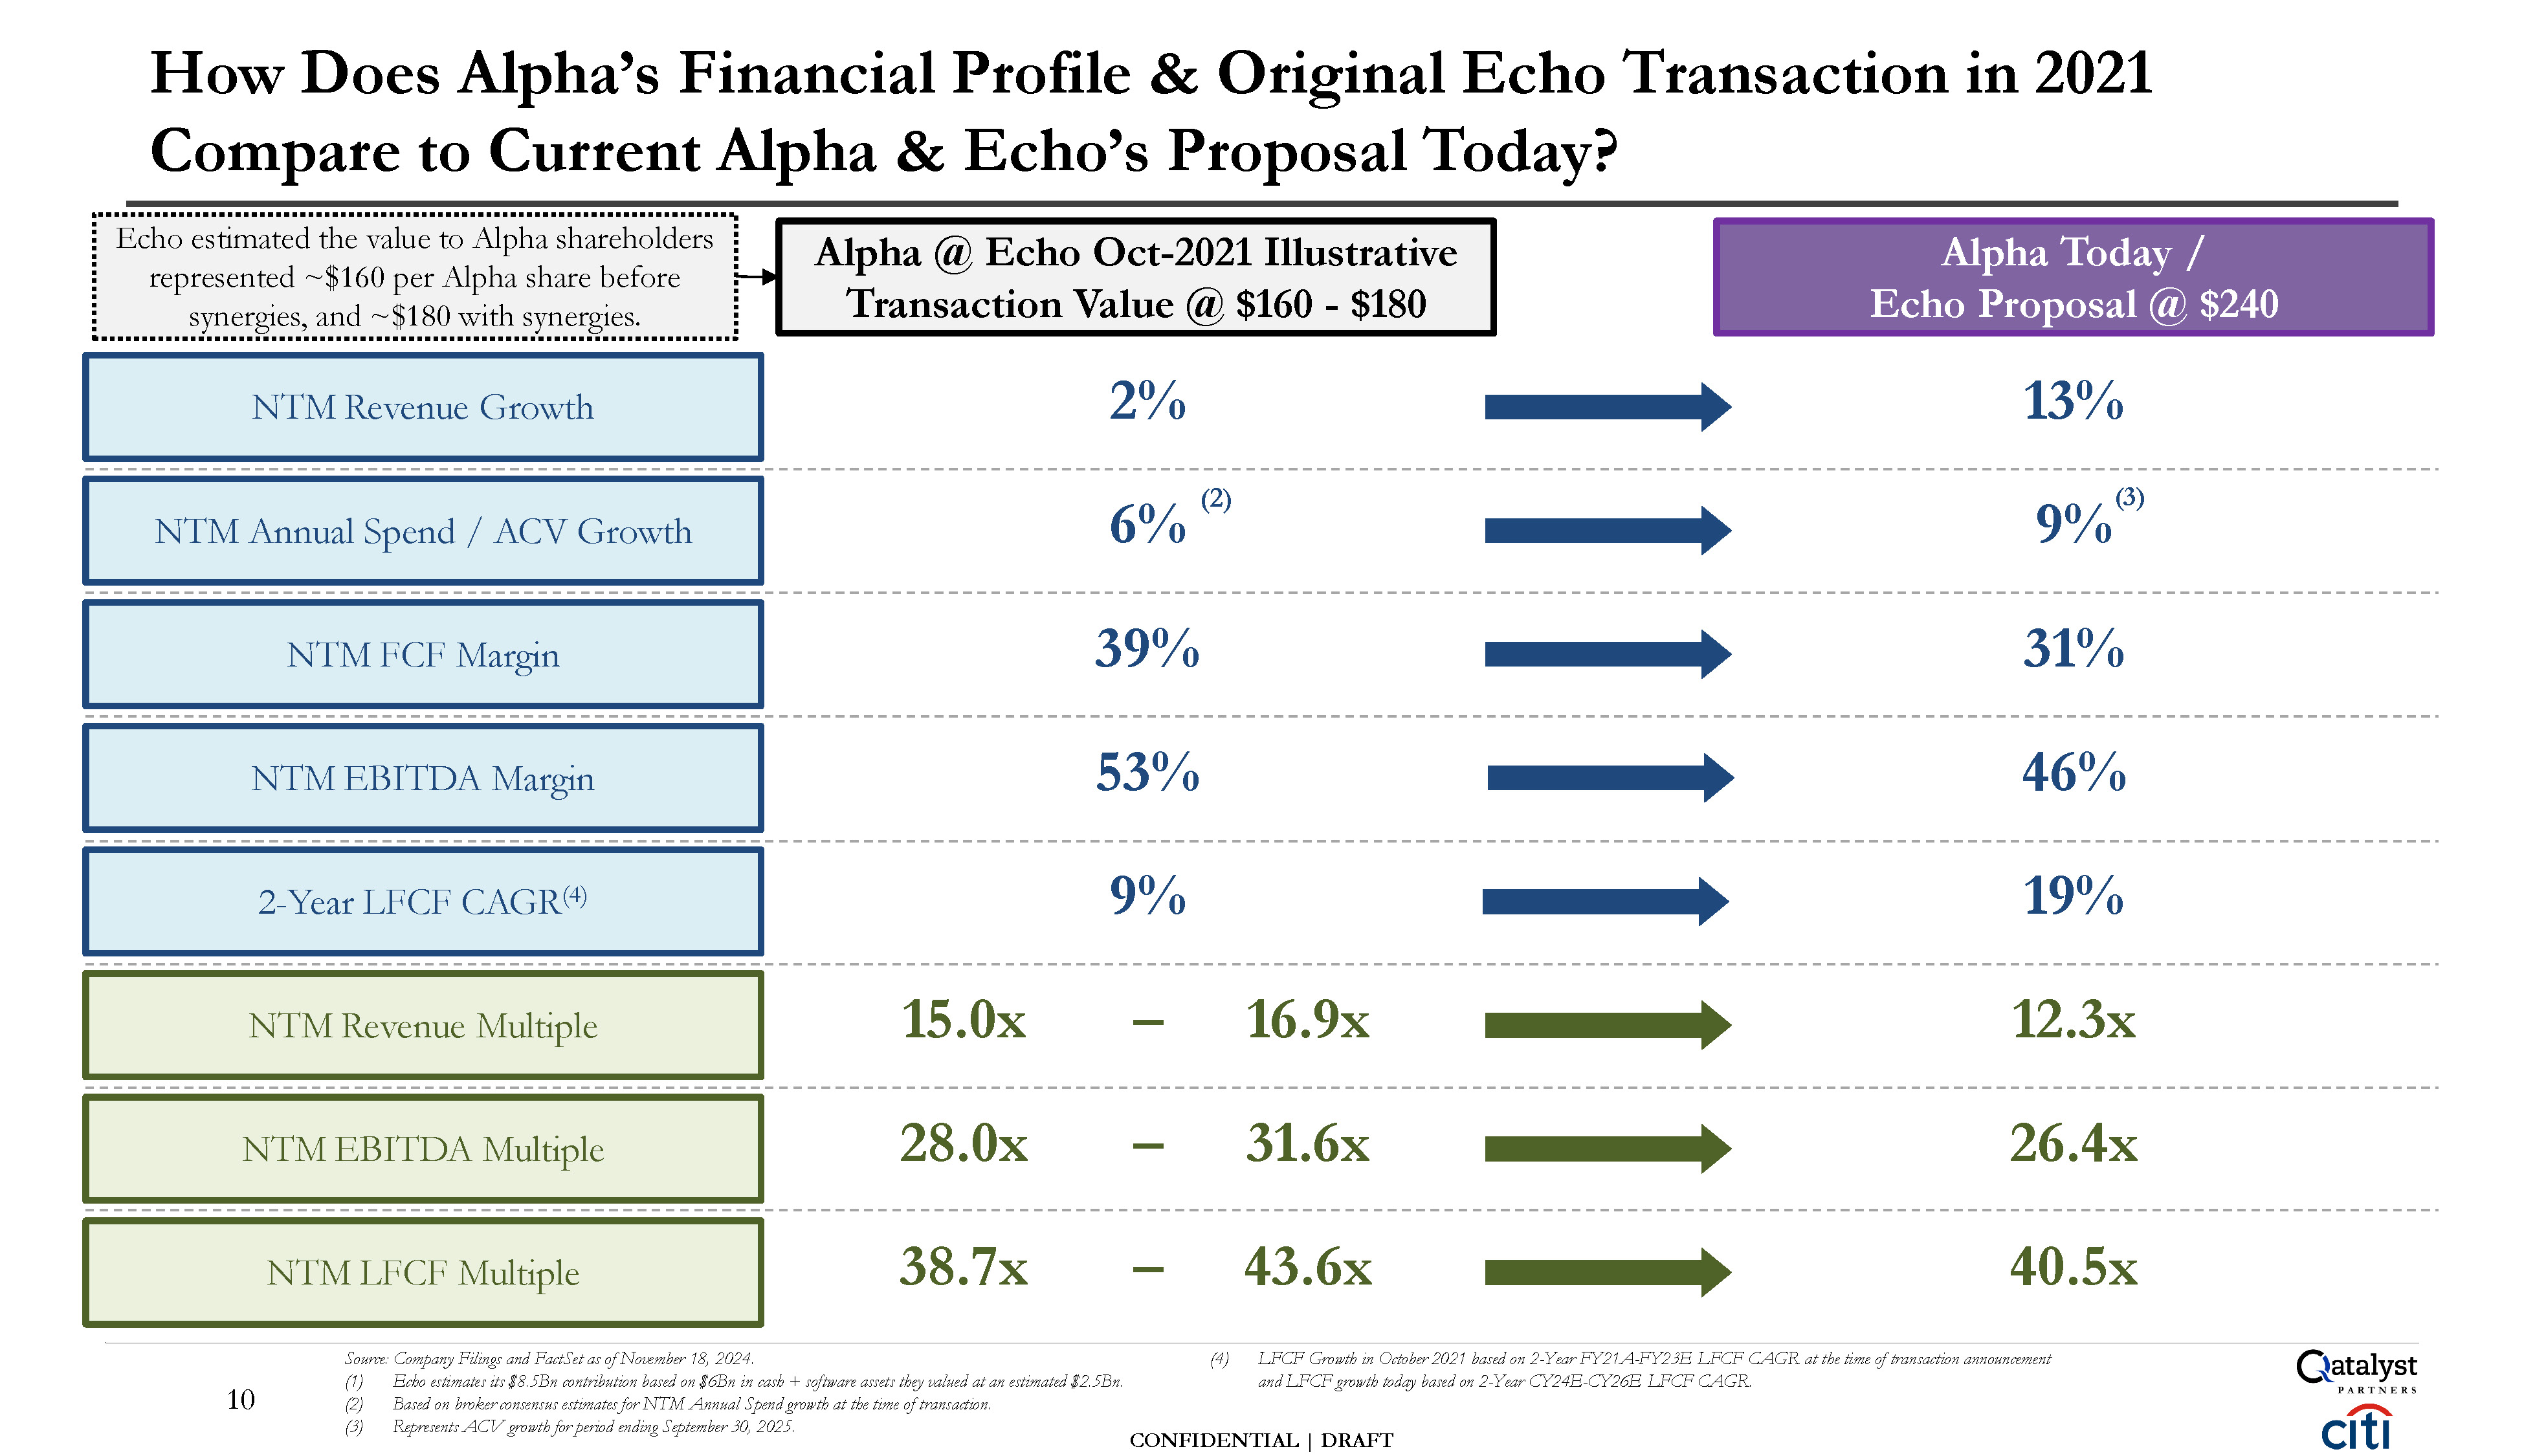
CONFIDENTIAL | DRAFT NTM Annual Spend / ACV Growth NTM FCF Margin 31% 39% NTM
EBITDA Margin 46% 53% 2-Year LFCF CAGR(4) 19% 9% NTM Revenue Growth 13% 2% NTM Revenue Multiple 12.3x 15.0x – 16.9x NTM EBITDA Multiple 26.4x 28.0x – 31.6x NTM LFCF Multiple 38.7x How Does Alpha’s Financial Profile &
Original Echo Transaction in 2021 Compare to Current Alpha & Echo’s Proposal Today? 10 Source: Company Filings and FactSet as of November 18, 2024. Echo estimates its $8.5Bn contribution based on $6Bn in cash + software assets they
valued at an estimated $2.5Bn. Based on broker consensus estimates for NTM Annual Spend growth at the time of transaction. Represents ACV growth for period ending September 30, 2025. – 43.6x 40.5x (4) LFCF Growth in October 2021 based on
2-Year FY21A-FY23E LFCF CAGR at the time of transaction announcement and LFCF growth today based on 2-Year CY24E-CY26E LFCF CAGR. (3) 9% Alpha @ Echo Oct-2021 Illustrative Transaction Value @ $160 - $180 Alpha Today / Echo Proposal @
$240 Echo estimated the value to Alpha shareholders represented ~$160 per Alpha share before synergies, and ~$180 with synergies. 6% (2)

NTM Multiples NTM Op Stats (1) Announce Date Precedent Transaction Rev.
Growth 10/30/24 Revenue EBITDA LFCF 14.5x 62.1x 78.2x 8% EBITDA LFCF Margin Growth Margin 23% 4%
19% 03/05/24 13.8x – – – – – – 02/15/24 16.3x 44.1x 60.6x 25% 37% NM 28% 01/16/24 14.5x 33.5x 48.8x 12% 43% 12% 29% 10/12/21 15.0x 28.0x 38.7x 2% 53% 1% 39% Average: 14.8x 41.9x 56.6x 11% 39% 6% 29% Alpha
@ $240 Echo Proposal (2) 12.3x 26.4x 40.5x 13% 46% 21% 31% NTM ACV Growth: 9% Precedent Technical Software Transactions Note: Multiples greater than 80.0x or negative excluded. (1) NTM revenue based on mean analyst consensus estimates for
the next 12-month period as of transaction announcement. Alpha (@ $160) Echo 11 (2) FactSet mean consensus estimates as of November 18, 2024. CONFIDENTIAL | DRAFT

Selected Transaction Statistics Selected Public Software Transactions Above $1
Billion Since 2011 with Revenue Growth Between ~0% and 20% and LFCF Margin > ~20%(1) Note: Multiples greater than 80.0x or negative shown as dashes. Overall median and percentiles do not include Alpha @ $180 transaction. AVEVA statistics
reflect 2022 buy-out of its minority shareholders by Schneider Electric. Echo estimated the value of its contribution for a 55% stake in Alpha at $8.5Bn / $160 per share ($6Bn in cash + software NTM Revenue Multiples of Selected
Transactions(2) Legend Recent Technical SW Transactions Oct. 2021 Echo Transaction NTM LFCF Multiples of Selected Transactions(2) NTM EBITDA Multiples of Selected Transactions(2) 25th Percentile: 3.9x th 75 Percentile: 29.9x 25th
Percentile: 15.4x Alpha @ $240: 12.3x (4) 25th Percentile: 16.6x Alpha @ $240: 26.4x (4) (4) 16.9x(4)16.3x 15.0x 14.5x 14.5x 9.7x 9.3x 8.8x 8.8x 8.6x 8.4x 8.2x 7.5x(3) 7.5x 7.4x 7.2x 7.1x 6.9x 6.4x 6.4x 5.9x 5.6x 5.1x
5.1x 4.8x 4.3x 4.1x 3.7x 3.7x 3.4x 3.2x 3.2x 3.2x 3.1x 2.5x 2.3x 75th Percentile: 8.5x Overall Median: 6.4x Alpha @ $180 Altium Alpha @ $160 Altair Ansys Black Knight Red
Hat Inovalon Mimecast Commerce Hub Coupa RealPage AVEVA Medidata McAfee PowerSchool Splunk Instructure Advent Software Smartsheet Cornerstone
OnDemand Squarespace VMware Citrix Cerner Informatica DealerTrack Infoblox Mentor Graphics LogMeIn AVG Riverbed Blackboard BMC Quest Software Neustar 78.2x 60.6x 48.8x 43.6x(4)41.5x 40.6x 39.3x 38.7x 37.8x 33.8x 33.4x(3)31.1x
29.3x 28.2x 28.2x 26.8x 24.1x 23.9x 23.2x 22.1x 21.9x 20.1x 20.0x 18.4x 17.9x 16.6x 16.2x 15.5x 14.5x 14.0x 13.2x 12.8x 10.6x 5.9x - - Alpha @ $240: 40.5x 75th Percentile: 33.8x Overall Median: 23.9x Altair Altium Ansys Alpha @
$180 Inovalon Mimecast Coupa Alpha @ $160 RealPage Red Hat AVEVA Smartsheet Splunk Black Knight PowerSchool Commerce Hub Advent Software Cerner Squarespace Informatica Infoblox Instructure DealerTrack Cornerstone
OnDemand Citrix VMware Blackboard Riverbed McAfee LogMeIn AVG Quest Software BMC Neustar Medidata Mentor Graphics 62.1x 12 (1) Includes Altair, Altium, Mentor Graphics, and Medidata transactions. (2) NTM statistics based on mean
analyst consensus estimates for the next 12-month period as of transaction announcement. assets they valued at an estimated $2.5Bn). Implied value of $180/share includes synergies. CONFIDENTIAL | DRAFT 44.1x 37.5x 35.0x 33.8x 33.5x 32.1x
31.6x(4) 31.0x 30.9x 28.9x 28.0x 25.0x 24.7x(3) 22.9x 21.0x 20.5x 19.7x 19.4x 19.4x 18.8x 18.1x 18.0x 17.0x 16.9x 16.0x 15.7x 15.1x 14.1x 12.6x 11.5x 10.9x 10.7x 9.0x 7.9x 5.0x Altair Altium Coupa Smartsheet Red
Hat Ansys Mimecast Alpha @ $180 Medidata Splunk RealPage Alpha @ $160 Inovalon AVEVA Squarespace PowerSchool Commerce Hub Black Knight Infoblox DealerTrack Cornerstone OnDemand Informatica Advent
Software McAfee Instructure Citrix Mentor Graphics VMware Cerner Blackboard Riverbed Quest Software LogMeIn AVG BMC Neustar Overall Median: 19.4x
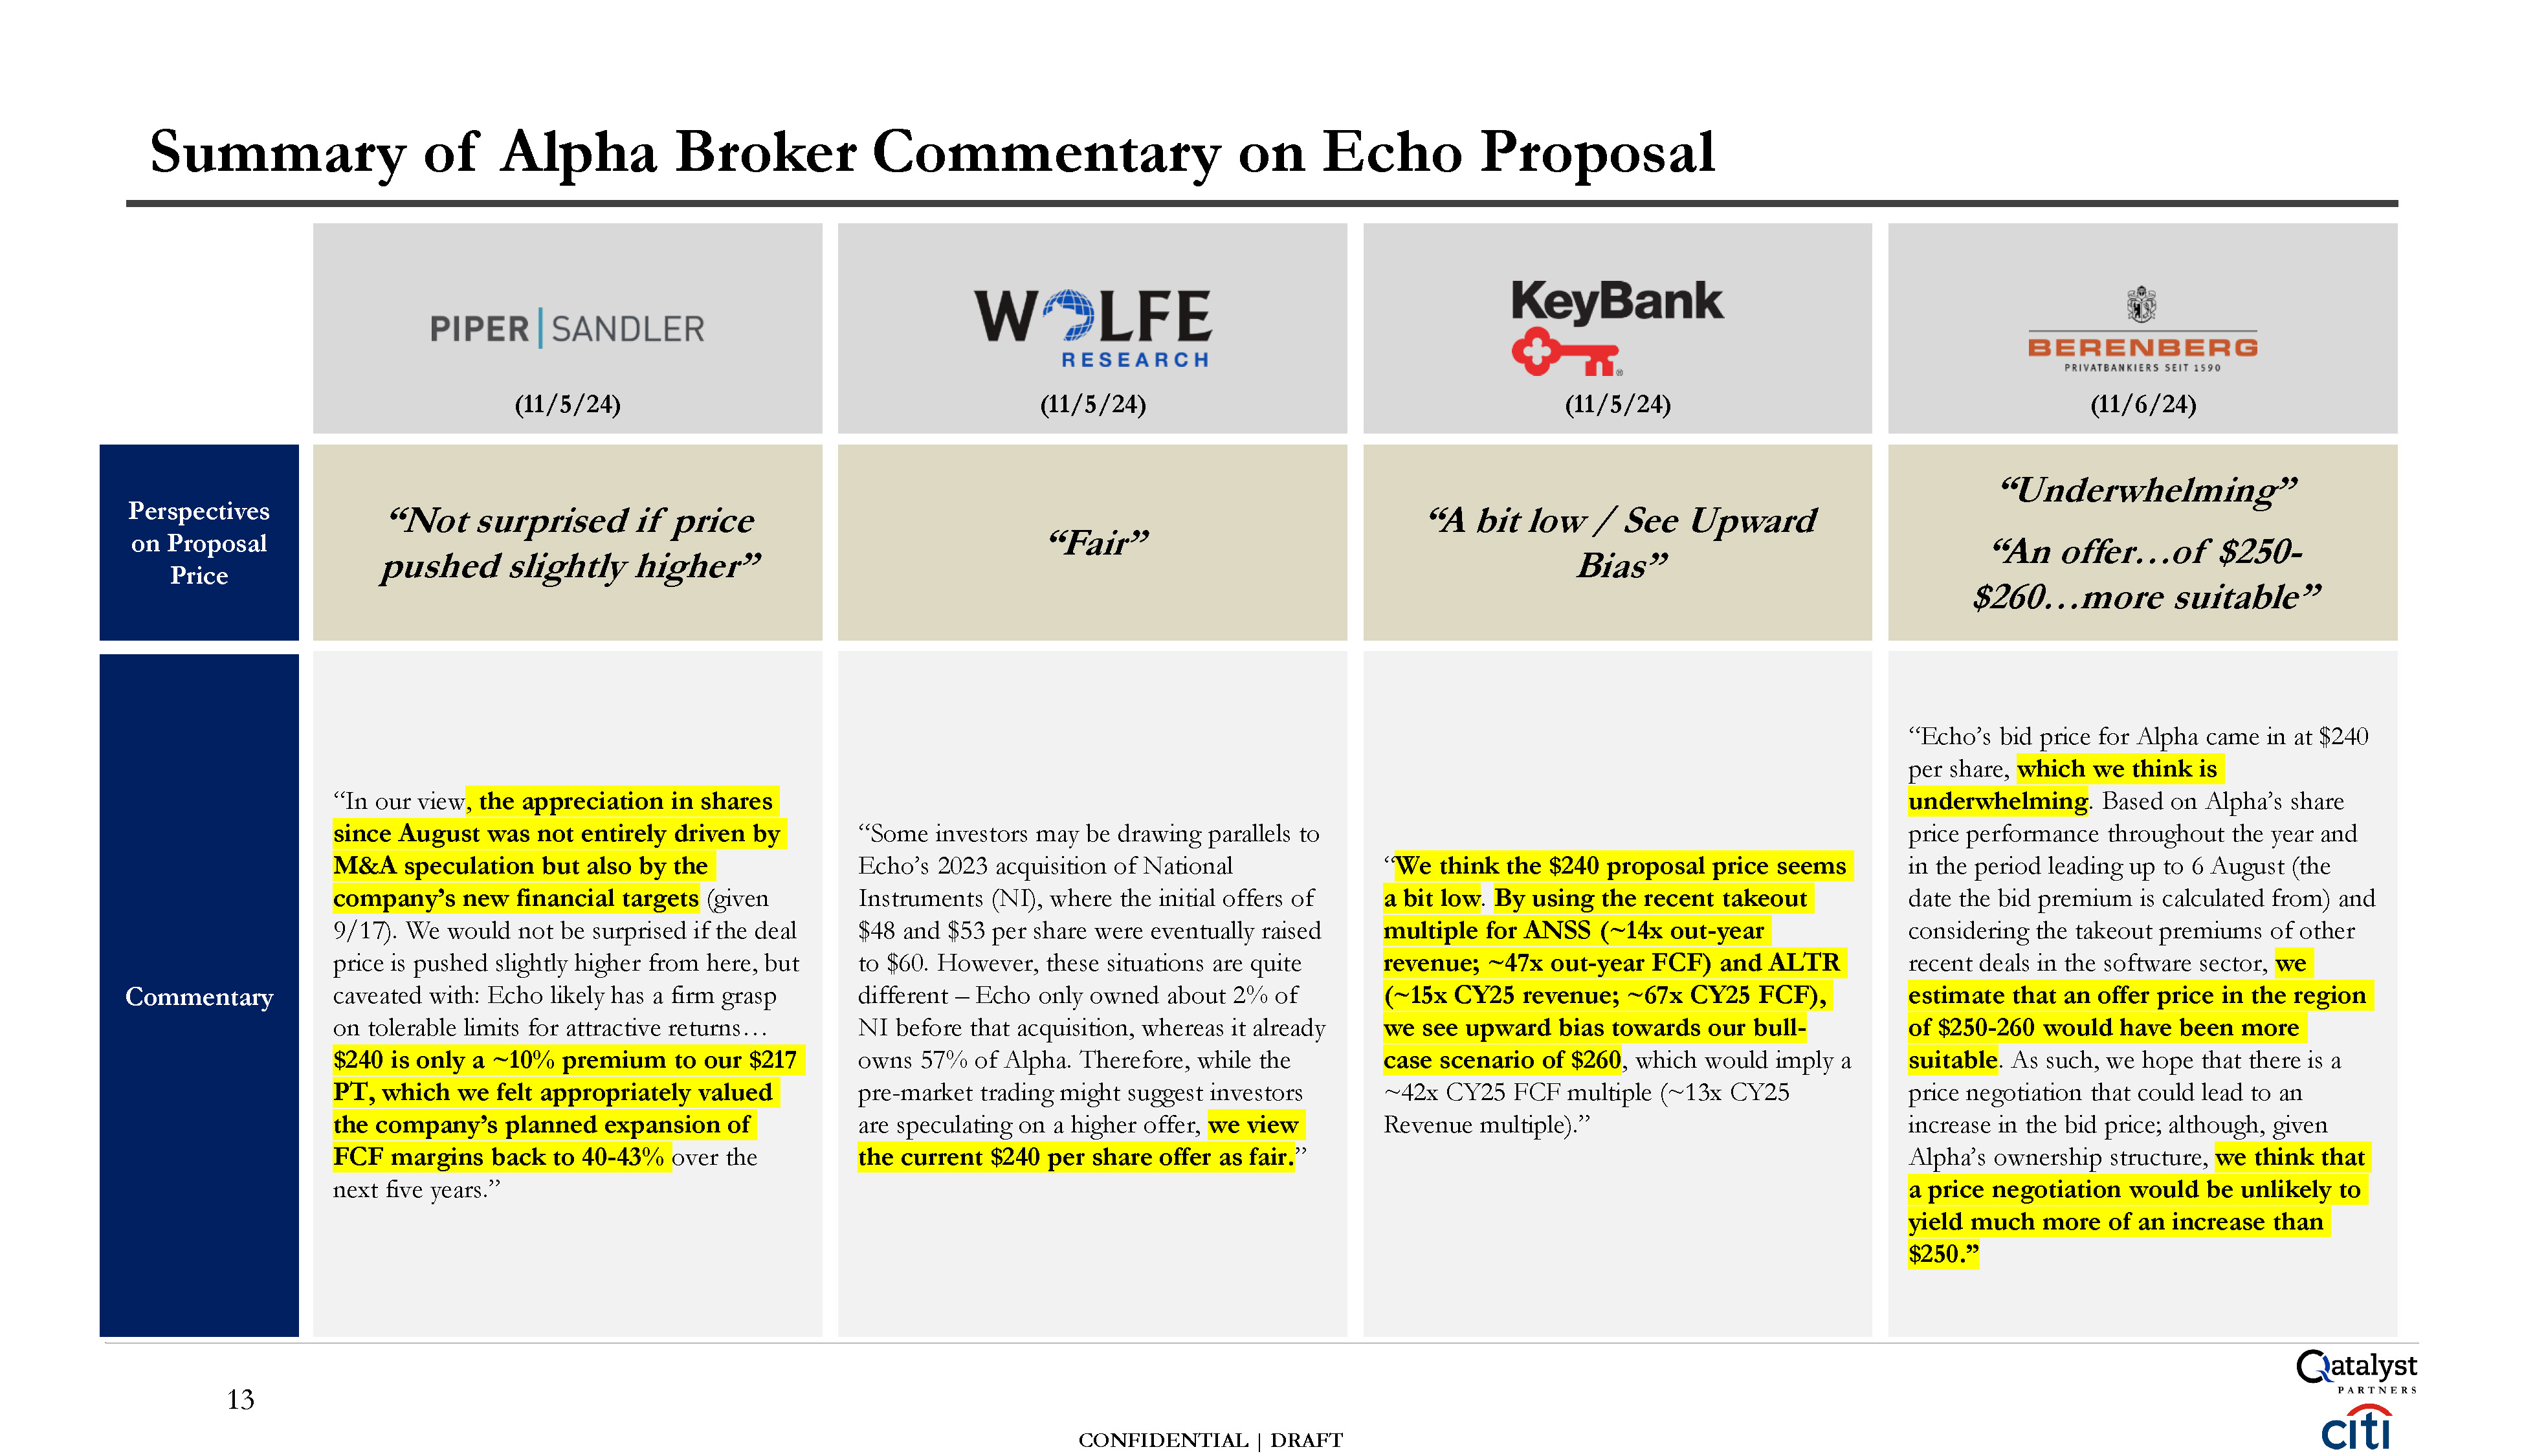
(11/5/24) “In our view , the appreciation in shares since August was not
entirely driven by M&A speculation but also by the company’s new financial targets (given 9/17). We would not be surprised if the deal price is pushed slightly higher from here, but caveated with: Echo likely has a firm grasp on
tolerable limits for attractive returns… $240 is only a ~10% premium to our $217 PT, which we felt appropriately valued the company’s planned expansion of FCF margins back to 40-43% over the next five years.” “Not surprised if
price pushed slightly higher” (11/5/24) “Some investors may be drawing parallels to Echo’s 2023 acquisition of National Instruments (NI), where the initial offers of $48 and $53 per share were eventually raised to $60. However, these
situations are quite different – Echo only owned about 2% of NI before that acquisition, whereas it already owns 57% of Alpha. Therefore, while the pre-market trading might suggest investors are speculating on a higher offer, we view the
current $240 per share offer as fair. ” “Fair” (11/5/24) “ We think the $240 proposal price seems a bit low. By using the recent takeout multiple for ANSS (~14x out-year revenue; ~47x out-year FCF) and ALTR (~15x CY25 revenue; ~67x
CY25 FCF), we see upward bias towards our bull- case scenario of $260 , which would imply a ~42x CY25 FCF multiple (~13x CY25 Revenue multiple).” “A bit low / See Upward Bias” (11/6/24) “Echo’s bid price for Alpha came in at $240 per
share, which we think is underwhelming . Based on Alpha’s share price performance throughout the year and in the period leading up to 6 August (the date the bid premium is calculated from) and considering the takeout premiums of
other recent deals in the software sector, we estimate that an offer price in the region of $250-260 would have been more suitable . As such, we hope that there is a price negotiation that could lead to an increase in the bid price;
although, given Alpha’s ownership structure, we think that a price negotiation would be unlikely to yield much more of an increase than $250.” “Underwhelming” “An offer…of $250- $260…more suitable” Summary of Alpha Broker Commentary on
Echo Proposal Commentary Perspectives on Proposal Price 13 CONFIDENTIAL | DRAFT
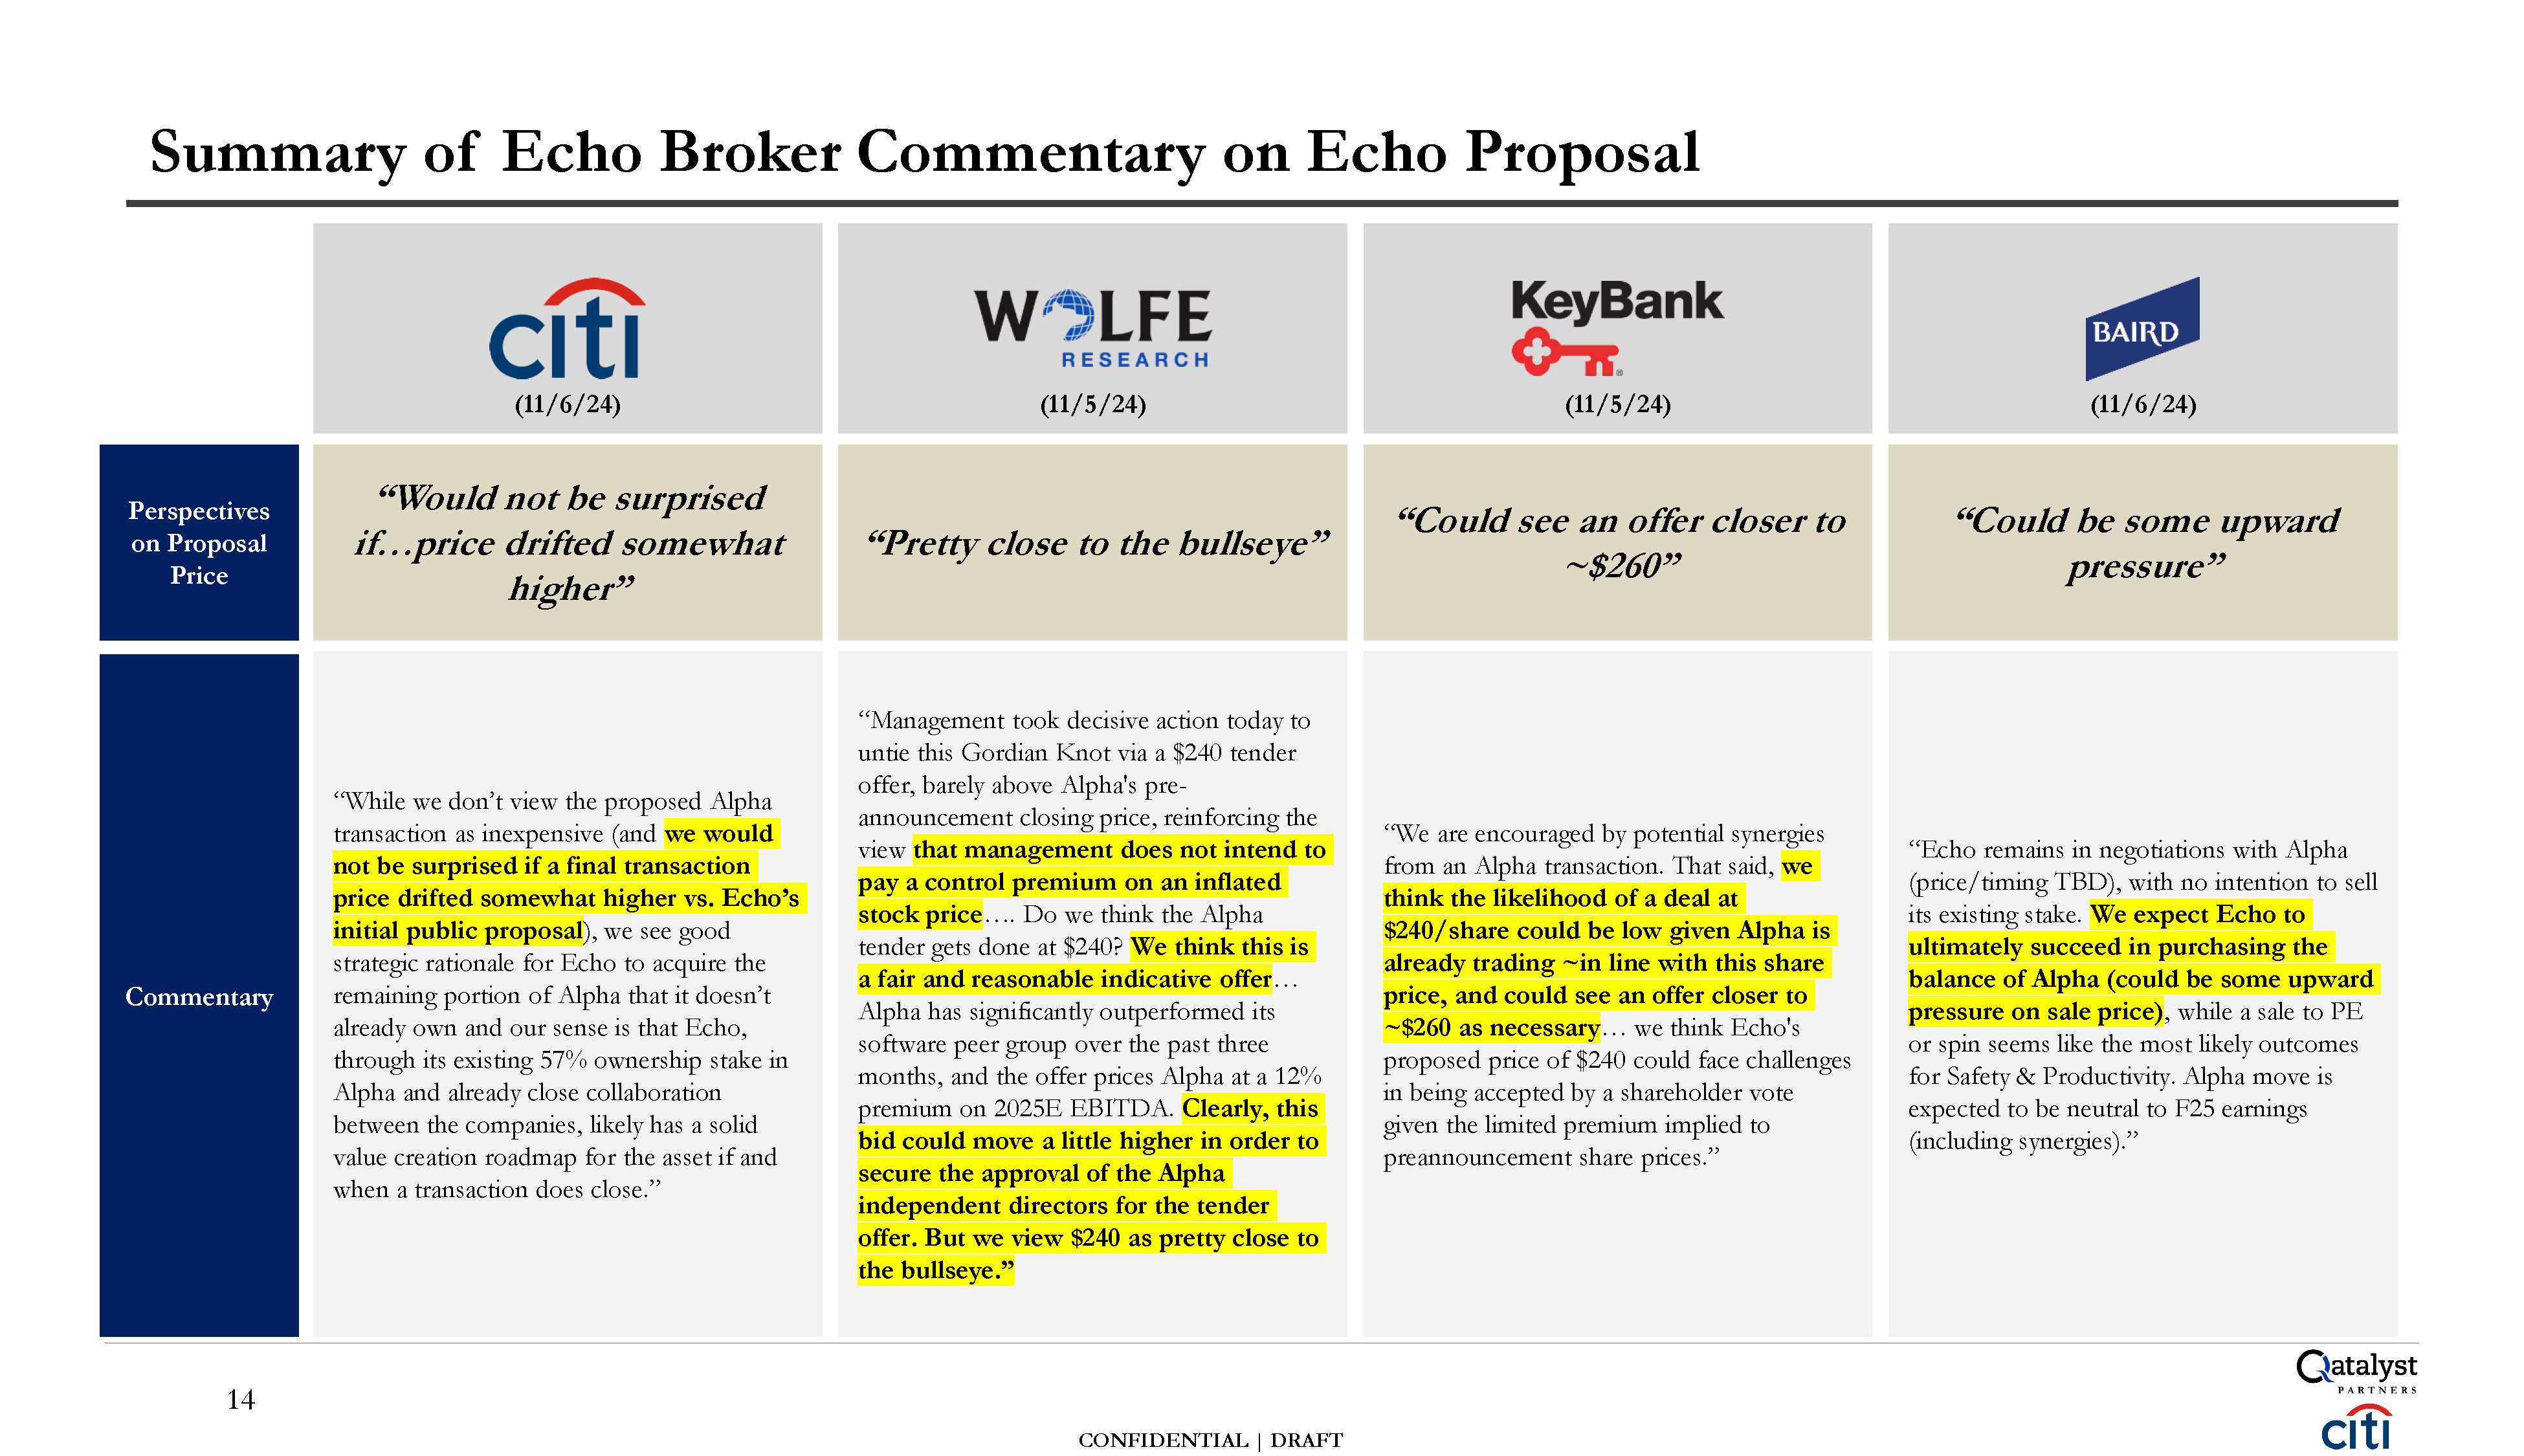
(11/6/24) “While we don’t view the proposed Alpha transaction as inexpensive
(and we would not be surprised if a final transaction price drifted somewhat higher vs. Echo’s initial public proposal ), we see good strategic rationale for Echo to acquire the remaining portion of Alpha that it doesn’t already own and
our sense is that Echo, through its existing 57% ownership stake in Alpha and already close collaboration between the companies, likely has a solid value creation roadmap for the asset if and when a transaction does close.” “Would not be
surprised if…price drifted somewhat higher” (11/5/24) “Management took decisive action today to untie this Gordian Knot via a $240 tender offer, barely above Alpha's pre- announcement closing price, reinforcing the view that management
does not intend to pay a control premium on an inflated stock price …. Do we think the Alpha tender gets done at $240? We think this is a fair and reasonable indicative offer … Alpha has significantly outperformed its software peer
group over the past three months, and the offer prices Alpha at a 12% premium on 2025E EBITDA. Clearly, this bid could move a little higher in order to secure the approval of the Alpha independent directors for the tender offer. But we
view $240 as pretty close to the bullseye.” “Pretty close to the bullseye” (11/5/24) “We are encouraged by potential synergies from an Alpha transaction. That said, we think the likelihood of a deal at $240/share could be low given Alpha
is already trading ~in line with this share price, and could see an offer closer to ~$260 as necessary … we think Echo's proposed price of $240 could face challenges in being accepted by a shareholder vote given the limited premium implied
to preannouncement share prices.” “Could see an offer closer to ~$260” (11/6/24) “Echo remains in negotiations with Alpha (price/timing TBD), with no intention to sell its existing stake. We expect Echo to ultimately succeed in
purchasing the balance of Alpha (could be some upward pressure on sale price) , while a sale to PE or spin seems like the most likely outcomes for Safety & Productivity. Alpha move is expected to be neutral to F25 earnings (including
synergies).” “Could be some upward pressure” Summary of Echo Broker Commentary on Echo Proposal Commentary Perspectives on Proposal Price 13 CONFIDENTIAL | DRAFT
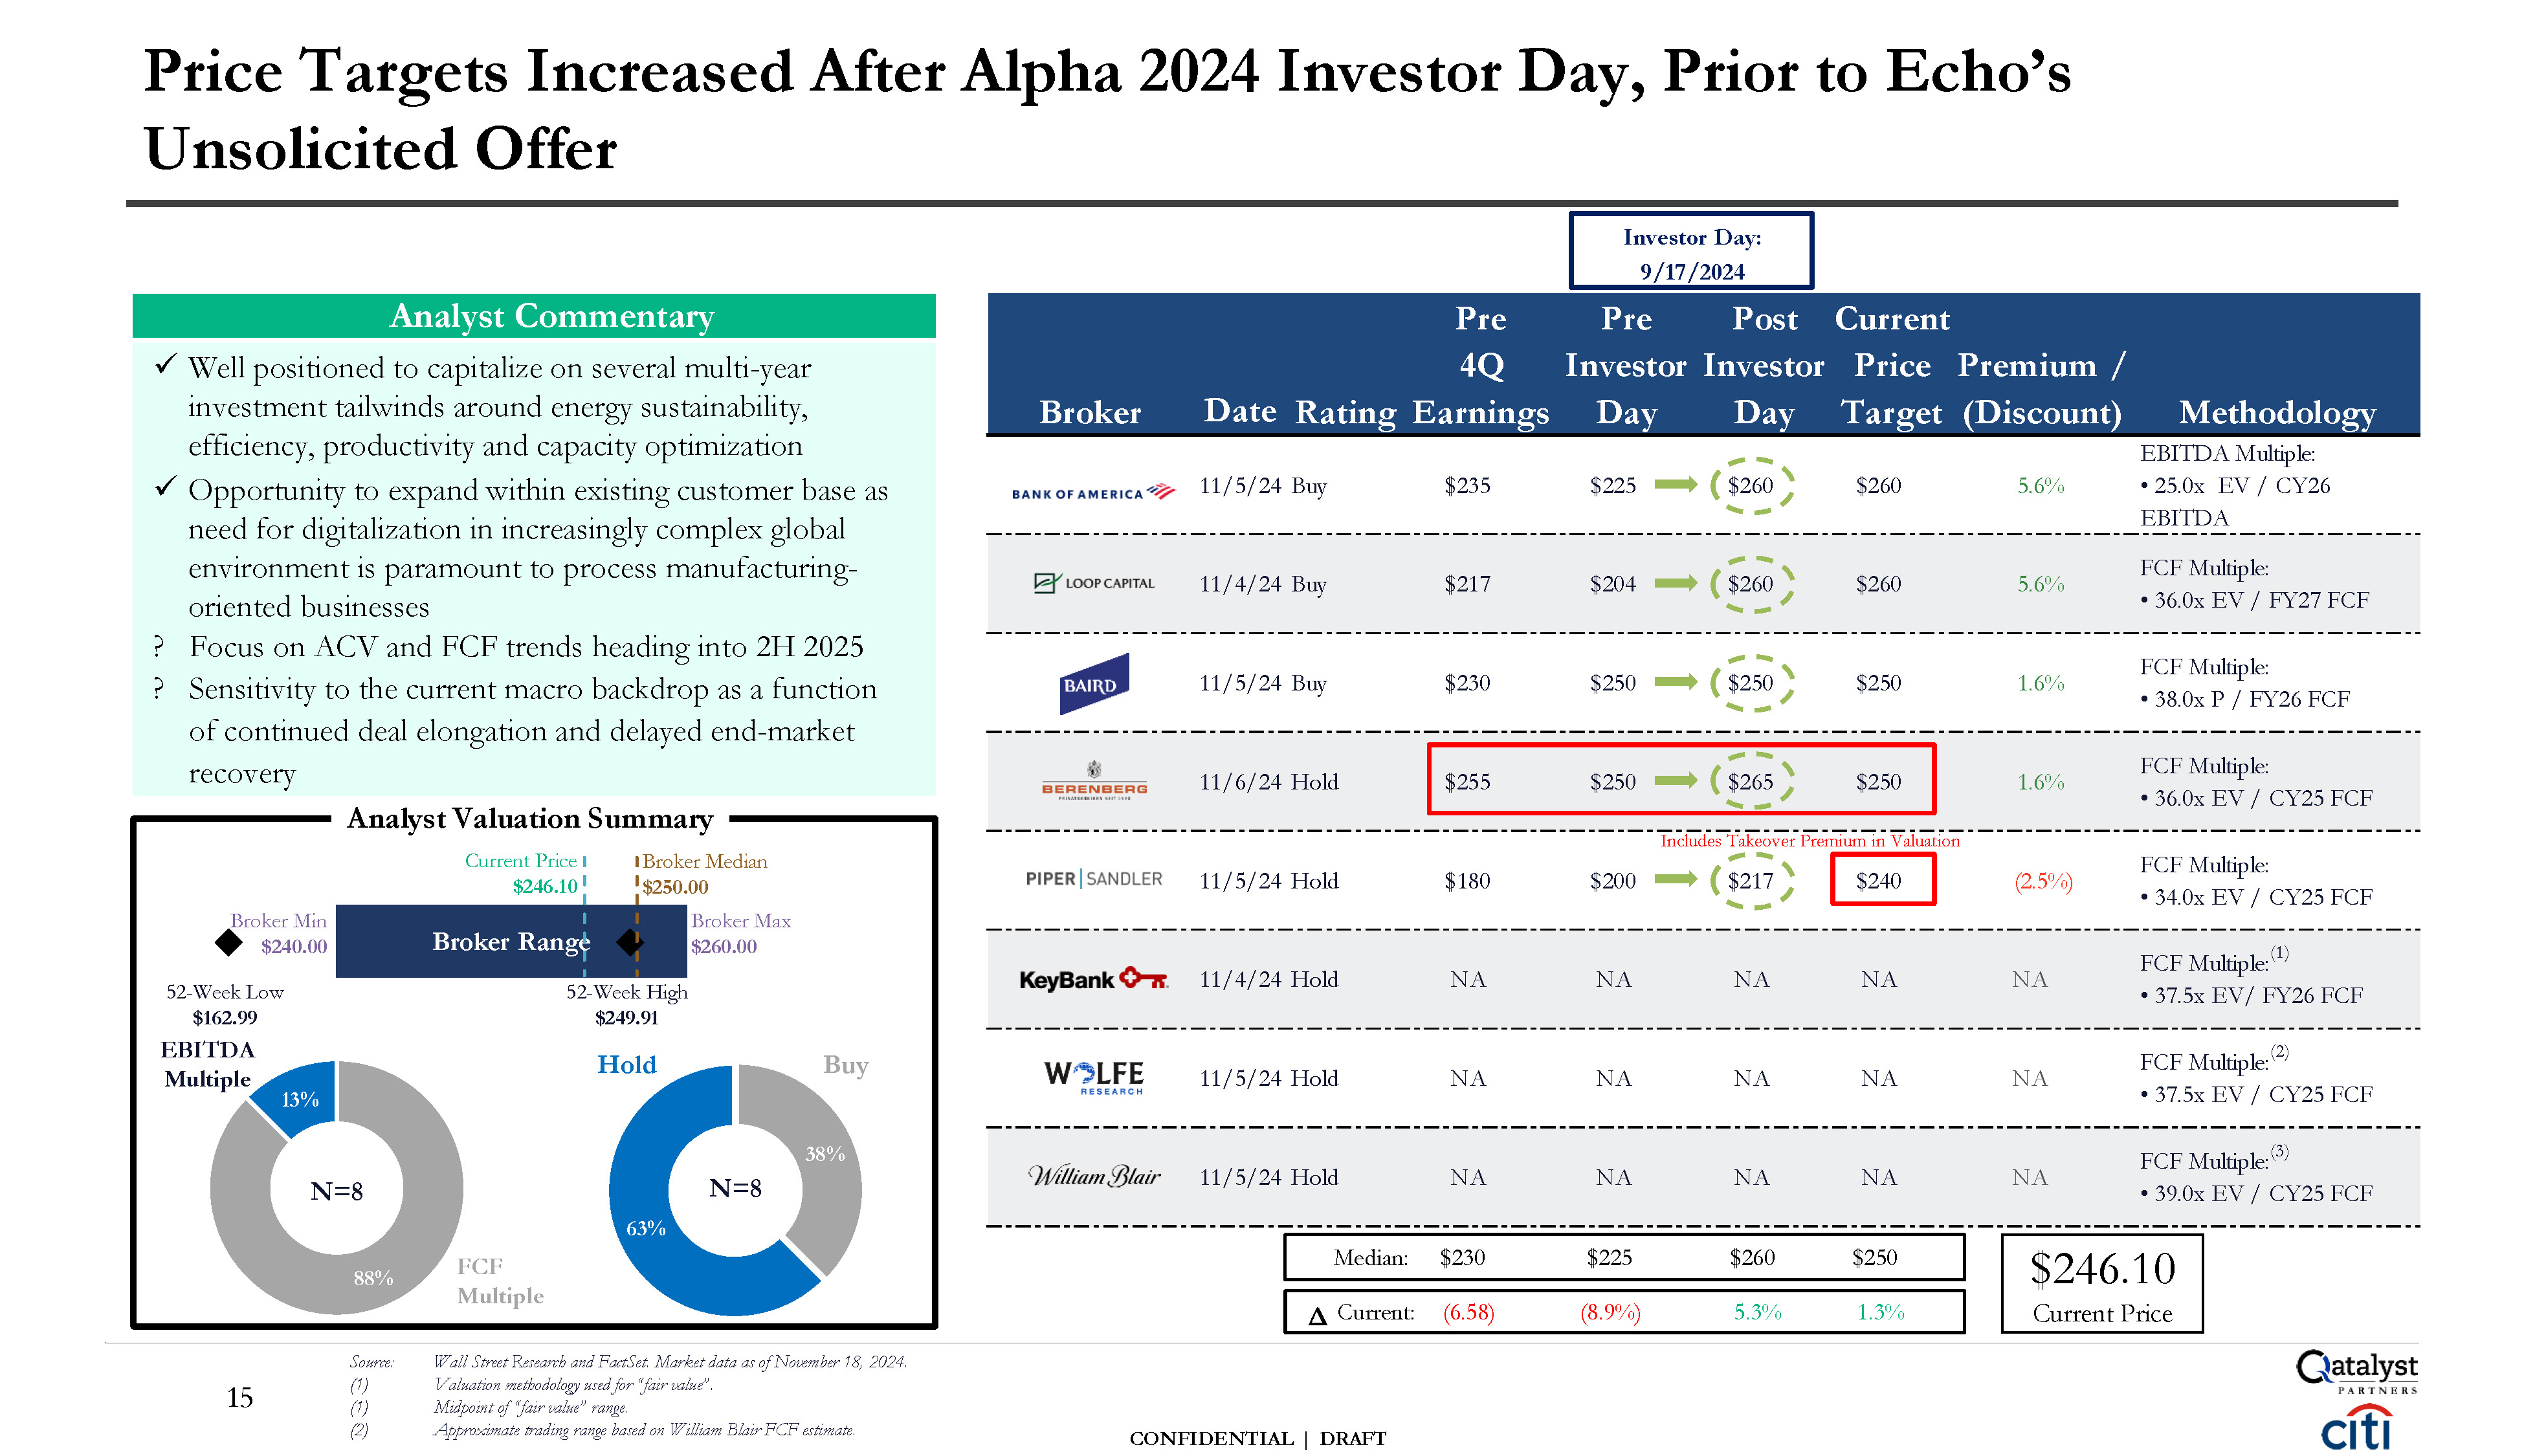
Price Targets Increased After Alpha 2024 Investor Day, Prior to
Echo’s Unsolicited Offer 11/4/24 Buy $217 $204 $260 $260 5.6% FCF Multiple: 36.0x EV / FY27 FCF 11/5/24 Buy $230 $250 $250 $250 1.6% FCF Multiple: 38.0x P / FY26 FCF 11/6/24 Hold $255 $250 $265 $250 1.6% FCF
Multiple: 36.0x EV / CY25 FCF Methodology Pre 4Q Broker Date Rating Earnings 11/5/24 Buy $235 Pre Post Current Investor Investor Price Premium / Day Day Target (Discount) $225 $260 $260 5.6% EBITDA Multiple: 25.0x EV /
CY26 EBITDA 11/5/24 Hold $180 $200 (2.5%) FCF Multiple: 34.0x EV / CY25 FCF 11/4/24 Hold NA NA NA NA NA 11/5/24 Hold NA NA NA NA NA 11/5/24 Hold NA NA NA NA NA 88% 38% 63% Source: (1) (1) (2) Wall Street Research
and FactSet. Market data as of November 18, 2024. Valuation methodology used for “fair value”. Midpoint of “fair value” range. Approximate trading range based on William Blair FCF estimate. N=8 FCF Multiple N=8 Buy Broker
Max $260.00 Broker Range 52-Week High $249.91 Hold Broker Median $250.00 Current Price $246.10 Broker Min $240.00 52-Week Low $162.99 EBITDA Multiple 13% Analyst Commentary Well positioned to capitalize on several multi-year
investment tailwinds around energy sustainability, efficiency, productivity and capacity optimization Opportunity to expand within existing customer base as need for digitalization in increasingly complex global environment is paramount to
process manufacturing- oriented businesses ? Focus on ACV and FCF trends heading into 2H 2025 ? Sensitivity to the current macro backdrop as a function of continued deal elongation and delayed end-market recovery Investor Day:
9/17/2024 Includes Takeover Premium in Valuation $217 $240 Median: $230 $225 $260 $250 Δ Current: (6.58) (8.9%) 5.3% 1.3% $246.10 Current Price CONFIDENTIAL | DRAFT 15 FCF Multiple:(2) 37.5x EV / CY25 FCF FCF
Multiple:(3) 39.0x EV / CY25 FCF FCF Multiple:(1) 37.5x EV/ FY26 FCF Analyst Valuation Summary
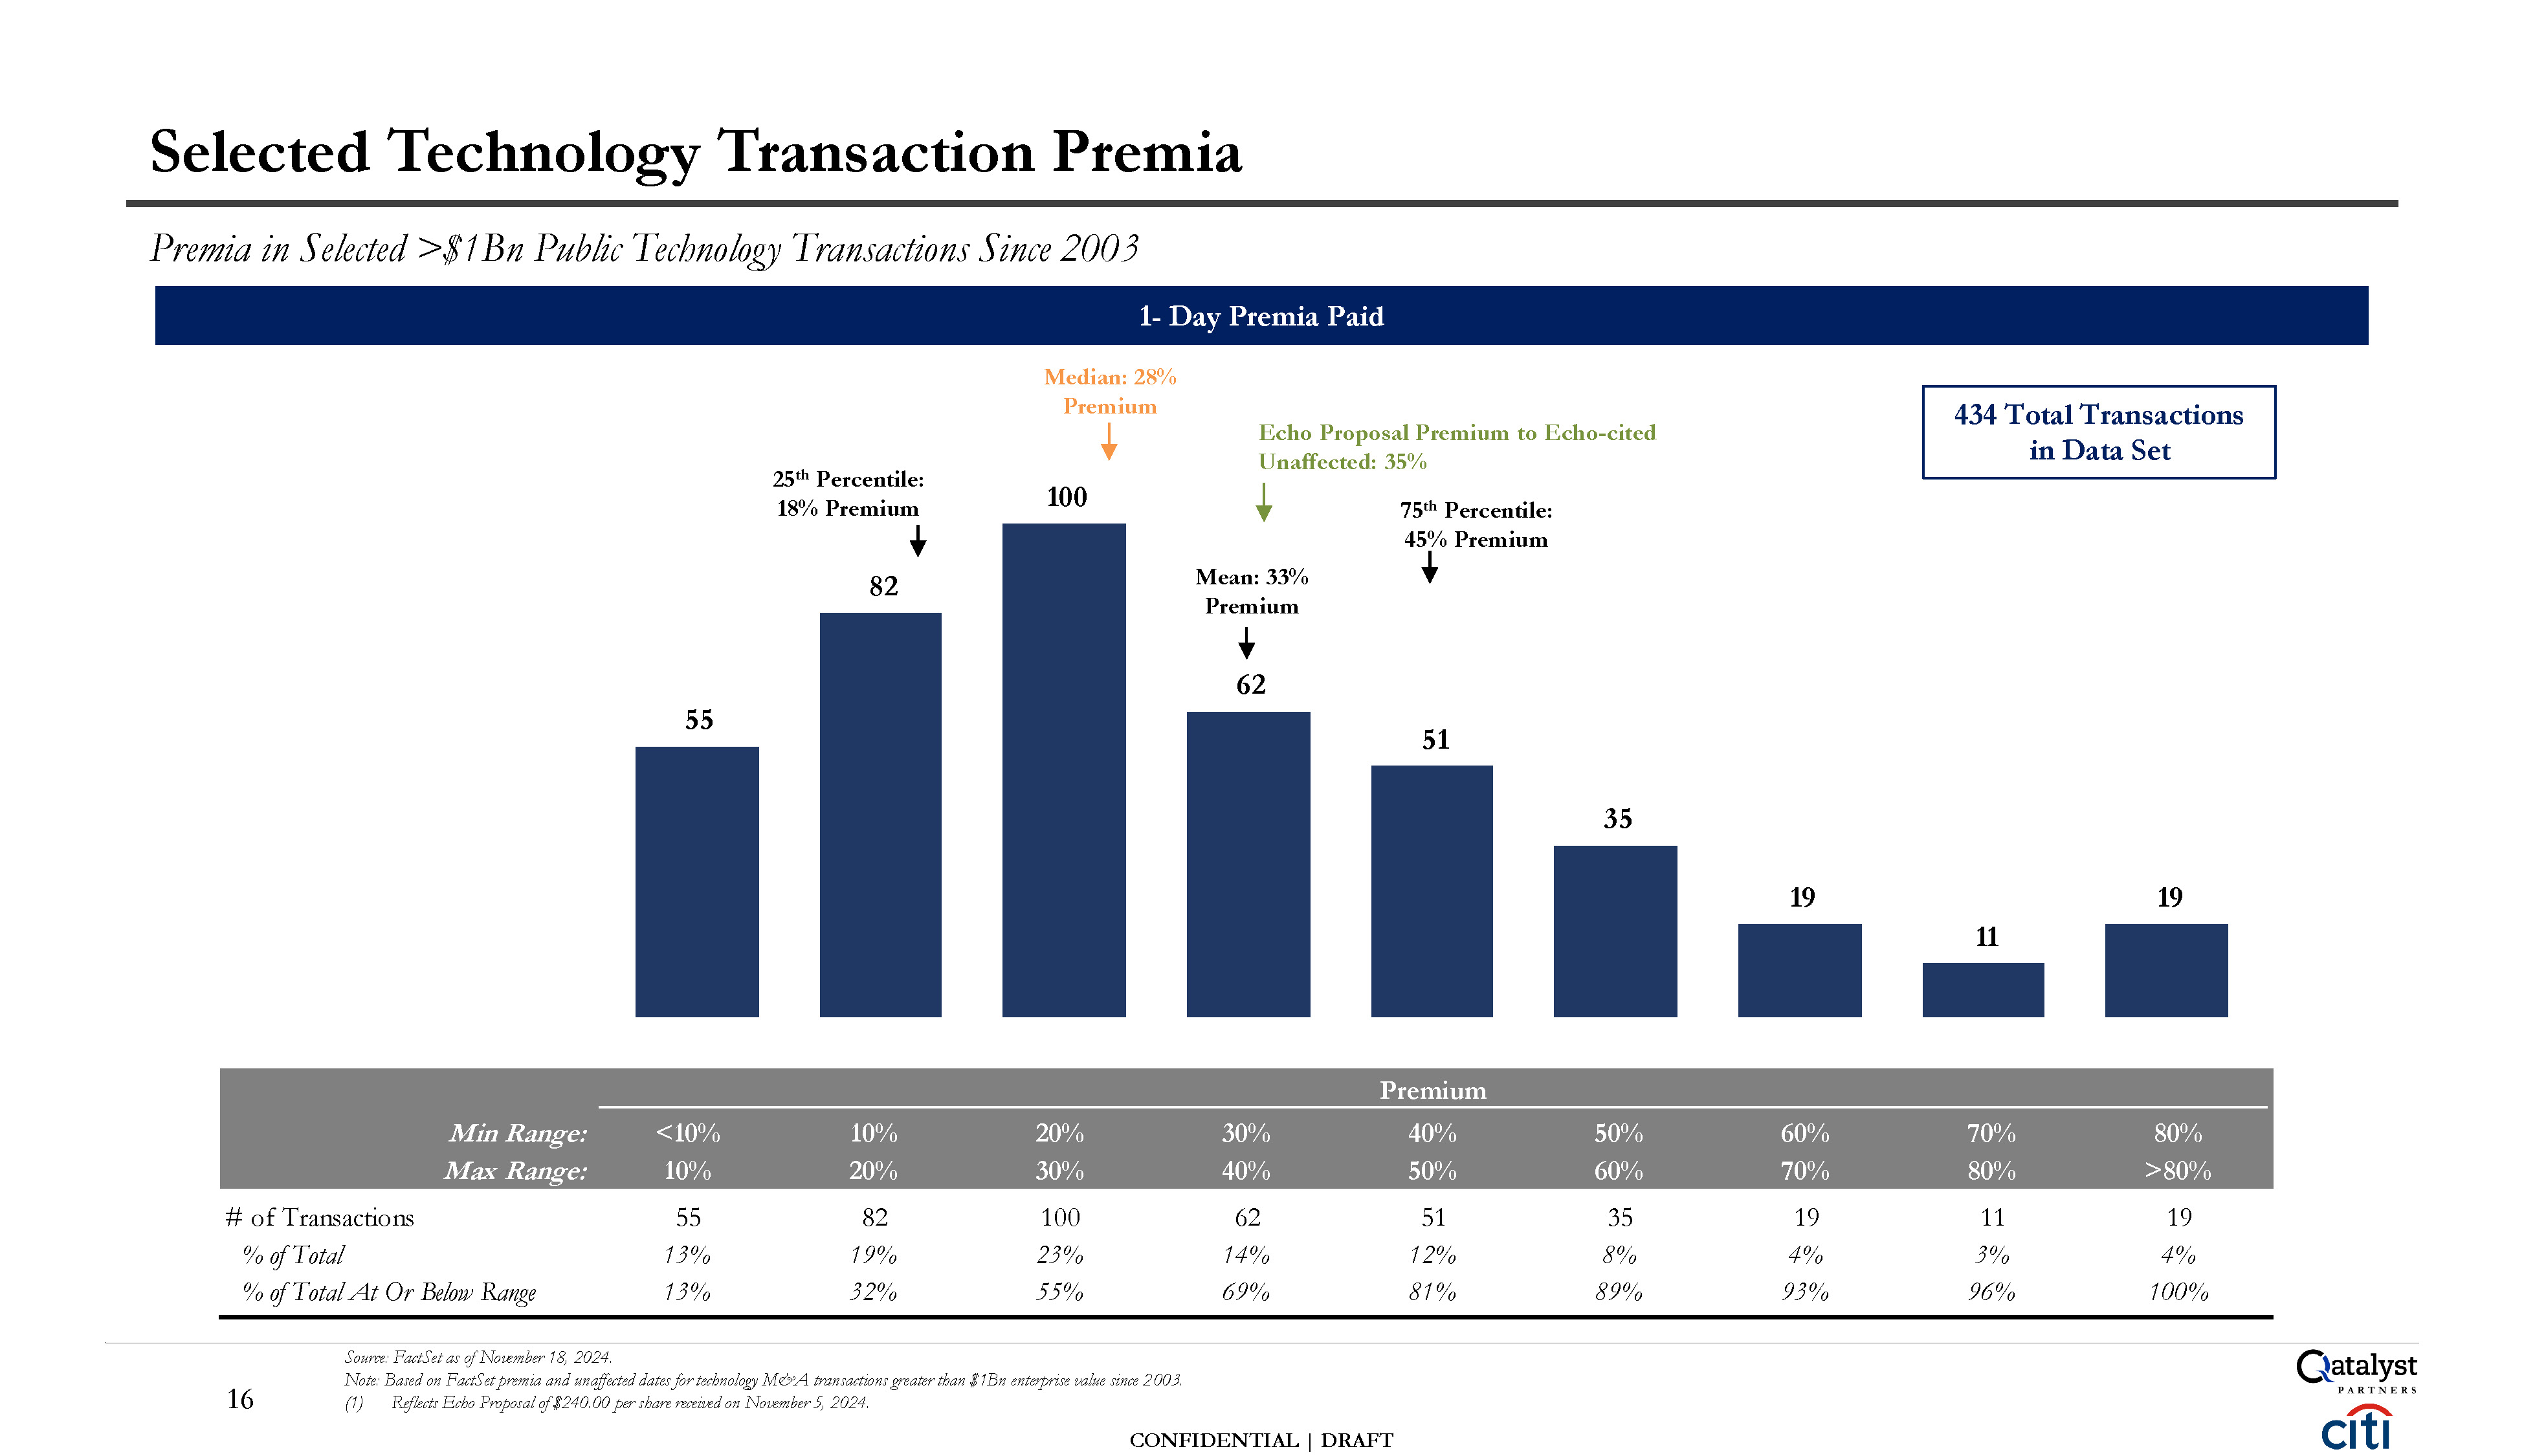
Premium Min Range: <10% 10% 20% 30% 40% 50% 60% 70% 80% Max
Range: 10% 20% 30% 40% 50% 60% 70% 80% >80% # of Transactions 55 82 100 62 51 35 19 11 19 % of Total 13% 19% 23% 14% 12% 8% 4% 3% 4% % of Total At Or Below
Range 13% 32% 55% 69% 81% 89% 93% 96% 100% Source: FactSet as of November 18, 2024. Note: Based on FactSet premia and unaffected dates for technology M&A transactions greater than $1Bn enterprise value since 2003. (1) Reflects
Echo Proposal of $240.00 per share received on November 5, 2024. CONFIDENTIAL | DRAFT 55 82 100 62 51 35 19 11 19 Median: 28% Premium Selected Technology Transaction Premia Premia in Selected >$1Bn Public Technology Transactions
Since 2003 16 1- Day Premia Paid 434 Total Transactions in Data Set 25th Percentile: 18% Premium Echo Proposal Premium to Echo-cited Unaffected: 35% 75th Percentile: 45% Premium Mean: 33% Premium
CONFIDENTIAL |
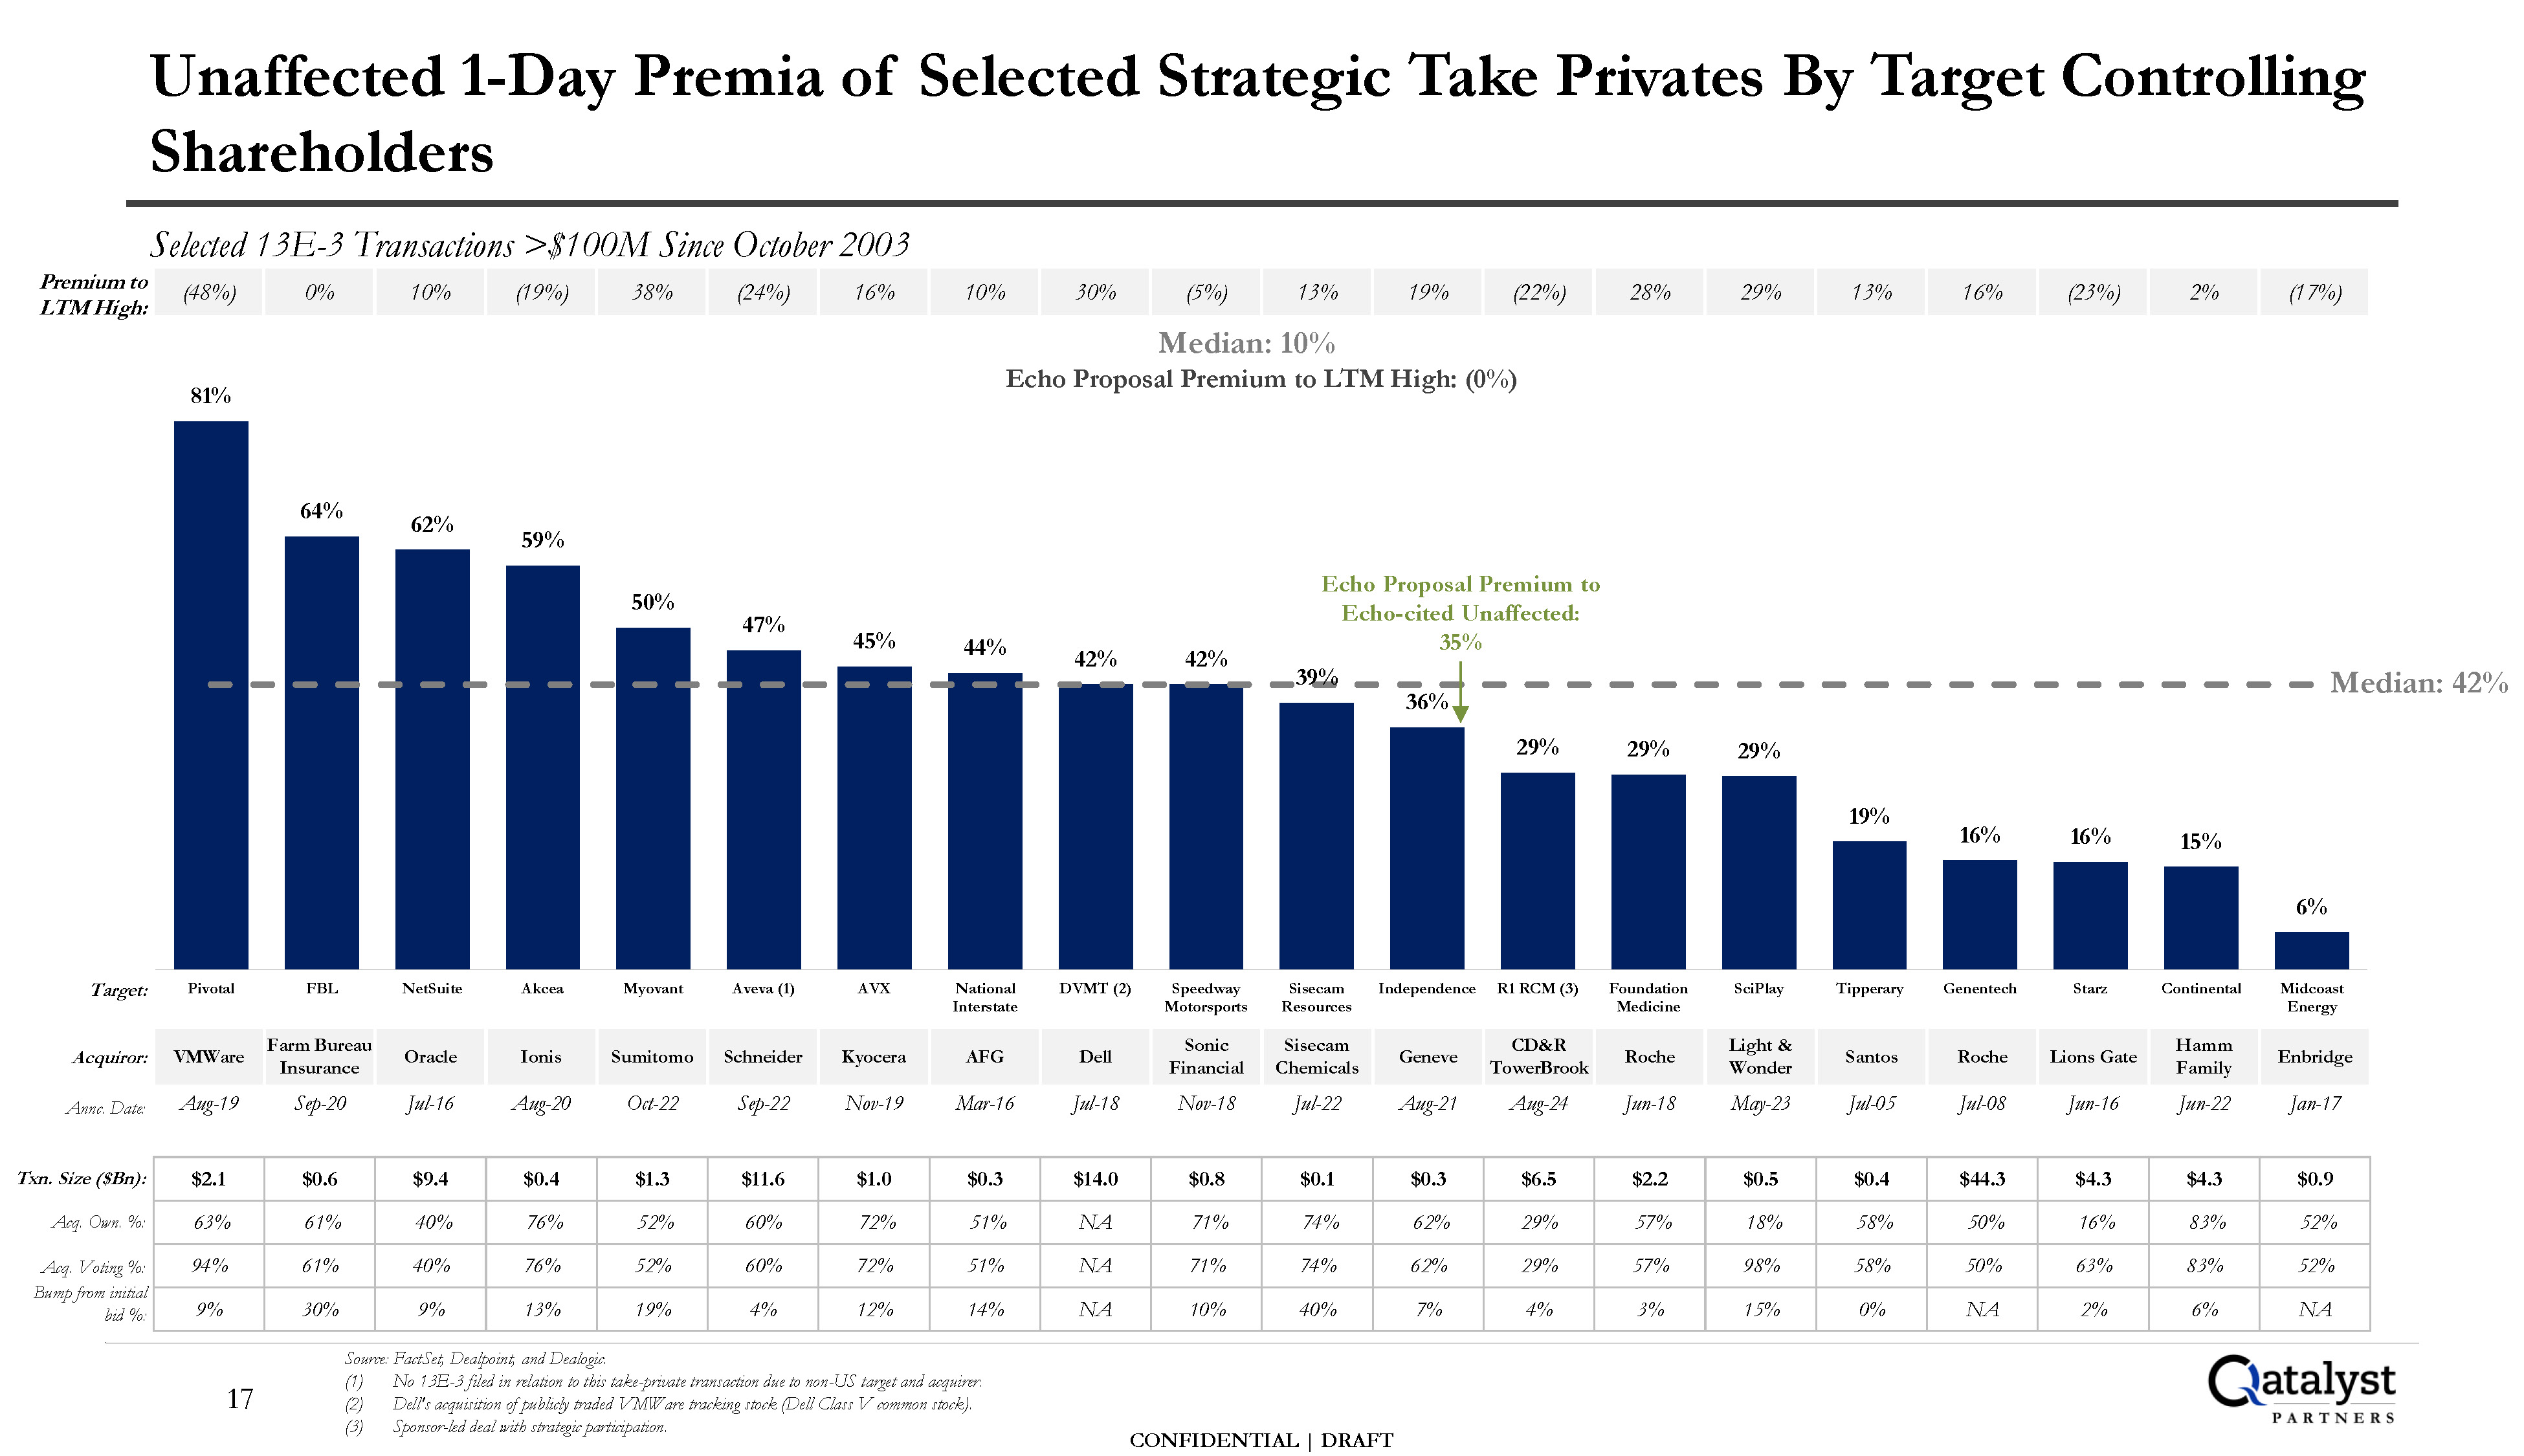
DRAFT 81% 64% 62% 59% 50% 47% 45% 44% 42% 42% 36% 29% 29% 29% 19% 16% 16% 15% 6% Pivotal FBL NetSuite Akcea Myovant Aveva (1) AVX National Interstate DVMT (2) Speedway Motorsports Sisecam
Resources Independence R1 RCM (3) Foundation Medicine SciPlay Tipperary Genentech Starz Continental Midcoast Energy Unaffected 1-Day Premia of Selected Strategic Take Privates By Target Controlling Shareholders Target: Source:
FactSet, Dealpoint, and Dealogic. No 13E-3 filed in relation to this take-private transaction due to non-US target and acquirer. Dell's acquisition of publicly traded VMWare tracking stock (Dell Class V common stock). Sponsor-led deal with
strategic participation. VMWare Farm Bureau Insurance Oracle Ionis Sumitomo Schneider Kyocera AFG Dell Sonic Financial Sisecam Chemicals Geneve CD&R TowerBrook Roche Light & Wonder Santos Roche Lions Gate Hamm
Family Enbridge Aug-19 Sep-20 Jul-16 Aug-20 Oct-22 Sep-22 Nov-19 Mar-16 Jul-18 Nov-18 Jul-22 Aug-21 Aug-24 Jun-18 May-23 Jul-05 Jul-08 Jun-16 Jun-22 Jan-17 Acquiror: Annc. Date: Txn. Size ($Bn): Acq. Own. %: Acq.
Voting %: Bump from initial bid
%: $2.1 $0.6 $9.4 $0.4 $1.3 $11.6 $1.0 $0.3 $14.0 $0.8 $0.1 $0.3 $6.5 $2.2 $0.5 $0.4 $44.3 $4.3 $4.3 $0.9 63% 61% 40% 76% 52% 60% 72% 51% NA 71% 74% 62% 29% 57% 18% 58% 50% 16% 83% 52% 94% 61% 40% 76% 52% 60% 72% 51% NA 71% 74% 62% 29% 57% 98% 58% 50% 63% 83% 52% 9% 30% 9% 13% 19% 4% 12% 14% NA 10% 40% 7% 4% 3% 15% 0% NA 2% 6% NA Median:
42% Echo Proposal Premium to Echo-cited Unaffected: 35% 39% Selected 13E-3 Transactions >$100M Since October 2003 (48%) 0% 10% (19%) 38% (24%) 16% 10% 30% (5%) 13% 19% (22%) 28% 29% 13% 16% (23%) 2% (17%) Premium to
LTM High: Median: 10% Echo Proposal Premium to LTM High: (0%) 17
Alpha Trading & Financial Overview
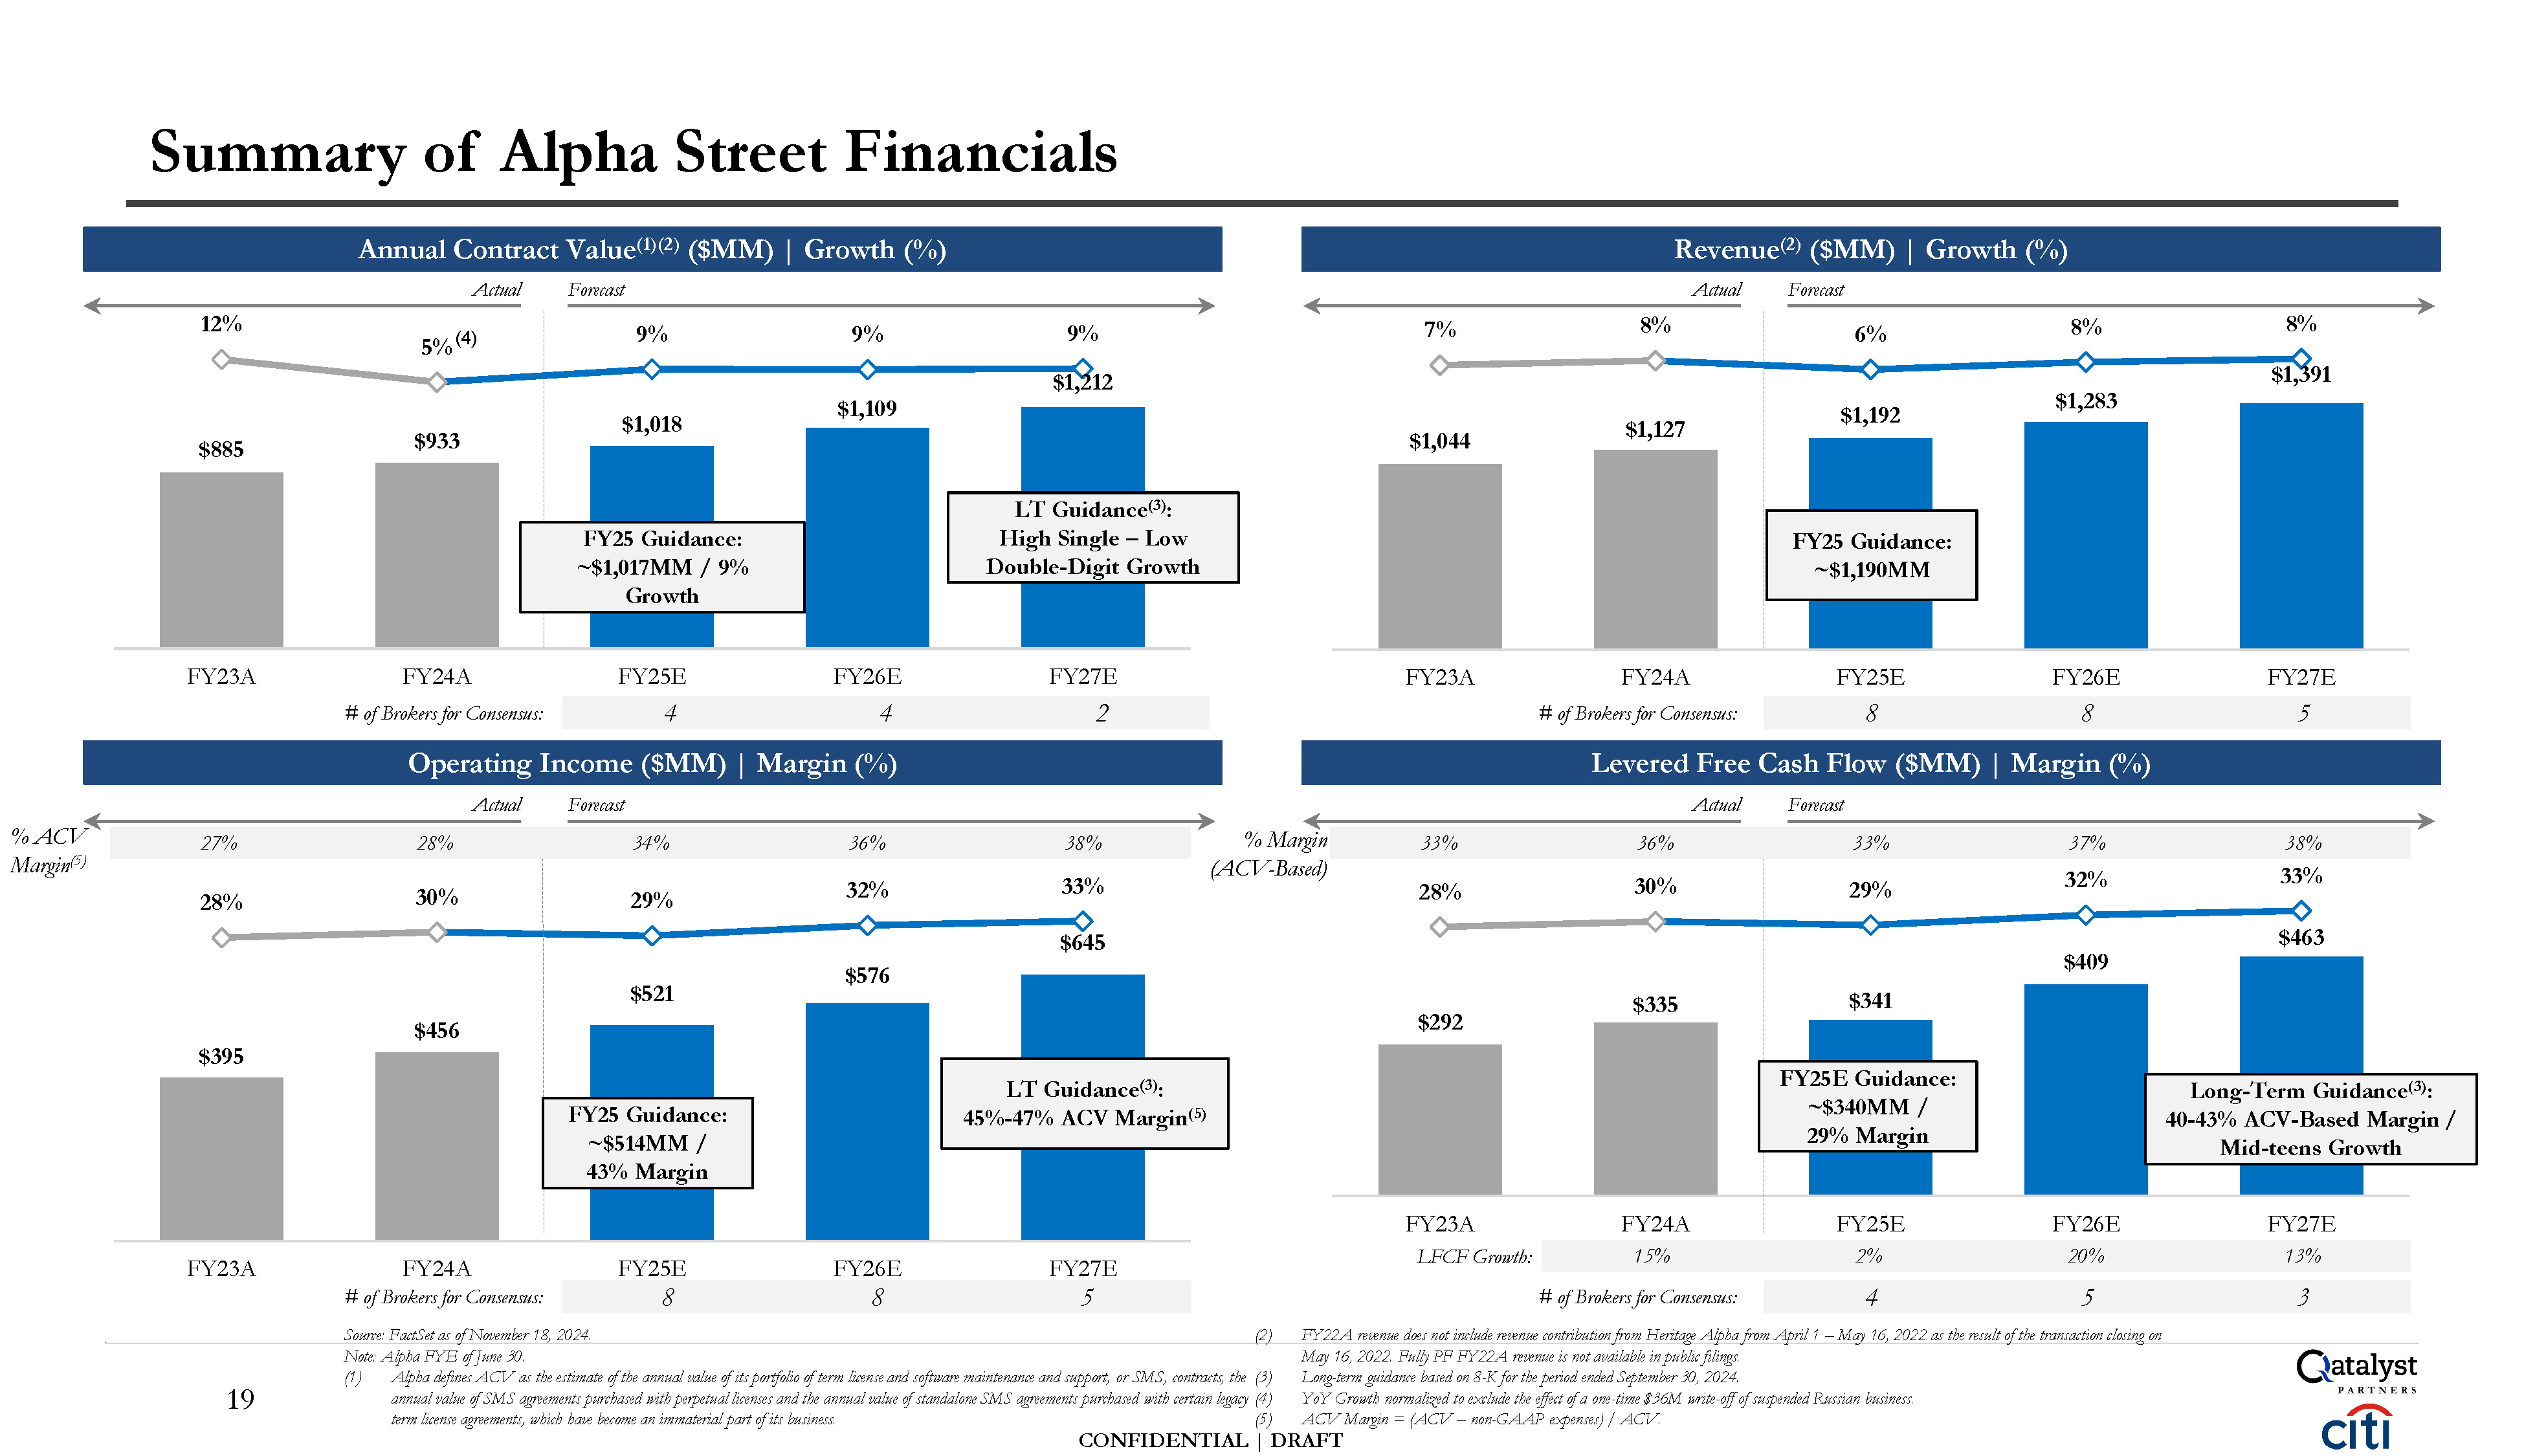
$885 $933 $1,018 $1,109 9%
9% 9% $1,212 12% FY23A FY24A FY25E FY26E FY27E $1,044 $1,127 $1,192 $1,283 6% 8% $1,391 7% 8% 8% FY23A FY24A FY25E FY26E FY27E $395 $456 $521 $576 $645 29% 32% 33% 28% 30% FY23A FY24A # of Brokers for
Consensus: FY25E FY26E FY27E $292 $335 $341 $409 $463 29% 32% 33% 28% 30% FY24A FY25E FY26E FY27E Summary of Alpha Street Financials Annual Contract Value(1)(2) ($MM) | Growth (%) Revenue(2) ($MM) | Growth (%) # of Brokers
for Consensus: 4 4 2 Operating In come ($MM) | M argin (%) # of Brokers for Consensus: 8 8 5 Levered Free Cash Flow ($MM) | Margin (%) Actual Forecast Actual Forecast Actual Forecast 8 8 5 15% 2% 20% 13% # of Brokers
for Consensus: 4 5 3 Note: Alpha FYE of June 30. Source: FactSet as of November 18, 2024. (2) FY22A revenue does not include revenue contribution from Heritage Alpha from April 1 – May 16, 2022 as the result of the transaction closing
on (1) Alpha defines ACV as the estimate of the annual value of its portfolio of term license and software maintenance and support, or SMS, contracts, the (3) annual value of SMS agreements purchased with perpetual licenses and the annual
value of standalone SMS agreements purchased with certain legacy (4) term license agreements, which have become an immaterial part of its business. (5) May 16, 2022. Fully PF FY22A revenue is not available in public filings. Long-term guidance
based on 8-K for the period ended September 30, 2024. YoY Growth normalized to exclude the effect of a one-time $36M write-off of suspended Russian business. ACV Margin = (ACV – non-GAAP expenses) / ACV. FY25 Guidance: ~$1,017MM /
9% Growth FY25E Guidance: ~$340MM / 29% Margin Long-Term Guidance(3): 40-43% ACV-Based Margin / Mid-teens Growth FY23A LFCF Growth: LT Guidance(3): High Single – Low Double-Digit Growth Actual Forecast 5% (4) FY25
Guidance: ~$1,190MM FY25 Guidance: ~$514MM / 43% Margin LT Guidance(3): 45%-47% ACV Margin(5) 27% 28% 34% 36% 38% % ACV Margin(5) 33% 36% 33% 37% 38% CONFIDENTIAL | DRAFT % Margin (ACV-Based) 19
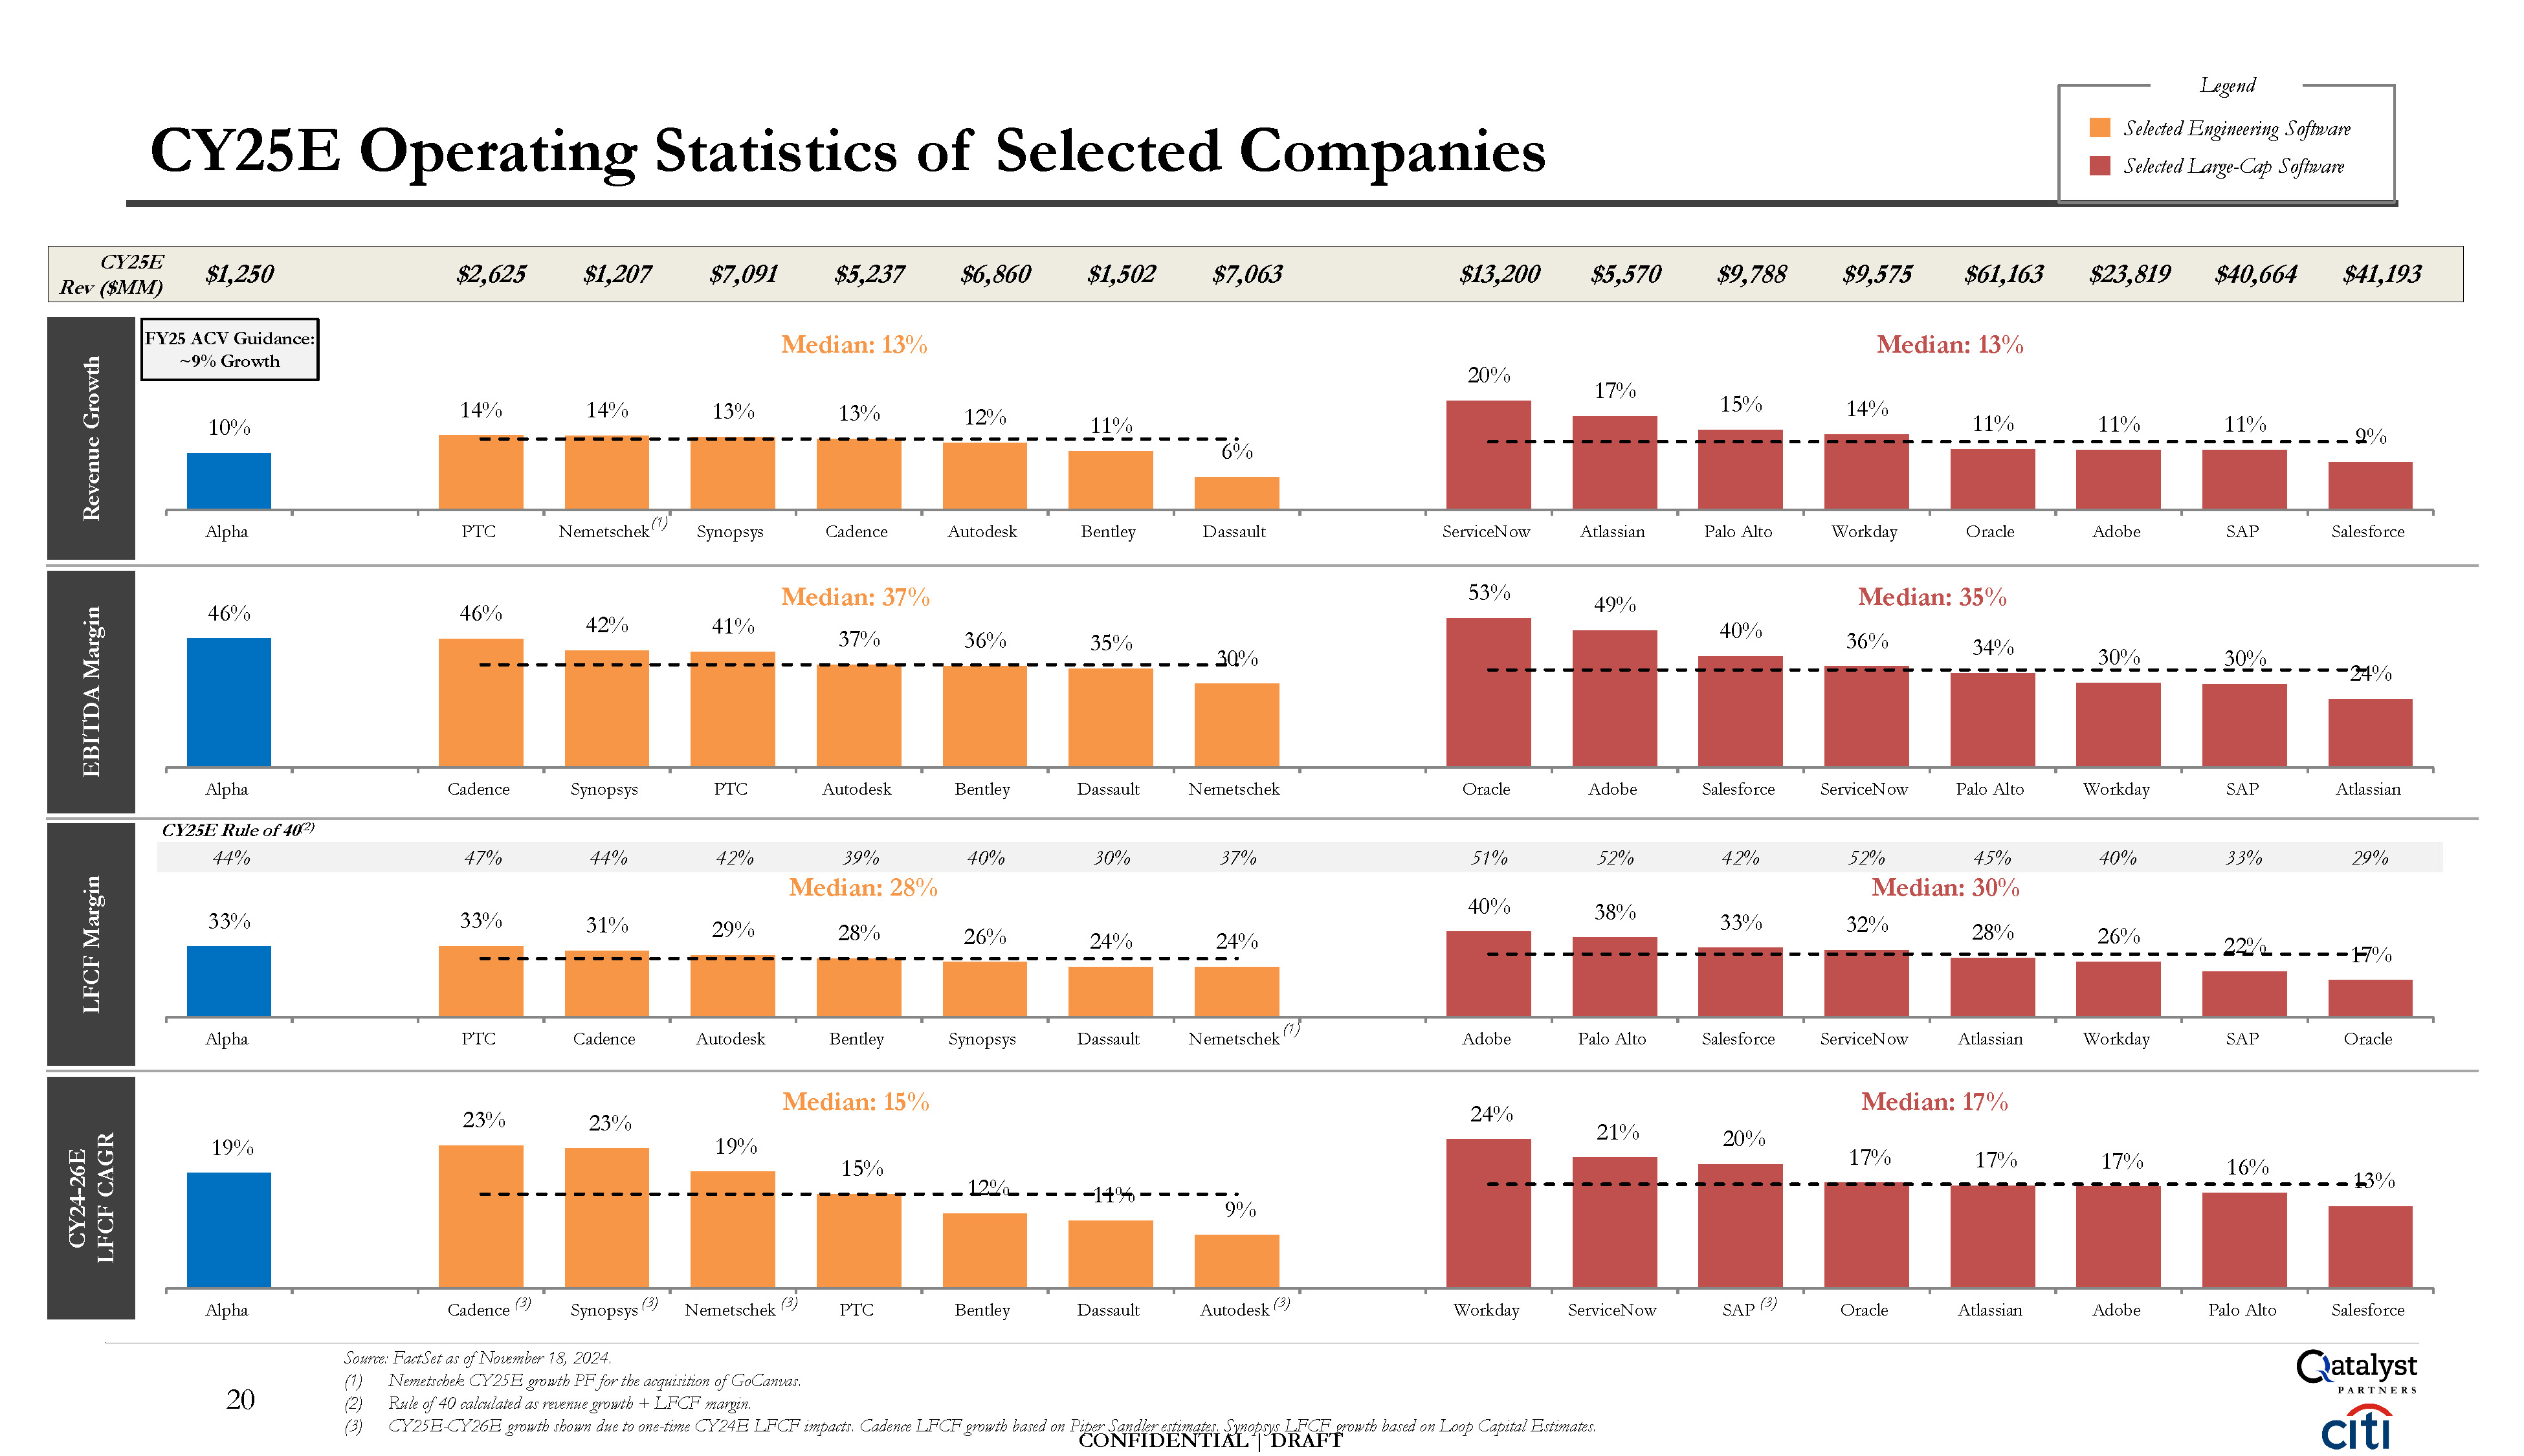
33% 33% 31% 29% 28% 26% 24% 24% 40% 38% 33% 32% 28% 26% 22% 17% Alpha PTC Cadence Autodesk Bentley Synopsys Dassault Adobe Palo
Alto Salesforce Workday SAP Oracle Median: 30% Median:
28% 46% 46% 42% 41% 36% 35% 30% 53% 49% 40% 36% 34% 30% 30% 24% Alpha Cadence Synopsys PTC Autodesk Bentley Dassault Nemetschek Oracle Adobe Salesforce ServiceNow Palo Alto Workday SAP Atlassian Median:
35% Median: 37% 37% 19% 23% 23% 19% 15% 12% 11% 9% 24% 21% 20% 17% 17% 17% 16% 13% Alpha Oracle Atlassian Adobe Palo Alto Salesforce ServiceNow Atlassian Median: 17% Median:
15% 10% 14% 14% 13% 13% 12% 11% 6% 20% 17% 15% 14% 11% 11% 11% 9% Alpha PTC Synopsys Cadence Autodesk Bentley Dassault ServiceNow Atlassian Palo Alto Workday Oracle Adobe SAP Salesforce Median: 13% Median:
13% CY25E Operating Statistics of Selected Companies Legend Selected Engineering Software Selected Large-Cap Software CY25E Rev
($MM) $1,250 $2,625 $1,207 $7,091 $5,237 $6,860 $1,502 $7,063 $13,200 $5,570 $9,788 $9,575 $61,163 $23,819 $40,664 $41,193 Revenue Growth CY24-26E LFCF CAGR LFCF
Margin 44% 47% 44% 42% 39% 40% 30% 37% 51% 52% 42% 52% 45% 40% 33% 29% Nemetschek(1) Nemetschek (1) 20 FY25 ACV Guidance: ~9% Growth EBITDA Margin CY25E Rule of 40(2) CONFIDENTIAL | DRAFT SAP (3) Cadence (3) Synopsys
(3) Nemetschek (3) PTC Bentley Dassault Autodesk (3) Workday ServiceNow Source: FactSet as of November 18, 2024. Nemetschek CY25E growth PF for the acquisition of GoCanvas. Rule of 40 calculated as revenue growth + LFCF margin. CY25E-CY26E
growth shown due to one-time CY24E LFCF impacts. Cadence LFCF growth based on Piper Sandler estimates. Synopsys LFCF growth based on Loop Capital Estimates.
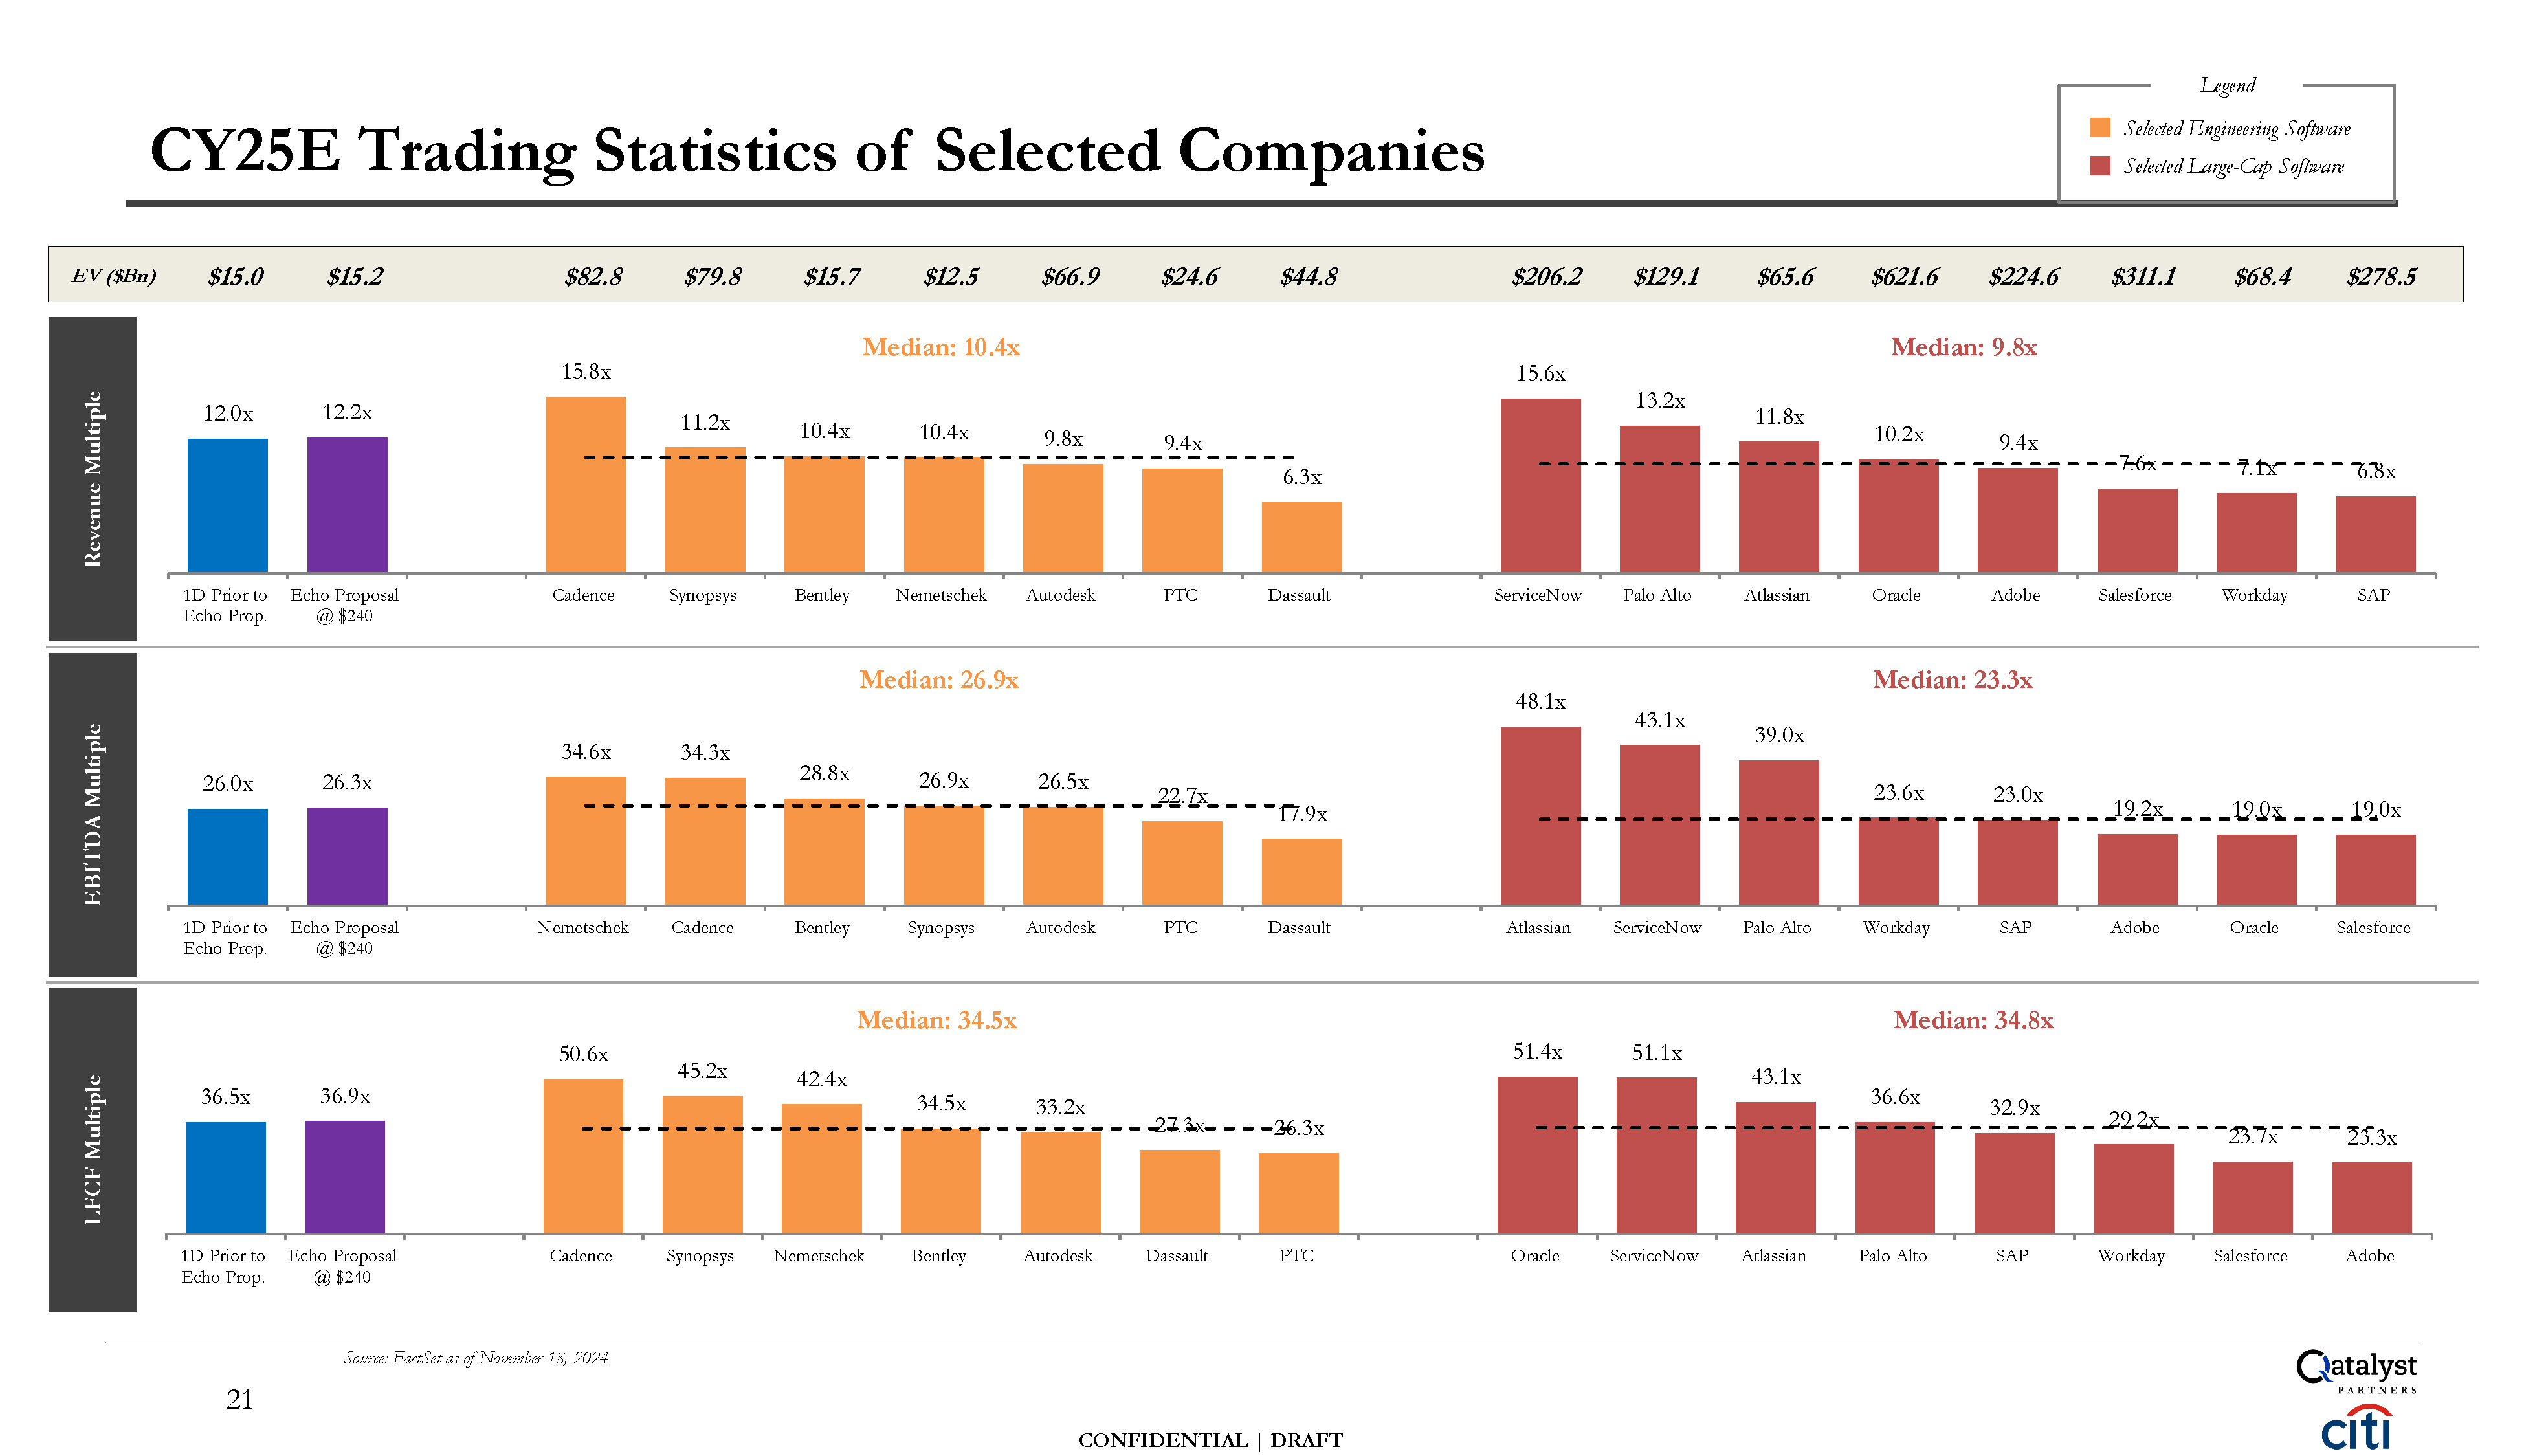
26.0x 26.3x 34.6x 34.3x 28.8x 26.9x 26.5x 22.7x 17.9x 48.1x 43.1x 39.0x 23.6x 23.0x 19.2x 19.0x 19.0x 1D
Prior to Echo Prop. Echo Proposal @ $240 Nemetschek Cadence Bentley Synopsys Autodesk PTC Dassault Atlassian ServiceNow Palo Alto Workday SAP Adobe Oracle Salesforce Median: 23.3x Median:
26.9x 12.0x 12.2x 15.8x 11.2x 10.4x 10.4x 9.8x 9.4x 6.3x 15.6x 13.2x 11.8x 10.2x 9.4x 7.6x 7.1x 6.8x 1D Prior to Echo Proposal Cadence Synopsys Bentley Nemetschek Autodesk PTC Dassault ServiceNow Palo
Alto Atlassian Oracle Adobe Salesforce Workday SAP Echo Prop. @ $240 Median: 9.8x Median: 10.4x 36.5x 36.9x 50.6x 45.2x 42.4x 34.5x 33.2x 27.3x 26.3x 51.4x 51.1x 43.1x 36.6x 32.9x 29.2x 23.7x 23.3x 1D Prior to Echo
Proposal Cadence Synopsys Nemetschek Bentley Autodesk Dassault PTC Oracle ServiceNow Atlassian Palo Alto SAP Workday Salesforce Adobe Echo Prop. @ $240 Median: 34.8x Median: 34.5x CY25E Trading Statistics of Selected
Companies Source: FactSet as of November 18, 2024. EV ($Bn) $15.0 $15.2 $82.8 $79.8 $15.7 $12.5 $66.9 $24.6 $44.8 $206.2 $129.1 $65.6 $621.6 $224.6 $311.1 $68.4 $278.5 LFCF Multiple Revenue Multiple EBITDA
Multiple Legend Selected Engineering Software Selected Large-Cap Software CONFIDENTIAL | DRAFT 21
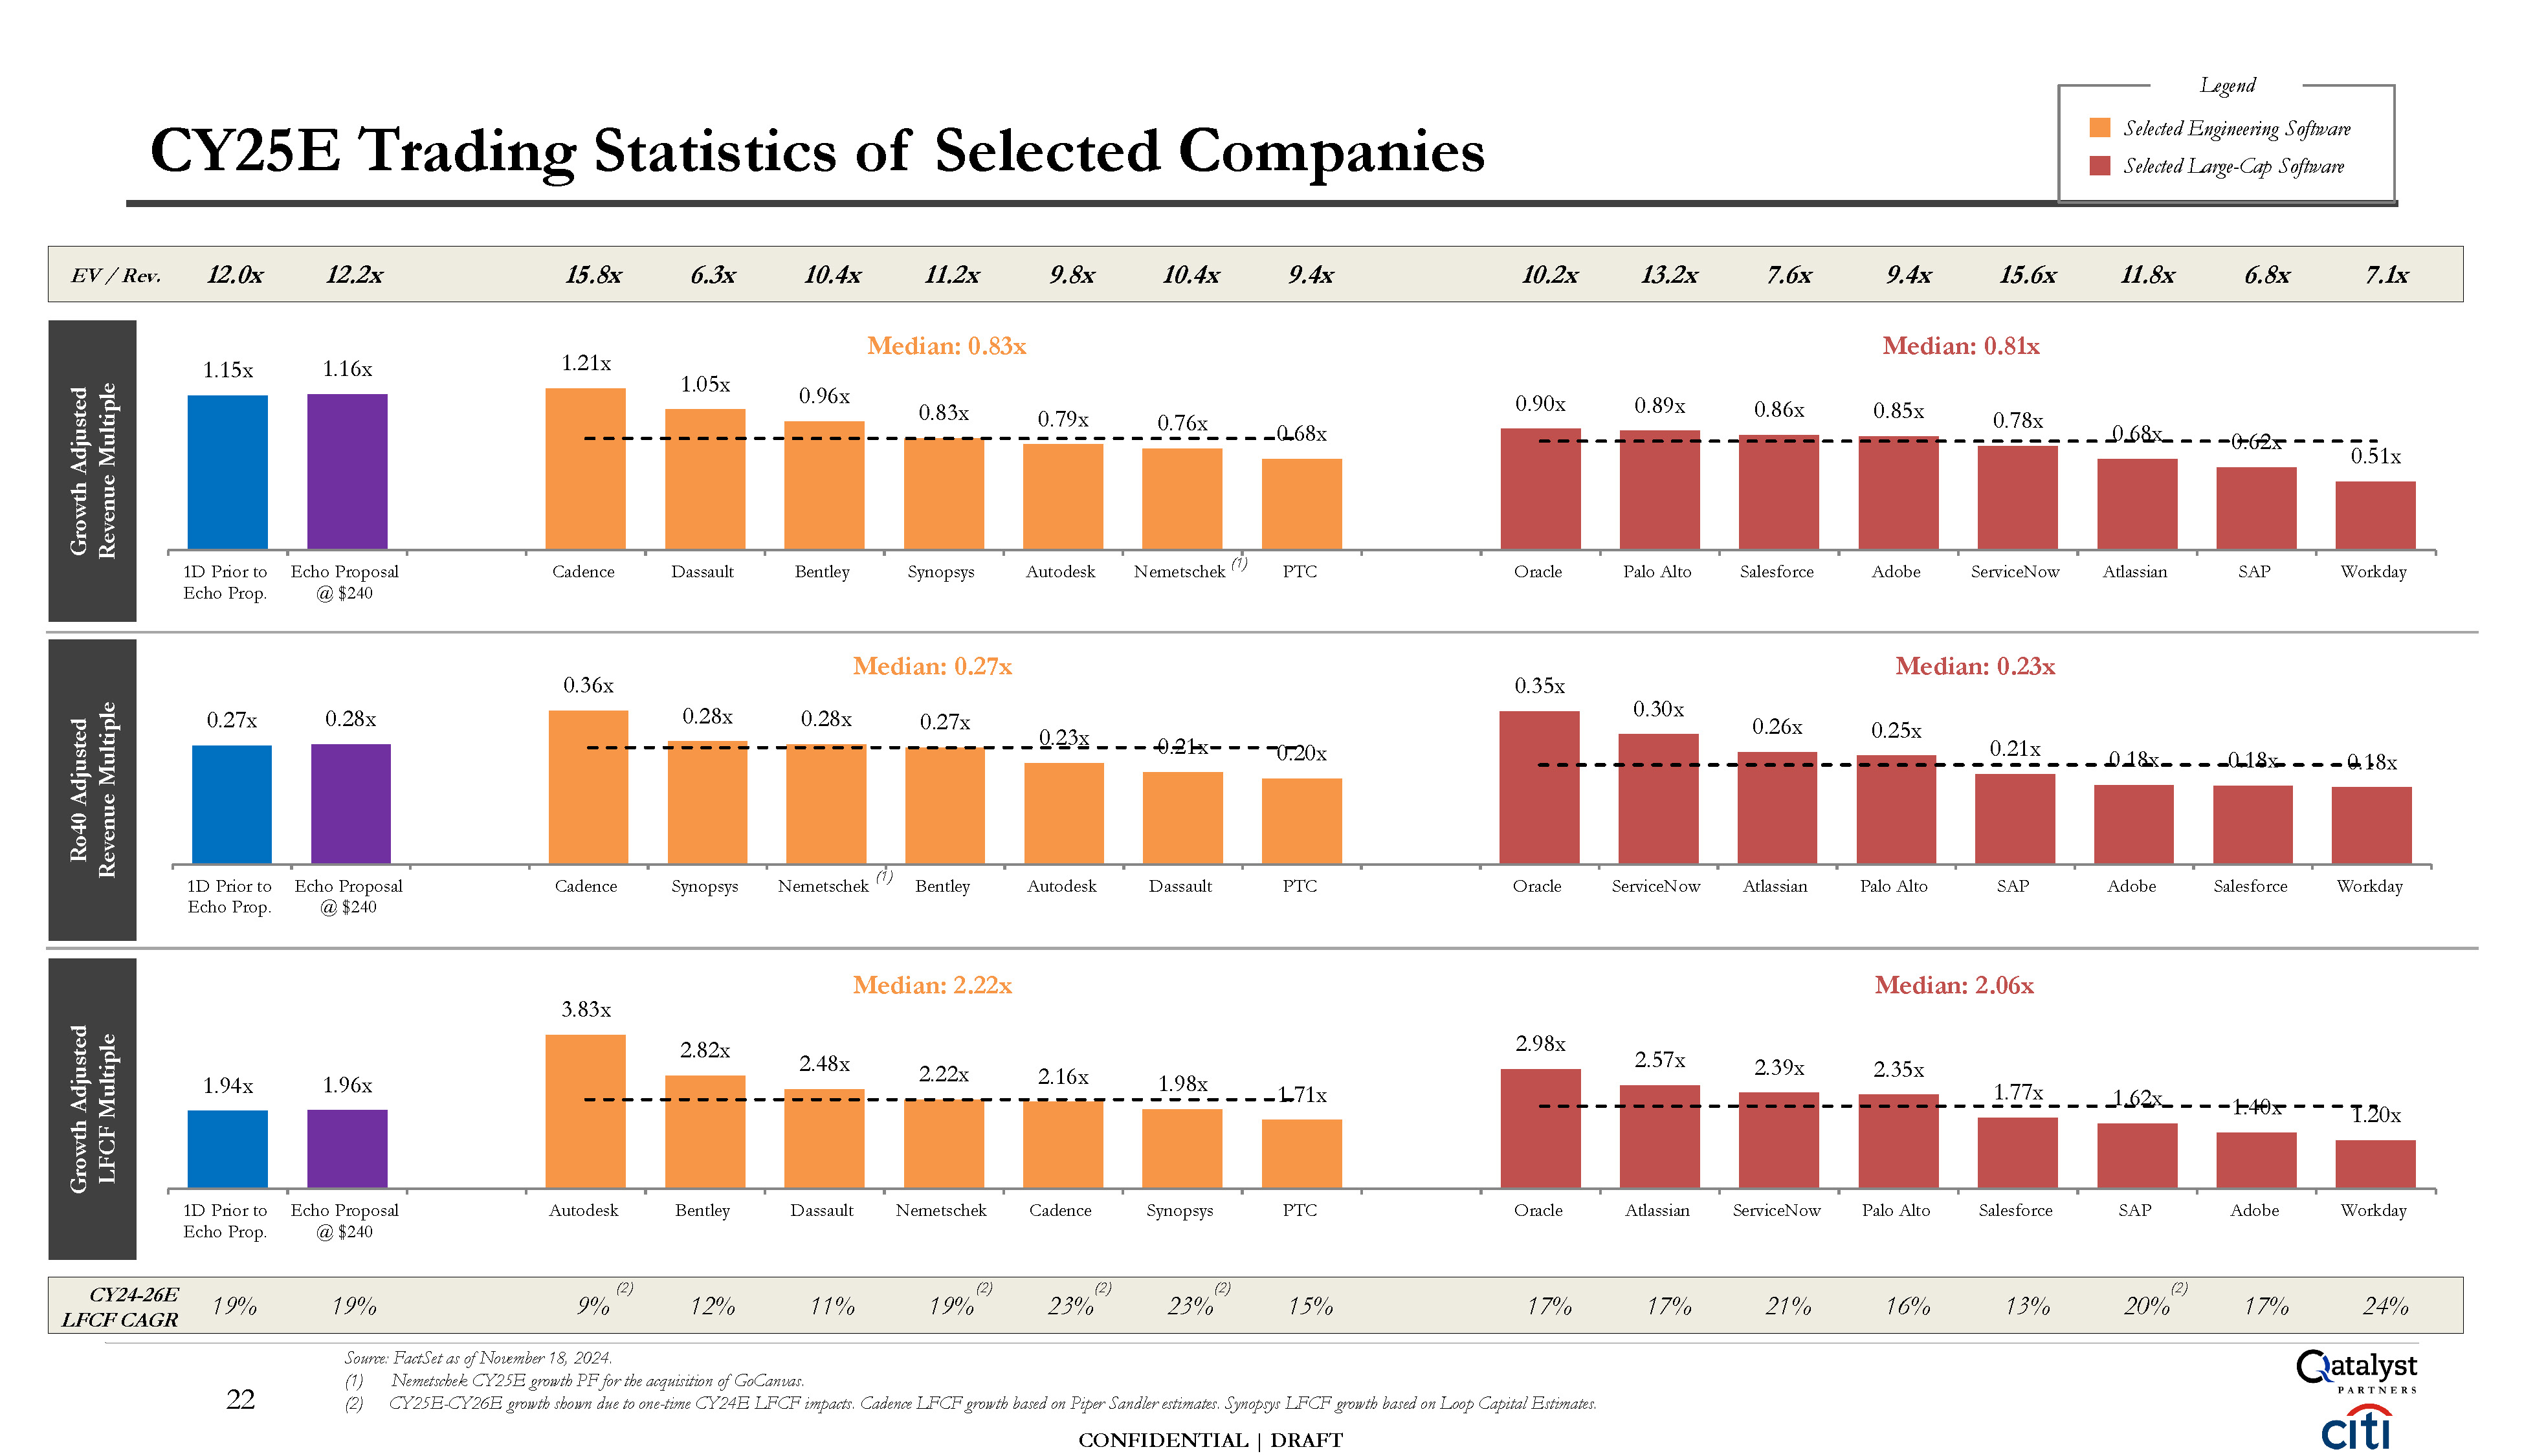
1.15x 1.16x 1.21x 1.05x 0.96x 0.83x 0.79x 0.76x 0.68x 0.90x 0.89x 0.86x 0.85x 0.78x 0.68x 0.62x 0.51x 1D
Prior to Echo Proposal Cadence Dassault Bentley Synopsys Autodesk Nemets chek (1) PTC Oracle Palo Alto Salesforce Adobe ServiceNow Atlassian SAP Workday Echo Prop. @ $240 Median: 0.81x Median:
0.83x 0.27x 0.28x 0.36x 0.28x 0.28x 0.27x 0.23x 0.21x 0.20x 0.35x 0.30x 0.26x 0.25x 0.21x 0.18x 0.18x 0.18x Median: 0.23x Median:
0.27x 1.94x 1.96x 3.83x 2.82x 2.48x 2.22x 2.16x 1.98x 1.71x 2.98x 2.57x 2.39x 2.35x 1.77x 1.62x 1.40x 1.20x 1D Prior to Echo
Proposal Autodesk Bentley Dassault Nemetschek Cadence Synopsys PTC Oracle Atlassian ServiceNow Palo Alto Salesforce SAP Adobe Workday Echo Prop. @ $240 Median: 2.06x Median: 2.22x CY25E Trading Statistics of Selected
Companies Source: FactSet as of November 18, 2024. (1) Nemetschek CY25E growth PF for the acquisition of GoCanvas. EV /
Rev. 12.0x 12.2x 15.8x 6.3x 10.4x 11.2x 9.8x 10.4x 9.4x 10.2x 13.2x 7.6x 9.4x 15.6x 11.8x 6.8x 7.1x Growth Adjusted LFCF Multiple Growth Adjusted Revenue Multiple Ro40 Adjusted Revenue Multiple 1D Prior to Echo
Proposal Cadence Synopsys Nemetschek (1) Bentley Autodesk Dassault PTC Oracle ServiceNow Atlassian Palo Alto SAP Adobe Salesforce Workday Echo Prop. @ $240 Legend Selected Engineering Software Selected Large-Cap
Software 22 (2) CY25E-CY26E growth shown due to one-time CY24E LFCF impacts. Cadence LFCF growth based on Piper Sandler estimates. Synopsys LFCF growth based on Loop Capital Estimates. CONFIDENTIAL | DRAFT CY24-26E 19% LFCF
CAGR 19% (2) 9% 12% 11% (2) 19% (2) 23% (2) 23% 15% 17% 17% 21% 16% 13% (2) 20% 17% 24%
Shareholder & Engagement Considerations
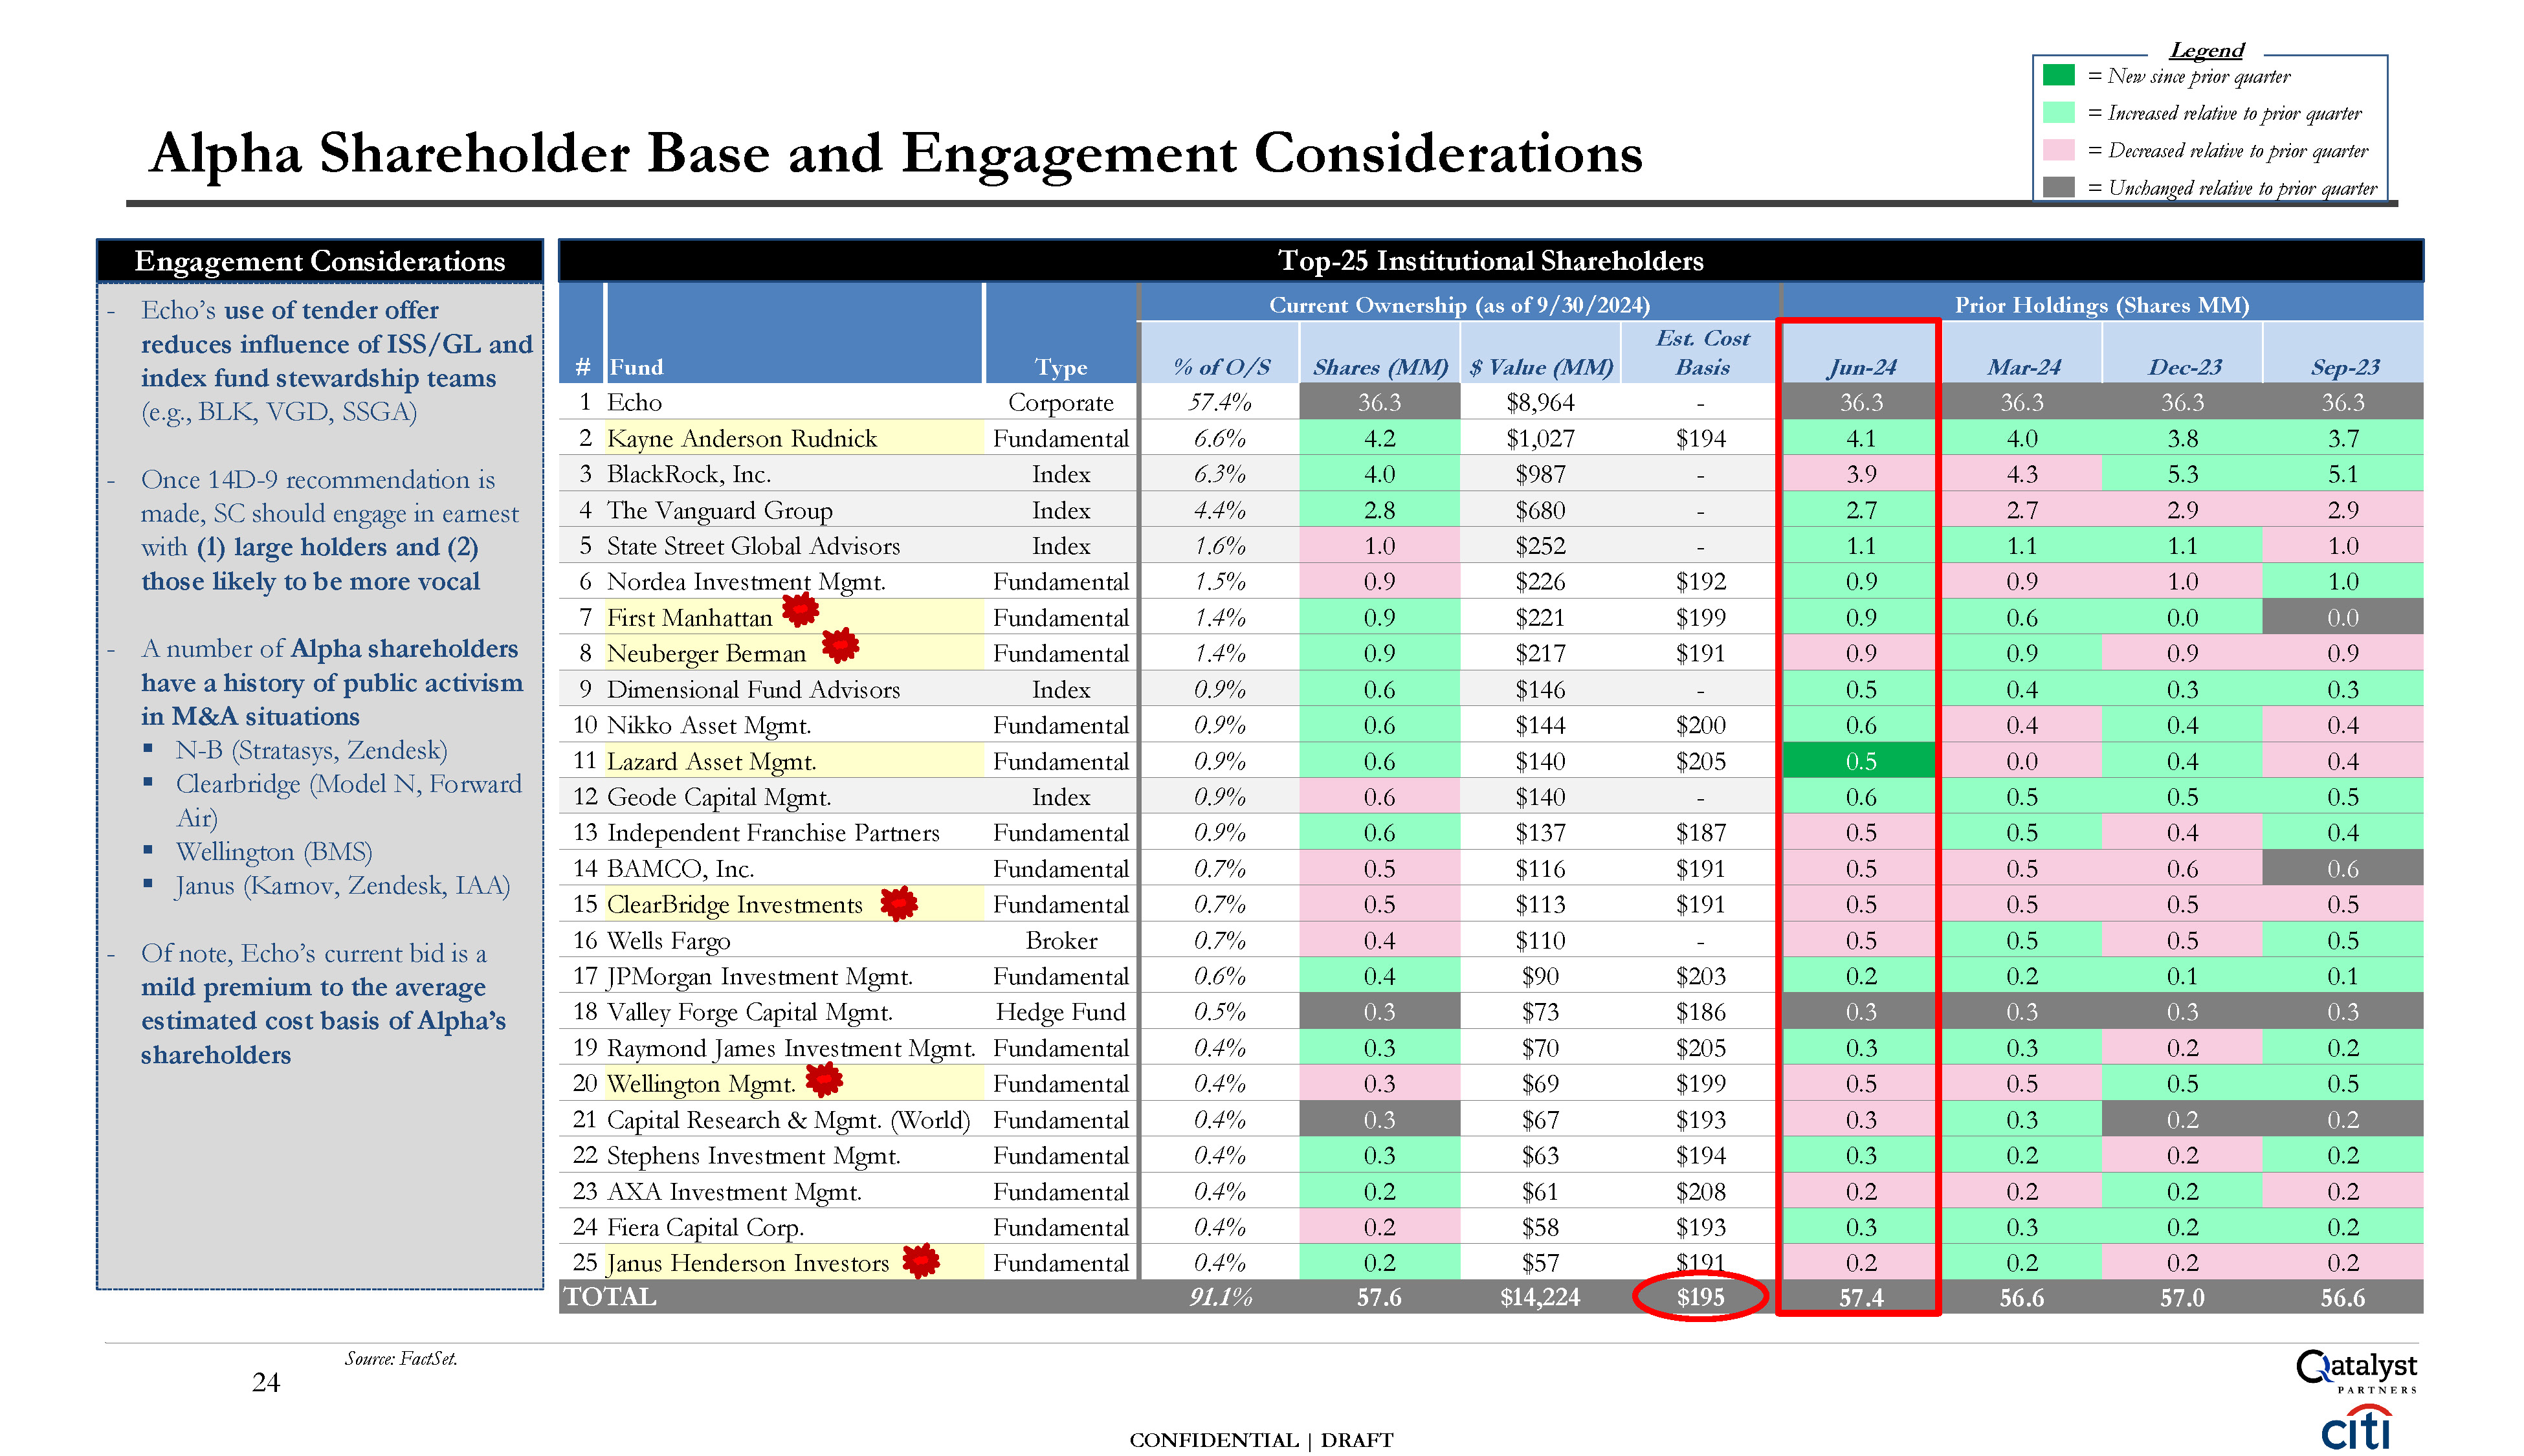
Top-25 Institutional Shareholders # Fund Type Current Ownership (as of
9/30/2024) Prior Holdings (Shares MM) % of O/S Shares (MM) $ Value (MM) Est. Cost Basis Jun-24 Mar-24 Dec-23 Sep-23 1 Echo Corporate 57.4% 36.3 $8,964 - 36.3 36.3 36.3 36.3 2 Kayne Anderson
Rudnick Fundamental 6.6% 4.2 $1,027 $194 4.1 4.0 3.8 3.7 3 BlackRock, Inc. Index 6.3% 4.0 $987 - 3.9 4.3 5.3 5.1 4 The Vanguard Group Index 4.4% 2.8 $680 - 2.7 2.7 2.9 2.9 5 State Street Global
Advisors Index 1.6% 1.0 $252 - 1.1 1.1 1.1 1.0 6 Nordea Investment Mgmt. Fundamental 1.5% 0.9 $226 $192 0.9 0.9 1.0 1.0 7 First Manhattan Fundamental 1.4% 0.9 $221 $199 0.9 0.6 0.0 0.0 8 Neuberger
Berman Fundamental 1.4% 0.9 $217 $191 0.9 0.9 0.9 0.9 9 Dimensional Fund Advisors Index 0.9% 0.6 $146 - 0.5 0.4 0.3 0.3 10 Nikko Asset Mgmt. Fundamental 0.9% 0.6 $144 $200 0.6 0.4 0.4 0.4 11 Lazard Asset
Mgmt. Fundamental 0.9% 0.6 $140 $205 0.5 0.0 0.4 0.4 12 Geode Capital Mgmt. Index 0.9% 0.6 $140 - 0.6 0.5 0.5 0.5 13 Independent Franchise Partners Fundamental 0.9% 0.6 $137 $187 0.5 0.5 0.4 0.4 14 BAMCO,
Inc. Fundamental 0.7% 0.5 $116 $191 0.5 0.5 0.6 0.6 15 ClearBridge Investments Fundamental 0.7% 0.5 $113 $191 0.5 0.5 0.5 0.5 16 Wells Fargo Broker 0.7% 0.4 $110 - 0.5 0.5 0.5 0.5 17 JPMorgan Investment
Mgmt. Fundamental 0.6% 0.4 $90 $203 0.2 0.2 0.1 0.1 18 Valley Forge Capital Mgmt. Hedge Fund 0.5% 0.3 $73 $186 0.3 0.3 0.3 0.3 19 Raymond James Investment Mgmt.
Fundamental 0.4% 0.3 $70 $205 0.3 0.3 0.2 0.2 20 Wellington Mgmt. Fundamental 0.4% 0.3 $69 $199 0.5 0.5 0.5 0.5 21 Capital Research & Mgmt. (World) Fundamental 0.4% 0.3 $67 $193 0.3 0.3 0.2 0.2 22 Stephens
Investment Mgmt. Fundamental 0.4% 0.3 $63 $194 0.3 0.2 0.2 0.2 23 AXA Investment Mgmt. Fundamental 0.4% 0.2 $61 $208 0.2 0.2 0.2 0.2 24 Fiera Capital Corp. Fundamental 0.4% 0.2 $58 $193 0.3 0.3 0.2 0.2 25 Janus
Henderson Investors Fundamental 0.4% 0.2 $57 $191 0.2 0.2 0.2 0.2 TOTAL 91.1% 57.6 $14,224 $195 57.4 56.6 57.0 56.6 Legend = New since prior quarter = Increased relative to prior quarter = Decreased relative to prior
quarter = Unchanged relative to prior quarter Echo’s use of tender offer reduces influence of ISS/GL and index fund stewardship teams (e.g., BLK, VGD, SSGA) Once 14D-9 recommendation is made, SC should engage in earnest with (1) large
holders and (2) those likely to be more vocal A number of Alpha shareholders have a history of public activism in M&A situations N-B (Stratasys, Zendesk) Clearbridge (Model N, Forward Air) Wellington (BMS) Janus (Karnov, Zendesk,
IAA) Of note, Echo’s current bid is a mild premium to the average estimated cost basis of Alpha’s shareholders Engagement Considerations Alpha Shareholder Base and Engagement Considerations Source: FactSet. 24 CONFIDENTIAL | DRAFT
Appendix Supplementary Information
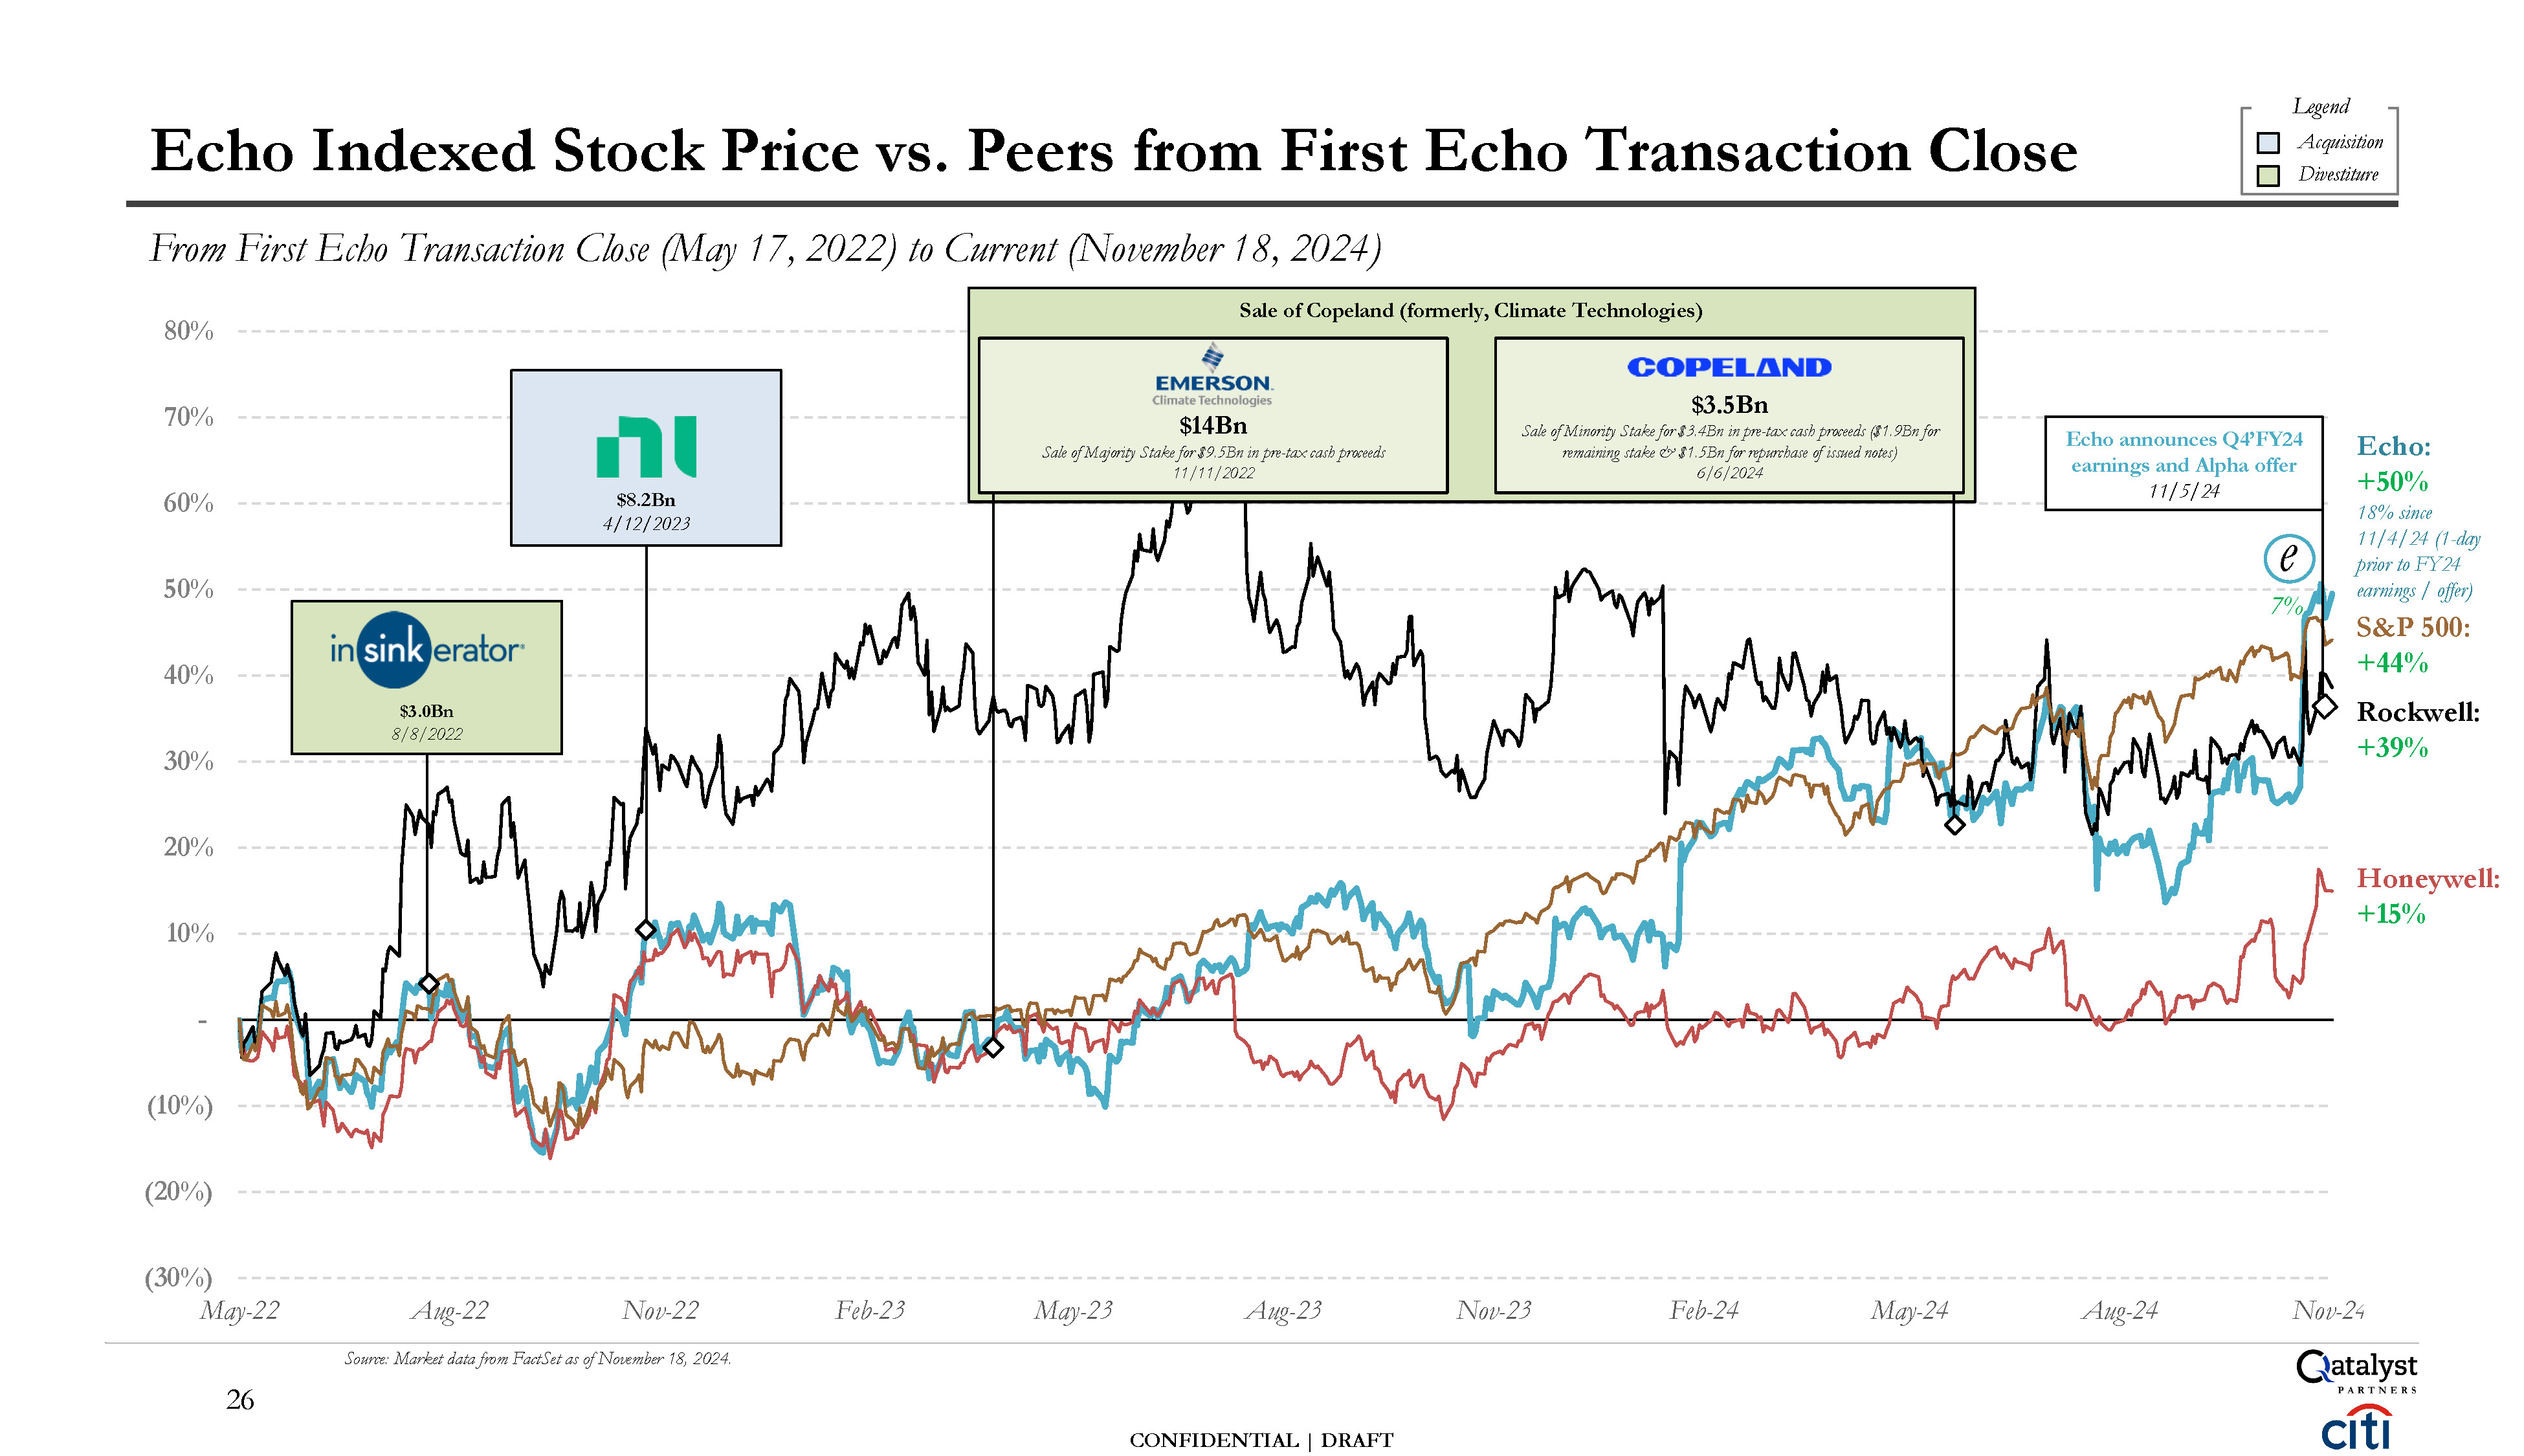
- (10%) (20%) (30%) 10% 20% 30% 40% 50% 60% 70% 80% May-22 Aug-22
Nov-22 Source: Market data from FactSet as of November 18, 2024. Feb-23 May-23 Aug-23 Nov-23 Feb-24 May-24 Aug-24 Nov-24 Echo Indexed Stock Price vs. Peers from First Echo Transaction Close From First Echo Transaction Close (May 17,
2022) to Current (November 18, 2024) Honeywell: +15% Legend Acquisition Divestiture $8.2Bn 4/12/2023 $3.0Bn 8/8/2022 Sale of Copeland (formerly, Climate Technologies) $14Bn Sale of Majority Stake for $9.5Bn in pre-tax cash proceeds
11/11/2022 $3.5Bn Sale of Minority Stake for $3.4Bn in pre-tax cash proceeds ($1.9Bn for remaining stake & $1.5Bn for repurchase of issued notes) 6/6/2024 Echo announces Q4’FY24 earnings and Alpha offer 11/5/24 Echo: +50% 18%
since e prio11/r4t/o2FY244 (1-day earnings / offer) S&P 500: +44% Rockwell: +39% 7% 27 CONFIDENTIAL | DRAFT
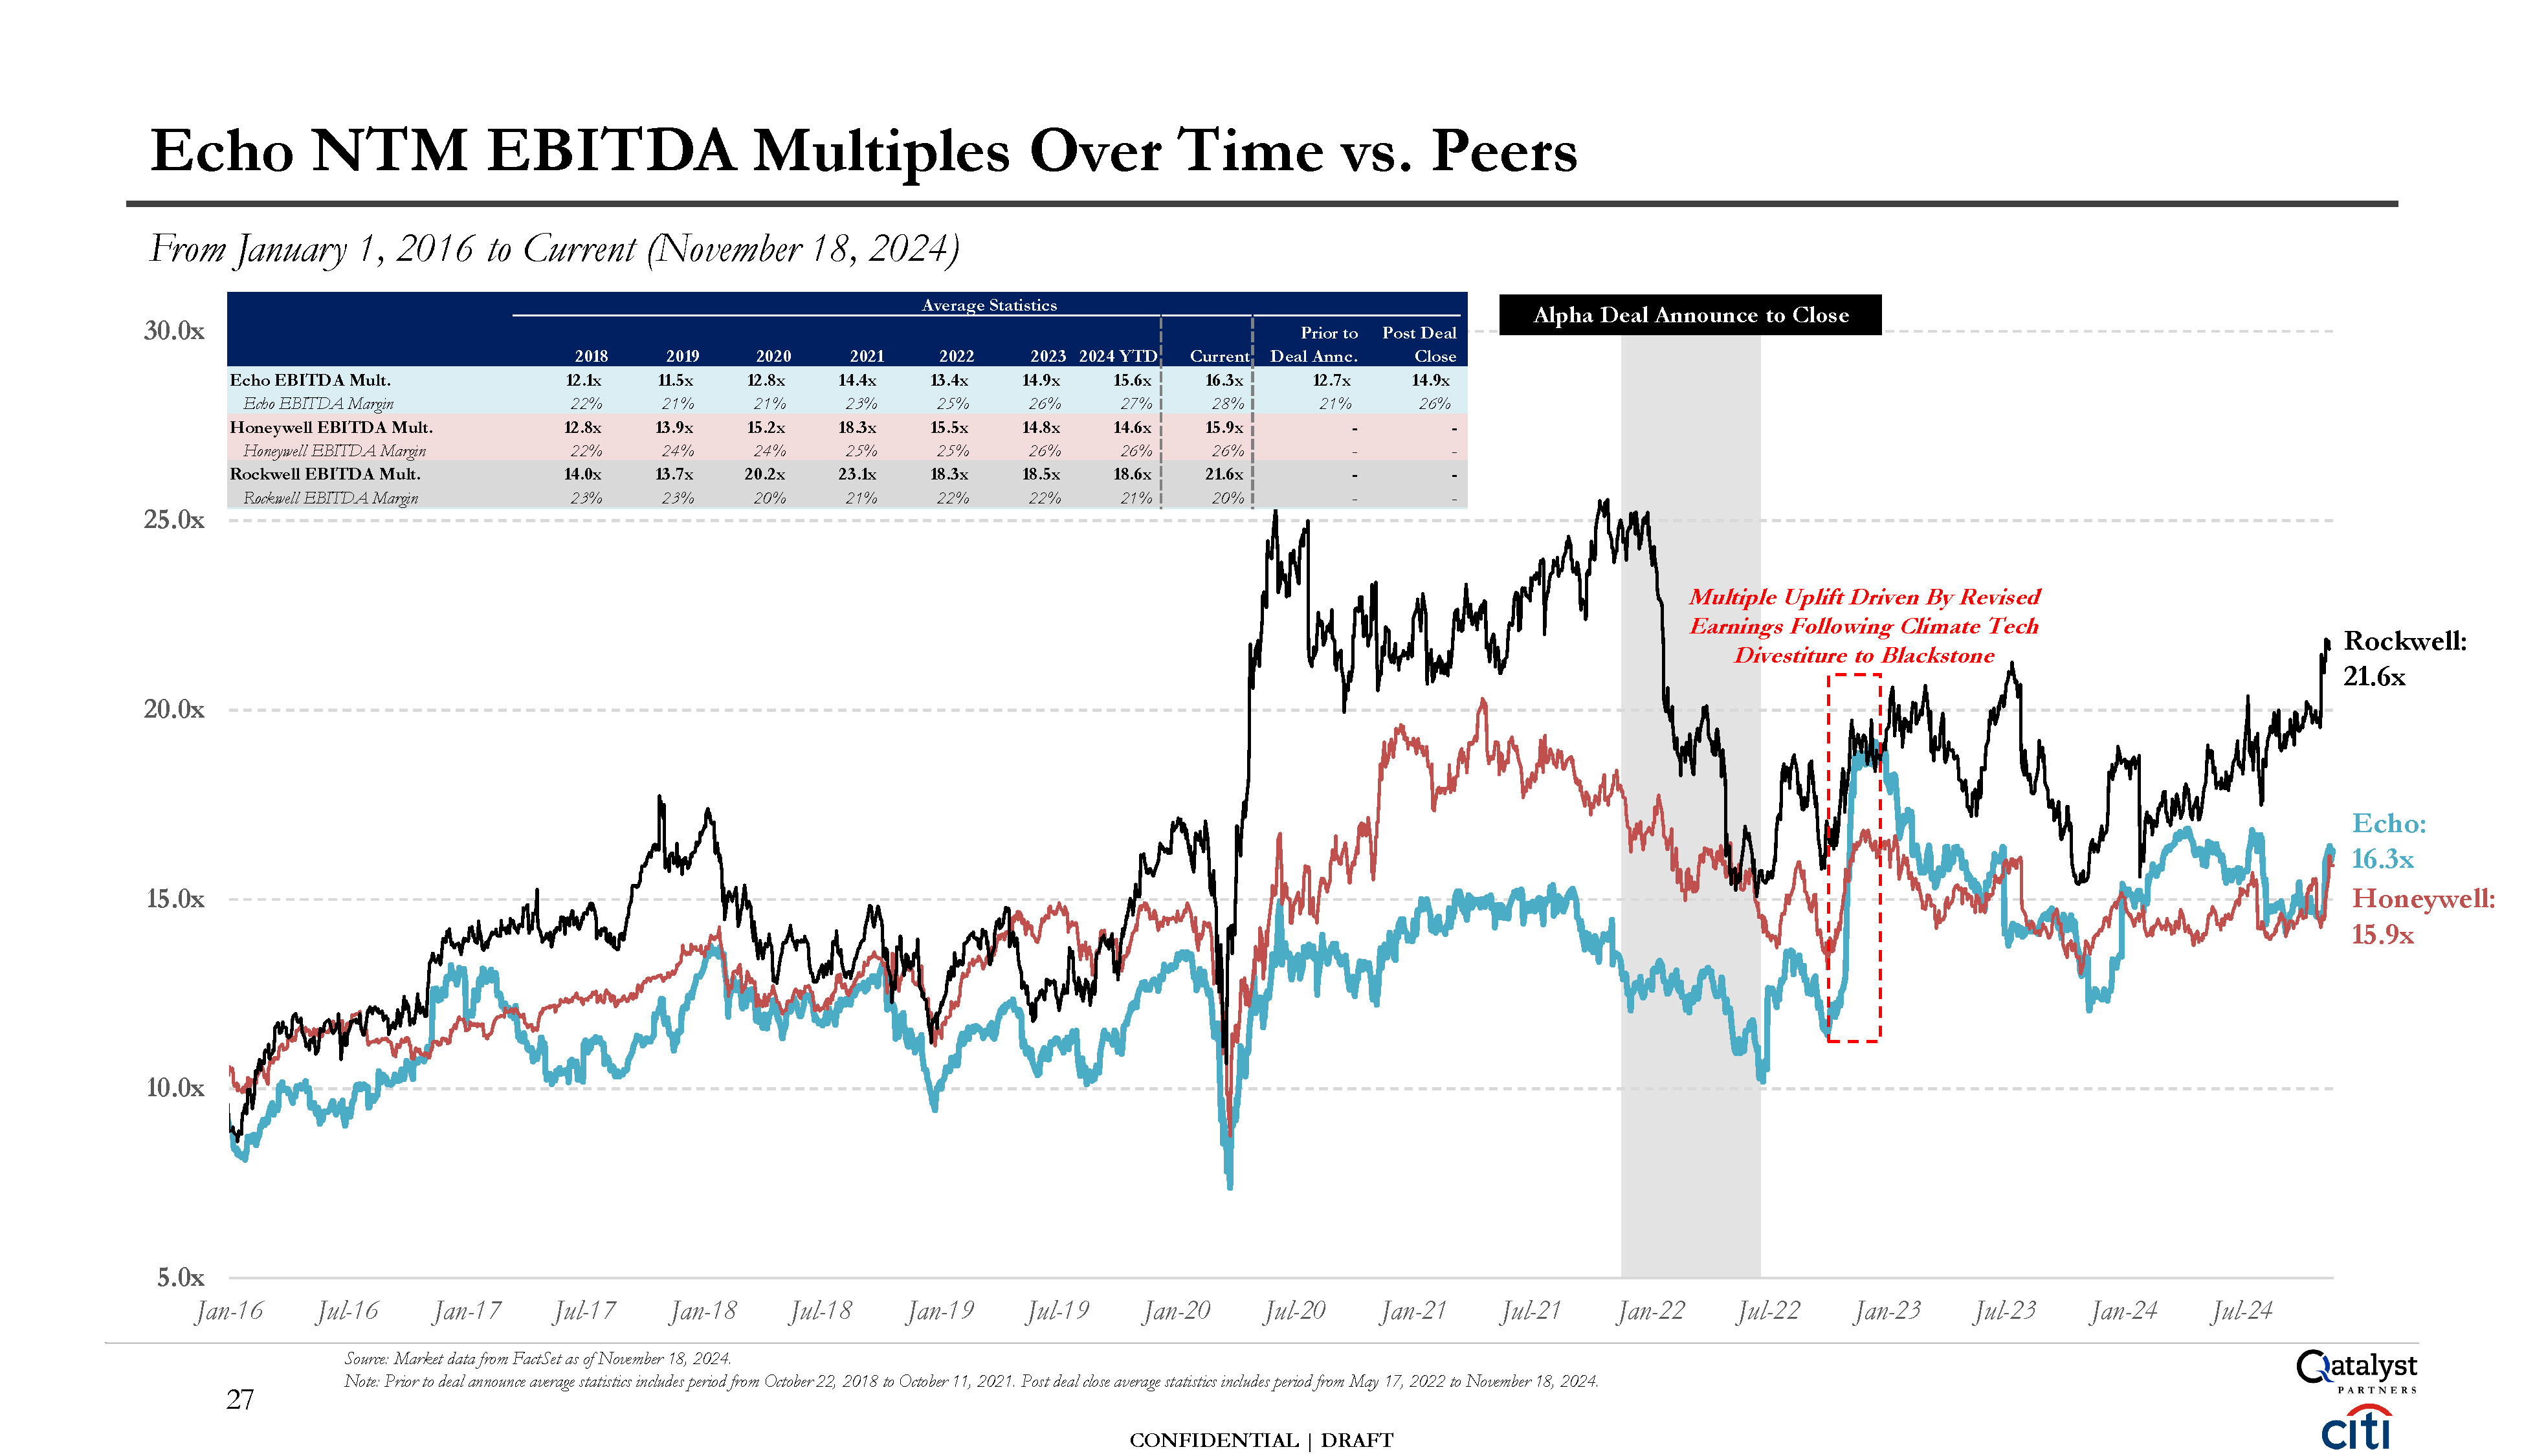
Echo NTM EBITDA Multiples Over Time vs. Peers From January 1, 2016 to Current
(November 18, 2024) Jul-16 Jan-17 Jul-17 Jan-18 Jul-18 Jan-19 Jul-19 Jan-20 Jul-20 Jan-21 Jul-21 Source: Market data from FactSet as of November 18, 2024. Note: Prior to deal announce average statistics includes period from October 22, 2018
to October 11, 2021. Post deal close average statistics includes period from May 17, 2022 to November 18, 2024. Multiple Uplift Driven By Revised Earnings Following Climate Tech Divestiture to
Blackstone 5.0x 10.0x 15.0x 20.0x 25.0x 30.0x Jan-16 Jan-22 Jul-22 Jan-23 Jul-23 Jan-24 Jul-24 Alpha Deal Announce to Close Echo: 16.3x Honeywell: 15.9x Rockwell: 21.6x Average Statistics 2018 2019 2020 2021 2022 2023
2024 YTD Current Prior to Deal Annc. Post Deal Close Echo EBITDA Mult. Echo EBITDA Margin 12.1x 22% 11.5x 21% 12.8x 21% 14.4x 23% 13.4x 25% 14.9x 26% 15.6x 27% 16.3x 28% 12.7x 21% 14.9x 26% Honeywell EBITDA
Mult. Honeywell EBITDA Margin 12.8x 22% 13.9x 24% 15.2x 24% 18.3x 25% 15.5x 25% 14.8x 26% 14.6x 26% 15.9x 26% - - - - Rockwell EBITDA Mult. Rockwell EBITDA
Margin 14.0x 23% 13.7x 23% 20.2x 20% 23.1x 21% 18.3x 22% 18.5x 22% 18.6x 21% 21.6x 20% - - - - 27 CONFIDENTIAL | DRAFT
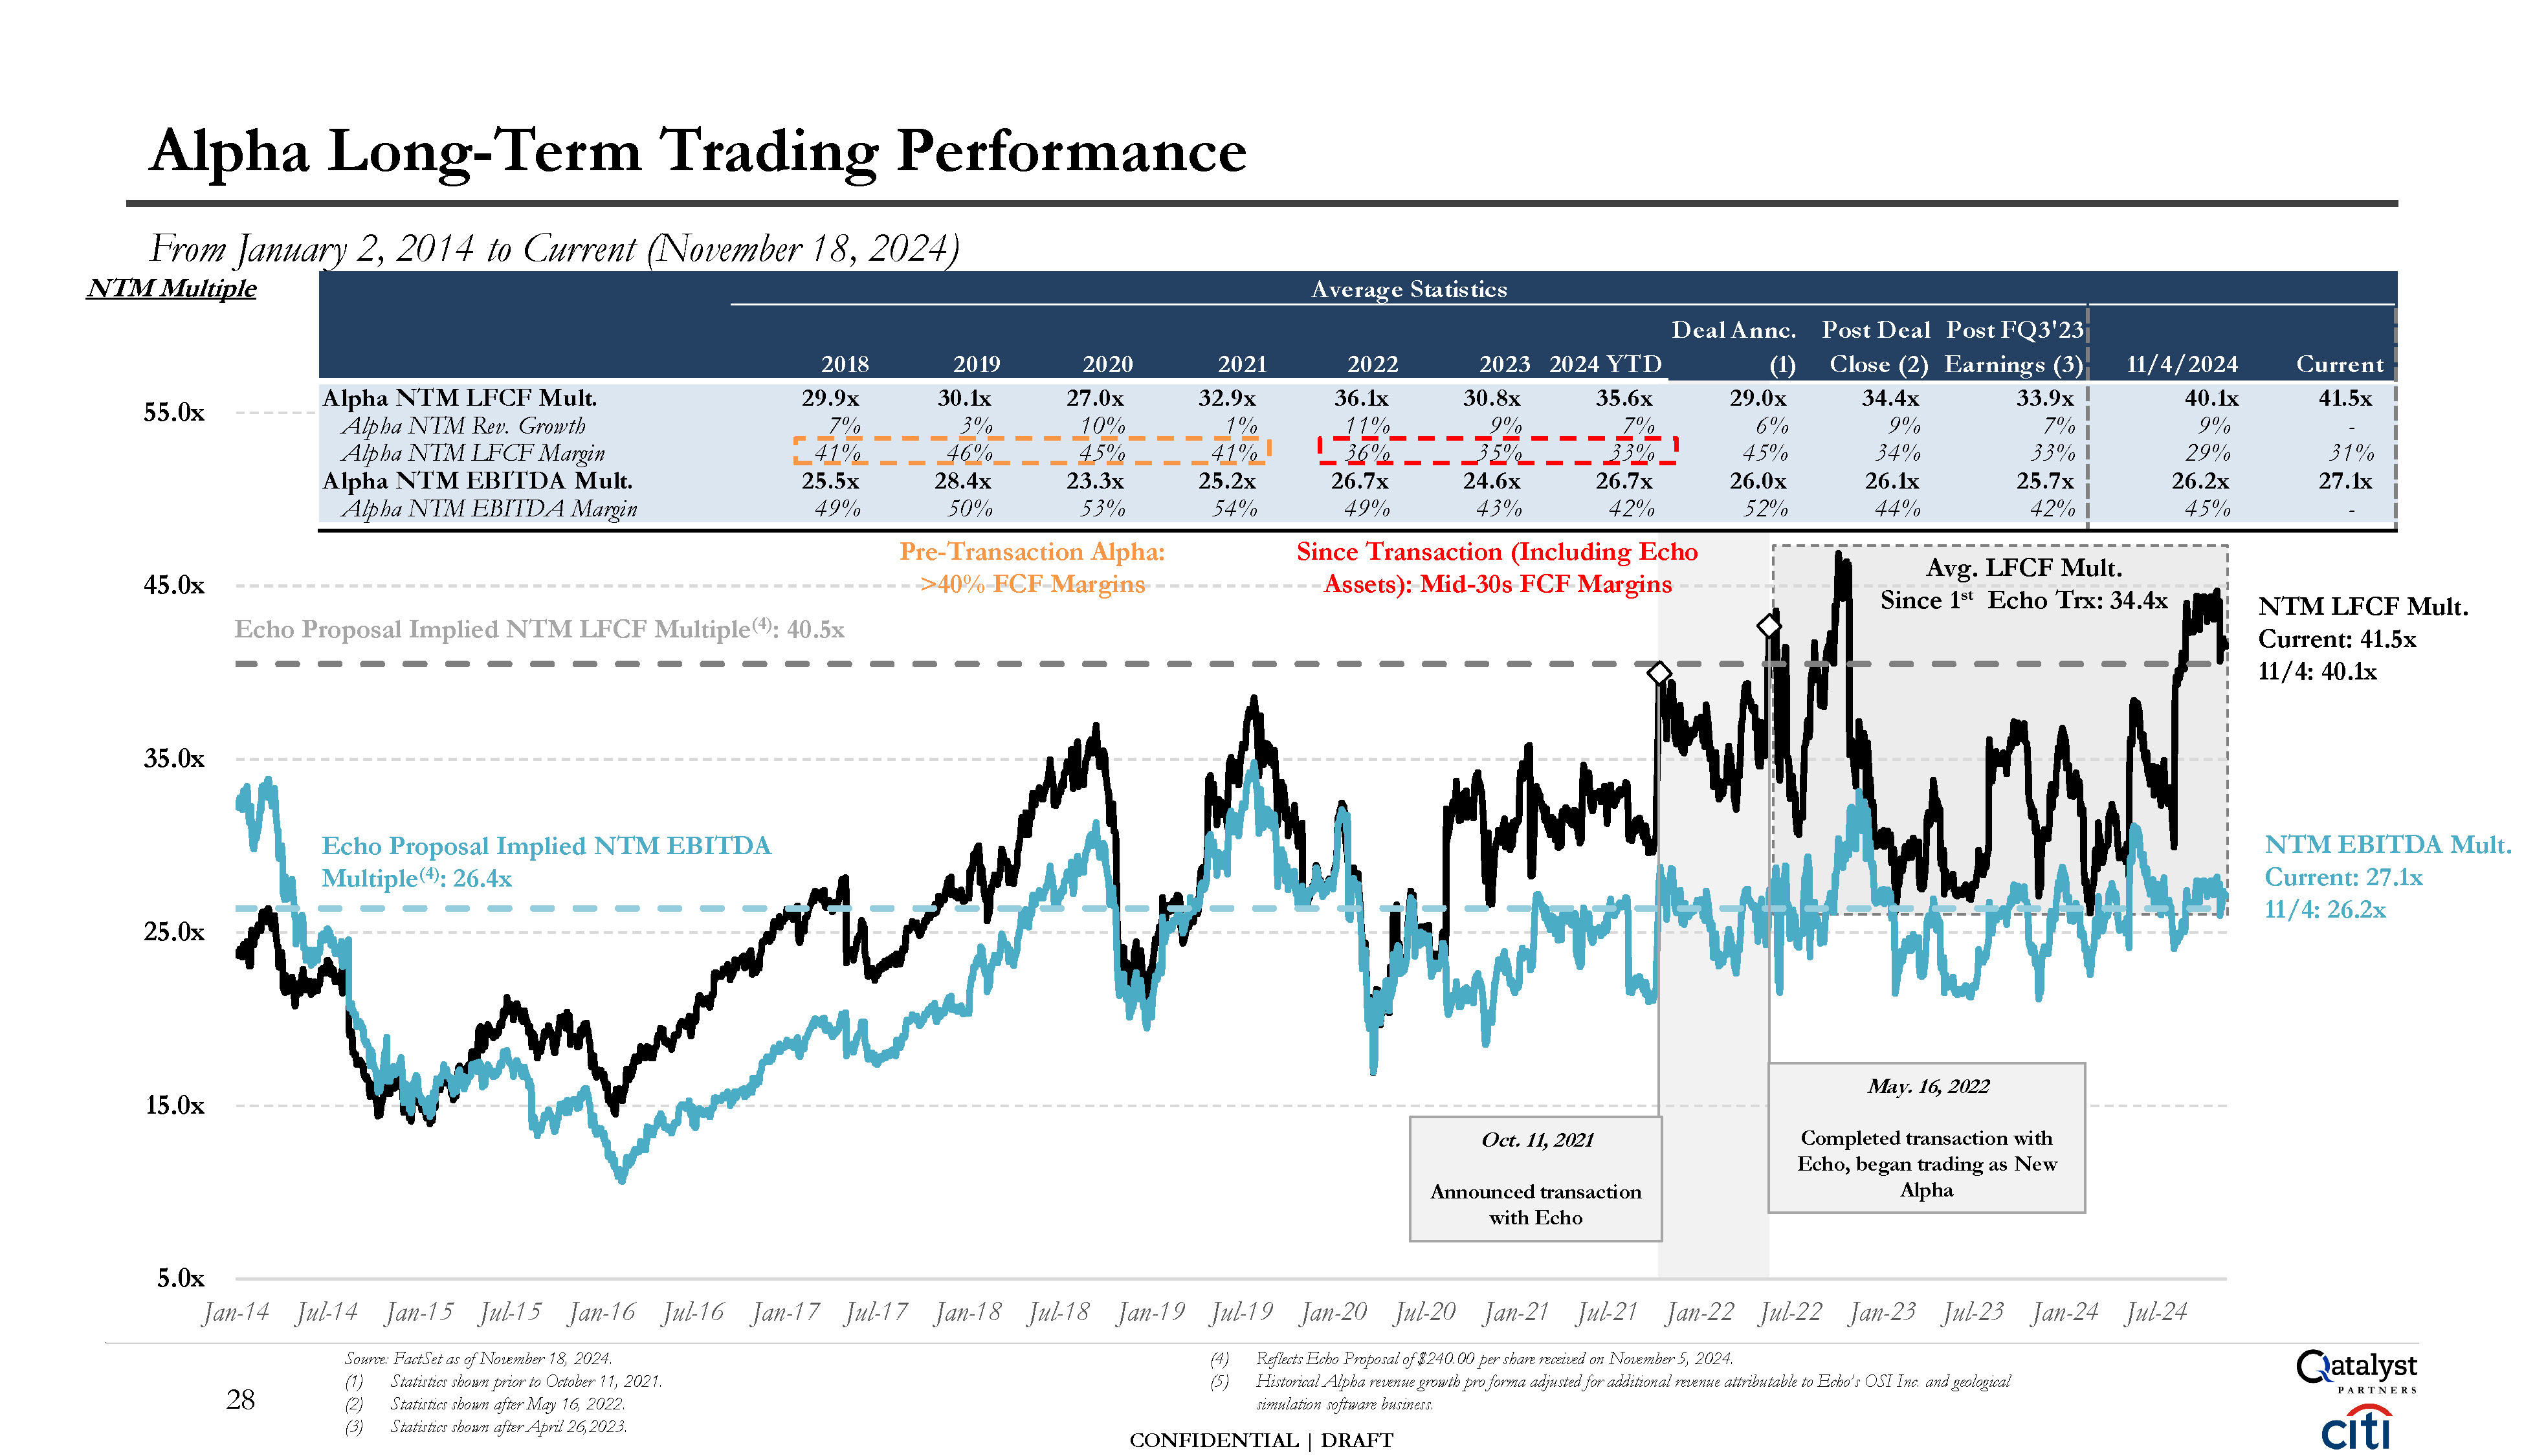
5.0x 15.0x 25.0x 35.0x 45.0x 55.0x Average Statistics 2018 2019 2020 2021
2022 2023 2024 YTD Deal Annc. (1) Post Deal Post FQ3'23 Close (2) Earnings (3) 11/4/2024
Current 29.0x 41.5x - 29.9x 7% 41% 30.1x 3% 46% 27.0x 10% 45% 32.9x 1% 41% 36.1x 11% 36% 30.8x 9% 35% 35.6x 7% 33% 6% 45% 28.4x 26.7x 26.0x 31% 27.1x Alpha NTM LFCF Mult. Alpha NTM Rev. Growth Alpha NTM LFCF
Margin Alpha NTM EBITDA Mult. Alpha NTM EBITDA Margin 25.5x 49% 50% 23.3x 53% 25.2x 54% 49% 24.6x 43% 26.7x 42% 52% 34.4x 9% 34% 26.1x 44% 33.9x 7% 33% 25.7x 42% 40.1x 9% 29% 26.2x 45% - Alpha Long-Term Trading
Performance From January 2, 2014 to Current (November 18, 2024) 28 Jan-14 Jul-14 Jan-15 Jul-15 Jan-16 Jul-16 Jan-17 Jul-17 Jan-18 Jul-18 Source: FactSet as of November 18, 2024. Statistics shown prior to October 11, 2021. Statistics shown
after May 16, 2022. Statistics shown after April 26,2023. Jan-19 Jul-19 Jan-20 Jul-20 Jan-21 Jul-21 Jan-22 Jul-22 Jan-23 Jul-23 Jan-24 Jul-24 Reflects Echo Proposal of $240.00 per share received on November 5, 2024. Historical Alpha revenue
growth pro forma adjusted for additional revenue attributable to Echo’s OSI Inc. and geological simulation software business. CONFIDENTIAL | DRAFT Echo Proposal Implied NTM LFCF Multiple(4): 40.5x NTM Multiple NTM EBITDA Mult. Current:
27.1x 11/4: 26.2x Echo Proposal Implied NTM EBITDA Multiple(4): 26.4x Oct. 11, 2021 Announced transaction with Echo Pre-Transaction Alpha: >40% FCF Margins Since Transaction (Including Echo Assets): Mid-30s FCF Margins Avg. LFCF
Mult. Since 1st Echo Trx: 34.4x NTM LFCF Mult. Current: 41.5x 11/4: 40.1x May. 16, 2022 Completed transaction with Echo, began trading as New Alpha
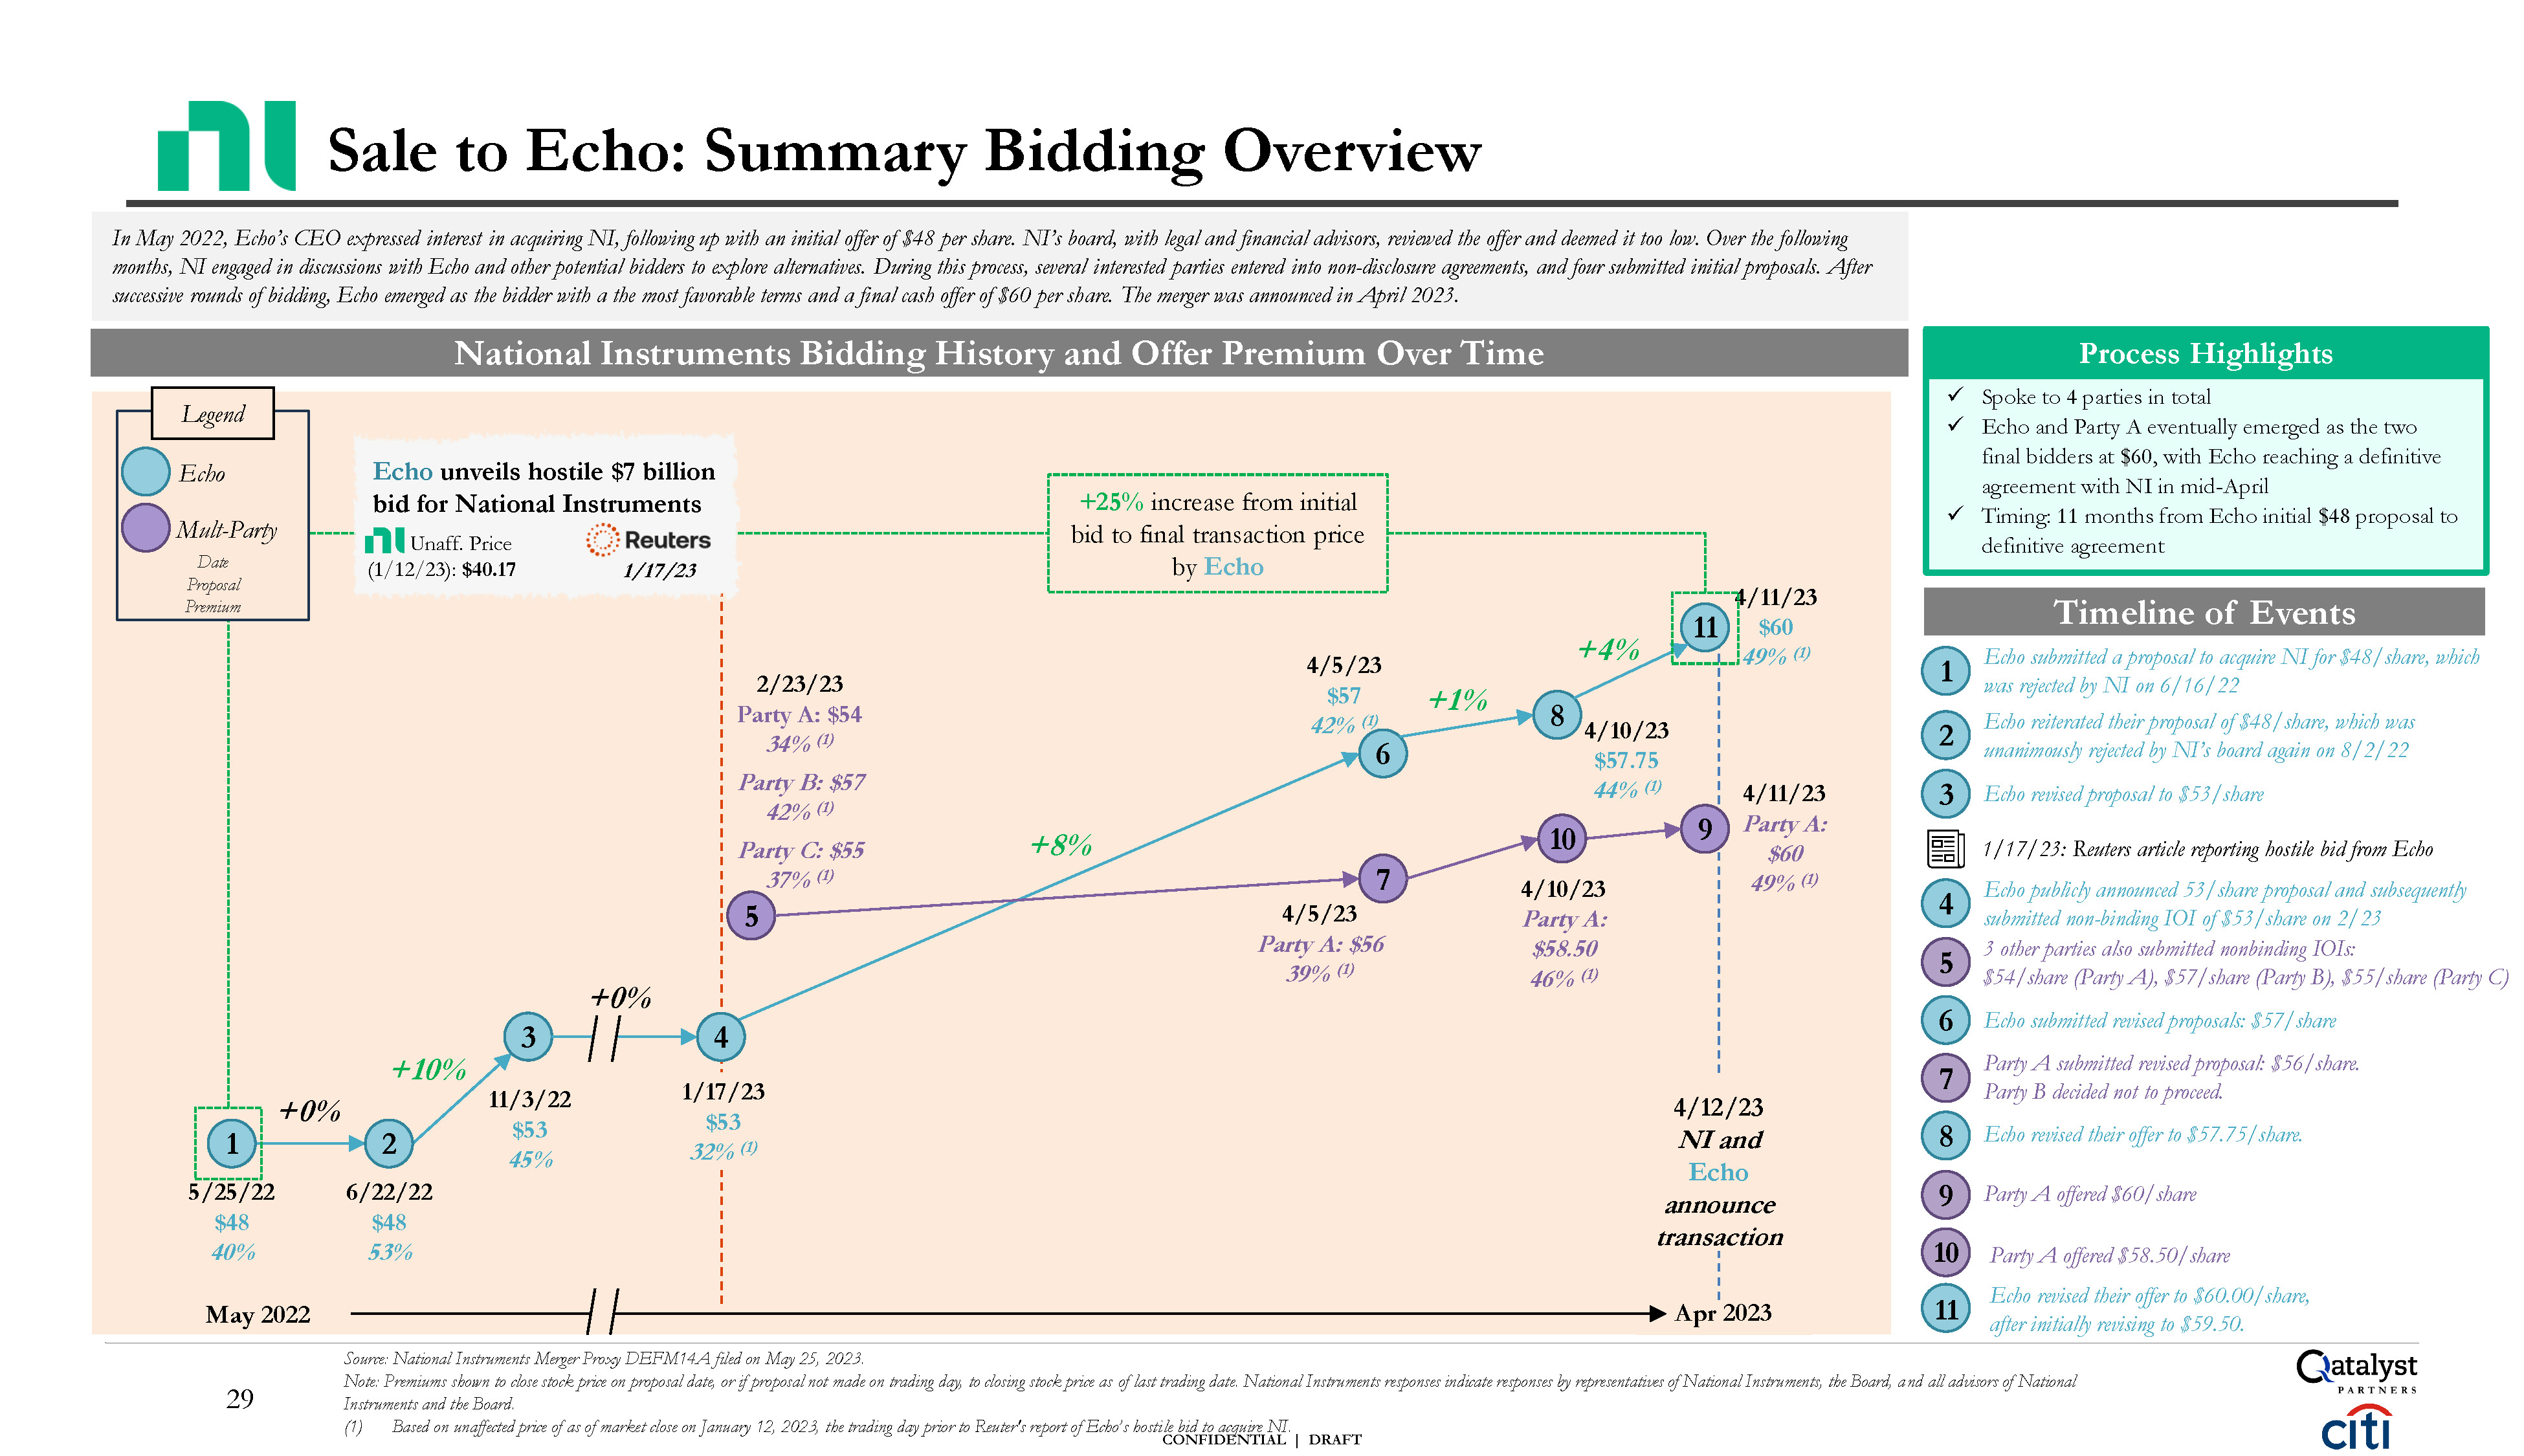
CONFIDENTIAL | DRAFT Source: National Instruments Merger Proxy DEFM14A filed on
May 25, 2023. Note: Premiums shown to close stock price on proposal date, or if proposal not made on trading day, to closing stock price as of last trading date. National Instruments responses indicate responses by representatives of National
Instruments, the Board, and all advisors of National Instruments and the Board. (1) Based on unaffected price of as of market close on January 12, 2023, the trading day prior to Reuter's report of Echo’s hostile bid to acquire
NI. 29 Timeline of Events 1 2 3 Echo submitted a proposal to acquire NI for $48/share, which was rejected by NI on 6/16/22 Echo reiterated their proposal of $48/share, which was unanimously rejected by NI’s board again on 8/2/22 Echo
revised proposal to $53/share National Instruments Bidding History and Offer Premium Over Time In May 2022, Echo’s CEO expressed interest in acquiring NI, following up with an initial offer of $48 per share. NI’s board, with legal and
financial advisors, reviewed the offer and deemed it too low. Over the following months, NI engaged in discussions with Echo and other potential bidders to explore alternatives. During this process, several interested parties entered into
non-disclosure agreements, and four submitted initial proposals. After successive rounds of bidding, Echo emerged as the bidder with a the most favorable terms and a final cash offer of $60 per share. The merger was announced in April
2023. Spoke to 4 parties in total Echo and Party A eventually emerged as the two final bidders at $60, with Echo reaching a definitive agreement with NI in mid-April Timing: 11 months from Echo initial $48 proposal to definitive
agreement Process Highlights Sale to Echo: Summary Bidding Overview Echo publicly announced 53/share proposal and subsequently submitted non-binding IOI of $53/share on 2/23 3 other parties also submitted nonbinding IOIs: $54/share (Party
A), $57/share (Party B), $55/share (Party C) Echo submitted revised proposals: $57/share Party A submitted revised proposal: $56/share. Party B decided not to proceed. Echo revised their offer to
$57.75/share. 4 5 6 7 8 9 10 11 Party A offered $58.50/share Echo revised their offer to $60.00/share, after initially revising to $59.50. Party A offered $60/share 2 6/22/22 $48 53% 3 11/3/22 $53 45% 4/12/23 NI and Echo
announce transaction May 2022 1 5/25/22 $48 40% 4/5/23 Party A: $56 39% (1) 4/5/23 $57 42% (1) 6 7 4/10/23 $57.75 44% (1) 9 8 4/11/23 Party A: $60 49% (1) 4/11/23 11 $60 49% (1) 10 4/10/23 Party A: $58.50 46% (1) Apr
2023 1/17/23 $53 32% (1) 4 2/23/23 Party A: $54 34% (1) Party B: $57 42% (1) Party C: $55 37% (1) 5 1/17/23: Reuters article reporting hostile bid from Echo +0% +10% +0% +8% +1% +4% +25% increase from initial bid to final
transaction price by Echo Legend Echo Mult-Party Date Proposal Premium Echo unveils hostile $7 billion bid for National Instruments Unaff. Price (1/12/23): $40.17 1/17/23
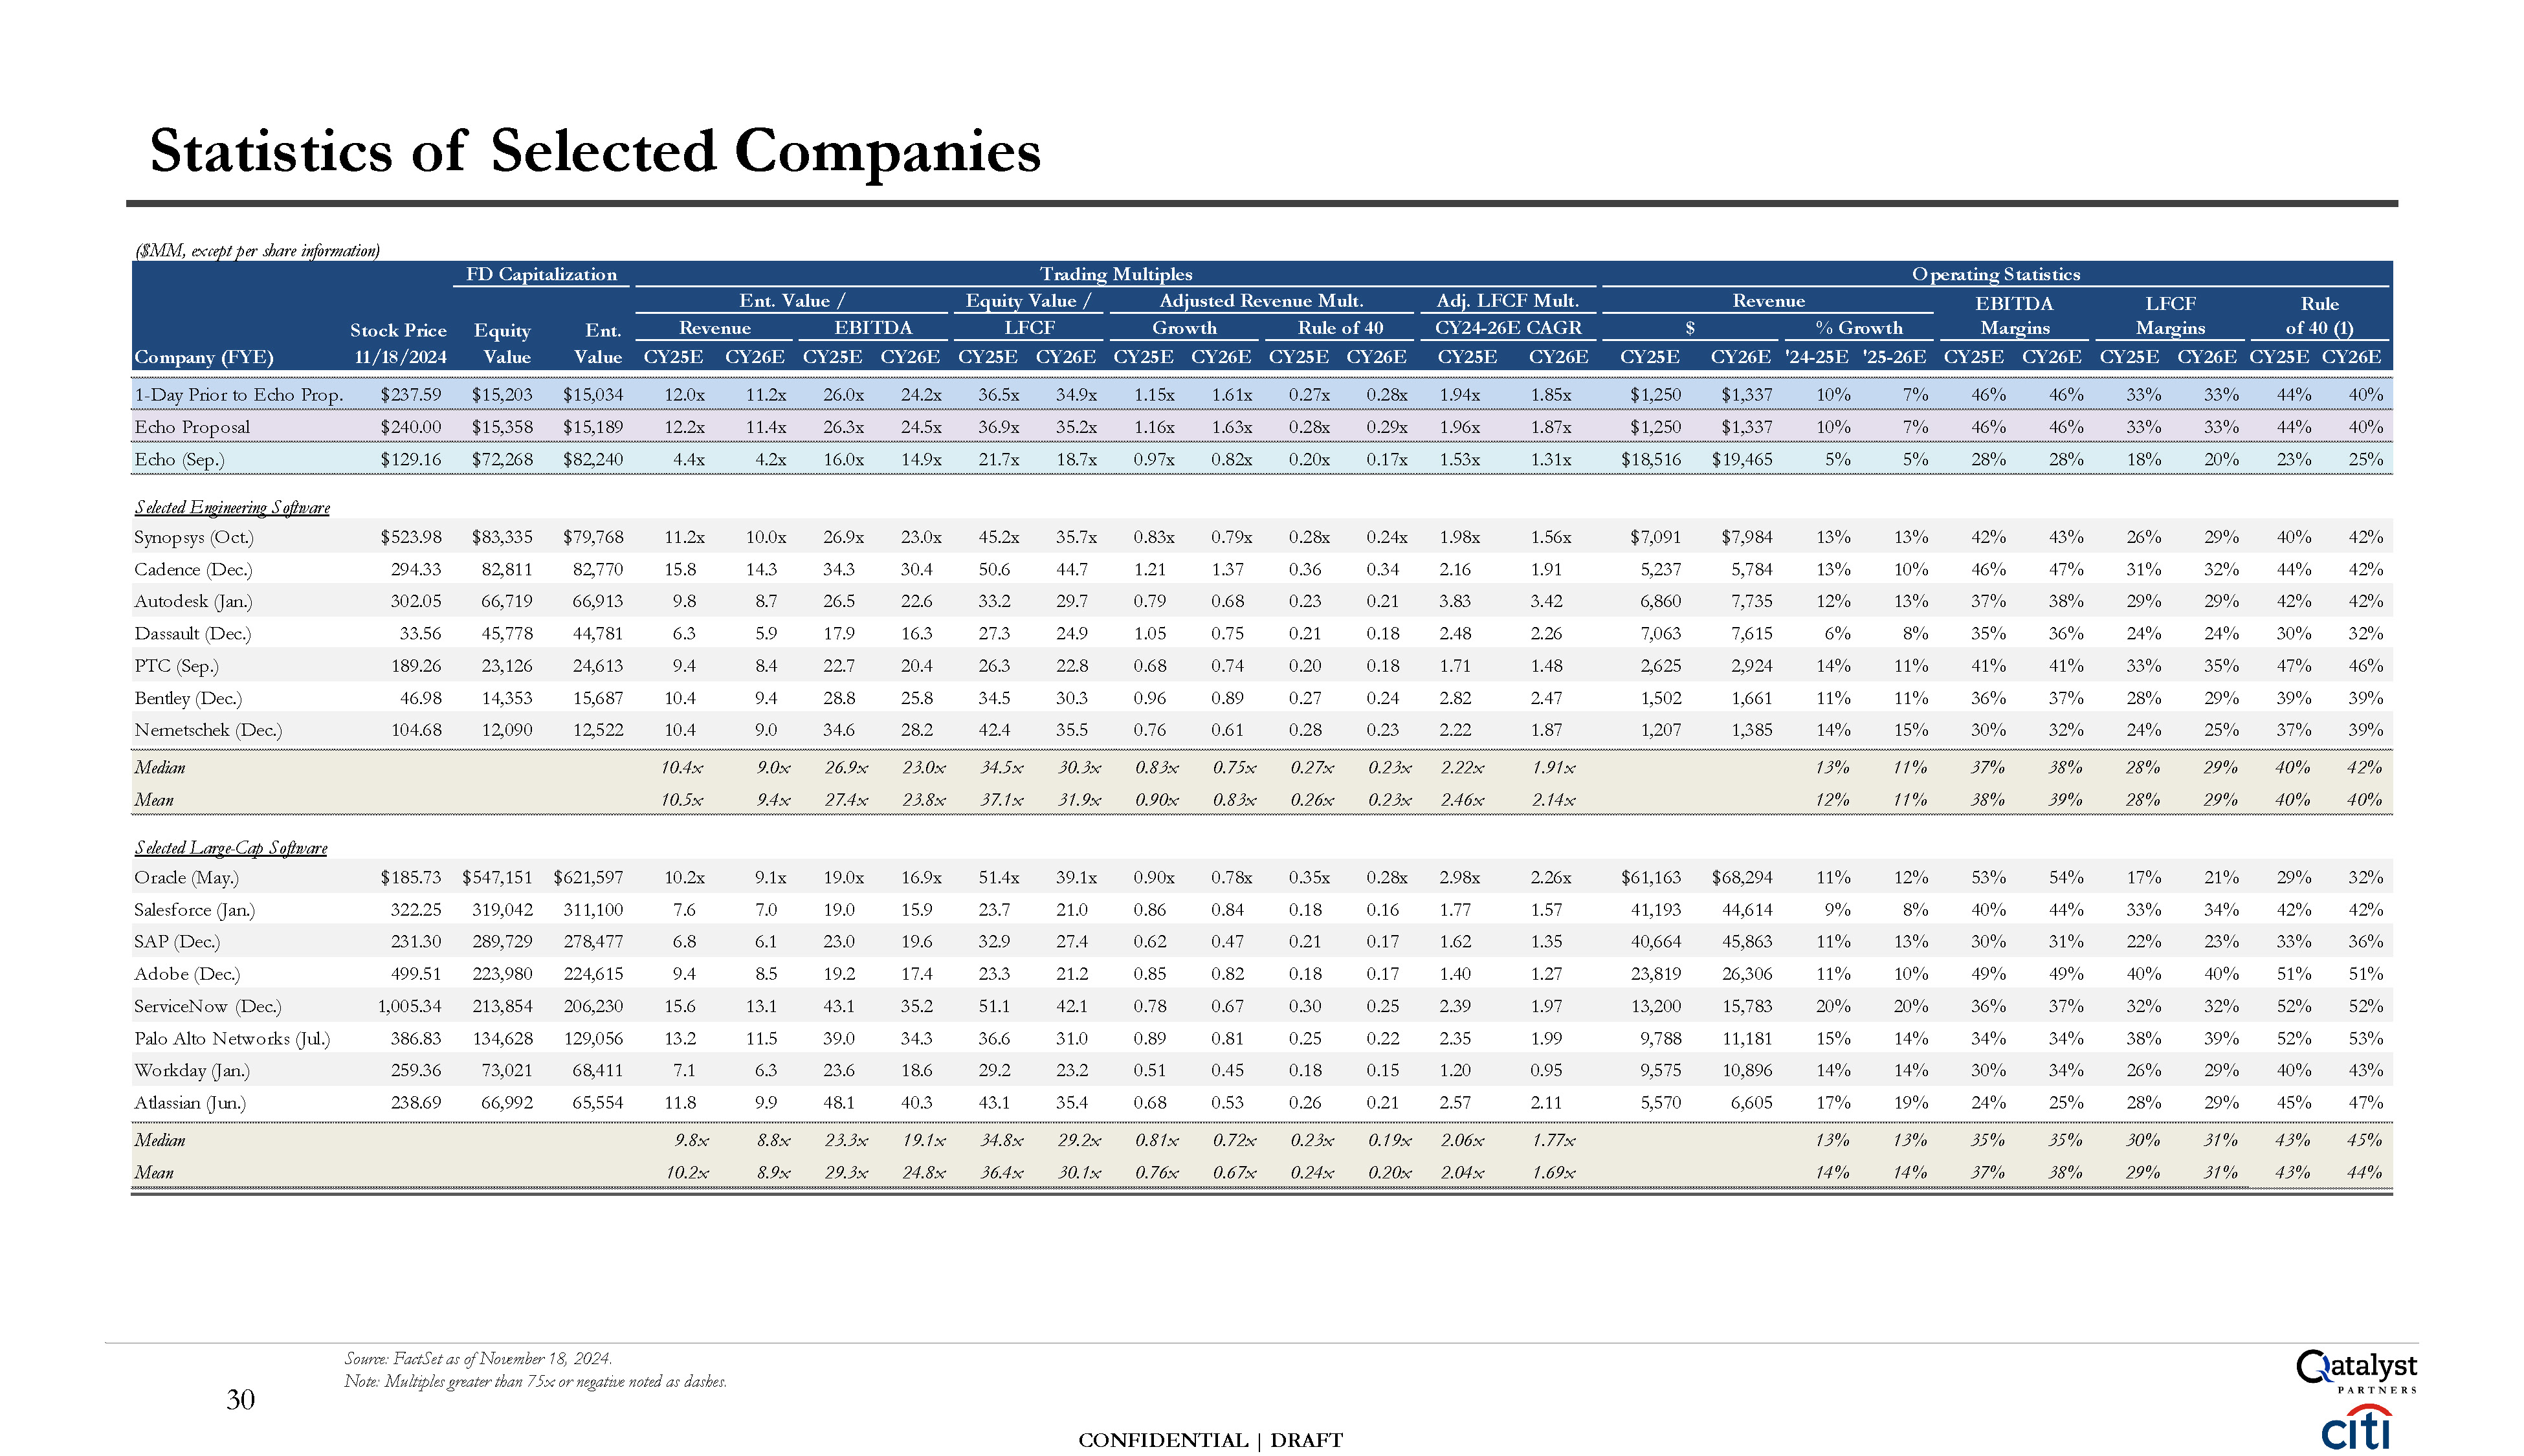
CONFIDENTIAL | DRAFT Statistics of Selected Companies Source: FactSet as of
November 18, 2024. Note: Multiples greater than 75x or negative noted as dashes. 30 Selected Engineering Software Synopsys
(Oct.) $523.98 $83,335 $79,768 11.2x 10.0x 26.9x 23.0x 45.2x 35.7x 0.83x 0.79x 0.28x 0.24x 1.98x 1.56x $7,091 $7,984 13% 13% 42% 43% 26% 29% 40% 42% Cadence
(Dec.) 294.33 82,811 82,770 15.8 14.3 34.3 30.4 50.6 44.7 1.21 1.37 0.36 0.34 2.16 1.91 5,237 5,784 13% 10% 46% 47% 31% 32% 44% 42% Autodesk
(Jan.) 302.05 66,719 66,913 9.8 8.7 26.5 22.6 33.2 29.7 0.79 0.68 0.23 0.21 3.83 3.42 6,860 7,735 12% 13% 37% 38% 29% 29% 42% 42% Dassault
(Dec.) 33.56 45,778 44,781 6.3 5.9 17.9 16.3 27.3 24.9 1.05 0.75 0.21 0.18 2.48 2.26 7,063 7,615 6% 8% 35% 36% 24% 24% 30% 32% PTC
(Sep.) 189.26 23,126 24,613 9.4 8.4 22.7 20.4 26.3 22.8 0.68 0.74 0.20 0.18 1.71 1.48 2,625 2,924 14% 11% 41% 41% 33% 35% 47% 46% Bentley
(Dec.) 46.98 14,353 15,687 10.4 9.4 28.8 25.8 34.5 30.3 0.96 0.89 0.27 0.24 2.82 2.47 1,502 1,661 11% 11% 36% 37% 28% 29% 39% 39% Nemetschek
(Dec.) 104.68 12,090 12,522 10.4 9.0 34.6 28.2 42.4 35.5 0.76 0.61 0.28 0.23 2.22 1.87 1,207 1,385 14% 15% 30% 32% 24% 25% 37% 39% Median 10.4x 9.0x 26.9x 23.0x 34.5x 30.3x 0.83x 0.75x 0.27x 0.23x 2.22x 1.91x 13% 11% 37% 38% 28% 29% 40% 42% Mean 10.5x 9.4x 27.4x 23.8x 37.1x 31.9x 0.90x 0.83x 0.26x 0.23x 2.46x 2.14x 12% 11% 38% 39% 28% 29% 40% 40% Selected
Large-Cap Software Oracle (May.) $185.73 $547,151 $621,597 10.2x 9.1x 19.0x 16.9x 51.4x 39.1x 0.90x 0.78x 0.35x 0.28x 2.98x 2.26x $61,163 $68,294 11% 12% 53% 54% 17% 21% 29% 32% Salesforce
(Jan.) 322.25 319,042 311,100 7.6 7.0 19.0 15.9 23.7 21.0 0.86 0.84 0.18 0.16 1.77 1.57 41,193 44,614 9% 8% 40% 44% 33% 34% 42% 42% SAP
(Dec.) 231.30 289,729 278,477 6.8 6.1 23.0 19.6 32.9 27.4 0.62 0.47 0.21 0.17 1.62 1.35 40,664 45,863 11% 13% 30% 31% 22% 23% 33% 36% Adobe
(Dec.) 499.51 223,980 224,615 9.4 8.5 19.2 17.4 23.3 21.2 0.85 0.82 0.18 0.17 1.40 1.27 23,819 26,306 11% 10% 49% 49% 40% 40% 51% 51% ServiceNow
(Dec.) 1,005.34 213,854 206,230 15.6 13.1 43.1 35.2 51.1 42.1 0.78 0.67 0.30 0.25 2.39 1.97 13,200 15,783 20% 20% 36% 37% 32% 32% 52% 52% Palo Alto Networks
(Jul.) 386.83 134,628 129,056 13.2 11.5 39.0 34.3 36.6 31.0 0.89 0.81 0.25 0.22 2.35 1.99 9,788 11,181 15% 14% 34% 34% 38% 39% 52% 53% Workday
(Jan.) 259.36 73,021 68,411 7.1 6.3 23.6 18.6 29.2 23.2 0.51 0.45 0.18 0.15 1.20 0.95 9,575 10,896 14% 14% 30% 34% 26% 29% 40% 43% Atlassian
(Jun.) 238.69 66,992 65,554 11.8 9.9 48.1 40.3 43.1 35.4 0.68 0.53 0.26 0.21 2.57 2.11 5,570 6,605 17% 19% 24% 25% 28% 29% 45% 47% Median 9.8x 8.8x 23.3x 19.1x 34.8x 29.2x 0.81x 0.72x 0.23x 0.19x 2.06x 1.77x 13% 13% 35% 35% 30% 31% 43% 45% Mean 10.2x 8.9x 29.3x 24.8x 36.4x 30.1x 0.76x 0.67x 0.24x 0.20x 2.04x 1.69x 14% 14% 37% 38% 29% 31% 43% 44% ($MM,
except per share information) FD Capitalization Trading Multiples Operating Statistics Stock Price Equity Ent. Ent. Value / Equity Value / Adjusted Revenue Mult. Revenue EBITDA LFCF Growth Rule of 40 Adj. LFCF Mult. CY24-26E
CAGR Revenue EBITDA LFCF Rule $ % Growth Margins Margins of 40 (1) CY25E CY26E CY25E CY26E CY25E CY26E CY25E CY26E CY25E CY26E CY25E CY26E CY25E CY26E '24-25E '25-26E CY25E CY26E CY25E CY26E CY25E CY26E Company
(FYE) 11/18/2024 Value Value 1-Day Prior to Echo Prop. $237.59 $15,203 $15,034 12.0x 11.2x 26.0x 24.2x 36.5x 34.9x 1.15x 1.61x 0.27x 0.28x 1.94x 1.85x $1,250 $1,337 10% 7% 46% 46% 33% 33% 44% 40% Echo
Proposal $240.00 $15,358 $15,189 12.2x 11.4x 26.3x 24.5x 36.9x 35.2x 1.16x 1.63x 0.28x 0.29x 1.96x 1.87x $1,250 $1,337 10% 7% 46% 46% 33% 33% 44% 40% Echo (Sep.) $129.16 $72,268 $82,240 4.4x 4.2x 16.0x 14.9x 21.7x 18.7x 0.97x 0.82x
0.20x 0.17x 1.53x 1.31x $18,516 $19,465 5% 5% 28% 28% 18% 20% 23% 25%
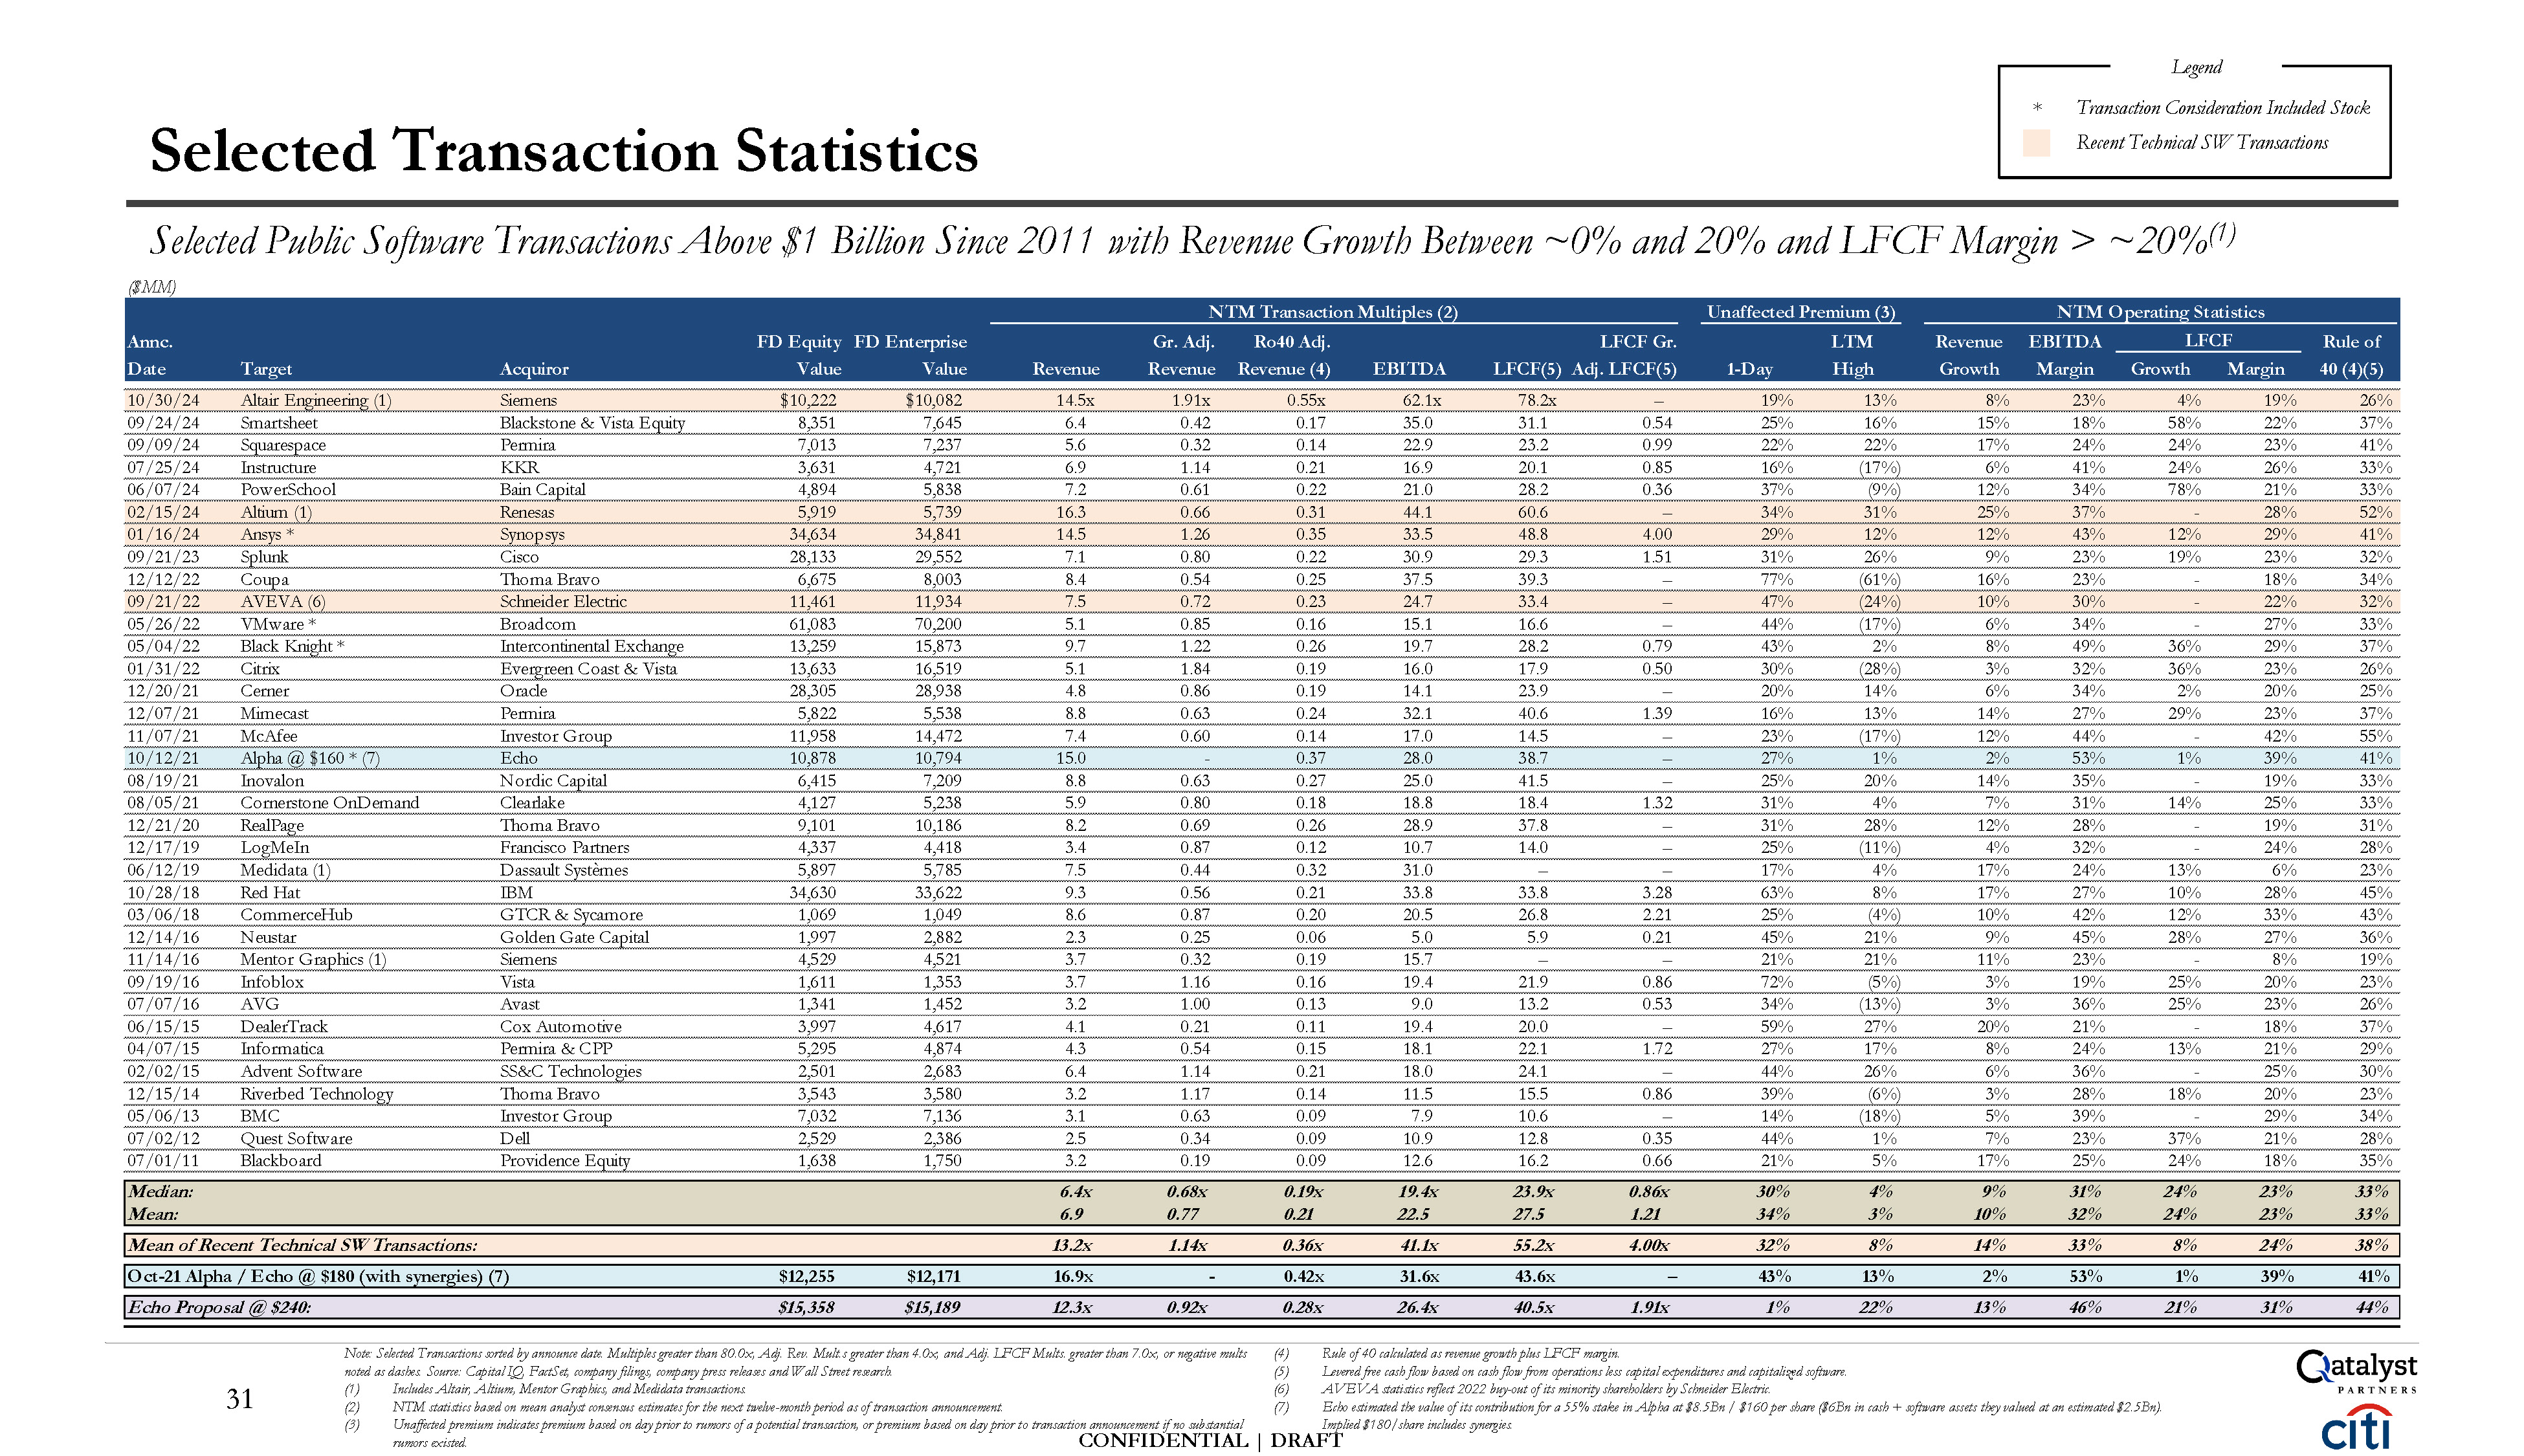
CONFIDENTIAL | DRAFT NTM Transaction Multiples (2) Unaffected Premium (3) NTM
Operating Statistics Annc. FD Equity FD Enterprise Gr. Adj. Ro40 Adj. LFCF Gr. LTM Revenue EBITDA LFCF Rule of Date Target Acquiror Value Value Revenue Revenue Revenue (4) EBITDA LFCF(5) Adj.
LFCF(5) 1-Day High Growth Margin Growth Margin 40 (4)(5) Mean of Recent Technical SW Transactions: 13.2x 1.14x 0.36x 41.1x 55.2x 4.00x 32% 8% 14% 33% 8% 24% 38% Oct-21 Alpha / Echo @ $180 (with synergies)
(7) $12,255 $12,171 16.9x - 0.42x 31.6x 43.6x – 43% 13% 2% 53% 1% 39% 41% Echo Proposal @ $240: $15,358 $15,189 12.3x 0.92x 0.28x 26.4x 40.5x 1.91x 1% 22% 13% 46% 21% 31% 44% 10/30/24 Altair Engineering
(1) Siemens $10,222 $10,082 14.5x 1.91x 0.55x 62.1x 78.2x – 19% 13% 8% 23% 4% 19% 26% 09/24/24 Smartsheet Blackstone & Vista
Equity 8,351 7,645 6.4 0.42 0.17 35.0 31.1 0.54 25% 16% 15% 18% 58% 22% 37% 09/09/24 Squarespace Permira 7,013 7,237 5.6 0.32 0.14 22.9 23.2 0.99 22% 22% 17% 24% 24% 23% 41% 07/25/24 Instructure KKR 3,631 4,721 6.9 1.14 0.21 16.9 20.1 0.85 16% (17%) 6% 41% 24% 26% 33% 06/07/24 PowerSchool Bain
Capital 4,894 5,838 7.2 0.61 0.22 21.0 28.2 0.36 37% (9%) 12% 34% 78% 21% 33% 02/15/24 Altium (1) Renesas 5,919 5,739 16.3 0.66 0.31 44.1 60.6 – 34% 31% 25% 37% - 28% 52% 01/16/24 Ansys
* Synopsys 34,634 34,841 14.5 1.26 0.35 33.5 48.8 4.00 29% 12% 12% 43% 12% 29% 41% 09/21/23 Splunk Cisco 28,133 29,552 7.1 0.80 0.22 30.9 29.3 1.51 31% 26% 9% 23% 19% 23% 32% 12/12/22 Coupa Thoma
Bravo 6,675 8,003 8.4 0.54 0.25 37.5 39.3 – 77% (61%) 16% 23% - 18% 34% 09/21/22 AVEVA (6) Schneider Electric 11,461 11,934 7.5 0.72 0.23 24.7 33.4 – 47% (24%) 10% 30% - 22% 32% 05/26/22 VMware
* Broadcom 61,083 70,200 5.1 0.85 0.16 15.1 16.6 – 44% (17%) 6% 34% - 27% 33% 05/04/22 Black Knight * Intercontinental
Exchange 13,259 15,873 9.7 1.22 0.26 19.7 28.2 0.79 43% 2% 8% 49% 36% 29% 37% 01/31/22 Citrix Evergreen Coast &
Vista 13,633 16,519 5.1 1.84 0.19 16.0 17.9 0.50 30% (28%) 3% 32% 36% 23% 26% 12/20/21 Cerner Oracle 28,305 28,938 4.8 0.86 0.19 14.1 23.9 – 20% 14% 6% 34% 2% 20% 25% 12/07/21 Mimecast Permira 5,822 5,538 8.8 0.63 0.24 32.1 40.6 1.39 16% 13% 14% 27% 29% 23% 37% 11/07/21 McAfee Investor
Group 11,958 14,472 7.4 0.60 0.14 17.0 14.5 – 23% (17%) 12% 44% - 42% 55% 10/12/21 Alpha @ $160 * (7) Echo 10,878 10,794 15.0 - 0.37 28.0 38.7 – 27% 1% 2% 53% 1% 39% 41% 08/19/21 Inovalon Nordic
Capital 6,415 7,209 8.8 0.63 0.27 25.0 41.5 – 25% 20% 14% 35% - 19% 33% 08/05/21 Cornerstone OnDemand Clearlake 4,127 5,238 5.9 0.80 0.18 18.8 18.4 1.32 31% 4% 7% 31% 14% 25% 33% 12/21/20 RealPage Thoma
Bravo 9,101 10,186 8.2 0.69 0.26 28.9 37.8 – 31% 28% 12% 28% - 19% 31% 12/17/19 LogMeIn Francisco Partners 4,337 4,418 3.4 0.87 0.12 10.7 14.0 – 25% (11%) 4% 32% - 24% 28% 06/12/19 Medidata (1) Dassault
Systèmes 5,897 5,785 7.5 0.44 0.32 31.0 – – 17% 4% 17% 24% 13% 6% 23% 10/28/18 Red Hat IBM 34,630 33,622 9.3 0.56 0.21 33.8 33.8 3.28 63% 8% 17% 27% 10% 28% 45% 03/06/18 CommerceHub GTCR &
Sycamore 1,069 1,049 8.6 0.87 0.20 20.5 26.8 2.21 25% (4%) 10% 42% 12% 33% 43% 12/14/16 Neustar Golden Gate Capital 1,997 2,882 2.3 0.25 0.06 5.0 5.9 0.21 45% 21% 9% 45% 28% 27% 36% 11/14/16 Mentor Graphics
(1) Siemens 4,529 4,521 3.7 0.32 0.19 15.7 – – 21% 21% 11% 23% - 8% 19% 09/19/16 Infoblox Vista 1,611 1,353 3.7 1.16 0.16 19.4 21.9 0.86 72% (5%) 3% 19% 25% 20% 23% 07/07/16 AVG Avast 1,341 1,452 3.2 1.00 0.13 9.0 13.2 0.53 34% (13%) 3% 36% 25% 23% 26% 06/15/15 DealerTrack Cox
Automotive 3,997 4,617 4.1 0.21 0.11 19.4 20.0 – 59% 27% 20% 21% - 18% 37% 04/07/15 Informatica Permira & CPP 5,295 4,874 4.3 0.54 0.15 18.1 22.1 1.72 27% 17% 8% 24% 13% 21% 29% 02/02/15 Advent
Software SS&C Technologies 2,501 2,683 6.4 1.14 0.21 18.0 24.1 – 44% 26% 6% 36% - 25% 30% 12/15/14 Riverbed Technology Thoma
Bravo 3,543 3,580 3.2 1.17 0.14 11.5 15.5 0.86 39% (6%) 3% 28% 18% 20% 23% 05/06/13 BMC Investor Group 7,032 7,136 3.1 0.63 0.09 7.9 10.6 – 14% (18%) 5% 39% - 29% 34% 07/02/12 Quest
Software Dell 2,529 2,386 2.5 0.34 0.09 10.9 12.8 0.35 44% 1% 7% 23% 37% 21% 28% 07/01/11 Blackboard Providence
Equity 1,638 1,750 3.2 0.19 0.09 12.6 16.2 0.66 21% 5% 17% 25% 24% 18% 35% Median: 6.4x 0.68x 0.19x 19.4x 23.9x 0.86x 30% 4% 9% 31% 24% 23% 33% Mean: 6.9 0.77 0.21 22.5 27.5 1.21 34% 3% 10% 32% 24% 23% 33% Selected
Transaction Statistics Selected Public Software Transactions Above $1 Billion Since 2011 with Revenue Growth Between ~0% and 20% and LFCF Margin > ~20%(1) ($MM) noted as dashes. Source: Capital IQ, FactSet, company filings, company press
releases and Wall Street research. (1) (2) (3) Includes Altair, Altium, Mentor Graphics, and Medidata transactions. NTM statistics based on mean analyst consensus estimates for the next twelve-month period as of transaction
announcement. Unaffected premium indicates premium based on day prior to rumors of a potential transaction, or premium based on day prior to transaction announcement if no substantial rumors existed. Note: Selected Transactions sorted by
announce date. Multiples greater than 80.0x, Adj. Rev. Mult.s greater than 4.0x, and Adj. LFCF Mults. greater than 7.0x, or negative mults (4) (5) (6) (7) Rule of 40 calculated as revenue growth plus LFCF margin. Levered free cash flow
based on cash flow from operations less capital expenditures and capitalized software. AVEVA statistics reflect 2022 buy-out of its minority shareholders by Schneider Electric. Echo estimated the value of its contribution for a 55% stake in
Alpha at $8.5Bn / $160 per share ($6Bn in cash + software assets they valued at an estimated $2.5Bn). Implied $180/share includes synergies. Legend * Transaction Consideration Included Stock Recent Technical SW Transactions 31
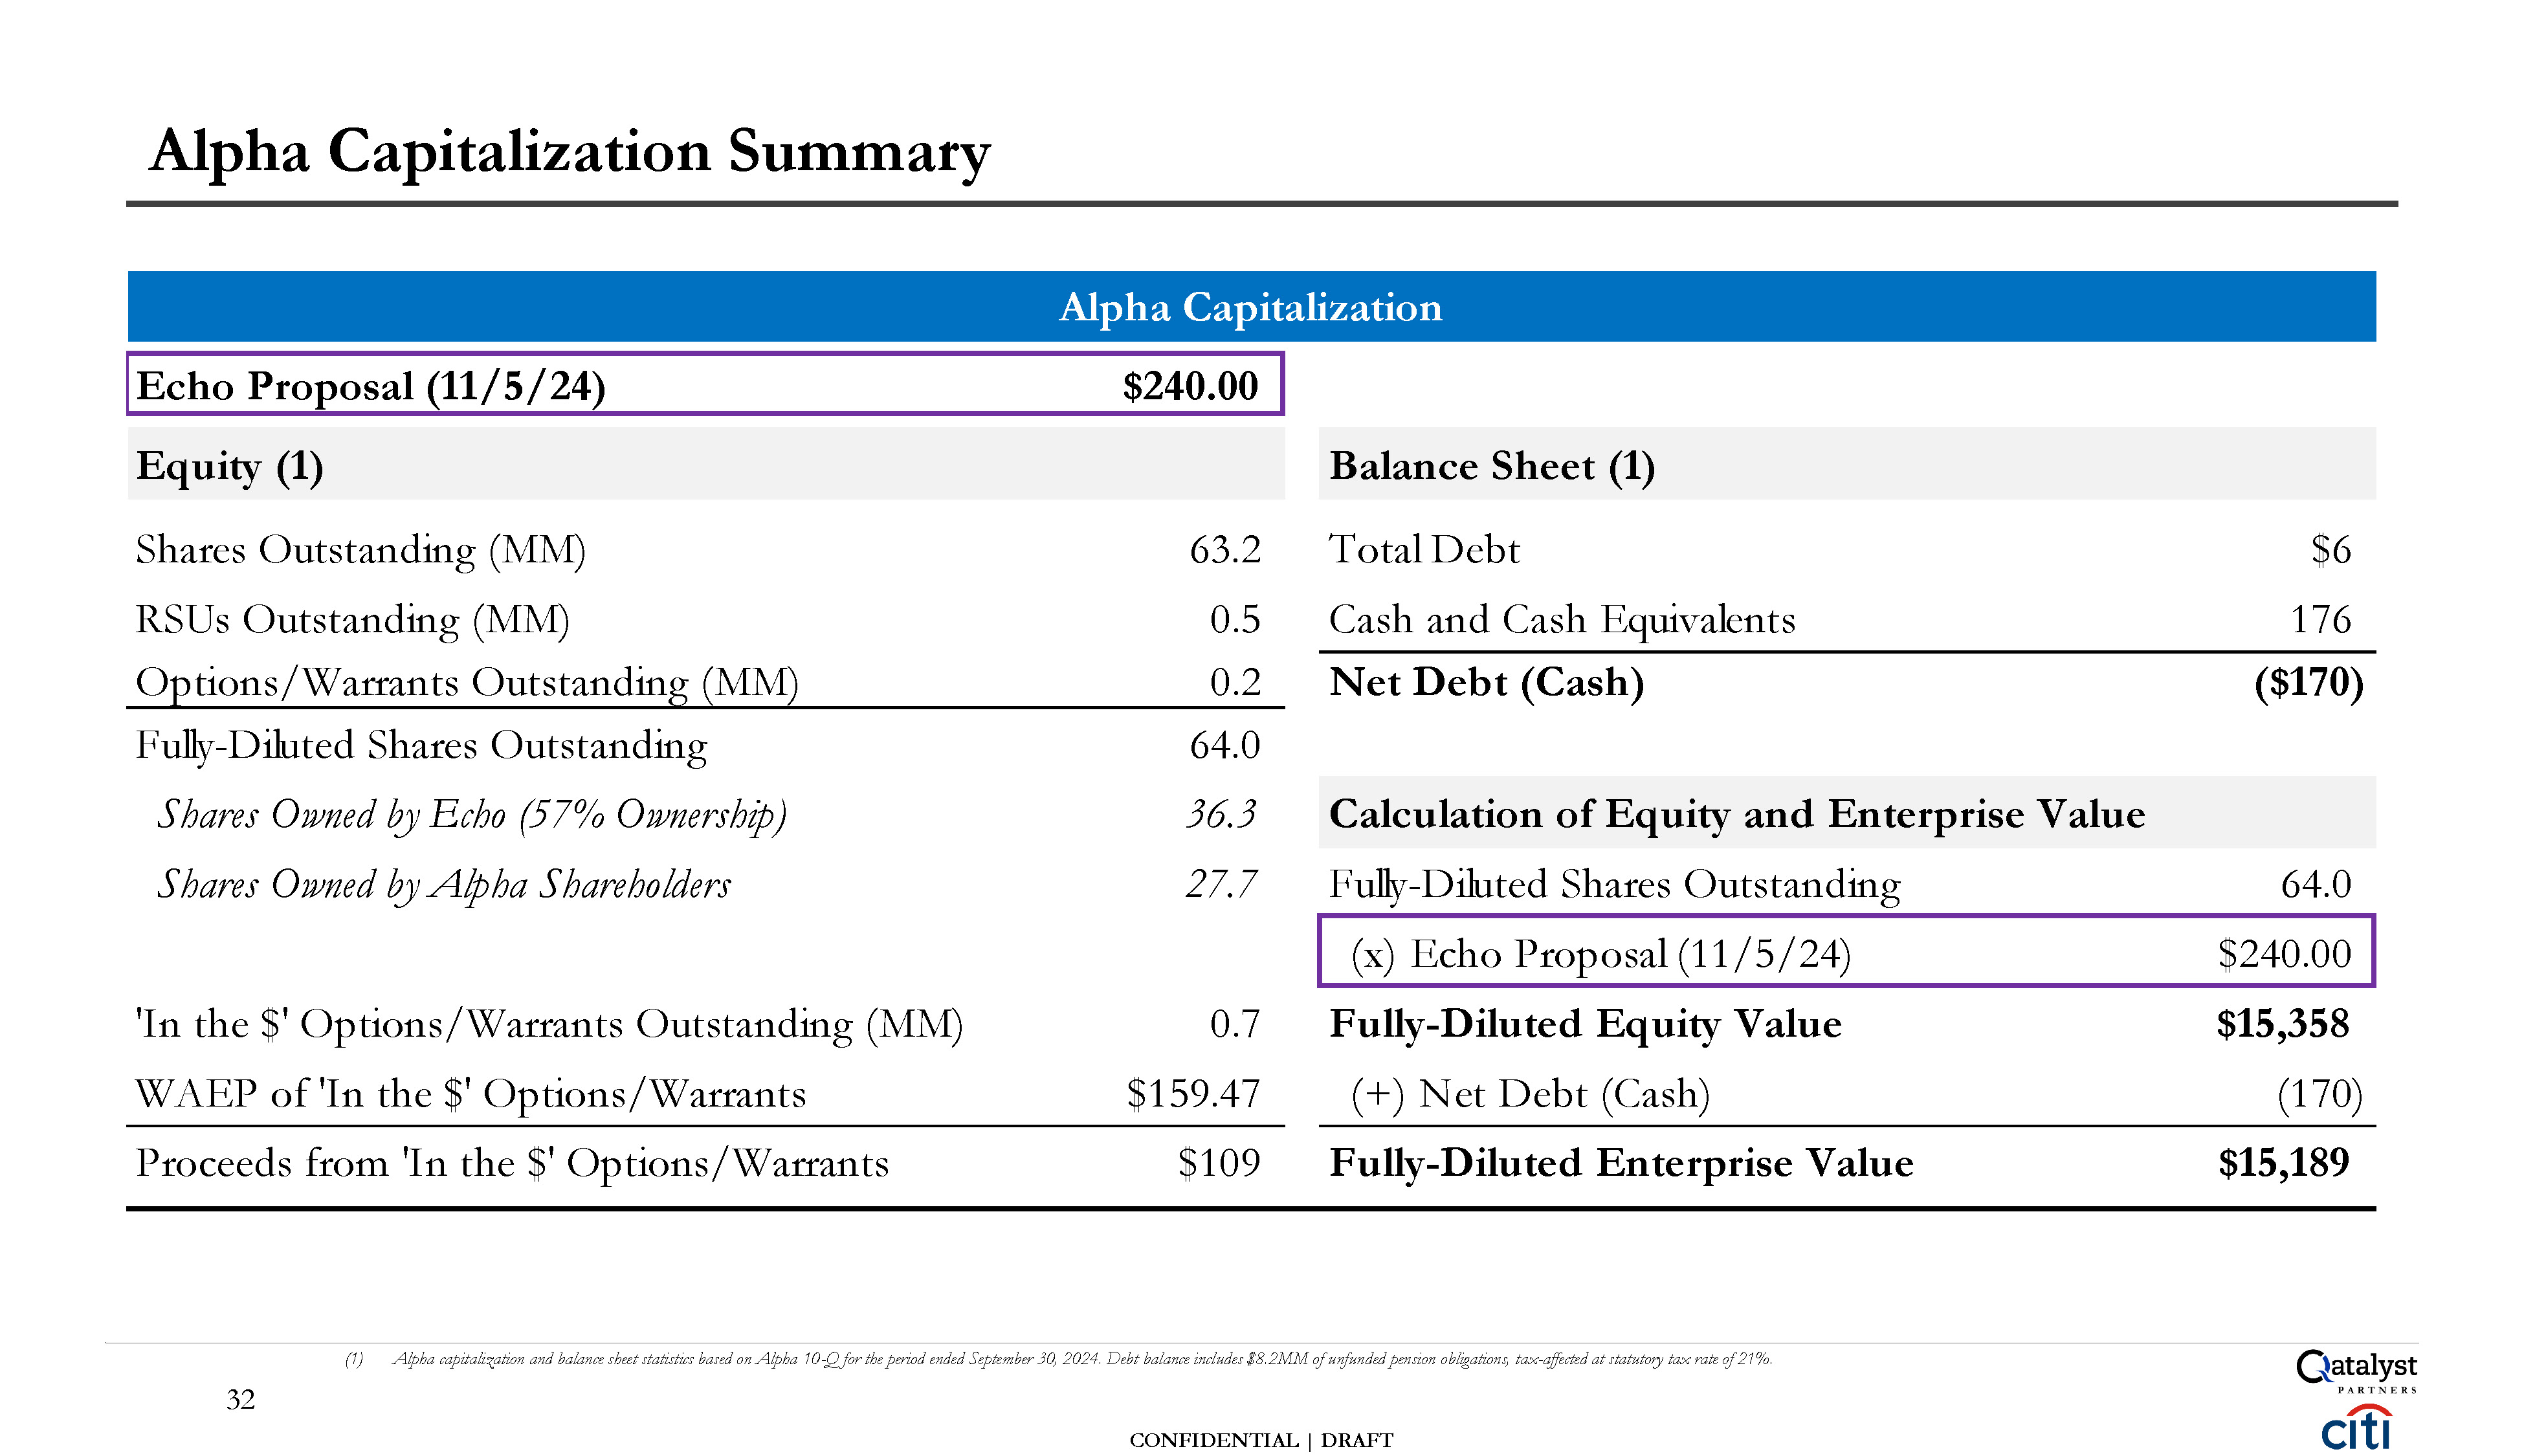
Alpha Capitalization Summary CONFIDENTIAL | DRAFT (1) Alpha capitalization and
balance sheet statistics based on Alpha 10-Q for the period ended September 30, 2024. Debt balance includes $8.2MM of unfunded pension obligations, tax-affected at statutory tax rate of 21%. 32 Echo Proposal (11/5/24) $240.00 Equity
(1) Balance Sheet (1) Shares Outstanding (MM) 63.2 Total Debt $6 RSUs Outstanding (MM) 0.5 Cash and Cash Equivalents 176 Options/Warrants Outstanding (MM) 0.2 Net Debt (Cash) ($170) Fu ly-Diluted Shares Outstanding 64.0 Shares
Owned by Echo (57% Ownership) 36.3 Calculation of Equity and Enterprise Value Shares Owned by Alpha Shareholders 27.7 Fu ly-Diluted Shares Outstanding 64.0 (x) Echo Proposal (11/5/24) $240.00 'In the $' Options/Warrants Outstanding
(MM) 0.7 Fully-Diluted Equity Value $15,358 WAEP of 'In the $' Options/Warrants $159.47 (+) Net Debt (Cash) (170) Proceeds from 'In the $' Options/Warrants $109 Fully-Diluted Enterprise Value $15,189 Alpha Capitalization
These materials have been prepared by Qatalyst Partners LP (including any
affiliates “Qatalyst”) for the Qatalyst client or potential client to whom such materials are directly addressed and delivered (the “Company”) in connection with an actual or potential mandate or engagement and may not be used or relied upon
for any purpose other than as specifically contemplated by a written agreement with Qatalyst. These materials are based on information provided by or on behalf of the Company and/or other potential transaction participants, from public sources
or otherwise reviewed by Qatalyst. Qatalyst assumes no responsibility for independent investigation or verification of such information and has relied on such information being complete and accurate in all respects. To the extent such
information includes estimates and forecasts of future financial performance (including estimates of potential cost savings and synergies) prepared by or reviewed with the managements of the Company and/or other potential transaction
participants or obtained from public sources, Qatalyst has assumed that such estimates and forecasts have been reasonably prepared on bases reflecting the best currently available estimates and judgments of such managements (or, with respect to
estimates and forecasts obtained from public sources, represent reasonable estimates). No representation or warranty, express or implied, is made as to the accuracy or completeness of such information and nothing contained herein is, or shall
be relied upon as, a representation, whether as to the past, the present or the future. These materials were designed for use by specific persons familiar with the business and affairs of the Company and are being furnished and should be
considered only in connection with other information, oral or written, being provided by Qatalyst in connection herewith. These materials are not intended to provide the sole basis for evaluating, and should not be considered a recommendation
with respect to, any transaction or other matter. Prior to entering into any transaction the Company should determine, without reliance on Qatalyst, the economic risks and merits as well as the legal, tax and accounting characterizations and
consequences of any such transaction. In this regard, by accepting this presentation, the Company acknowledges that (a) Qatalyst is not in the business of providing (and the Company is not relying on Qatalyst for) legal, tax or accounting
advice, (b) there may be legal, tax or accounting risks associated with any transaction, (c) the Company should receive (and rely on) separate and qualified legal, tax and accounting advice and (d) the Company should apprise senior management
as to such legal, tax and accounting advice (and any risks associated with any transaction) and Qatalyst’s disclaimer as to these matters. Qatalyst does not provide tax advice. Accordingly, any statements contained herein as to tax matters were
neither written nor intended by Qatalyst to be used and cannot be used by any taxpayer for the purpose of avoiding tax penalties that may be imposed on such taxpayer. Any discussion of tax matters in these materials may have been written in
connection with the “promotion” or “marketing” of any transaction contemplated hereby. Accordingly, any taxpayer should seek advice based on such taxpayer’s particular circumstances from an independent tax advisor. These materials do not
constitute an offer or solicitation to sell or purchase any securities and are not a commitment by Qatalyst to provide or arrange any financing for any transaction or to purchase any security in connection therewith. Qatalyst is not acting in
any other capacity as a fiduciary to the Company. Qatalyst assumes no obligation to update or otherwise revise these materials. These materials have not been prepared with a view toward public disclosure under state or federal securities laws
or otherwise, are intended for the benefit and use of the Company, and may not be reproduced, disseminated, quoted, summarized or referred to, in whole or in part, without the prior written consent of Qatalyst. These materials may not reflect
information known to other professionals in other business areas of Qatalyst. Qatalyst is a full service securities firm providing investment banking and other services and products to a wide range of corporations and individuals, domestically
and offshore, from which conflicting interests or duties may arise. In the ordinary course of these activities, Qatalyst may at any time hold long or short positions, and may trade or otherwise effect transactions, for their own account or the
accounts of customers, in debt or equity securities or loans of the Company, potential counterparties, or any other company that may be involved in a transaction. Qatalyst is required to obtain, verify and record certain information that
identifies each entity that enters into a formal business relationship with it, which information includes the complete name and address and taxpayer ID number. Qatalyst may also request corporate formation documents, or other forms of
identification, to verify information provided. Disclaimer CONFIDENTIAL | DRAFT
The preceding pages contain material provided to the Special Committee of the
Board of Directors of Alpha (the “Company”) by Citigroup Global Markets Inc. (“Citi”) in connection with the proposed transaction involving the Company and Echo. The accompanying material was compiled or prepared on a confidential basis
solely for the use of the Special Committee of the Board of Directors of the Company and not with a view toward public disclosure under any securities laws or otherwise. The information contained in the accompanying material was obtained from
the Company and other sources. Any estimates and projections contained herein have been prepared or adopted by management of the Company, obtained from public sources, or are based upon such estimates and projections, and involve numerous and
significant subjective determinations, and there is no assurance that such estimates and projections will be realized. Citi does not take responsibility for such estimates and projections, or the basis on which they were prepared. No
representation or warranty, express or implied, is made as to the accuracy or completeness of such information and nothing contained herein is, or shall be relied upon as, a representation, whether as to the past, the present or the future. In
preparing the accompanying material, Citi assumed and relied, without independent verification, upon the accuracy and completeness of all financial and other information and data publicly available or provided to or otherwise reviewed by or
discussed with Citi and upon the assurances of the management of the Company, that they are not aware of any relevant information that has been omitted or that remains undisclosed to Citi. The accompanying material was not prepared for use by
readers not as familiar with the Company and Echo as the Special Committee of the Board of Directors of the Company and, accordingly, neither the Company nor Citi nor their respective legal or financial advisors or accountants take any
responsibility for the accompanying material if used by persons other than the Special Committee of the Board of Directors of the Company. The accompanying material is necessarily based upon information available to Citi, and financial, stock
market and other conditions and circumstances existing and disclosed to Citi, as of the date of the accompanying material. Citi does not have any obligation to update or otherwise revise the accompanying material. Nothing contained herein shall
be construed as legal, tax or accounting advice. Disclaimer CONFIDENTIAL | DRAFT