DRAFT | Confidential Preliminary | Subject to Further Review and
Evaluation January 2025 Project Alpha Special Committee Materials
CONFIDENTIAL | DRAFT 2 Agenda Echo Ability to Pay & Earnings Impact
Analysis Perspectives on Pro Forma Impact to Alpha of Illustrative Target Echo + Alpha Synergies Analysis
Echo Ability to Pay & Earnings Impact Analysis
Valuation
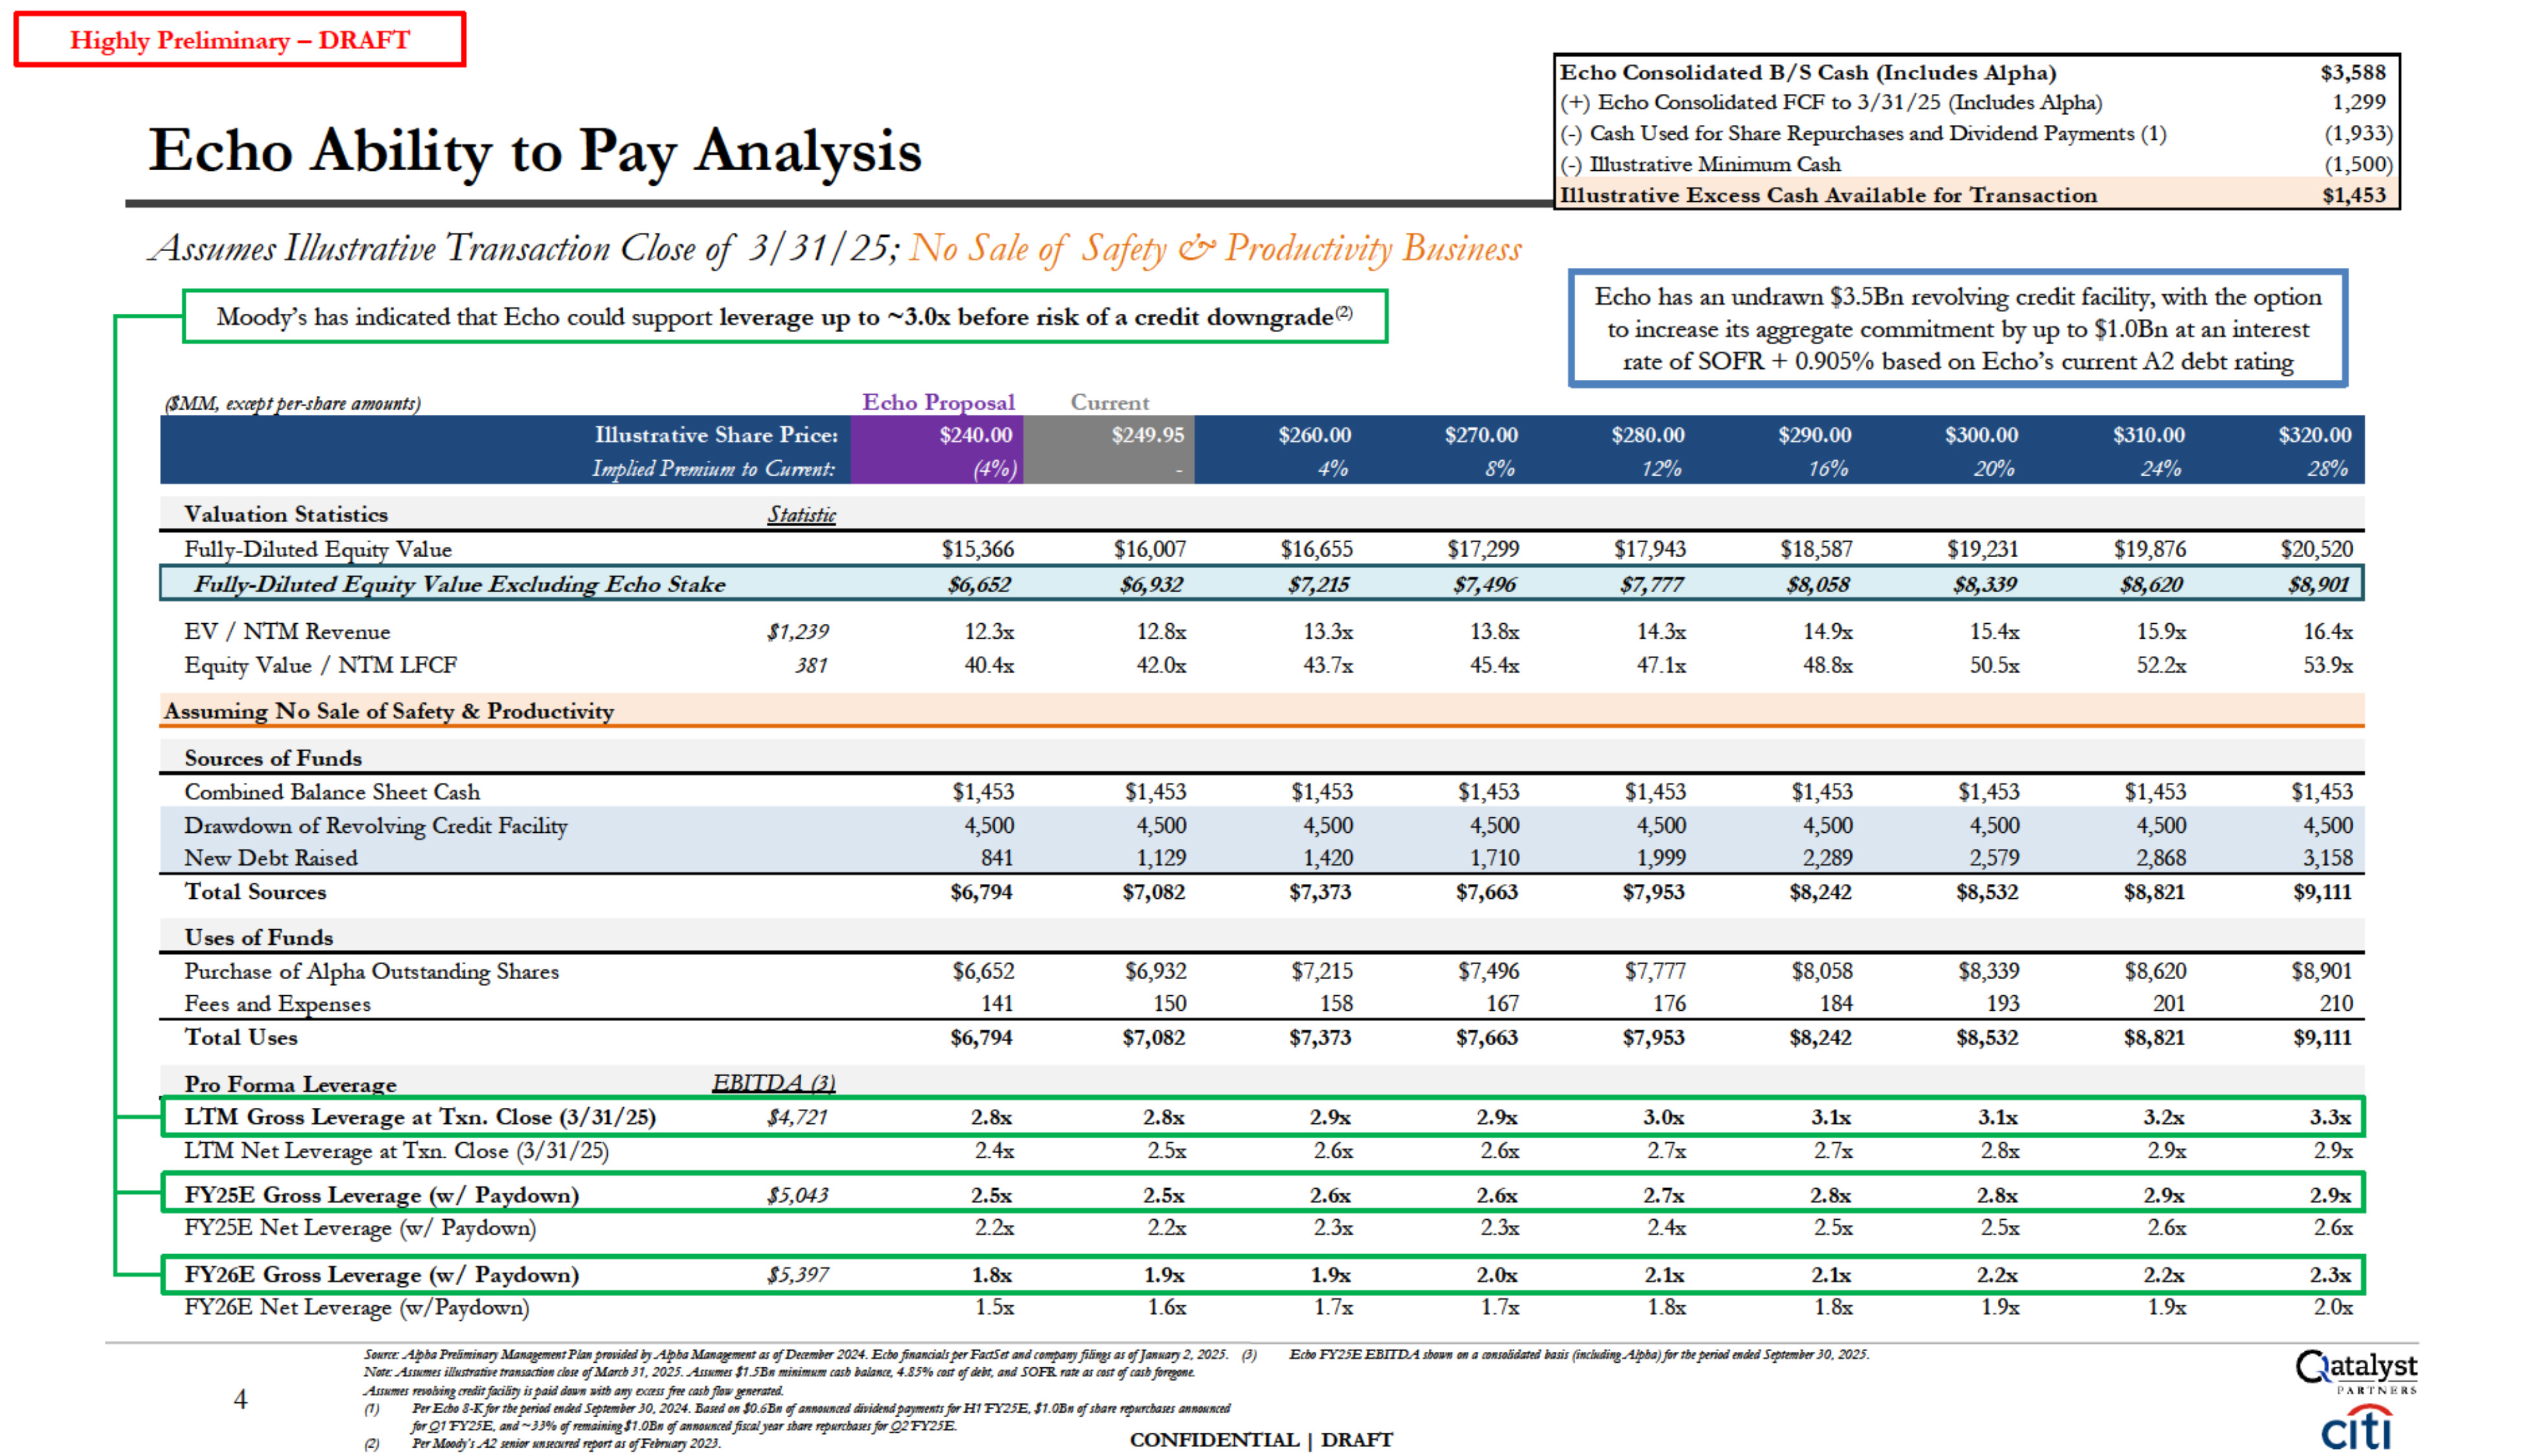
Statistics Statistic $15,366 $16,007 $16,655 $17,299 $17,943 $18,587 $19,231 $19,876 $20,520 V.-ilue Excludi Ecl10 Stake $6,652 $6,932 $7,215 $7,496 $7,777 $8,058 $8,339 $8,620 $8,901 EV / NTM
Revenue 11,239 12.3x 12.Sx 13.3x 13.Sx 14.3x 14.9x 15.4x 15.9x 16.4x Equity Value / NTM LFCF 381 40.4x 42.0x 43.7x 45.4x 47.lx 48.Sx 50.5x 52.2x 53.9x Assumin No Sale of Safe!l'.& Pcoductivi!l'. Sources of
Funds Combined Balance Sheet Cash $1,453 $1,453 $1,453 $1,453 $1,453 $1,453 $1,453 $1,453 $1,453 Drawdown of Revolving Credit Facility 4,500 4,500 4,500 4,500 4,500 4,500 4,500 4,500 4,500 New Debt
Raised 841 1,129 1,420 1,710 1,999 2,289 2,579 2,868 3,158 Total Sources $6,794 $7,082 $7,373 $7,663 $7,953 $8,242 $8,532 $8,821 $9,111 Uses of Funds Purchase of Alpha Outstanding
Shares $6,652 $6,932 $7,215 $7,496 $7,777 $8,058 $8,339 $8,620 $8,901 Fees and E enses 141 150 158 167 176 184 193 201 210 Total Uses $6,794 $7,082 $7,373 $7,663 $7,953 $8,242 $8,532 $8,821 $9,111 Pro Forina Levera
e LTM Gross Leverage at Txn. Close (3/31/25) $4,121 2.8x 2.8x 2.9x 2.9x 3.0x 3.lx 3.lx 3.2x 3.3x LTM Net Leverage at Txn. Oose (3/31/25) 2.4x 2.5x 2.6x 2.6x 2.7x 2.7x 2.Sx 2.9x 2.9x FY25E Gross Levera e w/ Pa
down 15,043 2.Sx 2.Sx 2.6x 2.6x 2.7x 2.8x 2.8x 2.9x 2.9x FY25E Net Leverage (w/ Paydown) 2.2x 2.2x 2.3x 2.3x 2.4x 2.5x 2.5x 2.6x 2.6x FY26E Gross Leverage (w/
Paydown) 15,397 1.8x 1.9x 1.9x 2.0x 2.lx 2.lx 2.2x 2.2x 2.3x FY26E Net Leverage (w/Paydown) 1.5x 1.6x 1.7x 1.7x 1.Sx 1.Sx 1.9x 1.9x 2.0x Highly Preliminary - DRAFT Echo Ability to Pay Analysis Echo Consolidated B/S Cash
(Includes Alpha) (+) Echo Consolidated FCF to 3/31/25 (Includes Alpha) (-) Cash Used for Sha.re Repurchases and Dividend Payments (1) (-) illustrative l\finimum Cash Illustrative Excess Cash Available foe
Transaction $3,588 1,299 (1,933) (1,500) $1,453 Assumes Illustrative Transaction Close of 3 / 31 / 25; No Sale of Safety & Productivity Business Moody's has indicated that Echo could support leverage up to ~3.0x before risk of a
credit downgrade<2l Echo has an undrawn $3.SBn revolving credit facility, with the option to increase its aggregate commitment by up to $1.0Bn at an interest rate of SOFR + 0.905% based on Echo's current A2 debt rating ' ' . Illustrative
Share Price: $240.00 Imp!ted Prrmmm lo C11m11/: (4%) E p $260.00 $270.00 $280.00 $290.00 $300.00 $310.00 $320.00 4% 8% 12% 16% 20% 24% 28% E.dJoFY25E..EBlTD.A.WH OIi a (t»l!o/ith:td Hsis(indlldin1,Alpb4)far tbt
ptriodt11dtd S ttr JO, 2025. C-latalyst PAiC'rNf!U, s :A9&1PrtliJ!lti11a,yZ14o tPN11p1mid«l"7A4>lxl. asefDt(tf/1/NT2024. E.dJoft11aMiabptr FllttSttat1dtmpa,,y filii't.14sof]at111a,y2. 2025. (J) N«t:A.slN.ltffl ilhl1tmiff trrlM«1#11
f.Hl1t llfMarr.bJ1. 2025.As1U1t1115B1111tillilltlim tasb 4.85%(t)/1 efdtk. tltUi SOFR. f'fJfl asmt If wb j,r1p.t. AslUltl ftMl.biJltmditfad51J iJpaidd4WII •ilbdJ!!t:XJ:ISI fttt tasbjh:P§llffl#td. Ptr Em, 8-Kfar tbtptriodmdtd Stp1t1111NTJO,
2024. <d1»1I0.6& 'f 411Mlillad di1idmdpaymm1farH1'FY.?5.E.l1.0B11II/slwt r,p,ml,o1tsJttJIWlll(td 4 CONFIDENTIAL I DRAFI farQ,1FY2J.E. a,,d~JJ'/4ofrmtlini11gl1.0BII IfJttJMlillttd filt4lJ'tt1r1&zrtrtpli1rba1t1farQ2FY2JE. Ptr
MtJodJ'1A2 fn#{J(' nltOlffli ttpon01efFtffltaty202.J. c1t1 (2)
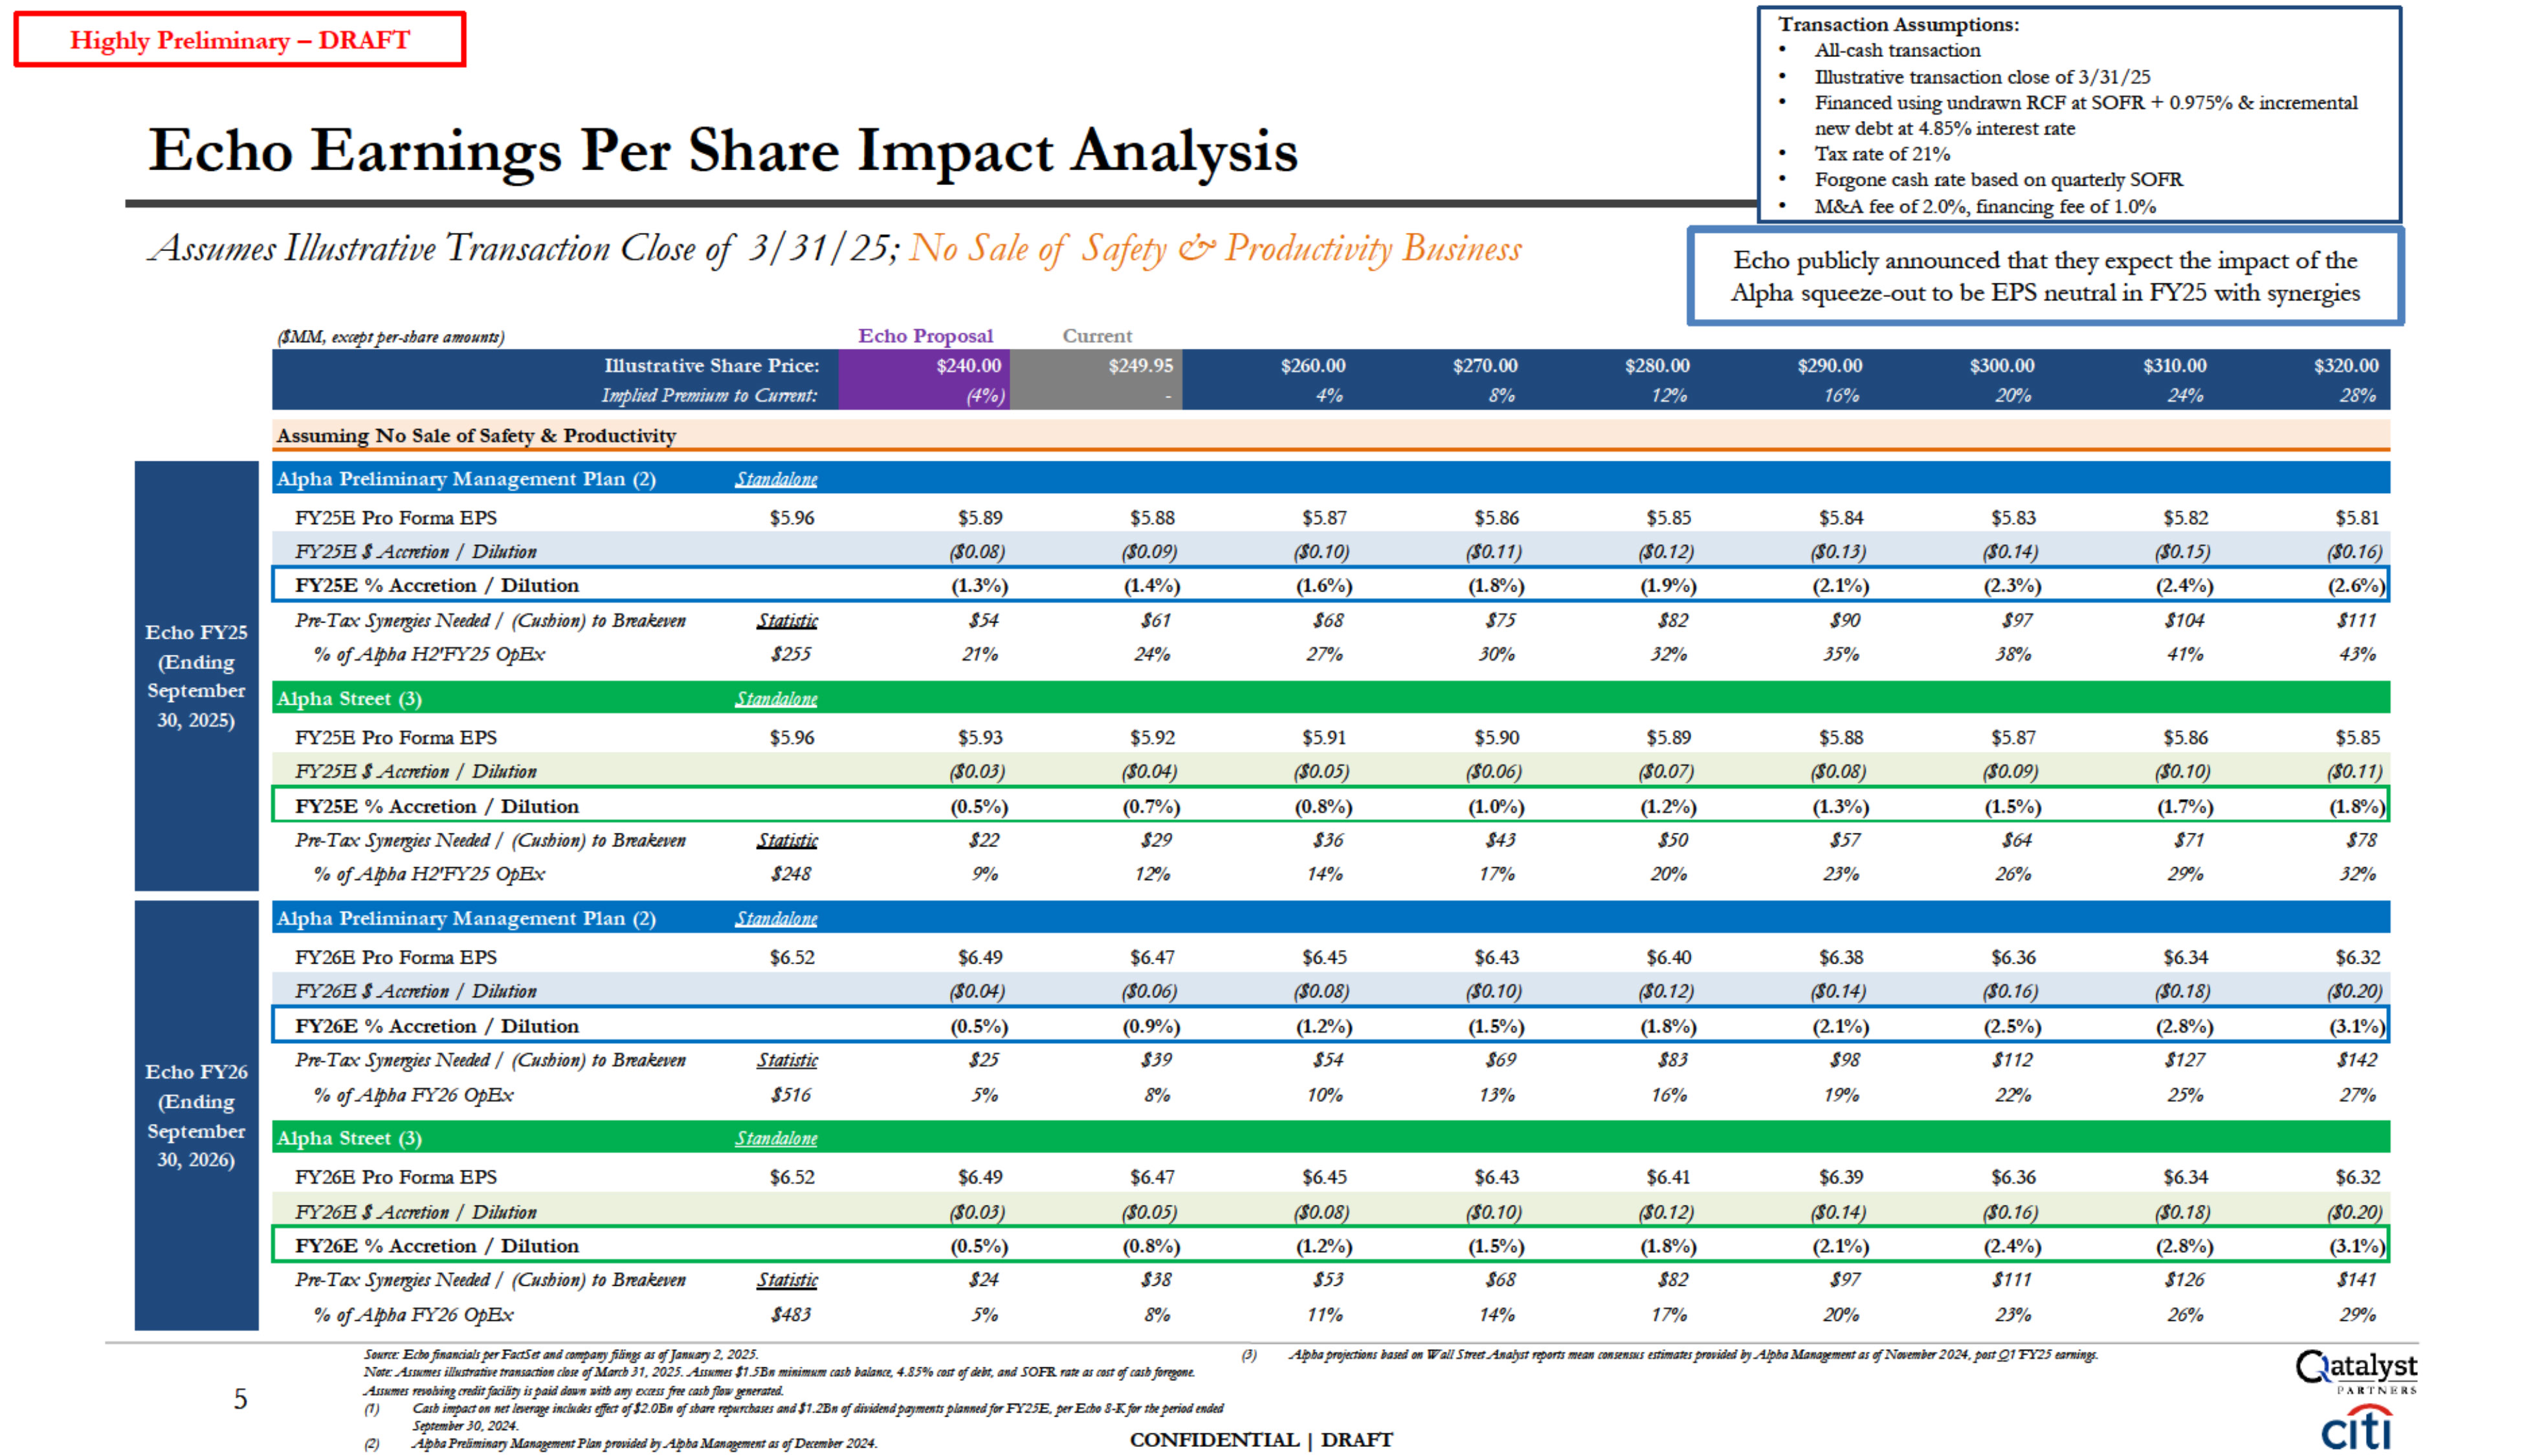
Hig hly Preliminary-DRAFT I Echo Earnings Per Share Impact
Analysis .Transaction Assumptions: . All-cash transaction Illustrative transaction close of 3/31/25 Financed usingundrawn RCF at SOFR + 0.975% & incremental . new debt at 4.85% interest rate Tax rate of 21% . Forgone cash rate based
on quarterly SOFR M&A fee of 2.0%, financing fee of 1.0% Assumes Illustrative Transaction Close of 3 / 31 / 25; No Sale of Safety & Productivity Business Echo publicly announced that they expect the impact of the Alpha squeeze-out to
be EPS neutral in FY25 with synergies ) (1i\!M,x, apr pff-shart a111011n11) Echo Proposal Current Illustrath•e Share Price: $240.00 $260.00 $2i0.00 $280.00 $290.00 $300.00 $310.00 $320.00 Implted Prw111m to
C11rrent: (4% lllllllllllllrl 4% 8% 12% 16% 20% 24% 28% Assuming No Sale of Safety & Productivity Alpha Preliminary Management Plan (2) FY25E Pro Forrna
EPS $5.96 $5.89 $5.88 $5.87 $586 $5.85 $5.84 $5.83 $5.82 $5.81 FY25B I Acmtion I Dil1ltion (10.08) (10.09) (10.10) (10.11) (10.12) {10.13) (10.14) (10.15) (10.16) PY25E % Accretion /
Dilution (1.3%) (1.4%) (1.6%) (1.8%) (1.9%) (2.1%) (2.3%) (2.4%) (2.6%)1 Prr-Tax Syne!!Jts Netdtd / (Cusbion) lo Bttahl:en iJJJtjJtk 154 161 168 175 182 190 197 1104 1111 % of Alpba H2'FY25
opBx 1255 21% 24% 27% 30% 32% 35% 38% 41% 43% Alpha Street (3) FY25E Pro Forrna EPS $5.96 $5.93 $5.92 $5.91 $590 $5.89 $5.88 $5.87 $5.86 $5.85 FY25B I Acmtion I
Dil1ltion (10.03) (10.04) (10.05) (10.06) (IO.o7) (10.08) (10.09) (10.10) (10.11) PY25E % Accretion / Dilution (0.5%) (0.7%) (0.8%) (1.0%) (1.2%) (1.3%) (1.5%) (1.7%) (1.8%)1 Prr-Tax Syne!!Jts Netdtd / (Cusbion) lo
Bttahl:en iJJJtjJtk 122 129 136 143 150 157 164 171 178 % of Alpba H2'FY25 opBx 1248 9% 12% 14% 17% 20% 23% 26% 29% 32% Alpha Preliminary Management Plan (2) FY26E Pro Forrna
EPS $6.52 $6.49 $6.47 $6.45 $6.43 $6.40 $6.38 $6.36 $6.34 $6.32 FY26B I Acmtion I Dil1ltion (10.04) (10.06) {10.08) (10.10) (10.12) (10.14) (10.16) (10.18) (10.20) PY26E % Accretion /
Dilution (0.5%) (0.9%) (1.2%) (1.5%) (1.8%) (2.1%) (2.5%) (2.8%) (3.1%) Prr-Tax Syne!!Jts Netdtd / (Cusbion) lo Bttahl:en Statistic 125 139 154 169 183 198 1112 1127 1142 % of Alpba FY26
opBx 1516 5% 8% 10% 13% 16% 19% 22% 25% 27% Alpha Street (3) Stando/om FY26E Pro Forrna EPS $6.52 $6.49 $6.47 $6.45 $6.43 $6.41 $6.39 $6.36 $6.34 $6.32 FY26B I Acmtion I Dil1ltion
0.03 '10.05 '10.08 0.10 0.12 0.14 0.16 0.18 '10.20 PY26E % Accretion / Dilution (0.5%) (0.8%) (1.2%) (1.5%) (1.8%) (2.1%) (2.4%) (2.8%) (3.1%) Prr-Tax Syne!!Jts Netdtd / (Cusbion) lo Bttahl:en Statistic
124 138 153 168 182 197 1111 1126 1141 % of Alpba FY26 opBx 1483 5% 8% 11% 14% 17% 20% 23% 26% 29% 5 s : E.d,oft11aMiabptrF«tStttllldfilingsas'(]IWl#fY 2. 2025. No:t: A.slN.ltffl ilhlstmiff trrlM«1#11 f.Hlst llfMarr.b)1.
2fJ2J.All/Ulttl11.5B1111tilliJltRm tasb As111111t1 ftMl.bi.ittmditfad51J iJpaidd4W1I •ilbdJ!! t:XJ:ISS fm tasbjh:P td. (J) 411ap,ef«tio11siasdtm W-411Stntt.Alll!J.'ltfl'J>4r1Smttm t#IIRl#JIIfSfim.tm,
J>fffidd -slfNa.'ttllNT2024.po1tQ1'FY25l#f'llfflt1- 4.85%(t)f1efdtk. tltUi SOFR. f'(Jfl as mt If wl, j,rp.t. (1) C4tb.,, .. Mt,_ mdNdtJ,jfrd,jl2.O1JJ,f sb.m,,,.,,..,,,.,.11.m. ,j dnwnsdp,y-11pllllmtdfa,FY25£.ptrE,t,,8-Kfar
tht"""'"""' S,p,,,mJO. 2024. (2) A9b#Pniim;,,,:,. Ptm,pr,,;dtd;_,A4>"'1.'44n-a,,jDt,,,.;,,202•. CONFIDENTIAL I DRAFI C-latalyst PAiC'rNf!U, c1t1
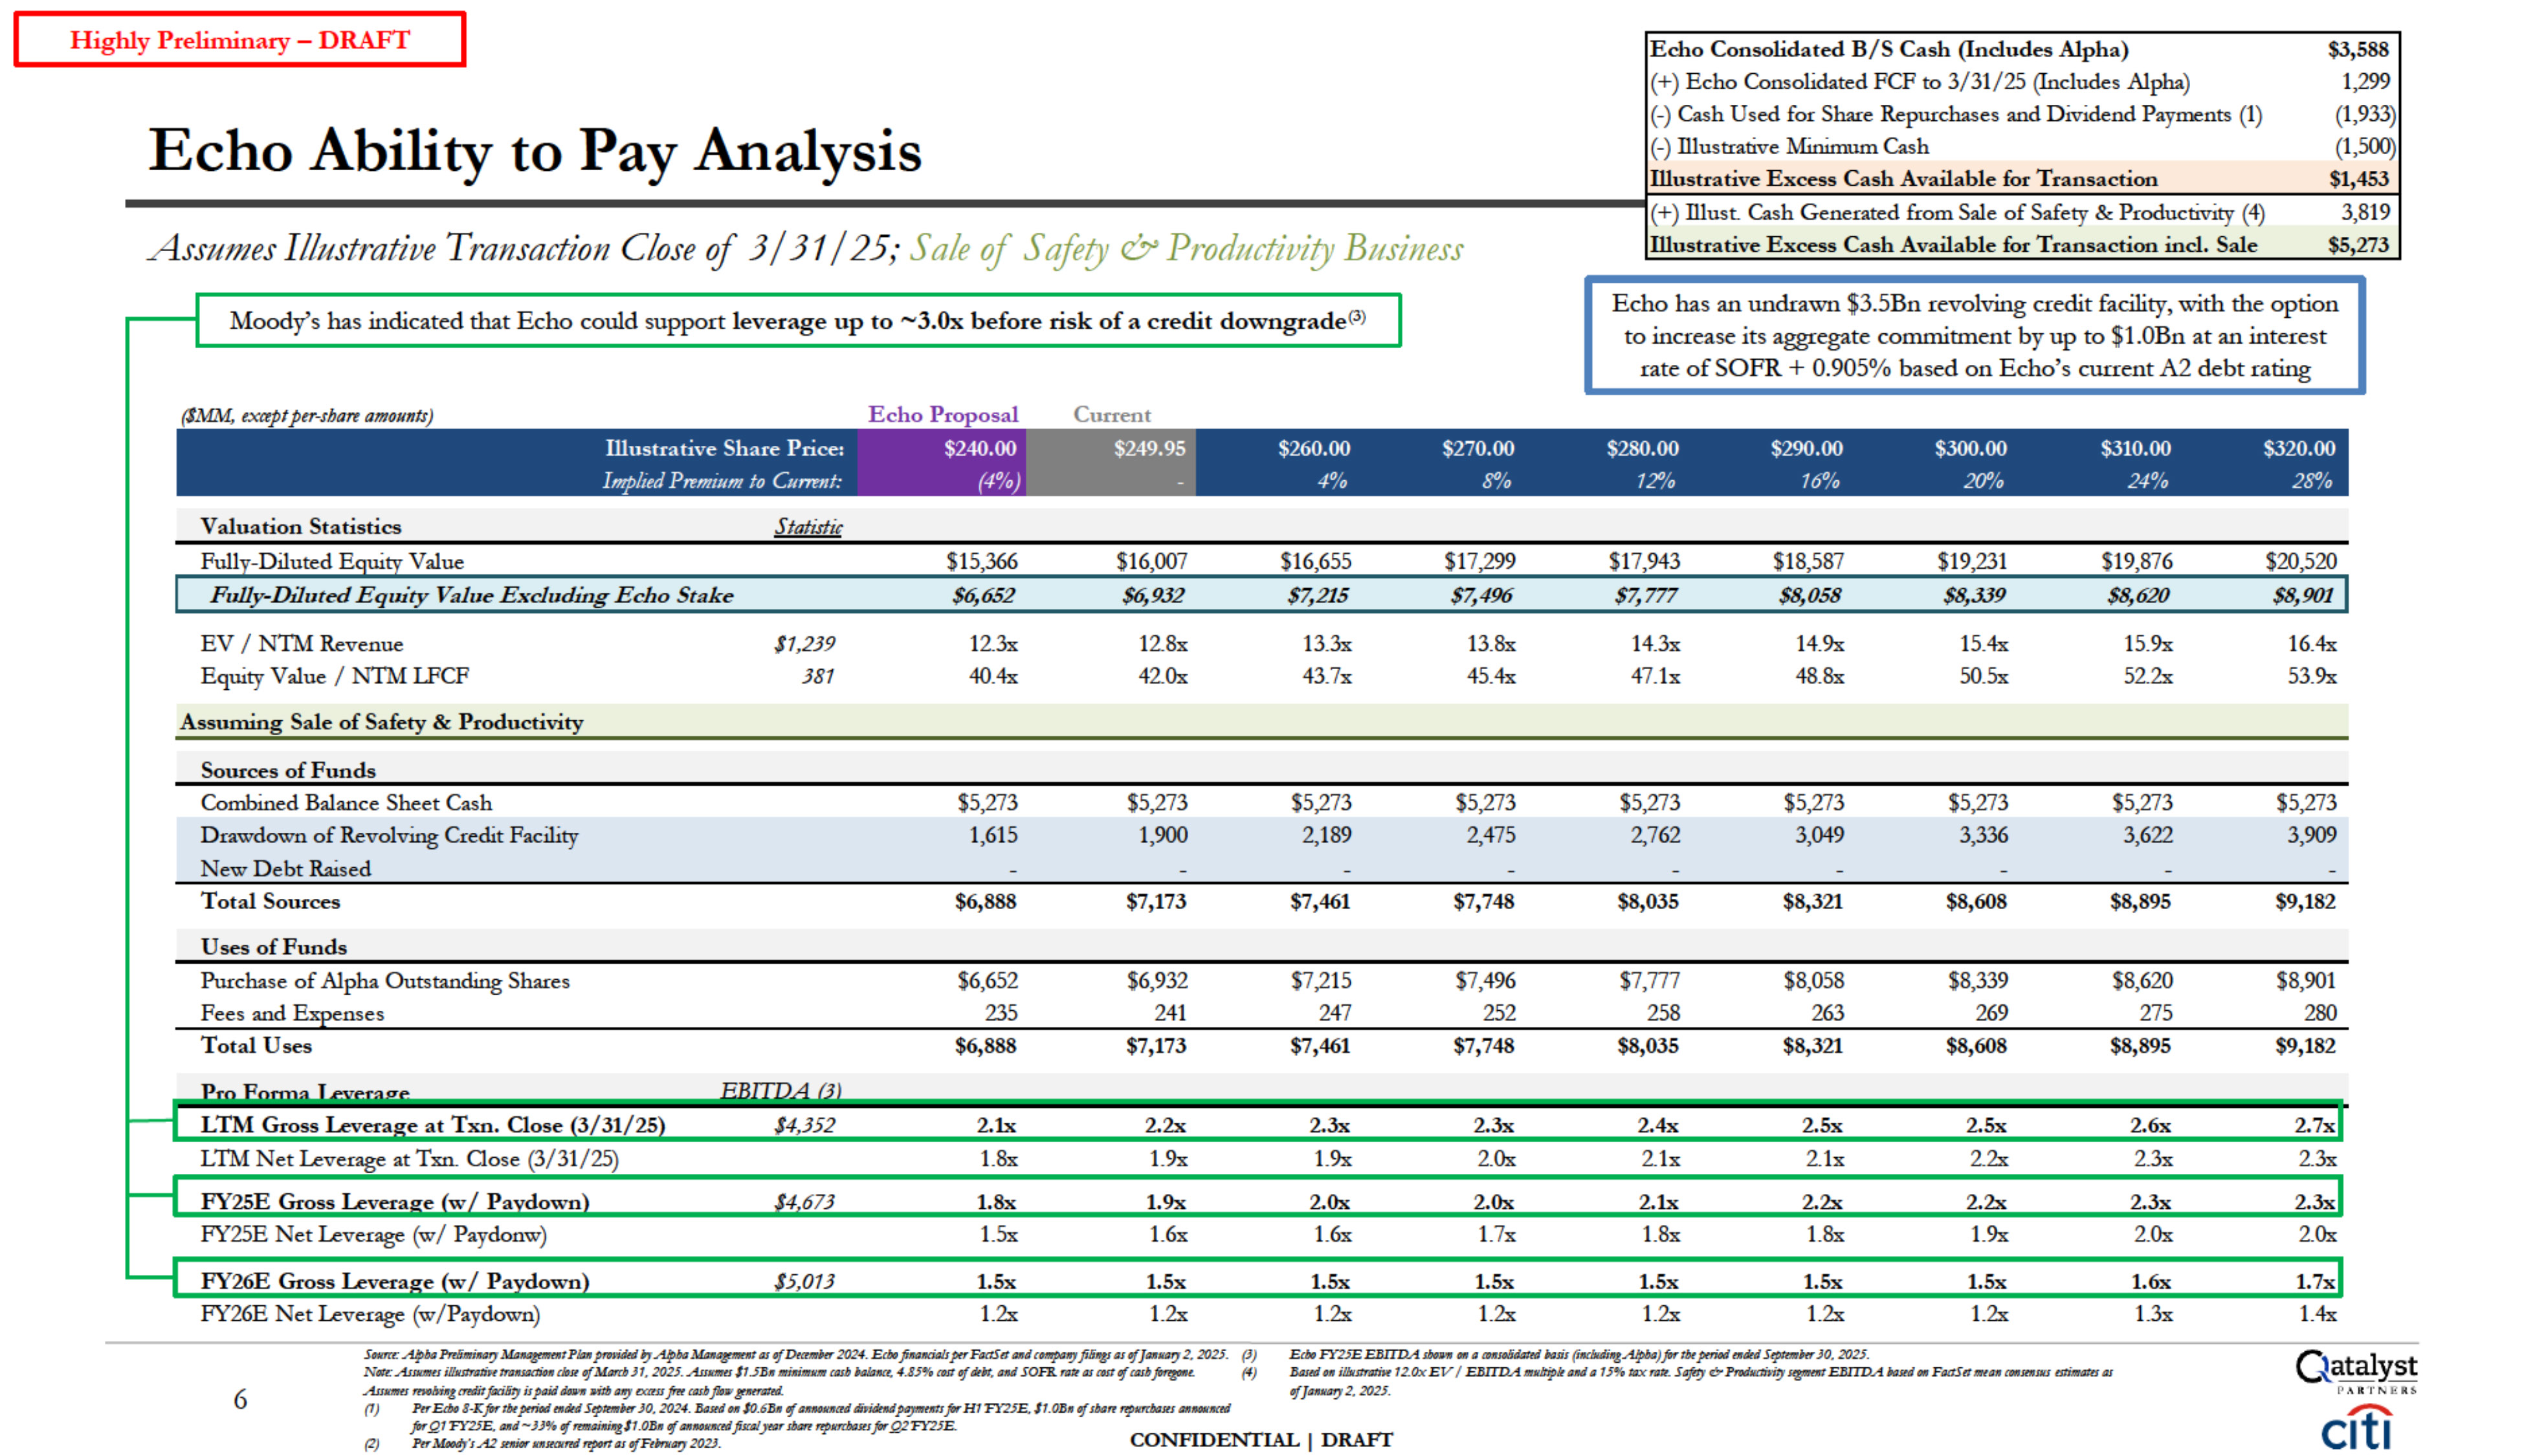
Echo Consolidated B/S Cash (Includes Alpha) $3,588 (+) Echo Consolidated FCF to
3/31/25 (Includes Alpha) 1,299 (-) Cash Used for Share Repurchases and Dividend Payments (1) (1,933) (-) Illustrative Minimum Cash (1,500) lliustrative Excess Cash Available for Transaction $1,453 (+) Illust. Cash Generated from Sale of
Safety & Productivity (4) 3,819 lliustrative Excess Cash Available for Transaction incl. Sale $5,273 Full -Diluted E ui Value $15,366 $16,007 $16,655 $17,299 $17,943 $18,587 $19,231 $19,876 $20,520 Fully-Diluted Equity Value
Excludi11g Ecl10 Stake $6,652 $6,932 $7,215 $7,496 $7,777 $8,058 $8,339 $8,620 $8,901 EV / N1M Revenue $1,239 12.3x 12.Sx 13.3x 13.Sx 14.3x 14.9x 15.4x 15.9x 16.4x Equity Value/ N1M
LFCF 381 40.4x 42.0x 43.7x 45.4x 47.lx 48.Sx 50.5x 52.2x 53.9x Assuming Sale of Safety & Productivity Sources of Funds Combined Balance Sheet
Cash $5,273 $5,273 $5,273 $5,273 $5,273 $5,273 $5,273 $5,273 $5,273 Drawdown of Revolving Credit Facility 1,615 1,900 2,189 2,475 2,762 3,049 3,336 3,622 3,909 New Debt Raised Total
Sources $6,888 $7,173 $7,461 $7,748 $8,035 $8,321 $8,608 $8,895 $9,182 Uses of Funds Purchase of Alpha Outstanding Shares $6,652 $6,932 $7,215 $7,496 $7,777 $8,058 $8,339 $8,620 $8,901 Fees and
Exeenses 235 241 247 252 258 263 269 275 280 Total Uses $6,888 $7,173 $7,461 $7,748 $8,035 $8,321 $8,608 $8,895 $9,182 LTM Gross Levera e at Txn. Oose
3/31/25 14,352 2.lx 2.2x 2.3x 2.3x 2.4x 2.Sx 2.Sx 2.6x 2.7x L1M Net Leverage at Txn. Oose (3/31/25) 1.8x 1.9x 1.9x 2.0x 2.lx 2.lx 2.2x 2.3x 2.3x FY25E Gross Levera e w Pa
down 4673 1.Sx 1.9x 2.0x 2.0x 2.lx 2.2x 2.2x 2.3x 2.3x FY25E Net Leverage (w/ Paydonw) 1.5x 1.6x 1.6x 1.7x 1.8x 1.8x 1.9x 2.0x 2.0x FY26E Gross Levera e w/ Pa
down 15,013 1.Sx 1.Sx 1.Sx 1.Sx 1.Sx 1.Sx 1.Sx 1.6x 1.7x FY26E Net Leverage (w/Paydown) 1.2x 1.2x 1.2x 1.2x 1.2x 1.2x 1.2x 1.3x 1.4x ---Hi-ghly Preliminary - DRAFT Echo Ability to Pay Analysis Assumes
IllustrativeTransaction Close of 3 / 31 / 25; Sale of S ajety & Productivity Business Moody's has indicated that Echo could support leverage up to ~3.0x before risk of a credit downgrade<3) Echo has an undrawn $3.5Bn revolving credit
facility, with the option to increase its aggregate commitment by up to $1.0Bn at an interest rate of SOFR + 0.905% based on Echo's current A2 debt rating ($MM, txctptper-sbareamounts) lliustrative Share
Price: $240.00 $260.00 $270.00 $280.00 $290.00 $300.00 $310.00 $320.00 Imp!ted Premium to Curren/: (4%) - 4% 8% 12% 16% 20% 24% 28% Echo Proposal Current Valuation Statistics Slatimc s :A9&1PrtliJ!lti11a,yZ14o
tPN111pmid«l"7A4>lxl. asefDt(tf/1/NT 2024.E.dJoft11aMiabptrFllttSttat1dtmpa,,y filii't.14sof]at111a,y2.2025. (J) /4) E.dJoFY25E..EBlTD.A.WH OIi a (t»l!o/ith:td Hsis(indlldin1,Alpb4)fartbt ptriodt11dtd S ttr JO,
2025. &std411ilbi.st'lrJlnlt12.0xEV/ .EBITDA11t1illiplt fJM4 15%IIJX f'fJfl. Slljty& Prod1urin stgmm.E.B1ID.A Hstd ,m Fat1Stt IIHl11J amsmoo efl""""'Y2, 202;. C-latalyst PAiC'rNf!U, N«t: A.s!NJtffs ilhlstmiff trrlM«t#11
f.HlstllfMarr.bJ1. 2fJ2J. AsslUlttl115B1111tillilltRmtasb 4.85%(t)lf efdtk.tltUi SOFR. f'fJfl asmt If wb j,rp.t. AsslUlttlftMl.biJltmditfad51J iJpaidd4WII •ilbdJ!!t:XJ:ISS fttt tasbjh:Pl,tllffl#td. (1) PtrEtbf 8-Kfar tbtptriodmdtd
Stp1t1111NTJO, 2024. &std1J11I0.6BII'f 411Mlillad di1idmdpaymm1far H1'FY.?5.E.l1.0B11II/slwt r,pldl'bostsJttJMllll(td 41 6 CONFIDENTIAL I DRAFI farQ,1FY2J.E. a,,d~JJ'/4 ofrmtzini11gl1.0BII IfJttJMJillttd
fisailJ'tt1rs&zrtrtpllfrbastsfarQ2FY2JE. PtrMtJodJ's.A2fn#{J(' llllltOlfflittponOS efFtffltaty202.J. c1t1 (2)
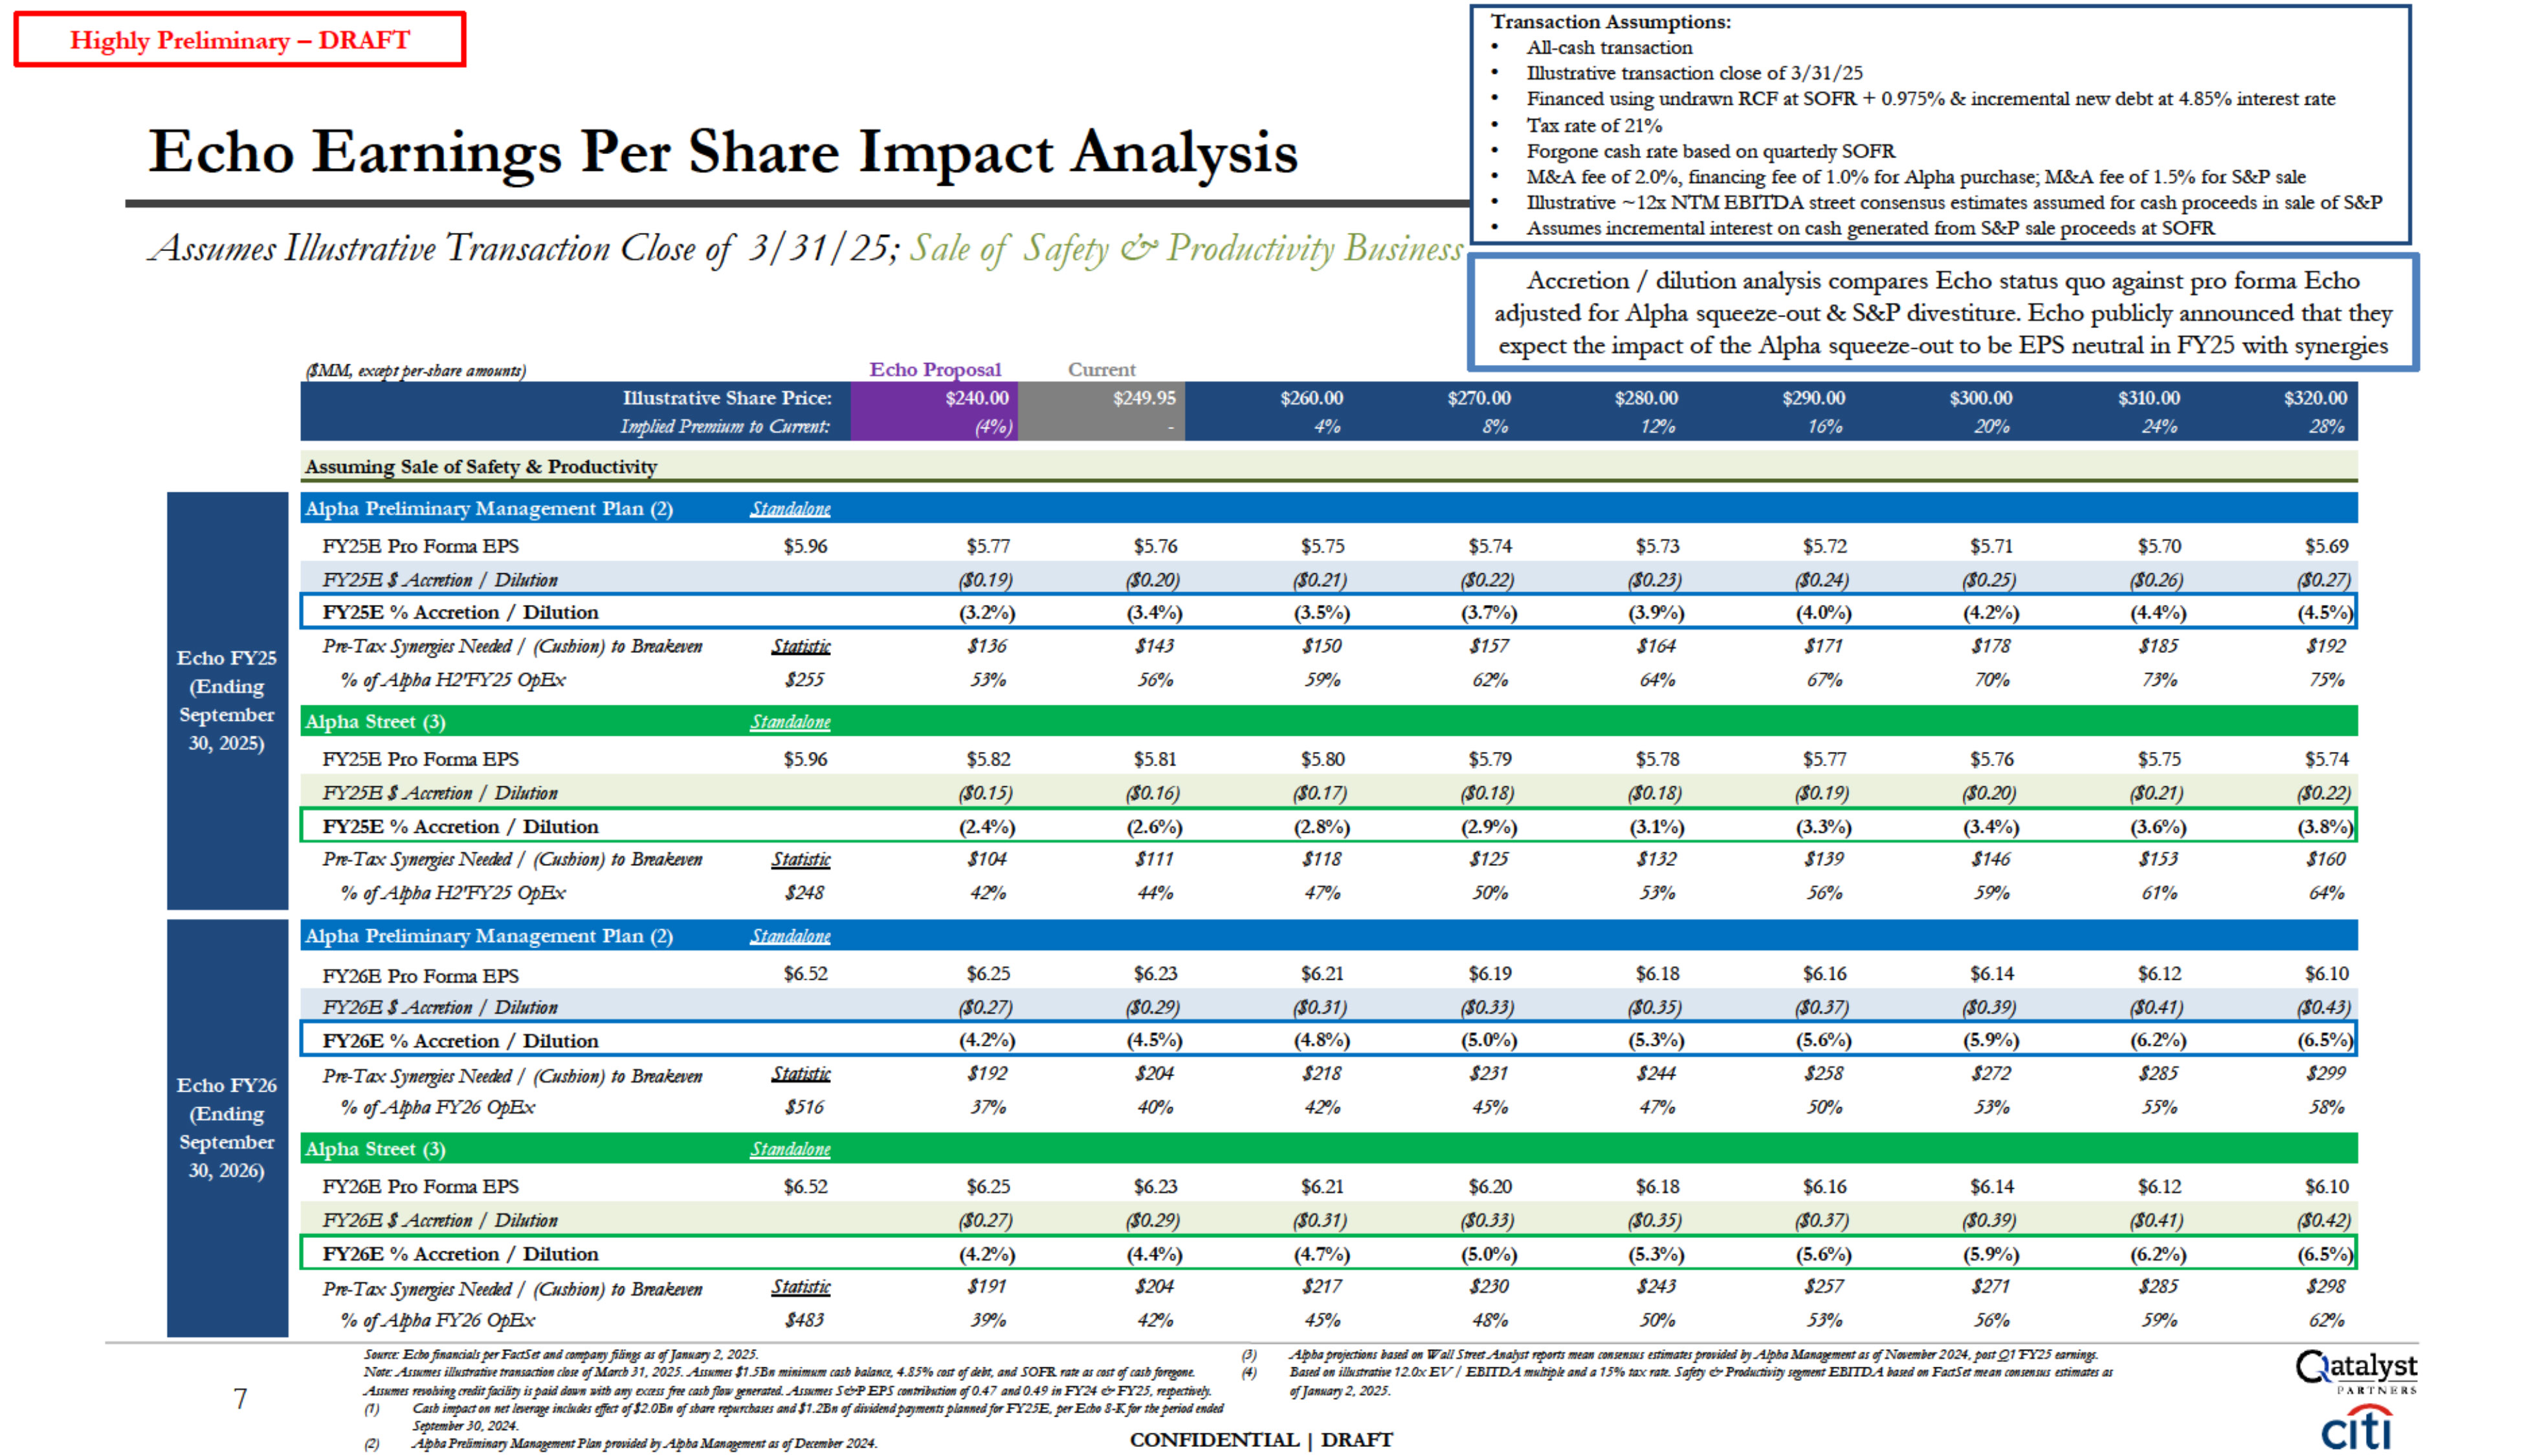
Highly Preliminary - DRAFT Echo Earnings Per Share Impact Analysis Assumes
IllustrativeTransaction Close of 3 / 31 / 25; Sale of S ajety & Productivity Business Transaction Assumptions: All-cash transaction Illustrative transaction close of 3/31/25 Financed using widrawn RCF at SOFR + 0.975% & incremental
new debt at 4.85% interest rate Tax rate of 21¾ Forgone cash rate based on quarterly SOFR M&A fee of2.0¾, financing fee of 1.0% for Alpha purchase; M&A fee of 1.5% for S&P sale Illustrative -12x NTM BBITDA street consensus
estimates assumed for cash proceeds in sale of S&P Assumes incremental interest on cash generated from S&P sale proceeds at SOFR "- , , .. Illustrative Share Price: $240.00 $260.00 $270.00 $280.00 $290.00 $300.00 $310.00
$320.00 8% 12% 16% 20% 24% 28% llllphtd Pretm,1111 to Oment: (4%) - 4% Accretion / dilution analysis compares Echo status quo against pro forma Echo adjusted for Alpha squeeze-out & S&P divestiture. Echo publicly announced that
they expect the impact of the Alpha squeeze-out to be EPS neutral in FY25 with synergies - Assuming Sale of Safety & Productivity Alpha Preliminary Management Plan (2) .s.tJmda/JJJJ!_ FY25B Pro Forma
BPS $5.96 $5.77 $5.76 $5.75 $5.74 $5.73 $5.72 $5.71 $5.70 $5.69 FY25B I Acmtion I Dilution 0.19 0.20 0.21 022 0.23 0.24 0.25 0.26 0.27 PY25E % Acccetion /
Dilution (3.2%) (3.4%) (3.5%) (3.7%) (3.9%) (4.0%) (4.2%) (4.4%) (4.5% Pn-Tax S.)'ne,giu Needed I (Oisbion) to Brtahim S./JJtiJJ.t $136 $143 $150 $157 $164 1171 1178 1185 $192 % ofAlpba H2'FY25
op& 1255 53% 56% 59% 62% 64% 67% 70% 73% 75% Alpha Street (3) Standa/ont FY25B Pro Forma BPS $5.96 $5.82 $5.81 $5.80 $5.79 $5.78 $5.77 $5.76 $5.75 $5.74 FY25B I Acmtion I
Dilution (10.15) (10.16) (10.17) (10.18) (10.18) (10.19) (10.20) (S0.21) (S0.22) PY25E % Acccetion / Dilution (24%) (2.6%) (2.8%) (2.9%) (3.1%) (3.3%) (3.4%) (3.6%) (3.8% Pn-Tax S.)'ne,giu Needed I (Oisbion) to
Brtahim Statistic $104 $111 $118 $125 $132 1139 1146 1153 $160 % ofAlpba H2'FY25 op& 1248 42% 44% 47% 50% 53% 56% 59% 61% 64% Alpha Preliminary Management Plan (2) .s.tJmda/JJJJ!_ FY26B Pro Forma
BPS $6.52 $6.25 $6.23 $6.21 $6.19 $6.18 $6.16 $6.14 $6.12 $6.10 FY26B I Acmtion I Dilution 0.27 0.29 0.31 0.33 0.35 0.37 0.39 0.41 0.43 PY26E % Acccetion /
Dilution (4.2%) (4.5%) (4.8%) (5.0%) (5.3%) (5.6%) (5.9%) (6.2%) (6.5% Pn-Tax S.)'ne,giu Needed I (Oisbion) to Brtahim S./JJtiJJ.t $192 $204 $218 $231 $244 1258 1272 1285 $299 % ofAlpba FY26
opBx 1516 37% 4(!'/o 42% 45% 47% 5(!'/o 53% 55% 58% Alpha Street (3) Standa/ont FY26B Pro Forma BPS $6.52 $6.25 $6.23 $6.21 $6.20 $6.18 $6.16 $6.14 $6.12 $6.10 FY26B I Acmtion I
Dilution (10.27) (10.29) (10.31) (10.33) (10.35) (10.37) (10.39) (S0.41) (S0.42) PY26E % Acccetion / Dilution (4.2%) (4.4%) (4.7%) (5.0%) (5.3%) (5.6%) (5.9%) (6.2%) (6.5% Pn-Tax S.)'ne,giu Needed I (Oisbion) to
Brtahim Statistic $191 $204 $217 $230 $243 1257 1271 1285 $298 % ofAlpba FY26 opBx 1483 39% 42% 45% 48% 5(!'/o 53% 56% 59% 62% 7 s..,,,:E<bo ft•wa/JI'"F.aStt_, - ftlhlgs.,,r f""'"Y 2. 2025. No:t:A.slN.ltffl ilhlstmiff
trrlM«1#11 f.Hlst llfMarr.b )1. 2fJ2J. All/Ulttl 11.5B1111tilliJltRmtasb 4.85%(t)f1efdtk. tltUi SOFR. f'(Jfl as mt If wl, j,rp.t. As111111t1ftMl.bi.ittmdit fad51J iJpaidd4W1I •ilbdJ!!t:XJ:ISS fmtasb jh:P td.AIJl/llltsS&P EPS
lllllln#'ll1i{mef0.47 fJM0.49 inFY24 & FY2J. rt1ptt1iJ't . (1) C4tb.,, .. Mt,_ mdNdtJ'.ffett,fl2.O1JJ,,f sb.m,,,.,,..,,,.,.11.m. ,j dnwnsdp,y-11pllllmtdfa,FY25£.pE,t,,8-KfarthtP""""""' S,p,,,mJO. 2024. (2) .Alpb4pnJi61;••'7 -
Pim,pr,,;d,d ;_,.Alpba.'44n_.,as,j Dt,,,.;,,2024. (J) /4) 411ap,ef«tio11siastdtmW-411Stru:t./1111!).'st fl'J>4rtJmttm t#IIRIISIIS ffim.tm,J>fffidtd -slfNa.'ttllNT2024.po11Q1'FY2.Jl#f'llfflg,.. &Jul411ilbi.st'lrJlnlt12.0x EV I
.EBITDA11t1illiplt fJM4 15%14X nfl. Slljty & Prod,urin stgmm.E.B1IDAHstd tmFat1Sttmt111J «mlffllltS 41 a/]""""'72. 2025. CONFIDENTIAL I DRAFI
Perspectives on Pro Forma Impact to Alpha of Illustrative Target

---Hi-ghly Preliminary - DRAFT Illustrative Alpha + Illust. Target FCF Per Share
Impact Analysis Assumes IllustrativeTransaction Close of 6/ 30/ 25 ($MM, except per-share amo1111ts) Alpha Management estimates annual revenue synergies to reach ~$10MM in Year 4, ramping ratably from ~$3MM in Year 2. At an illustrative
contribution margin of70% today, every $3MM in revenue synergies would imply an additional ~$0.04 FCF / share and drive -0.6% accretion Transaction Assumptions: All-cash transaction Illusuative 11:ansaction close of FY25 (6/YJ/2'5) Minimum
cash balance of $200MM Financed usingcash on hand & debt at SOFR + l SObps; debt piUd down with excess FCF Tax rate of 20% Fo,:gone cash rate based on SOFR Transaction fees/expenses of$25MM Illustrative Purchase Price: Implied CY25E
Revenue Transaction Multiple: - 100%Cash $1 $1 $1 8.3x 9.4x 10.6x - - - Alpha Prelim. Mgmt. Plan+ Illustrative Target (1)(2) Pro Forma FCF per Share Alpha FY26 (Ending June 30, 2026) !¾ Accretion / (Dilution) excl.
Synergies Pre-Tax Syn-e'l}es Needed/ (Cushion) to Breakeven (11.8) Alpha Street + Illustrative Target (2)(3) Pro Forma FCF per Share !¾ Accretion / (Dilution) excl. Synergies Pre-Tax Syn-e'l}es Needed/ (Cushion) to Breakeven $5.0 - -
- $11.1 - ($1.2) Alpha Prelim. Mgmt. Plan+ Illustrative Target (1)(2) Standalone Alpha FY27 (Ending June 30, 2027) Pro Forma FCF per Share $5.0 - - - $11.1 - $ Accretion I ¾Accretion ies Pre-Tax Syn-e'l}es Needed/ (Cushion) to
Breakeven ($33.9) - - ($33.9) - ($21.1) - Alpha Street + Illustrative Target (2)(3) Pro Forma FCF per Share $Accretion I Pre-Tax Syn-e'l}es Needed/ (Cushion) to Breakeven ($32.1) ($21.6) ($20.6) 9 N,r,:1/hamri,1"'1!1.fo,,mdah
.,,.,.,sJ95MM a.J l118MMfor FY26E m,J FY27E, nsp,m,,!:,, at 28-29%UCF 1m1,zm< {1) 41,a Prrlimwry M,,,,,z,,,,,.,Planp,,,idtd Ma"'Pmra, oj'Dmmt,,,202'. {2) 1/1,um,r;,,, T"'l''projtmd fo,,md,ls pr,,idtd Ma_,.,asofN..,,.t,,,202'. (J} 4ha
p1tljtttitms lwd 011 WaPStrtttAM!J•st rtpom IJlt411 (f)IIJtJUkS tstimm.spm>ided Afamrgt,m111 (J_J ofNM't111lttr2024»ptmQ1 'FY25 Mmittgs. CONFIDENTIAL I DRAFI
Echo + Alpha Synergies Analysis
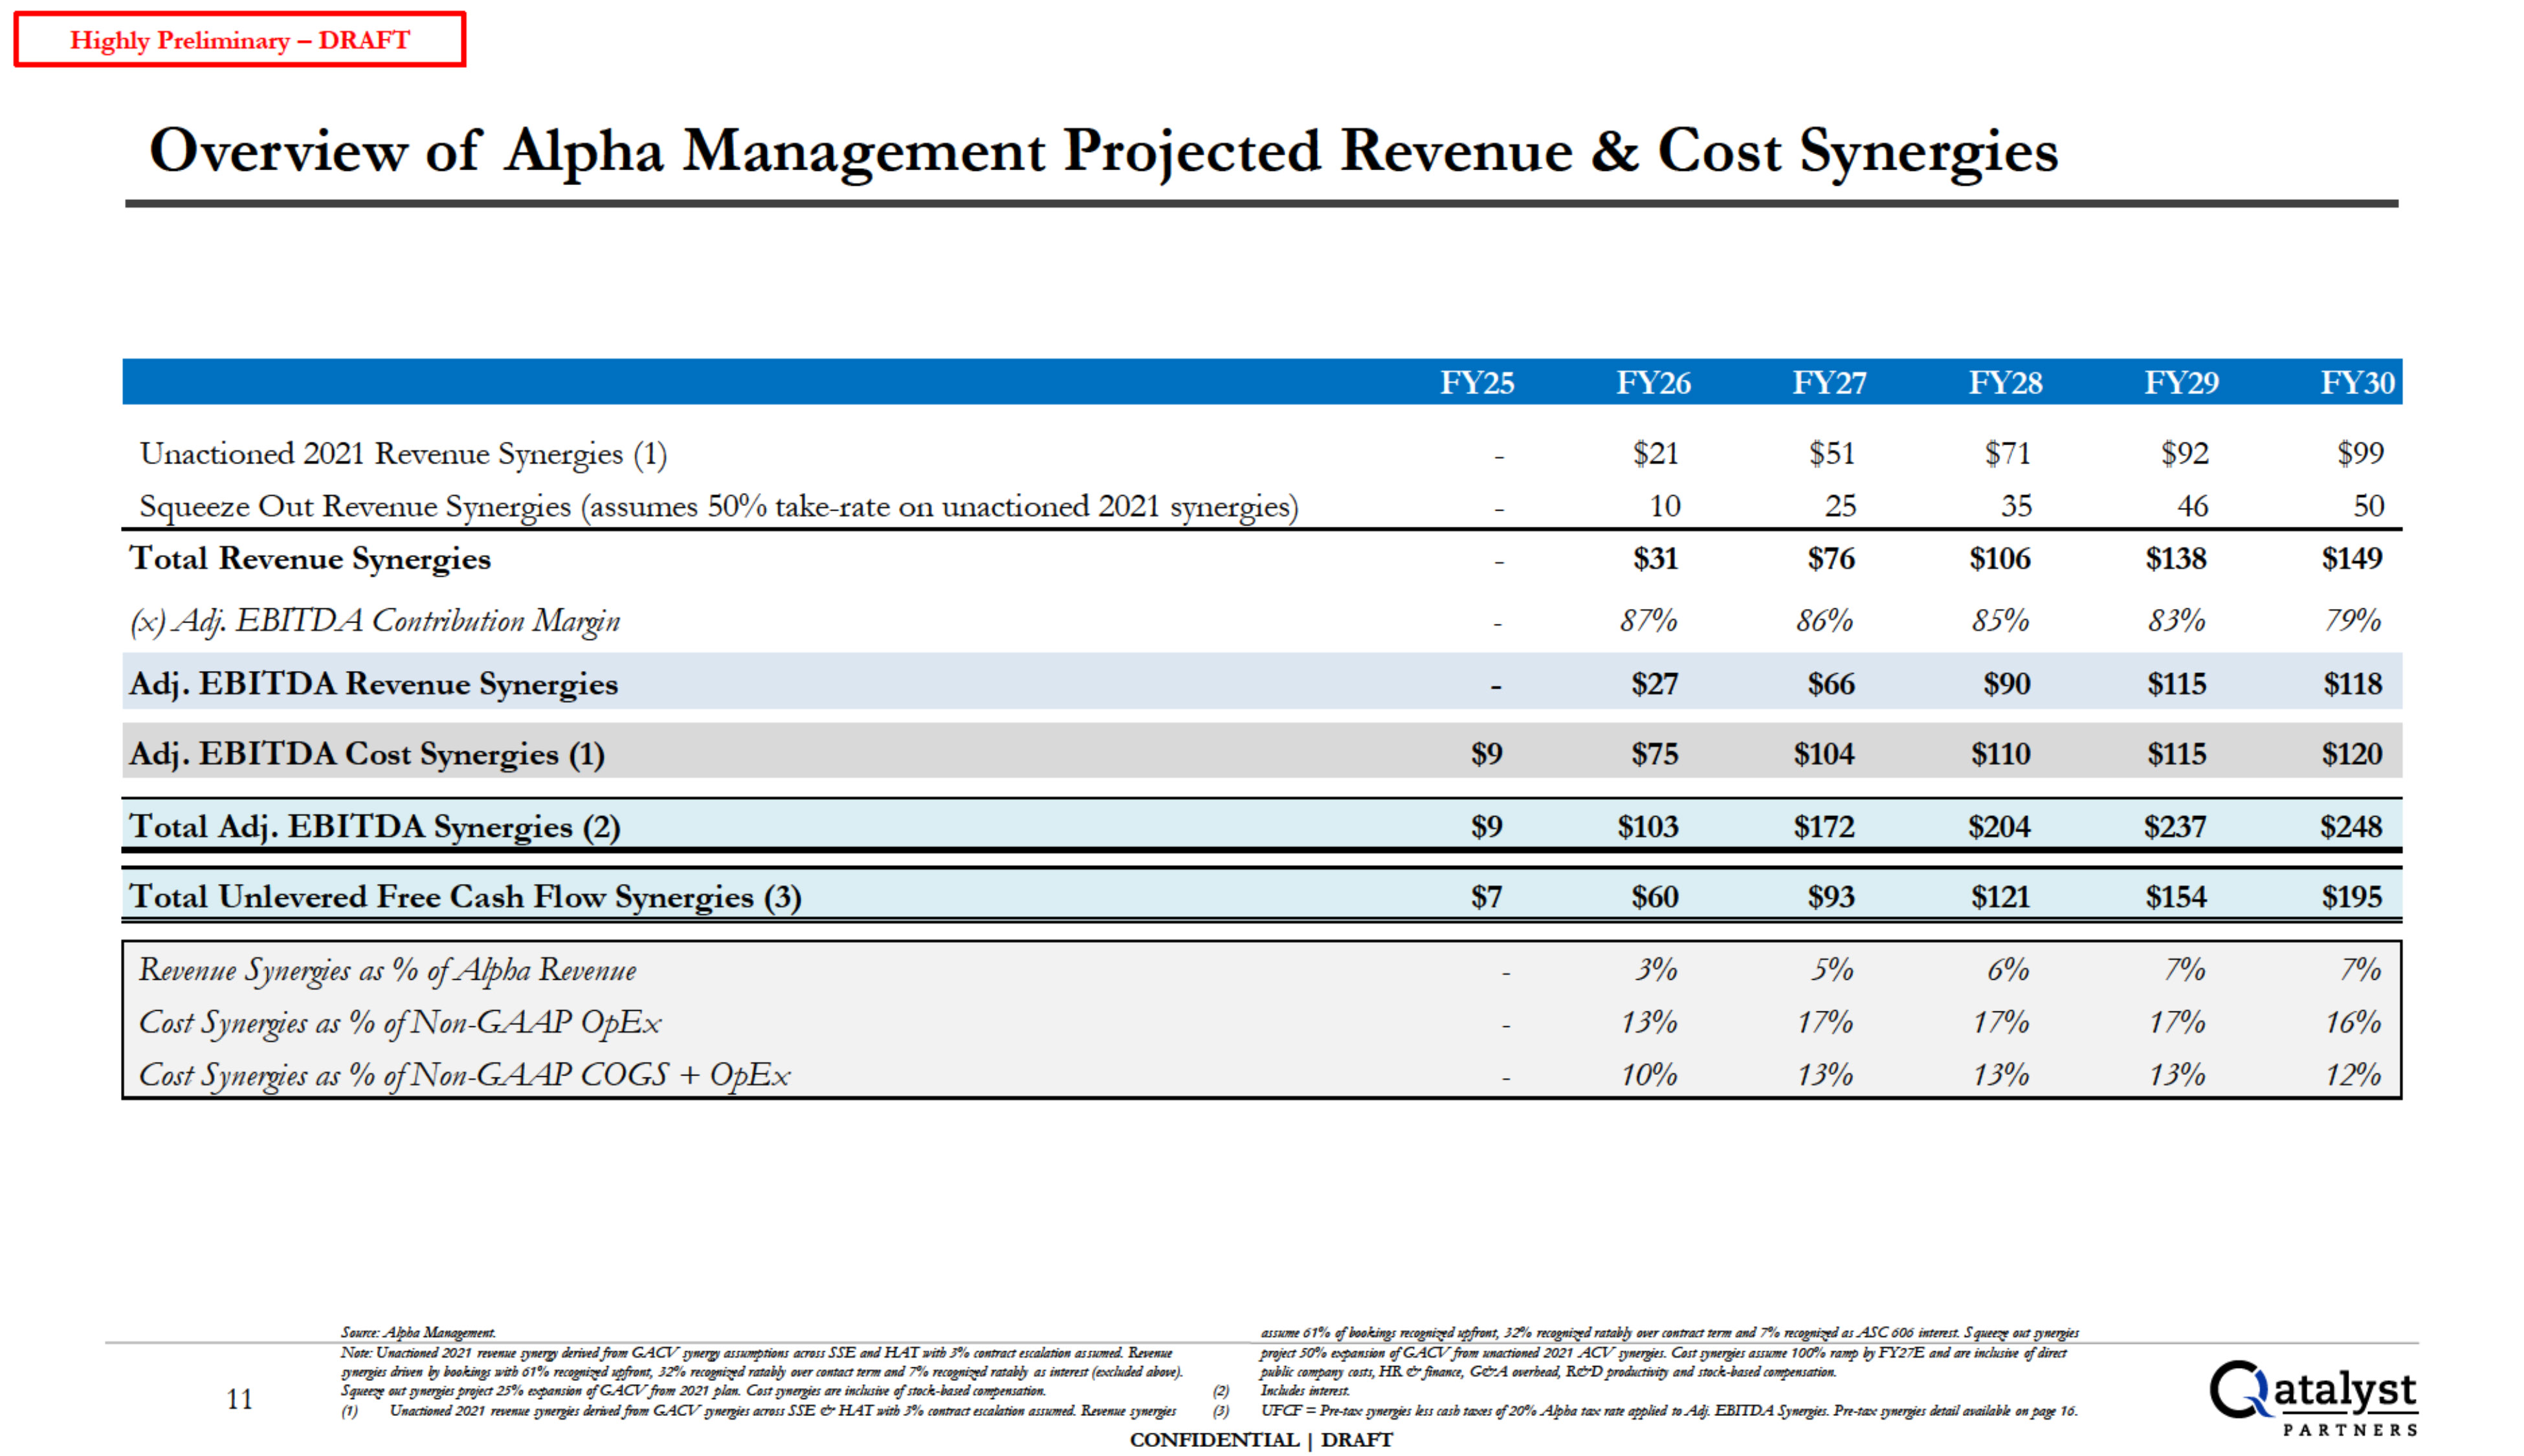
FY25 FY26 FY27 FY28 FY29 FY30 Unactioned 2021 Revenue Synergies
(1) $21 $51 $71 $92 $99 Squeeze Out Revenue Synergies (assumes 50% take-rate on unactioned 2021 synergies) 10 25 35 46 50 Total Revenue Synergies $31 $76 $106 $138 $149 (x) Ac!J. EBIIDA Contribution
Margin 81% 86% 85% 83% 19% Adj. EBITDA Revenue Synergies $27 $66 $90 $115 $118 Adj. EBITDA Cost Synergies (1) $9 $75 $104 $110 $115 $120 Total Adj. EBITDA Synergies (2) $9 $103 $172 $204 $237 $248 Total Unlevered Free
Cash Flow Synergies (3) $7 $60 $93 $121 $154 $195 Revenue Synergies as % of Alpha Revenue 3% 5% 6% 1% 7% Cost Syne,gies as% ofNon-GAAP OpEx 13% 11% 11% 11% 16% Cost Syne,gies as% ofNon-GAAP COGS +
OpEx 10% 13% 13% 13% 12% Highly Preliminary - DRAFT Overview of Alpha Management Projected Revenue & Cost Synergies 11 So,nu: Afh:a:MtlMJPl!ntf. Nok: Umutio,,ed 2021 m,1tllldV'11tT/J tkriwd fromGA.CV [JN,Z,assxmptioN "'"ss SSEand
HAT »id,.1%tollfrad tscalario11 tJSJIOlltd. Bna11t ulfn/its driw11 Jiwi:i,,gs rih 61% rnog,u d MP.fro .12% nttJfl"':;:tdra14.I,!, om' f(Jllf4f7 rm11and7% rnog,,r;:td rllf4j/J asinmur(e:,,:dNdtd dvM). s ONTulWf/llpf't!itt12J% txptJIISio# of GACV
from 2021 plm,. C.,,srV'1U'T/jtS (ITt i#cbaM of md:-iastd((JIIIJH1ffi1#tm. (1) U11anifJ1,ed 2021 m,1tllktV'11tTfits (kriffdf,o111 GA.CV [1Nrgit.1otr#SJ SSE & HAT .,.;th .1%cqllfrad nt"a.hti#n ass1011td. B.nit#ktVM'lfes (I.JSIUIH 61%
eflwkmgs rtt d1tpfn,,,1> J2% ft((Jgnt\rdrarai!J IWtT((J1,-1r«z rm11 a,,d7% rtt das.ASC606 mum:.SgN oJ/1!JNrgiu projtcr t.'<P'J#sio11tf GACV from""'1CtioMd 2021 Aa-'" [JNrgiu.VJ1r [JM,tfes asslOllt 100% ramp FY27E a!ld mT UK.INJM of dine
pi,t/,lit<O./l'fjJtJclo!Jns,HR & fi,,a,,a, G&A fJfffbtad, R.&D '!l aMI sr«k-itmdcompt,uttlio11. {2) LK/xtksi#"ftTt.Jt. (J) UFCF = Prt-14."t(V'11tTfits Its,rashraxrs ,f 20% A9ha f(ZJ(rak app&d ll)Adj. EBI1DA SyNTjjts.
PrN(ZJ[(JM'lfes dt1uilas:ttilaU 011 pogt 16. CONFIDENTIAL I DRAFI C-t_ataly:st PARTNERS
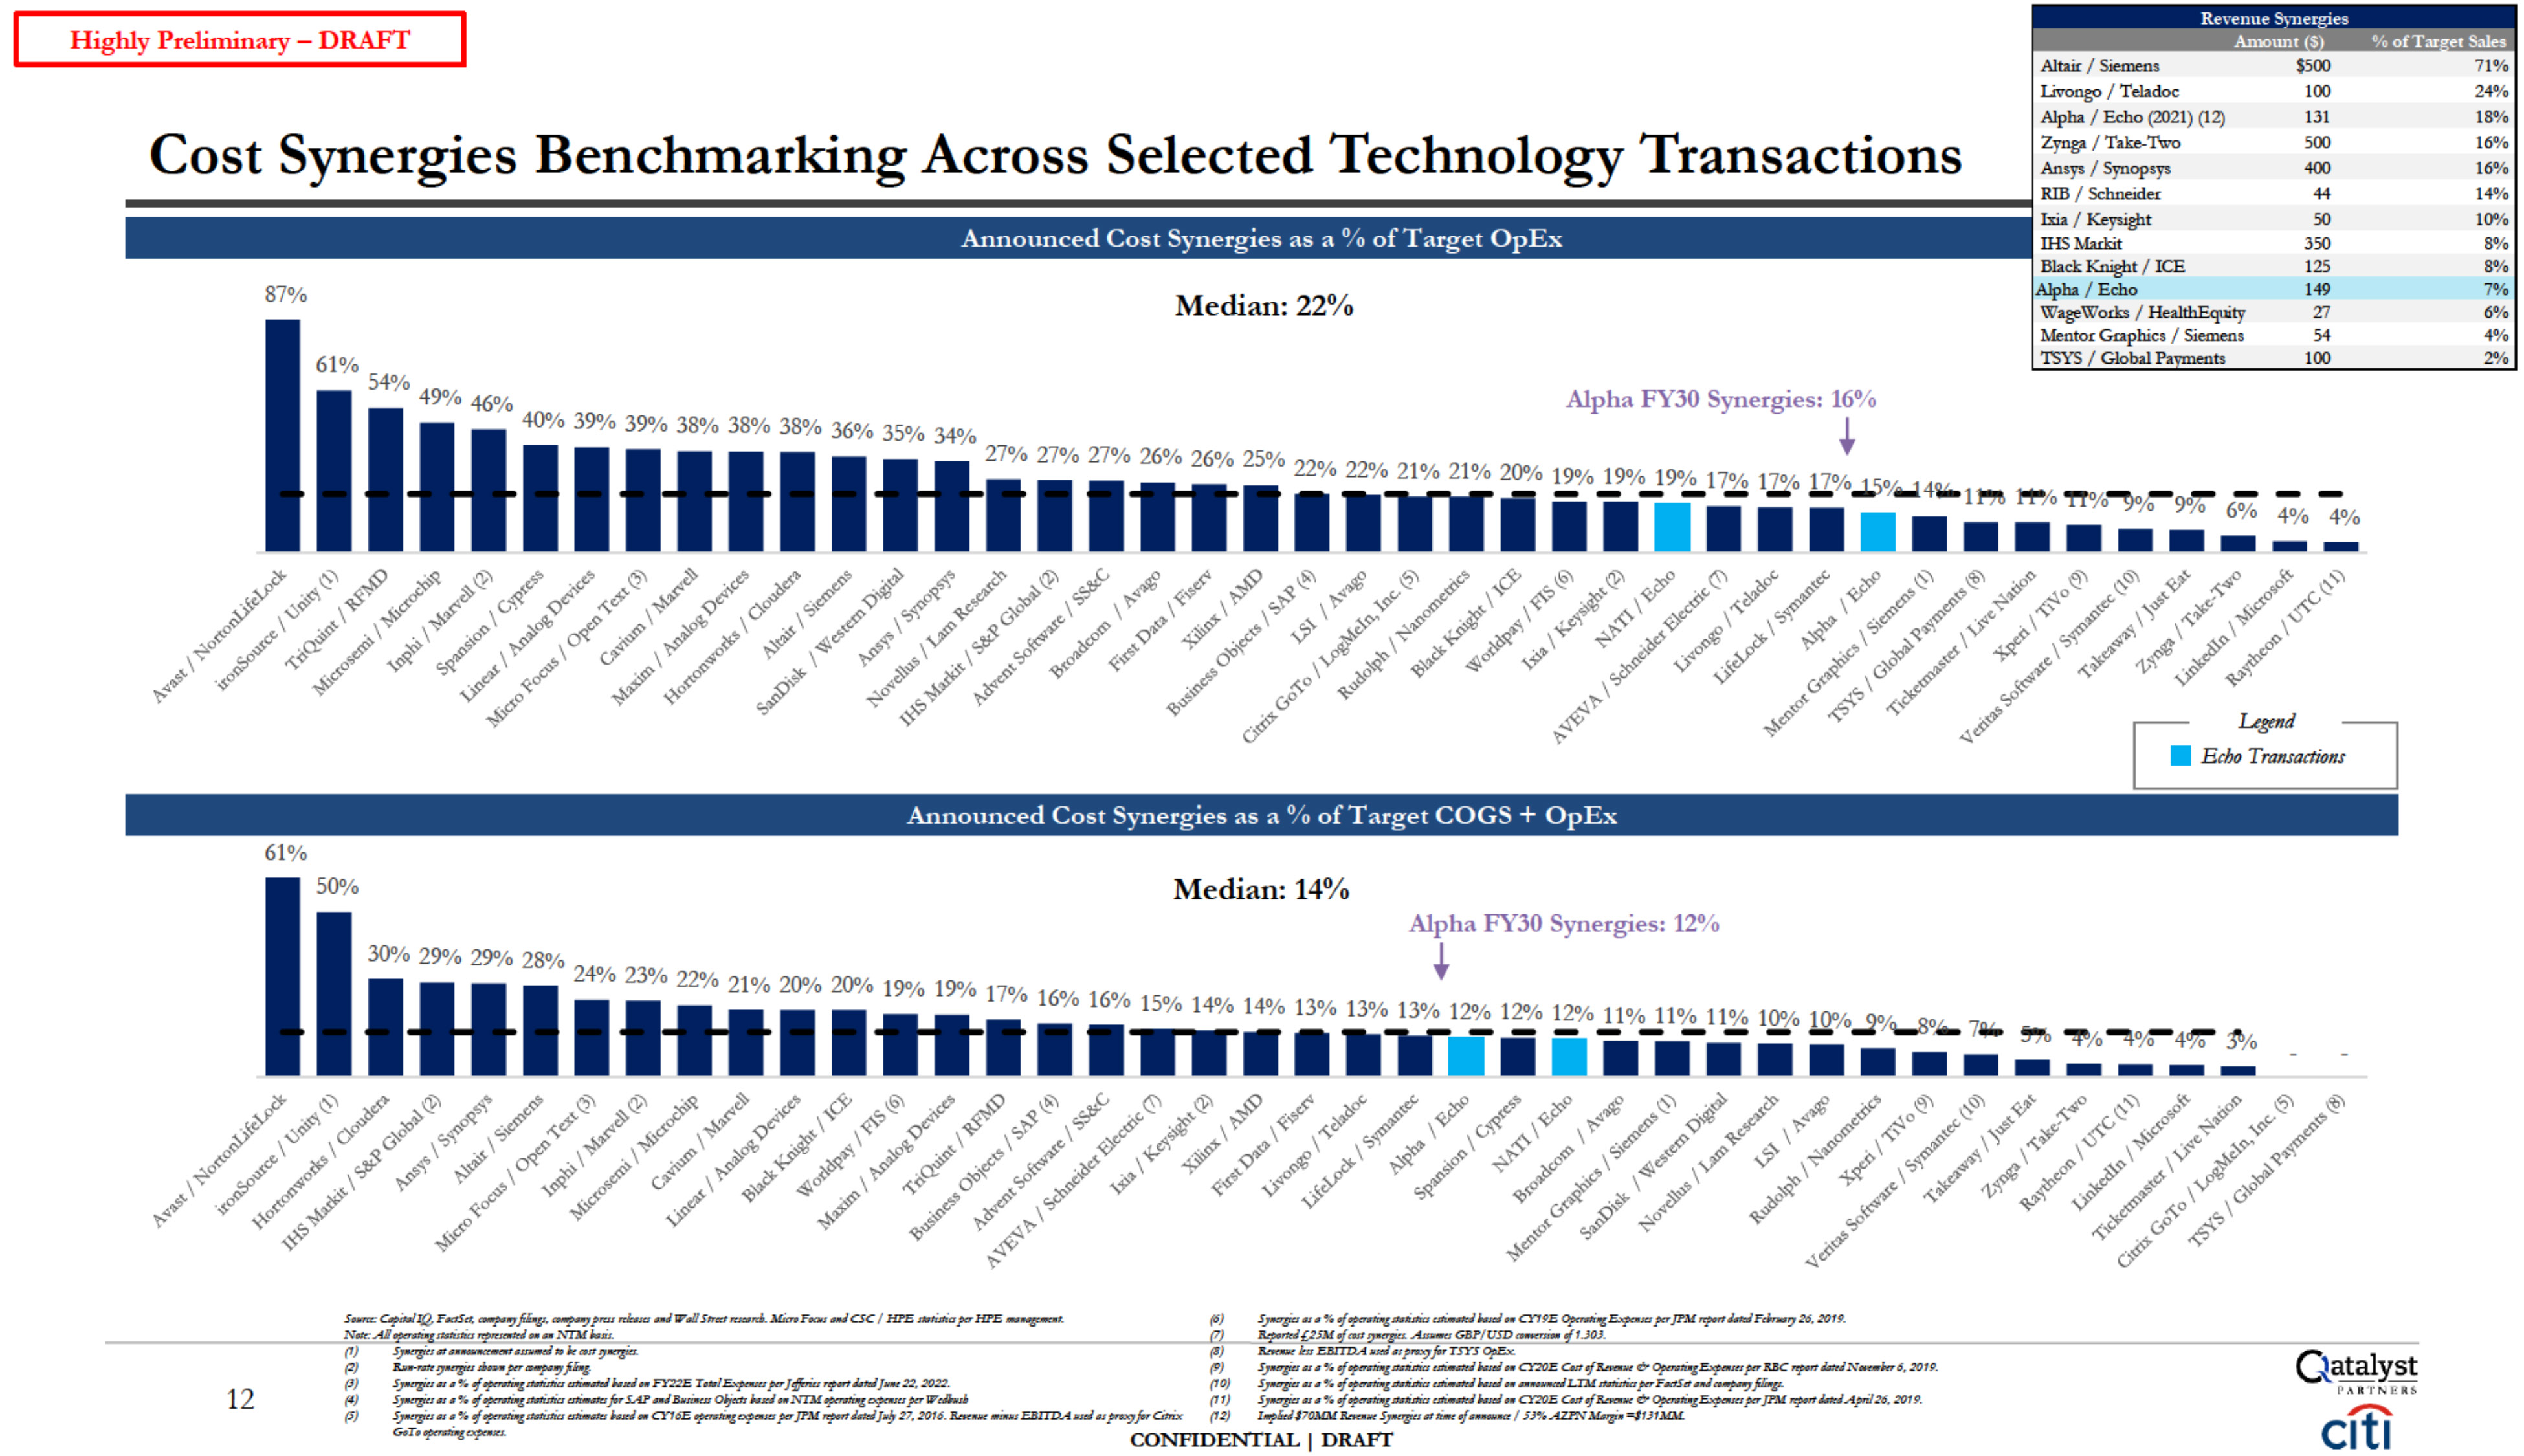
Highly Preliminary - DRAFT Cost Synergies Benchmarking Across Selected Technology
Transactions :: :; RIB/Schneider Ixia / Keysight IHS.Mailit Black Knight / ICE WageWorks / Hea!thEquity Announced Cost Synergies as a% of Target OpEx 87% 61% I 49% 46% Alpha FY30 Synergies:!16% 27% 27% 27% 26% 26% 25% 0
0 ID11111111t111n1iiiii■11 1■1■■:::-::-:: Re't'enue Synergies 1/oofTar et Sales Altair / Siemens $500 71% l..ivongo / Teladoc 100 24% Alpha / Echo (2021) (I
Z) 131 18% 500 16% 400 16% 44 14% so 10% 350 125 8% 8% Median: 22% Alpha/ Echo 149 'J:l 7% 6% 11.fentor Gnphics / Siemens 54 4% TSYS I Global Pa ents 100 2% 54% . 4% 4% -- Announced Cost Synergies as a% of Target
COGS+ OpEx 61% 50% Median: 14% Alpha FY30 Synergies: 12% I 24% 23% 22•1c 21 2"" 2"" • IIHI11.. 11tt o % v1/o v3/o 19% 19% 17•/cO 16°/Oc16°/c O 15% 14% 14% 13% 13% 13% 12% 12% 12% 11% 11% 11% 10% 10% 03/, 0 11111 ■■---■■■ i■■■ii■
===-=-=! Sum:G,pit.Jif2,F#dSa ji-g. pa1,r/mo•lrF.JISITtdm.Md. F-MJCSC/HPE.mti.t1fr1pHPE. Nm::Al n.tisria,gmsO!tltiMo 1\TTMNIU. S,-,ja.u,%ef#/'ffllli•t.1:wistit1,fliM.tmJN1tJ.-CY19.E
-zE.>:;-1opufPM!tJ¥-nindFtJ,,w,,;26,2019. (6) &p.ml{,2SM1/twt !r'P'= _, GBP/USD_,,_ eftJOJ. Xnrc--.u.!kssEB11DA.sd111pt,:,;JfarTSYSOpEx. S,-,ja.u,% ef#/'ffllli•1.1:wisti,tf1liM.tmJN,tJ.-070.EUlt,jCOJ"(1wtis,t mpABC "f'-rt"1tJN-Nr6.
2019. S,-,ja.u,%ef#/'ffllli•t.smi#it1tfliM.tmJN1tJ.--111'ffiiL.XMn.,,.n,mapF.aStr,.J jii,,z,. S,-,ja,u,,%ef#/'ffllli•t.s:nimt1tfliM.tmJN,tJ.- 070.EUlt,jCOfm,#llt..E>;-mpu J1'M n;,mltndApn/ 26.
2019. 12 S.JIW'lit1N,,-,11J.UIMM11,kr.111JM1'fic• X.U.-l'/lltt'1.JIW'litssJ»-p,..,.,-,}#111,. S.JIW'lit1.ut1%4/ •t.#lmf1Wmi,,,.m,JNKJ.-FY22E,T.,.J p]tjfawnp,,nJ.ndJ11M22,2022. S.JIW'lits,u,,% 4/ •t.lhmsliu mi,,,.m:,jw SAP •I B11#1'a:1
,.Id.-NTM•t.o.:ptrut1puWtilnsl, (I) (2) (J) (I,) (.1) S.JIW'lits,u,,% 4/ •t.lhmsliu mi,,,.m:,HXJ• CY'to.E #f't"'li•t.O?r-10 perJPMlt}¥-nJndf 27,2016. •;..,E.BITDA•1tJ,,, jwc;,,;x (12) I.,Stll70.\IM S.JIW'lits"" li•of11u-« /
JJ¾A.Znatmzi•=l1J1MM. G.T .. pmn;"l°'?'-' confidentialI drafi
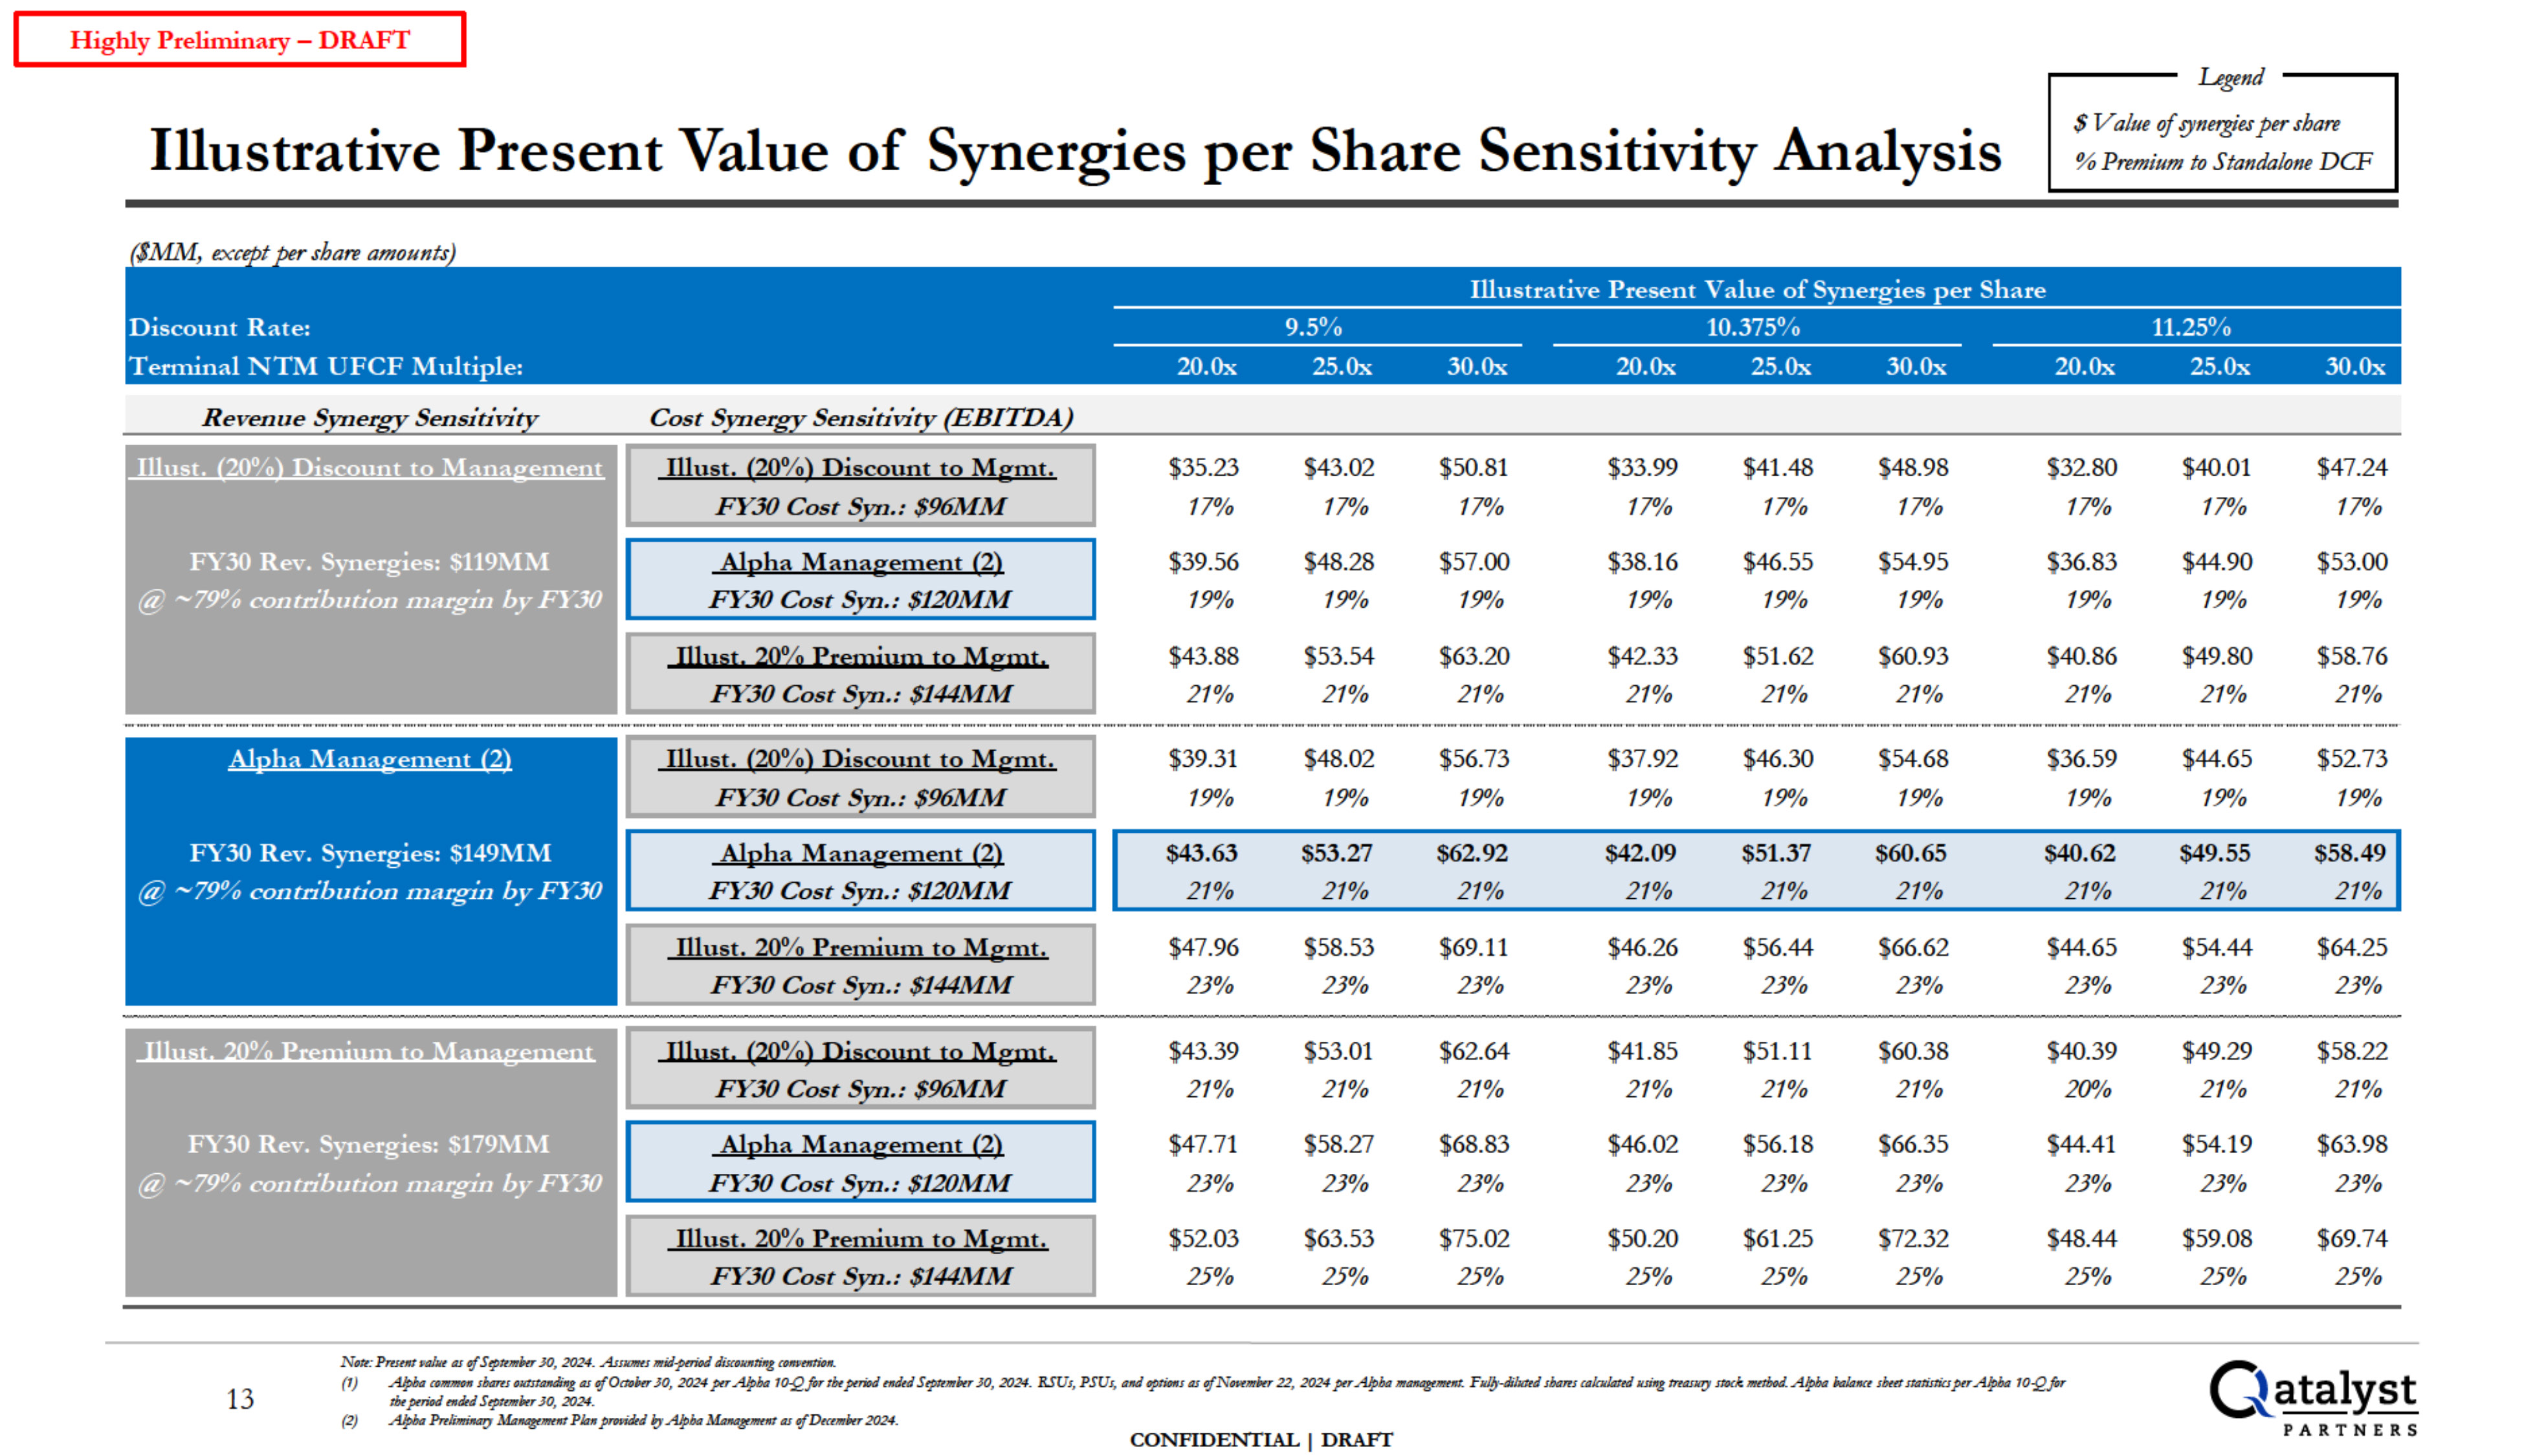
Illust. (20%) Discount to Mgmt. FY.JO Cost Syn.: $96MM Al12ha Management
(2) FY.JO Cost Syn.: $120MM Illrnu, (2ll0fq) Di12s;;g11u1112Mgmt, FY.JO Cost Syn.: $96MM Al12ha Management (2) FY.JO Cost S .:$120MM Illust. (20%) Discount to
Mgmt. $35.23 $43.02 $50.81 $33.99 $41.48 $48.98 $32.80 $40.01 $47.24 FY.JO Cost Syn.: $96MM 17% 17% 17% 17% 17% 17% 17% 17% 17% Al12ha Management
(2) $39.56 $48.28 $57.00 $38.16 $46.55 $54.95 $36.83 $44.90 $53.00 FY.JO Cost Syn.: $120MM 19% 19% 19% 19% 19% 19% 19% 19% 19% llh11a1. 20°i<al!a::s=winw 112 Mg;wt.
$43.88 $53.54 $63.20 $42.33 $51.62 $60.93 $40.86 $49.80 $58.76 FY30 Cost Syn.:
$144MM 21% 21% 21% 21% 21% 21% 21% 21% 21% $39.31 $48.02 $56.73 $37.92 $46.30 $54.68 $36.59 $44.65 $52.73 19% 19% 19% 19% 19% 19% 19% 19% 19% $43.63 $53.27 $62.92 $42.09 $51.37 $60.65 $40.62 $49.55 $58.49 21% 21% 21% 21% 21% 21% 21% 21% 21% Illust.
20% Premium to Mgmt. $47.96 $58.53 $69.11 $46.26 $56.44 $66.62 $44.65 $54.44 $64.25 FY30 Cost Syn.:
$144MM 23% 23% 23% 23% 23% 23% 23% 23% 23% $43.39 $53.01 $62.64 $41.85 $51.11 $60.38 $40.39 $49.29 $58.22 21% 21% 21% 21% 21% 21% 20% 21% 21% $47.71 $58.27 $68.83 $46.02 $56.18 $66.35 $44.41 $54.19 $63.98 23% 23% 23% 23% 23% 23% 23% 23% 23% Illust.
20% Premium to Mgmt. $52.03 $63.53 $75.02 $50.20 $61.25 $72.32 $48.44 $59.08 $69.74 FY30 Cost Syn.: $144MM 25% 25% 25% 25% 25% 25% 25% 25% 25% Highly Preliminary - DRAFT Illustrative Present Value of Synergies per Share
Sensitivity Analysis Legend $ Value of f}nergies per share % Premium to Standalone DCF , , ,, '$MM h Illustrative Present Value of Synergies per Share Discount Rate: 9.5% 10.375% 11.25% -------------30.0x25.0x20.0x
-------------30.0x25.0x20.0x Ten ni n al NTM UFCF Multiple: 20.0x 25.0x 30.0x Cost Synergy Sensitivity {EBITDA) Nott: Pmt111FtllNt as efStp1t111lttr JO, 2024. AsJJOflft.s111idptriod
diKoN11ri,,_cgo/fHllliq11. C-t_ataly:st PARTNERS 13 {1) com11m1sharts ok11rudi•g as oJOmkr O, 2024 ptr 4ha 10-Q,.for rhtptmdtttdtd Stptt1J1'1tOr , 2024. BSUs, PSU1» a!ld ,priot,s tJStf N91,1t111k,22, 2024 ptr Alpha 111anagt111t11t.
Fllfh....Jibmd 1ha1tScaladtatd N.Ji•g manny sr«i: IIHfbod. A#>J,a kthJKt shtttsktrisriaptr 10Q.for ti,,p,md md,d Stpm,J,,r JO, 2024. {2) p,, Ma'"'!!"""' Phnp,,,;dtd Alpha ,,,,.,as oj'Dtw11btr 2024. CONFIDENTIAL I DRAFI
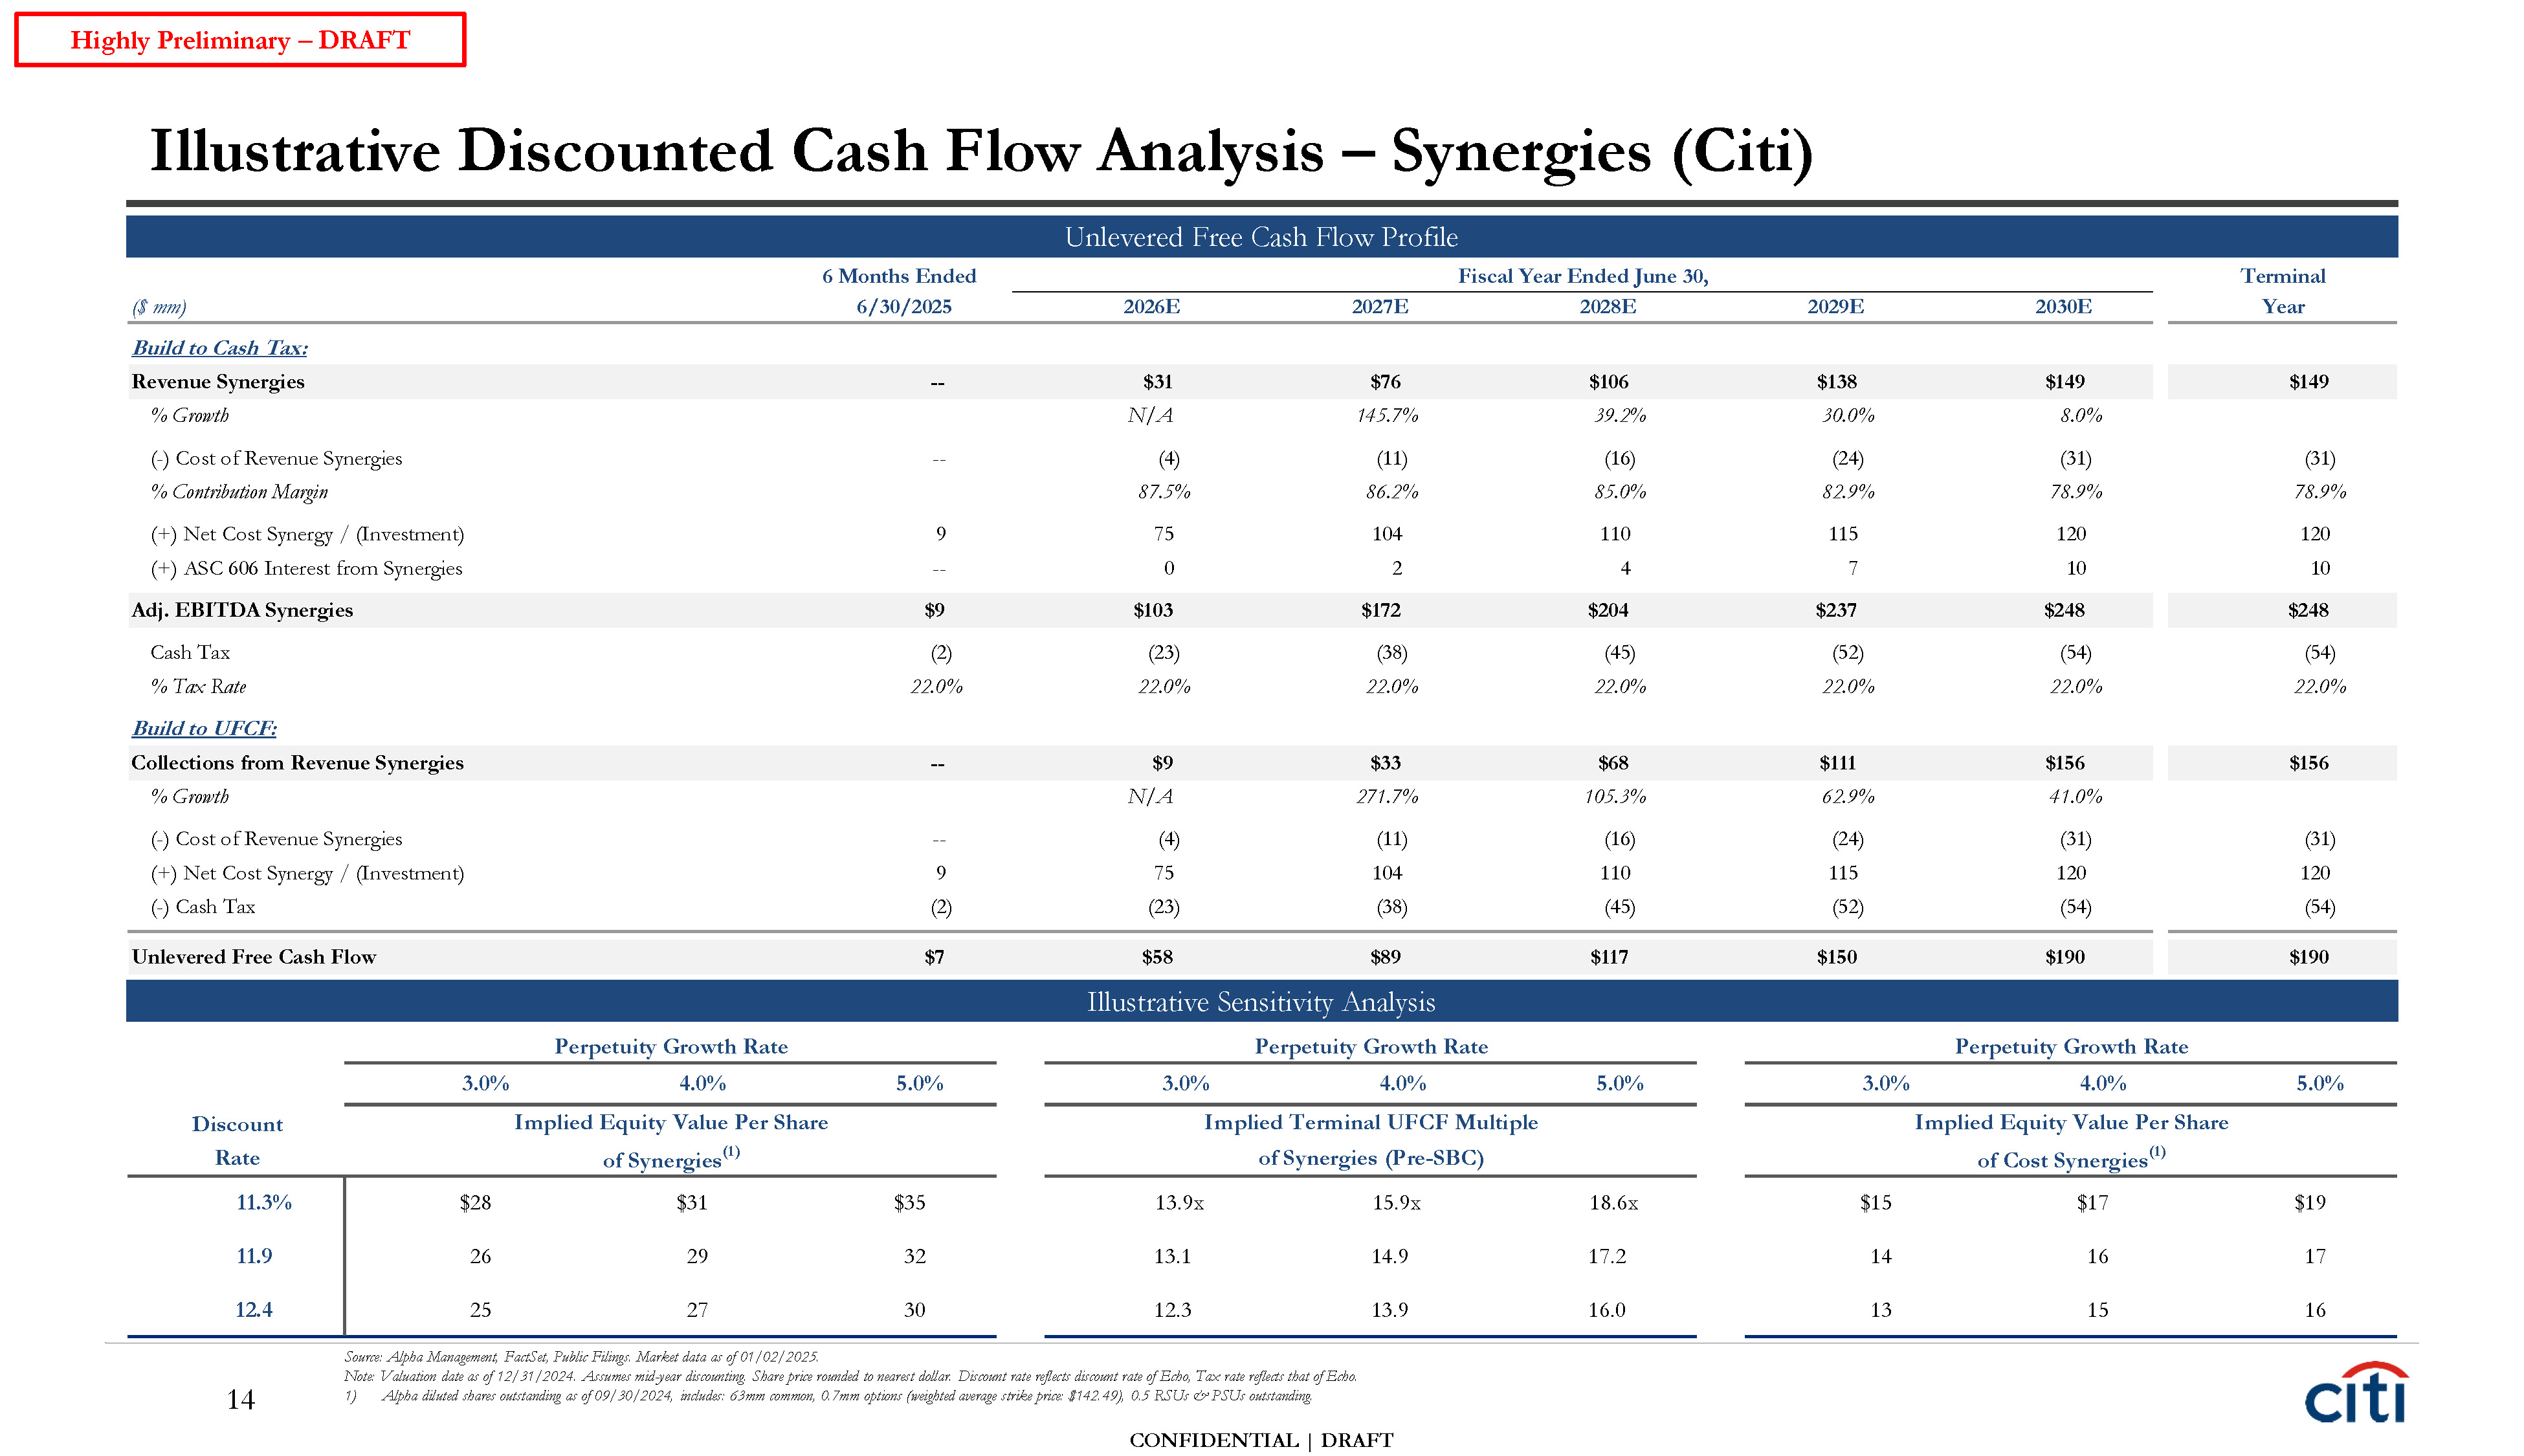
CONFIDENTIAL | DRAFT 14 Illustrative Discounted Cash Flow Analysis – Synergies
(Citi) Source: Alpha Management, FactSet, Public Filings. Market data as of 01/02/2025. Note: Valuation date as of 12/31/2024. Assumes mid-year discounting. Share price rounded to nearest dollar. Discount rate reflects discount rate of Echo,
Tax rate reflects that of Echo. 1) Alpha diluted shares outstanding as of 09/30/2024, includes: 63mm common, 0.7mm options (weighted average strike price: $142.49), 0.5 RSUs & PSUs outstanding. Highly Preliminary – DRAFT 6 Months Ended
Fiscal Year Ended June 30, Terminal Unlevered Free Cash Flow Profile 11.3% $28 $31 $35 11.9 26 29 32 12.4 25 27 30 ($ mm) 6/30/2025 2026E 2027E 2028E 2029E 2030E Year Build to Cash Tax: Revenue
Synergies -- $31 $76 $106 $138 $149 $149 % Growth N/A 145.7% 39.2% 30.0% 8.0% (-) Cost of Revenue Synergies -- (4) (11) (16) (24) (31) (31) % Contribution Margin 87.5% 86.2% 85.0% 82.9% 78.9% 78.9% (+) Net Cost Synergy
/ (Investment) 9 75 104 110 115 120 120 (+) ASC 606 Interest from Synergies -- 0 2 4 7 10 10 Adj. EBITDA Synergies $9 $103 $172 $204 $237 $248 $248 Cash Tax (2) (23) (38) (45) (52) (54) (54) % Tax
Rate 22.0% 22.0% 22.0% 22.0% 22.0% 22.0% 22.0% Build to UFCF: Collections from Revenue Synergies -- $9 $33 $68 $111 $156 $156 % Growth N/A 271.7% 105.3% 62.9% 41.0% (-) Cost of Revenue
Synergies -- (4) (11) (16) (24) (31) (31) (+) Net Cost Synergy / (Investment) 9 75 104 110 115 120 120 (-) Cash Tax (2) (23) (38) (45) (52) (54) (54) Unlevered Free Cash
Flow $7 $58 $89 $117 $150 $190 $190 Illustrative Sensitivity Analysis Perpetuity Growth Rate Perpetuity Growth Rate Perpetuity Growth Rate 3.0% 4.0% 5.0% 3.0% 4.0% 5.0% 3.0% 4.0% 5.0% Discount Rate Implied Equity Value Per
Share of Synergies(1) Implied Terminal UFCF Multiple of Synergies (Pre-SBC) Implied Equity Value Per Share of Cost Synergies(1) 13.9x 15.9x 18.6x $15 $17 $19 13.1 14.9 17.2 14 16 17 12.3 13.9 16.0 13 15 16
Appendix Additional Echo + Alpha Synergies Detail
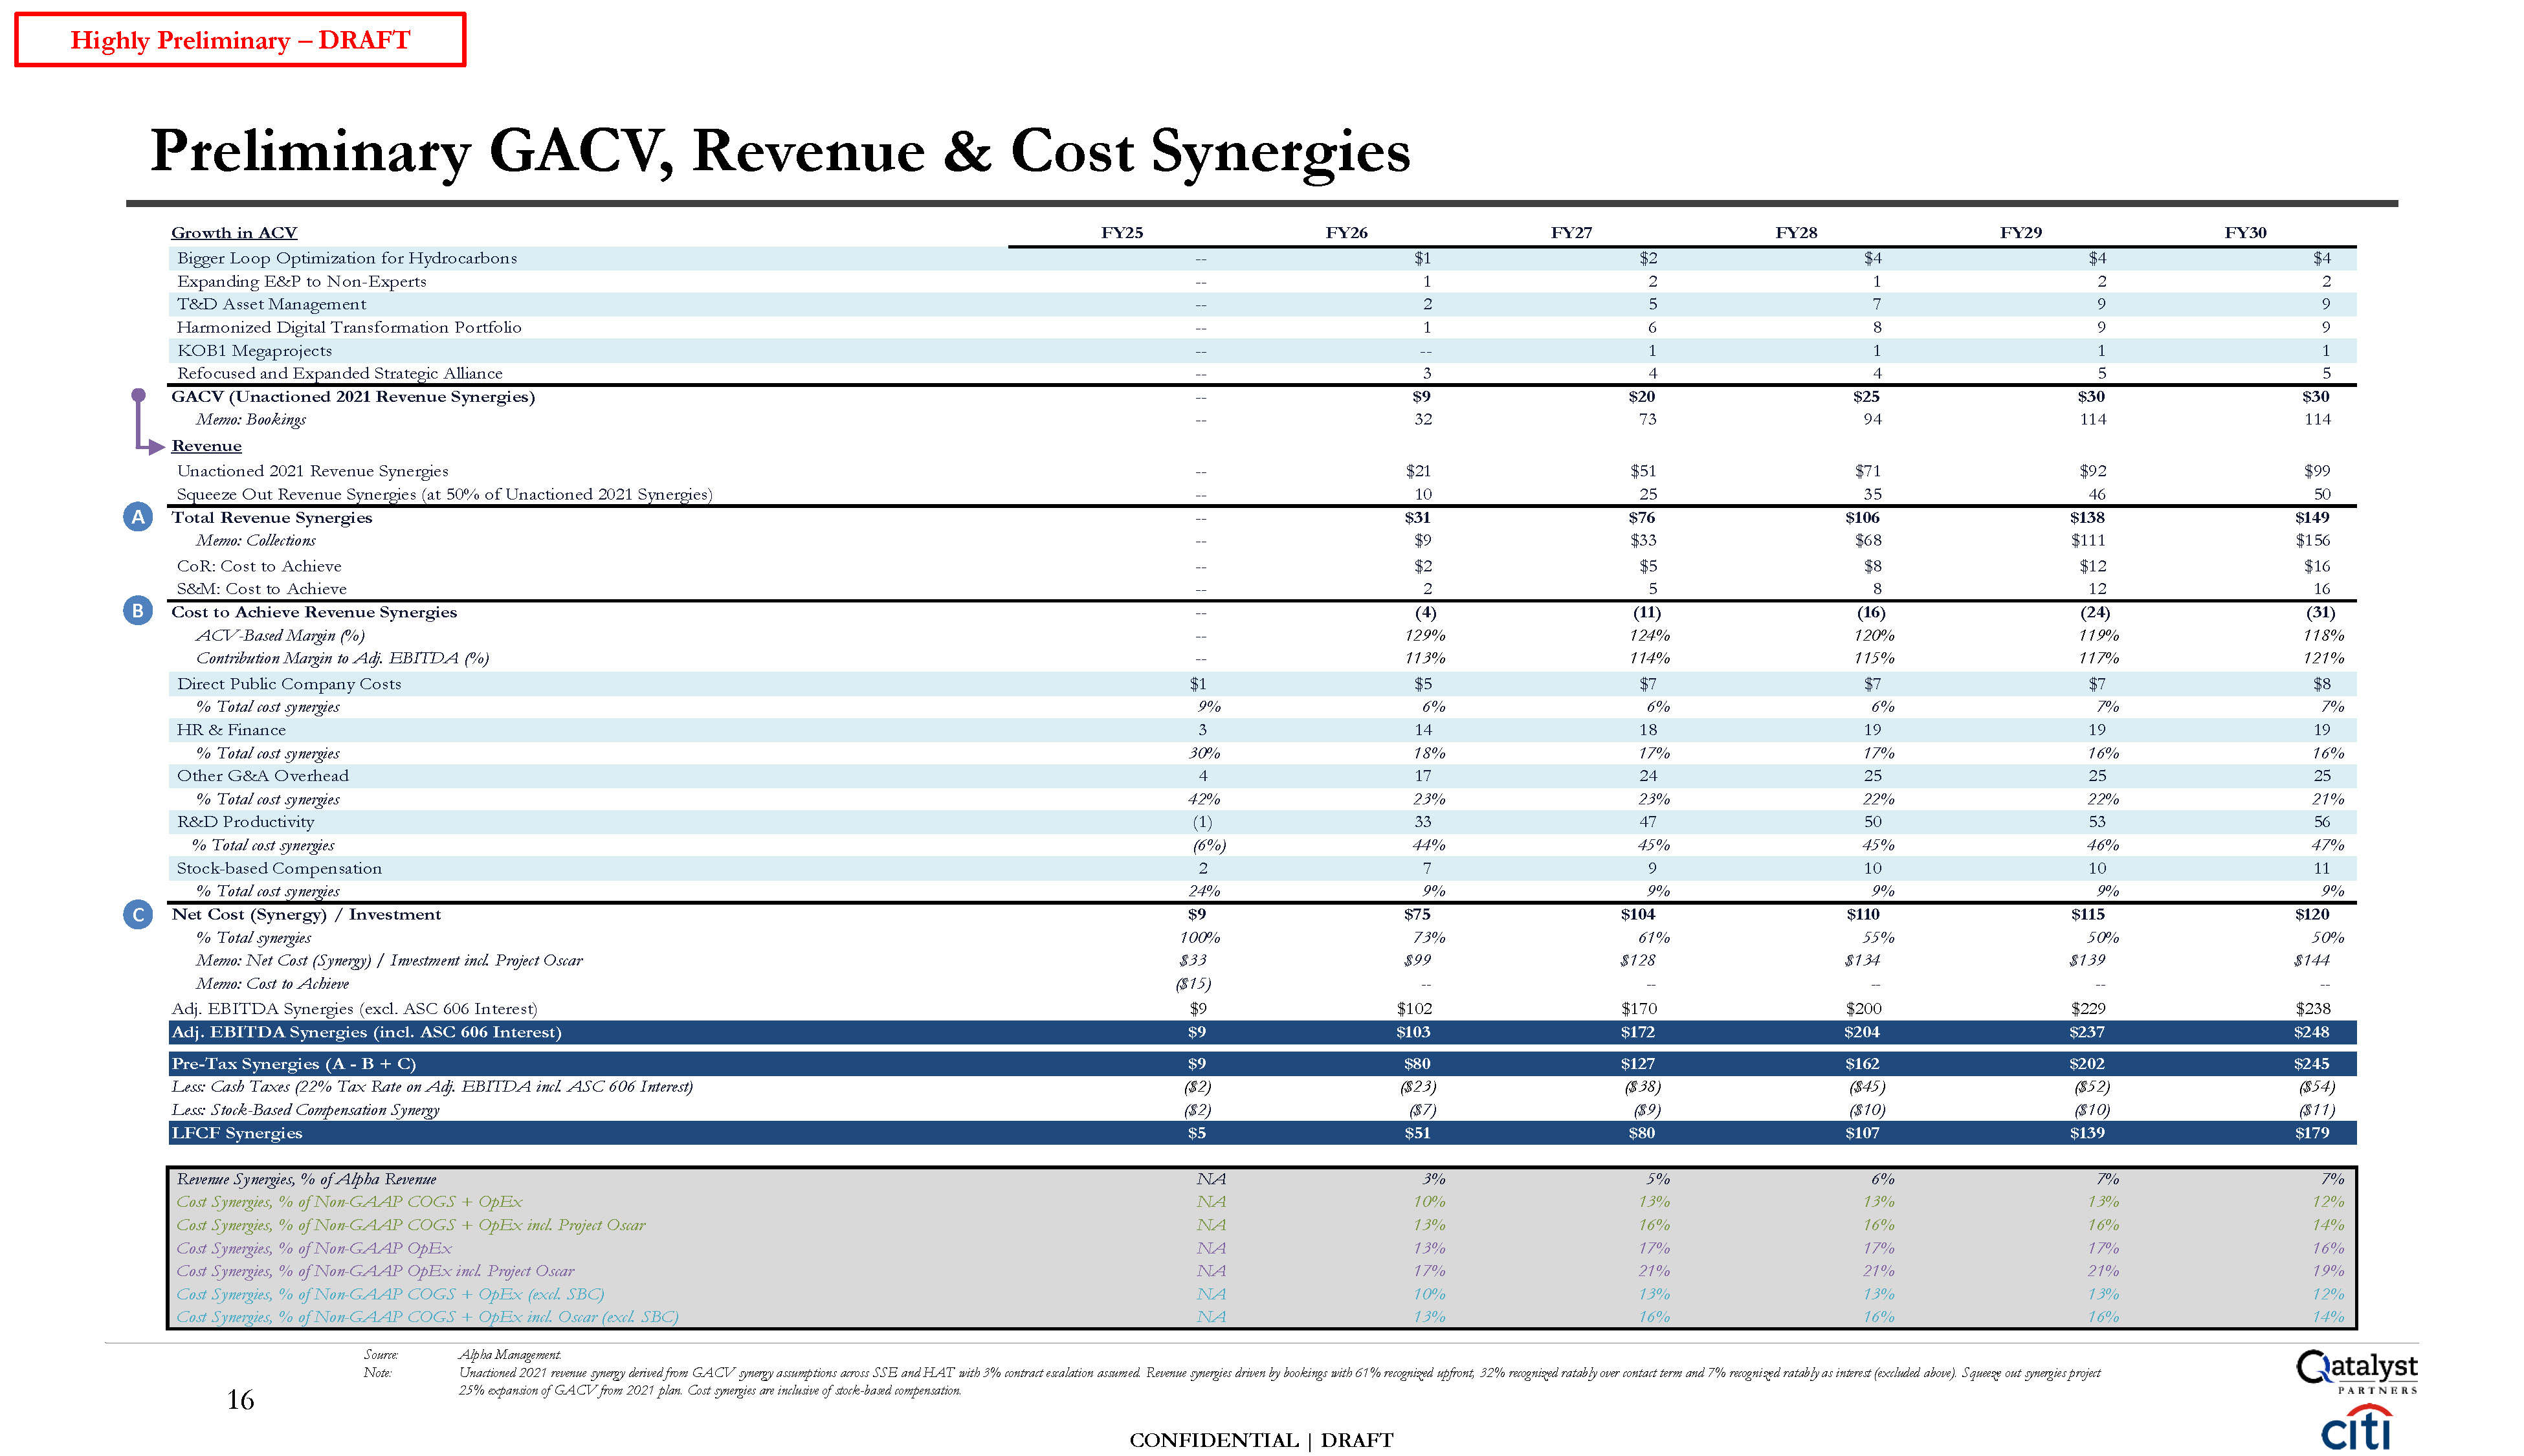
CONFIDENTIAL | DRAFT 16 Preliminary GACV, Revenue & Cost Synergies Source:
Note: Alpha Management. Unactioned 2021 revenue synergy derived from GACV synergy assumptions across SSE and HAT with 3% contract escalation assumed. Revenue synergies driven by bookings with 61% recognized upfront, 32% recognized ratably
over contact term and 7% recognized ratably as interest (excluded above). Squeeze out synergies project 25% expansion of GACV from 2021 plan. Cost synergies are inclusive of stock-based compensation. Highly Preliminary – DRAFT Growth in
ACV FY25 FY26 FY27 FY28 FY29 FY30 Bigger Loop Optimization for Hydrocarbons -- $1 $2 $4 $4 $4 Expanding E&P to Non-Experts -- 1 2 1 2 2 T&D Asset Management -- 2 5 7 9 9 Harmonized Digital Transformation
Portfolio -- 1 6 8 9 9 KOB1 Megaprojects -- -- 1 1 1 1 Refocused and Expanded Strategic Alliance -- 3 4 4 5 5 GACV (Unactioned 2021 Revenue Synergies) -- $9 $20 $25 $30 $30 Memo:
Bookings -- 32 73 94 114 114 Revenue Unactioned 2021 Revenue Synergies -- $21 $51 $71 $92 $99 Squeeze Out Revenue Synergies (at 50% of Unactioned 2021 Synergies) -- 10 25 35 46 50 A Total Revenue
Synergies -- $31 $76 $106 $138 $149 Memo: Collections -- $9 $33 $68 $111 $156 CoR: Cost to Achieve -- $2 $5 $8 $12 $16 S&M: Cost to Achieve -- 2 5 8 12 16 B Cost to Achieve Revenue
Synergies -- (4) (11) (16) (24) (31) ACV-Based Margin (%) -- 129% 124% 120% 119% 118% Contribution Margin to Adj. EBITDA (%) -- 113% 114% 115% 117% 121% Direct Public Company Costs $1 $5 $7 $7 $7 $8 % Total cost
synergies 9% 6% 6% 6% 7% 7% HR & Finance 3 14 18 19 19 19 % Total cost synergies 30% 18% 17% 17% 16% 16% Other G&A Overhead 4 17 24 25 25 25 % Total cost synergies 42% 23% 23% 22% 22% 21% R&D
Productivity (1) 33 47 50 53 56 % Total cost synergies (6%) 44% 45% 45% 46% 47% Stock-based Compensation 2 7 9 10 10 11 % Total cost synergies 24% 9% 9% 9% 9% 9% C Net Cost (Synergy) /
Investment $9 $75 $104 $110 $115 $120 % Total synergies 100% 73% 61% 55% 50% 50% Memo: Net Cost (Synergy) / Investment incl. Project Oscar $33 $99 $128 $134 $139 $144 Memo: Cost to Achieve ($15) -- -- -- -- -- Adj.
EBITDA Synergies (excl. ASC 606 Interest) $9 $102 $170 $200 $229 $238 Adj. EBITDA Synergies (incl. ASC 606 Interest) $9 $103 $172 $204 $237 $248 Pre-Tax Synergies (A - B + C) $9 $80 $127 $162 $202 $245 Less: Cash Taxes (22%
Tax Rate on Adj. EBITDA incl. ASC 606 Interest) ($2) ($23) ($38) ($45) ($52) ($54) Less: Stock-Based Compensation Synergy ($2) ($7) ($9) ($10) ($10) ($11) LFCF Synergies $5 $51 $80 $107 $139 $179 Revenue Synergies, % of
Alpha Revenue NA 3% 5% 6% 7% 7% Cost Synergies, % of Non-GAAP COGS + OpEx NA 10% 13% 13% 13% 12% Cost Synergies, % of Non-GAAP COGS + OpEx incl. Project Oscar NA 13% 16% 16% 16% 14% Cost Synergies, % of Non-GAAP
OpEx NA 13% 17% 17% 17% 16% Cost Synergies, % of Non-GAAP OpEx incl. Project Oscar NA 17% 21% 21% 21% 19% Cost Synergies, % of Non-GAAP COGS + OpEx (excl. SBC) NA 10% 13% 13% 13% 12% Cost Synergies, % of Non-GAAP COGS +
OpEx incl. Oscar (excl. SBC) NA 13% 16% 16% 16% 14%
These materials have been prepared by Qatalyst Partners LP (including any
affiliates “Qatalyst”) for the Qatalyst client or potential client to whom such materials are directly addressed and delivered or a special committee of the Board of Directors thereof (the “Company”) in connection with an actual or potential
mandate or engagement and may not be used or relied upon for any purpose other than as specifically contemplated by a written agreement with Qatalyst. These materials are based on information provided by or on behalf of the Company and/or other
potential transaction participants, from public sources or otherwise reviewed by Qatalyst. Qatalyst assumes no responsibility for independent investigation or verification of such information and has relied on such information being complete
and accurate in all respects. To the extent such information includes estimates and forecasts of future financial performance (including estimates of potential cost savings and synergies) prepared by or reviewed with the managements of the
Company and/or other potential transaction participants or obtained from public sources, Qatalyst has assumed that such estimates and forecasts have been reasonably prepared on bases reflecting the best currently available estimates and
judgments of such managements (or, with respect to estimates and forecasts obtained from public sources, represent reasonable estimates). No representation or warranty, express or implied, is made as to the accuracy or completeness of such
information and nothing contained herein is, or shall be relied upon as, a representation, whether as to the past, the present or the future. These materials were designed for use by specific persons familiar with the business and affairs of
the Company and are being furnished and should be considered only in connection with other information, oral or written, being provided by Qatalyst in connection herewith. These materials are not intended to provide the sole basis for
evaluating, and should not be considered a recommendation with respect to, any transaction or other matter. Prior to entering into any transaction the Company should determine, without reliance on Qatalyst, the economic risks and merits as well
as the legal, tax and accounting characterizations and consequences of any such transaction. In this regard, by accepting this presentation, the Company acknowledges that (a) Qatalyst is not in the business of providing (and the Company is not
relying on Qatalyst for) legal, tax or accounting advice, (b) there may be legal, tax or accounting risks associated with any transaction, (c) the Company should receive (and rely on) separate and qualified legal, tax and accounting advice and
(d) the Company should apprise senior management as to such legal, tax and accounting advice (and any risks associated with any transaction) and Qatalyst’s disclaimer as to these matters. Qatalyst does not provide tax advice. Accordingly, any
statements contained herein as to tax matters were neither written nor intended by Qatalyst to be used and cannot be used by any taxpayer for the purpose of avoiding tax penalties that may be imposed on such taxpayer. Any discussion of tax
matters in these materials may have been written in connection with the “promotion” or “marketing” of any transaction contemplated hereby. Accordingly, any taxpayer should seek advice based on such taxpayer’s particular circumstances from an
independent tax advisor. These materials do not constitute an offer or solicitation to sell or purchase any securities and are not a commitment by Qatalyst to provide or arrange any financing for any transaction or to purchase any security in
connection therewith. Qatalyst is not acting in any other capacity as a fiduciary to the Company. Qatalyst assumes no obligation to update or otherwise revise these materials. These materials have not been prepared with a view toward public
disclosure under state or federal securities laws or otherwise, are intended for the benefit and use of the Company, and may not be reproduced, disseminated, quoted, summarized or referred to, in whole or in part, without the prior written
consent of Qatalyst. These materials may not reflect information known to other professionals in other business areas of Qatalyst. Qatalyst is a full service securities firm providing investment banking and other services and products to a
wide range of corporations and individuals, domestically and offshore, from which conflicting interests or duties may arise. In the ordinary course of these activities, Qatalyst may at any time hold long or short positions, and may trade or
otherwise effect transactions, for their own account or the accounts of customers, in debt or equity securities or loans of the Company, potential counterparties, or any other company that may be involved in a transaction. Qatalyst is required
to obtain, verify and record certain information that identifies each entity that enters into a formal business relationship with it, which information includes the complete name and address and taxpayer ID number. Qatalyst may also request
corporate formation documents, or other forms of identification, to verify information provided. CONFIDENTIAL | DRAFT Disclaimer
The preceding pages contain material provided to the Special Committee of the
Board of Directors of Alpha (the “Company”) by Citigroup Global Markets Inc. (“Citi”) in connection with the proposed transaction involving the Company and Echo. The accompanying material was compiled or prepared on a confidential basis
solely for the use of the Special Committee of the Board of Directors of the Company and not with a view toward public disclosure under any securities laws or otherwise. The information contained in the accompanying material was obtained from
the Company and other sources. Any estimates and projections contained herein have been prepared or adopted by management of the Company, obtained from public sources, or are based upon such estimates and projections, and involve numerous and
significant subjective determinations, and there is no assurance that such estimates and projections will be realized. Citi does not take responsibility for such estimates and projections, or the basis on which they were prepared. No
representation or warranty, express or implied, is made as to the accuracy or completeness of such information and nothing contained herein is, or shall be relied upon as, a representation, whether as to the past, the present or the future. In
preparing the accompanying material, Citi assumed and relied, without independent verification, upon the accuracy and completeness of all financial and other information and data publicly available or provided to or otherwise reviewed by or
discussed with Citi and upon the assurances of the management of the Company, that they are not aware of any relevant information that has been omitted or that remains undisclosed to Citi. The accompanying material was not prepared for use by
readers not as familiar with the Company and Echo as the Special Committee of the Board of Directors of the Company and, accordingly, neither the Company nor Citi nor their respective legal or financial advisors or accountants take any
responsibility for the accompanying material if used by persons other than the Special Committee of the Board of Directors of the Company. The accompanying material is necessarily based upon information available to Citi, and financial, stock
market and other conditions and circumstances existing and disclosed to Citi, as of the date of the accompanying material. Citi does not have any obligation to update or otherwise revise the accompanying material. Nothing contained herein shall
be construed as legal, tax or accounting advice. CONFIDENTIAL | DRAFT Disclaimer