Exhibit 15.1
TECHNICAL REPORT SUMMARY FOR TITAN PROJECT
Statement of Use and Preparation
This Technical Report Summary (TRS) serves as an amendment to a previously filed TRS, maintains an effective date of June 30, 2022 with regards to assumptions and
the knowledge of Competent/Qualified Persons (QPs), and was prepared for the sole use of IperionX Limited (IPX) and its affiliated and subsidiary companies and advisors. Copies or references to information in this report may not be used without
the written permission of IPX.
This report is intended to provide sufficient information in a single document to support the disclosure of a statement of heavy mineral sand mineral resources by
IPX, as defined under the United States Securities and Exchange Commission (SEC) Regulation S-K 1300 Modernization of Property Disclosures, as well as under the Australasian Code for Reporting of Exploration Results, Mineral Resources and Ore
Reserves (JORC Code), through the consideration of geological, mining, environmental, and other factors, and ultimately to contribute to revenues and profits in a hypothetical business plan. Certain information set forth in this report contains
“forward-looking information”, including mineral resource estimates, operating cost estimates, capital cost estimates, sales prices, and other assumptions. These statements are not guarantees of future performance and undue reliance should not
be placed on them. The assumptions used to develop the forward-looking information and the risks that could cause the actual results to differ materially are detailed in the body of this report.
By definition, “indicated” and “inferred” terminology carries a lower level of geological and engineering confidence than that which would be reflected through the
derivation of “measured” resources. Indicated definitions provide a confidence level to support broad estimates of Mineral Resource quantity and grade adequate for long-term mine planning to support Probable Reserve definitions, Resource and
reserve estimations, and their impacts on production schedules, processing recoveries, saleable product tonnages, costs, revenues, profits, and other results presented in this TRS align with the definition and accuracy of indicated resources and
probable reserves. Through future exploration campaigns, geological and engineering studies, IPX desires to elevate classifications of resources in due time.
The statement is based on information provided by IPX and reviewed by various professionals and Competent/Qualified Persons from Primero Group Americas Inc. and
Karst Geo Solutions.
Competent/Qualified professionals who contributed to the drafting of this report meet the definition of Qualified Persons (QPs), consistent with the requirements of
the SEC. The information in this TRS related to ore resources and mineral reserves is based on, and fairly represents, information compiled by the QPs as of the effective date of the report.
Page 1
TECHNICAL REPORT SUMMARY
FOR TITAN PROJECT
FOR TITAN PROJECT
Description of “Amended” Technical Report Summary
This Technical Report Summary (TRS), dated May 30, 2023, serves as an amendment to a TRS filed on August 26, 2022, effective June 30, 2022, following IperionX Limited (IPX)’s receipt of comment letters and associated dialogue with the United States Securities and Exchange Commission (SEC). While this Amended TRS incorporates changes to the original version, it maintains an effective date of June 30, 2022 with regard to assumptions and the knowledge of the Qualified/Competent
Persons (QPs). Notable revisions and changes to the previously filed TRS include:
|
|
•
|
Includes various additional clarifications as requested by the SEC:
|
|
|
o
|
Revision of the name of the report from “Scoping Study” to “Initial Assessment”.
|
|
o
|
Addition of a map showing the location of material properties containing mineral resources (Section 3.2).
|
|
o
|
Disclosure of individual prices for all of the Rare Earth Elements (REE) that contribute to the REE concentrate price along with the percentage of
each REE found in the typical concentrate sold for the calculation of the estimated breakeven economic cut-off grade of 0.4% THM (Section 11.8).
|
|
o
|
Clarification as to which resources must have reasonable prospects for economic extraction to more clearly align with the mineral resource definition
in Item 1300 of Regulation S-K (Section 11.8).
|
|
o
|
Addition of the final pit outline and (ii) disclosures of the numeric values for the annual Life of Mine (LOM) production for waste material and ore,
along with the associated grades (Sections 13.2 and 13.3).
|
|
o
|
Addition of disclosure of the modified cutoff grade used for the optimized schedule along with the associated parameters and an explanation of how and
when the remaining resources will be mined and processed (Section 13.3).
|
|
o
|
Addition of historical prices, along with spot prices and forecast prices utilized, and addition of tables for (i) historic, spot, and forecast
individual REE prices, (ii) product specification requirements and (iii) key product specifications of Titan-derived rare earth mineral concentrate (Section 16.2).
|
|
o
|
Addition of a subsection including an opinion of the Qualified Person to the adequacy of the current environmental plans to comply with Item
601(b)(96)(iii)(B)(17)(vi) of Regulation S-K (Section 17.1.6).
|
|
o
|
Addition of a detailed life-of-project cash flow analysis, including the corresponding LOM production schedule (tonnage & grade) and a line item
for royalties and a description of the results of the analysis in the accompanying text with equal prominence (Section 19.2).
|
|
o
|
Addition of separate after tax cash flow analysis excluding inferred resources, presented with equal prominence (Section 19.2)
|
Page 2
IPERIONX TITAN PROJECT – INITIAL ASSESSMENT
TECHNICAL REPORT SUMMARY FOR TITAN PROJECT
| Contents |
|
|
|
1.
|
Executive Summary
|
3
|
|
2.
|
Introduction
|
9 |
|
3.
|
Property Description
|
11 |
|
4.
|
Accessibility, Climate, Local Resources, Infrastructure and Physiography
|
14 |
|
5.
|
History
|
16 |
|
6.
|
Geological Setting, Mineralization, and Deposit
|
17 |
|
7.
|
Exploration
|
18 |
|
8.
|
Sample Preparation, Analyses, and Security
|
19 |
|
9.
|
Data Verification
|
21 |
|
10.
|
Mineral Processing and Metallurgical Testing
|
22 |
|
11.
|
Mineral Resource Estimate
|
24 |
|
12.
|
Mineral Reserve Estimate
|
33 |
|
13.
|
Mining Methods
|
34 |
|
14.
|
Processing and Recovery Methods
|
42 |
|
15.
|
Infrastructure
|
47 |
|
16.
|
Market Studies
|
50 |
|
17.
|
Environmental Studies, Permitting, and Plans, Negotiations, or Agreements with Local Individuals or Groups
|
58 |
|
18.
|
Capital and Operating Costs
|
65 |
|
19.
|
Economic Analysis
|
67 |
|
20.
|
Adjacent Properties
|
75 |
|
21.
|
Other Relevant Data and Information
|
76 |
|
22.
|
Interpretation and Conclusions
|
77 |
|
23.
|
Recommendations
|
78 |
|
24.
|
References
|
79 |
|
25.
|
Reliance on Information Provided by the Registrant
|
80 |
Page 3
|
IPERIONX TITAN PROJECT – INITIAL ASSESSMENT
|
DISCLAIMER
The following report was prepared for IperionX by Primero Group Americas Inc. (Primero) as an independent consultant and is part based on information provided by IperionX and part on information not within the
control of either IperionX or Primero. While it is believed that the information, conclusions, and recommendations will be reliable under the conditions and subject to the limitations set forth herein, Primero does not guarantee their accuracy.
The use of this report and the information contained herein shall be at the user’s sole risk, regardless of any fault or negligence of Primero.
USE OF THIS INFORMATION
This document summarizes the scope of works Primero was engaged to undertake as an independent consultant, appointed by IperionX to investigate the requirements associated with establishing the mineral processing of
the Titan Project, along with associated infrastructure in accordance with Primero’s proposals Doc No. 40501-PPL-GE-001_4.
Primero gives its permission to IperionX to use the information if it reflects the findings and understanding that are presented in this report. Use of this document, for whatever purpose, by any third party must
seek written prior approval by Primero.
Primero has relied on other experts for the study portions on mineral resource estimate (Karst Geo Solutions) and metallurgical testing (Mineral Technology). Primero engaged sub-consultants, Palaris for the mining
discipline and Keypoint for the metallurgical test work review and mineral processing method.
Page 4
|
IPERIONX TITAN PROJECT – INITIAL ASSESSMENT
|
| 1. |
Executive Summary
|
IperionX engaged Primero Group Americas Inc. (Primero) to develop a Initial Assessment for the Titan Project near Camden, TN. The Project includes a sand mineral deposit with a nearby Wet Concentrator Plant (WCP)
located approximately at 17 miles northwest from the city of Camden. The Project also includes a dry Mineral Separation Plant (MSP) located approximately 1.2 miles southwest of the city of Camden. The distance separating the two plants is
approximately 19 miles and accessed via public roads and highways. IperionX holds a 100% interest in the Titan Project.
The products of the Titan Project include ilmenite, rutile, premium zircon, zircon concentrate and rare earth concentrate (mainly monazite).
Key production values are presented in Table 1. Note: All references to mass within this report are metric.
Table 1: Titan Project production average values.
|
Production Target
|
Average
Value
|
Units
|
|
|
ROM
|
9.7
|
Mt/y
|
|
|
Ilmenite
|
95,500
|
t/y
|
|
|
Rutile
|
16,700
|
t/y
|
|
|
Monazite
|
4,600
|
t/y
|
|
|
Zircon - Premium
|
22,400
|
t/y
|
|
|
Zircon - Concentrate
|
16,000
|
t/y
|
| 1.1 |
Exploration and Mineral Resource Estimate
|
IperionX engaged Karst Geo Solutions to prepare a Mineral Resource Estimate (MRE) for Total Heavy Minerals (THM), in accordance with the JORC Table 1 requirement. The content in this chapter is extracted from an ASX
release dated 6 October 2021 entitled “Maiden Resource Confirms Tennessee as Major Untapped Critical Mineral Province by IperionX”.
The Mineral Resource is based on 107 drill holes totaling 4,101 m and occupies an area roughly 6.2 km (north) by 3.6 km (east); the Mineral Resource is further broken up into several areas based on land holdings
(land agreements). These range from 0.5 km (north) by 0.9 km (east) for the smallest area to 5.1 km (north) by 3.6 km (east) for the largest area.
The maiden MRE for the Titan Project comprises 431 Mt @ 2.2% THM, containing 9.5 Mt THM at a 0.4% cut-off and includes a high-grade core of 195 Mt @ 3.7% THM, containing 7.1Mt THM at a 2.0% cut-off. Slimes (SL) and
oversize (OS) material accounts for approximately 20% and 2.5% of the in-ground material respectively SL and OS values for the Initial Assessment were derived from the metallurgical bulk sample testwork as it has been identified that the
dry-screening method utilized for the drill samples tends to under-report SL and over-report OS. It should be noted that these discrepancies do not materially impact THM and a revised method (wet screening) for drill samples has been developed and
tested for the Project moving forward in the next phase that will produce more accurate SL and OS values.
There is a high level of confidence associated with the MRE classification, with 56% (241 Mt) classified as being in the Indicated resource category. Mineralization occurs as a single, large, and coherent
near-surface deposit.
Page 5
|
IPERIONX TITAN PROJECT – INITIAL ASSESSMENT
|
Table 2: Mineral Resource Estimate and THM assemblage at 0.4% cut-off grade.
|
THM Assemblage
|
||||||||||
|
Cut off
|
Tons
|
THM %
|
THM
|
Zircon
|
Rutile
|
Ilmenite
|
REE
|
Staurolite
|
||
|
(THM %)
|
(Mt)
|
(%)
|
(Mt)
|
(%)
|
(%)
|
(%)
|
(%)
|
(%)
|
||
|
Indicated
|
0.4
|
241
|
2.2
|
5.3
|
11.3
|
9.3
|
39.7
|
2.1
|
15.6
|
|
|
Inferred
|
0.4
|
190
|
2.2
|
4.2
|
11.7
|
9.7
|
41.2
|
2.2
|
13.7
|
|
|
Total
|
0.4
|
431
|
2.2
|
9.5
|
11.5
|
9.5
|
40.3
|
2.1
|
14.8
|
|
| 1.2 |
Mining Methods
|
IperionX tasked Primero and its sub-consultant Palaris for the mine design, integrating the IperionX provided Project mineral resource block model. Reconciliation of the reported MRE of the resource block model
against the MRE report was achieved and confirmed. IperionX, requested that a high-level trade off study of the mining method be undertaken. The recommendation of using mobile mining units (MMU’s) for the mineral sand and conventional loading and
trucking units for the topsoil, overburden and interburden excavation, transportation and deposition was recommended and accepted. The MMU’s will be owned by the Project owner whereas the conventional loading and trucking activities be made by a
mining contractor.
The basic mining cycle is depicted in Figure 1, which shows the mine cycle from clearing to final condition post mining. The sequential mining method allows for low cost, reduced area footprint and environmentally
logical mining process by limiting the change in final material location with the mineralized material and waste basically being returned to a similar position in the ground strata. This proposed method of mining, and mining cycle, is well proven
in the heavy mineral sands industry, incorporating progressive backfill and rehabilitation to the pre-mining state.
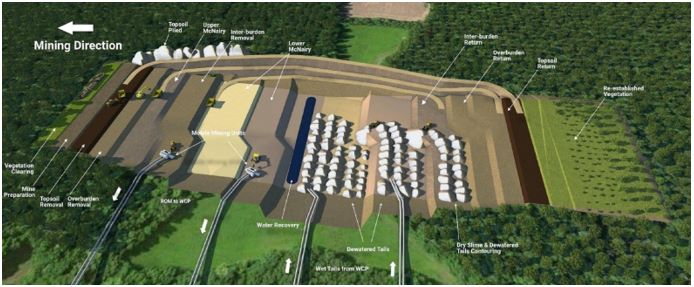
Figure 1: Titan Project mining cycle.
Pit optimizations were completed in order to produce a production schedule on an annual basis. This resulted in a total Production Targets of 243 Mt @ 3.0% THM In-Situ with a mine life of 25 years. The mining
schedule delivers an outcome with the first 14 years mining 100% of indicated mineralized resource only, and the remaining years mining the inferred mineralized resource, resulting in a total mine life of 25 years. The schedule is based on 57% of
the total mine ROM material being in an Indicated category.
Page 6
|
IPERIONX TITAN PROJECT – INITIAL ASSESSMENT
|
Table 3: Mine production schedule with % Indicated category processed by time period.
|
Year
|
ROM Tons
|
Inferred Tons
|
Indicated Tons
|
% Indicated Tons
|
|
(Mt)
|
(Mt)
|
(Mt)
|
(%)
|
|
|
1-14
|
136.5
|
0
|
136.5
|
100%
|
|
15-25
|
106.1
|
105.3
|
0.8
|
1%
|
|
LOM
|
242.6
|
105.3
|
137.3
|
57%
|
| 1.3 |
Mineral Processing and Metallurgical Testing
|
Four bulk samples were processed by Mineral Technologies through pilot equipment designed to emulate a full-scale Feed Preparation Plant (FPP), Wet Concentrator Plant (WCP), Monazite Flotation/Concentrate Upgrade
Plant and a Mineral Separation Plant (MSP). Mineral Technologies is a reputable test laboratory with significant experience in mineral sands flowsheet development.
Assays were conducted by SGS in Lakefield, Canada and Bureau Veritas in Perth, Australia, with XRF, laser ablation / ICPMS and QEMSCAN analytical methods.
The final products and the grades of those final products that were produced form the testwork demonstrated that the Upper and Lower mineralized resource could be separated using processing stages common to most
mineral sands’ operations. Notably, the flotation test work achieved an overall 97% recovery of rare earth minerals in the final rare earth concentrate.
Based on the testwork results, it was concluded that a viable commercial operation could be established with appropriate processing options for a 10 Mtpa operation commencing in Benton area.
| 1.4 |
Processing and Recovery Methods
|
IperionX tasked Primero and its sub-consultant Keypoint for the metallurgical test work review and mineral processing method.
An overview of the major processing stages can be description as follows, please refer to Figure 17 & Figure 18 for simplified flow diagrams.
1. Run of Mine mineralized resource is processed in the Mobile Mining Unit (MMU) which removes trash & oversize. The undersize is pumped to the Feed Preparation Plant (FPP) and Wet Concentrator Plant (WCP)
2. In the FPP, the feed is de-slimed to separate clay and the sand. The slimes are directed to the thickener where they are thickened and then filtered. The sand fed into a constant density tank which is pumped to
the rougher spiral stage at 1,000 tph at the start of the WCP
3. The WCP comprises of multiple stages of spiral separators which produce a tailings and a Heavy Mineral Concentrate (HMC) stream. The WCP tailings stream is dewatered and pumped to the mining void while the HMC (at
a target grade of >85% THM) is dewatered and trucked to the Monazite Separation Plant.
4. The Monazite Separation Plant which consists of a flotation circuit and wet gravity circuits, to produce a monazite product and an upgraded HMC which consists predominantly of the titanium minerals & zircon
minerals. The upgraded HMC is the feedstock for Mineral Separation Plant (MSP).
5. The MSP consists of a dryer, multiple stages of electrostatic separators, magnetic separators and wet gravity separators to produce ilmenite, rutile, premium zircon and zircon concentrate.
Page 7
|
IPERIONX TITAN PROJECT – INITIAL ASSESSMENT
|
| 1.5 |
Capital Cost Estimate
|
Capital Estimates for the mine and process plant have been prepared by Primero Group using a combination of cost estimates from suppliers, historical data, reference to recent comparable projects. Costs are presented
in US$ for Q2 2022 and are exclusive of escalation. The intended accuracy of the initial capital cost estimate for the Project is ± 35%. Table 4 highlights the total estimated capital expenditures for the Project.
Table 4: Titan Project capital cost estimate summary.
|
Capital Cost Estimate Breakdown
|
US$ Million
|
|
|
Mine and Wet Concentration Plant
|
94.6
|
|
|
Mineral Separation Plant
|
22.3
|
|
|
Common Services
|
12.5
|
|
|
Project Indirects
|
35.2
|
|
|
Mobile Mining Units Turnkey
|
23.3
|
|
|
Contingency (30%)
|
49.4
|
|
|
Total Initial Capital
|
237.2
|
|
|
Deferred and sustaining capital
|
198.5
|
| 1.6 |
Operating Cost Estimate
|
The processing plant operating cost estimate is based on a ±35% level of accuracy, utilizing indicative quotations where possible, and otherwise Primero database estimates and recent experience in the industry.
The OPEX is presented in USD and is current for Q1 2022. Table 5 summarizes the estimated operating costs at steady state.
Table 5: Titan Project operating cost estimate summary.
|
Operating Cost Estimate Breakdown
|
Average Annual Cost
(US$
Million/y)
|
US$/t ROM
|
|
|
Mining
|
25.8
|
2.66
|
|
|
Processing
|
28.2
|
2.91
|
|
|
Transport
|
2.1
|
0.22
|
|
|
General & Admin
|
6.9
|
0.71
|
|
|
Royalties
|
4.0
|
0.41
|
|
|
Total Operating Costs
|
67.1
|
6.91
|
| 1.7 |
Economic Analysis
|
A detailed financial model and discounted yearly cash flow (DCF) has been developed to complete the economic assessment of the Project and is based on current (Q1 2022) price projections and cost estimates in U.S.
dollars. No provision was made for the effects of future inflation, but cost estimates incorporate recent 2021 inflationary price increases. The evaluation was carried out on a 100%-equity basis using an 8% discount factor. Current US federal and
Tennessee state tax regulations were applied to assess the corporate tax liabilities.
Page 8
|
IPERIONX TITAN PROJECT – INITIAL ASSESSMENT
|
Table 6: Titan Project economic measures summary
|
Economic Measures Summary (After Tax)
|
Value
|
|
|
Annual EBITDA (first five years)
|
$118M
|
|
|
Project NPV (discounted at 8.0%)
|
$692M
|
|
|
Internal rate of return (IRR)
|
40%
|
|
|
Payback period (from start of operations)
|
1.9 y
|
| 1.8 |
Interpretation and Conclusions
|
The QPs are confident in the technical and economic assessment presented in this TRS.
The QPs also recognize that the results of this TRS are subject to many risks including, but not limited to: commodity prices, unanticipated inflation of capital or operating costs, geological uncertainty and
geotechnical and hydrologic assumptions.
The Initial Assessment update highlights several advantages which include:
| • |
Low complexity mining practices can be employed utilizing local service providers.
|
| • |
Mining footprint can be controlled to limit environmental and social impacts.
|
| • |
Mining approach presented returns land mass to pre-mining conditions as minimum.
|
| • |
Signed Memorandum of Understanding (MOU) for rare earth concentrate and titanium minerals (rutile and ilmenite) and zircon products.
|
| • |
Shipping advantage, given that a large proportion of the rare earth concentrate and titanium (rutile and ilmenite) products are anticipated to be sold within the U.S.
|
| • |
Exposure to high-demand, future-facing commodities experiencing increasing commodity prices.
|
| • |
The net present value of the 25-year based project is $692M at an 8% discount rate and after tax.
|
| • |
The internal rate of return (IRR) is 40%.
|
At the time of publication of this Initial Assessment report a preliminary feasibility study is planned to be completed.
| 1.9 |
Recommendations
|
The Initial Assessment demonstrates the Titan Project’s importance as a leading U.S. critical mineral project, and puts IperionX in a strong position to rapidly advance next steps in the development process,
including:
| • |
Continued exploration and expansion of the Company’s land position;
|
| • |
Advancing project permitting and development approvals;
|
| • |
Commencement of a pre-feasibility study to optimize mine and process design;
|
| • |
Performing feasibility study level flowsheet development test work (ongoing);
|
| • |
Develop a Mineral Demonstration Facility on site (completed desliming, planning wet concentration and mineral separation stages.)
|
Page 9
| • |
Investigation of product upgrading and downstream processing;
|
| • |
Undertaking a lifecycle analysis for the Company’s mineral and metal projects and operations;
|
| • |
Continue implementation of sustainable operating and rehabilitation practices with UTIA;
|
| • |
Continued stakeholder awareness and engagement; and
|
| • |
Formalizing agreements with a number of prospective strategic, technical and offtake partners.
|
Page 10
|
IPERIONX TITAN PROJECT – INITIAL ASSESSMENT
|
| 2. |
Introduction
|
IperionX’s mission is to be the leading developer of low-to-zero carbon, sustainable, critical material supply chains for advanced American industries including space, aerospace, electric vehicles and 3D printing.
The Company holds a 100% interest in the Titan Project, comprised of approximately 11,071 acres of surface and associated mineral rights in Tennessee prospective for heavy mineral sands (HMS), rich in minerals
critical to the U.S., including titanium, rare earth minerals, high grade silica sand and zircon in Tennessee, U.S. The Titan Project is strategically located proximal to the town of Camden in the southeast of the U.S., with low-cost road, rail and
water logistics connecting it to world class manufacturing industries and customers.
The Initial Assessment has confirmed that the Titan Project is one of the largest and most important critical mineral deposits in the U.S., with a high in-situ value underpinned by a product assemblage of high value
zircon, titanium minerals and heavy and light rare earth elements.
This Initial Assessment combines information and assumptions provided by a range of independent and reputable consultants, including the following consultants who have contributed to key components of the Study.
Table 7: Initial Assessment consultants & inputs.
|
Scope of Work
|
Consultant / Basis of Estimate
|
|
|
Mine design, process design, capex & opex, financial analysis
|
Primero and its sub-consultants
|
|
|
Mineral Resource Estimate
|
Karst Geo Solutions
|
|
|
Metallurgical testwork and analysis
|
Mineral Technologies & SGS
|
|
|
Pricing – Titanium feedstock and zircon products
|
TZMI
|
|
|
Pricing – Rare earth concentrates
|
Adamas Intelligence
|
|
|
Permitting
|
HDR
|
|
|
Rehabilitation program
|
University of Tennessee
|
|
|
ESG assessment and integration
|
PGS Consults
|
| 2.1 |
Registrant and Terms of Reference
|
This report was prepared for the sole use of IperionX and its affiliated and subsidiary companies and advisors. The report is intended to provide sufficient information in a single document to support the disclosure
of a statement of heavy mineral sand Mineral Resources by the Company, as defined under the United States Securities and Exchange Commission (SEC) Regulation S-K 1300 Modernization of Property Disclosures, as well as under the Australasian Code for
Reporting of Exploration Results, Mineral Resources and Ore Reserves (JORC Code).
All units of measurement used in this report are International System of Units (SI) metric unless otherwise stated. Heavy mineral sand resources are reported in metric tons.
| 2.2 |
Information Sources
|
This document summarizes the scope of works Primero was engaged to undertake as an independent consultant, appointed by IperionX to investigate the requirements associated with establishing the mineral processing of
the Titan Heavy Mineral Sands Project, along with associated infrastructure in accordance with Primero’s proposals Doc No. 40501-PPL-GE-001_4.
Primero has relied on other experts for the study portions on mineral resource estimate (Karst Geo Solutions) and metallurgical testing (Mineral Technology). Primero engaged sub-consultants, Palaris for the mining
discipline and Keypoint for the metallurgical test work review and mineral processing method.
Page 11
|
IPERIONX TITAN PROJECT – INITIAL ASSESSMENT
|
| 2.3 |
Personal Inspections
|
Adam Karst P.G., CP & QP for mineral resource estimate, has made several inspections of the site from October 2020 to May 2022 to review the drilling methods, sample collection, bulk sample collection, bulk
processing and QAQC procedures.
| 2.4 |
Previously Filed Technical Report Summary
|
No previous Technical Report Summaries have been filed.
| 2.5 |
Abbreviations, Acronyms and Units of Measure
|
Table 8: Abbreviations, acronyms and units of measure.
|
Symbol
|
Description
|
||
|
B
|
Billion
|
||
|
CAPEX
|
Capital Expenditure
|
||
|
COG
|
Cut Off Grade
|
||
|
EBITDA
|
Earnings Before Interest, Taxes, Depreciation and Amortization
|
||
|
EBT
|
Earnings Before Taxes
|
||
|
FEED
|
Front End Engineering Detail
|
||
|
HMC
|
Heavy Mineral Concentrate
|
||
|
HMS
|
Heavy Mineral Sand
|
||
|
HTR
|
Electrostatic High Tension Roll Separator
|
||
|
IA
|
Initial Assessment | ||
|
IRR
|
Internal Rate of Return
|
||
|
M
|
Million
|
||
|
MMU
|
Mobile Mining Unit
|
||
|
MSP
|
Mineral Separation Plant
|
||
|
MRE
|
Mineral Resource Estimate
|
||
|
Mtpy
|
Million tons (metric) per year
|
||
|
NPAT
|
Net Profit After Tax
|
||
|
NPI
|
Non-Process Infrastructure
|
||
|
NPV
|
Net Present Value
|
||
|
OPEX
|
Operational Expenditure
|
||
|
PFDs
|
Process Flow Diagrams
|
||
|
PFS
|
Pre-feasibility Study
|
||
|
Primero
|
Primero Group
|
||
|
RED
|
Rare Earth Drum
|
||
|
REE
|
Rare Earth Element
|
||
|
RER
|
Rare Earth Rolls
|
||
|
RHF
|
Rougher Head Feed
|
||
|
ROM
|
Run of Mine
|
||
|
SL
|
Slimes
|
||
|
SMP
|
Structural Mechanical and Piping
|
||
|
$
|
United States Dollars
|
||
|
WCP
|
Wet Concentrator Plant
|
Page 12
|
IPERIONX TITAN PROJECT – INITIAL ASSESSMENT
|
| 3. |
Property Description
|
| 3.1 |
Location
|
IperionX’s Titan Project is located near Camden, Tennessee, U.S., approximately 80 miles west of Nashville, Tennessee and approximately 7 miles northwest of Camden, Tennessee.
The Property is centered at approximately 36.14734997015158N, -88.20974639890532W. The Project is location on the Mansfield, Manleyville, Vale and Bruceton United States Geological Survey Quadrangles. The coordinate
system and datum used for modeling is UTMZ16N, NAD83.
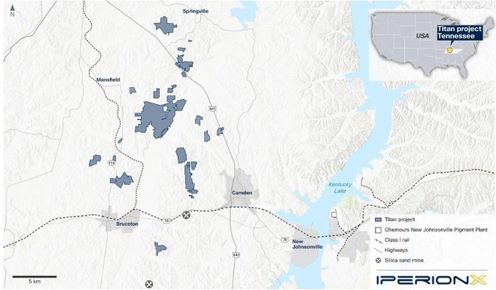
Figure 2: Titan Project location.
| 3.2 |
Titles, Claims or Leases
|
As of March 31, 2022, the Titan Project comprised of approximately 11,071 acres of surface and associated mineral rights in Tennessee within 82 separate property tracts, of which approximately 137 acres are owned
outright, approximately 1,355 acres are subject to exclusive option to purchase agreements, and approximately 9,579 acres are subject to exclusive option to lease agreements.
Our option to lease agreements, upon exercise, allow us to lease the surface property and associated mineral rights from the local landowners, and generally have expiry dates between mid-2026 to late 2027. During the
option period, our option to lease agreements provide for annual option payments and bonus payments during periods when we conduct drilling. Our annual option payments generally range between $25.00 to $75.00 per acre and our drilling bonuses
generally average approximately $1.00 per drill foot. Our obligation to make annual option payments and drilling bonus payments cease if we exercise our option to lease. Upon exercise, in the case of an option to lease, we will pay an annual
minimum royalty, generally $75 per acre, and a mining royalty, generally 5% of net revenues from products sold.
Page 13
|
IPERIONX TITAN PROJECT – INITIAL ASSESSMENT
|
Our option to purchase agreements, upon exercise, allow us to purchase outright the surface property and associated mineral rights from the local landowners, and generally have expiry dates between mid-2022 to
late-2023. During the option period, our option to purchase agreements provide for annual option payments and bonus payments during periods when we conduct drilling. Our annual option payments generally range between $25.00 to $50.00 per acre and
our drilling bonuses generally average approximately $1.00 per drill foot. Our obligation to make annual option payments and drilling bonus payments cease if we exercise our option to purchase. Upon exercise, in the case of a purchase, we will pay
cash consideration approximating the fair market value of the property, excluding the value of any minerals, plus a premium.
Page 14
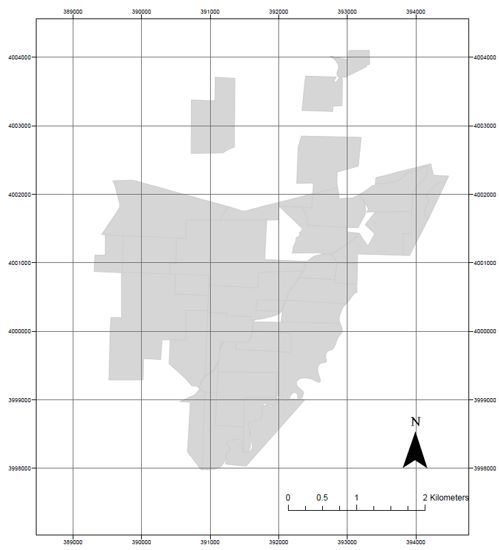
Figure 3: Titan Project location of material properties containing mineral resources (the coordinate system and datum used for modeling is UTMZ16N, NAD83)
| 3.3 |
Mineral Rights
|
IperionX provided maps to KGS of properties where IperionX controls the mineral right through Option to Purchase agreements, Option to Lease agreements or owning the land. KGS has no knowledge of the mineral rights
and or related to these properties nor does KGS possess knowledge of any previous or current boundary disputes or other concerns that would affect any future mining or processing operations.
| 3.4 |
Encumbrances
|
No Title Encumbrances are known.
| 3.5 |
Other Risks
|
All property deeds and titles are reviewed by IperionX’s legal team, no properties showed risks.
Page 15
|
IPERIONX TITAN PROJECT – INITIAL ASSESSMENT
|
| 4. |
Accessibility, Climate, Local Resources, Infrastructure and Physiography
|
| 4.1 |
Topography, Elevation and Vegetation
|
The Project area is located in the eastern portion of the United States and contains gently rolling topography with drainages (wetlands) dissecting the Project area. Surface elevations at the Project range from
approximately 175m above sea level in the upland regions and approximately 100m at the stream level.
| 4.2 |
Access and Transport
|
General access to the Project is via a well-developed network of primary and secondary roads. Interstate I-40 lies 22 miles to the south of the Project and provides access to Nashville International Airport
approximately 85 miles to the east.
| 4.3 |
Climate and Length of Operating Season
|
The Climate is temperate with warm summers and cold winters including the potential for snow/ice; this area will support year-round mining operations. Annual rainfall for the area is 53.8 inches. Land tracts within
the Project area are primarily used for agriculture with some timbered tracts.
| 4.4 |
Infrastructure
|
The Project area is located near the towns of Camden and Paris, Tennessee with proximity to abundant infrastructure and labor. The existing infrastructure includes power and gas, with high-capacity transmission lines
near the Project area, abundant transportation infrastructure including the Norfolk Southern mainline running through Camden, the major I-40 highway just 10 miles south of Camden and a major barge-loading point 15 miles from the Titan Project
connecting to all major U.S. customers and export ports. There are two international airports at Memphis and Nashville. Potential water sources include nearby surface water bodies but will likely involve shallow groundwater.
| 4.5 |
Location
|
IperionX’s Titan Project is strategically located near Camden, Tennessee, and will benefit from significant cost advantages due to the location and proximity to low cost, world-class infrastructure.
95,000 miles of highway, including 8 interstate highways, put Tennessee within a day’s drive of a majority of U.S. consumer markets. Tennessee is the third largest rail center in the U.S. and there are more than
1,000 miles of navigable waterways which access all other major waterways in the eastern U.S. There are over four commercial airports near Camden, including two international airports at Memphis and Nashville.
This world class infrastructure is expected to provide material cost and logistics advantages compared to projects located in more remote areas. The existing infrastructure includes low-cost power and gas, with
high-capacity transmission lines near the Project, abundant transportation infrastructure including the Norfolk Southern mainline running through Camden, the major I-40 highway just 10 miles south of Camden and a major barge-loading point 15 miles
from the Titan Project connecting to all major U.S. customers and export ports.
Page 16
|
IPERIONX TITAN PROJECT – INITIAL ASSESSMENT
|
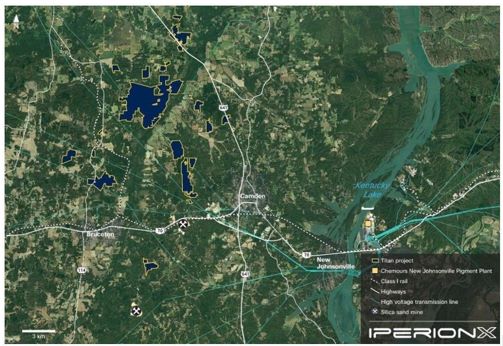
Figure 4: Titan Project location and access to major rail, barge and port infrastructure.
Page 17
|
IPERIONX TITAN PROJECT – INITIAL ASSESSMENT
|
| 5. |
History
|
| 5.1 |
Previous Heavy Mineral Sand Mining in the Region
|
No previous heavy mineral sand mining has occurred in the region.
| 5.2 |
Previous Exploration
|
This area has been explored for HMS since the 1950s as the McNairy Sand was known to contain high concentrations of economic heavy minerals based on work by federal and state agencies. DuPont, Kerr-McGee, RGC,
Iluka, Altair, and Astron are known to have evaluated the McNairy deposits in the Project area at various times; however, there has been no known heavy mineral production from the McNairy Sand in Tennessee.
Page 18
|
IPERIONX TITAN PROJECT – INITIAL ASSESSMENT
|
| 6. |
Geological Setting, Mineralization, and Deposit
|
| 6.1 |
Regional, Local and Property Geology
|
The Titan Project’s location in western Tennessee represents the eastern flank of the Mississippi Embayment, a large, southward plunging syncline within the Gulf Coastal Plain. This feature extends from southern
Illinois to the north and to Mississippi and Alabama to the south. The embayment is filled with sediments and sedimentary rocks of Cretaceous to Quaternary age.
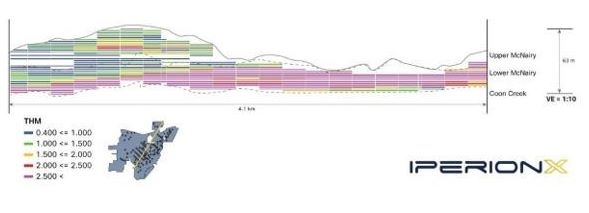
The McNairy Sand Formation represents a pro-grading deltaic environment during a regressive marine sequence. This is evidenced by the coarsening upward sequence grading from the glauconitic clay rich Coon Creek
Formation to the fine lower member of the McNairy Formation to the coarser upper member of the McNairy Formation.
The main mineralized zone at the Project is hosted stratigraphically in the lower member of the McNairy Formation, the McNairy Formation dips gently into the west in the Project area. Mineralization averages 31
meters thick and has been traced, to date, for 6.2 kilometers along strike. The upper zone is also mineralized in some areas.
| 6.2 |
Deposit Model
|
Exploration of the Project area utilizes the depositional model described in the previous section, sedimentary relationships, topography, and geological unit controls to target areas for evaluation.
Page 19
|
IPERIONX TITAN PROJECT – INITIAL ASSESSMENT
|
| 7. |
Exploration
|
| 7.1 |
Non-Drilling Procedures and Parameters
|
This section is not applicable to this TRS.
| 7.2 |
Drilling Procedures
|
All drilling for the Project has been roto-sonic. This method alternates advancement of a core barrel and a removeable casing (casing is used when needed to maintain sample integrity). The core barrel utilized for
this Project is 4 inches in diameter with a 6 inch diameter outer casing. The core barrel is retrieved from the ground and the samples are recovered directly from the barrel into a plastic sleeve. All holes are drilled vertically. The sonic
drilling method has been shown to provide representative unconsolidated mineral sands samples across a variety of deposits as it is a direct sampling method of the formation(s). At times water is used to create a head on the formation to help
prevent run-up.
A roto-sonic drill rig, the Geoprobe 5140LS, utilized a 10 ft core barrel to obtain direct 5 ft samples of the unconsolidated geological formations hosting the mineralization in the Project area. All holes were
drilled vertically which is essentially perpendicular to the mineralization. The sonic cores were used to produce approximately 2 kg samples for heavy liquid separation as well as further mineralogical analysis. Each core is measured, and the
recovery is calculated as length of recovered core divided by length drilled (typically 10 ft).
The Mineral Resource is based on 107 drill holes totaling 4,101 m, and occupies an area roughly 6.2 km (north) by 3.6 km (east); the Mineral Resource is further broken up into several areas based on land holdings
(land agreements). These range from 0.5 km (north) by 0.9 km (east) for the smallest area to 5.1 km (north) by 3.6 km (east) for the largest area. Figure 8 shows the drilling completed to date plan view, cross section and long section.
| 7.3 |
Hydrology and Hydrogeology
|
HDR is completing the one-year ground water base line study. No other hydrology and hydrogeology study has been completed.
| 7.4 |
Geotechnical Data
|
No geotechnical work has been completed.
Page 20
|
IPERIONX TITAN PROJECT – INITIAL ASSESSMENT
|
| 8. |
Sample Preparation, Analyses, and Security
|
| 8.1 |
Sample Collection and Security
|
Roto-sonic drill core samples, typically 1.5 m in length, are collected directly from the plastic sample sleeve at the drill site. Some interpretation is involved as the material can expand or compact as it is
recovered from the core barrel into the plastic sleeve. Each core is measured, and the recovery is calculated as length of recovered core divided by length drilled (typically 10’). Samples are logged for lithological, geological, and mineralogical
parameters in the field to help aid in determining depositional environment, major geologic units, and mineralized zones. Total depth of the drillhole is recorded as well as any drilling issues/concerns that could impact sample
representativeness. Samples are collected at regular (1.5m) intervals unless the geology/mineralogy warrant altering this as to co-mingle samples across major geological/mineralized boundaries.
All samples are panned and estimates made for the %THM and %SL. Logging is both qualitative (sorting, color, lithology) and quantitative (estimation of %THM, %SL) to help support the integrity of the Exploration
Results and Mineral Resource estimate. Photographs are taken of the sonic cores. All pertinent sample information (geology, sample ID, etc.) are collected on sequentially numbered tag books provided by the laboratory. The tag is inserted into
the sample bag and the information from the tag book is entered nightly into the Project database (GeoSpark).
The unconsolidated sonic cores are sampled by splitting the core in half lengthwise using a machete then recovering an even fillet with a trowel along the entire length of the sample interval. Sample volume is ~2 kg
and is appropriate for the analytical method(s) being used and ensure adequate sample volume is collected. Samples are collected directly to the pre-labeled/pre-tagged sample bags; the remaining sample is further split into a replicate/archival
sample and what remains is used to backfill the drillhole. A chip tray is maintained for each hole to keep a representative sample for each interval for later use during geological interpretation or between holes in the field or if any questions
arise during modelling.
Sample bags are sealed with a zip tie at the drill site, placed in rice bags, and remain in the custody of the field geologist from time of collection until time of delivery to the Project’s temporary storage
location which is a secure third-party storage unit or within a leased barn. A red security tag is used to secure the top of each rice bag and these tags are verified by the lab to guarantee all sample bags are intact.
| 8.2 |
Laboratory Procedures
|
Drill samples are sent to SGS NA facility in Lakefield, ON, Canada. SGS is a qualified third-party laboratory not related to IperionX. Samples are subjected to standard mineral sand industry assay procedures of
size fraction analysis, heavy-liquid separation, and chemical analysis. Samples are dry-screened at 44-micron (325 mesh) for slimes and 595-micron (30 mesh) for oversize. An 85 g aliquot of the -30/+325 sand is then submitted to methylene iodide
diluted with acetone to target specific gravity of 2.95 g/cm3, the greater than 2.95 g/cm3 portion is dried and weighed to calculate the percent heavy minerals. The THM is calculated by adding the percent slimes and oversize to the total.
Composites, based on geological domains, are then submitted for QEMSCAN analysis for mineralogical assemblage data. The mineral species determined from QEMSCAN are further combined and/or divided into groups representing anticipated products based
on metallurgical test work for inclusion in the geologic block model.
| 8.3 |
QA and QC Controls
|
Accuracy monitoring has been achieved through submission of in-house heavy mineral sand standard reference materials (SRM) developed specifically for the Project. A low-grade and a high-grade SRM were produced with
materials (HMs and silica sand) from the Project area to ensure representativeness. Each SRM was analyzed by the Project laboratory to generate a mean and standard deviations. SRMs are inserted at a 2.5% rate (1 every 40 samples). These SRMs are
placed loose in a standard sample bag that is labeled sequentially as to mimic a typical drill sample and passed through the laboratory process “blind”. A record of the SRM inserted and its sample IDs is kept in the Project database so that data
can be matched up and reviewed. Standards were created multiple times during the Project and each time a new dataset was generated to compare against.
Page 21
|
IPERIONX TITAN PROJECT – INITIAL ASSESSMENT
|
A quality control sample failure is any single sample 3 standard deviations from the true value for the comparison for each sample, or two out of three consecutive samples between 2 and 3 standard deviations, on the
same side of the mean value (i.e. both above or both below the mean value). Should the errors for a particular batch exceed these limits, the section of a batch bracketed by the SRM samples (i.e. number samples on either side) are reviewed to
determine if the SRM failures are material to the overall data for that batch or if the laboratory has had any procedural issues that need to be addressed. If necessary, samples are re‐analyzed. Overall, the objective of the quality assurance
program for resource purposes is a pass rate of >95%. A lower pass rate, on the order of 90% is acceptable for exploration purposes. Eleven SRMs (6 high and 5 low grade) were submitted during the drilling campaign for analysis and results were
all within 3 standard deviations of the mean of the SRM.
Sampling precision has been monitored by selecting a sample interval at a 3% rate (3 every 100 samples) and taking a second fillet sample over the same sample interval. These samples are consecutively numbered after
the primary sample and recorded in the sample database as “field duplicates” and the primary sample number recorded. Field duplicates are collected at the rate of approximately 3 in 100 samples and ideally should be collected when sampling
mineralized sonic core intervals containing visible THM (panning). Analytical precision is also be monitored using HLS duplicates that the laboratory produces at a rate of approximately 3 in 100 samples. Data from these two types of duplicate
analyses can be used to constrain sampling variance at different stages of the sampling and preparation process.
Field duplicates should have an average coefficient of variation (CoV) <10%, whereas laboratory duplicates should have an average CoV <5%. For the drilling results reported, 83 field duplicates were submitted
to the laboratory with results showing a CoV of less than 10%.
The use of an 85 g sub-sample for heavy liquid separation (HLS) results in a relative precision of 4% based on repeat analyses of standard reference materials (SRM) at SGS. This sub-sample mass is therefore
appropriate for the grain size being sampled.
Analysis of field duplicates indicates a relative precision of 31, indicating sampling of drill material presents the greatest uncertainty in the sampling procedure.
| 8.4 |
Opinion of Qualified Person
|
The QP is comfortable that the sample preparation, security, and analytical procedures are sufficient to reasonably support the mineral resource estimate in this TRS, in the opinion of the QP.
Page 22
|
IPERIONX TITAN PROJECT – INITIAL ASSESSMENT
|
| 9. |
Data Verification
|
| 9.1 |
Procedures of Qualified Person
|
The QP has conducted several site visits throughout the drilling campaigns and metallurgical test programs. The site visits provided visual confirmation of mineralization, drill hole locations, bulk sample collection
and logging and sampling procedures.
| 9.2 |
Limitations
|
None.
| 9.3 |
Opinion of Qualified Person
|
The QP is comfortable that the data is of a high quality and that no systemic or procedural issues that could impact the exploration results or mineral resource estimate are present that have not been reported in
this TRS.
Page 23
|
IPERIONX TITAN PROJECT – INITIAL ASSESSMENT
|
| 10. |
Mineral Processing and Metallurgical Testing
|
Four bulk samples were processed by Mineral Technologies through pilot equipment designed to emulate a full-scale Feed Preparation Plant (FPP), Wet Concentrator Plant (WCP), Monazite Flotation/Concentrate Upgrade
Plant and a Mineral Separation Plant (MSP). Mineral Technologies is a reputable test laboratory with significant experience in mineral sands flowsheet development. Assays were conducted by SGS in Lakefield, Canada and Bureau Veritas in Perth,
Australia, with XRF, laser ablation / ICPMS and QEMSCAN analytical methods.
The final products and the grades of those final products that were produced form the testwork demonstrated that the Upper and Lower mineralized resource could be separated using processing stages common to most
mineral sands’ operations. Notably, the flotation test work achieved an overall 97% recovery of rare earth minerals in the final rare earth concentrate.
Based on the testwork results, it was concluded that a viable commercial operation could be established with appropriate processing options for a 10 Mtpa operation commencing in Benton area.
An overview of the Benton Upper and Lower and Camden Lower testwork programs are depicted in Figure 5.
Further confirmation test work is planned to proceed during the next phase of the Project development.
The QP of Exploration Results and Mineral Resources is comfortable that the samples are representative of the type and style of mineralization exhibited at the Titan Project, in the opinion of the QP.
The QP of Process Design is comfortable that the analytical procedures and data for the purposes used in this TRS are adequate, in the opinion of the QP.
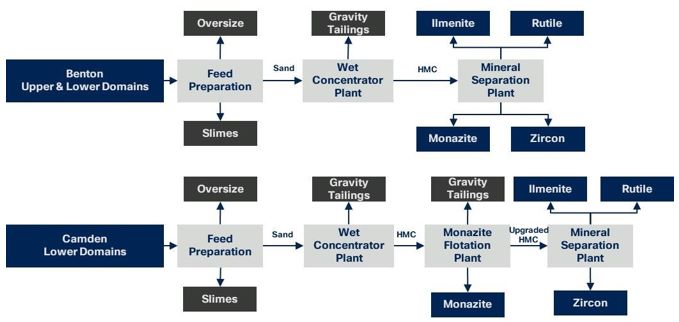
Figure 5: Overview of initial metallurgical testwork program.
Page 24
|
IPERIONX TITAN PROJECT – INITIAL ASSESSMENT
|
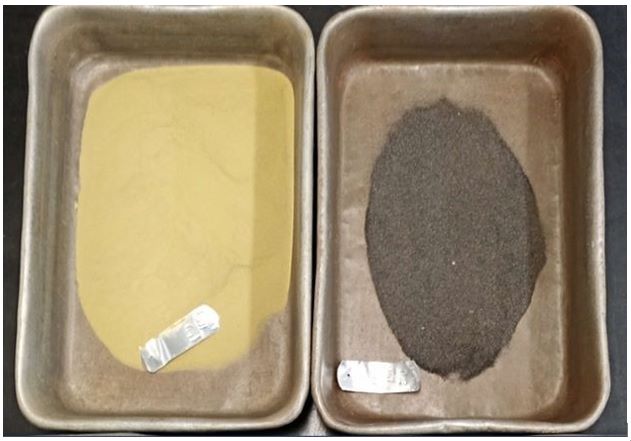
Figure 6: Rare earth (LHS) and heavy mineral concentrate (RHS) streams from wet shaking table tests after flotation.
Page 25
|
IPERIONX TITAN PROJECT – INITIAL ASSESSMENT
|
| 11. |
Mineral Resource Estimate
|
| 11.1 |
Assumptions, Parameters and Methods
|
The Mineral Resource occupies an area roughly 6.2 km (north) by 3.6 km (east); the MRE is further broken up into several areas based on land holdings (land agreements). These range from 0.5 km (north) by 0.9 km
(east) for the smallest area to 5.1 km (north) by 3.6 km (east) for the largest area.
The base of mineralization ranges in RL from 90 m to 110 m above current sea level. Mineralization varies from 6 m to 51 m thick and averages 31 m thick. Mineralization resides primarily in two zones within the
primary McNairy Sand unit. The grade interpolation was carried out using Vulcan software. Grade, slimes, and assemblage estimations were completed using inverse distance cubed (ID3) which is appropriate for this style of mineralization.
No THM top cut has been used or is deemed necessary for this deposit due to the geology, style, and consistency of the mineralization. Drill hole sample data was flagged with domain (zone) codes corresponding to the
geological structure of the deposit and the domains imprinted on the model from 3-dimensional surfaces generated from geological interpretations. A primary search dimension of 212*425*3 m (X*Y*Z) was used for all assay data. Successive search
volume factors of 2 and 4 have been adopted to interpolate grade in areas of lower data density. A parent cell size of 100*200*1.5 m was used. Parent cells are typically centered on the drill holes with a floating cell centered between drill holes
along and across strike. A search orientation of 30 east of north was used to emulate the trend of the mineralization. No consistent plunge is apparent in the mineralization.
The Octant search option was used with minimum of 1 and a maximum of 5 samples per octant and a minimum of 2 octants being estimated to calculate the grade for a block. If the insufficient data was found within the
first search, secondary and tertiary searches were used based on the search volume factors. In addition, a minimum of 2 samples were used from any particular drill hole. Standard mineral sands industry assay procedures (sizing 44-micron [325 mesh]
for slimes and 595-micron [30 mesh] for oversize) heavy-liquid separation of an 85 g split of the -30/+325 sand using methylene iodide. For mineralogy, QEMSCAN analysis was utilized. A total of 107 drill holes for 2,626 THM assay samples (heavy
liquid) and 181 THM and composite mineralogy (QEMSCAN) have been used to inform this MRE.
| 11.2 |
Mineral Resource Estimate
|
The maiden MRE for the Titan Project comprises 431 Mt @ 2.2% THM, containing 9.5 Mt THM at a 0.4% cut-off, and includes a high-grade core of 195 Mt @ 3.7% THM, containing 7.1 Mt THM at a 2.0% cut-off. Slimes and oversize material accounts for approximately 20% and 2.5% of the in-ground material respectively SL and OS values for the Initial Assessment were derived from the metallurgical bulk sample testwork as
it has been identified that the dry-screening method utilized for the drill samples tends to under-report SL and over-report OS. It should be noted that these discrepancies do not materially impact THM and a revised method (wet screening) for
drill samples has been developed and tested for the Project moving forward in the next phase that will produce more accurate SL and OS values. There is a high level of confidence associated with the MRE classification, with 56% (241 Mt) classified
as being in the Indicated resource category. Mineralization occurs as a single, large, and coherent near-surface deposit.
The MRE incorporates results from 107 sonic core drill holes for a total of 4,101 m drilled by IperionX during 2020 and 2021. This includes 45 new holes drilled during the Phase 3 drilling campaign in 2021, which are
previously unreported. A further 109 holes totaling 3,566 m have subsequently been drilled outside of the MRE area and are in the final stages of processing. It is anticipated that these drill hole results will be incorporated into an upgraded
MRE.
Page 26
|
IPERIONX TITAN PROJECT – INITIAL ASSESSMENT
|
Table 9: Mineral Resource Estimate and THM assemblage at 0.4% cut-off grade.
|
THM Assemblage
|
||||||||||
|
Cut off
|
Tons
|
THM %
|
THM
|
Zircon
|
Rutile
|
Ilmenite
|
REE
|
Staurolite
|
||
|
(THM %)
|
(Mt)
|
(%)
|
(Mt)
|
(%)
|
(%)
|
(%)
|
(%)
|
(%)
|
||
|
Indicated
|
0.4
|
241
|
2.2
|
5.3
|
11.3
|
9.3
|
39.7
|
2.1
|
15.6
|
|
|
Inferred
|
0.4
|
190
|
2.2
|
4.2
|
11.7
|
9.7
|
41.2
|
2.2
|
13.7
|
|
|
Total
|
0.4
|
431
|
2.2
|
9.5
|
11.5
|
9.5
|
40.3
|
2.1
|
14.8
|
|
Table 10: Mineral Resource Estimate and THM assemblage at 2.0% cut-off grade.
|
THM Assemblage
|
||||||||||
|
Cut off
|
Tons
|
THM %
|
THM
|
Zircon
|
Rutile
|
Ilmenite
|
REE
|
Staurolite
|
||
|
(THM %)
|
(Mt)
|
(%)
|
(Mt)
|
(%)
|
(%)
|
(%)
|
(%)
|
(%)
|
||
|
Indicated
|
2.0
|
105
|
3.8
|
3.9
|
11.7
|
9.8
|
42.0
|
2.3
|
10.7
|
|
|
Inferred
|
2.0
|
90
|
3.5
|
3.2
|
12.1
|
9.9
|
42.1
|
2.3
|
10.8
|
|
|
Total
|
2.0
|
195
|
3.7
|
7.1
|
12.1
|
9.9
|
42.0
|
2.3
|
10.7
|
|
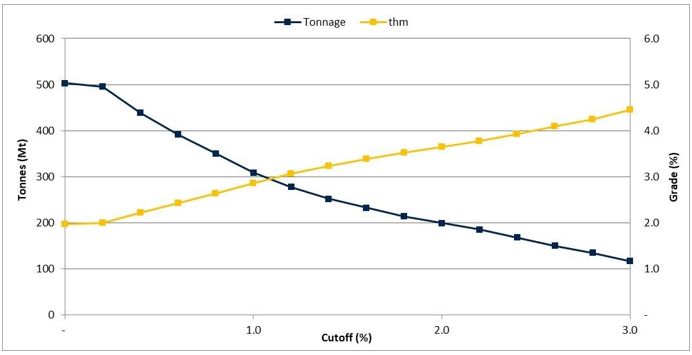
Figure 7: THM grade cutoff v. tonnage curve.
Page 27
|
IPERIONX TITAN PROJECT – INITIAL ASSESSMENT
|
Page 28
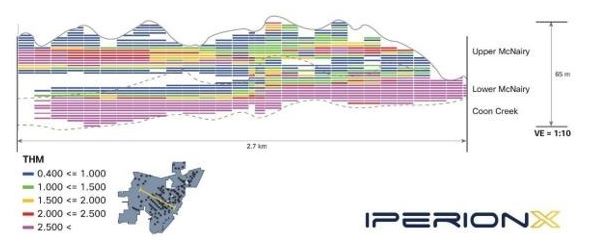
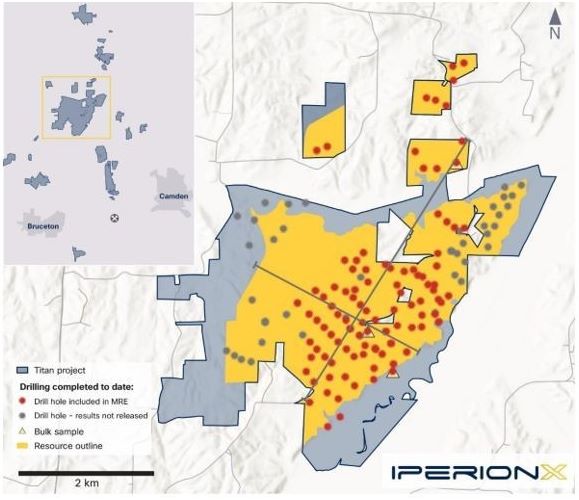
Figure 8: MRE plan view, cross section and long section.
Page 29
|
IPERIONX TITAN PROJECT – INITIAL ASSESSMENT
|
The shallow, high grade and unconsolidated nature of mineralization enables the potential for simple mining operations supported by an industry standard mineral processing flowsheet. The Company is focusing on
becoming the leading developer of low-to-zero carbon, sustainable, critical materials in the U.S., and is working with Presidio Graduate School’s expert consulting division, PGS Consults, to undertake Environmental, Sustainability and Corporate
Governance studies to define best practice mining and processing operations in this critical mineral province.
| 11.3 |
Geology and Geological Interpretation
|
The Titan Project’s location in western Tennessee represents the eastern flank of the Mississippi Embayment, a large, southward plunging syncline within the Gulf Coastal Plain. This feature extends from southern
Illinois to the north and to Mississippi and Alabama to the south. The embayment is filled with sediments and sedimentary rocks of Cretaceous to Quaternary age.

Page 30
Figure 9: Mississippi embayment & Cretaceous age coastline.
The McNairy Sand Formation represents a pro-grading deltaic environment during a regressive sequence. This is evidenced by the coarsening upward sequence grading from the glauconitic clay rich Coon Creek Formation to
the fine lower member of the McNairy Formation to the coarser upper member of the McNairy Formation.
The main mineralized zone at the Project is hosted stratigraphically in the lower member of the McNairy Formation. Mineralization averages 31 meters thick and has been traced, to date, for 6.2 kilometers along
strike.
Page 31
|
IPERIONX TITAN PROJECT – INITIAL ASSESSMENT
|
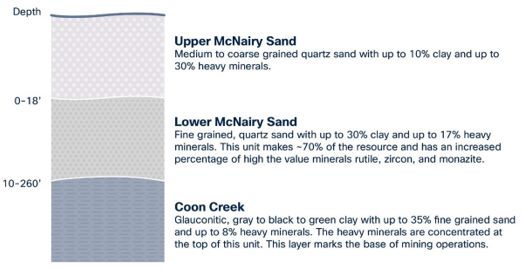
Figure 10: Idealized cross-section of McNairy Sand.
| 11.4 |
Drilling and Sampling Techniques
|
All drilling for the Project has been roto-sonic. This method alternates advancement of a core barrel and a removeable casing (casing is used when needed to maintain sample integrity). The core barrel utilized for
this Project is 4 inch in diameter with a 6 inch diameter outer casing. The core barrel is retrieved from the ground and the samples are recovered directly from the barrel into a plastic sleeve. All holes are drilled vertically. The sonic drilling
method has been shown to provide representative unconsolidated mineral sands samples across a variety of deposits as it is a direct sampling method of the formation(s). At times water is used to create a head on the formation to help prevent
run-up.
A roto-sonic drill rig, the Geoprobe 5140LS, utilized a 10 ft core barrel to obtain direct 5 ft samples of the unconsolidated geological formations hosting the mineralization in the Project area. All holes were
drilled vertically which is essentially perpendicular to the mineralization. The sonic cores were used to produce approximately 2kg samples for heavy liquid separation as well as further mineralogical analysis. Each core is measured, and the
recovery is calculated as length of recovered core divided by length drilled (typically 10 ft).
Some interpretation is involved as the material can expand or compact as it is recovered from the core barrel into the plastic sleeve. Samples are logged for lithological, geological, and mineralogical parameters in
the field to help aid in determining depositional environment, major geologic units, and mineralized zones.
All samples are panned and estimates made for the %THM and %SL. Logging is both qualitative (sorting, color, lithology) and quantitative (estimation of %THM, %SL) to help support the integrity of the Exploration
Results and Mineral Resource estimate. Photographs are taken of the sonic cores.
The unconsolidated sonic cores are sampled by splitting the core in half lengthwise using a machete then recovering an even fillet with a trowel along the entire length of the sample interval. Samples are collected
directly to the pre-labeled/pre-tagged sample bags; the remaining sample is further split into a replicate/archival sample and what remains is used to backfill the drillhole.
| 11.5 |
Sample Analysis Methodology
|
Roto-sonic drill core samples, typically 1.5 m, are sent to SGS NA facility in Lakefield, ON, Canada. Samples are subjected to standard mineral sand industry assay procedures of size fraction analysis, heavy-liquid
separation, and chemical analysis. Samples are screened at 44-micron (325 mesh) for slimes and 595-micron (30 mesh) for oversize. An 85g aliquot of the -30/+325 sand is then submitted to methylene iodide diluted with acetone to target specific
gravity of 2.95 g/cm3, the greater than 2.95 g/cm3 portion is dried and weighed to
calculate the percent heavy minerals. The THM is calculated by adding the percent slimes and oversize to the total. Composites, based on geological domains, are then submitted for QEMSCAN analysis for mineralogical assemblage data.
Page 32
|
IPERIONX TITAN PROJECT – INITIAL ASSESSMENT
|
| 11.6 |
Resource Estimation Methodology
|
The Mineral Resource occupies an area roughly 6.2 km (north) by 3.6 km (east); the MRE is further broken up into several areas based on land holdings (land agreements). These range from 0.5 km (north) by 0.9 km
(east) for the smallest area to 5.1 km (north) by 3.6 km (east) for the largest area.
The base of mineralization ranges in RL from 90 m to 110 m above current sea level. Mineralization varies from 6 m to 51 m thick and averages 31 m thick. Mineralization resides primarily in two zones within the
primary McNairy Sand unit. The grade interpolation was carried out using Vulcan software. Grade, slimes, and assemblage estimations were completed using inverse distance cubed (ID3) which is appropriate for this style of mineralization.
No THM top cut has been used or is deemed necessary for this deposit due to the geology, style, and consistency of the mineralization. Drill hole sample data was flagged with domain (zone) codes corresponding to the
geological structure of the deposit and the domains imprinted on the model from 3-dimensional surfaces generated from geological interpretations. A primary search dimension of 212*425*3 m (X*Y*Z) was used for all assay data. Successive search
volume factors of 2 and 4 have been adopted to interpolate grade in areas of lower data density. A parent cell size of 100*200*1.5 m was used. Parent cells are typically centered on the drill holes with a floating cell centered between drill holes
along and across strike. A search orientation of 30 east of north was used to emulate the trend of the mineralization. No consistent plunge is apparent in the mineralization.
The Octant search option was used with minimum of 1 and a maximum of 5 samples per octant and a minimum of 2 octants being estimated to calculate the grade for a block. If the insufficient data was found within the
first search, secondary and tertiary searches were used based on the search volume factors. In addition, a maximum of 2 samples were used from any particular drill hole.
| 11.7 |
Classification Criteria
|
The resource classification has been predominantly determined by the drill hole density reflecting the geological confidence. Supporting data are of suitable quality for resource estimation. Resource material
defined by sampling with an approximate density of 212mE-W by 425mN-S by 3mRL and having sufficient mineralogy data has been assigned an Indicated Resource classification, material defined by sampling with an approximate density of 305mE-W by
610mN-S by 3mRL with some mineralogy data has been assigned an Inferred Resource classification. Approximately 56% of the Mineral Resource is classified in the Indicated Mineral Resource category and approximately 44% is classified in the Inferred
Mineral Resource category. Variograms are run to test spatial continuity within the selected geological domains. Down hole and directional variography are run using ’R’ software and Vulcan version 2021.3.
Page 33
|
IPERIONX TITAN PROJECT – INITIAL ASSESSMENT
|
Table 11: Sources of uncertainty.
|
Source of Uncertainty
|
Discussion
|
||
|
Drilling
|
All drilling has been roto-sonic drilling. The roto-sonic drill rig provides a representative sample, with sufficient recoveries of unconsolidated sand, in order to represent the in-ground material and is
suitable for use in the MRE.
|
||
|
Sampling
|
Field duplicates are taken at a rate of 3% in order to identify in biases or inconsistencies. Examination of these duplicates indicates satisfactory performance of the sampling.
|
||
|
Geological Modelling
|
The geological model is supported with sufficient drill data. The Coon Creek formation is reached in >95% of the holes used the model. This provides a sufficient base to the extractable mineralization.
Discrimination between the upper and lower members of the McNairy Sand Formation is easily identified by the relative difference in grain size and the presence of micas within the lower member.
|
||
|
Estimation
|
The estimation techniques used are suitable for the deposit type and mineralization style. All data is log transformed and shows normally distributed grade data. A validation infill program will be executed
in a future study in order to gain additional confidence in the estimation.
|
| 11.8 |
Cut-off Grade
|
A nominal bottom cut of 0.4% THM is offered, based on preliminary assessment of resource value and anticipated operational cost evaluated through preliminary engineering work.
The estimated breakeven economic cut-off grade of 0.4% THM utilized for resource reporting purposes has been calculated using on a revenue cost break even calculation and is based on the following assumptions:
| • |
historical 2017 to 2021 annual average prices for ilmenite, rutile, rare earth concentrate and zircon as set out in Tables 16 and 17;
|
| • |
recovery factors of 82.6% for ilmenite, 60.9% for rutile, 77.1% for rare earth concentrate and 90.8% for zircon;
|
| • |
operating cost estimates of $3.00/t ROM mining, $3.00/t ROM processing, $0.40/t ROM transport and $0.90/t ROM general and administrative costs; and
|
| • |
a royalty of 5% is included in the cut-off grade.
|
SEC Regulation S-K 1300 requires that all reports of Mineral Resources must have reasonable prospects for economic extraction regardless of the classification of the resource.
As detailed in the Initial Assessment, Mineral Resources are amenable to exploitation, incorporating a multi-decade mine life and the application of conventional mining and processing technology.
The QP has used this information as the basis for determining reasonable prospects for economic extraction.
| 11.9 |
Mining and Metallurgical Methods and Parameters
|
The MRE assumes that the deposit will be mined by standard mineral sands dry-mining methods and hydraulic excavator/shovel with a mobile mining unit. It has been assumed that mineralized resource will be
transported to the wet concentrator plants after extraction via slurry pipeline(s).
Metallurgical testing has been conducted, with 3 bulk samples collected from both upper and lower mineralized horizons as well as spatially throughout the deposit footprint. Each bulk sample was processed by both
wet (gravity) and dry (magnetic and electrostatic) methods to produce ilmenite, rutile, zircon, and monazite/xenotime concentrates.
Products were further analyzed by QEMSCAN, XRF and ICPMS to provide scoping-level product and quality information for use in assessing salability and markets. Product information has not been included in the block
model at this stage of the Project.
| 11.10 |
Qualified Person’s Opinion
|
Based on a review of the data, third party verification of data integrity and validation of the block model, the QP believes that this is an accurate representation of IperionX’s heavy mineral sand resource.
Page 34
|
IPERIONX TITAN PROJECT – INITIAL ASSESSMENT
|
| 12. |
Mineral Reserve Estimate
|
This section is not relevant to this report.
Page 35
|
IPERIONX TITAN PROJECT – INITIAL ASSESSMENT
|
| 13. |
Mining Methods
|
| 13.1 |
Geotechnical and Hydrogeology
|
For the purpose of this study, no geotechnical or hydrological test work has been completed on the Project area. Preliminary mining void designs have been provided by IperionX utilizing batter and berm configuration
have been used for the purpose of defining potential mining limits
Exploration data suggests that the water table is 5 m below ground surface, but no water flow rate information has been provided.
| 13.1.1 |
Hydrology
|
No formal hydrology work for surface or sub-surface water flows has been completed and therefore for the purpose of this study the following main assumptions have been made:
| 1. |
Restricted areas due to region surface water management have adequately been defined with the provision of surface water buffer zones.
|
| 2. |
Ground water is not expected to present a pit wall stability issue and will be managed through the use of in-pit pumping associated with the sand tailing water reclaim system.
|
| 3. |
All surface water that interacts with the active mining areas will remain in the mine water management system and all surface water that does not interact with the active mining area will be diverted to natural water ways that move the
water from the mining areas.
|
| 4. |
All mine water used for the transportation of the mineralized material to the Wet Concentrator Plant (WCP) and used in the transportation of sand tails returned to the pit working area will be controlled within the mine water management
system which will prevent mine water from leaving the boundary of the mining areas in an uncontrolled fashion.
|
| 5. |
All mine water management system components (pumps, storage dams and pump lines) are adequately sized to manage expected peak performance requirements for high flow rates.
|
| 6. |
Ancillary mine water for use in dust suppression and all WCP water supply will be drawn from the Mine Water Management System.
|
Hydrology studies to validate these assumptions are required for the next study phase to provide direct input into the design elements.
| 13.1.2 |
Geotechnical
|
The depth of the planned workings below the surface varies from 25 to 40 m below an average ground surface of 125 m Above Sea Level (ASL). The depth is increased due to the terrain in the region having hills reaching
165 m ASL. This combination could result in pit void wall extending from 165 m to 80 m, creating 85 m walls. With this potential operating face height, the geotechnical design for the wall must be considered in detail, considering the impact of the
material types, the material mechanical characterization, the moisture content, potential of hydraulic pressures and geological structures.
With these geotechnical, hydrology and material characterization test work still to be done, preliminary designs for the mining voids have used batter and berm configurations from similar mineral sands type projects.
These slopes are adequate for the purpose of this study but will require refinement in future studies taking into account the local conditions and geometry.
The selected batter and berm configuration is based on 35-degree batters over a vertical height of 10 m and 5 m berms widths resulting in an overall pit slope of less than 28.6 degrees.
The final pit walls are assumed to have this configuration over the exposed working area side wall exposure, prior to back filling of the mining void. This “open pit mining approach” limits the time of exposure of
the mined void walls potentially allowing for more aggressive wall angles to be considered.
Page 36
|
IPERIONX TITAN PROJECT – INITIAL ASSESSMENT
|
| 13.2 |
Mine Design and Rehabilitation
|
The basic mining cycle is depicted in Figure 11, which shows the mine cycle from clearing to final condition post mining. The sequential mining method allows for low cost, reduced area footprint and environmentally
logical mining process by limiting the change in final material location with the mineralized material and waste basically being returned to a similar position in the ground strata. This proposed method of mining cycle is well proven in heavy
mineral sands industry with progressive backfill and rehabilitation to the pre-mining state.
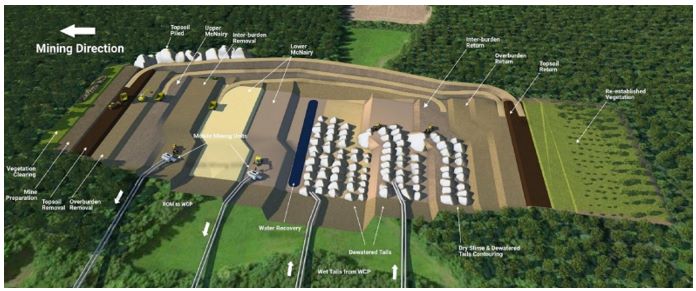
Figure 11: Titan Project mining cycle.
The mineralized material would be mined using excavator or front-end loader feeding an in-pit mining unit or mobile mining unit (MMU). The MMU would then transport the mined mineralized material in slurry form to the
Wet Concentrator Plant (WCP).
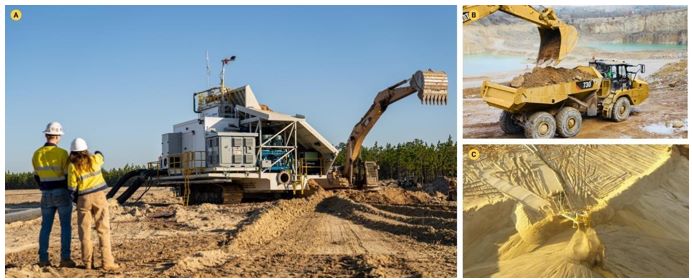
Figure 12: A – Example mobile mining unit mineralized material feed (courtesy of Mineral Technologies); B – Example dry mining of waste; C – Example wet sand tails waste.
Page 37
|
IPERIONX TITAN PROJECT – INITIAL ASSESSMENT
|
The topsoil and dry waste will be mined using conventional excavator/loader and truck mining practices applied in an open pit mining approach, with the objective of limit trucking distances and size of the open
mining void. This will minimize the mining operating costs and minimize mining footprint on the environment. Equipment for dry mining will likely consists of a contracted mining fleet for all activities for the mining of the mineralized material
and waste including the mining of the mineralized material to the input mining unit.
The wet waste sand from the WCP is returned via pipeline to the mine workings where it is discharged by a cyclone cluster that dumps retrieves water from the waste stream, dumping high solid content sands into a
cone. This sand will then be moved be spread by the dozers, with the dewatered slimes from WCP being returned to the mining void by trucks prior to being covered by the dry overburden and inter-burden.
The mining process is commenced with the excavation of the pre-mining void. The initial mining void sets up the working faces and working space to allow the open pit mining approach to operate its full cycle.
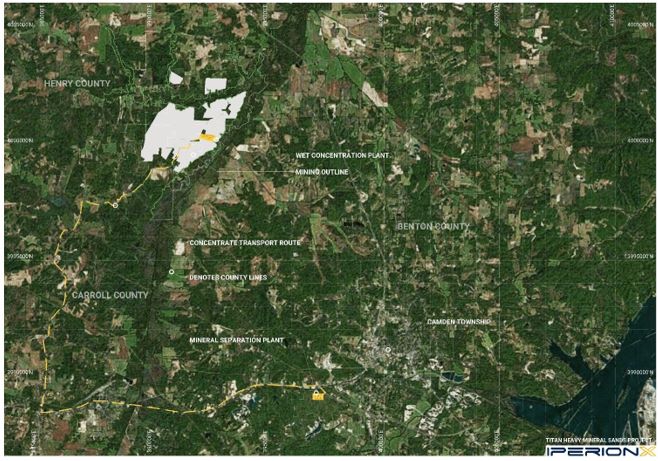
Figure 13: Titan Project site plan and mining area.
Page 38
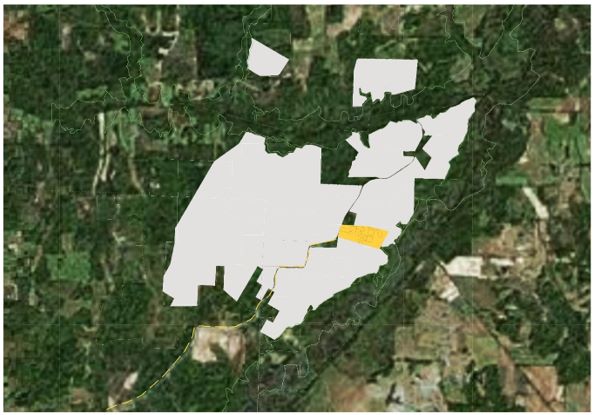
Figure 14: Titan Project mining outline (the mining outline defines the area mined and not a final open pit void as the process is incremental and pits are backfilled
progressively)
| 13.3 |
Production Target and Mine Schedule
|
Pit optimizations were completed in order to produce a production schedule on an annual basis. This resulted in a total Production Targets of 243 Mt @ 3.0% THM In-Situ with a mine life of 25 years. The mining
schedule delivers an outcome with the first 14 years mining 100% of indicated mineralized resource only, and the remaining years mining the inferred mineralized resource, resulting in a total mine life of 25 years. The schedule is based on 57% of
the total mine ROM material being in an Indicated category. Currently we have no plans to mine and process the remaining mineral resources located outside of this optimized pit, however this may change as the market evolves.
Page 39
|
IPERIONX TITAN PROJECT – INITIAL ASSESSMENT
|
Table 12: Mine production schedule with % Indicated category processed by time period.
|
Year
|
ROM Tons
|
Inferred Tons
|
Indicated Tons
|
% Indicated Tons
|
|
(Mt)
|
(Mt)
|
(Mt)
|
(%)
|
|
|
1-14
|
136.5
|
-
|
136.5
|
100%
|
|
15-25
|
106.1
|
105.3
|
0.8
|
1%
|
|
LOM
|
242.6
|
105.3
|
137.3
|
57%
|
Table 13: Annual LOM production tonnage and grade (Indicated and Inferred Resources).
|
Description
|
ROM
|
Waste
|
ROM AND WASTE
|
THM In-Situ
|
|
Units
|
Mt
|
Mt
|
Mt
|
%
|
|
Year 1-25
|
242.6
|
163.4
|
406.0
|
3.0%
|
|
1
|
10.0
|
3.6
|
13.6
|
3.9%
|
|
2
|
9.8
|
6.2
|
16.0
|
4.2%
|
|
3
|
9.9
|
12.3
|
22.3
|
3.6%
|
|
4
|
9.9
|
4.8
|
14.7
|
2.3%
|
|
5
|
9.9
|
3.7
|
13.6
|
2.6%
|
|
6
|
9.7
|
11.7
|
21.3
|
3.0%
|
|
7
|
9.4
|
9.1
|
18.5
|
2.9%
|
|
8
|
9.4
|
8.2
|
17.6
|
2.8%
|
|
9
|
9.5
|
6.8
|
16.3
|
2.7%
|
|
10
|
9.6
|
6.0
|
15.6
|
2.7%
|
|
11
|
9.7
|
6.1
|
15.9
|
2.8%
|
|
12
|
9.9
|
6.6
|
16.5
|
2.8%
|
|
13
|
9.9
|
7.2
|
17.1
|
2.6%
|
|
14
|
9.9
|
1.7
|
11.6
|
3.1%
|
|
15
|
9.3
|
12.4
|
21.7
|
3.0%
|
|
16
|
9.5
|
11.2
|
20.6
|
3.1%
|
|
17
|
9.5
|
10.5
|
20.0
|
3.1%
|
|
18
|
9.4
|
6.9
|
16.3
|
3.1%
|
|
19
|
9.5
|
6.3
|
15.9
|
3.0%
|
|
20
|
9.7
|
6.3
|
16.0
|
2.9%
|
|
21
|
10.0
|
4.6
|
14.6
|
2.7%
|
|
22
|
9.9
|
3.6
|
13.4
|
2.7%
|
|
23
|
9.8
|
5.1
|
14.9
|
2.8%
|
|
24
|
9.8
|
1.0
|
10.8
|
3.1%
|
|
25
|
9.9
|
1.4
|
11.2
|
3.4%
|
Page 40
Table 14: Annual LOM production tonnage and grade (assuming Indicated Resources only).
|
Description
|
ROM
|
Waste
|
ROM AND WASTE
|
THM In-Situ
|
|
Units
|
Mt
|
Mt
|
Mt
|
%
|
|
Year 1-14
|
136.5
|
94.2
|
230.7
|
3.0%
|
|
1
|
10.0
|
3.6
|
13.6
|
3.9%
|
|
2
|
9.8
|
6.2
|
16.0
|
4.2%
|
|
3
|
9.9
|
12.3
|
22.3
|
3.6%
|
|
4
|
9.9
|
4.8
|
14.7
|
2.3%
|
|
5
|
9.9
|
3.7
|
13.6
|
2.6%
|
|
6
|
9.7
|
11.7
|
21.3
|
3.0%
|
|
7
|
9.4
|
9.1
|
18.5
|
2.9%
|
|
8
|
9.4
|
8.2
|
17.6
|
2.8%
|
|
9
|
9.5
|
6.8
|
16.3
|
2.7%
|
|
10
|
9.6
|
6.0
|
15.6
|
2.7%
|
|
11
|
9.7
|
6.1
|
15.9
|
2.8%
|
|
12
|
9.9
|
6.6
|
16.5
|
2.8%
|
|
13
|
9.9
|
7.2
|
17.1
|
2.6%
|
|
14
|
9.9
|
1.7
|
11.6
|
3.1%
|
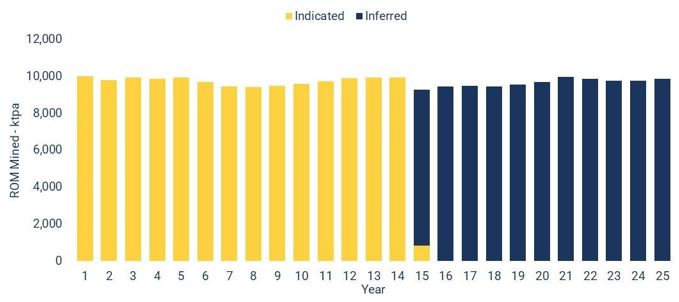
Figure 15: Titan Project Indicated and Inferred material split over mine life.
Page 41
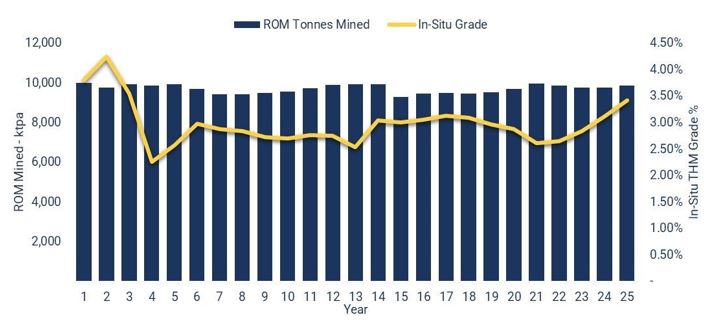
Figure 16: Titan Project production targets and grade profile.
Each of the solids of the various mining limits is bound by the constraining limits being: lease boundaries, flood plain buffer, the Coon Creek basement surface and regional topography. All physicals used for mine
scheduling and financial modelling in this report are inside (sub-set of) these mining limits.
Page 42
|
IPERIONX TITAN PROJECT – INITIAL ASSESSMENT
|
With these geotechnical, hydrology and material characterization test work still to be done, preliminary designs for the mining voids have used batter and berm configurations from similar mineral sands type projects.
These slopes are adequate for the purpose of this study but will require refinement in future studies taking into account the local conditions and geometry.
The selected batter and berm configuration is based on 35 degree batters over a vertical height of 10m and 5m berms widths resulting in an overall pit slope of less than 28.6 degrees.
The mine schedule is planned to provide a continuous rougher head feed rate of 1,000 tons per hour. The cut-off grade is defined at 1.00% THM based on preliminary economic assessment.
The estimated economic cut-off grade of 1.0% THM utilized for the purposed of determining the optimized pit in the Initial Assessment is based on the following assumptions:
| • |
TZMI forecast pricing for ilmenite, rutile and premium zircon products, and Adamas Intelligence forecast pricing for rare earth concentrate as set out in Table 17;
|
| • |
recovery factors of 81.0% for ilmenite, 72.3% for rutile, 88.2% for rare earth concentrate and 83.3% for zircon;
|
| • |
operating cost estimates of $1.94/t ROM mining, $3.60/t ROM processing, $0.53/t ROM transport and $1.56/t ROM capital expenditures; and
|
| • |
a royalty of 5% and commission of 3% is included in the cut-off grade.
|
Given the nature of the resource model, the block dimensions and the type of deposit, dilution is assumed to be included in into the modelled blocks, requiring no further modification for the purposed of this study
in scheduling physicals for the financial model inputs.
The mining recovery factor based on the planned mining equipment and the resource model block dimension, the selective mining units is a small percentage of a parent block size and therefore in practice should be
100%.
Assumed values of 10% slime for the Upper McNairy and 20% for the Lower McNairy.
The start point was selected to provide immediate access to high grade material in the Indicated mineral resource category. The schedule was based on reporting the optimized physicals for the blocks in panels and
then mining in the general sequence shown. The sequence for the East block results in the final stages of mining in year 5 being beside the WCP but also adjacent to the waste stockpiles created by the excavation of the initial mining void.
The second phase of the general scheduling has the workings moving the western areas of the current Indicated mining limits. This satisfies the requirement of Indicated mineral resource category only initially then
allowing Indicated & Inferred mineral resource category at the tail of the schedule.
The general mining sequence adopted for the schedule is south to north in full width panels. This is done intentionally to avoid mineralized material loss from having parallel narrower mining paths which will result
in mineralized material loss in the Lower McNairy due issues of mining adjacent to a previous mining path.
The final phase of the Project as known is the scheduling of the inferred mineral resource category from south to north, in the same manner as done for the second phase.
Page 43
|
IPERIONX TITAN PROJECT – INITIAL ASSESSMENT
|
| 14. |
Processing and Recovery Methods
|
An overview of the major processing stages can be described as follows:
| 1. |
Run of mine mineralized resource is processed in the Mobile Mining Unit (MMU) which removes trash & oversize. The undersize is pumped to the Feed Preparation Plant (FPP) and Wet Concentrator Plant (WCP).
|
| 2. |
In the FPP, the feed is de-slimed to separate clay and the sand. The slimes are directed to the thickener where they are thickened and then filtered. The sand fed into a constant density tank which is pumped to the rougher spiral stage
at 1,000 tph at the start of the WCP.
|
| 3. |
The WCP comprises of multiple stages of spiral separators which produce a tailings and a Heavy Mineral Concentrate (HMC) stream. The WCP tailings stream is dewatered and pumped to the mining void while the HMC (at a target grade of
>85% THM) is dewatered and trucked to the Monazite Separation Plant.
|
| 4. |
The Monazite Separation Plant which consists of a flotation circuit and wet gravity circuits, to produce a monazite product and an upgraded HMC which consists predominantly of the titanium minerals & zircon minerals. The upgraded HMC
is the feedstock for Mineral Separation Plant (MSP).
|
| 5. |
The MSP consists of a dryer, multiple stages of electrostatic separators, magnetic separators and wet gravity separators to produce ilmenite, rutile, premium zircon and zircon concentrate.
|
Page 44
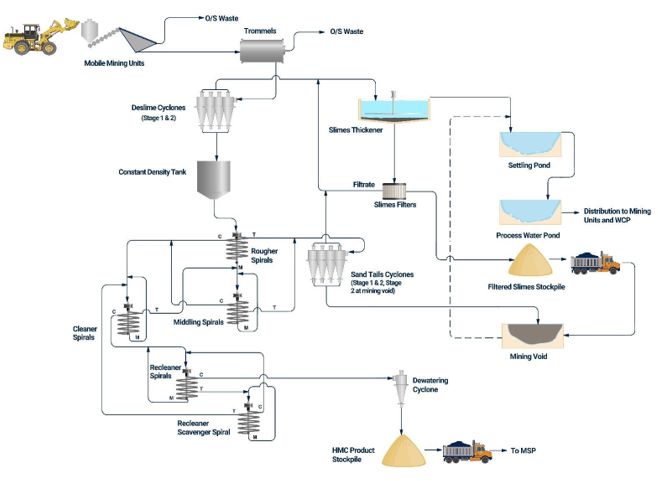
Figure 17: Titan Project mining and wet concentration plant simplified process diagram.
Page 45
|
IPERIONX TITAN PROJECT – INITIAL ASSESSMENT
|
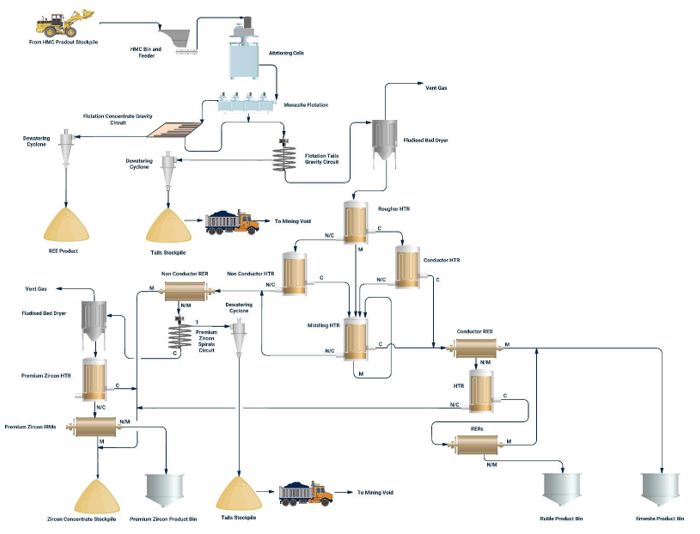
Figure 18: Titan Project mineral separation plant simplified process diagram.
The processing plant is designed to process 9.7 Mt/y ROM material, and will produce approximately 95,500 t/y ilmenite, 16,700 t/y rutile, 4,600 t/y monazite concentrate, 22,400 t/y premium zircon and 16,000 t/y
zircon concentrate on a life-of-mine average basis.
An estimate of the power demand for each area is 11.4 MW at the mine and WCP facility, and 2.2 MW at the MSP facility.
An allowance has been made for production, maintenance and management personnel associated with running the mine and processing plant. Rosters are based on 12 hours per shift, 2 shifts per day and 4 rotating crews.
Further rationalization of operational requirements for ramp-up will be reviewed in the PFS. An estimated total of 179 personnel are required for mine, WCP and MSP.
| 14.1 |
Mobile Mining Units (MMU)
|
The MMUs receive run-of-mine (ROM) mineralized resource fed by a loading tool. These units are designed to move along with the mining face. Separate to the MMU but integral to its operation is a static
scrubber/trommel which sits on the side of the mining area. The trommel protects the equipment by removing any grossly oversize material including vegetation.
Page 46
|
IPERIONX TITAN PROJECT – INITIAL ASSESSMENT
|
‘Shredders’ are included to assist with the liberation of the clay from the sand minerals. The material existing the ‘shredder’ is pumped to the scrubber/trommel which is stationed on the side of the mining area. The
scrubber/trommel breaks down larger material clumps through slurry rotational motion and spray water is also injected into the second half of the unit to help liberate the clay from the sand. The >2 mm particles at the end of the scrubber are
rejected to directly back to the mining void. The <2 mm material is then pumped from the scrubber/trommel to the WCP where the clay is firstly separated from the sand.
| 14.2 |
Feed Preparation Plant (FPP) and Wet Concentration Plant (WCP)
|
| 14.2.1 |
Feed Preparation Plant (FPP)
|
The <2.0 mm ROM will be pumped into cyclones to separate out the slimes. The cyclone overflow containing the slimes will report to a thickener where they will be treated with flocculant to produce a high solids
concentration slurry. Thickener underflow is pressure filtered and stockpiled for disposal via truck back to the mining void. Thickener overflow is recirculated as process water to the WCP and MMUs.
The cyclone underflow reports to a Constant Density (CD) tank. The CD tank provides several roles. The design of the CD tank distributes the sand so that the discharge output can be controlled. Therefore, any
fluctuations in tonnage upstream (mining units) are eliminated, allowing constant steady operation of downstream WCP. Similarly, the discharge density can also be controlled by injecting water into the sand by a dedicated injection water pump. The
CD tank also provides surge capacity that allows continued operation of the WCP in the advent of any mining interruptions. The CD tank can also provide a secondary desliming stage through the overflow launder.
There are also two discharge pumps on the CD tank feeding two parallel spiral circuits. This premise is to ensure that at a minimum, the plant can operate at half capacity if there are any downtime issues with mining
units. The sand from the CD tank is discharged at the nominated solids concentration (% solids) suitable for processing over spiral separators.
| 14.2.2 |
Wet Concentrator Plant (WCP)
|
The WCP will have two parallel circuits which comprise of a combination of MG12 and HG10i spirals to concentrate the heavy mineral component of the ROM into an HMC. The tailings stream from the spiral circuit is
pumped to the mining void where it is dewatered via cyclones with the underflow discharging into the mining void and the overflow is reused in the WCP via the thickener. The HMC from each of the parallel circuits is combined. The final stage of the
WCP is desliming cyclones and an HMC stacker. Return water from the cyclone is reused in the WCP via the thickener.
The HMC stacker HM can slew between three stacking positions so that while one stockpile is being stacked, one is being removed, leaving the last one to drain.
A front-end loader is used to load the damp HMC into trucks for transport to the Mineral Separation Plant.
The WCP installation also includes support infrastructure such as the tailings thickener, process water dam and tanks, workshop, administration buildings, and a HMC stockpile. The WCP design and construction will
ensure that the plant is suitable to be moved if required.
| 14.3 |
Mineral Separation Plant (MSP)
|
HMC from the WCP is trucked to the MSP where it is processed through the Monazite Flotation Plant (MFP) to produce a monazite product and an upgraded HMC as a feedstock for the Mineral Separation Plant (MSP). HMC
from the MSP HMC stockpile is reclaimed by front end loader and fed to the MFP via bin and feeder.
| 14.3.1 |
Monazite Flotation Plant (MFP)
|
The reclaimed HMC is conditioned to make the monazite mineral amenable to flotation. A two stage (rougher-scavenger) float circuit is employed to help with the recovery of the monazite. After flotation, the
concentrate (float) is upgraded by wet gravity tables that are used to remove any residual heavy minerals and other impurities.
Page 47
|
IPERIONX TITAN PROJECT – INITIAL ASSESSMENT
|
The monazite product produced from these tables is then filtered to reduce the moisture content (to approximately 5%). By not completely drying the monazite product, it reduces the risk of airborne particles and
dust. This stream is then conveyed to a product bin, and then loaded into specially designed 200L drums ready for transport.
The (rougher-scavenger) float circuit tailings (sinks) are then further upgraded using three stages of spirals to remove the remaining quartz and trash heavy mineral that is still present. The spiral tailings stream
is dewatered and transported back to the mining void. The concentrate then goes to the MSP where it is dewatered using a belt filter and dried in readiness for separation to make ilmenite, rutile & zircon products.
The metallurgical testwork has shown that rare earth minerals (REM) can be separated readily from the other valuable heavy minerals using flotation techniques.
| 14.3.2 |
Mineral Separation Plant (MSP)
|
As discussed above, the frontend electrostatic circuit of the MSP Process Option 2 is the same as process Option 1 MSP. This also includes the ilmenite and rutile magnetic circuit.
With Process Option 2, the non-conductors stream containing nearly all of the zircon mineral, plus residual staurolite, residual quartz, and some miss placed titanium minerals is further processed to produce a
premium zircon product plus a smaller zircon concentrate stream which will contain residual zircon mineral, plus residual staurolite, residual quartz, and some titanium minerals.
The separation of the zircon from the non-conductors stream begins when the material is passed over a rare earth roll separator (RER). In the RERs, the zircon reports to the non-magnetic stream and other materials
such as staurolite and other magnetic minerals to the magnetics stream. The magnetics stream is directed to the zircon concentrate product.
The zircon is then processed in a wet gravity circuit to remove quartz and other light heavy non-magnetic minerals resulting in an upgraded zircon stream. The wet zircon concentrate is then dried and further
processed through electrostatic separation stages and magnetic separation stages. The conductors from the electrostatic separators are directed to the zircon concentrate, while the non-conductors collected and processed over two stages of induced
roll magnetic separators. The cleaned non-magnetics become the premium zircon product, with the magnetics stream being directed to the zircon concentrate.
Page 48
|
IPERIONX TITAN PROJECT – INITIAL ASSESSMENT
|
| 15. |
Infrastructure
|
IperionX’s Titan Project is strategically located near Camden, Tennessee, and will benefit from significant cost advantages due to the location and proximity to low cost, world-class infrastructure.
95,000 miles of highway, including 8 interstate highways, put Tennessee within a day’s drive of a majority of U.S. consumer markets. Tennessee is the third largest rail center in the U.S. and there are more than
1,000 miles of navigable waterways which access all other major waterways in the eastern U.S. There are over four commercial airports near Camden, including two international airports at Memphis and Nashville.
This world class infrastructure is expected to provide material cost and logistics advantages compared to projects located in more remote areas. The existing infrastructure includes low-cost power and gas, with
high-capacity transmission lines near the Project, abundant transportation infrastructure including the Norfolk Southern mainline running through Camden, the major I-40 highway just 10 miles south of Camden and a major barge-loading point 15 miles
from the Titan Project connecting to all major U.S. customers and export ports. Potential water sources include nearby surface water bodies but will likely involve shallow groundwater.
Site infrastructure is an essential component to the success of the Project. The Project’s mineral sands resources and nearby Wet Concentrator Plant (WCP) are located approximately 17 miles northwest of the city of
Camden, Tennessee. The Project also includes a dry Mineral Separation Plant (MSP) that is located approximately 1.3 miles southwest of the city of Camden, Tennessee. The distance separating the two plants is approximately 19 miles and accessed via
public roads and highways.
The MSP is just 2 miles from Highway 70 and Highway 641, 15 miles from Interstate 40 and is less than 50 miles to Jackson McKellar Sipes Airport. It also has rail access.
Camden is a city of approximately 3,500 people with established infrastructure including scheme water, waste-water treatment, high voltage power, sealed roads and skilled labor.
| 15.1 |
Site Layout
|
A preliminary integrated site plan including mining operations, wet concentration plant and dry separation plant and ancillary facilities was developed by Primero Group during the study.
| 15.2 |
Potable Water
|
Potable water is provided to the plant from the Camden municipal water supply. Potable water supply to the WCP will be trucked approximately 17 miles from Camden and stored in a dedicated potable water tank. Potable
water supply to the MSP will be sourced direct from the Camden scheme water supply.
| 15.3 |
Wastewater Treatment
|
Wastewater will be treated through the existing Camden Wastewater Treatment Plant (WWTP). Waste from both the WCP and MSP will be stored at each-site then systematically pumped to a waste truck and delivered to the
existing WWTP for treatment.
| 15.4 |
Fire Services
|
Both the WCP and MSP sites will be protected by a fire water system in accordance with the National Fire Protection Association (NFPA) standards. This system comprises of a dedicated fire water storage tank,
electrical and diesel fire water pumps, fire water hose reels, standpipes and sprinkler systems as required.
| 15.5 |
Natural Gas
|
Natural gas shall be used as the fuel source for the rotary dryers, and for various heating duties associated with the HVAC systems around the site. Natural gas is supplied from the municipal distribution network.
Page 49
|
IPERIONX TITAN PROJECT – INITIAL ASSESSMENT
|
| 15.6 |
Roads
|
Site roads shall be provided for all operations and maintenance activities. Roads shall be asphalt in high traffic areas only.
| 15.7 |
Diesel
|
A diesel storage and distribution facilities shall be provided at both the WCP and MSP sites to supply mobile equipment. Diesel shall be supplied by road tanker and each facility will provide sufficient diesel
storage, provision for tanker unloading and for refueling of mobile equipment.
| 15.8 |
Compressed Air
|
Compressed air will be used at both the WCP and MSP circuits. The compressed air will be supplied by rotary screw compressors. Each compressed air circuit is complete with air dryers and filters to provide the
required air quality, and with air receivers sized to accommodate the maximum instantaneous flow rate required.
| 15.9 |
Renewable Power
|
IperionX intends to implement fully renewable power sourcing options for the Titan Project, including the assessment of existing on-grid solutions currently provided by incumbent power generators and suppliers in the
area. The WCP and MSP facility will each contain a substation with high voltage switchboard and suitable feeders to supply switch rooms located in different areas of the plant to reduce cable cost and drop voltage. An estimate of the power demand
for each area is 11.4 MW at the Mine and WCP facility, and 2.2 MW at the MSP facility.
| 15.10 |
Communication
|
There will be separate PLC-RIO, PLC-EOL, PLC-VFD, PLC-PLC, PLC_SCADA and SCADA_SCADA networks serviced by separate communications cards in the PLC processor racks. PLC to Remote PLC IO (RIO) communications will be
Ethernet over multimode fiber, copper and / or wireless. Communications within the plant area will be hardwired.
| 15.11 |
Buildings
|
Administration buildings located at the WCP and MSP facilities will be provided for all operations and maintenance personnel. Buildings shall be of prefabricated modular construction. The administration buildings
will be plumbed, powered, and contain HVAC as required.
Control rooms will be provided at both the WCP and MSP facilities. The control rooms will be modular, air-conditioned buildings. Maintenance workshop and stores located at both the WCP and MSP facilities will include
designated storage and laydown yards. The workshop will consist of mechanical, boilermaker, electrical and instrument work areas.
A site laboratory at the MSP facility will be provided. The laboratory will be of a prefabricated modular construction and connected to all services.
Page 50
|
IPERIONX TITAN PROJECT – INITIAL ASSESSMENT
|
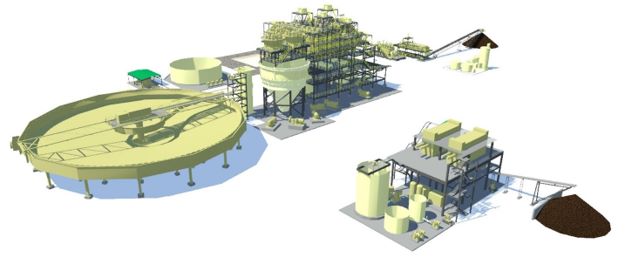
Figure 19: Titan Project WCP 3D model.
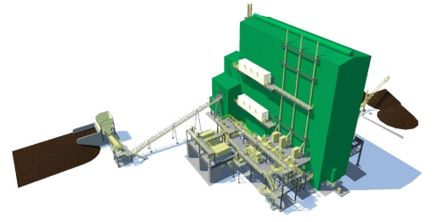
Figure 20: Titan Project MSP 3D model.
Page 51
|
IPERIONX TITAN PROJECT – INITIAL ASSESSMENT
|
| 16. |
Market Studies
|
| 16.1 |
Market Fundamentals and Product Sales
|
| 16.1.1 |
Critical Minerals Overview
|
A consistent, secure, and domestically sourced supply of critical minerals has been acknowledged by the U.S. government as one of the most urgent issues to U.S. national security and economic prosperity. Critical
minerals are both ubiquitous to current everyday life, and are essential inputs in advanced applications and technologies, particularly those related to decarbonization.
“Critical minerals provide the building blocks for many modern technologies and are essential to our national security and economic prosperity. These minerals—such as
rare earth elements, lithium, and cobalt—can be found in products from computers to household appliances. They are also key inputs in clean energy technologies like batteries, electric vehicles, wind turbines, and solar panels. As the world
transitions to a clean energy economy, global demand for these critical minerals is set to skyrocket by 400-600 percent over the next several decades, and, for minerals such as lithium and graphite used in electric vehicle (EV) batteries, demand
will increase by even more—as much as 4,000 percent. The U.S. is increasingly dependent on foreign sources for many of the processed versions of these minerals.” – U.S. White House,
February 20226
The U.S. Energy Act of 2020 defines a “critical mineral” as a non-fuel mineral or mineral material essential to the economic or national security of the U.S. and which has a supply chain vulnerable to disruption.
Critical minerals are also characterized as serving an essential function in the manufacturing of a product, the absence of which would have significant consequences for the economy or national security.
In February 2022, the U.S. Geological Survey, an office of the U.S. Department of the Interior, published its final list of minerals considered critical to the U.S.7, being: aluminum, antimony, arsenic, barite, beryllium, bismuth, cerium, cesium, chromium, cobalt, dysprosium, erbium, europium, fluorspar, gadolinium, gallium, germanium, graphite, hafnium, holmium, indium,
iridium, lanthanum, lithium, lutetium, magnesium, manganese, neodymium, nickel, niobium, palladium, platinum, praseodymium, rhodium, rubidium, ruthenium, samarium, scandium, tantalum, tellurium, terbium, thulium, tin, titanium, tungsten, vanadium,
ytterbium, yttrium, zinc, and zirconium.
Foreign nations, including China and Russia, currently dominate many of these critical mineral and material supply chains, including titanium and rare earth elements. Relying on foreign sources for these critical
materials poses a risk to the U.S.’s readiness to deter and defeat adversaries, with important defense applications for these supply chains including rare earth permanent magnets for jet fighter engines, missile guidance systems, antimissile
defense, space-based satellites, and communication systems and well as titanium for the structures of fighter jets, bombers, attack aircraft, transports and helicopters.
| 16.1.2 |
Rare Earth Concentrates
|
Rare elements earths (rare earths) are a group of 15 elements in the periodic table known as the Lanthanide series, plus Yttrium. Rare earths are categorized into light elements (lanthanum to samarium) and heavy
elements (europium to lutetium). Rare earths are used in many industrial applications, including mature industries, typically as additives in a mix of other materials to help products achieve superior performance. Rare earths react with other
metallic and non-metallic elements to form compounds which have specific chemical behaviors. This makes them indispensable and non-replaceable in many electronic, optical, magnetic, and catalytic applications.
Rare earths are used in many applications including battery alloys, catalysts, ceramics and metal alloys. However, it is the increasing demand for rare earths used in high strength permanent magnets, specifically
neodymium-iron-boron (NdFeB) magnets, found in power dense electric motors used in electric vehicles and wind turbines that makes up the majority of global consumption, accounting for ~90% of the global market by value in 2019 and expected to grow
rapidly along with growth in electric vehicle (EV) and wind turbine production.
6 Fact Sheet: Securing a Made in America Supply Chain for Critical Minerals (link)
7 2022 Final List of Critical Minerals (link)
Page 52
|
IPERIONX TITAN PROJECT – INITIAL ASSESSMENT
|
NdFeB magnets rely on the light rare earths neodymium (Nd) and praseodymium (Pr), with heavy rare earths such as dysprosium (Dy) and terbium (Tb) also used to improve resistance to demagnetization at temperatures
above 120°C. These magnets are key intermediate components of permanent magnet direct drive generators in wind turbines and electric synchronous traction motors for propulsion systems in EVs. Given their importance in key components in the
renewable energy electrification supply chain, namely energy generation and energy storage, rare earths are critical to the U.S.’s decarbonization efforts.
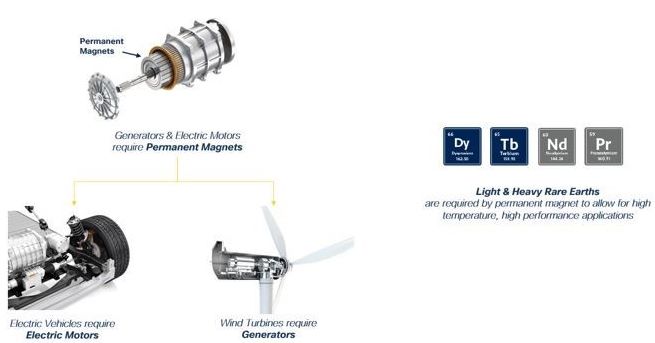
Figure 21: Major uses of rare earth containing permanent magnets.
Following a pandemic-induced lull in 2020, Adams Intelligence, an independent research and advisory consultant focused on strategic metals and minerals, data indicates that consumption of NdFeB magnets increased by
18.1% in 2021, with forecast demand to increase at a CAGR of 8.6% from 2022 through 2035 leading to a significant supply deficit throughout this period.
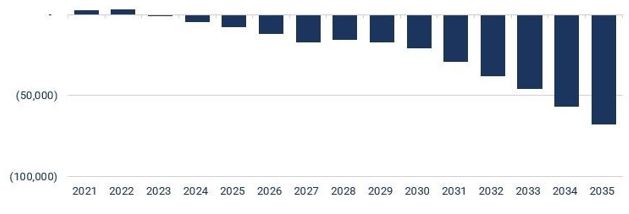
Figure 22: Global NdPr supply / demand imbalance (Nd/Pr oxide tons)8.
8 Source: Pensana PLC, June 2022 (link)
Page 53
|
IPERIONX TITAN PROJECT – INITIAL ASSESSMENT
|
Further, rare earths, particularly the heavy rare earths dysprosium and terbium, are essential for U.S. defense applications, primarily in targeting and weapons systems, including smart bombs and missiles, as well as
for their use in compact and powerful electric motors in air, sea and subsea weapons platforms.
There is only minor production of dysprosium and terbium outside of China, and no material production within the U.S. The potential production of these heavy rare earths within the U.S. is strategic and highly
valuable to the country’s leading defense, EV and clean energy sectors. In September 2021 the Commerce Department’s Bureau of Industry and Security initiated an investigation under section 232 of the Trade Expansion Act of 1962, to determine the
effects on U.S. national security from imports of NdFeB permanent magnets.
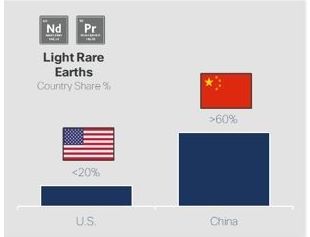
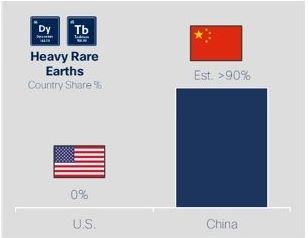
Figure 23: Rare earth production attributable to China and the U.S.
There is only minor production of dysprosium and terbium outside of China, and no material production within the U.S., and the potential production of these heavy rare earths at the Titan Project is strategic and
highly valuable to the country’s leading defense, EV and clean energy sectors.
Test work to date has highlighted that the rare earth minerals at the Titan Project contain a high percentage of rare earth oxides, with significant proportions of the highly valuable heavy rare earths terbium and
dysprosium as well as the valuable light rare earths neodymium and praseodymium identified within IperionX’s monazite and xenotime mineral concentrates.
Table 15: Titan Project rare earth concentrate profile, highlighting enrichment of heavy rare earths.
|
(%)
|
Typical Monazite Concentrate
|
IperionX REE Concentrate
|
|
|
TREO
|
53 – 55
|
58 – 59
|
|
|
Monazite / Xenotime
|
-
|
80 / 10
|
|
|
LREO (% TREO)
|
90.7
|
79.5
|
|
|
HREO (% TREO)
|
9.3
|
20.5
|
|
|
NdPr Oxides (%TREO)
|
22.0
|
21.2
|
|
|
DyTb Oxides (%TREO)
|
0.9
|
2.4
|
In April 2021, IperionX and Energy Fuels signed a Memorandum of Understanding for the supply of monazite sands from IperionX’s Titan Project in Tennessee to Energy Fuels’ White Mesa Mill in Utah. Energy Fuels and
IperionX are continuing to evaluate expanding their collaboration to establish a fully integrated permanent rare earth magnet supply chain in the U.S.
In March 2022, Energy Fuels undertook laboratory evaluation of rare earth mineral concentrates from IperionX’s Titan Project in west Tennessee. Energy Fuels’ evaluation indicates that IperionX’s rare earth minerals
are suitable as a high quality feedstock to produce a high purity mixed rare earth carbonate at Energy Fuels’ White Mesa Mill in Utah. Energy Fuels is currently producing a mixed rare earth carbonate at commercial scale at its mill. This commercial
product is the most advanced rare earth material being produced in the U.S. today at scale.
Page 54
|
IPERIONX TITAN PROJECT – INITIAL ASSESSMENT
|
Energy Fuels also intends to construct solvent extraction rare earth separation infrastructure at its mill in the coming years, allowing the facility to produce separated rare earth oxides from high quality
feedstocks like the rare earth concentrate expected to be produced from IperionX’s Titan Project.
| 16.1.3 |
Titanium Products
|
Titanium is the key input into the global paints and pigment industry, while titanium metal is desired by industry for its light weight, high strength to weight ratio, stiffness, fatigue strength and fracture
toughness, excellent corrosion resistance, and the retention of mechanical properties at elevated temperatures. Titanium and titanium alloys are used in diverse areas such as aerospace, defense, automotive components, chemical processing equipment
and medical implants. However, a barrier for the widespread use of titanium is the cost associated with manufacturing a finished part, with approximately half of the cost historically associated with fabrication.
The U.S. market is one of the largest and highest value titanium markets globally due to the significant use of titanium in the high-performance space, aerospace and defense sectors.
In the report delivered in June 2021 by the U.S. Department of Commerce Bureau of Industry and Security, The Effect Of Imports Of Titanium Sponge On The National Security, it
was noted that Congress has recognized that titanium sponge is critical to national security by including titanium as a strategic material in the Specialty Metals Clause, with all titanium used in national defense systems directed to be melted or
produced in the United States or a qualifying country.
Further, the Department of the Interior’s 2018 List of Critical Minerals established titanium as essential to U.S. security, and found that the absence of a titanium sponge supply would have significant consequences
for the U.S. economy and the national security.
The U.S. was the first nation to commercialize titanium sponge production in the 1950s. In 1984, there were five plants producing titanium sponge in the U.S. but by 2019, only one producer was capable of producing
titanium sponge for defense, commercial, and industrial purposes. That final production facility closed in 2020 and now the U.S. has no commercial titanium sponge production capacity and is 99.9% import reliant to produce semi-finished and final
products.
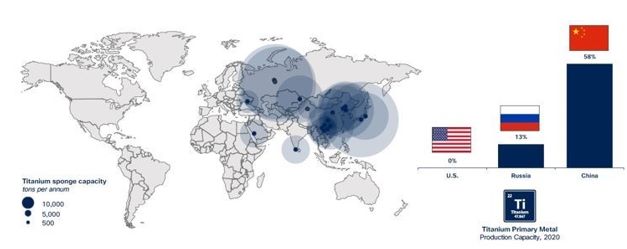
Figure 24: Global titanium sponge production capacity9.
9 Source: USGS
Page 55
|
IPERIONX TITAN PROJECT – INITIAL ASSESSMENT
|
The U.S. now has minimal commercial titanium sponge production capacity, which is a critical material for many U.S. defense systems, including fighter jets, bombers, attack aircraft, transports and helicopters, with
newer aircraft using increased amounts of titanium. Titanium is frequently deployed in applications which require high strength and low weight, such as the A-10 Thunderbolt II attack aircraft, where a titanium cockpit tub has proved vital to the
safe return of pilots despite heavy damage from enemy ground fire.
Table 16: Titanium content in select U.S. military airframes.
|
Airframe
|
Introduction into Service
|
% of Titanium Content
|
|
CH-47 Chinook
|
1962
|
8
|
|
F-15 Eagle
|
1976
|
10
|
|
F-16 Fighting Falcon
|
1978
|
7
|
|
F/A-18 Hornet
|
1984
|
12
|
|
F-22 Raptor
|
2005
|
39
|
|
V-22 Osprey
|
2007
|
31
|
|
F-35 Lightning II
|
2015
|
20
|
|
Military airframes entering service after 2000 have an average 30 percent titanium content; airframes entering service prior to 2000 had an average of just 9 percent.
|
||
|
Source: Arconic Engineered Structures, “World Titanium Trends in Defense”, Presentation at the Titanium USA conference, September 24, 2019
|
||
Titanium is also extensively used in naval applications due to is excellent anti-corrosion characteristics, as well as army ground vehicles and hypersonic missile programs due to its very high strength and light
weight.
Currently only Japan, Russia, and Kazakhstan have titanium sponge plants certified to produce aerospace rotating-quality sponge that can be used for aerospace engine parts and other sensitive aerospace applications.
In 2018, Russian and Chinese titanium sponge producers controlled 61% of the world’s titanium sponge production, an increase on their combined 55% share in 2008 and 37% share in 1998. In 2021, Russia and China’s control of global titanium sponge
production is likely to increase to over 70%
Absent domestic titanium sponge production capacity, the U.S. is completely dependent on imports of titanium sponge and scrap, and lacks the surge capacity required to support defense and critical infrastructure
needs in an extended national emergency.
Given the lack of domestic production capacity, and that the U.S. no longer maintains titanium sponge in the National Defense Stockpile, titanium producers, including producers of goods such as ingot, billet, sheet,
coil, and tube, are almost all entirely dependent on non-U.S. sources of titanium. This presents the possibility that in a national emergency, U.S. titanium producers would be denied access to imports of titanium sponge and scrap due to supply
disruption.
Titanium minerals found at the Titan Project are dominated by rutile and highly altered ilmenite, which are feedstocks for a variety of uses including for titanium dioxide, titanium metal and other applications
including welding and nanomaterials. Natural rutile is a high-grade titanium dioxide feedstock (typical TiO2 content of 92-95%), which commands a significant price
premium in the titanium dioxide market. Ilmenite is also a titanium dioxide feedstock (typical TiO2 content of 58-62%), which can be sold directly to pigment producers
or can be used as a feedstock for synthetic rutile production.
Test work to date indicates that ilmenite mineral found at the Titan Project is likely to be suitable for the chloride ilmenite market, with a TiO2 content greater than 58%. Additionally, the rutile product has the potential to be a high-grade feedstock, with a TiO2 content of between 93% and
97%.
Page 56
|
IPERIONX TITAN PROJECT – INITIAL ASSESSMENT
|
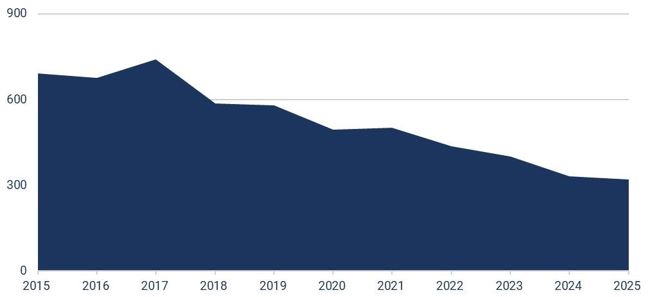
Figure 25: Global rutile supply outlook (kt)10.
In December 2021, the company entered into a Memorandum of Understanding with The Chemours Company (Chemours) for the supply of the titanium feedstocks ilmenite and rutile from IperionX’s Titan Project in west
Tennessee to Chemours. Chemours is one of the world’s largest producers of high quality titanium dioxide products for coatings, plastics, and laminates, with a nameplate titanium dioxide capacity of 1,250,000 tons globally, including New
Johnsonville, Tennessee, located 20 miles from IperionX’s Titan Project, and DeLisle, Mississippi, located 1,100 miles by back haul barge on the Mississippi River.
The MoU contemplates the commencement of negotiations of a supply agreement between IperionX and Chemours for an initial five year term on an agreed market based pricing methodology for the annual supply of up to
50,000 tons of ilmenite and 10,000 tons of rutile, which is equivalent to approximately 50% of total ilmenite production and approximately 60% of total rutile production over the first 5 years of operations at the Titan Project.
| 16.1.4 |
Zircon Products
|
Zircon is an opaque, hard mineral widely used in the production of ceramics, where it provides whiteness, strength and corrosion resistance, including in tiles, sinks, sanitary ware and tableware. Refractory linings
and foundry castings also utilize zircon in their manufacturing to provide chemical and corrosion resistance. Zircon can also be used as a feedstock for production of zirconium metal, used in many advanced industries including clean energy, health
and aerospace, with two zirconium metal producers currently operating in the U.S.
Test work to date indicates that zircon mineral found at the Titan Project is likely to be suitable for the premium zircon market, with a ZrO2+HfO2 content greater than 65%, with the potential to be sold into the domestic U.S. zircon premium market.
The global supply of zircon is forecast to decline due to mine depletions, with new projects required to meet predicted demand. There is no meaningful new capacity forecast in the near term, and market conditions
remain extremely tight.
10Source: Iluka Resources, February 2022 (link)
Page 57
|
IPERIONX TITAN PROJECT – INITIAL ASSESSMENT
|
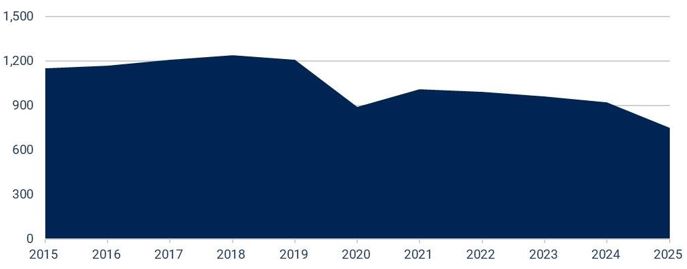
Figure 26: Global zircon supply outlook (kt)11.
In February 2022, the company entered into a Memorandum of Understanding with Mario Pilato BLAT S.A. (Mario Pilato) for the potential supply of zircon products. Mario Pilato is a leading international supplier of raw
materials for ceramics, glass and refractories, headquartered in Valencia, Spain The MoU contemplates the commencement of negotiations of a supply agreement between IperionX and Mario Pilato for an initial five year term on an agreed market based
pricing methodology for the annual supply of up to 20,000 tons of zircon products from the Titan Project, which is equivalent to approximately 50% of total zircon production over the first 5 years of operations at the Titan Project.
| 16.2 |
Price Forecasts
|
The Company engaged Adamas Intelligence, an independent research and advisory consultant focused on strategic metals and minerals, to provide a pricing methodology and price forecast for rare earth concentrates
produced at the Titan Project. The pricing methodology is based upon Adamas’ forecast pricing of IperionX’s rare earth concentrates with reference to the value of rare earth oxides contained, with a premium applied by Adamas for the specific rare
earth oxide enrichment, including heavy rare earths, contained within the Titan Project product.
The Company utilized commodity pricing based upon forecasts from TZMI for ilmenite, rutile and zircon products, adjusted for economic factors. TZMI is a global independent consulting and publishing company which
specializes in all aspects of the mineral sands, titanium dioxide and coatings industries, particularly the titanium and zirconium value chains. Zircon concentrate pricing forecasts have been assessed by the Company as receiving a 55% discount to
the price of premium zircon, a standard industry benchmark discount.
Table 17: Historic, spot, and forecast product prices (US$/t, 2022 real terms, rounded).
|
Product
|
Historic
2017 – 2021
(annual average,
US$/t)
|
Spot
pricing12
(US$/t)
|
Forecast
2023 – 2027
(annual average,
US$/t)
|
Forecast
2028+
(annual average,
US$/t)
|
|
Rare earth concentrate
|
$4,82113
|
$11,180 – $12,850
|
$14,325
|
$17,690
|
|
Rutile
|
$1,030
|
$1,960 – $2,280
|
$1,475
|
$1,285
|
|
Chloride Ilmenite
|
$200
|
$390 – $470
|
$305
|
$310
|
|
Zircon (premium)
|
$1,405
|
$2,500 – $3,025
|
$2,240
|
$1,685
|
|
Zircon (concentrate)
|
$630
|
$945 – $1,330
|
$1,010
|
$760
|
Page 58
Table 18: Historic, spot, and forecast individual REE prices (US$/t, 2022 real terms, rounded).
|
Rare Earth Oxide
|
Historic
2017 - 2021
(annual average
US$/kg)14
|
Spot
pricing15
(US$/kg)
|
Forecast
2023 - 2027
(annual average
US$/kg)
|
Forecast
2028+
(annual average
US$/kg)
|
|
|
Lanthanum
|
$1.8
|
$1.2
|
$1.4
|
$1.4
|
|
|
Cerium
|
$1.7
|
$1.3
|
$1.5
|
$1.5
|
|
|
Praseodymium
|
$64.1
|
$143.9
|
$194.4
|
$242.4
|
|
|
Neodymium
|
$58.2
|
$143.9
|
$204.6
|
$255.1
|
|
|
Samarium
|
$2.0
|
$$3.3
|
$4.9
|
$6.8
|
|
|
Europium
|
$44.5
|
$27.6
|
$34.5
|
$40.2
|
|
|
Gadolinium
|
$24.0
|
$79.0
|
$108.1
|
$130.1
|
|
|
Terbium
|
$695.0
|
$2,109.6
|
$2,419.6
|
$2,935.2
|
|
|
Dysprosium
|
$253.3
|
$371.2
|
$565.5
|
$690.6
|
|
|
Holmium
|
$61.7
|
$193.1
|
$295.5
|
$337.1
|
|
|
Erbium
|
$26.3
|
$53.7
|
$64.8
|
$73.9
|
|
|
Ytterbium
|
$12.8
|
$14.8
|
$18.6
|
$21.7
|
|
|
Lutetium
|
$545.8
|
$782.7
|
$900.9
|
$1,051.0
|
|
|
Yttrium
|
$3.6
|
$12.3
|
$16.1
|
$22.7
|
Pricing has been based upon the following standard product specification requirements:
Table 19: Initial Assessment product specification requirements.
|
Product
|
Product specification requirements
|
|
|
Rare earth concentrate
|
Mineral rare earth concentrate with 58.68 weight % total rare earth oxides (TREO) – as set out in Table 20. Value of rare earth concentrate calculated as 31% value of contained TREO plus 10% premium for Titan Project’s heavy rare earth
enrichment.
|
|
|
Rutile
|
Bulk rutile with titanium dioxide content (TiO2) of 94% - 96%
|
|
|
Chloride Ilmenite
|
Chloride ilmenite with titanium dioxide content (TiO2) of 58% - 65%
|
|
|
Zircon (premium)
|
Premium bulk zircon with ZrO2 + HfO2 >66%
|
|
|
Zircon (concentrate)
|
Zircon concentrate with ZrO2 + HfO2 >30%
|
Table 20: Key product specifications of Titan-derived rare earth mineral concentrate.
|
Rare Earth Oxide
|
Concentration (weight %)
|
|
|
La
|
10.50%
|
|
|
Ce
|
21.90%
|
|
|
Pr
|
2.59%
|
|
|
Nd
|
9.85%
|
|
|
Sm
|
1.80%
|
|
|
Eu
|
0.15%
|
|
|
Gd
|
1.48%
|
|
|
Tb
|
0.20%
|
|
|
Dy
|
1.19%
|
|
|
Ho
|
0.22%
|
|
|
Er
|
0.66%
|
|
|
Tm
|
0.09%
|
|
|
Yb
|
0.54%
|
|
|
Lu
|
0.08%
|
|
|
Y
|
7.43%
|
|
|
TREO
|
58.68%
|
11 Source: Iluka Resources, February 2022 (link).
12 Source: Ruidow.com at June 29, 2022 and Iluka Resources.
13 Refer to Table 18 for individual prices for REE’s that contribute to the REE concentrate price and Table 20 for the percentage of each REE in our
REE concentrate. REE historic average pricing is based on limited available data for 2017.
14 REE historic average pricing is based on limited available data for 2017.
15 Source: Argus at June 29, 2022.
Page 59
|
IPERIONX TITAN PROJECT –INITIAL ASSESSMENT
|
| 17. |
Environmental Studies, Permitting, and Plans, Negotiations, or Agreements with Local Individuals or Groups
|
| 17.1 |
Environmental Studies
|
| 17.1.1 |
Critical Issues Analysis
|
IperionX has engaged HDR to support permitting activities on the proposed Project. In 2020, HDR conducted a desktop review of topographic and aerial photograph base maps for the Project area utilizing publicly
available Geographic Information System (GIS) and interactive web-based mapping applications.
HDR utilized available data for Benton, Carroll and Henry Counties, TN to assess potential environmental conditions.
Following mapping and the initial environmental assessment, HDR completed a regulatory review and permit evaluation of the proposed Project as it relates to the following federal, state, and local environmental
regulations:
| • |
Clean Water Act (Sections 404 and 401);
|
| • |
National Pollutant Discharge Elimination System (NPDES) for Storm Water Discharges associated with Construction;
|
| • |
Section 10 (Rivers and Harbors Act);
|
| • |
Federal and State Threatened & Endangered Species;
|
| • |
Section 106 Historic Preservation Act;
|
| • |
Public Lands Permitting;
|
| • |
State and Local Floodplain;
|
| • |
State and Local Construction Dewatering;
|
| • |
Local Soil Erosion and Sedimentation Control requirements;
|
| • |
State Mining Permit; and,
|
| • |
Other applicable state and local environmental requirements.
|
| 17.1.2 |
USACE Wetland Delineation and TDEC Hydrologic Determination Field Work
|
In 2021, HDR conducted a stream/wetland delineation, threatened and endangered species habitat survey, cultural resources review, and continue to support a groundwater quality and quantity testing program.
HDR conducted field visits in May and June 2021 to document United States Army Corps of Engineers (USACE)-regulated jurisdictional Waters of the U.S. and TDEC-regulated waters of the state within the site.
| 17.1.3 |
Federally and State Threatened and Endangered Habitat Survey
|
HDR identified federal and state listed species habitat likely to occur on or in the vicinity of the site. HDR requested an Environmental Review through TDEC Natural Heritage Program (NHP) which provided
site-specific data of known state and federal concern plant and animal species, ecologically significant sites, and certain conservation managed lands. Concurrent with Task 2, HDR conducted a pedestrian survey of the site to verify the presence or
absence of potential habitat for federally threatened and endangered species that may occur on the site. A brief memo to IperionX was prepared detailing the results of the federal and state threatened and endangered (T&E) species habitat survey
results. The memo was delivered to IperionX on July 1, 2021.
| 17.1.4 |
Cultural Resources Background Research
|
HDR conducted a National Historic Preservation Act (NHPA) cultural resources background investigation for the approximately 2,432-acre Titan Project in Carroll and Henry counties, Tennessee in April 2021. The purpose
of the investigation was to identify known historic (National Register of Historic Places (NRHP)-eligible) properties in the Project Area and surrounding one-mile radius and make recommendations on further NHPA cultural resources work for the
Project.
Page 60
|
IPERIONX TITAN PROJECT – INITIAL ASSESSMENT
|
The research included results from the Tennessee Division of Archaeology (TDOA), the Tennessee Historical Commission (THC), the NRHP GIS database, and the Tennessee Cemetery Database (TNGenWeb). HDR synthesized the
research results and authored a report summarizing the findings of the background investigation completed for the Titan Project and associated recommendations that was delivered to IperionX on June 30, 2021.
HDR identified six previously recorded archaeological sites and five cemeteries within one mile of the Project Area. None of these known resources are located in the Project Area.
| 17.1.5 |
Groundwater Quality and Quantity Testing Program
|
HDR proposed to support IperionX with an evaluation of groundwater conditions within the Study area through 1) completion of an aquifer pumping test and 2) groundwater level monitoring and groundwater quality
testing. Both tasks required installation of monitoring wells.
In Q2 2021, HDR provided oversight for the installation of monitoring and aquifer test wells; conducted a 72-hour aquifer pumping test; and conducted the first of six planned bi-monthly groundwater sampling events.
The purpose of the well installation and testing is to provide a baseline understanding of aquifer properties, groundwater position, and ground water quality as they pertain to development of the Site as a mineral sand mine.
HDR will continue to collect baseline groundwater and surface water quality data on a bi-monthly basis for a period of one year. In 2022, HDR will provide a memo summarizing findings to include boring logs, sample
location map, potentiometric surface maps (per sampling event), aquifer test results, stream flow measurements, and laboratory data for groundwater and surface water samples.
|
17.1.6
|
Opinion of Qualified Person
|
The QP is comfortable that the current environmental plans to address environmental compliance, permitting, and local communities as reported in this TRS are adequate, in the opinion of the QP.
| 17.2 |
ESG Assessment and Integration
|
In May 2021, IperionX commenced an ESG (environmental, social, and governance responsibility) assessment and integration process, toward its development plan to produce low-to-zero carbon titanium in the U.S. The
company commissioned PGS Consults to conduct the following activities: materiality assessment, life cycle assessment, ESG-leadership playbook, and an environmental health and safety (EHS) management system gap assessment.
| 17.2.1 |
ESG Materiality Assessment
|
During the summer of 2021, PGS Consults was pleased to interview 59 individual identified stakeholders representing over 30 companies and organizations. The purpose of the interviews was to assess what Environmental,
Social, and Governance factors were most material for IperionX based on their stakeholder’s feedback. All interviews were anonymous, and all information gathered was aggregated, except for the final question where interviewees were invited to share
their thoughts associated with their name.
Of the respondents, 5 are IperionX executives and board members, 5 are IperionX management, and 49 work for other organizations or are representing themselves as residents near IperionX’s Tennessee location and
represented a variety of stakeholder categories.
| 17.2.2 |
ESG Factors Most Material to IperionX
|
Based on the ratings collected during the stakeholder interviews, PGS Consults plotted the potential material factors, as shown below. The material factors were scored by IperionX’s stakeholders from 1 (least
important) to 3 (most important) and were graphed with the internal stakeholder’s scoring on the “X” axis and the external stakeholder’s scoring on the “Y” axis. As can be seen by the range of the graph below, IperionX’s stakeholders scored most
of the material factors highly. The most important material factors appear in the darker blue areas of the graph (top and right portions), the medium ranked factors are in the medium blue (middle) portion of the graph.
Page 61
|
IPERIONX TITAN PROJECT – INITIAL ASSESSMENT
|
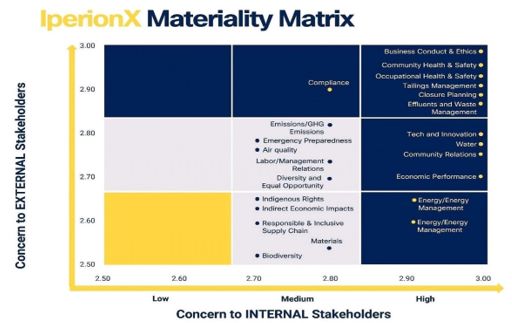
Figure 27: IperionX materiality index.
From the materiality matrix above, PGS Consults identified five ESG focus areas for IperionX:
| • |
ESG Focus Area 1 – Business Conduct & Ethics and Regulatory Compliance.
|
| • |
ESG Focus Area 2 – Health & Safety – Community & Employees.
|
| • |
ESG Focus Area 3 – End-State Vision: Tailings Management & Closure Planning.
|
| • |
ESG Focus Area 4 – Community & Labor Relations: Employment & Diversity/Equity/Inclusion.
|
| • |
ESG Focus Area 5 – Environmental Management: GHG Emissions, Air quality, water, energy, waste, biodiversity.
|
| 17.2.3 |
Life Cycle Assessment
|
Following the materiality assignment, PGS Consults began a life cycle assessment (LCA) of one of IperionX’s metals processes at their Utah facilities. The Granulation, Sintering, Deoxygenation (GSD) converts scrap
titanium metal to pure spherical titanium powder for the additive manufacturing industry. The LCA will help IperionX to continue to decarbonize their processes and compare the impacts of their process to more conventional titanium processes.
| 17.2.4 |
ESG Playbook
|
PGS Consults next prepared a “playbook” for IperionX’s ESG leadership and attainment of preliminary sustainability goals, tied to the five focus areas identified during the Materiality Assessment. Concurrently, the
consultants are forecasting the cost, impacts, and return on investment (ROI) and other business benefits of IperionX’s key ESG goals.
| 17.2.5 |
EHS Management System
|
As part of their commitment to the health and safety of their employees and the environment in which they operate, IperionX commissioned PGS Consults to conduct a Gap Assessment of IperionX’s Tennessee and Utah
operations against the global standards of ISO 45001 (occupational health and safety management systems) and ISO 14001 (environmental management systems). This EHS Management System Gap Assessment was completed in the fourth quarter of 2021 and
identified key improvement areas for IperionX. Next PGS Consults prepared an Implementation Plan to support IperionX in setting up a world class EHS Management system to ensure compliance and leading environmental and occupational health and
safety management in all their operations.
Page 62
|
IPERIONX TITAN PROJECT – INITIAL ASSESSMENT
|
| 17.2.6 |
ESG – Next Steps
|
During the first quarter of 2022, PGS Consults initiated work on IperionX’s carbon footprint baseline to quantify their carbon footprint for fiscal years 2021 and 2022, to support their company-wide low-to-zero
carbon goal. Additionally, work has commenced to prepare the first Annual Sustainability Report for IperionX, targeting a third quarter 2022 publication. This report will further summarize all the ESG achievements and ongoing work towards
IperionX’s ESG goals.
| 17.3 |
Community Engagement
|
The groundwork has been laid regarding the community engagement initiative, and we are very proud of those results thus far. Clearly, community relationships and engagement has made a positive impact on the corporate
image and brand reputation. We have built honest trusting relationships within the community as well as within the state. At IperionX, we are extremely dedicated to building these trusting and sustainable relationships. Being successful in a
community means creating long-term opportunity, managing environmental impacts and caring about the communities, their health and safety. The support of the communities, local and state governments is necessary in setting the standards that will
make lasting, generational differences between industries and the communities. We have been very fortunate to have the full support of the communities, and the government in our areas, and we know the value of that union and trust.
IperionX will continue to foster these community relationships. Collectively we work with the communities, organizations, and stakeholders in a structured way. This allows IperionX to continue to build trust, broaden
support, improve knowledge, promote participation, and involvement. All of these conditions together have certainly produced extraordinary results. The outcome has been allies, advocates and outside voices that actively validate and support
IperionX. This has allowed us to improve our visibility and awareness, increase collaboration, communication and engagement with community members, stakeholders, and key partners. We are able to share resources and exchange ideas, and provide trust
and accurate understanding of IperionX’s ultimate values, mission and vision.
Some examples of those people and organizations who we continue to engage with include (but not limited to) TDEC, TVA, TN state government officials, community members, business owners, local government officials,
local school systems, universities, tech schools, local and state government groups IperionX will continue identifying and engaging with new groups and stakeholders. IperionX’s vision is to create a legacy of operational excellence by maintaining
positive and sustainable industry standards, credible communications, and shared beneficial opportunities, including a focus on local employment. We continue to operate a transparent and open door standard.

Figure 28: Community engagement activities.
Page 63
|
IPERIONX TITAN PROJECT – INITIAL ASSESSMENT
|
| 17.4 |
Partnership with University of Tennessee’s Institute of Agriculture (UTIA)
|
IperionX is partnering with the University of Tennessee Institute of Agriculture to research the implementation of sustainable operating and rehabilitation practices at the Titan Project in West Tennessee. The
University of Tennessee is the flagship university in the state of Tennessee, and UTIA is at the forefront of agribusiness research, education and community outreach. The Titan Project includes programs focused on post mineral extraction practices
and carbon sequestration opportunities for generational land-use benefits for local landowners.
The initial scope of work will focus upon the elimination of invasive vegetation and subsequent improved ecological revegetation utilizing native warm season grasses, undertaken on IperionX’s owned properties.
IperionX will establish a 10-acre demonstration site at the Titan Project for UTIA’s use for the initial scope of work, with the potential for the site to be used for further sustainability investigations, including the use of biochars, gypsum and
other soil amendments to aid in higher crop yields and the carbon sequestration
| 17.4.1 |
Native Warm Season Grasses
|
Native Warm Season Grasses (NWSGs) are a variety of tall-growing bunch grasses that grow during the warmer months of the year and lay dormant in the autumn and winter. Native grasslands are among the most endangered
ecosystems in the Mid-South of the U.S., resulting in habitat destruction for native fauna including quail, rabbits and grassland songbirds, who use native grasslands for cover and nesting.
NWSGs are known for their fast-growing, deep root systems, which retain soil and help prevent erosion, along with their high-quality forage and hay production once mature. These deeper root systems help NWSGs
sequester more carbon than their non-native counterparts. Research has shown that NWSGs grow better and have better yields than non-native grasses commonly used at reclaimed mineral extraction operations in North America. UTIA and IperionX will
investigate the usage of Big Bluestem, Little Bluestem, and Indian Grass at the Titan Project to help remediate post-mining areas and return the land to its natural state with strong ecosystems, and potentially provide meaningfully higher
production capacity than pre-mining. Figure 29 shows the difference between NWSGs root depth and non-native grasses.
Page 64
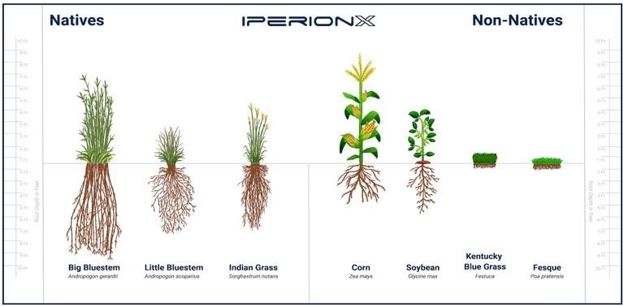
Figure 29: Native grass root growth vs. non-native.
Page 65
|
IPERIONX TITAN PROJECT – INITIAL ASSESSMENT
|
| 17.4.2 |
Biochar and Gypsum Soil Amendments
|
Biochar is a charcoal-like material made from grasses, wood and other plant materials, that is produced via the thermochemical decomposition of biomass at high temperature in low oxygen environments. Biochar is added
to soil mixtures to improve the productivity and resilience of agricultural systems by increasing water retention and increasing plant nutrient availability.
Gypsum, also known as calcium sulfate, is one of the earliest forms of fertilizer with 250 years of agricultural use. Gypsum’s primary applications include high-sodium soil remediation, breaking up compact soils like
clays, and providing calcium and sulfate sulfur nutrients to plants. Furthermore, it neutralizes aluminum toxicity in soils and improves drainage, reducing phosphorous runoff, crusting and ponding. Recent research has focused on using gypsum soil
additives as a potential means of carbon sequestering in soils by enhancing root growth, which UTIA and IperionX will investigate at the Titan Project.
| 17.4.3 |
Carbon Sequestrating
|
Carbon sequestration is the removal and storage of carbon from the atmosphere, including by plants in the form of undecomposed organic material, primarily as dead plant root material. As such, plants with
fast-growing, deep root systems, including Native Warm Season Grasses, may provide a significant opportunity for carbon sequestration under the right conditions, as does the use of soil additives which promote organic growth, including gypsum.
| 17.5 |
Waste Disposal and Closure Planning
|
Five waste and tailings types are generated at the Project, being:
| • |
Dry waste from the overburden waste and inter-burden waste.
|
| • |
Plus 250mm reject trash at MMU feed hopper grizzly.
|
| • |
Plus 2mm oversize material reject from the feed preparation trommel generated from the ROM feed.
|
| • |
Wet waste from the return of the sand tailing from the WCP generated from the ROM feed.
|
| • |
Dewatered slimes from the WCP generated from the ROM feed.
|
Dry waste is managed as by dry mining methods, with wet waste sand from the WCP returned via pipeline to the mine workings where it is discharged by a cyclone cluster that dumps retrieved water from the waste stream,
dumping high solid content sands into a cone. This sand will then be moved be spread by the Swamp D7 dozers, with the dewatered slimes from WCP being returned to the mining void by trucks prior to being covered by the dry overburden and
interburden.
The mineralized material oversize reject material that is pulled from the mineralized material stream from the in-pit mining unit at the trommel is planned to be stockpiled for use in road works. It is likely that
this material will be only onsite source of hard material that can be used to improve road conditions. While it is treated as an operating cost, this material also is valuable to the operations and the amount recovered could offset additional costs
to import road building material from off-site.
A detailed waste and tailings disposal as well as the site water management plan will be developed in the next phase of the study.
Initial mine closure planning has been undertaken with temporary stockpiles for waste and topsoil to be replaced during the final mine void closure. To limit costs at mine closure, consideration during future mine
scheduling will be given to where waste and topsoil is stockpiled from the initial mining void.
An allowance of mine closure cost of 10.25 US$ Million is estimated as part of the initial assessment. A detailed mine closure and rehabilitation plan will be developed in accordance with the regulations.
IperionX is partnering with the University of Tennessee Institute of Agriculture to research the implementation of sustainable operating and rehabilitation practices at the Titan Project in West Tennessee. The
University of Tennessee is the flagship university in the state of Tennessee, and UTIA is at the forefront of agribusiness research, education and community outreach. The Titan Project includes programs focused on post mineral extraction practices
and carbon sequestration opportunities for generational land-use benefits for local landowners.
IperionX is committed to prioritize local procurement and hiring during the Project development, execution, and operations.
Page 66
|
IPERIONX TITAN PROJECT – INITIAL ASSESSMENT
|
| 18. |
Capital and Operating Costs
|
| 18.1 |
Capital Cost Estimate
|
Capital Estimates for the mine and process plant have been prepared by Primero Group using a combination of cost estimates from suppliers, historical data, reference to recent comparable projects. Costs are presented
in US$ for Q2 2022 and are exclusive of escalation. The intended accuracy of the initial capital cost estimate for the Project is ± 35%.
The cost estimate basis along with the exchange rates used for the Project CAPEX is 0.73 USD/AUD.
The capital cost estimate was developed in two parts:
| • |
Direct costs for the mine pre-production, wet concentrate plant (WCP), mineral separation plant (MSP), common services including reagents and air/water services and non-process infrastructure.
|
| • |
Indirect costs were estimated for engineering, construction, and owner’s costs.
|
For the mine, the CAPEX estimation is based on the following aspects: clearing & grubbing, mine development, pumping & infrastructure, mobile mining equipment, and mining contractor mobilization.
For the WCP and MSP facilities, the process design criteria, flowsheets and mass balance calculations were produced with sufficient detail to allow for the preparation of a mechanical equipment list. Equipment
pricing was collected from benchmark information. The Project used as a benchmark is a similar circuit producing both WCP and MSP products. The Project is currently under construction in Australia, being managed by Primero. The overall supply
cost of mechanical equipment was then used to factor all other direct discipline costs such as concrete, steelwork, platework, piping, electrical, and instrumentation and control. These factors were also derived from the benchmarked Project.
In-direct costs, including EPCM, off-site management, capital spares, flights and accommodation, first fills and commissioning costs were also factored from the Project direct costs.
Project contingency was calculated as a factor of the total direct and in-direct costs.
For the non-process infrastructure (NPI), allowances were made for some costs not related to the mechanical equipment supply including process buildings and non-process infrastructure.
Table 21 highlights the total estimated capital expenditures for the Project.
Table 21: Titan Project capital cost estimate summary.
|
Capital Cost Estimate Breakdown
|
US$ Million
|
|
|
Mine and Wet Concentration Plant
|
94.6
|
|
|
Mineral Separation Plant
|
22.3
|
|
|
Common Services
|
12.5
|
|
|
Project Indirects
|
35.2
|
|
|
Mobile Mining Units Turnkey
|
23.3
|
|
|
Contingency (30%)
|
49.4
|
|
|
Total Initial Capital
|
237.2
|
|
|
Deferred and sustaining capital
|
198.5
|
| 18.2 |
Operating Cost Estimate
|
The operating cost estimate was prepared based on operating at annual average of 9.7 million t/y run-of-mine mineralized resource for a mine life of 25 years. Table 22 summarizes the estimated operating costs at
steady state.
Page 67
|
IPERIONX TITAN PROJECT – INITIAL ASSESSMENT
|
The operating cost estimate has been performed for the mining, tailings deslime, wet concentrator plant (WCP) that produces HMC and mineral separation plant (MSP). General and administration has been treated
separately.
The following non-exhaustive list of cost centers have been used for the estimation: Salaries; G&A; reagents; consumables; utilities (electricity, fuel, water, etc.); and maintenance.
The processing plant operating cost estimate is based on a ±35% level of accuracy, utilizing indicative quotations where possible, and otherwise Primero database estimates and recent experience in the industry.
The OPEX is presented in USD and is current for Q1 2022.
Table 22: Titan Project operating cost estimate summary.
|
Operating Cost Estimate Breakdown
|
Average Annual Cost
(US$ Million/y)
|
US$/t ROM
|
|
|
Mining
|
25.8
|
2.66
|
|
|
Processing
|
28.2
|
2.91
|
|
|
Transport
|
2.1
|
0.22
|
|
|
General & Admin
|
6.9
|
0.71
|
|
|
Royalties
|
4.0
|
0.41
|
|
|
Total Operating Costs
|
67.1
|
6.91
|
Page 68
|
IPERIONX TITAN PROJECT – INITIAL ASSESSMENT
|
| 19. |
Economic Analysis
|
A detailed financial model and discounted yearly cash flow (DCF) has been developed to complete the economic assessment of the Project and is based on current (Q1 2022) price projections and cost estimates in U.S.
dollars. No provision was made for the effects of future inflation, but cost estimates incorporate recent 2021 inflationary price increases. The evaluation was carried out on a 100%-equity basis using an 8% discount factor. Current US federal and
Tennessee state tax regulations were applied to assess the corporate tax liabilities.
The total mine life utilized in the model is 25 years scheduled yearly with the first 14 years of the mine life classified as 100% indicated. The WCP & MSP commence operations at the same time and have a ramp up
period of 8 months before reaching nameplate production.
| 19.1 |
Royalties, Taxes, Depreciation, and Depletion
|
The Initial Assessment project economics include the following key parameters related to royalties, tax, depreciation, and depletion allowances.
| • |
Royalties of 5% of revenue generated are based on the average land lease agreement.
|
| • |
Federal tax rate of 21% and Tennessee state corporate tax rate of 6.5% are applied.
|
| • |
Depletion allowance of 22% of heavy mineral sands is applied to sales price.
|
| • |
Depletion allowances for rare earth concentrate are assumed as 14%.
|
| • |
Depreciation in the mine and concentrate operations is based on Asset Class 10 – Mining in IRS Table B-1 using GDS of 7 years with the double declining balance method.
|
| 19.2 |
Initial Assessment Economics
|
The DCF analysis demonstrated compelling economics of the prospective Titan Project, with an NPV (after-tax, at an 8% discount rate) of US$692 million and an IRR of 40%. The DCF analysis also highlighted the low
operating costs, low royalties, and low corporate tax rates. Sensitivity analysis was performed on all key assumptions used. The robust Titan Project economics insulates IperionX’s Titan Project from variation in market pricing, capital expense, or
operating expenses. Payback period for the Project is 1.9 years from the start of operations. The payback period is based on free-cash flow, after taxes.
In the unlikely event that the remaining Inferred Mineral Resources are not able to be upgraded, the Project’s viability is not affected. This is supported by a stand-alone DCF analysis prepared that assumes only
Indicated Resources are included the mine plan in order to demonstrate the economic viability of the Project. Assuming only Indicated Resources are mined, the revised production target would be approximately 136.5 Mt ROM mineralized resource and
the mine life would be approximately 14 years. This DCF analysis demonstrates that the Project would still be expected to exhibit levels of profitability that would contribute significant value to IperionX shareholders, even if no additional
Indicated Resources are upgraded from existing Inferred Resources or replaced with new Indicated Resources that are yet to be discovered. The DCF analysis assuming only Indicated Resources are included the mine plan demonstrated with an NPV
(after-tax, at an 8% discount rate) of US$469 million and an IRR of 39%.
The main Project economic indicators are presented in Table 23.
Table 23: Project economic measures summary.
|
Economic Measures Summary (After Tax)
|
Value
|
|
|
Annual EBITDA (first five years)
|
$118M
|
|
|
Project NPV (discounted at 8.0%)
|
$692M
|
|
|
Internal rate of return (IRR)
|
40%
|
|
|
Payback period (from start of operations)
|
1.9 y
|
Page 69
|
IPERIONX TITAN PROJECT – INITIAL ASSESSMENT
|
Table 24: Key financial assumptions
|
Financial Assumptions
|
UoM
|
Value
|
|
|
Ilmenite LOM weighted average realized price
|
$/t
|
311
|
|
|
Rutile LOM weighted average realized price
|
$/t
|
1,311
|
|
|
Monazite LOM weighted average realized price
|
$/t
|
17,356
|
|
|
Zircon premium LOM weighted average realized price
|
$/t
|
1,748
|
|
|
Zircon concentrate LOM weighted average realized price
|
$/t
|
787
|
|
|
Discount rate
|
%
|
8
|
|
|
Royalties (leased land only)
|
%
|
5
|
|
|
Federal tax rate
|
%
|
21
|
|
|
Tennessee state corporate tax rate
|
%
|
6.5
|
|
|
Ilmenite depletion
|
%
|
22
|
|
|
Rutile depletion
|
%
|
22
|
|
|
Monazite depletion
|
%
|
14
|
|
|
Zircon premium
|
%
|
22
|
|
|
Zircon concentrate
|
%
|
22
|
|
|
Depreciation
|
-
|
7 year double declining method
|
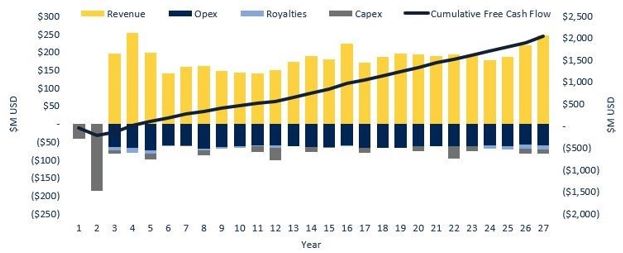
Figure 30: Titan Project after tax real cashflows.
Page 70
|
IPERIONX TITAN PROJECT – INITIAL ASSESSMENT
|
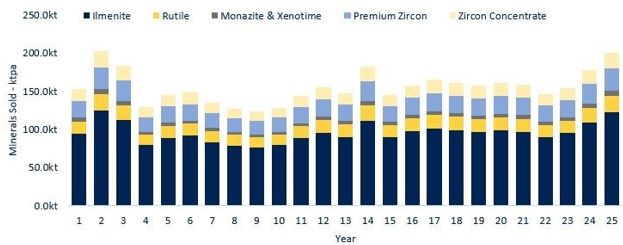
Figure 31: Titan Project production profile.
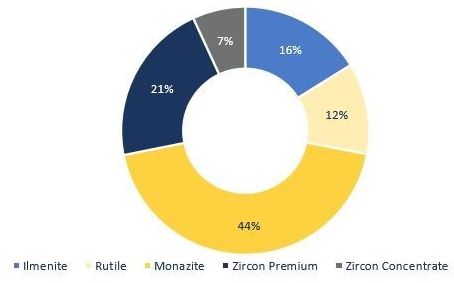
Figure 32: Titan Project revenue by product %.
Page 71
Table 25: Annual cash flow summary (Indicated and Inferred Resources)
|
Units
|
LOM Total
|
||||||||||||||||||||||||||||||||||||||||||||||||||||||||||||
|
Calendar Year
|
2023
|
2024
|
2025
|
2026
|
2027
|
2028
|
2029
|
2030
|
2031
|
2032
|
2033
|
2034
|
2035
|
2036
|
|||||||||||||||||||||||||||||||||||||||||||||||
|
Operation Year
|
0
|
1
|
2
|
3
|
4
|
5
|
6
|
7
|
8
|
9
|
10
|
11
|
12
|
13
|
|||||||||||||||||||||||||||||||||||||||||||||||
|
Mining and Processing Schedule
|
|||||||||||||||||||||||||||||||||||||||||||||||||||||||||||||
|
Total Material Mined
|
Mt
|
406.0
|
-
|
-
|
13.6
|
16.0
|
22.3
|
14.7
|
13.6
|
21.3
|
18.5
|
17.6
|
16.3
|
15.6
|
15.9
|
16.5
|
|||||||||||||||||||||||||||||||||||||||||||||
|
Total Ore Mined
|
Mt
|
242.6
|
-
|
-
|
10.0
|
9.8
|
9.9
|
9.9
|
9.9
|
9.7
|
9.4
|
9.4
|
9.5
|
9.6
|
9.7
|
9.9
|
|||||||||||||||||||||||||||||||||||||||||||||
|
Total Waste Mined
|
Mt
|
163.4
|
-
|
-
|
3.6
|
6.2
|
12.3
|
4.8
|
3.7
|
11.7
|
9.1
|
8.2
|
6.8
|
6.0
|
6.1
|
6.6
|
|||||||||||||||||||||||||||||||||||||||||||||
|
Mining Losses, Oversize, and Trash
|
Mt
|
4.5
|
-
|
-
|
0.3
|
0.2
|
0.3
|
0.2
|
0.2
|
0.2
|
0.2
|
0.1
|
0.1
|
0.1
|
0.1
|
0.1
|
|||||||||||||||||||||||||||||||||||||||||||||
|
Slimes
|
Mt
|
40.5
|
-
|
-
|
1.8
|
1.6
|
1.7
|
1.7
|
1.8
|
1.5
|
1.4
|
1.4
|
1.4
|
1.5
|
1.7
|
1.9
|
|||||||||||||||||||||||||||||||||||||||||||||
|
Total Heavy Minerals (THM) In-Situ
|
Mt
|
7.2
|
-
|
-
|
0.4
|
0.4
|
0.4
|
0.2
|
0.3
|
0.3
|
0.3
|
0.3
|
0.3
|
0.3
|
0.3
|
0.3
|
|||||||||||||||||||||||||||||||||||||||||||||
|
In-Situ Total Heavy Minerals Grade
|
% THM
|
3.0
|
%
|
-
|
-
|
3.8
|
%
|
4.2
|
%
|
3.6
|
%
|
2.3
|
%
|
2.6
|
%
|
3.0
|
%
|
2.9
|
%
|
2.8
|
%
|
2.7
|
%
|
2.7
|
%
|
2.8
|
%
|
2.8
|
%
|
||||||||||||||||||||||||||||||||
|
Mineral Grade Splits
|
|||||||||||||||||||||||||||||||||||||||||||||||||||||||||||||
|
Ilmenite
|
% THM
|
40.2
|
%
|
-
|
-
|
40.4
|
%
|
35.9
|
%
|
38.1
|
%
|
42.5
|
%
|
41.6
|
%
|
37.9
|
%
|
36.7
|
%
|
35.2
|
%
|
35.3
|
%
|
36.6
|
%
|
39.3
|
%
|
41.9
|
%
|
||||||||||||||||||||||||||||||||
|
Rutile
|
% THM
|
9.4
|
%
|
-
|
-
|
9.5
|
%
|
8.4
|
%
|
8.9
|
%
|
10.0
|
%
|
9.8
|
%
|
8.9
|
%
|
8.6
|
%
|
8.3
|
%
|
8.3
|
%
|
8.6
|
%
|
9.2
|
%
|
9.8
|
%
|
||||||||||||||||||||||||||||||||
|
Monazite
|
% THM
|
2.1
|
%
|
-
|
-
|
2.2
|
%
|
1.9
|
%
|
2.0
|
%
|
2.3
|
%
|
2.3
|
%
|
1.9
|
%
|
1.8
|
%
|
1.7
|
%
|
1.8
|
%
|
1.9
|
%
|
2.1
|
%
|
2.3
|
%
|
||||||||||||||||||||||||||||||||
|
Zircon
|
% THM
|
11.5
|
%
|
-
|
-
|
11.6
|
%
|
10.2
|
%
|
10.9
|
%
|
12.2
|
%
|
12.0
|
%
|
10.7
|
%
|
10.3
|
%
|
9.9
|
%
|
10.0
|
%
|
10.4
|
%
|
11.2
|
%
|
12.0
|
%
|
||||||||||||||||||||||||||||||||
|
In-Situ Mineral Content in Mined Material
|
|||||||||||||||||||||||||||||||||||||||||||||||||||||||||||||
|
Ilmenite
|
Mt
|
2.9
|
-
|
-
|
0.2
|
0.1
|
0.1
|
0.1
|
0.1
|
0.1
|
0.1
|
0.1
|
0.1
|
0.1
|
0.1
|
0.1
|
|||||||||||||||||||||||||||||||||||||||||||||
|
Rutile
|
Mt
|
0.7
|
-
|
-
|
0.0
|
0.0
|
0.0
|
0.0
|
0.0
|
0.0
|
0.0
|
0.0
|
0.0
|
0.0
|
0.0
|
0.0
|
|||||||||||||||||||||||||||||||||||||||||||||
|
Monazite
|
Mt
|
0.2
|
-
|
-
|
0.0
|
0.0
|
0.0
|
0.0
|
0.0
|
0.0
|
0.0
|
0.0
|
0.0
|
0.0
|
0.0
|
0.0
|
|||||||||||||||||||||||||||||||||||||||||||||
|
Zircon
|
Mt
|
0.8
|
-
|
-
|
0.0
|
0.0
|
0.0
|
0.0
|
0.0
|
0.0
|
0.0
|
0.0
|
0.0
|
0.0
|
0.0
|
0.0
|
|||||||||||||||||||||||||||||||||||||||||||||
|
Wet Concentration Plant Feed
|
Mt
|
237.3
|
-
|
-
|
9.6
|
9.5
|
9.6
|
9.6
|
9.6
|
9.4
|
9.3
|
9.3
|
9.3
|
9.4
|
9.6
|
9.6
|
|||||||||||||||||||||||||||||||||||||||||||||
|
Heavy Mineral Concentrate Produced
|
Mt
|
7.6
|
-
|
-
|
0.4
|
0.4
|
0.4
|
0.2
|
0.3
|
0.3
|
0.3
|
0.3
|
0.3
|
0.3
|
0.3
|
0.3
|
|||||||||||||||||||||||||||||||||||||||||||||
|
Saleable Mineral Products Recovered
|
|||||||||||||||||||||||||||||||||||||||||||||||||||||||||||||
|
Ilmenite
|
kt
|
2,388.0
|
-
|
-
|
94.0
|
124.4
|
112.2
|
79.0
|
89.0
|
91.4
|
83.4
|
78.8
|
76.3
|
79.2
|
88.4
|
95.3
|
|||||||||||||||||||||||||||||||||||||||||||||
|
Rutile
|
kt
|
417.5
|
-
|
-
|
16.4
|
21.7
|
19.6
|
13.8
|
15.6
|
16.0
|
14.6
|
13.8
|
13.3
|
13.9
|
15.5
|
16.7
|
|||||||||||||||||||||||||||||||||||||||||||||
|
Monazite
|
kt
|
116.2
|
-
|
-
|
4.7
|
6.0
|
5.5
|
3.9
|
4.4
|
4.2
|
3.7
|
3.5
|
3.5
|
3.7
|
4.3
|
4.8
|
|||||||||||||||||||||||||||||||||||||||||||||
|
Zircon Premium
|
kt
|
559.6
|
-
|
-
|
22.1
|
29.1
|
26.3
|
18.6
|
20.9
|
21.2
|
19.2
|
18.1
|
17.7
|
18.4
|
20.7
|
22.5
|
|||||||||||||||||||||||||||||||||||||||||||||
|
Zircon Concentrate
|
kt
|
402.4
|
-
|
-
|
15.9
|
20.9
|
18.9
|
13.4
|
15.1
|
15.3
|
13.8
|
13.0
|
12.7
|
13.3
|
14.9
|
16.2
|
|||||||||||||||||||||||||||||||||||||||||||||
|
Mineral Product Prices
|
|||||||||||||||||||||||||||||||||||||||||||||||||||||||||||||
|
Ilmenite
|
US$/t
|
$
|
284.2
|
$
|
298.7
|
$
|
313.3
|
$
|
327.8
|
$
|
309.8
|
$
|
309.8
|
$
|
309.8
|
$
|
309.8
|
$
|
309.8
|
$
|
309.8
|
$
|
309.8
|
$
|
309.8
|
$
|
309.8
|
$
|
309.8
|
||||||||||||||||||||||||||||||||
|
Rutile
|
US$/t
|
$
|
1,440.5
|
$
|
1,488.8
|
$
|
1,566.4
|
$
|
1,585.3
|
$
|
1,284.2
|
$
|
1,284.2
|
$
|
1,284.2
|
$
|
1,284.2
|
$
|
1,284.2
|
$
|
1,284.2
|
$
|
1,284.2
|
$
|
1,284.2
|
$
|
1,284.2
|
$
|
1,284.2
|
||||||||||||||||||||||||||||||||
|
Monazite
|
US$/t
|
$
|
13,062.2
|
$
|
14,296.3
|
$
|
15,013.1
|
$
|
14,708.0
|
$
|
14,546.1
|
$
|
14,296.5
|
$
|
14,723.1
|
$
|
15,426.6
|
$
|
16,264.3
|
$
|
16,928.3
|
$
|
17,423.5
|
$
|
17,919.0
|
$
|
18,414.9
|
$
|
18,414.9
|
||||||||||||||||||||||||||||||||
|
Zircon Premium
|
US$/t
|
$
|
2,376.3
|
$
|
2,429.1
|
$
|
2,398.6
|
$
|
2,309.5
|
$
|
1,687.4
|
$
|
1,687.4
|
$
|
1,687.4
|
$
|
1,687.4
|
$
|
1,687.4
|
$
|
1,687.4
|
$
|
1,687.4
|
$
|
1,687.4
|
$
|
1,687.4
|
$
|
1,687.4
|
||||||||||||||||||||||||||||||||
|
Zircon Concentrate
|
US$/t
|
$
|
1,069.3
|
$
|
1,093.1
|
$
|
1,079.4
|
$
|
1,039.3
|
$
|
759.3
|
$
|
759.3
|
$
|
759.3
|
$
|
759.3
|
$
|
759.3
|
$
|
759.3
|
$
|
759.3
|
$
|
759.3
|
$
|
759.3
|
$
|
759.3
|
||||||||||||||||||||||||||||||||
|
Gross Revenue
|
|||||||||||||||||||||||||||||||||||||||||||||||||||||||||||||
|
Ilmenite
|
US$M
|
$
|
742.3
|
-
|
-
|
$
|
29.5
|
$
|
40.8
|
$
|
34.8
|
$
|
24.5
|
$
|
27.6
|
$
|
28.3
|
$
|
25.8
|
$
|
24.4
|
$
|
23.6
|
$
|
24.5
|
$
|
27.4
|
$
|
29.5
|
||||||||||||||||||||||||||||||||
|
Rutile
|
US$M
|
$
|
547.3
|
-
|
-
|
$
|
25.8
|
$
|
34.5
|
$
|
25.2
|
$
|
17.8
|
$
|
20.0
|
$
|
20.5
|
$
|
18.7
|
$
|
17.7
|
$
|
17.1
|
$
|
17.8
|
$
|
19.9
|
$
|
21.4
|
||||||||||||||||||||||||||||||||
|
Monazite
|
US$M
|
$
|
2,016.0
|
-
|
-
|
$
|
70.0
|
$
|
88.0
|
$
|
79.9
|
$
|
56.4
|
$
|
65.3
|
$
|
65.3
|
$
|
60.2
|
$
|
59.2
|
$
|
60.7
|
$
|
66.9
|
$
|
79.4
|
$
|
88.3
|
||||||||||||||||||||||||||||||||
|
Zircon Premium
|
US$M
|
$
|
978.1
|
-
|
-
|
$
|
53.1
|
$
|
67.2
|
$
|
44.4
|
$
|
31.4
|
$
|
35.3
|
$
|
35.8
|
$
|
32.4
|
$
|
30.6
|
$
|
29.8
|
$
|
31.1
|
$
|
35.0
|
$
|
37.9
|
||||||||||||||||||||||||||||||||
|
Zircon Concentrate
|
US$M
|
$
|
316.5
|
-
|
-
|
$
|
17.2
|
$
|
21.7
|
$
|
14.4
|
$
|
10.2
|
$
|
11.4
|
$
|
11.6
|
$
|
10.5
|
$
|
9.9
|
$
|
9.6
|
$
|
10.1
|
$
|
11.3
|
$
|
12.3
|
||||||||||||||||||||||||||||||||
|
Total Gross Revenue
|
US$M
|
$
|
4,600.1
|
-
|
-
|
$
|
195.4
|
$
|
252.2
|
$
|
198.7
|
$
|
140.2
|
$
|
159.6
|
$
|
161.5
|
$
|
147.7
|
$
|
141.8
|
$
|
140.9
|
$
|
150.5
|
$
|
173.0
|
$
|
189.4
|
||||||||||||||||||||||||||||||||
|
Operating Costs
|
|||||||||||||||||||||||||||||||||||||||||||||||||||||||||||||
|
Mining
|
US$M
|
$
|
644.9
|
-
|
-
|
$
|
22.8
|
$
|
25.6
|
$
|
33.2
|
$
|
24.0
|
$
|
22.7
|
$
|
32.0
|
$
|
28.5
|
$
|
27.3
|
$
|
25.8
|
$
|
25.0
|
$
|
25.3
|
$
|
26.1
|
||||||||||||||||||||||||||||||||
|
Wet Processing Plant
|
US$M
|
$
|
242.2
|
-
|
-
|
$
|
9.8
|
$
|
9.7
|
$
|
9.8
|
$
|
9.8
|
$
|
9.8
|
$
|
9.6
|
$
|
9.5
|
$
|
9.5
|
$
|
9.6
|
$
|
9.6
|
$
|
9.8
|
$
|
9.8
|
||||||||||||||||||||||||||||||||
|
Slimes Tailings Disposal
|
US$M
|
$
|
153.3
|
-
|
-
|
$
|
6.7
|
$
|
6.1
|
$
|
6.5
|
$
|
6.4
|
$
|
6.6
|
$
|
5.9
|
$
|
5.4
|
$
|
5.4
|
$
|
5.6
|
$
|
5.8
|
$
|
6.3
|
$
|
6.8
|
||||||||||||||||||||||||||||||||
|
Mineral Separation Plant
|
US$M
|
$
|
310.2
|
-
|
-
|
$
|
15.0
|
$
|
15.9
|
$
|
14.2
|
$
|
10.6
|
$
|
11.5
|
$
|
12.4
|
$
|
11.9
|
$
|
11.8
|
$
|
11.6
|
$
|
11.6
|
$
|
11.9
|
$
|
11.9
|
||||||||||||||||||||||||||||||||
|
General & Administration
|
US$M
|
$
|
173.1
|
-
|
-
|
$
|
6.9
|
$
|
6.9
|
$
|
6.9
|
$
|
6.9
|
$
|
6.9
|
$
|
6.9
|
$
|
6.9
|
$
|
6.9
|
$
|
6.9
|
$
|
6.9
|
$
|
6.9
|
$
|
6.9
|
||||||||||||||||||||||||||||||||
|
Landowner Royalties
|
US$M
|
$
|
100.4
|
-
|
-
|
$
|
9.8
|
$
|
12.6
|
$
|
9.9
|
$
|
1.4
|
-
|
$
|
4.0
|
$
|
5.9
|
$
|
4.3
|
$
|
2.1
|
$
|
6.8
|
-
|
-
|
|||||||||||||||||||||||||||||||||||
|
Transport and Logistics Costs
|
US$M
|
$
|
53.4
|
-
|
$
|
2.1
|
$
|
2.8
|
$
|
2.5
|
$
|
1.8
|
$
|
2.0
|
$
|
1.9
|
$
|
1.7
|
$
|
1.6
|
$
|
1.6
|
$
|
1.7
|
$
|
2.0
|
$
|
2.2
|
|||||||||||||||||||||||||||||||||
|
Total Operating Costs
|
US$M
|
$
|
1,677.6
|
-
|
-
|
$
|
73.2
|
$
|
79.6
|
$
|
83.1
|
$
|
60.9
|
$
|
59.6
|
$
|
72.8
|
$
|
69.9
|
$
|
66.9
|
$
|
63.1
|
$
|
67.4
|
$
|
62.2
|
$
|
63.8
|
||||||||||||||||||||||||||||||||
|
Operating Income before Taxes
|
US$M
|
$
|
2,922.6
|
-
|
-
|
$
|
122.3
|
$
|
172.6
|
$
|
115.6
|
$
|
79.2
|
$
|
100.0
|
$
|
88.7
|
$
|
77.8
|
$
|
74.9
|
$
|
77.7
|
$
|
83.0
|
$
|
110.8
|
$
|
125.6
|
||||||||||||||||||||||||||||||||
|
Capital Costs
|
|||||||||||||||||||||||||||||||||||||||||||||||||||||||||||||
|
Development Capital
|
US$M
|
$
|
237.2
|
$
|
42.2
|
$
|
186.3
|
$
|
8.7
|
-
|
-
|
-
|
-
|
-
|
-
|
-
|
-
|
-
|
-
|
-
|
|||||||||||||||||||||||||||||||||||||||||
|
Sustaining Capital, incl. Ongoing Reclamation
|
US$M
|
$
|
188.3
|
-
|
-
|
-
|
-
|
$
|
16.1
|
-
|
$
|
2.0
|
$
|
14.2
|
-
|
-
|
$
|
14.2
|
$
|
34.6
|
-
|
$
|
14.2
|
||||||||||||||||||||||||||||||||||||||
|
Final Closing/Reclamation Capital
|
US$M
|
$
|
10.3
|
-
|
-
|
-
|
-
|
-
|
-
|
-
|
-
|
-
|
-
|
-
|
-
|
-
|
-
|
||||||||||||||||||||||||||||||||||||||||||||
|
Total Capital Costs
|
US$M
|
$
|
435.7
|
$
|
42.2
|
$
|
186.3
|
$
|
8.7
|
-
|
$
|
16.1
|
-
|
$
|
2.0
|
$
|
14.2
|
-
|
-
|
$
|
14.2
|
$
|
34.6
|
-
|
$
|
14.2
|
|||||||||||||||||||||||||||||||||||
|
Depreciation
|
US$M
|
$
|
435.7
|
-
|
-
|
$
|
67.8
|
$
|
48.4
|
$
|
39.2
|
$
|
28.0
|
$
|
20.5
|
$
|
18.7
|
$
|
13.4
|
$
|
9.6
|
$
|
10.9
|
$
|
17.6
|
$
|
12.6
|
$
|
13.0
|
||||||||||||||||||||||||||||||||
|
Depletion
|
US$M
|
$
|
823.3
|
-
|
-
|
$
|
27.2
|
$
|
46.0
|
$
|
35.4
|
$
|
25.6
|
$
|
29.9
|
$
|
29.5
|
$
|
26.6
|
$
|
25.7
|
$
|
25.7
|
$
|
26.5
|
$
|
31.7
|
$
|
34.6
|
||||||||||||||||||||||||||||||||
|
Income Taxes
|
US$M
|
$
|
434.7
|
-
|
-
|
$
|
7.1
|
$
|
20.4
|
$
|
10.7
|
$
|
6.7
|
$
|
13.0
|
$
|
10.6
|
$
|
9.9
|
$
|
10.4
|
$
|
10.7
|
$
|
10.2
|
$
|
17.4
|
$
|
20.4
|
||||||||||||||||||||||||||||||||
|
Change in Working Capital
|
US$M
|
-
|
-
|
-
|
$
|
12.4
|
$
|
4.3
|
$
|
(4.4
|
)
|
$
|
(3.5
|
)
|
$
|
1.7
|
$
|
(0.6
|
)
|
$
|
(1.1
|
)
|
$
|
(0.3
|
)
|
$
|
0.2
|
$
|
0.4
|
$
|
2.3
|
$
|
1.3
|
||||||||||||||||||||||||||||
|
After Tax Free Cash Flow
|
US$M
|
$
|
2,052.1
|
$
|
(42.2
|
)
|
$
|
(186.3
|
)
|
$
|
94.0
|
$
|
147.9
|
$
|
93.2
|
$
|
76.0
|
$
|
83.4
|
$
|
64.6
|
$
|
69.0
|
$
|
64.8
|
$
|
52.7
|
$
|
37.9
|
$
|
91.1
|
$
|
89.8
|
||||||||||||||||||||||||||||
Page 72
| Units |
LOM Total
|
||||||||||||||||||||||||||||||||||||||||||||||||||||||||||||
|
Calendar Year
|
2037
|
2038
|
2039
|
2040
|
2041
|
2042
|
2043
|
2044
|
2045
|
2046
|
2047
|
2048
|
2049
|
2050
|
|||||||||||||||||||||||||||||||||||||||||||||||
|
Operation Year
|
14
|
15
|
16
|
17
|
18
|
19
|
20
|
21
|
22
|
23
|
24
|
25
|
26
|
27
|
|||||||||||||||||||||||||||||||||||||||||||||||
|
Mining and Processing Schedule
|
|||||||||||||||||||||||||||||||||||||||||||||||||||||||||||||
|
Total Material Mined
|
Mt
|
406.0
|
17.1
|
11.6
|
21.7
|
20.6
|
20.0
|
16.3
|
15.9
|
16.0
|
14.6
|
13.4
|
14.9
|
10.8
|
11.2
|
-
|
|||||||||||||||||||||||||||||||||||||||||||||
|
Total Ore Mined
|
Mt
|
242.6
|
9.9
|
9.9
|
9.3
|
9.5
|
9.5
|
9.4
|
9.5
|
9.7
|
10.0
|
9.9
|
9.8
|
9.8
|
9.9
|
-
|
|||||||||||||||||||||||||||||||||||||||||||||
|
Total Waste Mined
|
Mt
|
163.4
|
7.2
|
1.7
|
12.4
|
11.2
|
10.5
|
6.9
|
6.3
|
6.3
|
4.6
|
3.6
|
5.1
|
1.0
|
1.4
|
-
|
|||||||||||||||||||||||||||||||||||||||||||||
|
Mining Losses, Oversize, and Trash
|
Mt
|
4.5
|
0.1
|
0.2
|
0.2
|
0.2
|
0.2
|
0.2
|
0.2
|
0.2
|
0.2
|
0.2
|
0.2
|
0.1
|
0.2
|
-
|
|||||||||||||||||||||||||||||||||||||||||||||
|
Slimes
|
Mt
|
40.5
|
1.9
|
1.8
|
1.2
|
1.4
|
1.4
|
1.4
|
1.5
|
1.6
|
1.9
|
1.8
|
1.7
|
1.7
|
1.8
|
-
|
|||||||||||||||||||||||||||||||||||||||||||||
|
Total Heavy Minerals (THM) In-Situ
|
Mt
|
7.2
|
0.3
|
0.3
|
0.3
|
0.3
|
0.3
|
0.3
|
0.3
|
0.3
|
0.3
|
0.3
|
0.3
|
0.3
|
0.3
|
-
|
|||||||||||||||||||||||||||||||||||||||||||||
|
In-Situ Total Heavy Minerals Grade
|
% THM
|
3.0
|
%
|
2.5
|
%
|
3.0
|
%
|
3.0
|
%
|
3.1
|
%
|
3.1
|
%
|
3.1
|
%
|
3.0
|
%
|
2.9
|
%
|
2.6
|
%
|
2.6
|
%
|
2.8
|
%
|
3.1
|
%
|
3.4
|
%
|
-
|
|||||||||||||||||||||||||||||||
|
Mineral Grade Splits
|
|||||||||||||||||||||||||||||||||||||||||||||||||||||||||||||
|
Ilmenite
|
% THM
|
40.2
|
%
|
42.9
|
%
|
44.2
|
%
|
38.5
|
%
|
40.2
|
%
|
40.9
|
%
|
40.4
|
%
|
40.8
|
%
|
42.1
|
%
|
44.4
|
%
|
41.2
|
%
|
40.9
|
%
|
42.9
|
%
|
43.4
|
%
|
-
|
|||||||||||||||||||||||||||||||
|
Rutile
|
% THM
|
9.4
|
%
|
10.1
|
%
|
10.4
|
%
|
9.0
|
%
|
9.4
|
%
|
9.6
|
%
|
9.5
|
%
|
9.6
|
%
|
9.9
|
%
|
10.4
|
%
|
9.7
|
%
|
9.6
|
%
|
10.1
|
%
|
10.2
|
%
|
-
|
|||||||||||||||||||||||||||||||
|
Monazite
|
% THM
|
2.1
|
%
|
2.4
|
%
|
2.4
|
%
|
1.9
|
%
|
2.0
|
%
|
2.1
|
%
|
2.1
|
%
|
2.2
|
%
|
2.2
|
%
|
2.4
|
%
|
2.2
|
%
|
2.2
|
%
|
2.4
|
%
|
2.4
|
%
|
-
|
|||||||||||||||||||||||||||||||
|
Zircon
|
% THM
|
11.5
|
%
|
12.4
|
%
|
12.7
|
%
|
10.9
|
%
|
11.4
|
%
|
11.7
|
%
|
11.6
|
%
|
11.7
|
%
|
12.1
|
%
|
12.8
|
%
|
11.8
|
%
|
11.7
|
%
|
12.4
|
%
|
12.5
|
%
|
-
|
|||||||||||||||||||||||||||||||
|
In-Situ Mineral Content in Mined Material
|
|||||||||||||||||||||||||||||||||||||||||||||||||||||||||||||
|
Ilmenite
|
Mt
|
2.9
|
0.1
|
0.1
|
0.1
|
0.1
|
0.1
|
0.1
|
0.1
|
0.1
|
0.1
|
0.1
|
0.1
|
0.1
|
0.1
|
-
|
|||||||||||||||||||||||||||||||||||||||||||||
|
Rutile
|
Mt
|
0.7
|
0.0
|
0.0
|
0.0
|
0.0
|
0.0
|
0.0
|
0.0
|
0.0
|
0.0
|
0.0
|
0.0
|
0.0
|
0.0
|
-
|
|||||||||||||||||||||||||||||||||||||||||||||
|
Monazite
|
Mt
|
0.2
|
0.0
|
0.0
|
0.0
|
0.0
|
0.0
|
0.0
|
0.0
|
0.0
|
0.0
|
0.0
|
0.0
|
0.0
|
0.0
|
-
|
|||||||||||||||||||||||||||||||||||||||||||||
|
Zircon
|
Mt
|
0.8
|
0.0
|
0.0
|
0.0
|
0.0
|
0.0
|
0.0
|
0.0
|
0.0
|
0.0
|
0.0
|
0.0
|
0.0
|
0.0
|
-
|
|||||||||||||||||||||||||||||||||||||||||||||
|
Wet Concentration Plant Feed
|
Mt
|
237.3
|
9.6
|
9.6
|
9.1
|
9.3
|
9.3
|
9.3
|
9.4
|
9.5
|
9.6
|
9.6
|
9.6
|
9.6
|
9.6
|
-
|
|||||||||||||||||||||||||||||||||||||||||||||
|
Heavy Mineral Concentrate Produced
|
Mt
|
7.6
|
0.3
|
0.3
|
0.3
|
0.3
|
0.3
|
0.3
|
0.3
|
0.3
|
0.3
|
0.3
|
0.3
|
0.3
|
0.4
|
-
|
|||||||||||||||||||||||||||||||||||||||||||||
|
Saleable Mineral Products Recovered
|
|||||||||||||||||||||||||||||||||||||||||||||||||||||||||||||
|
Ilmenite
|
kt
|
2,388.0
|
90.2
|
111.4
|
89.7
|
97.0
|
101.3
|
98.9
|
96.4
|
98.4
|
96.7
|
90.0
|
94.9
|
109.0
|
122.7
|
-
|
|||||||||||||||||||||||||||||||||||||||||||||
|
Rutile
|
kt
|
417.5
|
15.8
|
19.5
|
15.7
|
16.9
|
17.7
|
17.3
|
16.9
|
17.2
|
16.9
|
15.7
|
16.6
|
19.1
|
21.4
|
-
|
|||||||||||||||||||||||||||||||||||||||||||||
|
Monazite
|
kt
|
116.2
|
4.6
|
5.6
|
4.1
|
4.5
|
4.9
|
4.8
|
4.7
|
4.8
|
4.9
|
4.4
|
4.7
|
5.6
|
6.3
|
-
|
|||||||||||||||||||||||||||||||||||||||||||||
|
Zircon Premium
|
kt
|
559.6
|
21.3
|
26.3
|
20.8
|
22.6
|
23.7
|
23.2
|
22.6
|
23.1
|
22.9
|
21.1
|
22.3
|
25.8
|
29.0
|
-
|
|||||||||||||||||||||||||||||||||||||||||||||
|
Zircon Concentrate
|
kt
|
402.4
|
15.3
|
18.9
|
15.0
|
16.2
|
17.0
|
16.7
|
16.3
|
16.6
|
16.4
|
15.2
|
16.0
|
18.5
|
20.9
|
-
|
|||||||||||||||||||||||||||||||||||||||||||||
|
Mineral Product Prices
|
|||||||||||||||||||||||||||||||||||||||||||||||||||||||||||||
|
Ilmenite
|
US$/t
|
$
|
309.8
|
$
|
309.8
|
$
|
309.8
|
$
|
309.8
|
$
|
309.8
|
$
|
309.8
|
$
|
309.8
|
$
|
309.8
|
$
|
309.8
|
$
|
309.8
|
$
|
309.8
|
$
|
309.8
|
$
|
309.8
|
$
|
309.8
|
||||||||||||||||||||||||||||||||
|
Rutile
|
US$/t
|
$
|
1,284.2
|
$
|
1,284.2
|
$
|
1,284.2
|
$
|
1,284.2
|
$
|
1,284.2
|
$
|
1,284.2
|
$
|
1,284.2
|
$
|
1,284.2
|
$
|
1,284.2
|
$
|
1,284.2
|
$
|
1,284.2
|
$
|
1,284.2
|
$
|
1,284.2
|
$
|
1,284.2
|
||||||||||||||||||||||||||||||||
|
Monazite
|
US$/t
|
$
|
18,414.9
|
$
|
18,414.9
|
$
|
18,414.9
|
$
|
18,414.9
|
$
|
18,414.9
|
$
|
18,414.9
|
$
|
18,414.9
|
$
|
18,414.9
|
$
|
18,414.9
|
$
|
18,414.9
|
$
|
18,414.9
|
$
|
18,414.9
|
$
|
18,414.9
|
$
|
18,414.9
|
||||||||||||||||||||||||||||||||
|
Zircon Premium
|
US$/t
|
$
|
1,687.4
|
$
|
1,687.4
|
$
|
1,687.4
|
$
|
1,687.4
|
$
|
1,687.4
|
$
|
1,687.4
|
$
|
1,687.4
|
$
|
1,687.4
|
$
|
1,687.4
|
$
|
1,687.4
|
$
|
1,687.4
|
$
|
1,687.4
|
$
|
1,687.4
|
$
|
1,687.4
|
||||||||||||||||||||||||||||||||
|
Zircon Concentrate
|
US$/t
|
$
|
759.3
|
$
|
759.3
|
$
|
759.3
|
$
|
759.3
|
$
|
759.3
|
$
|
759.3
|
$
|
759.3
|
$
|
759.3
|
$
|
759.3
|
$
|
759.3
|
$
|
759.3
|
$
|
759.3
|
$
|
759.3
|
$
|
759.3
|
||||||||||||||||||||||||||||||||
|
Gross Revenue
|
|||||||||||||||||||||||||||||||||||||||||||||||||||||||||||||
|
Ilmenite
|
US$M
|
$
|
742.3
|
$
|
27.9
|
$
|
34.5
|
$
|
27.8
|
$
|
30.1
|
$
|
31.4
|
$
|
30.6
|
$
|
29.9
|
$
|
30.5
|
$
|
30.0
|
$
|
27.9
|
$
|
29.4
|
$
|
33.8
|
$
|
38.0
|
-
|
|||||||||||||||||||||||||||||||
|
Rutile
|
US$M
|
$
|
547.3
|
$
|
20.3
|
$
|
25.0
|
$
|
20.1
|
$
|
21.8
|
$
|
22.7
|
$
|
22.2
|
$
|
21.6
|
$
|
22.1
|
$
|
21.7
|
$
|
20.2
|
$
|
21.3
|
$
|
24.5
|
$
|
27.5
|
-
|
|||||||||||||||||||||||||||||||
|
Monazite
|
US$M
|
$
|
2,016.0
|
$
|
84.3
|
$
|
104.0
|
$
|
75.7
|
$
|
83.8
|
$
|
89.5
|
$
|
88.2
|
$
|
86.6
|
$
|
89.1
|
$
|
90.3
|
$
|
81.4
|
$
|
85.7
|
$
|
102.2
|
$
|
115.6
|
-
|
|||||||||||||||||||||||||||||||
|
Zircon Premium
|
US$M
|
$
|
978.1
|
$
|
36.0
|
$
|
44.4
|
$
|
35.1
|
$
|
38.1
|
$
|
40.0
|
$
|
39.1
|
$
|
38.1
|
$
|
39.0
|
$
|
38.6
|
$
|
35.7
|
$
|
37.6
|
$
|
43.5
|
$
|
49.0
|
-
|
|||||||||||||||||||||||||||||||
|
Zircon Concentrate
|
US$M
|
$
|
316.5
|
$
|
11.6
|
$
|
14.4
|
$
|
11.4
|
$
|
12.3
|
$
|
12.9
|
$
|
12.6
|
$
|
12.3
|
$
|
12.6
|
$
|
12.5
|
$
|
11.5
|
$
|
12.2
|
$
|
14.1
|
$
|
15.9
|
-
|
|||||||||||||||||||||||||||||||
|
Total Gross Revenue
|
US$M
|
$
|
4,600.1
|
$
|
180.1
|
$
|
222.3
|
$
|
170.1
|
$
|
186.0
|
$
|
196.5
|
$
|
192.7
|
$
|
188.5
|
$
|
193.2
|
$
|
193.1
|
$
|
176.6
|
$
|
186.2
|
$
|
218.0
|
$
|
246.0
|
-
|
|||||||||||||||||||||||||||||||
|
Operating Costs
|
|||||||||||||||||||||||||||||||||||||||||||||||||||||||||||||
|
Mining
|
US$M
|
$
|
644.9
|
$
|
27.0
|
$
|
20.2
|
$
|
32.3
|
$
|
31.0
|
$
|
30.2
|
$
|
25.8
|
$
|
25.3
|
$
|
25.5
|
$
|
23.9
|
$
|
22.5
|
$
|
24.1
|
$
|
19.2
|
$
|
19.8
|
||||||||||||||||||||||||||||||||
|
Wet Processing Plant
|
US$M
|
$
|
242.2
|
$
|
9.8
|
$
|
9.8
|
$
|
9.4
|
$
|
9.5
|
$
|
9.5
|
$
|
9.5
|
$
|
9.6
|
$
|
9.7
|
$
|
9.8
|
$
|
9.8
|
$
|
9.8
|
$
|
9.8
|
$
|
9.8
|
||||||||||||||||||||||||||||||||
|
Slimes Tailings Disposal
|
US$M
|
$
|
153.3
|
$
|
7.0
|
$
|
6.8
|
$
|
4.8
|
$
|
5.4
|
$
|
5.5
|
$
|
5.4
|
$
|
5.7
|
$
|
6.2
|
$
|
6.8
|
$
|
6.5
|
$
|
6.3
|
$
|
6.4
|
$
|
6.6
|
||||||||||||||||||||||||||||||||
|
Mineral Separation Plant
|
US$M
|
$
|
310.2
|
$
|
11.4
|
$
|
12.8
|
$
|
12.1
|
$
|
12.4
|
$
|
12.6
|
$
|
12.5
|
$
|
12.2
|
$
|
12.2
|
$
|
11.6
|
$
|
11.6
|
$
|
12.1
|
$
|
12.8
|
$
|
13.8
|
||||||||||||||||||||||||||||||||
|
General & Administration
|
US$M
|
$
|
173.1
|
$
|
6.9
|
$
|
6.9
|
$
|
6.9
|
$
|
6.9
|
$
|
6.9
|
$
|
6.9
|
$
|
6.9
|
$
|
6.9
|
$
|
6.9
|
$
|
6.9
|
$
|
6.9
|
$
|
6.9
|
$
|
6.9
|
||||||||||||||||||||||||||||||||
|
Landowner Royalties
|
US$M
|
$
|
100.4
|
-
|
$
|
2.2
|
-
|
-
|
-
|
-
|
-
|
-
|
-
|
$
|
8.8
|
$
|
9.3
|
$
|
10.9
|
$
|
12.3
|
-
|
|||||||||||||||||||||||||||||||||||||||
|
Transport and Logistics Costs
|
US$M
|
$
|
53.4
|
$
|
2.1
|
$
|
2.6
|
$
|
1.9
|
$
|
2.1
|
$
|
2.2
|
$
|
2.2
|
$
|
2.2
|
$
|
2.2
|
$
|
2.3
|
$
|
2.0
|
$
|
2.1
|
$
|
2.6
|
$
|
2.9
|
||||||||||||||||||||||||||||||||
|
Total Operating Costs
|
US$M
|
$
|
1,677.6
|
$
|
64.1
|
$
|
61.3
|
$
|
67.4
|
$
|
67.3
|
$
|
67.0
|
$
|
62.4
|
$
|
61.9
|
$
|
62.7
|
$
|
61.3
|
$
|
68.3
|
$
|
70.7
|
$
|
68.6
|
$
|
72.0
|
-
|
|||||||||||||||||||||||||||||||
|
Operating Income before Taxes
|
US$M
|
$
|
2,922.6
|
$
|
116.0
|
$
|
160.9
|
$
|
102.7
|
$
|
118.7
|
$
|
129.5
|
$
|
130.3
|
$
|
126.6
|
$
|
130.6
|
$
|
131.8
|
$
|
108.4
|
$
|
115.5
|
$
|
149.4
|
$
|
174.0
|
-
|
|||||||||||||||||||||||||||||||
|
Capital Costs
|
|||||||||||||||||||||||||||||||||||||||||||||||||||||||||||||
|
Development Capital
|
US$M
|
$
|
237.2
|
-
|
-
|
-
|
-
|
-
|
-
|
-
|
-
|
-
|
-
|
-
|
-
|
-
|
-
|
||||||||||||||||||||||||||||||||||||||||||||
|
Sustaining Capital, incl. Ongoing Reclamation
|
US$M
|
$
|
188.3
|
$
|
2.0
|
-
|
$
|
14.2
|
-
|
-
|
$
|
14.2
|
-
|
$
|
34.6
|
$
|
14.2
|
-
|
-
|
$
|
14.2
|
-
|
-
|
||||||||||||||||||||||||||||||||||||||
|
Final Closing/Reclamation Capital
|
US$M
|
$
|
10.3
|
-
|
-
|
-
|
-
|
-
|
-
|
-
|
-
|
-
|
-
|
-
|
-
|
$
|
10.3
|
||||||||||||||||||||||||||||||||||||||||||||
|
Total Capital Costs
|
US$M
|
$
|
435.7
|
$
|
2.0
|
-
|
$
|
14.2
|
-
|
-
|
$
|
14.2
|
-
|
$
|
34.6
|
$
|
14.2
|
-
|
-
|
$
|
14.2
|
$
|
10.3
|
-
|
|||||||||||||||||||||||||||||||||||||
|
Depreciation
|
US$M
|
$
|
435.7
|
$
|
9.9
|
$
|
7.1
|
$
|
9.1
|
$
|
6.5
|
$
|
4.6
|
$
|
7.4
|
$
|
5.3
|
$
|
13.6
|
$
|
13.8
|
$
|
9.8
|
$
|
7.0
|
$
|
9.1
|
$
|
32.9
|
||||||||||||||||||||||||||||||||
|
Depletion
|
US$M
|
$
|
823.3
|
$
|
32.9
|
$
|
40.2
|
$
|
31.4
|
$
|
34.2
|
$
|
36.1
|
$
|
35.3
|
$
|
34.6
|
$
|
35.4
|
$
|
35.3
|
$
|
30.7
|
$
|
32.4
|
$
|
37.8
|
$
|
42.6
|
||||||||||||||||||||||||||||||||
|
Income Taxes
|
US$M
|
$
|
434.7
|
$
|
19.1
|
$
|
29.7
|
$
|
16.3
|
$
|
20.4
|
$
|
23.2
|
$
|
22.9
|
$
|
22.7
|
$
|
21.3
|
$
|
21.6
|
$
|
17.7
|
$
|
19.9
|
$
|
26.8
|
$
|
25.7
|
-
|
|||||||||||||||||||||||||||||||
|
Change in Working Capital
|
US$M
|
-
|
$
|
(0.8
|
)
|
$
|
3.5
|
$
|
(4.4
|
)
|
$
|
1.3
|
$
|
0.9
|
$
|
(0.1
|
)
|
$
|
(0.3
|
)
|
$
|
0.3
|
$
|
0.0
|
$
|
(2.0
|
)
|
$
|
0.7
|
$
|
2.6
|
$
|
2.1
|
$
|
(16.5
|
)
|
|||||||||||||||||||||||||
|
After Tax Free Cash Flow
|
US$M
|
$
|
2,052.1
|
$
|
95.7
|
$
|
127.7
|
$
|
76.7
|
$
|
97.0
|
$
|
105.4
|
$
|
93.4
|
$
|
104.3
|
$
|
74.3
|
$
|
95.9
|
$
|
92.6
|
$
|
95.0
|
$
|
105.8
|
$
|
135.9
|
$
|
16.5
|
||||||||||||||||||||||||||||||
Page 73
Table 26: Annual cash flow summary (Indicated Resources only)
| Units |
LOM Total
|
||||||||||||||||||||||||||||||||||||||||||||||||||||||||||||||||||||||||
|
Calendar Year
|
2023
|
2024
|
2025
|
2026
|
2027
|
2028
|
2029
|
2030
|
2031
|
2032
|
2033
|
2034
|
2035
|
2036
|
2037
|
2038
|
2039
|
||||||||||||||||||||||||||||||||||||||||||||||||||||||||
|
Operation Year
|
0
|
1
|
2
|
3
|
4
|
5
|
6
|
7
|
8
|
9
|
10
|
11
|
12
|
13
|
14
|
15
|
16
|
||||||||||||||||||||||||||||||||||||||||||||||||||||||||
|
Mining and Processing Schedule
|
|||||||||||||||||||||||||||||||||||||||||||||||||||||||||||||||||||||||||
|
Total Material Mined
|
Mt
|
230.7
|
-
|
-
|
13.6
|
16.0
|
22.3
|
14.7
|
13.6
|
21.3
|
18.5
|
17.6
|
16.3
|
15.6
|
15.9
|
16.5
|
17.1
|
11.6
|
-
|
||||||||||||||||||||||||||||||||||||||||||||||||||||||
|
Total Ore Mined
|
Mt
|
136.5
|
-
|
-
|
10.0
|
9.8
|
9.9
|
9.9
|
9.9
|
9.7
|
9.4
|
9.4
|
9.5
|
9.6
|
9.7
|
9.9
|
9.9
|
9.9
|
-
|
||||||||||||||||||||||||||||||||||||||||||||||||||||||
|
Total Waste Mined
|
Mt
|
94.2
|
-
|
-
|
3.6
|
6.2
|
12.3
|
4.8
|
3.7
|
11.7
|
9.1
|
8.2
|
6.8
|
6.0
|
6.1
|
6.6
|
7.2
|
1.7
|
-
|
||||||||||||||||||||||||||||||||||||||||||||||||||||||
|
Mining Losses, Oversize, and Trash
|
Mt
|
2.6
|
-
|
-
|
0.3
|
0.2
|
0.3
|
0.2
|
0.2
|
0.2
|
0.2
|
0.1
|
0.1
|
0.1
|
0.1
|
0.1
|
0.1
|
0.2
|
-
|
||||||||||||||||||||||||||||||||||||||||||||||||||||||
|
Slimes
|
Mt
|
23.2
|
-
|
-
|
1.8
|
1.6
|
1.7
|
1.7
|
1.8
|
1.5
|
1.4
|
1.4
|
1.4
|
1.5
|
1.7
|
1.9
|
1.9
|
1.8
|
-
|
||||||||||||||||||||||||||||||||||||||||||||||||||||||
|
Total Heavy Minerals (THM) In-Situ
|
Mt
|
4.1
|
-
|
-
|
0.4
|
0.4
|
0.4
|
0.2
|
0.3
|
0.3
|
0.3
|
0.3
|
0.3
|
0.3
|
0.3
|
0.3
|
0.3
|
0.3
|
-
|
||||||||||||||||||||||||||||||||||||||||||||||||||||||
|
In-Situ Total Heavy Minerals Grade
|
% THM
|
3.0
|
%
|
-
|
-
|
3.8
|
%
|
4.2
|
%
|
3.6
|
%
|
2.3
|
%
|
2.6
|
%
|
3.0
|
%
|
2.9
|
%
|
2.8
|
%
|
2.7
|
%
|
2.7
|
%
|
2.8
|
%
|
2.8
|
%
|
2.5
|
%
|
3.0
|
%
|
-
|
|||||||||||||||||||||||||||||||||||||||
|
Mineral Grade Splits
|
|||||||||||||||||||||||||||||||||||||||||||||||||||||||||||||||||||||||||
|
Ilmenite
|
% THM
|
39.2
|
%
|
-
|
-
|
40.4
|
%
|
35.9
|
%
|
38.1
|
%
|
42.5
|
%
|
41.6
|
%
|
37.9
|
%
|
36.7
|
%
|
35.2
|
%
|
35.3
|
%
|
36.6
|
%
|
39.3
|
%
|
41.9
|
%
|
42.9
|
%
|
44.2
|
%
|
-
|
|||||||||||||||||||||||||||||||||||||||
|
Rutile
|
% THM
|
9.2
|
%
|
-
|
-
|
9.5
|
%
|
8.4
|
%
|
8.9
|
%
|
10.0
|
%
|
9.8
|
%
|
8.9
|
%
|
8.6
|
%
|
8.3
|
%
|
8.3
|
%
|
8.6
|
%
|
9.2
|
%
|
9.8
|
%
|
10.1
|
%
|
10.4
|
%
|
-
|
|||||||||||||||||||||||||||||||||||||||
|
Monazite
|
% THM
|
2.1
|
%
|
-
|
-
|
2.2
|
%
|
1.9
|
%
|
2.0
|
%
|
2.3
|
%
|
2.3
|
%
|
1.9
|
%
|
1.8
|
%
|
1.7
|
%
|
1.8
|
%
|
1.9
|
%
|
2.1
|
%
|
2.3
|
%
|
2.4
|
%
|
2.4
|
%
|
-
|
|||||||||||||||||||||||||||||||||||||||
|
Zircon
|
% THM
|
11.2
|
%
|
-
|
-
|
11.6
|
%
|
10.2
|
%
|
10.9
|
%
|
12.2
|
%
|
12.0
|
%
|
10.7
|
%
|
10.3
|
%
|
9.9
|
%
|
10.0
|
%
|
10.4
|
%
|
11.2
|
%
|
12.0
|
%
|
12.4
|
%
|
12.7
|
%
|
-
|
|||||||||||||||||||||||||||||||||||||||
|
In-Situ Mineral Content in Mined Material
|
|||||||||||||||||||||||||||||||||||||||||||||||||||||||||||||||||||||||||
|
Ilmenite
|
Mt
|
1.6
|
-
|
-
|
0.2
|
0.1
|
0.1
|
0.1
|
0.1
|
0.1
|
0.1
|
0.1
|
0.1
|
0.1
|
0.1
|
0.1
|
0.1
|
0.1
|
|||||||||||||||||||||||||||||||||||||||||||||||||||||||
|
Rutile
|
Mt
|
0.4
|
-
|
-
|
0.0
|
0.0
|
0.0
|
0.0
|
0.0
|
0.0
|
0.0
|
0.0
|
0.0
|
0.0
|
0.0
|
0.0
|
0.0
|
0.0
|
|||||||||||||||||||||||||||||||||||||||||||||||||||||||
|
Monazite
|
Mt
|
0.1
|
-
|
-
|
0.0
|
0.0
|
0.0
|
0.0
|
0.0
|
0.0
|
0.0
|
0.0
|
0.0
|
0.0
|
0.0
|
0.0
|
0.0
|
0.0
|
|||||||||||||||||||||||||||||||||||||||||||||||||||||||
|
Zircon
|
Mt
|
0.5
|
-
|
-
|
0.0
|
0.0
|
0.0
|
0.0
|
0.0
|
0.0
|
0.0
|
0.0
|
0.0
|
0.0
|
0.0
|
0.0
|
0.0
|
0.0
|
|||||||||||||||||||||||||||||||||||||||||||||||||||||||
|
Wet Concentration Plant Feed
|
Mt
|
133.3
|
-
|
-
|
9.6
|
9.5
|
9.6
|
9.6
|
9.6
|
9.4
|
9.3
|
9.3
|
9.3
|
9.4
|
9.6
|
9.6
|
9.6
|
9.6
|
-
|
||||||||||||||||||||||||||||||||||||||||||||||||||||||
|
Heavy Mineral Concentrate Produced
|
Mt
|
4.3
|
-
|
-
|
0.4
|
0.4
|
0.4
|
0.2
|
0.3
|
0.3
|
0.3
|
0.3
|
0.3
|
0.3
|
0.3
|
0.3
|
0.3
|
0.3
|
-
|
||||||||||||||||||||||||||||||||||||||||||||||||||||||
|
Saleable Mineral Products Recovered
|
Mt
|
||||||||||||||||||||||||||||||||||||||||||||||||||||||||||||||||||||||||
|
Ilmenite
|
kt
|
1,293.0
|
-
|
-
|
94.0
|
124.4
|
112.2
|
79.0
|
89.0
|
91.4
|
83.4
|
78.8
|
76.3
|
79.2
|
88.4
|
95.3
|
90.2
|
111.4
|
-
|
||||||||||||||||||||||||||||||||||||||||||||||||||||||
|
Rutile
|
kt
|
226.1
|
-
|
-
|
16.4
|
21.7
|
19.6
|
13.8
|
15.6
|
16.0
|
14.6
|
13.8
|
13.3
|
13.9
|
15.5
|
16.7
|
15.8
|
19.5
|
-
|
||||||||||||||||||||||||||||||||||||||||||||||||||||||
|
Monazite
|
kt
|
62.5
|
-
|
-
|
4.7
|
6.0
|
5.5
|
3.9
|
4.4
|
4.2
|
3.7
|
3.5
|
3.5
|
3.7
|
4.3
|
4.8
|
4.6
|
5.6
|
-
|
||||||||||||||||||||||||||||||||||||||||||||||||||||||
|
Zircon Premium
|
kt
|
302.6
|
-
|
-
|
22.1
|
29.1
|
26.3
|
18.6
|
20.9
|
21.2
|
19.2
|
18.1
|
17.7
|
18.4
|
20.7
|
22.5
|
21.3
|
26.3
|
-
|
||||||||||||||||||||||||||||||||||||||||||||||||||||||
|
Zircon Concentrate
|
kt
|
217.6
|
-
|
-
|
15.9
|
20.9
|
18.9
|
13.4
|
15.1
|
15.3
|
13.8
|
13.0
|
12.7
|
13.3
|
14.9
|
16.2
|
15.3
|
18.9
|
-
|
||||||||||||||||||||||||||||||||||||||||||||||||||||||
|
Mineral Product Prices
|
|||||||||||||||||||||||||||||||||||||||||||||||||||||||||||||||||||||||||
|
Ilmenite
|
US$/t
|
$
|
284.2
|
$
|
298.7
|
$
|
313.3
|
$
|
327.8
|
$
|
309.8
|
$
|
309.8
|
$
|
309.8
|
$
|
309.8
|
$
|
309.8
|
$
|
309.8
|
$
|
309.8
|
$
|
309.8
|
$
|
309.8
|
$
|
309.8
|
$
|
309.8
|
$
|
309.8
|
$
|
309.8
|
||||||||||||||||||||||||||||||||||||||
|
Rutile
|
US$/t
|
$
|
1,440.5
|
$
|
1,488.8
|
$
|
1,566.4
|
$
|
1,585.3
|
$
|
1,284.2
|
$
|
1,284.2
|
$
|
1,284.2
|
$
|
1,284.2
|
$
|
1,284.2
|
$
|
1,284.2
|
$
|
1,284.2
|
$
|
1,284.2
|
$
|
1,284.2
|
$
|
1,284.2
|
$
|
1,284.2
|
$
|
1,284.2
|
$
|
1,284.2
|
||||||||||||||||||||||||||||||||||||||
|
Monazite
|
US$/t
|
$
|
13,062.2
|
$
|
14,296.3
|
$
|
15,013.1
|
$
|
14,708.0
|
$
|
14,546.1
|
$
|
14,296.5
|
$
|
14,723.1
|
$
|
15,426.6
|
$
|
16,264.3
|
$
|
16,928.3
|
$
|
17,423.5
|
$
|
17,919.0
|
$
|
18,414.9
|
$
|
18,414.9
|
$
|
18,414.9
|
$
|
18,414.9
|
$
|
18,414.9
|
||||||||||||||||||||||||||||||||||||||
|
Zircon Premium
|
US$/t
|
$
|
2,376.3
|
$
|
2,429.1
|
$
|
2,398.6
|
$
|
2,309.5
|
$
|
1,687.4
|
$
|
1,687.4
|
$
|
1,687.4
|
$
|
1,687.4
|
$
|
1,687.4
|
$
|
1,687.4
|
$
|
1,687.4
|
$
|
1,687.4
|
$
|
1,687.4
|
$
|
1,687.4
|
$
|
1,687.4
|
$
|
1,687.4
|
$
|
1,687.4
|
||||||||||||||||||||||||||||||||||||||
|
Zircon Concentrate
|
US$/t
|
$
|
1,069.3
|
$
|
1,093.1
|
$
|
1,079.4
|
$
|
1,039.3
|
$
|
759.3
|
$
|
759.3
|
$
|
759.3
|
$
|
759.3
|
$
|
759.3
|
$
|
759.3
|
$
|
759.3
|
$
|
759.3
|
$
|
759.3
|
$
|
759.3
|
$
|
759.3
|
$
|
759.3
|
$
|
759.3
|
||||||||||||||||||||||||||||||||||||||
|
Gross Revenue
|
|||||||||||||||||||||||||||||||||||||||||||||||||||||||||||||||||||||||||
|
Ilmenite
|
US$M
|
$
|
403.1
|
-
|
-
|
$
|
29.5
|
$
|
40.8
|
$
|
34.8
|
$
|
24.5
|
$
|
27.6
|
$
|
28.3
|
$
|
25.8
|
$
|
24.4
|
$
|
23.6
|
$
|
24.5
|
$
|
27.4
|
$
|
29.5
|
$
|
27.9
|
$
|
34.5
|
-
|
|||||||||||||||||||||||||||||||||||||||
|
Rutile
|
US$M
|
$
|
301.5
|
-
|
-
|
$
|
25.8
|
$
|
34.5
|
$
|
25.2
|
$
|
17.8
|
$
|
20.0
|
$
|
20.5
|
$
|
18.7
|
$
|
17.7
|
$
|
17.1
|
$
|
17.8
|
$
|
19.9
|
$
|
21.4
|
$
|
20.3
|
$
|
25.0
|
-
|
|||||||||||||||||||||||||||||||||||||||
|
Monazite
|
US$M
|
$
|
1,027.9
|
-
|
-
|
$
|
70.0
|
$
|
88.0
|
$
|
79.9
|
$
|
56.4
|
$
|
65.3
|
$
|
65.3
|
$
|
60.2
|
$
|
59.2
|
$
|
60.7
|
$
|
66.9
|
$
|
79.4
|
$
|
88.3
|
$
|
84.3
|
$
|
104.0
|
-
|
|||||||||||||||||||||||||||||||||||||||
|
Zircon Premium
|
US$M
|
$
|
544.4
|
-
|
-
|
$
|
53.1
|
$
|
67.2
|
$
|
44.4
|
$
|
31.4
|
$
|
35.3
|
$
|
35.8
|
$
|
32.4
|
$
|
30.6
|
$
|
29.8
|
$
|
31.1
|
$
|
35.0
|
$
|
37.9
|
$
|
36.0
|
$
|
44.4
|
-
|
|||||||||||||||||||||||||||||||||||||||
|
Zircon Concentrate
|
US$M
|
$
|
176.2
|
-
|
-
|
$
|
17.2
|
$
|
21.7
|
$
|
14.4
|
$
|
10.2
|
$
|
11.4
|
$
|
11.6
|
$
|
10.5
|
$
|
9.9
|
$
|
9.6
|
$
|
10.1
|
$
|
11.3
|
$
|
12.3
|
$
|
11.6
|
$
|
14.4
|
-
|
|||||||||||||||||||||||||||||||||||||||
|
Total Gross Revenue
|
US$M
|
$
|
2,453.1
|
-
|
-
|
$
|
195.4
|
$
|
252.2
|
$
|
198.7
|
$
|
140.2
|
$
|
159.6
|
$
|
161.5
|
$
|
147.7
|
$
|
141.8
|
$
|
140.9
|
$
|
150.5
|
$
|
173.0
|
$
|
189.4
|
$
|
180.1
|
$
|
222.3
|
-
|
|||||||||||||||||||||||||||||||||||||||
|
Operating Costs
|
|||||||||||||||||||||||||||||||||||||||||||||||||||||||||||||||||||||||||
|
Mining
|
US$M
|
$
|
365.5
|
-
|
-
|
$
|
22.8
|
$
|
25.6
|
$
|
33.2
|
$
|
24.0
|
$
|
22.7
|
$
|
32.0
|
$
|
28.5
|
$
|
27.3
|
$
|
25.8
|
$
|
25.0
|
$
|
25.3
|
$
|
26.1
|
$
|
27.0
|
$
|
20.2
|
||||||||||||||||||||||||||||||||||||||||
|
Wet Processing Plant
|
US$M
|
$
|
136.0
|
-
|
-
|
$
|
9.8
|
$
|
9.7
|
$
|
9.8
|
$
|
9.8
|
$
|
9.8
|
$
|
9.6
|
$
|
9.5
|
$
|
9.5
|
$
|
9.6
|
$
|
9.6
|
$
|
9.8
|
$
|
9.8
|
$
|
9.8
|
$
|
9.8
|
||||||||||||||||||||||||||||||||||||||||
|
Slimes Tailings Disposal
|
US$M
|
$
|
87.6
|
-
|
-
|
$
|
6.7
|
$
|
6.1
|
$
|
6.5
|
$
|
6.4
|
$
|
6.6
|
$
|
5.9
|
$
|
5.4
|
$
|
5.4
|
$
|
5.6
|
$
|
5.8
|
$
|
6.3
|
$
|
6.8
|
$
|
7.0
|
$
|
6.8
|
||||||||||||||||||||||||||||||||||||||||
|
Mineral Separation Plant
|
US$M
|
$
|
174.3
|
-
|
-
|
$
|
15.0
|
$
|
15.9
|
$
|
14.2
|
$
|
10.6
|
$
|
11.5
|
$
|
12.4
|
$
|
11.9
|
$
|
11.8
|
$
|
11.6
|
$
|
11.6
|
$
|
11.9
|
$
|
11.9
|
$
|
11.4
|
$
|
12.8
|
||||||||||||||||||||||||||||||||||||||||
|
General & Administration
|
US$M
|
$
|
96.9
|
-
|
-
|
$
|
6.9
|
$
|
6.9
|
$
|
6.9
|
$
|
6.9
|
$
|
6.9
|
$
|
6.9
|
$
|
6.9
|
$
|
6.9
|
$
|
6.9
|
$
|
6.9
|
$
|
6.9
|
$
|
6.9
|
$
|
6.9
|
$
|
6.9
|
||||||||||||||||||||||||||||||||||||||||
|
Landowner Royalties
|
US$M
|
$
|
59.0
|
-
|
-
|
$
|
9.8
|
$
|
12.6
|
$
|
9.9
|
$
|
1.4
|
-
|
$
|
4.0
|
$
|
5.9
|
$
|
4.3
|
$
|
2.1
|
$
|
6.8
|
-
|
-
|
-
|
$
|
2.2
|
-
|
|||||||||||||||||||||||||||||||||||||||||||
|
Transport and Logistics Costs
|
US$M
|
$
|
28.7
|
-
|
$
|
2.1
|
$
|
2.8
|
$
|
2.5
|
$
|
1.8
|
$
|
2.0
|
$
|
1.9
|
$
|
1.7
|
$
|
1.6
|
$
|
1.6
|
$
|
1.7
|
$
|
2.0
|
$
|
2.2
|
$
|
2.1
|
$
|
2.6
|
|||||||||||||||||||||||||||||||||||||||||
|
Total Operating Costs
|
US$M
|
$
|
947.9
|
-
|
-
|
$
|
73.2
|
$
|
79.6
|
$
|
83.1
|
$
|
60.9
|
$
|
59.6
|
$
|
72.8
|
$
|
69.9
|
$
|
66.9
|
$
|
63.1
|
$
|
67.4
|
$
|
62.2
|
$
|
63.8
|
$
|
64.1
|
$
|
61.3
|
-
|
|||||||||||||||||||||||||||||||||||||||
|
Operating Income before Taxes
|
US$M
|
$
|
1,505.2
|
-
|
-
|
$
|
122.3
|
$
|
172.6
|
$
|
115.6
|
$
|
79.2
|
$
|
100.0
|
$
|
88.7
|
$
|
77.8
|
$
|
74.9
|
$
|
77.7
|
$
|
83.0
|
$
|
110.8
|
$
|
125.6
|
$
|
116.0
|
$
|
160.9
|
-
|
|||||||||||||||||||||||||||||||||||||||
|
Capital Costs
|
|||||||||||||||||||||||||||||||||||||||||||||||||||||||||||||||||||||||||
|
Development Capital
|
US$M
|
$
|
237.2
|
$
|
42.2
|
$
|
186.3
|
$
|
8.7
|
-
|
-
|
-
|
-
|
-
|
-
|
-
|
-
|
-
|
-
|
-
|
-
|
-
|
-
|
||||||||||||||||||||||||||||||||||||||||||||||||||
|
Sustaining Capital, incl. Ongoing Reclamation
|
US$M
|
$
|
97.1
|
-
|
-
|
-
|
-
|
$
|
16.1
|
-
|
$
|
2.0
|
$
|
14.2
|
-
|
-
|
$
|
14.2
|
$
|
34.6
|
-
|
$
|
14.2
|
$
|
2.0
|
-
|
-
|
||||||||||||||||||||||||||||||||||||||||||||||
|
Final Closing/Reclamation Capital
|
US$M
|
$
|
10.3
|
-
|
-
|
-
|
-
|
-
|
-
|
-
|
-
|
-
|
-
|
-
|
-
|
-
|
-
|
-
|
$
|
10.3
|
-
|
||||||||||||||||||||||||||||||||||||||||||||||||||||
|
Total Capital Costs
|
US$M
|
$
|
344.5
|
$
|
42.2
|
$
|
186.3
|
$
|
8.7
|
-
|
$
|
16.1
|
-
|
$
|
2.0
|
$
|
14.2
|
-
|
-
|
$
|
14.2
|
$
|
34.6
|
-
|
$
|
14.2
|
$
|
2.0
|
$
|
10.3
|
-
|
||||||||||||||||||||||||||||||||||||||||||
|
Depreciation
|
US$M
|
$
|
344.5
|
-
|
-
|
$
|
67.8
|
$
|
48.4
|
$
|
39.2
|
$
|
28.0
|
$
|
20.5
|
$
|
18.7
|
$
|
13.4
|
$
|
9.6
|
$
|
10.9
|
$
|
17.6
|
$
|
12.6
|
$
|
13.0
|
$
|
9.9
|
$
|
34.9
|
||||||||||||||||||||||||||||||||||||||||
|
Depletion
|
US$M
|
$
|
437.6
|
-
|
-
|
$
|
27.2
|
$
|
46.0
|
$
|
35.4
|
$
|
25.6
|
$
|
29.9
|
$
|
29.5
|
$
|
26.6
|
$
|
25.7
|
$
|
25.7
|
$
|
26.5
|
$
|
31.7
|
$
|
34.6
|
$
|
32.9
|
$
|
40.2
|
||||||||||||||||||||||||||||||||||||||||
|
Income Taxes
|
US$M
|
$
|
189.0
|
-
|
-
|
$
|
7.1
|
$
|
20.4
|
$
|
10.7
|
$
|
6.7
|
$
|
13.0
|
$
|
10.6
|
$
|
9.9
|
$
|
10.4
|
$
|
10.7
|
$
|
10.2
|
$
|
17.4
|
$
|
20.4
|
$
|
19.1
|
$
|
22.4
|
-
|
|||||||||||||||||||||||||||||||||||||||
|
Change in Working Capital
|
US$M
|
-
|
-
|
-
|
$
|
12.4
|
$
|
4.3
|
$
|
(4.4
|
)
|
$
|
(3.5
|
)
|
$
|
1.7
|
$
|
(0.6
|
)
|
$
|
(1.1
|
)
|
$
|
(0.3
|
)
|
$
|
0.2
|
$
|
0.4
|
$
|
2.3
|
$
|
1.3
|
$
|
(0.8
|
)
|
$
|
3.5
|
$
|
(15.4
|
)
|
||||||||||||||||||||||||||||||||
|
After Tax Free Cash Flow
|
US$M
|
$
|
971.7
|
$
|
(42.2
|
)
|
$
|
(186.3
|
)
|
$
|
94.0
|
$
|
147.9
|
$
|
93.2
|
$
|
76.0
|
$
|
83.4
|
$
|
64.6
|
$
|
69.0
|
$
|
64.8
|
$
|
52.7
|
$
|
37.9
|
$
|
91.1
|
$
|
89.8
|
$
|
95.7
|
$
|
124.8
|
$
|
15.4
|
||||||||||||||||||||||||||||||||||
Page 74
| 19.3 |
Sensitivity Analysis
|
The Study have been designed to a Scoping level of detail with an intended accuracy of ± 35%. Key inputs into the Study have been tested by pricing, capital cost, and operating cost sensitivities.
The results highlight that the NPV is most sensitive to Monazite price and OPEX variations, and that IRR is most Sensitive to CAPEX variations.
Page 75
|
IPERIONX TITAN PROJECT – INITIAL ASSESSMENT
|
Figure 33: Titan Project sensitivity analysis results – post tax NPV (US$M).
Figure 34: Titan Project sensitivity analysis results – post tax IRR (%).
Page 76
|
IPERIONX TITAN PROJECT – INITIAL ASSESSMENT
|
| 20. |
Adjacent Properties
|
No proprietary information associated with neighboring properties was used as part of this study.
Page 77
|
IPERIONX TITAN PROJECT – INITIAL ASSESSMENT
|
| 21. |
Other Relevant Data and Information
|
No other relevant data exist at this time.
Page 78
|
IPERIONX TITAN PROJECT – INITIAL ASSESSMENT
|
| 22. |
Interpretation and Conclusions
|
The QPs are confident in the technical and economic assessment presented in this TRS.
The QPs also recognize that the results of this TRS are subject to many risks including, but not limited to: commodity prices, unanticipated inflation of capital or operating costs, geological uncertainty and
geotechnical and hydrologic assumptions.
The Initial Assessment highlights several advantages which include:
| • |
Low complexity mining practices can be employed utilizing local service providers.
|
| • |
Mining footprint can be controlled to limit environmental and social impacts.
|
| • |
Mining approach presented returns land mass to pre-mining conditions as minimum.
|
| • |
Signed Memorandum of Understanding (MOU) for rare earth concentrate and titanium minerals (rutile and ilmenite) and zircon products.
|
| • |
Shipping advantage, given that a large proportion of the rare earth concentrate and titanium (rutile and ilmenite) products are anticipated to be sold within the U.S.
|
| • |
Exposure to high-demand, future-facing commodities experiencing increasing commodity prices.
|
| • |
The net present value of the 25-year based Project is $692M at an 8% discount rate and after tax.
|
| • |
The internal rate of return (IRR) is 40%.
|
At the time of publication of this Initial Assessment report a preliminary feasibility study is planned to be completed.
Page 79
|
IPERIONX TITAN PROJECT – INITIAL ASSESSMENT
|
| 23. |
Recommendations
|
The Initial Assessment demonstrates the Titan Project’s importance as a leading U.S. critical mineral project, and puts IperionX in a strong position to rapidly advance next steps in the development process,
including:
| • |
Continued exploration and expansion of the Company’s land position;
|
| • |
Advancing project permitting and development approvals;
|
| • |
Commencement of a pre-feasibility study to optimize mine and process design;
|
| • |
Performing feasibility study level flowsheet development test work (ongoing);
|
| • |
Develop a Mineral Demonstration Facility on site (completed desliming, planning wet concentration and mineral separation stages.)
|
| • |
Investigation of product upgrading and downstream processing;
|
| • |
Undertaking a lifecycle analysis for the Company’s mineral and metal projects and operations;
|
| • |
Continue implementation of sustainable operating and rehabilitation practices with UTIA;
|
| • |
Continued stakeholder awareness and engagement; and
|
| • |
Formalizing agreements with a number of prospective strategic, technical and offtake partners.
|
Page 80
|
IPERIONX TITAN PROJECT – INITIAL ASSESSMENT
|
| 24. |
References
|
Primero Scoping Study Report, Titan Heavy Mineral Sands Project, 40501-REP-GE-002, June 2022.
Mineral Technologies Report, Titan Mineral Sands Project – Benton Ore, Conventional Wet Gravity and Dry Physical Separation Testwork Including Creation of Ilmenite, Rutile, Zircon, and Monazite Concentrate from
Provided Ore Samples, MTNA21069, Rev.2, 22 September 2021.
Mineral Technologies Report, Titan Mineral Sands Project – Camden Ore, Scoping Testwork for Wet Gravity, Rare Earth Mineral Flotation and Dry Physical Separation to Produce Concentrates of Zircon, Monazite and
Titanium Minerals, MS21/3394979/1, Rev.2, 16 February 2022.
IperionX, ASX Release, Maiden Resource Confirms Tennessee as Major Untapped Critical Mineral Province, 6 October 2021.
Page 81
|
IPERIONX TITAN PROJECT – INITIAL ASSESSMENT
|
| 25. |
Reliance on Information Provided by the Registrant
|
Primero has relied upon the following information supplied by IperionX:
| • |
Section 16: Market Studies. Pricing information was based on data sourced from Adamas Intelligence, TZMI and IperionX.
|
| • |
Section 17: Environmental Studies, Permitting, and Plans, Negotiations, or Agreements with Local Individuals or Groups. This is based on the information from HDR, PGS Consults, UTIA and IperionX.
|
Page 82