.2

Second Quarter 2026 Results August 10, 2026
Important Disclosure This presentation is intended to provide general
information only and is not, and should not be considered, as an offer to purchase or sell the Company’s securities, or a proposal to receive such offers. In addition, this presentation is not an offer to the public of the Company’s
securities. By attending or viewing this presentation, each attendee (“Attendee”) agrees that he or she (i) has read this disclaimer, (ii) is bound by the restrictions set out herein, (iii) is permitted, in accordance with all applicable
laws, to receive such information, (iv) is solely responsible for his or her own assessment of the business and financial position of the Company and (v) will conduct his or her own analysis and be solely responsible for forming the
Attendee's view of the potential future performance of the Company’s business. This presentation includes projections, guidance, forecasts, estimates, assessments and other information pertaining to future events and/or matters, whose
materialization is uncertain and is beyond the Company’s control, and which constitute forward looking statements (within the meaning of Section 27A of the Securities Act of 1933, as amended, Section 21E of the Securities Exchange Act of
1934, as amended, and the Israeli Securities Law, 5728-1968). Many of the forward-looking statements contained in this presentation can be identified by the use of forward-looking words such as “anticipate,” “believe,” “could,” “expect,”
“should,” “plan,” “intend,” “estimate” and “potential,” among others. Forward-looking statements include, but are not limited to, expectations and evaluations relating to the Company’s business and financial targets and strategy, the
integration of the Company’s technology in various systems and industries, the advantages of the Company’s existing and future products, timetables regarding completion of the Company’s developments and the Company’s intentions in relation to
various industries, the Company’s intentions in relation to the creation of collaborations and engagements in licensing agreements, production and distribution in various countries, and other statements regarding our intent, belief or current
expectations. Forward-looking statements are based on our management’s beliefs and assumptions and on information currently available to our management. Such statements are subject to risks and uncertainties, and actual results may differ
materially from those expressed or implied in the forward-looking statements due to various factors, including, but not limited to: our expectations regarding general market conditions, including as a result of global economic trends; changes
in consumer tastes and preferences; fluctuations in inflation, interest rates and exchange rates in the global economic environment; the availability of qualified personnel and the ability to retain such personnel and the ability to retain
such personnel; changes in commodity costs, labor, distribution and other operating costs; our ability to implement our growth strategy; changes in government regulation and tax matters; political, demographic and business conditions in
Israel; the success of operating initiatives, including advertising and promotional efforts and new product and concept development by us and our competitors; factors relating to acquisitions made by the Company, including our ability to
effectively and efficiently integrate acquired businesses into our existing business; and other risk factors discussed under “Risk Factors” in our annual report on Form 20-F filed with the SEC on March 9 , 2026 (our “Annual Report"). The
preceding list is not intended to be an exhaustive list of all of our forward-looking statements. The forward-looking statements are based on our beliefs, assumptions and expectations of future performance, taking into account the information
currently available to us. These statements are only estimates based upon our current expectations and projections about future events. There are important factors that could cause our actual results, levels of activity, performance or
achievements to differ materially from the results, levels of activity, performance or achievements expressed or implied by the forward-looking statements. In particular, you should consider the risks provided under “Risk Factors” in our
Annual Report. You should not rely upon forward-looking statements as predictions of future events. Although we believe that the expectations reflected in the forward-looking statements are reasonable, we cannot guarantee that future
results, levels of activity, performance and events and circumstances reflected in the forward-looking statements will be achieved or will occur. Each forward-looking statement speaks only as of the date of the particular statement. Except as
required by law, we undertake no obligation to update publicly any forward-looking statements provided in this presentation for any reason, to conform these statements to actual results or to changes in our expectations. In addition, the
presentation includes data published by various bodies, and data provided to the Company in the framework of cooperation engagements, concerning the industry, competitive position and markets in which the Company operates, whose content was
not independently verified by the Company, such that the Company is not responsible for the accuracy or completeness of such date or whether the data is up-to-date, and Company takes no responsibility for any reliance on such data.
Management estimates contained in this presentation are derived from publicly available information released by independent industry analysts and other third-party sources, as well as data from the Company's internal research, and are based
on assumptions made by the Company upon review of such data, and the Company's experience in, and knowledge of, the industry and markets in which the Company operates. Although the Company believes these management estimates are reasonable,
projections, assumptions and estimates of the future performance of the industry in which the Company operates and the Company's future performance are necessarily subject to uncertainty and risk due to a variety of factors, including those
described above. These and other factors could cause results to differ materially from those expressed in the estimates made by independent parties and by the Company. Industry publications, research, surveys and studies generally state that
the information they provide has been obtained from sources believed to be reliable, but that the accuracy and completeness of such information is not guaranteed. Forecasts and other forward-looking information obtained from these sources are
subject to the same qualifications and uncertainties as the other forward-looking statements in this presentation. In addition to various operational metrics and financial measures in accordance with accounting principles generally accepted
under International Financial Reporting Standards, or IFRS, this presentation contains Adjusted EBITDA, Free Cash Flow, Adjusted OPEX and Adjusted Net Income, each a non-IFRS financial measure provided to help evaluate our past results and
future prospects. Please refer to the appendix for of this presentation for a definition of Adjusted EBITDA, Free Cash Flow, Adjusted OPEX and Adjusted Net Income as well as reconciliations of Adjusted EBITDA and Adjusted Net Income to net
income (loss), Free Cash Flow to operating cash and Adjusted OPEX to OPEX. Due to the inherent difficulty in forecasting and quantifying the amounts of certain items that are necessary for such reconciliation, the Company is not able,
without unreasonable effort, to provide a reconciliation of forward-looking Adjusted EBITDA and Adjusted Net Income to IFRS net income (loss), in particular because items such as finance expenses and issuance and acquisition costs used to
calculate projected net income (loss) vary dramatically based on actual events. Therefore, the Company is not able to forecast on an IFRS basis with reasonable certainty all deductions needed in order to provide an IFRS calculation of
projected net income (loss) at this time. The amount of these deductions may be material and therefore could result in projected IFRS net income (loss) being materially less than projected Adjusted EBITDA and Adjusted Net Income (non-IFRS).
The Company and its licensors have proprietary rights to trademarks used in this presentation. Solely for convenience, trademarks and trade names referred to in this presentation may appear without the “®” or “TM” symbols, but the lack of
such references is not intended to indicate, in any way, that the Company will not assert, to the fullest extent possible under applicable law, its rights or the rights of the applicable licensor to these trademarks and trade names. This
presentation also contains trademarks, trade names and service marks of other companies, which are the property of their respective owners and are used here for reference purposes only. Such use of other parties’ trademarks, trade names or
service marks should not be construed to imply a relationship with, or an endorsement or sponsorship of the Company, by any other party. Forward-looking statements, risk factors, and non-GAAP financial measures referenced in this
presentation

Today’s Presenters 3 Yair Nechmad CEO & Co-Founder Sagit
Manor CFO Aaron Greenberg CSO 3
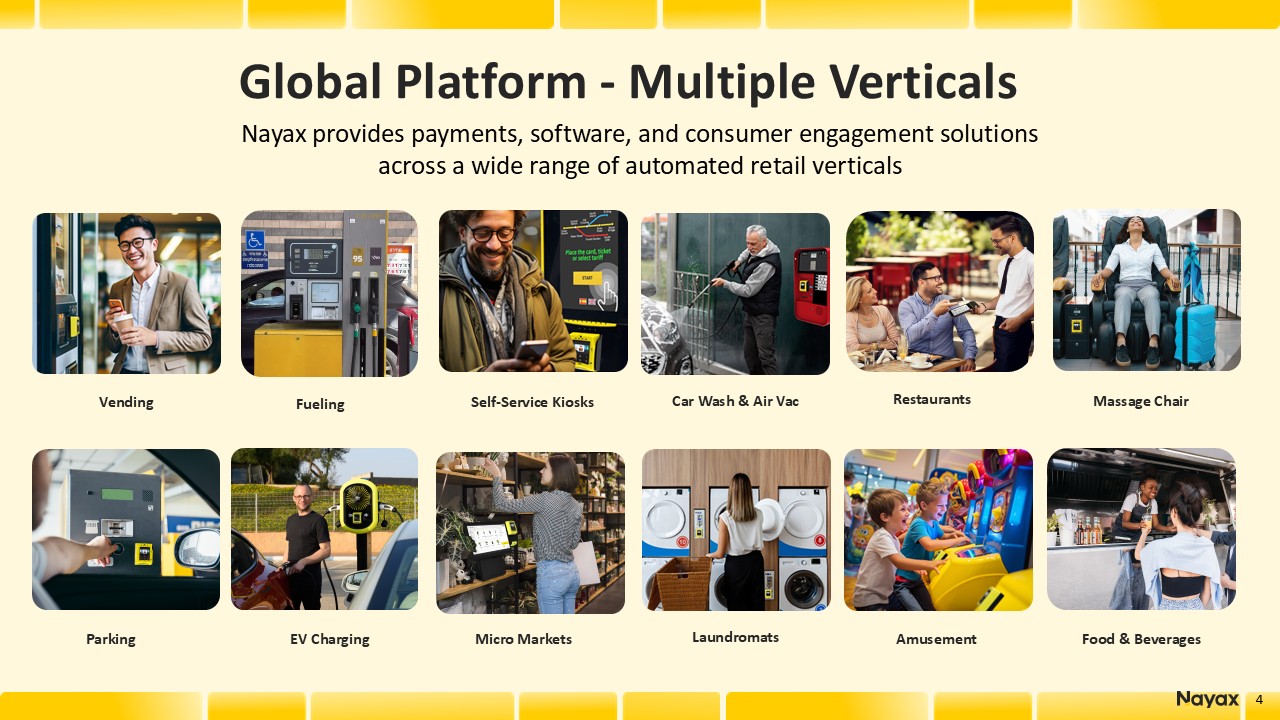
Nayax provides payments, software, and consumer engagement solutions across a
wide range of automated retail verticals Global Platform - Multiple Verticals Massage Chair Fueling Self-Service Kiosks Laundromats Car Wash & Air Vac Amusement Food & Beverages Restaurants Micro Markets EV Charging
Vending Parking 4 4
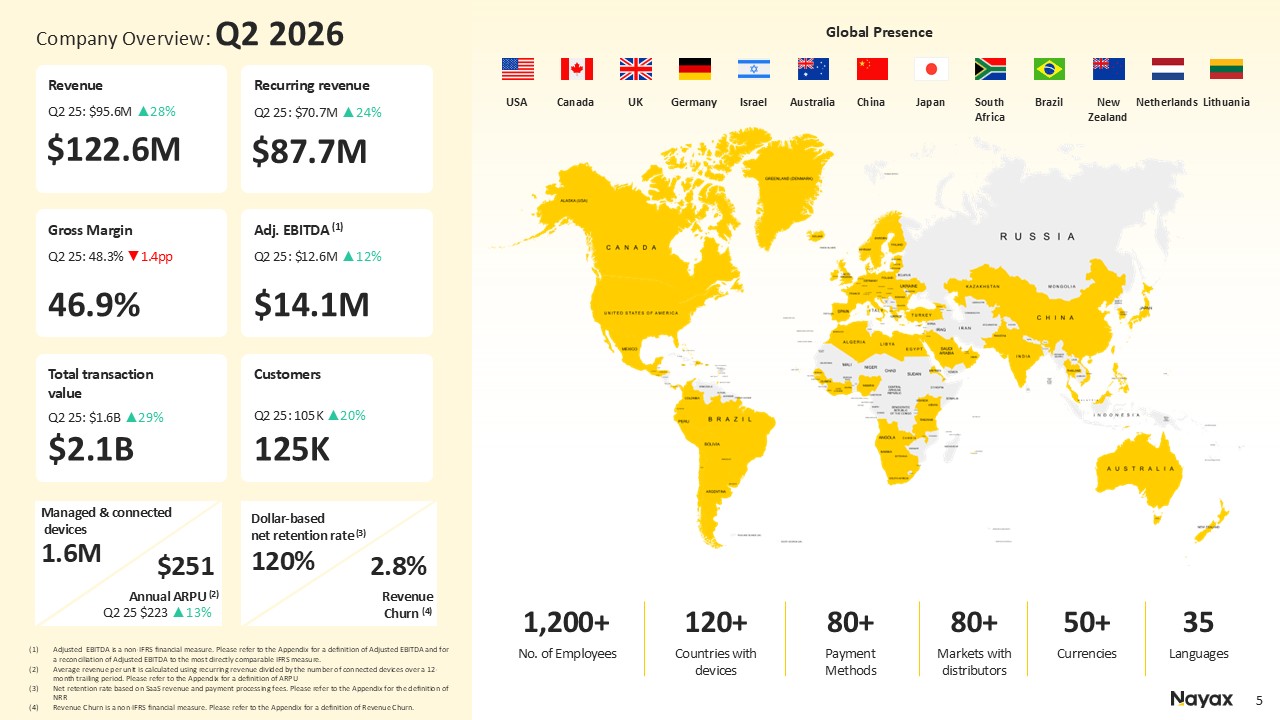
Revenue $122.6M Q2 25: $95.6M ▲28% Recurring revenue $87.7M Q2 25: $70.7M
▲24% Gross Margin 46.9% Q2 25: 48.3% ▼1.4pp Adj. EBITDA (1) $14.1M Q2 25: $12.6M ▲12% Total transaction value $2.1B Customers 125K Revenue Churn (4) 2.8% Q2 25: $1.6B ▲29% Q2 25: 105K ▲20% Dollar-basednet retention rate
(3) 120% Adjusted EBITDA is a non-IFRS financial measure. Please refer to the Appendix for a definition of Adjusted EBITDA and for a reconciliation of Adjusted EBITDA to the most directly comparable IFRS measure. Average revenue per unit
is calculated using recurring revenue divided by the number of connected devices over a 12-month trailing period. Please refer to the Appendix for a definition of ARPU Net retention rate based on SaaS revenue and payment processing fees.
Please refer to the Appendix for the definition of NRR Revenue Churn is a non-IFRS financial measure. Please refer to the Appendix for a definition of Revenue Churn. Managed & connected devices 1.6M $251 Q2 25 $223 ▲13% Annual
ARPU (2) Company Overview: Q2 2026 No. of Employees 1,200+ Countries with devices 120+ Payment Methods 80+ Markets with distributors 80+ Currencies 50+ Languages 35 Global
Presence Canada USA UK Israel Germany Australia China Japan South Africa Brazil New Zealand Netherlands Lithuania
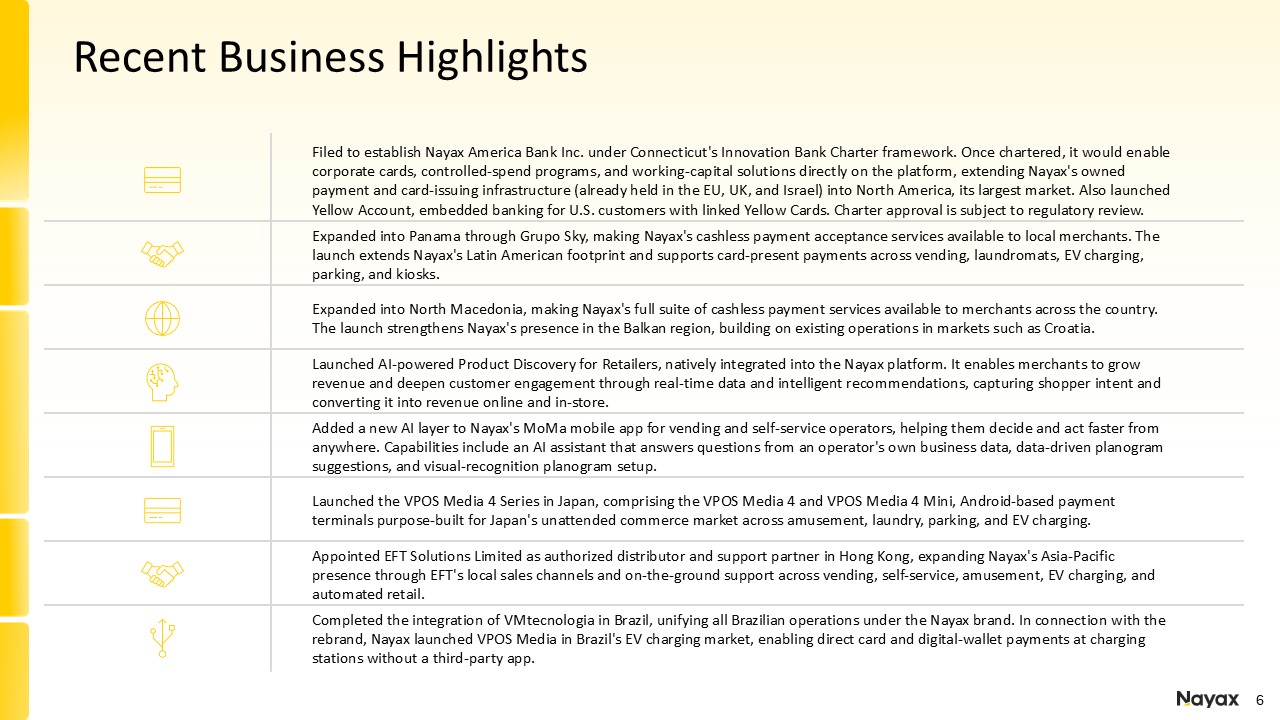
Recent Business Highlights Filed to establish Nayax America Bank Inc. under
Connecticut's Innovation Bank Charter framework. Once chartered, it would enable corporate cards, controlled-spend programs, and working-capital solutions directly on the platform, extending Nayax's owned payment and card-issuing
infrastructure (already held in the EU, UK, and Israel) into North America, its largest market. Also launched Yellow Account, embedded banking for U.S. customers with linked Yellow Cards. Charter approval is subject to regulatory
review. Expanded into Panama through Grupo Sky, making Nayax's cashless payment acceptance services available to local merchants. The launch extends Nayax's Latin American footprint and supports card-present payments across vending,
laundromats, EV charging, parking, and kiosks. Launched AI-powered Product Discovery for Retailers, natively integrated into the Nayax platform. It enables merchants to grow revenue and deepen customer engagement through real-time data and
intelligent recommendations, capturing shopper intent and converting it into revenue online and in-store. Expanded into North Macedonia, making Nayax's full suite of cashless payment services available to merchants across the country. The
launch strengthens Nayax's presence in the Balkan region, building on existing operations in markets such as Croatia. Added a new AI layer to Nayax's MoMa mobile app for vending and self-service operators, helping them decide and act faster
from anywhere. Capabilities include an AI assistant that answers questions from an operator's own business data, data-driven planogram suggestions, and visual-recognition planogram setup. Launched the VPOS Media 4 Series in Japan, comprising
the VPOS Media 4 and VPOS Media 4 Mini, Android-based payment terminals purpose-built for Japan's unattended commerce market across amusement, laundry, parking, and EV charging. Appointed EFT Solutions Limited as authorized distributor and
support partner in Hong Kong, expanding Nayax's Asia-Pacific presence through EFT's local sales channels and on-the-ground support across vending, self-service, amusement, EV charging, and automated retail. Completed the integration of
VMtecnologia in Brazil, unifying all Brazilian operations under the Nayax brand. In connection with the rebrand, Nayax launched VPOS Media in Brazil's EV charging market, enabling direct card and digital-wallet payments at charging stations
without a third-party app.

What’s Next?
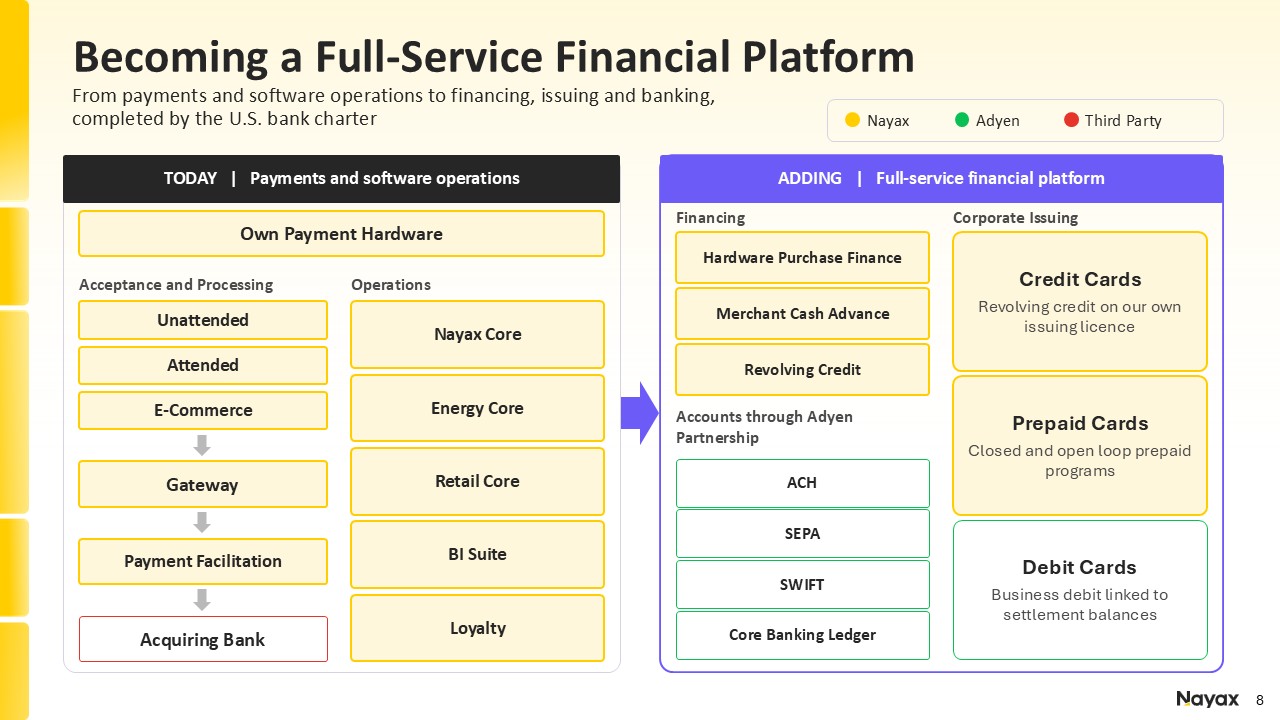
Becoming a Full-Service Financial Platform From payments and software
operations to financing, issuing and banking, completed by the U.S. bank charter TODAY | Payments and software operations ADDING | Full-service financial platform Acceptance and
Processing Unattended Attended E-Commerce Gateway Payment Facilitation Acquiring Bank Operations Nayax Core Energy Core Retail Core BI Suite Loyalty Financing Hardware Purchase Finance Merchant Cash Advance Revolving
Credit Accounts through Adyen Partnership ACH SEPA SWIFT Core Banking Ledger Corporate Issuing Credit Cards Revolving credit on our own issuing licence Prepaid Cards Closed and open loop prepaid programs Debit Cards Business debit
linked to settlement balances Nayax Adyen Third Party Own Payment Hardware
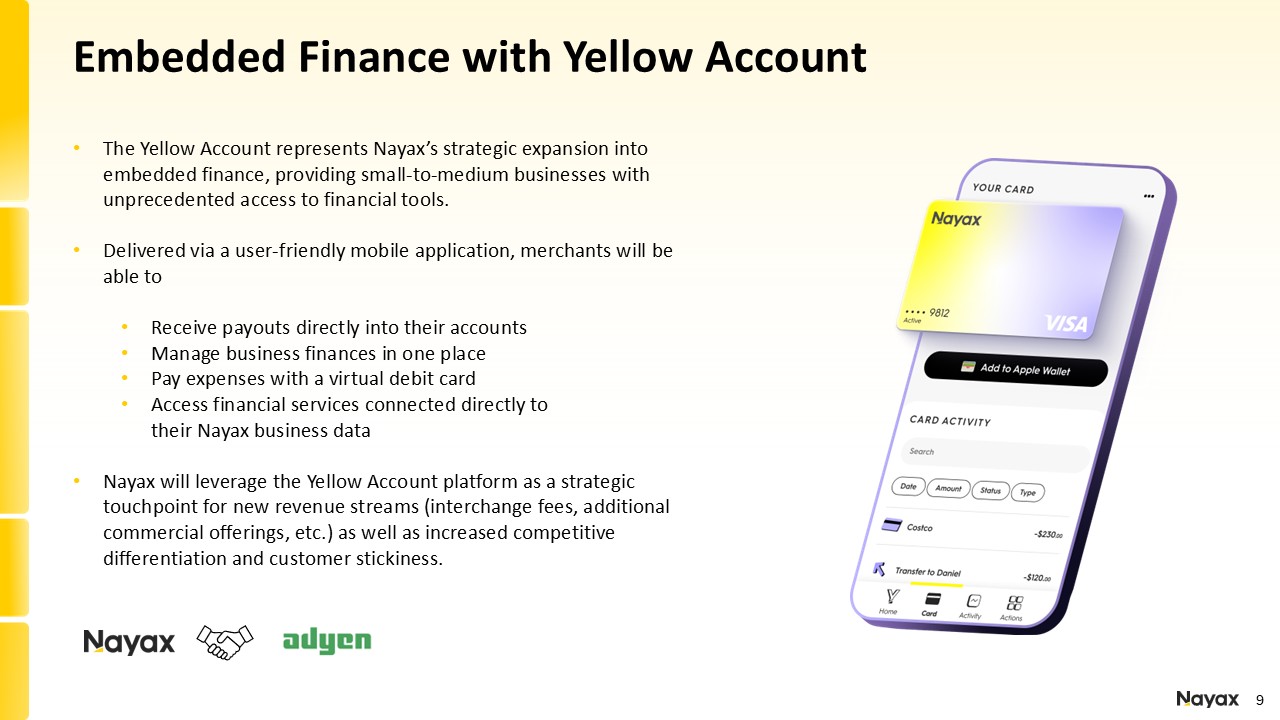
Embedded Finance with Yellow
Account The Yellow Account represents Nayax’s strategic expansion into embedded finance, providing small-to-medium businesses with unprecedented access to financial tools. Delivered via a user-friendly mobile application, merchants will be
able to Receive payouts directly into their accounts Manage business finances in one place Pay expenses with a virtual debit card Access financial services connected directly to their Nayax business data Nayax will leverage the Yellow
Account platform as a strategic touchpoint for new revenue streams (interchange fees, additional commercial offerings, etc.) as well as increased competitive differentiation and customer stickiness.
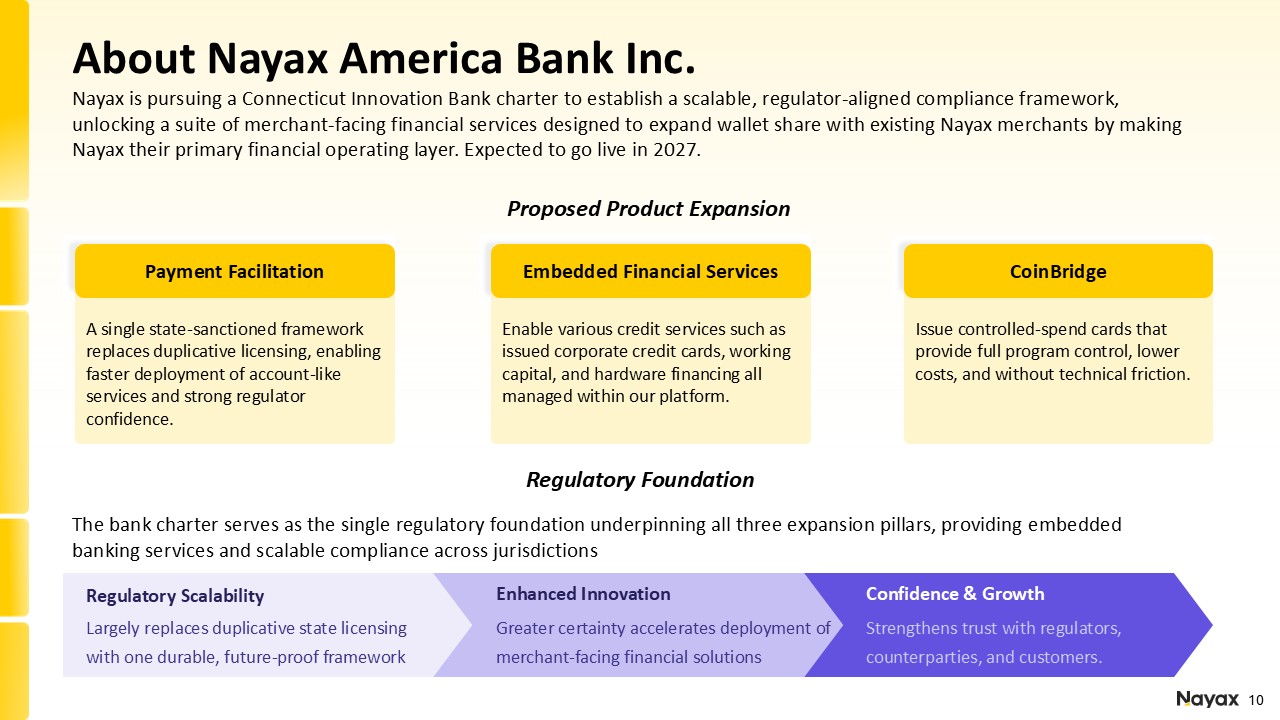
About Nayax America Bank Inc. Nayax is pursuing a Connecticut Innovation Bank
charter to establish a scalable, regulator-aligned compliance framework, unlocking a suite of merchant-facing financial services designed to expand wallet share with existing Nayax merchants by making Nayax their primary financial operating
layer. Expected to go live in 2027. A single state-sanctioned framework replaces duplicative licensing, enabling faster deployment of account-like services and strong regulator confidence. Payment Facilitation Enable various credit
services such as issued corporate credit cards, working capital, and hardware financing all managed within our platform. Embedded Financial Services Issue controlled-spend cards that provide full program control, lower costs, and without
technical friction. CoinBridge The bank charter serves as the single regulatory foundation underpinning all three expansion pillars, providing embedded banking services and scalable compliance across jurisdictions Regulatory
Scalability Largely replaces duplicative state licensing with one durable, future-proof framework Enhanced Innovation Greater certainty accelerates deployment of merchant-facing financial solutions Confidence & Growth Strengthens
trust with regulators, counterparties, and customers. Proposed Product Expansion Regulatory Foundation
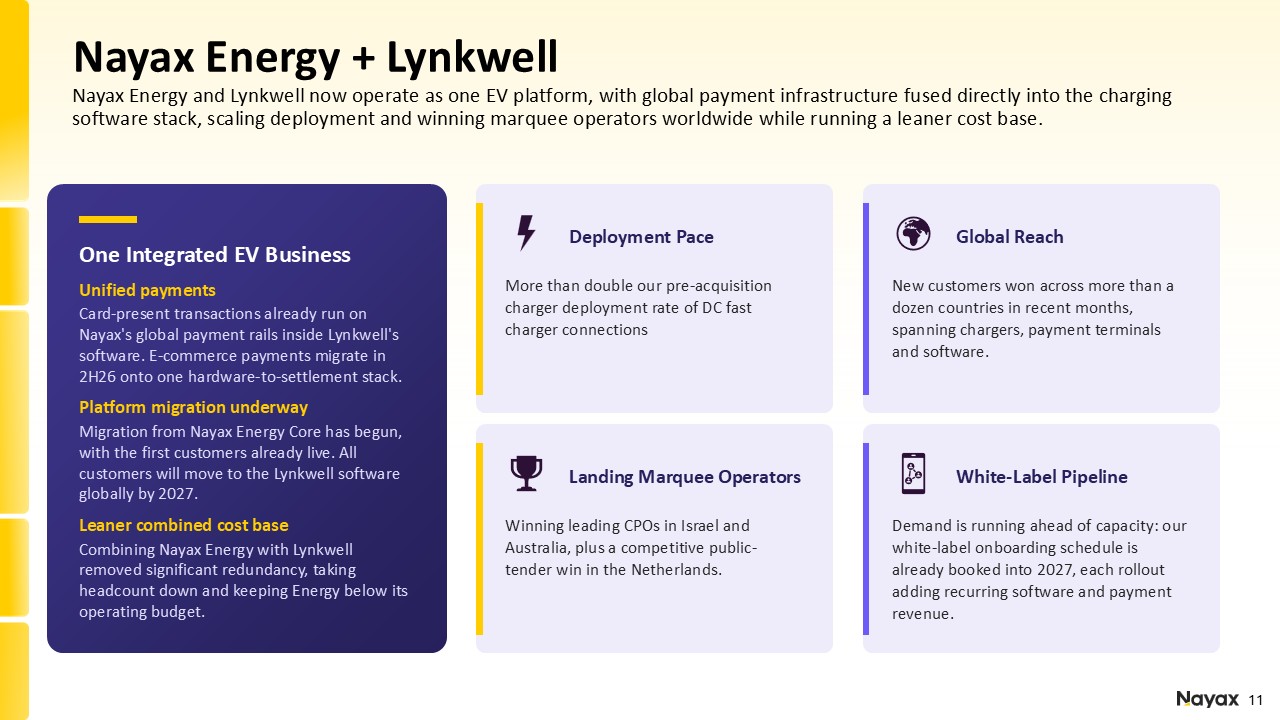
Nayax Energy + Lynkwell Nayax Energy and Lynkwell now operate as one EV
platform, with global payment infrastructure fused directly into the charging software stack, scaling deployment and winning marquee operators worldwide while running a leaner cost base. One Integrated EV Business Unified
payments Card-present transactions already run on Nayax's global payment rails inside Lynkwell's software. E-commerce payments migrate in 2H26 onto one hardware-to-settlement stack. Platform migration underway Migration from Nayax Energy
Core has begun, with the first customers already live. All customers will move to the Lynkwell software globally by 2027. Leaner combined cost base Combining Nayax Energy with Lynkwell removed significant redundancy, taking headcount down
and keeping Energy below its operating budget. Deployment Pace More than double our pre-acquisition charger deployment rate of DC fast charger connections Global Reach New customers won across more than a dozen countries in recent months,
spanning chargers, payment terminals and software. Landing Marquee Operators Winning leading CPOs in Israel and Australia, plus a competitive public-tender win in the Netherlands. White-Label Pipeline Demand is running ahead of capacity:
our white-label onboarding schedule is already booked into 2027, each rollout adding recurring software and payment revenue.

Financial Performance & Outlook
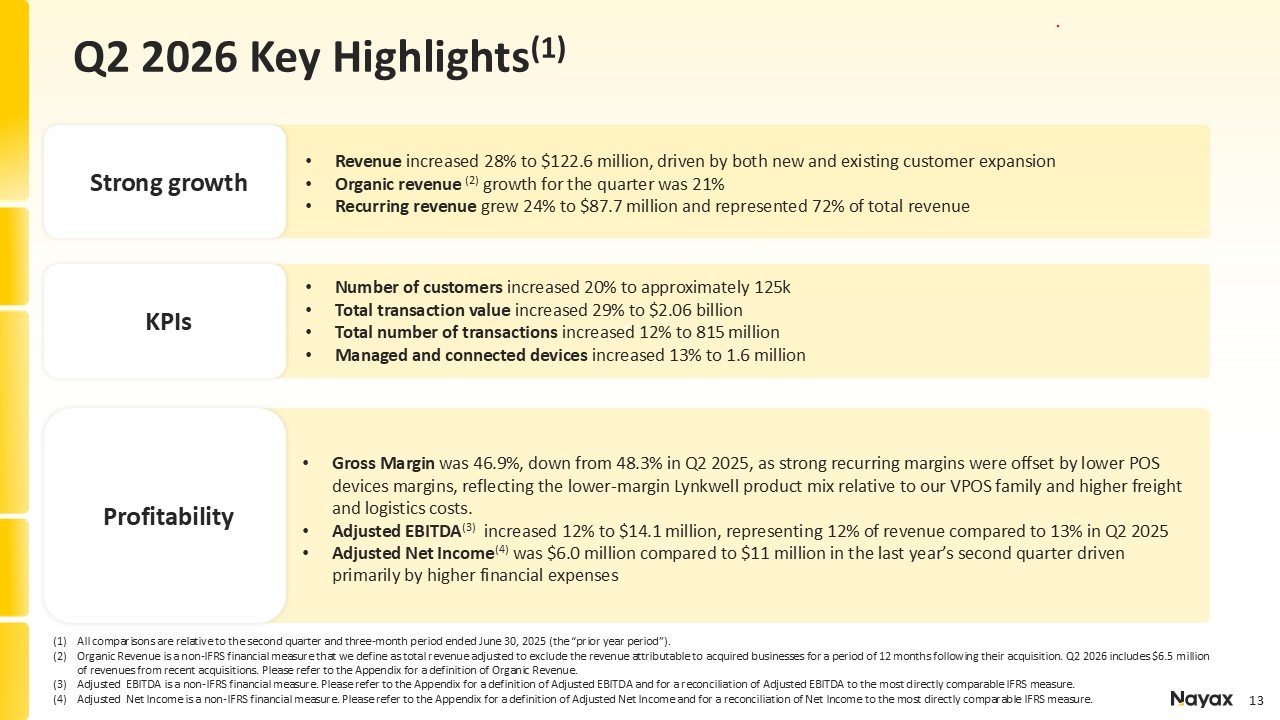
Strong growth Revenue increased 28% to $122.6 million, driven by both new and
existing customer expansion Organic revenue (2) growth for the quarter was 21% Recurring revenue grew 24% to $87.7 million and represented 72% of total revenue Number of customers increased 20% to approximately 125k Total transaction
value increased 29% to $2.06 billion Total number of transactions increased 12% to 815 million Managed and connected devices increased 13% to 1.6 million KPIs Profitability Gross Margin was 46.9%, down from 48.3% in Q2 2025, as strong
recurring margins were offset by lower POS devices margins, reflecting the lower-margin Lynkwell product mix relative to our VPOS family and higher freight and logistics costs. Adjusted EBITDA(3) increased 12% to $14.1 million, representing
12% of revenue compared to 13% in Q2 2025 Adjusted Net Income(4) was $6.0 million compared to $11 million in the last year’s second quarter driven primarily by higher financial expenses All comparisons are relative to the second quarter and
three-month period ended June 30, 2025 (the “prior year period”). Organic Revenue is a non-IFRS financial measure that we define as total revenue adjusted to exclude the revenue attributable to acquired businesses for a period of 12 months
following their acquisition. Q2 2026 includes $6.5 million of revenues from recent acquisitions. Please refer to the Appendix for a definition of Organic Revenue. Adjusted EBITDA is a non-IFRS financial measure. Please refer to the Appendix
for a definition of Adjusted EBITDA and for a reconciliation of Adjusted EBITDA to the most directly comparable IFRS measure. Adjusted Net Income is a non-IFRS financial measure. Please refer to the Appendix for a definition of Adjusted Net
Income and for a reconciliation of Net Income to the most directly comparable IFRS measure. Q2 2026 Key Highlights(1)
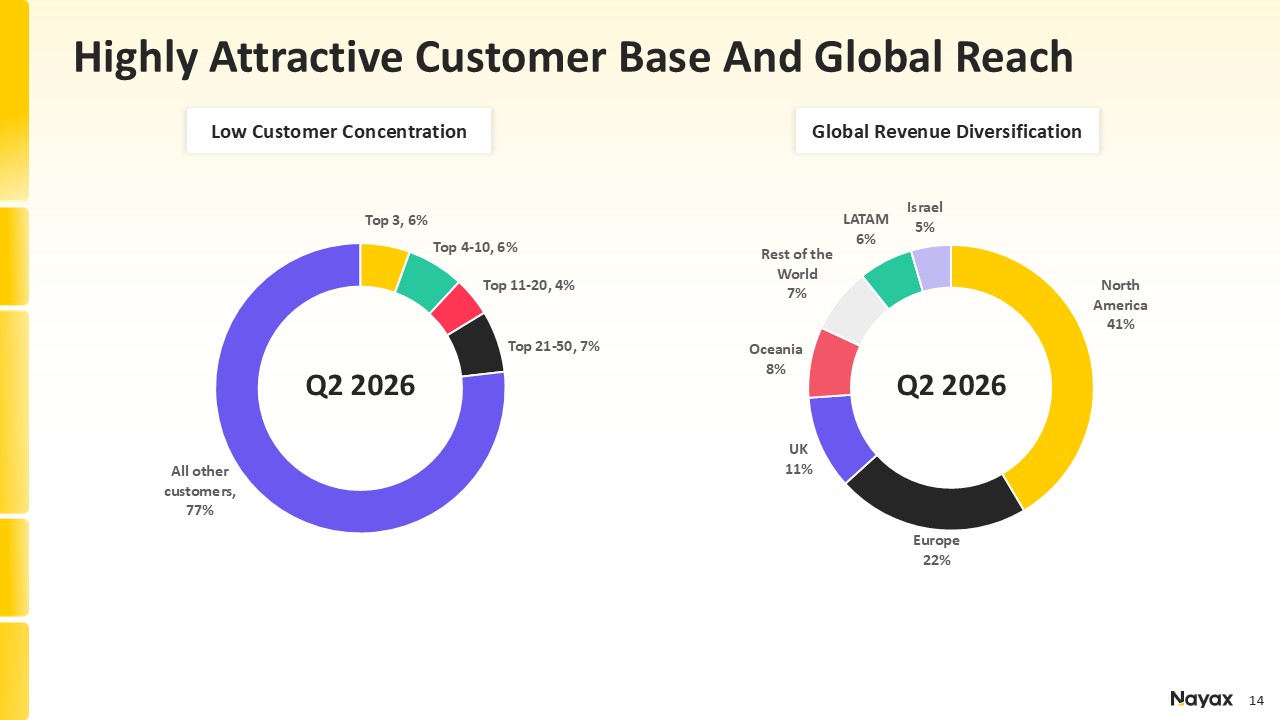
Highly Attractive Customer Base And Global Reach Low Customer
Concentration Global Revenue Diversification Q2 2026 Q2 2026
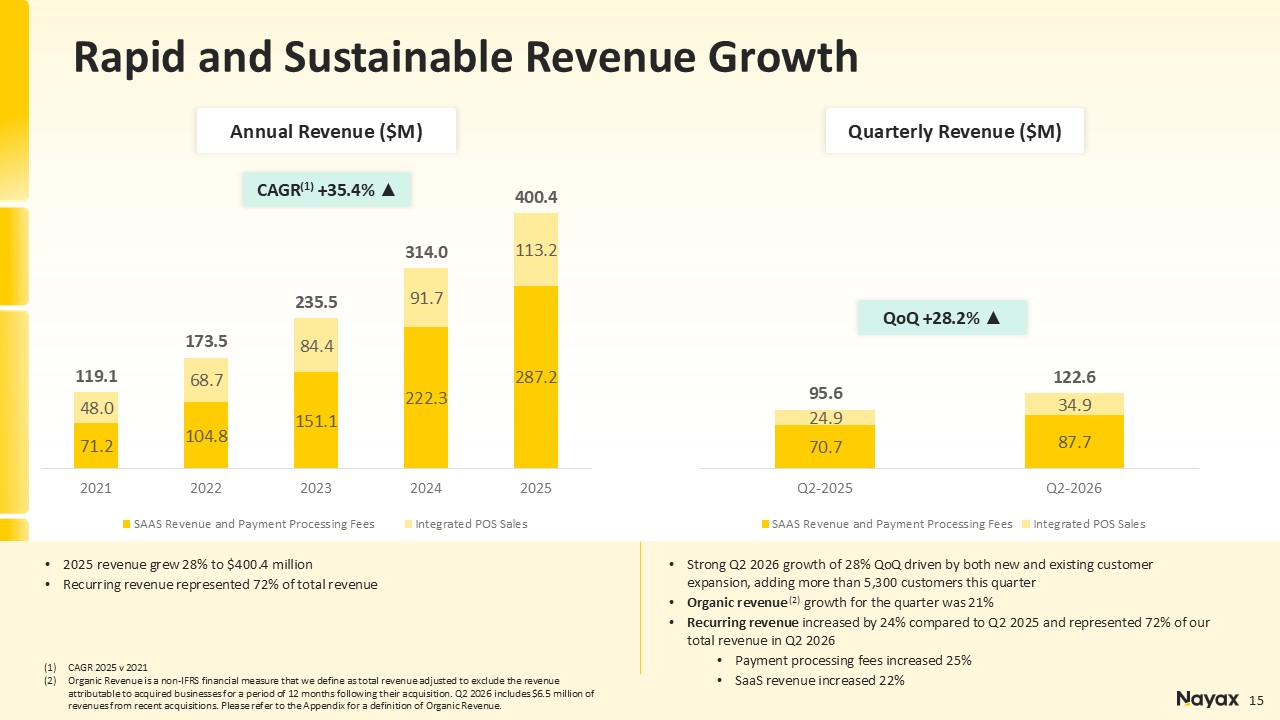
2025 revenue grew 28% to $400.4 million Recurring revenue represented 72% of
total revenue CAGR 2025 v 2021 Organic Revenue is a non-IFRS financial measure that we define as total revenue adjusted to exclude the revenue attributable to acquired businesses for a period of 12 months following their acquisition. Q2
2026 includes $6.5 million of revenues from recent acquisitions. Please refer to the Appendix for a definition of Organic Revenue. CAGR(1) +35.4% ▲ 15 Annual Revenue ($M) Quarterly Revenue ($M) QoQ +28.2% ▲ Strong Q2 2026 growth of 28%
QoQ driven by both new and existing customer expansion, adding more than 5,300 customers this quarter Organic revenue (2) growth for the quarter was 21% Recurring revenue increased by 24% compared to Q2 2025 and represented 72% of our total
revenue in Q2 2026 Payment processing fees increased 25% SaaS revenue increased 22% Rapid and Sustainable Revenue Growth
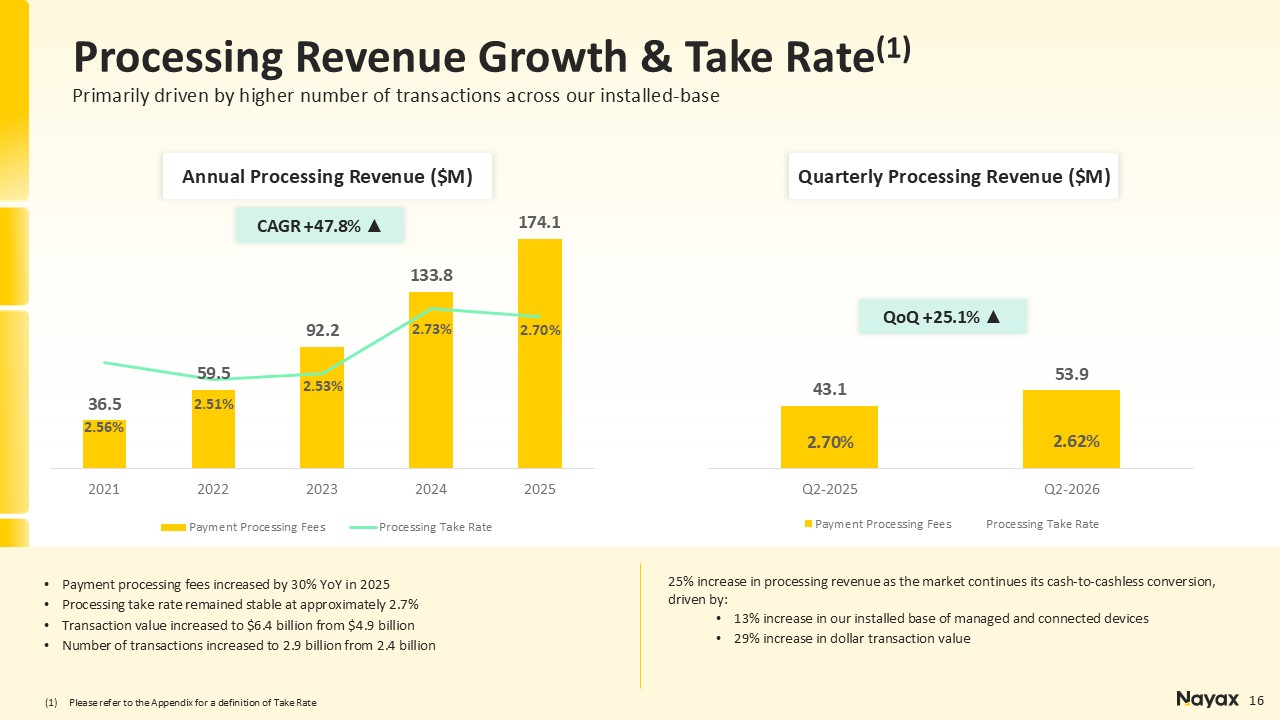
CAGR +47.8% ▲ 16 Annual Processing Revenue ($M) Quarterly Processing Revenue
($M) QoQ +25.1% ▲ Please refer to the Appendix for a definition of Take Rate Payment processing fees increased by 30% YoY in 2025 Processing take rate remained stable at approximately 2.7% Transaction value increased to $6.4 billion from
$4.9 billion Number of transactions increased to 2.9 billion from 2.4 billion 25% increase in processing revenue as the market continues its cash-to-cashless conversion, driven by: 13% increase in our installed base of managed and
connected devices 29% increase in dollar transaction value Processing Revenue Growth & Take Rate(1) Primarily driven by higher number of transactions across our installed-base
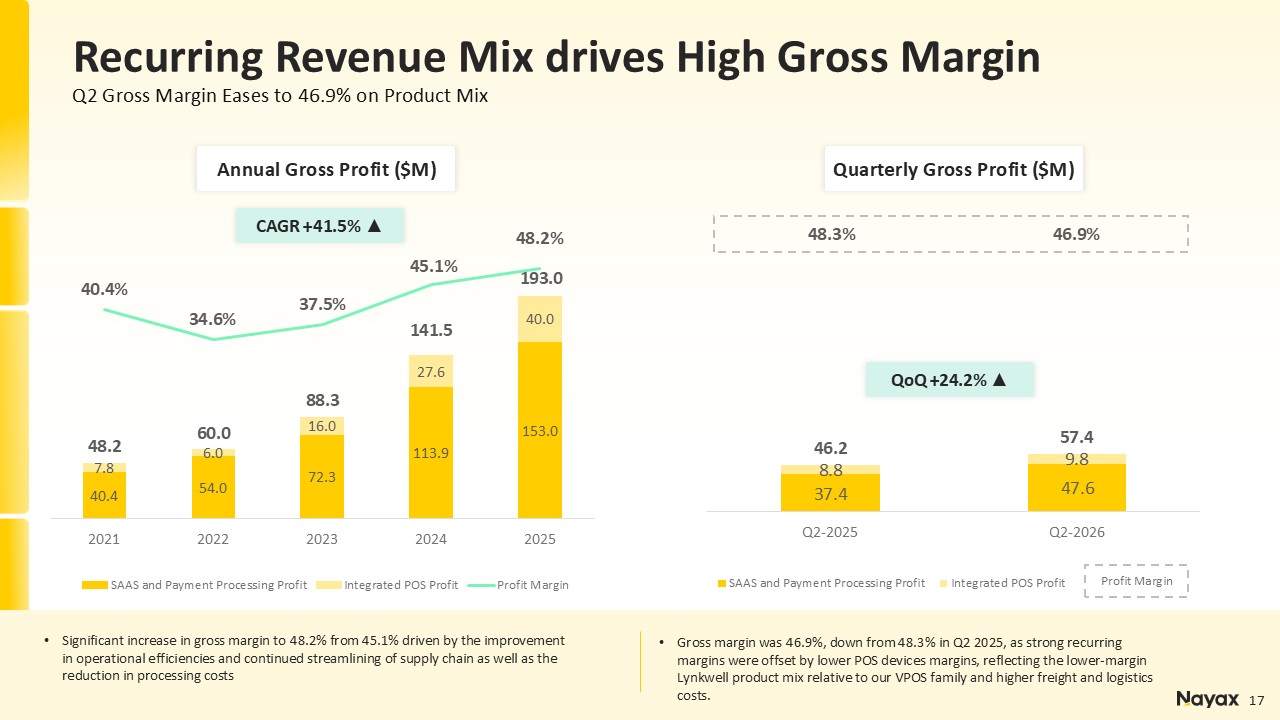
CAGR +41.5% ▲ 17 Annual Gross Profit ($M) Quarterly Gross Profit ($M) QoQ
+24.2% ▲ Significant increase in gross margin to 48.2% from 45.1% driven by the improvement in operational efficiencies and continued streamlining of supply chain as well as the reduction in processing costs Gross margin was 46.9%, down
from 48.3% in Q2 2025, as strong recurring margins were offset by lower POS devices margins, reflecting the lower-margin Lynkwell product mix relative to our VPOS family and higher freight and logistics costs. Recurring Revenue Mix drives
High Gross Margin Q2 Gross Margin Eases to 46.9% on Product Mix Profit Margin
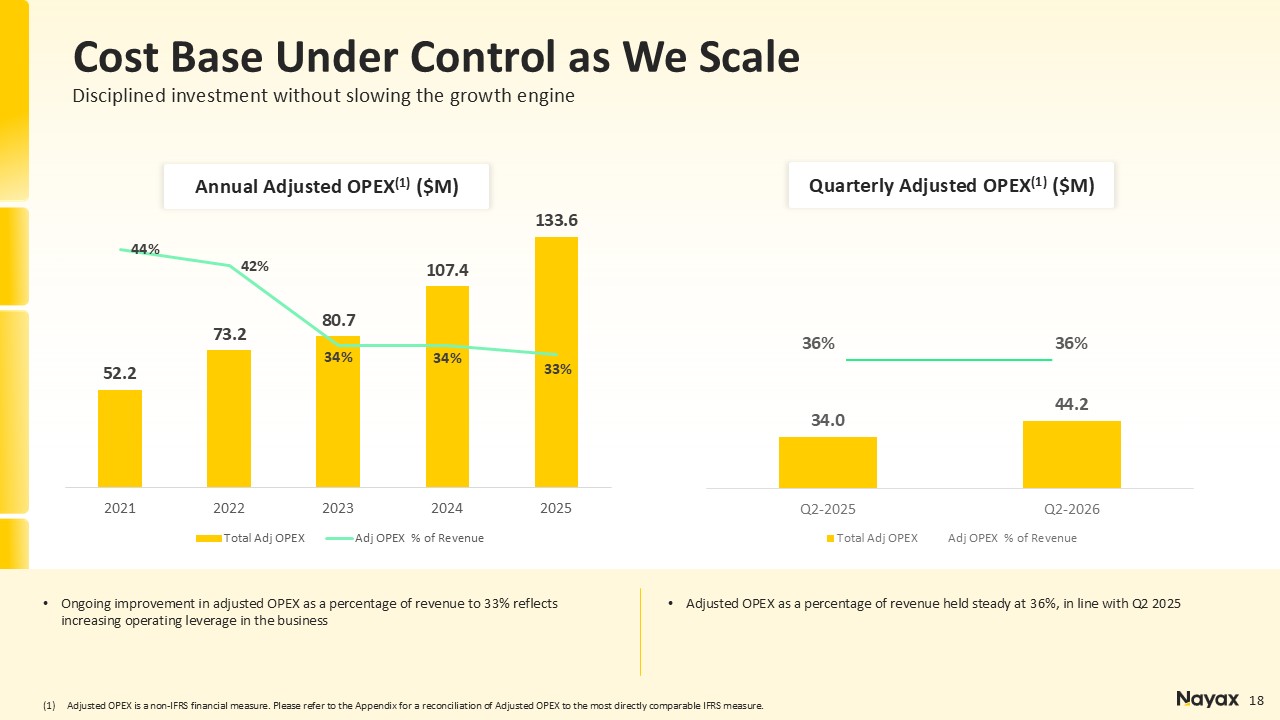
18 Annual Adjusted OPEX(1) ($M) Quarterly Adjusted OPEX(1) ($M) Ongoing
improvement in adjusted OPEX as a percentage of revenue to 33% reflects increasing operating leverage in the business Adjusted OPEX as a percentage of revenue held steady at 36%, in line with Q2 2025 Adjusted OPEX is a non-IFRS financial
measure. Please refer to the Appendix for a reconciliation of Adjusted OPEX to the most directly comparable IFRS measure. Cost Base Under Control as We Scale Disciplined investment without slowing the growth engine
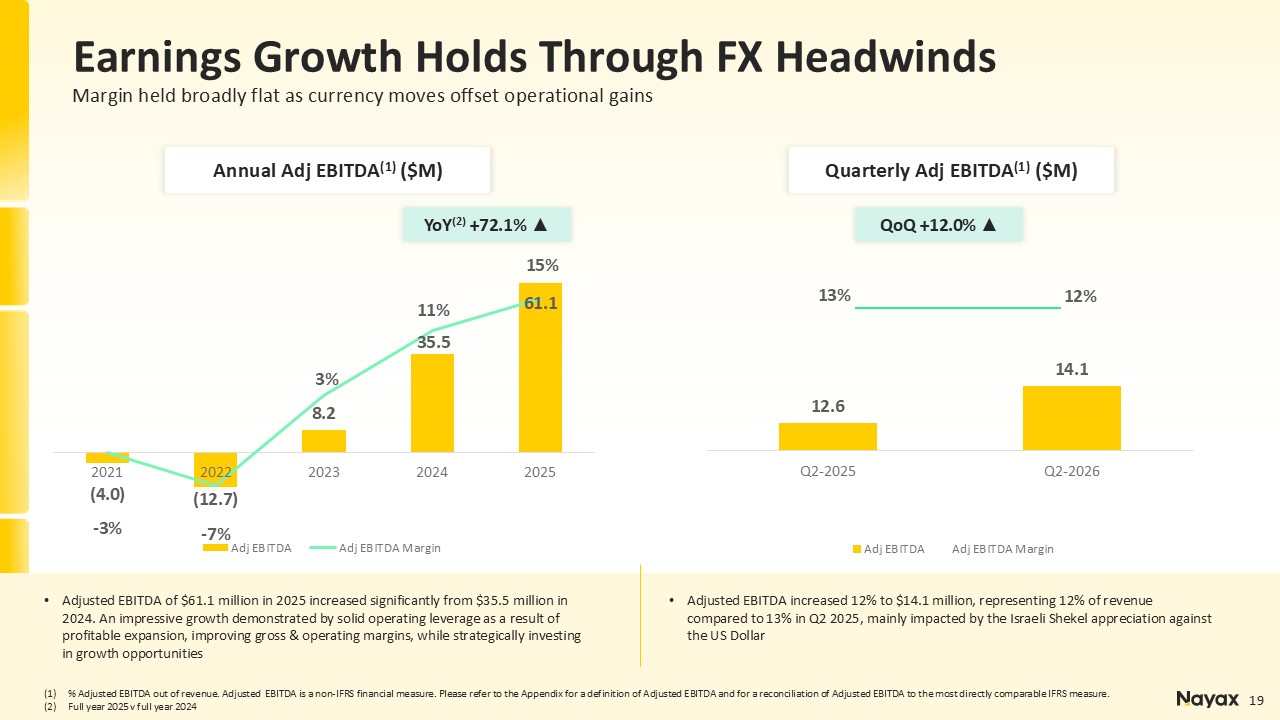
YoY(2) +72.1% ▲ 19 Annual Adj EBITDA(1) ($M) Quarterly Adj EBITDA(1)
($M) QoQ +12.0% ▲ % Adjusted EBITDA out of revenue. Adjusted EBITDA is a non-IFRS financial measure. Please refer to the Appendix for a definition of Adjusted EBITDA and for a reconciliation of Adjusted EBITDA to the most directly
comparable IFRS measure. Full year 2025 v full year 2024 Adjusted EBITDA of $61.1 million in 2025 increased significantly from $35.5 million in 2024. An impressive growth demonstrated by solid operating leverage as a result of profitable
expansion, improving gross & operating margins, while strategically investing in growth opportunities Adjusted EBITDA increased 12% to $14.1 million, representing 12% of revenue compared to 13% in Q2 2025, mainly impacted by the Israeli
Shekel appreciation against the US Dollar Earnings Growth Holds Through FX Headwinds Margin held broadly flat as currency moves offset operational gains
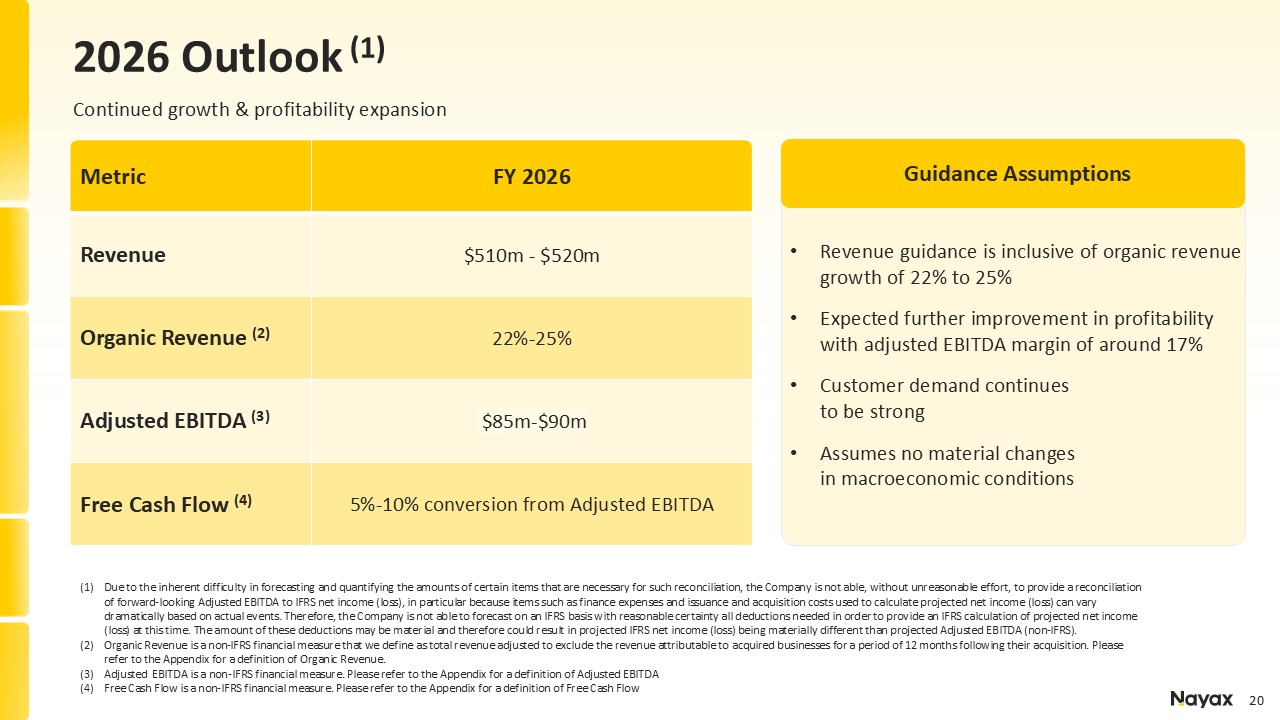
Metric FY 2026 Revenue $510m - $520m Organic Revenue (2) 22%-25% Adjusted
EBITDA (3) $85m-$90m Free Cash Flow (4) 5%-10% conversion from Adjusted EBITDA Due to the inherent difficulty in forecasting and quantifying the amounts of certain items that are necessary for such reconciliation, the Company is not
able, without unreasonable effort, to provide a reconciliation of forward-looking Adjusted EBITDA to IFRS net income (loss), in particular because items such as finance expenses and issuance and acquisition costs used to calculate projected
net income (loss) can vary dramatically based on actual events. Therefore, the Company is not able to forecast on an IFRS basis with reasonable certainty all deductions needed in order to provide an IFRS calculation of projected net income
(loss) at this time. The amount of these deductions may be material and therefore could result in projected IFRS net income (loss) being materially different than projected Adjusted EBITDA (non-IFRS). Organic Revenue is a non-IFRS financial
measure that we define as total revenue adjusted to exclude the revenue attributable to acquired businesses for a period of 12 months following their acquisition. Please refer to the Appendix for a definition of Organic Revenue. Adjusted
EBITDA is a non-IFRS financial measure. Please refer to the Appendix for a definition of Adjusted EBITDA Free Cash Flow is a non-IFRS financial measure. Please refer to the Appendix for a definition of Free Cash Flow 2026 Outlook (1)
Continued growth & profitability expansion Guidance Assumptions Revenue guidance is inclusive of organic revenue growth of 22% to 25% Expected further improvement in profitability with adjusted EBITDA margin of around 17% Customer
demand continues to be strong Assumes no material changes in macroeconomic conditions
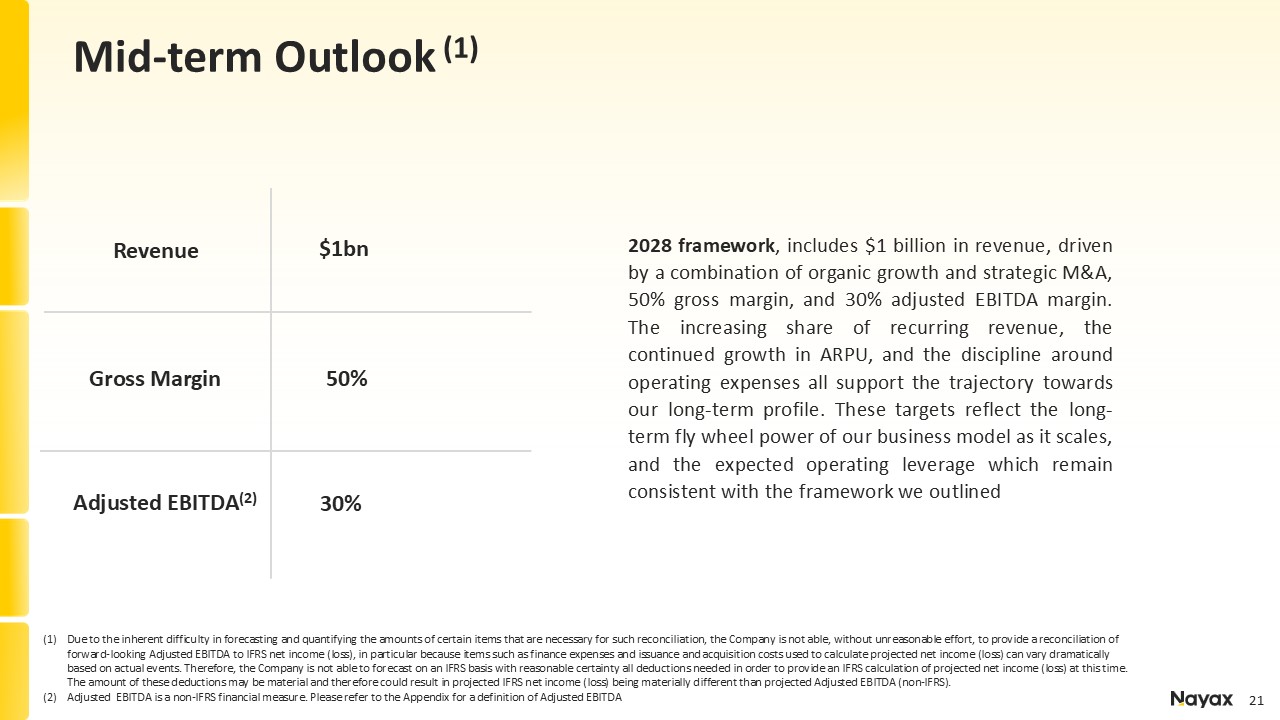
Mid-term Outlook (1) Revenue $1bn Gross Margin 50% Adjusted
EBITDA(2) 30% 2028 framework, includes $1 billion in revenue, driven by a combination of organic growth and strategic M&A, 50% gross margin, and 30% adjusted EBITDA margin. The increasing share of recurring revenue, the continued growth
in ARPU, and the discipline around operating expenses all support the trajectory towards our long-term profile. These targets reflect the long-term fly wheel power of our business model as it scales, and the expected operating leverage which
remain consistent with the framework we outlined Due to the inherent difficulty in forecasting and quantifying the amounts of certain items that are necessary for such reconciliation, the Company is not able, without unreasonable effort, to
provide a reconciliation of forward-looking Adjusted EBITDA to IFRS net income (loss), in particular because items such as finance expenses and issuance and acquisition costs used to calculate projected net income (loss) can vary dramatically
based on actual events. Therefore, the Company is not able to forecast on an IFRS basis with reasonable certainty all deductions needed in order to provide an IFRS calculation of projected net income (loss) at this time. The amount of these
deductions may be material and therefore could result in projected IFRS net income (loss) being materially different than projected Adjusted EBITDA (non-IFRS). Adjusted EBITDA is a non-IFRS financial measure. Please refer to the Appendix
for a definition of Adjusted EBITDA

Appendix 22
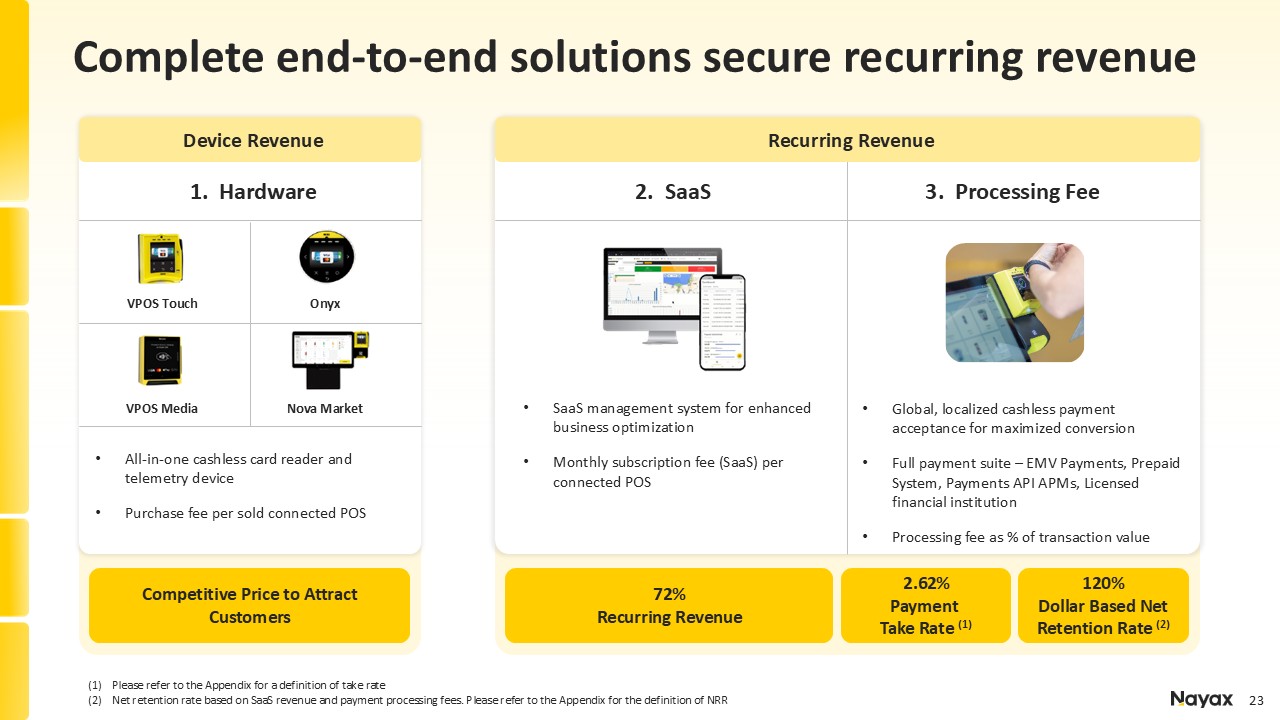
Device Revenue VPOS Touch All-in-one cashless card reader and telemetry
device Purchase fee per sold connected POS Onyx VPOS Media Nova Market Competitive Price to Attract Customers 1. Hardware 2. SaaS 3. Processing Fee 72% Recurring Revenue 2.62% Payment Take Rate (1) 120% Dollar Based Net
Retention Rate (2) SaaS management system for enhanced business optimization Monthly subscription fee (SaaS) per connected POS Global, localized cashless payment acceptance for maximized conversion Full payment suite – EMV Payments,
Prepaid System, Payments API APMs, Licensed financial institution Processing fee as % of transaction value Please refer to the Appendix for a definition of take rate Net retention rate based on SaaS revenue and payment processing fees.
Please refer to the Appendix for the definition of NRR Recurring Revenue Complete end-to-end solutions secure recurring revenue
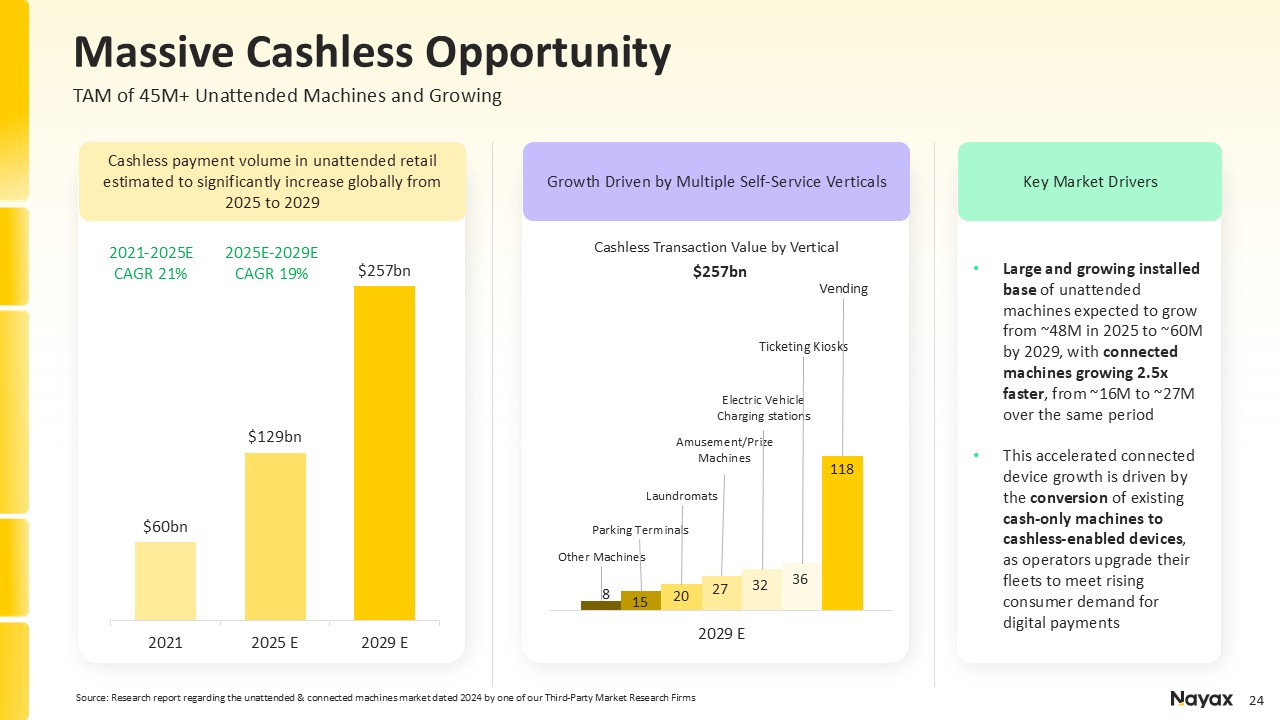
Key Market Drivers Growth Driven by Multiple Self-Service Verticals Source:
Research report regarding the unattended & connected machines market dated 2024 by one of our Third-Party Market Research Firms Cashless Transaction Value by Vertical Large and growing installed base of unattended machines expected to
grow from ~48M in 2025 to ~60M by 2029, with connected machines growing 2.5x faster, from ~16M to ~27M over the same period This accelerated connected device growth is driven by the conversion of existing cash-only machines to
cashless-enabled devices, as operators upgrade their fleets to meet rising consumer demand for digital payments Cashless payment volume in unattended retail estimated to significantly increase globally from 2025 to 2029 2021-2025E CAGR
21% 2025E-2029E CAGR 19% Massive Cashless Opportunity TAM of 45M+ Unattended Machines and Growing $257bn 8 15 20 27 32 36 118
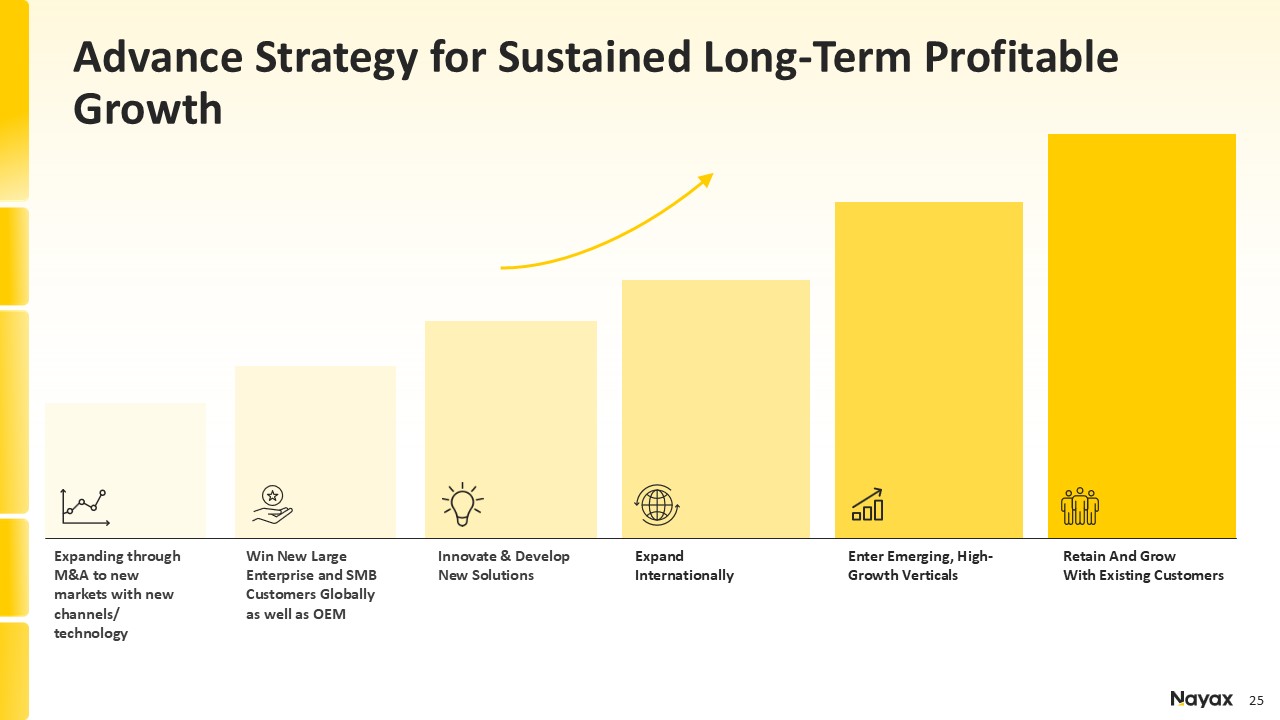
Expand Internationally Enter Emerging, High-Growth Verticals Retain And Grow
With Existing Customers Innovate & Develop New Solutions Win New Large Enterprise and SMB Customers Globally as well as OEM Expanding through M&A to new markets with new channels/ technology Advance Strategy for Sustained
Long-Term Profitable Growth
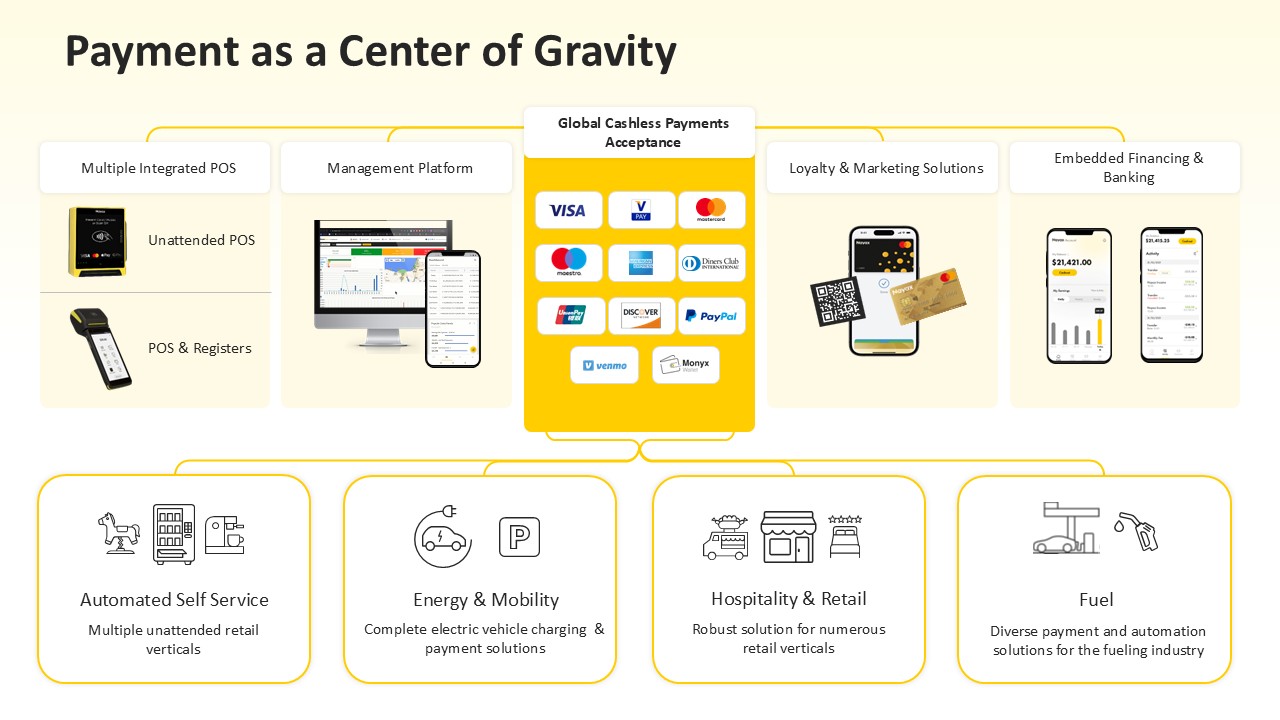
Payment as a Center of Gravity Global Cashless Payments Acceptance Multiple
Integrated POS Unattended POS POS & Registers Management Platform Loyalty & Marketing Solutions Embedded Financing & Banking Multiple unattended retail verticals Automated Self Service Hospitality & Retail Robust
solution for numerous retail verticals Complete electric vehicle charging & payment solutions Energy & Mobility Diverse payment and automation solutions for the fueling industry Fuel
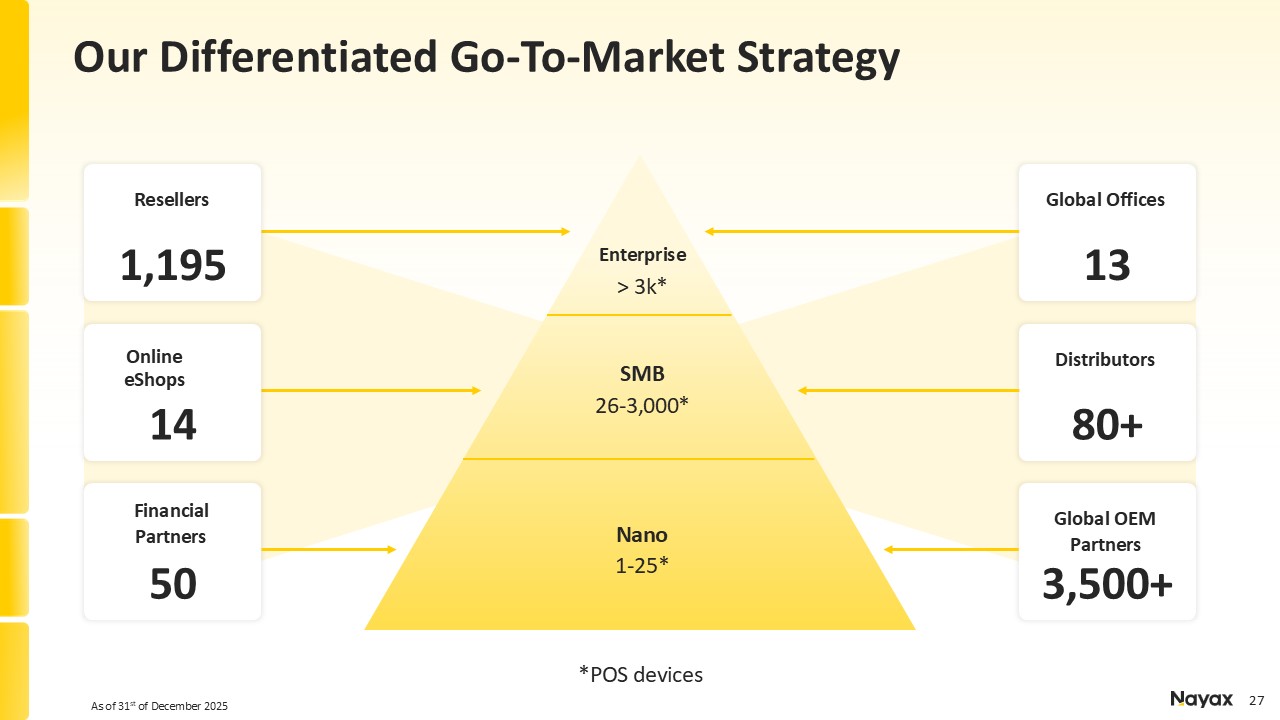
Global Offices 13 *POS devices Distributors 80+ Global OEM
Partners 3,500+ Resellers 1,195 Online eShops 14 Financial Partners 50 Nano 1-25* SMB 26-3,000* Enterprise > 3k* As of 31st of December 2025 Our Differentiated Go-To-Market Strategy
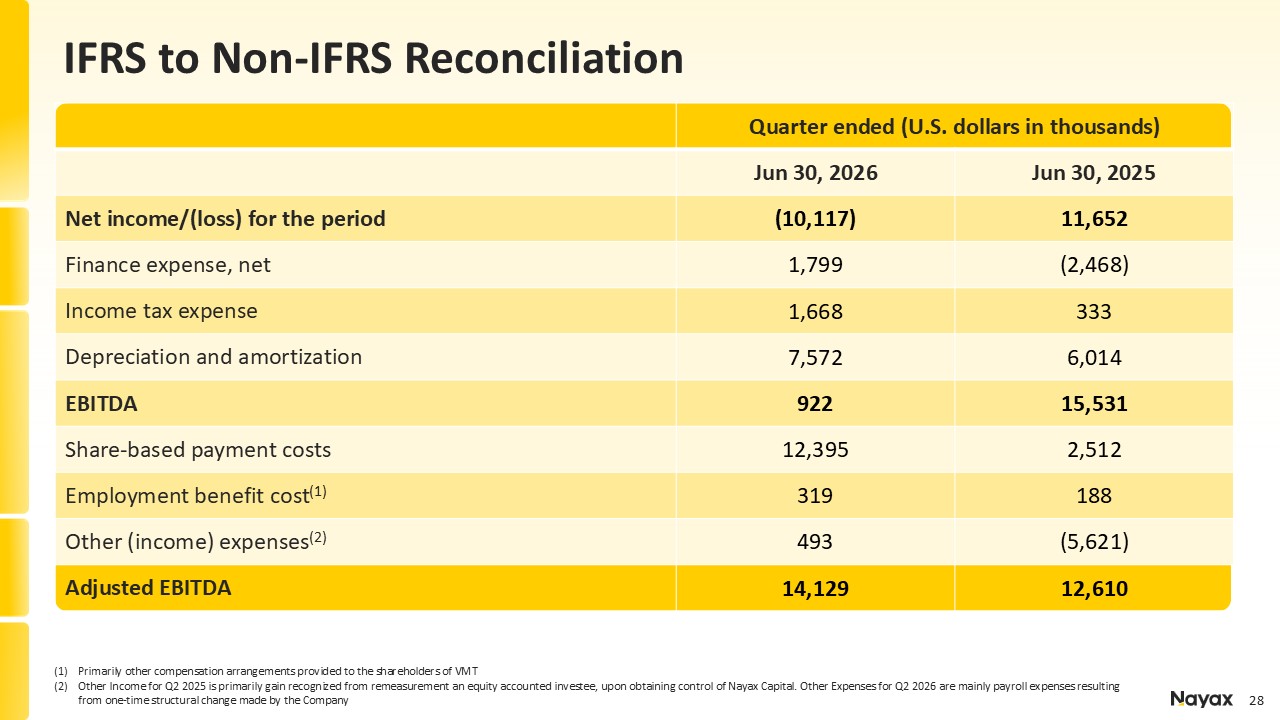
IFRS to Non-IFRS Reconciliation Primarily other compensation arrangements
provided to the shareholders of VMT Other Income for Q2 2025 is primarily gain recognized from remeasurement an equity accounted investee, upon obtaining control of Nayax Capital. Other Expenses for Q2 2026 are mainly payroll expenses
resulting from one-time structural change made by the Company Quarter ended (U.S. dollars in thousands) Jun 30, 2026 Jun 30, 2025 Net income/(loss) for the period (10,117) 11,652 Finance expense, net 1,799 (2,468) Income tax
expense 1,668 333 Depreciation and amortization 7,572 6,014 EBITDA 922 15,531 Share-based payment costs 12,395 2,512 Employment benefit cost(1) 319 188 Other (income) expenses(2) 493 (5,621) Adjusted
EBITDA 14,129 12,610
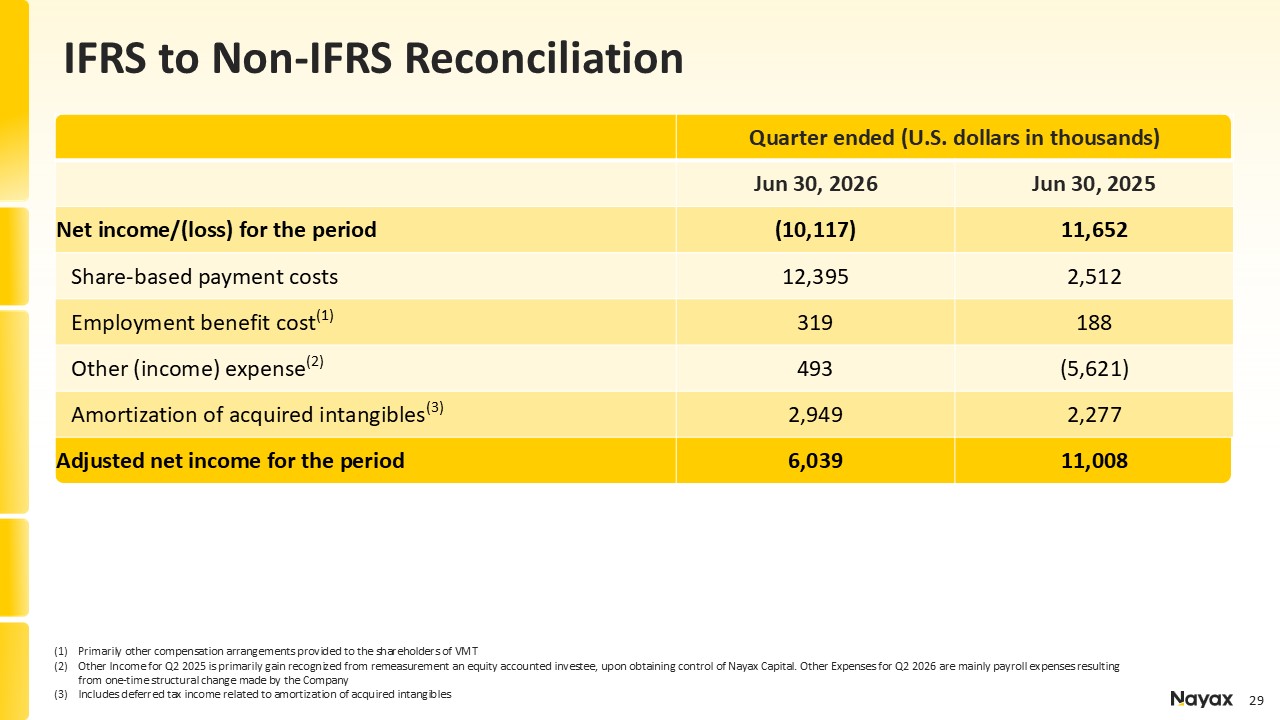
IFRS to Non-IFRS Reconciliation Quarter ended (U.S. dollars in thousands) Jun
30, 2026 Jun 30, 2025 Net income/(loss) for the period (10,117) 11,652 Share-based payment costs 12,395 2,512 Employment benefit cost(1) 319 188 Other (income) expense(2) 493 (5,621) Amortization of acquired intangibles(3)
2,949 2,277 Adjusted net income for the period 6,039 11,008 Primarily other compensation arrangements provided to the shareholders of VMT Other Income for Q2 2025 is primarily gain recognized from remeasurement an equity accounted
investee, upon obtaining control of Nayax Capital. Other Expenses for Q2 2026 are mainly payroll expenses resulting from one-time structural change made by the Company Includes deferred tax income related to amortization of acquired
intangibles
Quarter ended (U.S. dollars in thousands) Jun 30, 2026 Jun 30,
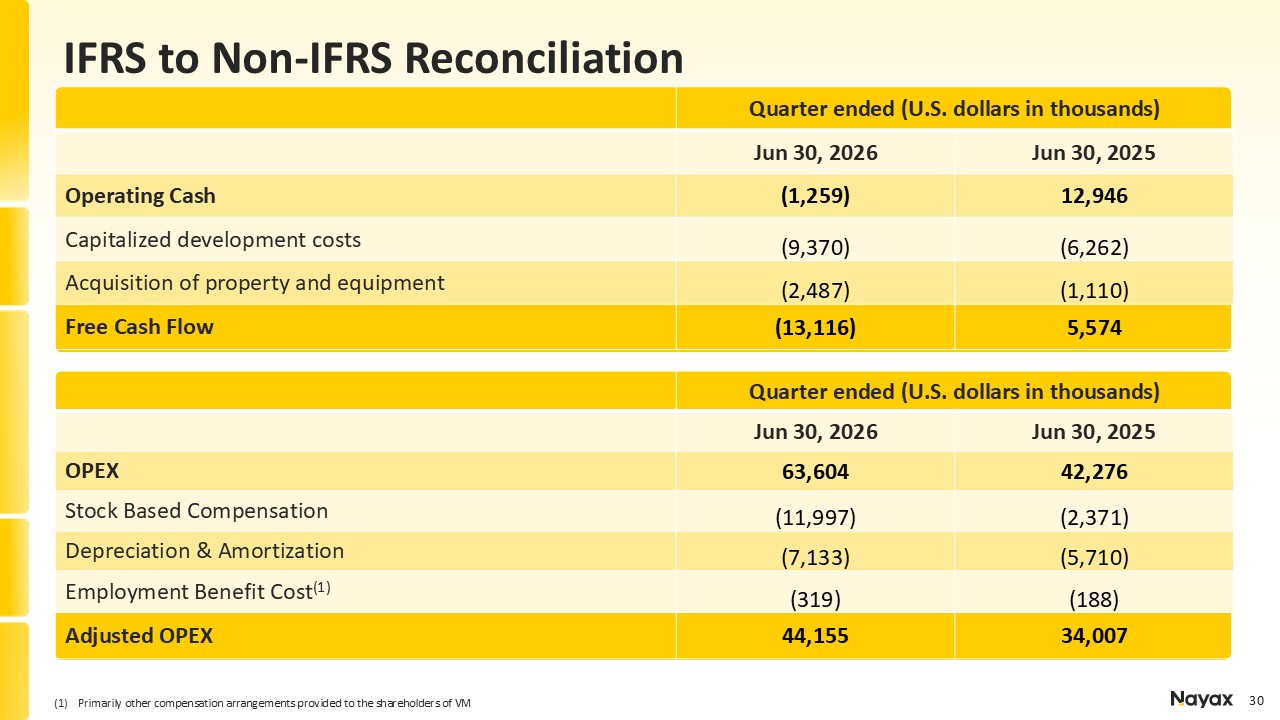
2025 OPEX 63,604 42,276 Stock Based Compensation (11,997) (2,371) Depreciation & Amortization (7,133) (5,710) Employment Benefit Cost(1) (319) (188) Adjusted OPEX 44,155 34,007 IFRS to Non-IFRS Reconciliation Quarter
ended (U.S. dollars in thousands) Jun 30, 2026 Jun 30, 2025 Operating Cash (1,259) 12,946 Capitalized development costs (9,370) (6,262) Acquisition of property and equipment (2,487) (1,110) Free Cash
Flow (13,116) 5,574 Primarily other compensation arrangements provided to the shareholders of VM
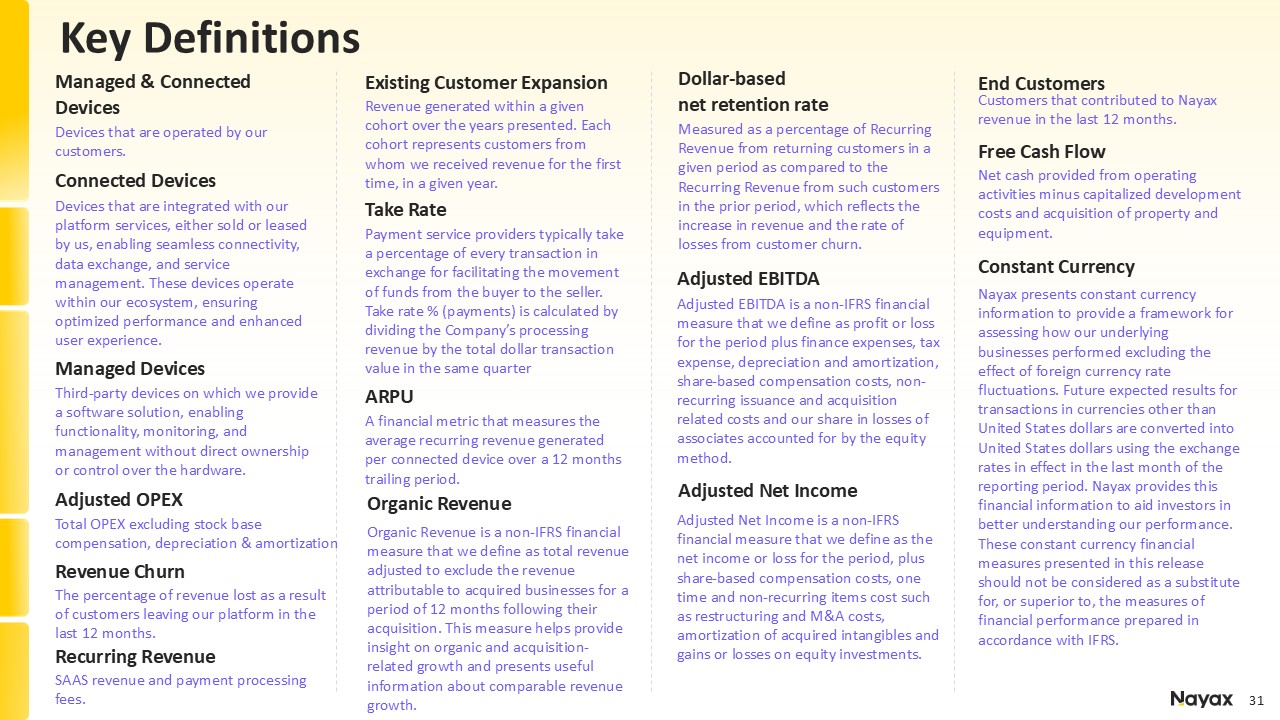
Key Definitions Measured as a percentage of Recurring Revenue from returning
customers in a given period as compared to the Recurring Revenue from such customers in the prior period, which reflects the increase in revenue and the rate of losses from customer churn. Dollar-based net retention rate Nayax presents
constant currency information to provide a framework for assessing how our underlying businesses performed excluding the effect of foreign currency rate fluctuations. Future expected results for transactions in currencies other than United
States dollars are converted into United States dollars using the exchange rates in effect in the last month of the reporting period. Nayax provides this financial information to aid investors in better understanding our performance. These
constant currency financial measures presented in this release should not be considered as a substitute for, or superior to, the measures of financial performance prepared in accordance with IFRS. Constant Currency Adjusted EBITDA is a
non-IFRS financial measure that we define as profit or loss for the period plus finance expenses, tax expense, depreciation and amortization, share-based compensation costs, non-recurring issuance and acquisition related costs and our share
in losses of associates accounted for by the equity method. Adjusted EBITDA Devices that are integrated with our platform services, either sold or leased by us, enabling seamless connectivity, data exchange, and service management. These
devices operate within our ecosystem, ensuring optimized performance and enhanced user experience. Connected Devices Devices that are operated by our customers. Managed & Connected Devices Customers that contributed to Nayax revenue
in the last 12 months. End Customers SAAS revenue and payment processing fees. Recurring Revenue The percentage of revenue lost as a result of customers leaving our platform in the last 12 months. Revenue Churn Revenue generated within
a given cohort over the years presented. Each cohort represents customers from whom we received revenue for the first time, in a given year. Existing Customer Expansion Net cash provided from operating activities minus capitalized
development costs and acquisition of property and equipment. Free Cash Flow Third-party devices on which we provide a software solution, enabling functionality, monitoring, and management without direct ownership or control over the
hardware. Managed Devices Total OPEX excluding stock base compensation, depreciation & amortization Adjusted OPEX Payment service providers typically take a percentage of every transaction in exchange for facilitating the movement of
funds from the buyer to the seller. Take rate % (payments) is calculated by dividing the Company’s processing revenue by the total dollar transaction value in the same quarter Take Rate A financial metric that measures the average recurring
revenue generated per connected device over a 12 months trailing period. ARPU Organic Revenue is a non-IFRS financial measure that we define as total revenue adjusted to exclude the revenue attributable to acquired businesses for a period
of 12 months following their acquisition. This measure helps provide insight on organic and acquisition-related growth and presents useful information about comparable revenue growth. Organic Revenue Adjusted Net Income is a non-IFRS
financial measure that we define as the net income or loss for the period, plus share-based compensation costs, one time and non-recurring items cost such as restructuring and M&A costs, amortization of acquired intangibles and gains or
losses on equity investments. Adjusted Net Income

Aaron Greenberg Chief Strategy Officer ir@nayax.com IR Contact Thank
You! ir.nayax.com Website