As filed with the Securities and Exchange Commission on April 24, 2026.
Securities Act File No. 333-279912
UNITED STATES
SECURITIES AND EXCHANGE COMMISSION
Washington, D.C. 20549
FORM N-2
REGISTRATION STATEMENT UNDER THE SECURITIES ACT OF 1933
| Pre-Effective Amendment No. | ||
| Post-Effective Amendment No. |
(Exact name of registrant as specified in Declaration of Trust)
(212 ) 810-5300
(Address and telephone number, including area code, of principal executive offices)
BlackRock Capital Investment Advisors, LLC
(212 ) 810-5800
(Name and address of agent for service)
COPIES TO:
Diana Huffman
BlackRock Capital Investment Advisors, LLC
50 Hudson Yards
New York, New York 10001
|
Steven Grigoriou, Esq.
Simpson Thacher & Bartlett LLP
900 G Street, NW
Washington, DC 20001
|
Jonathan Gaines, Esq.
Simpson Thacher & Bartlett LLP
425 Lexington Avenue
New York, NY 10017
|
Cynthia M. Krus
Owen J. Pinkerton
Dwaune L. Dupree
Eversheds Sutherland (US) LLP
700 6th Street, NW
Washington, DC 20004
|
Approximate Date of Commencement of Proposed Public Offering: As soon as practicable after the effective date of this Registration Statement.
| Check box if the only securities being registered on this Form are being offered pursuant to dividend or interest reinvestment plans. |
| Check box if any securities being registered on this Form will be offered on a delayed or continuous basis in reliance on Rule 415 under the Securities Act of 1933 (“Securities Act”), other than securities offered in connection with a dividend reinvestment plan. |
| Check box if this Form is a registration statement pursuant to General Instruction A.2 or a post-effective amendment thereto. |
| Check box if this Form is a registration statement pursuant to General Instruction B or a post-effective amendment thereto that will become effective upon filing with the Commission pursuant to Rule 462(e) under the Securities Act. |
| Check box if this Form is a post-effective amendment to a registration statement filed pursuant to General Instruction B to register additional securities or additional classes of securities pursuant to Rule 413(b) under the Securities Act. |
It is proposed that this filing will become effective (check appropriate box):
| when declared effective pursuant to Section 8(c) of the Securities Act. |
| immediately upon filing pursuant to paragraph (b) of Rule 486. |
| on (date), 2025 pursuant to paragraph (b) of Rule 486. |
| 60 days after filing pursuant to paragraph (a) of Rule 486. |
| on (date) pursuant to paragraph (a) of Rule 486. |
If appropriate, check the following box:
| This [post-effective] amendment designates a new effective date for a previously filed [post-effective amendment] [registration statement]. |
| This Form is filed to register additional securities for an offering pursuant to Rule 462(b) under the Securities Act, and the Securities Act registration statement number of the earlier effective registration statement for the same offering is:. |
| This Form is a post-effective amendment filed pursuant to Rule 462(c) under the Securities Act, and the Securities Act registration statement number of the earlier effective registration statement for the same offering is:. |
| This Form is a post-effective amendment filed pursuant to Rule 462(d) under the Securities Act, and the Securities Act registration statement number of the earlier effective registration statement for the same offering is: |
Check each box that appropriately characterizes the Registrant:
| Registered Closed-End Fund (closed-end company that is registered under the Investment Company Act of 1940 (“Investment Company Act”)). |
| Business Development Company (closed-end company that intends or has elected to be regulated as a business development company under the Investment Company Act). |
| Interval Fund (Registered Closed-End Fund or a Business Development Company that makes periodic repurchase offers under Rule 23c-3 under the Investment Company Act). |
| A.2 Qualified (qualified to register securities pursuant to General Instruction A.2 of this Form). |
| Well-Known Seasoned Issuer (as defined by Rule 405 under the Securities Act). |
| Emerging Growth Company (as defined by Rule 12b-2 under the Securities Exchange Act of 1934 (“Exchange Act”)). |
| If an Emerging Growth Company, indicate by check mark if the registrant has elected not to use the extended transition period for complying with any new or revised financial accounting standards provided pursuant to Section 7(a)(2)(B) of Securities Act. |
| New Registrant (registered or regulated under the Investment Company Act for less than 12 calendar months preceding this filing). |
EXPLANATORY NOTE:
This Post-Effective Amendment No. 2 (the “Amendment”) to the Registration Statement on Form N-2 (File No. 333-279912) (the “Registration Statement”) of BlackRock Private Credit Fund (the “Registrant”) is being filed
pursuant to Rule 486(b) under the Securities Act of 1933, as amended, to provide updated financial information and make certain other non-material changes to the Registrant’s Prospectus. This Amendment is organized as follows (a) Prospectus and (b)
Part C Information relating to the Registrant. No additional securities of the Registrant are being registered by this filing. The registration fee was paid in connection with Registrant’s previous filings.
Prospectus
BlackRock Private Credit Fund
Class S, Class D and Institutional Shares
Maximum Offering of $5,000,000,000
BlackRock Private Credit Fund is a Delaware statutory trust that seeks to invest primarily in originated loans and other securities, including broadly syndicated loans, of private middle market U.S. companies. Our
investment objective is to target high risk-adjusted returns produced primarily from current income generated by investing primarily in directly originated, senior secured corporate debt instruments. Throughout the prospectus, we refer to BlackRock
Private Credit Fund as the “Fund,” “we,” “us” or “our.”
We are a non-diversified, closed-end management investment company that has elected to be regulated as a business development company (“BDC”) under the Investment Company Act of 1940, as amended (the “1940 Act”). We
are externally managed by our adviser, BlackRock Capital Investment Advisors, LLC (the “Investment Adviser”). BlackRock Advisors, LLC (the “Sub-Adviser” and, together with the Investment Adviser, the “Advisers”) serves as our sub-adviser The
Investment Adviser and the Sub-Adviser are subsidiaries of BlackRock, Inc. (together with its subsidiaries, including but not limited to the Advisers, “BlackRock”). We have elected to be treated for U.S. federal income tax purposes, and intend to
qualify annually, as a regulated investment company (“RIC”) as defined under Subchapter M of the Internal Revenue Code of 1986, as amended (the “Code”).
We are offering on a continuous basis up to $5,000,000,000 of our common shares of beneficial interest (“Common Shares”). We are offering to sell any combination of three classes of Common Shares, Class S shares, Class
D shares and Institutional shares, with a dollar value up to the maximum offering amount. The share classes have different ongoing shareholder servicing and/or distribution fees. Shares of each class of our Common Shares will be issued on a monthly
basis at a price per share equal to the net asset value (“NAV”) per share for such class. This is a “best efforts” offering, which means that BlackRock Investments, LLC, the distributor for this offering (the “Distributor”), will use its best efforts
to sell shares, but is not obligated to purchase or sell any specific amount of shares in this offering.
Investing in our Common Shares involves a high degree of risk. You should purchase these securities only if you can afford a complete loss of your investment. See “Risk Factors” beginning on page 32 of this prospectus.
Also consider the following:
| • |
There is no assurance that we will achieve our investment objective.
|
| • |
You will not have the opportunity to evaluate our investments before we make them.
|
| • |
You should not expect to be able to sell your shares regardless of how we perform.
|
| • |
You should consider that you may not have access to the money you invest for an extended period of time.
|
| • |
We do not intend to list our shares on any securities exchange, and we do not expect a secondary market in our shares to develop prior to any listing.
|
| • |
Because you may be unable to sell your shares, you will be unable to reduce your exposure in any market downturn.
|
| • |
We have implemented a share repurchase program, but only a limited number of shares will be eligible for repurchase and repurchases will be subject to available liquidity and other significant restrictions. Our share repurchase program can
be modified or suspended at our Board of Trustees’ discretion.
|
| • |
An investment in our Common Shares is not suitable for you if you need access to the money you invest. See “Suitability Standards” and “Share Repurchase Program.”
|
| • |
We cannot guarantee that we will make distributions, and if we do we may fund such distributions from sources other than cash flow from operations, including, without limitation, the sale of assets, borrowings, return of capital or
offering proceeds, and, subject to certain limitations imposed under the NASAA Omnibus Guidelines (as defined below), we have no limits on the amounts we may pay from such sources. A return of capital (1) is a return of the original amount
invested, (2) does not constitute earnings or profits and (3) will have the effect of reducing the basis such that when a shareholder sells its shares the sale may be subject to taxes even if the shares are sold for less than the original
purchase price.
|
| • |
Distributions may also be funded in significant part, directly or indirectly, from temporary waivers or expense reimbursements borne by the Investment Adviser or its affiliates, that may be subject to reimbursement to the Investment
Adviser or its affiliates. The repayment of any amounts owed to our affiliates will reduce future distributions to which you would otherwise be entitled.
|
| • |
We use and expect to continue to use leverage, which will magnify the potential for loss on amounts invested in us.
|
| • |
We qualify as an “emerging growth company” as defined in the Jumpstart Our Business Startups Act and we cannot be certain if the reduced disclosure requirements applicable to emerging growth companies will make our Common Shares less
attractive to investors.
|
| • |
We intend to invest in securities that are rated below investment grade by rating agencies or that would be rated below investment grade if they were rated. Below investment grade securities, which are often referred to as “junk,” have
predominantly speculative characteristics with respect to the issuer’s capacity to pay interest and repay principal. They may also be illiquid and difficult to value.
|
| • |
An investor may pay a sales load of up to 3.50% and offering expenses of up to 1.50% on the amounts it invests in Class S shares. If you pay the maximum 3.50% sales load and offering expenses of 1.50%, you must experience a total return on
your net investment of 5.26% in order to recover these expenses.
|
| • |
An investor may pay a sales load of up to 1.50% and offering expenses of up to 1.50% on the amounts it invests in Class D shares. If you pay the maximum 1.50% sales load and offering expenses of 1.50%, you must experience a total return on
your net investment of 3.09% in order to recover these expenses.
|
Neither the Securities and Exchange Commission nor any state securities regulator has approved or disapproved of these securities or determined if this prospectus is truthful or complete. Any
representation to the contrary is a criminal offense. Securities regulators have also not passed upon whether this offering can be sold in compliance with existing or future suitability or conduct standards including the ‘Regulation Best Interest’
standard to any or all purchasers.
The use of forecasts in this offering is prohibited. Any representations to the contrary and any predictions, written or oral, as to the amount or certainty of any present or future cash benefits or
tax consequences that may result from an investment in our Common Shares is prohibited. No one is authorized to make any statements about this offering different from those that appear in this prospectus.
| Price to the Public(1) | Proceeds to Us, Before Expenses(2) | |||||||
| Maximum Offering(3) | $ | 5,000,000,000 | $ | 5,000,000,000 | ||||
| Class S Shares, per Share | $ | | $ | 1,666,666,666 | ||||
| Class D Shares, per Share | $ | | $ | 1,666,666,667 | ||||
| Institutional Shares, per Share | $ | | $ | 1,666,666,667 | ||||
| (1) |
Shares of each class of our Common Shares are being offered on a monthly basis at a price per share equal to the NAV per share for such class. The table reflects the NAV per share of Institutional Shares, Class S Shares and Class D Shares
as of March 31, 2026.
|
| (2) |
No upfront sales load will be paid with respect to Class S shares, Class D shares or Institutional shares, however, if you buy Class S shares or Class D shares through certain financial intermediaries, they may directly charge you
transaction or other fees, including upfront placement fees or brokerage commissions, in such amount as they may determine, provided that selling agents limit such charges to a 3.5% cap on NAV for Class S shares and a 1.5% cap on NAV for
Class D shares. Selling agents will not charge such fees on Institutional shares. We will also pay the following shareholder servicing and/or distribution fee to the Distributor, subject to Financial Industry Regulatory Authority, Inc.
(“FINRA”) limitations on underwriting compensation: (a) for Class S shares, a shareholder servicing and/or distribution fee equal to 0.85% per annum of the aggregate NAV of the Class S shares calculated monthly as of the beginning of the
first calendar day of the month and (b) for Class D shares, a shareholder servicing fee equal to 0.25% per annum of the aggregate NAV of the Class D shares calculated monthly as of the beginning of the first calendar day of the month. No
shareholder servicing or distribution fees will be paid with respect to the Institutional shares. The total amount that will be paid over time for other underwriting compensation depends on the average length of time for which shares remain
outstanding, the term over which such amount is measured and the performance of our investments. We will also pay or reimburse certain organization and offering expenses, including, subject to FINRA limitations on underwriting compensation,
certain wholesaling expenses. See “Plan of Distribution” and “Use of Proceeds.” The total underwriting compensation and total organization and offering expenses will not exceed 10% and 15%, respectively, of the gross proceeds from this
offering. Proceeds are calculated before deducting shareholder servicing or distribution fees or organization and offering expenses payable by us, which are paid over time.
|
| (3) |
The table assumes that all shares are sold in the primary offering, with 1/3 of the gross offering proceeds from the sale of Class S shares, 1/3 from the sale of Class D shares and 1/3 from the sale of Institutional shares. The number of
shares of each class sold and the relative proportions in which the classes of shares are sold are uncertain and may differ significantly from this assumption.
|
The date of this prospectus is April 24, 2026
Common Shares offered through this prospectus are suitable only as a long-term investment for persons of adequate financial means such that they do not have a need for liquidity in this investment. We have established
financial suitability standards for initial shareholders in this offering which require that a purchaser of shares have either:
| • |
a gross annual income of at least $70,000 and a net worth of at least $70,000, or
|
| • |
a net worth of at least $250,000.
|
For purposes of determining the suitability of an investor, net worth in all cases should be calculated excluding the value of an investor’s home, home furnishings and automobiles. In the case of sales to fiduciary
accounts, these minimum standards must be met by the beneficiary, the fiduciary account or the donor or grantor who directly or indirectly supplies the funds to purchase the shares if the donor or grantor is the fiduciary.
In addition, we will not sell shares to investors in the states named below unless they meet special suitability standards set forth below:
Alabama- A person's aggregate investment in us and other non-traded direct participation programs shall not exceed 10% of the person's liquid net worth at the time of their
investment in us. The concentration limit shall not apply to investments made as a result of participation in a distribution reinvestment program. This concentration limit shall not apply to any person that is an accredited investor as defined in
Rule 501(a) of Regulation D. For purposes of the Alabama suitability standard, "liquid net worth" is defined as that portion of net worth consisting of cash, cash equivalents, and readily marketable securities.
California-California residents may not invest more than 10% of their liquid net worth in us and must have either (a) a liquid net worth of $350,000 and annual gross income of
$65,000 or (b) a liquid net worth of $500,000.
Idaho-Purchasers residing in Idaho must have either (a) a liquid net worth of $85,000 and annual gross income of $85,000 or (b) a liquid net worth of $300,000.
Iowa-Iowa investors must (i) have either (a) an annual gross income of at least $100,000 and a net worth of at least $100,000, or (b) a net worth of at least $350,000 (net worth
should be determined exclusive of home, auto and home furnishings); and (ii) limit their aggregate investment in this offering and in the securities of other non-traded business development companies (“BDCs”) to 10% of such investor’s liquid net
worth (liquid net worth should be determined as that portion of net worth that consists of cash, cash equivalents and readily marketable securities).
Kansas- The Securities Commissioner of Kansas recommends that Kansas investors limit their aggregate investment in our securities and other similar investments to not more than
10 percent of their liquid net worth.
Kentucky-A Kentucky investor may not invest more than 10% of its liquid net worth in us or our affiliates. “Liquid net worth” is defined as that portion of net worth that is
comprised of cash, cash equivalents and readily marketable securities.
Maine-The Maine Office of Securities recommends that an investor’s aggregate investment in this offering and similar direct participation investments not exceed 10% of the
investor’s liquid net worth. For this purpose, “liquid net worth” is defined as that portion of net worth that consists of cash, cash equivalents and readily marketable securities.
Massachusetts-Massachusetts investors must have either (a) a minimum liquid net worth of $100,000 and a minimum annual gross income of $85,000, or (b) a minimum liquid net worth
of $350,000. For these purposes, “liquid net worth” is defined as that portion of net worth (total assets exclusive of home, home furnishings and automobiles, minus total liabilities) that consists of cash, cash equivalents and readily marketable
securities. In addition, a Massachusetts investor’s investment in us, our affiliates and other non-publicly-traded direct investment programs (including real estate investment trusts, business development companies, oil and gas programs, equipment
leasing programs and commodity pools, but excluding unregistered, federally and state exempt private offerings) may not exceed ten percent (10%) of his or her liquid net worth.
Missouri- No more than ten percent (10%) of any one (1) Missouri investor's liquid net worth shall be invested in the securities being registered in this offering.
Nebraska-In addition to the suitability standards set forth above, Nebraska investors must limit their aggregate investment in this offering and the securities of other business
development companies to 10% of such investor’s net worth. Investors who are accredited investors as defined in Regulation D under the Securities Act of 1933, as amended, are not subject to the foregoing investment concentration limit.
New Jersey-New Jersey investors must have either (a) a minimum liquid net worth of $100,000 and a minimum annual gross income of $100,000, or (b) a minimum liquid net worth of
$350,000. For these purposes, “liquid net worth” is defined as that portion of net worth (total assets exclusive of home, home furnishings and automobiles, minus total liabilities) that consists of cash, cash equivalents and readily marketable
securities. In addition, a New Jersey investor’s investment in us, our affiliates and other non-publicly-traded direct investment programs (including real estate investment trusts, business development companies, oil and gas programs, equipment
leasing programs and commodity pools (each, a “DIP Category”), but excluding unregistered, federally and state exempt private offerings) may not exceed ten percent (10%) of an investor’s liquid net worth. However, New Jersey investors who are
accredited investors, as defined at N.J.S.A. 49:3-49(p), may not invest more than ten percent (10%) of their liquid net worth in each DIP Category.
New Mexico-In addition to the general suitability standards listed above, a New Mexico investor may not invest, and we may not accept from an investor more than ten percent (10%)
of that investor’s liquid net worth in shares of us, our affiliates and in other non-traded business development companies. Liquid net worth is defined as that portion of net worth which consists of cash, cash equivalents and readily marketable
securities. Investors who are accredited investors as defined in Regulation D under the Securities Act of 1933, as amended, are not subject to the foregoing concentration limit.
North Dakota-Purchasers residing in North Dakota must have a net worth of at least ten times their investment in us.
Ohio-Purchasers residing in Ohio may not invest more than 10% of their liquid net worth in us, our affiliates, and other non-traded business development companies. For purposes
of Ohio’s suitability standard, “liquid net worth” is defined as that portion of net worth (total assets exclusive of home, home furnishings, and automobiles minus total liabilities) that is comprised of cash, cash equivalents, and readily marketable
securities. This condition does not apply, directly or indirectly, to federally covered securities. The condition also does not apply to purchasers who meet the definition of an accredited investor as defined in rule 501(a) of Regulation D under the
Securities Act of 1933, 15 U.S.C.A. 77a, as amended.
Oklahoma-Purchasers residing in Oklahoma may not invest more than 10% of their liquid net worth in us.
Oregon-In addition to the suitability standards set forth above, non-accredited Oregon investors may not invest more than 10% of their liquid net worth in us. For purposes of
Oregon’s suitability standard, “liquid net worth” is defined as that portion of an investor’s net worth consisting of cash, cash equivalents and readily marketable securities. Oregon investors who meet the definition of “accredited investor” as
defined in Regulation D under the Securities Act of 1933, as amended, are not subject to the limitation described in this paragraph.
Puerto Rico-Purchasers residing in Puerto Rico may not invest more than 10% of their liquid net worth in us, our affiliates and other non-traded business development companies.
For these purposes, “liquid net worth” is defined as that portion of net worth (total assets exclusive of primary residence, home furnishings and automobiles minus total liabilities) consisting of cash, cash equivalents and readily marketable
securities.
Tennessee-Purchasers residing in Tennessee must have a liquid net worth of at least ten times their investment in us.
Vermont-Accredited investors in Vermont, as defined in 17 C.F.R. §230.501, may invest freely in this offering. In addition to the suitability standards described above,
non-accredited Vermont investors may not purchase an amount in this offering that exceeds 10% of the investor’s liquid net worth. For these purposes, “liquid net worth” is defined as an investor’s total assets (not including home, home furnishings,
or automobiles) minus total liabilities.
The Investment Adviser, those selling shares on our behalf, and participating brokers and registered investment advisers recommending the purchase of shares in this offering are required to make every reasonable effort
to determine that the purchase of shares in this offering is a suitable and appropriate investment for each investor based on information provided by the investor regarding the investor’s financial situation and investment objectives and must
maintain records for at least six years after the information is used to determine that an investment in our shares is suitable and appropriate for each investor. In making this determination, the participating broker, registered investment adviser,
authorized representative or other person selling shares will, based on a review of the information provided by the investor, consider whether the investor:
| • |
meets the minimum income and net worth standards established in the investor’s state;
|
| • |
can reasonably benefit from an investment in our Common Shares based on the investor’s overall investment objectives and portfolio structure;
|
| • |
is able to bear the economic risk of the investment based on the investor’s overall financial situation, including the risk that the investor may lose its entire investment; and
|
| • |
has an apparent understanding of the following:
|
| • |
the fundamental risks of the investment;
|
| • |
the lack of liquidity of our shares;
|
| • |
the background and qualification of our Investment Adviser; and
|
| • |
the tax consequences of the investment.
|
In addition to investors who meet the minimum income and net worth requirements set forth above, our shares may be sold to financial institutions that qualify as “institutional investors” under the state securities
laws of the state in which they reside. “Institutional investor” is generally defined to include banks, insurance companies, investment companies as defined in the 1940 Act, pension or profit sharing trusts and certain other financial institutions. A
financial institution that desires to purchase shares will be required to confirm that it is an “institutional investor” under applicable state securities laws.
In addition to the suitability standards established herein, (i) a participating broker may impose additional suitability requirements and investment concentration limits to which an investor could be subject and (ii)
various states may impose additional suitability standards, investment amount limits and alternative investment limitations.
Broker-dealers must comply with Regulation Best Interest, which, among other requirements, enhances the existing standard of conduct for broker-dealers and establishes a “best interest” obligation for broker-dealers
and their associated persons when making recommendations of any securities transaction or investment strategy involving securities to a retail customer. The obligations of Regulation Best Interest are in addition to, and may be more restrictive than,
the suitability requirements listed above. When making such a recommendation to a retail customer, a broker-dealer must, among other things, act in the best interest of the retail customer at the time a recommendation is made, without placing its
interests ahead of its retail customer’s interests. A broker-dealer may satisfy the best interest standard imposed by Regulation Best Interest by meeting disclosure, care, conflict of interest and compliance obligations. Regulation Best Interest also
requires registered investment advisers and registered broker-dealers to provide a brief relationship summary to retail investors. This relationship summary, referred to as Form CRS, is not a prospectus. Investors should refer to the prospectus for
detailed information about this offering before deciding to purchase Common Shares. Currently, there is no administrative or case law interpreting Regulation Best Interest and the full scope of its applicability on brokers participating in our
offering cannot be determined at this time.
Please carefully read this prospectus and any accompanying prospectus supplement together with any exhibits and the additional information described under the heading and “Available Information” and the section under
the heading “Risk Factors” before you make an investment decision. You should rely only on the information contained, or incorporated by reference, collectively, in this prospectus.
In addition to factors identified elsewhere in this Registration Statement, including the “Risk Factors” section, the following factors, among others, could cause actual results to differ materially from
forward-looking statements or historical performance:
| • |
the Fund’s, or the Fund’s portfolio companies’, future business, operations, operating results or prospects;
|
| • |
the return or impact of current and future investments;
|
| • |
the impact of a protracted decline in the liquidity of credit markets on the Fund’s business;
|
| • |
the impact of fluctuations in interest rates on the Fund’s business;
|
| • |
the impact of changes in laws or regulations governing the Fund’s operations or the operations of the Fund’s portfolio companies;
|
| • |
the Fund’s contractual arrangements and relationships with third parties;
|
| • |
the general economy and its impact on the industries in which the Fund invests;
|
| • |
the financial condition of and ability of the Fund’s portfolio companies to achieve their objectives;
|
| • |
the Fund’s expected financings and investments;
|
| • |
the adequacy of the Fund’s financing resources and working capital;
|
| • |
the ability of the Advisers to locate suitable investments for the Fund and to monitor and administer the Fund’s investments;
|
| • |
the timing of cash flows, if any, from the operations of the Fund’s portfolio companies;
|
| • |
the timing, form and amount of any dividend distributions; and
|
| • |
the Fund’s ability to maintain the Fund’s qualification as a regulated investment company and as a business development company.
|
This Registration Statement contains, and other statements that the Fund may make may contain, forward-looking statements with respect to future financial or business performance, strategies or expectations.
Forward-looking statements are typically identified by words or phrases such as “anticipate,” “believe,” “expect,” “intend,” “will,” “should,” “could,” “may,” “plan” and similar words.
Forward-looking statements are subject to numerous assumptions, risks and uncertainties, which change over time. Forward-looking statements speak only as of the date they are made, and the Fund assumes no duty to and
do not undertake to update forward-looking statements. These forward-looking statements do not meet the safe harbor for forward-looking statements pursuant to Section 27A of the Securities Act of 1933 (the “Securities Act”) or Section 21E of the
Securities Exchange Act of 1934 (the “Exchange Act”). Actual results could differ materially from those anticipated in forward-looking statements and future results could differ materially from historical performance.
Statistical and market data used in this Registration Statement has been obtained from governmental and independent industry sources and publications. The Fund has not independently verified the data obtained from
these sources. Forward-looking information obtained from these sources is subject to the same qualifications and the additional uncertainties regarding the other forward-looking statements contained in this Registration Statement, for which the safe
harbor provided in Section 27A of the Securities Act and Section 21E of the Exchange Act is not available.
iv
Page
|
i
|
|
|
iv
|
|
|
iv
|
|
|
1
|
|
|
27
|
|
|
30
|
|
|
31
|
|
|
32
|
|
|
86
|
|
|
88
|
|
|
109
|
|
|
121
|
|
| 142 | |
|
156
|
|
| 174 | |
| 176 |
|
| 178 |
|
| 190 |
|
| 194 |
|
| 212 |
|
| 215 |
|
| 218 |
|
| 219 |
|
| 226 |
|
| 234 |
|
| 236 |
|
| 236 |
|
| 236 |
|
| 236 |
|
| 237 |
PROSPECTUS SUMMARY
This prospectus summary highlights certain information contained elsewhere in this prospectus. This is only a summary of all material information and it may not contain all of the information that
is important to you. Before deciding to invest in this offering, you should carefully read this entire prospectus, including the “Risk Factors” section.
Q: What is BlackRock Private Credit Fund?
| A: |
We are a Delaware statutory trust formed on December 23, 2021. We are a non-diversified, closed-end management investment company that has elected to be regulated as a business development company (“BDC”) under the Investment Company Act
of 1940, as amended (the “1940 Act”). We are externally managed by our adviser, BlackRock Capital Investment Advisors, LLC (the “Investment Adviser”). BlackRock Advisors, LLC (the “Sub-Adviser” and, together with the Investment Adviser, the
“Advisers”) serves as our sub-adviser. The Investment Adviser and the Sub-Adviser are subsidiaries of BlackRock, Inc. (together with its subsidiaries, including but not limited to the Advisers, “BlackRock.” The words “we,” “us,” “our” and the
“Fund” refer to BlackRock Private Credit Fund, together with its consolidated subsidiaries.)
|
Q: Who are BlackRock, the Investment Adviser and the Sub-Adviser?
| A: |
BlackRock is a leading publicly traded investment management firm, with $14 trillion of assets under management as of December 31, 2025. For 35+ years, including through legacy entities, BlackRock has been creating and managing
alternatives portfolios. Today, BlackRock manages $424 billion in alternative client assets, with approximately 2,000 professionals dedicated solely to alternatives across 50+ global investment centers. BlackRock’s strong governance and scale
enable its investment teams to focus solely on investing and benefit from accessing more deals, research, and insight than they would as independent businesses. BlackRock’s scale helps it deliver sourcing, performance, and solutions that aim
to help clients achieve their objectives.
|
The Investment Adviser, an indirect subsidiary of BlackRock, Inc., has over two decades of experience investing in directly originated loans to middle market companies.
The Sub-Adviser is an indirect subsidiary of BlackRock, Inc. and is an affiliate of the Fund and the Investment Adviser.
Q: What is your investment objective?
| A: |
Our investment objective is to target high risk-adjusted returns produced primarily from current income generated by investing primarily in directly originated, senior secured corporate debt instruments.
|
Q: What is your investment strategy?
| A: |
The Investment Adviser has a deep and experienced investment team, organized across 19 industry-focused verticals, that is among the most tenured in the direct lending market, having invested in the strategy across multiple market cycles
for more than 20 years. This depth of experience enables the team to not only identify unique and less competitive investments, but also to structure customized downside protection and better target outsized risk-adjusted returns.
|
The Fund expects to benefit from BlackRock’s broad and established sourcing network to seek attractive investment opportunities across all market environments. BlackRock is one of the largest
corporate lenders in the world and a long-tenured participant in the private debt markets. As such, it has diversified sourcing channels and maintains an active dialogue with industry and sector contacts, banks, brokers, sponsors, secondary desks,
client relationships, other credit-focused investment managers and its well-established network of industry experts and executive-level operating professionals-all of which help to produce attractive deal flow.
The Investment Adviser believes its deep industry and credit experience distinguishes its reputation, allowing BlackRock to uncover opportunities that less-experienced managers are either not
qualified to analyze, or are under-resourced to properly evaluate. BlackRock will continue its longstanding practice of seeking to alter the risk/reward balance in favor of its clients by using a hands-on approach to seek to create superior
risk-adjusted returns while protecting value in challenging situations when required.
Q: What types of investments do you intend to make?
| A: |
Under normal circumstances, we will invest at least 80% of our total assets (net assets plus borrowings for investment purposes) in private credit investments (loans, bonds and other credit instruments that are issued in private offerings
or issued by private companies).
|
The Fund expects to benefit from what it believes to be BlackRock’s successful strategy of investing in privately-originated, performing senior secured debt primarily in North America-based
companies. The Fund expects to hold positions in first lien, second lien and unitranche debt, with a preference for floating-rate debt, which the Investment Adviser believes provides flexibility to adapt to changing market conditions.
Our investment strategy focuses primarily on originating and making loans to U.S. middle market companies. We define “middle market companies” to generally mean companies with earnings before
interest expense, income tax expense, depreciation and amortization, or “EBITDA”, between $10 million and $250 million annually and/or annual revenue of $50 million to $2.5 billion at the time of investment. We generally target the core segment of
the middle market, which is defined as companies with EBITDA of between $25 million and $75 million, though we may invest in smaller or larger companies if an attractive opportunity presents itself, especially when there are dislocations in the
capital markets. While we focus our investments in U.S. companies, we may make investments in portfolio companies that are domiciled outside of the United States, subject to regulatory limitations and other investment restrictions discussed in this
Registration Statement. We invest in senior secured or unsecured loans, subordinated loans or mezzanine loans and, to a lesser extent, equity and equity-related securities which includes common and preferred stock, securities convertible into common
stock, and warrants. The Investment Adviser will generally target for the Fund what it views as healthy businesses that are seeking capital for various objectives, including but not limited to, growth, acquisitions, refinancings/recapitalizations,
expansion stage venture lending and leveraged buyout activity. BlackRock actively seeks to uncover what it believes are overlooked, asset-rich opportunities with a degree of complexity “outside-of the-box” for traditional senior debt providers.
Q: What is an originated loan?
| A: |
An originated loan is a loan where we lend directly to the borrower and hold the loan generally on our own or only with other BlackRock affiliates. This is distinct from a syndicated loan, which is generally originated by a bank and then
syndicated, or sold, in several pieces to other investors. Originated loans are generally held until maturity or until they are refinanced by the borrower. Syndicated loans often have liquid markets and can be traded by investors.
|
Q: What potential competitive strengths does BlackRock offer?
| A: |
BlackRock believes that the following characteristics distinguish it from other firms and will allow the Fund to maximize the risk/reward ratio of a given investment opportunity.
|
Strategy
BlackRock has successfully applied its direct lending strategy throughout its history to generate attractive investment opportunities in all phases of a market cycle. Since 1999, BlackRock has deployed more than $49
billion across more than 1,000 companies in its direct lending strategy. BlackRock believes that the following elements of its direct lending strategy are designed to enable the Fund to generate above-market yields:
| I. |
Identifying value where others do not, in complex or overlooked deals through unique, multi-channel sourcing.
|
| II. |
Large, reputable and deeply experienced team that has the ability to respond to various market conditions quickly and effectively.
|
| III. |
Dual direct lending and stressed/distressed (special situations) experience to structure better pricing and downside protection and be prepared for unexpected events.
|
Focus on the Middle Market
Since BlackRock’s first direct lending loan in its first institutional fund was made in 2000, its direct lending strategy has focused primarily on North American middle market companies with target enterprise values
from $100 million to $2.5 billion.
Direct Lending Investment Network and Superior Deal Sourcing Capability
BlackRock’s primary deal flow is derived from its proprietary network established over a 20+ year history of providing direct lending capital to middle market U.S. companies and its intensive industry research and
relationship-based approach. BlackRock’s investment professionals maintain established relationships among industry-focused bankers, restructuring professionals, bankruptcy and other attorneys, senior lenders, liquidators, high yield specialists,
research analysts and major accounting firms. BlackRock’s long history in direct investing provides what it believes is a broader and deeper network of contacts among fellow corporate board members, former colleagues from a range of high- quality
firms, other financial and operating professionals, insurance companies, credit funds, private equity funds, hedge funds and other similar alternative investment funds, which assists in sourcing and negotiating transaction opportunities. Given both
its extremely long tenure in the market as well as its position within the world’s largest asset manager, BlackRock is often a first call for middle market direct lending opportunities, and in particular, those that require a level of specialized
knowledge or skill to underwrite and execute. BlackRock’s Capital Markets team helps to harness the power of the global franchise in an effort to ensure that BlackRock sees the broadest range of deal opportunities across its investment business.
Furthermore, BlackRock’s relationships with prior portfolio companies help facilitate positive word-of-mouth recommendations to others seeking BlackRock’s expertise and capital.
BlackRock’s acquisition of HPS Investment Partners (“HPS”) on July 1, 2025 resulted in the formation of the $370 billion Private Financing Solutions (PFS) platform, granting the Company access to even more deal flow.
Both BlackRock and HPS have managed private credit strategies for approximately two decades, each with differentiated origination platforms spanning both sponsor and non-sponsor channels. The Company benefits from the full scale, sourcing network,
and underwriting expertise of the combined PFS platform, while maintaining its dedicated investment team and strategy-specific governance.
Access to Operating Talent
The Investment Adviser augments its aforementioned in-house talent with multi-year relationships with former senior executives with strong records of success in major companies across industries in which BlackRock
invests. These executive relationships may be used for assistance with due diligence, board seats, sourcing, and in some cases, to fill certain portfolio company operating roles.
Integrity
BlackRock conducts business with the highest standards for integrity. Those standards are apparent in its transparency and openness with its clients, its conservative accounting and management principles, and its
relationships with counterparties, rival and allied creditors, portfolio company management teams and external advisors. BlackRock recognizes the value its business integrity provides in attracting clients, employees and operating talent, sourcing
and evaluating transactions, and in reorganization negotiations.
A Leader in Alternative Credit Investing
For 35+ years, including through legacy entities, BlackRock has been creating and managing alternatives portfolios. BlackRock has continually grown investment capabilities in response to, and in anticipation of, client
needs. This strategic commitment is reflected in the considerable human and technological resources it has developed in order to ensure the long-term success of its alternatives platform. BlackRock has also hired respected industry professionals to
complement its homegrown talent. Today, BlackRock has approximately 2,000 professionals dedicated solely to alternatives across 50+ global investment centers. BlackRock’s strong governance and scale enable its investment teams to focus solely on
investing and benefit from accessing more deals, research, and insight than they would as independent businesses. BlackRock’s scale helps it deliver sourcing, performance, and solutions that aim to help clients achieve objectives. The Investment
Adviser’s leadership team comprises senior professionals from BlackRock.
Q: Has BlackRock made an investment in the Fund?
| A: |
BlackRock Financial Management, Inc. has invested in common shares of beneficial interest (“Common Shares”) of the Fund with an aggregate net asset value of approximately $140.1 million as of December 31, 2025.
|
Q: What is the market opportunity?
| A: |
BlackRock believes that an attractive investment environment exists for middle market and privately-originated illiquid loans using the investment strategy and approach that BlackRock has successfully employed for over 20 years. Over that
time, due to fundamental changes in the U.S. banking system and corporate debt market, lending to middle market companies in the U.S. has radically transformed.
|
Since BlackRock’s first direct lending investment was made in June 2000, the role of banks in middle market lending has materially reduced. In order to comply with regulations, such as Basel III, the
Dodd-Frank Act and certain provisions therein known as the “Volcker Rule,” banks have reduced their balance sheets to de-risk their business activities. Banks simply cannot lend on the scale they once did to absorb the supply of middle market loans
because it has become economically challenging for banks to hold middle market loans. BlackRock recognizes that stricter regulations and enforcement of leveraged lending guidelines has further reduced bank lending activities in the middle market
versus earlier periods, and in particular, the period prior to the global financial crisis.
Simultaneously, middle market financing needs are high. BlackRock believes that institutional private capital will be needed to address a large volume of financing requirements over the next several
years driven by refinancing needs as well as deployment of private equity cash reserves (often referred to as “dry powder”).
BlackRock believes that the growth of small-to-medium sized businesses will be key to growth for all developed economies, and in particular, the United States. Middle market companies represent
approximately one-third of U.S. private sector GDP and employ nearly 48 million people, providing approximately one-third of all U.S. jobs, according to the National Center for the Middle Market. BlackRock anticipates that direct lending providers to
the middle market will enable these businesses to access capital that is increasingly difficult for them to obtain from traditional bank sources yet is important for continued economic growth. In particular, BlackRock believes the direct lending
strategy has developed into a core asset class that serves the needs of this segment of the U.S. economy. BlackRock has established itself as a leader in this segment over almost two decades with a reputation for reliability and creativity in
structuring financing solutions.
Q: How will you identify investments?
| A: |
BlackRock’s deal flow comes from its proprietary network and research, earned over an exceptionally long and successful market tenure. The majority of investments in the Fund are expected to be generated from primary market sources and
will also include opportunistic secondary purchases. The Investment Adviser’s investment professionals have long-term relationships with a wide range of deal sources including industry-focused bankers, restructuring professionals, bankruptcy
attorneys, senior lenders, high yield bond specialists, trading desks (both regional and money center), research analysts, liquidators, accounting firms, fund management teams, board members of former portfolio companies, former colleagues at
other high-quality investment firms and other operating professionals to facilitate deal flow.
|
BlackRock's acquisition of HPS Investment Partners in July 2025 further strengthens this foundation through the creation of the Private Financing Solutions ("PFS") platform, which serves as the
center of excellence for private credit originations at the firm. PFS acts as the central funnel for all deal flow across sourcing channels, spanning both sponsored and non-sponsored relationships, allowing opportunities to be efficiently captured,
screened, and matched with eligible capital. While BDEBT's investment strategy remains unchanged, the integration enhances the team's sourcing and origination capabilities by centralizing private debt origination within PFS and offering borrowers
comprehensive "one-stop" solutions across the capital structure and lifecycle needs. We believe this increases the opportunity set for investors and provides a competitive advantage relative to capital providers with narrower platforms or more siloed
operating models.
The Investment Adviser also leverages the significant BlackRock organizational resources at its disposal by communicating with members of BlackRock’s global credit platform, including
investment-grade credit analysts, sub-investment grade credit analysts, real estate (both equity and debt) and private equity teams, and professionals in risk and quantitative analysis. Furthermore, the Investment Adviser is supported by the
BlackRock Capital Markets group, a dedicated capital markets team responsible for sourcing private and illiquid investment opportunities across the BlackRock Alternatives platform. The BlackRock Capital Markets group provides global, comprehensive
sourcing coverage by geography, asset class, and transaction type, further supplementing the Investment Adviser’s deal sourcing by maintaining close relationships across multiple sourcing channels.
Given both its tenure in the direct lending market as well as its scope as one of the largest investment managers in the world, BlackRock is often the first call for new deal opportunities in its
core middle market segment. In addition, BlackRock has relationships with numerous other credit investors, including insurance companies, credit funds, multi-strategy private equity funds, hedge funds and other comparable alternative funds that
invest in assets similar to those targeted by the Fund.
In addition to drawing upon experience from its considerable resources, BlackRock regularly calls on both active and recently retired senior-level executives from relevant industries to assist with
due diligence for potential investments. Historically, these relationships with retired senior executives have also been a valuable source of transactions and critical information. BlackRock’s relationships with its portfolio companies across the
entirety of its credit franchise also facilitate positive word-of-mouth recommendations to other companies seeking BlackRock’s expertise and capital. BlackRock’s relationship network provides it with the ability to access investment opportunities
that competitors may miss or, in competitive circumstances, allows it to engage at an earlier stage in the process.
Q: What is the role of the Sub-Adviser?
| A: |
The Sub-Adviser will perform certain of the day-to-day investment management of the Fund. The Sub-Adviser will be primarily responsible for the Fund’s investments in liquid investments, including liquid investments held during the period
of time that the Fund is investing the proceeds of this offering in accordance with its investment strategy.
|
Q: Will you use leverage?
| A: |
Yes. To seek to enhance our returns, we employ and intend to continue to employ leverage as market conditions permit and at the discretion of the Investment Adviser, but in no event will leverage employed exceed the limitations set forth
in the 1940 Act, which currently allows us to borrow up to a 2:1 debt to equity ratio. We use and intend to continue to use leverage in the form of borrowings, including loans from certain financial institutions and the issuance of debt
securities. We may also use leverage in the form of the issuance of preferred shares, but do not currently intend to do so. In determining whether to borrow money, we will analyze the maturity, covenant package and rate structure of the
proposed borrowings as well as the risks of such borrowings compared to our investment outlook. Any such leverage, if incurred, would be expected to increase the total capital available for investment by the Fund. See “Risk Factors.”
|
Q: How will the Fund be allocated investment opportunities?
| A: |
BlackRock manages and advises numerous accounts for clients around the world, such as registered and unregistered funds and owners of separately managed accounts (collectively, “Client Accounts”). Client Accounts include funds and accounts
in which BlackRock or its personnel have an interest (“BlackRock Accounts”). Certain of these Client Accounts have investment objectives, and utilize investment strategies, that are similar to the Fund’s. As a result, certain investments may
be appropriate for the Fund and also for other Client Accounts. To address actual and potential conflicts associated with allocation of investments, BlackRock has developed an investment allocation policy (the “Investment Allocation Policy”)
and related guidelines. In addition, certain BlackRock entities and business units have supplemental allocation policies for making allocation decisions among Client Accounts managed by such BlackRock entities (together with the Investment
Allocation Policy and related guidelines, the “Allocation Policy”). The Allocation Policy is intended to ensure that investment opportunities are allocated on a fair and equitable basis among Client Accounts over time, taking into account
various factors.
|
We believe that, in certain circumstances, it may be in the Fund’s best interests to be able to co-invest with registered funds, unregistered funds and business development companies managed now or
in the future by the Investment Adviser and its affiliates, along with certain affiliates of the Investment Adviser acting in a principal capacity, in order to be able to participate in a wider range of transactions. See “Regulation - Exemptive
Orders.”
Q: How is an investment in shares of your Common Shares different from listed BDCs?
| A: |
An investment in our Common Shares generally differs from an investment in listed BDCs in a number of ways, including:
|
| • |
Shares of listed BDCs are priced by the trading market, which is influenced generally by numerous factors, not all of which are related to the underlying value of the entity’s assets and liabilities. Our Board of Trustees, rather than the
“market,” determined the initial offering price of our shares in its sole discretion after considering the initial public offering prices per share of other blind pool non-traded BDCs. The estimated value of our assets and liabilities will be
used to determine our net asset value (“NAV”) following this offering. Non-traded BDCs are generally less volatile and the value of shares of a non-traded BDC is generally more closely correlated with the values of their underlying loans as
determined in good faith under the 1940 Act as opposed to other conditions that may impact public markets. See “Risk Factors—As required by the 1940 Act, a significant portion of our investment portfolio is and will be recorded at fair value
as determined in good faith and, as a result, there is and will be uncertainty as to the value of our portfolio investments.”
|
| • |
An investment in our shares has limited or no liquidity outside of our share repurchase plan and our share repurchase plan may be modified or suspended. In contrast, an investment in a listed BDC is a liquid investment, as shares can be
sold on an exchange at any time the exchange is open.
|
| • |
Some listed BDCs are self-managed, whereas our investment operations are managed by the Advisers, which are subsidiaries of BlackRock.
|
| • |
Listed BDCs may be reasonable alternatives to the Fund, and may be less costly and less complex with fewer and/or different risks than we have. Such listed BDCs will likely have historical performance that investors can evaluate, and
transactions for listed securities often involve nominal or no commissions.
|
| • |
Unlike the offering of a listed BDC, which is exempt from state securities regulation, this offering will be registered in every state in which we are offering and selling shares. As a result, we include certain limits in our governing
documents that are not typically provided for in the governing documents of a listed BDC. For example, our Declaration of Trust limits the fees we may pay to the Investment Adviser.
|
A listed BDC does not typically provide for these restrictions within its governing documents A listed BDC is, however, subject to the governance requirements of the exchange on which its shares are
traded, including requirements relating to its Board of Trustees, audit committee, independent Trustee oversight of executive compensation and the Trustee nomination process, code of conduct, shareholder meetings, related party transactions,
shareholder approvals and voting rights. Although we expect to follow many of the same governance guidelines as are imposed by exchanges, there is no requirement that we do so unless it is required for other reasons. Both listed BDCs and non-traded
BDCs are subject to the requirements of the 1940 Act and the Securities Exchange Act of 1934, as amended (the “Exchange Act”).
Q: For whom may an investment in your shares be appropriate?
| A: |
An investment in our shares may be appropriate for you if you:
|
| • |
meet the minimum suitability standards described above under “Suitability Standards”;
|
| • |
seek to allocate a portion of your investment portfolio to a direct investment vehicle with an income-oriented portfolio of primarily U.S. credit investments;
|
| • |
seek to receive current income through regular distribution payments;
|
| • |
wish to obtain the potential benefit of long-term capital appreciation; and
|
| • |
are able to hold your shares as a long-term investment and do not need liquidity from your investment quickly in the near future.
|
We cannot assure you that an investment in our shares will allow you to realize any of these objectives. An investment in our shares is only intended for investors who do not need the ability to sell
their shares quickly in the future since we are not obligated to offer to repurchase any of our Common Shares in any particular quarter in our discretion. See “Share Repurchase Program.”
Q: Are there any risks involved in buying your shares?
| A: |
Investing in our Common Shares involves a high degree of risk. If we are unable to effectively manage the impact of these risks, we may not meet our investment objective and, therefore, you should purchase our shares only if you can afford
a complete loss of your investment. An investment in our Common Shares involves significant risks and is intended only for investors with a long-term investment horizon and who do not require immediate liquidity or guaranteed income. Some of
the more significant risks relating to an investment in our Common Shares include those listed below:
|
| • |
There is no assurance that we will achieve our investment objective.
|
| • |
This is a “blind pool” offering and thus you will not have the opportunity to evaluate our investments before we make them.
|
| • |
You should not expect to be able to sell your shares regardless of how we perform.
|
| • |
You should consider that you may not have access to the money you invest for an extended period of time.
|
| • |
We do not intend to list our shares on any securities exchange, and we do not expect a secondary market in our shares to develop prior to any listing.
|
| • |
Because you may be unable to sell your shares, you will be unable to reduce your exposure in any market downturn.
|
| • |
We have implemented a share repurchase program, but only a limited number of shares will be eligible for repurchase and repurchases will be subject to available liquidity and other significant restrictions. Our share repurchase program can
be modified or suspended at our Board of Trustees’ discretion.
|
| • |
An investment in our Common Shares is not suitable for you if you need access to the money you invest. See “Suitability Standards” and “Share Repurchase Program.”
|
| • |
We cannot guarantee that we will make distributions, and if we do we may fund such distributions from sources other than cash flow from operations, including, without limitation, the sale of assets, borrowings, return of capital or
offering proceeds, and, subject to certain limitations imposed under the NASAA Omnibus Guidelines, we have no limits on the amounts we may pay from such sources. A return of capital (1) is a return of the original amount invested, (2) does
not constitute earnings or profits and (3) will have the effect of reducing the basis such that when a shareholder sells its shares the sale may be subject to taxes even if the shares are sold for less than the original purchase price.
|
| • |
Distributions may also be funded in significant part, directly or indirectly, from temporary waivers or expense reimbursements borne by the Investment Adviser or its affiliates, that may be subject to reimbursement to the Investment
Adviser or its affiliates. The repayment of any amounts owed to our affiliates will reduce future distributions to which you would otherwise be entitled.
|
| • |
We use and expect to continue to use leverage, which will magnify the potential for loss on amounts invested in us.
|
| • |
We qualify as an “emerging growth company” as defined in the Jumpstart Our Business Startups Act (the “JOBS Act”), and we cannot be certain if the reduced disclosure requirements applicable to emerging growth companies will make our Common
Shares less attractive to investors.
|
| • |
We intend to invest in securities that are rated below investment grade by rating agencies or that would be rated below investment grade if they were rated. Below investment grade securities, which are often referred to as “junk,” have
predominantly speculative characteristics with respect to the issuer’s capacity to pay interest and repay principal. They may also be illiquid and difficult to value.
|
| • |
An investor may pay a sales load of up to 3.50% and offering expenses of up to 1.50% on the amounts it invests in Class S shares. If you pay the maximum 3.50% sales load and offering expenses of 1.50%, you must experience a total return on
your net investment of 5.26% in order to recover these expenses.
|
| • |
An investor may pay a sales load of up to 1.50% and offering expenses of up to 1.50% on the amounts it invests in Class D shares. If you pay the maximum 1.50% sales load and offering expenses of 1.50%, you must experience a total return on
your net investment of 3.09% in order to recover these expenses.
|
Q: Do you currently own any investments?
| A: |
Yes. Please see “Management’s Discussion and Analysis of Financial Condition and Results of Operations” and the financial statements included herein and our periodic reports under the Exchange Act and www.bdebt.com for information
on our investments.
|
Q: What is the role of your Board of Trustees?
| A: |
We operate under the direction of our Board of Trustees, the members of which are accountable to us and our shareholders as fiduciaries. We have 5 Trustees, 3 of whom have been determined to be independent of us, the Advisers, BlackRock
and its affiliates (“Independent Trustees”). Our Independent Trustees are responsible for reviewing the performance of the Advisers and approving the compensation paid to the Advisers and their affiliates. The names and biographical
information of our Trustees are provided under “Management of the Fund—Trustees and Executive Officers.”
|
Q: What is the difference between the Class S, Class D and Institutional Common Shares being offered?
| A: |
We are offering to the public three classes of Common Shares, Class S shares, Class D shares and Institutional shares. The differences between the share classes relate to ongoing shareholder servicing fees and/or distribution fees. In
addition, although no upfront sales loads will be paid with respect to Class S shares, Class D Shares or Institutional shares, if you buy Class S shares or Class D shares through certain financial intermediaries, they may directly charge you
transaction or other fees, including upfront placement fees or brokerage commissions, in such amount as they may determine, provided that selling agents limit such charges to a 3.5% cap on NAV for Class S shares and a 1.5% cap on NAV for
Class D shares. Selling agents will not charge such fees on Institutional shares. We will also pay the following shareholder servicing and/or distribution fee to the Distributor, subject to FINRA limitations on underwriting compensation: (a)
for Class S shares, a shareholder servicing and/or distribution fee equal to 0.85% per annum of the aggregate NAV of the Class S shares calculated monthly as of the beginning of the first calendar day of the month and (b) for Class D shares,
a shareholder servicing fee equal to 0.25% per annum of the aggregate NAV of the Class D shares calculated monthly as of the beginning of the first calendar day of the month. Class S shares and Class D shares will receive shareholder
services. Shareholder servicing and/or distribution fees are similar to a commission in that the amount an investor pays may exceed the value of services they receive. Institutional shares will not receive shareholder services. Investors
should also inquire with their financial intermediary about what additional fees they may charge with respect to the share class under consideration or with respect to the type of account in which the shares will be held, as that is also an
important consideration when selecting a share class. See “Description of Our Shares” and “Plan of Distribution” for a discussion of the differences between our Class S, Class D and Institutional shares.
|
Assuming a constant net asset value per share of $25.00, we expect that a one-time investment in 400 shares of each class of our shares (representing an aggregate net asset value of $10,000 for each
class) would be subject to the following shareholder servicing and/or distribution fees:
|
Annual Shareholder Servicing
and/or Distribution Fees |
Total Over Five Years
|
|||||||
|
Class S
|
$
|
85
|
$
|
425
|
||||
|
Class D
|
$
|
25
|
$
|
125
|
||||
|
Institutional
|
$
|
0
|
$
|
0
|
||||
Class S shares and Class D shares are available through brokerage and transaction-based accounts. Institutional shares are generally available for purchase in this offering only (1) through fee-based
programs, also known as wrap accounts, that provide access to Institutional shares, (2) by endowments, foundations, pension funds and other institutional investors, (3) through participating intermediaries that have alternative fee arrangements with
their clients to provide access to Institutional shares, (4) through certain registered investment advisers, (5) by our executive officers and trustees and their immediate family members, as well as officers and employees of the Advisers, BlackRock
or other affiliates and their immediate family members, and joint venture partners, consultants and other service providers or (6) other categories of investors that we name in an amendment or supplement to this prospectus. In certain cases, where a
holder of Class S shares or Class D shares exits a relationship with a participating broker for this offering and does not enter into a new relationship with a participating broker for this offering, such holder’s shares may be exchanged into an
equivalent NAV amount of Institutional shares. Before making your investment decision, please consult with your financial intermediary regarding your account type and the classes of Common Shares you may be eligible to purchase.
Q: What is the per share purchase price?
| A: |
Shares of each class of our Common Shares will be issued on a monthly basis at a price per share equal to the NAV per share for such class, as described below.
|
Q: How will your NAV per share be calculated?
| A: |
Our NAV will be determined based on the value of our assets less our liabilities, including accrued fees and expenses, as of any date of determination.
|
The Board of Trustees has designated the Investment Adviser as the “valuation designee” (the “Valuation Designee”) for the Fund pursuant to the provisions of Rule 2a-5 under the 1940 Act. The
Valuation Designee has adopted and the Board of Trustees has approved, procedures pursuant to which the Valuation Designee will value the Fund’s investments (the “Valuation Procedures”) and determine our NAV per share each month. Investments for
which market quotations are readily available will typically be valued at those market quotations. To validate market quotations, we will utilize a number of factors to determine if the quotations are representative of fair value, including the
source and number of the quotations. Securities that are not publicly traded or for which market prices are not readily available will be valued at fair value as determined in good faith by the Valuation Designee pursuant to the Valuation Procedures
based on, among other things, the input of independent third-party valuation firms engaged to review our investments. See “Determination of Net Asset Value.”
Q: Is there any minimum investment required?
| A: |
The minimum initial investment in our Common Shares is $2,500 for Class S shares, $2,500 for Class D shares, and $1,000,000 for Institutional shares, which is waived or reduced by the Distributor to $10,000 or less for certain investors as
described below under “Plan of Distribution”; and the minimum subsequent investment in our shares is $500 per transaction, except that the minimum subsequent investment amount does not apply to purchases made under our distribution
reinvestment plan. In addition, the Distributor may elect to accept smaller initial and subsequent investments in its discretion. Financial intermediaries may impose their own minimum investment requirements for initial and/or subsequent
investments in excess of those described in this Prospectus.
|
Q: What is a “best efforts” offering?
| A: |
Our Common Shares are being offered publicly on a “best efforts” basis. A “best efforts” offering means the participating brokers are only required to use their best efforts to sell the shares. When shares are offered to the public on a
“best efforts” basis, no underwriter, broker or other person has a firm commitment or obligation to purchase any of the shares. Therefore, we cannot guarantee that any minimum number of shares will be sold.
|
Q: What is the expected term of this offering?
| A: |
We have registered $5,000,000,000 in Common Shares. It is our intent, however, to conduct a continuous offering for an extended period of time, by filing for additional offerings of our shares, subject to regulatory approval and continued
compliance with the rules and regulations of the Securities and Exchange Commission (“SEC”) and applicable state laws.
|
We will endeavor to take all reasonable actions to avoid interruptions in the continuous offering of our Common Shares. There can be no assurance, however, that we will not need to suspend our
continuous offering while the SEC and, where required, state securities regulators, review such filings for additional offerings of our Common Shares until such filings are declared effective, if at all.
Q: When may I make purchases of shares and at what price?
| A: |
Subscriptions to purchase our Common Shares may be made on an ongoing basis, but investors may only purchase our Common Shares pursuant to accepted subscription orders effective as of the first business day of each month (based on the NAV
per share as determined as of the last day of the preceding month), and to be accepted, a subscription request including the full subscription amount must be received in good order at least five business days prior to the first business day
of the month (unless waived by the Distributor). Certain access or feeder vehicles, which are offered shares pursuant to exceptions to registration under the Securities Act and not as part of this offering, may be subject to different
subscription deadlines), due to administrative or operational considerations applicable to such vehicles. Subscription amounts will be held in a non-interest-bearing account by the Fund’s transfer agent, prior to the subscription being
accepted by the Fund.
|
Notice of each share transaction will be furnished to shareholders (or their financial representatives) as soon as practicable but not later than seven business days after the Fund’s NAV is
determined and credited to the shareholder’s account, together with information relevant for personal and tax records. While a shareholder will not know our NAV applicable on the effective date of the share purchase, our NAV applicable to a purchase
of shares will be available on our website at www.bdebt.com generally within 20 business days after the effective date of the share purchase; at that time, the number of shares based on that NAV and each shareholder’s purchase will be
determined and shares will be credited to the shareholder’s account as of the effective date of the share purchase.
See “How to Subscribe” for more details.
Q: When will the NAV per share be available?
| A: |
We will report our NAV per share as of the last day of each month generally within 20 business days. Because subscriptions must be submitted at least five business days prior to the first business day of each month, you will not know the
NAV per share at which you will be subscribing at the time you subscribe.
|
For example, if you are subscribing in October, your subscription must be submitted at least five business days prior to November 1. The purchase price for your shares will be the NAV per share
determined as of October 31. The NAV per share as of October 31 will generally be available within 20 business days from October 31.
Our monthly NAV per share will be available through our website at www.bdebt.com after it becomes available.
Q: May I withdraw my subscription request once I have made it?
| A: |
Yes. Subscribers are not committed to purchase shares at the time their subscription orders are submitted and any subscription may be canceled at any time before the time it has been accepted. You may withdraw your purchase request by
notifying the transfer agent, through your financial intermediary or directly on our toll-free, automated telephone line, (888) 204-3956.
|
Q: When will my subscription be accepted?
| A: |
Completed subscription requests will not be accepted by us any earlier than two business days before the first business day of each month.
|
Q: Will I receive distributions and how often?
| A: |
We expect to pay regular monthly distributions. Any distributions we make will be at the discretion of our Board of Trustees, considering factors such as our earnings, cash flow, capital needs and general financial condition and the
requirements of Delaware law. As a result, our distribution rates and payment frequency may vary from time to time.
|
Our Board of Trustees’ discretion as to the payment of distributions will be directed, in substantial part, by its determination to cause us to comply with the distribution requirements applicable to
a RIC under Subchapter M of the Internal Revenue Code of 1986, as amended. To maintain our treatment as a RIC, we generally are required to make aggregate annual distributions to our shareholders of at least 90% of our net investment income. See
“Description of our Shares” and “U.S. Federal Income Tax Matters.”
The per share amount of distributions on Class S, Class D and Institutional shares generally differ because of different class-specific shareholder servicing and/or distribution fees that are
deducted from the gross distributions for each share class. Specifically, distributions on Class S and Class D shares will be lower than Institutional shares because we are required to pay higher ongoing shareholder servicing and/or distribution fees
with respect to the Class S and Class D shares compared to Institutional shares.
There is no assurance we will pay distributions in any particular amount, if at all. We may fund any distributions from sources other than cash flow from operations, including, without limitation,
the sale of assets, borrowings, return of capital or offering proceeds, and, subject to certain limitations imposed under the NASAA Omnibus Guidelines, we have no limits on the amounts we may pay from such sources. The extent to which we pay
distributions from sources other than cash flow from operations will depend on various factors, including the level of participation in our distribution reinvestment plan, how quickly we invest the proceeds from this and any future offering and the
performance of our investments. Funding distributions from the sales of assets, borrowings, return of capital or proceeds of this offering will result in us having less funds available to acquire investments. As a result, the return you realize on
your investment may be reduced. Doing so may also negatively impact our ability to generate cash flows. Likewise, funding distributions from the sale of additional securities will dilute your interest in us on a percentage basis and may impact the
value of your investment especially if we sell these securities at prices less than the price you paid for your shares. We believe the likelihood that we pay distributions from sources other than cash flow from operations will be higher in the early
stages of the offering.
Q: Will the distributions I receive be taxable as ordinary income?
| A: |
Generally, distributions that you receive, including cash distributions that are reinvested pursuant to our distribution reinvestment plan, will be taxed as ordinary income to the extent they are paid from our current or accumulated
earnings and profits. Dividends received will generally not be eligible to be taxed at the lower U.S. federal income tax rates applicable to individuals for “qualified dividends.”
|
We may designate a portion of distributions as capital gain dividends taxable at capital gain rates to the extent we recognize net capital gains from sales of assets. In addition, a portion of your
distributions may be considered return of capital for U.S. federal income tax purposes. Amounts considered a return of capital generally will not be subject to tax, but will instead reduce the tax basis of your investment. This, in effect, defers a
portion of your tax until your shares are repurchased, you sell your shares or we are liquidated, at which time you generally will be taxed at capital gains rates. Because each investor’s tax position is different, you should consult with your tax
advisor. In particular, non-U.S. investors should consult their tax advisors regarding potential withholding taxes on distributions that they receive. See “U.S. Federal Income Tax Matters.”
Q: May I reinvest my cash distributions in additional shares?
| A: |
Yes. We have adopted a distribution reinvestment plan whereby shareholders (other than Alabama, Arkansas, California, Idaho, Kansas, Kentucky, Maine, Maryland, Massachusetts, Nebraska, New Jersey, North Carolina, Ohio, Oregon, Tennessee,
Vermont and Washington investors and clients of certain participating brokers that do not permit automatic enrollment in our distribution reinvestment plan) will have their cash distributions (net of any withholding tax) automatically
reinvested in additional Common Shares unless they elect to receive their distributions in cash. Alabama, California, Arkansas, Idaho, Kansas, Kentucky, Maine, Maryland, Massachusetts, Nebraska, New Jersey, North Carolina, Ohio, Oregon,
Tennessee, Vermont and Washington investors and clients of certain participating brokers that do not permit automatic enrollment in our distribution reinvestment plan will automatically receive their distributions in cash (net of any
withholding tax) unless they elect to have their cash distributions reinvested in additional Common Shares. If you participate in our distribution reinvestment plan, the cash distributions attributable to the class of shares that you own will
be automatically invested in additional Common Shares. The purchase price for shares purchased under our distribution reinvestment plan will be equal to the most recent NAV per share for such shares at the time the distribution is payable.
Shareholders will not pay upfront selling commissions when purchasing shares under our distribution reinvestment plan; however, all shares, including those purchased under our distribution reinvestment plan, will be subject to ongoing
shareholder servicing and/or distribution fees. Participants may terminate their participation in the distribution reinvestment plan by providing written notice to the Plan Administrator (defined below) five business days in advance of the
first business day of the next month in order for a shareholder’s termination to be effective for such month. See “Description of Our Shares” and “Distribution Reinvestment Plan.”
|
Q: Can I request that my shares be repurchased?
| A: |
Yes, subject to limitations. The Fund has commenced a share repurchase program in which the Fund, at the discretion of our Board of Trustees, intends to repurchase, in each quarter, up to 5% of the Fund’s Common Shares outstanding (either
by number of shares or aggregate NAV) as of the close of the previous calendar quarter. The Fund does not intend to conduct a share repurchase offer during any calendar quarter for which our liquid assets plus available and undrawn leverage
are less than 25% of our net assets as of the date of the most recent publicly available NAV prior to the commencement of such calendar quarter. In addition, our Board of Trustees may amend or suspend the share repurchase program at any time
if it deems such action to be in our best interest and the best interest of our shareholders. As a result, share repurchases may not be available each quarter. We intend to conduct such repurchase offers in accordance with the requirements of
Rule 13e-4 promulgated under the Exchange Act and the 1940 Act. All shares purchased by us pursuant to the terms of each tender offer will be retired and thereafter will be authorized and unissued shares.
|
Under our share repurchase plan, to the extent we offer to repurchase shares in any particular quarter pursuant to a tender offer, we expect to repurchase shares at the expiration of the tender offer
using a purchase price equal to the NAV per share as of the last day of the applicable calendar quarter, except that shares that have not been outstanding for at least one year will be repurchased at 98% of such NAV (an “Early Repurchase Deduction”).
The one-year holding period is measured as of the subscription closing date immediately following the valuation date of the applicable tender offer. The Early Repurchase Deduction may be waived at the Fund’s or Distributor’s discretion (a) in the
case of repurchase requests arising from the death, divorce or qualified disability of the holder, or (b) due to trade or operational error, or (c) for repurchase requests with respect to shares held in accounts of asset allocation programs, such as
model portfolio management programs (and similar arrangements). The Early Repurchase Deduction will be waived in the event that a shareholder’s shares are repurchased because the shareholder has failed to maintain the $500 minimum account balance. In
addition, the Fund’s Common Shares are sold to certain feeder vehicles primarily created to hold the Fund’s Common Shares that in turn offer interests in such feeder vehicles to non-U.S. persons. For such feeder vehicles and similar arrangements in
certain markets, the Fund may not apply the Early Repurchase Deduction to the feeder vehicles or underlying investors, often because of administrative or systems limitations. The Early Repurchase Deduction will be retained by the Fund for the benefit
of remaining shareholders.
In the event the amount of shares tendered exceeds the repurchase offer amount, shares will be repurchased on a pro rata basis. All unsatisfied repurchase requests must be resubmitted in the next
quarterly tender offer, or upon the recommencement of the share repurchase plan, as applicable.
The majority of our assets will consist of instruments that cannot generally be readily liquidated without impacting our ability to realize full value upon their disposition. Therefore, we may not
always have sufficient liquid resources to make repurchase offers. In order to provide liquidity for share repurchases, we intend to generally maintain under normal circumstances an allocation to syndicated loans and other liquid investments. We may
fund repurchase requests from sources other than cash flow from operations, including, without limitation, the sale of assets, borrowings, return of capital or offering proceeds, and, subject to certain limitations imposed under the NASAA Omnibus
Guidelines, we have no limits on the amounts we may pay from such sources. However, we do not intend to commence a share repurchase offer during any calendar quarter for which our liquid assets plus available and undrawn leverage are less than 25% of
our net assets as of the date of the most recent publicly available NAV prior to the commencement of such calendar quarter. For purposes of the foregoing calculation, our liquid assets are those that we reasonably expect can be sold in current market
conditions within seven business days without significantly changing the market price of the investment. In addition, should making repurchase offers, in our judgment, place an undue burden on our liquidity, adversely affect our operations or risk
having an adverse impact on the Fund as a whole, or should we otherwise determine that investing our liquid assets in originated loans or other illiquid investments rather than repurchasing our shares is in the best interests of the Fund as a whole,
then we may choose to offer to repurchase fewer shares than described above, or none at all. See “Share Repurchase Program.”
Q: Can I sell, transfer or otherwise liquidate my shares post purchase?
| A: |
The purchase of our Common Shares is intended to be a long-term investment. We do not intend to list our shares on a national securities exchange, and do not expect a public market to develop for our shares in the foreseeable future. We
also do not intend to complete a liquidity event within any specific period, and there can be no assurance that we will ever complete a liquidity event. We intend to conduct quarterly share repurchase offers as described herein to provide
limited liquidity to our shareholders. Our share repurchase program will be the only liquidity initiative that we offer to our shareholders.
|
Because of the lack of a trading market for our shares, you may not be able to sell your shares promptly or at a desired price. If you are able to sell your shares, you may have to sell them at a
discount to the purchase price of your shares.
Our Common Shares are freely transferable, except where a transfer is restricted by federal and state securities laws or by contract. We will generally not charge you to facilitate transfers of your
shares, other than for necessary and reasonable costs actually incurred by us.
Q: What is a business development company, or BDC?
| A: |
Congress created the business development company, or BDC, through the Small Business Investment Incentive Act of 1980 to facilitate capital investment in small and middle market companies. Closed-end investment companies organized in the
U.S. that elect to be treated as BDCs under the 1940 Act are subject to specific provisions of the law, most notably that at least 70% of their total assets must be “qualifying assets.” Qualifying assets are generally defined as privately
offered debt or equity securities of U.S. private companies or U.S. publicly traded companies with market capitalizations less than $250 million.
|
Q: What is a regulated investment company, or RIC?
| A: |
We have elected to be treated for U.S. federal income tax purposes, and intend to qualify annually, as a RIC under the Code.
|
In general, a RIC is a company that:
| • |
is a BDC or registered investment company that combines the capital of many investors to acquire securities;
|
| • |
offers the benefits of a securities portfolio under professional management;
|
| • |
satisfies various requirements of the Code, including an asset diversification requirement; and
|
| • |
is generally not subject to U.S. federal corporate income taxes on its net taxable income that it currently distributes to its shareholders, which substantially eliminates the “double taxation” (i.e., taxation at both the corporate and
shareholder levels) that generally results from investments in a C corporation.
|
Q: What is a non-exchange traded, perpetual-life BDC?
| A: |
A non-exchange traded BDC is a BDC whose shares are not listed for trading on a stock exchange or other securities market. We use the term “perpetual-life BDC” to describe an investment vehicle of indefinite duration, whose Common Shares
are intended to be sold by the BDC monthly on a continuous basis at a price generally equal to the BDC’s monthly NAV per share. In our perpetual-life structure, we may, subject to Board approval, offer investors an opportunity to repurchase
their shares on a quarterly basis, but we are not obligated to offer to repurchase any in any particular quarter in our discretion. We believe that our perpetual nature enables us to execute a patient and opportunistic strategy and be able to
invest across different market environments. This may reduce the risk of the Fund being a forced seller of assets in market downturns compared to non-perpetual funds. While we may consider a liquidity event at any time in the future, we do
not intend to undertake a liquidity event, and we are not obligated by our Declaration of Trust or otherwise to effect a liquidity event at any time.
|
Q: Will I be notified of how my investment is doing?
| A: |
Yes. We will provide you with periodic updates on the performance of your investment with us, including:
|
| • |
quarterly financial reports and investor statements;
|
| • |
an annual report;
|
| • |
in the case of certain U.S. shareholders, an annual Internal Revenue Service (“IRS”) Form 1099-DIV or IRS Form 1099-B, if required, and, in the case of non-U.S. shareholders, an annual IRS Form 1042-S;
|
| • |
confirmation statements (after transactions affecting your balance, except reinvestment of distributions in us and certain transactions through minimum account investment or withdrawal programs); and
|
| • |
a quarterly statement providing material information regarding your participation in the distribution reinvestment plan and an annual statement providing tax information with respect to income earned on shares under the distribution
reinvestment plan for the calendar year.
|
Depending on legal requirements, we may post this information on our website, www.bdebt.com when available, or provide this information to you via
U.S. mail or other courier, electronic delivery, or some combination of the foregoing. Information about us will also be available on the SEC’s website at www.sec.gov.
In addition, our monthly NAV per share will be available through our website after it has become available.
Q: What fees do you pay to the Advisers?
| A: |
Pursuant to the advisory agreement between us and the Investment Adviser (the “Advisory Agreement”), the Investment Adviser is responsible for, among other things, identifying investment opportunities, monitoring our investors and
determining the composition of our portfolio. We pay the Investment Adviser a fee for its services under the Advisory Agreement consisting of two components: a management fee and an incentive fee.
|
The management fee is payable monthly in arrears at an annual rate of 1.25% of the value of our net assets as of the end of the most recently completed calendar month. The incentive fee consists of
two components as follows:
| • |
The income component of the incentive fee will be the amount, if positive, equal to 12.5% of the aggregate net investment income before incentive compensation earned for the most recent calendar quarter and the preceding eleven calendar
quarters (or if shorter, the number of calendar quarters that have occurred since commencement of the Fund’s operations), less aggregate income incentive compensation previously paid with respect to the first eleven calendar quarters (or the
portion thereof) included in the relevant trailing twelve quarters.
|
The income component of the incentive fee is subject to a 5.0% total return hurdle on daily weighted average unreturned capital contributions (the “Hurdle Rate”). As such, the Fund will not be
obligated to pay any income incentive fee to the extent the annualized trailing twelve quarter (or if shorter, the number of calendar quarters that have occurred since the commencement of the fund) total return of the Fund (as defined below),
including net realized gains and losses and net unrealized appreciation and depreciation, does not exceed the Hurdle Rate. To the extent that the Fund’s annualized total return for the relevant period exceeds the Hurdle Rate, but is less than
5.714286% of daily weighted average unreturned capital contributions, the income incentive fee will be subject to a “catch up,” calculated as 100% of the aggregate net investment income before incentive compensation earned in excess of Hurdle Rate
for the relevant period. To the extent that the Fund’s annualized total return for the relevant period exceeds 5.714286%, the income component of the incentive fee will be equal to 12.5% of net investment income before incentive compensation earned
in excess of this total return threshold.
| • |
The capital gains component of the incentive fee will be the amount, if positive, equal to the lesser of (i) 12.5% of the aggregate realized capital gains (computed net of realized losses and net of unrealized capital depreciation, if any)
for the most recent calendar quarter and the preceding eleven calendar quarters (or if shorter, the number of calendar quarters that have occurred since commencement of the Fund’s operations), less capital gains incentive compensation
previously paid or distributed in respect of the first eleven calendar quarters (or the portion thereof) included in the relevant trailing twelve quarters or (ii) 12.5% of cumulative aggregate realized capital gains (computed net of realized
losses and net of unrealized capital depreciation, if any) since commencement of the Fund, less capital gains incentive compensation previously paid or distributed since commencement of the Fund. The capital gains component will be paid in
full prior to payment of the ordinary income component.
|
In any case, incentive compensation (including both the income and capital gains components) will only be paid to the extent the trailing twelve quarter (or if shorter, the number of calendar
quarters that have occurred since commencement of the Fund) total return of the Fund after incentive compensation and including such payment would equal or exceed a 5% annual total return on daily weighted average unreturned contributed capital
contributions for such period.
Pursuant to the sub-investment advisory agreement between us, the Investment Adviser and the Sub-Adviser (the “Sub-Advisory Agreement”), the Investment Adviser, and not the Fund, will pay a portion
of the management fee received by the Investment Adviser to the Sub-Adviser as a sub-advisory fee in an amount equal to a percentage of the average daily value of the Fund’s assets allocated to the Sub-Adviser.
See “Advisory Agreement, Sub-Advisory Agreement and Administrative Agreement.”
Q: Who will administer the Fund?
| A: |
BlackRock Financial Management, Inc., as our administrator (the “Administrator”), will provide, or oversee the performance of, administrative and compliance services. We will reimburse the Administrator for its costs, expenses and the
Fund’s allocable portion of compensation of the Administrator’s personnel and the Administrator’s overhead (including rent, office equipment and utilities) and other expenses incurred by the Administrator in performing its administrative
obligations under the administration agreement (the “Administration Agreement”).
|
The Administrator has entered into a sub-administration agreement (the “Sub-Administration Agreement”) with State Street Bank and Trust Company. The sub-administrator will receive compensation for
its sub-administrative services under the Sub-Administration Agreement.
See “Advisory Agreement, Sub-Advisory Agreement and Administration Agreement-Administration Agreement” and “-Sub Administration Agreement.”
Q: What are the offering and servicing costs?
| A: |
No upfront sales load will be paid with respect to Class S shares, Class D shares or Institutional shares, however, if you buy Class S or Class D shares through certain financial intermediaries, they may directly charge you transaction or
other fees, including upfront placement fees or brokerage commissions, in such amount as they may determine, provided that selling agents limit such charges to a 3.5% cap on NAV for Class S shares and a 1.5% cap on NAV for Class D shares.
Selling agents will not charge such fees on Institutional shares. Please consult your selling agent for additional information.
|
We will also pay the following shareholder servicing and/or distribution fee to the Distributor, subject to FINRA limitations on underwriting compensation:
| • |
For Class S shares, a shareholder servicing and/or distribution fee equal to 0.85% per annum of the aggregate NAV of the Class S shares calculated monthly as of the beginning of the first calendar day of the month.
|
| • |
For Class D shares, a shareholder servicing fee equal to 0.25% per annum of the aggregate NAV of the Class D shares calculated monthly as of the beginning of the first calendar day of the month.
|
| • |
No shareholder servicing or distribution fees will be paid with respect to the Institutional shares.
|
The shareholder servicing and/or distribution fee is payable monthly in arrears. The Distributor reallows (pays) all or a portion of the shareholder servicing and/or distribution fees to
participating brokers and servicing brokers for ongoing shareholder services performed by such brokers, and will waive shareholder servicing and/or distribution fees to the extent a broker is not eligible to receive it for failure to provide such
services. Shareholder servicing and/or distribution fees are similar to a commission in that the amount an investor pays may exceed the value of services they receive.
We will also pay or reimburse certain organization and offering expenses, including, subject to FINRA limitations on underwriting compensation, certain wholesaling expenses. See “Plan of
Distribution” and “Use of Proceeds.” The total underwriting compensation and total organization and offering expenses will not exceed 10% and 15%, respectively, of the gross proceeds from this offering. Organization and offering expenses may include
the reimbursement to the Investment Adviser for organization and offering expenses paid by the Investment Adviser on our behalf through September 1, 2022, the initial closing date of our continuous public offering, pursuant to the Fee Waiver and
Expense Support and Reimbursement Agreement between the Fund and the Investment Adviser. The Investment Adviser was entitled to reimbursement of such expenses from us during the 36 months following the commencement of the Fund’s operations, to the
extent that the Fund’s annual Operating Expenses (as defined herein) did not exceed 1.25% of the value of the Fund’s net assets, calculated monthly based on month-end net assets of the Fund. The Fee Waiver and Expense Support and Reimbursement
Agreement expired on March 18, 2025. On August 26, 2025, the Fund entered into an Expense Support and Conditional Reimbursement Agreement (the “Expense Support and Conditional Reimbursement Agreement”) with the Investment Adviser. Pursuant to the
Expense Support and Conditional Reimbursement Agreement, the Investment Adviser may elect to pay certain expenses on the Fund’s behalf (an “Expense Payment”), provided that no portion of an Expense Payment will be used to pay any interest expense or
shareholder servicing and/or distribution fees of the Fund. Any Expense Payment that the Investment Adviser has committed to pay shall be paid by the Investment Adviser to the Fund in any combination of cash or other immediately available funds no
later than seventy-five days after such commitment was made in writing, and/or offset against amounts due from the Fund to the Investment Adviser or its affiliates. See “Advisory Agreement, Sub-Advisory Agreement and Administration Agreement—Expense
Support and Conditional Reimbursement Agreement” for additional information regarding the Expense Support Agreement.
Q: What are your operating expenses?
| A: |
We incur operating expenses in the form of our management and incentive fees, shareholder servicing and/or distribution fees, interest expense on our borrowings and other expenses, including the expenses we pay to our Administrator. See
“Fees and Expenses.”
|
Q: What are your policies related to conflicts of interests with BlackRock and its affiliates?
| A: |
The Advisers, BlackRock and their affiliates (collectively, the “Firm”) will be subject to certain conflicts of interest with respect to the services the Advisers and the Administrator provide for us. These conflicts will arise primarily
from the involvement of the Firm in other activities that may conflict with our activities. You should be aware that individual conflicts will not necessarily be resolved in favor of our interest.
|
| • |
Broad and Wide-Ranging Activities. As a global provider of investment management, risk management and advisory services to institutional and retail clients, BlackRock, the Advisers and their
respective affiliates (for purposes of this discussion of potential conflicts, the “BlackRock Entities”), engage in a broad spectrum of activities, including sponsoring and managing a variety of public and private investment funds, funds of
funds and separate accounts across fixed income, liquidity, equity, alternative investment and real estate strategies; providing financial advisory services; providing technology infrastructure and analytics under the BlackRock Solutions®
brand and engaging in certain broker-dealer activities and other activities. Although the relationships and activities of the BlackRock Entities should help enable these entities to offer attractive opportunities and service to the Fund, such
relationships and activities create certain inherent actual and potential conflicts of interest. In the ordinary course of business, the BlackRock Entities engage in activities where their interests or the interests of their clients may
conflict with the interests of the Fund, certain investors or a group of investors, or the Fund’s investments.
|
| • |
Allocation of Investment Opportunities. The BlackRock Entities manage and advise numerous Client Accounts, including BlackRock Accounts. Certain of these Client Accounts have investment
objectives, and utilize investment strategies, that are similar to the Fund’s. As a result, certain investments may be appropriate for the Fund and also for other Client Accounts. The BlackRock Entities’ allocation of investment opportunities
among various Client Accounts presents inherent potential and actual conflicts of interest, particularly where an investment opportunity is limited. These potential conflicts are exacerbated in situations where BlackRock is entitled to higher
fees and incentive compensation from certain Client Accounts than from other Client Accounts (including the Fund), where the portfolio managers making an allocation decision are entitled to an incentive fee, carried interest or other similar
compensation from such other Client Accounts, or where there are differences in proprietary investments in the Fund and other Client Accounts. The prospect of achieving higher compensation or greater investment return from another investment
vehicle or separate account than from the Fund provides incentives for the Advisers or other BlackRock Entities to favor the other investment vehicle or separate account over the Fund when, for example, allocating investment opportunities
that the Advisers believe could result in favorable performance. It is the policy of BlackRock not to make decisions based on the foregoing interests or greater fees or compensation.
|
Any person that is an affiliate of the Fund for purposes of the 1940 Act generally is prohibited from participating in certain transactions such as co-investing with, or buying or selling any
security from or to, the Fund absent the prior approval of the Independent Trustees and, in some cases, of the SEC. However, the Investment Adviser, the Fund and certain other Client Accounts (as defined below) managed by the Investment Adviser or
certain affiliates have received an order providing an exemption from certain SEC regulations prohibiting transactions with affiliates (the “Order”). The Order requires that certain procedures be followed prior to making an investment subject to the
Order. The Investment Adviser may face conflicts of interest in making investments pursuant to the Order.
As a result of the Order, there could be significant overlap in the Fund’s investment portfolio and the investment portfolios of other Client Accounts, including, in some cases, proprietary accounts
of the Investment Adviser or its affiliates. Because investments may be allocated across multiple other Client Accounts, the Fund will at times receive a lower allocation to an investment than desired; likewise, the Fund may also be limited in the
degree to which it is able to participate in selling opportunities that it may otherwise wish to pursue due to allocations, including non-pro rata allocations, to other Client Accounts.
If the Investment Adviser identifies a co-investment opportunity and the Fund is unable to rely on the Order or other no-action positions of the SEC staff for that particular co-investment
opportunity, the Investment Adviser will be required to determine which Client Accounts should make the investment at the potential exclusion of other Client Accounts. In such circumstances, the Investment Adviser will adhere to the Allocation Policy
in order to determine the Client Account to which to allocate investment opportunities. Accordingly, it is possible that the Fund may not be given the opportunity to participate in investments made by other Client Accounts.
The 1940 Act also prohibits certain “joint” transactions with certain of the Fund’s affiliates, which could include investments in the same portfolio company (whether at the same or different times),
without prior approval of the Independent Trustees and, in some cases, of the SEC. The Fund is prohibited from buying or selling any security from or to any person who owns more than 25% of the Fund’s voting securities and from or to certain of that
person’s affiliates, or entering into prohibited joint transactions with such persons, absent the prior approval of the SEC (other than certain limited situations pursuant to current regulatory guidance). The analysis of whether a particular
transaction constitutes a joint transaction requires a review of the relevant facts and circumstances relating to the particular transaction. Similar restrictions limit the Fund’s ability to transact business with its officers or trustees or their
affiliates.
To address actual and potential conflicts associated with allocation of investments, BlackRock has developed the Investment Allocation Policy and related guidelines. In addition, certain BlackRock
Entities and business units have supplemental allocation policies for making allocation decisions among Client Accounts managed by such BlackRock Entities (together with the Investment Allocation Policy and related guidelines, the “Allocation
Policy”). The Allocation Policy is intended to ensure that investment opportunities are allocated on a fair and equitable basis among Client Accounts over time, taking into account various factors including the Client Account’s investment objective,
guidelines and restrictions and other portfolio construction considerations; available capital and liquidity needs; tax, regulatory and contractual considerations; risk or investment concentration parameters; supply or demand for a security at a
given price level; size of available investment; unfunded capital commitments or cash availability and liquidity requirements; leverage limitations; regulatory restrictions; contractual restrictions (including with other clients); minimum investment
size; relative size; and such other factors as may be relevant to a particular transaction or Client Account.
| • |
Allocation of Expenses. Side-by-side management by the BlackRock Entities of the Fund and Client Accounts raises other potential and actual conflicts of interest, including those associated with
allocating expenses attributable to the Fund and one or more other Client Accounts. Subject to applicable law, including the Order, the Advisers and their affiliates will attempt to make such allocations on a basis that they consider to be
fair and equitable to the Fund under the circumstances over time and considering such factors as it deems relevant. The allocations of such expenses may not be proportional, and any such determinations involve inherent matters of discretion,
e.g., in determining whether to allocate pro rata based on number of Client Accounts or proportionately in accordance with asset size, or in certain circumstances determining whether a particular expense has a greater benefit to the Fund,
other Client Accounts or the Advisers and/or their affiliates.
|
| • |
Activities of Other Client Accounts. The BlackRock Entities will, from time to time, be actively engaged in transactions on behalf of other Client Accounts in the same investments, securities,
derivatives and other instruments in which the Fund will directly or indirectly invest. Trading for certain other Client Accounts is carried out without reference to positions held directly or indirectly by the Fund and may have an effect on
the value or liquidity of the positions so held or may result in another Client Account having an interest in an issuer adverse to that of the Fund.
|
Under certain circumstances and subject to the Order and applicable law, the Fund may invest directly or indirectly in a transaction in which one or more other Client Accounts are expected, or seek,
to participate or already have made, or concurrently will make or seek to make, an investment. The Fund and the other Client Accounts may have conflicting interests and objectives in connection with such investments, including with respect to views
on the operations or activities of the project or company involved, the targeted returns from the investment and the timeframe for, and method of, exiting the investment. Conflicts will also arise in cases where the Fund, directly or indirectly, and
other Client Accounts invest in different parts of an issuer’s capital structure, including circumstances in which one or more Client Accounts may own private securities or obligations of an issuer and other Client Accounts may own public securities
of the same issuer. If an issuer in which the Fund, directly or indirectly, and one or more other Client Accounts hold different classes of securities (or other assets, instruments or obligations issued by such issuer) encounters financial problems,
decisions over the terms of any workout will raise potential conflicts of interests (including, for example, conflicts regarding the terms of recapitalizations and proposed waivers, amendments or enforcement of debt covenants). As a result, one or
more Client Accounts may pursue or enforce rights with respect to a particular issuer in which the Fund has directly or indirectly invested, and those activities may have an adverse effect on the Fund. Because of the different legal rights associated
with debt and equity of the same portfolio company, BlackRock expects to face a potential conflict of interest in respect of the advice given to, and the actions taken on behalf of, the Fund versus another Client Account (e.g., the terms of debt
instruments, the enforcement of covenants, the terms of recapitalizations and the resolution of workouts or bankruptcies). In the event of an insolvency, bankruptcy or similar proceeding of an issuer, the Fund may be limited (by applicable law,
courts or otherwise) in the positions or actions it may be permitted to take due to other interests held or actions or positions taken by other Client Accounts. In negotiating the terms and conditions of any such investments, or any subsequent
amendments or waivers, the Advisers and the other BlackRock Entities may find that their own interests, the interests of the Fund and/or the interests of one or more other Client Accounts could conflict. Any of the foregoing conflicts of interest
will be discussed and resolved on a case-by-case basis. The resolution of such conflicts will take into consideration the interests of the relevant parties, the circumstances giving rise to the conflict, the Order to the extent applicable and
applicable law. Shareholders should be aware that conflicts will not necessarily be resolved in favor of the Fund and that the Fund could be adversely affected by the actions taken by BlackRock Entities on behalf of Client Accounts.
In order to avoid or reduce the conflicts that may arise in cases where the Fund, directly or indirectly, and other Client Accounts invest in different parts of an issuer’s capital structure, or for
other reasons, the Fund may choose not to invest in issuers in which other Client Accounts hold an existing investment, even if the Advisers believe such investment opportunity to be attractive and otherwise appropriate for the Fund and is permitted
under applicable law and regulation, which may adversely affect the performance of the Fund.
The BlackRock Entities may also, in certain circumstances and subject to the Order and applicable law and regulation, pursue or enforce rights or take other actions with respect to a particular
issuer or investment jointly on behalf of the Fund and other Client Accounts. In such circumstances, the Fund may be adversely impacted by the other Client Accounts’ activities, and transactions for the Fund may be impaired or effected at prices or
terms that may be less favorable than would otherwise have been the case had the other Client Accounts not pursued a particular course of action with respect to the issuer or investment. For example, one or more Client Accounts may dispose of or make
an in kind distribution of its portion of an investment that is also held by the Fund and other Client Accounts, and such action may adversely affect the Fund and such other Client Accounts that continue to hold such investment.
Conflicts may also arise because portfolio decisions made by the Advisers on behalf of the Fund may benefit other BlackRock Entities or Client Accounts, including BlackRock Accounts. For example,
subject to the Order and applicable law and regulation, the Fund may invest directly or indirectly in the securities, bank loans or other obligations of issuers in which a Client Account has an equity, debt or other interest, or vice versa. In
certain circumstances, the Advisers may be incentivized not to undertake certain actions on behalf of the Fund in connection with such investments, in view of a BlackRock Entity’s or Client Account’s involvement with the relevant issuer or
investment. Further, the Fund may also engage in investment transactions that result in other Client Accounts being relieved of obligations or otherwise divesting of investments that the Fund also holds, or which cause the Fund to have to divest
certain investments. The purchase, holding and sale of investments by the Fund may enhance the profitability of another Client Account’s own investments in and activities with respect to such investments.
Without limiting the generality of the foregoing, the Fund may invest, directly or indirectly, in equity of investments or issuers affiliated with the BlackRock Entities or in which a BlackRock
Entity or a Client Account has a direct or indirect debt or other interest, or vice versa, and may acquire such equity or debt either directly or indirectly through public or private acquisitions. Such investments may benefit the BlackRock Entities
or Client Accounts. In addition, the Advisers may be incentivized not to undertake certain actions on behalf of the Fund in connection with such investments, in view of a BlackRock Entity’s or Client Account’s involvement with the relevant issuer or
investment.
| • |
Transactions Between Client Accounts. Each of the BlackRock Entities and the Advisers reserve the right to conduct cross trades between the Fund and other Client Accounts in accordance with
applicable legal and regulatory requirements. The Advisers may cause the Fund to purchase securities or other assets from or sell securities or other assets to, or engage in other transactions with, other Client Accounts or vehicles when the
Advisers believes such transactions are appropriate and in the participants’ best interest, subject to applicable law and regulation. The Fund may enter into “agency cross transactions,” in which a BlackRock Entity may act as broker for the
Fund and for the other party to the transaction, to the extent permitted under applicable law and regulation and the relevant Client Account governing documents. In such cases, the Advisers and such other Client Accounts or BlackRock
Entities, as applicable, may have a potentially conflicting division of loyalties and responsibilities regarding both parties to the transaction. To the extent that any provision of Section 11(a) of the Exchange Act, or any of the rules
promulgated thereunder, is applicable to any transactions effected by the Advisers, such transactions will be effected in accordance with the requirements of such provisions and rules.
|
| • |
Management of the Fund. In connection with the management of the Fund, the Board of Trustees and/or the Advisers will have the right to make certain determinations on behalf of the Fund, in its
discretion. Any such determinations may affect shareholders differently and some shareholders may be adversely affected by such determinations by the Board of Trustees or Advisers. Shareholders may be situated differently in a number of ways,
including being resident of, or organized in, various jurisdictions, being subject to different tax rules or regulatory structures and/or having different internally- or externally-imposed investment policies, restrictions or guidelines. As a
result, conflicts of interest may arise in connection with decisions made by the Board of Trustees or the Advisers that may be more beneficial for certain shareholders. In making determinations on behalf of the Fund, including in structuring
and completing investments, the Advisers intend to consider the investment and tax objectives of the Fund and the shareholders as a whole, not the investment, tax or other objectives of any shareholder individually.
|
| • |
Limited Access to Information; Information Advantage of Certain BlackRock Clients. As a result of receiving client reports, service on a Client Account’s advisory board, affiliation with the
Advisers or otherwise, one or more BlackRock clients may have access to different information regarding the BlackRock Entities’ transactions, strategies or views, and may act on such information in accounts not controlled by the BlackRock
Entities, which may have a material adverse effect on the performance of the Fund. The Fund and its investments may also be adversely affected by market movements or by decreases in the pool of available securities or liquidity arising from
purchases and sales by, as well as increases of capital in, and withdrawals of capital from, other Client Accounts and other accounts of BlackRock clients not controlled by BlackRock. These effects can be more pronounced in respect of
investments with limited capacity and in thinly traded securities and less liquid markets.
|
Furthermore, shareholders’ rights to information regarding the Advisers or the Fund generally will be limited to applicable reporting obligations and information requirements under the Exchange Act
and applicable state laws. It is anticipated that the Advisers and their affiliates will obtain certain types of material information from or relating to the Fund’s investments that will not be disclosed to shareholders because such disclosure is
prohibited, including as a result of contractual, legal or similar obligations outside of BlackRock’s control. Such limitations on the disclosure of such information may have adverse consequences for shareholders in a variety of circumstances and may
make it difficult for a shareholder to monitor the Advisers and its performance.
| • |
Advisers’ Decisions May Benefit BlackRock Entities and BlackRock Accounts. BlackRock Entities may derive ancillary benefits from certain decisions made on behalf of the Fund. While the Advisers will
make decisions for the Fund in accordance with their obligations to manage the Fund appropriately, the fees, allocations, compensation and other benefits to the BlackRock Entities (including benefits relating to business relationships of the
BlackRock Entities) may be greater as a result of certain portfolio, investment, service provider or other decisions made by the Advisers for the Fund than they would have been had other decisions been made which also might have been
appropriate for the Fund. In addition, BlackRock Entities may invest in Client Accounts and therefore may indirectly derive ancillary benefits from certain decisions made by the Advisers. The Advisers may also make decisions and exercise
discretion with respect to the Fund that could benefit BlackRock Entities that have invested in the Fund.
|
| • |
Management Responsibilities. The employees and directors of the Advisers or their affiliates are not under any obligation to devote all of their professional time to the affairs of the Fund, but
will devote such time and attention to the affairs of the Fund as BlackRock determines in its discretion is necessary to carry out the operations of the Fund effectively. Employees and directors of the Advisers engage in other activities
unrelated to the affairs of the Fund, including managing or advising other Client Accounts, which presents potential conflicts in allocating management time, services and functions among the Fund and other Client Accounts. These potential
conflicts will be exacerbated in situations where employees may be entitled to greater incentive compensation or other remuneration from certain Client Accounts than from other Client Accounts (including the Fund).
|
The Advisers may, subject to applicable law, utilize the personnel or services of its affiliates in a variety of ways to make available to the Fund BlackRock’s global capabilities. Although the
Advisers believes this practice generally is in the best interests of clients, it is possible that conflicts with respect to allocation of investment opportunities, portfolio execution, client servicing or other matters may arise due to differences
in regulatory requirements in various jurisdictions, time differences or other reasons. The Advisers will seek to ameliorate any conflicts that arise and may determine not to utilize the personnel or services of a particular affiliate in
circumstances where it believes the potential conflict outweighs the potential benefits.
| • |
Potential Restrictions on the Advisers’ Activities on Behalf of the Fund. From time to time, the Advisers expect to be restricted from purchasing or selling securities or taking other actions on
behalf of the Fund because of regulatory and legal requirements applicable to BlackRock Entities, other Client Accounts and/or the Advisers’ internal policies designed to comply with or limit the applicability of, or which otherwise relate
to, such requirements. An investment fund not advised by BlackRock Entities may not be subject to the same considerations. There may be periods when the Advisers (on behalf of the Fund) may not initiate or recommend certain types of
transactions, may limit or delay purchases, may sell or redeem existing investments, forego transactions or other investment opportunities, restrict or limit the exercise of rights (including voting rights), or may otherwise restrict or limit
their advice with respect to securities or instruments issued by or related to issuers for which BlackRock Entities are performing advisory or other services. Such policies may restrict the Fund’s activities more than required by applicable
law. For example, when BlackRock Entities are engaged to provide advisory or risk management services for an issuer, the Fund may be prohibited from or limited in purchasing or selling interests of that issuer, particularly in cases where
BlackRock Entities have or may obtain material nonpublic information about the issuer. Similar prohibitions or limitations could also arise if: (i) BlackRock Entity personnel serve as directors or officers of issuers, the securities or other
interests of which the Fund wishes to purchase or sell, (ii) the Advisers on behalf of the Fund participates in a transaction (including a controlled acquisition of a U.S. public company) that results in the requirement to restrict all
purchases, sales and voting of equity securities of such target issuer, or (iii) regulations, including portfolio affiliation rules or stock exchange rules, prohibit participation in offerings by an issuer when other Client Accounts have
prior holdings of such issuer’s securities or desire to participate in such a public offering, or where other Client Accounts have or may have short positions in such issuer’s securities. However, where permitted by applicable law, and where
consistent with the BlackRock Entities’ policies and procedures, the BlackRock Entities may, but are not obligated to, seek to avoid such prohibitions or limitations (such as through the implementation of appropriate information barriers),
and in such cases, the Advisers on behalf of the Fund may purchase or sell securities or instruments that are issued by such issuers. In addition, certain activities and actions may also be considered to result in reputational risk or
disadvantage for the management of the Fund and/or for the Advisers and their affiliates, and the Advisers may decline or limit an investment opportunity or dispose of an existing investment as a result.
|
In addition, in regulated industries and in certain markets, and in certain futures and derivative transactions, there are limits on the aggregate amount of investment by affiliated investors that
may not be exceeded without a regulatory filing, the grant of a license or other regulatory or corporate consent. For example, the U.S. Commodity Futures Trading Commission (“CFTC”), the U.S. commodities exchanges and certain non-U.S. exchanges have
established limits referred to as “speculative position limits” or “position limits” on the maximum long or short (or, for some commodities, the gross) positions which any person or group of persons may own, hold or control in certain futures or
options on futures contracts, and such rules generally require aggregation of the positions owned, held or controlled by related entities. Any such limits may prevent the Fund from acquiring positions that might otherwise have been desirable or
profitable. Under certain circumstances, the Advisers may restrict a purchase or sale of securities, derivative instruments or other assets on behalf of Client Accounts in anticipation of a future conflict that may arise if such purchase or sale
would be made. Any such determination will take into consideration the interests of the relevant Client Accounts, the circumstances that would give rise to the future conflict and applicable law. Such determination will be made on a case by case
basis.
| • |
Other Services and Activities of the BlackRock Entities. Subject to the Governing Documents of the Fund and applicable law, the BlackRock Entities (including the Advisers) will, from time to time,
provide financial, consulting and other services to, and receive compensation from, an entity which is the issuer of a security or other investment held by the Fund, counterparties to transactions with the Fund or third parties that also
provide services to the Fund. In addition, the BlackRock Entities (including the Advisers) may purchase property (including securities) from, sell property (including securities) or lend funds to, or otherwise deal with, any entity which is
the issuer of a security held by the Fund, counterparties to transactions with the Fund or third parties that also provide services to the Fund. It is also likely that the Fund will have multiple business relationships with and will invest
in, engage in transactions with, make voting decisions with respect to, or obtain services from entities for which BlackRock Entities perform or seek to perform certain financial services. There can be no assurance that no other service
provider is more qualified to provide such services, could provide such services at a lesser cost or could provide greater benefits to issuers of securities held by the Fund, counterparties to transactions with the Fund or third parties that
also provide services to the Fund. Conflicts are expected to arise in connection with the foregoing.
|
The BlackRock Entities may derive ancillary benefits from providing investment advisory, administrative and other services to the Fund, and providing such services to the Fund may enhance the
BlackRock Entities’ relationships with various parties, facilitate additional business development, and enable the BlackRock Entities to obtain additional business and generate additional revenue.
| • |
Potential Restrictions and Issues Relating to Information Held by BlackRock. The Advisers may not have access to information and personnel of all BlackRock Entities, including as a result of
informational barriers constructed between different investment teams and groups within BlackRock focusing on alternative investments and otherwise. Therefore, the Advisers may not be able to manage the Fund with the benefit of information
held by one or more other investment teams and groups within the BlackRock Entities. However, although they are under no obligation to do so, if they are permitted to do so, the Advisers may consult with personnel on other investment teams
and in other groups within BlackRock, or with persons unaffiliated with BlackRock, or may form investment policy committees composed of such personnel, and in certain circumstances, personnel of affiliates of the Advisers may have input into,
or make determinations regarding, portfolio management transactions for the Fund, and may receive information regarding the Advisers’ proposed investment activities for the Fund that generally is not available to the public. There will be no
obligation on the part of such persons to make available for use by the Fund any information or strategies known to them or developed in connection with their own client, proprietary or other activities. In addition, BlackRock will be under
no obligation to make available any research or analysis prior to its public dissemination.
|
The Advisers make decisions for the Fund based on the Fund’s investment program. The Advisers from time to time may have access to certain fundamental analysis, research and proprietary technical
models developed by BlackRock Entities and their personnel. There will be no obligation on the part of the BlackRock Entities to make available for use by the Fund, or to effect transactions on behalf of the Fund on the basis of, any such
information, strategies, analyses or models known to them or developed in connection with their own proprietary or other activities. In certain cases, such personnel will be prohibited from disclosing or using such information for their own benefit
or for the benefit of any other person, including the Fund and other Client Accounts. In other cases, fundamental analyses, research and proprietary models developed internally may be used by various BlackRock Entities and their personnel on behalf
of different Client Accounts, which could result in purchase or sale transactions in the same security at different times (and could potentially result in certain transactions being made by one portfolio manager on behalf of certain Client Accounts
before similar transactions are made by a different portfolio manager on behalf of other Client Accounts), or could also result in different purchase and sale transactions being made with respect to the same security. The Advisers may also effect
transactions for the Fund that differ from fundamental analysis, research or proprietary models issued by the BlackRock Entities or by the Advisers themselves in various contexts. The foregoing transactions may negatively impact the Fund and its
direct and indirect investments through market movements or by decreasing the pool of available securities or liquidity, which effects can be more pronounced in thinly traded securities and less liquid markets.
The BlackRock Entities and different investment teams and groups within the Advisers have no obligation to seek information or to make available to or share with the Fund or any third-party manager
with which the Fund invests any information, research, investment strategies, opportunities or ideas known to BlackRock Entity personnel or developed or used in connection with other clients or activities. The BlackRock Entities and different
investment teams and groups within the Advisers may compete with the Fund or any third- party manager with which the Fund invests for appropriate investment opportunities on behalf of their other Client Accounts. The results of the investment
activities of the Fund may differ materially from the results achieved by BlackRock Entities for other Client Accounts. BlackRock Entities may give advice and take action with respect to other Client Accounts that may compete or conflict with the
advice the Advisers may give to the Fund, including with respect to their view of the operations or activities of an investment, the return of an investment, the timing or nature of action relating to an investment or the method of exiting an
investment.
| • |
BlackRock Entities May Restrict Transactions for Themselves, but not for the Fund, or Vice Versa. BlackRock Entities and certain of their personnel, including the Advisers’ personnel or other
BlackRock Entity personnel advising or otherwise providing services to the Fund, may be in possession of information not available to all BlackRock Entity personnel, and such personnel may act on the basis of such information in ways that
have adverse effects on the Fund. The Fund could sustain losses during periods in which BlackRock Entities and other Client Accounts achieve significant profits.
|
| • |
Resolution of Conflicts. Any conflicts of interest that arise between the Fund or particular shareholders, on the one hand, and other Client Accounts or BlackRock Entities or affiliates thereof, on
the other hand, will be discussed and resolved on a case-by-case basis by business, legal and compliance officers of the Advisers and their affiliates, as applicable. Any such discussions will take into consideration the requirements of
applicable law and regulation, the interests of the relevant parties and the circumstances giving rise to the conflicts. Shareholders should be aware that conflicts will not necessarily be resolved in favor of the interests of the Fund or any
affected shareholder. There can be no assurance that any actual or potential conflicts of interest will not result in the Fund receiving less favorable investment or other terms with respect to investments, transactions or services than if
such conflicts of interest did not exist.
|
| • |
Potential Impact on the Fund. It is difficult to predict the circumstances under which one or more of the foregoing conflicts could become material, but it is possible that such relationships could
require the Fund to refrain from making all or a portion of any investment or a disposition in order for BlackRock to comply with its fiduciary duties, the 1940 Act, Investment Advisers Act of 1940, as amended (the “Advisers Act”) or other
applicable law. The Advisers may, under certain circumstances, seek to have conflicts or transactions involving conflicts approved in accordance with the governing agreements of the Fund. Copies of Part 2A of each of the Advisers’ Form ADV,
which includes additional detail regarding conflicts of interest that are relevant to BlackRock’s investment management business, are available at www.sec.gov and will be provided to current and prospective shareholders upon
request.
|
The foregoing list of potential and actual conflicts of interest does not purport to be a complete enumeration of the conflicts attendant to an investment in the Fund. Prospective investors should
consult with their independent advisors before deciding whether to invest in the Fund. In addition, as the Fund’s investment program develops and changes over time, an investment in the Fund may be subject to additional and different actual and
potential conflicts of interest.
See “Risk Factors –Our Advisers and their affiliates and employees may have certain conflicts of interest” for additional information about conflicts of interest that could impact the Fund.
Q: Are there any ERISA considerations in connection with an investment in our shares?
| A: |
We conduct and intend to continue to conduct our affairs so that our assets should not be deemed to constitute “plan assets” under the Employee Retirement Income Security Act of 1974, as amended (“ERISA”) and certain U.S. Department of
Labor regulations promulgated thereunder, as modified by Section 3(42) of ERISA (the “Plan Asset Regulations”). In this regard, until such time as all classes of the Common Shares are considered “publicly-offered securities” within the
meaning of the Plan Asset Regulations, the Fund intends to limit investment in our Common Shares so that holdings by “benefit plan investors” are not “significant” within the meaning of the Plan Asset Regulations (and as discussed further
below under “Restrictions on Share Ownership”).
|
In addition, each prospective investor that is, or is acting on behalf of any (i) “employee benefit plan” (within the meaning of Section 3(3) of ERISA) that is subject to Title I of ERISA, (ii)
“plan” described in Section 4975(e)(1) of the Code that is subject to Section 4975 of the Code (including, for example, an individual retirement account and a “Keogh” plan), (iii) plan, account or other arrangement that is subject to the provisions
of any other federal, state, local, non-U.S. or other laws or regulations that are similar to such provisions of ERISA or the Code (collectively, “Similar Laws”), or (iv) entity whose underlying assets are considered to include the assets of any of
the foregoing described in clauses (i), (ii) and (iii) (each of the foregoing described in clauses (i), (ii), (iii) and (iv) referred to as a “Plan”), must independently determine that our Common Shares are an appropriate investment for the Plan,
taking into account its obligations under ERISA, the Code and applicable Similar Laws, and the facts and circumstances of each investing Plan.
Prospective investors should carefully review the matters discussed under “Risk Factors” and “Restrictions on Share Ownership” and should consult with their own advisors as to the consequences of
making an investment in the Fund.
Q: What is the impact of being an “emerging growth company”?
| A: |
We are an “emerging growth company,” as defined by the JOBS Act. As an emerging growth company, we are eligible to take advantage of certain exemptions from various reporting and disclosure requirements that are applicable to public
companies that are not emerging growth companies. For so long as we remain an emerging growth company, we will not be required to:
|
| • |
have an auditor attestation report on our internal control over financial reporting pursuant to Section 404(b) of the Sarbanes-Oxley Act of 2002 (“Sarbanes-Oxley Act”);
|
| • |
submit certain executive compensation matters to shareholder advisory votes pursuant to the “say on frequency” and “say on pay” provisions (requiring a non-binding shareholder vote to approve compensation of certain executive officers) and
the “say on golden parachute” provisions (requiring a non-binding shareholder vote to approve golden parachute arrangements for certain executive officers in connection with mergers and certain other business combinations) of the Dodd-Frank
Wall Street Reform and Consumer Protection Act of 2010; or
|
| • |
disclose certain executive compensation related items, such as the correlation between executive compensation and performance and comparisons of the chief executive officer’s compensation to median employee compensation.
|
In addition, the JOBS Act provides that an emerging growth company may take advantage of an extended transition period for complying with new or revised accounting standards that have different
effective dates for public and private companies. This means that an emerging growth company can delay adopting certain accounting standards until such standards are otherwise applicable to private companies.
We will remain an emerging growth company for up to five years, or until the earliest of: (1) the last date of the fiscal year during which we had total annual gross revenues of $1.235 billion or
more; (2) the date on which we have, during the previous three-year period, issued more than $1 billion in non-convertible debt; or (3) the date on which we are deemed to be a “large accelerated filer” as defined under Rule 12b-2 under the Exchange
Act which will not be the case for so long as our Common Shares are not traded on a securities exchange.
We do not believe that being an emerging growth company will have a significant impact on our business or this offering. We have elected to opt in to the extended transition period for complying with
new or revised accounting standards available to emerging growth companies. Also, because we are not a large accelerated filer or an accelerated filer under Section 12b-2 of the Exchange Act, and will not be for so long as our Common Shares are not
traded on a securities exchange, we will not be subject to auditor attestation requirements of Section 404(b) of the Sarbanes-Oxley Act even once we are no longer an emerging growth company. In addition, so long as we are externally managed by the
Advisers and we do not directly compensate our executive officers, or reimburse the Advisers or their affiliates for the salaries, bonuses, benefits and severance payments for persons who also serve as one of our executive officers or as executive
officers of the Advisers, we do not expect to include disclosures relating to executive compensation in our periodic reports or proxy statements and, as a result, do not expect to be required to seek shareholder approval of executive compensation and
golden parachute compensation arrangements pursuant to Section 14A(a) and (b) of the Exchange Act.
Q: When will I get my detailed tax information?
| A: |
In the case of certain U.S. shareholders, we expect your IRS Form 1099-DIV tax information, if required, to be mailed by January 31 of each year.
|
Q: Who can help answer my questions?
| A: |
If you have more questions about this offering or if you would like additional copies of this prospectus, you should contact your financial adviser or our transfer agent: State Street Bank and Trust Company, at State Street Bank and
Trust Company, ATTN: BlackRock Alternative Funds, 1776 Heritage Drive, JAB3, North Quincy, MA 02171.
|
The following table is intended to assist you in understanding the costs and expenses that an investor in Common Shares will bear, directly or indirectly. Other expenses are estimated and may vary. Actual expenses may be greater or less than shown.
| Class S Shares | Class D Shares | Institutional Shares | ||||||||||
| Shareholder transaction expenses ( | ||||||||||||
| Maximum sales load(1) | | % | | % | | % | ||||||
| Maximum Early Repurchase Deduction(2) | | % | | % | | % | ||||||
| Class S Shares | Class D Shares | Institutional Shares | ||||||||||
| Annual expenses (as a percentage of net assets attributable to our Common Shares)(3) | ||||||||||||
| Base management fees(4) | | % | | % | | % | ||||||
| Incentive fees(5) | % | % | % | |||||||||
| Shareholder servicing and/or distribution fees(6) | | % | | % | | % | ||||||
| Interest payment on borrowed funds(7) | | % | | % | | % | ||||||
| Other expenses(8) | | % | | % | | % | ||||||
| Total annual expenses | % | % | % | |||||||||
| (1) | |
| (2) | |
| (3) | |
| (4) | |
| (5) | We may receive capital gains and investment income that could result in the payment of an incentive fee. For additional information please see “Advisory Agreement, Sub-Advisory Agreement and Administration Agreement-Advisory Agreement-Incentive Fee-Examples of Incentive Fee Calculation” in this Prospectus. The incentive fees, if any, are divided into two parts: |
| • |
The income component of the incentive fee will be the amount, if positive, equal to 12.5% of the aggregate net investment income before incentive compensation earned for the most recent calendar quarter and the preceding eleven calendar
quarters (or if shorter, the number of calendar quarters that have occurred since commencement of the Fund’s operations), less aggregate income incentive compensation previously paid with respect to the first eleven calendar quarters (or the
portion thereof) included in the relevant trailing twelve quarters.
|
The income component of the incentive fee is subject to a 5.0% total return hurdle on daily weighted average unreturned capital contributions (the “Hurdle Rate”). As such, the Fund will not be
obligated to pay any income incentive fee to the extent the annualized trailing twelve quarter (or if shorter, the number of calendar quarters that have occurred since the commencement of the fund) total return of the Fund (as defined below),
including net realized gains and losses and net unrealized appreciation and depreciation, does not exceed the Hurdle Rate. To the extent that the Fund’s annualized total return for the relevant period exceeds the Hurdle Rate, but is less than
5.714286% of daily weighted average unreturned capital contributions, the income incentive fee will be subject to a “catch up”, calculated as 100% of the aggregate net investment income before incentive compensation earned in excess of Hurdle Rate
for the relevant period. To the extent that the Fund’s annualized total return for the relevant period exceeds 5.714286%, the income component of the incentive fee will be equal to 12.5% of net investment income before incentive compensation earned
in excess of this total return threshold.
| • |
The capital gains component of the incentive fee will be the amount, if positive, equal to the lesser of (i) 12.5% of the aggregate realized capital gains (computed net of realized losses and net of unrealized capital depreciation, if any)
for the most recent calendar quarter and the preceding eleven calendar quarters (or if shorter, the number of calendar quarters that have occurred since commencement of the Fund’s operations), less capital gains incentive compensation
previously paid or distributed in respect of the first eleven calendar quarters (or the portion thereof) included in the relevant trailing twelve quarters or (ii) 12.5% of cumulative aggregate realized capital gains (computed net of realized
losses and net of unrealized capital depreciation, if any) since commencement of the Fund, less capital gains incentive compensation previously paid or distributed since commencement of the Fund. The capital gains component will be paid in
full prior to payment of the ordinary income component.
|
In any case, incentive compensation (including both the income and capital gains components) will only be paid to the extent the trailing twelve quarter (or if shorter, the number of calendar
quarters that have occurred since commencement of the fund) total return of the Fund after incentive compensation and including such payment would equal or exceed a 5% annual total return on daily weighted average unreturned contributed capital
contributions for such period.
The Investment Adviser has waived any portion of the income component of the incentive fee attributable to the inclusion of Expense Payments (as defined below) in the calculation of (i) aggregate net
investment income before incentive compensation or (ii) total return.
The table above reflects incentive fees based on income, if any. The incentive fee based on income of 1.20 % referenced in the table above is based on actual amounts of the income component of the incentive fee payable under the Advisory Agreement during the fiscal year ended December 31, 2025. As we cannot predict with certainty whether we will meet the necessary performance targets with respect to the capital gains component of the incentive fee, we have assumed no such fees for this table. If we were to achieve a total return of 5.0% in a calendar year made up of entirely realized capital gains net of all realized capital losses and unrealized capital depreciation, an incentive fee equal to 0.63% of our net assets would be payable. See “Advisory Agreement, Sub-Advisory Agreement and Administration Agreement-Advisory Agreement-Incentive Fee” for more information concerning the incentive fees.
| (6) | |
| (7) | |
| (8) | |
Example: We have provided an example of the projected dollar amount of total expenses that would be incurred over various periods with respect to a
hypothetical $1,000 investment in each class of our Common Shares. In calculating the following expense amounts, we have assumed that: (1) our annual operating expenses and offering expenses remain at the levels set forth in the table above, except
to reduce annual expenses upon completion of recoupment of organization and offering expenses, (2) the annual return before fees and expenses is 5.0%, (3) the net return after payment of fees and expenses is distributed to shareholders and reinvested
at NAV and (4) your financial intermediary does not directly charge you transaction or other fees.
Class S shares
| Return Assumption | 1 Year | 3 Years | 5 Years | 10 Years | ||||||||||||
| You would pay the following expenses on a $1,000 investment, assuming a 5.0% annual return from net investment income: | $ | | $ | | $ | | $ | | ||||||||
| Total expenses assuming a 5.0% annual return solely from net realized capital gains: | $ | | $ | | $ | | $ | | ||||||||
Class D shares
| Return Assumption | 1 Year | 3 Years | 5 Years | 10 Years | ||||||||||||
| You would pay the following expenses on a $1,000 investment, assuming a 5.0% annual return from net investment income: | $ | | $ | | $ | | $ | | ||||||||
| Total expenses assuming a 5.0% annual return solely from net realized capital gains: | $ | | $ | | $ | | $ | | ||||||||
Institutional shares
| Return Assumption | 1 Year | 3 Years | 5 Years | 10 Years | ||||||||||||
| You would pay the following expenses on a $1,000 investment, assuming a 5.0% annual return from net investment income: | $ | | $ | | $ | | $ | | ||||||||
| Total expenses assuming a 5.0% annual return solely from net realized capital gains: | $ | | $ | | $ | | $ | | ||||||||
While the examples assume a 5.0% annual return on investment before fees and expenses, our performance will vary and may result in an annual return that is greater or less than this. These
examples should not be considered a representation of your future expenses. If we achieve sufficient returns on our investments to trigger a quarterly incentive fee on income and/or if we achieve net realized capital gains in excess of
5.0%, both our returns to our shareholders and our expenses would be higher. See “Advisory Agreement, Sub-Advisory Agreement and Administration Agreement” for information concerning incentive fees.
Our internet address is www.bdebt.com. We make available free of charge on our website our annual report on Form 10-K, quarterly reports on Form 10-Q, current reports on Form 8-K, proxy statement and amendments to
those reports as soon as reasonably practicable after we electronically file such material with, or furnish it to, the SEC. This information will also be available on the SEC’s website at www.sec.gov.
The following tables of financial highlights is intended to help a prospective investor understand the Fund’s financial performance for the periods shown. The financial data set forth in the following tables as of and
for the year ended December 31, 2025, 2024 and 2023 and the period from March 18, 2022 (Inception) to December 31, 2022 have been derived from audited financial data. You should read these financial highlights in conjunction with our consolidated
financial statements and notes thereto and “Management’s Discussion and Analysis of Financial Condition and Results of Operations” included in this prospectus. The following tables of financial highlights is shown for Institutional shares, Class S
shares and Class D shares:
|
For the Year Ended December 31,
|
For the
Period from
March 18,
2022
(Inception) to
December 31,
|
|||||||||||||||||||||||||||||||
|
2025
|
2024(1)
|
2023
|
2022
|
|||||||||||||||||||||||||||||
|
Institutional
Class
|
Class S
|
Class D
|
Institutional
Class
|
Class S
|
Class D
|
Institutional
Class
|
Institutional
Class
|
|||||||||||||||||||||||||
|
Per Common Share
|
||||||||||||||||||||||||||||||||
|
Per share NAV at beginning of period
|
$
|
24.79
|
$
|
24.79
|
$
|
24.79
|
$
|
24.85
|
$
|
24.95
|
$
|
24.75
|
$
|
23.69
|
$
|
25.00
|
||||||||||||||||
|
Investment operations: (2)
|
||||||||||||||||||||||||||||||||
|
Net investment income before excise taxes
|
2.22
|
2.01
|
2.15
|
2.60
|
1.35
|
0.99
|
3.19
|
0.99
|
||||||||||||||||||||||||
|
Excise taxes
|
—
|
—
|
—
|
—
|
—
|
—
|
(0.01
|
)
|
—
|
|||||||||||||||||||||||
|
Net investment income
|
2.22
|
2.01
|
2.15
|
2.60
|
1.35
|
0.99
|
3.18
|
0.99
|
||||||||||||||||||||||||
|
Net realized and unrealized gain (loss)
|
(0.46
|
)
|
(0.46
|
)
|
(0.46
|
)
|
0.10
|
(0.04
|
)
|
0.15
|
0.85
|
(1.55
|
)
|
|||||||||||||||||||
|
Total from investment operations
|
1.75
|
1.55
|
1.69
|
2.70
|
1.31
|
1.14
|
4.03
|
(0.56
|
)
|
|||||||||||||||||||||||
|
Dividends to common shareholders
|
(2.60
|
)
|
(2.39
|
)
|
(2.53
|
)
|
(2.76
|
)
|
(1.47
|
)
|
(1.10
|
)
|
(2.87
|
)
|
(0.75
|
)
|
||||||||||||||||
|
Per share NAV at end of period
|
$
|
23.95
|
$
|
23.95
|
$
|
23.95
|
$
|
24.79
|
$
|
24.79
|
$
|
24.79
|
$
|
24.85
|
$
|
23.69
|
||||||||||||||||
|
Total return based on net asset value: (3)
|
7.10
|
%
|
6.25
|
%
|
6.82
|
%
|
10.87
|
%
|
5.25
|
%
|
4.61
|
%
|
17.01
|
%
|
(2.24
|
)%
|
||||||||||||||||
|
Shares outstanding at end of period
|
61,039,850
|
4,782,132
|
93,350
|
24,334,133
|
1,808,175
|
127,381
|
9,608,484
|
4,968,576
|
||||||||||||||||||||||||
|
Ratios to average net asset value: (4)
|
||||||||||||||||||||||||||||||||
|
Net investment income(5)
|
9.58
|
%
|
8.73
|
%
|
8.79
|
%
|
10.66
|
%
|
9.86
|
%
|
10.38
|
%
|
13.50
|
%
|
8.21
|
%
|
||||||||||||||||
|
Expenses before incentive fee (6)
|
5.16
|
%
|
6.19
|
%
|
5.96
|
%
|
5.89
|
%
|
5.84
|
%
|
5.24
|
%
|
6.70
|
%
|
7.80
|
%
|
||||||||||||||||
|
Expenses and incentive fee (7)(8)(9)
|
6.31
|
%
|
7.36
|
%
|
7.07
|
%
|
7.54
|
%
|
6.79
|
%
|
5.91
|
%
|
6.70
|
%
|
7.80
|
%
|
||||||||||||||||
|
Ending net asset value
|
$
|
1,461,960,470
|
$
|
114,536,454
|
$
|
2,235,823
|
$
|
603,211,729
|
$
|
44,822,335
|
$
|
3,157,610
|
$
|
238,804,026
|
$
|
117,685,277
|
||||||||||||||||
|
Weighted-average number of common shares
|
40,231,661
|
3,524,337
|
132,688
|
16,353,680
|
1,107,732
|
75,396
|
7,055,915
|
2,596,026
|
||||||||||||||||||||||||
|
Fund-Level Supplemental Data
|
||||||||||||||||||||||||||||||||
|
Portfolio turnover rate
|
24.53
|
%
|
22.89
|
%
|
23.13
|
%
|
4.23
|
%
|
||||||||||||||||||||||||
|
Weighted-average debt outstanding
|
$
|
637,922,451
|
$
|
201,243,169
|
$
|
110,172,603
|
$
|
45,242,215
|
||||||||||||||||||||||||
|
Weighted-average interest rate on debt
|
6.25
|
%
|
7.15
|
%
|
7.01
|
%
|
5.08
|
%
|
||||||||||||||||||||||||
|
Weighted-average debt per share
|
$
|
9.68
|
$
|
7.66
|
$
|
11.47
|
$
|
9.11
|
||||||||||||||||||||||||
| (1) |
Class S commenced operations on June 1, 2024 and Class D commenced operations on August 1, 2024.
|
| (2) |
Per share changes in net asset value are computed based on the actual number of shares outstanding during the time such activity occurred.
|
| (3) |
Not annualized for periods less than one year. Total return based on net asset value equals the change in net asset value per share during the period plus declared dividends per share during the period, divided by the beginning net asset
value per share at the beginning of the period.
|
| (4) |
Annualized for periods less than one year except for incentive fees and other certain non-recurring expenses, excluding the effect of management fee and incentive fee waivers by the Adviser which represented 3.18% of average net assets.
|
| (5) |
Net of incentive fees and excise taxes.
|
| (6) |
Includes interest and other debt costs but excludes excise taxes.
|
| (7) |
Includes incentive fees and all Fund expenses including interest and other debt costs but excludes excise taxes.
|
| (8) |
For the year ended December 31, 2025, amounts are annualized except for organizational costs, management fee and income based incentive fee waivers by the Investment Adviser. For the year ended December 31,
2025, the ratio of total operating expenses to average net assets was 7.50%, 8.49%, and 7.75% on Institutional Class, Class S and Class D respectively, on an annualized basis, excluding the effect of expense support/(recoupment) and income
based incentive fee waivers by the Investment Adviser which represented 1.19%, 1.13% and 0.68% on Institutional Class, Class S and Class D, respectively, of average net assets.
|
| (9) |
For the year ended December 31, 2023, the ratio of total operating expenses to average was 9.86% on Institutional Class, on an annualized basis, excluding the effect of management fee and income based incentive
fee waivers by the Investment Adviser which represented 3.18% on Institutional Class of average net assets.
|
SENIOR SECURITIES
Information about our senior securities is shown in the following table as of for each of the years ended December 31, 2025, 2024, 2023 and the period from March 18, 2022 (Inception) to December 31, 2022. This
information about our senior securities should be read in conjunction with our consolidated financial statements and related notes thereto and “Management’s Discussion and Analysis of Financial Condition and Results of Operations” included in this
prospectus.
| Class and Year | Total Amount Outstanding(1) | Asset Coverage Per Unit (2) | Involuntary Liquidating Preference Per Unit(3) | Average Market Value Per Unit(4) | ||||||||||||
| Credit Facility | ||||||||||||||||
| Fiscal year 2025 | $ | | $ | | | N/A | ||||||||||
| Fiscal year 2024 | $ | | $ | | | N/A | ||||||||||
| Fiscal year 2023 | $ | | $ | | | N/A | ||||||||||
| Fiscal year 2022 | $ | | $ | | | N/A | ||||||||||
| Revolving Credit Facility | ||||||||||||||||
| Fiscal year 2025 | $ | | $ | | | N/A | ||||||||||
| Fiscal year 2024 | | $ | | | N/A | |||||||||||
| SG Revolving Credit Facility | ||||||||||||||||
| Fiscal year 2025 | $ | | $ | | | N/A | ||||||||||
| Tranche A Notes | ||||||||||||||||
| Fiscal year 2025 | $ | | $ | | | N/A | ||||||||||
| Fiscal year 2024 | $ | | $ | | | N/A | ||||||||||
| Tranche B Notes | ||||||||||||||||
| Fiscal year 2025 | $ | | $ | | | N/A | ||||||||||
| Promissory Notes | ||||||||||||||||
| Fiscal year 2025 | $ | | $ | | | N/A | ||||||||||
| 2025A Tranche B Notes | ||||||||||||||||
| Fiscal year 2025 | $ | | $ | | | N/A | ||||||||||
| 2025A Tranche A Notes | ||||||||||||||||
| Fiscal year 2025 | $ | | $ | | | N/A | ||||||||||
| (1) | |
| (2) | |
| (3) | |
| (4) |
The Fund’s senior securities are not registered for public trading.
|
RISK FACTORS
Investing in our Common Shares involves a number of significant risks. The following information is a discussion of the material risk factors associated with an investment in our Common Shares
specifically, as well as those factors generally associated with an investment in a company with investment objectives, investment policies, capital structure or traders markets similar to ours. In addition to the other information contained in this
prospectus, you should consider carefully the following information before making an investment in our Common Shares. The risks set out below are not the only risks we face. Additional risks and uncertainties not presently known to us or not
presently deemed material by us may also impair our operations and performance. If any of the following events occur, our business, financial condition and results of operations could be materially and adversely affected. In such cases, the NAV of
our Common Shares could decline, and you may lose all or part of your investment in us.
Shareholders are dependent on the judgment and abilities of the Advisers.
Shareholders will have no authority to make decisions or to exercise business discretion on behalf of the Fund, and will not have the opportunity to evaluate fully for themselves the relevant economic, financial and
other information regarding the Fund’s investments. Accordingly, no potential purchaser of the Fund’s Common Shares should purchase such shares unless such purchaser is willing to entrust the management of the investments of the Fund to the Advisers.
The Fund’s performance will depend in large part upon the skill and expertise of the team of investment professionals managing the Fund’s portfolio. The future performance of the Fund depends on the continued service
of such persons. The departure of any of the investment professionals of the Advisers may have an adverse effect on the profits of the Fund.
The level of analytical sophistication, both financial and legal, necessary for successful investment in the Fund’s investments is unusually high.
There is no assurance that the Advisers will correctly judge the nature and magnitude of the many factors that could affect the prospects for successful Fund investments.
Investment analyses and decisions may be undertaken on an expedited basis in order for the Fund to take advantage of available investment opportunities. In such cases, the information available at the time of an
investment decision may be limited, and the Advisers may not have access to the detailed information necessary for a thorough evaluation of the investment opportunity. Further, the Advisers may have to conduct its due diligence activities over a very
brief period.
Our Common Shares will not be insured or guaranteed by any person or entity, and shareholders could experience a total loss of their investment.
Our Common Shares will not be insured or guaranteed by any person or entity. The Fund will have no substantial assets other than the Fund’s investments. In the event of the dissolution of the Fund or otherwise, if the
proceeds of the Fund’s assets are insufficient to repay capital contributions made to the Fund by the shareholders, no other assets will be available for the payment of any deficiency. Neither the Advisers nor their affiliates have any liability for
the repayment of capital contributions made to the Fund by the shareholders. Shareholders could experience a total loss of their investment in the Fund.
An investment in our shares will have limited liquidity.
No market exists for the Common Shares, and it is possible that none develops. Neither the Advisers, any placement agent nor any other person is under any obligation to make a market in the common shares of the Fund.
Consequently, a purchaser must be prepared to hold the shares for an indefinite period of time or until the termination of the Fund. In addition, the Common Shares are subject to certain transfer restrictions and can only be transferred to certain
transferees as described herein. Such restrictions on the transfer of the Common Shares may further limit the liquidity of the Common Shares.
Because our investments are generally not in publicly traded securities, there will be uncertainty regarding the value of our investments, which could adversely affect the
determination of our net asset value.
Our portfolio investments will generally not be in publicly traded securities. As a result, although we expect that some of our equity investments may trade on private secondary marketplaces, the fair value of our
direct investments in portfolio companies will often not be readily determinable. Under the 1940 Act, investments for which there are no readily available market quotations, including securities that while listed on a private securities exchange have
not actively traded, will be valued at fair value as determined using a consistently applied valuation process in accordance with our documented valuation policy that has been reviewed and approved by our Board of Trustees. The Valuation Designee
determines the value of our investments in accordance with such valuation policy. In connection with such determination, the Valuation Designee utilizes the services of an independent valuation firm, which prepares valuation reports on a quarterly
basis for most of our portfolio investments that are not publicly traded or for which we do not have readily available market quotations, including securities that while listed on a private securities exchange, have not actively traded. However, the
Valuation Designee retains ultimate authority as to the appropriate valuation of each such investment. The types of factors that the Valuation Designee takes into account in approving fair value with respect to such non-traded investments includes,
as relevant and, to the extent available, the portfolio company’s earnings, the markets in which the portfolio company does business, comparison to valuations of publicly traded companies, comparisons to recent sales of comparable companies, the
discounted value of the cash flows of the portfolio company and other relevant factors. This information may not be available because it is difficult to obtain financial and other information with respect to private companies, and even where we are
able to obtain such information, there can be no assurance that it is complete or accurate. Because such valuations are inherently uncertain and may be based on estimates, our determinations of fair value may differ materially from the values that
would be assessed if a readily available market for these securities existed. Due to this uncertainty, our fair value determinations with respect to any non-traded investments we hold may cause our net asset value on a given date to materially
understate or overstate the value that we may ultimately realize on one or more of our investments. As a result, investors purchasing our Common Shares based on an overstated net asset value may pay a higher market price than the value of our
investments might warrant. Conversely, investors tendering Common Shares based on a net asset value that understates the value of our investments may receive a lower market price for their tendered Common Shares than the value of our investments
might warrant.
As a public company, we are subject to regulations not applicable to private companies, such as provisions of the Sarbanes-Oxley Act. Efforts to comply with such regulations will
involve significant expenditures, and non-compliance with such regulations may adversely affect us.
As a public company, we are subject to the Sarbanes-Oxley Act and the related rules and regulations promulgated by the SEC. Our management is required to report on our internal control over financial reporting pursuant
to Section 404 of the Sarbanes-Oxley Act. We are required to review on an annual basis our internal control over financial reporting, and on a quarterly and annual basis to evaluate and disclose changes in our internal control over financial
reporting. Developing and maintaining an effective system of internal controls may require significant expenditures, which may negatively impact our financial performance and our ability to make distributions. This process also will result in a
diversion of our management’s time and attention. We cannot be certain of when our evaluation, testing and remediation actions will be completed or the impact of the same on our operations. In addition, we may be unable to ensure that the process is
effective or that our internal controls over financial reporting are or will be effective in a timely manner. In the event that we are unable to develop or maintain an effective system of internal controls and maintain or achieve compliance with the
Sarbanes-Oxley Act and related rules, we may be adversely affected.
Our independent registered public accounting firm will not be formally required to attest to the effectiveness of our internal control over financial reporting until there is a public market for our shares, which is
not expected to occur.
A BlackRock credit event could adversely affect our business.
Although the Fund and the Advisers are separate legal entities from BlackRock, in the event that BlackRock were to experience material financial distress or a downgrade in its credit rating, or if there were a change
of control of BlackRock, the Fund could nonetheless be adversely affected. In that regard, financial distress, a credit rating downgrade or change of control of BlackRock or the Advisers could cause the Advisers to have difficulty retaining personnel
or otherwise adversely affect the Fund and its ability to achieve its investment objective. Such an event may also cause a default with respect to indebtedness incurred by the Fund.
Shareholders will not have any direct interest in our investments.
The offering of Common Shares does not constitute a direct or indirect offering of interests in the Fund’s investments. Shareholders will have no direct interest in the Fund’s investments and generally will have no
voting rights in, or standing or recourse against, any of the Fund’s investments. Moreover, none of the shareholders will have the right to participate in the control, management or operations of any of the Fund’s investments, or have any discretion
over the management of any of the Fund’s investments by reason of their investment in the Fund.
We are an “emerging growth company” under the JOBS Act, and we cannot be certain if the reduced disclosure requirements applicable to emerging growth companies will make our
shares less attractive to investors.
The Fund will be and will remain an “emerging growth company” as defined in the JOBS Act until the earlier of (a) the last day of the fiscal year (i) in which the Fund has total annual gross revenue of at least $1.235
billion, or (ii) in which the Fund is deemed to be a large accelerated filer, and (b) the date on which the Fund issued more than $1.0 billion in non- convertible debt during the prior three- year period. For so long as the Fund remains an “emerging
growth company,” we may take advantage of certain exemptions from various reporting requirements that are applicable to other public companies that are not “emerging growth companies” including, but not limited to, not being required to comply with
the auditor attestation requirements of Section 404 of the Sarbanes-Oxley Act. The Fund cannot predict if investors will find the Fund’s shares less attractive because the Fund will rely on some or all of these exemptions. If some investors find the
Fund’s shares less attractive as a result, there may be a less active trading market for the Fund’s shares and the Fund’s share price may be more volatile.
In addition, Section 107 of the JOBS Act also provides that an “emerging growth company” can take advantage of the extended transition period provided in Section 7(a)(2)(B) of the Securities Act for complying with new
or revised accounting standards. In other words, an “emerging growth company” can delay the adoption of certain accounting standards until those standards would otherwise apply to private companies. The Fund will take advantage of the extended
transition period for complying with new or revised accounting standards, which may make it more difficult for investors and securities analysts to evaluate the Fund since our financial statements may not be comparable to companies that comply with
public company effective dates and may result in less investor confidence.
Our investments in prospective portfolio companies may be risky, and we could lose all or part of our investment.
General. The Fund’s investments may be risky, and shareholders could lose all or part of their investment. The Advisers will have broad discretion in making investments for the
Fund. The Fund’s investments will generally consist of debt obligations and other securities and assets that present significant risks as a result of business, financial, market and legal uncertainties. There can be no assurance that the Advisers
will correctly evaluate the nature and magnitude of the various factors that could affect the value of and return on the Fund’s investments. Prices of the Fund’s investments may be volatile, and a variety of other factors that are inherently
difficult to predict, such as domestic or international economic and political developments, may significantly affect the results of the Fund’s activities and the value of the Fund’s investments. The Fund’s performance over a particular period may
not necessarily be indicative of the results that may be expected in future periods. Similarly, the past performance of the Advisers and its affiliates may not necessarily be indicative of the results the Advisers may be able to achieve with the
Fund’s investments. While the Advisers expect to focus primarily on privately-originated, performing senior secured debt primarily in issuers headquartered in North America in making its investments, the Advisers have broad discretion to invest as
they determine, consistent with the investment objective of the Fund, and no shareholder approval is required for any investment the Fund may make. Furthermore, the Advisers may invest in products or use investment techniques not specifically
described in this Registration Statement, including in financial instruments that have not yet been designed or have not yet become prevalent in the market. Any such instruments or techniques may subject the Fund to additional risks. Investors will
not be notified prior to the Fund’s making any investments in products or using investment techniques not specifically described in this Registration Statement; however, the Board of Trustees, in exercising its fiduciary duties to shareholders and to
the Fund, will oversee these investments at a heightened level. In addition, because the Fund’s investments will be actively managed, frequent purchases and sales of investments may result in higher transaction costs to the Fund, which costs will
decrease the value of the common shares of the Fund.
Secured Loans Risk. Loans held by the Fund may be secured. While secured loans purchased by the Fund will often intend to be over-collateralized, the Fund may be exposed to
losses resulting from default and foreclosure. Therefore, the value of the underlying collateral, the creditworthiness of the borrower and the priority of the lien are each of great importance. The Fund cannot guarantee the adequacy of the protection
of the Fund’s interests, including the validity or enforceability of the loan and the maintenance of the anticipated priority and perfection of the applicable security interests. Furthermore, the Fund cannot assure that claims may not be asserted
that might interfere with enforcement of the Fund’s rights. In the event of a foreclosure, the Fund or an affiliate of the Fund may assume direct ownership of the underlying asset. The liquidation proceeds upon sale of such asset may not satisfy the
entire outstanding balance of principal and interest on the loan, resulting in a loss to the Fund. Any costs or delays involved in the effectuation of a foreclosure of the loan or a liquidation of the underlying property will further reduce the
proceeds and thus increase the loss.
Unsecured Loans Risk. While the Fund is expected to focus primarily on secured loans, the Fund may hold unsecured loans. Unsecured loans have lower priority in right of payment
to any higher ranking obligations of the borrower and are not backed by a security interest in any specific collateral. They are subject to risk that the cash flow of the borrower and available assets may be insufficient to meet scheduled payments
after giving effect to any higher ranking obligations of the borrower. Unsecured loans are expected to have greater price volatility than senior loans and secured loans and may be less liquid. There is also a possibility that originators will not be
able to sell participations in unsecured loans, which would create greater credit risk exposure.
Second Lien Loans Risk. Second lien loans are subject to the same risks associated with investment in senior loans. However, second lien loans are second in right of payment to
senior loans and therefore are subject to additional risk that the cash flow of the borrower and any property securing the loan may be insufficient to meet scheduled payments after giving effect to the senior secured obligations of the borrower.
Second lien loans are expected to have greater price volatility than senior loans and may be less liquid. There is also a possibility that originators will not be able to sell participations in second lien loans, which would create greater credit
risk exposure. In the event of default on a “second lien” loan, the first priority lien holder has first claim to the underlying collateral of the loan. It is possible that no collateral value would remain for the second priority lien holder, which
would therefore result in a loss of investment to the Fund.
Borrower Fraud. Of paramount concern when investing in loans is the possibility of material misrepresentation or omission on the part of borrower. Such inaccuracy or
incompleteness may adversely affect, among other things, the valuation of the collateral underlying the loans or may adversely affect the ability of the Fund to perfect or effectuate a lien on the collateral securing the loan. The Fund will rely upon
the accuracy and completeness of representations made by borrowers to the extent reasonable, but cannot guarantee such accuracy or completeness. While the Fund will conduct due diligence with respect to the collateral before investing, including
obtaining appraisals of inventory values from independent sources, and will seek to obtain appropriate monitoring rights, there can be no assurance that the Advisers will detect representational borrower fraud or inaccuracy or that the Fund’s
investments will not be adversely affected by such fraud or inaccuracy.
Equity Securities. The Fund will also be permitted to invest in common and preferred stock and other equity securities, including both public and private equity securities.
Equity securities generally involve a high degree of risk and will be subordinate to the debt securities and other indebtedness of the issuers of such equity securities. Prices of equity securities generally fluctuate more than prices of debt
securities and are more likely to be affected by poor economic or market conditions. In some cases, the issuers of such equity securities may be highly leveraged or subject to other risks such as limited product lines, markets or financial resources.
In addition, some of these equity securities may be illiquid. Because of perceived or actual illiquidity or investor concerns regarding leveraged capitalization, these securities often trade at significant discounts to otherwise comparable
investments or are not readily tradable. These securities generally do not produce current income for the Fund and may also be speculative. The Fund may experience a substantial or complete loss on individual equity securities.
Preferred Stock Risk. To the extent that the Fund invests in preferred securities, there are special risks, including:
Deferral. Preferred securities may include provisions that permit the issuer, at its discretion, to defer distributions for a stated period without any adverse consequences to
the issuer. If the Fund owns a preferred security that is deferring its distributions, the Fund may be required to report income for tax purposes although the Fund has not yet received such income.
Subordination. Preferred securities are subordinated to bonds and other debt instruments in a company’s capital structure in terms of priority to corporate income and liquidation
payments, and therefore will be subject to greater credit risk than more senior debt instruments.
Liquidity. Preferred securities may be substantially less liquid than many other securities, such as common stocks or U.S. Government securities.
Limited Voting Rights. Generally, preferred security holders have no voting rights with respect to the issuing company unless preferred dividends have been in arrears for a
specified number of periods, at which time the preferred security holders may elect a number of directors to the issuer’s board. Generally, once all the arrearages have been paid, the preferred security holders no longer have voting rights.
Mezzanine Investments. Mezzanine investments of the type in which the Fund intends to invest are primarily privately negotiated subordinated debt and equity securities issued in
connection with leveraged transactions, such as management buyouts, acquisitions, refinancings, recapitalizations and later stage growth capital financings, and are generally rated below investment-grade. Mezzanine investments may also include
investments with equity participation features such as warrants, convertible securities, senior equity investments and common stock. Such mezzanine investments may be issued with or without registration rights. Mezzanine investments may be subject to
risks associated with illiquid investments, since there will usually be relatively few holders of any particular mezzanine investment. Similar to other high yield securities, maturities of mezzanine investments are typically seven to ten years, but
the expected average life is significantly shorter at three to five years due to prepayment rights. Mezzanine investments are usually unsecured and subordinate to other obligations of the issuer. Mezzanine investments share all of the risks of other
high yield securities and are often even more subordinated than other high yield debt, as they often represent the most junior debt security in an issuer’s capital structure.
Risks Associated with Investments in Small to Medium Capitalization Companies. The Fund may invest a portion of its assets in the securities of companies with small-to
medium-sized market capitalizations. While the Investment Adviser believes these investments often provide significant potential for appreciation, those securities, particularly smaller-capitalization securities, involve higher risks in some respects
than do investments in securities of larger companies, including:
| • |
these companies may have limited financial resources and may be unable to meet their obligations under their debt securities that we hold, which may be accompanied by a deterioration in the value of any collateral;
|
| • |
they typically have shorter operating histories, narrower product lines and smaller market shares than larger businesses, which tend to render them more vulnerable to competitors’ actions and market conditions, as well as general economic
downturns;
|
| • |
they are more likely to depend on the management talents and efforts of a small group of persons; therefore, the death, disability, resignation or termination of one or more of these persons could have a material adverse impact on the
portfolio company and, in turn, on us;
|
| • |
they generally have less predictable operating results, may from time to time be parties to litigation, may be engaged in rapidly changing businesses with products subject to a substantial risk of obsolescence, and may require substantial
additional capital to support their operations, finance expansion or maintain their competitive position;
|
| • |
our executive officers, directors and the Investment Adviser may, in the ordinary course of business, be named as defendants in litigation arising from our investments in the portfolio companies;
|
| • |
changes in laws and regulations, as well as their interpretations, may adversely affect their respective businesses, financial structures or prospects; and
|
| • |
they may have difficulty accessing the capital markets to meet future capital needs.
|
Limited public information exists about private middle market companies, and we expect to rely on the Investment Adviser’s investment professionals to obtain adequate information to evaluate the potential returns from
investing in these companies. These companies and their financial information are not subject to the Sarbanes-Oxley Act of 2002 and other rules that govern disclosures and financial controls of public companies. If we are unable to uncover all
material information about these companies, we may not make a fully informed investment decision, and we may lose money on our investment.
Risks Associated with Investments in the Medium- and Large-Sized U.S. Corporate Debt Market. Price declines in the medium- and large-sized U.S. corporate debt market may
adversely affect the fair value of the Fund’s portfolio, reducing our NAV through increased net unrealized depreciation. Conditions in the medium- and large-sized U.S. corporate debt market may deteriorate, as seen during the financial crisis of
2007-2009, which may cause pricing levels to similarly decline or be volatile. During the financial crisis, many institutions were forced to raise cash by selling their interests in performing assets in order to satisfy margin requirements or the
equivalent of margin requirements imposed by their lenders and/or, in the case of hedge funds and other investment vehicles, to satisfy widespread redemption requests. This resulted in a forced deleveraging cycle of price declines, compulsory sales
and further price declines, with falling underlying credit values, and other constraints resulting from the credit crisis generating further selling pressure. If similar events occurred in the medium- and large-sized U.S. corporate debt market, the
Fund’s NAV could decline through an increase in unrealized depreciation and incurrence of realized losses in connection with the sale of our investments, which could have a material adverse impact on the Fund’s business, financial condition and
results of operations.
Below Investment Grade Risk. In addition, the Fund intends to invest in securities that are rated below investment grade by rating agencies or that would be rated below
investment grade if they were rated. Below investment grade securities, which are often referred to as “junk,” have predominantly speculative characteristics with respect to the issuer’s capacity to pay interest and repay principal. They may also be
difficult to value and illiquid. The major risks of below investment grade securities include:
| • |
Below investment grade securities may be issued by less creditworthy issuers. Issuers of below investment grade securities may have a larger amount of outstanding debt relative to their assets than issuers of investment grade securities.
In the event of an issuer’s bankruptcy, claims of other creditors may have priority over the claims of holders of below investment grade securities, leaving few or no assets available to repay holders of below investment grade securities.
|
| • |
Prices of below investment grade securities are subject to extreme price fluctuations. Adverse changes in an issuer’s industry and general economic conditions may have a greater impact on the prices of below investment grade securities
than on other higher-rated fixed-income securities.
|
| • |
Issuers of below investment grade securities may be unable to meet their interest or principal payment obligations because of an economic downturn, specific issuer developments or the unavailability of additional financing.
|
| • |
Below investment grade securities frequently have redemption features that permit an issuer to repurchase the security from us before it matures. If the issuer redeems below investment grade securities, we may have to invest the proceeds
in securities with lower yields and may lose income.
|
| • |
Below investment grade securities may be less liquid than higher-rated fixed-income securities, even under normal economic conditions. There are fewer dealers in the below investment grade securities market, and there may be significant
differences in the prices quoted by the dealers. Judgment may play a greater role in valuing these securities and we may be unable to sell these securities at an advantageous time or price.
|
| • |
We may incur expenses to the extent necessary to seek recovery upon default or to negotiate new terms with a defaulting issuer.
|
The credit rating of a high-yield security does not necessarily address its market value risk. Ratings and market value may change from time to time, positively or negatively, to reflect new developments regarding the
issuer.
Undervalued Assets. The Fund will seek to invest in undervalued assets. The identification of investment opportunities in undervalued assets is a difficult task, and there is no
assurance that such opportunities will be successfully recognized or acquired. While investments in undervalued assets offer the opportunity for above-average capital appreciation, these investments involve a high degree of financial risk and can
result in substantial losses. The Fund may be forced to sell, at a substantial loss, assets identified as undervalued, if they are not in fact undervalued. In addition, the Fund may be required to hold such assets for a substantial period of time
before realizing their anticipated value. During this period, a portion of the Fund’s capital would be committed to these assets purchased, potentially preventing the Fund from investing in other opportunities.
CLO Risk. The Fund’s investments in CLOs may be riskier than a direct investment in the debt or other securities of the underlying companies. When investing in CLOs, the Fund
may invest in any level of a CLO’s subordination chain, including subordinated (lower-rated) tranches and residual interests (the lowest tranche). CLOs are typically highly levered and therefore, the junior debt and equity tranches that we may invest
in are subject to a higher risk of total loss and deferral or nonpayment of interest than the more senior tranches to which they are subordinated. In addition, the Fund will generally have the right to receive payments only from the CLOs, and will
generally not have direct rights against the underlying borrowers or entities that sponsored the CLOs. Furthermore, the investments the Fund makes in CLOs are at times thinly traded or have only a limited trading market. As a result, investments in
such CLOs may be characterized as illiquid securities.
Bridge Financings Risk. From time to time, the Fund may lend to portfolio companies on a short-term, unsecured basis or otherwise invest on an interim basis in portfolio
companies in anticipation of a future issuance of equity or long-term debt securities or other refinancing or syndication. Such bridge loans would typically be convertible into a more permanent, long-term security; however, for reasons not always in
the Fund’s control, such long-term securities issuance or other refinancing or syndication may not occur and such bridge loans and interim investments may remain outstanding. In such event, the interest rate on such loans or the terms of such interim
investments may not adequately reflect the risk associated with the position taken by the Fund.
Private Investments Risk. The Fund intends to invest primarily in privately-held companies. Investments in private companies pose significantly greater risks than investments in
public companies. First, private companies have reduced access to the capital markets, resulting in diminished capital resources and the ability to withstand financial distress. Second, the depth and breadth of experience of management in private
companies tends to be less than that at public companies, which makes such companies more likely to depend on the management talents and efforts of a smaller group of persons and/or persons with less depth and breadth of experience. Therefore, the
decisions made by such management teams and/or the death, disability, resignation or termination of one or more of these persons could have a material adverse impact on our investments and, in turn, on the Fund. Third, the investments themselves tend
to be less liquid. As such, we may have difficulty exiting an investment promptly or at a desired price prior to maturity or outside of a normal amortization schedule. As a result, the relative lack of liquidity and the potential diminished capital
resources of our target portfolio companies may affect our investment returns. Fourth, little public information generally exists about private companies. Further, these companies may not have third-party debt ratings or audited financial statements.
We must therefore rely on the ability of the Investment Adviser to obtain adequate information through due diligence to evaluate the creditworthiness and potential returns from investing in these companies. The Investment Adviser would typically
assess an investment in a portfolio company based on the Investment Adviser’s estimate of the portfolio company’s earnings and enterprise value, among other things, and these estimates may be based on limited information and may otherwise be
inaccurate, causing the Investment Adviser to make different investment decisions than it may have made with more complete information. These companies and their financial information will generally not be subject to the Sarbanes-Oxley Act and other
rules that govern public companies. If the Fund unable to uncover all material information about these companies, we may not make a fully informed investment decision, and we may lose money on our investments.
Risks Associated with Repurchase Agreements. Subject to the Fund’s investment objective and policies, the Fund may invest in repurchase agreements as a buyer for investment
purposes. Repurchase agreements typically involve the acquisition by the Fund of debt securities from a selling financial institution such as a bank, savings and loan association or broker-dealer. The agreement provides that the Fund will sell the
securities back to the institution at a fixed time in the future for the purchase price plus premium (which often reflects the interests). The Fund does not bear the risk of a decline in the value of the underlying security unless the seller defaults
under its repurchase obligation. In the event of the bankruptcy or other default of a seller of a repurchase agreement, the Fund could experience both delays in liquidating the underlying securities and losses, including (1) possible decline in the
value of the underlying security during the period in which the Fund seeks to enforce its rights thereto; (2) possible lack of access to income on the underlying security during this period; and (3) expenses of enforcing its rights. In addition, as
described above, the value of the collateral underlying the repurchase agreement will be at least equal to the repurchase price, including any accrued interest earned on the repurchase agreement. In the event of a default or bankruptcy by a selling
financial institution, the Fund generally will seek to liquidate such collateral. However, the exercise of the Fund’s right to liquidate such collateral could involve certain costs or delays and, to the extent that proceeds from any sale upon a
default of the obligation to repurchase were less than the repurchase price, the Fund could suffer a loss.
Risks Associated with Securities Lending Agreements. The Fund may from time to time make secured loans of its marginable securities to brokers, dealers and other financial
institutions if our asset coverage, as defined in the 1940 Act, would at least equal 150% immediately after each such loan. The risks in lending portfolio securities, as with other extensions of credit, consist of possible delay in recovery of the
securities or possible loss of rights in the collateral should the borrower fail financially. However, such loans will be made only to brokers and other financial institutions that are believed by the Investment Adviser to be of high credit standing.
Securities loans are made to broker-dealers pursuant to agreements requiring that loans be continuously secured by collateral consisting of U.S. government securities, cash or cash equivalents (e.g., negotiable certificates of deposit, bankers’
acceptances or letters of credit) maintained on a daily mark-to-market basis in an amount at least equal at all times to the market value of the securities lent. If the Fund enters into a securities lending arrangement, the Investment Adviser, as
part of its responsibilities under the Advisory Agreement, will invest the Fund’s cash collateral in accordance with the Fund’s investment objective and strategies. The Fund will pay the borrower of the securities a fee based on the amount of the
cash collateral posted in connection with the securities lending program. The borrower will pay to the Fund, as the lender, an amount equal to any dividends or interest received on the securities lent.
The Fund may invest the cash collateral received only in accordance with its investment objective, subject to the Fund’s agreement with the borrower of the securities. In the case of cash collateral, the Fund expects
to pay a rebate to the borrower. The reinvestment of cash collateral will result in a form of effective leverage for the Fund.
Although voting rights or rights to consent with respect to the loaned securities pass to the borrower, the Fund, as the lender, will retain the right to call the loans and obtain the return of the securities loaned at
any time on reasonable notice, and it will do so in order that the securities may be voted by the Fund if the holders of such securities are asked to vote upon or consent to matters materially affecting the investment. The Fund may also call such
loans in order to sell the securities involved. When engaged in securities lending, the Fund’s performance will continue to reflect changes in the value of the securities loaned and will also reflect the receipt of interest through investment of cash
collateral by the Fund in permissible investments.
Distressed Debt Securities Risk. At times, distressed debt obligations may not produce income and may require us to bear certain extraordinary expenses (including legal,
accounting, valuation and transaction expenses) in order to protect and recover our investment. Therefore, to the extent we invest in distressed debt, our ability to achieve current income for our shareholders may be diminished. We also will be
subject to significant uncertainty as to when and in what manner and for what value the distressed debt we invest in will eventually be satisfied (e.g., through a liquidation of the obligor’s assets, an exchange offer or plan of reorganization
involving the distressed debt securities or a payment of some amount in satisfaction of the obligation). In addition, even if an exchange offer is made or plan of reorganization is adopted with respect to distressed debt we hold, there can be no
assurance that the securities or other assets received by us in connection with such exchange offer or plan of reorganization will not have a lower value or income potential than may have been anticipated when the investment was made. Moreover, any
securities received by us upon completion of an exchange offer or plan of reorganization may be restricted as to resale. As a result of our participation in negotiations with respect to any exchange offer or plan of reorganization with respect to an
issuer of distressed debt, we may be restricted from disposing of such securities.
Payment-in-kind Interest Risk. Our loans may contain a payment-in-kind, or “PIK”, interest provision. PIK investments carry additional risk as holders of these types of
securities receive no cash until the cash payment date unless a portion of such securities is sold. If the issuer defaults the Fund may obtain no return on its investment. The PIK interest, computed at the contractual rate specified in each loan
agreement, is added to the principal balance of the loan and recorded as interest income. To avoid the imposition of corporate- level tax on us, this non-cash source of income needs to be paid out to shareholders in cash distributions or, in the
event that we determine to do so and in certain cases, in shares of our common stock, even though we have not yet collected and may never collect the cash relating to the PIK interest. As a result, we may have to distribute a taxable stock dividend
to account for PIK interest even though we have not yet collected the cash.
We may from time to time enter into credit default swaps or other derivative transactions which expose us to certain risks, including credit risk, market risk, counterparty risk
and other risks similar to those associated with the use of leverage.
We may from time to time enter into credit default swaps or other derivative transactions that seek to modify or replace the investment performance of a particular reference security or other asset. These transactions
are typically individually negotiated, non-standardized agreements between two parties to exchange payments, with payments generally calculated by reference to a notional amount or quantity. Swap contracts and similar derivative contracts are not
traded on exchanges; rather, banks and dealers act as principals in these markets. These investments may present risks in excess of those resulting from the referenced security or other asset. Because these transactions are not an acquisition of the
referenced security or other asset itself, the investor has no right directly to enforce compliance with the terms of the referenced security or other asset and has no voting or other consensual rights of ownership with respect to the referenced
security or other asset. In the event of insolvency of a counterparty, we will be treated as a general creditor of the counterparty and will have no claim of title with respect to the referenced security or other asset.
A credit default swap is a contract in which one party buys or sells protection against a credit event with respect to an issuer, such as an issuer’s failure to make timely payments of interest or principal on its debt
obligations, bankruptcy or restructuring during a specified period. Generally, if we sell credit protection using a credit default swap, we will receive fixed payments from the swap counterparty and if a credit event occurs with respect to the
applicable issuer, we will pay the swap counterparty par for the issuer’s defaulted debt securities and the swap counterparty will deliver the defaulted debt securities to us. Generally, if we buy credit protection using a credit default swap, we
will make fixed payments to the counterparty and if a credit event occurs with respect to the applicable issuer, we will deliver the issuer’s defaulted securities underlying the swap to the swap counterparty and the counterparty will pay us par for
the defaulted securities. Alternatively, a credit default swap may be cash settled and the buyer of protection would receive the difference between the par value and the market value of the issuer’s defaulted debt securities from the seller of
protection.
Credit default swaps are subject to the credit risk of the underlying issuer. If we are selling credit protection, there is a risk that we will not properly assess the risk of the underlying issuer, a credit event will
occur and we will have to pay the counterparty. If we are buying credit protection, there is a risk that we will not properly assess the risk of the underlying issuer, no credit event will occur and we will receive no benefit for the premium paid.
The success of our hedging transactions will depend on our ability to correctly predict movements and interest rates. Therefore, while we may enter into such transactions to seek to reduce interest rate risks, unanticipated changes in interest rates
may result in poorer overall investment performance than if we had not engaged in any such hedging transactions. In addition, the degree of correlation between price movements of the instruments used in a hedging strategy and price movements in the
portfolio positions being hedged may vary. Moreover, for a variety of reasons, we may not seek to establish a perfect correlation between such hedging instruments and the portfolio holdings or debt arrangements being hedged. Any such imperfect
correlation may prevent us from achieving the intended hedge and expose us to risk of loss.
A derivative transaction is also subject to the risk that a counterparty will default on its payment obligations thereunder or that we will not be able to meet our obligations to the counterparty. In some cases, we may
post collateral to secure our obligations to the counterparty, and we may be required to post additional collateral upon the occurrence of certain events such as a decrease in the value of the reference security or other asset. In some cases, the
counterparty may not collateralize any of its obligations to us. Derivative investments effectively add leverage to a portfolio by providing investment exposure to a security or market without owning or taking physical custody of such security or
investing directly in such market. In addition to the risks described above, such arrangements are subject to risks similar to those associated with the use of leverage.
We may form one or more CLOs, which may subject us to certain structured financing risks.
To finance investments, the Fund may securitize certain of its secured loans or other investments, including through the formation of one or more CLOs, while retaining all or most of the exposure to the performance of
these investments. This would involve contributing a pool of assets to a special purpose entity, and selling debt interests in such entity on a non- recourse or limited-recourse basis to purchasers. It is possible that an interest in any such CLO
held by us may be considered a “non-qualifying” portfolio investment for purposes of the 1940 Act.
If the Fund creates a CLO, the Fund will depend in part on distributions from the CLO’s assets out of its earnings and cash flows to enable the Fund to make distributions to shareholders. The ability of a CLO to make
distributions will be subject to various limitations, including the terms and covenants of the debt it issues. Also, a CLO may take actions that delay distributions in order to preserve ratings and to keep the cost of present and future financings
lower or the CLO may be obligated to retain cash or other assets to satisfy over-collateralization requirements commonly provided for holders of the CLO’s debt, which could impact our ability to receive distributions from the CLO. If the Fund does
not receive cash flow from any such CLO that is necessary to satisfy the annual distribution requirement for maintaining RIC status, and the Fund is unable to obtain cash from other sources necessary to satisfy this requirement, the Fund may not
maintain our qualification as a RIC, which would have a material adverse effect on an investment in the shares.
In addition, a decline in the credit quality of loans in a CLO due to poor operating results of the relevant borrower, declines in the value of loan collateral or increases in defaults, among other things, may force a
CLO to sell certain assets at a loss, reducing their earnings and, in turn, cash potentially available for distribution to the Fund for distribution to shareholders. To the extent that any losses are incurred by the CLO in respect of any collateral,
such losses will be borne first by the Fund as owner of equity interests in the CLO.
The manager for a CLO that the Fund creates may be the Fund, the Investment Adviser or an affiliate, and such manager may be entitled to receive compensation for structuring and/or management services. To the extent
the Investment Adviser or an affiliate other than the Fund serves as manager and the Fund is obligated to compensate the Investment Adviser or the affiliate for such services, the Fund, the Investment Adviser or the affiliate will implement
offsetting arrangements to assure that the Fund, and indirectly, Fund shareholders, pay no additional management fees to the Investment Adviser or the affiliate in connection therewith. To the extent the Fund serves as manager, the Fund will waive
any right to receive fees for such services from the Fund (and indirectly its shareholders) or any affiliate.
Debt obligations are subject to credit and interest rate risks which may adversely affect the performance of our investments.
Debt portfolios are subject to credit and interest rate risks. “Credit risk” refers to the likelihood that an issuer will default in the payment of principal and/or interest on an instrument. Financial strength and
solvency of an issuer are the primary factors influencing credit risk. In addition, lack or inadequacy of collateral or credit enhancement for a debt instrument may affect its credit risk. Credit risk may change over the life of an instrument, and
debt obligations which are rated by rating agencies are often reviewed by such agencies and may be subject to downgrade.
“Interest rate risk” refers to the risks associated with market changes in interest rates. Interest rate changes may affect the value of a debt instrument indirectly (especially in the case of fixed rate securities)
and directly (especially in the case of instruments whose rates are adjustable). General interest rate fluctuations may have a substantial negative impact on the Fund’s investments, the value of the Fund’s common shares and the Fund’s rate of return
on invested capital.
An increase in interest rates could decrease the value of any investments held by the Fund that earn fixed interest rates, including subordinated loans, senior and junior secured and unsecured debt securities and loans
and high-yield bonds, and also could increase the Fund’s interest expense, thereby decreasing its net income. In general, rising interest rates will negatively impact the price of a fixed rate debt instrument and falling interest rates will have a
positive effect on price. Adjustable rate instruments also react to interest rate changes in a similar manner although generally to a lesser degree (depending, however, on the characteristics of the reset terms, including the index chosen, frequency
of reset and reset caps or floors, among other factors). This risk will be greater for long-term securities than for short-term securities. Interest rate sensitivity is generally more pronounced and less predictable in instruments with uncertain
payment or prepayment schedules. The Fund may attempt to minimize the exposure of its debt portfolio to interest rate changes through the use of interest rate swaps, interest rate futures, interest rate options and/or other hedging strategies.
However, there can be no guarantee that the Advisers will be successful in mitigating the impact of interest rate changes on the portfolio.
Conversely, a decrease in the general level of interest rates typically leads to a higher rate of prepayments by borrowers. Accordingly, a decrease in interest rates may result in our reinvestment of the prepayment
proceeds at lower rates of return than the return on the investments that were prepaid. A decrease in interest rates could lead to loans generating lower returns for us for the same level of risk. We may therefore be required to invest in risker
loans to achieve the same level of returns.
Factors that may affect market interest rates include, without limitation, inflation, deflation, slow or stagnant economic growth or recession, unemployment, money supply, governmental monetary policies, international
disorders and instability in domestic and foreign financial markets. There may be significant unexpected movements in interest rates, which movements could have adverse effects on portfolio companies and the economy as a whole. In light of the
foregoing, and more generally, the Fund expects that it will periodically experience imbalances in the interest rate sensitivities of its assets and liabilities and the relationships of various interest rates to each other, which could adversely
affect their performance.
In addition, to the extent that the Fund may be leveraged, movements in the level of interest rates may affect the returns from these assets more significantly than other assets in some instances. The structure and
nature of the debt encumbering an investment may therefore be an important element to consider in assessing the interest risk of the investment. In particular, the type of facilities, maturity profile, rates being paid, fixed versus variable
components and covenants in place (including the manner in which they affect returns to equity holders) are crucial factors in assessing any interest rate risk. You should also be aware that a change in the general level of interest rates can be
expected to lead to a change in the interest rate we receive on many of our debt investments. Accordingly, a change in the interest rate could make it easier for us to meet or exceed the performance threshold and may result in a substantial increase
in the amount of Incentive Fees payable to our Investment Adviser with respect to the portion of the Incentive Fee based on income.
Prepayments of our debt investments by our portfolio companies could adversely impact our results of operations and reduce our return on equity.
The Fund is subject to the risk that investments in our portfolio companies may be repaid prior to maturity. When this occurs, the Fund will generally reinvest these proceeds in temporary investments, pending their
future investment in new portfolio companies. These temporary investments will typically have substantially lower yields than the debt being prepaid and we could experience significant delays in reinvesting these amounts. Any future investment in a
new portfolio company may also be at lower yields than the debt that was repaid. As a result, the Fund’s results of operations could be materially adversely affected if one or more portfolio companies elect to prepay amounts owed to the Fund.
Additionally, prepayments, net of prepayment fees, could negatively impact the Fund’s return on equity.
Market disruptions and other geopolitical or macroeconomic events could create market volatility that negatively impact our business, financial condition and earnings.
General economic and market conditions, such as interest rates, availability of credit, inflation rates, economic uncertainty, supply chain disruptions, labor shortages, energy and other resource
shortages, changes in laws, trade barriers, currency exchange controls and national and international political circumstances, may have long-term negative effects on the U.S. and worldwide financial markets and economy. These conditions have resulted
in, and in many cases continue to result in, greater price volatility, less liquidity, widening credit spreads and a lack of price transparency, with many securities remaining illiquid and of uncertain value. Such market conditions may adversely
affect the Fund, including by making valuation of some of the Fund’s securities uncertain and/or result in sudden and significant valuation increases or declines in the Fund’s holdings. If there is a significant decline in the value of the Fund’s
portfolio, this may impact the asset coverage levels for the Fund’s outstanding leverage.
Risks resulting from any future debt or other economic crisis could also have a detrimental impact on the global economy, the financial condition of financial institutions and our business,
financial condition and results of operation. Market and economic disruptions have affected, and may in the future affect, consumer confidence levels and spending, personal bankruptcy rates, levels of incurrence and default on consumer debt and home
prices, among other factors. To the extent uncertainty regarding the U.S. or global economy negatively impacts consumer confidence and consumer credit factors, our business, financial condition and results of operations could be significantly and
adversely affected. Downgrades to the credit ratings of major banks could result in increased borrowing costs for such banks and negatively affect the broader economy. Moreover, Federal Reserve policy, including with respect to certain interest
rates, may also adversely affect the value, volatility and liquidity of dividend- and interest-paying securities. Market volatility, an increase in interest rates and/or a return to unfavorable economic conditions could impair the Fund’s ability to
achieve its investment objective.
The occurrence of events similar to those in recent years, such as localized wars, instability, pandemics, epidemics or outbreaks of infectious diseases in certain parts of the world, and
catastrophic events such as fires, floods, earthquakes, tornadoes, hurricanes and global health epidemics, terrorist attacks in the U.S. and around the world, social and political discord, debt crises sovereign debt downgrades, increasingly strained
relations between the U.S. and a number of foreign countries, new and continued political unrest in various countries, the exit or potential exit of one or more countries from the EU or the EMU, continued changes in the balance of political power
among and within the branches of the U.S. government, government shutdowns, among others, may result in market volatility, may have long term effects on the U.S. and worldwide financial markets, and may cause further economic uncertainties in the
U.S. and worldwide.
In particular, the impact on inflation and increased disruption to supply chains and energy resources may impact our portfolio companies, result in an economic downturn or recession either globally
or locally in the U.S. or other economies, reduce business activity, spawn additional conflicts (whether in the form of traditional military action, reignited “cold” wars or in the form of virtual warfare such as cyberattacks) with similar and
perhaps wider ranging impacts and consequences and have an adverse impact on the Fund’s returns and net asset value. In response to the conflict between Russia and Ukraine, the U.S. and other countries have imposed sanctions or other restrictive
actions against Russia, Russian-backed separatist regions in Ukraine, and certain banks, companies, government officials and other individuals in Russia and Belarus. In addition, ongoing armed conflicts among Israel, Iran, Hamas and other militant
groups in the Middle East (including the joint U.S.-Israeli strikes on Iran in first quarter 2026), political unrest in South America and recent U.S. military action overseas may cause exacerbated volatility and disruptions to both the
domestic and global economy, spawn additional conflicts, result in possible sanctions and countersanctions, and trigger retaliatory cyberattacks. Any of the above factors, as well as other governmental actions, could have an adverse impact on
macroeconomic factors that affect the Fund and our portfolio companies' businesses, financial conditions, cashflows, and operations. We cannot predict the nature, magnitude and duration of the hostilities stemming from these conflicts. Prolonged
unrest, military activities, or broad-based sanctions could have a material adverse effect on our portfolio companies. Such consequences also may increase our funding cost or limit our access to the capital markets.
The current political climate has intensified concerns about potential trade wars between China and the U.S., as each country has imposed tariffs on the other country’s products, and
between the U.S. and other nations, with additional tariffs under the new administration in the U.S. also under discussion. These actions may trigger a significant reduction in international trade, the oversupply of certain manufactured
goods, substantial price reductions of goods and possible failure of individual companies and/or large segments of China’s export industry, which could have a negative impact on our performance. U.S. companies that source material and goods from
China and those that make large amounts of sales in China would be particularly vulnerable to an escalation of trade tensions. Uncertainty regarding the outcome of the trade tensions and the potential for a trade war could cause the U.S. dollar to
decline against safe haven currencies, such as the Japanese yen and the euro. Events such as these and their consequences are difficult to predict and it is unclear whether further tariffs may be imposed or other escalating actions may be taken in
the future. Any of these effects could have a material adverse effect on our business, financial condition and results of operations.
The impact of the events described above on our portfolio companies could impact their ability to make payments on their loans on a timely basis and may impact their ability to continue making
their loan payments on a timely basis or meeting their loan covenants. The inability of portfolio companies to make timely payments or meet loan covenants may in the future require us to undertake amendment actions with respect to our investments or
to restructure our investments, which may include the need for us to make additional investments in our portfolio companies (including debt or equity investments) beyond any existing commitments, exchange debt for equity, or change the payment terms
of our investments to permit a portfolio company to pay a portion of its interest through payment-in-kind, which would defer the cash collection of such interest and add it to the principal balance, and which would generally be due upon repayment of
the outstanding principal.
Tariffs may adversely affect us or our portfolio companies.
The current United States administration has threatened or imposed tariffs on certain imports from a number of countries, including China. Tariffs and international trade arrangements may continue
to change, potentially without warning and to an extent that is difficult to predict. Existing or new tariffs imposed on foreign goods imported by the United States or on U.S. goods imported by foreign countries could subject us or our portfolio
companies to additional risks. Among other effects, tariffs may increase the cost of production for certain or our portfolio companies or reduce demand for their products, which could affect the results of their operations, and may cause a general
economic slowdown or recession. We cannot predict whether, or to what extent, any tariff or other trade protections may affect us, our portfolio companies or the economy.
We may be impacted by general European economic conditions.
The success of the Fund’s investment activities could be affected by general economic and market conditions in Europe and in the rest of the world, as well as by changes in applicable laws and regulations (including
laws relating to taxation of our investments), trade barriers, currency exchange controls, rate of inflation, currency depreciation, asset re-investment, resource self-sufficiency and national and international political and socioeconomic
circumstances in respect of the European and other non-U.S. countries in which the Fund may invest. These factors will affect the level and volatility of securities prices and the liquidity of the Fund’s investments, which could impair the Fund’s
profitability or result in losses. General fluctuations in the market prices of securities and interest rates may affect the Fund’s investment opportunities and the value of the Fund’s investments. The Fund may maintain substantial trading positions
that can be adversely affected by the level of volatility in the financial markets; the larger the positions, the greater the potential for loss. Declines in the performance of national economies or the credit markets in certain jurisdictions have
had a negative impact on general economic and market conditions globally, and as a result, could have a material adverse effect on the Fund’s business, financial condition and results of operations. In particular, the consequences of the ongoing armed conflicts between Russia and Ukraine in Europe, and among Israel, Iran, Hamas and other militant groups in the Middle East (including the joint U.S.-Israeli strikes on Iran in first quarter 2026),
political unrest in South America and recent U.S. military action overseas, including the impact of international sanctions and the potential impact on inflation and increased disruption to supply chains, may impact our portfolio
companies. Such consequences also may increase our funding cost or limit our access to the capital markets.
Economic recessions or downturns could negatively impact our portfolio companies and harm our operating results.
Market disruptions and other geopolitical or macroeconomic events could create market volatility that negatively impact our business.
Many of our portfolio companies may be susceptible to economic slowdowns or recessions and may be unable to repay our loans during these periods. Therefore, our non-performing assets may increase
and the value of our portfolio may decrease during these periods as we are required to record the values of our investments. Adverse economic conditions also may decrease the value of collateral securing some of our loans and the value of our equity
investments. Economic slowdowns or recessions could lead to financial losses in our portfolio and a decrease in revenues, net income and assets. Unfavorable economic conditions also could increase our funding costs, limit our access to the capital
markets or result in a decision by lenders not to extend credit to us. These events could prevent us from increasing investments and harm our operating results.
A portfolio company’s failure to satisfy financial or operating covenants imposed by us or other lenders could lead to defaults and, potentially, termination of its loans and foreclosure on its
secured assets, which could trigger cross-defaults under other agreements and jeopardize our portfolio company’s ability to meet its obligations under the debt securities that we hold. We may incur expenses to the extent necessary to seek recovery
upon default or to negotiate new terms with a defaulting portfolio company. In addition, if one of our portfolio companies were to go bankrupt, even though we or one of our affiliates may have structured our interest in such portfolio company as
senior debt, depending on the facts and circumstances, including the extent to which we actually provided managerial assistance to that portfolio company, a bankruptcy court might re-characterize our debt holding as equity and subordinate all or a
portion of our claim to claims of other creditors.
Efforts by the Federal Reserve and other central banks globally to combat inflation and restore price stability, as well as other global events, may raise the prospect or severity of a recession.
Wars have added, and other international tensions or escalations of conflict may add, instability to the uncertainty driving socioeconomic forces, which may continue to have an impact on global trade and result in inflation or economic instability.
Present conditions and the state of the U.S. and global economies make it difficult to predict whether and/or to what extent a recession will occur in the near future.
Any such recession would negatively impact the businesses in which we invest and our business. These impacts may include:
| • |
severe declines in the market price of our securities or net asset value;
|
| • |
inability of the Fund to accurately or reliably value its portfolio;
|
| • |
inability of the Fund to comply with certain asset coverage ratios that would prevent the Fund from paying dividends to our shareholders and that could result breaches of covenants or events of default under our credit agreement;
|
| • |
inability of the Fund to pay any dividends and distributions or service its debt;
|
| • |
inability of the Fund to maintain its status as a RIC under the Code;
|
| • |
declines in the value of our investments;
|
| • |
increased risk of default or bankruptcy by the companies in which we invest;
|
| • |
increased risk of companies in which we invest being unable to weather an extended cessation of normal economic activity and thereby impairing their ability to continue functioning as a going concern;
|
| • |
limited availability of new investment opportunities;
|
| • |
inability for us to replace our existing leverage when it becomes due or replace it on terms as favorable as our existing leverage; and
|
| • |
general threats to the Fund’s ability to continue investment operations and to operate successfully as a BDC.
|
In addition, economic problems in a single country are increasingly affecting other markets and economies. A continuation of this trend could adversely affect global economic conditions and world markets and, in turn,
could adversely affect the Fund’s performance.
Any of the foregoing events could result in substantial or total losses to the Fund in respect of certain investments, which losses will likely be exacerbated by the presence of leverage in a portfolio company’s
capital structure.
We are subject to risks related to inflation.
Inflation risk is the risk that the value of assets or income from investments will be worth less in the future as inflation decreases the value of money. Inflation rates may change frequently and
significantly as a result of various factors, including unexpected shifts in the domestic or global economy and changes in economic policies, and the Fund’s investments may not keep pace with inflation, which may result in losses to shareholders.
Periods of elevated inflation and high interest rates, such as those experienced in recent years, can contribute to significant volatility in debt and equity markets. If inflation increases, the real value of our shares and dividends therefore may
decline. In addition, during any periods of rising inflation, interest rates of any debt securities issued by the Fund would likely increase, which would tend to further reduce returns to shareholders. This risk is greater for fixed-income
instruments with longer maturities.
Although inflation generally decelerated and stabilized throughout 2024 and 2025 due to central bank monetary tightening, including maintaining elevated interest rates, it remains above target levels set by central
banks, including the Federal Reserve. Until September 2025, the Federal Reserve had held interest rates steady in 2025. Despite the interest rate reductions in the third and fourth quarters of 2025, rates remain elevated relative to the interest rate
environment prior to the inflationary spike in 2022-2023.
MiFID II obligations could have an adverse effect on the ability of the Advisers and its MiFID-authorized EEA affiliates to obtain and research in connection with the provision of
an investment service.
The Recast European Union Directive on Markets in Financial Instruments (“MiFID II”) came into effect on January 3, 2018, and imposes regulatory obligations in respect of providing financial services in the European
Economic Area (“EEA”) by EEA banks and EEA investment firms providing regulated services (each an “Investment Firm”). Each of the Advisers is a non-EEA investment company and is, therefore, not subject to MiFID II but can be indirectly affected. The
regulatory obligations imposed by MiFID II may impact, and constrain the implementation of, the investment strategy of the Fund. MiFID II restricts Investment Firms’ ability to obtain research in connection with the provision of an investment
service. For example, Investment Firms providing portfolio management or independent investment advice may purchase investment research only at their own expense or out of specifically dedicated research payment accounts agreed upon with their
clients. Research will also have to be unbundled and paid separately from the trading commission. EEA broker-dealers will unbundle research costs and invoice them to Investment Firms separated from dealing commissions.
Therefore, in light of the above, MiFID II could have an adverse effect on the ability of the Advisers and their MiFID- authorized EEA affiliates to obtain and to provide research. The new requirements regarding the
unbundling of research costs under MiFID II are not consistent with market practice in the United States and the regulatory framework concerning the use of commissions to acquire research developed by the SEC, although the SEC has issued temporary
no-action letters to facilitate compliance by firms with the research requirements under MiFID II in a manner that is consistent with the U.S. federal securities laws. The Advisers’ access to third-party research may nonetheless be significantly
limited. Some EEA jurisdictions extend certain MiFID II obligations also to other market participants (e.g., Alternative Investment Fund Managers) under national law. There is very little guidance, and limited market practice, that has developed in
preparation for MiFID II. As such, the precise impact of MiFID II on the Advisers and the Fund cannot be fully predicted at this stage.
Compliance with the SEC’s Regulation Best Interest may negatively impact our ability to raise capital, which would harm our ability to achieve our investment objectives.
Since June 30, 2020, broker-dealers have been required to comply with Regulation Best Interest, which, among other requirements, enhances the existing standard of conduct for broker-dealers and natural persons who are
associated persons of a broker-dealer when recommending to a retail customer any securities transaction or investment strategy involving securities to a retail customer. The impact of Regulation Best Interest on broker-dealers participating in our
offerings cannot be determined at this time, but it may negatively impact whether broker-dealers and their associated persons recommend our offerings to retail customers. Regulation Best Interest imposes a duty of care for broker-dealers to evaluate
reasonable alternatives in the best interests of their clients. Reasonable alternatives to the Fund exist and may have lower expenses and/or lower investment risk than the Fund. Under Regulation Best Interest, broker-dealers participating in our
offerings must consider such alternatives in the best interests of their clients. If Regulation Best Interest reduces our ability to raise capital in our offerings, it would harm our ability to create a diversified portfolio of investments and
achieve our investment objectives and would result in our fixed operating costs representing a larger percentage of our gross income.
We are exposed to heightened credit and liquidity risks in the current environment.
We are in the midst of significant market, economic and geopolitical uncertainty and instability and an investment environment that has recently undergone rapid change. Investing in highly volatile environments
presents certain inherent risks, including reduced market liquidity and increased credit risk, as well as less certainty in core assumptions in respect of a particular investment or an investment strategy as a whole. While such investment
environments provide the opportunity for significant returns, they also present significant risks, many of which cannot be predicted, managed or hedged against. Beginning in the fourth quarter of 2008, world financial markets experienced
extraordinary market conditions, including, among other things, extreme losses and volatility in securities markets and the dislocation of credit markets. The shock to the global financial markets and the resulting instability in the developed global
economies have increased the volatility of asset values and the risks of doing business generally, both of which are expected to continue in the short, medium and long terms. The already challenged global economic and political environment may be
adversely affected by events outside the Fund’s control, such as changes in government policies, directives in the credit sector and other areas, the impact of pandemics, epidemics or outbreaks of infectious disease, increases in sovereign debt,
political instability, terrorist attacks, social unrest and rioting or military action affecting areas abroad, rising interest rates or renewed inflationary pressure, and taxation and other political, economic or social developments in or affecting
the world. Policymakers in many advanced economies have publicly acknowledged the need to urgently adopt credible strategies to contain public debt and excessive fiscal deficits and later bring them down to more sustainable levels. The implementation
of these policies may restrict economic growth.
Volatility and dislocation in the capital markets can also create a challenging environment in which to raise or access debt capital. Such conditions could make it difficult to extend the maturity of or refinance our
existing indebtedness or obtain new indebtedness with similar terms and any failure to do so could have a material adverse effect on our business. The debt capital that will be available to us in the future, if at all, may be at a higher cost,
including as a result of the current interest rate environment, and on less favorable terms and conditions than what we have historically experienced. If we are unable to raise or refinance debt, then our shareholders may not benefit from the
potential for increased returns on equity resulting from leverage and we may be limited in our ability to make new commitments or to fund existing commitments to our portfolio companies. Significant changes or volatility in the capital markets may
also have a negative effect on the valuations of our investments. While most of our investments are not publicly traded, applicable accounting standards require us to assume as part of our valuation process that our investments are sold in a
principal market to market participants (even if we plan on holding an investment through its maturity).Significant changes in the capital markets may adversely affect the pace of our investment activity and economic activity generally. The illiquid
nature of our investments may make it difficult for us to sell such investments to access capital if required, and as a result, we could realize significantly less than the value at which we have recorded our investments if we were required to sell
them for liquidity purposes. An inability to raise or access capital, and any required sale of all or a portion of our investments as a result, could have a material adverse effect on our business, financial condition or results of operations.
A portfolio company’s failure to satisfy financial or operating covenants imposed by the Fund or other lenders could lead to defaults and, potentially, termination of its loans and foreclosure on its secured assets,
which could trigger cross-defaults under other agreements and jeopardize the ability of the Fund’s portfolio company to meet its obligations under the debt securities that the Fund holds. The Fund may incur expenses to the extent necessary to seek
recovery upon default or to negotiate new terms with a defaulting portfolio company. In addition, if one of the Fund’s portfolio companies were to go bankrupt, even though the Fund or one of its affiliates may have structured its interest in such
portfolio company as senior debt, depending on the facts and circumstances, including the extent to which the Fund or one of its affiliates actually provided managerial assistance to that portfolio company, a bankruptcy court might re-characterize
the Fund’s debt holding as equity and subordinate all or a portion of the Fund’s claim to claims of other creditors.
The Advisers cannot predict how long the financial markets will continue to be affected by these events and cannot predict the effects of these or similar events in the future on the Fund, the global economy and the
global securities markets. An investment in the Fund may not be appropriate for all prospective investors. A prospective investor should carefully consider his or her ability to assume these risks before making an investment in the Fund.
Investments in covenant-lite loans may expose us to different and increased risks.
Although the Investment Adviser generally expects the transaction documentation of some portion of the Fund’s investments to include covenants and other structural protections, a portion of the Fund’s investments may
be composed of so-called “covenant-lite loans.” Generally, covenant-lite loans either do not have certain maintenance covenants that would require the issuer to maintain debt service or other financial ratios or do not contain common restrictions on
the ability of the issuer to change significantly its operations or to enter into other significant transactions that could affect its ability to repay such loans. Ownership of covenant-lite loans may expose the Fund to different risks, including
with respect to liquidity, price volatility and ability to restructure loans, than is the case with loans that have financial maintenance covenants. As a result, the Fund’s exposure to losses may be increased, which could result in an adverse impact
on the issuer’s ability to comply with its obligations under the loan. In addition, in the current economic environment, the market prices of covenant-lite loans may be depressed.
Our investments in non-U.S. portfolio companies may expose us to additional risks.
To the extent any portion of the Fund’s investments may be in securities of non-U.S. portfolio companies in order to provide diversification or to complement the Fund’s U.S. investments, the Fund may be exposed to
additional risks not typically associated with investing in U.S. companies. These risks include changes in exchange control regulations, political and social instability, expropriation, imposition of non-U.S. taxes, less liquid markets and less
available information than is generally the case in the United States, higher transaction costs, less government supervision of exchanges, brokers and issuers, less developed bankruptcy laws, difficulty in enforcing contractual obligations, lack of
uniform accounting and auditing standards and greater price volatility. These risks may be more pronounced for portfolio companies located or operating primarily in emerging markets, whose economies, markets and legal systems may be less developed.
The consequences of the ongoing armed conflicts between Russia and Ukraine in Europe and among Israel, Iran, Hamas and other militant groups in the Middle East (including the joint U.S.-Israeli strikes on Iran in
first quarter 2026), political unrest in South America and recent U.S. military action overseas, including international sanctions, the potential impact on inflation and increased disruption to global trade may exacerbate these risks.
In regards to the regulatory requirements for business development companies, some of these investments may not qualify as investments in “eligible portfolio companies,” and thus may not be considered “qualifying
assets.” “Eligible portfolio companies” generally include U.S. companies that are not investment companies and that do not have securities listed on a national exchange. If at any time less than 70% of our gross assets are comprised of qualifying
assets, including as a result of an increase in the value of any non-qualifying assets or decrease in the value of any qualifying assets, we would generally not be permitted to acquire any additional non-qualifying assets until such time as 70% of
our then current gross assets were comprised of qualifying assets. We would not be required, however, to dispose of any non-qualifying assets in such circumstances.
Although most of the Fund’s investments are denominated in U.S. dollars, its investments that are denominated in a non-U.S. currency are subject to the risk that the value of a particular currency may change in
relation to the U.S. dollar. Among the factors that may affect currency values are trade balances, the level of short-term interest rates, differences in relative values of similar assets in different currencies, long-term opportunities for
investment and capital appreciation and political developments. The Fund may employ hedging techniques to minimize these risks, but it can offer no assurance that it will, in fact, hedge currency risk or, that it does, that such strategies will be
effective. As a result, a change in currency exchange rates may adversely affect the Fund’s profitability.
The effect of global climate change may impact the operations of our portfolio companies.
There may be evidence of global climate change. Climate change creates physical and financial risk and some of our portfolio companies may be adversely affected by climate change. For example, the needs of customers of
energy companies vary with weather conditions, primarily temperature and humidity. To the extent weather conditions are affected by climate change, energy use could increase or decrease depending on the duration and magnitude of any changes.
Increases in the cost of energy could adversely affect the cost of operations of our portfolio companies if the use of energy products or services is material to their business. A decrease in energy use due to weather changes may affect some of our
portfolio companies’ financial condition, through decreased revenues. Extreme weather conditions in general require more system backup, adding to costs, and can contribute to increased system stresses, including service interruptions. Other risks
associated with climate change include risks related to the impact of climate-related legislation and regulation (both domestically and internationally), as well as risks related to climate-related business trends.
The lack of liquidity in certain of our investments may adversely affect our business.
The Fund may invest in securities, loans, derivatives or other assets, for which no (or only a limited) liquid market exists or that are subject to legal or other restrictions on the transfer of such assets and will
generally less liquid than publicly traded securities.
The market value of the Fund’s investments will fluctuate due to a variety of factors that are inherently difficult to predict including, among other things, changes in market rates of interest, general economic
conditions, economic conditions in particular industries, the condition of financial markets, prevailing credit spreads, domestic or international economic or political events, and the financial condition of the issuers of the Fund’s investments. In
addition, the lack of an established, liquid secondary market for many of the Fund’s investments may have an adverse effect on the market value of the Fund’s investments and on the Fund’s ability to dispose of them. Therefore, no assurance can be
given that, if the Fund is determined to dispose of a particular investment, it could dispose of such investment at the previously prevailing market price. In addition, if the Fund is required to liquidate all or a portion of its portfolio quickly,
the Fund may realize significantly less than the value at which the Fund had previously recorded its investments.
The sale of illiquid assets and restricted securities often requires more time and results in higher brokerage charges or dealer discounts and other selling expenses than does the sale of securities eligible for
trading on national securities exchanges or in the over-the-counter markets. Restricted securities may sell at a price lower than similar securities that are not subject to restrictions on resale. Moreover, during periods when the market for such
assets is illiquid, the Investment Adviser and any placement agent, as applicable, may not be able to efficiently dispose of or accurately determine the value of the Fund’s investments in such assets, in which case distributions may be delayed.
A portion of the Fund’s investments will consist of securities that are subject to restrictions on resale by the Fund for reasons including that they were acquired in a “private placement” transaction or that the Fund
is deemed to be an affiliate of the issuer of such securities. Generally, the Fund will be able to sell such securities without restriction to other large institutional investors but may be restrained in its ability to sell them to other investors.
If restricted securities are sold to the public, the Fund may be deemed to be an underwriter or possibly a controlling person with respect thereto for the purposes of the Securities Act and be subject to liability as such under the Securities Act.
The Investment Adviser or its affiliates may, from time to time, possess material nonpublic information, limiting the Investment Adviser’s investment discretion. The Investment Adviser’s investment professionals,
Investment Committee or their respective affiliates may serve as directors of, or in a similar capacity with, companies in which the Fund invests. In the event that material nonpublic information is obtained with respect to such companies, or the
Fund became subject to trading restrictions under the internal trading policies of those companies or as a result of applicable law, the Fund could be prohibited for a period of time from purchasing or selling the securities of such companies, and
this prohibition may have an adverse effect on the Fund and, consequently, your interests as an investor.
As required by the 1940 Act, a significant portion of our investment portfolio is and will be recorded at fair value as determined in good faith and, as a result, there is and
will be uncertainty as to the value of our portfolio investments.
Investments for which market quotations are not readily available will be valued at fair value based upon the principles and methods of valuation set forth in the Valuation Procedures. Due to the inherent uncertainty
of determining the fair value of investments that do not have a readily available market value, the fair value of the Fund’s investments may differ significantly from the values that would have been used had a readily available market value existed
for such investments, and the differences could be material, and, as a result, there may be uncertainty regarding the value of the Fund’s portfolio investments. The Fund’s net asset value could be adversely affected if determinations regarding the
fair value of these investments were materially higher than the values ultimately realized upon the disposal of such investments.
Our ability to achieve our investment objective depends on the ability of the Advisers to manage and support our investment process. If the Advisers or BlackRock were to lose any
members of their respective senior management teams, our ability to achieve our investment objective could be significantly harmed.
The success of the Fund will be highly dependent on the financial and managerial expertise of the Advisers and their personnel. The loss of one or more Voting Members (as defined below in “Investment Committee and
Decision-Making”) could have a material adverse effect on the performance of the Fund. Although the Advisers will devote a significant amount of its efforts to the Fund’s portfolio, it actively manages investments for other clients and investment
professionals are not required to (and will not) devote all of their time to the Fund’s portfolio. Our success will depend to a significant extent on the continued service and coordination of our Advisers, including their key professionals. The
departure of a significant number of key professionals from the Advisers could have a material adverse effect on our ability to achieve our investment objective. The Advisers do not have employment agreements with any of these key professionals and
we cannot guarantee that all, or any particular one, will remain affiliated with us and/or the Advisers. Further, we do not intend to separately maintain key person life insurance on any of these individuals.
We are not managed by BlackRock, but rather one of its subsidiaries and may not replicate the success of that entity or BlackRock.
Our investment strategies differ from those of BlackRock or its affiliates. As a BDC, we are subject to certain investment restrictions that do not apply to BlackRock. Our performance may be lower or higher than the
performance of other entities managed by BlackRock or its affiliates and their past performance is no guarantee of our future results.
Our business model depends upon the development and maintenance of strong referral relationships with other asset managers and investment banking firms.
We are substantially dependent on our informal relationships, which we use to help identify and gain access to investment opportunities. If we fail to maintain our relationships with key firms, or if we fail to
establish strong referral relationships with other firms or other sources of investment opportunities, we will not be able to grow our portfolio of investments and achieve our investment objective. In addition, persons with whom we have informal
relationships are not obligated to inform us of investment opportunities, and therefore such relationships may not lead to the origination of equity or other investments. Any loss or diminishment of such relationships could effectively reduce our
ability to identify attractive portfolio companies that meet our investment criteria, either for direct investments or for investments through private secondary market transactions or other secondary transactions.
Changes in interest rates and currency exchange rates may affect our cost of capital and net investment income.
The Advisers are authorized to use various investment strategies such as short sales and derivative transactions to hedge interest rate and currency risks. These strategies are generally accepted as portfolio
management techniques and are regularly used by many investment funds and other institutional investors. Techniques and instruments may change over time as new instruments and strategies are developed or regulatory changes occur. The Advisers may use
any or all such types of interest rate and currency hedging transactions at any time and no particular strategy will dictate the use of one transaction rather than another. The choice of any particular interest rate and currency hedging transactions
will be a function of numerous variables, including market conditions. However, the Fund may seek to acquire floating-rate assets based on the same index or currency as its floating-rate liabilities.
Although the Advisers intend to engage in interest rate and/or currency hedging transactions only for hedging and risk management purposes and not for speculation, use of interest rate and currency hedging transactions
involves certain risks. These risks include (i) the possibility that the market will move in a manner or direction that would have resulted in gain for the Fund had interest rate or currency hedging transactions not been utilized, in which case it
would have been better had the Fund not engaged in the interest rate or currency hedging transactions, (ii) the risk of imperfect correlation between the risk sought to be hedged and the interest rate or currency hedging transactions utilized and
(iii) potential illiquidity for the hedging instrument utilized, which may make it difficult for the Fund to close out or unwind one or more interest rate or currency hedging transactions.
The Fund is also authorized to enter into certain hedging and short sale transactions, referred to herein as “Defensive Hedge Transactions,” for the purpose of protecting the market value of a Fund investment for a
period of time without having to currently dispose of such Fund investment. Such Defensive Hedge Transactions may be entered into when the Fund is legally restricted from selling a Fund investment or when the Fund otherwise determines that it is
advisable to decrease its exposure to the risk of a decline in the market value of a Fund investment. There can be no assurance that the Fund will accurately assess the risk of a market value decline with respect to a Fund investment or enter into an
appropriate Defensive Hedge Transaction to protect against such risk. Furthermore, the Fund is not obligated to enter into any Defensive Hedge Transaction.
The Fund may, from time to time, employ various investment programs including the use of derivatives, short sales and swap transactions. There can be no assurance that any such investment program will be undertaken
successfully.
We may invest in credit derivatives that expose us to certain risks, including market risk, liquidity risk and other risks similar to those associated with the use of leverage.
In addition to hedging and short sale transactions entered into for the purpose of interest rate hedging and Defensive Hedge Transactions, the Fund is also authorized to make investments in the form of hedging and
short sale transactions. These investments are referred to herein as “Structured Product Transactions” and are more generally known as credit derivatives. These transactions generally provide for the transfer from one counterparty to another of
certain credit risks inherent in the ownership of a financial asset such as a bank loan or a high yield security. Such risks include, among other things, the risk of default and insolvency of the obligor of such asset, the risk that the credit of the
obligor or the underlying collateral will decline or that credit spreads for like assets will change (thus affecting the market value of the financial asset). The transfer of credit risk pursuant to a credit derivative may be complete or partial, and
may be for the life of the related asset or for a shorter period. Credit derivatives may be used as a risk management tool for a pool of financial assets, providing the Fund with the opportunity to gain or reduce exposure to one or more reference
loans or other financial assets (each, a “Reference Asset”) without actually owning or selling such assets in order, for example, to increase or reduce a concentration risk or to diversify a portfolio. Conversely, credit derivatives may be used by
the Fund to reduce exposure to an owned asset without selling it in order, for example, to maintain relationships with clients, avoid difficult transfer restrictions, manage illiquid assets or hedge declining credit quality of the financial asset.
The Fund would typically enter into a Structured Product Transaction in order to permit the Fund to realize the same or similar economic benefit of owning one or more Reference Assets on a leveraged basis. However,
because the Fund would not own the Reference Assets, the Fund may not have any voting rights with respect to the Reference Assets, and in such cases all decisions related to the obligors on the Reference Assets, including whether to exercise certain
remedies, will be controlled by the swap counterparties. In addition, the Fund will not benefit from general rights applicable to the holders of the Reference Assets, such as the right to indemnity and rights of setoff. The economic performance of
the Reference Assets will largely depend upon the ability of the actual lenders or holders or their agents or trustees to administer the Reference Assets. Moreover, in monitoring and enforcing the lenders’ or holders’ rights under related
documentation and in consenting to or proposing amendments to the terms included in such documentation, the actual lenders or holders will not have any obligation to consider the economic interests of the Fund.
Credit derivatives are subject to many of the same types of risks described above in “Risk Factors—Changes in interest rates and currency exchange rates may affect our cost of capital and net investment income”; for
example, in the event that the Fund enters into a credit derivative with a counterparty who subsequently becomes insolvent or files for bankruptcy, the credit derivative may be terminated in accordance with its terms and the Fund’s ability to realize
its rights under the credit derivative could be adversely affected.
The use of leverage will significantly increase the sensitivity of the market value of the credit derivatives to changes in the market value of the Reference Assets. The Reference Assets are subject to the risks
related to the credit of their underlying obligors. These risks include the possibility of a default or bankruptcy of the obligors or a claim that the pledging of collateral to secure a loan constituted a fraudulent conveyance or preferential
transfer that can be subordinated to the rights of other creditors of the obligors or nullified under applicable law. See “Risk Factors—Our Investments in prospective portfolio companies may be risky, and we could lose all or part of our investment”
and “We could be subject to lender liability and equitable subordination” for a description of some of these risks.
Rule 18f-4 under the 1940 Act requires BDCs that use derivatives to comply with a value-at-risk leverage limit, implement a derivatives risk management program and satisfy testing requirements and requirements related
to board reporting. These requirements apply unless the BDC qualifies as a “limited derivatives user,” as defined under Rule 18f-4. Under Rule 18f-4, a BDC may enter into an unfunded commitment agreement that is not a derivatives transaction, such as
an agreement to provide financing to a portfolio company, if the BDC has, among other things, a reasonable belief, at the time it enters into such an agreement, that it will have sufficient cash and cash equivalents to meet its obligations with
respect to all of its unfunded commitment agreements, in each case as it becomes due. Collectively, these requirements may limit the Fund’s ability to use derivatives and/or enter into certain other financial contracts.
Posting collateral exposes us to additional risks of our counterparties.
Where the Fund enters into an over-the-counter (“OTC”) derivative contract or a securities financing transaction, it may be required to pass collateral to the relevant counterparty. Collateral that the Fund posts to a
counterparty that is not segregated with a third-party custodian may not have the benefit of customer-protected “segregation” of such assets. Therefore in the event of the insolvency of a counterparty or broker, the Fund may become subject to the
risk that it may not receive the return of its collateral or that the collateral may take some time to return if the collateral becomes available to the creditors of the relevant counterparty or broker. In addition the Fund is subject to the risk
that it will be unable to liquidate collateral provided to it to cover a counterparty default. The Fund is also subject to the risk of loss resulting from inadequate or failed internal processes, people and systems or from external events.
Where cash collateral received by the Fund is re-invested, the Fund will be exposed to the risk of a failure or default of the issuer of the relevant security in which the cash collateral has been invested.
Where collateral is posted to a counterparty by way of a title transfer collateral arrangement or where the Fund grants a right of re-use under a security collateral arrangement which is subsequently exercised by the
counterparty, the Fund will only have an unsecured contractual claim for the return of equivalent assets. In the event of the insolvency of a counterparty, the Fund shall rank as an unsecured creditor and may not receive equivalent assets or recover
the full value of the assets. Shareholders should assume that the insolvency of any counterparty would result in a loss to the Fund, which could be material. In addition, assets subject to a right of re-use by a counterparty may form part of a
complex chain of transactions over which the Fund or its delegates will not have any visibility or control.
Because the passing of collateral is effected through the use of standard contracts, the Fund may be exposed to legal risks such as the contract may not accurately reflect the intentions of the parties or the contract
may not be enforceable against the counterparty in its jurisdiction of incorporation.
Borrowings expose us to additional risks and could adversely affect our business, financial condition and results of operations.
An investment in the Fund is subject to the risks of leverage to the extent that leverage is employed by the Fund. Leverage arises as a consequence of borrowing money. Leverage has the effect of magnifying both gains
and losses. The leverage in which the Fund may engage will increase returns to shareholders if the investments held by the Fund earn a greater return than expected, but will also magnify losses to shareholders if the investments held by the Fund fail
to earn as much as expected or operate a loss.
Subject to the restrictions on borrowings described herein, the Fund may from time to time enter into loan agreements with third parties to provide working capital for the Fund. The Fund may borrow or use other forms
of leverage on a secured or an unsecured basis for any purpose, including increasing investment capacity, covering operating expenses, making redemption or dividend payments or for clearance of transactions.
The use of leverage creates increased risk of loss and is considered a speculative investment technique. The use of leverage magnifies the potential gains and losses from an investment and increases the risk of loss of
capital. Borrowing money to purchase securities may provide an opportunity for greater capital appreciation, but, at the same time, increases the Fund’s exposure to capital risk and higher current expenses through interest charges, fees imposed by
lenders and transaction costs. To the extent that income derived by the Fund from investments purchased with borrowed funds is greater than the cost of borrowing, the Fund’s income will be greater than if borrowing had not been used. Conversely, if
the income from investments purchased from these sources is not sufficient to cover the cost of the leverage, the Fund’s investment income will be less than if leverage had not been used, and the amount available for ultimate distribution to the
holders of Common Shares will be reduced. The extent to which the gains and losses associated with leveraged investing are increased will generally depend on the degree of leverage employed. The Fund may, under some circumstances, be required to
dispose of investments under unfavorable market conditions in order to maintain its leverage, thus causing the Fund to recognize a loss that might not otherwise have occurred. In the event of a sale of investments upon default under the Fund’s
borrowing arrangements, secured creditors will be contractually entitled to direct such sales and may be expected to do so in their interest, rather than in the interests of the holders of Common Shares. Holders of Common Shares will incur losses if
the proceeds from a sale in any of the foregoing circumstances are insufficient, after payment in full of amounts due and payable on leverage, including administrative expenses, to repay such holder’s investments in the Common Shares. As a result,
you could experience a total loss of your investment. Any decrease in the Fund’s revenue would cause the Fund’s net income to decline more than it would have had the Fund not borrowed funds and could negatively affect the Fund’s ability to make
distributions to shareholders. The ability to service any debt that the Fund has or may have outstanding depends largely on its financial performance and is subject to prevailing economic conditions and competitive pressures.
There is no limitation on the percentage of portfolio investments that can be pledged to secure borrowings. If loans are collateralized with portfolio investments that decrease in value, the Fund may be obliged to
provide additional collateral to the lender or sell positions at a loss to avoid liquidation of the pledged investments. Any such liquidation could result in substantial losses. Except as described herein, such borrowings may not be subject to any
limitations on the amount or terms of borrowings other than those imposed by the lender. The amount of leverage that the Fund employs at any particular time will depend on the Investment Adviser’s assessments of market and other factors at the time
of any proposed borrowing.
Pursuant to the terms of any borrowings, we may be required to comply with certain financial and operational covenants, including (i) restrictions on the level of indebtedness that we are permitted to incur in relation
to the value of our assets; (ii) restrictions on our ability to make distributions and other restricted payments under certain circumstances; (iii) restrictions on extraordinary events, such as mergers, consolidation and sales of assets; (iv)
restrictions on our ability to incur liens and incur indebtedness; and (v) maintenance of a minimum level of shareholders’ equity. There are no assurances that we will continue to comply with such covenants. Failure to comply with such covenants
would result in a default under the applicable borrowing agreement which, if we were unable to obtain a waiver from the respective lenders thereunder, could result in an acceleration of repayments.
Illustration. The following table illustrates the effect of leverage on returns from an investment in our common stock assuming various annual returns, net of expenses. The calculations in the table below are hypothetical and actual returns may be higher or lower than those appearing below. The calculation is based on our level of leverage at December 31, 2025, which represented borrowings equal to 33.2% of our total assets. On such date, we also had $2,517.9 million in total assets; $2,244.7 million in total investments; an average cost of funds of 5.9% based on contractual terms at December 31, 2025; $836.1 million aggregate principal amount of debt outstanding; and $1,578.7 million of total net assets. In order to compute the “Corresponding Return to Common Shareholders,” the “Assumed Return on Portfolio (Net of Expenses Other than Interest)” is multiplied by the total value of our investment portfolio at December 31, 2025 to obtain an assumed return to us. From this amount, interest expense (calculated by multiplying the weighted-average interest rate of 5.9 % by the $836.1 million of debt) is subtracted to determine the return available to shareholders. The return available to shareholders is then divided by the total value of our net assets at December 31, 2025 to determine the “Corresponding Return to Common Shareholders.” Actual interest payments may vary. Our investment portfolio at fair value would have had to produce an annual return of approximately 2.2% to cover annual interest payments on the outstanding debt.
| Assumed Return on Portfolio (Net of Expenses Other than Interest) | -10.0 | % | -5.0 | % | 0.0 | % | 5.0 | % | 10.0 | % | ||||||||||
| Corresponding Return to Common Shareholders | - | % | - | % | - | % | | % | | % |
The assumed portfolio return in the table is based on SEC regulations and is not a prediction of, and does not represent, our projected or actual performance. The table also assumes that we will maintain a constant
level of leverage. The amount of leverage that we use will vary from time to time.
We generally will not control our portfolio companies.
The Fund may not be in a position to exercise control over its portfolio companies or to prevent decisions by management of its portfolio companies that could decrease the value of the Fund’s investments.
The Fund does not generally intend to take controlling equity positions in its portfolio companies. To the extent that the Fund does not hold a controlling equity interest in a portfolio company, the Fund is subject to
the risk that such portfolio company may make business decisions with which the Fund disagrees, and the shareholders and management of such portfolio company may take risks or otherwise act in ways that are adverse to the Fund’s interests. Due to the
lack of liquidity for the debt and equity investments that the Fund typically holds in its portfolio companies, the Advisers may not be able to dispose of its investments in the event the Advisers disagree with the actions of a portfolio company, and
may therefore suffer a decrease in the value of its investments.
In addition, the Fund may not be in a position to control any portfolio company by investing in its debt securities. As a result, the Fund is subject to the risk that a portfolio company in which it invests may make
business decisions with which it disagrees and the management of such company, as representatives of the holders of their common equity, may take risks or otherwise act in ways that do not serve the Fund’s interests as debt investors.
Board or committee participation may limit our ability to sell investments.
It is possible that the Fund, through members of the Investment Adviser’s Investment Committee, will be represented on the boards of directors or creditor committees of some of the companies in which the Fund makes
investments (although the Fund has no obligation to seek representation on any such boards or committees). While such representation may be important to the Investment Adviser’s investment strategy and should enhance the Investment Adviser’s ability
to manage the Fund’s investments, it may also have the effect of impairing the ability of the Fund to sell the related investments when, and upon the terms, it might otherwise desire, including as a result of applicable securities laws. Under its
current policies, the Investment Adviser restricts personal trading by the members of the Investment Committee and its other employees in issuers under the Investment Adviser’s consideration or in which the Fund or Client Accounts have an investment.
The Fund may become involved in third-party litigation.
The Fund’s investment activities subject it to the normal risks of becoming involved in litigation by third parties. This risk is somewhat greater where the Fund exercises control or significant influence over a
portfolio company’s direction, including as a result of board participation. The expense of defending against claims made against the Fund by third parties and paying any amounts pursuant to settlements or judgments would, to the extent that (i) the
Fund has not been able to protect itself through indemnification or other rights against the portfolio company or (ii) is not entitled to such protections or (iii) the portfolio company is not solvent, be borne by the Fund pursuant to indemnification
obligations and reduce net assets. The Advisers and others are indemnified by the Fund in connection with such litigation, subject to certain conditions.
We could be subject to lender liability and equitable subordination.
In recent years, a number of judicial decisions in the United States have upheld the right of borrowers to sue lending institutions on the basis of various evolving legal theories (collectively termed “lender
liability”). Generally, lender liability is founded upon the premise that an institutional lender has violated a duty (whether implied or contractual) of good faith and fair dealing owed to the borrower or has assumed a degree of control over the
borrower resulting in creation of a fiduciary duty owed to the borrower or its other creditors or shareholders. While believed to be unlikely, because of the nature of certain of the Fund investments, the Fund could be subject to allegations of
lender liability.
In addition, under common law principles that in some cases form the basis for lender liability claims, if a lending institution (i) intentionally takes an action that results in the under capitalization of a borrower
to the detriment of other creditors of such borrower, (ii) engages in other inequitable conduct to the detriment of such other creditors, (iii) engages in fraud with respect to, or makes misrepresentations to, such other creditors or (iv) uses its
influence to dominate or control a borrower to the detriment of the other creditors of such borrower, a court may elect to subordinate the claim of the offending lending institution to the claims of the disadvantaged creditor or creditors, a remedy
called “equitable subordination.” Because of the nature of certain of the Fund investments and investments in an obligor by affiliates of the Fund, the Fund could be subject to claims from creditors of an obligor that Fund investments issued by such
obligor that are held by the Fund should be equitably subordinated. A significant number of Fund investments are expected to involve investments in which the Fund would not be the lead creditor. It is, accordingly, possible that lender liability or
equitable subordination claims affecting the Fund investments could arise without the direct involvement of the Fund.
Inaccurate projections could adversely affect the performance of our investments.
The Fund may rely upon projections, forecasts or estimates developed by the Advisers and/or a portfolio company concerning the portfolio company’s future performance and cash flow. Projections, forecasts and estimates
are forward-looking statements and are based upon certain assumptions. Actual events are difficult to predict and beyond the Fund’s control. Actual events may differ from those assumed. Some important factors which could cause actual results to
differ materially from those in any forward-looking statements include changes in interest rates; domestic and foreign business, market, financial or legal conditions; differences in the actual allocation of the Fund’s investments among different
asset categories from those assumed herein; changes in the degree of leverage actually used by the Fund from time to time; the degree to which the Fund’s investments are hedged and the effectiveness of such hedges; and the terms of any borrowing
agreements, among others. In addition, the degree of risk will be increased as a result of leveraging of the investments. Accordingly, there can be no assurance that estimated returns or projections can be realized or that actual returns or results
will not be materially lower than those estimated therein.
Projections are inherently subject to uncertainty and factors beyond the control of the Advisers and the Fund. The inaccuracy of certain assumptions, the failure to satisfy certain financial requirements and the
occurrence of other unforeseen events could impair the ability of the Fund to realize projected values and cash flow.
We may face increasing competition for investment opportunities, which could delay deployment of our capital, reduce returns and result in losses.
The investment strategy of the Fund is highly competitive. The identification of attractive investment opportunities is difficult and involves a high degree of uncertainty. Consequently, there can be no assurance that
the Advisers will be able to fully invest the proceeds of our Common Shares or that suitable investment opportunities will be identified which satisfy the Fund’s investment objective.
A reduction in market inefficiencies that provide opportunities may reduce the scope for the Fund’s investment strategies. In the event that the perceived mispricings underlying the Fund’s positions were to fail to
converge toward, or were to diverge further from, relationships expected by the Advisers, the Fund may incur a loss. Further, the investments utilized in implementing such strategies may include derivatives, such as options, that are themselves
inherently volatile in the context of specific market movements.
In making investments, the Fund or its affiliates compete with a broad spectrum of investors. Some of the Fund’s existing and potential competitors are substantially larger and have considerably greater financial,
technical and marketing resources than the Fund does. For example, some competitors may have a lower cost of funds and access to funding sources that are not available to BlackRock. In addition, some of the Fund’s competitors may have higher risk
tolerances or different risk assessments, which could allow them to consider a wider variety of investments and establish more relationships than the Fund. The Fund cannot assure you that the competitive pressures the Fund faces will not have a
material adverse effect on its business, financial condition and results of operations.
Our failure to make follow-on investments in our portfolio companies could impair the value of our portfolio.
Following an initial investment in a portfolio company, we may make additional investments in that portfolio company as “follow-on” investments in order to: (1) increase or maintain in whole or in part our equity
ownership percentage; (2) exercise warrants, options or convertible securities that were acquired in the original or subsequent financing; or (3) attempt to preserve or enhance the value of our initial investment.
We may elect not to make follow-on investments or otherwise lack sufficient funds to make those investments. Our failure to make follow-on investments may, in some circumstances, jeopardize the continued viability of a
portfolio company and our initial investment, or may result in a missed opportunity for us to increase our participation in a successful operation. Even if we have sufficient capital to make a desired follow-on investment, we may elect not to make
such follow-on investment because we may not want to increase our concentration of risk, because we prefer other opportunities, because we are inhibited by compliance with BDC requirements or because we desire to maintain our tax status.
The Fund’ s portfolio companies may be highly leveraged.
Portfolio companies may be highly leveraged, and there may be no restriction on the amount of debt a portfolio company can incur. Substantial indebtedness may add additional risk with respect to a portfolio company,
and could (i) limit its ability to borrow money for its working capital, capital expenditures, debt service requirements, strategic initiatives or other purposes; (ii) require it to dedicate a substantial portion of its cash flow from operations to
the repayment of its indebtedness, thereby reducing funds available to it for other purposes; (iii) make it more highly leveraged than some of its competitors, which may place it at a competitive disadvantage; and/or (iv) subject it to restrictive
financial and operating covenants, which may preclude it from favorable business activities or the financing of future operations or other capital needs. In some cases, proceeds of debt incurred by a portfolio company could be paid as a dividend to
shareholders rather than retained by the portfolio company for its working capital. Leveraged companies are often more sensitive to declines in revenues, increases in expenses, and adverse business, political, or financial developments or economic
factors such as a significant rise in interest rates, a severe downturn in the economy or deterioration in the condition of such companies or their industries. A leveraged company’s income and net assets will tend to increase or decrease at a greater
rate than if borrowed money were not used.
If a portfolio company is unable to generate sufficient cash flow to meet principal and interest payments to its lenders, it may be forced to take other actions to satisfy such obligations under its indebtedness. These
alternative measures may include reducing or delaying capital expenditures, selling assets, seeking additional capital, or restructuring or refinancing indebtedness. Any of these actions could significantly reduce the value of the Fund’s
investment(s) in such portfolio company. If such strategies are not successful and do not permit the portfolio company to meet its scheduled debt service obligations, the portfolio company may also be forced into liquidation, dissolution or
insolvency, and the value of the Fund’s investment in such portfolio company could be significantly reduced or even eliminated. Where the Fund receives PIK interest with respect to an investment, over time such investment’s principal balance will
increase, making such investment more highly leveraged.
The Fund is subject to risks due to its reliance on portfolio company management.
The Investment Adviser generally will seek to monitor the performance of investments in operating companies either through interaction with the board of the applicable company and/or by maintaining an ongoing dialogue
with the company’s management and/or sponsor team. However, the Fund generally will not be in a position to control any borrower by virtue of investing in its debt and the portfolio company’s management will be primarily responsible for the
operations of the company on a day-to-day basis. Although it is the intent of the Fund to invest in companies with strong management teams, there can be no assurance that the existing management team, or any new one, will be able to operate the
company successfully. In addition, the Fund is subject to the risk that a borrower in which it invests may make business decisions with which the Fund disagrees and the management of such borrower, as representatives of the common equity holders, may
take risks or otherwise act in ways that do not serve the interests of the debt investors, including the Fund. Furthermore, in exercising its investment discretion, the Investment Adviser may in certain circumstances commit funds of the Fund to other
entities that will be given a mandate to make certain investments consistent with the Fund’s investment objective and that may earn a performance-based fee on those investments. Once such a commitment is made, such entities will have full control
over the investment of such funds, and the Investment Adviser will cease to have such control.
The Fund is subject to risks associated with investments that may become distressed.
The Fund has made, and may continue to make, investments that become distressed due to factors outside the control of the Investment Adviser. There is no assurance that there will be sufficient collateral to cover the
value of the loans and/or other investments purchased by the Fund or that there will be a successful reorganization or similar action of the company or investment which becomes distressed. In any reorganization or liquidation proceeding relating to a
company in which the Fund invests, the Fund may lose its entire investment, may be required to accept cash or securities with a value less than the Fund’s original investment and/or may be required to accept payment over an extended period of time.
In addition, under applicable law, the Fund may not be able to participate in future financings for restructured investments.
Troubled company and other asset-based investments require active monitoring and may, at times, require participation in business strategy or reorganization proceedings by the Investment Adviser and/or its affiliates.
To the extent that the Investment Adviser and/or its affiliates becomes involved in such proceedings, the Fund may have participated more actively in the affairs of the company than that assumed generally by a passive investor. In addition,
involvement by the Investment Adviser and/or its affiliates in an issuer’s or portfolio company’s reorganization proceedings could result in the imposition of restrictions limiting the Fund’s ability to liquidate its position in the issuer and/or
portfolio company. Such investments would likely take more time to realize before generating any returns and may not generate income during the course of reorganization.
The Advisers will exercise discretion in selecting brokers and dealers to execute transactions on our behalf.
Pursuant to the Advisory Agreement and the Sub-Advisory Agreement, the Advisers have discretion to select brokers and dealers to execute transactions as agent on behalf of the Fund. This discretion is subject to the
approval and oversight of the Board of Trustees. The Fund is not committed to continue its relationship with any broker or dealer it selects for any minimum period and the Advisers may select more than one broker to act as prime broker to the Fund.
In selecting brokers to effect portfolio transactions for the Fund, the Advisers make the decision on the basis of best execution and considers such factors as the ability of the brokers to effect the transactions, the
brokers’ facilities, reliability and financial responsibility and the provision or payment (or the rebate to the Fund for payment) of the costs of brokerage or research products or services. The Advisers need not solicit competitive bids and does not
have an obligation to seek the lowest available commission cost. Accordingly, if the Advisers determine in good faith that the commissions charged by a broker are reasonable in relation to the value of the brokerage and research products or services
provided by such broker, the Fund may pay commissions to such broker in an amount greater than the amount another broker might charge.
Research products or services provided to the Advisers may include research reports on particular industries and companies, economic surveys and analyses, recommendations as to specific securities and other products
and services (e.g., quotation equipment and expenses) and providing lawful and appropriate assistance to the Advisers in the performance of their investment decision-making responsibilities.
Commissions or “soft dollars,” if used to pay for research products or services, will fall within the safe harbor for soft dollars created by Section 28(e) of the Exchange Act, and use of “soft dollars,” if any, will
comply at all times with the rules of the Financial Conduct Authority to the extent required by applicable law. Under Section 28(e), research obtained with soft dollars generated by the Fund may be used by the Advisers to service accounts other than
the Fund. Where a product or service provides both research and non-research assistance to the Advisers, a portion of the cost of the product or service, based upon a reasonable allocation between the two types of uses, may be paid for with soft
dollars.
The Fund’s securities transactions can be expected to generate brokerage commissions and other compensation, all of which the Fund, not the Advisers, is obligated to pay. The Advisers have complete discretion in
deciding what brokers and dealers the Fund uses and in negotiating the rates of compensation the Fund pays. In addition to using brokers as “agents” and paying commissions, the Fund may buy or sell securities directly from or to dealers acting as
principals at prices that include markups or markdowns, and may buy securities from underwriters or dealers in public offerings at prices that include compensation to the underwriters and dealers.
We may incur losses as a result of errors.
The Fund may on occasion experience errors with respect to trades placed on its behalf by the Advisers. An error is generally compensable from the Advisers to the Fund when it is a mistake (whether an action or
inaction) in which the Advisers have, in the Advisers’ reasonable view, deviated from the applicable standard of care in managing the Fund’s assets.
Trade errors (and similar errors) may occur and, subject to applicable law, the Fund may be responsible for any resulting losses in the absence of the gross negligence (as determined in accordance with the laws of the
State of Delaware) of the Advisers or their affiliates or personnel. Examples of such trade errors may include, without limitation, (i) the placement of orders (either purchases or sales) in excess of the amount of securities the Fund intended to
trade; (ii) the sale (or purchase) of a security when it should have been purchased (or sold); (iii) the purchase or sale of the wrong security; (iv) the purchase or sale of a security contrary to regulatory restrictions or the Fund’s investment
guidelines or restrictions; (v) incorrect allocations of trades; (vi) keystroke errors that occur when entering trades into an electronic trading system; and (vii) typographical or drafting errors related to derivatives contracts or similar
agreements. Mistakes may also occur in connection with other activities that may be undertaken by the Advisers and their affiliates and personnel, such as net asset value calculation, transfer agent activities (i.e.,
processing subscriptions and withdrawals), fund accounting, trade recording and settlement and other matters.
The Advisers make determinations regarding errors pursuant to their policies on a case-by-case basis, in their discretion, based on factors they consider reasonable, including regulatory requirements and business
practices. The Advisers generally will endeavor to detect trade errors prior to settlement and correct and/or mitigate them in an expeditious manner. The Advisers may also consider whether it is possible to adequately address a mistake through
cancellation, reallocation of losses and gains or other means. To the extent an error is caused by a counterparty, such as a broker-dealer, the Advisers may seek to recover any losses associated with such error from the counterparty. The
determination whether to seek compensation from a counterparty and whether to accept any amount in settlement of such a matter will be made by the Advisers in their sole discretion.
Compensation for Errors. When the Advisers determines that reimbursement by the Advisers is appropriate, the Fund will be compensated as determined in good faith by the
Advisers. The Advisers will follow their guidelines regarding these matters in light of all of the facts and circumstances related to an error. In general, compensation is expected to be limited to direct and actual losses, which may be calculated
relative to comparable conforming investments, market factors and benchmarks and with reference to other factors the Advisers considers relevant. Compensation generally will not include any amounts or measures that the Advisers determine are
speculative or uncertain, including potential opportunity losses resulting from delayed investment or sale as a result of correcting an error or other forms of consequential or indirect losses. In addition, losses may also be capped at the value of
the actual loss, particularly when the outcome of a differing investment would in the Advisers’ view be speculative or uncertain or in light of reasonable equitable considerations.
Reprocessing Net Asset Value Errors and Compensation of Shareholders. The Advisers follow materiality guidelines to determine when individual shareholder accounts will be
restated (credited or debited) in respect of particular errors, and to handle certain net asset value-related errors that occur in the Fund’s operation (including, without limitation, errors made in the processing of subscriptions and withdrawals).
Under these guidelines, when a compensable error by the Advisers occurs, the Advisers may reimburse the Fund in an amount according to its policies without the Fund reprocessing individual shareholder accounts. Reprocessing of individual shareholder
accounts generally will only occur when the error is of a size that exceeds the materiality threshold for reprocessing. This means that an error below the materiality threshold may disadvantage shareholders during the period the error persists, but
reimbursement may benefit shareholders at the time of reimbursement and may not, in either event, be allocated to, or in proportion to, the specific shareholders whose interests were negatively affected by the error.
We may be subject to the risks of the credit or liquidity problems of our contractual counterparties.
The Fund may effect a portion of its transactions in “over-the-counter” or “interdealer” markets or through private transactions. The participants in such markets and the counterparties in such private transactions are
typically not subject to credit evaluation and regulatory oversight as are members of “exchange-based” markets. This may expose the Fund to the risk that a counterparty will not settle a transaction because of a credit or liquidity problem, thus
causing the Fund to suffer a loss. Counterparty risk is accentuated for contracts with longer maturities where events may intervene to prevent settlement, or where the Fund has concentrated its transactions with a single or small group of
counterparties. The Fund is not restricted from dealing with any particular counterparty or from concentrating any or all of its transactions with one counterparty. The Fund manages counterparty risk by entering into transactions only with
counterparties that they believe have the financial resources to honor their obligations and by monitoring the financial stability of those counterparties. Financial assets, which potentially expose the Fund to market, issuer and counterparty credit
risks, consist principally of investments in portfolio companies. The extent of the Fund’s exposure to market, issuer and counterparty credit risks with respect to these financial assets is generally approximated by their fair value recorded in the
Consolidated Statements of Assets and Liabilities in the Fund’s Annual Report on Form 10-K. The Fund is also exposed to credit risk related to maintaining all of its cash at a major financial institution.
The U.S. and global capital markets are subject to systemic risk that could adversely affect our business, financial condition and results of operations.
Issuers, national and regional banks, financial institutions and other participants in the U.S. and global capital markets are closely interrelated as a result of credit, trading, clearing, technology and other
relationships. A significant adverse development (such as a bank run, insolvency, bankruptcy or default) with one or more national or regional banks, financial institutions or other participants in the financial or capital markets may spread to
others and lead to significant concentrated or market-wide problems (such as defaults, liquidity problems, impairment charges, additional bank runs and/or losses) for other participants in these markets. Future developments, including actions taken
by the U.S. Department of Treasury, FDIC, Federal Reserve Board, and systemic risk in the U.S. and global banking sectors and broader economies in general, are difficult to assess and quantify, and the form and magnitude of such developments or other
actions of the U.S. Department of Treasury, FDIC and Federal Reserve Board may remain unknown for significant periods of time and could have an adverse effect on the Fund.
For example, the financial markets recently experienced volatility in connection with concerns that some banks, especially small and regional banks, may have significant investment-related losses that might make it
difficult to find demands to withdraw deposits and other liquidity needs. This and similar developments could in the future lead to further rules and regulations for public companies, banks, financial institutions and other participants in the U.S.
and global capital markets, including business development companies such as us, and complying with the requirements of any such rules or regulations may be burdensome. Even if not adopted, evaluating and responding to any such proposed rules or
regulations could results in increased costs and require significant attention from our Investment Adviser.
There can be no assurance that any risk control framework will achieve its objective.
No risk control system is fail-safe, and no assurance can be given that any risk control framework employed by the Advisers will achieve its objective. Target risk limits developed by the Advisers may be based upon
historical trading patterns for the securities and financial instruments in which the Fund invests. To the extent such risk control framework (or the assumptions underlying it) does not prove to be correct, the Fund may not perform as anticipated,
which could result in substantial losses. All models ultimately depend upon the judgment of the Advisers and the assumptions embedded in the framework. No assurance can be given that such historical trading patterns will accurately predict future
trading patterns.
We will be obligated to pay certain fees and expenses regardless of our performance and results of operations.
The Fund will incur obligations to pay operating, legal, accounting, auditing, custodial and other related fees and expenses, including the Advisory Fee. In addition, the Fund will incur obligations to pay brokerage
commissions, option premiums and other transaction costs to securities brokers and dealers. The foregoing fees and expenses are payable regardless of whether the Fund realizes any profits from its investment operations. In accordance with the
governing agreements, amounts owing to the Fund’s creditors will be paid before amounts are distributed to shareholders. It is possible that the Fund will not realize any profits in excess of such amounts. Distributions in respect of the Fund’s
common shares are not guaranteed, and shareholders shall not have recourse to any assets or property of the Advisers, any of their affiliates or any of the Fund’s other service providers in connection therewith.
The Fund is subject to laws that restrict it from dealing with entities, individuals, organizations and/or investments which are subject to applicable sanctions regimes.
Accordingly, the Fund will require shareholders to represent and warrant, on a continuing basis, that it is not, and that to the best of its knowledge or belief its beneficial owners, controllers or authorized persons
(“Related Persons”) (if any) are not; (i) named on any list of sanctioned entities or individuals maintained by the U.S. Treasury Department’s Office of Foreign Assets Control (“OFAC”) or pursuant to EU and/or UK Regulations (as the latter are
extended to the Cayman Islands by Statutory Instrument), (ii) operationally based or domiciled in a country or territory in relation to which sanctions imposed by the United Nations, OFAC, the EU and/or the UK apply, or (iii) otherwise subject to
sanctions imposed by the United Nations, OFAC, the EU or the UK (including as the latter are extended to the Cayman Islands by Statutory Instrument) (collectively, a “Sanctions Subject”).
Where the shareholder or a Related Person is or becomes a Sanctions Subject, the Fund may be required immediately and without notice to the shareholder to cease any further dealings with the shareholder and/or the
shareholder’s interest in the Fund until the shareholder ceases to be a Sanctions Subject, or a license is obtained under applicable law to continue such dealings (a “Sanctioned Persons Event”). The Fund, the Administrator and the Advisers shall have
no liability whatsoever for any liabilities, costs, expenses, damages and/or losses (including but not limited to any direct, indirect or consequential losses, loss of profit, loss of revenue, loss of reputation and all interest, penalties and legal
costs and all other professional costs and expenses) incurred by the shareholder as a result of a Sanctioned Persons Event. In addition, should any investment made on behalf of the Fund subsequently become subject to applicable sanctions, the Fund
may immediately and without notice to the shareholder cease any further dealings with that investment until the applicable sanctions are lifted or a license is obtained under applicable law to continue such dealings.
Legislative and regulatory changes may adversely affect our costs of compliance or the value of our investments.
The Fund may invest in assets and securities that may entail unusual risks, including contradictory legislation, incomplete, unclear and changing laws, ignorance or breaches of regulations on the part of other market
participants, lack of established or effective avenues for legal redress and lack of standard practices and confidentiality customs. In addition, legal, tax, and regulatory changes, as well as judicial decisions, could adversely affect the Fund. In
particular, the regulatory environment relevant to the Fund and the Advisers is evolving and may entail increased regulatory involvement or result in ambiguity or conflict among legal or regulatory schemes, all of which could adversely affect the
investment or trading strategies pursued by the Advisers or the value of investments. Other potential changes that could be pursued by the current or a future presidential administration could include an increase in the corporate income tax rate;
changes to regulatory enforcement priorities; and spending on clean energy and infrastructure. It is impossible to predict how changes in policy or regulation will affect the investments of the Fund, but such changes may significantly increase the
Fund’s costs of compliance or may necessitate the untimely liquidation of the Fund’s investments.
Additional risks arising from the differences in expressed policy preferences among the various constituencies in the branches of the U.S. government has led in the past, and may lead in the future, to short-term or
prolonged policy impasses, which could, and has, resulted in shutdowns of the U.S. federal government. U.S. federal government shutdowns, especially prolonged shutdowns, could have a significant adverse impact on the economy in general and could
impair the ability of issuers to raise capital in the securities markets. Any of these effects could have a material adverse effect on our business, financial condition and results of operations.
In addition, the rules dealing with the U.S. federal income taxation are constantly under review by persons involved in the legislative process and by the IRS and the U.S. Treasury Department. The effect of any changes
to such rules is uncertain, both in terms of the direct effect on the taxation of an investment in the Fund’s shares and their indirect effect on the value of the Fund’s assets, the Fund’s shares or market conditions generally.
We may not be able to obtain all required state licenses.
The Fund intends to engage in loan origination activities. Certain jurisdictions have enacted laws or regulations that require lenders engaged in loan origination to obtain a finance lenders license and restrict loan
origination activity absent a license. The costs, regulatory burden and restrictions imposed by these laws and regulations may have a significant negative impact on the Fund and the Advisers. In addition, the license application process may entail
the disclosure of the identity of certain shareholders. The Fund may elect to forego or limit investments in certain jurisdictions rather than incur the costs and burden of obtaining and maintaining a required license.
General economic conditions could adversely affect the performance of our investments and our operations.
The success of the activities of the Fund will be affected by general economic and market conditions, such as interest rates, availability of credit, inflation rates, economic uncertainty, changes in laws, trade
barriers, currency exchange controls and national and international political circumstances (such as changes in foreign investment policies). These factors may affect the level and volatility of securities prices and the liquidity of the investments.
Volatility or illiquidity could impair the Fund’s profitability or result in losses.
The economies of individual countries in emerging and frontier markets may differ favorably or unfavorably from the economy of a developed country in such respects as growth of gross domestic product, rate of
inflation, currency depreciation, asset reinvestment, resource self-sufficiency and balance of payments position. Further, the economies of such countries generally are heavily dependent upon international trade and, accordingly, have been, and may
continue to be adversely affected by trade barriers, exchange controls, managed adjustments in relative currency values and other protectionist measures imposed or negotiated by the countries with which they trade. These economies also have been and
may continue to be adversely affected by economic conditions in the countries with which they trade. The economies of certain of these countries may be based, predominantly, on only a few industries and may be vulnerable to changes in trade
conditions and may have higher levels of debt or inflation.
Various social and political tensions around the world may contribute to increased market volatility, may have long-term effects on the worldwide financial markets and may cause further economic uncertainties
worldwide. In particular, the consequences of the ongoing armed conflicts between Russia and Ukraine in Europe and among Israel, Iran, Hamas and other militant groups in the Middle East (including the joint
U.S.-Israeli strikes on Iran in first quarter 2026), political unrest in South America and recent U.S. military action overseas, including international sanctions, the potential impact on inflation and increased disruption to supply
chains, may impact our portfolio companies.
Inflation risk is the risk that the value of assets or income from investments will be worth less in the future as inflation decreases the value of money. Inflation rates may change frequently and significantly as a
result of various factors, including unexpected shifts in the domestic or global economy and changes in economic policies, and the Fund’s investments may not keep pace with inflation, which may result in losses to shareholders. If inflation
increases, the real value of our shares and dividends therefore may decline. In addition, during any periods of rising inflation, interest rates of any debt securities issued by the Fund would likely increase, which would tend to further reduce
returns to shareholders. This risk is greater for fixed-income instruments with longer maturities.
Market disruptions and the dramatic increase in the capital allocated to alternative investment strategies during recent years have led to increased governmental as well as self-regulatory scrutiny of the private
investment fund industry in general. Certain legislation proposing greater regulation of the industry periodically is considered by various jurisdictions. It is impossible to predict what, if any, changes in the regulations applicable to the Fund
and/or the Advisers, the markets in which they trade and invest, or the counterparties with which they do business, may be instituted in the future. Any such regulation could have a material adverse impact on the profit potential of the Fund.
Uncertainty regarding the Euro and the Eurozone could adversely affect the value of our investments.
The deterioration of the sovereign debt of several countries, together with the risk of contagion to other, more stable, countries, exacerbated the global economic crisis. There is a continued possibility that Eurozone
countries could be subject to an increase in borrowing costs. This situation as well as the United Kingdom’s withdrawal from the EU have raised a number of uncertainties regarding the stability and overall standing of the European Economic and
Monetary Union. The departure or risk of departure from the Euro by one or more Eurozone countries could lead to the reintroduction of national currencies in one or more Eurozone countries or, in more extreme circumstances, the possible dissolution
of the Euro entirely. These potential developments, or market perceptions concerning these and related issues, could adversely affect the value of the Fund’s investments. Shareholders should carefully consider how any potential changes to the
Eurozone and European Union may affect their investment in the Fund.
Governmental intervention in the financial markets may increase volatility.
We and our portfolio companies are susceptible to the effects of economic slowdowns or recessions. In response to a recession, economic slowdown or financial market instability, governments and regulators may choose to
intervene by implementing austerity measures and reforms, as seen in the 2007-2009 global financial crisis. There is no guarantee a government or regulatory intervention will have the desired effect and any such intervention may result in social
unrest, limit future growth and economic recovery or have unintended consequences. Additionally, such interventions have sometimes been unclear in scope and application, resulting in confusion and uncertainty which in itself has been detrimental to
the efficient functioning of financial markets. It is impossible to predict with certainty what temporary or permanent governmental restrictions may be imposed on the markets in the future and/or the effect of such restrictions on the Advisers’
ability to implement the Fund’s investment objective, the European or global economy or the global securities market. Instability in the global financial markets or government intervention may increase the volatility of the Fund and hence the risk of
loss to the value of your investment.
We may face a breach of our cybersecurity, which could result in adverse consequences to our operations and exposure of confidential information.
Our business operations rely upon secure information technology systems for data processing, storage, and reporting. Despite careful security and controls design, implementation and
updating, the Fund or any of the service providers, including the Advisers, may be subject to risks resulting from cybersecurity incidents and/or technological malfunctions. A cybersecurity incident is an event that may cause a loss of
proprietary information, data corruption or a loss of operational capacity. Cybersecurity incidents can result from deliberate cyberattacks or unintentional events. Cyberattacks include, but are not limited to, gaining unauthorized access to digital
systems (e.g. through hacking or malicious software coding) for the purposes of misappropriating assets or sensitive information, corrupting data, releasing confidential information without authorization or causing operational disruption.
Cyberattacks may also be carried out in a manner that does not require gaining unauthorized access, such as causing denial-of-service attacks on websites, which may make network services unavailable to intended users. The issuers of securities and
counterparties to other financial instruments in which the Fund invests may also be subject to cybersecurity incidents.
Cybersecurity incidents may cause the Fund to suffer financial losses, interfere with the Fund’s ability to calculate its net asset value, impede trading, disrupt the ability of shareholders to subscribe for, exchange
or redeem their units, violate privacy and other laws and incur regulatory fines, penalties, reputational damage, reimbursement or other compensation costs, or additional compliance costs. Cyberattacks may render records of assets and transactions of
the Fund, shareholder ownership of units, and other data integral to the functioning of the Fund inaccessible, inaccurate or incomplete. In addition, substantial costs may be incurred in order to prevent any cybersecurity incidents in the future
which may adversely impact the Fund.
While the Fund and the Advisers have established business continuity plans and risk management strategies to seek to prevent cybersecurity incidents, such plans and strategies could prove to be inadequate, and, if
compromised, could become inoperable for extended periods of time, cease to function properly, fail to adequately secure private information or have other risks that have not been identified given the evolving nature of the threat of cyberattacks.
Furthermore, neither of the Fund or the Advisers can control the business continuity plans or cybersecurity strategies put in place by other service providers to the Fund or issuers of securities and counterparties to other financial instruments in
which the Fund invests. The Advisers rely on third party service providers for many of their day-to-day operations and will be subject to the risk that the protections and policies implemented by those third party service providers will be
ineffective to protect the Fund from cyber-attack.
We are subject to the cybersecurity risks of our Service Providers, which could negatively impact the Fund and its shareholders.
The Fund relies on the information and technology systems of the the Advisers, the Administrator, and the Fund’s third-party service providers (including, but not limited to,
accountants, custodians, transfer agents and administrators), and counterparties (the “Service Providers”), each of which could be directly or indirectly adversely affected by information systems interruptions, cybersecurity incidents or
other disruptions, which in turn could have a material adverse effect on the Fund.
The Fund and the Service Providers are susceptible to operational, information security and related cybersecurity risks both directly and through their own service providers. Cyber incidents can result from deliberate
attacks or unintentional events. They include, but are not limited to, gaining unauthorized access to systems, corrupting or destroying data, and causing operational disruption. Geopolitical tensions may increase the scale and sophistication of
deliberate attacks, particularly those from nation-states or from entities with nation- state backing.
Cybersecurity incidents may cause disruptions and impact business operations. They may result in any of the following: financial losses (including loss or theft of Fund assets), interference with the Fund’s ability to
calculate its NAV, disclosure of confidential information, impediments to trading, submission of erroneous trades or erroneous creation or redemption orders, the inability of the Fund or the Service Providers to transact business, violations of
applicable privacy and other laws, regulatory fines, penalties, reputational damage, reimbursement or other compensation costs, and other legal and compliance costs. In addition, cyber incidents may render records of Fund assets and transactions,
shareholder ownership of Fund shares, and other data integral to the functioning of the Fund inaccessible, inaccurate or incomplete. The Fund may incur substantial costs in order to resolve or prevent cyber incidents.
The Advisers, indirect subsidiaries of BlackRock, are responsible for the overall management of the Fund. The Advisers rely on BlackRock’s enterprise risk management framework for the Fund’s cybersecurity risk
management and strategy. Although BlackRock has implemented policies and controls and takes protective measures involving significant expense to prevent and address potential data breaches, inadvertent disclosures and sophisticated cyberattacks and
cyber-related fraud, there can be no assurance that any of these measures proves fully effective. In addition, a successful cyber-attack may persist for an extended period of time before being detected, and it may take a considerable amount of time
for an investigation to be completed and the severity and potential impact to be known.
Furthermore, the Fund cannot control the cybersecurity plans and systems of its Service Providers. The Fund and its shareholders could be negatively impacted as a result.
We are dependent on information systems and systems failures could significantly disrupt our business, which may, in turn, negatively affect our ability to pay dividends.
Our business is dependent on our and third parties’ communications and information systems. Further, in the ordinary course of our business we or the Investment Adviser may engage certain third party service providers
to provide us with services necessary for our business. Any failure or interruption of those systems or services, including as a result of the termination or suspension of an agreement with any third-party service providers, could cause delays or
other problems in our business activities. Our financial, accounting, data processing, backup or other operating systems and facilities may fail to operate properly or become disabled or damaged as a result of a number of factors including events
that are wholly or partially beyond our control and adversely affect our business. There could be:
| • |
sudden electrical or telecommunications outages;
|
| • |
natural disasters such as earthquakes, tornadoes and hurricanes;
|
| • |
disease pandemics;
|
| • |
events arising from local or larger scale political or social matters, including terrorist acts; and
|
| • |
cyberattacks.
|
These events, in turn, could have a material adverse effect on our operating results and negatively affect our ability to pay dividends to our shareholders.
We are subject to risks associated with artificial intelligence and machine learning technology.
Recent technological advances in artificial intelligence and machine learning technology pose risks to the Fund and our portfolio investments. These advancements could harm the Fund
and our portfolio investments by reducing the demand for both the technology and software offerings of our portfolio investments. Additionally, these advancements could significantly disrupt our portfolio investments and subject them to increased
competition, which could have a material adverse effect on our business, financial condition and results of operations. Also, artificial intelligence and machine learning technology advancements, including efficiency improvements, without related
increases in the adoption and development of such technologies, could also negatively impact demand for, and the valuation of, digital infrastructure assets.
The Fund and our portfolio investments could be exposed to the risks of artificial intelligence and machine learning technology if third-party service providers or any
counterparties, whether or not known to the Fund, also use artificial intelligence and machine learning technology in their business activities. We and our portfolio companies may not be in a position to control the use of artificial intelligence and
machine learning technology in third-party products or services.
Use of artificial intelligence and machine learning technology could include the input of confidential information in contravention of applicable policies, contractual or other obligations or restrictions, resulting in
such confidential information becoming part accessible by other third-party artificial intelligence and machine learning technology applications and users.
Independent of its context of use, artificial intelligence and machine learning technology is generally highly reliant on the collection and analysis of large amounts of data, and it is not possible or practicable to
incorporate all relevant data into the model that artificial intelligence and machine learning technology utilizes to operate. Certain data in such models will inevitably contain a degree of inaccuracy and error-potentially materially so-and could
otherwise be inadequate or flawed, which would be likely to degrade the effectiveness of artificial intelligence and machine learning technology. To the extent that we or our portfolio investments are exposed to the risks of artificial intelligence
and machine learning technology use, any such inaccuracies or errors could have adverse impacts on the Fund or our investments.
Regulations related to artificial intelligence and machine learning technology could also impose certain obligations and costs related to monitoring and compliance. For example, in April 2023, the
Federal Trade Commission, U.S. Department of Justice, Consumer Financial Protection Bureau, and U.S. Equal Employment Opportunity Commission released a joint statement on artificial intelligence demonstrating interest in monitoring the development
and use of automated systems and enforcement of their respective laws and regulations. In October 2023, an executive order established new standards for AI safety and security. In addition to the U.S. regulatory framework, in 2024, the EU adopted the
Artificial Intelligence Act in 2024, which applies to certain artificial intelligence and machine learning technology and the data used to train, test and deploy them, which may create additional compliance burdens, higher administrative costs and
significant penalties should the Fund , the Advisers and our portfolio companies fail to comply.
Artificial intelligence and machine learning technology and its applications, including in the private investment and financial sectors, continue to develop rapidly, and it is impossible to predict the future risks
that may arise from such developments. The full extent of current or future risks related thereto is not possible to predict and we may not be able to anticipate, prevent, mitigate or remediate all of the potential
risks, challenges or impacts of such changes.
Certain Tax Risks
Legislative or regulatory tax changes could adversely affect investors.
Developments in the tax laws of the United States or other jurisdictions, which may be applied retroactively, could have a material effect on the tax consequences to shareholders, the Fund and/or the entities in which
the Fund invests. Such legislation could affect shareholders, even if not specifically targeted at such shareholders. Moreover, the interpretation and application of tax laws and regulations by certain tax authorities may not be clear, consistent or
transparent. For example, legislation has been proposed that would modify key aspects of the tax Code, including by increasing tax rates.
Each prospective shareholder should be aware that developments in the tax laws of the United States or other jurisdictions, may alter the tax consequences and other tax considerations discussed herein and that
shareholders may be required to provide certain information to the Fund (which may be provided to the IRS or other taxing authorities) or may cause the Fund or the shareholders to be subject to other adverse consequences as a result of such change in
tax laws.
Based on the types of investments likely to be made directly or indirectly by the Fund and uncertainty as to the potential tax treatment of certain investment structures, no assurance can be given that any tax planning
objectives of the Fund or any particular shareholders will be achieved. None of the Advisers or any of their affiliates are obligated to consider the potential tax or other objectives of any shareholder. Each prospective shareholder is urged to
consult its tax advisor to determine the U.S. federal, state, local and non-U.S. income tax and other tax consequences of acquiring, holding and disposing of Common Shares in light of its particular circumstances, including as a result of changes in
tax laws.
We will be subject to corporate-level income tax if we are unable to maintain our status as a RIC under Subchapter M of the Code or to satisfy RIC distribution requirements.
Although the Fund currently qualifies as a RIC, no assurance can be given that the Fund will be able to maintain RIC status. To maintain RIC status and be relieved of U.S. federal income taxes on income and gains
distributed to shareholders, the Fund generally must meet the annual distribution, source-of-income and asset diversification requirements.
The annual distribution requirement for a RIC will generally be satisfied if the Fund distributes at least 90% of its ordinary income and net short-term capital gain in excess of net long-term capital loss, if any, to
shareholders. To maintain status as a RIC, the Fund generally must also meet certain asset diversification requirements at the end of each calendar quarter and source-of-income tests on an annual basis. Failure to meet these tests may result in the
Fund having to dispose of certain investments quickly in order to prevent the loss of RIC status. Because most of the Funds’ investments are in private companies, any such dispositions could be made at disadvantageous prices and may result in
substantial losses.
If the Fund fails to maintain our status as a RIC for any reason and becomes subject to corporate-level income tax, the resulting corporate-level income taxes could substantially reduce the Fund’s net assets, the
amount of income available for distribution and the amount of the Fund’s distributions.
We may have difficulty paying our required distributions if we recognize income before or without receiving cash representing such income.
For U.S. federal income tax purposes, the Fund may include in income certain amounts that the Fund has not yet received in cash, such as original issue discount, which may arise if the Fund receives warrants in
connection with the making of a loan or possibly in other circumstances, or PIK interest, which represents contractual interest added to the loan balance and due in the future, often only at the end of the loan. Such original issue discount, which
could be significant relative to the Fund’s overall investment activities, or increases in loan balances as a result of PIK arrangements are generally included in the Fund’s taxable income before the Fund receives any corresponding cash payments. The
Fund also may be required to include in income certain other amounts that it does not receive in cash or may be subject to limitations on the deductibility of certain of the Fund’s cash expenses.
Since the Fund may recognize taxable income before or without receiving cash representing such income or may be subject to limitations on the deductibility of the Fund’s losses and expenses, the Fund may have
difficulty meeting the tax requirement to distribute at least 90% of the Fund’s ordinary income and net short-term capital gain in excess of net long-term capital loss, if any, to maintain the Fund’s status as a RIC. Accordingly, the Fund may have to
sell some of its investments at times the Advisers would not consider advantageous, raise additional debt or equity capital or reduce new investment originations to meet these distribution requirements.
All investors should review “U.S. Federal Income Tax Matters” for a discussion of certain additional risk factors.
Risks Related to the Fund’s Regulation and Operation as a BDC
Our Board of Trustees may change our operating policies and strategies without prior notice or shareholder approval, the effects of which may be adverse to our results of
operations and financial condition.
The Board of Trustees has the authority to modify or waive the Fund’s operating policies and strategies without prior notice and without shareholder approval. The Fund cannot predict the effect any changes to its
current operating policies and strategies would have on the Fund’s business, operating results or value of the Common Shares. Nevertheless, the effects could adversely affect the Fund’s business and impact the Fund’s ability to make distributions and
cause you to lose all or part of your investment.
The Advisers’ potential liability under the Advisory Agreement and Sub-Advisory Agreement is limited.
The Advisers have not assumed any responsibility to the Fund other than to render the services described in the Advisory Agreement and Sub-Advisory Agreement, respectively, and will not be responsible for any action of
the Board of Trustees in declining to follow the Advisers’ advice or recommendations. Pursuant to the Advisory
Agreement and the Sub-Advisory Agreement, the Advisers and their members and their respective officers, managers, partners, agents, employees, controlling persons and members and any other person or entity affiliated
with it will not be liable to the Fund for their acts under the Advisory Agreement and Sub-Advisory Agreement, absent bad faith, misconduct, willful misfeasance, negligence or reckless disregard in the performance of their duties. The Fund has agreed
to indemnify, defend and protect the Advisers and their members and their respective officers, managers, partners, agents, employees, controlling persons and members and any other person or entity affiliated with it with respect to all damages,
liabilities, costs and expenses resulting from acts of the Advisers not arising out of bad faith, misconduct, willful misfeasance, negligence or reckless disregard in the performance of their duties under the investment and management agreement.
These protections may lead the Advisers to act in a riskier manner when acting on behalf of the Fund than it would when acting for their own account.
The Advisers and their affiliates, including our officers and some of our Trustees, face conflicts of interest caused by compensation arrangements with us and our affiliates,
which could result in actions that are not in the best interests of our shareholders. In addition, we may be obligated to pay the Investment Adviser incentive compensation even if we incur a net loss due to a decline in the value of our portfolio.
The Investment Adviser and its affiliates receive substantial fees from us in return for their services, and these fees could influence the advice provided to us. We pay to the Investment Adviser an incentive fee that
is based on the performance of our portfolio and an annual base management fee that is based on the value of our net assets as of the end of the most recently completed calendar month. Because the incentive fee is based on the performance of our
portfolio, the incentive compensation payable by the Fund to the Investment Adviser may create an incentive for the Investment Adviser to make investments on the Fund’s behalf that are risky or more speculative than would be the case in the absence
of such compensation arrangement to increase the return on the Fund’s investments. This could result in higher investment losses, particularly during cyclical economic downturns. A rise in the general level of interest rates can be expected to lead
to higher interest rates applicable to certain of the Fund’s debt investments and may accordingly result in a substantial increase in the amount of incentive compensation payable to the Investment Adviser with respect to the Fund’s cumulative
investment income. Although the incentive compensation is subject to a total return hurdle, the Investment Adviser may have some ability to accelerate the realization of gains to obtain incentive compensation earlier than it otherwise would when it
may be in the Fund’s best interests to not yet realize gains. The Board of Trustees monitors the Investment Adviser’s management of the Fund’s investment program in the best interests of shareholders. The way in which the incentive fee is determined
may also encourage the Investment Adviser to use leverage to increase the return on our investments.
The Fund is subject to risks relating to rights against third Parties, including Service Providers.
The Fund is reliant on the performance of the Advisers, the Administrator, our Service Providers, and other third-parties including legal advisors, lenders, bankers, brokers, consultants, sourcing, operating and joint
venture partners. The Fund may bear the risk of any errors or omissions by such third parties. In addition, misconduct by such third parties may result in reputational damage, litigation, business disruption and/or financial losses to the Fund. Each
shareholder’s contractual relationship in respect of its investment in Common Shares of the Fund is with the Fund only and shareholders are not in contractual privity with any such third-party. Therefore, generally, no shareholder will have any
contractual claim against any third-party with respect to such third-party default or breach. Accordingly, shareholders must generally rely upon the Adviser and/or Administrator to enforce the Fund’s rights against a third party. In certain
circumstances, which are generally not expected to prevail, shareholders may have limited rights to enforce the Fund’s rights on a derivative basis or may have rights against third parties if they can establish that such third parties owe duties to
the shareholders. In addition, shareholders will have no right to participate in the day-to-day operation of the Fund and decisions regarding the selection of Service Providers or other third parties. Rather, such decisions, including the retention
and compensation of such providers, will be made by the Adviser and/or Administrator without the review by or consent of the shareholders. The shareholders must therefore rely on the ability of the Adviser and/or Administrator to select and
compensate Service Providers and third parties and to make investments and manage and dispose of investments.
Moreover, the involvement of service providers may present a number of risks due to, among other factors, the Advisers’ and/or Administrator’s reduced control over the functions that are contracted. There can be no
assurances that the Adviser and/or Administrator, through conducting oversight of the service providers, will be able to identify, prevent or mitigate the risks of engaging service providers. The Fund may suffer adverse consequences from actions,
errors or failures to act by such third parties, and will have obligations, including indemnity obligations, toward and limited recourse against them as discussed above.
In certain circumstances, service providers may sub-delegate particular duties to additional third-party service providers, and there is no guarantee that the Advisers and/or Administrator will have consent rights to
such sub-delegation in all cases. Such sub-delegation of services by service providers exacerbates the risks described above as none of the Advisers, the Administrator or the Fund would be in contractual privity with sub-delegates. Further, the
Fund’s investors, the Advisers, the Administrator, and the Fund will have to rely on the service providers for appropriate selection and oversight of such sub-delegates.
Contracting certain services may not occur uniformly for the Fund and other clients of the Investment Adviser and/or its affiliates, and the expenses that may be borne by such vehicles and accounts vary. Accordingly,
certain costs may be incurred by (or allocated to) the Fund through the use of third-party service providers that are not incurred by (or allocated to) certain other clients of the Investment Adviser and/or its affiliates for similar services.
We are dependent upon senior management personnel of the Investment Adviser for our future success; if the Investment Adviser is unable to retain qualified
personnel or if the Investment Adviser loses any member of its senior management team, our ability to achieve our investment objective could be significantly harmed.
The success of the Fund is highly dependent on the financial and managerial expertise of the Investment Adviser. The loss of one or more of the voting members of the Investment Committee could have
a material adverse effect on the performance of the Fund. Although the Investment Adviser and the voting members of the Investment Committee devote a significant amount of their respective efforts to the Fund, they actively manage investments for
other clients and are not required to (and will not) devote all of their time to the Fund’s affairs. In addition, in connection with the acquisition of Tennenbaum Capital Partners, LLC (a subsidiary of the Investment Adviser) by BlackRock in August
2018, certain senior members of the Investment Adviser’s investment team and other key advisory personnel were granted retention bonuses. As the last of such retention bonuses have been paid, there may be less economic incentive for certain senior
investment team members and certain other key personnel to remain with the Investment Adviser than in prior periods. Certain members of the Investment Adviser's investment team that received such bonuses have left the firm. The loss of key members of
the Investment Adviser’s investment team, or a material portion of other key advisory personnel, could have a material adverse effect on the performance of the Fund if the Investment Adviser were unable to replace such persons in a timely manner.
The resignation of the Advisers could adversely affect our business, financial condition and results of operations.
The Investment Adviser has the right, under the Advisory Agreement, to resign at any time upon not less than 120 days’ written notice, whether the Fund has found a replacement or not. The Sub-Adviser has the right,
under the Sub-Advisory Agreement, to resign at any time upon not less than 60 days’ written notice, whether the Fund has found a replacement or not. If the Advisers resign, the Fund may not be able to find a new investment advisor or hire internal
management with similar expertise and ability to provide the same or equivalent services on acceptable terms within the necessary timeframe, or at all. If the Fund unable to do so quickly, its operations are likely to experience a disruption, its
financial condition, business and results of operations as well as its ability to pay distributions are likely to be adversely affected. In addition, the coordination of the Fund’s internal management and investment activities is likely to suffer if
the Fund is unable to identify and reach an agreement with a single institution or group of executives having the expertise possessed by the Advisers and their affiliates. Even if the Fund is able to retain comparable management, whether internal or
external, the integration of such management and their lack of familiarity with the Fund’s investment objective may result in additional costs and time delays that may adversely affect the Fund’s financial condition, business and results of
operations.
The requirement that we invest a sufficient portion of our assets in Qualifying Assets could preclude us from investing in accordance with our current business strategy;
conversely, the failure to invest a sufficient portion of our assets in Qualifying Assets could result in our failure to maintain our status as a BDC.
As a BDC, the Fund is prohibited from acquiring any assets other than “qualifying assets” unless, at the time of and after giving effect to such acquisition, at least 70% of the Fund’s total assets are qualifying
assets. If the Fund does not invest a sufficient portion of its assets in qualifying assets, the Fund will be prohibited from investing in additional non-qualifying assets, which could have a material adverse effect on the Fund’s business, financial
condition and results of operations. Similarly, these rules could prevent the Fund from making follow-on investments in existing portfolio companies (which could result in the dilution of the Fund’s position) or could require the Fund to dispose of
investments at inopportune times in order to come into compliance with the 1940 Act. If the Fund needs to dispose of these investments quickly, it may be difficult to dispose of such investments on favorable terms. For example, the Fund may have
difficulty in finding a buyer and, even if a buyer is found, the Fund may have to sell the investments at a substantial loss.
Failure to maintain our status as a BDC could have an adverse effect on our business.
The Fund intends to qualify as business development companies under the 1940 Act. The 1940 Act imposes numerous constraints on the operations of business development companies. For example, BDCs are prohibited from
making any unqualifying investments unless at least 70% of their total assets are invested in qualifying investments which are primarily securities of private or thinly-traded U.S. companies, cash, cash equivalents, U.S. Government securities and
other high quality debt investments that mature in one year or less. Failure to comply with the requirements imposed on business development companies by the 1940 Act could cause the SEC to bring an enforcement action against the Fund and/or expose
the Fund to claims of private litigants.
Our ability to enter into transactions with our affiliates is restricted.
We are prohibited under the 1940 Act from participating in certain transactions with certain of our affiliates (including portfolio companies of other Client Accounts, as defined below) without the prior approval of a
majority of the independent members of our Board of Trustees and, in some cases, the SEC. Any person that owns, directly or indirectly, 5% or more of the Fund’s outstanding voting securities or is managed by the Advisers will generally be an
affiliate of the Fund for purposes of the 1940 Act and the Fund is generally prohibited from participating in certain transactions such as co-investing with, or buying or selling any security from or to, such affiliate, absent the prior approval of
the Independent Trustees and, in some cases, of the SEC. The 1940 Act prohibits certain “joint” transactions with certain affiliates of the Fund, which could include investments in the same portfolio company (whether at the same or different times),
without prior approval of the Independent Trustees and, in some cases, of the SEC. The Fund is prohibited from buying or selling any security from or to any person who owns more than 25% of the Fund’s voting securities and from or to certain of that
person’s affiliates, or entering into prohibited joint transactions with such persons, absent the prior approval of the SEC (other than certain limited situations pursuant to current regulatory guidance). The analysis of whether a particular
transaction constitutes a joint transaction requires a review of the relevant facts and circumstances relating to the particular transaction. Similar restrictions limit the Fund’s ability to transact business with its officers or directors or their
affiliates.
These prohibitions will affect the manner in which investment opportunities are allocated between the Fund and other Client Accounts. Most importantly, the Fund generally is prohibited from co-investing with other
Client Accounts in loans and financings originated by the Investment Adviser and/or its affiliates except for pursuant to the co-investment exemptive relief granted to the Investment Adviser, the Fund, and certain other Client Accounts managed by the
Investment Adviser or its affiliates by the SEC (the “Order”) which delineates the requirements the Investment Adviser must comply with for the Fund to invest with certain other Client Accounts.
The Order requires that certain procedures be followed prior to making an investment subject to the Order and such procedures could in certain circumstances adversely affect the price paid or received by the Fund or
the availability or size of the position purchased or sold by the Fund. The Investment Adviser may also face conflicts of interest in making investments pursuant to the Order.
Our Advisers and their affiliates and employees may have certain conflicts of interest.
As a global provider of investment management, risk management and advisory services to institutional and retail clients, BlackRock, the Investment Adviser and their respective affiliates (for purposes of this
discussion of potential conflicts, the “BlackRock Entities”), engage in a broad spectrum of activities, including sponsoring and managing a variety of public and private investment funds, funds of funds and separate accounts across fixed income,
liquidity, equity, alternative investment and real estate strategies; providing financial advisory services; providing technology infrastructure and analytics under the BlackRock Solutions® brand and engaging in certain broker-dealer activities and
other activities. Although the relationships and activities of the BlackRock Entities should help enable these entities to offer attractive opportunities and services to the Fund, such relationships and activities create certain inherent actual and
potential conflicts of interest. In the ordinary course of business, the BlackRock Entities engage in activities where their interests or the interests of their clients may conflict with the interests of the Fund, certain investors or a group of
investors, or the Fund’s investments. The following discussion enumerates certain potential and actual conflicts of interest.
Allocation of Investment Opportunities. The BlackRock Entities manage and advise numerous accounts for clients around the world, such as registered and unregistered funds and
owners of separately managed accounts (collectively, “Client Accounts”). Client Accounts include funds and accounts in which the BlackRock Entities or their personnel have an interest (“BlackRock Accounts”). Certain of these Client Accounts have
investment objectives, and utilize investment strategies, that are similar to the Fund’s. As a result, certain investments may be appropriate for the Fund and also for other Client Accounts. The BlackRock Entities’ allocation of investment
opportunities among various Client Accounts presents inherent potential and actual conflicts of interest, particularly where an investment opportunity is limited. These potential conflicts are exacerbated in situations where BlackRock is entitled to
higher fees and incentive compensation from certain Client Accounts than from other Client Accounts (including the Fund), where the portfolio managers making an allocation decision are entitled to an incentive fee, carried interest or other similar
compensation from such other Client Accounts, or where there are differences in proprietary investments in the Fund and other Client Accounts. The prospect of achieving higher compensation or greater investment return from another investment vehicle
or separate account than from the Fund provides incentives for the Advisers or other BlackRock Entities to favor the other investment vehicle or separate account over the Fund when, for example, allocating investment opportunities that the Advisers
believe could result in favorable performance. It is the policy of BlackRock not to make decisions based on the foregoing interests or greater fees or compensation.
Any person that is an affiliate of the Fund for purposes of the 1940 Act generally is prohibited from participating in certain transactions such as co-investing with, or buying or selling any security from or to, the
Fund absent the prior approval of the Independent Trustees and, in some cases, of the SEC. However, the Investment Adviser and the funds managed by the Investment Adviser and certain affiliates have received an order providing an exemption from
certain SEC regulations prohibiting transactions with affiliates. The Order requires that certain procedures be followed prior to making an investment subject to the Order. The Investment Adviser may face conflicts of interest in making investments
pursuant to the Order.
As a result of the Order, there could be significant overlap in the Fund’s investment portfolio and the investment portfolios of other Client Accounts, including, in some cases, proprietary accounts of the Investment
Adviser or its affiliates. Because investments may be allocated across multiple other Client Accounts, the Fund will at times receive a lower allocation to an investment than desired; likewise, the Fund may also be limited in the degree to which it
is able to participate in selling opportunities that it may otherwise wish to pursue due to allocations, including non-pro rata allocations, to other Client Accounts.
If the Investment Adviser identifies a co-investment opportunity and the Fund is unable to rely on the Order or other no-action positions of the SEC staff for that particular co-investment opportunity, the Investment
Adviser will be required to determine which Client Accounts should make the investment at the potential exclusion of other Client Accounts. In such circumstances, the Investment Adviser will adhere to the Allocation Policy (defined herein) in order
to determine the Client Account to which to allocate investment opportunities. Accordingly, it is possible that the Fund may not be given the opportunity to participate in investments made by other Client Accounts.
The 1940 Act also prohibits certain “joint” transactions with certain of the Fund’s affiliates, which could include investments in the same portfolio company (whether at the same or different times), without prior
approval of the Independent Trustees and, in some cases, of the SEC. The Fund is prohibited from buying or selling any security from or to any person who owns more than 25% of the Fund’s voting securities and from or to certain of that person’s
affiliates, or entering into prohibited joint transactions with such persons, absent the prior approval of the SEC (other than certain limited situations pursuant to current regulatory guidance). The analysis of whether a particular transaction
constitutes a joint transaction requires a review of the relevant facts and circumstances relating to the particular transaction. Similar restrictions limit the Fund’s ability to transact business with its officers or directors or their affiliates.
To address actual and potential conflicts associated with allocation of investments, BlackRock has developed an investment allocation policy (the “Investment Allocation Policy”) and related guidelines. In addition,
certain BlackRock Entities and business units have supplemental allocation policies for making allocation decisions among Client Accounts managed by such BlackRock Entities (together with the Investment Allocation Policy and related guidelines, the
“Allocation Policy”). The Allocation Policy is intended to ensure that investment opportunities are allocated on a fair and equitable basis among Client Accounts over time, taking into account various factors including the Client Account’s investment
objective, guidelines and restrictions and other portfolio construction considerations; available capital and liquidity needs; tax, regulatory and contractual considerations; risk or investment concentration parameters; supply or demand for a
security at a given price level; size of available investment; unfunded capital commitments or cash availability and liquidity requirements; leverage limitations; regulatory restrictions; contractual restrictions (including with other clients);
minimum investment size; relative size; and such other factors as may be relevant to a particular transaction or Client Account. The BlackRock Entities reserve the right to allocate investment opportunities appropriate for the investment objectives
of the Fund and other Client Accounts in any other manner deemed fair and equitable by the BlackRock Entities consistent with the Allocation Policy, the Order and applicable law. The application of the Allocation Policy, the Order and the foregoing
considerations may result in a particular Client Account, including the Fund, not receiving an allocation of an investment opportunity that has been allocated to other Client Accounts following the same or similar strategy, or receiving a smaller
allocation than other Client Accounts or an allocation on an other than pro rata basis. Furthermore, as the investment programs of the Fund and the other applicable Client Accounts change and develop over time, additional issues and considerations
may affect the Allocation Policy and the expectations of the BlackRock Entities with respect to the allocation of investment opportunities to the Fund and other Client Accounts. BlackRock and the Investment Adviser reserve the right to change the
Allocation Policy and guidelines relating thereto from time to time without the consent of or notice to shareholders, subject to the disclosure requirements of applicable law.
Allocation of Expenses. Side-by-side management by the BlackRock Entities of the Fund and Client Accounts raises other potential and actual conflicts of interest, including
those associated with allocating expenses attributable to the Fund and one or more other Client Accounts. Subject to applicable law, including the Order, the Investment Adviser and its affiliates will attempt to make such allocations on a basis that
they consider to be fair and equitable to the Fund under the circumstances over time and considering such factors as it deems relevant. The allocations of such expenses may not be proportional, and any such determinations involve inherent matters of
discretion, e.g., in determining whether to allocate pro rata based on number of Client Accounts or proportionately in accordance with asset size, or in certain circumstances determining whether a particular expense has a greater benefit to the Fund,
other Client Accounts or the Investment Adviser and/or its affiliates.
Activities of Other Client Accounts. The BlackRock Entities will, from time to time, be actively engaged in transactions on behalf of other Client Accounts in the same
investments, securities, derivatives and other instruments in which the Fund will directly or indirectly invest. Trading for certain other Client Accounts is carried out without reference to positions held directly or indirectly by the Fund and may
have an effect on the value or liquidity of the positions so held or may result in another Client Account having an interest in an issuer adverse to that of the Fund.
Under certain circumstances and subject to the Order and applicable law, the Fund may invest directly or indirectly in a transaction in which one or more other Client Accounts are expected, or seek, to participate or
already have made, or concurrently will make or seek to make, an investment. The Fund and the other Client Accounts may have conflicting interests and objectives in connection with such investments, including with respect to views on the operations
or activities of the project or company involved, the targeted returns from the investment and the timeframe for, and method of, exiting the investment. For example, the Investment Adviser’s decisions on behalf of other Client Accounts to sell,
redeem from or otherwise liquidate a security in which the Fund is invested may adversely affect the Fund, including by causing such investment to be less liquid or more concentrated, or by causing the Fund to no longer participate in a controlling
position in the investment or to lose the benefit of certain negotiated terms, including, without limitation, fee discounts. Conflicts will also arise in cases where the Fund, directly or indirectly, and other Client Accounts invest in different
parts of an issuer’s capital structure, including circumstances in which one or more Client Accounts may own private securities or obligations of an issuer and other Client Accounts may own public securities of the same issuer. If an issuer in which
the Fund, directly or indirectly, and one or more other Client Accounts hold different classes of securities (or other assets, instruments or obligations issued by such issuer) encounters financial problems, decisions over the terms of any workout
will raise potential conflicts of interests (including, for example, conflicts regarding the terms of recapitalizations and proposed waivers, amendments or enforcement of debt covenants). As a result, one or more Client Accounts may pursue or enforce
rights with respect to a particular issuer in which the Fund has directly or indirectly invested, and those activities may have an adverse effect on the Fund. Because of the different legal rights associated with debt and equity of the same portfolio
company, BlackRock expects to face a potential conflict of interest in respect of the advice given to, and the actions taken on behalf of, the Fund versus another Client Account (e.g., the terms of debt instruments, the enforcement of covenants, the
terms of recapitalizations and the resolution of workouts or bankruptcies). For example, if the Fund holds debt securities of an issuer and a Client Account directly or indirectly holds equity securities of the same issuer, then, if the issuer
experiences financial or operational challenges, the Fund may seek a liquidation of the issuer in which it may be paid in full, whereas the Client Account, as a direct or indirect equity holder, might prefer a reorganization that holds the potential
to create value for the equity holders. Similarly, if additional capital is necessary as a result of financial or other difficulties, or to finance growth of other opportunities, subject to the Order and applicable law and regulation, a Client
Account may not provide such additional capital and the Fund may do so, or vice versa. In the event of an insolvency, bankruptcy or similar proceeding of an issuer, the Fund may be limited (by applicable law, courts or otherwise) in the positions or
actions it may be permitted to take due to other interests held or actions or positions taken by other Client Accounts. In negotiating the terms and conditions of any such investments, or any subsequent amendments or waivers, the Investment Adviser
and the other BlackRock Entities may find that their own interests, the interests of the Fund and/or the interests of one or more other Client Accounts could conflict. Any of the foregoing conflicts of interest will be discussed and resolved on a
case-by-case basis. The resolution of such conflicts will take into consideration the interests of the relevant parties, the circumstances giving rise to the conflict, the Order to the extent applicable and applicable law. Shareholders should be
aware that conflicts will not necessarily be resolved in favor of the Fund and that the Fund could be adversely affected by the actions taken by BlackRock Entities on behalf of Client Accounts.
In order to avoid or reduce the conflicts that may arise in cases where the Fund, directly or indirectly, and other Client Accounts invest in different parts of an issuer’s capital structure, or for other reasons, the
Fund may choose not to invest in issuers in which other Client Accounts hold an existing investment, even if the Investment Adviser believes such investment opportunity to be attractive and otherwise appropriate for the Fund and is permitted under
applicable law and regulation, which may adversely affect the performance of the Fund.
Other transactions by one or more Client Accounts also may have the effect of diluting the values or prices of investments held directly or indirectly by the Fund or otherwise disadvantaging the Fund. This may occur
when portfolio decisions regarding the Fund are based on research or other information that is also used to support portfolio decisions for other Client Accounts. When a BlackRock Entity implements a portfolio decision or strategy on behalf of a
Client Account other than the Fund ahead of, or contemporaneously with, similar portfolio decisions or strategies for the Fund (whether or not the portfolio decisions emanate from the same research analysis or other information), market impact,
liquidity constraints or other factors could result in the Fund receiving less favorable investment results, and the cost of implementing such portfolio decisions or strategies for the Fund could increase, or the Fund could otherwise be
disadvantaged.
Additionally, if the Fund makes an investment in a portfolio company in conjunction with an investment made by another Client Account, the Fund may not invest through the same investment vehicles, have the same access
to credit or employ the same hedging or investment strategies as such other Client Account. This likely will result in differences in investment cost, investment terms, leverage and associated expenses between the Fund and any other Client Account.
There can be no assurance that the Fund and the other Client Accounts will exit the investment at the same time or on the same terms, and there can be no assurance that the Fund’s return on such an investment will be the same as the returns achieved
by any other Client Accounts participating in the transactions. Given the nature of these conflicts, there can be no assurance that the resolution of these conflicts will be beneficial to the Fund.
The BlackRock Entities may also, in certain circumstances and subject to the Order and applicable law and regulation, pursue or enforce rights or take other actions with respect to a particular issuer or investment
jointly on behalf of the Fund and other Client Accounts. In such circumstances, the Fund may be adversely impacted by the other Client Accounts’ activities, and transactions for the Fund may be impaired or effected at prices or terms that may be less
favorable than would otherwise have been the case had the other Client Accounts not pursued a particular course of action with respect to the issuer or investment. For example, one or more Client Accounts may dispose of or make an in kind
distribution of its portion of an investment that is also held by the Fund and other Client Accounts, and such action may adversely affect the Fund and such other Client Accounts that continue to hold such investment.
Conflicts may also arise because portfolio decisions made by the Investment Adviser on behalf of the Fund may benefit other BlackRock Entities or Client Accounts, including BlackRock Accounts. For example, subject to
the Order and applicable law and regulation, the Fund may invest directly or indirectly in the securities, bank loans or other obligations of issuers in which a Client Account has an equity, debt or other interest, or vice versa. In certain
circumstances, the Investment Adviser may be incentivized not to undertake certain actions on behalf of the Fund in connection with such investments, in view of a BlackRock Entity’s or Client Account’s involvement with the relevant issuer or
investment. Further, the Fund may also engage in investment transactions that result in other Client Accounts being relieved of obligations or otherwise divesting of investments that the Fund also holds or which cause the Fund to have to divest
certain investments. The purchase, holding and sale of investments by the Fund may enhance the profitability of another Client Account’s own investments in and activities with respect to such investments.
Without limiting the generality of the foregoing, the Fund may invest, directly or indirectly, in equity of investments or issuers affiliated with the BlackRock Entities or in which a BlackRock Entity or a Client
Account has a direct or indirect debt or other interest, or vice versa, and may acquire such equity or debt either directly or indirectly through public or private acquisitions. Such investments may benefit the BlackRock Entities or Client Accounts.
In addition, the Investment Adviser may be incentivized not to undertake certain actions on behalf of the Fund in connection with such investments, in view of a BlackRock Entity’s or Client Account’s involvement with the relevant issuer or
investment.
Moreover, the Investment Adviser’s investment professionals, its senior management and employees serve or may serve as officers, directors or principals of entities that operate in the same or a related line of
business as the Fund. Accordingly, these individuals may have obligations to investors in those entities or funds, the fulfillment of which might not be in the best interests of the Fund or shareholders. In addition, certain of the personnel employed
by the Investment Adviser or focused on the Fund’s business may change in ways that are detrimental to the Fund’s business.
Transactions Between Client Accounts. Each of the BlackRock Entities and the Investment Adviser reserve the right to conduct cross trades between the Fund and other Client
Accounts in accordance with applicable legal and regulatory requirements. The Investment Adviser may cause the Fund to purchase securities or other assets from or sell securities or other assets to, or engage in other transactions with, other Client
Accounts or vehicles when the Investment Adviser believes such transactions are appropriate and in the participants’ best interest, subject to applicable law and regulation. The Fund may enter into “agency cross transactions,” in which a BlackRock
Entity may act as broker for the Fund and for the other party to the transaction, to the extent permitted under applicable law and regulation and the relevant Client Account governing documents. In such cases, the Investment Adviser and such other
Client Accounts or BlackRock Entities, as applicable, may have a potentially conflicting division of loyalties and responsibilities regarding both parties to the transaction. To the extent that any provision of Section 11(a) of the Exchange Act, or
any of the rules promulgated thereunder, is applicable to any transactions effected by the Investment Adviser, such transactions will be affected in accordance with the requirements of such provisions and rules.
Proxy Voting. The Board of Trustees has delegated to the Investment Adviser discretion with respect to voting and consent rights of the assets of the Fund. Consistent with
applicable rules under the Advisers Act, BlackRock has adopted and implemented written proxy voting policies and procedures with respect to individual securities held by the Fund that are reasonably designed: (i) to ensure that proxies are voted,
consistent with its fiduciary obligations, in the best interests of Client Accounts under the circumstances over time; and (ii) to prevent conflicts of interest from influencing proxy voting decisions made on behalf of clients. Nevertheless, when
votes are cast in accordance with BlackRock’s proxy voting policy and in a manner that BlackRock believes to be consistent with its fiduciary obligations, actual proxy voting decisions made on behalf of one Client Account may have the effect of
favoring or harming the interests of other Client Accounts, including the Fund. With respect to the Fund, the Investment Adviser has adopted the BlackRock Active Investment Stewardship – Global Engagement and Voting Guidelines (the “Proxy Voting
Policies and Procedures”). Shareholders may receive a copy of the Proxy Voting Policies and Procedures upon request, and may also obtain a copy at:
http://www.blackrock.com/corporate/en-us/about-us/responsible-investment/responsible-investment-reports.
Investment Terms of Other Client Accounts. The investment terms offered to other Client Accounts or to investors in other Client Accounts with similar investment objectives as
the Fund may be different than those applicable to our shareholders and may create conflicts. In particular, with respect to investors in other Client Accounts that are managed as dedicated funds or with respect to other Client Accounts investing
through separate accounts with similar investment objectives to the Fund, information sharing may, to the extent permitted under applicable law and regulation, be more extensive, detailed and timely as compared to information available to our
shareholders, and the other Client Accounts’ liquidity may not be subject to the restrictions that apply to our shareholders.
Management of the Fund. In connection with the management of the Fund, the Board of Trustees and/or the Investment Adviser will have the right to make certain determinations on
behalf of the Fund, in its discretion. Any such determinations may affect shareholders differently and some shareholders may be adversely affected by such determinations by the Board of Trustees or Investment Adviser. Shareholders may be situated
differently in a number of ways, including being resident of, or organized in, various jurisdictions, being subject to different tax rules or regulatory structures and/or having different internally- or externally-imposed investment policies,
restrictions or guidelines. As a result, conflicts of interest may arise in connection with decisions made by the Board of Trustees or the Investment Adviser that may be more beneficial for certain shareholders. In making determinations on behalf of
the Fund, including in structuring and completing investments, the Investment Adviser intends to consider the investment and tax objectives of the Fund and the shareholders as a whole, not the investment, tax or other objectives of any stockholder
individually.
Subject to applicable law, including the 1940 Act, and the terms of the applicable contracts with the Fund, BlackRock Entities may from time to time, and without notice to the Fund or shareholders, insource or
outsource to third-parties, including parties which are affiliated with BlackRock, certain processes or functions in connection with a variety of services that they provide to the Fund in their administrative or other capacities. Such in-sourcing or
outsourcing may give rise to potential conflicts of interest.
Limited Access to Information; Information Advantage of Certain BlackRock Clients. As a result of receiving client reports, service on a Client Account’s advisory board,
affiliation with the Investment Adviser or otherwise, one or more BlackRock clients may have access to different information regarding the BlackRock Entities’ transactions, strategies or views, and may act on such information in accounts not
controlled by the BlackRock Entities, which may have a material adverse effect on the performance of the Fund. The Fund and its investments may also be adversely affected by market movements or by decreases in the pool of available securities or
liquidity arising from purchases and sales by, as well as increases of capital in, and withdrawals of capital from, other Client Accounts and other accounts of BlackRock clients not controlled by BlackRock. These effects can be more pronounced in
respect of investments with limited capacity and in thinly traded securities and less liquid markets.
Furthermore, our shareholders’ rights to information regarding the Investment Adviser or the Fund generally will be limited to applicable reporting obligations and information requirements under the Exchange Act and
applicable state law. It is anticipated that the Investment Adviser and its affiliates will obtain certain types of material information from or relating to the Fund’s investments that will not be disclosed to shareholders because such disclosure is
prohibited, including as a result of contractual, legal or similar obligations outside of BlackRock’s control. Such limitations on the disclosure of such information may have adverse consequences for shareholders in a variety of circumstances and may
make it difficult for a stockholder to monitor the Investment Adviser and its performance.
Adviser Decisions May Benefit BlackRock Entities and BlackRock Accounts. BlackRock Entities may derive ancillary benefits from certain decisions made on behalf of the Fund.
While the Investment Adviser will make decisions for the Fund in accordance with its obligations to manage the Fund appropriately, the fees, allocations, compensation and other benefits to the BlackRock Entities (including benefits relating to
business relationships of the BlackRock Entities) may be greater as a result of certain portfolio, investment, service provider or other decisions made by the Investment Adviser for the Fund than they would have been had other decisions been made
which also might have been appropriate for the Fund. In addition, BlackRock Entities may invest in Client Accounts and therefore may indirectly derive ancillary benefits from certain decisions made by the Investment Adviser. The Investment Adviser
may also make decisions and exercise discretion with respect to the Fund that could benefit BlackRock Entities that have invested in the Fund.
Temporary Investments in Cash Management Products. Subject to applicable law, the Fund may invest, on a temporary basis, in short-term, high-grade assets or other cash
management products, including SEC-registered investment funds (open-end or closed-end) or unregistered funds, including any such funds that are sponsored, managed or serviced by advisory BlackRock Entities. In connection with any of these
investments, the Fund will bear all fees pertaining to the investment, including advisory, administrative or 12b-1 fees, and no portion of any fees otherwise payable by the Fund will be offset against fees payable in accordance with any of these
investments (i.e., there could be “double fees” involved in making any of these investments which would not arise in connection with a stockholder’s direct investment in such money market or liquidity funds, because a BlackRock Entity could receive
fees with respect to both the management of the Fund, on one hand, and such cash management products, on the other). In these circumstances, as well as in other circumstances in which any BlackRock Entities receive any fees or other compensation in
any form relating to the provision of services, subject to the Fund’s Governing Documents, no accounting, repayment to the Fund or offset of the Advisory Fee will be required.
Management Responsibilities. The employees and directors of the Investment Adviser or its affiliates are not under any obligation to devote all of their professional time to the
affairs of the Fund, but will devote such time and attention to the affairs of the Fund as BlackRock determines in its discretion is necessary to carry out the operations of the Fund effectively. Employees and directors of the Investment Adviser
engage in other activities unrelated to the affairs of the Fund, including managing or advising other Client Accounts, which presents potential conflicts in allocating management time, services and functions among the Fund and other Client Accounts.
These potential conflicts will be exacerbated in situations where employees may be entitled to greater incentive compensation or other remuneration from certain Client Accounts than from other Client Accounts (including the Fund).
The Investment Adviser may, subject to applicable law, utilize the personnel or services of its affiliates in a variety of ways to make available to the Fund BlackRock’s global capabilities. Although the Investment
Adviser believes this practice generally is in the best interests of its clients, it is possible that conflicts with respect to allocation of investment opportunities, portfolio execution, client servicing or other matters may arise due to
differences in regulatory requirements in various jurisdictions, time differences or other reasons. The Investment Adviser will seek to ameliorate any conflicts that arise and may determine not to utilize the personnel or services of a particular
affiliate in circumstances where it believes the potential conflict outweighs the potential benefits.
Investments by Directors, Officers and Employees of BlackRock Entities. The directors, officers and employees of BlackRock Entities are permitted to buy and sell public or
private securities, commingled vehicles or other investments held by the Fund for their own accounts, or accounts of their family members and in which such BlackRock Entity personnel may have a pecuniary interest, including through accounts (or
investments in funds) managed by BlackRock Entities, in accordance with BlackRock’s personal trading policies. As a result of differing trading and investment strategies or constraints, positions taken by BlackRock Entity directors, officers, and
employees may be the same as or different from, or made contemporaneously or at different times than, positions taken for the Fund.
Such persons and/or investment vehicles they manage also may invest in companies in the same industries as companies in which the Fund expects to invest, and may compete with the Fund for investment opportunities, and
their investments may compete with the Fund’s investments.
In addition, BlackRock personnel may serve on the boards of directors of companies in the same industries as companies in which the Fund expects to invest, which can give rise to conflicting obligations and interests.
As these situations may involve potential conflicts of interest, BlackRock has adopted policies and procedures relating to personal securities transactions, insider trading and other ethical considerations. These
policies and procedures are intended to identify and reduce actual conflicts of interest with clients and to resolve such conflicts appropriately if they do occur.
Issues Relating to the Valuation of Assets. While securities and other property held by the Fund generally will be valued by reference to an independent third-party source, in
certain circumstances holdings may be valued at fair value based upon the principles and methods of valuation set forth in policies adopted by the Investment Adviser as Valuation Designee under the supervision of our Board of Trustees. Moreover, a
significant portion of the assets in which the Fund may directly or indirectly invest may not have a readily ascertainable market value and, subject to applicable law, may be valued at fair value based upon the principles and methods of valuation set
forth in policies adopted by the Investment Adviser as Valuation Designee under the supervision of our Board of Trustees.
Potential Restrictions on the Investment Adviser’s Activities on Behalf of the Fund. From time to time, the Investment Adviser expects to be restricted from purchasing or
selling securities or taking other actions on behalf of the Fund because of regulatory and legal requirements applicable to BlackRock Entities, other Client Accounts and/or the Investment Adviser’s internal policies designed to comply with or limit
the applicability of, or which otherwise relate to, such requirements. An investment fund not advised by BlackRock Entities may not be subject to the same considerations. There may be periods when the Investment Adviser (on behalf of the Fund) may
not initiate or recommend certain types of transactions, may limit or delay purchases, may sell or redeem existing investments, forego transactions or other investment opportunities, restrict or limit the exercise of rights (including voting rights),
or may otherwise restrict or limit their advice with respect to securities or instruments issued by or related to issuers for which BlackRock Entities are performing advisory or other services. Such policies may restrict the Fund’s activities more
than required by applicable law. For example, when BlackRock Entities are engaged to provide advisory or risk management services for an issuer, the Fund may be prohibited from or limited in purchasing or selling interests of that issuer,
particularly in cases where BlackRock Entities have or may obtain material nonpublic information about the issuer. Similar prohibitions or limitations could also arise if: (i) BlackRock Entity personnel serve as directors or officers of issuers, the
securities or other interests of which the Fund wishes to purchase or sell, (ii) the Investment Adviser on behalf of the Fund participates in a transaction (including a controlled acquisition of a U.S. public company) that results in the requirement
to restrict all purchases, sales and voting of equity securities of such target issuer, or (iii) regulations, including portfolio affiliation rules or stock exchange rules, prohibit participation in offerings by an issuer when other Client Accounts
have prior holdings of such issuer’s securities or desire to participate in such a public offering, or where other Client Accounts have or may have short positions in such issuer’s securities. However, where permitted by applicable law, and where
consistent with the BlackRock Entities’ policies and procedures, the BlackRock Entities may, but are not obligated to, seek to avoid such prohibitions or limitations (such as through the implementation of appropriate information barriers), and in
such cases, the Investment Adviser on behalf of the Fund may purchase or sell securities or instruments that are issued by such issuers. In addition, certain activities and actions may also be considered to result in reputational risk or disadvantage
for the management of the Fund and/or for the Investment Adviser and its affiliates, and the Investment Adviser may decline or limit an investment opportunity or dispose of an existing investment as a result.
In addition, in regulated industries and in certain markets, and in certain futures and derivative transactions, there are limits on the aggregate amount of investment by affiliated investors that may not be exceeded
without a regulatory filing, the grant of a license or other regulatory or corporate consent. For example, the U.S. Commodity Futures Trading Commission (“CFTC”), the U.S. commodities exchanges and certain non-U.S. exchanges have established limits
referred to as “speculative position limits” or “position limits” on the maximum long or short (or, for some commodities, the gross) positions which any person or group of persons may own, hold or control in certain futures or options on futures
contracts, and such rules generally require aggregation of the positions owned, held or controlled by related entities. Any such limits may prevent the Fund from acquiring positions that might otherwise have been desirable or profitable. Under
certain circumstances, the Investment Adviser may restrict a purchase or sale of securities, derivative instruments or other assets on behalf of Client Accounts in anticipation of a future conflict that may arise if such purchase or sale would be
made. Any such determination will take into consideration the interests of the relevant Client Accounts, the circumstances that would give rise to the future conflict and applicable law. Such determination will be made on a case by case basis.
Other Services and Activities of the BlackRock Entities. The BlackRock Entities (including the Investment Adviser) will, from time to time, provide financial, consulting and
other services to, and receive compensation from, an entity which is the issuer of a security or other investment held by the Fund, counterparties to transactions with the Fund or third parties that also provide services to the Fund. In addition, the
BlackRock Entities (including the Investment Adviser) may purchase property (including securities) from, sell property (including securities) or lend funds to, or otherwise deal with, any entity which is the issuer of a security held by the Fund,
counterparties to transactions with the Fund or third parties that also provide services to the Fund. It is also likely that the Fund will have multiple business relationships with and will invest in, engage in transactions with, make voting
decisions with respect to, or obtain services from entities for which BlackRock Entities perform or seek to perform certain financial services. Conflicts are expected to arise in connection with the foregoing.
The BlackRock Entities may derive ancillary benefits from providing investment advisory, administrative and other services to the Fund, and providing such services to the Fund may enhance the BlackRock Entities’
relationships with various parties, facilitate additional business development, and enable the BlackRock Entities to obtain additional business and generate additional revenue.
Potential Restrictions and Issues Relating to Information Held by BlackRock. The Investment Adviser may not have access to information and personnel of all BlackRock Entities,
including as a result of informational barriers constructed between different investment teams and groups within BlackRock focusing on alternative investments and otherwise. Therefore, the Investment Adviser may not be able to manage the Fund with
the benefit of information held by one or more other investment teams and groups within the BlackRock Entities. However, although it is under no obligation to do so, if it is permitted to do so, the Investment Adviser may consult with personnel on
other investment teams and in other groups within BlackRock, or with persons unaffiliated with BlackRock, or may form investment policy committees composed of such personnel, and in certain circumstances, personnel of affiliates of the Investment
Adviser may have input into, or make determinations regarding, portfolio management transactions for the Fund, and may receive information regarding the Investment Adviser’s proposed investment activities for the Fund that generally is not available
to the public. There will be no obligation on the part of such persons to make available for use by the Fund any information or strategies known to them or developed in connection with their own client, proprietary or other activities. In addition,
BlackRock will be under no obligation to make available any research or analysis prior to its public dissemination.
The Investment Adviser makes decisions for the Fund based on the Fund’s investment program. The Investment Adviser from time to time may have access to certain fundamental analysis, research and proprietary technical
models developed by BlackRock Entities and their personnel. There will be no obligation on the part of the BlackRock Entities to make available for use by the Fund, or to effect transactions on behalf of the Fund on the basis of, any such
information, strategies, analyses or models known to them or developed in connection with their own proprietary or other activities. In certain cases, such personnel will be prohibited from disclosing or using such information for their own benefit
or for the benefit of any other person, including the Fund and other Client Accounts. In other cases, fundamental analyses, research and proprietary models developed internally may be used by various BlackRock Entities and their personnel on behalf
of different Client Accounts, which could result in purchase or sale transactions in the same security at different times (and could potentially result in certain transactions being made by one portfolio manager on behalf of certain Client Accounts
before similar transactions are made by a different portfolio manager on behalf of other Client Accounts), or could also result in different purchase and sale transactions being made with respect to the same security. The Investment Adviser may also
effect transactions for the Fund that differ from fundamental analysis, research or proprietary models issued by the BlackRock Entities or by the Investment Adviser itself in various contexts. The foregoing transactions may negatively impact the Fund
and its direct and indirect investments through market movements or by decreasing the pool of available securities or liquidity, which effects can be more pronounced in thinly traded securities and less liquid markets.
The BlackRock Entities and different investment teams and groups within the Investment Adviser have no obligation to seek information or to make available to or share with the Fund or any third-party manager with which
the Fund invests any information, research, investment strategies, opportunities or ideas known to BlackRock Entity personnel or developed or used in connection with other clients or activities. The BlackRock Entities and different investment teams
and groups within the Investment Adviser may compete with the Fund or any third-party manager with which the Fund invests for appropriate investment opportunities on behalf of their other Client Accounts. The results of the investment activities of
the Fund may differ materially from the results achieved by BlackRock Entities for other Client Accounts. BlackRock Entities may give advice and take action with respect to other Client Accounts that may compete or conflict with the advice the
Investment Adviser may give to the Fund, including with respect to their view of the operations or activities of an investment, the return of an investment, the timing or nature of action relating to an investment or the method of exiting an
investment.
BlackRock Entities may restrict transactions for themselves, but not for the Fund, or vice versa. BlackRock Entities and certain of their personnel, including the Investment Adviser’s personnel or other BlackRock
Entity personnel advising or otherwise providing services to the Fund, may be in possession of information not available to all BlackRock Entity personnel, and such personnel may act on the basis of such information in ways that have adverse effects
on the Fund. The Fund could sustain losses during periods in which BlackRock Entities and other Client Accounts achieve significant profits.
Material, Nonpublic Information. The Investment Adviser and its personnel may not trade for the Fund or other Client Accounts or for their own benefit or recommend trading in
financial instruments of a company while they are in possession of material, nonpublic or price sensitive information (“Inside Information”) concerning such company, or disclose such Inside Information to any person not entitled to receive it. The
BlackRock Entities (including the Investment Adviser) may have access to Inside Information. The Investment Adviser has instituted an internal information barrier policy designed to prevent securities laws violations based on access to Inside
Information. Accordingly, there may be certain cases where the Investment Adviser may be restricted from effecting purchases and/or sales of interests in securities or other financial instruments, or entering into certain transactions or exercising
certain rights under such transactions on behalf of the Fund and/or the other Client Accounts. There can be no assurance that the Investment Adviser will not receive Inside Information and that such restrictions will not occur. At times, the
Investment Adviser, in an effort to avoid restriction for the Fund or the other Client Accounts, may elect not to receive Inside Information, which may be relevant to the Fund’s portfolio, that other market participants are eligible to receive or
have received and could affect decisions that would have otherwise been made.
Any partner, officer or employee of the BlackRock Entities may serve as an officer, director, advisor or in comparable management functions for the investments of other Client Accounts, and any such person may obtain
Inside Information in connection therewith, or in connection with such partner’s, officer’s or employee’s other activities in the financial markets. In an effort to manage possible risks arising from the internal sharing of material nonpublic
information, BlackRock maintains a list of restricted securities with respect to which it has access to material nonpublic information and in which Client Accounts are restricted from trading. If partners, officers or employees of BlackRock obtain
such material nonpublic information about a portfolio company which is an investment of a Client Account, the Fund may be prohibited by law, policy or contract, for a period of time, from (i) unwinding a position in such company, (ii) establishing an
initial position or taking any greater position in such company and/or (iii) pursuing other investment opportunities, which could impact the returns to the Fund. In addition, in certain circumstances, particularly during the liquidation of a Client
Account, the Fund may be prohibited from trading a position that it holds, directly or indirectly, in the Client Account because BlackRock determines that one or more partners, officers or employees of BlackRock holds material nonpublic information
with respect to one or more remaining positions held by the Client Account.
Transactions with Certain Shareholders. The Fund is permitted to enter into transactions with certain shareholders, subject to applicable law. For example, the Investment
Adviser may be presented with opportunities to receive financing and/or other services in connection with the Fund’s operations and/or the Fund’s investments from certain shareholders or their affiliates that are engaged in lending or related
business, which subjects the Investment Adviser to conflicts of interest.
The Fund’s Use of Investment Consultants and BlackRock’s Relationship with Investment Consultants. Shareholders may work with pension or other institutional investment
consultants (collectively, “Investment Consultants”). Investment Consultants provide a wide array of services to pension plans and other institutions, including assisting in the selection and monitoring of investment advisers such as the Investment
Adviser. From time to time, Investment Consultants who recommend the Investment Adviser to, and provide oversight of the Investment Adviser for, shareholders may also provide services to or purchase services from the BlackRock Entities. For example,
the BlackRock Entities purchase certain index and performance-related databases and human resources-related information from Investment Consultants and their affiliates. The BlackRock Entities also utilize brokerage execution services of Investment
Consultants or their affiliates, and BlackRock Entities personnel may attend conferences sponsored by Investment Consultants. Conversely, from time to time, the BlackRock Entities may be hired by Investment Consultants and their affiliates to provide
investment management and/or risk management services, creating possible conflicts of interest.
Other Relationships with BlackRock Entities, Clients and Market Participants. The BlackRock Entities have developed, and will in the future develop, relationships with (or may
invest in) a significant number of clients and other market participants (e.g., financial institutions, service providers, managers of investment funds, banks, brokers, advisors, joint venturers, consultants, finders (including executive finders),
executives, attorneys, accountants, institutional investors, family offices, lenders, current and former employees, and current and former portfolio investment executives, as well as certain family members or close contacts of these persons),
including those that may hold or may have held investments similar to the investments intended to be made by the Fund, that may themselves represent appropriate investment opportunities for the Fund, or that may compete with the Fund for investment
opportunities. Furthermore, the Investment Adviser generally exercises its discretion to recommend to the Fund or to an investment thereof that it contracts for services with such clients and market participants, and/or with other BlackRock Entities.
It is difficult to predict the circumstances under which these relationships could become material conflicts for the Fund, but it is possible that as a result of such relationships (or agreements with other Client Accounts) the Investment Adviser may
refrain from making all or a portion of any investment or a disposition on behalf of the Fund, which may materially adversely affect the performance of the Fund. Certain of these persons or entities will invest (or will be affiliated with an
investor) in, engage in transactions with and/or provide services (including services at reduced rates) to, the BlackRock Entities and/or Client Accounts and/or their affiliates. BlackRock expects to be subject to a potential conflict of interest
with the Fund in recommending the retention or continuation of a third-party service provider to such Fund or a portfolio investment if such recommendation, for example, is motivated by a belief that the service provider or its affiliate(s) will
continue to invest in the Fund or one or more Client Accounts, will provide the BlackRock Entities information about markets and industries in which the BlackRock Entities operate (or are contemplating operations) or will provide other services that
are beneficial to the BlackRock Entities, the Fund or one or more Client Accounts. The Investment Adviser expects to be subject to a potential conflict of interest in making such recommendations, in that Investment Adviser has an incentive to
maintain goodwill between it and clients and other market participants, while the products or services recommended may not necessarily be the best available or most cost effective to the Fund or its investments.
Legal Representation. The Fund, as well as the Investment Adviser and/or other BlackRock Entities, have engaged several counsel to represent them. In connection with such
representation, counsel has relied upon certain information furnished to them by the Investment Adviser and the BlackRock Entities, and has not investigated or verified the accuracy or completeness of such information. Such counsel’s engagement is
limited to the specific matters as to which they are consulted and, therefore, there may exist facts or circumstances that could have a bearing on the Fund’s or BlackRock’s financial condition or operations with respect to which counsel has not been
consulted and for which they expressly disclaim any responsibility. Counsel has not represented and will not be representing shareholders. No independent counsel has been retained (or is expected to be retained) to represent shareholders. No
attorney-client relationship exists between any counsel and any stockholder solely by such stockholder making an investment in the Fund. As a result, shareholders are urged to retain their own counsel.
Resolution of Conflicts. Any conflicts of interest that arise between the Fund or particular shareholders, on the one hand, and other Client Accounts or BlackRock Entities or
affiliates thereof, on the other hand, will be discussed and resolved on a case-by-case basis by business, legal and compliance officers of the Investment Adviser and its affiliates, as applicable. Any such discussions will take into consideration
the requirements of applicable law and regulation, the interests of the relevant parties and the circumstances giving rise to the conflicts. Shareholders should be aware that conflicts will not necessarily be resolved in favor of the interests of the
Fund or any affected stockholder. There can be no assurance that any actual or potential conflicts of interest will not result in the Fund receiving less favorable investment or other terms with respect to investments, transactions or services than
if such conflicts of interest did not exist.
Potential Impact on the Fund. It is difficult to predict the circumstances under which one or more of the foregoing conflicts could become material, but it is possible that
such relationships could require the Fund to refrain from making all or a portion of any investment or a disposition in order for BlackRock to comply with its fiduciary duties, the 1940 Act, the Advisers Act or other applicable law. The Investment
Adviser may, under certain circumstances, seek to have conflicts or transactions involving conflicts approved in accordance with the governing agreements of the Fund. Copies of Part 2A of the Investment Adviser’s Form ADV, which includes additional
detail regarding conflicts of interest that are relevant to BlackRock’s investment management business, are available at www.sec.gov and will be provided to current and prospective shareholders upon request.
The foregoing list of potential and actual conflicts of interest does not purport to be a complete enumeration of the conflicts attendant to an investment in the Fund. Additional conflicts may exist that are not
presently known to the Investment Adviser, BlackRock or their respective affiliates or are deemed immaterial. Prospective investors should consult with their independent advisors before deciding whether to invest in the Fund. In addition, as the
investment program of the Fund develops and changes over time, an investment in the Fund may be subject to additional and different actual and potential conflicts of interest.
Changes in laws may negatively impact our business, results of operations or financial condition.
The Fund is subject to changing rules and regulations of federal and state governments. These entities, including the Public Fund Accounting Oversight Board and the SEC have issued a significant number of new and
increasingly complex requirements and regulations over the course of the last several years and continue to develop additional regulations.
Changes in the laws or regulations or the interpretations of the laws and regulations that govern BDCs, RICs or non-depository commercial lenders could significantly affect the Fund’s operations and cost of doing
business. The Fund is subject to federal, state and local laws and regulations and are subject to judicial and administrative decisions that affect the Fund’s operations, including its loan originations, maximum interest rates, fees and other
charges, disclosures to portfolio companies, the terms of secured transactions, collection and foreclosure procedures and other trade practices. If these laws, regulations or decisions change, or the Fund expands its business into jurisdictions that
have adopted more stringent requirements than those in which the Fund currently conducts business, the Fund may have to incur significant expenses in order to comply, or the Fund might have to restrict its operations. In addition, if the Fund does
not comply with applicable law, the Fund may lose licenses needed for the conduct of its business and may be subject to civil fines and criminal penalties, any of which could have a material adverse effect upon the Fund’s business, results of
operations or financial condition.
We are subject to risks relating to non-diversification and concentration.
We are classified as a non-diversified investment company within the meaning of the 1940 Act, which means that we are not limited by the 1940 Act with respect to the proportion of our assets that we may invest in
securities of a single issuer. Under the 1940 Act, a “diversified” investment company is required to invest at least 75% of the value of its total assets in cash and cash items, government securities, securities of other investment companies and
other securities limited in respect of any one issuer to an amount not greater than 5% of the value of the total assets of such company and no more than 10% of the outstanding voting securities of such issuer. As a non-diversified investment company,
we are not subject to this requirement. To the extent that we assume large positions in the securities of a small number of issuers, or within a particular industry, our NAV may fluctuate to a greater extent than that of a diversified investment
company as a result of changes in the financial condition or the market’s assessment of the issuer. We may also be more susceptible to any single economic or regulatory occurrence than a diversified investment company or to a general downturn in the
economy. However, we will be subject to the diversification requirements applicable to RICs under Subchapter M of the Code. See “U.S. Federal Income Tax Matters-Taxation of the Fund.”
Beyond the Fund's asset diversification requirements as a RIC under the Code, the Fund does not have fixed guidelines for diversification, and our investments could be concentrated in relatively few portfolio
companies. In addition, the Fund does not have fixed guidelines for diversification by industry or type of security, and investments may be concentrated in only a few industries or types of securities. Further, if the expected amount of leverage is
not obtained or deployed, the Fund may be more concentrated in an investment than originally anticipated. As a result, the Fund's investments could be concentrated and the poor performance of a single investment could have pronounced negative
consequences to the Fund and the aggregate returns realized by the shareholders. To the extent the Fund's investments are concentrated in the securities of companies in a specific market sector or industry, the Fund's portfolio may be more exposed to
the price movements of companies in and developments affecting that sector or industry than a more broadly diversified portfolio. Concentration in a particular sector increases the risk of poor performance during a downturn in that sector.
When we borrow money, the potential for loss on amounts invested in us will be magnified and may increase the risk of investing in us. Borrowed money may also adversely affect the
return on our assets, reduce cash available for distribution to our shareholders and result in losses.
The Fund has entered into credit facility and revolving credit facility agreements in order to finance investments or pay expenses with borrowings (such indebtedness “Credit Facility Debt”). Such Credit Facility Debt
may be important for the Fund’s operations because it allows the Advisers to manage cash. A number of factors may result in the inability of the Fund to access Credit Facility Debt comparable to those available to other Client Accounts. These factors
may include, among others: insufficient diversity of investments, the profile and creditworthiness of shareholders, the size of the Fund, the availability of Credit Facility Debt to the Fund in light of the current state of the global credit markets,
whether or not any financing is with recourse to the Fund and how a lender views the worth of recourse provided, the scope of assurances shareholders are willing to provide to financing sources, the Fund’s lack of operating history or trading history
with counterparties and the time at which the Fund seeks financing.
The Advisers may obtain Credit Facility Debt for one or more Client Accounts and is under no obligation to make such financing available to the Fund. Differences in availability and terms of Credit Facility Debt
resulting from such factors may affect the performance of the Fund relative to other Client Accounts. In the event that the Advisers are unable to obtain sufficient Credit Facility Debt for the Fund, the Fund may need to hold larger amount of cash
reserves than it would if the Fund were able to obtain sufficient Credit Facility Debt. The failure by the Fund to obtain Credit Facility Debt on favorable terms (or at all) could adversely affect the returns of the Fund.
As a BDC, the Fund may issue “senior securities,” including borrowing money from banks or other financial institutions only in amounts such that the Fund meets applicable asset coverage requirements under the 1940 Act.
A BDC is generally not permitted to issue senior securities unless after giving effect thereto the BDC meets a coverage ratio of total assets, less liabilities and indebtedness not represented by senior securities, to total senior securities, which
includes all borrowings of the BDC, of at least 200%. Provided that a BDC meets certain disclosure requirements and obtains certain approvals, the asset coverage requirement applicable to such BDC is reduced from 200% to 150%. The reduced asset
coverage requirement permits a BDC to have a ratio of total consolidated assets to outstanding indebtedness of 2:1 as compared to a maximum of 1:1 under the 200% asset coverage requirement. On March 16, 2022, our sole shareholder approved the
adoption of this 150% threshold pursuant to Section 61(a)(2) of the 1940 Act and such election became effective the following day.
1940 Act asset coverage requirements limit the amount that the Fund may borrow and may unfavorably limit the Fund’s ability to utilize Credit Facility Debt. If the value of the Fund’s assets declines, the Fund may be
unable to satisfy the asset coverage test, which could prohibit the Fund from paying distributions. If the Fund cannot satisfy the asset coverage test, the Fund may be required to sell a portion of its investments and repay a portion of its
indebtedness at a time when such sales may be disadvantageous. Accordingly, any failure to satisfy this test could have a material adverse effect on the Fund’s business, financial condition or results of operations.
We may default under our credit facilities.
In the event the Fund defaults under the terms of its credit facilities or other borrowings, the Fund’s business could be adversely affected as the Fund may be forced to sell a portion of our investments quickly and
prematurely at what may be disadvantageous prices to the Fund in order to meet our outstanding payment obligations and/or support working capital requirements under such borrowing facility, any of which would have a material adverse effect on the
Fund’s business, financial condition, results of operations and cash flows. In addition, following any such default, the agent for the lenders under such borrowing facility could assume control of the disposition of any or all of the Fund’s assets,
including the selection of such assets to be disposed and the timing of such disposition, which would have a material adverse effect on the Fund’s business, financial condition, results of operations and cash flows.
We are uncertain of our sources for funding future distributions.
The Fund has not established any limit on the amount of funds we may use from available sources, such as borrowings, if any, or proceeds from our offerings, to fund distributions (which may reduce the amount of capital
we ultimately invest in assets). Shareholders should understand that any distributions made from sources other than cash flow from operations or relying on fee or expense reimbursement waivers, if any, from the Investment Adviser or the Administrator
are not based on the Fund’s investment performance, and can only be sustained if the Fund achieves positive investment performance in future periods and/or the Investment Adviser or the Administrator continues to makes such expense reimbursements, if
any. The extent to which the Fund pays distributions from sources other than cash flow from operations will depend on various factors, including the level of participation in the Fund’s distribution reinvestment plan, how quickly the Fund invests the
proceeds from any offering and the performance of the Fund’s investments. Shareholders should also understand that our future repayments to the Investment Adviser will reduce the distributions that they would otherwise receive. Shareholders should
also understand that the Fund’s future repayments to the Investment Adviser will reduce the distributions that they would otherwise receive. There can be no assurance that the Fund will achieve such performance in order to sustain these
distributions, or be able to pay distributions at all. The Investment Adviser and the Administrator have no obligation to waive fees or receipt of expense reimbursements, if any.
Although we have adopted a share repurchase program, we have discretion to not repurchase your shares and to suspend the program.
Although we have adopted a share repurchase program, we have discretion to not repurchase your shares and to suspend the program. Our Board of Trustees may amend or suspend the share repurchase program at any time in
its discretion. You may not be able to sell your shares at all in the event our Board of Trustees amends, suspends or terminates the share repurchase program, absent a liquidity event, and we do not intend to undertake a liquidity event, and we are
not obligated by our Declaration of Trust or otherwise to effect a liquidity event at any time. We will notify you of such developments in our quarterly reports or other filings. If less than the full amount of Common Shares requested to be
repurchased in any given repurchase offer are repurchased, funds will be allocated pro rata based on the total number of Common Shares being repurchased without regard to class. The share repurchase program has many limitations and should not be
relied upon as a method to sell shares promptly or at a desired price. Shareholders should also understand that if during any consecutive four-quarter period (“Four Quarter Period”), there is not at least one quarter in which the Fund fully accepts
all properly submitted tenders in a repurchase offer, the Investment Adviser will intend to recommend that the Board approve a plan pursuant to which the Fund will not make any new investments (excluding some investments – see “Share Repurchase
Program”) and will use all “capital available for investing” to accept properly submitted tenders until such time that all properly submitted tenders in any one repurchase offer have been fully accepted; provided that the Investment Adviser does not
intend to make such recommendations to the Board if the Fund has, during such Four Quarter Period, accepted repurchase offers for at least (i) 5% of the aggregate Common Shares outstanding (either by number of shares or aggregate NAV) in each of the
quarters in such Four Quarter Period or (ii) the equivalent aggregate percentage (i.e. 20%) of Common Shares outstanding (either by number of shares or aggregate NAV)) during such Four Quarter Period. In addition, shareholders should also understand
that if, during any Four Quarter Period, there is not at least one quarter in which the Fund fully accepts all properly submitted tenders in a repurchase offer, then beginning at the end of such Four Quarter Period the Investment Adviser will defer
its incentive fee until all properly submitted tenders in any one repurchase offer have been accepted, after which such deferred incentive fee will become payable and no further incentive fee amounts will be required to be deferred; provided that the
Investment Adviser is not required to defer its incentive fee if the Fund has, during such Four Quarter Period, accepted repurchase offers for at least (i) 5% of the aggregate Common Shares outstanding (either by number of shares or aggregate NAV) in
each of the quarters in such Four Quarter Period or (ii) the equivalent aggregate percentage (i.e. 20%) of Common Shares outstanding (either by number of shares or aggregate NAV)) during such Four Quarter Period. If the Fund takes either action, it
could negatively impact the Fund’s ability to achieve its investment objectives.
The timing of our repurchase offers pursuant to our share repurchase program may be at a time that is disadvantageous to our shareholders.
The timing of our repurchase offers pursuant to our share repurchase program may be at a time that is disadvantageous to our shareholders. In the event a shareholder chooses to participate in our share repurchase
program, the shareholder will be required to provide us with notice of intent to participate prior to knowing what the NAV per share of the class of shares being repurchased will be on the Repurchase Date. Although a shareholder will have the ability
to withdraw a repurchase request prior to the Repurchase Date, to the extent a shareholder seeks to sell shares to us as part of our periodic share repurchase program, the shareholder will be required to do so without knowledge of what the repurchase
price of our shares will be on the Repurchase Date.
If we are unable to raise substantial funds, then we will be more limited in the number and type of investments we may make, our expenses may be higher relative to our total
assets, and the value of your investment in us may be reduced in the event our assets under-perform.
Amounts that the Fund raises may not be sufficient for us to purchase a broad portfolio of investments. To the extent that less than the maximum number of Common Shares is subscribed for, the opportunity for the Fund
to purchase a broad portfolio of investments may be decreased and the returns achieved on those investments may be reduced as a result of allocating all of our expenses among a smaller capital base. If the Fund is unable to raise substantial funds,
we may not achieve certain economies of scale and our expenses may represent a larger proportion of our total assets.
We may have difficulty sourcing investment opportunities.
We cannot assure investors that we will be able to locate a sufficient number of suitable investment opportunities to allow us to deploy all investments successfully. In addition, privately-negotiated investments in
loans and illiquid securities of private middle market companies require substantial due diligence and structuring, and we cannot assure investors that we will achieve our anticipated investment pace. As a result, investors will be unable to evaluate
any future portfolio company investments prior to purchasing our shares. Additionally, our Advisers will select our investments subsequent to our offerings, and our shareholders will have no input with respect to such investment decisions. These
factors increase the uncertainty, and thus the risk, of investing in our shares. To the extent we are unable to deploy all investments, our investment income and, in turn, our results of operations, will likely be materially adversely affected.
Special considerations exist for certain benefit plan investors.
We intend to conduct our affairs so that our assets should not be deemed to constitute “plan assets” under ERISA and the Plan Asset Regulations. In this regard, until such time as all classes of our Common Shares are
considered “publicly-offered securities” within the meaning of the Plan Asset Regulations, we intend to limit investment in each class of our Common Shares so that holdings by “benefit plan investors” are not “significant” (within the meaning of the
Plan Asset Regulations).
If, notwithstanding our intent, the assets of the Fund were deemed to be “plan assets” of any shareholder that is a “benefit plan investor” under the Plan Asset Regulations, this would result, among other things, in
(i) the application of the prudence and other fiduciary responsibility standards of ERISA to investments made by the Fund, and (ii) the possibility that certain transactions in which the Fund might seek to engage could constitute “prohibited
transactions” under ERISA and the Code. If a prohibited transaction occurs for which no exemption is available, among other things, the Advisers and/or any other fiduciary that has engaged in the prohibited transaction could be required to (i)
restore to the “benefit plan investor” any profit realized on the transaction and (ii) reimburse the “benefit plan investor” for any losses suffered by the “benefit plan investor” as a result of the investment. In addition, each disqualified person
(within the meaning of Section 4975 of the Code) involved could be subject to an excise tax equal to 15% of the amount involved in the prohibited transaction for each year the transaction continues and, unless the transaction is corrected within
statutorily required periods, to an additional tax of 100%. The Fiduciary of a “benefit plan investor” who decides to invest in the Fund could, under certain circumstances, be liable for prohibited transactions or other violations as a result of
their investment in the Fund or as co- fiduciaries for actions taken by or on behalf of the Fund or the Advisers. With respect to a “benefit plan investor” that is an individual retirement account (an “IRA”) that invests in the Fund, the occurrence
of a non-exempt prohibited transaction involving the individual who established the IRA, or his or her beneficiaries, would cause the IRA to lose its tax-exempt status.
Until such time as all the classes of our Common Shares constitute “publicly traded securities” within the meaning of the Plan Asset Regulations, we have the power to (a) exclude any shareholder or potential
shareholder from purchasing or transferring our Common Shares; (b) prohibit any redemption of our Common Shares; and (c) redeem some or all Common Shares held by any holder in each case if, and to the extent that, our Board of Trustees determines
that there is a substantial risk that such holder’s purchase, ownership or redemption of Common Shares would result in our assets to be characterized as “plan assets,” for purposes of the fiduciary responsibility or prohibited transaction provisions
of ERISA or Section 4975 of the Code, and all Common Shares of the Fund shall be subject to such terms and conditions.
Prospective investors should carefully review the matters discussed under “Restrictions on Share Ownership” and should consult with their own advisors as to the consequences of making an investment in the Fund.
Shareholders may experience dilution.
All distributions declared in cash payable to shareholders that are participants in our distribution reinvestment plan will generally be automatically reinvested in our Common Shares. As a result, shareholders that do
not participate in our distribution reinvestment plan may experience dilution over time. Holders of our Common Shares will not have preemptive rights to any shares we issue in the future. Our Declaration of Trust allows us to issue an unlimited
number of Common Shares. Our Board of Trustees may elect, without shareholder approval, to: (1) sell additional shares in future public offerings; (2) issue Common Shares or interests in any of our subsidiaries in private offerings; (3) issue Common
Shares upon the exercise of the options we may grant to our Independent directors or future employees; or (4) subject to applicable law, issue Common Shares in payment of an outstanding obligation to pay fees for services rendered to us. To the
extent we issue additional Common Shares, your percentage ownership interest in us will be diluted. Because of these and other reasons, our shareholders may experience substantial dilution in their percentage ownership of our shares or their
interests in the underlying assets held by our subsidiaries.
The NAV of our Common Shares may fluctuate significantly.
The NAV of the Fund’s Common Shares may be significantly affected by numerous factors, some of which are beyond our control and may not be directly related to our operating performance. These factors include:
| • |
changes in regulatory policies or tax guidelines, particularly with respect to RICs or BDCs;
|
| • |
loss of RIC or BDC status;
|
| • |
changes in earnings or variations in operating results;
|
| • |
changes in the value of the Fund’s portfolio of investments;
|
| • |
changes in accounting guidelines governing valuation of our investments;
|
| • |
any shortfall in revenue or net income or any increase in losses from levels expected by investors;
|
| • |
departure of either of our adviser or certain of its respective key personnel;
|
| • |
general economic trends and other external factors; and
|
| • |
loss of a major funding source.
|
Our shares may be held by a diverse shareholder group.
The Fund’s shareholders are expected to be based in a wide variety of jurisdictions and take a wide variety of forms. The shareholders may have conflicting investment, tax and other interests with respect to their
investments in the Fund and with respect to the interests of investors in other Client Accounts managed or advised by the Advisers and the BlackRock Entities that may participate in the same investments as the Fund. The conflicting interests of
individual shareholders with respect to other shareholders and relative to investors in other investment vehicles would generally relate to or arise from, among other things, the nature of investments made by the Fund and such other partnerships, the
structuring or the acquisition of investments and the timing of disposition of investments. As a consequence, conflicts of interest may arise in connection with the decisions made by the Advisers or other BlackRock Entities, including with respect to
the nature or structuring of investments that may be more beneficial for one investor than for another investor, especially with respect to investors’ individual tax situations.
In addition, the Fund may make investments that may have a negative impact on related investments made by the shareholders in separate transactions. In selecting and structuring investments appropriate for the Fund,
the Advisers will consider the investment and tax objectives of the Fund and the shareholders as a whole, not the investment, tax or other objectives of any shareholder individually. In addition, certain shareholders also may be investors in other
Client Accounts, including supplemental capital vehicles and co-investment vehicles that may invest alongside the Fund in one or more investments, consistent with applicable law and/or any applicable SEC-granted order. Shareholders also may include
affiliates of the Advisers, including other Client Accounts. BlackRock-related or affiliated shareholders will have equivalent rights to vote and withhold consents as nonrelated shareholders. Nonetheless, BlackRock may have the ability to influence,
directly or indirectly, BlackRock-related or affiliated shareholders.
We may also offer Institutional shares to other investment vehicles, including certain feeder vehicles primarily created to hold our Institutional shares, which in turn offer interests in themselves to investors. We
conduct such offerings to feeder vehicles pursuant to exceptions to registration under the Securities Act. Such feeder vehicles may be sponsored by affiliates of the Advisers or other financial institutions. Such feeder vehicles may have additional
costs and expenses, including performance based fees, which would be disclosed by such feeder vehicles in connection with the offering of their interests. BlackRock, out of its own resources and not out of Fund assets, may incur costs and expenses in
connection with the formation and operation of such feeder vehicles. BlackRock may have incentives to refer potential investors to feeder vehicles.
Certain investors may invest through asset allocation programs, such as model portfolio management programs and similar arrangements. Rebalancing decisions by such programs may result in simultaneous subscriptions or
repurchase requests by such investors.
Our shares may be purchased by the Advisers or their affiliates.
BlackRock Financial Management, Inc., our Administrator and an affiliate of the Advisers, has purchased our Common Shares, and as of December 31, 2025 holds approximately 8.88% of our outstanding common shares. The
Advisers, our Administrator and their affiliates may purchase our Common Shares in the future. The Advisers, our Administrator and their affiliates will not acquire Common Shares with the intention to resell or re-distribute such shares. The purchase
of Common Shares by the Advisers, our Administrator and their affiliates could create certain risks, including, but not limited to, that the Advisers, our Administrator and their affiliates may have an interest in disposing of our assets at an
earlier date so as to recover their investment in our Common Shares. Shareholders who beneficially own 25% or more of the outstanding Common Shares of the Fund may be deemed to “control” the Fund for purposes of the 1940 Act. For so long as the
Advisers, our Administrator or their affiliates hold a significant portion of our Common Shares, they may exert a significant influence on the outcome of any matters submitted to a vote of our shareholders.
BlackRock Acquisition of HPS.
On July 1, 2025, BlackRock acquired 100% of the business and assets of HPS LLC (the “BlackRock/HPS Transaction”). There is no guarantee that BlackRock will be able to successfully maintain and continue to build its
business after the BlackRock/HPS Transaction or that BlackRock or the Advisers will be able to realize the anticipated benefits of the acquisition, including synergies, value creation or other benefits, fully or at all, or on the timeline that
BlackRock expects, and a failure to obtain such synergies may adversely affect the operations of BlackRock and the Advisers. In particular, as with any business combination, BlackRock and the Advisers will be subject to substantial risks, including
with respect to the long-term retention of key employees, the successful consolidation of corporate, technological and administrative infrastructures and the retention of existing business and operational relationships. It is possible that employees
currently involved in the operation of the Advisers may not continue with the Advisers as a result of the BlackRock/HPS Transaction and the operations and business relationships of BlackRock and the Advisers may be disrupted following the
BlackRock/HPS Transaction. The integration of HPS LLC into BlackRock will be a complex, costly and time-consuming process and if BlackRock experiences difficulties in this process, the anticipated benefits may not be realized fully or at all, or may
take longer to realize than expected, which could have an adverse effect on BlackRock and the Advisers for an undetermined period. At times, the resources of BlackRock and the Advisers or the attention of certain members of their management may be
focused on integration of the acquisition and diverted from day-to-day business operations, which may disrupt ongoing business. In addition, the integration process may have an adverse impact on BlackRock, including from risks related to significant
transaction and integration costs, unknown liabilities, employee turnover, divergence of management attention, litigation and/or regulatory actions related to the acquisition or if resulting business does not perform as expected, which could
materially affect BlackRock and the Advisers. In the event that the BlackRock/HPS Transaction has an adverse impact on the Advisers, including for the foregoing reasons, our operations and investment results may be adversely affected.
Based on prevailing conditions, we intend to invest the proceeds from each monthly subscription closing generally within 30 to 90 days. The precise timing will depend on the availability of investment opportunities
that are consistent with our investment objective and strategies. Until we are able to find such investment opportunities, we intend to invest the net proceeds of this offering primarily in cash, cash-equivalents, U.S. government securities, money
market funds and high-quality debt instruments maturing in one year or less from the time of investment. This is consistent with our status as a BDC and our intention to qualify annually as a RIC. The Investment Adviser does not expect to be able to
fully achieve its target allocations until the Fund has raised substantial proceeds in this offering and acquired a broad portfolio of investments. During such time, a greater portion of the Fund’s assets may be invested in liquid securities
consistent with the Fund’s investment objective and policies, which will be managed by the Sub-Adviser. The Investment Adviser cannot predict how long the period will last. The actual allocations of the Fund’s portfolio at any time will depend on the
availability of investment opportunities, the Investment Adviser’s assessment of the relative attractiveness of such opportunities, inflows of capital into the Fund anticipated cash requirements and limitations or requirements relating to the Fund’s
status as a BDC and intention to be treated as a RIC for U.S. federal income tax purposes.
We may also use a portion of the net proceeds to pay our operating expenses, fund distributions to shareholders and for general corporate purposes. Any distributions we make during the period before the Fund is fully
invested in accordance with its target allocations may be substantially lower than the distributions that we expect to pay when our portfolio is fully invested.
We estimate that we will incur approximately $4,000,000 of offering and organizational expenses (excluding the shareholder servicing and/or distribution fee) in connection with this offering, or approximately 0.08% of
the gross proceeds, assuming maximum gross proceeds of $5,000,000,000.
The following tables sets forth our estimate of how we intend to use the gross proceeds from this offering. Information is provided assuming that the Fund sells the maximum number of shares registered in this offering,
or 200,160,128 shares. The amount of net proceeds may be more or less than the amount depicted in the table below depending on the public offering price of our shares and the actual number of shares we sell in this offering. The table below assumes
that shares are sold at the current offering price as of March 31, 2026 of $23.52 per share. Such amount is subject to increase or decrease based upon our NAV per share.
The following tables present information about the net proceeds raised in this offering for each class, assuming that we sell the maximum primary offering amount of $5,000,000,000. The tables assume that 1/3 of our
gross offering proceeds are from the sale of Class S shares, 1/3 of our gross offering proceeds are from the sale of Class D shares and 1/3 of our gross offering proceeds are from the sale of Institutional shares. The number of shares of each class
sold and the relative proportions in which the classes of shares are sold are uncertain and may differ significantly from what is shown in the tables below. Because amounts in the following tables are estimates, they may not accurately reflect the
actual receipt or use of the gross proceeds from this offering. Amounts expressed as a percentage of net proceeds or gross proceeds may be higher or lower due to rounding.
The following table presents information regarding the use of proceeds raised in this offering with respect to Class S shares.
|
Maximum Offering of
$1,666,666,666 in
Class S Shares
|
||||||||
|
Gross Proceeds(1)
|
$
|
1,666,666,666
|
100
|
%
|
||||
|
Upfront Sales Load(2)
|
$
|
—
|
—
|
%
|
||||
|
Organization and Offering Expenses(3)
|
$
|
1,333,333
|
0.08
|
%
|
||||
|
Net Proceeds Available for Investment
|
$
|
1,665,333,333
|
99.92
|
%
|
||||
The following table presents information regarding the use of proceeds raised in this offering with respect to Class D shares.
|
Maximum Offering of
$1,666,666,667 in
Class D Shares
|
||||||||
|
Gross Proceeds(1)
|
$
|
1,666,666,667
|
100
|
%
|
||||
|
Upfront Sales Load(2)
|
$
|
—
|
—
|
%
|
||||
|
Organization and Offering Expenses(3)
|
$
|
1,333,333
|
0.08
|
%
|
||||
|
Net Proceeds Available for Investment
|
$
|
1,665,333,334
|
99.92
|
%
|
||||
The following table presents information regarding the use of proceeds raised in this offering with respect to Institutional shares.
|
Maximum Offering of
$1,666,666,667 in
Institutional Shares
|
||||||||
|
Gross Proceeds(1)
|
$
|
1,666,666,667
|
100
|
%
|
||||
|
Upfront Sales Load(2)
|
$
|
—
|
—
|
%
|
||||
|
Organization and Offering Expenses(3)
|
$
|
1,333,333
|
0.08
|
%
|
||||
|
Net Proceeds Available for Investment
|
$
|
1,665,333,333
|
99.92
|
%
|
||||
| (1) |
We intend to conduct a continuous offering of an unlimited number of Common Shares over an unlimited time period by filing a new registration statement prior to the end of the three-year period described in Rule 415 under the Securities
Act; however, in certain states this offering is subject to annual extensions.
|
| (2) |
No upfront sales load will be paid with respect to Class S shares, Class D shares or Institutional shares, however, if you buy Class S shares or Class D shares through certain financial intermediaries, they may directly charge you
transaction or other fees, including upfront placement fees or brokerage commissions, in such amount as they may determine, provided that selling agents limit such charges to a 3.5% cap on NAV for Class S shares and a 1.5% cap on NAV for
Class D shares. Selling agents will not charge such fees on Institutional shares. We will pay the following shareholder servicing and/or distribution fees to the Distributor, subject to FINRA limitations on underwriting compensation: (a) for
Class S shares, a shareholder servicing and/or distribution fee equal to 0.85% per annum of the aggregate NAV of the Class S shares calculated monthly as of the beginning of the first calendar day of the month and (b) for Class D shares, a
shareholder servicing fee equal to 0.25% per annum of the aggregate NAV of the Class D shares calculated monthly as of the beginning of the first calendar day of the month. Shareholder servicing fees and/or distribution fees are similar to a
commission in that the amount an investor pays may exceed the value of services they receive. The total amount that will be paid over time for shareholder servicing and/or distribution fees depends on the average length of time for which
shares remain outstanding, the term over which such amount is measured and the performance of our investments, and is not expected to be paid from sources other than cash flow from operating activities. We will cease paying the shareholder
servicing and/or distribution fee on the Class S shares and Class D shares on the earlier to occur of the following: (i) a listing of Institutional shares, (ii) our merger or consolidation with or into another entity, or the sale or other
disposition of all or substantially all of our assets or (iii) the date following the completion of the primary portion of this offering on which, in the aggregate, underwriting compensation from all sources in connection with this offering,
including the shareholder servicing and/or distribution fee and other underwriting compensation, is equal to 10% of the gross proceeds from our primary offering. In addition, consistent with the exemptive relief allowing us to offer multiple
classes of shares, at the end of the month in which the Distributor in conjunction with the transfer agent determines that total transaction or other fees, including upfront placement fees or brokerage commissions, and shareholder servicing
and/or distribution fees paid with respect to any single share held in a shareholder’s account would exceed, in the aggregate, 10% of the gross proceeds from the sale of such share (or a lower limit as determined by the Distributor or the
applicable selling agent), we will cease paying the shareholder servicing and/or distribution fee on all Class S shares and Class D shares in such shareholder’s account. We may modify this requirement if permitted by applicable exemptive
relief. At the end of the month in which such 10% (or lower) limit is met, the applicable Class S shares and Class D shares in such shareholder’s account will convert into a number of Institutional shares (including any fractional shares),
with an equivalent aggregate NAV as such Class S shares and Class D shares. See “Plan of Distribution.”
|
| (3) |
The organization and offering expense numbers shown above represent our estimates of expenses to be incurred by us in connection with this offering and include estimated wholesaling expenses reimbursable by us. See “Plan of Distribution”
for examples of the types of organization and offering expenses we may incur. Organization and offering expenses may include the reimbursement to the Investment Adviser for organization and offering expenses paid by the Investment Adviser on
our behalf through September 1, 2022, the initial closing date of our continuous public offering, pursuant to the Fee Waiver and Expense Support and Reimbursement Agreement between the Fund and the Investment Adviser. The Investment Adviser
was entitled to reimbursement of such expenses from us during the 36 months following the commencement of the Fund’s operations, to the extent that the Fund’s annual Operating Expenses (as defined herein) did not exceed 1.25% of the value of
the Fund’s net assets, calculated monthly based on month-end net assets of the Fund. The Fee Waiver and Expense Support and Reimbursement Agreement expired on March 18, 2025. On August 26, 2025, the Fund entered into an Expense Support and
Conditional Reimbursement Agreement (the “Expense Support and Conditional Reimbursement Agreement”) with the Investment Adviser. Pursuant to the Expense Support and Conditional Reimbursement Agreement, the Investment Adviser may elect to pay
certain expenses on the Fund’s behalf (an “Expense Payment”), provided that no portion of an Expense Payment will be used to pay any interest expense or shareholder servicing and/or distribution fees of the Fund. Any Expense Payment that the
Investment Adviser has committed to pay shall be paid by the Investment Adviser to the Fund in any combination of cash or other immediately available funds no later than seventy-five days after such commitment was made in writing, and/or
offset against amounts due from the Fund to the Investment Adviser or its affiliates. See “Advisory Agreement, Sub-Advisory Agreement and Administration Agreement—Expense Support and Conditional Reimbursement Agreement” for additional
information regarding the Expense Support Agreement.
|
AND RESULTS OF OPERATIONS
The information in this section contains forward-looking statements that involve risks and uncertainties. Please see “Risk Factors” and “Cautionary Note Regarding Forward-Looking Statements” for a discussion of the
uncertainties, risks and assumptions associated with these statements. You should read the following discussion in conjunction with the financial statements and related notes and other financial information appearing elsewhere in this prospectus.
Overview
The Fund is a Delaware statutory trust formed on December 23, 2021 and is an externally managed, closed-end, non-diversified management investment company. We have elected to be regulated as a BDC under the 1940 Act.
Our investment objective is to target high risk-adjusted returns produced primarily from current income generated by investing primarily in directly originated, senior secured corporate debt instruments. We seek to achieve our investment objective
through investments in privately-originated, performing senior secured debt primarily in North America-based companies with target enterprise values between $100 million and $1.5 billion. Performing debt is debt that at the time of investment is not
defaulted or, in the view of the Advisers, distressed. The Fund targets positions in first lien, second lien and unitranche debt, with a preference for floating-rate debt, which the Advisers believe provides flexibility to adapt to changing market
conditions. The Fund may invest in securities of any maturity and credit quality. Our investment activities will benefit from what we believe are the competitive advantages of our Advisers, including their diverse in-house skills, proprietary deal
flow, and consistent and rigorous investment process focused on established, middle market companies.
The Fund has elected to be treated as a RIC for U.S. federal income tax purposes. As a RIC, the Fund will not be taxed on its income to the extent that it distributes such income each year and satisfies other
applicable income tax requirements.
To qualify as a RIC, we must, among other things, meet certain source-of-income and asset diversification requirements and timely distribute to our shareholders generally at least 90% of our investment company taxable
income, as defined by the Code, for each year. Pursuant to this election, we generally will not have to pay corporate level taxes on any income that we distribute to our shareholders provided that we satisfy those requirements.
On July 1, 2025, BlackRock, Inc. completed its previously announced acquisition of 100% of the business and assets of HPS, a leading global credit investment manager. In connection with the BlackRock/HPS Transaction,
certain senior personnel of HPS joined the Investment Adviser’s investment committee for the Fund’s portfolio as voting members.
Investments
Our level of investment activity can and does vary substantially from period to period depending on many factors, including the amount of debt and equity capital available to middle- market companies, the level of
merger and acquisition activity, the general economic environment and the competitive environment for the types of investments we make.
As a BDC, we are required to comply with certain regulatory requirements. For instance, we generally have to invest at least 70% of our total assets in “qualifying assets,” including securities and indebtedness of
private U.S. companies, public U.S. operating companies whose securities are not listed on a national securities exchange or registered under the Exchange Act, public domestic operating companies having a market capitalization of less than $250.0
million, cash, cash equivalents, U.S. government securities and high-quality debt investments that mature in one year or less. We are also permitted to make certain follow-on investments in companies that were eligible portfolio companies at the time
of initial investment but that no longer meet the definition. As of December 31, 2025, approximately 89.2% of our total assets were invested in qualifying assets.
Revenues
We generate revenues primarily in the form of interest on the debt we hold. We also generate revenue from dividends on our equity interests, capital gains on the disposition of investments, and certain lease, fee, and
other income. Our investments in fixed income instruments generally have an expected maturity of three to five years, although we have no lower or upper constraint on maturity. Interest on our debt investments is generally payable quarterly or
semi-annually. Payments of principal of our debt investments may be amortized over the stated term of the investment, deferred for several years or due entirely at maturity. In some cases, our debt investments and preferred stock investments may
defer payments of cash interest or dividends or PIK. Any outstanding principal amount of our debt investments and any accrued but unpaid interest will generally become due at the maturity date. In addition, we may generate revenue in the form of
prepayment fees, commitment, origination, structuring or due diligence fees, end-of-term or exit fees, fees for providing significant managerial assistance, consulting fees and other investment related income.
Expenses
The Fund will be responsible for paying the compensation of the Investment Adviser. In addition, the Fund will generally be responsible for all operating expenses of the Fund, and shall pay, and shall reimburse the
Investment Adviser or the Administrator and their respective affiliates for, all fees, costs, expenses, liabilities and obligations of the Fund relating or attributable to:
| • |
our organization;
|
| • |
calculating our net asset value (including the cost and expenses of any independent valuation firms);
|
| • |
interest payable on debt, if any, incurred to finance our investments;
|
| • |
the base management fee and any incentive fee;
|
| • |
dividends and distributions on our Common Shares;
|
| • |
administration fees payable under the Administration Agreement;
|
| • |
fees payable to third parties relating to, or associated with, making investments;
|
| • |
transfer agent and custodial fees;
|
| • |
registration fees;
|
| • |
taxes;
|
| • |
trustee fees and expenses;
|
| • |
costs of preparing and filing reports or other documents with the SEC;
|
| • |
costs of any reports, proxy statements or other notices to our shareholders, including printing costs;
|
| • |
our fidelity bond;
|
| • |
directors and officers/errors and omissions liability insurance, and any other insurance premiums;
|
| • |
indemnification payments;
|
| • |
direct costs and expenses of administration, including audit and legal costs; and
|
| • |
all other expenses reasonably incurred by us and the Administrator in connection with administering our business, such as the allocable portion of overhead under the Administration Agreement, including rent and other allocable portions of
the cost of certain of our officers and their respective staffs.
|
The Advisory Agreement provides that the management fee is calculated at an annual rate of 1.25% of the value of the Fund’s net assets at the end of the most recently completed calendar month and payable monthly in
arrears. For purposes of calculating the base management fee, “net assets” means the Fund’s total assets less liabilities determined on a consolidated basis in accordance with GAAP. For the first calendar month in which the Fund had operations, net
assets were measured as the beginning net assets as of the date on which the Fund first issued Common Shares to one or more investors (other than the Investment Adviser and its affiliates). The Investment Adviser agreed to waive its management fee
for the first twelve months following the date of the commencement of the Fund’s operations.
Additionally, the Advisory Agreement provides that the Investment Adviser may be entitled to incentive fee under certain circumstances. According to the terms of such agreement, the incentive fee equals the sum of (i)
12.5% of all net investment income and (ii) 12.5% of all net realized capital gains (net of any net unrealized capital depreciation) less net investment income incentive fee and capital gains incentive fee previously paid. However, incentive fee will
only be paid to the extent the cumulative total return of the Fund after the incentive fee and including such payment would equal or exceed a 5% annual return on daily weighted-average unreturned contributed capital contributions. The determination
of the incentive fee is subject to limitations under the 1940 Act and the Advisers Act.
Pursuant to the Amended and Restated Fee Waiver and Expense Support and Reimbursement Agreement between the Fund and the Investment Adviser, dated as of August 29, 2022, as amended on April 25, 2023, the Investment
Adviser agreed to waive its base management fee and incentive fee for the period from the date of the commencement of the Fund’s operations through December 31, 2023.
Pursuant to the Sub-Advisory Agreement, the Investment Adviser, and not the Fund, will pay a portion of the management fee received by the Investment Adviser to the Sub-Adviser as a sub-advisory fee in an amount equal
to a percentage of the average daily value of the Fund’s assets allocated to the Sub-Adviser.
Pursuant to the Expense Support and Conditional Reimbursement Agreement between the Fund and the Investment Adviser, the Investment Adviser may elect to pay certain expenses on the Fund’s behalf (an “Expense Payment”),
provided that no portion of an Expense Payment will be used to pay any interest expense or shareholder servicing and/or distribution fees of the Fund.
The Investment Adviser has agreed to waive any portion of the income component of the Incentive Fee attributable to the inclusion of Expense Payments (as set forth in the Expense Support and Conditional Reimbursement
Agreement) in the calculation of (i) aggregate net investment income before incentive compensation or (ii) total return.
Critical Accounting Policies and Estimates
Our discussion and analysis of our financial condition and results of operations are based upon our consolidated financial statements, which have been prepared in accordance with GAAP. The preparation of these
consolidated financial statements requires management to make estimates and assumptions that affect the reported amounts of assets, liabilities, revenues and expenses. Changes in the economic environment, financial markets and any other parameters
used in determining such estimates could cause actual results to differ. Management considers the following critical accounting policies important to understanding the consolidated financial statements. In addition to the discussion below, our
critical accounting policies are further described in the notes to our consolidated financial statements.
Valuation of Portfolio Investments
Pursuant to Rule 2a-5 under the 1940 Act, which establishes requirements for determining fair value in good faith for purposes of the 1940 Act, the Fund’s Board of Trustees has designated the Investment Adviser as the
Fund’s Valuation Designee to perform certain fair value functions, including performing fair value determinations. As required by Rule 2a-5, the Valuation Designee provides periodic fair valuation reporting and notifications on behalf of the Fund to
the Board of Trustees to facilitate the Board of Trustees’ oversight duties.
We value our portfolio investments at fair value based upon the principles and methods of valuation set forth in the Valuation Designee’s policies and procedures adopted for the Fund by the Valuation Designee. Fair
value is defined as the price that would be received to sell an asset in an orderly transaction between market participants at the measurement date. Market participants are buyers and sellers in the principal (or most advantageous) market for the
asset that (i) are independent of us, (ii) are knowledgeable, having a reasonable understanding about the asset based on all available information (including information that might be obtained through due diligence efforts that are usual and
customary), (iii) are able to transact for the asset, and (iv) are willing to transact for the asset or liability (that is, they are motivated but not forced or otherwise compelled to do so).
When market quotations are not readily available or are believed by the Valuation Designee to be inaccurate or unreliable, the Fund’s investments are valued at fair value (“Fair Value Assets”). Fair Value Assets are
valued by the Valuation Designee in accordance with the Valuation Procedures. The Valuation Designee may conclude that a market quotation is not readily available, inaccurate or unreliable if a security or other asset or liability does not have a
price source due to its complete lack of trading, if the Valuation Designee believes a market quotation from a broker-dealer or other source is unreliable (e.g., where it varies significantly from a recent trade, or no longer reflects the fair value
of the security or other asset or liability subsequent to the most recent market quotation), where the security or other asset or liability is only thinly traded or due to the occurrence of a significant event subsequent to the most recent market
quotation.
For this purpose, a “significant event subsequent to the most recent market quotation” is deemed to occur if the Valuation Designee determines, in its business judgment prior to or at the time of pricing the Fund’s
assets or liabilities, that it is likely that the event will cause a material change to the last exchange closing price or closing market price of one or more assets or liabilities held by the Fund. Examples of these events could include cases where
a security trades infrequently causing a quoted purchase or sale price to become stale, where markets quotations vary substantially among market makers, or where there is a wide bid-ask spread or significant increase in the bid-ask spread. On any
date the NYSE is open and the primary exchange on which a foreign asset or liability is traded is closed, such asset or liability will be valued using the prior day’s price, provided that the Valuation Designee is not aware of any significant event
or other information that would cause such price to no longer reflect the fair value of the asset or liability, in which case such asset or liability would be treated as a Fair Value Asset. For certain foreign securities, a third-party vendor
supplies evaluated, systematic fair value pricing based upon the movement of a proprietary multi-factor model after the relevant foreign markets have closed. This systematic fair value pricing methodology is designed to correlate the prices of
foreign securities following the close of the local markets to the price that might have prevailed as of the Fund’s pricing time.
A substantial portion of the Fund’s assets are expected to consist of securities of private companies for which there are no readily available market quotations. The information available in the marketplace for such
companies, their securities and the status of their businesses and financial conditions is often extremely limited, outdated and difficult to confirm. Such securities are valued by the Fund monthly at fair value as determined pursuant to the
principles and methods of valuation set forth in the Valuation Designee’s policies and procedures adopted for the Fund by the Valuation Designee and approved by the Board of Trustees. In determining fair value each month, the Valuation Designee is
required to consider all appropriate factors relevant to value and all indicators of value available to the Fund. The determination of fair value necessarily involves judgment in evaluating this information in order to determine the price that the
Fund might reasonably expect to receive for the security upon its current sale. The most relevant information may often be that information which is provided by the issuer of the securities. Fair valuations, particularly those of private companies
and privately originated instruments, often reflect only periodic information received by the Investment Adviser about the issuer’s financial condition and/or business operations, which may be on a lagged basis and can be based on estimates. Given
the nature, timeliness, amount and reliability of information provided by the issuer, fair valuations may become more difficult and uncertain as such information is unavailable or becomes outdated. Because the Fund will value all of its assets
monthly, the Fund is subject to greater risk that the information available to determine fair value on any given day is uncertain, incomplete and potentially unreliable and, as a result, that the prices assigned to fair valued securities may not in
fact represent approximately the price that the Fund could receive upon their current sale.
Certain investments for which market quotations are not readily available or for which market quotations are deemed not to represent fair value are valued on a monthly basis utilizing a market approach, an income
approach, or both approaches, as appropriate. The market approach uses prices and other relevant information generated by market transactions involving identical or comparable assets or liabilities (including a business). The income approach uses
valuation techniques to convert future amounts (for example, cash flows or earnings) to a single present amount (discounted). The measurement is based on the value indicated by current market expectations about those future amounts. In following
these approaches, the types of factors that we may take into account in determining the fair value of our investments include, as relevant and among other factors: available current market data (e.g., information available through regulatory filings,
press releases, news feeds and financial press), including relevant and applicable market trading and transaction comparables, applicable market yields and multiples, information provided by the company (e.g., letters to investors, financials,
information provided pursuant to financial document reporting obligations), security covenants, call protection provisions, information rights, the nature and realizable value of any collateral, the portfolio company’s ability to make payments, its
earnings and discounted cash flows, the markets in which the portfolio company does business, comparisons of financial ratios of peer companies that are public, M&A comparables and enterprise values.
With respect to the Fund’s investments for which market quotations are not readily available or for which market quotations are deemed not to represent fair value, the Valuation Designee has approved a valuation
process that takes into account a variety of inputs.
When determining the price for a Fair Value Asset, the BlackRock Global Valuation Committee (or its delegate) shall seek to determine the price that the Fund might reasonably expect to receive from the current sale of
that asset or liability in an arm’s-length transaction. The price generally may not be determined based on what the Fund might reasonably expect to receive for selling an asset or liability at a later time or if it holds the asset or liability to
maturity. Fair value determinations shall be based upon all available factors that the BlackRock Global Valuation Committee (or its delegate) deems relevant at the time of the determination, and may be based on analytical values determined by the
Valuation Designee using proprietary or third party valuation models.
Fair value represents a good faith approximation of the value of an asset or liability. The fair value of one or more assets or liabilities may not, in retrospect, be the price at which those assets or liabilities
could have been sold during the period in which the particular fair values were used in determining the Fund’s NAV, and the differences between the fair value of the assets and the prices at which those assets are ultimately sold may be significant.
As a result, the Fund’s sale or repurchase of its shares at NAV, at a time when a holding or holdings are valued at fair value, may have the effect of diluting or increasing the economic interest of existing shareholders. Information that becomes
known to the Fund or its agents after the NAV has been calculated in a particular month will not be used to retroactively adjust the price of a security or the NAV determined earlier that month.
The Fund’s annual audited financial statements, which are prepared in accordance with GAAP, follow the requirements for valuation set forth in ASC 820, which defines and establishes a hierarchical disclosure framework
for measuring fair value under GAAP and expands financial statement disclosure requirements relating to fair value measurements.
The three-level hierarchy for fair value measurement is defined as follows:
Level 1: Quoted prices in active markets for identical assets
Level 2: Other direct and indirect observable market inputs (for example, quoted prices in inactive markets or quotes for comparable investments)
Level 3: Independent third-party valuation sources that employ significant unobservable inputs
As of December 31, 2025, none of our investments were categorized as Level 1, 26.9% were categorized as Level 2 and 73.1% were Level 3 investments valued based on valuations by independent third party sources.
In certain cases, the inputs used to measure fair value may fall into different levels of the fair value hierarchy. In such cases, an investment’s level within the fair value hierarchy is based on the lowest level of
input that is significant to the overall fair value measurement. The Valuation Designee’s assessment of the significance of a particular input to the fair value measurement in its entirety requires judgment and consideration of factors specific to
the investment.
Determination of fair value involves subjective judgments and estimates. Accordingly, the notes to our consolidated financial statements express the uncertainty with respect to the possible effect of such valuations,
and any change in such valuations, on the consolidated financial statements.
Revenue Recognition
Interest and dividend income, including income paid in kind, is recorded on an accrual basis, when such amounts are considered collectible. Origination, structuring, closing, commitment and other upfront fees,
including original issue discounts, earned with respect to capital commitments are generally amortized or accreted into interest income over the life of the respective debt investment, as are end-of-term or exit fees receivable upon repayment of a
debt investment. Other fees, including certain amendment fees, prepayment fees and commitment fees on broken deals, are recognized as earned. Prepayment fees and similar income due upon the early repayment of a loan or debt security are recognized
when earned and are included in interest income.
Certain of our debt investments are purchased at a discount to par as a result of the underlying credit risks and financial results of the issuer, as well as general market factors that influence the financial markets
as a whole. Discounts on the acquisition of corporate bonds are generally amortized using the effective-interest or constant-yield method assuming there are no questions as to collectability. When principal payments on a loan are received in an
amount in excess of the loan’s amortized cost, the excess principal payments are recorded as interest income.
Debt investments are generally placed on non-accrual status when it is probable that principal or interest will not be collected according to the contractual terms. When a debt investment is placed on non-accrual
status, accrued and unpaid interest (including any accrued PIK interest) is generally reversed, and discount accretion or premium amortization is discontinued. The Fund does not reverse previously capitalized PIK income. Payments received on
non-accrual investments may be recognized as income or applied to principal depending upon the Fund’s judgment regarding collectability of the outstanding principal and interest. Non-accrual investments are restored to accrual status if past due
principal and interest are paid or, in the Fund’s judgement, the repayment of the remaining contractual principal and interest is expected. The Fund may opt not to place a distressed debt investment on non-accrual status if principal and interest are
secured through sufficient collateral value and are in the process of collection through legal actions or other efforts that are expected to result in repayment of principal and interest.
Net Realized Gains or Losses and Net Change in Unrealized Appreciation or Depreciation
We measure realized gains or losses by the difference between the net proceeds from the repayment or sale and the amortized cost basis of the investment, without regard to unrealized appreciation or depreciation
previously recognized. Realized gains and losses are computed using the specific identification method. Net change in unrealized appreciation or depreciation reflects the change in portfolio investment values during the reporting period, including
the reversal of previously recorded unrealized appreciation or depreciation when gains or losses are realized.
Portfolio and Investment Activity
During the year ended December 31, 2025, we invested approximately $1,623.1 million, comprised of new investments in 127 new portfolio companies, as well as draws made on existing commitments and PIK received on prior
investments, all of which were in senior secured loans. Additionally, we received approximately $406.1 million in proceeds from sales or repayments during the year ended December 31, 2025.
During the year ended December 31, 2024, we invested approximately $775.3 million, comprised of new investments in 81 new portfolio companies, as well as draws made on existing commitments and PIK received on prior
investments, all of which were in senior secured loans. Additionally, we received approximately $142.7 million in proceeds from sales or repayments during the year ended December 31, 2024.
At December 31, 2025, our investment portfolio of $2,244.7 million (at fair value) consisted of 268 portfolio companies and was invested 100.0% in senior secured loans and 0.0% in equity investments. Our average
portfolio company investment at fair value was approximately $8.4 million. Our largest portfolio company investment by fair value was approximately 2.1% of our portfolio and our five largest portfolio company investments by fair value comprised
approximately 10.2% of our portfolio at December 31, 2025.
At December 31, 2024, our investment portfolio of $1,040.4 million (at fair value) consisted of 197 portfolio companies and was invested 100.0% in senior secured loans and 0.0% in equity investments. Our average
portfolio company investment at fair value was approximately $5.3 million. Our largest portfolio company investment by fair value was approximately 2.8% of our portfolio and our five largest portfolio company investments by fair value comprised
approximately 11.5% of our portfolio at December 31, 2024.
The industry composition of our portfolio at fair value at December 31, 2025 was as follows:
|
Industry
|
December 31, 2025
|
|||
|
Software
|
20.4
|
%
|
||
|
Professional Services
|
10.0
|
%
|
||
|
Diversified Financial Services
|
7.9
|
%
|
||
|
Construction and Engineering
|
6.7
|
%
|
||
|
Capital Markets
|
4.7
|
%
|
||
|
Insurance
|
4.7
|
%
|
||
|
Health Care Technology
|
4.3
|
%
|
||
|
Commercial Services and Supplies
|
4.1
|
%
|
||
|
IT Services
|
3.4
|
%
|
||
|
Hotels, Restaurants and Leisure
|
3.2
|
%
|
||
|
Internet Software and Services
|
2.7
|
%
|
||
|
Automobiles
|
2.1
|
%
|
||
|
Aerospace and Defense
|
2.1
|
%
|
||
|
Road and Rail
|
2.0
|
%
|
||
|
Wireless Telecommunication Services
|
1.9
|
%
|
||
|
Healthcare Providers and Services
|
1.7
|
%
|
||
|
Media
|
1.6
|
%
|
||
|
Electrical Equipment
|
1.5
|
%
|
||
|
Communications Equipment
|
1.5
|
%
|
||
|
Machinery
|
1.5
|
%
|
||
|
Internet and Catalog Retail
|
1.4
|
%
|
||
|
Diversified Consumer Services
|
1.2
|
%
|
||
|
Textiles, Apparel and Luxury Goods
|
1.2
|
%
|
||
|
Building Products
|
1.2
|
%
|
||
|
Chemicals
|
1.1
|
%
|
||
|
Other
|
5.9
|
%
|
||
|
Totals
|
100.0
|
%
|
||
The weighted average effective yield of our debt and total portfolio was 8.8% at December 31, 2025 and 10.6% at December 31, 2024. At December 31, 2025, 100.0% of debt investments in our portfolio bore interest based
on floating rates, such as the Secured Overnight Financing Rate (“SOFR”), the Federal Funds Rate or PRIME Rate, and 0.0% of the debt investments bore interest at fixed rates. The percentage of floating rate debt investments in our portfolio that were
subject to an interest rate floor was 80.0% at December 31, 2025. At December 31, 2024, 100.0% of debt investments in our portfolio bore interest based on floating rates, such as SOFR, the Federal Funds Rate or PRIME Rate, and 0.0% of the debt
investments bore interest at fixed rates. The percentage of floating rate debt investments in our portfolio that were subject to an interest rate floor was 81.2% at December 31, 2024. Debt investments in two portfolio companies were on non-accrual
status as of December 31, 2025, representing 0.1% of the portfolio at fair value and 0.3% at cost. Debt investments in one portfolio company were on non-accrual status as of December 31, 2024, representing 0.0% of the portfolio at fair value and 0.0%
at cost.
Results of Operations
Investment Income
Investment income totaled $163.5 million, $74.3 million, and $34.2 million, respectively, for the years ended December 31, 2025, 2024 and 2023, all of which was attributable to interest and fees on our debt
investments. The increase in investment income in the year ended December 31, 2025 compared to the year ended December 31, 2024 reflects the significant increase in portfolio size as the Fund continues to ramp up.
Expenses
Total net operating expenses for the years ended December 31, 2025, 2024 and 2023 were $65.8 million, $30.9 million and $11.3 million, respectively, comprised of $43.1 million, $15.7 million and $8.4 million in
interest and other debt expenses, $13.7 million, $6.3 million and $3.3 million in incentive fees, $12.3 million, $4.9 million and $2.0 million in management fees, $2.5 million, $0.0 million and $0.0 million in amortization of offering costs, $1.5
million, $1.1 million and $1.3 million in administrative expenses, $1.3 million, $0.8 million and $0.7 million in professional fees, $(0.5) million, $0.5 million and $0.0 million in incentive fees on capital gains, and $3.9 million, $1.6 million and
$1.0 million in other operating expenses, offset by $(10.8) million, $0.0 million, and $0.0 million in expense support, $(1.3) million, $0.0 million, and $(3.3) million in incentive fee waivers, respectively. The increase in expenses in the year
ended December 31, 2025 compared to the year ended December 31, 2024, primarily reflects the significant increase in portfolio size, amount of debt outstanding, and other Fund activities as the Fund continues to ramp up.
Net Investment Income (Loss)
Net investment income was $97.7 million, $43.4 million and $22.8 million respectively, for the years ended December 31, 2025, 2024 and 2023. The increase in net investment income reflects the higher investment income,
partially offset by the higher operating expenses in the year ended December 31, 2025 compared to the year ended December 31, 2024.
Net Realized and Unrealized Gain or Loss
Net realized gain (loss) for the years ended December 31, 2025, 2024 and 2023 were $(4.7) million, $(1.4) million and $0.1 million respectively. Net realized losses for the year ended December 31, 2025 was comprised
primarily of $(1.3) million in losses from the restructuring of our investments in Streamland Media Midco and $(1.0) million in losses from the sales of our investments in Magenta Security Holdings.
For the years ended December 31, 2025, 2024 and 2023 the change in net unrealized appreciation (depreciation) was $(15.5) million, $3.3 million and $5.3 million, respectively. The change in net unrealized appreciation
(depreciation) for the year ended December 31, 2025 was primarily driven by $(6.2) million change in unrealized depreciation in Engineering Research Holding LLC, $(3.3) million on our investment in Spark Buyer, LLC, $(2.3) million on our investment
in Alpine Acquisition Corp II, $(1.9) million on our investment in GI Consilio Parent LLC, $(1.6) million on our investment in DTI Holdco, Inc, $(1.3) million on our investment in Express Wash Acquisition Company, LLC, as well as change in unrealized
losses across the portfolio, partially offset by $1.1 million reversal of previously recognized unrealized depreciation from the restructuring of our investment in Streamland Media Midco LLC. The change in net unrealized appreciation (depreciation)
for the year ended December 31, 2024 was primarily driven by $0.9 million in reversal of previously recognized unrealized depreciation from the repayment of our investment in Nephron Pharmaceuticals Corp. and $0.7 million change in unrealized
appreciation in our investment in Research Now Group, as well as change in unrealized gains across the portfolio, offset by $(1.2) million change in unrealized depreciation in our investment in Streamland Media Midco and $(0.5) million on our
investment in Alpine Acquisition Corp II. The change in net unrealized appreciation (depreciation) for the year ended December 31, 2023 was primarily driven by $0.4 million change in unrealized appreciation on our investment in Fender Musical
Instruments Corp and $0.4 million change in unrealized appreciation in our investment in Accordion Partners, as well as change in unrealized gains across the portfolio, offset by $(0.9) million change in unrealized depreciation in our investment in
Nephron Pharmaceuticals Corp and $(0.5) million on our investment in Magenta Buyer.
Incentive Compensation
The income component of the incentive fee will be the amount, if positive, equal to 12.5% of the aggregate net investment income before incentive compensation earned for the most recent calendar quarter and the
preceding eleven calendar quarters (or if shorter, the number of calendar quarters that have occurred since commencement of the Fund’s operations), less aggregate income incentive compensation previously paid in with respect to the first eleven
calendar quarters (or the portion thereof) included in the relevant trailing twelve quarters. The income component of the incentive fee is subject to a 5.0% total return hurdle on daily weighted average unreturned capital contributions (the “Hurdle
Rate”). The capital gains component of the incentive fee will be the amount, if positive, equal to the lesser of (i) 12.5% of the aggregate realized capital gains (computed net of realized losses and net of unrealized capital depreciation, if any)
for the most recent calendar quarter and the preceding eleven calendar quarters (or if shorter, the number of calendar quarters that have occurred since commencement of the Fund’s operations), less capital gains incentive compensation previously paid
or distributed in respect of the first eleven calendar quarters (or the portion thereof) included in the relevant trailing twelve quarters or (ii) 12.5% of cumulative aggregate realized capital gains (computed net of realized losses and net of
unrealized capital depreciation, if any) since commencement of the Fund, less capital gains incentive compensation previously paid or distributed since commencement of the Fund. The capital gains component will be paid in full prior to payment of the
ordinary income component. In any case, incentive compensation (including both the income and capital gains components) will only be paid to the extent the trailing twelve quarter (or if shorter, the number of calendar quarters that have occurred
since commencement of the fund) total return of the Fund after incentive compensation and including such payment would equal or exceed a 5% annual total return on daily weighted average unreturned contributed capital contributions for such period. In
addition, the Adviser has agreed to waive any portion of the income component of the Incentive Fee attributable to the inclusion of Expense Payments (as set forth in the Expense Support and Conditional Reimbursement Agreement) in the calculation of
(i) aggregate net investment income before incentive compensation or (ii) total return. For the year ended December 31, 2025, $13.7 million in incentive fees were earned, compared to $6.3 million earned for the year ended December 31, 2024 and $3.3
million earned for the year ended December 31, 2023. For the years ended December 31, 2025, 2024 and 2023, $(0.5) million, $0.5 million and $0, respectively, incentive fees on capital gains were accrued on a liquidation basis (but not payable) under
GAAP. For the years ended December 31, 2025, 2024 and 2023, the Investment Adviser waived incentive fees in an amount of $(1.3) million, $0.0 million, and $(3.3) million, respectively.
Income Tax Expense, Including Excise Tax
The Fund has elected to be treated as a RIC under Subchapter M of the Code and operates in a manner so as to qualify for the tax treatment applicable to RICs. To qualify as a RIC, the Fund must, among other things,
timely distribute to its shareholders generally at least 90% of its investment company taxable income, as defined by the Code, for each year. The Fund has made and intends to continue to make the requisite distributions to its shareholders which will
generally relieve the Fund from U.S. federal income taxes.
Depending on the level of taxable income earned in a tax year, we may choose to carry forward taxable income in excess of current year dividend distributions from such current year taxable income into the next tax year
and pay a 4% excise tax on such income. Any excise tax expense is recorded at year end as such amounts are known. For the years ended December 31, 2025 and 2024, no excise tax was recorded. For the year ended December 31, 2023, excise tax expenses of
$0.1 million was recorded, based on the amount of tax-basis ordinary income carried forward at the year-end.
Net Increase (Decrease) in Net Assets Resulting from Operations
The net increase in net assets applicable to common shareholders resulting from operations was $77.5 million, $45.4 million and $28.3 million respectively for the years ended December 31, 2025, 2024 and 2023.
Liquidity and Capital Resources
Our liquidity and capital resources are expected to be generated primarily through the offerings of the Fund’s common shares, borrowings under the Credit Facility, Revolving Credit Facility, SG Revolving Facility (each
as defined below), and cash flows from operations, including investments sales and repayments and income earned from investments and cash equivalents. The primary uses of cash have been investments in portfolio companies and other general corporate
purposes.
Our primary uses of cash are expected to be for investments in portfolio companies and other investments, for operational costs such as paying the Investment Adviser and Administrator, for costs related to our credit
facility and for distributions to our shareholders.
The Investment Adviser has agreed to pay all of our organization and offering expenses on our behalf (including legal, accounting, printing, mailing, subscription processing and filing fees and expenses and other
offering expenses, including costs associated with technology integration between the Fund’s systems and those of our participating brokers, reasonable bona fide due diligence expenses of participating brokers supported by detailed and itemized
invoices, costs in connection with preparing sales materials and other marketing expenses, design and website expenses, fees and expenses of our transfer agent, fees to attend retail seminars sponsored by participating brokers and costs, expenses and
reimbursements for travel, meals, accommodations, entertainment and other similar expenses related to meetings or events with prospective investors, brokers, registered investment advisors or financial or other advisors, but excluding the shareholder
servicing and/or distribution fee) through the commencement of the Fund’s operations.
Pursuant to the Fee Waiver and Expense Support and Reimbursement Agreement we entered into with the Investment Adviser, we were obligated to reimburse the Investment Adviser for expenses during the 36 months following
the commencement of the Fund’s operations (the "Reimbursement Period"), to the extent that the Fund’s annual Operating Expenses did not exceed 1.25% of the value of the Fund’s net assets, calculated monthly based on month-end net assets of the Fund.
The Reimbursement Period expired on March 18, 2025. From inception of the Fund through the expiration of the Reimbursement Period, the Fund reimbursed the Investment Adviser for $0.8 million related to organizational and offering expenses of the Fund
pursuant to the Fee Waiver and Expense Support and Reimbursement Agreement.
Pursuant to the Expense Support and Conditional Reimbursement Agreement, the Investment Adviser may also elect to pay certain expenses on the Fund’s behalf, provided that no portion of an Expense Payment will be used
to pay any interest expense or shareholder servicing and/or distribution fees of the Fund. For the year ended December 31, 2025, the Fund received $10.8 million in expense support from the Investment Adviser.
On June 3, 2022, BlackRock Private Credit Fund Leverage I, LLC (the “Borrower”), a Delaware limited liability company and wholly-owned subsidiary of the Fund, established a $200 million combined revolving credit and
term loan facility with PNC Bank, National Association as facility agent (the “Credit Facility”). The Credit Facility matures on June 3, 2032 and generally bears interest at three-month Term SOFR, plus (a) 1.55% if the aggregate balance of Middle
Market Loans is less than or equal to 25%, (b) 1.65% if the aggregate balance of Middle Market Loans is above 25% and less than or equal to 50%, (c) 1.80% if the aggregate balance of Middle Market Loans is above 50% and less than or equal to 75%, or
(d) 1.90% if the aggregate balance of Middle Market Loans is above 75%. The Credit Facility also accrues commitment fees on any undrawn amounts at an annual rate of 0.50%, or 0.35% for the period from the closing date of the Credit Facility to the
three-month anniversary of the closing date. The Credit Facility is secured by all of the assets held by the Borrower. Under the Credit Facility, the Borrower has made certain customary representations and warranties, and is required to comply with
various covenants, reporting requirements and other customary requirements for similar credit facilities.
On September 8, 2023, the Borrower entered into Amendment No. 1 to the Credit Facility (the “Amendment”). The Amendment extended the term commitment termination date under the Credit Facility with respect to term
commitments entered into on the closing date to December 8, 2023. On December 15, 2023, the Borrower entered into Amendment No. 2 to the Credit Facility (the “Second Amendment”). The Second Amendment increased the total revolving commitments from
$50.0 million to $75.0 million, increased total term commitments from $150.0 million to $225.0 million, and increased the facility margin level applicable to the borrower.
On November 27, 2024, the Borrower entered into Amendment No. 3 to the Credit Facility (the “First Amended and Restated Credit and Security Agreement”). The amendment increased the total revolving commitments from
$75.0 million to $125.0 million, increased total term commitments from $225.0 million to $325.0 million, and modified certain other terms of the Credit Facility, including (i) extending the final maturity date to June 3, 2033, (ii) extending the
reinvestment period to June 3, 2026, and (iii) extending the delayed draw term loan commitment termination date until December 15, 2025. The credit facility commitment fees accrual rate was amended at a rate equal to 0.35% per annum, if as of such
date the outstanding principal amount of the Revolving Advances is greater than 50% of the Revolving Commitment otherwise the rate is 0.50% per annum. The rate for Term Commitment was amended at 0.35% per annum for the first three months following
any Incremental Commitment Effective Date, and thereafter 0.50% per annum. The Credit Facility includes usual and customary events of default for credit facilities of this nature. Borrowings under the Credit Facility are considered our borrowings for
purposes of complying with the asset coverage requirements under the 1940 Act.
On May 2, 2025, the Fund entered into Amendment No. 1 to the First Amended and Restated Credit and Security Agreement (the “Credit Facility Amendment”). Pursuant to the Credit Facility Amendment, under the Credit
Facility, the total revolving commitments increased from $125.0 million to $150.0 million, and the total term commitments increased from $325.0 million to $500.0 million. The Credit Facility Amendment modified certain other terms of the Credit
Facility, including extending the prepayment lockout period until the first anniversary of the closing date of the Credit Facility Amendment.
On December 12, 2025, the Fund entered into Amendment No. 2 to First Amended and Restated Credit and Security Agreement (the “Second Amendment”) to extend the commitment period for certain undrawn term loan commitments
to May 2, 2026. As of December 31, 2025, there was $260.0 million drawn on the Credit Facility.
On April 19, 2024, the Fund entered into a Senior Secured Credit Agreement for a $75 million revolving credit facility (the “Revolving Credit Facility”) with Sumitomo Mitsui Banking Corporation, as administrative
agent, and the lenders and issuing banks from time to time parties thereto. The Revolving Credit Facility matures on April 19, 2029 and generally bears interest at either (i) term SOFR plus a credit spread adjustment plus margin of 2.00% or 1.875%
per annum or (ii) the prime rate plus a margin of 2.00% or 1.875% per annum, in each case subject to certain conditions. The Fund may elect either the term SOFR or prime rate at the time of drawdown. The Revolving Credit Facility will be guaranteed
by certain domestic subsidiaries of the Fund that are formed or acquired by the Fund in the future (collectively, the “Guarantors”). The Revolving Credit Facility is secured by substantially all of the portfolio investments held by the Fund and each
Guarantor, subject to certain exceptions. On November 4, 2024, the Fund increased the commitment on the Revolving Credit Facility from $75 million to $150 million.
On August 7, 2025, the Fund entered into the First Amendment to the Revolving Credit Facility (the “First Amendment”), which, among other things, (i) extends the revolver availability period from April 2028 to August
2029, (ii) extends the scheduled maturity date from April 2029 to August 2030, (iii) increases the accordion provision to permit increases to a total facility amount of up to $600.0 million, (iv) increases the total facility amount from $150.0
million to $315.0 million, and (v) resets the minimum shareholders’ equity test.
On December 5, 2025, the Fund entered into a joinder agreement (“Joinder Agreement”) which increased the aggregate amount of outstanding total revolving commitments under the Revolving Credit Facility to $365.0
million. The other material terms of the Revolving Credit Facility remain unchanged. As of December 31, 2025, there was $51.0 million drawn on the Revolving Credit Facility.
On November 18, 2024, the Fund entered into a Master Note Purchase Agreement (the “Master Note Purchase Agreement”), governing the issuance (a) on November 18, 2024, of $70.0 million aggregate principal amount of its
7.14% Series 2024A Senior Notes, Tranche A, due November 18, 2027 (the “Tranche A Notes”), and (b) on January 22, 2025 (subject to customary closing conditions), of $55.0 million aggregate principal amount of its 7.33% Series 2024A Senior Notes,
Tranche B, due January 22, 2030 (the “Tranche B Notes” and, together with the Tranche A Notes, the “Notes”), to qualified institutional investors in a private placement. The Tranche A Notes bear interest at a rate equal to 7.14% per annum that is
payable semi-annually on May 18 and November 18 of each year, beginning on May 18, 2025. The Tranche B Notes bear interest at a rate equal to 7.33% per annum that is payable semi-annually on January 22 and July 22 of each year, beginning on July 22,
2025. The Notes will be guaranteed by certain domestic subsidiaries of the Fund that are formed or acquired by the Fund in the future (collectively, the “Guarantors”). The Tranche A Notes were issued at a closing on November 18, 2024, and the Tranche
B Notes were issued at a closing which occurred on January 22, 2025. As of December 31, 2025, there was $70.0 million and $55.0 million, respectively, outstanding on the Tranche A Notes and Tranche B Notes.
On May 28, 2025, BlackRock Private Credit Fund Leverage II, LLC (the “SG Borrower”), a Delaware limited liability company and wholly-owned subsidiary of the Fund, established the SG Revolving Credit Facility, a
$200.0 million revolving credit facility with Societe Generale as Administrative agent (the "SG Revolving Credit Facility”). The SG Revolving Credit Facility matures on May 29, 2027 and generally bears interest at term SOFR plus, for a period of 1
year from the date of entry into the SG Revolving Credit Facility, 1.15% and, thereafter, 1.25%. The proceeds of the SG Revolving Credit Facility were used to acquire a portfolio of broadly syndicated leveraged loans (the “SG Portfolio Assets”).
Pursuant to a collateral management agreement between the SG Borrower and the Fund, the Fund was responsible for the selection, management and reporting of the SG Portfolio Assets. The SG Revolving Credit Facility includes customary covenants,
including certain limitations on the incurrence by the SG Borrower of additional indebtedness and on the SG Borrower’s ability to make distributions, as well as customary events of default. As of September 30, 2025, the SG Borrower was in full
compliance with such covenants. As of December 31, 2025, there was $200.0 million drawn on the SG Revolving Credit Facility.
On October 1, 2025, the Fund closed on an offering 110 promissory notes due October 1, 2055 (the “Promissory Notes”) in a private offering, with each Promissory Note being issued in connection with the issuance of
one common share of the Fund (the “Promissory Notes Offering”) to accredited investors (as that term is defined in Rule 501(a) of Regulation D under the Securities Act. The aggregate principal amount of the Promissory Notes is $110,000 less the net
asset value, as of October 1, 2025, of the common shares issued in the Promissory Notes Offering. The Fund will pay an interest totaling $120 per year on each outstanding Promissory Note, with such interest to be paid semi-annually on or before
June 30 and December 31 each year, beginning on December 31, 2025.
On October 8, 2025, the Fund entered into the First Supplement (the “First Supplement”) to the Master Note Purchase Agreement, dated November 18, 2024, as supplemented by the First Supplement, the “Purchase
Agreement”), governing the issuance (a) on October 8, 2025, of $150.0 million aggregate principal amount of its 6.14% Series 2025A Senior Notes, Tranche B, due October 8, 2030 (the “2025A Tranche B Notes”), and (b) on December 17, 2025 (subject to
customary closing conditions), of $50.0 million aggregate principal amount of its 5.78% Series 2025A Senior Notes, Tranche A, due December 17, 2028 (the “2025A Tranche A Notes” and, together with the 2025A Tranche B Notes, the “2025A Notes”), to
qualified institutional investors in a private placement. The 2025A Tranche B Notes were issued on October 8, 2025 and the 2025A Tranche A Notes were issued on December 17, 2025, subject to customary closing conditions.
The 2025A Tranche B Notes bear an interest rate of 6.14% per year and are payable semi-annually on April 8 and October 8, beginning April 8, 2026. The 2025A Tranche A Notes bear an interest rate of 5.78% per year
payable semi-annually on June 17 and December 17 of each year, beginning on June 17, 2026. The 2025A Notes may be redeemed in whole or in part at any time or from time to time at the Fund’s option at par plus accrued interest to the prepayment date
and, if applicable, a make-whole premium. In addition, the Fund is obligated to offer to prepay the 2025A Notes at par plus accrued and unpaid interest up to, but excluding, the date of prepayment, if certain change in control events occur. The
2025A Notes are general unsecured obligations of the Fund that rank pari passu with all outstanding and future unsecured and unsubordinated indebtedness issued by the Fund.
Under Section 61(a) of the 1940 Act, prior to March 23, 2018, a BDC was generally not permitted to issue senior securities unless after giving effect thereto the BDC met a coverage ratio of total assets, less
liabilities and indebtedness not represented by senior securities, to total senior securities, which includes all borrowings of the BDC, of at least 200%. On March 23, 2018, the Small Business Credit Availability Act (“SBCAA”) was signed into law,
which among other things, amended Section 61(a) of the 1940 Act to add a new Section 61(a)(2) that reduces the asset coverage requirement applicable to BDCs from 200% to 150% so long as the BDC meets certain disclosure requirements and obtains
certain approvals. After obtaining shareholder approval by written consent on March 16, 2022, the Fund’s asset coverage requirement was reduced from 200% to 150%, as set forth in Section 61(a)(2) of the 1940 Act, as amended by the SBCAA. As of
December 31, 2025, the Fund's asset coverage ratio was 286%.
Net cash used in operating activities for the year ended December 31, 2025 was $1,118.7 million, consisting primarily of the settlement of acquisitions of investments (net of dispositions) of $1,206.8 million and net
investment income (net of non-cash income and expenses) of approximately $88.1 million.
Net cash provided by financing activities was $1,298.8 million for the year ended December 31, 2025, consisting primarily of $933.0 million in proceeds from share issuances, $191.0 million in credit facility draws
(net of repayments), $255.1 million in proceeds from the Senior Notes, offset by $51.6 million dividends paid in cash to shareholders, $24.5 million payments of repurchased shares and $4.1 million payments of debt issuance costs.
At December 31, 2025, we had $221.2 million in cash and cash equivalents.
Share Transactions
The following table summarizes transactions in Common Shares for the years ended December 31, 2025 and 2024:
|
Year ended December 31, (1)
|
||||||||||||||||
|
2025
|
2024
|
|||||||||||||||
|
Shares
|
Amount
|
Shares
|
Amount
|
|||||||||||||
|
Institutional Class
|
||||||||||||||||
|
Subscriptions
|
35,326,769
|
$
|
855,541,552
|
13,602,003
|
$
|
337,869,390
|
||||||||||
|
Share transfers between classes
|
179,403
|
4,341,091
|
-
|
-
|
||||||||||||
|
Distributions reinvested
|
2,102,102
|
51,063,803
|
1,270,509
|
31,574,888
|
||||||||||||
|
Share Repurchases
|
(902,557
|
)
|
(21,853,128
|
)
|
(146,864
|
)
|
(3,643,716
|
)
|
||||||||
|
Net Increase (Decrease)
|
36,705,717
|
$
|
889,093,318
|
14,725,648
|
$
|
365,800,562
|
||||||||||
|
Class S
|
||||||||||||||||
|
Subscriptions
|
3,040,787
|
73,986,811
|
1,806,766
|
44,856,000
|
||||||||||||
|
Distributions reinvested
|
44,165
|
1,068,261
|
1,410
|
35,010
|
||||||||||||
|
Share Repurchases
|
(110,995
|
)
|
(2,664,421
|
)
|
-
|
-
|
||||||||||
|
Net Increase (Decrease)
|
2,973,957
|
$
|
72,390,651
|
1,808,176
|
$
|
44,891,010
|
||||||||||
|
Class D
|
||||||||||||||||
|
Subscriptions
|
140,964
|
3,429,598
|
127,369
|
3,155,500
|
||||||||||||
|
Share transfers between classes
|
(179,403
|
)
|
(4,341,091
|
)
|
-
|
-
|
||||||||||
|
Distributions reinvested
|
4,408
|
106,430
|
12
|
295
|
||||||||||||
|
Net Increase (Decrease)
|
(34,031
|
)
|
$
|
(805,063
|
)
|
127,381
|
$
|
3,155,795
|
||||||||
|
(1)
|
Class S commenced operations on June 1, 2024 and Class D commenced operations on August 1, 2024.
|
The following table presents information with respect to the Fund's repurchases for the years ended December 31, 2025 and 2024:
|
Repurchase Offer
Commencement Date
|
Repurchase
request
deadline
|
Number of
Shares
Repurchased
(All Classes)
|
Percentage of
Outstanding Shares
Repurchased(1)
|
Price
Paid Per
Share
|
Repurchase
Pricing Date
|
Amount
Repurchased
(All Classes)(2)
|
Maximum number of
shares that may yet be
repurchased(3)
|
||||||||||||||||
|
January 31, 2025
|
February 28, 2025
|
139,189
|
0.5
|
%
|
$
|
24.42
|
March 31, 2025
|
$
|
3,398,946
|
-
|
|||||||||||||
|
April 30, 2025
|
May 28, 2025
|
265,506
|
0.7
|
%
|
$
|
24.24
|
June 30, 2025
|
$
|
6,434,733
|
-
|
|||||||||||||
|
July 31, 2025
|
August 27, 2025
|
552,561
|
1.1
|
%
|
$
|
24.07
|
September 30, 2025
|
$
|
13,290,207
|
-
|
|||||||||||||
|
October 31, 2025
|
November 28, 2025
|
1,215,939
|
1.8
|
%
|
$
|
23.95
|
December 31, 2025
|
$
|
29,116,490
|
-
|
|||||||||||||
| (1) |
Percentage is based on total shares as of the close of the previous calendar quarter.
|
| (2) |
Net of Early Repurchase Deduction (if any).
|
| (3) |
All repurchase requests were satisfied in full.
|
|
Repurchase Offer
Commencement Date
|
Repurchase
request
deadline
|
Number of
Shares
Repurchased
(All Classes)
|
Percentage of
Outstanding Shares
Repurchased(1)
|
Price Paid
Per Share
|
Repurchase
Pricing Date
|
Amount
Repurchased
(All Classes)(2)
|
Maximum number of
shares that may yet be
repurchased(3)
|
||||||||||||||||
|
January 31, 2024
|
February 29, 2024
|
23,540
|
0.2
|
%
|
$
|
24.98
|
March 31, 2024
|
$
|
588,036
|
-
|
|||||||||||||
|
April 30, 2024
|
May 31, 2024
|
11,023
|
0.1
|
%
|
$
|
24.84
|
June 30, 2024
|
$
|
273,818
|
-
|
|||||||||||||
|
July 31, 2024
|
August 30, 2024
|
112,301
|
0.5
|
%
|
$
|
24.77
|
September 30, 2024
|
$
|
2,781,862
|
-
|
|||||||||||||
|
October 31, 2024
|
November 29, 2024
|
56,295
|
0.2
|
%
|
$
|
24.79
|
December 31, 2024
|
$
|
1,393,661
|
-
|
|||||||||||||
| (1) |
Percentage is based on total shares as of the close of the previous calendar quarter.
|
| (2) |
Net of Early Repurchase Deduction (if any).
|
| (3) |
All repurchase requests were satisfied in full.
|
Contractual Obligations
We have entered into several contracts under which we have future commitments. Pursuant to the Advisory Agreement, the Investment Adviser manages our day-to-day operations and provides investment advisory services to
us. Payments under the Advisory Agreement are equal to a percentage of the value of our total assets (excluding cash and cash equivalents) and an incentive fee, plus reimbursement of certain expenses incurred by the Investment Adviser. Under our
Administration Agreement, the Administrator provides us with administrative services, facilities and personnel. Payments under the Administration Agreement are equal to an allocable portion of overhead and other expenses incurred by the
Administrator in performing its obligations to us, and may include rent and our allocable portion of the cost of certain of our officers and their respective staffs. We are responsible for reimbursing the Investment Adviser for due diligence and
negotiation expenses, fees and expenses of custodians, administrators, transfer and distribution agents, counsel and directors, insurance, filings and registrations, proxy expenses, expenses of communications to investors, compliance expenses,
interest, taxes, portfolio transaction expenses, costs of responding to regulatory inquiries and reporting to regulatory authorities, costs and expenses of preparing and maintaining our books and records, indemnification, litigation and other
extraordinary expenses and such other expenses as are approved by the directors as being reasonably related to our organization, offering, capitalization, operation or administration and any portfolio investments, as applicable. The Investment
Adviser is not responsible for any of the foregoing expenses. The Fund may terminate each of the Advisory Agreement and Administration Agreement without penalty upon not less than 60 days’ written notice to the other party and the Investment
Adviser and the Administrator may terminate the Advisory Agreement or Administration Agreement, as applicable, without penalty upon not less than 120 days’ written notice to the other party. The Sub-Advisory Agreement may be terminated as a whole
at any time by the Fund without the payment of any penalty, upon the vote of a majority of the Board of Trustees or a majority of the outstanding voting securities of the Fund or by the Investment Adviser or the Sub-Adviser, on 60 days’ written
notice by either party to the other.
On June 3, 2022, the Fund entered into the Credit Facility, a $200 million revolving credit facility that matures on June 3, 2032 and generally bears interest at a floating rate. On September 8, 2023, the Borrower
entered into Amendment No. 1 to the Credit Facility. The Amendment extended the term commitment termination date under the Credit Facility with respect to term commitments entered into on the closing date to December 8, 2023. On December 15, 2023,
the Borrower entered into Amendment No. 2 to the Credit Facility. The Second Amendment increased the total revolving commitments from $50.0 million to $75.0 million, increased total term commitments from $150.0 million to $225.0 million, and
increased the facility margin level applicable to the borrower. On November 27, 2024, the Fund entered into the First Amended and Restated Credit and Security Agreement to the Credit Facility, which, among other things, increased the total
revolving commitments from $75.0 million to $125.0 million and increased total term commitments from $225.0 million to $325.0 million. On May 2, 2025, the Fund entered into the Amendment No. 1 to First Amended and Restated Credit and Security
Agreement to the Credit Facility, which, among other things, increased the total revolving commitments from $125.0 million to $150.0 million and increased total term commitments from $325.0 million to $500.0 million.
On December 12, 2025, the Fund entered into the Second Amendment to extend the commitment period for certain undrawn term loan commitments to May 2, 2026. As of December 31, 2025, there was $260.0 million drawn on
the Credit Facility.
On April 19, 2024, the Fund entered into the Revolving Credit Facility that matures on April 19, 2029 and generally bears interest at either (i) term SOFR plus a credit spread adjustment plus margin of 2.00% or
1.875% per annum or (ii) the prime rate plus a margin of 2.00% or 1.875% per annum, in each case subject to certain conditions. The Fund may elect either the term SOFR or prime rate at the time of drawdown. The Revolving Credit Facility includes
usual and customary events of default for credit facilities of this nature. On November 4, 2024, the Fund increased the commitment on the Revolving Credit Facility from $75 million to $150 million.
On August 7, 2025, the Fund (i) extended the revolver availability period from April 2028 to August 2029, (ii) extended the scheduled maturity date from April 19, 2029 to August 19, 2030, (iii) increased the
accordion provision to permit increases to a total facility amount of up to $600 million, (iv) increased the total facility amount from $150 million to $315 million and (v) reset the minimum shareholders’ equity test.
On December 5, 2025, the Fund entered into the Joinder Agreement which increased the aggregate amount of outstanding total revolving commitments under the Revolving Credit Facility to $365.0 million. The other
material terms of the Revolving Credit Facility remain unchanged. As of December 31, 2025, there was $51.0 million drawn on the Revolving Credit Facility.
On November 18, 2024, the Fund entered into the Master Note Purchase Agreement, governing the issuance (a) on November 18, 2024, of $70,000,000 aggregate principal amount of its 7.14% Tranche A Notes, due November
18, 2027, and (b) on January 22, 2025, of $55,000,000 aggregate principal amount of its 7.33% Tranche B Notes, due January 22, 2030. As of December 31, 2025, there was $70.0 million and $55.0 million, respectively outstanding on the Tranche A Notes
and Tranche B Notes.
On May 28, 2025, SG Borrower entered into the SG Revolving Credit Facility, a $200.0 million revolving credit facility with Societe Generale as Administrative agent. The SG Revolving Credit Facility matures on May
29, 2027 and generally bears interest at term SOFR plus, for a period of 1 year from the date of entry into the SG Revolving Credit Facility, 1.15% and, thereafter, 1.25%. The SG Revolving Credit Facility includes customary covenants, including
certain limitations on the incurrence by the SG Borrower of additional indebtedness and on the SG Borrower’s ability to make distributions, as well as customary events of default. As of December 31,2025, there was $200.0 million drawn on the SG
Revolving Credit Facility.
On October 1, 2025, the Fund closed on the Promissory Notes Offering to accredited investors (as that term is defined in Rule 501(a) of Regulation D under the Securities Act. The aggregate principal amount of the
Promissory Notes is $110,000 less the net asset value, as of October 1, 2025, of the common shares issued in the Promissory Notes Offering. The Fund will pay an interest totaling $120 per year on each outstanding Promissory Note, with such interest
to be paid semi-annually on or before June 30 and December 31 each year, beginning on December 31, 2025.
On October 8, 2025, the Fund entered into the First Supplement to the Master Note Purchase Agreement, dated November 18, 2024, governing the issuance of the 2025A Notes, to qualified institutional investors in a
private placement. The 2025A Tranche B Notes were issued on October 8, 2025 and the 2025A Tranche A Notes will be issued on December 17, 2025, subject to customary closing conditions. The 2025A Tranche B Notes bear an interest rate of 6.14% per
year and are due on October 8, 2030, unless redeemed, purchased, or prepaid prior to such date by the Fund or its affiliates in accordance with their terms. The 2025A Tranche A Notes will bear an interest rate of 5.78% per year and will be due on
December 17, 2028, unless redeemed, purchased, or prepaid prior to such date by the Fund or its affiliates in accordance with their terms. Interest on the 2025A Tranche B Notes will be due semiannually, beginning April 8, 2026. Interest on the
2025A Tranche A Notes will be due semiannually, beginning June 17, 2026. The Fund is obligated to offer to prepay the 2025A Notes at par plus accrued and unpaid interest up to, but excluding, the date of prepayment, if certain change in control
events occur. The 2025A Notes are general unsecured obligations of the Fund that rank pari passu with all outstanding and future unsecured and unsubordinated indebtedness issued by the Fund. In addition, in the event that a Below Investment Grade
Event occurs, the 2025A Notes will bear interest at the rate per annum which is 1.00% above the interest rate then in effect on the applicable 2025A Notes from the date of the occurrence of the Below Investment Grade Event to and until the date on
which such Below Investment Grade Event is no longer continuing. As of December 31, 2025, there was $150.0 million and $50.0 million, respectively, outstanding on the 2025A Tranche B Notes and 2025A Tranche A Notes.
On March 13, 2026, BlackRock Private Credit Fund Leverage III, LLC (“PCFL III”), a subsidiary of the Fund, entered into a Loan and Security Agreement (the “BMO Loan Agreement”). The maximum amount of commitments
under the BMO Loan Agreement that can be drawn by PCFL III is (a) for a period of 3 years from the date of the BMO Loan Agreement, $200 million; and (b) thereafter, an amount equal to the outstanding principal amount of the loans. The applicable
interest rate on the loans drawn under the BMO Loan Agreement is the benchmark rate (Daily Simple SOFR rate) plus (a) for a period of 3 years from the date of the BMO Loan Agreement, 1.50%, and (b) thereafter, 1.75%. The BMO Loan Agreement includes
customary covenants, including certain limitations on the incurrence by PCFL III of additional indebtedness and on PCFL III’s ability to make distributions, as well as customary events of default.
We cannot assure shareholders that we will be able to enter into any other credit facilities on favorable terms or at all. In connection with any other credit facilities or other borrowings, lenders may require us to
pledge assets, commitments and/or drawdowns (and the ability to enforce the payment thereof) and may ask to comply with positive or negative covenants that could have an effect on our operations. Borrowings under the Credit Facility, the Revolving
Credit Facility and SG Revolving Credit Facility are considered our borrowings for purposes of complying with the asset coverage requirements under the 1940 Act.
Distributions
Our dividends and distributions to shareholders, if any, are determined and declared by our Board of Trustees and are recorded on the ex-dividend date. Distributions are declared considering our estimate of annual
taxable income available for distribution to shareholders and the amount of taxable income carried over from the prior year for distribution in the current year. We do not have a policy to pay distributions at a specific level and expect to
continue to distribute substantially all of our taxable income. We cannot assure shareholders that they will receive any distributions or distributions at a particular level.
Institutional Class Shares
The following tables summarize the Fund’s dividends declared and paid for the Institutional Class shares for the years ended December 31, 2025 and 2024:
|
Date Declared
|
Record Date
|
Payment Date
|
Type
|
Amount Per Share
|
Total Amount
|
|||||||||
|
January 26, 2024
|
January 30, 2024
|
February 27, 2024
|
Regular
|
$
|
0.2300
|
$
|
2,348,876
|
|||||||
|
February 23, 2024
|
February 28, 2024
|
March 27, 2024
|
Regular
|
0.2300
|
2,471,608
|
|||||||||
|
March 26, 2024
|
March 28, 2024
|
April 26, 2024
|
Regular
|
0.2300
|
2,572,189
|
|||||||||
|
April 24, 2024
|
April 29, 2024
|
May 29, 2024
|
Regular
|
0.2300
|
2,817,179
|
|||||||||
|
May 24, 2024
|
May 30, 2024
|
June 26, 2024
|
Regular
|
0.2300
|
2,983,344
|
|||||||||
|
June 26, 2024
|
June 27, 2024
|
July 29, 2024
|
Regular
|
0.2300
|
3,183,325
|
|||||||||
|
July 26, 2024
|
July 30, 2024
|
August 28, 2024
|
Regular
|
0.2300
|
3,812,774
|
|||||||||
|
August 23, 2024
|
August 29, 2024
|
September 26, 2024
|
Regular
|
0.2300
|
4,370,691
|
|||||||||
|
September 25, 2024
|
September 27, 2024
|
October 29, 2024
|
Regular
|
0.2300
|
4,658,792
|
|||||||||
|
October 24, 2024
|
October 30, 2024
|
November 27, 2024
|
Regular
|
0.2300
|
4,925,216
|
|||||||||
|
November 25, 2024
|
November 27, 2024
|
December 27, 2024
|
Regular
|
0.2300
|
5,342,972
|
|||||||||
|
December 20, 2024
|
December 30, 2024
|
January 29, 2025
|
Regular
|
0.2300
|
5,596,850
|
|||||||||
|
$
|
2.7600
|
$
|
45,083,816
|
|||||||||||
|
January 24, 2025
|
January 30, 2025
|
February 26, 2025
|
Regular
|
$
|
0.2300
|
$
|
5,923,347
|
|||||||
|
February 25, 2025
|
February 27, 2025
|
March 27, 2025
|
Regular
|
0.2300
|
6,249,265
|
|||||||||
|
March 24, 2025
|
March 28, 2025
|
April 28, 2025
|
Regular
|
0.2300
|
6,588,559
|
|||||||||
|
April 24, 2025
|
April 29, 2025
|
May 28, 2025
|
Regular
|
0.2300
|
7,190,565
|
|||||||||
|
May 23, 2025
|
May 29, 2025
|
June 26, 2025
|
Regular
|
0.2300
|
7,422,523
|
|||||||||
|
June 26, 2025
|
June 27, 2025
|
July 29, 2025
|
Regular
|
0.2300
|
7,802,691
|
|||||||||
|
July 25, 2025
|
July 30, 2025
|
August 27, 2025
|
Regular
|
0.2300
|
9,024,581
|
|||||||||
|
August 22, 2025
|
August 28, 2025
|
September 26, 2025
|
Regular
|
0.1980
|
8,822,622
|
|||||||||
|
September 26, 2025
|
September 29, 2025
|
October 29, 2025
|
Regular
|
0.1976
|
9,423,839
|
|||||||||
|
October 24, 2025
|
October 30, 2025
|
November 26, 2025
|
Regular
|
0.1966
|
10,429,938
|
|||||||||
|
November 26, 2025
|
November 28, 2025
|
December 29, 2025
|
Regular
|
0.1959
|
11,205,904
|
|||||||||
|
December 23, 2025
|
December 30, 2025
|
January 28, 2026
|
Regular
|
0.1959
|
11,957,706
|
|||||||||
|
$
|
2.5940
|
$
|
102,041,540
|
|||||||||||
Class S Shares
The following table summarizes the Fund’s dividends declared for the Class S shares for the year ended December 31, 2025 and 2024.
|
Date Declared (1)
|
Record Date
|
Payment Date
|
Type
|
Gross
Amount
Per Share
|
Amount Per Share Net of Shareholder
Servicing
and/or Distribution Fees
|
Gross
Amount
|
Net
Amount
|
||||||||||||||||
|
June 26, 2024
|
June 27, 2024
|
July 29, 2024
|
Regular
|
$
|
0.2300
|
$
|
0.2100
|
$
|
68,922
|
$
|
63,626
|
||||||||||||
|
July 26, 2024
|
July 30, 2024
|
August 28, 2024
|
Regular
|
0.2300
|
0.2100
|
142,491
|
131,591
|
||||||||||||||||
|
August 23, 2024
|
August 29, 2024
|
September 26, 2024
|
Regular
|
0.2300
|
0.2100
|
201,157
|
185,825
|
||||||||||||||||
|
September 25, 2024
|
September 27, 2024
|
October 29, 2024
|
Regular
|
0.2300
|
0.2100
|
255,347
|
235,807
|
||||||||||||||||
|
October 24, 2024
|
October 30, 2024
|
November 27, 2024
|
Regular
|
0.2300
|
0.2100
|
320,062
|
295,709
|
||||||||||||||||
|
November 25, 2024
|
November 27, 2024
|
December 27, 2024
|
Regular
|
0.2300
|
0.2100
|
377,573
|
348,681
|
||||||||||||||||
|
December 20, 2024
|
December 30, 2024
|
January 29, 2025
|
Regular
|
0.2300
|
0.2100
|
415,880
|
384,088
|
||||||||||||||||
|
|
$
|
1.6100
|
$
|
1.4700
|
$
|
1,781,432
|
$
|
1,645,327
|
|||||||||||||||
|
January 24, 2025
|
January 30, 2025
|
February 26, 2025
|
Regular
|
$
|
0.2300
|
$
|
0.2124
|
$
|
472,537
|
$
|
436,377
|
||||||||||||
|
February 25, 2025
|
February 27, 2025
|
March 27, 2025
|
Regular
|
0.2300
|
0.2125
|
527,138
|
487,029
|
||||||||||||||||
|
March 24, 2025
|
March 28, 2025
|
April 28, 2025
|
Regular
|
0.2300
|
0.2125
|
599,042
|
553,463
|
||||||||||||||||
|
April 24, 2025
|
April 29, 2025
|
May 28, 2025
|
Regular
|
0.2300
|
0.2127
|
683,484
|
632,083
|
||||||||||||||||
|
May 23, 2025
|
May 29, 2025
|
June 26, 2025
|
Regular
|
0.2300
|
0.2129
|
731,457
|
677,139
|
||||||||||||||||
|
June 26, 2025
|
June 27, 2025
|
July 29, 2025
|
Regular
|
0.2300
|
0.2128
|
783,555
|
724,982
|
||||||||||||||||
|
July 25, 2025
|
July 30, 2025
|
August 27, 2025
|
Regular
|
0.2300
|
0.2128
|
847,411
|
784,161
|
||||||||||||||||
|
August 22, 2025
|
August 28, 2025
|
September 26, 2025
|
Regular
|
0.1980
|
0.1808
|
783,407
|
715,516
|
||||||||||||||||
|
September 26, 2025
|
September 29, 2025
|
October 29, 2025
|
Regular
|
0.1976
|
0.1805
|
836,967
|
764,370
|
||||||||||||||||
|
October 24, 2025
|
October 30, 2025
|
November 26, 2025
|
Regular
|
0.1966
|
0.1796
|
864,300
|
789,349
|
||||||||||||||||
|
November 26, 2025
|
November 28, 2025
|
December 29, 2025
|
Regular
|
0.1959
|
0.1789
|
910,079
|
831,135
|
||||||||||||||||
|
December 23, 2025
|
December 30, 2025
|
January 28, 2026
|
Regular
|
0.1959
|
0.1789
|
936,819
|
855,583
|
||||||||||||||||
|
$
|
2.5940
|
$
|
2.3873
|
$
|
8,976,196
|
$
|
8,251,187
|
||||||||||||||||
| (1) |
Class S commenced operations on June 1, 2024.
|
Class D Shares
The following table summarizes the Fund’s dividends declared for the Class D shares for the year ended December 31, 2025 and 2024.
|
Date Declared (1)
|
Record Date
|
Payment Date
|
Type
|
Gross
Amount
Per Share
|
Amount Per Share Net of Shareholder
Servicing
and/or Distribution Fees
|
Gross
Amount
|
Net
Amount
|
||||||||||||||||
|
August 23, 2024
|
August 29, 2024
|
September 26, 2024
|
Regular
|
$
|
0.2300
|
$
|
0.2248
|
$
|
28
|
$
|
27
|
||||||||||||
|
September 25, 2024
|
September 27, 2024
|
October 29, 2024
|
Regular
|
0.2300
|
0.2248
|
51
|
50
|
||||||||||||||||
|
October 24, 2024
|
October 30, 2024
|
November 27, 2024
|
Regular
|
0.2300
|
0.2200
|
27,906
|
27,275
|
||||||||||||||||
|
November 25, 2024
|
November 27, 2024
|
December 27, 2024
|
Regular
|
0.2300
|
0.2200
|
29,249
|
28,588
|
||||||||||||||||
|
December 20, 2024
|
December 30, 2024
|
January 29, 2025
|
Regular
|
0.2300
|
0.2200
|
29,297
|
28,638
|
||||||||||||||||
|
|
$
|
1.1500
|
$
|
1.0996
|
$
|
86,531
|
$
|
84,578
|
|||||||||||||||
|
January 24, 2025
|
January 30, 2025
|
February 26, 2025
|
Regular
|
$
|
0.2300
|
$
|
0.2248
|
$
|
30,170
|
$
|
29,488
|
||||||||||||
|
February 25, 2025
|
February 27, 2025
|
March 27, 2025
|
Regular
|
0.2300
|
0.2248
|
32,328
|
31,597
|
||||||||||||||||
|
March 24, 2025
|
March 28, 2025
|
April 28, 2025
|
Regular
|
0.2300
|
0.2249
|
34,059
|
33,304
|
||||||||||||||||
|
April 24, 2025
|
April 29, 2025
|
May 28, 2025
|
Regular
|
0.2300
|
0.2249
|
37,499
|
36,670
|
||||||||||||||||
|
May 23, 2025
|
May 29, 2025
|
June 26, 2025
|
Regular
|
0.2300
|
0.2250
|
37,558
|
36,737
|
||||||||||||||||
|
June 26, 2025
|
June 27, 2025
|
July 29, 2025
|
Regular
|
0.2300
|
0.2249
|
46,315
|
45,297
|
||||||||||||||||
|
July 25, 2025
|
July 30, 2025
|
August 27, 2025
|
Regular
|
0.2300
|
0.2250
|
24,559
|
23,409
|
||||||||||||||||
|
August 22, 2025
|
August 28, 2025
|
September 26, 2025
|
Regular
|
0.1980
|
0.1930
|
24,447
|
23,762
|
||||||||||||||||
|
September 26, 2025
|
September 29, 2025
|
October 29, 2025
|
Regular
|
0.1976
|
0.1926
|
22,624
|
21,940
|
||||||||||||||||
|
October 24, 2025
|
October 30, 2025
|
November 26, 2025
|
Regular
|
0.1966
|
0.1916
|
22,433
|
21,861
|
||||||||||||||||
|
November 26, 2025
|
November 28, 2025
|
December 29, 2025
|
Regular
|
0.1959
|
0.1909
|
18,547
|
18,073
|
||||||||||||||||
|
December 23, 2025
|
December 30, 2025
|
January 28, 2026
|
Regular
|
0.1959
|
0.1909
|
18,287
|
17,821
|
||||||||||||||||
|
$
|
2.5940
|
$
|
2.5332
|
$
|
348,827
|
$
|
339,959
|
||||||||||||||||
| (1) |
Class D commenced operations on August 1, 2024.
|
Tax characteristics of any distributions are reported to shareholders on Form 1099-DIV or Form 1042-S after the end of the calendar year.
We have elected to be taxed as a RIC under Subchapter M of the Code. In order to maintain favorable RIC tax treatment, we must distribute annually to our shareholders at least 90% of our ordinary income and realized
net short-term capital gains in excess of realized net long-term capital losses, if any, out of the assets legally available for distribution. In order to avoid certain excise taxes imposed on RICs, we must distribute during each calendar year an
amount at least equal to the sum of:
| • |
98% of our ordinary income (not taking into account any capital gains or losses) for the calendar year;
|
| • |
98.2% of the amount by which our capital gains exceed our capital losses (adjusted for certain ordinary losses) for the one-year period generally ending on October 31 of the calendar year; and
|
| • |
certain undistributed amounts from previous years on which we paid no U.S. federal income tax.
|
We may, at our discretion, carry forward taxable income in excess of calendar year distributions and pay a 4% excise tax on this income. If we choose to do so, all other things being equal, this would increase
expenses and reduce the amounts available to be distributed to our shareholders. We will accrue excise tax on estimated taxable income as required. In addition, although we currently intend to distribute realized net capital gains (i.e., net
long-term capital gains in excess of short-term capital losses), if any, at least annually, out of the assets legally available for such distributions, we may in the future decide to retain such capital gains for investment.
We may not be able to achieve operating results that will allow us to make dividends and distributions at a specific level or to increase the amount of these dividends and distributions from time to time. Also, we
may be limited in our ability to make dividends and distributions due to the asset coverage test applicable to us as a BDC under the 1940 Act and due to provisions in our existing and future credit facilities. If we do not distribute a certain
percentage of our income annually, we will suffer adverse tax consequences, including possible loss of favorable RIC tax treatment. In addition, in accordance with GAAP and tax regulations, we include in income certain amounts that we have not yet
received in cash, such as PIK interest, which represents contractual interest added to the loan balance that becomes due at the end of the loan term, or the accrual of original issue or market discount. Since we may recognize income before or
without receiving cash representing such income, we may have difficulty meeting the requirement to distribute at least 90% of our investment company taxable income to obtain tax benefits as a RIC and may be subject to an excise tax.
In order to satisfy the annual distribution requirement applicable to RICs, we have the ability to pay a large portion of a dividend in our Common Shares instead of in cash. As long as a sufficient portion of such
dividend is paid in cash (which portion can generally be as low as 20%) and certain requirements are met, the entire distribution would be treated as a dividend for U.S. federal income tax purposes.
Related Parties
We have entered into a number of business relationships with affiliated or related parties, including the following:
| • |
The Fund has entered into an Advisory Agreement with the Investment Adviser.
|
| • |
The Fund and the Investment Adviser have entered into the Sub-Advisory Agreement with the Sub-Adviser.
|
| • |
The Fund has entered into the Administration Agreement with the Administrator.
|
| • |
The Fund has entered into a royalty-free license agreement with BlackRock and the Investment Adviser, pursuant to which each of BlackRock and the Investment Adviser has agreed to grant us a non-exclusive, royalty-free license to use the
name “BlackRock.”
|
| • |
The Fund and the Distributor have entered into the Distribution Agreement.
|
| • |
The Fund has entered into the Expense Support and Conditional Reimbursement Agreement with the Investment Adviser.
|
The Advisers and their affiliates, employees and associates currently do and, in the future, may manage other funds and accounts. The Advisers and their affiliates may determine that an investment is appropriate for
us and for one or more of those other funds or accounts. Accordingly, conflicts may arise regarding the allocation of investments or opportunities among us and those accounts. In general, the Advisers will allocate investment opportunities pro rata
among us and the other funds and accounts (assuming the investment satisfies the objectives of each) based on the amount of committed capital each then has available. The allocation of certain investment opportunities in private placements is
subject to independent director approval pursuant to the terms of the co-investment exemptive order applicable to us. In certain cases, investment opportunities may be made other than on a pro rata basis. For example, we may desire to retain an
asset at the same time that one or more other funds or accounts desire to sell it or we may not have additional capital to invest at a time the other funds or accounts do. If the Advisers are unable to manage our investments effectively, we may be
unable to achieve our investment objective. In addition, the Advisers may face conflicts in allocating investment opportunities between us and certain other entities that could impact our investment returns. While our ability to enter into
transactions with our affiliates is restricted under the 1940 Act, we have received an exemptive order from the SEC permitting certain affiliated investments subject to certain conditions. As a result, we may face conflict of interests and
investments made pursuant to the exemptive order conditions which could in certain circumstances affect adversely the price paid or received by us or the availability or size of the position purchased or sold by us.
Recent Developments
On January 2, 2026, the Fund accepted $33.2 million of additional subscriptions, to purchase $30.0 million of additional Institutional shares, $3.1 million of additional Class S shares and $0.1 million of additional
Class D shares, par value $0.001 per share. On January 21, 2026, the number of shares being purchased was fixed when the purchase price of $23.95 per Institutional, Class S shares and Class D shares were determined by the Fund. As a result, the
Fund issued 1.3 million Institutional shares, 0.1 million Class S shares and 0.0 million Class D shares and received $33.2 million in proceeds.
On January 26, 2026, the Fund declared a regular distribution as follows:
|
Gross
Distribution
|
Shareholder
Servicing and/or
Distribution Fee
|
Net Distribution
|
||||||||||
|
Institutional Shares
|
$
|
0.1956
|
$
|
—
|
$
|
0.1956
|
||||||
|
Class S Shares
|
0.1956
|
0.0170
|
0.1786
|
|||||||||
|
Class D Shares
|
0.1956
|
0.0050
|
0.1906
|
|||||||||
The distribution was paid on February 25, 2026 to shareholders of record at the close of business on January 29, 2026. The distribution was paid in cash or reinvested in Fund shares for shareholders participating in
the Fund’s distribution reinvestment plan.
On February 2, 2026, the Fund accepted $48.4 million of additional subscriptions, to purchase $45.1 million of additional Institutional shares, $3.3 million of additional Class S shares and $0.0 million of additional
Class D shares, par value $0.001 per share. On February 20, 2026, the number of shares being purchased was fixed when the purchase price of $23.90 per Institutional, Class S shares and Class D shares were determined by the Fund. As a result, the
Fund issued 1.9 million Institutional shares, 0.1 million Class S shares and 0.0 million Class D shares and received $48.4 million in proceeds.
On February 24, 2026, the Fund declared a regular distribution as follows:
|
Gross
Distribution
|
Shareholder
Servicing and/or
Distribution Fee
|
Net Distribution
|
||||||||||
|
Institutional Shares
|
$
|
0.1951
|
$
|
—
|
$
|
0.1951
|
||||||
|
Class S Shares
|
0.1951
|
0.0169
|
0.1782
|
|||||||||
|
Class D Shares
|
0.1951
|
0.0050
|
0.1901
|
|||||||||
The distribution was paid on March 27, 2026 to shareholders of record at the close of business on February 26, 2026. The distribution was paid in cash or reinvested in Fund shares for shareholders participating in
the Fund’s distribution reinvestment plan.
On February 24, 2026, the Board approved an amendment and restatement of the Fund’s multi-class plan (the “Multi-Class Plan”). The Multi-Class Plan, among other things, allows the Fund’s shares to be exchanged to
other share classes. The Multi-Class Plan became effective immediately.
Quantitative and Qualitative Disclosures About Market Risk
We are subject to financial market risks, including changes in interest rates. At December 31, 2025, 100.0% of debt investments in our portfolio bore interest based on floating rates, such as SOFR, or the Prime Rate.
The interest rates on such investments generally reset by reference to the current market index after one to six months. At December 31, 2025, the percentage of floating rate debt investments in our portfolio that were subject to an interest rate
floor was 80.0%. Floating rate investments subject to a floor generally reset by reference to the current market index after one to six months only if the index exceeds the floor.
Interest rate sensitivity refers to the change in earnings that may result from changes in the level of interest rates. Because we fund a portion of our investments with borrowings, our net investment income is
affected by the difference between the rate at which we invest and the rate at which we borrow. As a result, there can be no assurance that a significant change in market interest rates will not have a material adverse effect on our net investment
income. We assess our portfolio companies periodically to determine whether such companies will be able to continue making interest payments in the event that interest rates increase. There can be no assurances that the portfolio companies will be
able to meet their contractual obligations at any or all levels of increases in interest rates.
Based on our Consolidated Statement of Assets and Liabilities as of December 31, 2025, the following table shows the annual impact on net investment income (excluding the related incentive fee impact) of base rate
changes in interest rates (considering interest rate floors for variable rate instruments and the fact that our assets and liabilities may not have the same base rate period as assumed in this table) assuming no changes in our investment and
borrowing structure:
|
Basis Point Change
|
Net Investment
Income
|
Net Investment Income
Per Share
|
||||||
|
Up 300 basis points
|
$
|
52,656,346
|
$
|
0.80
|
||||
|
Up 200 basis points
|
34,984,073
|
0.53
|
||||||
|
Up 100 basis points
|
17,311,799
|
0.26
|
||||||
|
Down 100 basis points
|
(17,116,522
|
)
|
(0.26
|
)
|
||||
|
Down 200 basis points
|
(33,726,070
|
)
|
(0.51
|
)
|
||||
|
Down 300 basis points
|
(46,781,252
|
)
|
(0.71
|
)
|
||||
INVESTMENT OBJECTIVE AND STRATEGIES
We were formed on December 23, 2021, as a Delaware statutory trust. We were organized to invest primarily in originated loans and other securities, including syndicated loans, of private middle market U.S. companies
targeting core middle market companies with EBITDA of $25 million to $75 million annually.
We have filed an election to be regulated as a BDC under the 1940 Act. We have elected to be treated, and intend to qualify annually, as a RIC under Subchapter M of the Code. As a BDC and a RIC, we will be required
to comply with certain regulatory requirements.
Our investment objective is to target high risk-adjusted returns produced primarily from current income generated by investing primarily in directly originated, senior secured corporate debt instruments.
The Investment Adviser has a deep and experienced investment team, organized across 19 industry-focused verticals, that is among the most tenured in the direct lending market, having invested in the strategy across
multiple market cycles for more than 20 years. This depth of experience enables the team to not only identify unique and less competitive investments, but also to structure customized downside protection and better target outsized risk-adjusted
returns.
The Fund expects to benefit from BlackRock’s broad and established sourcing network to seek attractive investment opportunities across all market environments. BlackRock is one of the largest corporate lenders in the
world and a long-tenured participant in the private debt markets. As such, it has diversified sourcing channels and maintains an active dialogue with industry and sector contacts, banks, brokers, sponsors, secondary desks, client relationships,
other credit-focused investment managers and its well-established network of industry experts and executive-level operating professionals - all of which help to produce attractive deal flow.
The Investment Adviser believes its deep industry and credit experience distinguishes its reputation, allowing BlackRock to uncover opportunities that less-experienced managers are either not qualified to analyze, or
are under-resourced to properly evaluate. BlackRock will continue its longstanding practice of seeking to alter the risk/reward balance in favor of its clients by using a hands-on approach to seek to create superior risk-adjusted returns while
protecting value in challenging situations when required.
The Fund expects to benefit from BlackRock’s successful strategy of investing in privately-originated, performing senior secured debt primarily in North America-based companies. The Fund expects to hold positions in
first lien, second lien and unitranche debt, with a preference for floating-rate debt, which the Investment Adviser believes provides flexibility to adapt to changing market conditions.
Our investment strategy focuses primarily on originating and making loans to U.S. middle market companies. We define “middle market companies” to generally mean companies with earnings before interest expense, income
tax expense, depreciation and amortization, or “EBITDA”, between $10 million and $250 million annually and/or annual revenue of $50 million to $2.5 billion at the time of investment. We generally target the core segment of the middle market, which
is defined as companies with EBITDA of between $25 million and $75 million, though we may invest in smaller or larger companies if an attractive opportunity presents itself, especially when there are dislocations in the capital markets. While we
focus our investments in U.S. companies, we may make investments in portfolio companies that are domiciled outside of the United States, subject to regulatory limitations and other investment restrictions discussed in this Registration Statement.
We invest in senior secured or unsecured loans, subordinated loans or mezzanine loans and, to a lesser extent, equity and equity-related securities which includes common and preferred stock, securities convertible into common stock, and warrants.
The Investment Adviser will generally target for the Fund what it views as healthy businesses that are seeking capital for various objectives, including but not limited to, growth, acquisitions, refinancings/recapitalizations, expansion stage
venture lending and leveraged buyout activity. BlackRock actively seeks to uncover what it believes are overlooked, asset-rich opportunities with a degree of complexity “outside-of the-box” for traditional senior debt providers.
Consistent with our goal of capital preservation, we generally intend to invest in companies with loan-to-value ratios of 50% or lower. Our target credit investments will typically have maturities between three and
ten years. We expect that investments typically will have position sizes that range between 1% and 3% of our portfolio, although investment sizes will vary with the size of our capital base. To a lesser extent, we may make investments in syndicated
loan opportunities for cash management purposes, which includes but is not limited to maintaining liquidity for more liquid investments to manage our share repurchase program. Most of our investments are in private U.S. companies, but (subject to
compliance with BDCs’ requirement to invest at least 70% of its assets in private U.S. companies) we also expect to invest to some extent in European and other non-U.S. companies, but we do not expect to invest in emerging markets. Subject to the
limitations of the 1940 Act, we may invest in loans or other securities, the proceeds of which may refinance or otherwise repay debt or securities of companies whose debt is owned by other BlackRock funds. From time to time, we may co-invest with
other BlackRock funds. See “Regulation—Exemptive Relief.”
The Fund will pursue primary loan originations as its core strategy with capacity for secondary market accumulations when appropriate. A long-established history of investing in both of these segments affords
BlackRock the flexibility to pursue what it views as superior risk-adjusted returns in a variety of market conditions.
The Fund expects that a significant portion of the debt investments in the Fund’s portfolio will bear interest based on floating rates, such as the Federal Funds Rate, SOFR, the Prime Rate, or EURIBOR.
To seek to enhance our returns, we employ and intend to continue to employ leverage as market conditions permit and at the discretion of the Investment Adviser, but in no event will leverage employed exceed the
limitations set forth in the 1940 Act; which currently allows us to borrow up to a 2:1 debt to equity ratio. We use and intend to continue to use leverage in the form of borrowings, including loans from certain financial institutions and the
issuance of debt securities. We may also use leverage in the form of the issuance of preferred shares, but do not currently intend to do so. In determining whether to borrow money, we will analyze the maturity, covenant package and rate structure
of the proposed borrowings as well as the risks of such borrowings compared to our investment outlook. Any such leverage, if incurred, would be expected to increase the total capital available for investment by the Fund. See “Risk Factors—When we
borrow money, the potential for loss on amounts invested in us will be magnified and may increase the risk of investing in us. Borrowed money may also adversely affect the return on our assets, reduce cash available for distribution to our
shareholders and result in losses.”
We expect to pay regular monthly distributions. Any distributions we make will be at the discretion of our Board of Trustees, considering factors such as our earnings, cash flow, capital needs and general financial
condition and the requirements of Delaware law. As a result, our distribution rates and payment frequency may vary from time to time.
Our investments are subject to a number of risks. See “Risk Factors.”
The Investment Adviser, the Sub-Adviser and the Administrator
The Fund’s investment activities are managed by BlackRock Capital Investment Advisors, LLC, an investment adviser registered with the SEC under the Advisers Act. Our Investment Adviser is responsible for originating
prospective investments, conducting research and due diligence investigations on potential investments, analyzing investment opportunities, negotiating and structuring our investments and monitoring our investments and portfolio companies on an
ongoing basis.
BlackRock Advisors, LLC, an investment adviser registered with the SEC under the Advisers Act, serves as our sub-adviser. The Sub-Adviser performs certain of the day-to-day investment management of the Fund. The
Sub-Adviser is primarily responsible for the Fund’s liquid investments, including liquid investments held during the period of time that the Fund is investing the proceeds of this offering in accordance with its investment strategy.
BlackRock Financial Management, Inc, as our Administrator, provides, or oversees the performance of, administrative and compliance services, including, but not limited to, maintaining financial records, overseeing
the calculation of NAV, compliance monitoring (including diligence and oversight of our other service providers), preparing reports to shareholders and reports filed with the SEC, preparing materials and coordinating meetings of our Board of
Trustees, managing the payment of expenses and the performance of administrative and professional services rendered by others and providing office space, equipment and office services.
The Investment Adviser and Sub-Adviser are affiliates of BlackRock. As such, our Adviser and Sub-Adviser have access to the broader resources of BlackRock, subject to BlackRock’s policies and procedures regarding the
management of conflicts of interest.
BlackRock is a leading publicly traded investment management firm, with over $14 trillion of assets under management as of December 31, 2025. BlackRock manages assets on behalf of institutions and individuals
worldwide through a variety of equity, fixed income, real estate, cash management and alternative investment products.
BlackRock serves clients in North and South America, Europe, Asia, Australia, Africa and the Middle East. Headquartered in New York, BlackRock maintains offices in over 38 countries, including 25 primary investment
centers. BlackRock’s institutional knowledge includes proprietary valuation techniques, market outlook, competitive evaluation and structuring and operational expertise. In addition, BlackRock provides risk management, investment system outsourcing
and financial advisory services to a growing number of institutional investors. Through BlackRock Solutions®, BlackRock provides risk management and advisory services that combine capital markets expertise with internally-developed systems and
technology.
Attractive Opportunities in Senior Secured Loans
BlackRock believes that an attractive investment environment exists for middle market and privately-originated illiquid loans using the investment strategy and approach that BlackRock has successfully employed for
over 20 years. Over that time, due to fundamental changes in the U.S. banking system and corporate debt market, lending to middle market companies in the U.S. has radically transformed.
Since BlackRock’s first direct lending investment was made in June 2000, the role of banks in middle market lending has materially reduced. In order to comply with regulations, such as Basel III, the Dodd-Frank Act
and certain provisions therein known as the “Volcker Rule,” banks have reduced their balance sheets to de-risk their business activities. Banks simply cannot lend on the scale they once did to absorb the supply of middle market loans because it has
become economically challenging for banks to hold middle market loans. BlackRock recognizes that stricter regulations and enforcement of leveraged lending guidelines has further reduced bank lending activities in the middle market versus earlier
periods, and in particular, the period prior to the global financial crisis.
Simultaneously, middle market financing needs are high. BlackRock believes that institutional private capital will be needed to address a large volume of financing requirements over the next several years driven by
refinancing needs as well as deployment of private equity cash reserves (often referred to as “dry powder”).
BlackRock believes that the growth of small-to-medium sized businesses will be key to growth for all developed economies, and in particular, the United States. Middle market companies represent approximately
one-third of U.S. private sector GDP and employ nearly 48 million people, providing approximately one-third of all U.S. jobs, according to the National Center for the Middle Market. BlackRock anticipates that direct lending providers to the middle
market will enable these businesses to access capital that is increasingly difficult for them to obtain from traditional bank sources yet is important for continued economic growth. In particular, BlackRock believes the direct lending strategy has
developed into a core asset class that serves the needs of this segment of the U.S. economy. BlackRock has established itself as a leader in this segment over almost two decades with a reputation for reliability and creativity in structuring
financing solutions.
Potential Competitive Strengths
BlackRock believes that the following characteristics distinguish it from other firms and will allow the Fund to maximize the risk/reward ratio of a given investment opportunity.
Strategy
BlackRock has successfully applied its direct lending strategy throughout its history to generate attractive investment opportunities in all phases of a market cycle. Since 1999, BlackRock has deployed more than $49
billion across more than 1,000 companies in its direct lending strategy. BlackRock believes that the following elements of its direct lending strategy are designed to enable the Fund to generate above-market yields:
| I. |
Identifying value where others do not, in complex or overlooked deals through unique, multi-channel sourcing.
|
| II. |
Large, reputable and deeply experienced team that has the ability to respond to various market conditions quickly and effectively.
|
| III. |
Dual direct lending and stressed/distressed (special situations) experience to structure better pricing and downside protection and be prepared for unexpected events.
|
Focus on the Middle Market
Since BlackRock’s first direct lending loan in its first institutional fund was made in 2000, its direct lending strategy has focused primarily on North American middle market companies with target enterprise values
from $100 million to $2.5 billion.
Direct Lending Investment Network and Superior Deal Sourcing Capability
BlackRock’s primary deal flow is derived from its proprietary network established over a 20+ year history of providing direct lending capital to middle market U.S. companies and its intensive industry research and
relationship-based approach. BlackRock’s investment professionals maintain established relationships among industry-focused bankers, restructuring professionals, bankruptcy and other attorneys, senior lenders, liquidators, high yield specialists,
research analysts and major accounting firms. BlackRock’s long history in direct investing provides what it believes is a broader and deeper network of contacts among fellow corporate board members, former colleagues from a range of high- quality
firms, other financial and operating professionals, insurance companies, credit funds, private equity funds, hedge funds and other similar alternative investment funds, which assists in sourcing and negotiating transaction opportunities. Given both
its extremely long tenure in the market as well as its position within the world’s largest asset manager, BlackRock is often a first call for middle market direct lending opportunities, and in particular, those that require a level of specialized
knowledge or skill to underwrite and execute. BlackRock’s Capital Markets team helps to harness the power of the global franchise in an effort to ensure that BlackRock sees the broadest range of deal opportunities across its investment business.
Furthermore, BlackRock’s relationships with prior portfolio companies help facilitate positive word-of-mouth recommendations to others seeking BlackRock’s expertise and capital.
BlackRock’s acquisition of HPS on July 1, 2025 resulted in the formation of the $370 billion Private Financing Solutions (PFS) platform, granting the Company access to even more deal flow. Both BlackRock and HPS have
managed private credit strategies for approximately two decades, each with differentiated origination platforms spanning both sponsor and non-sponsor channels. The Company now benefits from the full scale, sourcing network, and underwriting
expertise of the combined PFS platform, while maintaining its dedicated investment team and strategy-specific governance.
Access to Operating Talent
The Investment Adviser augments its aforementioned in-house talent with multi-year relationships with former senior executives with strong records of success in major companies across industries in which BlackRock
invests. These executive relationships may be used for assistance with due diligence, board seats, sourcing, and in some cases, to fill certain portfolio company operating roles.
Integrity
BlackRock conducts business with the highest standards for integrity. Those standards are apparent in its transparency and openness with its clients, its conservative accounting and management principles, and its
relationships with counterparties, rival and allied creditors, portfolio company management teams and external advisors. BlackRock recognizes the value its business integrity provides in attracting clients, employees and operating talent, sourcing
and evaluating transactions, and in reorganization negotiations.
A Leader in Alternative Credit Investing
For 35+ years, including through legacy entities, BlackRock has been creating and managing alternatives portfolios. BlackRock has continually grown investment capabilities in response to, and in anticipation of,
client needs. This strategic commitment is reflected in the considerable human and technological resources it has developed in order to ensure the long-term success of its alternatives platform. BlackRock has also hired respected industry
professionals to complement its homegrown talent. Today, BlackRock has approximately 2,000 professionals dedicated solely to alternatives across 50+ global investment centers. BlackRock’s strong governance and scale enable its investment teams to
focus solely on investing and benefit from accessing more deals, research, and insight than they would as independent businesses. BlackRock’s scale helps it deliver sourcing, performance, and solutions that aim to help clients achieve objectives.
The Investment Adviser’s leadership team comprises senior professionals from BlackRock.
Investment Process
BlackRock’s investment process is designed for superior execution based upon its strategic advantages: a deep bench of experienced credit professionals across both liquid and illiquid credit strategies, a strong
brand name in middle market direct lending and unique in-house skills in each stage of its investment process.
The investment process is structured around a group of senior industry-focused investment professionals organized into teams that typically follow an investment from origination through realization and supplemented
by incremental origination resources designed to make certain the Firm is accessing all key sourcing channels. BlackRock believes that this consistent involvement of industry focused professionals with intimate knowledge of a company and its unique
industry dynamics leads to better investment outcomes. The Investment Adviser’s investment professionals, particularly at the senior levels, also possess a broad range of transactional experience across both its direct lending and opportunistic
credit strategies. The Investment Adviser believes that this multi-strategy experience benefits direct lending in two key areas: (1) it informs its underwriting, and (2) it improves the Investment Adviser’s ability to source investment
opportunities. The complementary experience in stressed/distressed (special situations) credit informs the Investment Adviser’s underwriting for direct lending portfolios, as substantial experience with companies across each industry vertical in
challenging circumstances assists the team in better understanding relevant areas of diligence and critical documentation provisions that have been previously stress-tested with other comparable companies in each industry sector.
The ability to provide a capital solution to a wide range of middle market deal sources over more than 20 years and across the industries the Firm follows, both in good times and bad, also makes the BlackRock
investment professionals consistently relevant to those deal sources as a valuable capital provider. When industry sectors are performing, BlackRock professionals are providing more direct lending capital, but when an industry experiences a
downturn, BlackRock professionals remain relevant as an opportunistic credit capital provider. BlackRock believes that this active participation across its industry teams to all phases of an industry cycle encourages knowledge-sharing, active
debate, critical examination of unique opportunities, more robust origination and establishes a deeper set of relationships with key deal sources that need a reliable partner.
BlackRock evaluates investment opportunities by following a rigorous and disciplined investment process that combines the characteristics highlighted below.
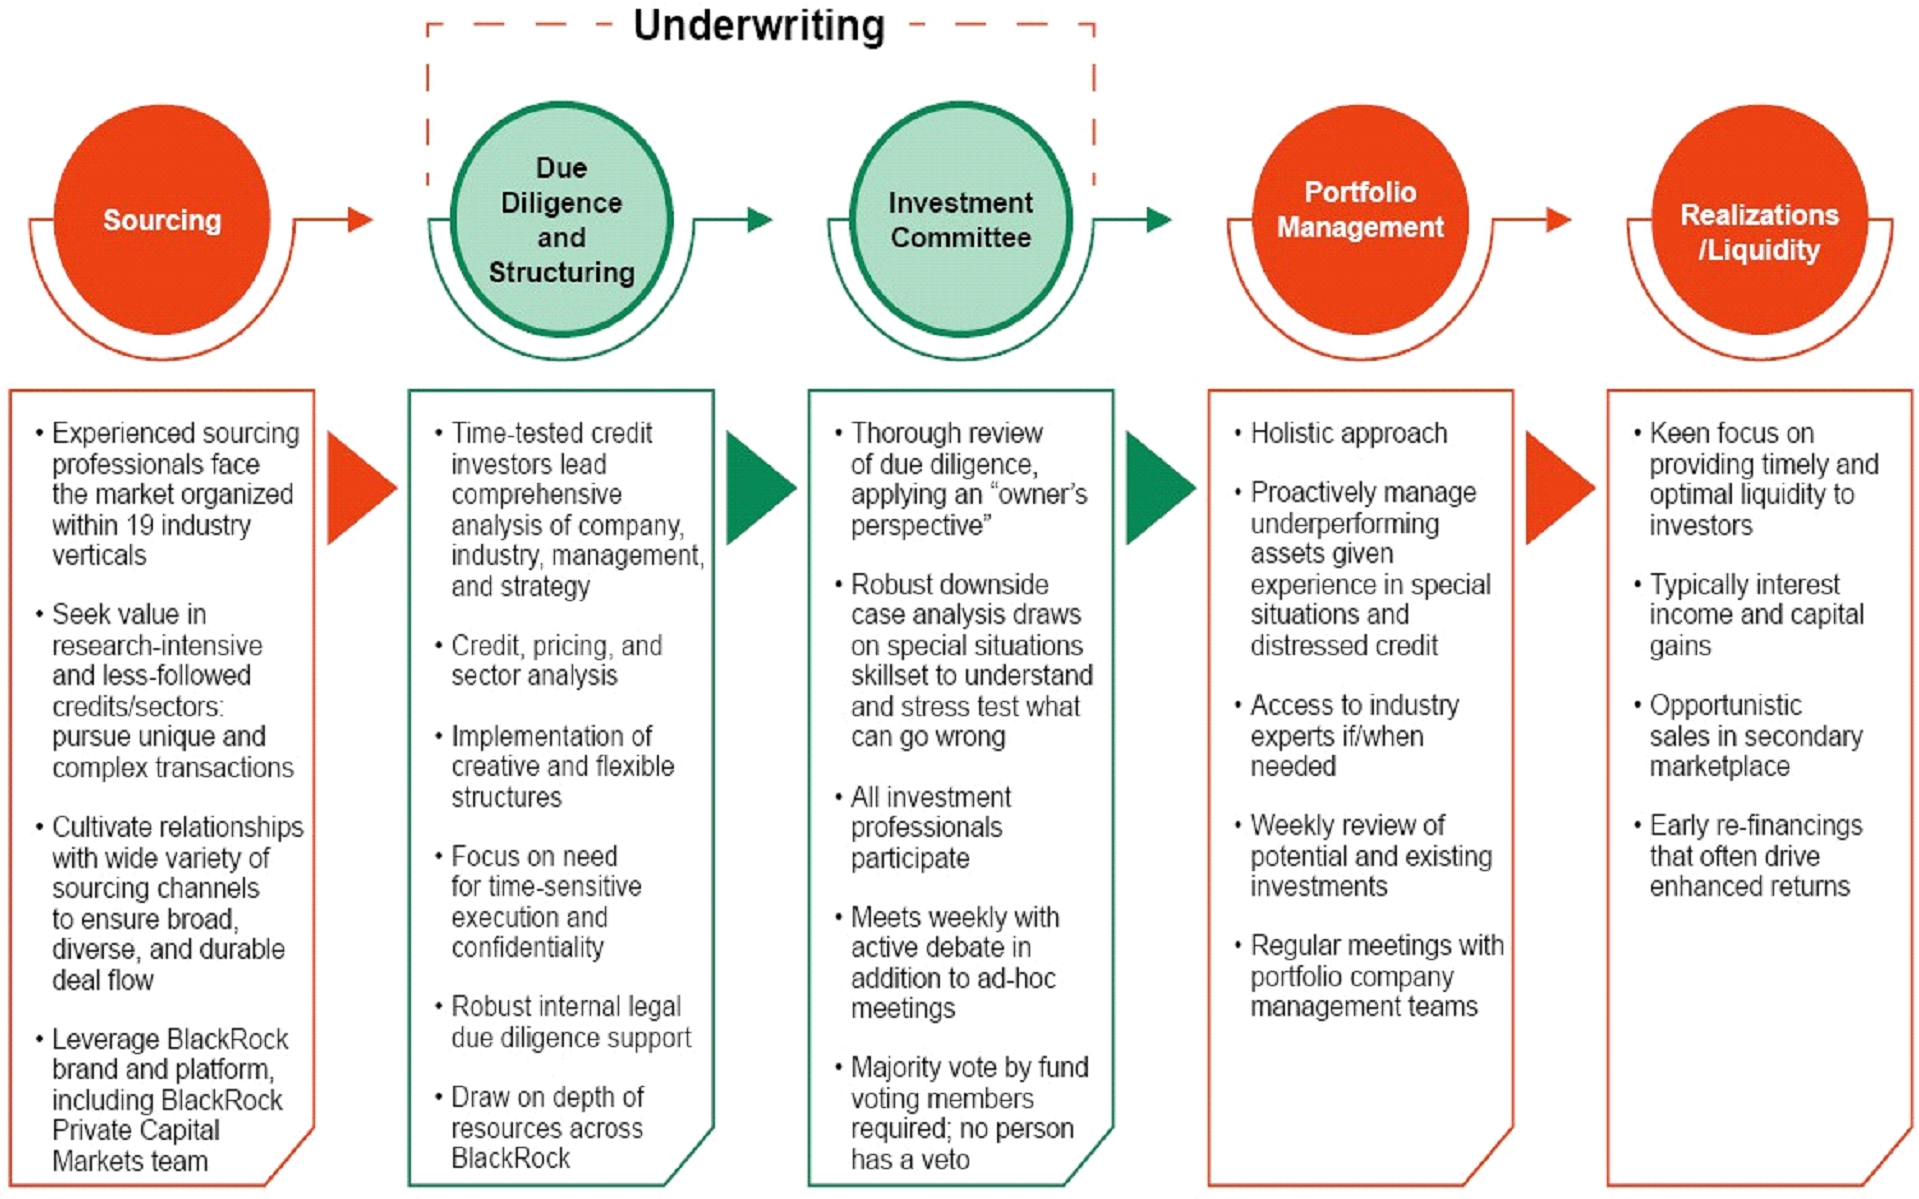
Deal Sourcing
BlackRock’s deal flow comes from its proprietary network and research, earned over an exceptionally long and successful market tenure. The majority of investments in the Fund are expected to be generated from primary
market sources and will also include opportunistic secondary purchases. The Investment Adviser’s investment professionals have long-term relationships with a wide range of deal sources including industry-focused bankers, restructuring
professionals, bankruptcy attorneys, senior lenders, high yield bond specialists, trading desks (both regional and money center), research analysts, liquidators, accounting firms, fund management teams, board members of former portfolio companies,
former colleagues at other high-quality investment firms and other operating professionals to facilitate deal flow.
BlackRock's acquisition of HPS Investment Partners in July 2025 further strengthens this foundation through the creation of the Private Financing Solutions (“PFS”) platform, which serves as the center of excellence
for private credit originations at the firm. PFS acts as the central funnel for all deal flow across sourcing channels, spanning both sponsored and non-sponsored relationships, allowing opportunities to be efficiently captured, screened, and
matched with eligible capital. While BDEBT's investment strategy remains unchanged, the integration enhances the team's sourcing and origination capabilities by centralizing private debt origination within PFS and offering borrowers comprehensive
"one-stop" solutions across the capital structure and lifecycle needs. We believe this increases the opportunity set for investors and provides a competitive advantage relative to capital providers with narrower platforms or more siloed operating
models.
The Investment Adviser also leverages the significant BlackRock organizational resources at its disposal by communicating with members of BlackRock’s global credit platform, including investment-grade credit
analysts, sub-investment grade credit analysts, real estate (both equity and debt) and private equity teams, and professionals in risk and quantitative analysis. Furthermore, the Investment Adviser is supported by the BlackRock Capital Markets
group, a dedicated capital markets team responsible for sourcing private and illiquid investment opportunities across the BlackRock Alternatives platform. The BlackRock Capital Markets group provides global, comprehensive sourcing coverage by
geography, asset class, and transaction type, further supplementing the Investment Adviser’s deal sourcing by maintaining close relationships across multiple sourcing channels.
Given both its tenure in the direct lending market as well as its scope as one of the largest investment managers in the world, BlackRock is often the first call for new deal opportunities in its core middle market
segment. In addition, BlackRock has relationships with numerous other credit investors, including insurance companies, credit funds, multi-strategy private equity funds, hedge funds and other comparable alternative funds that invest in assets
similar to those targeted by the Fund.
In addition to drawing upon experience from its considerable resources, BlackRock regularly calls on both active and recently retired senior-level executives from relevant industries to assist with due diligence for
potential investments. Historically, these relationships with retired senior executives have also been a valuable source of transactions and critical information. BlackRock’s relationships with its portfolio companies across the entirety of its
credit franchise also facilitate positive word-of-mouth recommendations to other companies seeking BlackRock’s expertise and capital. The Firm’s relationship network provides it with the ability to access investment opportunities that competitors
may miss or, in competitive circumstances, allows it to engage at an earlier stage in the process.
Due Diligence
The foundation of BlackRock’s investment process is intensive investment research and analysis by the Firm’s experienced investment professionals. The Investment Adviser’s leadership team has an average of 21 years
of experience; collectively, they possess a level of direct lending investing experience that is difficult to replicate. In addition to the abundant internal relationships and resources available through BlackRock’s global platform, its in-house
knowledge is supplemented with industry experts with direct senior-level management experience in the sectors it targets. The process of rigorously and comprehensively analyzing issuers of securities or loans includes a quantitative and qualitative
assessment of the company’s business, an evaluation of its management, business strategy, industry trends, and an in-depth examination of the company’s capital structure, financial results and projections. BlackRock’s due diligence process
includes:
| • |
An analysis of the fundamental asset values and enterprise value;
|
| • |
Review of key assets, core competencies, competitive advantages, historical and projected financial statements, capital structure, financial flexibility, debt amortization requirements, environmental, social and governance
considerations, and tax, legal and regulatory contingencies;
|
| • |
An assessment of the outlook for the industry and general macroeconomic trends;
|
| • |
Discussions with management, as well as other industry executives, including an assessment of management/board strengths and weaknesses;
|
| • |
Review of the issuer’s credit or other related documents, including those governing the issuer such as charter, by-laws and key contracts; and
|
| • |
Analysis of portfolio risks from a top-down and bottom-up perspective.
|
Investment Committee and Decision-Making
BlackRock’s transaction evaluation is organized around a centralized investment committee that provides for a consistent, repeatable decision-making process. BlackRock’s investment committee for the Fund’s portfolio
(the “Investment Committee”) includes all investment professionals of the Investment Adviser and key senior-level constituents from other functional groups including BlackRock’s Risk and Qualitative Analysis (“RQA”) group. The voting members of the
Investment Committee (the “Voting Members”) will be drawn from a pool of the Investment Adviser’s senior professionals. There are currently six permanent Voting Members. The Investment Committee generally meets several times per week and all key
professionals are invited and encouraged to attend. Transactions are brought before the Investment Committee and presented by the industry-led deal teams and accompanied by detailed investment memoranda distributed for review in advance of each
meeting. Buy/sell recommendations are debated vigorously and all members of the Investment Committee are encouraged to contribute to the discussion. No Voting Member of the Investment Committee holds a veto.
Often, investment opportunities are discussed at multiple meetings as the deal team responds to input provided by the Investment Committee throughout the process. Additionally, the investment policy committee
generally meets weekly to review new investment opportunities scheduled for broader-firm discussion. The investment policy committee’s purpose is to screen each new opportunity to ensure efficient use of Firm resources and focus deal teams on what
it views as the most appropriate potential transactions.
Portfolio Management
BlackRock closely monitors each investment, as it believes that careful and consistent monitoring of financial performance and market developments is critical to successful investment management. This monitoring is
designed to enable BlackRock to respond in a timely and efficient manner to individual company, industry or broader market movements. In addition, BlackRock constructs its direct lending portfolios in a highly-diversified manner by both borrower
and industry in an effort to mitigate the drag of any potential credit losses. Accordingly, BlackRock uses an established process that includes the following:
| • |
Weekly (sometimes daily) monitoring by industry-led deal team members that executed the initial purchase;
|
| • |
Regular and repeated dialogue with investment constituents including company management, industry experts, co-investment partners (if applicable) and senior-level resources throughout the BlackRock platform;
|
| • |
Internal meetings, as needed, to highlight material investment developments or trends;
|
| • |
A weekly review by the Investment Committee of activity related to existing portfolio investments that may require broader feedback and decision-making;
|
| • |
A quarterly portfolio review process that includes a more detailed discussion (with all key investment professionals invited to attend) of each portfolio company meeting certain minimum materiality thresholds to review performance and
outlook relative to the original investment thesis; and
|
| • |
Attendance by industry-focused investment professionals at industry conferences and seminars, and regular meetings with comparable company management contacts.
|
Culture of Risk Management
BlackRock has a strong risk management orientation. The investment professionals use the Firm’s independent RQA group to aid the day to day portfolio management activities.
RQA leads BlackRock’s portfolio risk analytics by providing independent top-down and bottom-up oversight. RQA partners with BlackRock’s investment professionals to help ensure that risks in the portfolio are
consistent across each strategy, with the team’s current investment themes, and with each client’s formal risk constraints. Members of RQA have specialized knowledge of each type of portfolio that BlackRock manages. RQA seeks to identify and
properly measure key risks for each portfolio type.
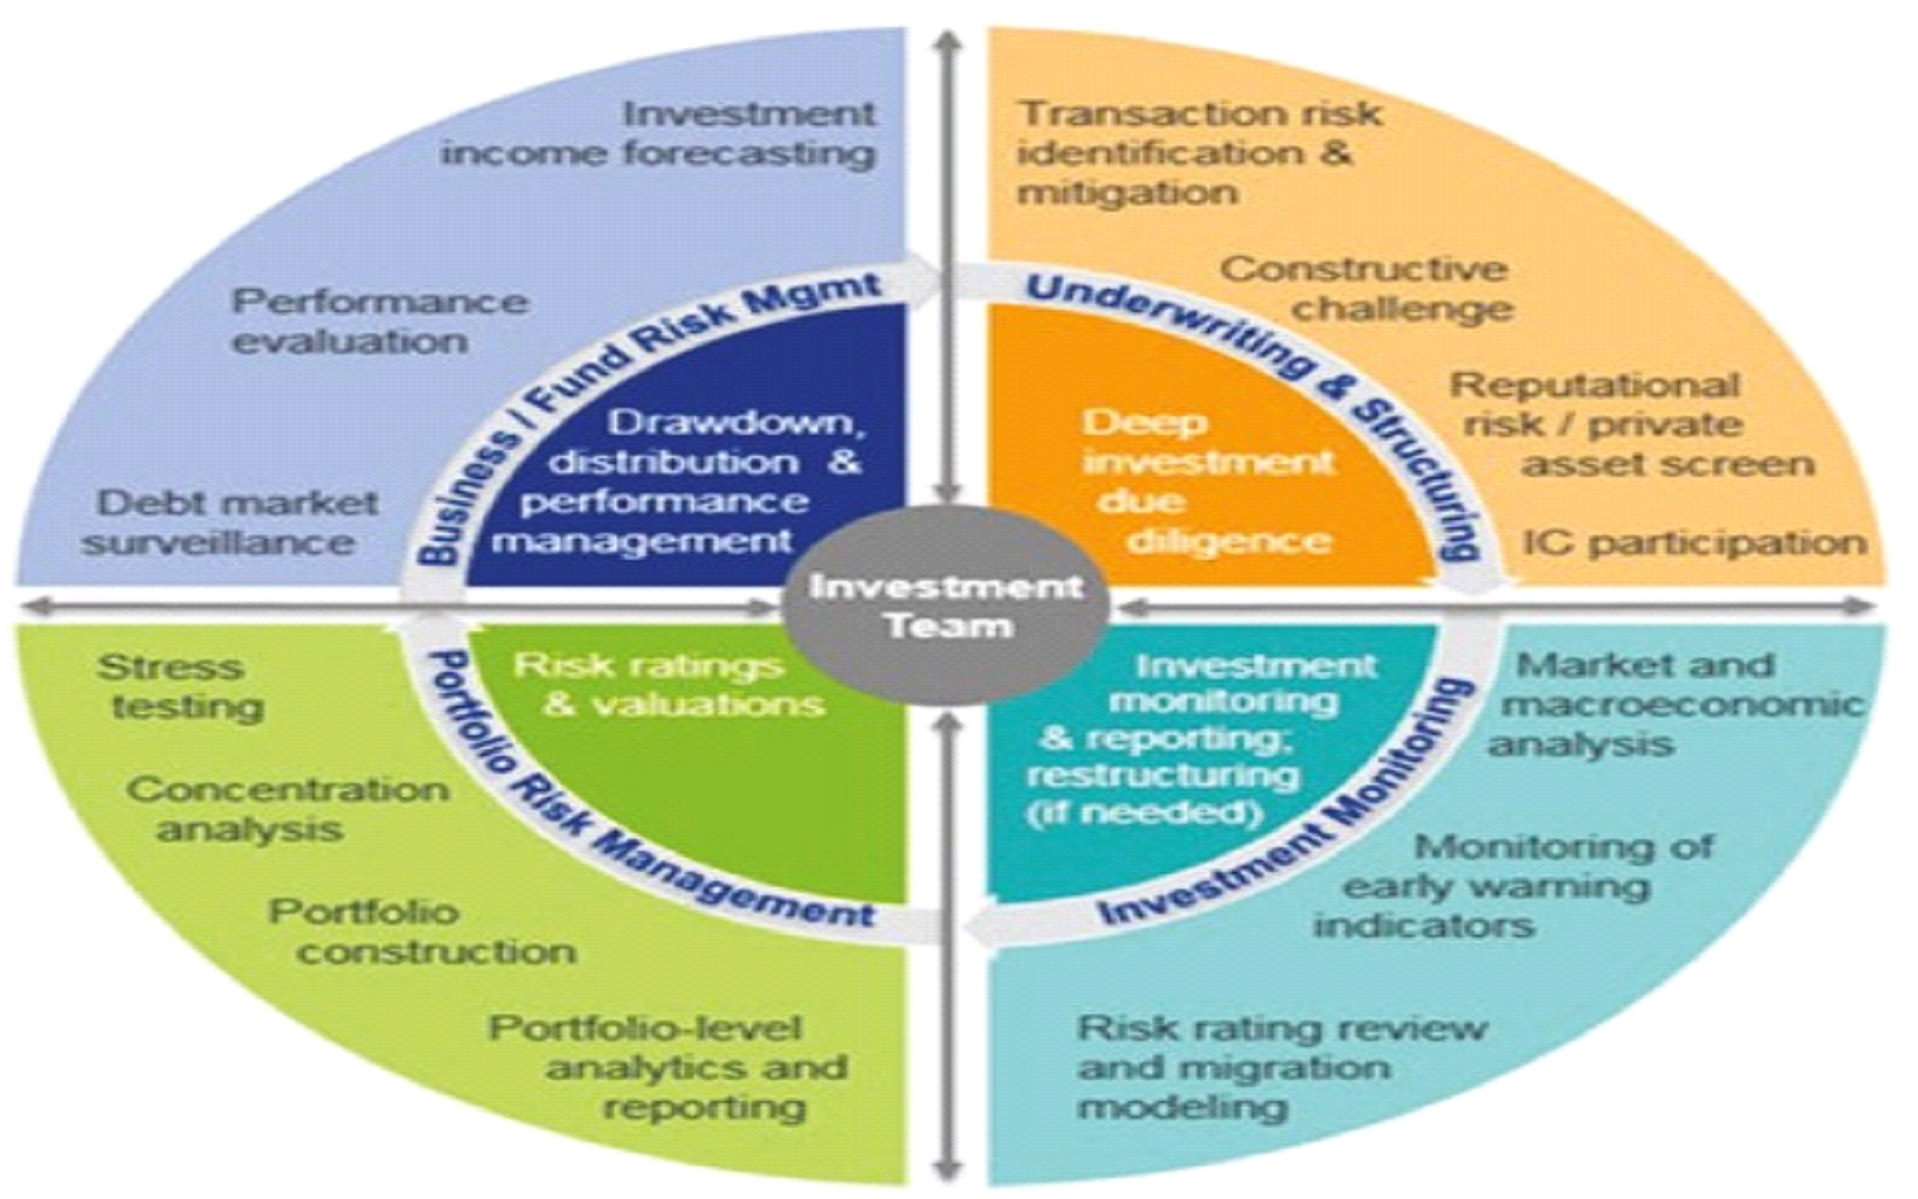
A private credit risk management team engages throughout the investment process. Early involvement with the investment team facilitates identification of risks and effective, constructive challenge. Additionally, the
RQA team has full access to the investment teams’ diligence to provide an unbiased view from the same set of information. The private credit risk team is further supported by the broader RQA platform outlined below.
Realizations
BlackRock anticipates that the returns it will generate for the Fund will be primarily from interest income from cash-pay credit investments in the portfolio with the remainder generated by capital gains. In addition
to regular payments of principal and interest on its credit investments, there are several means by which the Fund will monetize investments, including:
| • |
Refinancing and/or repayment by the issuer/borrower;
|
| • |
Change of control transaction involving the company leading to a refinancing;
|
| • |
Exchanges of existing instruments for new securities that are subsequently sold; and
|
| • |
Public offering of securities that create a liquidity event.
|
Environmental, Social and Governance (“ESG”) Integration
Although the Fund does not seek to implement a specific sustainability objective, strategy or process unless disclosed in the Prospectus, Fund management will consider ESG factors as part of the investment process
for the Fund. Fund management views ESG integration as the practice of incorporating financially material ESG data or information into investment processes with the objective of enhancing risk-adjusted returns. These ESG considerations will vary
depending on a fund’s particular investment strategies and may include consideration of third-party research as well as consideration of proprietary research of the Advisers across the ESG risks and opportunities regarding an issuer. The ESG
characteristics utilized in the Fund’s investment process are anticipated to evolve over time and one or more characteristics may not be relevant with respect to all issuers that are eligible for investment.
Certain of these considerations may affect the Fund’s exposure to certain companies or industries. While Fund management views ESG considerations as having the potential to contribute to the Fund’s long-term
performance, there is no guarantee that such results will be achieved.
Competition
We compete for investments with other BDCs and investment funds (including private equity funds, mezzanine funds, performing and other credit funds, and funds that invest in CLOs, structured notes, derivatives and
other types of collateralized securities and structured products), as well as traditional financial services companies such as commercial banks and other sources of funding. Moreover, alternative investment vehicles, such as hedge funds, have begun
to invest in areas in which they have not traditionally invested, including making investments in mid-sized private U.S. companies. As a result of these new entrants, competition for investment opportunities in middle market private U.S. companies
may intensify. Many of our competitors are substantially larger and have considerably greater financial, technical and marketing resources than we do. For example, some competitors may have a lower cost of capital and access to funding sources that
are not available to us. In addition, some of our competitors may have higher risk tolerances or different risk assessments than we have. These characteristics could allow our competitors to consider a wider variety of investments, establish more
relationships and offer better pricing and more flexible structuring than we are able to do. We may lose investment opportunities if we do not match our competitors’ pricing, terms or structure. If we are forced to match our competitors’ pricing,
terms or structure, we may not be able to achieve acceptable returns on our investments or may bear substantial risk of capital loss. A significant part of our competitive advantage stems from the fact that the market for investments in middle
market private U.S. companies is underserved by traditional commercial banks and other financial sources. A significant increase in the number and/or the size of our competitors in this target market could force us to accept less attractive
investment terms. Furthermore, many of our competitors have greater experience operating under, or are not subject to, the regulatory restrictions that the 1940 Act imposes on us as a BDC.
Non-Exchange Traded, Perpetual-Life BDC
The Fund is non-exchange traded, meaning its shares are not listed for trading on a stock exchange or other securities market and a perpetual-life BDC, meaning it is an investment vehicle of indefinite duration,
whose common shares are intended to be sold by the BDC monthly on a continuous basis at a price generally equal to the BDC’s monthly NAV per share. In our perpetual-life structure, we may, subject to the sole discretion of the Board, offer
investors an opportunity to tender their shares to us for repurchase on a quarterly basis, but we are not obligated to offer to repurchase any shares in any particular quarter in our discretion. We believe that our perpetual nature enables us to
execute a patient and opportunistic strategy and be able to invest across different market environments. This may reduce the risk of the Fund being a forced seller of assets in market downturns compared to non-perpetual funds. While we may consider
a liquidity event at any time in the future, we do not intend to undertake a liquidity event, and we are not obligated by our Declaration of Trust or otherwise to effect a liquidity event at any time.
Emerging Growth Company
We are an “emerging growth company,” as defined by the Jumpstart Our Business Startups Act of 2012, or the “JOBS Act.” As an emerging growth company, we are eligible to take advantage of certain exemptions from
various reporting and disclosure requirements that are applicable to public companies that are not emerging growth companies. For so long as we remain an emerging growth company, we will not be required to:
| • |
have an auditor attestation report on our internal control over financial reporting pursuant to Section 404(b) of the Sarbanes-Oxley Act;
|
| • |
submit certain executive compensation matters to shareholder advisory votes pursuant to the “say on frequency” and “say on pay” provisions (requiring a non-binding shareholder vote to approve compensation of certain executive officers)
and the “say on golden parachute” provisions (requiring a non-binding shareholder vote to approve golden parachute arrangements for certain executive officers in connection with mergers and certain other business combinations) of the
Dodd-Frank Wall Street Reform and Consumer Protection Act of 2010; or
|
| • |
disclose certain executive compensation related items, such as the correlation between executive compensation and performance and comparisons of the chief executive officer’s compensation to median employee compensation.
|
In addition, the JOBS Act provides that an emerging growth company may take advantage of an extended transition period for complying with new or revised accounting standards that have different effective dates for
public and private companies. This means that an emerging growth company can delay adopting certain accounting standards until such standards are otherwise applicable to private companies.
We will remain an emerging growth company for up to five years, or until the earliest of: (1) the last date of the fiscal year during which we had total annual gross revenues of $1.235 billion or more; (2) the date
on which we have, during the previous three-year period, issued more than $1 billion in non-convertible debt; or (3) the date on which we are deemed to be a “large accelerated filer” as defined under Rule 12b-2 under the Exchange Act.
We do not believe that being an emerging growth company will have a significant impact on our business or this offering. As stated above, we have elected to opt in to the extended transition period for complying with
new or revised accounting standards available to emerging growth companies. Also, because we are not a large accelerated filer or an accelerated filer under Section 12b-2 of the Exchange Act, and will not be for so long as our Common Shares are not
traded on a securities exchange, we will not be subject to auditor attestation requirements of Section 404(b) of the Sarbanes-Oxley Act even once we are no longer an emerging growth company. In addition, so long as we are externally managed by the
Investment Adviser and we do not directly compensate our executive officers, or reimburse the Investment Adviser or its affiliates for the salaries, bonuses, benefits and severance payments for persons who also serve as one of our executive
officers or as an executive officer of the Investment Adviser, we do not expect to include disclosures relating to executive compensation in our periodic reports or proxy statements and, as a result, do not expect to be required to seek shareholder
approval of executive compensation and golden parachute compensation arrangements pursuant to Section 14A(a) and (b) of the Exchange Act.
Employees
We do not currently have any employees and do not expect to have any employees. Services necessary for our business are provided by individuals who are employees of the Advisers or its affiliates pursuant to the
terms of the Advisory Agreement and the Administrator or its affiliates pursuant to the Administration Agreement. Each of our executive officers described under “Management of the Fund” is employed by the Advisers or its affiliates. Our day-to-day
investment operations will be managed by the Advisers. The services necessary for the sourcing and administration of our investment portfolio will be provided by investment professionals employed by the Advisers or their affiliates. The investment
team will focus on origination, non-originated investments and transaction development and the ongoing monitoring of our investments. In addition, we will reimburse the Administrator for its costs, expenses and allocable portion of overhead,
including compensation paid by the Administrator (or its affiliates) to the Fund’s chief compliance officer and chief financial officer and their respective staffs as well as other administrative personnel (based on the percentage of time such
individuals devote, on an estimated basis, to the business and affairs of the Fund).
Exemptive Order and SEC Guidance.
The Advisers and the Fund believe that, in certain circumstances, it may be in the Fund’s best interests to be able to co-invest with registered funds, unregistered funds and business development companies managed
now or in the future by the Advisers and their affiliates, along with certain affiliates of the Advisers acting in a principal capacity, in order to be able to participate in a wider range of transactions. Currently, SEC regulations and
interpretations would permit the Fund to co-invest with registered and unregistered funds that are managed by the Advisers and/or their affiliates, along with certain affiliates of the Advisers acting in a principal capacity, in publicly traded
securities and also in private placements where (i) the Advisers negotiate only the price, interest rate and similar price-related terms of the securities and not matters such as covenants, collateral or management rights and (ii) each relevant
account acquires and sells the securities at the same time in pro rata amounts (subject to exceptions approved by compliance personnel after considering the reasons for the requested exception). Such regulations and interpretations also permit the
Fund to co-invest in other private placements with registered investment funds affiliated with the Advisers in certain circumstances, some of which would require certain findings by the Fund’s Independent Trustees and the independent directors of
each other eligible registered fund. Under current SEC regulations, in the absence of an exemption or other guidance from the SEC, the Fund may be prohibited from co-investing in certain private placements where terms in addition to price are
negotiated with certain clients of the Advisers or their affiliates, as well as with certain affiliates of the Advisers acting in a principal capacity.
To the extent permitted by the 1940 Act and interpretations of the staff of the SEC, and subject to the Allocation Policies of the Investment Adviser, the Investment Adviser may deem it appropriate for the Fund to
participate in an investment opportunity alongside certain affiliates of the Investment Adviser and certain other Client Accounts. On May 6, 2025, the SEC granted the Order, which provides exemptive relief to the Investment Adviser, and certain
affiliates, and the Fund that permits the Fund, subject to satisfaction of certain conditions, to co-invest in certain privately negotiated investment transactions with certain affiliates of the Investment Adviser and certain Client Accounts
managed by the Investment Adviser and other BlackRock Entities. Any of these co-investment opportunities may give rise to conflicts of interest or perceived conflicts of interest among us and the other participating funds and/or accounts. To
mitigate these conflicts, the Investment Adviser and its affiliates managing other funds and accounts participating in transactions under the Order will seek to allocate such transactions for all of the participating investment accounts, including
the Fund, on a fair and equitable basis and in accordance with their respective allocation policies. The Board has reviewed, and expects to in the future, review the Allocation Policies of the Investment Adviser. In addition, pursuant to such
order, the Board is required to maintain oversight of our participation in the co-investment program permitted by such order in the exercise of the Board’s reasonable business judgment, and under certain circumstances, such as in the case of
non-pro rata acquisitions and dispositions, or in the case of pre-existing investments in an issuer by certain affiliated funds or accounts, approve certain co-investment transactions.
The Advisers and their affiliates may spend substantial time on other business activities, including investment management and advisory activities for entities with the same or overlapping investment objectives,
investing for their own account with the Fund, financial advisory services (including services for entities in which the Fund invests), and acting as directors, officers, creditor committee members or in similar capacities. Subject to the
requirements of the 1940 Act, the Advisers and their affiliates and associates intend to engage in such activities and may receive compensation from third parties for their services. Subject to the same requirements, such compensation may be
payable by entities in which the Fund invests in connection with actual or contemplated investments, and the Advisers may receive fees and other compensation in connection with structuring investments which they will share.
The Advisers and their partners, officers, directors, stockholders, members, managers, employees, affiliates and agents may be subject to certain potential or actual conflicts of interest in connection with the
activities of, and investments by, the Fund.
The following is a listing of each portfolio company investment, together referred to as our investment portfolio, at December 31, 2025. Percentages shown for class of securities held by us represent percentage of
the class owned and do not necessarily represent voting ownership or economic ownership. Percentages shown for equity securities other than warrants or options represent the actual percentage of the class of security held before dilution.
Percentages shown for warrants and options held represent the percentage of class of security we may own on a fully diluted basis assuming we exercise our warrants or options. Each variable rate debt investment that is determined by a reference to
a reference rate resets either monthly, quarterly, semi-annually or annually.
Our Board of Trustees approved the valuation of our investment portfolio as of December 31, 2025 at fair value as determined in good faith using a consistently applied valuation process in accordance with our
documented valuation policy that has been reviewed and approved by our Board of Trustees. For more information relating to our investments, see our consolidated schedule of investments included in the index to financial statements included
elsewhere in this prospectus.
|
Issuer(F)
|
Company Address
|
Instrument
|
Ref(B)
|
Floor
|
Spread
|
Total
Coupon |
Maturity
|
Principal
|
Cost
|
Fair
Value |
% of Total
Cash and Investment |
Notes |
|||||||||||||||||
|
Debt Investments(A)
|
|||||||||||||||||||||||||||||
|
Aerospace and Defense
|
|||||||||||||||||||||||||||||
|
Arcline FM Holdings, LLC (Fairbanks Morse)
|
655 3rd St, Suite 301, Beloit, WI 53511
|
First Lien Term Loan
|
SOFR(Q)
|
0.75
|
%
|
2.75
|
%
|
6.42
|
%
|
6/23/2030
|
$
|
2,887,923
|
$
|
2,893,381
|
$
|
2,903,489
|
0.12
|
%
|
|||||||||||
|
Cobham Ultra US Co-Borrower LLC (Ultra Electronics)
|
c/o The Corporation Trust Company, 1209 Orange Street, Wilmington, DE 19801
|
First Lien Term Loan
|
SOFR(S)
|
—
|
4.18
|
%
|
8.37
|
%
|
8/4/2029
|
$
|
3,228,596
|
3,230,317
|
3,242,721
|
0.13
|
%
|
||||||||||||||
|
Engineering Research Holding LLC (Astrion, Inc.)
|
1100 Redstone Gateway, Suite 230 & 300, Huntsville, AL 35806
|
First Lien Term Loan
|
SOFR(Q)
|
1.00
|
%
|
5.00
|
%
|
8.67
|
%
|
8/29/2031
|
$
|
22,807,353
|
22,528,778
|
16,649,368
|
0.68
|
%
|
E |
||||||||||||
|
Kaman Corporation
|
1332 Blue Hills Ave, Bloomfield, CT 06002
|
First Lien Term Loan
|
SOFR(Q)
|
—
|
2.50
|
%
|
6.32
|
%
|
1/30/2032
|
$
|
5,772,929
|
5,754,549
|
5,803,266
|
0.24
|
%
|
||||||||||||||
|
Kaman Corporation
|
1332 Blue Hills Ave, Bloomfield, CT 06002
|
First Lien Delayed Draw Term Loan
|
SOFR(Q)
|
—
|
2.50
|
%
|
6.43
|
%
|
2/26/2032
|
$
|
52,283
|
49,913
|
55,158
|
—
|
|||||||||||||||
|
Propulsion BC Finco Sarl (Luxembourg)
|
13, Rue Edward Steichen, Luxembourg, L-2540, Luxembourg
|
First Lien Term Loan
|
SOFR(Q)
|
—
|
5.00
|
%
|
8.69
|
%
|
11/20/2032
|
$
|
1,586,823
|
1,592,220
|
1,596,741
|
0.06
|
%
|
C |
|||||||||||||
|
Skydio, Inc
|
3000 Clearview Way, Building E, San Mateo, CA 94402
|
First Lien Term Loan
|
SOFR(M)
|
2.50
|
%
|
2.75% Cash +2.75% PIK
|
9.17
|
%
|
12/4/2029
|
$
|
7,711,220
|
7,652,362
|
7,641,819
|
0.31
|
%
|
E |
|||||||||||||
|
Skydio, Inc
|
3000 Clearview Way, Building E, San Mateo, CA 94402
|
First Lien Delayed Draw Term Loan B
|
SOFR(M)
|
2.50
|
%
|
5.00% Cash
|
8.73
|
%
|
12/4/2029
|
$
|
—
|
(29,429
|
)
|
(33,750
|
)
|
—
|
D/E |
||||||||||||
|
Skydio, Inc
|
3000 Clearview Way, Building E, San Mateo, CA 94402
|
First Lien Delayed Draw Term Loan A
|
SOFR(M)
|
2.50
|
%
|
5.00% Cash
|
8.73
|
%
|
12/4/2029
|
$
|
3,750,000
|
3,720,571
|
3,716,250
|
0.15
|
%
|
E |
|||||||||||||
|
Signia Aerospace, LLC
|
1575 West 124th Avenue, Suite 210, Westminster, CO 80234, United States
|
First Lien Term Loan
|
SOFR(Q)
|
—
|
2.75
|
%
|
6.44
|
%
|
11/21/2031
|
$
|
5,459,791
|
5,473,122
|
5,486,708
|
0.22
|
%
|
||||||||||||||
|
Signia Aerospace, LLC
|
1575 West 124th Avenue, Suite 210, Westminster, CO 80234, United States
|
First Lien Delayed Draw Term Loan
|
SOFR(Q)
|
—
|
2.75
|
%
|
6.44
|
%
|
11/21/2031
|
$
|
—
|
659
|
590
|
—
|
|||||||||||||||
|
52,866,443
|
47,062,360
|
1.91
|
% | ||||||||||||||||||||||||||
|
Automobiles
|
|||||||||||||||||||||||||||||
|
ABC Technologies Inc. (TI Automotive) (Canada)
|
2 Norelco Drive, Toronto, Ontario M9L 2X6, Canada
|
First Lien Term Loan
|
EURIBOR(M)
|
0.75
|
%
|
5.88
|
%
|
7.78
|
%
|
8/22/2031
|
€
|
17,275,741
|
19,439,337
|
19,604,164
|
0.80
|
%
|
C/E |
||||||||||||
|
ABC Technologies Inc. (TI Automotive) (Canada)
|
2 Norelco Drive, Toronto, Ontario M9L 2X6, Canada
|
First Lien Term Loan
|
SOFR(Q)
|
0.75
|
%
|
5.75
|
%
|
9.47
|
%
|
8/22/2031
|
$
|
29,249,834
|
28,219,047
|
28,228,108
|
1.14
|
%
|
C/E |
||||||||||||
|
47,658,384
|
47,832,272
|
1.94
|
% | ||||||||||||||||||||||||||
|
Auto Components
|
|||||||||||||||||||||||||||||
|
Clarios Global LP (Canada)
|
5757 N. Green Bay Ave., Glendale, WI 53209
|
First Lien Term Loan
|
SOFR(M)
|
—
|
2.75
|
%
|
6.47
|
%
|
1/14/2032
|
$
|
6,214,425
|
6,252,714
|
6,254,228
|
0.25
|
%
|
C |
|||||||||||||
|
Beverages
|
|||||||||||||||||||||||||||||
|
Triton Water Holdings Inc
|
900 Long Ridge Road, Building 2, Stamford, CT 06902, United States
|
First Lien Term Loan
|
SOFR(Q)
|
—
|
2.25
|
%
|
5.92
|
%
|
3/31/2028
|
$
|
622,540
|
622,540
|
625,033
|
0.03
|
%
|
||||||||||||||
|
Building Products
|
|||||||||||||||||||||||||||||
|
Gulfside Supply Inc
|
2900 7th Avenue East, Suite 200, Tampa, FL 33605
|
First Lien Term Loan
|
SOFR(Q)
|
—
|
3.00
|
%
|
6.67
|
%
|
5/29/2031
|
$
|
1,599,360
|
1,594,580
|
1,580,376
|
0.06
|
%
|
||||||||||||||
|
TL Alpine Holding Corp.
|
605 Shiloh Road, Plano, Texas, 75074, United States
|
First Lien Term Loan
|
SOFR(M)
|
1.00
|
%
|
6.00
|
%
|
9.72
|
%
|
8/1/2030
|
$
|
9,624,423
|
9,477,443
|
9,662,921
|
0.39
|
%
|
E |
||||||||||||
|
Trulite Holding Corp.
|
403 Westpark Court, Peachtree City, GA 30269
|
First Lien Term Loan
|
SOFR(Q)
|
1.00
|
%
|
6.00
|
%
|
9.98
|
%
|
3/1/2030
|
$
|
9,975,199
|
9,836,159
|
9,675,943
|
0.40
|
%
|
E |
||||||||||||
|
Wilsonart LLC
|
2501 Wilsonart Dr, Temple, TX 76504, United States
|
First Lien Term Loan
|
SOFR(Q)
|
—
|
4.25
|
%
|
7.92
|
%
|
7/25/2031
|
$
|
5,261,473
|
5,189,992
|
5,109,259
|
0.21
|
%
|
||||||||||||||
|
26,098,174
|
26,028,499
|
1.06
|
%
|
||||||||||||||||||||||||||
|
Issuer(F)
|
Company Address
|
Instrument
|
Ref(B)
|
Floor
|
Spread
|
Total
Coupon |
Maturity
|
Principal
|
Cost
|
Fair
Value |
% of Total
Cash and Investment |
Notes |
|||||||||||||||||
|
Debt Investments - Continued
|
|||||||||||||||||||||||||||||
|
Capital Markets
|
|||||||||||||||||||||||||||||
|
Apex Group Treasury LLC
|
251 Little Falls Drive, Wilmington, DE 19808
|
First Lien Term Loan
|
SOFR(Q)
|
—
|
3.50
|
%
|
7.39
|
%
|
2/20/2032
|
$
|
1,005,419
|
$
|
983,504
|
$
|
950,121
|
0.04
|
%
|
||||||||||||
|
Ardonagh Group FinCo Pty Ltd (Australia)
|
2 Minster Court, Mincing Lane, London, EC3R 7PD, United Kingdom
|
First Lien Term Loan
|
SOFR(Q)
|
—
|
2.75
|
%
|
6.42
|
%
|
2/27/2031
|
$
|
4,622,921
|
4,615,454
|
4,621,973
|
0.19
|
%
|
C |
|||||||||||||
|
Ascensus Holdings, Inc
|
200 Dryden Road, Suite 4000, Dresher, PA 19025
|
First Lien Term Loan
|
SOFR(M)
|
0.50
|
%
|
3.00
|
%
|
6.72
|
%
|
8/2/2028
|
$
|
2,951,085
|
2,954,873
|
2,951,675
|
0.12
|
%
|
|||||||||||||
|
Allspring Buyer, LLC
|
1415 Vantage Park Drive, 3rd Floor, Charlotte, NC 28203
|
First Lien Term Loan
|
SOFR(Q)
|
—
|
2.75
|
%
|
6.81
|
%
|
11/1/2030
|
$
|
815,550
|
817,113
|
820,953
|
0.03
|
%
|
||||||||||||||
|
BCPE Pequod Buyer Inc. (Envestnet Inc.)
|
1000 Chesterbrook Blvd, Berwyn, PA 19312
|
First Lien Term Loan
|
SOFR(M)
|
—
|
3.00
|
%
|
6.72
|
%
|
9/19/2031
|
$
|
2,166,438
|
2,171,851
|
2,173,880
|
0.09
|
%
|
||||||||||||||
|
Brookfield Properties Retail Holding LLC
|
250 Vesey Street, 15th Floor, New York, NY 10281
|
First Lien Term Loan
|
SOFR(M)
|
—
|
3.50
|
%
|
7.22
|
%
|
5/28/2030
|
$
|
309,445
|
305,326
|
311,472
|
0.01
|
%
|
||||||||||||||
|
Focus Financial Partners, LLC
|
1325 Avenue of the Americas, 11th Floor, New York, NY 10019
|
First Lien Term Loan
|
SOFR(M)
|
—
|
2.50
|
%
|
6.22
|
%
|
9/15/2031
|
$
|
6,308,415
|
6,312,705
|
6,326,142
|
0.26
|
%
|
||||||||||||||
|
Grant Thornton Advisors LLC
|
171 N. Clark Street, Suite 200, Chicago, IL 60601
|
First Lien Term Loan
|
SOFR(M)
|
—
|
2.75
|
%
|
6.47
|
%
|
6/2/2031
|
$
|
5,352,996
|
5,347,282
|
5,369,751
|
0.22
|
%
|
||||||||||||||
|
Grant Thornton Advisors LLC
|
171 N. Clark Street, Suite 200, Chicago, IL 60601
|
First Lien Term Loan
|
SOFR(M)
|
—
|
3.00
|
%
|
6.72
|
%
|
5/30/2031
|
$
|
919,695
|
909,316
|
924,459
|
0.04
|
%
|
||||||||||||||
|
OVG Business Services LLC (Oak View)
|
5050 S Syracuse Street, Suite 800, Denver, CO 80237
|
First Lien Term Loan
|
SOFR(M)
|
—
|
3.00
|
%
|
6.72
|
%
|
6/15/2031
|
$
|
1,828,491
|
1,828,360
|
1,834,205
|
0.07
|
%
|
||||||||||||||
|
PMA Parent Holdings, LLC
|
380 Sentry Parkway, Blue Bell, PA 19422
|
First Lien Term Loan
|
SOFR(Q)
|
0.75
|
%
|
4.75
|
%
|
8.42
|
%
|
1/31/2031
|
$
|
44,967,275
|
44,495,836
|
44,595,800
|
1.80
|
%
|
E |
||||||||||||
|
PMA Parent Holdings, LLC
|
380 Sentry Parkway, Blue Bell, PA 19422
|
First Lien Revolver
|
SOFR(Q)
|
0.75
|
%
|
4.75
|
%
|
8.42
|
%
|
1/31/2031
|
$
|
—
|
(53,869
|
)
|
(41,575
|
)
|
—
|
D/E |
|||||||||||
|
Wharf Street Rating Acquisition, LLC (KBRA)
|
805 3rd Ave, Floor 29, New York, NY 10022, United States
|
First Lien Delayed Draw Term Loan
|
SOFR(M)
|
0.75
|
%
|
4.75
|
%
|
8.47
|
%
|
9/16/2032
|
$
|
—
|
(38,662
|
)
|
(27,661
|
)
|
—
|
D/E |
|||||||||||
|
Wharf Street Rating Acquisition, LLC (KBRA)
|
805 3rd Ave, Floor 29, New York, NY 10022, United States
|
First Lien Revolver
|
SOFR(M)
|
0.75
|
%
|
4.75
|
%
|
8.47
|
%
|
9/16/2032
|
$
|
—
|
(37,713
|
)
|
(27,661
|
)
|
—
|
D/E |
|||||||||||
|
Wharf Street Rating Acquisition, LLC (KBRA)
|
805 3rd Ave, Floor 29, New York, NY 10022, United States
|
First Lien Term Loan
|
SOFR(M)
|
0.75
|
%
|
4.75
|
%
|
8.47
|
%
|
9/16/2032
|
$
|
35,437,574
|
35,098,029
|
35,188,625
|
1.43
|
%
|
E |
||||||||||||
|
105,709,405
|
105,972,159
|
4.30
|
%
|
||||||||||||||||||||||||||
|
Chemicals
|
|||||||||||||||||||||||||||||
|
Advancion (f/k/a Aruba Investments Holdings, LLC)
|
1500 E Lake Cook Road, Buffalo Grove, IL 60089
|
First Lien Term Loan
|
SOFR(M)
|
0.75
|
%
|
4.10
|
%
|
7.82
|
%
|
11/24/2027
|
$
|
1,230,720
|
1,227,201
|
1,133,801
|
0.05
|
%
|
|||||||||||||
|
Ascend Learning, LLC
|
25 Mall Road, 6th Floor, Burlington, MA 01803
|
First Lien Term Loan
|
SOFR(M)
|
—
|
3.00
|
%
|
6.72
|
%
|
12/11/2028
|
$
|
2,804,601
|
2,781,774
|
2,817,867
|
0.11
|
%
|
||||||||||||||
|
CP Iris Holdco I, Inc
|
375 Park Avenue, 11th Floor, New York, NY 10152
|
First Lien Delayed Draw Term Loan
|
SOFR(M)
|
—
|
4.00
|
%
|
7.72
|
%
|
10/27/2032
|
$
|
74,543
|
74,693
|
73,048
|
—
|
|||||||||||||||
|
CP Iris Holdco I, Inc
|
375 Park Avenue, 11th Floor, New York, NY 10152
|
First Lien Term Loan
|
SOFR(M)
|
—
|
4.00
|
%
|
7.72
|
%
|
10/18/2032
|
$
|
2,625,211
|
2,630,656
|
2,615,366
|
0.11
|
%
|
||||||||||||||
|
Derby Buyer LLC
|
200 Powder Mill Road, Building 308, Wilmington, DE 19803
|
First Lien Term Loan
|
SOFR(M)
|
—
|
3.00
|
%
|
6.75
|
%
|
11/1/2030
|
$
|
4,719,861
|
4,727,660
|
4,740,345
|
0.18
|
%
|
||||||||||||||
|
Discovery Purchaser Corporation
|
c/o The Corporation Trust Company, 1209 Orange Street, Wilmington, DE 19801
|
First Lien Term Loan
|
SOFR(Q)
|
0.50
|
%
|
3.75
|
%
|
7.61
|
%
|
10/4/2029
|
$
|
3,808,974
|
3,755,238
|
3,669,547
|
0.15
|
%
|
|||||||||||||
|
INEOS Composites International Holdings LLC (FORTIS)
|
38 Hans Crescent, Knightsbridge, London, SW1X 0LZ, UK
|
First Lien Term Loan
|
SOFR(Q)
|
—
|
3.50
|
%
|
7.17
|
%
|
2/6/2032
|
$
|
722,370
|
720,757
|
717,313
|
0.03
|
%
|
||||||||||||||
|
Olympus Water US Holding Corporation (Solenis)
|
2475 Pinnacle Drive, Wilmington, DE 19803
|
First Lien Term Loan
|
SOFR(Q)
|
0.50
|
%
|
3.00
|
%
|
6.67
|
%
|
6/9/2031
|
$
|
4,227,335
|
4,215,451
|
4,197,067
|
0.17
|
%
|
|||||||||||||
|
Sparta U.S. Holdco LLC
|
875 Third Avenue, 11th Floor, New York, NY 10022, United States
|
First Lien Term Loan
|
SOFR(M)
|
0.75
|
%
|
3.00
|
%
|
6.86
|
%
|
8/2/2028
|
$
|
2,154,660
|
2,136,167
|
2,142,088
|
0.09
|
%
|
|||||||||||||
|
W. R. Grace Holdings, LLC
|
7500 Grace Drive, Columbia, MD 21044, United States
|
First Lien Term Loan
|
SOFR(Q)
|
0.50
|
%
|
3.00
|
%
|
6.67
|
%
|
8/19/2032
|
$
|
1,663,830
|
1,653,877
|
1,668,505
|
0.07
|
%
|
|||||||||||||
|
23,923,474
|
23,774,947
|
0.96
|
%
|
||||||||||||||||||||||||||
|
Issuer(F)
|
Company Address
|
Instrument
|
Ref(B)
|
Floor
|
Spread
|
Total
Coupon |
Maturity
|
Principal
|
Cost
|
Fair
Value |
% of Total
Cash and Investment |
Notes
|
|||||||||||||||||
|
Debt Investments - Continued
|
|||||||||||||||||||||||||||||
|
Commercial Services and Supplies
|
|||||||||||||||||||||||||||||
|
Allied Universal Holdco LLC
|
251 Little Falls Drive, Wilmington, DE 19808
|
First Lien Term Loan
|
SOFR(M)
|
0.75
|
%
|
3.25
|
%
|
6.97
|
%
|
8/5/2032
|
$
|
6,683,639
|
$
|
6,689,196
|
$
|
6,726,448
|
0.27
|
%
|
|||||||||||
|
Anticimex Inc. (Sweden)
|
Hälsingegatan 40, SE-113 43 Stockholm, Sweden
|
First Lien Term Loan
|
SOFR(Q)
|
—
|
2.90
|
%
|
6.81
|
%
|
11/17/2031
|
$
|
184,729
|
184,729
|
185,884
|
0.01
|
%
|
C |
|||||||||||||
|
Apollo Group Holdco, LLC (Topsail)
|
6950 NW 77th Court, Doral, FL 33166
|
First Lien Term Loan
|
SOFR(Q)
|
1.00
|
%
|
5.75
|
%
|
9.42
|
%
|
12/26/2030
|
$
|
15,477,503
|
15,220,345
|
15,353,683
|
0.62
|
%
|
E |
||||||||||||
|
Cohnreznick Advisory LLC
|
1301 Avenue of the Americas, 10th Floor, New York, NY 10019
|
First Lien Term Loan
|
SOFR(Q)
|
—
|
3.50
|
%
|
7.17
|
%
|
3/31/2032
|
$
|
21,081,233
|
21,006,950
|
21,226,272
|
0.85
|
%
|
||||||||||||||
|
Cohnreznick Advisory LLC
|
1301 Avenue of the Americas, 10th Floor, New York, NY 10019
|
First Lien Delayed Draw Term Loan
|
SOFR(Q)
|
—
|
3.50
|
%
|
7.17
|
%
|
3/31/2032
|
$
|
(3,144
|
)
|
(14,726
|
)
|
19,937
|
—
|
D |
||||||||||||
|
Creative Artists Agency, LLC.
|
2000 Avenue of the Stars, Los Angeles, CA 90067
|
First Lien Term Loan
|
SOFR(M)
|
—
|
2.50
|
%
|
6.22
|
%
|
10/1/2031
|
$
|
4,126,534
|
4,128,258
|
4,147,167
|
0.17
|
%
|
||||||||||||||
|
Dealer Tire Financial, LLC
|
7012 Euclid Ave, Cleveland, OH 44103
|
First Lien Term Loan
|
SOFR(M)
|
—
|
3.00
|
%
|
6.72
|
%
|
7/2/2031
|
$
|
1,881,242
|
1,875,181
|
1,885,945
|
0.08
|
%
|
||||||||||||||
|
EnergySolutions, LLC
|
299 South Main Street, Suite 1700, Salt Lake City, UT 84111
|
First Lien Term Loan
|
SOFR(M)
|
0.50
|
%
|
3.25
|
%
|
6.97
|
%
|
9/18/2030
|
$
|
647,427
|
644,621
|
652,687
|
0.03
|
%
|
|||||||||||||
|
Ensemble RCM, LLC
|
11511 Reed Hartman Hwy, Blue Ash, OH 45241
|
First Lien Term Loan B
|
SOFR(Q)
|
—
|
3.00
|
%
|
6.84
|
%
|
8/3/2029
|
$
|
5,337,605
|
5,343,943
|
5,370,004
|
0.22
|
%
|
||||||||||||||
|
GFL Environmental Services Inc (Canada)
|
100 New Park Place, Suite 500, Vaughan, ON L4K 0J3, Canada
|
First Lien Term Loan
|
SOFR(Q)
|
—
|
2.50
|
%
|
6.27
|
%
|
2/4/2032
|
$
|
6,194,475
|
6,216,156
|
6,228,545
|
0.25
|
%
|
C |
|||||||||||||
|
Interstate Waste Services Inc
|
300 Frank W Burr Blvd, Suite 39, Teaneck, NJ 07666
|
First Lien Term Loan
|
SOFR(Q)
|
—
|
3.25
|
%
|
6.92
|
%
|
10/4/2030
|
$
|
1,360,475
|
1,362,286
|
1,364,733
|
0.06
|
%
|
||||||||||||||
|
Madison Safety & Flow LLC
|
444 W Lake Street, Chicago, IL 60606
|
First Lien Term Loan
|
SOFR(M)
|
—
|
2.50
|
%
|
6.23
|
%
|
9/26/2031
|
$
|
3,753,631
|
3,764,526
|
3,784,918
|
0.15
|
%
|
||||||||||||||
|
Modigent, LLC (Pueblo)
|
410 N 44TH St, Suite 650, Phoenix, AZ 85008
|
First Lien Delayed Draw Term Loan
|
SOFR(Q)
|
0.75
|
%
|
5.25
|
%
|
8.92
|
%
|
8/23/2028
|
$
|
5,451,836
|
5,389,531
|
5,380,537
|
0.22
|
%
|
E |
||||||||||||
|
Modigent, LLC (Pueblo)
|
410 N 44TH St, Suite 650, Phoenix, AZ 85008
|
First Lien Term Loan
|
SOFR(Q)
|
0.75
|
%
|
5.25
|
%
|
8.92
|
%
|
8/23/2028
|
$
|
1,415,717
|
1,400,135
|
1,397,202
|
0.06
|
%
|
E |
||||||||||||
|
Modigent, LLC (Pueblo)
|
410 N 44TH St, Suite 650, Phoenix, AZ 85008
|
First Lien Delayed Draw Term Loan
|
SOFR(Q)
|
0.75
|
%
|
5.25
|
%
|
8.92
|
%
|
8/23/2028
|
$
|
982,031
|
970,820
|
969,188
|
0.04
|
%
|
E |
||||||||||||
|
Modigent, LLC (Pueblo)
|
410 N 44TH St, Suite 650, Phoenix, AZ 85008
|
First Lien Revolver
|
SOFR(Q)
|
0.75
|
%
|
5.25
|
%
|
8.92
|
%
|
8/23/2027
|
$
|
—
|
(10,153
|
)
|
(9,853
|
)
|
—
|
D/E
|
|||||||||||
|
TA TT Buyer, LLC (TouchTunes, Octave Music)
|
730 3rd Ave, Suite 21st Floor, New York, NY 10017, United States
|
First Lien Tranche B-1 Term Loan
|
SOFR(Q)
|
0.50
|
%
|
4.75
|
%
|
8.42
|
%
|
4/1/2029
|
$
|
16,717,565
|
16,719,731
|
16,346,686
|
0.66
|
%
|
|||||||||||||
|
90,891,529
|
91,029,983
|
3.69
|
%
|
||||||||||||||||||||||||||
|
Construction Materials
|
|||||||||||||||||||||||||||||
|
Covia Holdings LLC
|
3 Summit Park Drive, Suite 700, Independence, OH 44131
|
First Lien Term Loan
|
SOFR(Q)
|
—
|
2.75
|
%
|
6.71
|
%
|
2/12/2032
|
$
|
2,330,322
|
2,333,466
|
2,317,214
|
0.10
|
%
|
||||||||||||||
|
Potters Industries, LLC
|
3222 Phoenixville Pike, Suite 103, Malvern, PA 19355
|
First Lien Term Loan
|
SOFR(Q)
|
—
|
2.50
|
%
|
6.17
|
%
|
12/9/2032
|
$
|
275,000
|
274,313
|
276,031
|
0.01
|
%
|
||||||||||||||
|
2,607,779
|
2,593,245
|
0.11
|
%
|
||||||||||||||||||||||||||
|
Issuer(F)
|
Company Address
|
Instrument
|
Ref(B)
|
Floor
|
Spread
|
Total
Coupon |
Maturity
|
Principal
|
Cost
|
Fair
Value |
% of Total
Cash and Investment |
Notes
|
|||||||||||||||||
|
Debt Investments - Continued
|
|||||||||||||||||||||||||||||
|
Construction and Engineering
|
|||||||||||||||||||||||||||||
|
Brand Industrial Services Inc
|
600 Galleria Parkway SE, Suite 1100, Atlanta, GA 30339
|
First Lien Term Loan
|
SOFR(Q)
|
0.50
|
%
|
4.50
|
%
|
8.35
|
%
|
8/1/2030
|
$
|
4,645,232
|
$
|
4,605,767
|
$
|
4,245,626
|
0.17
|
%
|
|||||||||||
|
Brown & Settle, Inc.
|
9400 Innovation Dr, Manassas, VA 20110
|
First Lien Term Loan
|
SOFR(Q)
|
1.00
|
%
|
6.25
|
%
|
10.26
|
%
|
5/16/2030
|
$
|
21,998,615
|
21,517,923
|
22,174,604
|
0.90
|
%
|
E | ||||||||||||
|
Brown & Settle, Inc.
|
9400 Innovation Dr, Manassas, VA 20110
|
First Lien Revolver
|
SOFR(M)
|
1.00
|
%
|
6.25
|
%
|
10.12
|
%
|
5/16/2030
|
$
|
1,838,836
|
1,785,263
|
1,838,836
|
0.07
|
%
|
E | ||||||||||||
|
Compsych Holdings Corp
|
130 East Randolph Street, Suite 700, Chicago, IL 60601
|
First Lien Term Loan
|
SOFR(Q)
|
0.75
|
%
|
4.75
|
%
|
8.61
|
%
|
7/22/2031
|
$
|
12,925,854
|
12,874,575
|
13,055,113
|
0.54
|
%
|
E | ||||||||||||
|
Compsych Holdings Corp
|
130 East Randolph Street, Suite 700, Chicago, IL 60601
|
First Lien Delayed Draw Term Loan
|
SOFR(Q)
|
0.75
|
%
|
4.75
|
%
|
8.61
|
%
|
7/22/2031
|
$
|
—
|
(7,414
|
)
|
37,376
|
—
|
D/E
|
||||||||||||
|
JF Acquisition, LLC (JF Petroleum)
|
100 Perimeter Park Dr, #H, Morrisville, NC 27560
|
First Lien Term Loan
|
SOFR(M)
|
1.00
|
%
|
5.75
|
%
|
9.48
|
%
|
6/18/2030
|
$
|
35,990,440
|
35,422,152
|
35,630,536
|
1.44
|
%
|
E | ||||||||||||
|
JF Acquisition, LLC (JF Petroleum)
|
100 Perimeter Park Dr, #H, Morrisville, NC 27560
|
First Lien Revolver
|
SOFR(M)
|
1.00
|
%
|
5.75
|
%
|
9.48
|
%
|
6/18/2030
|
$
|
—
|
(75,397
|
)
|
(41,587
|
)
|
—
|
D/E
|
|||||||||||
|
JF Acquisition, LLC (JF Petroleum)
|
100 Perimeter Park Dr, #H, Morrisville, NC 27560
|
First Lien Delayed Draw Term Loan
|
SOFR(M)
|
1.00
|
%
|
5.75
|
%
|
9.48
|
%
|
6/18/2030
|
$
|
—
|
(110,852
|
)
|
(67,232
|
)
|
—
|
D/E
|
|||||||||||
|
LJ Avalon Holdings, LLC (Ardurra)
|
1000 NW 57th Ct., Suite 800, Miami, FL 33126
|
First Lien Delayed Draw Term Loan
|
SOFR(Q)
|
1.00
|
%
|
4.50
|
%
|
8.34
|
%
|
2/1/2030
|
$
|
2,381,164
|
2,364,060
|
2,381,164
|
0.10
|
%
|
E | ||||||||||||
|
LJ Avalon Holdings, LLC (Ardurra)
|
1000 NW 57th Ct., Suite 800, Miami, FL 33126
|
First Lien Term Loan
|
SOFR(Q)
|
1.00
|
%
|
4.50
|
%
|
8.46
|
%
|
2/1/2030
|
$
|
1,648,177
|
1,633,251
|
1,648,177
|
0.07
|
%
|
E | ||||||||||||
|
LJ Avalon Holdings, LLC (Ardurra)
|
1000 NW 57th Ct., Suite 800, Miami, FL 33126
|
First Lien Delayed Draw Term Loan
|
SOFR(Q)
|
1.00
|
%
|
4.50
|
%
|
8.27
|
%
|
2/1/2030
|
$
|
983,549
|
959,834
|
983,549
|
0.04
|
%
|
E | ||||||||||||
|
LJ Avalon Holdings, LLC (Ardurra)
|
1000 NW 57th Ct., Suite 800, Miami, FL 33126
|
First Lien Revolver
|
SOFR(Q)
|
1.00
|
%
|
4.50
|
%
|
8.29
|
%
|
2/1/2029
|
$
|
—
|
(1,898
|
)
|
—
|
—
|
D/E
|
||||||||||||
|
Legence Holdings LLC (Refficiency)
|
345 Park Avenue, 43rd Floor, New York, NY 10154
|
First Lien Term Loan
|
SOFR(M)
|
—
|
2.25
|
%
|
5.97
|
%
|
12/16/2031
|
$
|
3,028,997
|
3,039,748
|
3,053,608
|
0.12
|
%
|
||||||||||||||
|
Pioneer Acquisitionco, LLC
|
251 Little Falls Drive, Wilmington, DE 19808
|
First Lien Term Loan
|
SOFR(Q)
|
—
|
3.25
|
%
|
6.94
|
%
|
10/23/2032
|
$
|
188,000
|
187,540
|
189,058
|
0.01
|
%
|
||||||||||||||
|
RBS Buyer Inc.
|
5901 Stewart Pkwy Douglasville, GA 30135
|
First Lien Delayed Draw Term Loan
|
SOFR(Q)
|
1.00
|
%
|
5.00
|
%
|
8.84
|
%
|
7/31/2031
|
$
|
—
|
(19,794
|
)
|
34,064
|
—
|
D/E
|
||||||||||||
|
RBS Buyer Inc.
|
5901 Stewart Pkwy Douglasville, GA 30135
|
First Lien Revolver
|
SOFR(Q)
|
1.00
|
%
|
5.00
|
%
|
8.84
|
%
|
7/31/2031
|
$
|
—
|
(65,979
|
)
|
—
|
—
|
D/E
|
||||||||||||
|
RBS Buyer Inc.
|
5901 Stewart Pkwy Douglasville, GA 30135
|
First Lien Term Loan
|
SOFR(Q)
|
1.00
|
%
|
5.00
|
%
|
8.84
|
%
|
7/31/2031
|
$
|
19,254,896
|
19,031,127
|
19,447,445
|
0.79
|
%
|
E |
||||||||||||
|
Titan Home Improvement, LLC (Renuity)
|
1447 S Tryon St, Charlotte, NC 28203
|
First Lien Term Loan
|
SOFR(Q)
|
1.00
|
%
|
4.75
|
%
|
8.57
|
%
|
5/31/2030
|
$
|
9,533,188
|
9,392,997
|
9,628,520
|
0.39
|
%
|
E |
||||||||||||
|
Titan Home Improvement, LLC (Renuity)
|
1447 S Tryon St, Charlotte, NC 28203
|
First Lien Delayed Draw Term Loan
|
SOFR(Q)
|
1.00
|
%
|
4.75
|
%
|
8.57
|
%
|
5/31/2030
|
$
|
—
|
(13,309
|
)
|
18,101
|
—
|
D/E
|
||||||||||||
|
Titan Home Improvement, LLC (Renuity)
|
1447 S Tryon St, Charlotte, NC 28203
|
First Lien Revolver
|
SOFR(Q)
|
1.00
|
%
|
4.75
|
%
|
8.57
|
%
|
5/31/2030
|
$
|
—
|
(22,172
|
)
|
—
|
—
|
D/E
|
||||||||||||
|
Tecta America Corp.
|
9450 Bryn Mawr Ave, Ste 500, Rosemont, IL 60018-5274, United States
|
First Lien Term Loan
|
SOFR(M)
|
1.00
|
%
|
2.75
|
%
|
6.47
|
%
|
2/18/2032
|
$
|
1,376,085
|
1,381,131
|
1,383,069
|
0.06
|
%
|
|||||||||||||
|
Vortex Companies, LLC
|
18150 Imperial Valley Dr, Houston, TX 77060
|
First Lien Delayed Draw Term Loan
|
SOFR(M)
|
1.00
|
%
|
5.00
|
%
|
8.72
|
%
|
9/4/2029
|
$
|
11,069,460
|
10,940,583
|
11,124,807
|
0.45
|
%
|
E | ||||||||||||
|
Vortex Companies, LLC
|
18150 Imperial Valley Dr, Houston, TX 77060
|
First Lien Term Loan
|
SOFR(M)
|
1.00
|
%
|
5.00
|
%
|
8.72
|
%
|
9/4/2029
|
$
|
4,972,668
|
4,914,773
|
4,997,531
|
0.20
|
%
|
E | ||||||||||||
|
Vortex Companies, LLC
|
18150 Imperial Valley Dr, Houston, TX 77060
|
First Lien Term Loan
|
SOFR(M)
|
1.00
|
%
|
5.00
|
%
|
8.72
|
%
|
9/4/2029
|
$
|
2,671,969
|
2,671,969
|
2,685,329
|
0.11
|
%
|
E | ||||||||||||
|
Vortex Companies, LLC
|
18150 Imperial Valley Dr, Houston, TX 77060
|
First Lien Term Loan
|
SOFR(M)
|
1.00
|
%
|
5.00
|
%
|
8.72
|
%
|
9/4/2029
|
$
|
943,685
|
930,012
|
948,403
|
0.04
|
%
|
E | ||||||||||||
|
Vortex Companies, LLC
|
18150 Imperial Valley Dr, Houston, TX 77060
|
First Lien Term Loan
|
SOFR(M)
|
1.00
|
%
|
5.00
|
%
|
8.72
|
%
|
9/4/2029
|
$
|
9,086,694
|
8,970,998
|
9,132,127
|
0.37
|
%
|
E | ||||||||||||
|
Vortex Companies, LLC
|
18150 Imperial Valley Dr, Houston, TX 77060
|
First Lien Delayed Draw Term Loan
|
SOFR(M)
|
1.00
|
%
|
5.00
|
%
|
8.72
|
%
|
9/4/2029
|
$
|
2,587,408
|
2,551,505
|
2,600,345
|
0.11
|
%
|
E | ||||||||||||
|
Vortex Companies, LLC
|
18150 Imperial Valley Dr, Houston, TX 77060
|
First Lien Delayed Draw Term Loan
|
SOFR(M)
|
1.00
|
%
|
5.00
|
%
|
8.72
|
%
|
9/4/2029
|
$
|
611,620
|
602,754
|
614,678
|
0.02
|
%
|
E | ||||||||||||
|
Vortex Companies, LLC
|
18150 Imperial Valley Dr, Houston, TX 77060
|
First Lien Delayed Draw Term Loan
|
SOFR(M)
|
1.00
|
%
|
5.00
|
%
|
8.72
|
%
|
9/4/2029
|
$
|
832,881
|
762,966
|
860,337
|
0.03
|
%
|
E | ||||||||||||
|
Vortex Companies, LLC
|
18150 Imperial Valley Dr, Houston, TX 77060
|
First Lien Revolver
|
SOFR(M)
|
1.00
|
%
|
5.00
|
%
|
8.72
|
%
|
9/4/2029
|
$
|
839,464
|
815,675
|
839,464
|
0.03
|
%
|
E | ||||||||||||
|
147,039,788
|
149,443,048
|
6.06
|
%
|
||||||||||||||||||||||||||
|
Issuer(F)
|
Company Address
|
Instrument
|
Ref(B)
|
Floor
|
Spread
|
Total
Coupon |
Maturity
|
Principal
|
Cost
|
Fair
Value |
% of Total
Cash and Investment |
Notes |
|||||||||||||||||
|
Debt Investments - Continued
|
|||||||||||||||||||||||||||||
|
Consumer Finance
|
|||||||||||||||||||||||||||||
|
Lucky US BuyerCo, LLC (Global Payments)
|
3550 Lenox Road, Atlanta, GA 30326
|
First Lien Term Loan
|
SOFR(Q)
|
1.00
|
%
|
7.50
|
%
|
11.22
|
%
|
3/30/2029
|
$
|
3,118,582
|
$
|
3,067,974
|
$
|
3,069,259
|
0.13
|
%
|
E |
||||||||||
|
Lucky US BuyerCo, LLC (Global Payments)
|
3550 Lenox Road, Atlanta, GA 30326
|
First Lien Revolver
|
SOFR(Q)
|
1.00
|
%
|
7.50
|
%
|
11.22
|
%
|
3/30/2029
|
$
|
371,870
|
365,203
|
365,393
|
0.01
|
%
|
E |
||||||||||||
|
3,433,177
|
3,434,652
|
0.14
|
%
|
||||||||||||||||||||||||||
|
Containers and Packaging
|
|||||||||||||||||||||||||||||
|
Charter Next Generation, Inc. (fka Charter NEX US, Inc.)
|
300 N. LaSalle Drive, Suite 1575, Chicago, IL 60654
|
First Lien Term Loan
|
SOFR(M)
|
—
|
2.75
|
%
|
6.50
|
%
|
12/1/2030
|
$
|
8,161,664
|
8,156,985
|
8,188,802
|
0.33
|
%
|
||||||||||||||
|
Clydesdale Acquisition Holdings, Inc
|
251 Little Falls Drive, Wilmington, DE 19808
|
First Lien Term Loan
|
SOFR(M)
|
—
|
3.25
|
%
|
6.97
|
%
|
4/13/2029
|
$
|
1,123,954
|
1,123,738
|
1,124,353
|
0.05
|
%
|
||||||||||||||
|
Clydesdale Acquisition Holdings, Inc
|
251 Little Falls Drive, Wilmington, DE 19808
|
First Lien Delayed Draw Term Loan
|
SOFR(M)
|
—
|
3.25
|
%
|
6.97
|
%
|
4/13/2029
|
$
|
17,881
|
17,647
|
(4,852
|
)
|
—
|
D |
|||||||||||||
|
Mauser Packaging Solutions Holding Co
|
1515 W. 22nd Street, Suite 1100, Oak Brook, IL 60523
|
First Lien Term Loan
|
SOFR(Q)
|
—
|
5.00
|
%
|
8.69
|
%
|
4/15/2030
|
$
|
800,000
|
780,339
|
786,168
|
0.03
|
%
|
||||||||||||||
|
10,078,709
|
10,094,471
|
0.41
|
%
|
||||||||||||||||||||||||||
|
Communications Equipment
|
|||||||||||||||||||||||||||||
|
Digicert Inc
|
2801 N Thanksgiving Way, Suite 500, Lehi, UT 84043
|
First Lien Term Loan
|
SOFR(M)
|
0.75
|
%
|
5.75
|
%
|
9.47
|
%
|
7/30/2030
|
$
|
33,854,115
|
33,378,564
|
33,471,665
|
1.36
|
%
|
E |
||||||||||||
|
Distributors
|
|||||||||||||||||||||||||||||
|
Bradyplus Holdings LLC
|
7055 S. Lindell Road, Las Vegas, NV 89118
|
First Lien Term Loan
|
SOFR(Q)
|
—
|
3.50
|
%
|
7.26
|
%
|
12/13/2032
|
$
|
652,000
|
642,220
|
646,158
|
0.03
|
%
|
||||||||||||||
|
Diversified Consumer Services
|
|||||||||||||||||||||||||||||
|
Belron Finance 2019 LLC (United Kingdom)
|
Milton Park, Stroude Road, Egham, Surrey, TW20 9EL, UK
|
First Lien Term Loan
|
SOFR(Q)
|
—
|
2.25
|
%
|
6.12
|
%
|
10/16/2031
|
$
|
2,054,837
|
2,072,303
|
2,068,964
|
0.08
|
%
|
C |
|||||||||||||
|
Express Wash Acquisition Company, LLC (Whistle)
|
5821 Fairview Road, Suite 400, Charlotte, NC, 28209
|
First Lien Term Loan
|
SOFR(Q)
|
1.00
|
%
|
6.25
|
%
|
10.18
|
%
|
4/10/2031
|
$
|
21,560,745
|
21,371,400
|
20,137,736
|
0.81
|
%
|
E |
||||||||||||
|
Express Wash Acquisition Company, LLC (Whistle)
|
5821 Fairview Road, Suite 400, Charlotte, NC, 28209
|
First Lien Revolver
|
SOFR(Q)
|
1.00
|
%
|
6.25
|
%
|
10.18
|
%
|
4/10/2031
|
$
|
—
|
(11,194
|
)
|
(84,124
|
)
|
—
|
D/E |
|||||||||||
|
Fusion Holding Corp. (Finalsite)
|
655 Winding Brook Drive, Glastonbury, CT 06033
|
First Lien Term Loan
|
SOFR(Q)
|
0.75
|
%
|
6.25
|
%
|
9.92
|
%
|
9/29/2028
|
$
|
4,409,996
|
4,357,511
|
4,088,410
|
0.17
|
%
|
E |
||||||||||||
|
Fusion Holding Corp. (Finalsite)
|
655 Winding Brook Drive, Glastonbury, CT 06033
|
First Lien Revolver
|
Prime
|
0.75
|
%
|
5.25
|
%
|
12.00
|
%
|
9/15/2027
|
$
|
204,123
|
201,279
|
189,355
|
0.01
|
%
|
E |
||||||||||||
|
Planet US Buyer LLC
|
9 W 57th Street, 32nd Floor, New York, NY 10019
|
First Lien Term Loan
|
SOFR(Q)
|
—
|
3.00
|
%
|
6.82
|
%
|
1/31/2031
|
$
|
1,118,644
|
1,121,092
|
1,127,330
|
0.05
|
%
|
||||||||||||||
|
29,112,391
|
27,527,671
|
1.12
|
%
|
||||||||||||||||||||||||||
|
Diversified Financial Services
|
|||||||||||||||||||||||||||||
|
Accuserve Solutions, Inc.
|
5611 Hudson Dr, Suite 300, Hudson, OH 44236
|
First Lien Term Loan
|
SOFR(Q)
|
1.00
|
%
|
5.25
|
%
|
9.09
|
%
|
3/15/2030
|
$
|
494,954
|
494,954
|
438,034
|
0.02
|
%
|
E |
||||||||||||
|
Beekeeper Buyer Inc. (Archway)
|
8888 Keystone Crossing, Suite 1400, Indianapolis, IN 46240
|
First Lien Term Loan
|
SOFR(Q)
|
0.75
|
%
|
5.25
|
%
|
8.92
|
%
|
6/30/2031
|
$
|
5,809,164
|
5,755,977
|
5,814,973
|
0.24
|
%
|
E |
||||||||||||
|
Beekeeper Buyer Inc. (Archway)
|
8888 Keystone Crossing, Suite 1400, Indianapolis, IN 46240
|
First Lien Revolver
|
SOFR(Q)
|
0.75
|
%
|
5.25
|
%
|
8.92
|
%
|
6/30/2031
|
$
|
—
|
(13,297
|
)
|
—
|
—
|
D/E |
||||||||||||
|
EdgeCo Buyer, Inc.
|
1251 Waterfront Place, Suite 510, Pittsburgh, PA 15222
|
First Lien Delayed Draw Term Loan E
|
SOFR(Q)
|
1.00
|
%
|
4.50
|
%
|
8.17
|
%
|
6/1/2028
|
$
|
4,934,075
|
4,893,263
|
4,890,246
|
0.20
|
%
|
E |
||||||||||||
|
EdgeCo Buyer, Inc.
|
1251 Waterfront Place, Suite 510, Pittsburgh, PA 15222
|
First Lien Term Loan B
|
SOFR(Q)
|
1.00
|
%
|
4.50
|
%
|
8.17
|
%
|
6/1/2028
|
$
|
2,522,567
|
2,504,839
|
2,503,673
|
0.10
|
%
|
E |
||||||||||||
|
EdgeCo Buyer, Inc.
|
1251 Waterfront Place, Suite 510, Pittsburgh, PA 15222
|
First Lien Term Loan
|
SOFR(Q)
|
—
|
4.50
|
%
|
8.17
|
%
|
6/1/2028
|
$
|
1,102,343
|
1,094,596
|
1,094,086
|
0.04
|
%
|
E |
|||||||||||||
|
EdgeCo Buyer, Inc.
|
1251 Waterfront Place, Suite 510, Pittsburgh, PA 15222
|
First Lien Revolver
|
SOFR(Q)
|
1.00
|
%
|
4.50
|
%
|
8.17
|
%
|
6/1/2028
|
$
|
—
|
(4,116
|
)
|
(4,387
|
)
|
—
|
D/E |
|||||||||||
|
EdgeCo Buyer, Inc.
|
1251 Waterfront Place, Suite 510, Pittsburgh, PA 15222
|
First Lien Delayed Draw Term Loan A
|
SOFR(Q)
|
1.00
|
%
|
4.50
|
%
|
8.17
|
%
|
6/1/2028
|
$
|
214,467
|
212,960
|
212,861
|
0.01
|
%
|
E |
||||||||||||
|
EdgeCo Buyer, Inc.
|
1251 Waterfront Place, Suite 510, Pittsburgh, PA 15222
|
First Lien Delayed Draw Term Loan B
|
SOFR(Q)
|
1.00
|
%
|
4.50
|
%
|
8.17
|
%
|
6/1/2028
|
$
|
186,266
|
184,957
|
184,871
|
0.01
|
%
|
E |
||||||||||||
|
EdgeCo Buyer, Inc.
|
1251 Waterfront Place, Suite 510, Pittsburgh, PA 15222
|
First Lien Delayed Draw Term Loan C
|
SOFR(Q)
|
1.00
|
%
|
4.50
|
%
|
8.17
|
%
|
6/1/2028
|
$
|
61,928
|
61,492
|
61,464
|
—
|
E |
|||||||||||||
|
Issuer(F)
|
Company Address
|
Instrument
|
Ref(B)
|
Floor
|
Spread
|
Total
Coupon |
Maturity
|
Principal
|
Cost
|
Fair
Value |
% of Total
Cash and Investment |
Notes
|
|||||||||||||||||
|
Debt Investments - Continued
|
|||||||||||||||||||||||||||||
|
Diversified Financial Services (Continued)
|
|||||||||||||||||||||||||||||
|
GC Champion Acquisition LLC (Numerix)
|
100 Park Avenue, 15th Floor, New York, NY 10017
|
First Lien Delayed Draw Term Loan
|
SOFR(S)
|
1.00
|
%
|
5.00
|
%
|
9.22
|
%
|
8/19/2028
|
$
|
—
|
$
|
(36,363
|
)
|
$
|
(28,487
|
)
|
—
|
D/E
|
|||||||||
|
GC Champion Acquisition LLC (Numerix)
|
100 Park Avenue, 15th Floor, New York, NY 10017
|
First Lien Incremental Term Loan
|
SOFR(S)
|
1.00
|
%
|
5.00
|
%
|
9.22
|
%
|
8/21/2028
|
$
|
8,786,733
|
8,649,295
|
8,718,768
|
0.35
|
%
|
E | ||||||||||||
|
GC Champion Acquisition LLC (Numerix)
|
100 Park Avenue, 15th Floor, New York, NY 10017
|
First Lien Term Loan
|
SOFR(S)
|
1.00
|
%
|
5.00
|
%
|
9.22
|
%
|
8/21/2028
|
$
|
10,031,377
|
10,011,156
|
9,953,784
|
0.40
|
%
|
E | ||||||||||||
|
GC Champion Acquisition LLC (Numerix)
|
100 Park Avenue, 15th Floor, New York, NY 10017
|
First Lien Delayed Draw Term Loan
|
SOFR(S)
|
1.00
|
%
|
5.00
|
%
|
9.22
|
%
|
8/21/2028
|
$
|
639,841
|
634,224
|
634,892
|
0.03
|
%
|
E | ||||||||||||
|
GC Waves Holdings, Inc. (Mercer)
|
1200 17th Street, Suite 500, Denver, CO 80202
|
First Lien Term Loan
|
SOFR(M)
|
0.75
|
%
|
4.50
|
%
|
8.22
|
%
|
9/30/2030
|
$
|
18,925,793
|
18,925,793
|
19,115,051
|
0.78
|
%
|
E | ||||||||||||
|
GC Waves Holdings, Inc. (Mercer)
|
1200 17th Street, Suite 500, Denver, CO 80202
|
First Lien Revolver
|
SOFR(M)
|
0.75
|
%
|
4.50
|
%
|
8.22
|
%
|
8/10/2029
|
$
|
—
|
—
|
—
|
—
|
E | |||||||||||||
|
GC Waves Holdings, Inc. (Mercer)
|
1200 17th Street, Suite 500, Denver, CO 80202
|
First Lien Delayed Draw Term Loan
|
SOFR(M)
|
0.75
|
%
|
4.50
|
%
|
8.22
|
%
|
10/4/2030
|
$
|
1,536,670
|
1,393,142
|
1,838,101
|
0.07
|
%
|
E | ||||||||||||
|
Gryphon Debt Merger Sub Inc. (Altera Corporation LLC)
|
c/o The Corporation Trust Company, 1209 Orange Street, Wilmington, DE 19801
|
First Lien Term Loan
|
SOFR(S)
|
—
|
3.00
|
%
|
6.88
|
%
|
8/17/2028
|
$
|
840,000
|
835,829
|
846,741
|
0.03
|
%
|
||||||||||||||
|
HP PHRG Borrower LLC
|
c/o The Corporation Trust Company, 1209 Orange Street, Wilmington, DE 19801
|
First Lien Term Loan
|
SOFR(Q)
|
—
|
4.00
|
%
|
7.67
|
%
|
2/20/2032
|
$
|
19,216,009
|
19,045,554
|
19,135,974
|
0.78
|
%
|
||||||||||||||
|
Orion Us Finco Inc.
|
73 Front Street, 5th Floor, Hamilton, HM 12, Bermuda
|
First Lien Term Loan
|
SOFR(Q)
|
—
|
3.50
|
%
|
7.43
|
%
|
10/10/2032
|
$
|
442,000
|
439,852
|
444,590
|
0.02
|
%
|
||||||||||||||
|
Oak Funding LLC
|
101 Hudson Street, 17th Floor, Jersey City, NJ 07302
|
First Lien Term Loan
|
SOFR(Q)
|
0.50
|
%
|
4.50
|
%
|
8.29
|
%
|
12/2/2032
|
$
|
17,487,635
|
17,315,538
|
17,314,735
|
0.70
|
%
|
E | ||||||||||||
|
Oak Funding LLC
|
101 Hudson Street, 17th Floor, Jersey City, NJ 07302
|
First Lien Delayed Draw Term Loan
|
SOFR(Q)
|
0.50
|
%
|
4.50
|
%
|
8.29
|
%
|
12/2/2032
|
$
|
—
|
(16,861
|
)
|
(16,868
|
)
|
—
|
D/E
|
|||||||||||
|
Payroc, LLC
|
7840 Graphic Drive, Suite 200, Tinley Park, IL 60477
|
First Lien Term Loan
|
SOFR(M)
|
1.00
|
%
|
4.75
|
%
|
8.47
|
%
|
11/1/2027
|
$
|
7,515,599
|
7,460,323
|
7,500,568
|
0.30
|
%
|
E | ||||||||||||
|
Payroc, LLC
|
7840 Graphic Drive, Suite 200, Tinley Park, IL 60477
|
First Lien Revolver
|
SOFR(M)
|
1.00
|
%
|
4.75
|
%
|
8.47
|
%
|
11/1/2027
|
$
|
—
|
(1,231
|
)
|
(333
|
)
|
—
|
D/E
|
|||||||||||
|
Payroc, LLC
|
7840 Graphic Drive, Suite 200, Tinley Park, IL 60477
|
First Lien Term Loan
|
SOFR(M)
|
1.00
|
%
|
4.75
|
%
|
8.47
|
%
|
10/31/2027
|
$
|
540,952
|
538,574
|
539,870
|
0.02
|
%
|
E | ||||||||||||
|
SitusAMC Holdings Corporation
|
Tower 49, 12 East 49th Street, 34th Floor, New York, NY 10017
|
First Lien Term Loan
|
SOFR(Q)
|
0.75
|
%
|
5.50
|
%
|
9.17
|
%
|
5/14/2031
|
$
|
14,798,438
|
14,775,028
|
14,902,027
|
0.60
|
%
|
E | ||||||||||||
|
SitusAMC Holdings Corporation
|
Tower 49, 12 East 49th Street, 34th Floor, New York, NY 10017
|
First Lien Term Loan
|
SOFR(Q)
|
0.75
|
%
|
5.50
|
%
|
9.17
|
%
|
5/14/2031
|
$
|
32,535,805
|
32,435,058
|
32,763,556
|
1.33
|
%
|
E | ||||||||||||
|
Wealth Enhancement Group, LLC
|
505 N Hwy 169, Ste 900, Plymouth, MN 55441, United States
|
First Lien Delayed Draw Term Loan
|
SOFR(Q)
|
1.00
|
%
|
4.50
|
%
|
8.49
|
%
|
10/4/2028
|
$
|
13,961,875
|
13,961,875
|
13,898,907
|
0.56
|
%
|
E | ||||||||||||
|
Wealth Enhancement Group, LLC
|
505 N Hwy 169, Ste 900, Plymouth, MN 55441, United States
|
First Lien Delayed Draw Term Loan
|
SOFR(Q)
|
1.00
|
%
|
4.50
|
%
|
8.17
|
%
|
10/2/2028
|
$
|
2,669,859
|
2,657,834
|
2,640,245
|
0.11
|
%
|
E | ||||||||||||
|
Wealth Enhancement Group, LLC
|
505 N Hwy 169, Ste 900, Plymouth, MN 55441, United States
|
First Lien Delayed Draw Term Loan
|
SOFR(Q)
|
1.00
|
%
|
4.50
|
%
|
8.49
|
%
|
10/4/2028
|
$
|
3,629,871
|
3,610,401
|
3,613,500
|
0.15
|
%
|
E | ||||||||||||
|
Wealth Enhancement Group, LLC
|
505 N Hwy 169, Ste 900, Plymouth, MN 55441, United States
|
First Lien Delayed Draw Term Loan
|
SOFR(Q)
|
1.00
|
%
|
4.50
|
%
|
8.49
|
%
|
10/2/2028
|
$
|
1,082,893
|
1,082,893
|
1,078,009
|
0.04
|
%
|
E | ||||||||||||
|
Wealth Enhancement Group, LLC
|
505 N Hwy 169, Ste 900, Plymouth, MN 55441, United States
|
First Lien Revolver
|
SOFR(Q)
|
1.00
|
%
|
4.50
|
%
|
8.17
|
%
|
10/4/2028
|
$
|
—
|
(612
|
)
|
(5,948
|
)
|
—
|
D/E
|
|||||||||||
|
Issuer(F)
|
Company Address
|
Instrument
|
Ref(B)
|
Floor
|
Spread
|
Total
Coupon |
Maturity
|
Principal
|
Cost
|
Fair
Value |
% of Total
Cash and Investment |
Notes
|
|||||||||||||||||
|
Debt Investments - Continued
|
|||||||||||||||||||||||||||||
|
Diversified Financial Services (Continued)
|
|||||||||||||||||||||||||||||
|
Wealth Enhancement Group, LLC
|
505 N Hwy 169, Ste 900, Plymouth, MN 55441, United States
|
First Lien Delayed Draw Term Loan
|
SOFR(Q)
|
1.00
|
%
|
4.50
|
%
|
8.17
|
%
|
10/2/2028
|
$
|
—
|
$
|
(16,919
|
)
|
$
|
(34,318
|
)
|
—
|
D/E
|
|||||||||
|
White Cap Supply Holdings, LLC
|
6250 Brook Hollow Parkway, Norcross, GA 30071, United States
|
First Lien Tranche B Term Loan
|
SOFR(M)
|
—
|
3.25
|
%
|
6.97
|
%
|
10/19/2029
|
$
|
7,797,923
|
7,770,114
|
7,838,511
|
0.32
|
%
|
||||||||||||||
|
176,656,122
|
177,887,696
|
7.21
|
%
|
||||||||||||||||||||||||||
|
Diversified Telecommunication Services
|
|||||||||||||||||||||||||||||
|
Level 3 Financing Inc.
|
1601 Las Plumas Avenue, San Jose, CA 95133
|
First Lien Term Loan
|
SOFR(M)
|
—
|
3.25
|
%
|
6.97
|
%
|
3/27/2032
|
$
|
1,664,000
|
1,665,077
|
1,670,864
|
0.07
|
%
|
||||||||||||||
|
Venga Finance Sarl (Luxembourg)
|
18 Rue Dicks, 1417 Luxembourg, Luxembourg
|
First Lien Term Loan
|
SOFR(Q)
|
—
|
4.01
|
%
|
7.83
|
%
|
6/28/2029
|
$
|
1,246,851
|
1,250,735
|
1,252,618
|
0.05
|
%
|
C | |||||||||||||
|
2,915,812
|
2,923,482
|
0.12
|
%
|
||||||||||||||||||||||||||
|
Electrical Equipment
|
|||||||||||||||||||||||||||||
|
Griffon Bidco Inc. (Layerzero)
|
1500 Danner Drive, Aurora, OH 44202
|
First Lien Delayed Draw Term Loan
|
SOFR(Q)
|
0.75
|
%
|
5.00
|
%
|
8.67
|
%
|
7/31/2031
|
$
|
—
|
(41,944
|
)
|
—
|
0.00
|
%
|
D/E
|
|||||||||||
|
Griffon Bidco Inc. (Layerzero)
|
1500 Danner Drive, Aurora, OH 44202
|
First Lien Revolver
|
SOFR(Q)
|
0.75
|
%
|
5.00
|
%
|
8.67
|
%
|
7/31/2031
|
$
|
—
|
(41,944
|
)
|
—
|
0.00
|
%
|
D/E
|
|||||||||||
|
Griffon Bidco Inc. (Layerzero)
|
1500 Danner Drive, Aurora, OH 44202
|
First Lien Term Loan
|
SOFR(Q)
|
0.75
|
%
|
5.00
|
%
|
8.67
|
%
|
7/31/2031
|
$
|
25,285,726
|
25,048,459
|
25,285,726
|
1.04
|
%
|
E | ||||||||||||
|
Spark Buyer, LLC (Sparkstone)
|
133 N Swift Road, Addison, IL 60101
|
First Lien Term Loan
|
SOFR(Q)
|
0.75
|
%
|
5.25
|
%
|
9.13
|
%
|
10/15/2031
|
$
|
11,636,468
|
11,492,173
|
9,472,085
|
0.38
|
%
|
E | ||||||||||||
|
Spark Buyer, LLC (Sparkstone)
|
133 N Swift Road, Addison, IL 60101
|
First Lien Revolver
|
SOFR(Q)
|
0.75
|
%
|
5.25
|
%
|
8.94
|
%
|
10/15/2031
|
$
|
799,273
|
770,122
|
362,024
|
0.01
|
%
|
E | ||||||||||||
|
Spark Buyer, LLC (Sparkstone)
|
133 N Swift Road, Addison, IL 60101
|
First Lien Delayed Draw Term Loan
|
SOFR(Q)
|
0.75
|
%
|
5.25
|
%
|
8.94
|
%
|
10/15/2031
|
$
|
—
|
(58,301
|
)
|
(874,498
|
)
|
-0.04
|
%
|
D/E
|
||||||||||
|
37,168,565
|
34,245,337
|
1.39 | % | ||||||||||||||||||||||||||
|
Energy Equipment and Services
|
|||||||||||||||||||||||||||||
|
PG Polaris Bidco SARL (Rosen Group) (Luxembourg)
|
35D, Avenue John F. Kennedy, 1855 Luxembourg
|
First Lien Term Loan
|
SOFR(Q)
|
—
|
2.25
|
%
|
5.92
|
%
|
3/26/2031
|
$
|
2,735,825
|
2,745,388
|
2,748,437
|
0.11
|
%
|
C | |||||||||||||
|
Entertainment
|
|||||||||||||||||||||||||||||
|
City Football Group Ltd (United Kingdom)
|
400 Ashton New Road, Manchester, England, M11 4TQ
|
First Lien Term Loan
|
SOFR(Q)
|
0.50
|
%
|
3.26
|
%
|
6.93
|
%
|
7/21/2030
|
$
|
2,074,734
|
2,076,369
|
2,077,327
|
0.08
|
%
|
C | ||||||||||||
|
Endeavor Operating Company LLC
|
9601 Wilshire Blvd, Beverly Hills, CA 90210
|
First Lien Term Loan
|
SOFR(M)
|
—
|
3.00
|
%
|
6.72
|
%
|
1/28/2032
|
$
|
6,270,323
|
6,269,522
|
6,314,215
|
0.26
|
%
|
||||||||||||||
|
International Entertainment JJJCO 3 Ltd (ATG Entertainment LLC) (United Kingdom)
|
72 Welbeck Street, London, W1G 0AY, United Kingdom
|
First Lien Term Loan
|
SOFR(Q)
|
—
|
3.00
|
%
|
6.84
|
%
|
4/19/2032
|
$
|
457,703
|
455,622
|
455,987
|
0.02
|
%
|
C/E
|
|||||||||||||
|
Renaissance Holding Corp.
|
1384 Broadway, 22nd Floor, New York, NY 10018, United States
|
First Lien Term Loan
|
SOFR(M)
|
—
|
4.00
|
%
|
7.72
|
%
|
12/11/2031
|
$
|
960,202
|
941,381
|
841,324
|
0.03
|
%
|
||||||||||||||
|
9,742,894
|
9,688,853
|
0.39 |
% | ||||||||||||||||||||||||||
|
Food Products
|
|||||||||||||||||||||||||||||
|
Sauer Brands Inc
|
2000 West Broad Street, Richmond, VA 23220, United States
|
First Lien Term Loan
|
SOFR(M)
|
—
|
3.00
|
%
|
6.72
|
%
|
2/4/2032
|
$
|
251,574
|
251,106
|
252,936
|
0.01
|
%
|
||||||||||||||
|
Saratoga Food Specialties LLC (Solina France SASU) (France)
|
201 Rue des Écotais, 35310 Bréal-sous-Montfort, Bretagne, France
|
First Lien Term Loan
|
SOFR(Q)
|
—
|
3.25
|
%
|
6.98
|
%
|
3/7/2029
|
$
|
932,950
|
936,157
|
941,500
|
0.04
|
%
|
C | |||||||||||||
|
Wellness Pet LLC (Woof)
|
77 S Bedford St, Suite 500, Burlington, MA 01803, United States
|
First Lien First Out Term Loan
|
SOFR(Q)
|
—
|
3.95
|
%
|
7.62
|
%
|
12/1/2029
|
$
|
479,108
|
443,529
|
295,849
|
0.01
|
%
|
||||||||||||||
|
1,630,792
|
1,490,285
|
0.06 |
% | ||||||||||||||||||||||||||
|
Issuer(F)
|
Company Address
|
Instrument
|
Ref(B)
|
Floor
|
Spread
|
Total
Coupon |
Maturity
|
Principal
|
Cost
|
Fair
Value |
% of Total
Cash and Investment |
Notes
|
|||||||||||||||||
|
Debt Investments - Continued
|
|||||||||||||||||||||||||||||
|
Health Care Equipment and Supplies
|
|||||||||||||||||||||||||||||
|
Avalara, Inc.
|
512 Mangum Street, Suite 100, Durham, NC 27701, US
|
First Lien Term Loan
|
SOFR(Q)
|
—
|
2.75
|
%
|
6.42
|
%
|
3/26/2032
|
$
|
462,678
|
$
|
460,615
|
$
|
465,216
|
0.02
|
%
|
||||||||||||
|
Chariot Buyer, LLC
|
c/o The Corporation Trust Company, 1209 Orange Street, Wilmington, DE 19801
|
First Lien Term Loan
|
SOFR(M)
|
0.50
|
%
|
2.75
|
%
|
6.47
|
%
|
7/22/2032
|
$
|
5,442,636
|
5,420,839
|
5,460,216
|
0.23
|
%
|
|||||||||||||
|
Opal Bidco SAS (Opella) (France)
|
157 av. Charles de Gaulle, 92200, Neuilly-sur-Seine, France.
|
First Lien Term Loan
|
SOFR(Q)
|
—
|
3.00
|
%
|
6.69
|
%
|
4/23/2032
|
$
|
6,503,700
|
6,528,276
|
6,552,478
|
0.26
|
%
|
C | |||||||||||||
|
12,409,730
|
12,477,910
|
0.51
|
% | ||||||||||||||||||||||||||
|
Healthcare Providers and Services
|
|||||||||||||||||||||||||||||
|
Acp Tara Holdings Inc. (Arcadia)
|
251 Little Falls Drive, Wilmington, DE 19808
|
First Lien Term Loan
|
SOFR(Q)
|
—
|
3.25
|
%
|
6.97
|
%
|
9/17/2032
|
$
|
152,000
|
151,621
|
153,045
|
0.01
|
%
|
E | |||||||||||||
|
AHP Health Partners, Inc.
|
1452 Hughes Rd, Suite 350, Grapevine, TX 76051
|
First Lien Term Loan
|
SOFR(M)
|
—
|
2.25
|
%
|
5.97
|
%
|
9/20/2032
|
$
|
1,915,200
|
1,922,456
|
1,918,494
|
0.08
|
%
|
||||||||||||||
|
CHG Healthcare Services, Inc.
|
7259 S Bingham Junction Blvd, Midvale, UT 84047
|
First Lien Term Loan
|
SOFR(Q)
|
—
|
2.75
|
%
|
6.59
|
%
|
9/29/2028
|
$
|
2,711,392
|
2,694,913
|
2,726,955
|
0.11
|
%
|
||||||||||||||
|
Electron Bidco Inc.
|
100 N Main St, Ann Arbor, MI 48104
|
First Lien Term Loan
|
SOFR(M)
|
—
|
2.50
|
%
|
6.22
|
%
|
10/7/2028
|
$
|
2,059,385
|
2,064,427
|
2,072,493
|
0.08
|
%
|
||||||||||||||
|
LifePoint Health Inc
|
330 Seven Springs Way, Brentwood, TN 37027
|
First Lien Term Loan
|
SOFR(M)
|
—
|
3.50
|
%
|
7.33
|
%
|
5/19/2031
|
$
|
1,525,099
|
1,525,113
|
1,529,232
|
0.06
|
%
|
||||||||||||||
|
LifePoint Health Inc
|
330 Seven Springs Way, Brentwood, TN 37027
|
First Lien Term Loan
|
SOFR(Q)
|
—
|
3.75
|
%
|
7.65
|
%
|
5/16/2031
|
$
|
1,917,929
|
1,918,013
|
1,926,368
|
0.08
|
%
|
||||||||||||||
|
Ingenovis Health, Inc.
|
9997 Carver Rd, Suite 300, Blue Ash, Ohio 45242
|
First Lien Term Loan
|
SOFR(Q)
|
0.75
|
%
|
4.25
|
%
|
8.19
|
%
|
3/5/2028
|
$
|
238,091
|
236,197
|
69,939
|
—
|
||||||||||||||
|
IvyRehab Intermediate II, LLC
|
1311 Mamaroneck Ave., Suite 140, White Plains, NY 10605
|
First Lien Delayed Draw Term Loan
|
SOFR(Q)
|
0.75
|
%
|
5.35
|
%
|
9.02
|
%
|
4/23/2029
|
$
|
14,014,906
|
13,863,384
|
14,014,906
|
0.56
|
%
|
E | ||||||||||||
|
IvyRehab Intermediate II, LLC
|
1311 Mamaroneck Ave., Suite 140, White Plains, NY 10605
|
First Lien Delayed Draw Term Loan
|
SOFR(Q)
|
0.75
|
%
|
5.10
|
%
|
8.77
|
%
|
4/23/2029
|
$
|
9,317,238
|
8,934,995
|
9,135,995
|
0.36
|
%
|
E | ||||||||||||
|
Raven Acquisition Holdings LLC (R1 RCM)
|
433 W Ascension Way, Suite 200, Murray, UT 84123, United States
|
First Lien Term Loan
|
SOFR(M)
|
—
|
3.00
|
%
|
6.72
|
%
|
11/19/2031
|
$
|
1,890,777
|
1,890,578
|
1,899,125
|
0.08
|
%
|
||||||||||||||
|
Raven Acquisition Holdings LLC (R1 RCM)
|
433 W Ascension Way, Suite 200, Murray, UT 84123, United States
|
First Lien Delayed Draw Term Loan
|
SOFR(M)
|
—
|
3.00
|
%
|
6.72
|
%
|
11/19/2031
|
$
|
—
|
235
|
602
|
—
|
|||||||||||||||
|
Surgery Partners Holdings, LLC
|
340 Seven Springs Way, Suite 600, Brentwood, TN 37027, United States
|
First Lien Term Loan
|
SOFR(M)
|
—
|
2.50
|
%
|
6.22
|
%
|
12/19/2030
|
$
|
3,363,047
|
3,375,052
|
3,380,165
|
0.15
|
%
|
||||||||||||||
|
38,576,984
|
38,827,319
|
1.57
|
% |
||||||||||||||||||||||||||
|
Health Care Technology
|
|||||||||||||||||||||||||||||
|
Athenahealth Group Inc.
|
80 Guest Street, Boston, MA 02135
|
First Lien Term Loan
|
SOFR(M)
|
0.50
|
%
|
2.75
|
%
|
6.47
|
%
|
2/15/2029
|
$
|
9,924,727
|
9,918,729
|
9,955,742
|
0.40
|
%
|
|||||||||||||
|
Cotiviti Holdings, Inc
|
10701 S River Front Pkwy, Suite 200, South Jordan, UT 84095
|
First Lien Term Loan
|
SOFR(M)
|
—
|
2.75
|
%
|
6.62
|
%
|
2/24/2031
|
$
|
1,540,082
|
1,528,655
|
1,483,615
|
0.06
|
%
|
||||||||||||||
|
Cotiviti Holdings, Inc
|
10701 S River Front Pkwy, Suite 200, South Jordan, UT 84095
|
First Lien Term Loan
|
SOFR(M)
|
—
|
2.75
|
%
|
6.62
|
%
|
2/13/2032
|
$
|
906,947
|
898,813
|
872,941
|
0.04
|
%
|
||||||||||||||
|
MRO Parent Corporation
|
1000 Madison Avenue, Suite 100, Norristown, PA 19403
|
First Lien Term Loan
|
SOFR(M)
|
0.75
|
%
|
4.50
|
%
|
8.22
|
%
|
6/9/2032
|
$
|
34,673,825
|
34,195,620
|
34,465,782
|
1.40
|
%
|
E | ||||||||||||
|
MRO Parent Corporation
|
1000 Madison Avenue, Suite 100, Norristown, PA 19403
|
First Lien Revolver
|
SOFR(M)
|
0.75
|
%
|
4.50
|
%
|
8.22
|
%
|
6/9/2032
|
$
|
—
|
(41,687
|
)
|
(18,136
|
)
|
—
|
D/E
|
|||||||||||
|
MRO Parent Corporation
|
1000 Madison Avenue, Suite 100, Norristown, PA 19403
|
First Lien Delayed Draw Term Loan
|
SOFR(M)
|
0.75
|
%
|
4.50
|
%
|
8.22
|
%
|
6/9/2032
|
$
|
—
|
(20,844
|
)
|
(18,136
|
)
|
—
|
D/E
|
|||||||||||
|
Mpulse Mobile Inc.
|
21255 Burbank Blvd., Los Angeles, CA 91367
|
First Lien Delayed Draw Term Loan
|
SOFR(Q)
|
0.75
|
%
|
3.25
|
%
|
6.97
|
%
|
8/26/2032
|
$
|
—
|
(36,284
|
)
|
(36,732
|
)
|
—
|
D/E
|
|||||||||||
|
Mpulse Mobile Inc.
|
21255 Burbank Blvd., Los Angeles, CA 91367
|
First Lien Revolver
|
SOFR(Q)
|
0.75
|
%
|
4.75
|
%
|
8.42
|
%
|
8/26/2032
|
$
|
—
|
(54,426
|
)
|
(55,201
|
)
|
—
|
D/E
|
|||||||||||
|
Mpulse Mobile Inc.
|
21255 Burbank Blvd., Los Angeles, CA 91367
|
First Lien Term Loan
|
SOFR(Q)
|
0.75
|
%
|
4.75
|
%
|
8.42
|
%
|
8/26/2032
|
$
|
40,121,205
|
39,746,068
|
39,735,520
|
1.61
|
%
|
E | ||||||||||||
|
Issuer(F)
|
Company Address
|
Instrument
|
Ref(B)
|
Floor
|
Spread
|
Total
Coupon |
Maturity
|
Principal
|
Cost
|
Fair
Value |
% of Total
Cash and Investment |
Notes
|
|||||||||||||||||
|
Debt Investments - Continued
|
|||||||||||||||||||||||||||||
|
Health Care Technology (Continued)
|
|||||||||||||||||||||||||||||
|
Polaris Newco, LLC
|
4000 Legato Rd., Suite 600, Fairfax, VA 22033
|
First Lien Term Loan
|
SOFR(Q)
|
0.50
|
%
|
3.75
|
%
|
7.85
|
%
|
6/2/2028
|
$
|
2,920,685
|
$
|
2,921,313
|
$
|
2,823,222
|
0.11
|
%
|
|||||||||||
|
PointClickCare Technologies Inc. (Canada)
|
5570 Explorer Drive, Mississauga, ON L4W 0C4, Canada
|
First Lien Term Loan
|
SOFR(Q)
|
—
|
2.75
|
%
|
6.42
|
%
|
11/3/2031
|
$
|
4,393,621
|
4,401,487
|
4,408,274
|
0.18
|
%
|
C | |||||||||||||
|
Press Ganey Holdings, Inc.
|
1173 Ignition Drive, South Bend, IN 46601
|
First Lien Term Loan
|
SOFR(M)
|
—
|
3.00
|
%
|
6.72
|
%
|
4/30/2031
|
$
|
2,049,918
|
2,052,850
|
2,056,324
|
0.08
|
%
|
||||||||||||||
|
Zelis Healthcare Corp
|
149 Newbury Street, 5th Floor, Boston, MA 02116, United States
|
First Lien Term Loan
|
SOFR(M)
|
—
|
2.75
|
%
|
6.47
|
%
|
9/15/2029
|
$
|
1,946,433
|
1,935,510
|
1,930,219
|
0.08
|
%
|
||||||||||||||
|
97,445,804
|
97,603,434
|
3.96
|
% | ||||||||||||||||||||||||||
|
Hotels, Restaurants and Leisure
|
|||||||||||||||||||||||||||||
|
Alterra Mountain Company
|
3501 Wazee Street, Suite 400, Denver, CO 80216
|
First Lien Term Loan
|
SOFR(Q)
|
—
|
5.00
|
%
|
8.69
|
%
|
5/31/2030
|
$
|
1,246,875
|
1,255,994
|
1,254,668
|
0.05
|
%
|
E | |||||||||||||
|
Fertitta Entertainment, LLC
|
1510 West Loop South, Houston, TX 77027
|
First Lien Term Loan
|
SOFR(M)
|
0.50
|
%
|
3.25
|
%
|
6.97
|
%
|
1/27/2029
|
$
|
7,914,353
|
7,892,164
|
7,921,555
|
0.32
|
%
|
|||||||||||||
|
Great Canadian Gaming Corp. (Canada)
|
39 Wynford Drive, Toronto, ON M3C 3K5, Canada
|
First Lien Term Loan
|
SOFR(Q)
|
—
|
4.75
|
%
|
8.44
|
%
|
11/1/2029
|
$
|
429,281
|
429,243
|
423,110
|
0.02
|
%
|
C | |||||||||||||
|
Herschend Entertainment Company LLC
|
157 Technology Parkway Suite 100, Peachtree Corners, GA 30092
|
First Lien Term Loan
|
SOFR(M)
|
—
|
3.25
|
%
|
6.97
|
%
|
5/20/2032
|
$
|
2,484,600
|
2,490,526
|
2,505,048
|
0.10
|
%
|
||||||||||||||
|
Motion Finco LLC
|
c/o The Corporation Trust Company, 1209 Orange Street, Wilmington, DE 19801
|
First Lien Term Loan B
|
SOFR(Q)
|
—
|
3.50
|
%
|
7.17
|
%
|
11/12/2029
|
$
|
686,692
|
689,218
|
610,730
|
0.02
|
%
|
||||||||||||||
|
Scientific Games Holdings LP
|
1500 Bluegrass Lakes Pkwy, Alpharetta, GA 30004, United States
|
First Lien Term Loan
|
SOFR(Q)
|
0.50
|
%
|
3.00
|
%
|
6.93
|
%
|
4/4/2029
|
$
|
3,887,771
|
3,869,912
|
3,824,614
|
0.16
|
%
|
|||||||||||||
|
Showtime Acquisition LLC (World Choice)
|
850 New Burton Road, Suite 201, Dover, DE 19904, United States
|
First Lien Term Loan
|
SOFR(Q)
|
—
|
4.75
|
%
|
8.63
|
%
|
8/13/2031
|
$
|
44,822,847
|
44,458,777
|
44,442,122
|
1.80
|
%
|
E | |||||||||||||
|
Stonebridge Companies, LLC
|
4949 South Niagara Street, Suite 300, Denver, CO 80237
|
First Lien Term Loan
|
SOFR(M)
|
0.75
|
%
|
5.00
|
%
|
8.72
|
%
|
5/16/2031
|
$
|
6,274,616
|
6,190,377
|
6,299,714
|
0.26
|
%
|
E | ||||||||||||
|
Stonebridge Companies, LLC
|
4949 South Niagara Street, Suite 300, Denver, CO 80237
|
First Lien Revolver
|
SOFR(M)
|
0.75
|
%
|
5.00
|
%
|
8.72
|
%
|
5/16/2030
|
$
|
—
|
(15,669
|
)
|
—
|
—
|
D/E
|
||||||||||||
|
Stonebridge Companies, LLC
|
4949 South Niagara Street, Suite 300, Denver, CO 80237
|
First Lien Delayed Draw Term Loan
|
SOFR(M)
|
0.75
|
%
|
5.00
|
%
|
8.72
|
%
|
5/16/2031
|
$
|
—
|
(12,034
|
)
|
7,171
|
—
|
D/E
|
||||||||||||
|
TRQ Sales LLC
|
100 St. Paul Street, Denver, CO 80206, United States
|
First Lien Term Loan
|
SOFR(Q)
|
—
|
3.25
|
%
|
6.94
|
%
|
8/13/2032
|
$
|
1,050,000
|
1,038,980
|
1,038,188
|
0.04
|
%
|
E | |||||||||||||
|
Voyager Parent LLC
|
9 West 57th Street, 41st Floor, New York, NY 10019, United States
|
First Lien Term Loan
|
SOFR(Q)
|
—
|
4.75
|
%
|
8.42
|
%
|
5/8/2032
|
$
|
1,754,603
|
1,740,873
|
1,758,060
|
0.07
|
%
|
||||||||||||||
|
Whatabrands LLC
|
300 Concord Plaza Dr, San Antonio, TX 78216, United States
|
First Lien Term Loan
|
SOFR(Q)
|
—
|
2.50
|
%
|
6.46
|
%
|
8/3/2028
|
$
|
1,236,877
|
1,241,974
|
1,241,534
|
0.05
|
%
|
||||||||||||||
|
71,270,335
|
71,326,514
|
2.89
|
%
|
||||||||||||||||||||||||||
|
Household Durables
|
|||||||||||||||||||||||||||||
|
Hunter Douglas Holding BV (Netherlands)
|
Blaak 555, 3011 GB Rotterdam, Netherlands
|
First Lien Term Loan
|
SOFR(Q)
|
—
|
3.00
|
%
|
6.21
|
%
|
1/17/2032
|
$
|
4,092,307
|
4,087,429
|
4,120,073
|
0.17
|
%
|
C | |||||||||||||
|
Pye-Barker Fire & Safety LLC
|
2500 Northwinds Parkway, Suite 200, Alpharetta, GA 30009, United States
|
First Lien Term Loan
|
SOFR(M)
|
—
|
2.50
|
%
|
6.21
|
%
|
12/10/2032
|
$
|
848,250
|
844,022
|
854,523
|
0.03
|
%
|
||||||||||||||
|
Pye-Barker Fire & Safety LLC
|
2500 Northwinds Parkway, Suite 200, Alpharetta, GA 30009, United States
|
First Lien Delayed Draw Term Loan
|
SOFR(M)
|
—
|
2.50
|
%
|
7.74
|
%
|
12/10/2032
|
$
|
—
|
—
|
937
|
—
|
|||||||||||||||
|
Weber Stephen Products, LLC
|
1415 S. Roselle Road, Palatine, IL 60067
|
First Lien Term Loan
|
SOFR(Q)
|
—
|
3.75
|
%
|
0.00
|
%
|
9/17/2032
|
$
|
1,244,000
|
1,235,289
|
1,247,421
|
0.05
|
%
|
||||||||||||||
|
6,166,740
|
6,222,954
|
0.25
|
% | ||||||||||||||||||||||||||
|
Issuer(F)
|
Company Address
|
Instrument
|
Ref(B)
|
Floor
|
Spread
|
Total
Coupon |
Maturity
|
Principal
|
Cost
|
Fair
Value |
% of Total
Cash and Investment |
Notes
|
|||||||||||||||||
|
Debt Investments - Continued
|
|||||||||||||||||||||||||||||
|
Industrial Conglomerates
|
|||||||||||||||||||||||||||||
|
Beach Acquisition Bidco LLC
|
251 Little Falls Drive, Wilmington, DE 19808
|
First Lien Term Loan
|
SOFR(Q)
|
—
|
3.25
|
%
|
7.23
|
%
|
6/25/2032
|
$
|
582,000
|
$
|
580,604
|
$
|
587,459
|
0.02
|
%
|
||||||||||||
|
Chromalloy Holdings LLC
|
3999 RCA Boulevard, Palm Beach Gardens, FL 33410
|
First Lien Term Loan
|
SOFR(Q)
|
—
|
3.25
|
%
|
6.91
|
%
|
3/31/2031
|
$
|
3,801,758
|
3,817,350
|
3,828,788
|
0.16
|
%
|
||||||||||||||
|
Cube Industrials Buyer Inc. (Circor)
|
30 Corporate Drive, Suite 200, Burlington, MA 01803
|
First Lien Term Loan
|
SOFR(Q)
|
—
|
3.00
|
%
|
7.37
|
%
|
10/20/2031
|
$
|
934,947
|
933,594
|
942,151
|
0.04
|
%
|
||||||||||||||
|
LSF12 Crown US Commercial Bidco, LLC
|
6688 N. Central Expressway, Suite 1600, Dallas, Texas 75206
|
First Lien Term Loan
|
SOFR(M)
|
—
|
3.50
|
%
|
0.00
|
%
|
12/2/2031
|
$
|
842,313
|
843,713
|
848,630
|
0.03
|
%
|
||||||||||||||
|
6,175,261
|
6,207,028
|
0.25
|
% |
||||||||||||||||||||||||||
|
Insurance
|
|||||||||||||||||||||||||||||
|
Alliant Holdings Intermediate, LLC
|
18100 Von Karman Avenue, 10th Floor, Irvine, CA 92612
|
First Lien Term Loan
|
SOFR(M)
|
—
|
2.50
|
%
|
8.79
|
%
|
9/19/2031
|
$
|
11,973,302
|
11,938,624
|
12,013,832
|
0.49
|
%
|
||||||||||||||
|
AmeriLife Holdings, LLC
|
2650 McCormick Drive, Clearwater, FL 33759
|
First Lien Term Loan
|
SOFR(Q)
|
0.75
|
%
|
5.00
|
%
|
8.79
|
%
|
8/31/2029
|
$
|
23,732,225
|
23,521,749
|
23,732,225
|
0.95
|
%
|
E | ||||||||||||
|
AmeriLife Holdings, LLC
|
2650 McCormick Drive, Clearwater, FL 33759
|
First Lien Delayed Draw Term Loan
|
SOFR(Q)
|
0.75
|
%
|
5.00
|
%
|
8.79
|
%
|
8/31/2029
|
$
|
—
|
(12,678
|
)
|
—
|
—
|
D/E
|
||||||||||||
|
AmeriLife Holdings, LLC
|
2650 McCormick Drive, Clearwater, FL 33759
|
First Lien Revolver
|
SOFR(Q)
|
0.75
|
%
|
5.00
|
%
|
8.79
|
%
|
8/31/2028
|
$
|
322,848
|
313,299
|
322,848
|
0.01
|
%
|
E | ||||||||||||
|
AmeriLife Holdings, LLC
|
2650 McCormick Drive, Clearwater, FL 33759
|
First Lien Delayed Draw Term Loan
|
SOFR(Q)
|
0.75
|
%
|
5.00
|
%
|
6.67
|
%
|
8/31/2029
|
$
|
921,627
|
910,113
|
921,627
|
0.04
|
%
|
E | ||||||||||||
|
Amynta Agency Borrower Inc. (Mayfield)
|
909 3rd Avenue, 33rd Floor, New York, NY 10022
|
First Lien Term Loan
|
SOFR(M)
|
—
|
2.75
|
%
|
8.67
|
%
|
12/29/2031
|
$
|
4,312,013
|
4,316,591
|
4,326,825
|
0.18
|
%
|
||||||||||||||
|
EBS Parent Holdings Inc. (The Difference Card)
|
200 Business Park, Suite 311, Armonk, NY 10504
|
First Lien Term Loan
|
SOFR(Q)
|
0.75
|
%
|
5.00
|
%
|
8.67
|
%
|
7/1/2032
|
$
|
14,565,788
|
14,430,612
|
14,420,130
|
0.58
|
%
|
E | ||||||||||||
|
EBS Parent Holdings Inc. (The Difference Card)
|
200 Business Park, Suite 311, Armonk, NY 10504
|
First Lien Revolver
|
SOFR(Q)
|
0.75
|
%
|
5.00
|
%
|
8.67
|
%
|
7/1/2032
|
$
|
—
|
(11,265
|
)
|
(12,138
|
)
|
—
|
D/E
|
|||||||||||
|
EBS Parent Holdings Inc. (The Difference Card)
|
200 Business Park, Suite 311, Armonk, NY 10504
|
First Lien Delayed Draw Term Loan
|
SOFR(Q)
|
0.75
|
%
|
5.00
|
%
|
8.17
|
%
|
7/1/2032
|
$
|
—
|
(16,897
|
)
|
(36,414
|
)
|
—
|
D/E
|
|||||||||||
|
Galway Borrower LLC
|
3000 Executive Parkway, Suite 325, San Ramon, CA 94583
|
First Lien Delayed Draw Term Loan
|
SOFR(Q)
|
1.00
|
%
|
4.50
|
%
|
8.17
|
%
|
9/29/2028
|
$
|
5,227,629
|
5,178,749
|
5,227,629
|
0.21
|
%
|
E | ||||||||||||
|
Galway Borrower LLC
|
3000 Executive Parkway, Suite 325, San Ramon, CA 94583
|
First Lien Term Loan
|
SOFR(Q)
|
—
|
4.50
|
%
|
8.22
|
%
|
9/29/2028
|
$
|
3,154,034
|
3,122,047
|
3,154,034
|
0.13
|
%
|
E | |||||||||||||
|
Higginbotham Insurance Agency, Inc.
|
500 W 13th Street, Fort Worth, TX 76102
|
First Lien Term Loan
|
SOFR(M)
|
1.00
|
%
|
4.50
|
%
|
8.22
|
%
|
6/11/2031
|
$
|
15,352,328
|
15,352,328
|
15,352,328
|
0.62
|
%
|
E | ||||||||||||
|
Higginbotham Insurance Agency, Inc.
|
500 W 13th Street, Fort Worth, TX 76102
|
First Lien Delayed Draw Term Loan
|
SOFR(M)
|
1.00
|
%
|
4.50
|
%
|
8.22
|
%
|
9/30/2026
|
$
|
—
|
(59,373
|
)
|
—
|
—
|
D/E
|
||||||||||||
|
Higginbotham Insurance Agency, Inc.
|
500 W 13th Street, Fort Worth, TX 76102
|
First Lien Delayed Draw Term Loan
|
SOFR(M)
|
1.00
|
%
|
4.50
|
%
|
8.82
|
%
|
12/10/2027
|
$
|
—
|
—
|
—
|
—
|
E | |||||||||||||
|
Integrity Marketing Acquisition, LLC
|
1445 Ross Avenue, 40th Floor, Dallas, TX 75202
|
First Lien Term Loan
|
SOFR(Q)
|
0.75
|
%
|
5.00
|
%
|
8.82
|
%
|
8/25/2028
|
$
|
9,690,530
|
9,665,397
|
9,615,380
|
0.39
|
%
|
E | ||||||||||||
|
Integrity Marketing Acquisition, LLC
|
1445 Ross Avenue, 40th Floor, Dallas, TX 75202
|
First Lien Delayed Draw Term Loan
|
SOFR(Q)
|
—
|
5.00
|
%
|
8.82
|
%
|
8/26/2033
|
$
|
—
|
(8,979
|
)
|
(21,013
|
)
|
—
|
D/E
|
||||||||||||
|
Integrity Marketing Acquisition, LLC
|
1445 Ross Avenue, 40th Floor, Dallas, TX 75202
|
First Lien Revolver
|
SOFR(Q)
|
0.75
|
%
|
5.00
|
%
|
6.78
|
%
|
8/25/2028
|
$
|
—
|
(84,775
|
)
|
(32,452
|
)
|
—
|
D/E
|
|||||||||||
|
Jones Deslauriers Insurance Management Inc (Canada)
|
2375 Skymark Ave, Mississauga, ON L4W 4Y6, Canada
|
First Lien Term Loan
|
SOFR(Q)
|
—
|
3.00
|
%
|
7.42
|
%
|
12/9/2032
|
$
|
1,113,988
|
1,111,295
|
1,116,773
|
0.05
|
%
|
C | |||||||||||||
|
Summit Acquisition Inc.
|
1 Glenlake Pkwy Ste 1075 Atlanta, GA, 30328-7267 United States
|
First Lien Term Loan
|
SOFR(M)
|
—
|
3.50
|
%
|
6.22
|
%
|
10/16/2031
|
$
|
151,620
|
151,620
|
152,947
|
0.01
|
%
|
E | |||||||||||||
|
Sedgwick Claims Management Services, Inc. (Lightning Cayman Merger Sub, Ltd.)
|
8125 Sedgwick Way, Memphis, TN 38125, United States
|
First Lien Term Loan
|
SOFR(M)
|
—
|
2.50
|
%
|
6.42
|
%
|
7/13/2031
|
$
|
7,667,052
|
7,665,578
|
7,699,829
|
0.31
|
%
|
||||||||||||||
|
Truist Insurance Holdings, LLC
|
550 South Caldwell St, 15th Floor, Charlotte, NC 28202, United States
|
First Lien Term Loan
|
SOFR(Q)
|
—
|
2.75
|
%
|
0.00
|
%
|
5/6/2031
|
$
|
7,663,726
|
7,678,281
|
7,686,104
|
0.31
|
%
|
||||||||||||||
|
105,162,316
|
105,640,494
|
4.28
|
% | ||||||||||||||||||||||||||
|
Issuer(F)
|
Company Address
|
Instrument
|
Ref(B)
|
Floor
|
Spread
|
Total
Coupon |
Maturity
|
Principal
|
Cost
|
Fair
Value |
% of Total
Cash and Investment |
Notes
|
|||||||||||||||||
|
Debt Investments - Continued
|
|||||||||||||||||||||||||||||
|
Internet and Catalog Retail
|
|||||||||||||||||||||||||||||
|
Syndigo, LLC
|
141 W Jackson Blvd, Suite 1375, Chicago, IL 60604
|
First Lien Revolver
|
SOFR(Q)
|
0.75
|
%
|
5.00
|
%
|
8.82
|
%
|
9/2/2032
|
$
|
—
|
$
|
(40,084
|
)
|
$
|
(46,283
|
)
|
—
|
D/E
|
|||||||||
|
Syndigo, LLC
|
141 W Jackson Blvd, Suite 1375, Chicago, IL 60604
|
First Lien Term Loan
|
SOFR(Q)
|
0.75
|
%
|
5.00
|
%
|
0.00
|
%
|
9/2/2032
|
$
|
31,304,022
|
31,005,795
|
30,959,678
|
1.25
|
%
|
E | ||||||||||||
|
30,965,711
|
30,913,395
|
1.25
|
%
|
||||||||||||||||||||||||||
|
Internet and Direct Marketing Retail
|
|||||||||||||||||||||||||||||
|
Pug LLC
|
c/o The Corporation Trust Company, 1209 Orange Street, Wilmington, DE 19801
|
First Lien Term Loan
|
SOFR(M)
|
—
|
4.75
|
%
|
0.00
|
%
|
3/15/2030
|
$
|
3,698,286
|
3,693,285
|
3,672,860
|
0.15
|
%
|
||||||||||||||
|
Internet Software and Services
|
|||||||||||||||||||||||||||||
|
Bynder Bidco B.V. (Netherlands)
|
Overtoom 16 1054 HJ, Amsterdam, Netherlands
|
First Lien Term Loan B
|
SOFR(Q)
|
1.00
|
%
|
6.00
|
%
|
9.86
|
%
|
1/26/2029
|
$
|
2,110,569
|
2,078,217
|
2,113,064
|
0.09
|
%
|
C/E
|
||||||||||||
|
Bynder Bidco B.V. (Netherlands)
|
Overtoom 16 1054 HJ, Amsterdam, Netherlands
|
First Lien Revolver B
|
SOFR(Q)
|
1.00
|
%
|
6.00
|
%
|
9.86
|
%
|
1/26/2029
|
$
|
—
|
(723
|
)
|
—
|
—
|
C/D/E
|
||||||||||||
|
Bynder Bidco, Inc. (Netherlands)
|
Overtoom 16 1054 HJ, Amsterdam, Netherlands
|
First Lien Term Loan A
|
SOFR(Q)
|
1.00
|
%
|
6.00
|
%
|
9.86
|
%
|
1/26/2029
|
$
|
582,226
|
573,301
|
582,914
|
0.02
|
%
|
C/E
|
||||||||||||
|
Bynder Bidco, Inc. (Netherlands)
|
Overtoom 16 1054 HJ, Amsterdam, Netherlands
|
First Lien Revolver A
|
SOFR(Q)
|
1.00
|
%
|
6.00
|
%
|
9.86
|
%
|
1/26/2029
|
$
|
—
|
(2,624
|
)
|
—
|
—
|
C/D/E
|
||||||||||||
|
Civicplus LLC
|
302 South 4th Street, Suite 500, Manhattan, KS 66502
|
First Lien Term Loan
|
SOFR(Q)
|
0.75
|
%
|
6.00
|
%
|
9.82
|
%
|
8/24/2030
|
$
|
10,703,864
|
10,633,609
|
10,625,758
|
0.43
|
%
|
E | ||||||||||||
|
Civicplus LLC
|
302 South 4th Street, Suite 500, Manhattan, KS 66502
|
First Lien Revolver
|
SOFR(Q)
|
0.75
|
%
|
5.50
|
%
|
9.20
|
%
|
8/24/2030
|
$
|
—
|
(4,436
|
)
|
(5,098
|
)
|
—
|
D/E
|
|||||||||||
|
Civicplus LLC
|
302 South 4th Street, Suite 500, Manhattan, KS 66502
|
First Lien Delayed Draw Term Loan
|
SOFR(Q)
|
0.75
|
%
|
5.50
|
%
|
9.20
|
%
|
8/24/2030
|
$
|
3,664,069
|
3,609,472
|
3,619,138
|
0.15
|
%
|
E | ||||||||||||
|
e-Discovery Acquireco, LLC (Reveal)
|
145 S. Wells Street, Suite 600, Chicago, IL 60606
|
First Lien Term Loan
|
SOFR(Q)
|
1.00
|
%
|
6.25
|
%
|
10.07
|
%
|
8/23/2029
|
$
|
8,579,230
|
8,448,506
|
8,665,022
|
0.35
|
%
|
E | ||||||||||||
|
e-Discovery Acquireco, LLC (Reveal)
|
145 S. Wells Street, Suite 600, Chicago, IL 60606
|
First Lien Initial Term Loan
|
SOFR(Q)
|
1.00
|
%
|
5.50
|
%
|
9.32
|
%
|
9/1/2028
|
$
|
6,640,840
|
6,640,840
|
6,592,362
|
0.27
|
%
|
E | ||||||||||||
|
e-Discovery Acquireco, LLC (Reveal)
|
145 S. Wells Street, Suite 600, Chicago, IL 60606
|
First Lien Revolver
|
SOFR(Q)
|
1.00
|
%
|
6.25
|
%
|
10.07
|
%
|
8/23/2029
|
$
|
768,775
|
751,774
|
768,775
|
0.03
|
%
|
E | ||||||||||||
|
Gympass US, LLC
|
30 Irving Pl, New York, NY 10003
|
First Lien Term Loan
|
SOFR(M)
|
1.00
|
%
|
3.25% Cash + 3.25% PIK
|
10.34
|
%
|
8/29/2029
|
$
|
2,849,124
|
2,841,564
|
2,877,615
|
0.12
|
%
|
E | |||||||||||||
|
Gympass US, LLC
|
30 Irving Pl, New York, NY 10003
|
First Lien Delayed Draw Term Loan
|
SOFR(M)
|
1.00
|
%
|
3.25% Cash + 3.25% PIK
|
10.34
|
%
|
8/29/2029
|
$
|
12,792,857
|
12,729,836
|
12,920,786
|
0.51
|
%
|
E | |||||||||||||
|
Magenta Buyer, LLC (McAfee)
|
6000 Headquarters Drive, Suite 600, Plano, TX 75024
|
First Lien Term Loan
|
SOFR(M)
|
—
|
3.00
|
%
|
6.72
|
%
|
3/1/2029
|
$
|
2,282,612
|
2,279,594
|
2,114,007
|
0.09
|
%
|
||||||||||||||
|
Spartan Bidco Pty Ltd (StarRez) (Australia)
|
660 Spencer St, West Melbourne, Victoria 3003, Australia
|
First Lien Incremental Term Loan
|
SOFR(Q)
|
0.75
|
%
|
6.65
|
%
|
10.51
|
%
|
1/24/2028
|
$
|
10,038,061
|
9,935,064
|
10,018,186
|
0.41
|
%
|
C/E
|
||||||||||||
|
Spartan Bidco Pty Ltd (StarRez) (Australia)
|
660 Spencer St, West Melbourne, Victoria 3003, Australia
|
First Lien Revolver
|
SOFR(S)
|
0.75
|
%
|
6.50
|
%
|
10.23
|
%
|
1/24/2028
|
$
|
187,753
|
180,990
|
186,667
|
0.01
|
%
|
C/E
|
||||||||||||
|
60,694,984
|
61,079,196
|
2.48
|
% |
||||||||||||||||||||||||||
|
Issuer(F)
|
Company Address
|
Instrument
|
Ref(B)
|
Floor
|
Spread
|
Total
Coupon |
Maturity
|
Principal
|
Cost
|
Fair
Value |
% of Total
Cash and Investment |
Notes
|
|||||||||||||||||
|
Debt Investments - Continued
|
|||||||||||||||||||||||||||||
|
IT Services
|
|||||||||||||||||||||||||||||
|
Anthracite Buyer, Inc. (Coalfire)
|
330 N Wabash Ave, Suite 1430, Chicago, IL 60611
|
First Lien Term Loan
|
SOFR(Q)
|
0.75
|
%
|
4.50
|
%
|
8.34
|
%
|
12/3/2032
|
$
|
17,151,957
|
$
|
17,067,169
|
$
|
17,066,197
|
0.68
|
%
|
E | ||||||||||
|
Anthracite Buyer, Inc. (Coalfire)
|
330 N Wabash Ave, Suite 1430, Chicago, IL 60611
|
First Lien Revolver
|
SOFR(Q)
|
0.75
|
%
|
4.50
|
%
|
8.34
|
%
|
12/3/2032
|
$
|
—
|
(21,197
|
)
|
(21,440
|
)
|
—
|
D/E
|
|||||||||||
|
CrewLine Buyer, Inc. (New Relic)
|
188 Spear St., Suite 1000, San Francisco, CA 94105
|
First Lien Term Loan
|
SOFR(Q)
|
1.00
|
%
|
6.75
|
%
|
10.59
|
%
|
11/8/2030
|
$
|
9,559,143
|
9,393,531
|
9,520,906
|
0.39
|
%
|
E | ||||||||||||
|
CrewLine Buyer, Inc. (New Relic)
|
188 Spear St., Suite 1000, San Francisco, CA 94105
|
First Lien Revolver
|
SOFR(Q)
|
1.00
|
%
|
6.75
|
%
|
10.59
|
%
|
11/8/2030
|
$
|
—
|
(17,251
|
)
|
(3,983
|
)
|
—
|
D/E
|
|||||||||||
|
Ensono Holdings, Inc.
|
3333 Finley Road, Suite 300, Downers Grove, IL 60515
|
First Lien Term Loan
|
SOFR(M)
|
0.75
|
%
|
4.11
|
%
|
7.83
|
%
|
5/26/2028
|
$
|
18,852,332
|
18,734,370
|
18,870,807
|
0.76
|
%
|
|||||||||||||
|
Fortress Intermediate 3, Inc
|
1345 Avenue of the Americas, New York, NY 10105
|
First Lien Term Loan
|
SOFR(M)
|
—
|
3.00
|
%
|
6.78
|
%
|
6/27/2031
|
$
|
3,130,808
|
3,140,604
|
3,137,680
|
0.13
|
%
|
||||||||||||||
|
Intercept Bidco, Inc.
|
Two Center Plaza, Suite 500, Boston, MA 02108
|
First Lien Term Loan
|
SOFR(Q)
|
1.00
|
%
|
6.00
|
%
|
9.77
|
%
|
6/3/2030
|
$
|
11,229,177
|
11,063,738
|
11,094,427
|
0.45
|
%
|
E | ||||||||||||
|
Intercept Bidco, Inc.
|
Two Center Plaza, Suite 500, Boston, MA 02108
|
First Lien Revolver
|
SOFR(Q)
|
1.00
|
%
|
6.00
|
%
|
9.77
|
%
|
6/3/2030
|
$
|
—
|
(25,452
|
)
|
(20,731
|
)
|
—
|
D/E
|
|||||||||||
|
Intercept Bidco, Inc.
|
Two Center Plaza, Suite 500, Boston, MA 02108
|
First Lien Delayed Draw Term Loan
|
SOFR(Q)
|
1.00
|
%
|
6.00
|
%
|
9.77
|
%
|
6/3/2030
|
$
|
—
|
(19,089
|
)
|
(31,096
|
)
|
—
|
D/E
|
|||||||||||
|
Madison Logic Holdings, Inc.
|
780 3rd Avenue, 20th Floor, New York, NY, 10017
|
First Lien Term Loan
|
SOFR(M)
|
1.00
|
%
|
4.73% Cash + 2.37% PIK
|
10.72
|
%
|
12/29/2028
|
$
|
2,274,371
|
2,241,294
|
1,976,428
|
0.08
|
%
|
E | |||||||||||||
|
Madison Logic Holdings, Inc.
|
780 3rd Avenue, 20th Floor, New York, NY, 10017
|
First Lien Revolver
|
SOFR(M)
|
1.00
|
%
|
4.73% Cash + 2.37% PIK
|
10.72
|
%
|
12/30/2027
|
$
|
—
|
(1,026
|
)
|
(11,240
|
)
|
—
|
D/E
|
||||||||||||
|
Neon Maple US Debt Mergersub Inc.
|
Prudential Tower, 800 Boylston Street, Boston, MA 02199
|
First Lien Term Loan
|
SOFR(M)
|
—
|
2.50
|
%
|
6.22
|
%
|
11/17/2031
|
$
|
1,738,048
|
1,736,053
|
1,742,315
|
0.07
|
%
|
||||||||||||||
|
Research Now Group, LLC (Dynata)
|
4 Research Drive, Suite 300, Shelton, CT 06484, United States
|
Second Out Term Loan
|
SOFR(Q)
|
1.00
|
%
|
5.76
|
%
|
9.64
|
%
|
10/15/2028
|
$
|
1,649,563
|
1,501,552
|
1,025,311
|
0.04
|
%
|
|||||||||||||
|
Research Now Group, LLC (Dynata)
|
4 Research Drive, Suite 300, Shelton, CT 06484, United States
|
First Lien Term Loan
|
SOFR(Q)
|
—
|
5.26
|
%
|
9.14
|
%
|
7/15/2028
|
$
|
232,897
|
218,770
|
232,082
|
0.01
|
%
|
||||||||||||||
|
Serrano Parent, LLC (Sumo Logic)
|
855 Main St., Suite 100, Redwood City, CA 94063
|
First Lien Term Loan
|
SOFR(Q)
|
1.00
|
%
|
6.50
|
%
|
10.36
|
%
|
5/12/2030
|
$
|
4,099,217
|
4,035,397
|
3,849,165
|
0.16
|
%
|
E | ||||||||||||
|
Serrano Parent, LLC (Sumo Logic)
|
855 Main St., Suite 100, Redwood City, CA 94063
|
First Lien Revolver
|
SOFR(Q)
|
1.00
|
%
|
6.50
|
%
|
10.36
|
%
|
5/12/2030
|
$
|
—
|
(6,382
|
)
|
(25,005
|
)
|
—
|
D/E
|
|||||||||||
|
Trident Technologies LLC
|
310 The Bridge St Ste 350, Huntsville, AL 35806, United States
|
First Lien Term Loan
|
SOFR(M)
|
—
|
4.50
|
%
|
8.42
|
%
|
2/6/2032
|
$
|
7,350,703
|
7,293,674
|
7,283,297
|
0.30
|
%
|
||||||||||||||
|
76,335,755
|
75,685,120
|
3.07
|
%
|
||||||||||||||||||||||||||
|
Issuer(F)
|
Company Address
|
Instrument
|
Ref(B)
|
Floor
|
Spread
|
Total
Coupon |
Maturity
|
Principal
|
Cost
|
Fair
Value |
% of Total
Cash and Investment |
Notes
|
|||||||||||||||||
|
Debt Investments - Continued
|
|||||||||||||||||||||||||||||
|
Life Sciences Tools and Services
|
|||||||||||||||||||||||||||||
|
Alcami Corporation
|
2320 Scientific Park Dr, Wilmington, NC 28405
|
First Lien Term Loan
|
SOFR(Q)
|
1.00
|
%
|
7.15
|
%
|
10.97
|
%
|
12/21/2028
|
$
|
968,857
|
$
|
952,064
|
$
|
968,857
|
0.04
|
%
|
E | ||||||||||
|
Alcami Corporation
|
2320 Scientific Park Dr, Wilmington, NC 28405
|
First Lien Delayed Draw Term Loan
|
SOFR(M)
|
1.00
|
%
|
7.10
|
%
|
10.83
|
%
|
12/21/2028
|
$
|
71,311
|
70,075
|
71,311
|
—
|
E | |||||||||||||
|
Alcami Corporation
|
2320 Scientific Park Dr, Wilmington, NC 28405
|
First Lien Revolver
|
SOFR(M)
|
1.00
|
%
|
7.10
|
%
|
10.83
|
%
|
12/21/2028
|
$
|
28,300
|
25,993
|
28,300
|
—
|
E | |||||||||||||
|
DNAnexus, Inc
|
1975 W El Camino, Suite 101, Mountain View, CA 94040
|
First Lien Delayed Draw Term Loan
|
SOFR(M)
|
3.00
|
%
|
5.25
|
%
|
8.98
|
%
|
12/18/2029
|
$
|
1,199,513
|
1,056,775
|
1,163,528
|
0.05
|
%
|
E | ||||||||||||
|
DNAnexus, Inc
|
1975 W El Camino, Suite 101, Mountain View, CA 94040
|
First Lien Term Loan
|
SOFR(M)
|
3.00
|
%
|
5.25
|
%
|
8.98
|
%
|
12/20/2029
|
$
|
5,997,566
|
5,949,829
|
5,985,571
|
0.24
|
%
|
E | ||||||||||||
|
Parexel International, Inc.
|
541 Church at North Hills St., Suite 1000, Raleigh, NC 27609
|
First Lien Term Loan
|
SOFR(Q)
|
—
|
2.75
|
%
|
6.53
|
%
|
12/9/2031
|
$
|
1,450,000
|
1,458,127
|
1,456,648
|
0.06
|
%
|
||||||||||||||
|
Star Parent Inc
|
1030 Sync Street, Morrisville, NC 27560
|
First Lien Term Loan
|
SOFR(Q)
|
—
|
4.00
|
%
|
7.67
|
%
|
9/27/2030
|
$
|
2,274,213
|
2,276,858
|
2,279,455
|
0.09
|
%
|
||||||||||||||
|
Sotera Health Holdings, LLC
|
9100 South Hills Blvd, Suite 300, Broadview Heights, OH 44147
|
First Lien Term Loan
|
SOFR(Q)
|
—
|
2.50
|
%
|
6.34
|
%
|
5/30/2031
|
$
|
2,889,682
|
2,899,316
|
2,909,563
|
0.12
|
%
|
||||||||||||||
|
14,689,037
|
14,863,233
|
0.60
|
%
|
||||||||||||||||||||||||||
|
Machinery
|
|||||||||||||||||||||||||||||
|
AI Aqua Merger Sub, Inc. (Osmosis Buyer) (United Kingdom)
|
c/o The Corporation Trust Company, 1209 Orange Street, Wilmington, DE 19801
|
First Lien Term Loan
|
SOFR(Q)
|
1.00
|
%
|
3.00
|
%
|
6.85
|
%
|
7/30/2028
|
$
|
7,129,546
|
7,101,267
|
7,153,287
|
0.30
|
%
|
C | ||||||||||||
|
Coorstek Inc.
|
14143 Denver West Pkwy, Golden, Colorado 80401
|
First Lien Term Loan
|
SOFR(Q)
|
—
|
3.00
|
%
|
6.86
|
%
|
10/28/2032
|
$
|
670,000
|
666,722
|
676,285
|
0.03
|
%
|
||||||||||||||
|
Filtration Group Corporation
|
500 N Michigan Ave, Suite 600, Chicago, IL 60611
|
First Lien Term Loan
|
SOFR(M)
|
0.50
|
%
|
2.75
|
%
|
6.47
|
%
|
10/23/2028
|
$
|
5,400,776
|
5,421,623
|
5,436,205
|
0.22
|
%
|
|||||||||||||
|
Hobbs & Associates, LLC
|
4850 Brookside Ct, Suite 100, Norfolk, VA 23502
|
First Lien Term Loan
|
SOFR(M)
|
—
|
2.75
|
%
|
6.47
|
%
|
7/23/2031
|
$
|
2,065,643
|
2,058,618
|
2,067,905
|
0.08
|
%
|
||||||||||||||
|
Hobbs & Associates, LLC
|
4850 Brookside Ct, Suite 100, Norfolk, VA 23502
|
First Lien Delayed Draw Term Loan
|
SOFR(M)
|
—
|
2.75
|
%
|
6.47
|
%
|
7/23/2031
|
$
|
—
|
200
|
—
|
—
|
E | ||||||||||||||
|
Husky Injection Molding Systems Ltd. (Canada)
|
500 Queen Street South, Bolton, ON L7E 5S5, Canada
|
First Lien Term Loan
|
SOFR(M)
|
—
|
3.75
|
%
|
7.47
|
%
|
2/15/2029
|
$
|
5,213,162
|
5,223,223
|
5,259,142
|
0.21
|
%
|
C | |||||||||||||
|
Indicor, LLC (Roper Industrial Pro)
|
11605 N. Community House Rd., Suite 250, Charlotte, NC 28277
|
First Lien Term Loan
|
SOFR(Q)
|
—
|
2.75
|
%
|
6.42
|
%
|
11/22/2029
|
$
|
3,365,634
|
3,373,403
|
3,389,816
|
0.14
|
%
|
||||||||||||||
|
KKR Apple Bidco, LLC
|
30 Hudson Yards, New York, NY 10001
|
First Lien Term Loan
|
SOFR(M)
|
—
|
2.50
|
%
|
6.22
|
%
|
9/23/2031
|
$
|
331,196
|
331,196
|
333,278
|
0.01
|
%
|
||||||||||||||
|
Madison IAQ LLC
|
444 W Lake Street, Chicago, IL 60606
|
First Lien Term Loan
|
SOFR(Q)
|
—
|
2.75
|
%
|
6.64
|
%
|
11/8/2032
|
$
|
5,450,022
|
5,439,238
|
5,491,197
|
0.22
|
%
|
||||||||||||||
|
TK Elevator US Newco Inc
|
788 Circle 75 Parkway SE, Atlanta, GA 30339
|
First Lien Term Loan
|
SOFR(S)
|
0.50
|
%
|
2.75
|
%
|
6.95
|
%
|
4/30/2030
|
$
|
3,484,743
|
3,485,427
|
3,510,373
|
0.14
|
%
|
|||||||||||||
|
33,100,917
|
33,317,488
|
1.35
|
%
|
||||||||||||||||||||||||||
|
Media
|
|||||||||||||||||||||||||||||
|
Kid Distro Holdings, LLC
|
34 Third Avenue, #183, New York, New York 10003
|
First Lien Term Loan
|
SOFR(S)
|
1.00
|
%
|
5.00
|
%
|
9.20
|
%
|
10/1/2029
|
$
|
16,657,453
|
16,657,453
|
16,504,204
|
0.66
|
%
|
E | ||||||||||||
|
Kid Distro Holdings, LLC
|
34 Third Avenue, #183, New York, New York 10003
|
First Lien Term Loan
|
SOFR(S)
|
1.00
|
%
|
5.00
|
%
|
9.20
|
%
|
10/1/2029
|
$
|
1,121,303
|
1,121,303
|
1,110,987
|
0.05
|
%
|
E | ||||||||||||
|
Kid Distro Holdings, LLC
|
34 Third Avenue, #183, New York, New York 10003
|
First Lien Revolver
|
SOFR(S)
|
1.00
|
%
|
5.00
|
%
|
9.20
|
%
|
10/1/2029
|
$
|
—
|
—
|
(14,227
|
)
|
—
|
D/E
|
||||||||||||
|
Speedster Bidco GMBH (Germany)
|
Tolzer Str. 16, 82031 Gruenwald, Bayern, Germany
|
First Lien Term Loan
|
SOFR(Q)
|
—
|
5.00
|
%
|
8.69
|
%
|
12/10/2031
|
$
|
3,110,000
|
3,130,647
|
3,121,663
|
0.13
|
%
|
C | |||||||||||||
|
Issuer(F)
|
Company Address
|
Instrument
|
Ref(B)
|
Floor
|
Spread
|
Total
Coupon |
Maturity
|
Principal
|
Cost
|
Fair
Value |
% of Total
Cash and Investment |
Notes
|
|||||||||||||||||
|
Debt Investments - Continued
|
|||||||||||||||||||||||||||||
|
Media (Continued)
|
|||||||||||||||||||||||||||||
|
Streamland Media Midco LLC
|
3900 W Alameda Ave, 10th Floor, Burbank, CA 91505
|
First Out Term Loan
|
SOFR(Q)
|
1.00
|
%
|
6.76% PIK
|
10.43
|
%
|
3/31/2029
|
$
|
1,461,957
|
$
|
1,461,957
|
$
|
1,461,957
|
0.06
|
%
|
E | |||||||||||
|
Streamland Media Midco LLC
|
3900 W Alameda Ave, 10th Floor, Burbank, CA 91505
|
Last Out Term Loan
|
SOFR(Q)
|
—
|
6.76% PIK
|
10.43
|
%
|
3/31/2029
|
$
|
1,331,823
|
1,263,126
|
969,567
|
0.04
|
%
|
E/G
|
||||||||||||||
|
Streamland Media Midco LLC
|
3900 W Alameda Ave, 10th Floor, Burbank, CA 91505
|
First Lien Delayed Draw Term Loan
|
SOFR(Q)
|
1.00
|
%
|
6.76% PIK
|
10.43
|
%
|
3/31/2029
|
$
|
116,958
|
116,958
|
116,958
|
—
|
E | ||||||||||||||
|
Streamland Media Midco LLC
|
3900 W Alameda Ave, 10th Floor, Burbank, CA 91505
|
First Lien Revolver
|
SOFR(Q)
|
—
|
6.76% PIK
|
10.43
|
%
|
3/31/2029
|
$
|
206,470
|
206,470
|
206,470
|
0.01
|
%
|
E | ||||||||||||||
|
TL Voltron Purchaser, LLC (GES)
|
7000 S Lindell Road, Suite 4702, Las Vegas, NV 89118
|
First Lien Term Loan
|
SOFR(Q)
|
1.00
|
%
|
5.25
|
%
|
9.09
|
%
|
12/31/2030
|
$
|
11,637,067
|
11,443,205
|
11,474,148
|
0.47
|
%
|
E | ||||||||||||
|
Zayo Group Holdings, Inc.
|
1805 29th Street, Boulder, CO 80301
|
First Lien Term Loan
|
SOFR(M)
|
—
|
3.11
|
%
|
6.83
|
%
|
3/11/2030
|
$
|
267,470
|
265,488
|
254,583
|
0.01
|
%
|
||||||||||||||
|
35,666,607
|
35,206,310
|
1.43
|
%
|
||||||||||||||||||||||||||
|
Metals and Mining
|
|||||||||||||||||||||||||||||
|
Grinding Media Inc. (Molycop LTD)
|
2111 South 67th Street, Suite 270, Omaha, NE 68106
|
First Lien Term Loan
|
SOFR(Q)
|
0.75
|
%
|
3.50
|
%
|
7.34
|
%
|
10/21/2028
|
$
|
978,838
|
982,953
|
980,673
|
0.04
|
%
|
E | ||||||||||||
|
Oil, Gas and Consumable Fuels
|
|||||||||||||||||||||||||||||
|
Deep Blue Operating I, LLC
|
4 Waterway Square Place, Suite 300, The Woodlands, TX 77380
|
First Lien Term Loan
|
SOFR(M)
|
—
|
2.75
|
%
|
6.59
|
%
|
3/31/2029
|
$
|
1,151,000
|
1,152,661
|
1,156,513
|
0.04
|
%
|
||||||||||||||
|
Palmdale Oil Company, LLC
|
7111 Fairway Drive, Suite #450, Palm Beach Gardens, FL 33418
|
First Lien Term Loan
|
SOFR(Q)
|
—
|
4.75
|
%
|
8.38
|
%
|
12/12/2031
|
$
|
763,292
|
759,492
|
759,476
|
0.03
|
%
|
E | |||||||||||||
|
Palmdale Oil Company, LLC
|
7111 Fairway Drive, Suite #450, Palm Beach Gardens, FL 33418
|
First Lien Delayed Draw Term Loan
|
SOFR(Q)
|
—
|
4.75
|
%
|
8.38
|
%
|
12/12/2031
|
$
|
—
|
—
|
—
|
0.01
|
%
|
E | |||||||||||||
|
Palmdale Oil Company, LLC
|
7111 Fairway Drive, Suite #450, Palm Beach Gardens, FL 33418
|
First Lien Delayed Draw Term Loan
|
SOFR(Q)
|
—
|
4.75
|
%
|
8.38
|
%
|
12/12/2031
|
$
|
—
|
—
|
—
|
—
|
E | ||||||||||||||
|
Stakeholder Midstream, LLC
|
19122 US HWY 281 N., Ste 113, San Antonio, TX 78258
|
First Lien Term Loan
|
SOFR(S)
|
—
|
4.00
|
%
|
8.04
|
%
|
8/19/2032
|
$
|
461,843
|
457,224
|
464,586
|
0.02
|
%
|
||||||||||||||
|
2,369,377
|
2,380,575
|
0.10
|
%
|
||||||||||||||||||||||||||
|
Paper and Forest Products
|
|||||||||||||||||||||||||||||
|
Alpine Acquisition Corp II (48Forty)
|
3650 Mansell Rd, Suite 100, Alpharetta, GA 30022
|
First Lien 2nd Incremental Term Loan
|
SOFR(Q)
|
1.00
|
%
|
6.15
|
%
|
9.94
|
%
|
11/30/2029
|
$
|
5,011,624
|
4,909,789
|
2,153,996
|
0.09
|
%
|
E/G
|
||||||||||||
|
Alpine Acquisition Corp II (48Forty)
|
3650 Mansell Rd, Suite 100, Alpharetta, GA 30022
|
First Lien Term Loan
|
SOFR(Q)
|
1.00
|
%
|
6.15
|
%
|
9.94
|
%
|
11/30/2029
|
$
|
210,389
|
206,324
|
90,425
|
—
|
E/G
|
|||||||||||||
|
FSK Pallet Holding Corp. (Kamps)
|
2900 Peach Ridge Ave NW, Walker, MI, 49534
|
First Lien Term Loan
|
SOFR(Q)
|
1.25
|
%
|
6.75
|
%
|
10.83
|
%
|
12/23/2026
|
$
|
1,462,677
|
1,451,859
|
1,453,164
|
0.06
|
%
|
E | ||||||||||||
|
FSK Pallet Holding Corp. (Kamps)
|
2900 Peach Ridge Ave NW, Walker, MI, 49534
|
First Lien Term Loan
|
SOFR(Q)
|
1.00
|
%
|
6.40
|
%
|
10.09
|
%
|
12/23/2026
|
$
|
1,168,766
|
1,168,766
|
1,163,317
|
0.05
|
%
|
E | ||||||||||||
|
7,736,738
|
4,860,902
|
0.20
|
%
|
||||||||||||||||||||||||||
|
Professional Services
|
|||||||||||||||||||||||||||||
|
Allied Benefit Systems Intermediate, LLC
|
200 W Adams St, Suite 500, Chicago, IL 60606
|
First Lien Term Loan
|
SOFR(Q)
|
0.75
|
%
|
5.00
|
%
|
8.73
|
%
|
10/31/2030
|
$
|
41,671,397
|
41,472,491
|
41,254,683
|
1.67
|
%
|
E | ||||||||||||
|
Allied Benefit Systems Intermediate, LLC
|
200 W Adams St, Suite 500, Chicago, IL 60606
|
First Lien Delayed Draw Term Loan
|
SOFR(Q)
|
0.75
|
%
|
5.00
|
%
|
8.73
|
%
|
10/31/2030
|
$
|
—
|
—
|
(51,631
|
)
|
—
|
D/E
|
||||||||||||
|
Applause App Quality, Inc.
|
100 Pennsylvania Ave, Suite 500, Framingham, MA 01701
|
First Lien Term Loan
|
SOFR(Q)
|
1.50
|
%
|
5.75
|
%
|
9.43
|
%
|
10/24/2029
|
$
|
15,007,034
|
14,778,230
|
14,931,999
|
0.61
|
%
|
E | ||||||||||||
|
Applause App Quality, Inc.
|
100 Pennsylvania Ave, Suite 500, Framingham, MA 01701
|
First Lien Revolver
|
SOFR(Q)
|
1.50
|
%
|
5.75
|
%
|
9.69
|
%
|
10/24/2029
|
$
|
300,140
|
282,404
|
292,636
|
0.01
|
%
|
E | ||||||||||||
|
Acuren Delaware Holdco Inc.
|
14434 Medical Complex Drive, Suite 100, Tomball, TX, 77377
|
First Lien Term Loan
|
SOFR(M)
|
0.75
|
%
|
2.75
|
%
|
6.47
|
%
|
1/31/2030
|
$
|
171,136
|
171,136
|
172,238
|
0.01
|
%
|
|||||||||||||
|
Issuer(F)
|
Company Address
|
Instrument
|
Ref(B)
|
Floor
|
Spread
|
Total
Coupon |
Maturity
|
Principal
|
Cost
|
Fair
Value |
% of Total
Cash and Investment |
Notes
|
|||||||||||||||||
|
Debt Investments - Continued
|
|||||||||||||||||||||||||||||
|
Professional Services (Continued)
|
|||||||||||||||||||||||||||||
|
Bullhorn, Inc.
|
100 Summer Street, 17th Floor, Boston, MA 02110
|
First Lien Delayed Draw Term Loan
|
SOFR(M)
|
—
|
5.00
|
%
|
8.72
|
%
|
9/30/2029
|
$
|
12,136,269
|
$
|
12,125,167
|
$
|
12,075,588
|
0.49
|
%
|
E | |||||||||||
|
Bullhorn, Inc.
|
100 Summer Street, 17th Floor, Boston, MA 02110
|
First Lien Term Loan
|
SOFR(M)
|
1.00
|
%
|
5.00
|
%
|
8.72
|
%
|
10/1/2029
|
$
|
10,262,184
|
10,244,292
|
10,210,873
|
0.41
|
%
|
E | ||||||||||||
|
Bullhorn, Inc.
|
100 Summer Street, 17th Floor, Boston, MA 02110
|
First Lien Delayed Draw Term Loan
|
SOFR(M)
|
1.00
|
%
|
5.00
|
%
|
8.72
|
%
|
9/30/2029
|
$
|
—
|
—
|
(5,620
|
)
|
—
|
D/E
|
||||||||||||
|
Bullhorn, Inc.
|
100 Summer Street, 17th Floor, Boston, MA 02110
|
First Lien Revolver
|
SOFR(M)
|
1.00
|
%
|
5.00
|
%
|
8.72
|
%
|
10/1/2029
|
$
|
197,141
|
195,213
|
152,784
|
0.01
|
%
|
E | ||||||||||||
|
Bullhorn, Inc.
|
100 Summer Street, 17th Floor, Boston, MA 02110
|
First Lien Delayed Draw Term Loan
|
SOFR(M)
|
1.00
|
%
|
5.00
|
%
|
8.72
|
%
|
9/30/2029
|
$
|
1,400,965
|
1,398,570
|
1,393,960
|
0.06
|
%
|
E | ||||||||||||
|
Cherry Bekaert Advisory, LLC
|
3800 Glenwood Ave, Raleigh, North Carolina 27612
|
First Lien Term Loan
|
SOFR(M)
|
0.75
|
%
|
4.50
|
%
|
8.22
|
%
|
6/28/2030
|
$
|
2,114,842
|
2,091,101
|
2,094,529
|
0.08
|
%
|
E | ||||||||||||
|
Cherry Bekaert Advisory, LLC
|
3800 Glenwood Ave, Raleigh, North Carolina 27612
|
First Lien Delayed Draw Term Loan
|
SOFR(M)
|
0.75
|
%
|
4.50
|
%
|
8.22
|
%
|
6/28/2030
|
$
|
871,417
|
861,628
|
863,047
|
0.03
|
%
|
E | ||||||||||||
|
Cherry Bekaert Advisory, LLC
|
3800 Glenwood Ave, Raleigh, North Carolina 27612
|
First Lien Delayed Draw Term Loan
|
SOFR(M)
|
0.75
|
%
|
4.50
|
%
|
8.22
|
%
|
6/28/2030
|
$
|
960,698
|
950,545
|
951,470
|
0.04
|
%
|
E | ||||||||||||
|
Cherry Bekaert Advisory, LLC
|
3800 Glenwood Ave, Raleigh, North Carolina 27612
|
First Lien Term Loan
|
SOFR(M)
|
0.75
|
%
|
4.50
|
%
|
8.22
|
%
|
6/28/2030
|
$
|
737,825
|
730,027
|
730,738
|
0.03
|
%
|
E | ||||||||||||
|
Cherry Bekaert Advisory, LLC
|
3800 Glenwood Ave, Raleigh, North Carolina 27612
|
First Lien Revolver
|
SOFR(M)
|
0.75
|
%
|
4.50
|
%
|
8.22
|
%
|
6/28/2030
|
$
|
—
|
(5,021
|
)
|
(4,296
|
)
|
—
|
D/E
|
|||||||||||
|
Cherry Bekaert Advisory, LLC
|
3800 Glenwood Ave, Raleigh, North Carolina 27612
|
First Lien Term Loan
|
SOFR(M)
|
0.75
|
%
|
4.50
|
%
|
8.22
|
%
|
6/28/2030
|
$
|
7,868,480
|
7,793,151
|
7,792,903
|
0.32
|
%
|
E
|
||||||||||||
|
Cherry Bekaert Advisory, LLC
|
3800 Glenwood Ave, Raleigh, North Carolina 27612
|
First Lien Delayed Draw Term Loan
|
SOFR(M)
|
0.75
|
%
|
4.50
|
%
|
8.22
|
%
|
6/28/2030
|
$
|
4,241,111
|
4,165,781
|
4,165,534
|
0.17
|
%
|
E | ||||||||||||
|
Chronicle Parent LLC (Lexitas)
|
4424 W Sam Houston Pkwy N Westway II, Suite 420, Houston, TX 77041
|
First Lien Term Loan
|
SOFR(Q)
|
1.00
|
%
|
5.00
|
%
|
8.90
|
%
|
4/15/2031
|
$
|
30,633,102
|
30,363,262
|
30,663,735
|
1.24
|
%
|
E | ||||||||||||
|
Chronicle Parent LLC (Lexitas)
|
4424 W Sam Houston Pkwy N Westway II, Suite 420, Houston, TX 77041
|
First Lien Revolver
|
SOFR(Q)
|
1.00
|
%
|
5.00
|
%
|
8.87
|
%
|
4/15/2031
|
$
|
—
|
(28,547
|
)
|
—
|
—
|
D/E
|
||||||||||||
|
Chronicle Parent LLC (Lexitas)
|
4424 W Sam Houston Pkwy N Westway II, Suite 420, Houston, TX 77041
|
First Lien Delayed Draw Term Loan
|
SOFR(Q)
|
1.00
|
%
|
5.00
|
%
|
8.87
|
%
|
4/15/2031
|
$
|
797,222
|
754,402
|
806,944
|
0.03
|
%
|
E | ||||||||||||
|
Citrin Cooperman Advisors LLC
|
50 Rockefeller Plaza, New York, NY 10020
|
First Lien Term Loan
|
SOFR(Q)
|
—
|
3.00
|
%
|
6.67
|
%
|
3/6/2032
|
$
|
4,814,692
|
4,811,784
|
4,834,745
|
0.20
|
%
|
||||||||||||||
|
CoreLogic, Inc. (fka First American Corporation)
|
40 Pacifica Avenue, Suite 900, Irvine, CA 92618
|
First Lien Term Loan
|
SOFR(M)
|
0.50
|
%
|
3.61
|
%
|
7.33
|
%
|
6/2/2028
|
$
|
7,153,055
|
7,114,789
|
7,169,292
|
0.29
|
%
|
|||||||||||||
|
DTI Holdco, Inc. (Epiq)
|
501 Kansas Ave, Kansas City, KS 66105
|
First Lien Term Loan
|
SOFR(M)
|
0.75
|
%
|
4.00
|
%
|
7.72
|
%
|
4/26/2029
|
$
|
21,995,849
|
21,923,040
|
20,597,573
|
0.83
|
%
|
|||||||||||||
|
Element Materials Technology Group US Holdings Inc.
|
2601 Green Road, Suite 100, Ann Arbor, MI 48105
|
First Lien Term Loan
|
SOFR(Q)
|
0.50
|
%
|
3.68
|
%
|
7.35
|
%
|
6/24/2029
|
$
|
1,867,430
|
1,864,930
|
1,886,104
|
0.08
|
%
|
|||||||||||||
|
GI Consilio Parent LLC (Skopima Consilio Parent LLC)
|
1828 L Street NW, Suite 1070, Washington, DC 20036
|
First Lien Term Loan
|
SOFR(M)
|
0.50
|
%
|
3.75
|
%
|
7.47
|
%
|
5/12/2028
|
$
|
20,552,215
|
20,422,673
|
18,830,967
|
0.76
|
%
|
|||||||||||||
|
HSI Halo Acquisitions, Inc.
|
c/o The Corporation Trust Company, 1209 Orange Street, Wilmington, DE 19801
|
First Lien Term Loan
|
SOFR(Q)
|
0.75
|
%
|
5.00
|
%
|
8.84
|
%
|
6/28/2031
|
$
|
6,119,117
|
6,100,467
|
6,119,117
|
0.25
|
%
|
E | ||||||||||||
|
HSI Halo Acquisitions, Inc.
|
c/o The Corporation Trust Company, 1209 Orange Street, Wilmington, DE 19801
|
First Lien Revolver
|
SOFR(Q)
|
0.75
|
%
|
5.00
|
%
|
8.84
|
%
|
6/28/2031
|
$
|
—
|
—
|
—
|
—
|
E | |||||||||||||
|
Issuer(F)
|
Company Address
|
Instrument
|
Ref(B)
|
Floor
|
Spread
|
Total
Coupon |
Maturity
|
Principal
|
Cost
|
Fair
Value |
% of Total
Cash and Investment |
Notes
|
|||||||||||||||||
|
Debt Investments - Continued
|
|||||||||||||||||||||||||||||
|
Professional Services (Continued)
|
|||||||||||||||||||||||||||||
|
HSI Halo Acquisitions, Inc.
|
c/o The Corporation Trust Company, 1209 Orange Street, Wilmington, DE 19801
|
First Lien Delayed Draw Term Loan
|
SOFR(Q)
|
0.75
|
%
|
5.00
|
%
|
8.84
|
%
|
6/28/2031
|
$
|
549,054
|
$
|
549,054
|
$
|
549,054
|
0.02
|
%
|
E | ||||||||||
|
Huckabee Acquisition, LLC (MOREgroup)
|
801 Cherry Street, Suite 500, Fort Worth, TX 76102
|
First Lien Term Loan
|
SOFR(Q)
|
1.00
|
%
|
5.25
|
%
|
8.94
|
%
|
1/16/2030
|
$
|
4,611,775
|
4,549,667
|
4,611,775
|
0.19
|
%
|
E | ||||||||||||
|
Huckabee Acquisition, LLC (MOREgroup)
|
801 Cherry Street, Suite 500, Fort Worth, TX 76102
|
First Lien Delayed Draw Term Loan
|
SOFR(Q)
|
1.00
|
%
|
5.25
|
%
|
8.94
|
%
|
1/16/2030
|
$
|
—
|
(13,742
|
)
|
—
|
—
|
D/E
|
||||||||||||
|
Huckabee Acquisition, LLC (MOREgroup)
|
801 Cherry Street, Suite 500, Fort Worth, TX 76102
|
First Lien Revolver
|
SOFR(Q)
|
1.00
|
%
|
5.25
|
%
|
8.94
|
%
|
1/16/2030
|
$
|
—
|
(8,245
|
)
|
—
|
—
|
D/E
|
||||||||||||
|
ICIMS, Inc.
|
101 Crawfords Corner Road, Suite 3-100, Holmdel, NJ 07733
|
First Lien Incremental Term Loan
|
SOFR(Q)
|
0.75
|
%
|
6.25
|
%
|
10.11
|
%
|
8/18/2028
|
$
|
1,152,092
|
1,142,984
|
1,114,762
|
0.05
|
%
|
E | ||||||||||||
|
Lighthouse Parent Holdings, Inc (Aperture)
|
2000 E Lamar Blvd, Suite 550, Arlington, TX 76006
|
First Lien Term Loan
|
SOFR(Q)
|
0.75
|
%
|
4.75
|
%
|
8.65
|
%
|
12/20/2031
|
$
|
5,564,864
|
5,505,485
|
5,531,475
|
0.22
|
%
|
E | ||||||||||||
|
Lighthouse Parent Holdings, Inc (Aperture)
|
2000 E Lamar Blvd, Suite 550, Arlington, TX 76006
|
First Lien Delayed Draw Term Loan
|
SOFR(Q)
|
0.75
|
%
|
4.75
|
%
|
8.51
|
%
|
12/20/2031
|
$
|
1,007,798
|
993,330
|
991,550
|
0.04
|
%
|
E | ||||||||||||
|
Lighthouse Parent Holdings, Inc (Aperture)
|
2000 E Lamar Blvd, Suite 550, Arlington, TX 76006
|
First Lien Revolver
|
SOFR(Q)
|
0.75
|
%
|
4.75
|
%
|
8.51
|
%
|
12/20/2031
|
$
|
—
|
(11,596
|
)
|
(6,511
|
)
|
—
|
D/E
|
|||||||||||
|
OMNIA Partners, LLC
|
5001 Aspen Grove Drive, Franklin, TN 37067
|
First Lien Term Loan
|
SOFR(Q)
|
1.00
|
%
|
2.75
|
%
|
6.45
|
%
|
7/25/2030
|
$
|
1,651,160
|
1,656,312
|
1,659,713
|
0.07
|
%
|
|||||||||||||
|
Secretariat Advisors LLC
|
1175 Peachtree Street NE, 100 Colony Square, Suite 400, Atlanta, GA 30361, United States
|
First Lien Term Loan
|
SOFR(Q)
|
—
|
4.00
|
%
|
7.67
|
%
|
2/24/2032
|
$
|
7,296,808
|
7,265,420
|
7,326,470
|
0.30
|
%
|
||||||||||||||
|
Secretariat Advisors LLC
|
1175 Peachtree Street NE, 100 Colony Square, Suite 400, Atlanta, GA 30361, United States
|
First Lien Delayed Draw Term Loan
|
SOFR(Q)
|
—
|
4.00
|
%
|
7.67
|
%
|
2/24/2032
|
$
|
—
|
—
|
3,601
|
—
|
|||||||||||||||
|
Vensure Employer Services, Inc.
|
2600 W Geronimo Place, Suite 100, Chandler, AZ 85224-4996, United States
|
First Lien Term Loan
|
SOFR(Q)
|
0.75
|
%
|
5.00
|
%
|
8.67
|
%
|
9/27/2031
|
$
|
15,618,411
|
15,517,365
|
15,398,847
|
0.62
|
%
|
E | ||||||||||||
|
Vensure Employer Services, Inc.
|
2600 W Geronimo Place, Suite 100, Chandler, AZ 85224-4996, United States
|
First Lien Delayed Draw Term Loan
|
SOFR(Q)
|
0.75
|
%
|
5.00
|
%
|
8.67
|
%
|
9/19/2031
|
$
|
—
|
281
|
(3,519
|
)
|
—
|
D/E
|
||||||||||||
|
|
227,727,830
|
|
225,107,129
|
9.13
|
% | ||||||||||||||||||||||||
|
Pharmaceuticals
|
|||||||||||||||||||||||||||||
|
Boots Group Finco LP
|
c/o The Corporation Trust Company, 1209 Orange Street, Wilmington, DE 19801
|
First Lien Term Loan
|
SOFR(Q)
|
—
|
3.50
|
%
|
7.21
|
%
|
7/22/2032
|
$
|
2,056,000
|
2,061,125
|
2,069,703
|
0.08
|
%
|
||||||||||||||
|
Real Estate Management and Development
|
|||||||||||||||||||||||||||||
|
Community Merger Sub Debt LLC (CINC Systems)
|
3055 Breckinridge Blvd, Suite 310, Duluth, GA 30096
|
First Lien Term Loan
|
SOFR(M)
|
0.75
|
%
|
5.25
|
%
|
8.97
|
%
|
1/18/2030
|
$
|
10,119,171
|
9,997,913
|
10,137,375
|
0.41
|
%
|
E | ||||||||||||
|
Community Merger Sub Debt LLC (CINC Systems)
|
3055 Breckinridge Blvd, Suite 310, Duluth, GA 30096
|
First Lien Revolver
|
SOFR(M)
|
0.75
|
%
|
5.25
|
%
|
8.97
|
%
|
1/18/2030
|
$
|
—
|
(26,952
|
)
|
—
|
—
|
D/E
|
||||||||||||
|
|
9,970,961
|
|
10,137,375
|
0.41
|
% | ||||||||||||||||||||||||
|
Road and Rail
|
|||||||||||||||||||||||||||||
|
Motive Technologies, Inc. (Keep Truckin)
|
55 Hawthorne Street, Suite #500, San Francisco, CA 94105
|
First Lien Term Loan
|
SOFR(M)
|
1.00
|
%
|
7.36
|
%
|
11.08
|
%
|
4/8/2027
|
$
|
44,864,231
|
44,204,127
|
44,774,503
|
1.82
|
%
|
E | ||||||||||||
|
Software
|
|||||||||||||||||||||||||||||
|
Applied Systems, Inc.
|
320 N Sangamon St, #750, Chicago, Illinois 60607
|
First Lien Term Loan
|
SOFR(Q)
|
0.50
|
%
|
2.50
|
%
|
6.17
|
%
|
2/24/2031
|
$
|
489,434
|
489,433
|
492,774
|
0.02
|
%
|
|||||||||||||
|
Barracuda Parent LLC
|
3175 Winchester Blvd, Campbell, CA 95008
|
First Lien Term Loan
|
SOFR(Q)
|
—
|
4.50
|
%
|
8.34
|
%
|
8/15/2029
|
$
|
671,201
|
661,134
|
549,442
|
0.02
|
%
|
||||||||||||||
|
Bluefin Holding, LLC (Allvue)
|
396 Alhambra Circle, 11th Floor, Coral Gables, FL 33134
|
First Lien Term Loan
|
SOFR(Q)
|
1.00
|
%
|
4.25
|
%
|
7.98
|
%
|
9/12/2029
|
$
|
17,648,902
|
17,397,772
|
17,754,795
|
0.72
|
%
|
E | ||||||||||||
|
Issuer(F)
|
Company Address
|
Instrument
|
Ref(B)
|
|
Floor |
Spread
|
Total
Coupon |
Maturity
|
Principal
|
Cost
|
Fair
Value |
% of Total
Cash and Investment |
Notes
|
||||||||||||||||
|
Debt Investments - Continued
|
|||||||||||||||||||||||||||||
|
Software (Continued)
|
|||||||||||||||||||||||||||||
|
Bluefin Holding, LLC (Allvue)
|
396 Alhambra Circle, 11th Floor, Coral Gables, FL 33134
|
First Lien Revolver
|
SOFR(Q)
|
1.00
|
%
|
4.25
|
%
|
7.98
|
%
|
9/12/2029
|
$
|
—
|
$
|
(18,333
|
)
|
$
|
—
|
—
|
D/E
|
||||||||||
|
Boxer Parent Company, Inc.
|
c/o The Corporation Trust Company, 1209 Orange Street, Wilmington, DE 19801
|
First Lien Term Loan
|
SOFR(Q)
|
—
|
3.00
|
%
|
6.82
|
%
|
7/30/2031
|
$
|
4,863,121
|
4,871,237
|
4,856,191
|
0.20
|
%
|
||||||||||||||
|
Cart.Com, Inc.
|
1334 Brittmoore Rd., Suite 225, Houston, TX 77043
|
First Lien Term Loan (2.5% Exit Fee)
|
SOFR(M)
|
1.50
|
%
|
7.75
|
%
|
11.47
|
%
|
5/30/2029
|
$
|
12,000,000
|
11,910,944
|
11,772,000
|
0.48
|
%
|
E/H
|
||||||||||||
|
Cart.Com, Inc.
|
1334 Brittmoore Rd., Suite 225, Houston, TX 77043
|
First Lien Term Loan (2.5% Exit Fee)
|
SOFR(M)
|
1.50
|
%
|
7.75
|
%
|
11.47
|
%
|
5/30/2029
|
$
|
5,876,756
|
5,827,063
|
5,788,605
|
0.23
|
%
|
E/H
|
||||||||||||
|
Central Parent, Inc.
|
11809 Domain Dr Austin, TX 78758
|
First Lien Term Loan
|
SOFR(Q)
|
—
|
3.25
|
%
|
6.92
|
%
|
7/6/2029
|
$
|
980,094
|
968,930
|
833,364
|
0.03
|
%
|
||||||||||||||
|
Clever Devices Ltd.
|
300 Crossways Park Drive, Woodbury, NY 11797
|
First Lien Term Loan
|
SOFR(M)
|
1.00
|
%
|
6.00
|
%
|
9.72
|
%
|
6/12/2030
|
$
|
2,192,902
|
2,152,292
|
2,162,201
|
0.09
|
%
|
E | ||||||||||||
|
Clever Devices Ltd.
|
300 Crossways Park Drive, Woodbury, NY 11797
|
First Lien Revolver
|
SOFR(M)
|
1.00
|
%
|
6.00
|
%
|
9.72
|
%
|
6/12/2030
|
$
|
494,733
|
477,554
|
481,746
|
0.02
|
%
|
E | ||||||||||||
|
Cloudera, Inc.
|
5470 Great America Parkway, Santa Clara, CA 95054
|
First Lien Term Loan
|
SOFR(M)
|
0.50
|
%
|
3.85
|
%
|
7.57
|
%
|
10/8/2028
|
$
|
3,927,576
|
3,894,639
|
3,773,536
|
0.15
|
%
|
|||||||||||||
|
Clover Holding 2, LLC (COHESITY)
|
2625 Augustine Dr., Santa Clara, CA 95054
|
First Lien Term Loan
|
SOFR(M)
|
—
|
4.00
|
%
|
7.77
|
%
|
10/31/2031
|
$
|
6,790,603
|
6,796,169
|
6,804,388
|
0.28
|
%
|
||||||||||||||
|
Connectwise LLC
|
400 N Tampa Street, Suite 130, Tampa, FL 33602
|
First Lien Term Loan
|
SOFR(Q)
|
—
|
3.76
|
%
|
7.43
|
%
|
9/30/2028
|
$
|
1,305,465
|
1,308,773
|
1,285,074
|
0.05
|
%
|
||||||||||||||
|
Delta Topco, Inc
|
1001 17th St, Suite 100, Denver, CO 80202
|
First Lien Term Loan
|
SOFR(Q)
|
—
|
2.75
|
%
|
6.44
|
%
|
12/24/2029
|
$
|
3,918,760
|
3,924,292
|
3,905,005
|
0.16
|
%
|
||||||||||||||
|
Deepl Se (Germany)
|
Maarweg 165 Cologne, North Rhine-Westphalia 50825, Germany
|
First Lien Term Loan
|
SOFR(Q)
|
2.50
|
%
|
5.00
|
%
|
8.69
|
%
|
6/26/2030
|
$
|
16,895,175
|
16,677,365
|
16,658,643
|
0.68
|
%
|
C/E
|
||||||||||||
|
Deepl Se (Germany)
|
Maarweg 165 Cologne, North Rhine-Westphalia 50825, Germany
|
First Lien Delayed Draw Term Loan
|
SOFR(Q)
|
2.50
|
%
|
5.00
|
%
|
8.69
|
%
|
6/26/2030
|
$
|
—
|
—
|
(206,966
|
)
|
-0.01
|
%
|
C/D/E
|
|||||||||||
|
Deepl Se (Germany)
|
Maarweg 165 Cologne, North Rhine-Westphalia 50825, Germany
|
First Lien Delayed Draw Term Loan
|
SOFR(Q)
|
2.50
|
%
|
5.00
|
%
|
8.69
|
%
|
6/26/2030
|
$
|
—
|
—
|
20,832
|
—
|
C/E
|
|||||||||||||
|
Douglas Holdings, Inc (Docupace)
|
101 Crawfords Corner Road, Suite 1324, Holmdel, NJ 07733
|
First Lien Term Loan
|
SOFR(Q)
|
1.00
|
%
|
5.75
|
%
|
9.44
|
%
|
8/27/2030
|
$
|
8,550,747
|
8,451,287
|
8,431,037
|
0.34
|
%
|
E | ||||||||||||
|
Douglas Holdings, Inc (Docupace)
|
101 Crawfords Corner Road, Suite 1324, Holmdel, NJ 07733
|
First Lien Delayed Draw Term Loan B
|
SOFR(Q)
|
1.00
|
%
|
5.75
|
%
|
9.44
|
%
|
8/27/2030
|
$
|
223,063
|
210,955
|
197,039
|
0.01
|
%
|
E | ||||||||||||
|
Douglas Holdings, Inc (Docupace)
|
101 Crawfords Corner Road, Suite 1324, Holmdel, NJ 07733
|
First Lien PIK Delayed Draw Term Loan
|
SOFR(Q)
|
1.00
|
%
|
5.75
|
%
|
9.44
|
%
|
8/27/2030
|
$
|
774,174
|
774,174
|
759,392
|
0.03
|
%
|
E | ||||||||||||
|
Douglas Holdings, Inc (Docupace)
|
101 Crawfords Corner Road, Suite 1324, Holmdel, NJ 07733
|
First Lien Revolver
|
SOFR(Q)
|
1.00
|
%
|
5.75
|
%
|
9.44
|
%
|
8/27/2030
|
$
|
—
|
(8,649
|
)
|
(10,410
|
)
|
—
|
D/E
|
|||||||||||
|
Dragos, Inc.
|
1745 Dorsey Road, Hanover, MD 21076
|
First Lien Term Loan
|
SOFR(Q)
|
1.00
|
%
|
5.25
|
%
|
8.85
|
%
|
6/30/2030
|
$
|
29,886,213
|
29,617,630
|
29,587,351
|
1.21
|
%
|
E | ||||||||||||
|
Dragos, Inc.
|
1745 Dorsey Road, Hanover, MD 21076
|
First Lien Delayed Draw Term Loan
|
SOFR(Q)
|
1.00
|
%
|
5.25
|
%
|
8.85
|
%
|
6/30/2030
|
$
|
—
|
(179,055
|
)
|
(199,241
|
)
|
-0.01
|
%
|
D/E
|
||||||||||
|
Dragos, Inc.
|
1745 Dorsey Road, Hanover, MD 21076
|
First Lien Delayed Draw Term Loan
|
SOFR(Q)
|
1.00
|
%
|
5.25
|
%
|
8.85
|
%
|
6/30/2030
|
$
|
—
|
—
|
(73,152
|
)
|
—
|
D/E
|
||||||||||||
|
Dawn Bidco, LLC
|
3311 East Old Shakopee Road, Minneapolis, MN 55425
|
First Lien Term Loan
|
SOFR(Q)
|
—
|
3.00
|
%
|
6.66
|
%
|
10/7/2032
|
$
|
2,083,000
|
2,078,012
|
2,079,292
|
0.08
|
%
|
||||||||||||||
|
Darktrace Finco US LLC
|
1601 Willow Road, Menlo Park, CA 94025
|
First Lien Term Loan
|
SOFR(Q)
|
—
|
3.25
|
%
|
7.19
|
%
|
10/9/2031
|
$
|
384,033
|
383,329
|
385,921
|
0.02
|
%
|
||||||||||||||
|
Emburse Inc.
|
633 W 5th Street, Suite 650, Los Angeles, CA 90071
|
First Lien Term Loan
|
SOFR(Q)
|
0.75
|
%
|
4.25
|
%
|
7.92
|
%
|
4/10/2032
|
$
|
26,049,261
|
25,989,690
|
26,492,098
|
1.07
|
%
|
E | ||||||||||||
|
Emburse Inc.
|
633 W 5th Street, Suite 650, Los Angeles, CA 90071
|
First Lien Revolver
|
SOFR(Q)
|
0.75
|
%
|
4.25
|
%
|
7.92
|
%
|
5/28/2032
|
$
|
—
|
(5,319
|
)
|
—
|
—
|
D/E
|
||||||||||||
|
Emburse Inc.
|
633 W 5th Street, Suite 650, Los Angeles, CA 90071
|
First Lien Delayed Draw Term Loan
|
SOFR(Q)
|
0.75
|
%
|
4.25
|
%
|
7.92
|
%
|
5/28/2032
|
$
|
—
|
(10,638
|
)
|
79,078
|
—
|
D/E
|
||||||||||||
|
Epicor Software Corporation (fka Eagle Parent Inc.)
|
807 Las Cimas Pkwy, Suite 400, Austin, TX 78746
|
First Lien Term Loan
|
SOFR(M)
|
0.75
|
%
|
2.50
|
%
|
6.22
|
%
|
5/30/2031
|
$
|
6,780,761
|
6,759,900
|
6,810,596
|
0.28
|
%
|
|||||||||||||
|
Issuer(F)
|
Company Address
|
Instrument
|
Ref(B)
|
Floor
|
Spread
|
Total
Coupon |
Maturity
|
Principal
|
Cost
|
Fair
Value |
% of Total
Cash and Investment |
Notes
|
|||||||||||||||||
|
Debt Investments - Continued
|
|||||||||||||||||||||||||||||
|
Software (Continued)
|
|||||||||||||||||||||||||||||
|
Flexport Capital, LLC
|
760 Market Street, 8th Floor, San Francisco, CA 94102
|
First Lien Term Loan
|
SOFR(M)
|
2.00
|
%
|
5.50
|
%
|
9.25
|
%
|
6/30/2029
|
$
|
25,317,664
|
$
|
25,095,107
|
$
|
25,140,440
|
1.02
|
%
|
E |
||||||||||
|
Flexport Capital, LLC
|
760 Market Street, 8th Floor, San Francisco, CA 94102
|
First Lien Delayed Draw Term Loan
|
SOFR(M)
|
2.00
|
%
|
5.50
|
%
|
9.25
|
%
|
6/30/2029
|
$
|
—
|
(170,175
|
)
|
(135,524
|
)
|
-0.01
|
%
|
D/E
|
||||||||||
|
Fusion Risk Management, Inc.
|
2 North Riverside Plaza, Suite 1000, Chicago, IL 60606
|
First Lien Term Loan
|
SOFR(Q)
|
1.00
|
%
|
6.00
|
%
|
9.82
|
%
|
5/22/2029
|
$
|
4,036,148
|
3,997,679
|
4,052,293
|
0.16
|
%
|
E |
||||||||||||
|
Fusion Risk Management, Inc.
|
2 North Riverside Plaza, Suite 1000, Chicago, IL 60606
|
First Lien Revolver
|
SOFR(M)
|
1.00
|
%
|
6.00
|
%
|
9.72
|
%
|
5/22/2029
|
$
|
122,027
|
114,837
|
122,027
|
—
|
E |
|||||||||||||
|
FirstUp, Inc
|
123 Mission Street, 25th Floor, San Francisco, CA 94105
|
First Lien Term Loan
|
SOFR(Q)
|
1.00
|
%
|
6.25
|
%
|
9.92
|
%
|
7/13/2027
|
$
|
9,817,959
|
9,754,457
|
9,759,051
|
0.40
|
%
|
E |
||||||||||||
|
FirstUp, Inc
|
123 Mission Street, 25th Floor, San Francisco, CA 94105
|
First Lien Term Loan
|
SOFR(Q)
|
1.00
|
%
|
6.25
|
%
|
9.92
|
%
|
7/13/2027
|
$
|
1,009,278
|
1,002,750
|
1,003,222
|
0.04
|
%
|
E |
||||||||||||
|
FirstUp, Inc
|
123 Mission Street, 25th Floor, San Francisco, CA 94105
|
First Lien Revolver
|
SOFR(Q)
|
1.00
|
%
|
6.25
|
%
|
9.92
|
%
|
7/13/2027
|
$
|
—
|
(5,876
|
)
|
(5,451
|
)
|
—
|
D/E
|
|||||||||||
|
Finastra USA Inc.
|
10800 Parkridge Boulevard, Suite 400, Reston, VA 20191
|
First Lien Term Loan
|
SOFR(Q)
|
—
|
4.00
|
%
|
7.72
|
%
|
7/30/2032
|
$
|
2,097,000
|
2,076,684
|
2,056,769
|
0.08
|
%
|
||||||||||||||
|
Freedom Bidco Limited (Ireland)
|
6th Floor, 2 Grand Canal Square, Dublin 2, Ireland
|
First Lien Delayed Draw Term Loan
|
SOFR(Q)
|
0.75
|
%
|
6.28
|
%
|
10.12
|
%
|
12/31/2028
|
$
|
20,829,384
|
20,589,601
|
20,589,575
|
0.83
|
%
|
C/E
|
||||||||||||
|
GTY Technology Holdings Inc.
|
1155 Perimeter Center West, Suite 500, Sandy Springs, GA 30338
|
First Lien Term Loan
|
SOFR(Q)
|
1.00
|
%
|
2.50% Cash +4.13% PIK
|
10.30
|
%
|
7/9/2029
|
$
|
3,821,002
|
3,781,306
|
3,773,515
|
0.15
|
%
|
E |
|||||||||||||
|
GTY Technology Holdings Inc.
|
1155 Perimeter Center West, Suite 500, Sandy Springs, GA 30338
|
First Lien Delayed Draw Term Loan
|
SOFR(Q)
|
1.00
|
%
|
2.50% Cash +4.13% PIK
|
10.30
|
%
|
7/9/2029
|
$
|
1,306,234
|
1,294,733
|
1,290,000
|
0.05
|
%
|
E |
|||||||||||||
|
GTY Technology Holdings Inc.
|
1155 Perimeter Center West, Suite 500, Sandy Springs, GA 30338
|
First Lien Delayed Draw Term Loan
|
SOFR(Q)
|
0.75
|
%
|
2.50% Cash +4.13% PIK
|
10.30
|
%
|
7/9/2029
|
$
|
1,134,951
|
1,121,283
|
1,120,846
|
0.05
|
%
|
E |
|||||||||||||
|
GTY Technology Holdings Inc.
|
1155 Perimeter Center West, Suite 500, Sandy Springs, GA 30338
|
First Lien Revolver
|
SOFR(Q)
|
1.00
|
%
|
2.50% Cash +4.13% PIK
|
10.30
|
%
|
7/9/2029
|
$
|
—
|
(12,269
|
)
|
(13,125
|
)
|
—
|
D/E
|
||||||||||||
|
Guardian US Holdco LLC
|
c/o The Corporation Trust Company, 1209 Orange Street, Wilmington, DE 19801
|
First Lien Term Loan
|
SOFR(Q)
|
0.50
|
%
|
3.50
|
%
|
7.17
|
%
|
1/31/2030
|
$
|
2,289,084
|
2,288,260
|
2,295,757
|
0.09
|
%
|
|||||||||||||
|
G-3 Apollo Acquisition Corp (Appriss Retail)
|
220 Progress, Suite 175, Irvine, CA 92618
|
First Lien Term Loan
|
SOFR(Q)
|
1.00
|
%
|
5.00
|
%
|
8.74
|
%
|
3/10/2031
|
$
|
13,326,632
|
13,153,830
|
13,313,305
|
0.54
|
%
|
E |
||||||||||||
|
G-3 Apollo Acquisition Corp (Appriss Retail)
|
220 Progress, Suite 175, Irvine, CA 92618
|
First Lien Delayed Draw Term Loan
|
SOFR(Q)
|
1.00
|
%
|
5.00
|
%
|
8.69
|
%
|
3/10/2031
|
$
|
—
|
(27,911
|
)
|
(2,870
|
)
|
—
|
D/E
|
|||||||||||
|
G-3 Apollo Acquisition Corp (Appriss Retail)
|
220 Progress, Suite 175, Irvine, CA 92618
|
First Lien Revolver
|
SOFR(Q)
|
1.00
|
%
|
5.00
|
%
|
8.69
|
%
|
3/10/2031
|
$
|
287,006
|
249,791
|
284,136
|
0.01
|
%
|
E |
||||||||||||
|
Genesys Cloud Services Inc.
|
1302 El Camino Real, Suite 300, Menlo Park, CA 94025
|
First Lien Term Loan
|
SOFR(M)
|
—
|
2.50
|
%
|
6.22
|
%
|
1/23/2032
|
$
|
2,047,631
|
2,038,638
|
2,046,034
|
0.08
|
%
|
||||||||||||||
|
Honey Intermediate, Inc. (iLobby) (Canada)
|
5255 Yonge Street, Suite 1500, North York, ON M2N 6P4, Canada
|
First Lien Term Loan
|
SOFR(M)
|
1.00
|
%
|
2.88% Cash +3.38% PIK
|
9.97
|
%
|
9/30/2030
|
$
|
14,656,842
|
14,484,145
|
14,422,333
|
0.58
|
%
|
C/E
|
|||||||||||||
|
Honey Intermediate, Inc. (iLobby) (Canada)
|
5255 Yonge Street, Suite 1500, North York, ON M2N 6P4, Canada
|
First Lien Revolver
|
SOFR(M)
|
1.00
|
%
|
2.88% Cash +3.38% PIK
|
9.97
|
%
|
9/26/2030
|
$
|
—
|
(21,007
|
)
|
(29,958
|
)
|
—
|
C/D/E
|
||||||||||||
|
Hyphen Solutions, LLC
|
1507 LBJ Freeway, Suite 300, Dallas, TX 75234
|
First Lien Delayed Draw Term Loan
|
SOFR(M)
|
1.00
|
%
|
4.50
|
%
|
8.22
|
%
|
8/6/2032
|
$
|
—
|
(15,115
|
)
|
—
|
—
|
D/E
|
||||||||||||
|
Hyphen Solutions, LLC
|
1507 LBJ Freeway, Suite 300, Dallas, TX 75234
|
First Lien Revolver
|
SOFR(M)
|
1.00
|
%
|
4.50
|
%
|
8.22
|
%
|
8/6/2032
|
$
|
—
|
(18,138
|
)
|
—
|
—
|
D/E
|
||||||||||||
|
Hyphen Solutions, LLC
|
1507 LBJ Freeway, Suite 300, Dallas, TX 75234
|
First Lien Term Loan
|
SOFR(M)
|
1.00
|
%
|
4.50
|
%
|
8.22
|
%
|
8/6/2032
|
$
|
34,655,092
|
34,491,845
|
34,655,092
|
1.42
|
%
|
E |
||||||||||||
|
JOBVITE, Inc. (Employ, Inc.)
|
1730 Blake Street, Suite #445, Denver, CO, 80202
|
First Lien Last Out Term Loan
|
SOFR(Q)
|
0.75
|
%
|
7.50
|
%
|
11.37
|
%
|
8/5/2028
|
$
|
2,321,515
|
2,295,910
|
2,165,904
|
0.09
|
%
|
E |
||||||||||||
|
IQN Holding Corporation (Beeline)
|
5011 Gate Parkway Building 100, Suite 250, Jacksonville, FL 32256
|
First Lien Delayed Draw Term Loan
|
SOFR(Q)
|
0.75
|
%
|
2.63% Cash +3.13% PIK
|
9.42
|
%
|
5/2/2029
|
$
|
38,464,385
|
38,145,879
|
38,129,745
|
1.56
|
%
|
E |
|||||||||||||
|
Issuer(F)
|
Company Address
|
Instrument
|
Ref(B)
|
Floor
|
Spread
|
Total
Coupon |
Maturity
|
Principal
|
Cost
|
Fair
Value |
% of Total
Cash and Investment |
Notes
|
|||||||||||||||||
|
Debt Investments - Continued
|
|||||||||||||||||||||||||||||
|
Software (Continued)
|
|||||||||||||||||||||||||||||
|
IVXS UK Limited (ComplyAdvantage) (United Kingdom)
|
86-90 Paul Street, London, EC2A 4NE, United Kingdom
|
First Lien Term Loan (4.5% Exit Fee)
|
SOFR(Q)
|
4.00
|
%
|
5.75
|
%
|
9.75
|
%
|
5/19/2029
|
$
|
9,466,533
|
$
|
9,385,993
|
$
|
9,450,440
|
0.38
|
%
|
C/E/H
|
||||||||||
|
IVXS UK Limited (ComplyAdvantage) (United Kingdom)
|
86-90 Paul Street, London, EC2A 4NE, United Kingdom
|
First Lien Delayed Draw Term Loan (4.5% Exit Fee)
|
SOFR(Q)
|
4.00
|
%
|
5.75
|
%
|
9.75
|
%
|
5/19/2029
|
$
|
—
|
(26,847
|
)
|
(5,364
|
)
|
—
|
C/D/E/H
|
|||||||||||
|
ION Platform Finance US Inc.
|
1345 Ave of the Americas, New York, NY 10105
|
First Lien Term Loan
|
SOFR(Q)
|
—
|
3.75
|
%
|
7.42
|
%
|
9/30/2032
|
$
|
1,702,000
|
1,679,204
|
1,602,314
|
0.06
|
%
|
||||||||||||||
|
Kaseya, Inc.
|
333 SE 2nd Ave., 35th Floor, Miami, FL 33131
|
First Lien Term Loan
|
SOFR(M)
|
—
|
3.00
|
%
|
6.72
|
%
|
3/20/2032
|
$
|
2,475,595
|
2,474,995
|
2,480,695
|
0.10
|
%
|
||||||||||||||
|
Logicmonitor, Inc
|
98 San Jacinto Blvd, Suite 1300, Austin, TX 78701
|
First Lien Term Loan
|
SOFR(Q)
|
0.75
|
%
|
5.50
|
%
|
9.34
|
%
|
11/19/2031
|
$
|
36,628,138
|
36,287,873
|
36,188,600
|
1.48
|
%
|
E |
||||||||||||
|
Logicmonitor, Inc
|
98 San Jacinto Blvd, Suite 1300, Austin, TX 78701
|
First Lien Revolver
|
SOFR(Q)
|
0.75
|
%
|
5.50
|
%
|
9.34
|
%
|
11/19/2031
|
$
|
—
|
(15,614
|
)
|
(22,278
|
)
|
—
|
D/E
|
|||||||||||
|
Logicmonitor, Inc
|
98 San Jacinto Blvd, Suite 1300, Austin, TX 78701
|
First Lien Delayed Draw Term Loan
|
SOFR(Q)
|
0.75
|
%
|
5.50
|
%
|
9.34
|
%
|
10/7/2032
|
$
|
—
|
(40,379
|
)
|
(130,656
|
)
|
-0.01
|
%
|
D/E
|
||||||||||
|
MH Sub I, LLC (Micro Holding Corp.)
|
909 N Pacific Coast Highway, 11th floor, El Segundo, CA 90245
|
First Lien Term Loan
|
SOFR(M)
|
—
|
4.25
|
%
|
7.97
|
%
|
12/11/2031
|
$
|
2,392,390
|
2,377,074
|
2,058,580
|
0.08
|
%
|
||||||||||||||
|
MH Sub I, LLC (Micro Holding Corp.)
|
909 N Pacific Coast Highway, 11th floor, El Segundo, CA 90245
|
First Lien 2023 Incremental Term Loan
|
SOFR(Q)
|
1.00
|
%
|
4.25
|
%
|
7.97
|
%
|
5/3/2028
|
$
|
2,159,635
|
2,158,392
|
2,014,400
|
0.08
|
%
|
|||||||||||||
|
Mitchell International Inc
|
9771 Clairemont Mesa Blvd, Suite A, San Diego, CA 92124
|
First Lien Term Loan
|
SOFR(M)
|
0.50
|
%
|
3.25
|
%
|
6.97
|
%
|
6/17/2031
|
$
|
3,049,177
|
3,040,693
|
3,062,914
|
0.12
|
%
|
|||||||||||||
|
Planview Parent, Inc.
|
12301 Research Blvd, Bldg V, Suite 400, Austin, TX 78759
|
First Lien Term Loan
|
SOFR(Q)
|
—
|
3.50
|
%
|
7.17
|
%
|
12/17/2027
|
$
|
3,262,299
|
3,251,543
|
3,139,457
|
0.13
|
%
|
||||||||||||||
|
Project Boost Purchaser, LLC (JD Power, AutoData Inc)
|
320 East Big Beaver Road, Troy, MI 48083
|
First Lien Term Loan
|
SOFR(Q)
|
—
|
2.75
|
%
|
6.42
|
%
|
7/2/2031
|
$
|
4,833,200
|
4,835,604
|
4,850,720
|
0.20
|
%
|
||||||||||||||
|
Ping Identity Holding Corp
|
1001 17th Street, Suite 100, Denver, CO 80202
|
First Lien Term Loan
|
SOFR(Q)
|
—
|
2.75
|
%
|
6.59
|
%
|
11/5/2032
|
$
|
1,657,000
|
1,661,442
|
1,663,214
|
0.07
|
%
|
||||||||||||||
|
Proofpoint, Inc.
|
925 W Maude Ave, Sunnyvale, CA 94085
|
First Lien Term Loan
|
SOFR(Q)
|
—
|
3.00
|
%
|
6.67
|
%
|
8/21/2028
|
$
|
5,062,196
|
5,052,025
|
5,096,644
|
0.21
|
%
|
||||||||||||||
|
Pyramid Analytics BV (Netherlands)
|
Jollemanhof 22, 1019 GW Amsterdam, Netherlands
|
First Lien Delayed Draw Term Loan
|
SOFR(Q)
|
4.25
|
%
|
6.50
|
%
|
10.75
|
%
|
5/14/2029
|
$
|
722,984
|
714,145
|
771,527
|
0.03
|
%
|
C/E
|
||||||||||||
|
Qlik Technologies Inc. (Project Alpha)
|
150 North Radnor Chester Road, Radnor Township, PA 19087
|
First Lien Term Loan
|
SOFR(Q)
|
—
|
3.25
|
%
|
6.92
|
%
|
10/28/2030
|
$
|
1,001,805
|
1,003,854
|
1,001,374
|
0.04
|
%
|
||||||||||||||
|
RealPage, Inc
|
2201 Lakeside Blvd, Richardson, TX 75082
|
First Lien Term Loan
|
SOFR(Q)
|
—
|
3.75
|
%
|
7.42
|
%
|
4/22/2028
|
$
|
5,699,105
|
5,708,283
|
5,724,637
|
0.23
|
%
|
||||||||||||||
|
Shackleton Bidco Inc. (Payworks) (Canada)
|
1700 - 360 Main Street, Winnipeg, Manitoba R3C 3Z3, Canada
|
First Lien Revolver
|
CORRA (Q)
|
0.75
|
%
|
4.50
|
%
|
6.76
|
%
|
11/5/2032
|
CAD$ -
|
(37,370
|
)
|
(37,370
|
)
|
—
|
C/D/E
|
||||||||||||
|
Shackleton Bidco Inc. (Payworks) (Canada)
|
1700 - 360 Main Street, Winnipeg, Manitoba R3C 3Z3, Canada
|
First Lien Delayed Draw Term Loan
|
CORRA (Q)
|
0.75
|
%
|
4.50
|
%
|
6.76
|
%
|
11/5/2032
|
CAD$ -
|
(149,481
|
)
|
(149,481
|
)
|
-0.01
|
%
|
C/D/E
|
|||||||||||
|
Shackleton Bidco Inc. (Payworks) (Canada)
|
1700 - 360 Main Street, Winnipeg, Manitoba R3C 3Z3, Canada
|
First Lien Term Loan
|
CORRA (Q)
|
0.75
|
%
|
4.50
|
%
|
6.76
|
%
|
10/25/2032
|
CAD$ 43,064,004
|
30,311,270
|
31,109,089
|
1.26
|
%
|
C/E
|
|||||||||||||
|
Sophia, L.P. (Ellucian)
|
2003 Edmund Halley Dr, Reston, VA 20191-3496
|
First Lien Term Loan
|
SOFR(M)
|
0.50
|
%
|
2.75
|
%
|
6.47
|
%
|
10/7/2029
|
$
|
5,630,975
|
5,627,127
|
5,669,688
|
0.23
|
%
|
|||||||||||||
|
Thunder Purchaser, Inc. (Vector Solutions)
|
4890 W Kennedy Blvd, Suite 300, Tampa, FL 33609
|
First Lien Incremental Delayed Draw Term Loan
|
SOFR(Q)
|
1.00
|
%
|
5.40
|
%
|
9.07
|
%
|
6/30/2028
|
$
|
1,016,317
|
1,007,067
|
1,006,006
|
0.04
|
%
|
E |
||||||||||||
|
Thunder Purchaser, Inc. (Vector Solutions)
|
4890 W Kennedy Blvd, Suite 300, Tampa, FL 33609
|
First Lien Incremental Term Loan
|
SOFR(Q)
|
1.00
|
%
|
5.40
|
%
|
9.07
|
%
|
6/30/2028
|
$
|
569,137
|
565,262
|
564,817
|
0.02
|
%
|
E |
||||||||||||
|
TIBCO Software Inc.
|
3303 Hillview Avenue, Palo Alto, CA 94304
|
First Lien Term Loan
|
SOFR(M)
|
—
|
3.25
|
%
|
6.92
|
%
|
8/13/2032
|
$
|
1,754,561
|
1,750,580
|
1,758,807
|
0.07
|
%
|
||||||||||||||
|
Trintech, Inc.
|
5600 Granite Parkway, Suite 10000, Plano, TX 75024
|
First Lien Term Loan
|
SOFR(M)
|
1.00
|
%
|
5.50
|
%
|
9.22
|
%
|
7/25/2029
|
$
|
9,218,393
|
9,054,253
|
9,214,761
|
0.37
|
%
|
E |
||||||||||||
|
Issuer(F)
|
Company Address
|
Instrument
|
Ref(B)
|
Floor
|
Spread
|
Total
Coupon |
Maturity
|
Principal
|
Cost
|
Fair
Value |
% of Total
Cash and Investment |
Notes
|
|||||||||||||||||
|
Debt Investments - Continued
|
|||||||||||||||||||||||||||||
|
Software (Continued)
|
|||||||||||||||||||||||||||||
|
Trintech, Inc.
|
5600 Granite Parkway, Suite 10000, Plano, TX 75024
|
First Lien Revolver
|
SOFR(M)
|
1.00
|
%
|
5.50
|
%
|
9.22
|
%
|
7/25/2029
|
$
|
206,737
|
$
|
193,853
|
$
|
206,452
|
0.01
|
%
|
E |
||||||||||
|
UKG Inc.
|
2250 N. Commerce Parkway, Weston, FL 33326, United States
|
First Lien Term Loan
|
SOFR(Q)
|
—
|
2.50
|
%
|
6.34
|
%
|
1/30/2031
|
$
|
1,377,103
|
1,377,007
|
1,380,140
|
0.06
|
%
|
||||||||||||||
|
Xplor T1, LLC
|
11330 Olive Blvd., Suite 200, Creve Coeur, MO 63141, United States
|
First Lien Term Loan
|
SOFR(Q)
|
—
|
3.50
|
%
|
7.34
|
%
|
10/28/2032
|
$
|
1,450,365
|
1,447,636
|
1,453,991
|
0.06
|
%
|
E |
|||||||||||||
|
457,802,308
|
458,627,865
|
18.60
|
%
|
||||||||||||||||||||||||||
|
Specialty Retail
|
|||||||||||||||||||||||||||||
|
Mavis Tire Express Services Topco Corp
|
100 Hillside Ave, White Plains, NY 10603
|
First Lien Term Loan
|
SOFR(M)
|
0.75
|
%
|
3.00
|
%
|
6.72
|
%
|
5/4/2028
|
$
|
5,635,663
|
5,630,686
|
5,662,630
|
0.23
|
%
|
|||||||||||||
|
Trading Companies and Distributors
|
|||||||||||||||||||||||||||||
|
BCPE Empire Holdings, Inc.
|
4001 Kennett Pike, Suite 302, Wilmington, DE 19807
|
First Lien Term Loan
|
SOFR(M)
|
—
|
3.25
|
%
|
6.97
|
%
|
12/11/2030
|
$
|
1,207,478
|
1,204,722
|
1,196,913
|
0.05
|
%
|
||||||||||||||
|
Flow Merger Sub Inc.
|
251 Little Falls Drive, Wilmington, DE 19808
|
First Lien Term Loan
|
SOFR(Q)
|
—
|
3.25
|
%
|
7.55
|
%
|
3/31/2028
|
$
|
52,000
|
52,000
|
52,270
|
—
|
|||||||||||||||
|
Veritiv Corp.
|
1000 Abernathy Rd Bldg 400 Ste 1700, Atlanta, GA 30328-5658, United States
|
First Lien Term Loan
|
SOFR(Q)
|
—
|
4.00
|
%
|
7.67
|
%
|
11/17/2030
|
$
|
394,491
|
392,861
|
395,006
|
0.02
|
%
|
||||||||||||||
|
1,649,583
|
1,644,189
|
0.07
|
% |
||||||||||||||||||||||||||
|
Textiles, Apparel and Luxury Goods
|
|||||||||||||||||||||||||||||
|
WH Borrower, LLC (WHP)
|
530 5th Avenue, New York, NY 10036, United States
|
First Lien Term Loan
|
SOFR(Q)
|
0.50
|
%
|
4.50
|
%
|
8.39
|
%
|
2/20/2032
|
$
|
26,648,628
|
26,531,577
|
26,808,919
|
1.09
|
%
|
|||||||||||||
|
Technology Hardware, Storage and Peripherals
|
|||||||||||||||||||||||||||||
|
SumUp Holdings Luxembourg S.A.R.L. (Luxembourg)
|
32-34 Great Marlborough St, London, W1F 7JB, United Kingdom
|
First Lien Delayed Draw Term Loan
|
SOFR(Q)
|
1.00
|
%
|
6.00
|
%
|
9.82
|
%
|
4/25/2031
|
$
|
12,800,000
|
12,733,172
|
12,876,800
|
0.52
|
%
|
C/E
|
||||||||||||
|
Transportation Infrastructure
|
|||||||||||||||||||||||||||||
|
Bleriot US Bidco Inc.
|
4001 Kennett Pike, Suite 302, Wilmington, DE 19807
|
First Lien Term Loan
|
SOFR(Q)
|
—
|
2.50
|
%
|
6.17
|
%
|
10/30/2026
|
$
|
3,298,317
|
3,298,220
|
3,318,239
|
0.13
|
%
|
||||||||||||||
|
Brown Group Holding, LLC
|
251 Little Falls Drive, Wilmington, DE 19808
|
First Lien Term Loan
|
SOFR(Q)
|
—
|
2.50
|
%
|
6.22
|
%
|
7/1/2031
|
$
|
1,236,877
|
1,236,877
|
1,244,471
|
0.05
|
%
|
||||||||||||||
|
Brown Group Holding, LLC
|
251 Little Falls Drive, Wilmington, DE 19808
|
First Lien Term Loan
|
SOFR(Q)
|
—
|
2.75
|
%
|
6.57
|
%
|
7/2/2029
|
$
|
2,882,702
|
2,900,419
|
2,900,416
|
0.12
|
%
|
||||||||||||||
|
7,435,516
|
7,463,126
|
0.30
|
%
|
||||||||||||||||||||||||||
|
Wireless Telecommunication Services
|
|||||||||||||||||||||||||||||
|
OpenMarket, Inc. (Infobip) (United Kingdom)
|
35 - 38 New Bridge Street, London EC4V 6BW, United Kingdom
|
First Lien Term Loan
|
SOFR(Q)
|
0.75
|
%
|
5.50
|
%
|
9.17
|
%
|
6/11/2029
|
$
|
43,800,168
|
43,235,290
|
43,368,561
|
1.76
|
%
|
C/E
|
||||||||||||
|
Total Debt Investments - 142.2% of Net Assets
|
2,253,599,573
|
2,244,580,686
|
91.04
|
% |
|||||||||||||||||||||||||
|
Issuer(F)
|
Company Address
|
Instrument
|
Ref(B)
|
Floor
|
Spread
|
Total
Coupon |
Maturity
|
Principal
|
Cost
|
Fair
Value |
% of Total
Cash and Investment |
Notes
|
|||||||||||||||||
|
Equity Securities
|
|||||||||||||||||||||||||||||
|
IT Services
|
|||||||||||||||||||||||||||||
|
New Insight Holdings, Inc. (Dynata)
|
55 East 52nd Street, 34th Floor New York, NY 10055
|
Common Stock
|
$
|
22,972
|
$
|
402,032
|
$
|
120,603
|
—
|
I/J
|
|||||||||||||||||||
|
Media
|
|||||||||||||||||||||||||||||
|
Streamland Media Holdings LLC
|
3900 W Alameda Ave, 10th Floor, Burbank, CA 91505
|
Common Units
|
$
|
12,363
|
645,215
|
—
|
—
|
E/I/J
|
|||||||||||||||||||||
|
Paper and Forest Products
|
|||||||||||||||||||||||||||||
|
48forty Intermediate Holdings, Inc.
|
3650 Mansell Rd, Suite 100, Alpharetta, GA 30022
|
Common Stock
|
$
|
685
|
—
|
—
|
—
|
E/I/J
|
|||||||||||||||||||||
|
Total Equity Securities - 0.0% of Net Assets
|
1,047,247
|
120,603
|
—
|
||||||||||||||||||||||||||
|
Total Investments - 142.2% of Net Assets
|
2,254,646,820
|
2,244,701,289
|
91.04
|
% |
|||||||||||||||||||||||||
|
Cash and Cash Equivalents - 14.0% of Net Assets
|
221,222,080
|
8.96
|
% |
||||||||||||||||||||||||||
|
Total Cash and Investments - 156.2% of Net Assets
|
2,465,923,369
|
100.00
|
% |
||||||||||||||||||||||||||
Notes to Schedule of Investments:
| (A) |
Debt investments include investments in bank debt that generally are bought and sold among institutional investors in transactions not subject to registration under the Securities Act. Such transactions are generally subject to
contractual restrictions, such as approval of the agent or borrower.
|
| (B) |
100.0% of the fair value of total senior secured loans in the Fund’s portfolio bear interest at a floating rate that may be determined by reference to SOFR, “S”, or other base rate (commonly the Federal Funds Rate or the Prime
Rate), “P”. In addition, 80.0% of the fair value of such senior secured loans have floors of 0.50% to 4.25%, with a weighted average of 0.90%. The borrower under a senior secured loan generally has the option to select from interest
reset periods of one, two, three or six months and may alter that selection at the end of any reset period. The stated interest rate represents the weighted average interest rate at December 31, 2025 of all contracts within the
specified loan facility. SOFR resets monthly (M), quarterly (Q) or semiannually (S).
|
| (C) |
Non-U.S. company or principal place of business outside the U.S. and as a result, the investment is not a qualifying asset under Section 55(a) of the 1940 Act. Under the 1940 Act, the Fund may not acquire any non-qualifying asset
unless, at the time such acquisition is made, qualifying assets represent at least 70% of the Fund's total assets.
|
|
(D)
|
Negative balances represent unfunded commitments that were acquired and/or valued at a discount.
|
| (E) |
Investments are considered Level 3 in accordance with ASC Topic 820 (see Note 2 to the Fund’s consolidated financial statements).
|
|
(F)
|
The Fund generally uses GICS codes to identify the industry groupings.
|
|
(G)
|
Non-accruing debt investment.
|
| (H) |
In addition to the stated coupon, investment has an exit fee payable upon repayment of the loan in an amount equal to the percentage of the original principal amount shown.
|
|
(I)
|
Restricted security (see Note 2 to the Fund’s consolidated financial statements).
|
|
(J)
|
Non-income producing investment.
|
| (K) |
Deemed an investment company under Section 3(c) of the 1940 Act and as a result, the investment is not a qualifying asset under Section 55(a) of the 1940 Act. Under the 1940 Act, the Fund may not acquire any non-qualifying asset
unless, at the time such acquisition is made, qualifying assets represent at least 70% of the Fund's total assets
|
| (L) |
Publicly traded company with a market capitalization greater than $250 million and as a result the investment is not a qualifying asset under Section 55(a) of the 1940 Act. Under the 1940 Act, the Fund may not acquire any
non-qualifying asset unless, at the time such acquisition is made, qualifying assets represent at least 70% of the Fund’s total assets.
|
Aggregate acquisitions and aggregate dispositions of investments totaled $1,623,125,961 and $406,092,817, respectively for the year ended December 31, 2025. Aggregate acquisitions include investment assets received as payment in kind.
Aggregate dispositions include principal paydowns on investments. The total value of restricted securities and bank debt as of December 31, 2025 was $2,244,701,289 or 91.0% of total cash and investments of the Fund. As of December 31, 2025,
approximately 10.8% of the total assets of the Fund were not qualifying assets under Section 55(a) of the 1940 Act.
Board of Trustees
Our business and affairs are managed under the direction of our Board of Trustees. The responsibilities of the Board of Trustees include, among other things, the oversight of our investment activities, the valuation
of our assets, oversight of our financing arrangements and corporate governance activities. Our Board of Trustees consists of five members, three of whom are not “interested persons” of the Fund or of the Advisers as defined in Section 2(a)(19) of
the 1940 Act and are “independent,” as determined by our Board of Trustees. We refer to these individuals as our Independent Trustees. The Board is divided into three classes. At each annual meeting of shareholders, the term of only one class of
Trustees expires and only the Trustees in that one class stand for re-election. Trustees standing for election at an annual meeting of shareholders are elected to serve until the third annual meeting of shareholders following their election and
when their successors are duly elected and qualify.
The Board of Trustees believes its relatively small size and the composition and leadership of its committees allow each Trustee to enjoy full, accurate and efficient communication with the Fund, the Investment
Adviser and management, and facilitates the timely transmission of information among such parties. The Lead Independent Trustee serves as a liaison between the Independent Trustees and the Investment Adviser and other service providers on a wide
variety of matters. The Lead Independent Trustee and Board Chair work together to ensure the Board of Trustees is effectively fulfilling its responsibilities.
Our Board of Trustees elects our executive officers, who serve at the discretion of the Board of Trustees.
Trustees
Information regarding the Board of Trustees is as follows:
|
Name, Address*
and Year of Birth
|
Position(s) Held
with Fund
|
Term of Office
and Length of
Time Served
|
Principal Occupation(s) During
Past Five Years
|
No. of
BlackRock
Advised
BDCs
Overseen
|
Other Public
or Investment
Company
Directorships
Held by
Trustee** |
|||||
|
Independent Trustees
|
||||||||||
|
Andrea L. Petro
Year of birth: 1952
|
Trustee, Governance and Compensation Committee Chair, Audit Committee Member and Joint Transactions Committee Member
|
2027; 2022 to present
|
From 2022 to present, Ms. Petro has been a Trustee of the Fund, Chair of the Fund’s Governance and Compensation Committee, a member of the Audit Committee and a member of the Joint Transactions Committee.
From 2020 to present, Ms. Petro has served as a Director of BlackRock TCP Capital Corp. and currently serves as Chair of its Governance and Compensation Committee and a member of its Audit Committee and Joint Transactions Committee. From
November 2024 to present, Ms. Petro has served as a Senior Advisor to Carob Financial, LLC, a private credit fund. From June 2020 to June 2024, Ms. Petro served as a Director of Ready Capital Corporation. From June 2018 to February 2020,
Ms. Petro served as Managing Director and Group Head of the Specialty Commercial Finance Group of Waterfall Asset Management. Ms. Petro served as a consultant for Waterfall Asset Management from March 2020 through February 2023.
|
2 BDCs
consisting of 2 Portfolios
|
None
|
|
Name, Address*
and Year of Birth
|
Position(s) Held
with Fund
|
Term of Office
and Length of
Time Served
|
Principal Occupation(s) During
Past Five Years
|
No. of
BlackRock
Advised
BDCs
Overseen
|
Other Public
or Investment
Company
Directorships
Held by
Trustee** |
|||||
|
Ms. Petro previously worked at Wells Fargo Capital Finance from December 2000 to December 2017 as the Executive Vice President and Group Head of the Lender Finance Division and Supply Chain Finance Division.
Ms. Petro also served as a member of the MS Finance Advisory Board of the McCombs School of Business at the University of Texas at Austin from December 2015 to December 2025. She also served as the President of the Commercial Finance
Association from 2016 to 2017 and previously served as a member of the Secured Finance Foundation board of directors from 2000 to 2022.
|
||||||||||
|
Maureen K. Usifer
Year of birth: 1960
|
Trustee, Audit Committee Chair, Governance and Compensation Committee Member and Joint Transactions Committee Member
|
2028; 2022 to present
|
From 2022 to present, Ms. Usifer has served as a Trustee, member of the Audit Committee, a member of the Governance and Compensation Committee and a member of the Joint Transactions Committee. From 2024 to
present, Ms. Usifer has served as Chair of the Audit Committee of the Fund. Ms. Usifer is also a Director and the Chair of the Audit Committee of each of BlackRock TCP Capital Corp. and BlackRock Direct Lending Corp. From 2005 until its
merger with and into a wholly-owned subsidiary of BlackRock TCP Capital Corp. on March 18, 2024, Ms. Usifer was a Director of BlackRock Capital Investment Corporation.
From 2024 to present, Ms. Usifer has served as a Director for Charlotte’s Web. From 2021 to present, Ms. Usifer has served as a Director for PC Construction. Since 2018, Ms. Usifer has been a Director of
Liberty All Star Funds. Ms. Usifer was a member of the Green Mountain Care Board, a regulatory board appointed by the Governor in Vermont responsible for approving hospital budgets, insurance rates and capital projects, from 2017 to 2021.
Ms. Usifer served as CFO of Seventh Generation Inc., a distributor of its brand of household and personal care products, from 2012 to 2016. From 1996 to 2012, Ms. Usifer served in various roles with Church & Dwight Co., Inc. (“Church
& Dwight”), a major producer of baking soda and consumer products. Ms. Usifer served as Vice President of Investor Relations, Senior Finance Director, Divisional CFO and controller during her tenure at Church & Dwight. Ms. Usifer
received an undergraduate degree in business from St. Michael’s College and an M.B.A. in Finance from Clarkson University.
|
3 BDCs
consisting of 3 Portfolios
|
Ms. Usifer currently serves as a Director of Liberty All Star Funds and serves as chair of the audit committee. Ms. Usifer also serves as a Director of Charlotte’s Web and serves as chair of the audit committee.
|
|||||
|
Name, Address*
and Year of Birth
|
Position(s) Held
with Fund
|
Term of Office
and Length of
Time Served
|
Principal Occupation(s) During
Past Five Years
|
No. of
BlackRock
Advised
BDCs
Overseen
|
Other Public
or Investment
Company
Directorships
Held by
Trustee** |
|||||
|
Eric J. Draut
Year of birth: 1957
|
Lead Independent Trustee, Audit Committee Member, Governance and Compensation Committee Member, Joint Transactions Committee Member
|
2026; 2022 to present
|
From 2022 to present, Mr. Draut has been a Trustee of the Fund. From 2022 to November 2024, and since May 18, 2025, Mr. Draut has served as Lead Independent Trustee and as a member of the Audit Committee, a
member of the Governance and Compensation Committee, and a member of the Joint Transactions Committee. From 2020 to present, Mr. Draut has been a Director of BlackRock Direct Lending Corp., and from 2011 to present, Mr. Draut has been a
Director of BlackRock TCP Capital Corp.
Mr. Draut is the Vice-Chair of the Board and the Chair of the Audit Committee of Thrivent Financial for Lutherans, a registered investment adviser and Fortune 500 Company. From August 2022 until December
2025, Mr. Draut served as a trustee of the ELCA Foundation. In February 2015, Mr. Draut was also appointed to the Board of Holy Family Ministries, operator of Holy Family School, where he served as the Interim Chief Executive Officer from
2017 to 2018 and currently serves as Chair of the Board. From 2008 to 2010 and again from 2014 to 2017, Mr. Draut was Chairman of the Board of Lutheran Social Services of Illinois. From 2012 to 2014, Mr. Draut was Executive Chairman and, in
2017, became chairman emeritus, of the Board of Lutheran Social Services of Illinois.
|
3 BDCs
consisting of 3 Portfolios
|
None
|
|||||
|
Interested Trustees
|
||||||||||
|
John Perlowski(1)
Year of birth: 1964
|
Trustee
|
2027; 2022 to present
|
From 2009 to present, Mr. Perlowski has been a Managing Director of BlackRock, Inc., Head of BlackRock Global Accounting and Product Services. Mr. Perlowski also serves as President and Chief Executive
Officer of other funds managed by the Investment Adviser and its affiliates. Mr. Perlowski has also served as Advisory Director of Family Resource Network (charitable foundation) since 2009.
|
1 BDC
consisting of 1 Portfolio
|
Mr. Perlowski currently serves as director/trustee of other funds managed by the Investment Adviser and its affiliates, including 89 BlackRock advised investment companies, consisting of 266 investment portfolios.
|
|
Name, Address*
and Year of Birth
|
Position(s) Held
with Fund
|
Term of Office
and Length of
Time Served
|
Principal Occupation(s) During
Past Five Years
|
No. of
BlackRock
Advised
BDCs
Overseen
|
Other Public
or Investment
Company
Directorships
Held by
Trustee** |
|||||
|
Philip Tseng(1)
Year of birth: 1976
|
Trustee, Board Chair, Chief Executive Officer and Co-Chief Investment Officer
|
2028; May 2025 to present
|
Mr. Tseng is a Trustee, the Chief Executive Officer and Co-Chief Investment Officer of the Fund. Mr. Tseng is a senior member of the investment team within BlackRock’s Private Financing Solutions (PFS) platform,
where he leads BlackRock’s U.S. core middle market direct lending strategy. In this capacity, Mr. Tseng is responsible for oversight of the strategy’s investment process and plays a leadership role in the evaluation, structuring, and
execution of private secured investments in U.S. core middle market companies. Mr. Tseng also serves as the Chairman, CEO and Co-CIO of BlackRock TCP Capital Corp. and BlackRock Direct Lending Corp. Prior to joining BlackRock, Mr. Tseng was
a Managing Partner at Tennenbaum Capital Partners, LLC, where he was also a member of the Management Committee. Prior to joining Tennenbaum Capital Partners, LLC, Mr. Tseng was a member of the Credit Suisse First Boston technology
investment banking group focusing on technology and business services. While at CSFB, he advised on and executed M&A, public and private equity and structured debt transactions for a broad range of small and large cap companies. He also
spent time covering technology services companies as an equity research analyst. Prior to that, he spent time in investment banking at Deutsche Banc Alex Brown. Mr. Tseng holds an M.B.A. from Harvard Business School and a B.A. (honors) in
Economics from Harvard College.
|
3 BDCs consisting of 3 Portfolios
|
None
|
| (1) |
Each of Mr. Perlowski and Mr. Tseng is an “interested person” (as defined in the 1940 Act) of the Fund by virtue of his current position with the Investment Adviser.
|
| * |
The address for each trustee is c/o BlackRock Capital Investment Advisors, LLC, 50 Hudson Yards, New York, New York, 10001.
|
| ** |
Directorships disclosed under this column do not include directorships disclosed under the column “Principal Occupation(s) During Past Five Years.”
|
The Trustees of the Fund are classified into three classes of Trustees. Eric J. Draut is the Class I Trustee of the Fund and will stand for re-election at the 2026 annual meeting of shareholders of the Fund. Andrea
L. Petro and John Perlowski are the Class II Trustees of the Fund and will stand for re-election at the 2027 annual meeting of shareholders of the Fund. Maureen K. Usifer and Philip Tseng are Class III Trustees of the Fund and will stand for
re-election at the 2028 annual meeting of shareholders of the Fund.
Executive Officers Who are Not Trustees
Information regarding our executive officers who are not Trustees is as follows:
|
Name, Address*
and Year of Birth
|
Position(s) Held
with Fund
|
Term of Office
and Length of
Time Served
|
Principal Occupation(s) During
Past Five Years
|
No. of
Portfolios in
Fund
Complex
Overseen
|
Other Public
or Investment
Company
Directorships
Held by
Officer
|
|||||
|
Erik L. Cuellar
Year of birth: 1971
|
Chief Financial Officer and Treasurer
|
N/A; 2022 to present
|
Mr. Cuellar is the Chief Financial Officer of the Fund, BlackRock TCP Capital Corp. and BlackRock Direct Lending Corp. He is responsible for financial and regulatory reporting. Mr. Cuellar has been at
BlackRock and, before that, Tennenbaum Capital Partners, LLC, since 2011. Prior to his current role, Mr. Cuellar served as Controller for Ares Capital Corporation. Prior to that, Mr. Cuellar was with Metropolitan West Asset Management where
he served as the Assistant Treasurer and Principal Accounting Officer for the Metropolitan West Funds. Prior to that, Mr. Cuellar managed the Alternative Investments Group at Western Asset Management Company. Mr. Cuellar began his career
with Deloitte & Touche LLP where he was a Senior Auditor in their Financial Services Group. Mr. Cuellar earned a B.S. in Accounting from California State University Northridge and is a Certified Public Accountant in California.
|
N/A
|
N/A
|
|||||
|
Patrick Wolfe
Year of birth: 1982
|
Chief Operating Officer
|
N/A; 2022 to present
|
Patrick Wolfe is the Chief Operating Officer of the Fund, BlackRock TCP Capital Corp. and BlackRock Direct Lending Corp. He is also a Senior Portfolio Manager within BlackRock’s Private Financing Solutions
(PFS) platform. He is Head of Portfolio Construction for U.S. Private Capital’s U.S. Direct Lending funds which includes overseeing allocations, portfolio positioning, and liability management. Mr. Wolfe is also Head of U.S. middle-market
CLOs at BlackRock. Mr. Wolfe joined BlackRock through the acquisition of Tennenbaum Capital Partners, LLC. At Tennenbaum Capital Partners, LLC, Mr. Wolfe was a portfolio manager on the U.S. Direct Lending Funds and launched the
middle-market CLO platform taking the business to over $1 billion of assets. He also co-led the development of the firm’s proprietary private credit software platform. He was one of the creators of the Direct Lending fund structure designed
for insurance company clients. Before Tennenbaum Capital Partners, LLC, Mr. Wolfe was in structured credit at Deutsche Bank for six years focusing on the structuring, issuance, and management of CLOs and other credit strategies. He began
his career in 2006 at KSJG LLP in the Advisory group focused on mortgage banking. Mr. Wolfe earned a B.S. in Accounting from San Diego State University in 2006. Mr. Wolfe volunteers his time as a member of the Board of Directors for the
Southern California Golf Association (“SCGA”) and Southern California Golf Association Junior Foundation.
|
N/A
|
N/A
|
|
Name, Address*
and Year of Birth
|
Position(s) Held
with Fund
|
Term of Office
and Length of
Time Served
|
Principal Occupation(s) During
Past Five Years
|
No. of
Portfolios in
Fund
Complex
Overseen
|
Other Public
or Investment
Company
Directorships
Held by
Officer
|
|||||
|
Charles C. S. Park
Year of birth: 1967
|
Chief Compliance Officer
|
N/A; July 2025 to present
|
Mr. Park is the Chief Compliance Officer of the Fund, BlackRock TCP Capital Corp. and BlackRock Direct Lending Corp., and Chief Compliance Officer of the Investment Adviser and the Sub-Adviser. He is also the
Chief Compliance Officer of other BlackRock US-registered investment advisers since 2014; Principal of and Chief Compliance Officer for iShares® Delaware Trust
Sponsor LLC since 2012 and BlackRock Fund Advisors (“BFA”) since 2006; Chief Compliance Officer for BlackRock Asset Management International Inc. since 2012; Chief Compliance Officer of the Fund from 2018 to February 2024; Chief Compliance
Officer of the BlackRock-advised Funds in the BlackRock Multi-Asset Complex and the BlackRock Fixed-Income Complex from 2014 to 2023; Chief Compliance Officer for the BFA-advised iShares® exchange traded funds from 2006 to 2023.
|
N/A
|
N/A
|
|||||
|
Jason Mehring
Year of birth: 1971
|
President
|
N/A; 2024 to present
|
Mr. Mehring is the President of the Fund, BlackRock TCP Capital Corp. and BlackRock Direct Lending Corp. Mr. Mehring is a senior member of the investment team within BlackRock’s Private Financing Solutions
(PFS) platform. Mr. Mehring plays a leadership role in the evaluation, structuring, and execution of private secured investments in U.S. core middle market companies. Mr. Mehring has over 30 years’ experience in middle market investing
including his 20 years’ experience with the BlackRock team, joining as a Managing Director at BlackRock Capital Investment Corporation’s former advisor in 2005. Mr. Mehring previously spent more than ten years at Banc of America Capital
Investors (BACI), an affiliate of Bank of America, Inc., in Chicago, where he held positions of increasing responsibility, becoming a Principal of the firm in 2000. At BACI, Mr. Mehring focused on mezzanine and private equity investing in
middle market companies. Prior to joining BACI in 1994, he worked at Firstar Bank, a predecessor to U.S. Bank. Mr. Mehring holds an M.B.A from the Kellogg School of Management at Northwestern University and a B.B.A., summa cum laude, in
Finance and Economics from the University of Wisconsin Eau Claire (graduating with University Honors).
|
N/A
|
N/A
|
|
Name, Address*
and Year of Birth
|
Position(s) Held
with Fund
|
Term of Office
and Length of
Time Served
|
Principal Occupation(s) During
Past Five Years
|
No. of
Portfolios in
Fund
Complex
Overseen
|
Other Public
or Investment
Company
Directorships
Held by
Officer
|
|||||
|
Diana Huffman
Year of birth: 1982
|
General Counsel and Secretary
|
N/A; 2022 to present
|
Ms. Huffman is General Counsel and Secretary of the Fund and BlackRock Direct Lending Corp., and General Counsel, Secretary and Authorized Person of BlackRock TCP Capital Corp. Ms. Huffman also serves as
Secretary of HPS Net Income Lease REIT. Ms. Huffman previously served as General Counsel of BlackRock Capital Investment Corporation, a public BDC, prior to its merger with BlackRock TCP Capital Corp. in March 2024. As a part of BlackRock’s
Legal & Compliance department, Ms. Huffman is responsible for supporting BlackRock’s Private Financing Solutions (PFS) platform, with a focus on retail alternatives, advising on a broad array of legal and regulatory issues, including
product development and corporate governance matters. Prior to joining BlackRock in 2022, Ms. Huffman served as Corporate Counsel at PGIM Investments LLC starting in 2015, where she served as Chief Legal Officer for its BDC and as the lead
attorney for retail funds. From 2009 to 2015, Ms. Huffman was an associate in the Asset Management group at Willkie Farr & Gallagher LLP, where she focused on the organization and operation of private and regulated funds. Ms. Huffman
has a J.D. (cum laude) from Fordham University School of Law and a B.A. (summa cum laude) in International Relations from Boston University.
|
N/A
|
N/A
|
|
Name, Address*
and Year of Birth
|
Position(s) Held
with Fund
|
Term of Office
and Length of
Time Served
|
Principal Occupation(s) During
Past Five Years
|
No. of
Portfolios in
Fund
Complex
Overseen
|
Other Public
or Investment
Company
Directorships
Held by
Officer
|
|||||
|
Dan Worrell
Year of birth: 1963
|
Co-Chief Investment Officer
|
N/A; 2024 to present
|
Mr. Worrell serves as the Co-Chief Investment Officer of the Fund, BlackRock TCP Capital Corp. and BlackRock Direct Lending Corp. Mr. Worrell is a senior member of the investment team within BlackRock’s
Private Financing Solution (PFS) platform, where he is a leader in BlackRock’s U.S. core middle market direct lending strategy. In this capacity, Mr. Worrell is responsible for oversight of the strategy’s investment process and plays a
leadership role in the evaluation, structuring, and execution of private secured investments in U.S. core middle market companies. Prior to joining BlackRock, Mr. Worrell was a Managing Director at Tennenbaum Capital Partners, LLC, where he
led investment activity across several industry verticals, including Healthcare, Consumer Brands, Retail, and Consumer and Specialty Finance. Prior to Tennenbaum Capital Partners, LLC, Mr. Worrell was a High Yield Portfolio Manager with
Mulholland Capital Advisors. Mr. Worrell holds an M.B.A. from Columbia University and a B.S. from California State University, Northridge
|
N/A
|
N/A
|
| * |
The address for each executive officer is c/o BlackRock Capital Investment Advisors, LLC, 50 Hudson Yards, New York, New York, 10001.
|
Biographical Information
The following is information concerning the business experience of our Board of Trustees and executive officers. Our Trustees have been divided into two groups – interested Trustees and independent Trustees.
Interested Trustees are “interested persons” as defined in the 1940 Act.
Interested Trustees
John Perlowski, Senior Managing Director of BlackRock, is a Trustee of the Fund. Mr. Perlowski’s experience as Managing Director of BlackRock, Inc. since 2009,
as the Head of BlackRock Global Accounting and Product Services since 2009, and as a board member and officer of investment companies provides him with a strong understanding of the Fund, its operations, and the business and regulatory issues
facing the Fund. Mr. Perlowski also serves as President and Chief Executive Officer of other funds managed by the Investment Adviser and its affiliates. Mr. Perlowski has also served as Advisory Director of Family Resource Network (charitable
foundation) since 2009. Mr. Perlowski’s prior position as Managing Director and Chief Operating Officer of the Global Product Group at Goldman Sachs Asset Management, and his former service as Treasurer and Senior Vice President of the Goldman
Sachs Mutual Funds and as Director of the Goldman Sachs Offshore Funds provides the Board with the benefit of his experience with the management practices of other financial companies. Mr. Perlowski also serves as a board member for the funds in
the BlackRock Multi-Asset Complex and the BlackRock Fixed-Income Complex.
Philip Tseng, Managing Director of BlackRock, is a Trustee, Chairman of the Board, the Chief Executive Officer and
Co-Chief Investment Officer of the Fund. Mr. Tseng is a senior member of the investment team within BlackRock’s Private Financing Solutions (PFS) platform, where he leads BlackRock’s U.S. core middle market direct lending strategy. In this
capacity, Mr. Tseng is responsible for oversight of the strategy’s investment process and plays a leadership role in the evaluation, structuring, and execution of private secured investments in U.S. core middle market companies. Mr. Tseng also
serves as the Chairman, CEO and Co-CIO of BlackRock TCP Capital Corp. and BlackRock Direct Lending Corp. Prior to joining BlackRock, Mr. Tseng was a Managing Partner at Tennenbaum Capital Partners, LLC, where he was also a member of the Management
Committee. Prior to joining Tennenbaum Capital Partners, LLC, Mr. Tseng was a member of the Credit Suisse First Boston technology investment banking group focusing on technology and business services. While at CSFB, he advised on and executed
M&A, public and private equity and structured debt transactions for a broad range of small and large cap companies. He also spent time covering technology services companies as an equity research analyst. Prior to that, he spent time in
investment banking at Deutsche Banc Alex Brown. Mr. Tseng holds an M.B.A. from Harvard Business School and a B.A. (honors) in Economics from Harvard College.
Independent Trustees
Eric J. Draut is Lead Independent Trustee of the Fund. From 2022 to November 14, 2024, and since May 18, 2025, Mr. Draut has served as a member of the Fund’s
Audit Committee, a member of the Fund’s Governance and Compensation Committee, and a member of the Fund’s Joint Transactions Committee. From November 14, 2024 through May 18, 2025, Mr. Draut was an “interested person” (as defined in the 1940 Act)
of the Fund by virtue of his position as a director of a company that purchased debt securities issued by the Fund. The Fund’s Board of Trustees benefits from Mr. Draut’s nearly 30-year career in accounting and finance. Mr. Draut completed a
20-year career at Kemper Corporation (formerly Unitrin, Inc.) in 2010, serving the last nine years as Executive Vice President, Chief Financial Officer and a member of its board of directors. Mr. Draut also held positions at Kemper Corporation as
Group Executive, Treasurer and Corporate Controller. Prior to joining Kemper Corporation, Mr. Draut was Assistant Corporate Controller at Duchossois Industries, Inc. and at AM International, Inc. Mr. Draut began his career at Coopers and Lybrand
(now PricewaterhouseCoopers LLP). Mr. Draut is a Certified Public Accountant, received an M.B.A. in finance and operations from Kellogg Graduate School of Management at Northwestern University and a B.S. in accountancy from the University of
Illinois at Urbana-Champaign, graduating with High Honors. Until September 2013 Mr. Draut served as a Director and Chairman of the audit committee of Intermec. Mr. Draut is the Vice-Chair of the Board and the Chair of the Audit Committee of
Thrivent Financial for Lutherans, a registered investment adviser and Fortune 500 Company. In February 2015 Mr. Draut was also appointed to the Board of Holy Family Ministries, operator of Holy Family School, where he served as the Interim Chief
Executive Officer from 2017 to 2018 and currently serves as Chair of the Board. From August 2022 until December 2025, Mr. Draut served as a trustee of the ELCA Foundation. Mr. Draut volunteers with Lutheran Social Services of Illinois where he
currently serves as chairman emeritus of the Board of Directors and has served as Executive Chairman of its Board of Directors. Mr. Draut is also a National Association of Corporate Directors Fellow. Mr. Draut’s knowledge of financial and
accounting matters, and his independence from the Fund and the Investment Adviser, qualifies him to serve as a member of the Fund’s Audit Committee.
Andrea L. Petro is a Trustee of the Fund, Chair of the Fund’s Governance and Compensation Committee, a member of the Audit Committee, and a member of the Joint
Transactions Committee. Ms. Petro also serves as a Director of BlackRock TCP Capital Corp. and currently serves as Chair of its Governance and Compensation Committee and a member of its Audit Committee and Joint Transactions Committee. From
November 2024 to present, Ms. Petro has served as a Senior Advisor to Carob Financial, LLC, a private credit fund. From June 2020 to June 2024, Ms. Petro served as a Director of Ready Capital Corporation. From June 2018 to February 2020, Ms. Petro
served as Managing Director and Group Head of the Specialty Commercial Finance Group of Waterfall Asset Management. Ms. Petro served as a consultant for Waterfall Asset Management from March 2020 through February 2023. Ms. Petro previously worked
at Wells Fargo Capital Finance from December 2000 to December 2017 as the Executive Vice President and Group Head of the Lender Finance Division and Supply Chain Finance Division. Ms. Petro currently serves as a member of the MS Finance Advisory
Board of the McCombs School of Business at the University of Texas at Austin from December 2015 to December 2025. She also served as the President of the Commercial Finance Association from 2016 to 2017 and previously served as a member of the
Secured Finance Foundation board of directors from 2000 to 2022. Ms. Petro holds a Master of Business Administration degree in finance from the McCombs School of Business at the University of Texas and a Bachelor of Arts degree with a concentration
in Russian and Soviet Studies from Kent State University. Ms. Petro’s knowledge of financial and accounting matters qualifies her to serve as a member of the Fund’s Audit Committee.
Maureen K. Usifer is a Trustee of the Fund, Chair of the Fund’s Audit Committee, a member of the Governance and Compensation Committee, and a member of the
Joint Transactions Committee. Ms. Usifer also serves as a Director, Chair of the Audit Committee, and a member of the Joint Transactions Committee of each of BlackRock TCP Capital Corp. and BlackRock Direct Lending Corp., and a member of the
Governance and Compensation Committee of BlackRock TCP Capital Corp. From 2005 until its merger with and into a wholly-owned subsidiary of BlackRock TCP Capital Corp. on March 18, 2024, Ms. Usifer was a Director of BlackRock Capital Investment
Corporation. Since 2021, Ms. Usifer has served as a Director for PC Construction. From 2024 to present, Ms. Usifer has served as a Director for Charlotte’s Web. From 2021 to present, Ms. Usifer has served as a Director for PC Construction. Since
2018, Ms. Usifer has been a Director of Liberty All Star Funds. Ms. Usifer was a member of the Green Mountain Care Board, a regulatory board appointed by the Governor in Vermont responsible for approving hospital budgets, insurance rates and
capital projects, from 2017 to 2021. Ms. Usifer served as CFO of Seventh Generation Inc., a distributor of its brand of household and personal care products, from 2012 to 2016. From 1996 to 2012, Ms. Usifer served in various roles with Church &
Dwight Co., Inc. (“Church & Dwight”), a major producer of baking soda and consumer products. Ms. Usifer served as Vice President of Investor Relations, Senior Finance Director, Divisional CFO and controller during her tenure at Church &
Dwight. Ms. Usifer received an undergraduate degree in business from St. Michael’s College and an M.B.A. in Finance from Clarkson University. Ms. Usifer’s prior board service, in addition to her roles as an Independent Director of BlackRock TCP
Capital Corp. and BlackRock Direct Lending Corp., provides her with specific understanding of the Fund, its operations and the business and regulatory issues facing BDCs. Ms. Usifer’s independence from the Fund enhances her service as Chair of the
Fund’s Audit Committee and member of other Board committees.
Executive Officers Who Are Not Trustees
Erik L. Cuellar, Director of BlackRock, is the Chief Financial Officer of the Fund, BlackRock TCP Capital Corp., and BlackRock Direct Lending Corp. Mr. Cuellar
has been at BlackRock and, before that, Tennenbaum Capital Partners, LLC, since 2011. Prior to his current role, Mr. Cuellar served as Controller for Ares Capital Corporation. Prior to that, Mr. Cuellar was with Metropolitan West Asset Management
where he served as the Assistant Treasurer and Principal Accounting Officer for the Metropolitan West Funds. Prior to that, Mr. Cuellar managed the Alternative Investments Group at Western Asset Management Company. Mr. Cuellar began his career with
Deloitte & Touche LLP where he was a Senior Auditor in their Financial Services Group. Mr. Cuellar earned a B.S. in Accounting from California State University Northridge and is a Certified Public Accountant in California.
Patrick Wolfe, Managing Director of BlackRock, is the Chief Operating Officer of the Fund, BlackRock TCP Capital Corp. and BlackRock Direct Lending Corp. He is
also a Senior Portfolio Manager within BlackRock’s Private Financing Solutions (PFS) platform. Mr. Wolfe is Head of Portfolio Construction for U.S. Private Capital’s U.S. Direct Lending funds which includes overseeing allocations, portfolio
positioning, and liability management. Mr. Wolfe is also Head of U.S. middle-market CLOs at BlackRock. Mr. Wolfe joined BlackRock through the acquisition of Tennenbaum Capital Partners, LLC. At Tennenbaum Capital Partners, LLC, Mr. Wolfe was a
portfolio manager on the U.S. Direct Lending Funds and launched the middle-market CLO platform taking the business to over $1 billion of assets. He also co-led the development of the firm’s proprietary private credit software platform. He was one
of the creators of the Direct Lending fund structure designed for insurance company clients. Before Tennenbaum Capital Partners, LLC CP, Mr. Wolfe was in structured credit at Deutsche Bank for six years focusing on the structuring, issuance, and
management of CLOs and other credit strategies. He began his career in 2006 at KSJG LLP in the Advisory group focused on mortgage banking. Mr. Wolfe earned a B.S. in Accounting from San Diego State University in 2006. Mr. Wolfe volunteers his time
as a member of the Board of Directors for the Southern California Golf Association (“SCGA”) and Southern California Golf Association Junior Foundation.
Charles C. S. Park, Managing Director of BlackRock, is the Chief Compliance Officer of the Fund and Chief Compliance Officer of the Investment Adviser and the
Sub-Adviser of the Fund. Mr. Park is also the Chief Compliance Officer to BlackRock TCP Capital Corp. and BlackRock Direct Lending Corp. Mr. Park has served as Chief Compliance Officer of certain BlackRock US-registered investment advisers since
2014; Principal of and Chief Compliance Officer for iShares® Delaware Trust Sponsor LLC since 2012 and BlackRock Fund Advisors (“BFA”) since 2006; Chief Compliance
Officer for BlackRock Asset Management International Inc. since 2012; Chief Compliance Officer of the Fund from 2018 to February 2024; Chief Compliance Officer of the BlackRock-advised Funds in the BlackRock Multi-Asset Complex and the BlackRock
Fixed-Income Complex from 2014 to 2023; Chief Compliance Officer for the BFA-advised iShares® exchange traded funds from 2006 to 2023.
Jason Mehring, Managing Director of BlackRock, is the President of the Fund, BlackRock TCP Capital Corp. and BlackRock Direct Lending Corp. Mr. Mehring is a
senior member of the investment team and an investment committee member within BlackRock’s Private Financing Solutions (PFS) platform. Mr. Mehring plays a leadership role in the evaluation, structuring, and execution of private secured investments
in U.S. core middle market companies. Mr. Mehring has over 30 years’ experience in middle market investing including his 20 years’ experience with the BlackRock team, joining as a Managing Director at BlackRock Capital Investment Corporation’s
former advisor in 2005. Mr. Mehring previously spent more than ten years at Banc of America Capital Investors (BACI), an affiliate of Bank of America, Inc., in Chicago, where he held positions of increasing responsibility, becoming a Principal of
the firm in 2000. At BACI, Mr. Mehring focused on mezzanine and private equity investing in middle market companies. Prior to joining BACI in 1994, he worked at Firstar Bank, a predecessor to U.S. Bank. Mr. Mehring holds an M.B.A from the Kellogg
School of Management at Northwestern University and a B.B.A., summa cum laude, in Finance and Economics from the University of Wisconsin Eau Claire (graduating with University Honors).
Diana Huffman, Executive Director of BlackRock, serves as General Counsel and Secretary of the Fund and BlackRock Direct Lending Corp. and General Counsel,
Secretary, and Authorized Person of BlackRock TCP Capital Corp. Ms. Huffman also serves as Secretary of HPS Net Income Lease REIT. Ms. Huffman previously served as General Counsel for BlackRock Capital Investment Corporation, a public BDC, prior to
its merger with BlackRock TCP Capital Corp. in March 2024. As part of BlackRock’s Legal & Compliance department, Ms. Huffman is responsible for supporting BlackRock’s Private Financing Solutions (PFS) platform, with a focus on retail
alternatives, advising on a broad array of legal and regulatory issues, including product development and corporate governance matters. Prior to joining BlackRock in 2022, Ms. Huffman served as Corporate Counsel at PGIM Investments LLC starting in
2015, where she served as Chief Legal Officer for its BDC and as the lead attorney for retail funds. From 2009 to 2015, Ms. Huffman was an associate in the Asset Management group at Willkie Farr & Gallagher LLP, where she focused on the
organization and operation of private and regulated funds. Ms. Huffman has a J.D. (cum laude) from Fordham University School of Law and a B.A. (summa cum laude) in International Relations from Boston University.
Dan Worrell, Managing Director of BlackRock, is Co-Chief Investment Officer of the Fund, BlackRock TCP Capital Corp. and BlackRock Direct Lending Corp. Mr.
Worrell is a senior member of the investment team within BlackRock’s Private Financing Solution (PFS) platform, where he is a leader in BlackRock’s U.S. core middle market direct lending strategy. In this capacity, Mr. Worrell is responsible for
oversight of the strategy’s investment process and plays a leadership role in the evaluation, structuring, and execution of private secured investments in U.S. core middle market companies. Prior to joining BlackRock, Mr. Worrell was a Managing
Director at Tennenbaum Capital Partners, LLC, where he led investment activity across several industry verticals, including Healthcare, Consumer Brands, Retail, and Consumer and Specialty Finance. Prior to Tennenbaum Capital Partners, LLC, Mr.
Worrell was a High Yield Portfolio Manager with Mulholland Capital Advisors. Mr. Worrell holds an M.B.A. from Columbia University and a B.S. from California State University, Northridge.
Communications with Trustees
Shareholders and other interested parties may communicate with the Board of Trustees or any Trustee by mail addressed to the Board of Trustees or the Trustee(s) with whom they wish to communicate by either name or
title. All such correspondence should be sent c/o Secretary of the Fund at 50 Hudson Yards, New York, New York 10001.
Committees of the Board of Trustees
Our Board of Trustees currently has three committees: an Audit Committee, a Governance and Compensation Committee and a Joint Transactions Committee.
Audit Committee. The Audit Committee operates pursuant to a charter approved by the Board of Trustees. The Audit
Committee currently holds regular meetings on a quarterly basis and special meetings as needed. The charter sets forth the responsibilities of the Audit Committee and can be accessed at www.bdebt.com, then clicking “Audit Committee charter” under
the Resources Tab. The primary function of the Audit Committee is to serve as an independent and objective party to assist the Board of Trustees in fulfilling its responsibilities for overseeing all material aspects of the Fund’s accounting and
financial reporting processes, monitoring the independence and performance of the Fund’s independent registered public accounting firm, providing a means for open communication among the Fund’s independent accountants, financial and senior
management and the Board of Trustees, and overseeing the Fund’s compliance with legal and regulatory requirements. The Audit Committee is presently composed of Eric Draut, Andrea L. Petro, and Maureen K. Usifer (Chair), each of whom is considered
independent for purposes of the 1940 Act. The Board of Trustees has determined that each member of our Audit Committee is an “audit committee financial expert” as defined under Item 407(d)(5) of Regulation S-K of the Exchange Act. In addition, each
member of our Audit Committee meets the current independence and experience requirements of Rule 10A-3 of the Exchange Act and, in addition, is not an “interested person” of the Fund or of the Advisers as defined in Section 2(a)(19) of the 1940
Act. During the Fund’s fiscal year ended December 31, 2025, the Audit Committee met four times.
Governance and Compensation Committee. The Governance and Compensation Committee operates pursuant to a charter
approved by the Board of Trustees. The charter sets forth the responsibilities of the Governance and Compensation Committee, including, but not limited to, making nominations for the appointment or election of Independent Trustees, personnel
training policies, administering the provisions of the code of ethics applicable to the Independent Trustees and determining, or recommending to the Board of Trustees for determination, the compensation of any officers of the Fund. The charter can
be accessed at www.bdebt.com. Currently the Fund’s officers do not receive any direct compensation from the Fund. The Governance and Compensation Committee is presently composed of Eric Draut, Andrea L. Petro (Chair) and Maureen K. Usifer, each of
whom is considered independent for purposes of the 1940 Act. During the Fund’s fiscal year ended December 31, 2025, the Governance and Compensation Committee met two times.
Joint Transactions Committee. The Joint Transactions Committee is comprised of Eric Draut, Andrea L. Petro, and
Maureen K. Usifer. The Joint Transactions Committee operates to approve the allocation of certain private placement transactions in which the Fund participates with one or more of the Investment Adviser’s other accounts in accordance with an
exemptive order obtained from the SEC. During the Fund’s fiscal year ended December 31, 2025, the Joint Transactions Committee met five times.
Compensation of Trustees
The Fund is authorized to pay each Independent Trustee the following amounts for serving as a Trustee: (i) an annual retainer of (a) $50,000 per year for each year in which the Fund’s net asset value is $1 billion or
less, (b) $75,000 per year for each year in which the Fund’s net asset value is between $1 billion and $2 billion, or (c) $100,000 per year for each year in which the Fund’s net asset value is greater than $2 billion (in each case, prorated for any
partial calendar year for which a Trustee serves); (ii) $2,500 for each regular meeting of the Board of Trustees of the Fund attended by such Trustee; (iii) $250 for each special meeting of the Board of Trustees attended by such Trustee at which
such Trustee is asked to vote on a proposal solely related to the declaration of a dividend for the Fund; (iv) $1,000 for each meeting of a committee of the Board of Trustees, other than the Joint Transactions Committee, attended by such Trustee;
(v) $500 for each meeting of the Joint Transactions Committee of the Board of Trustees attended by such Trustee; (vi) a supplemental retainer at the annual rate of $7,500 per year for the Audit Committee Chair; (vii) a supplemental retainer at the
annual rate of $5,000 per year for the Governance and Compensation Committee Chair; and (viii) for each special meeting of the Board with a limited agenda attended by such Independent Trustee (whether in person or telephonic), (a) $500 per meeting
if, at the time of such meeting, the Fund’s net asset value is $1 billion or less, (b) $750 per meeting if, at the time of such meeting, the Fund’s net asset value is between $1 billion and $2 billion, or (c) $1,000 per meeting if, at the time of
such meeting, the Fund’s net asset value is greater than $2 billion.
Staffing
We do not currently have any employees and do not expect to have any employees. Services necessary for our business are provided by individuals who are employees of the Investment Adviser, pursuant to the terms of
the Advisory Agreement. Our day-to-day investment operations are managed by our Advisers. In addition, we reimburse the Administrator for our allocable portion of expenses incurred by it in performing its obligations under the Administration
Agreement, including our allocable portion of the cost of our officers and their respective staffs.
Compensation of Executive Officers
None of the officers receive compensation from the Fund. The compensation of the officers is paid by the Investment Adviser or through distributions from the Administrator. A portion of such compensation may be
reimbursed by the Fund for the cost to the Investment Adviser or the Administrator of administrative services rendered by such officer on behalf of the Fund.
Means by Which the Board of Trustees Supervises Executive Officers
The Board of Trustees is regularly informed on developments and issues related to the business of the Fund, and monitors the activities and responsibilities of the officers in various ways. At each regular meeting of
the Board of Trustees, the officers report to the Board of Trustees on developments and important issues. Each of the officers, as applicable, also provides regular updates to the members of the Board of Trustees regarding the Fund’s business
between the dates of regular meetings of the Board of Trustees. Officers and other members of the Advisers, at the invitation of the Board of Trustees, regularly attend portions of meetings of the Board of Trustees and its committees to report on
the financial results of the Fund, its operations, performance and outlook, and on areas of the business within their responsibility, including risk management and management information systems, as well as other business matters.
The Board of Trustees’ Role in Risk Oversight
Day-to-day risk management with respect to the Fund is the responsibility of the Advisers or other service providers (depending on the nature of the risk) subject to the supervision of the Board of Trustees. The Fund
is subject to a number of risks, including investment, compliance, operational and valuation risks, among others. While there are a number of risk management functions performed by the Advisers and the other service providers, as applicable, it is
not possible to eliminate all of the risks applicable to the Fund. Risk oversight is part of the Board of Trustees’ general oversight of the Fund and is addressed as part of various Board of Trustees and committee activities. The Board of Trustees,
directly or through a committee, also reviews reports from, among others, management, the independent registered public accounting firm for the Fund and internal accounting personnel for the Advisers, as appropriate, regarding risks faced by the
Fund and management’s or the service provider’s risk functions. The committee system facilitates the timely and efficient consideration of matters by the Trustees, and facilitates effective oversight of compliance with legal and regulatory
requirements and of the Fund’s activities and associated risks. The Fund’s Chief Compliance Officer oversees the implementation and testing of the Fund’s compliance program and reports to the Board of Trustees regarding compliance matters for the
Fund and its service providers. The Independent Trustees have engaged independent legal counsel to assist them in performing their oversight responsibilities.
Delaware Trustee
The Corporation Trust Company (the “Delaware Trustee”) serves as a Trustee for the sole purpose of satisfying the requirement under the Delaware Statutory Trust Act to have at least one trustee that has its principal
place of business in the State of Delaware. The Delaware Trustee’s principal offices are located at Corporation Trust Center, 1209 Orange Street, Wilmington, Delaware 19801. The Delaware Trustee is unaffiliated with us. The Delaware Trustee’s
duties and liabilities with respect to the offering of our Common Shares and the management of the Fund are limited to its express obligations under our Declaration of Trust.
The rights and duties of the Delaware Trustee are governed by the provisions of the Delaware Statutory Trust Act and by our Declaration of Trust. The duties of the Delaware Trustee are limited to (i) accepting legal
process served on the Fund in the state of Delaware and (ii) the execution of any certificates required to be filed with the Delaware Secretary of State, which the Delaware Trustee is required to execute under the Delaware Statutory Trust Act. The
Delaware Trustee does not owe any other duties to us or our shareholders.
The Declaration of Trust provides that the Delaware Trustee is permitted to resign upon at least 30 days’ notice to us, provided that any such resignation will not be effective until a successor trustee is appointed
by our Board of Trustees or a court of competent jurisdiction, or a successor is appointed by a court of competent jurisdiction pursuant to a court petition by the Delaware Trustee. The Delaware Trustee may be removed by the Trustees upon 30 days’
prior written notice to the Delaware Trustee.
The Declaration of Trust provides that the Delaware Trustee is compensated by us in accordance with a separate fee agreement, and is indemnified by us against any and all from and against any and all claims, actions,
suits, demands, assessments, judgments, losses, liabilities, damages, costs, taxes, and expenses, including reasonable fees and expenses of counsel, to the extent that such expenses arise out of or are imposed upon or asserted at any time against
the Delaware Trustee with respect to the performance of any duties contemplated by the Declaration of Trust or from the services provided or functions performed by the Delaware Trustee, provided, however, that we shall not be required to indemnify
the Delaware Trustee for any expenses which are a result of the willful misfeasance, bad faith, gross negligence, or reckless disregard of the duties involved in the conduct of its position as Delaware Trustee.
The Delaware Trustee shall not be liable for supervising or monitoring the performance and the duties and obligations of any other person, including, without limitation, the Trustees or the Fund under the Declaration
of Trust or any related document.
BlackRock Capital Investment Advisors, LLC serves as our investment adviser and BlackRock Advisors, LLC serves as our sub-adviser. The Investment Adviser and the Sub Adviser are registered as investment advisers
under the Advisers Act. The Investment Adviser has served as a registered investment adviser for over five years. Subject to the overall supervision of our Board of Trustees, the Investment Adviser manages the day-to-day operations of, and provide
investment advisory and management services to, us. The Sub Adviser performs certain of the day-to-day investment management of the Fund. The Sub-Adviser will be primarily responsible for the Fund’s investments in liquid investments, including
liquid investments held during the period of time that the Fund is investing the proceeds of this offering in accordance with its investment strategy.
The Investment Adviser
Investment Committee
Investment opportunities and follow-on investments in existing portfolio companies will generally require approval by a majority of the Voting Members of the Investment Committee. The Investment Committee meets
regularly to consider our investments, direct our strategic initiatives and supervise the actions taken by the Investment Adviser on our behalf. In addition, the Investment Committee reviews and determines whether to make prospective investments
identified by the Investment Adviser and monitors the performance of our investment portfolio. The day-to-day management of investments approved by the Investment Committees will be overseen by investment personnel.
Voting Members
The persons with the most significant responsibility for the day-to-day management of the Fund’s portfolio are the permanent Voting Members of the Investment Committee. The permanent Voting Members of the Investment
Committee are:
Philip Tseng, Managing Director.
Mr. Tseng is a Trustee, Chairman of the Board, the Chief Executive Officer and Co-Chief Investment Officer of the Fund, BlackRock TCP Capital Corp. and BlackRock Direct Lending Corp. Mr. Tseng is a senior member of
the investment team within BlackRock’s Private Financing Solutions (PFS) platform, where he leads BlackRock’s U.S. core middle market direct lending strategy. In this capacity, Mr. Tseng is responsible for oversight of the strategy’s investment
process and plays a leadership role in the evaluation, structuring, and execution of private secured investments in U.S. core middle market companies. Prior to joining BlackRock, Mr. Tseng was a Managing Partner at Tennenbaum Capital Partners, LLC, where he was also a member of the Management Committee. Prior to joining Tennenbaum Capital Partners, LLC, Mr. Tseng was a member of the Credit Suisse First
Boston technology investment banking group focusing on technology and business services. While at CSFB, he advised on and executed M&A, public and private equity and structured debt transactions for a broad range of small and large cap
companies. He also spent time covering technology services companies as an equity research analyst. Prior to that, he spent time in investment banking at Deutsche Banc Alex Brown. Mr. Tseng holds an M.B.A. from Harvard Business School and a B.A.
(honors) in Economics from Harvard College.
Jason Mehring, Managing Director.
Mr. Mehring is the President of the Fund, BlackRock TCP Capital Corp. and BlackRock Direct Lending Corp. Mr. Mehring is a senior member of the investment team and an investment committee member within BlackRock’s
Private Financing Solutions (PFS) platform. Mr. Mehring plays a leadership role in the evaluation, structuring, and execution of private secured investments in U.S. core middle market companies. Mr. Mehring has over 30 years’ experience in middle
market investing including his 20 years’ experience with the BlackRock team, joining as a Managing Director at BlackRock Capital Investment Corporation’s former advisor in 2005. Mr. Mehring previously spent more than ten years at Banc of America
Capital Investors (BACI), an affiliate of Bank of America, Inc., in Chicago, where he held positions of increasing responsibility, becoming a Principal of the firm in 2000. At BACI, Mr. Mehring focused on mezzanine and private equity investing in
middle market companies. Prior to joining BACI in 1994, he worked at Firstar Bank, a predecessor to U.S. Bank. Mr. Mehring holds an M.B.A from the Kellogg School of Management at Northwestern University and a B.B.A., summa cum laude, in Finance and
Economics from the University of Wisconsin Eau Claire (graduating with University Honors).
Dan Worrell, Managing Director.
Mr. Worrell is Co-Chief Investment Officer of the Fund, BlackRock TCP Capital Corp. and BlackRock Direct Lending Corp. Mr. Worrell is a senior member of the investment team within BlackRock’s Private Financing
Solution (PFS) platform, where he is a leader in BlackRock’s U.S. core middle market direct lending strategy. In this capacity, Mr. Worrell is responsible for oversight of the strategy’s investment process and plays a leadership role in the
evaluation, structuring, and execution of private secured investments in U.S. core middle market companies. Prior to joining BlackRock, Mr. Worrell was a Managing Director at Tennenbaum Capital Partners, LLC
where he led investment activity across several industry verticals, including Healthcare, Consumer Brands, Retail, and Consumer and Specialty Finance. Prior to Tennenbaum Capital Partners, LLC, Mr. Worrell
was a High Yield Portfolio Manager with Mulholland Capital Advisors. Mr. Worrell holds an M.B.A. from Columbia University and a B.S. from California State University, Northridge.
Vikas Keswani, Managing Director.
Mr. Keswani is a senior member of the investment team within BlackRock’s Private Financing Solutions (PFS) platform. He is also Head of Direct Lending at HPS, a part of BlackRock. In this capacity, Mr. Keswani plays
a leadership role in sourcing, evaluating, structuring, and executing private senior secured investments across a variety of industries. Prior to joining HPS in 2010, Mr. Keswani spent a majority of his career at BlackRock, where he was a part of
the initial team that established, structured and capitalized BlackRock Capital Investment Corporation (NASDAQ: BKCC), a publicly traded private investment vehicle. Mr. Keswani is a CFA charterholder and holds a BSE, magna cum laude, from The
Wharton School at the University of Pennsylvania.
Michael Fenstermacher, Managing Director.
Mr. Fenstermacher is a senior member of the investment team within BlackRock’s Private Financing Solution (PFS) platform. He is also Co-Head of North American Core Senior Lending at HPS, a part of BlackRock. In this
capacity, Mr. Fenstermacher plays a leadership role in sourcing, evaluating, structuring, and executing private senior secured investments across a variety of industries. Prior to joining HPS in 2008, Mr. Fenstermacher was an Associate at
JPMorgan’s Leveraged Finance Group, where he originated, underwrote and distributed high yield bonds and leveraged loans. During his four years with JPMorgan, Mr. Fenstermacher specialized in financial sponsor transactions. Prior to joining
JPMorgan, Mr. Fenstermacher spent two years at Bank One as a Credit Analyst in the Automotive and Financial Institutions groups. Mr. Fenstermacher holds a BS from Indiana University.
Grishma Parekh, Managing Director.
Ms. Parekh is a senior member of the investment team within BlackRock’s Private Financing Solutions (PFS) platform. She is also Co-Head of North American Core Senior Lending at HPS, a part of BlackRock, as well as
the President of HPS Corporate Lending Fund, a non-traded BDC managed by HPS. In this capacity, Ms. Parekh plays a leadership role in sourcing, evaluating, structuring, and executing private senior secured investments across a variety of
industries. Prior to joining HPS in 2020, Ms. Parekh spent over twelve years as a Partner and Managing Director at The Carlyle Group. During her tenure at The Carlyle Group, Ms. Parekh was a founding member of the Direct Lending platform, served as
Head of Origination for Illiquid Credit, and was a member of the Investment Committee for the Direct Lending business. Prior to joining The Carlyle Group in 2007, Ms. Parekh was an Investment Banking Associate at JPMorgan where she was responsible
for originating, structuring and executing high yield bond and leveraged loan transactions. Ms. Parekh holds a BS in Finance and Information Systems from the Stern School of Business at New York University.
Material conflicts of interest may arise in connection with the permanent Voting Members’ management of the Fund’s investments, on the one hand, and the investments of the Other Client Accounts, on the other.
Each permanent Voting Member receives a fixed salary from the Investment Adviser. Additionally, each permanent Voting Member may receive a performance-based discretionary bonus, the opportunity to participate in
various benefits programs and the opportunity to participate in one or more of the incentive compensation programs established by BlackRock.
The discussion below describes the permanent Voting Members’ compensation as of December 31, 2025.
BlackRock’s financial arrangements with the permanent Voting Members, its competitive compensation and its career path emphasis at all levels reflect the value senior management places on key resources. Compensation
may include a variety of components and may vary from year to year based on a number of factors. The principal components of compensation include a base salary, a performance-based discretionary bonus, participation in various benefits programs and
one or more of the incentive compensation programs established by BlackRock.
Base Compensation. Generally, the permanent Voting Members receive base compensation based on their position with the firm.
Discretionary Incentive Compensation. Discretionary incentive compensation is a function of several components: the performance of BlackRock, Inc., the performance of the
permanent Voting Member’s group within BlackRock, the investment performance, including risk-adjusted returns, of the firm’s assets under management or supervision by that permanent Voting Member, and the individual’s performance and contribution
to the overall performance of these portfolios and BlackRock.
Discretionary incentive compensation is generally distributed to permanent Voting Members in a combination of cash deferred BlackRock, Inc. stock awards, deferred cash and/or deferred cash awards that notionally
track the return of certain BlackRock investment products.
Permanent Voting Members receive their annual discretionary incentive compensation in the form of cash. Permanent Voting Members whose total compensation is above a specified threshold also receive deferred
BlackRock, Inc. stock awards annually as part of their discretionary incentive compensation. Paying a portion of discretionary incentive compensation in the form of deferred BlackRock, Inc. stock puts compensation earned by a permanent Voting
Member for a given year “at risk” based on BlackRock’s ability to sustain and improve its performance over future periods. In some cases, additional deferred BlackRock, Inc. stock may be granted to certain key employees as part of a long-term
incentive award to aid in retention, align interests with long-term shareholders and motivate performance. Deferred BlackRock, Inc. stock awards are generally granted in the form of BlackRock, Inc. restricted stock units that vest pursuant to the
terms of the applicable plan and, once vested, settle in BlackRock, Inc. common stock. The permanent Voting Members of the Fund are eligible to receive deferred BlackRock, Inc. stock awards.
For certain permanent Voting Members, a portion of the discretionary incentive compensation is also distributed in the form of deferred cash or deferred cash awards that notionally track the returns of select
BlackRock investment products they manage, which provides direct alignment of permanent Voting Member discretionary incentive compensation with investment product results. Deferred cash awards vest ratably over a number of years and, once vested,
settle in the form of cash. Only permanent Voting Members who manage specified products and/or whose total compensation is above a specified threshold are eligible to participate in the deferred cash award program.
Other Compensation Benefits. In addition to base salary and discretionary incentive compensation, voting Members may be eligible to receive or participate in one or more of
the following:
Incentive Savings Plans. BlackRock, Inc. has created a variety of incentive savings plans in which BlackRock, Inc. employees are eligible to participate, including a 401(k) plan, the BlackRock Retirement Savings Plan
(RSP), and the BlackRock Employee Stock Purchase Plan (ESPP).
Other Accounts Managed
The information below lists the number of other accounts for which each permanent Voting Member was primarily responsible for the day-to-day management as of December 31, 2025.
|
Name of
permanent Voting
Member
|
Type of Accounts
|
Total No. of Other
Accounts Managed
|
Total Other Assets
(in Millions)
|
No. of Other
Accounts where
Advisory Fee is
Based on
Performance
|
Total Assets in
Other Accounts
where Advisory Fee
is Based on
Performance (in
Millions)
|
|||||||||||||
|
Philip Tseng
|
Registered Investment Companies
|
3
|
$
|
3,970.35
|
3
|
$
|
3,970.35
|
|||||||||||
|
|
Other Pooled Investment Vehicles: |
34
|
12,861.91
|
33
|
12,595.37
|
|||||||||||||
|
|
Other Accounts:
|
4
|
511.47
|
2
|
163.65
|
|||||||||||||
|
Jason Mehring
|
Registered Investment Companies
|
3
|
3,970.35
|
3
|
3,970.35
|
|||||||||||||
|
|
Other Pooled Investment Vehicles: |
25
|
12,388.35
|
24
|
12,121.81
|
|||||||||||||
|
|
Other Accounts:
|
4
|
511.47
|
2
|
163.65
|
|||||||||||||
|
Dan Worrell
|
Registered Investment Companies
|
3
|
3,970.35
|
3
|
3,970.35
|
|||||||||||||
|
|
Other Pooled Investment Vehicles: |
34
|
12,861.91
|
33
|
12,595.37
|
|||||||||||||
|
|
Other Accounts: |
4
|
511.47
|
2
|
163.65
|
|||||||||||||
|
Vikas Keswani
|
Registered Investment Companies
|
3
|
3,970.35
|
3
|
3,970.35
|
|||||||||||||
|
|
Other Pooled Investment Vehicles: |
25
|
12,388.35
|
24
|
12,121.81
|
|||||||||||||
|
|
Other Accounts: |
4
|
511.47
|
2
|
163.65
|
|||||||||||||
|
Michael Fenstermacher
|
Registered Investment Companies
|
3
|
3,970.35
|
3
|
3,970.35
|
|||||||||||||
|
|
Other Pooled Investment Vehicles: |
25
|
12,388.35
|
24
|
12,121.81
|
|||||||||||||
|
|
Other Accounts:
|
4
|
511.47
|
2
|
163.65
|
|||||||||||||
|
Grishma Parekh
|
Registered Investment Companies
|
3
|
3,970.35
|
3
|
3,970.35
|
|||||||||||||
|
|
Other Pooled Investment Vehicles:
|
25
|
12,388.35
|
24
|
12,121.81
|
|||||||||||||
|
|
Other Accounts:
|
4
|
511.47
|
2
|
163.65
|
|||||||||||||
Ownership of Securities
The following table sets forth the dollar range of our equity securities held by each member of each Voting Member as of December 31, 2025.
|
Name and Address
|
Dollar Range of Equity
Securities in
BlackRock Private
Credit Fund(1)
|
|||
|
Philip Tseng
|
|
$10,001 - $50,000
|
||
|
Jason Mehring
|
|
$10,001 - $50,000
|
||
|
Dan Worrell
|
|
$50,001 - $100,000
|
||
|
Vikas Keswani
|
None
|
|||
|
Michael Fenstermacher
|
None
|
|||
|
Grishma Parekh
|
None
|
|||
| (1) |
The dollar range of equity securities beneficially owned are: none, $1 - $10,000, $10,001 - $50,000, $50,001 - $100,000, $100,001 - $500,000, $500,001 - $1,000,000 or over $1,000,000.
|
ADVISORY AGREEMENT, SUB-ADVISORY AGREEMENT AND ADMINISTRATION AGREEMENT
Advisory Agreement
BlackRock Capital Investment Advisors, LLC is located at 50 Hudson Yards, New York, New York, 10001. The Investment Adviser is registered as an investment adviser under the Advisers Act. The Investment Adviser is an
indirect subsidiary of BlackRock, Inc. BlackRock is the world’s largest publicly traded investment management firm, with $14 trillion of assets under management as of December 31, 2025. BlackRock manages assets on behalf of institutions and
individuals worldwide through a variety of equity, fixed income, real estate, cash management and alternative investment products. BlackRock serves clients in North and South America, Europe, Asia, Australia, Africa and the Middle East.
Headquartered in New York, BlackRock maintains offices in over 38 countries, including 25 primary investment centers. BlackRock’s institutional knowledge includes proprietary valuation techniques, market outlook, competitive evaluation and
structuring and operational expertise. In addition, BlackRock provides risk management, investment system outsourcing and financial advisory services to a growing number of institutional investors. Through BlackRock Solutions®, BlackRock provides
risk management and advisory services that combine capital markets expertise with internally-developed systems and technology.
Under the terms of the Advisory Agreement, the Investment Adviser:
| • |
determines the composition of the Fund’s portfolio, the nature and timing of the changes to the Fund’s portfolio and the manner of implementing such changes;
|
| • |
identifies, evaluates and negotiates the structure of the investments the Fund makes (including performing due diligence on prospective portfolio companies); and
|
| • |
closes, monitors and administers the investments the Fund makes, including the exercise of any voting or consent rights.
|
The Investment Adviser’s services under the Advisory Agreement are not exclusive, and it is free to furnish similar services to other entities so long as its services to the Fund are not impaired.
Pursuant to the Advisory Agreement, the Fund pays the Investment Adviser compensation for investment advisory and management services consisting of base management compensation and a two-part incentive compensation
(the “Advisory Fee”).
Base Management Fee
The management fee is payable monthly in arrears at an annual rate of 1.25% of the value of our net assets as of the end of the most recently completed calendar month. For purposes of the Advisory Agreement, net
assets means our total assets determined on a consolidated basis in accordance with U.S. GAAP.
Incentive Fee
Incentive compensation will be payable to the Investment Adviser pursuant to the Advisory Agreement. The incentive fee will consist of two components, an income component and a capital gains component. Each component
of the incentive fee will be calculated and, if due, will be payable quarterly in arrears.
The income component of the incentive fee will be the amount, if positive, equal to 12.5% of the aggregate net investment income before incentive compensation earned for the most recent calendar quarter and the
preceding eleven calendar quarters (or if shorter, the number of calendar quarters that have occurred since commencement of the Fund’s operations), less aggregate income incentive compensation previously paid in with respect to the first eleven
calendar quarters (or the portion thereof) included in the relevant trailing twelve quarters.
The income component of the incentive fee is subject to a 5.0% total return hurdle on daily weighted average unreturned capital contributions (the “Hurdle Rate”). As such, the Fund will not be obligated to pay any
income incentive fee to the extent the annualized trailing twelve quarter (or if shorter, the number of calendar quarters that have occurred since the commencement of the fund) total return of the Fund (as defined below), including net realized
gains and losses and net unrealized appreciation and depreciation, does not exceed the Hurdle Rate. To the extent that the Fund’s annualized total return for the relevant period exceeds the Hurdle Rate, but is less than 5.714286% of daily weighted
average unreturned capital contributions, the income incentive fee will be subject to a “catch up,” calculated as 100% of the aggregate net investment income before incentive compensation earned in excess of Hurdle Rate for the relevant period. To
the extent that the Fund’s annualized total return for the relevant period exceeds 5.714286%, the income component of the incentive fee will be equal to 12.5% of net investment income before incentive compensation earned in excess of this total
return threshold.
The capital gains component of the incentive fee will be the amount, if positive, equal to the lesser of (i) 12.5% of the aggregate realized capital gains (computed net of realized losses and net of unrealized
capital depreciation, if any) for the most recent calendar quarter and the preceding eleven calendar quarters (or if shorter, the number of calendar quarters that have occurred since commencement of the Fund’s operations), less capital gains
incentive compensation previously paid or distributed in respect of the first eleven calendar quarters (or the portion thereof) included in the relevant trailing twelve quarters or (ii) 12.5% of cumulative aggregate realized capital gains (computed
net of realized losses and net of unrealized capital depreciation, if any) since commencement of the Fund, less capital gains incentive compensation previously paid or distributed since commencement of the Fund. The capital gains component will be
paid in full prior to payment of the ordinary income component.
In any case, incentive compensation (including both the income and capital gains components) will only be paid to the extent the trailing twelve quarter (or if shorter, the number of calendar quarters that have
occurred since commencement of the fund) total return of the Fund after incentive compensation and including such payment would equal or exceed a 5% annual total return on daily weighted average unreturned contributed capital contributions for such
period.
The Investment Adviser has agreed to waive any portion of the income component of the Incentive Fee attributable to the inclusion of Expense Payments (as set forth in the Expense Support and Conditional Reimbursement
Agreement) in the calculation of (i) aggregate net investment income before incentive compensation or (ii) total return.
For purposes of the foregoing computations and the total return limitation:
“net investment income before incentive compensation” means the Fund’s interest income, dividend income and any other income (including any other fees, such as commitment, origination, structuring, diligence,
managerial assistance and consulting fees or other fees received from portfolio companies) during the period, minus the Fund’s operating expenses during the period (including the base management fee, expenses payable under the administration
agreements, any interest expense and any dividends paid on any issued and outstanding preferred stock), plus increases and minus decreases in net assets not treated as components of income, operating expense, gain, loss, appreciation or
depreciation and not treated as changes in unreturned capital contributions, and without reduction for any incentive compensation and any organization or offering costs, in each case determined on an accrual and consolidated basis.
“total return” means the amount equal to the combination of net investment income before incentive compensation, realized capital gains and losses and unrealized capital appreciation and depreciation of the Fund for
the period, in each case determined on an accrual and consolidated basis.
“unreturned capital contributions” means the proceeds to the Fund of all issuances of Common Shares, less all distributions by the Fund to shareholders representing a return of capital.
Examples of Incentive Fee Calculation
The figures provided in the following examples are hypothetical, are presented for illustrative purposes only and are not indicative of actual expenses or returns.
Example 1: Income Portion of Incentive Compensation:
I. Alternative 1:
Assumptions
Daily weighted average unreturned capital contributions (“UCC”) and NAV of $100 million across all quarters
Gross net investment income for each of the quarters (including interest, dividends, fees, etc.) = 2.0%.
No realized or unrealized capital gains or losses.
Hurdle rate = 5% annualized
Other expenses (management fee, legal, accounting, custodian, transfer agent, etc.) = 1.0%
Hurdle rate = 5% annualized
Other expenses (management fee, legal, accounting, custodian, transfer agent, etc.) = 1.0%
No capital gains incentive fee.
Pre-incentive fee net investment income for each quarter
(investment income – (management fee + other expenses)) = 1.0%
(investment income – (management fee + other expenses)) = 1.0%
Assumes no other quarters in the applicable Trailing Twelve Quarters
Aggregate pre-incentive fee net investment income during the relevant Trailing Twelve Quarters = $1,000,000
Hurdle Amount = Q1 UCC × 1.25% = $1,250,000
Excess Income Amount = pre-incentive fee net investment income during the relevant Trailing Twelve Quarters – Hurdle Amount = $1,000,000 – $1,250,000 = $(250,000)
Hurdle Amount = Q1 UCC × 1.25% = $1,250,000
Excess Income Amount = pre-incentive fee net investment income during the relevant Trailing Twelve Quarters – Hurdle Amount = $1,000,000 – $1,250,000 = $(250,000)
As the pre-incentive fee net investment income does not exceed the Hurdle Amount, no incentive fee is payable during the quarter.
II. Alternative 2:
Assumptions
Daily weighted average unreturned UCC and NAV of $100 million across all quarters
Gross net investment income for each of the quarters (including interest, dividends, fees, etc.) = 2.5%.
No realized or unrealized capital gains or losses.
Hurdle rate = 5% annualized
Other expenses (management fee, legal, accounting, custodian, transfer agent, etc.) = 1.0%
Hurdle rate = 5% annualized
Other expenses (management fee, legal, accounting, custodian, transfer agent, etc.) = 1.0%
No capital gains incentive fee.
Pre-incentive fee net investment income for each quarter
(investment income – (management fee + other expenses)) = 1.5%
(investment income – (management fee + other expenses)) = 1.5%
Assumes no other quarters in the applicable Trailing Twelve Quarters
First Quarter
Aggregate pre-incentive fee net investment income during the relevant Trailing Twelve Quarters = $1,500,000
Hurdle Amount = UCC × 1.25% = $1,250,000
Excess Income Amount = pre-incentive fee net investment income during the relevant Trailing Twelve Quarters – Hurdle Amount = $1,500,000 – $1,250,000 = $250,000
Hurdle Amount = UCC × 1.25% = $1,250,000
Excess Income Amount = pre-incentive fee net investment income during the relevant Trailing Twelve Quarters – Hurdle Amount = $1,500,000 – $1,250,000 = $250,000
Catch-up Fee Amount = 100% of pre-incentive fee net investment income that is greater than $1,250,000 (the Hurdle Amount) but less than 1.4286% (5.714286% annualized) × Q1 UCC, or $1,428,571.50.
This Catch-up Fee Amount equals $178,571.50
Post Catch-up Fee Amount = 12.5% of pre-incentive fee net investment income that exceeds the Catch-up Amount = 0.125 × ($1,500,000 – $1,428,571) = $8,928.56
Catch-up Fee Amount + Post Catch-up Fee Amount = income incentive fee payment = $187,500
No income incentive fee previously paid during the Trailing Twelve Quarters
No income incentive fee previously paid during the Trailing Twelve Quarters
5.0% Total Return Limitation = 1.25% (5.0% annualized) total return = $1,250,000. Total Return – Incentive Fee = $1,500,000 – $187,500 = $1,312,500 which is greater than $1,250,000. Accordingly
full incentive fee is paid.
Second Quarter
Aggregate pre-incentive fee net investment income during the relevant Trailing Twelve Quarters = $1,500,000+$1,500,000 = $3,000,000
Hurdle Amount = UCC × 2.50% = $2,500,000
Excess Income Amount = pre-incentive fee net investment income during the relevant Trailing Twelve Quarters – Hurdle Amount = $3,000,000 – $2,500,000 = $500,000
Hurdle Amount = UCC × 2.50% = $2,500,000
Excess Income Amount = pre-incentive fee net investment income during the relevant Trailing Twelve Quarters – Hurdle Amount = $3,000,000 – $2,500,000 = $500,000
Catch-up Fee Amount = 100% of pre-incentive fee net investment income that is greater than $2,500,000 (the Hurdle Amount) but less than 2.857143% (5.714286% annualized) × UCC, or $2,857,143.00. This
Catch-up Fee Amount equals $357,143.00
Post Catch-up Fee Amount = 12.5% of pre-incentive fee net investment income that exceeds the Catch-up Amount = 0.125 × ($3,000,000 – $2,857,143) = $17,857.13
Catch-up Fee Amount + Post Catch-up Fee Amount = income incentive fee payment = $375,000 $187,500 previously paid during the quarter. Total Incentive Fee = $187.500
5.0% Total Return Limitation = 2.50% (5.0% annualized) total return = $2,500,000. Total Return – Incentive Fee = $3,000,000 – $375,000 = $2,625,000, which is greater than 2,500,000. Accordingly
full incentive fee is paid.
III. Alternative 3:
Weighted average unreturned UCC and NAV of $100 million across all quarters
Gross net investment income for first quarter and second quarter (including interest, dividends, fees, etc.) = 2.5%.
$1,400,000 realized capital gains in the first quarter, $1,400,000 of unrealized capital loss in the second quarter.
Hurdle rate = 5% annualized
Hurdle rate = 5% annualized
Other expenses (management fee, legal, accounting, custodian, transfer agent, etc.) = 1.0%
Capital gains incentive fee of $175,000 paid in the first quarter
Pre-incentive fee net investment income for each quarter
(investment income – (management fee + other expenses)) = 1.5%
(investment income – (management fee + other expenses)) = 1.5%
Assumes no other quarters in the applicable Trailing Twelve Quarters
First Quarter
Aggregate pre-incentive fee net investment income during the relevant Trailing Twelve Quarters = $1,500,000
Hurdle Amount = UCC × 1.25% = $1,250,000
Excess Income Amount = pre-incentive fee net investment income during the relevant Trailing Twelve Quarters – Hurdle Amount = $1,500,000 – $1,250,000 = $250,000
Hurdle Amount = UCC × 1.25% = $1,250,000
Excess Income Amount = pre-incentive fee net investment income during the relevant Trailing Twelve Quarters – Hurdle Amount = $1,500,000 – $1,250,000 = $250,000
Catch-up Fee Amount = 100% of pre-incentive fee net investment income that is greater than $1,250,000 (the Hurdle Amount) but less than 1.4286% (5.714286% annualized) × UCC, or $1,428,571.50. This
Catch-up Fee Amount equals $178,571.50
Post Catch-up Fee Amount = 12.5% of pre-incentive fee net investment income that exceeds the Catch-up Amount = 0.125 × ($1,500,000 – $1,428,571) = $8,928.56
Catch-up Fee Amount + Post Catch-up Fee Amount = income incentive fee payment = $187,500
No income incentive fee previously paid during the Trailing Twelve Quarters
No income incentive fee previously paid during the Trailing Twelve Quarters
5.0% Total Return Limitation = 1.25% (5.0% annualized) total return = $1,250,000. Total Return – Incentive Fee = $2,900,000 – $362,500 ($187,500 Income Incentive + $175,000 Capital Gains Incentive)
= $2,537,500 which is greater than $1,250,000. Accordingly full incentive fee is paid.
Second Quarter
Aggregate pre-incentive fee net investment income during the relevant Trailing Twelve Quarters = $1,500,000+$1,500,000 = $3,000,000
Hurdle Amount = UCC × 2.50% = $2,500,000
Excess Income Amount = pre-incentive fee net investment income during the relevant Trailing Twelve Quarters – Hurdle Amount = $3,000,000 – $2,500,000 = $500,000
Hurdle Amount = UCC × 2.50% = $2,500,000
Excess Income Amount = pre-incentive fee net investment income during the relevant Trailing Twelve Quarters – Hurdle Amount = $3,000,000 – $2,500,000 = $500,000
Catch-up Fee Amount = 100% of pre-incentive fee net investment income that is greater than $2,500,000 (the Hurdle Amount) but less than 2.857143% (5.714286% annualized) × UCC, or $2,857,143.00. This
Catch-up Fee Amount equals $357,143.00
Post Catch-up Fee Amount = 12.5% of pre-incentive fee net investment income that exceeds the Catch-up Amount = 0.125 × ($3,000,000 – $2,857,143) = $17,857.13
Catch-up Fee Amount + Post Catch-up Fee Amount = income incentive fee payment = $375,000 $187,500 previously paid during the Trailing Twelve Quarters. Total Incentive Fee = $187,500
5.0% Total Return Limitation = 2.50% (5.0% annualized) total return = $2,500,000. Total Return – Incentive Fee = $3,000,000 – $550,000 (375,000 Income Incentive + 175,000 Capital Gains Incentive) =
$2,450,000, which is less than 2,500,000. Accordingly, $50,000 of the income incentive fee is not paid, leaving total income incentive fee of $137,500
Example 2: Capital Gains Portion of Incentive Compensation1:
I. Alternative 1:
a. Assumptions
| i. |
Year 1: $20 million investment made in Company A (“Investment A”), and $30 million investment made in Company B (“Investment B”).
|
| ii. |
Year 2: Investment A sold for $50 million and fair market value (“FMV”) of Investment B determined to be $32 million. Trailing twelve quarter total return of 20%.
|
| iii |
Year 3: FMV of Investment B determined to be $25 million. Trailing twelve quarter total return of 15%.
|
|
iv.
|
Year 4: Investment B sold for $31 million. Trailing twelve quarter total return of 10%.
|
b. The capital gains portion of the incentive compensation would be:
|
i.
|
Year 1: None.
|
| ii. |
Year 2: Capital gains incentive compensation of $3.75 million ($3.75 million = $30 million realized capital gains on sale of Investment A multiplied by 12.5% and total return hurdle satisfied).
|
|
iii.
|
Year 3: None; no realized capital gains.
|
| iv |
Year 4: Capital gains incentive compensation of $0.125 million ($31 million cumulative realized capital gains multiplied by 12.5%, less $3.75 million of capital gains incentive compensation paid in year 2).
|
II. Alternative 2
a. Assumptions
| i. |
Year 1: $20 million investment made in Company A (“Investment A”), $30 million investment made in Company B (“Investment B”) and $25 million investment made in Company C (“Investment C”).
|
| ii. |
Year 2: Investment A sold for $50 million, FMV of Investment B determined to be $25 million and FMV of Investment C determined to be $25 million. Trailing twelve quarter total return of 10%.
|
| iii. |
Year 3: FMV of Investment B determined to be $27 million and Investment C sold for $30 million. Trailing twelve quarter total return of 5.5%.
|
| 1 |
The capital gains component will be paid in full prior to payment of the income component. Incentive compensation (including both the income and capital gains components) will only be paid to the extent the
trailing twelve quarter (or if shorter, the number of calendar quarters that have occurred since commencement of the fund) total return of the Fund after incentive compensation and including such payment would equal or exceed a 5% annual
total return on daily weighted average unreturned contributed capital contributions for such period.
|
| iv. |
Year 4: FMV of Investment B determined to be $35 million. Trailing twelve quarter total return of 15%.
|
| v. |
Year 5: Investment B sold for $40 million. Trailing twelve quarter total return of 20%.
|
b. The capital gains portion of the incentive compensation would be:
|
i.
|
Year 1: None.
|
| ii. |
Year 2: Capital gains incentive compensation of $3.125 million; 12.5% multiplied by $25 million ($30 million realized capital gains on Investment A less $5 million unrealized capital depreciation on Investment B).
|
| iii. |
Year 3: Capital gains incentive compensation of $0.875 million; 12.5% multiplied by $32 million ($30 million realized capital gains on Investment A less $3 million unrealized capital depreciation on Investment B plus $5 million
realized capital gains on Investment C, less $3.125 million capital gains incentive compensation paid in year 2).
|
| iv. |
Year 4: Capital gains incentive compensation of $0.375 million ($35 million cumulative realized capital gains multiplied by 12.5%, less $4.0 million capital gains incentive compensation paid in years 2 and 3).
|
| v. |
Year 5: Capital gains incentive compensation of $1.25 million ($45 million cumulative realized capital gains multiplied by 12.5%, less $4.375 million in capital gains incentive compensation paid in years 2, 3 and 4).
|
Board Approval of the Advisory Agreement
Our Board, including our Independent Trustees, approved the continuation of the Advisory Agreement for an additional one-year period at a meeting held on October 28-29, 2025. In reaching a decision to approve the
Advisory Agreement, the Board reviewed a significant amount of information and considered, among other things:
| • |
the nature, quality and extent of the advisory and other services to be provided to the Fund by the Investment Adviser;
|
| • |
the proposed investment advisory fee rates to be paid by the Fund to the Investment Adviser;
|
| • |
the fee structures of comparable externally managed business development companies that engage in similar investing activities;
|
| • |
our projected operating expenses and expense ratio compared to business development companies with similar investment objectives;
|
| • |
information about the services to be performed and the personnel who would be performing such services under the Advisory Agreement; and
|
| • |
the organizational capability and financial condition of the Investment Adviser and its affiliates.
|
Based on the information reviewed and the discussion thereof, the Board, including a majority of the non-interested trustees, concluded that the investment advisory fee rates are reasonable in relation to the
services to be provided and approved the Advisory Agreement as being in the best interests of our shareholders. A discussion regarding the basis for the approval of the continuation of the Advisory Agreement by the Board is also available in the
Fund’s annual report on Form 10-K for the fiscal year ended December 31, 2025.
Sub-Advisory Agreement
BlackRock Advisors, LLC, an indirect subsidiary of BlackRock, will perform certain of the day-to-day investment management of the Fund pursuant to a separate sub-investment advisory agreement (the “Sub-Advisory
Agreement”). BlackRock Advisors, LLC is located at 100 Bellevue Parkway, Wilmington, Delaware 19809.
Pursuant to the Sub-Advisory Agreement, the Investment Adviser, and not the Fund, will pay a portion of the management fee received by the Investment Adviser to the Sub-Adviser as a sub-advisory fee in an amount
equal to a percentage of the average daily value of the Fund’s assets allocated to the Sub-Adviser.
The Sub-Advisory Agreement provides that, in the absence of bad faith, misconduct, willful misfeasance, negligence or reckless disregard of its obligations thereunder, the Fund will indemnify the Sub-Adviser, its
directors, officers, employees, agents, associates and control persons for liabilities incurred by them in connection with their services to the Fund, subject to certain limitations.
Although the Sub-Adviser intends to devote such time and effort to the business of the Fund as is reasonably necessary to perform its duties to the Fund, the services of the Sub-Adviser are not exclusive and the
Sub-Adviser provides similar services to other investment companies and other clients and may engage in other activities.
The Sub-Advisory Agreement continues in effect for successive periods of 12 months, provided that each continuance is specifically approved at least annually by both (1) the vote of a majority of the Board or the
vote of a majority of the outstanding voting securities of the Fund (as defined in the 1940 Act) and (2) by the vote of a majority of the Trustees who are not parties to such agreement or interested persons (as such term is defined in the 1940 Act)
of any such party, cast in person at a meeting called for the purpose of voting on such approval. The Sub-Advisory Agreement may be terminated as a whole at any time by the Fund without the payment of any penalty, upon the vote of a majority of the
Board or a majority of the outstanding voting securities of the Fund or by the Investment Adviser or the Sub-Adviser, on 60 days’ written notice by either party to the other. The Sub-Advisory Agreement will also terminate automatically in the event
of its assignment (as such term is defined in the 1940 Act and the rules thereunder).
Board Approval of the Sub-Advisory Agreement
Our Board, including our Independent Trustees, approved the continuation of the Sub-Advisory Agreement for an additional one-year period at a meeting held on October 28-29, 2025. In reaching a decision to approve the
Sub-Advisory Agreement, the Board reviewed a significant amount of information and considered, among other things:
| • |
the nature, quality and extent of the advisory and other services to be provided to the Fund by the Sub-Adviser;
|
| • |
the proposed investment sub-advisory fee rates to be paid by the Investment Adviser to the Sub-Adviser;
|
| • |
the fee structures of comparable externally managed business development companies that engage in similar investing activities;
|
| • |
our projected operating expenses and expense ratio compared to business development companies with similar investment objectives;
|
| • |
information about the services to be performed and the personnel who would be performing such services under the Sub-Advisory Agreement; and
|
| • |
the organizational capability and financial condition of the Sub-Adviser and its affiliates.
|
Based on the information reviewed and the discussion thereof, the Board, including a majority of the non-interested trustees, concluded that the investment sub-advisory fee rates are reasonable in relation to the
services to be provided and approved the Sub-Advisory Agreement as being in the best interests of our shareholders. A discussion regarding the basis for the approval of the continuation of the Sub-Advisory Agreement by the Board is also available
in the Fund’s annual report on Form 10-K for the fiscal year ended December 31, 2025.
Administration Agreement
BlackRock Financial Management, Inc. serves as the Fund’s Administrator. The principal executive offices of the Administrator are located at 50 Hudson Yards, New York, New York 10001. The Fund has entered into an
administration agreement with the Administrator (the “Administration Agreement”). Pursuant to the Administration Agreement, the Administrator will perform (or oversee, or arrange for, the performance by third parties of) the administrative services
necessary for the operation of the Fund. Without limiting the generality of the foregoing, the Administrator will provide the Fund with office facilities, equipment, clerical, bookkeeping and record keeping services at such office facilities and
such other services as the Administrator, subject to review by the Board of Trustees of the Fund, will from time to time determine to be necessary or useful to perform its obligations under this Agreement. The Administrator will also, on behalf of
the Fund, arrange for the services of, and oversee, custodians, depositories, transfer agents, dividend disbursing agents, other stockholder servicing agents, accountants, attorneys, underwriters, brokers and dealers, corporate fiduciaries,
insurers, banks, stockholders and such other persons in any such other capacity deemed to be necessary or desirable. The Administrator also makes reports to the Fund’s Board of Trustees of its performance of obligations under the Administration
Agreement and furnish advice and recommendations with respect to such other aspects of the business and affairs of the Fund as it determines to be desirable. The Administrator is responsible for the financial and other records that the Fund is
required to maintain and will prepare all reports and other materials required by any agreement or to be filed with the SEC or any other regulatory authority, including reports on Forms 8-K, 10-Q, 10-K and periodic reports to shareholders,
determining the amounts available for distribution as dividends and distributions to be paid by the Fund to its shareholders, review and implementation of any share purchase programs authorized by the Board of Trustees and maintaining or overseeing
the maintenance of the books and records of the Fund as required under the 1940 Act and maintaining (or overseeing maintenance by other persons) such other books and records required by law or for the proper operation of the Fund. In addition, the
Administrator will assist the Fund in determining and publishing the Fund’s net asset value, overseeing the preparation and filing of the Fund’s tax returns, and the printing and dissemination of reports to shareholders of the Fund, and generally
overseeing the payment of the Fund’s expenses and the performance of administrative and professional services rendered to the Fund by others.
Pursuant to the Administration Agreement, in full consideration of the provision of the services of the Administrator, the Fund reimburses the Administrator for the costs and expenses incurred by the Administrator in
performing its obligations and providing personnel and facilities thereunder, including payments to the Administrator in an amount equal to the Fund’s allocable portion of overhead and other expenses incurred by the Administrator or its affiliate
in performing its obligations and services under the Administration Agreement, such as rent, license fees and other costs associated with computer software utilized in providing such obligations and services and the Fund’s allocable portion of the
cost of personnel attributable to performing such obligations and services, including, but not limited to, marketing, legal and other services performed by the Administrator for the Fund. For the avoidance of doubt, the Fund will bear its allocable
portion of the costs of the compensation, benefits, and related administrative expenses (including travel expenses) of the Fund’s officers who provide operational and administrative services, their respective staffs and other professionals who
provide services to the Fund (including, in each case, employees of the Administrator or its affiliate) who assist with the preparation, coordination, and administration of the foregoing or provide other “back office” or “middle office” financial
or operational services to the Fund. The Board of Trustees will periodically receive and review information regarding the allocation of such reimbursable expenses and will consider whether such allocations are fair and reasonable. Additionally, the
Administrator has entered into a Sub-Administration Agreement with State Street Bank and Trust Company. The Fund will bear all of the costs and expenses of the Sub-Administration Agreement.
The Board of Trustees approved the continuation of the Administration Agreement for an additional one-year period at a meeting held on October 28-29, 2025, on the basis that it (i) is in the best interests of the
Fund and its shareholders; (ii) provides for services that are required for the Fund’s operations; and (iii) provides for fees that are fair and reasonable.
Sub-Administration Agreement
The Administrator has entered into the Sub-Administration Agreement with State Street Bank and Trust Company. State Street Bank and Trust Company will receive compensation for its sub-administrative services.
Compliance with the NASAA Omnibus Guidelines Published
Net Worth of Sponsors
The North American Securities Administrators Association (“NASAA”), in its Omnibus Guidelines Statement of Policy adopted on March 29, 1992, as amended on May 7, 2007 and from time to time (the “NASAA Omnibus
Guidelines”), requires that our affiliates and Investment Adviser, or our Sponsor, as defined under the NASAA Omnibus Guidelines, have an aggregate financial net worth, exclusive of home, automobiles and home furnishings, of the greater of either
$100,000, or 5.0% of the first $20 million of both the gross amount of securities currently being offered in this offering and the gross amount of any originally issued direct participation program securities sold by our affiliates and sponsors
within the past 12 months, plus 1.0% of all amounts in excess of the first $20 million. Based on these requirements, our Investment Adviser and its affiliates, while not liable directly or indirectly for any indebtedness we may incur, have an
aggregate financial net worth in excess of those amounts required by the NASAA Omnibus Guidelines.
Prohibited Activities
Our activities are subject to compliance with the 1940 Act. In addition, our Declaration of Trust prohibits the following activities among us, the Investment Adviser and its affiliates:
| • |
We may not purchase or lease assets in which the Investment Adviser or its affiliates has an interest unless (i) the transaction occurs at the formation of the Fund and we disclose the terms of the transaction to our shareholders, the
terms are reasonable to us and the price does not exceed the lesser of cost or fair market value, as determined by an independent expert or (ii) such purchase or lease of assets is consistent with the 1940 Act or an exemptive order under
the 1940 Act issued to us by the SEC;
|
| • |
We may not invest in general partnerships or joint ventures with affiliates and non-affiliates unless certain conditions are met;
|
| • |
The Investment Adviser and its affiliates may not acquire assets from us unless (i) approved by our shareholders entitled to cast a majority of the votes entitled to be cast on the matter or (ii) such acquisition is consistent with the
1940 Act or an exemptive order under the 1940 Act issued to us by the SEC;
|
| • |
We may not lease assets to the Investment Adviser or its affiliates unless the transaction occurs at the formation of the Fund, we disclose the terms of the transaction to our shareholders and such terms are fair and reasonable to us;
|
| • |
We may not make any loans, credit facilities, credit agreements or otherwise to the Investment Adviser or its affiliates except for the advancement of funds as permitted by our Declaration of Trust or unless otherwise permitted by the
1940 Act or applicable guidance or exemptive relief of the SEC;
|
| • |
We may not acquire assets in exchange for our Common Shares without approval of a majority of the Board of Trustees, including a majority of the Independent Trustees with consideration to an independent appraisal of such assets;
|
| • |
We may not pay a commission or fee, either directly or indirectly to the Investment Adviser or its affiliates, except as otherwise permitted by our Declaration of Trust, in connection with the reinvestment of cash flows from operations
and available reserves or of the proceeds of the resale, exchange or refinancing of our assets;
|
| • |
The Investment Adviser may not charge duplicate fees to us; and
|
| • |
The Investment Adviser may not provide financing to us with a term in excess of 12 months.
|
In addition, in the Advisory Agreement, the Investment Adviser agrees that its activities will at all times be in compliance in all material respects with all applicable federal and state securities laws governing
its operations and investments.
Rebates, Kickbacks and Reciprocal Arrangements
Our Declaration of Trust prohibits our Investment Adviser from: (i) receiving or accepting any rebate, give-ups or similar arrangement that is prohibited under applicable federal or state securities laws, (ii)
participating in any reciprocal business arrangement that would circumvent provisions of applicable federal or state securities laws governing conflicts of interest or investment restrictions or (iii) entering into any agreement, arrangement or
understanding that would circumvent the restrictions against dealing with affiliates or promoters under applicable federal or state securities laws. In addition, our Investment Adviser may not directly or indirectly pay or award any fees or
commissions or other compensation to any person or entity engaged to sell our shares or give investment advice to a potential shareholder; provided, however, that our Investment Adviser may pay a registered broker or other properly licensed agent
sales commissions or other compensation (including cash compensation and non-cash compensation (as such terms are defined under FINRA Rule 2310)) for selling or distributing our Common Shares, including out of the Investment Adviser’s own assets,
including those amounts paid to the Investment Adviser under the Advisory Agreement. The Investment Adviser will not enter into any agreement, arrangement or understanding that could circumvent the restrictions against dealing with affiliates or
promoters under the NASAA Omnibus Guidelines.
Commingling
The Investment Adviser may not permit our funds to be commingled with the funds of any other entity.
Expense Support and Conditional Reimbursement Agreement
On August 26, 2025, the Fund entered into the Expense Support and Conditional Reimbursement Agreement with the Investment Adviser. Pursuant to the Expense Support and Conditional Reimbursement Agreement, the
Investment Adviser may elect to pay certain Expense Payments on the Fund’s behalf, provided that no portion of an Expense Payment will be used to pay any interest expense or shareholder servicing and/or distribution fees of the Fund. Any Expense
Payment that the Investment Adviser has committed to pay shall be paid by the Investment Adviser to the Fund in any combination of cash or other immediately available funds no later than seventy-five days after such commitment was made in writing,
and/or offset against amounts due from the Fund to the Investment Adviser or its affiliates.
Following any calendar month in which Available Operating Funds (as defined below) exceed the cumulative distributions accrued to the Fund’s shareholders based on distributions declared with respect to record dates
occurring in such calendar month (the amount of such excess being hereinafter referred to as “Excess Operating Funds”), the Fund shall pay such Excess Operating Funds, or a portion thereof, as applicable, to the Investment Adviser until such time
as all Expense Payments made by the Investment Adviser to the Fund within three years prior to the last business day of such calendar month have been reimbursed. Any payments required to be made by the Fund shall be referred to herein as a
“Reimbursement Payment.” “Available Operating Funds” means the sum of (i) the Fund’s net investment company taxable income (including net short-term capital gains reduced by net long-term capital losses), (ii) the Fund’s net capital gains
(including the excess of net long-term capital gains over net short-term capital losses), and (iii) dividends and other distributions paid to the Fund on account of investments in portfolio companies (to the extent such amounts listed in clause
(iii) are not included under clauses (i) and (ii) above).
No Reimbursement Payment for any month shall be made if: (1) the Effective Rate of Distributions Per Share declared by the Fund at the time of such Reimbursement Payment is lower than the Effective Rate of
Distributions Per Share at the time the related Expense Payment was made, provided that to the extent that the Effective Rate of Distributions Per Share declared by the Fund at the time of such Reimbursement Payment has declined relative to the
Effective Rate of Distributions Per Share declared by the Fund at the time of the related Expense Payment in an amount (measured in basis points) equal to or less than a corresponding decline in the 3-month SOFR (measured in basis points) over the
same period, this condition (1) shall not restrict the payment of such Reimbursement Payment; or (2) the Fund’s Operating Expense Ratio at the time of such Reimbursement Payment is greater than the Operating Expense Ratio at the time the related
Expense Payment was made. “Effective Rate of Distributions Per Share” means the annualized rate of regular cash distributions per share exclusive of returns of capital, distribution rate reductions due to shareholder servicing and/or distribution
fees, and declared special dividends or special distributions, if any. The “Operating Expense Ratio” is calculated by dividing Operating Expenses, less organizational and offering expenses, base management and incentive fees owed to the Investment
Adviser, shareholder servicing and/or distribution fees, and interest expense, by the Fund’s net assets. “Operating Expenses” means all of the Fund’s operating costs and expenses incurred, as determined in accordance with generally accepted
accounting principles for investment companies. The Investment Adviser has agreed to waive any portion of the income component of the incentive fee attributable to the inclusion of Expense Payments in the calculation of (i) aggregate net investment
income before incentive compensation or (ii) total return.
The Fund’s obligation to make a Reimbursement Payment shall automatically become a liability of the Fund on the last business day of the applicable calendar month, except to the extent the Investment Adviser has
waived its right to receive such payment for the applicable month.
Expenses
The Fund will be responsible for paying the compensation of the Investment Adviser. In addition, the Fund will generally be responsible for all operating expenses of the Fund, and shall pay, and shall reimburse the
Investment Adviser or the Administrator and their respective affiliates for, all fees, costs, expenses, liabilities and obligations of the Fund relating or attributable to:
| • |
the Fund’s business, affairs and operations, including any private placement fees, sales commissions, appraisal fees, taxes, brokerage fees and commissions, underwriting commissions and discounts, expenses related to short sales,
indemnification obligations, legal, accounting, research, auditing, information, appraisal, advisory, valuation (including third-party valuations, appraisals or pricing services), consulting (including consulting and retaining fees and
other compensation paid to consultants performing investment initiatives and other similar consultants), tax, investment banking, information services, title, transfer, registration, loan agency services (including any third party service
providers related to the foregoing) and other professional fees, expenses of filings and registrations;
|
| • |
activities with respect to the structuring, organizing, negotiating, consummating, financing, refinancing, acquiring, bidding on, owning, managing, monitoring, operating, holding, hedging, restructuring, trading, taking public or
private, selling, valuing, winding up, liquidating, or otherwise disposing of, as applicable, of actual and potential investments (including any associated legal, financing, commitment, transaction or other fees and expenses payable to
attorneys, accountants, investment bankers, lenders, third-party diligence software and service providers, consultants and similar professionals in connection therewith and any fees and expenses related to transactions that may have been
offered to co-investors), whether or not any contemplated transaction or project is consummated and whether or not such activities are successful;
|
| • |
investment transactions that are not consummated, including break-up fees and other “broken deal” costs, and legal, accounting, investment banking, consulting, information services and other professional fees related thereto;
|
| • |
compensation of the Independent Trustees of the Fund;
|
| • |
the preparation of audits, financial and tax reports, portfolio valuations and tax returns of the Fund, including fees and out-of-pocket expenses of any service company retained to provide accounting and bookkeeping services to the Fund;
|
| • |
all ongoing legal and compliance costs of the Fund (including any costs associated with complying with any tax reporting regime) and the costs of prosecuting or defending any legal action for or against the Fund;
|
| • |
all extraordinary professional fees incurred in connection with the business or management of the Fund;
|
| • |
all indemnification, contribution and similar obligations of the Fund;
|
| • |
indebtedness of, or guarantees made by, the Fund (including any credit facility, letter of credit or similar credit support), including interest with respect thereto, or seeking to put in place any such indebtedness or guarantee, and
principal and interest on, and fees and expenses arising out of, all permitted borrowings (including any credit facility, letter of credit or similar credit support) made by the Fund and costs and expenses incurred in connection with
seeking to put in place such borrowings (including, but not limited to, financing, commitment, origination and similar fees and expenses) and costs of reporting to the Fund’s creditors;
|
| • |
any hedging transactions (including currency hedging and other types of hedging), including in respect of the Fund and/or its investments;
|
| • |
any litigation, indemnification, judgments, settlements, director and officer liability or other insurance, including reasonable premiums for insurance protecting the Fund, any of its affiliates and any of its employees and agents, and
all other extraordinary expenses or liabilities of the Fund (including fees, costs and expenses that are classified as extraordinary expenses under accounting principles generally accepted in the United States of America (“U.S. GAAP”));
|
| • |
all administrative costs and expenses of the Fund, including the fees of, and reasonable out of pocket expenses incurred by, any administrator (including the Administrator) and/or any other agent appointed by the Fund properly incurred
by them, including any fees and expenses of custodians, transfer and distribution agents;
|
| • |
reporting to the Fund’s shareholders, conducting shareholder meetings and the solicitation of shareholder consents, proxy expenses and expenses of communications to investors;
|
| • |
any governmental and regulatory filings and reporting requirements and other tax or regulatory requirements in respect of the Fund (including costs related to regulatory compliance and government filings) and costs of responding to
regulatory inquiries;
|
| • |
all expenses of dissolving and winding up the Fund;
|
| • |
any taxes, fees or other governmental charges levied against the Fund and all expenses incurred in connection with any tax audit, investigation, settlement or review of the Fund;
|
| • |
any supplements or amendments to or restatements of, and waivers, consents or approvals pursuant to, the constituent documents of the Fund and any related entities, including the preparation, distribution and implementation thereof;
|
| • |
distributions or dividends;
|
| • |
all ongoing legal, regulatory, listing, share trustee and compliance costs, including the costs of any third-party consultants (including any costs associated with the implementation of and/or compliance with any change of law or
regulation applicable to the Fund) of the Fund, including third-party consultants engaged by the Fund or the Advisers in connection with the Fund’s regulatory or compliance reporting or the Advisers’ regulatory or compliance reporting
arising from the operation of the Fund;
|
| • |
agreements (including letter agreements) entered into with any investor or potential investor, and modifications and amendments to, and compliance with, such agreements;
|
| • |
printing and mailing, communications, marketing and publicity;
|
| • |
expenses relating to transfers of interests (although as determined by the Investment Adviser in its sole discretion, the Fund may require the transferor of (or the party withdrawing) Interests to pay the expenses relating to the
transfer);
|
| • |
the Fund’s allocable share of all costs and expenses (including taxes) related to entities in which the Fund holds an interest that are established to hold investments;
|
| • |
travel, lodging, meals or entertainment expenses relating to any of the foregoing, provided that any applicable travel expenses incurred as organizational or operating expenses will not be charged to or borne by the Fund at a cost
exceeding the cost of available first-class commercial airfare;
|
| • |
any additional amounts in order for the Fund to comply with any transfer pricing requirements, to the extent required by applicable law, in each case to the extent any such additional amounts are calculated on an arm’s-length basis; and
|
| • |
any VAT payable in respect of any of the foregoing expenses, fees or costs.
|
On behalf of the Fund, the Investment Adviser or the Administrator may advance payment of any such fees and expenses of the Fund, and the Fund will reimburse the Investment Adviser or the Administrator therefor in
accordance with the Advisory Agreement or the Administration Agreement.
Expenses associated with the general overhead of the Investment Adviser and the Administrator will not be covered by the Fund. Each of the Investment Adviser and the Administrator, as applicable, will be responsible
for, without reimbursement by the Fund, all of its own day-to-day operating expenses, such as compensation of its professional staff and the cost of office space, office supplies, communications, utilities and other such normal overhead expenses
(except for certain expenses set forth in the Administration Agreement). The Advisers will also be responsible for all legal, filing and other fees and expenses incurred in connection with the Advisers’ registration and compliance with the Advisers
Act and any related foreign laws, including: (i) all fees and expenses related to registration as an investment adviser under the Advisers Act and any related foreign laws, and the maintenance of such registration, and (ii) all fees and costs
relating to the filing of the Form ADV of the Advisers (provided, that any compliance fees and costs that relate directly to the affairs of the Fund (and not BlackRock-managed entities generally), including (but not limited to) costs of custodians
and foreign registrations, will be expenses of the Fund).
For the avoidance of doubt, Operating Expenses will be borne by the Fund and will not be considered administrative and overhead expenses of the Investment Adviser or the Administrator.
Pursuant to the Sub-Advisory Agreement, the Investment Adviser, and not the Fund, will pay a portion of the management fee received by the Investment Adviser to the Sub-Adviser as a sub-advisory fee in an amount
equal to a percentage of the average daily value of the Fund’s assets allocated to the Sub-Adviser.
The following table sets forth, as of March 31, 2026, information with respect to the ownership of our Common Shares by:
| • |
each person known to us to own, beneficially or of record, more than 5% of the outstanding Common Shares;
|
| • |
each of our Trustees and each executive officers; and
|
| • |
all of our Trustees and executive officers as a group.
|
Beneficial ownership is determined in accordance with the rules of the SEC and includes voting or investment power with respect to the securities. There are no Common Shares subject to options that are currently
exercisable or exercisable within 60 days of the offering.
| Shares Owned | ||||||
|
Name and Address(1)
|
Number
|
Percentage
|
||||
|
Interested Trustees
|
||||||
|
John Perlowski
|
None
|
None | ||||
|
Philip Tseng
|
1,009
|
(2)
|
0.001
|
%
|
||
|
Independent Trustees
|
||||||
|
Eric J. Draut
|
1,077
|
0.002
|
%
|
|||
|
Andrea L. Petro
|
None
|
None
|
||||
|
Maureen K. Usifer
|
None
|
None
|
||||
|
Executive Officers who are not Trustees
|
||||||
|
Jason Mehring
|
682
|
(2)
|
0.001
|
%
|
||
|
Erik L. Cuellar
|
None
|
None
|
||||
|
Patrick Wolfe
|
None(2)
|
None
|
||||
|
Charles C.S. Park
|
None
|
None
|
||||
|
Diana Huffman
|
None
|
None
|
||||
|
Dan Worrell
|
4,036
|
(2)
|
0.006
|
%
|
||
|
All Officers and Trustees as a group (11 persons)
|
6,804
|
0.01
|
%
|
|||
|
Other
|
||||||
|
BlackRock Financial Management, Inc.
50 Hudson Yards,
New York, NY 10001
|
5,998,843
|
8.515
|
%
|
|||
|
BlackRock Private Credit Fund iCapital Offshore Access Fund, L.P. - Cash
60 E. 42nd Street, 26th Floor
New York, NY 10165
|
32,712,748
|
46.435
|
%
|
|||
|
BlackRock Private Credit Fund iCapital Offshore Access Fund, L.P. - Reinvest
60 E. 42nd Street, 26th Floor
New York, NY 10165
|
13,065,303.203
|
18.546
|
%
|
|||
| (1) |
The address for all of the Fund’s officers and Trustees is c/o BlackRock Capital Investment Advisors, LLC, 50 Hudson Yards, New York, NY 10001.
|
| (2) |
Philip Tseng, Jason Mehring, Patrick Wolfe and Dan Worrell have each been granted phantom shares by an affiliate of the Adviser (and not by the Fund). Each phantom share represents the economic equivalent of one Common Share and, subject
to applicable vesting requirements, become payable in cash by the grantor of such phantom shares. As of March 31, 2026, the aggregate amount of phantom shares owned by each of Philip Tseng, Jason Mehring, Patrick Wolfe and Dan Worrell is
equal to 60,223.24, 8,427.45, 9,590.24 and 11,633.79 Common Shares, respectively.
|
The following table sets forth the dollar range of our equity securities held by each Trustee as of December 31, 2025. We are not part of a “family of investment companies,” as that term is defined in the 1940 Act.
|
Name and Address
|
Dollar Range of Equity
Securities in
BlackRock Private
Credit Fund(1)(2)
|
|||
|
Interested Trustees
|
||||
|
John Perlowski
|
None
|
|||
|
Philip Tseng
|
|
$10,001 - $50,000
|
||
|
Independent Trustees
|
||||
|
Eric J. Draut
|
|
$10,001 - $50,000
|
||
|
Andrea L. Petro
|
None
|
|||
|
Maureen K. Usifer
|
None
|
|||
| (1) |
Beneficial ownership has been determined in accordance with Rule 16a-1(a)(2) of the Exchange Act.
|
| (2) |
The dollar range of equity securities beneficially owned are: none, $1 - $10,000, $10,001 - $50,000, $50,001 - $100,000 or over $100,000.
|
We expect to pay regular monthly distributions. Any distributions we make will be at the discretion of our Board of Trustees, considering factors such as our earnings, cash flow, capital needs and general financial
condition and the requirements of Delaware law. As a result, our distribution rates and payment frequency may vary from time to time.
Our Board of Trustees’ discretion as to the payment of distributions will be directed, in substantial part, by its determination to cause us to comply with the RIC requirements. To maintain our treatment as a RIC, we
generally are required to make aggregate annual distributions to our shareholders of at least 90% of our net investment income. See “Description of our Shares” and “U.S. Federal Income Tax Matters.”
The per share amount of distributions on Class S, Class D and Institutional shares generally differ because of different class-specific shareholder servicing and/or distribution fees that are deducted from the gross
distributions for each share class. Specifically, distributions on Class S and Class D shares will be lower than Institutional shares because we are required to pay higher ongoing shareholder servicing and/or distribution fees with respect to the
Class S and Class D shares compared to Institutional shares. There is no assurance we will pay distributions in any particular amount, if at all. We may fund any distributions from sources other than cash flow from operations, including, without
limitation, the sale of assets, borrowings, return of capital or offering proceeds, and, subject to certain limitations imposed under the NASAA Omnibus Guidelines, we have no limits on the amounts we may pay from such sources. The extent to which
we pay distributions from sources other than cash flow from operations will depend on various factors, including the level of participation in our distribution reinvestment plan, how quickly we invest the proceeds from this and any future offering
and the performance of our investments. Funding distributions from the sales of assets, borrowings, return of capital or proceeds of this offering will result in us having less funds available to acquire investments. As a result, the return you
realize on your investment may be reduced. Doing so may also negatively impact our ability to generate cash flows. Likewise, funding distributions from the sale of additional securities will dilute your interest in us on a percentage basis and may
impact the value of your investment especially if we sell these securities at prices less than the price you paid for your shares. We believe the likelihood that we pay distributions from sources other than cash flow from operations will be higher
in the early stages of the offering.
From time to time, we may also pay special interim distributions in the form of cash or Common Shares at the discretion of our Board of Trustees.
We have not established limits on the amount of funds we may use from any available sources to make distributions. There can be no assurance that we will achieve the performance necessary to sustain our distributions
or that we will be able to pay distributions at a specific rate or at all. The Investment Adviser and its affiliates have no obligation to waive advisory fees or otherwise reimburse expenses in future periods. See “Advisory Agreement, Sub-Advisory
Agreement and Administration Agreement.”
Consistent with the Code, shareholders will be notified of the source of our distributions. Our distributions may exceed our earnings and profits, especially during the period before we have substantially invested
the proceeds from this offering. As a result, a portion of the distributions we make may represent a return of capital for tax purposes. The tax basis of shares must be reduced by the amount of any return of capital distributions, which will result
in an increase in the amount of any taxable gain (or a reduction in any deductible loss) on the sale of shares.
We have elected to be treated, and intend to qualify annually, as a RIC under the Code. To maintain RIC tax treatment, we must distribute at least 90% of our investment company taxable income (net ordinary taxable
income and net short-term capital gains in excess of net long-term capital losses), if any, to our shareholders. A RIC may satisfy the 90% distribution requirement by actually distributing dividends (other than capital gain dividends) during the
taxable year. In addition, a RIC may, in certain cases, satisfy the 90% distribution requirement by distributing dividends relating to a taxable year after the close of such taxable year under the “spillback dividend” provisions of Subchapter M. If
a RIC makes a spillback dividend, the amounts will be included in a shareholder’s gross income for the year in which the spillback dividend is paid. We currently intend to distribute net capital gains (i.e., net long-term capital gains in excess of
net short-term capital losses), if any, at least annually out of the assets legally available for such distributions. However, we may decide in the future to retain such capital gains for investment and elect to treat such gains as deemed
distributions to you. If this happens, you will be treated for U.S. federal income tax purposes as if you had received an actual distribution of the capital gains that we retain and reinvested the net after tax proceeds in us. In this situation,
you would be eligible to claim a tax credit (or, in certain circumstances, a tax refund) equal to your allocable share of the tax we paid on the capital gains deemed distributed to you. We can offer no assurance that we will achieve results that
will permit the payment of any cash distributions. See “U.S. Federal Income Tax Matters.”
If we issue senior securities, we may be prohibited from making distributions if doing so causes us to maintain the asset coverage ratios stipulated by the 1940 Act or if distributions are limited by the terms of any
of our borrowings.
We have adopted a distribution reinvestment plan pursuant to which you may elect to have the full amount of your cash distributions (net of any withholding tax) reinvested in additional Common Shares. See
“Distribution Reinvestment Plan.”
The following description is based on relevant portions of Delaware law and on our Declaration of Trust and bylaws. This summary is not necessarily complete, and we refer you to Delaware law, our
Declaration of Trust and our bylaws for a more detailed description of the provisions summarized below.
General
The terms of the Declaration of Trust authorize an unlimited number of Common Shares of any class, par value $0.001 per share, and an unlimited number of shares of preferred shares, par value $0.001 per share. The
Declaration of Trust provides that the Board of Trustees may classify or reclassify any unissued Common Shares into one or more classes or series of Common Shares or preferred shares by setting or changing the preferences, conversion or other
rights, voting powers, restrictions, or limitations as to dividends, qualifications, or terms or conditions of redemption of the shares. There is currently no market for our Common Shares, and we can offer no assurances that a market for our shares
will develop in the future. We do not intend for the shares offered under this prospectus to be listed on any national securities exchange. There are no outstanding options or warrants to purchase our shares. No shares have been authorized for
issuance under any equity compensation plans. Under the terms of our Declaration of Trust, shareholders shall be entitled to the same limited liability extended to shareholders of private Delaware for profit corporations formed under the Delaware
General Corporation Law, 8 Del. C. § 100 et. seq. Our Declaration of Trust provides that no shareholder shall be liable for any debt, claim, demand, judgment or obligation of any kind of, against or with respect to us by reason of being a
shareholder, nor shall any shareholder be subject to any personal liability whatsoever, in tort, contract or otherwise, to any person in connection with the Fund’s assets or the affairs of the Fund by reason of being a shareholder.
None of our shares are subject to further calls or to assessments, sinking fund provisions, obligations of the Fund or potential liabilities associated with ownership of the security (not including investment risks).
In addition, except as may be provided by the Board of Trustees in setting the terms of any class or series of Common Shares, no shareholder shall be entitled to exercise appraisal rights in connection with any transaction.
Outstanding Securities
| Title of Class | Amount Authorized | Amount Held by Fund for its Account | Amount Outstanding as of March 31, 2026 | |||
| | | | | |||
| | | | | |||
| | | | |
Common Shares
Under the terms of our Declaration of Trust, all Common Shares will have equal rights as to voting and, when they are issued, will be duly authorized, validly issued, fully paid and nonassessable. Dividends and distributions may be paid to the holders of our Common Shares if, as and when authorized by our Board of Trustees and declared by us out of funds legally available therefor. Except as may be provided by our Board of Trustees in setting the terms of classified or reclassified shares, our Common Shares will have no preemptive, exchange, conversion, appraisal or redemption rights and will be freely transferable, except where their transfer is restricted by federal and state securities laws or by contract and except that, in order to avoid the possibility that our assets could be treated as “plan assets,” we may require any person proposing to acquire Common Shares to furnish such information as may be necessary to determine whether such person is a benefit plan investor or a controlling person, restrict or prohibit transfers of such shares or redeem any outstanding shares for such price and on such other terms and conditions as may be determined by or at the direction of the Board of Trustees. In the event of our liquidation, dissolution or winding up, each share of our Common Shares would be entitled to share pro rata in all of our assets that are legally available for distribution after we pay all debts and other liabilities and subject to any preferential rights of holders of our preferred shares, if any preferred shares are outstanding at such time. Subject to the rights of holders of any other class or series of shares, each share of our Common Shares will be entitled to one vote on all matters submitted to a vote of shareholders, including the election of Trustees. Except as may be provided by the Board of Trustees in setting the terms of classified or reclassified shares, and subject to the express terms of any class or series of preferred shares, the holders of our Common Shares will possess exclusive voting power. There will be no cumulative voting in the election or removal of Trustees. Subject to the special rights of the holders of any class or series of preferred shares to elect Trustees, each Trustee will be elected by a plurality of the votes cast with respect to such Trustee’s election except in the case of a “contested election” (as defined in our bylaws), in which case Trustees will be elected by a majority vote of the shares outstanding and entitled to vote with respect to such contested election. Pursuant to our Declaration of Trust, our Board of Trustees may amend the bylaws to alter the vote required to elect trustees.
Class S Shares
No upfront selling commissions are paid for sales of any Class S shares, however, if you purchase Class S shares from certain financial intermediaries, they may directly charge you transaction or other fees,
including upfront placement fees or brokerage commissions, in such amount as they may determine, provided that selling agents limit such charges to 3.5% cap on NAV for Class S shares.
We pay the Distributor selling commissions over time as a shareholder servicing and/or distribution fee with respect to our outstanding Class S shares equal to 0.85% per annum of the aggregate NAV of our outstanding Class S shares, including any Class S shares issued pursuant to our distribution reinvestment plan. The Distributor reallows (pays) all or a portion of the shareholder servicing and/or distribution fees to participating brokers and servicing brokers for ongoing shareholder services performed by such brokers, and will waive shareholder servicing and/or distribution fees to the extent a broker is not eligible to receive it for failure to provide such services. Shareholder servicing and/or distribution fees are similar to a commission in that the amount an investor pays may exceed the value of services they receive.
Class D Shares
No upfront selling commissions are paid for sales of any Class D shares, however, if you purchase Class D shares from certain financial intermediaries, they may directly charge you transaction or other fees,
including upfront placement fees or brokerage commissions, in such amount as they may determine, provided that selling agents limit such charges to 1.5% cap on NAV for Class D shares.
We pay the Distributor selling commissions over time as a shareholder servicing and/or distribution fee with respect to our outstanding Class D shares equal to 0.25% per annum of the aggregate NAV of our outstanding Class D shares, including any Class D shares issued pursuant to our distribution reinvestment plan. The Distributor reallows (pays) all or a portion of the shareholder servicing and/or distribution fees to participating brokers and servicing brokers for ongoing shareholder services performed by such brokers, and will waive shareholder servicing and/or distribution fees to the extent a broker is not eligible to receive it for failure to provide such services. Shareholder servicing and/or distribution fees are similar to a commission in that the amount an investor pays may exceed the value of services they receive.
Institutional Shares
No upfront selling commissions or shareholder servicing and/or distribution fees are paid for sales of any Institutional shares and financial intermediaries will not charge you transaction or other such fees on
Institutional shares.
Institutional shares are generally available for purchase in this offering only (1) through fee-based programs, also known as wrap accounts, that provide access to Institutional shares, (2) by endowments,
foundations, pension funds and other institutional investors, (3) through participating brokers that have alternative fee arrangements with their clients to provide access to Institutional shares, (4) through certain registered investment advisers,
(5) by our executive officers and trustees and their immediate family members, as well as officers and employees of the Advisers, BlackRock or other affiliates and their immediate family members, and joint venture partners, consultants and other
service providers, or (6) by other categories of investors that we name in an amendment or supplement to this prospectus. In certain cases, where a holder of Class S or Class D shares exits a relationship with a participating broker for this
offering and does not enter into a new relationship with a participating broker for this offering, such holder’s shares may be exchanged into an equivalent NAV amount of Institutional shares.
We may also offer Class I shares to certain feeder vehicles primarily created to hold our Institutional shares, which in turn offer interests in themselves to investors. Such feeder vehicles may have additional costs
and expenses, which would be disclosed in connection with the offering of their interests.
Other Terms of Common Shares
We will cease paying the shareholder servicing and/or distribution fee on the Class S shares and Class D shares on the earlier to occur of the following: (i) a listing of Institutional shares, (ii) our merger or
consolidation with or into another entity, or the sale or other disposition of all or substantially all of our assets, or (iii) the date following the completion of the primary portion of this offering on which, in the aggregate, underwriting
compensation from all sources in connection with this offering, including the shareholder servicing and/or distribution fee and other underwriting compensation, is equal to 10% of the gross proceeds from our primary offering. In addition,
consistent with the exemptive relief allowing us to offer multiple classes of shares, at the end of the month in which the Distributor in conjunction with the transfer agent determines that total transaction or other fees, including upfront
placement fees or brokerage commissions, and shareholder servicing and/or distribution fees paid with respect to any single share held in a shareholder’s account would exceed, in the aggregate, 10% of the gross proceeds from the sale of such share
(or a lower limit as determined by the Distributor or the applicable selling agent), we will cease paying the shareholder servicing and/or distribution fee on all Class S shares and Class D shares in such shareholder’s account. We may modify this
requirement if permitted by applicable exemptive relief. At the end of the month in which such 10% (or lower) limit is met, the applicable Class S and Class D shares in such shareholder’s account will convert into a number of Institutional shares
(including any fractional shares), with an equivalent aggregate NAV as such Class S and Class D shares. In addition, immediately before any liquidation, dissolution or winding up, each Class S or Class D share will automatically convert into a
number of Institutional shares (including any fractional shares) with an equivalent NAV as such share.
Share Class Exchanges
Upon request, the Fund may, in its discretion, permit a current shareholder to exchange Common Shares of one class of the Fund held by them to another class of Common Shares; provided, however, that such shareholder
meets the eligibility requirements of the new share class or such requirements have been waived in the Fund’s discretion.
Preferred Shares
This offering does not include an offering of preferred shares. However, under the terms of the Declaration of Trust, our Board of Trustees may authorize us to issue preferred shares in one or more classes or series
without shareholder approval, to the extent permitted by the 1940 Act. The Board of Trustees has the power to fix the preferences, conversion and other rights, voting powers, restrictions, limitations as to dividends and other distributions,
qualifications and terms and conditions of redemption of each class or series of preferred shares. We do not currently anticipate issuing preferred shares in the near future. In the event we issue preferred shares, we will make any required
disclosure to shareholders. We will not offer preferred shares to the Advisers or our affiliates except on the same terms as offered to all other shareholders.
Preferred shares could be issued with terms that would adversely affect the common shareholders, provided that we may not issue any preferred shares that would limit or subordinate the voting rights of holders of our
Common Shares. Preferred shares could also be used as an anti-takeover device through the issuance of shares of a class or series of preferred shares with terms and conditions which could have the effect of delaying, deferring or preventing a
transaction or a change in control. Every issuance of preferred shares will be required to comply with the requirements of the 1940 Act. The 1940 Act requires, among other things, that: (1) immediately after issuance and before any dividend or
other distribution is made with respect to common shares and before any purchase of common shares is made, such preferred shares together with all other senior securities must not exceed an amount equal to 50% of our total assets after deducting
the amount of such dividend, distribution or purchase price, as the case may be, and (2) the holders of shares of preferred shares, if any are issued, must be entitled as a class voting separately to elect two Trustees at all times and to elect a
majority of the Trustees if distributions on such preferred shares are in arrears by two full years or more. Certain matters under the 1940 Act require the affirmative vote of the holders of at least a majority of the outstanding shares of
preferred shares (as determined in accordance with the 1940 Act) voting together as a separate class. For example, the vote of such holders of preferred shares would be required to approve a proposal involving a plan of reorganization adversely
affecting such securities.
The issuance of any preferred shares must be approved by a majority of our Independent Trustees not otherwise interested in the transaction, who will have access, at our expense, to our legal counsel or to
independent legal counsel.
Limitation on Liability of Trustees and Officers; Indemnification and Advance of Expenses
Delaware law permits a Delaware statutory trust to include in its declaration of trust a provision to indemnify and hold harmless any trustee or beneficial owner or other person from and against any and all claims
and demands whatsoever. Our Declaration of Trust generally provides that to the extent permitted by applicable law, the Fund will indemnify its Trustees, officers, controlling person and agents (each such person being an “indemnitee”) against any
liabilities and expenses, including amounts paid in satisfaction of judgments, in compromise or as fines and penalties, and reasonable counsel fees reasonably incurred by such indemnitee in connection with the defense or disposition of any action,
suit or other proceeding, whether civil or criminal, before any court or administrative or investigative body in which he or she may be or may have been involved as a party or otherwise or with which he or she may be or may have been threatened,
while acting in any such capacity by reason of his or her having acted in any such capacity, provided, however, that no indemnitee shall be indemnified under our Declaration of Trust against any liability to any person or any expense of such
indemnitee arising by reason of (i) willful misfeasance, (ii) bad faith, (iii) gross negligence, or (iv) reckless disregard of the duties involved in the conduct of his or her position. Notwithstanding the foregoing, with respect to any action,
suit or other proceeding voluntarily prosecuted by any indemnitee as plaintiff, indemnification shall be mandatory only if the prosecution of such action, suit or other proceeding by such indemnitee (1) was authorized by a majority of the Trustees
or (2) was instituted by the indemnitee to enforce his or her rights to indemnification under our Declaration of Trust in a case in which the indemnitee is found to be entitled to such indemnification. The rights to indemnification set forth in our
Declaration of Trust shall continue as to a person who has ceased to be a Trustee or officer of the Fund and shall inure to the benefit of his or her heirs, executors and personal and legal representatives. No amendment or restatement of our
Declaration of Trust or repeal of any of its provisions shall limit or eliminate any of the benefits provided to any person who at any time is or was a Trustee or officer of the Fund or otherwise entitled to indemnification under our Declaration of
Trust in respect of any act or omission that occurred prior to such amendment, restatement or repeal.
Notwithstanding the foregoing, no indemnification shall be made under our Declaration of Trust unless there has been a determination (i) by a final decision on the merits by a court or other body of competent
jurisdiction before whom the issue of entitlement to indemnification under our Declaration of Trust was brought that such indemnitee is entitled to indemnification under our Declaration of Trust or, (ii) in the absence of such a decision, by (1) a
majority vote of a quorum of those Trustees who are neither “interested persons” of the Fund (as defined in Section 2(a)(19) of the 1940 Act) nor parties to the proceeding (“Disinterested Non-Party Trustees”), that the indemnitee is entitled to
indemnification under our Declaration of Trust, or (2) if such quorum is not obtainable or even if obtainable, if such majority so directs, independent legal counsel in a written opinion concludes that the indemnitee should be entitled to
indemnification under our Declaration of Trust. In addition, no indemnification of the Sponsor shall be made under our Declaration of Trust unless all of the following conditions are met: (i) the Sponsor has determined, in good faith, that any
course of conduct which caused the loss or liability was in the best interests of the Fund; (ii) the Sponsor was acting on behalf of or performing services for the Fund; (iii) such liability or loss was not the result of negligence or misconduct by
the Sponsor; (iv) such indemnification is recoverable only out of the net assets of the Fund and not from the shareholders. In addition, no indemnification of the Sponsor or any person acting as a broker-dealer for the Fund shall be made under our
Declaration of Trust for any losses, liabilities or expenses arising from or out of an alleged violation of federal or state securities laws by such person or indemnitee unless one or more of the following conditions are met: (i) there has been a
successful adjudication on the merits of each count involving alleged securities law violations as to the indemnitee, (ii) such claims have been dismissed with prejudice on the merits by a court of competent jurisdiction as to the indemnitee or
(iii) a court of competent jurisdiction approves a settlement of the claims against the indemnitee and finds that indemnification of the settlement and the related costs should be made, and the court considering the request for indemnification has
been advised of the position of the SEC and of the published position of any state securities regulatory authority in which securities were offered or sold as to indemnification for violations of securities laws. The Fund will not incur the cost of
that portion of liability insurance which insures the Sponsor for any liabilities as to which the Sponsor is prohibited from being indemnified under our Declaration of Trust. All determinations to make advance payments in connection with the
expense of defending any proceeding shall be authorized and made in accordance with the immediately succeeding paragraph below.
The Fund shall make advance payments in connection with the expenses of defending any action with respect to which indemnification might be sought under the Declaration of Trust if the Fund receives a written
affirmation by the indemnitee of the indemnitee’s good faith belief that the standards of conduct necessary for indemnification have been met and a written undertaking to reimburse the Fund unless it is subsequently determined that the indemnitee
is entitled to such indemnification and if a majority of the Trustees determine that the applicable standards of conduct necessary for indemnification appear to have been met. In addition, at least one of the following conditions must be met: (i)
the indemnitee shall provide adequate security for his or her undertaking, (ii) the Fund shall be insured against losses arising by reason of any lawful advances, or (iii) a majority of a quorum of the Disinterested Non-Party Trustees, or if a
majority vote of such quorum so direct, independent legal counsel in a written opinion, shall conclude, based on a review of readily available facts (as opposed to a full trial-type inquiry), that there is substantial reason to believe that the
indemnitee ultimately will be found entitled to indemnification. In addition, the Fund shall make advance payment to the Sponsor or an affiliate of the Sponsor for expenses incurred as a result of any action with respect to which indemnification
might be sought under our Declaration of Trust only if all of the following are satisfied (i) the proceeding relates to acts or omissions with respect to the performance of duties or services on behalf of the Fund, (ii) the proceeding was initiated
by a third party who is not a shareholder or, the proceeding was initiated by a shareholder of the Fund acting in his or her capacity as such and a court of competent jurisdiction specifically approves such advancement, and (ii) the indemnitee
provides the Fund with a written agreement to repay the amount paid or reimbursed by the Fund, together with the applicable legal rate of interest thereon, if it is ultimately determined by final, non-appealable decision of a court of competent
jurisdiction, that the indemnitee is not entitled to indemnification.
The rights accruing to any indemnitee under the Declaration of Trust shall not exclude any other right which any person may have or hereafter acquire under the Declaration of Trust, the by-laws of the Fund, any
statute, agreement, vote of shareholders or Trustees who are “disinterested persons” (as defined in Section 2(a)(19) of the 1940 Act) or any other right to which he or she may be lawfully entitled.
The Fund shall have the power and authority to indemnify and provide for the advance payment of expenses to employees, agents and other persons providing services to the Fund or serving in any capacity at the request
of the Fund to the full extent corporations organized under the Delaware General Corporation Law may indemnify or provide for the advance payment of expenses for such persons, provided that such indemnification has been approved by a majority of
the Trustees.
Delaware Law and Certain Declaration of Trust Provisions
Organization and Duration
We were formed in Delaware on December 23, 2021, and will remain in existence until dissolved in accordance with our Declaration of Trust or pursuant to Delaware law.
Purpose
Under our Declaration of Trust, we are permitted to engage in any business activity that lawfully may be conducted by a statutory trust organized under Delaware law and, in connection therewith, to exercise all of
the rights and powers conferred upon us pursuant to the agreements relating to such business activity.
Our Declaration of Trust contains provisions that could make it more difficult for a potential acquirer to acquire us by means of a tender offer, proxy contest or otherwise. Our Board of Trustees may, without
shareholder action, authorize the issuance of shares in one or more classes or series, including preferred shares; our Board of Trustees may, without shareholder action, amend our Declaration of Trust to increase the number of our Common Shares, of
any class or series, that we will have authority to issue. These provisions are expected to discourage certain coercive takeover practices and inadequate takeover bids and to encourage persons seeking to acquire control of us to negotiate first
with our Board of Trustees. We believe that the benefits of these provisions outweigh the potential disadvantages of discouraging any such acquisition proposals because, among other things, the negotiation of such proposals may improve their terms.
Sales and Leases to the Fund
Our Declaration of Trust provides that, unless otherwise permitted by the 1940 Act or applicable guidance or exemptive relief of the SEC, except as otherwise permitted under the 1940 Act, we may not purchase or lease
assets in which the Investment Adviser or any of its affiliates have an interest unless all of the following conditions are met: (a) the transaction is fully disclosed to the shareholders in a prospectus or in a periodic report filed with the SEC
or otherwise, and the transaction occurs at the formation of the Fund; and (b) the assets are sold or leased upon terms that are reasonable to us and at a price not to exceed the lesser of cost or fair market value as determined by an independent
expert. However, the Investment Adviser may purchase assets in its own name (and assume loans in connection) and temporarily hold title, for the purposes of facilitating the acquisition of the assets, the borrowing of money, obtaining financing for
us, or the completion of construction of the assets, so long as all of the following conditions are met: (i) the assets are purchased by us at a price no greater than the cost of the assets to the Investment Adviser; (ii) all income generated by,
and the expenses associated with, the assets so acquired will be treated as belonging to us; and (iii) there are no other benefits arising out of such transaction to the Investment Adviser apart from compensation otherwise permitted by the NASAA
Omnibus Guidelines.
Sales and Leases to our Investment Adviser, Trustees or Affiliates
Our Declaration of Trust provides that, unless otherwise permitted by the 1940 Act or applicable guidance or exemptive relief of the SEC, we may not sell assets to the Investment Adviser or any of its affiliates
unless such sale is approved by the holders of a majority of our outstanding Common Shares. Our Declaration of Trust also provides that we may not lease assets to the Investment Adviser or any affiliate thereof unless all of the following
conditions are met: (a) the transaction is fully disclosed to the shareholders in a prospectus or in a periodic report filed with the SEC or otherwise, and the transaction occurs at the formation of the Fund; and (b) the terms of the transaction
are fair and reasonable to us.
Loans
Our Declaration of Trust provides that, unless otherwise permitted by the 1940 Act or applicable guidance or exemptive relief of the SEC, except for the advancement of indemnification funds, no loans, credit
facilities, credit agreements or otherwise may be made by us to the Investment Adviser or any of its affiliates.
Commissions on Financing, Refinancing or Reinvestment
Our Declaration of Trust provides that, unless otherwise permitted by the 1940 Act or applicable guidance or exemptive relief of the SEC, we generally may not pay, directly or indirectly, a commission or fee to the
Investment Adviser or any of its affiliates in connection with the reinvestment of cash available for distribution, available reserves, or the proceeds of the resale, exchange or refinancing of assets.
Lending Practices
Our Declaration of Trust provides that, with respect to financing made available to us by the Investment Adviser, the Investment Adviser may not receive interest in excess of the lesser of the Investment Adviser’s
cost of funds or the amounts that would be charged by unrelated lending institutions on comparable loans for the same purpose. The Investment Adviser may not impose a prepayment charge or penalty in connection with such financing and the Investment
Adviser may not receive points or other financing charges. In addition, the Investment Adviser will be prohibited from providing financing to us with a term in excess of 12 months.
Number of Trustees; Vacancies; Removal
Our Declaration of Trust provides that the number of Trustees will be set by our Board of Trustees, provided that the number of Trustees shall be no less than two nor more than fifteen. Our Declaration of Trust
provides that a majority of our entire Board of Trustees may at any time increase or decrease the number of Trustees. Our Declaration of Trust provides that the number of Trustees may not be less than two. Except as otherwise required by applicable
requirements of the 1940 Act and as may be provided by our Board of Trustees in setting the terms of any class or series of preferred shares, pursuant to an election under our Declaration of Trust, any and all vacancies on our Board of Trustees may
be filled by the affirmative vote of a majority of the remaining Trustees in office, even if the remaining Trustees do not constitute a quorum or by the nomination by the Trustees of an individual for election by shareholders at a meeting of
shareholders, and any Trustee elected to fill a vacancy will serve until the next meeting of shareholders at which Trustees are elected and until a successor is elected and qualified, subject to any applicable requirements of the 1940 Act.
Our Declaration of Trust provides that a Trustee may be removed (provided the aggregate number of Trustees after such removal shall not be less than two) (i) for cause only, and not without cause, by action taken by
a majority of the remaining Trustees followed by the holders of at least seventy-five percent (75%) of the shares then entitled to vote in an election of such Trustee, or (ii) upon a vote by the holders of more than fifty percent (50%) of the
outstanding shares of the Fund entitled to vote in an election of such Trustee, with or without cause, without concurrence by the Trustees.
We have a total of five members of our Board of Trustees, three of whom are Independent Trustees. Each Trustee will hold office until his or her successor is duly elected and qualified. While we do not intend to list
our shares on any securities exchange, if any class of our shares is listed on a national securities exchange, our Board of Trustees will be divided into three classes of Trustees serving staggered terms of three years each.
The Fund’s bylaws generally require that advance notice be given to the Fund in the event a shareholder desires to nominate a person for election to the Board or to transact any other business at a special meeting of
shareholders.
Notice of any such nomination or business must be sent to the Secretary of the Fund by registered mail, return receipt requested, requesting the Secretary to call a special meeting. Any notice by a shareholder must
be accompanied by certain information as provided in the bylaws. Reference should be made to the bylaws on file with the SEC for the full text of these provisions.
Action by Shareholders
Our bylaws provide that shareholder action can be taken only at an annual or special meeting of shareholders or by written consent in lieu of a meeting. The shareholders will only have voting rights as required by
the 1940 Act or as otherwise provided for in the Declaration of Trust. Upon a vote by holders of a majority of the then outstanding shares, our shareholders may, without the necessity of any concurrence by the Board of Trustees:
| • |
modify the Declaration of Trust;
|
| • |
dissolve the Fund;
|
| • |
cause the Fund to sell all or substantially all of the Fund’s assets other than in the ordinary course of the Fund’s business. Without the approval of holders of a majority of the then outstanding shares entitled to vote on the matter,
our Sponsor may not:
|
| • |
modify the Declaration of Trust except for amendments which do not adversely affect the rights of shareholders;
|
| • |
appoint a new investment adviser (other than a sub-adviser pursuant to the terms of an investment advisory agreement and applicable law);
|
| • |
sell all or substantially all of the Fund’s assets other than in the ordinary course of the Fund’s business or as otherwise permitted by law;
|
| • |
except as permitted under the investment advisory agreement, cause the Investment Adviser to voluntarily withdraw as our investment adviser unless such withdrawal would not affect the tax status of the Fund and would not materially
adversely affect the shareholders; or
|
| • |
cause the merger or other reorganization of the Fund.
|
Under our Declaration of Trust and bylaws, the Fund is required to hold an annual meeting of shareholders during each fiscal year. The Board of Trustees is divided into three classes. At each annual meeting of
shareholders, the term of only one class of Trustees expires, and only the Trustees in that one class stand for re-election. Trustees standing for election at an annual meeting of shareholders are elected to serve until the third annual meeting of
shareholders following their election and when their successors are duly elected and qualify. This provision could delay for up to two years the replacement of a majority of the Board of Trustees.
Special meetings may be called by the Trustees and certain of our officers, and will be limited to the purposes for any such special meeting set forth in the notice thereof. In addition, our Declaration of Trust
provides that, subject to the satisfaction of certain procedural and informational requirements by the shareholders requesting the meeting, a special meeting of shareholders will be called by the Secretary of the Fund upon the written request of
shareholders entitled to cast ten percent (10%) or more of the outstanding shares of the Fund or class or series of shares having voting rights on the matter to be voted on at the meeting. Within ten days of receipt of such request of shareholders,
we will provide shareholders with written notice of the meeting and the purpose(s) of the meeting. Any special meeting called upon such request of shareholders is required to be held not less than 15 nor more than 60 days after we provide notice to
shareholders of the special meeting. These provisions will have the effect of significantly reducing the ability of shareholders being able to have proposals considered at a meeting of shareholders.
With respect to special meetings of shareholders, only the business specified in our notice of the meeting may be brought before the meeting. Nominations of persons for election to the Board of Trustees at a special
meeting may be made only (1) by or at the direction of the Board of Trustees or any duly authorized committee thereof or (2) by a shareholder of record who is entitled to vote at the meeting and who has complied with the advance notice provisions
of the bylaws.
The purpose of requiring shareholders to give us advance notice of nominations and other business is to afford our Board of Trustees a meaningful opportunity to consider the qualifications of the proposed nominees
and the advisability of any other proposed business and, to the extent deemed necessary or desirable by our Board of Trustees, to inform shareholders and make recommendations about such qualifications or business, as well as to provide a more
orderly procedure for conducting meetings of shareholders. Although our Declaration of Trust does not give our Board of Trustees any power to disapprove shareholder nominations for the election of Trustees or proposals recommending certain action,
they may have the effect of precluding a contest for the election of Trustees or the consideration of shareholder proposals if proper procedures are not followed and of discouraging or deterring a third party from conducting a solicitation of
proxies to elect its own slate of trustees or to approve its own proposal without regard to whether consideration of such nominees or proposals might be harmful or beneficial to us and our shareholders.
Amendment of the Declaration of Trust and Bylaws
Our Declaration of Trust may be amended, (i) after a majority of the Trustees have approved a resolution therefor, by the affirmative vote of a majority of the shares present in person or represented by proxy and
entitled to vote on the subject matter, or (ii) upon a vote by the holders of a majority of the then outstanding shares, without concurrence by the Trustees.
The Trustees may amend or supplement our Declaration of Trust without any vote of shareholders of any class or series (i) to divide the shares of the Fund into one or more classes or additional classes, or one or
more series of any such class or classes, (ii) to determine the rights, powers, preferences, limitations and restrictions of any class or series of shares, (iii) to change the name of the Fund or any class or series of shares, (iv) to make any
change that does not adversely affect the relative rights or preferences of any shareholder, as they may deem necessary, (v) to conform the Declaration of Trust to the requirements of the 1940 Act or any other applicable federal laws or regulations
or the requirements of the regulated investment company provisions of the Code, or (vi) to comply or conform the Declaration of Trust as necessary to satisfy the NASAA Omnibus Guidelines or the statutes, rules, regulations or requests of any state
securities regulator, or otherwise necessary for the Fund to publicly offer shares in any state as determined by the Trustees in good faith.
Conversion
To convert the Fund to an open-end investment company, the Declaration of Trust requires the approval of a majority of the Trustees followed by the affirmative vote of the holders of at least seventy-five percent
(75%) of the outstanding shares of each affected class or series of shares of the Fund, voting separately as a class or series, unless such conversion has been approved by at least eighty percent (80%) of the Trustees, in which case the affirmative
vote of a “majority of the outstanding voting securities” (as defined in the 1940 Act) with each class and series of shares voting together as a single class shall be required.
Dissolution of the Fund
The Fund may be dissolved at any time upon affirmative vote by not less than eighty percent (80%) of the Trustees, or the vote of the holders of a majority of the then outstanding shares entitled to vote on the
matter, without the concurrence of the Trustees.
Derivative Actions
No person, other than a Trustee, who is not a shareholder shall be entitled to bring any derivative action, suit or other proceeding on behalf of the Fund. In addition to the requirements set forth in Section 3816 of
the Delaware Statutory Trust Statute, a shareholder may bring a derivative action on behalf of the Fund only if the following conditions are met: (i) the shareholder or shareholders must make a pre-suit demand upon the Board of Trustees to bring
the subject action unless an effort to cause the Board of Trustees to bring such an action is not likely to succeed; and a demand on the Board of Trustees shall only be deemed not likely to succeed and therefore excused if a majority of the Board
of Trustees, or a majority of any committee established to consider the merits of such action, is composed of Board of Trustees who are not “independent Trustees” (as that term is defined in the Delaware Statutory Trust Statute); and (ii) unless a
demand is not required under clause (i) above, the Board of Trustees must be afforded a reasonable amount of time to consider such shareholder request and to investigate the basis of such claim; and the Board of Trustees shall be entitled to retain
counsel or other advisors in considering the merits of the request. The Board of Trustees may designate a committee of one or more Trustees to consider a shareholder demand.
Exclusive Delaware Jurisdiction
Each Trustee, each officer and each person legally or beneficially owning a share or an interest in a share of the Fund (whether through a broker, dealer, bank, trust company or clearing corporation or an agent of
any of the foregoing or otherwise), to the fullest extent permitted by law, including Section 3804(e) of the Delaware Statutory Trust Statute, (i) irrevocably agrees that any claims, suits, actions or proceedings asserting a claim arising out of or
relating in any way to the Fund or our shares, the Delaware Statutory Trust Statute or the Declaration of Trust (including, without limitation, any claims, suits, actions or proceedings to interpret, apply or enforce (A) the provisions of the
Declaration of Trust, (B) the duties (including fiduciary duties), obligations or liabilities of the Fund to the shareholders or the Board of Trustees, or of officers or the Board of Trustees to the Fund, to the shareholders or each other, (C) the
rights or powers of, or restrictions on, the Fund, the officers, the Board of Trustees or the shareholders, (D) any provision of the Delaware Statutory Trust Statute or other laws of the State of Delaware pertaining to trusts made applicable to the
Fund pursuant to Section 3809 of the Delaware Statutory Trust Statute or (E) any other instrument, document, agreement or certificate contemplated by any provision of the Delaware Statutory Trust Statute or the Declaration of Trust relating in any
way to the Fund (regardless, in each case, of whether such claims, suits, actions or proceedings (x) sound in contract, tort, fraud or otherwise, (y) are based on common law, statutory, equitable, legal or other grounds or (z) are derivative or
direct claims)), shall be exclusively brought in the Court of Chancery of the State of Delaware or, if such court does not have subject matter jurisdiction thereof, the Superior Court of the State of Delaware, (ii) irrevocably submits to the
exclusive jurisdiction of such courts in connection with any such claim, suit, action or proceeding, (iii) irrevocably agrees not to, and waives any right to, assert in any such claim, suit, action or proceeding that (A) it is not personally
subject to the jurisdiction of such courts or any other court to which proceedings in such courts may be appealed, (B) such claim, suit, action or proceeding is brought in an inconvenient forum or (C) the venue of such claim, suit, action or
proceeding is improper, (iv) consents to process being served in any such claim, suit, action or proceeding by mailing, certified mail, return receipt requested, a copy thereof to such party at the address in effect for notices hereunder, and
agrees that such service shall constitute good and sufficient service of process and notice thereof; provided nothing in clause (iv) hereof shall affect or limit any right to serve process in any other manner permitted by law and (v) irrevocably
waives any and all right to trial by jury in any such claim, suit, action or proceeding. This exclusive jurisdiction provision does not apply to any claim under the U.S. federal or state securities laws. The exclusive jurisdiction provision may
increase costs for a shareholder to bring a claim and may discourage claims or limit investors’ ability to bring a claim in a judicial forum that they find favorable.
Restrictions on Roll-Up Transactions
In connection with a proposed “roll-up transaction,” which, in general terms, is any transaction involving the acquisition, merger, conversion or consolidation, directly or indirectly, of us and the issuance of
securities of an entity that would be created or would survive after the successful completion of the roll-up transaction, we will obtain an appraisal of all of our properties from an independent expert. In order to qualify as an independent expert
for this purpose, the person or entity must have no material current or prior business or personal relationship with us and must be engaged to a substantial extent in the business of rendering opinions regarding the value of assets of the type held
by us, who is qualified to perform such work. Our assets will be appraised on a consistent basis, and the appraisal will be based on the evaluation of all relevant information and will indicate the value of our assets as of a date immediately prior
to the announcement of the proposed roll-up transaction. The appraisal will assume an orderly liquidation of our assets over a 12-month period. The terms of the engagement of such independent expert will clearly state that the engagement is for our
benefit and the benefit of our shareholders. We will include a summary of the appraisal, indicating all material assumptions underlying the appraisal, in a report to the shareholders in connection with the proposed roll-up transaction. If the
appraisal will be included in a prospectus used to offer the securities of the roll-up entity, the appraisal will be filed with the SEC and the states as an exhibit to the Registration Statement for the offering.
In connection with a proposed roll-up transaction, the person sponsoring the roll-up transaction must offer to the shareholders who vote against the proposal a choice of:
| • |
accepting the securities of the entity that would be created or would survive after the successful completion of the roll-up transaction offered in the proposed roll-up transaction; or
|
| • |
one of the following:
|
| • |
remaining as shareholders and preserving their interests in us on the same terms and conditions as existed previously; or
|
| • |
receiving cash in an amount equal to their pro rata share of the appraised value of our net assets. We are prohibited from participating in any proposed roll-up transaction:
|
| • |
which would result in shareholders having voting rights in the entity that would be created or would survive after the successful completion of the roll-up transaction that are less than those provided in the Declaration of Trust,
including rights with respect to the election and removal of trustees or directors, annual and special meetings, amendments to the governing documents and our dissolution;
|
| • |
which includes provisions that would operate as a material impediment to, or frustration of, the accumulation of Common Shares by any purchaser of the securities of the entity that would be created or would survive after the successful
completion of the roll-up transaction, except to the minimum extent necessary to preserve the tax status of such entity, or which would limit the ability of an investor to exercise the voting rights of its securities of the entity that
would be created or would survive after the successful completion of the roll-up transaction on the basis of the number of shares held by that investor;
|
| • |
in which shareholders’ rights to access to records of the entity that would be created or would survive after the successful completion of the roll-up transaction will be less than those provided in the Declaration of Trust;
|
| • |
in which we would bear any of the costs of the roll-up transaction if the shareholders reject the roll-up transaction; or
|
| • |
unless the organizational documents of the entity that would survive the roll-up transaction provide that neither its adviser nor its intermediary-manager may vote or consent on matters submitted to its shareholders regarding the removal
of its adviser or any transaction between it and its adviser or any of its affiliates.
|
Access to Records
Any shareholder with proper purpose may: (i) in person or by agent, on written request, inspect and copy at all reasonable times the books and records and ledger of the Fund; (ii) present to any officer or resident
agent of the Fund a written request for a statement of its affairs; and (iii) in the event the Fund does not maintain the original or a duplicate ledger at its principal office, present to any officer or resident agent of the Fund a written request
for the shareholder list. A copy of the shareholder list, requested in accordance with the Declaration of Trust shall be mailed within ten (10) days of the request The shareholder list shall be updated at least quarterly to reflect changes in the
information contained therein. The Fund may impose a reasonable charge for expenses incurred in reproduction pursuant to the shareholder request. A holder of common shares may request a copy of the shareholder list in connection with matters
relating to shareholders’ voting rights, the exercise of shareholder rights under federal proxy laws or for any other proper and legitimate purpose. Each shareholder who receives a copy of the shareholder list shall keep such list confidential and
shall sign a confidentiality agreement to the effect that such shareholder will keep the shareholder list confidential and share such list only with its employees, representatives or agents who agree in writing to maintain the confidentiality of
the shareholder list.
If the Investment Adviser or Trustees neglect or refuse to exhibit, produce or mail a copy of the shareholder list as requested, the Investment Adviser and the Trustees shall be liable to any shareholder requesting
the list for the costs, including attorneys’ fees, incurred by that shareholder for compelling the production of the shareholder list, and for actual damages suffered by any shareholder by reason of such refusal or neglect. It shall be a defense
that the actual purpose and reason for the requests for inspection or for a copy of the shareholder list is to secure such list of shareholders or other information for the purpose of selling such list or copies thereof, or of using the same for a
commercial purpose other than in the interest of the applicant as a shareholder relative to the affairs of the Fund. The Fund may require the shareholder requesting the shareholder list to represent that the list is not requested for a commercial
purpose unrelated to the shareholder’s interest in the Fund.
Reports to Shareholders
Within 45 days after each fiscal quarter, we will distribute our quarterly report on Form 10-Q to all shareholders of record. In addition, we will distribute our annual report on Form 10-K to all shareholders within
90 days after the end of each calendar year, which must contain, among other things, a breakdown of the expenses reimbursed by us to the Investment Adviser. These reports will also be available through our website at www.bdebt.com and on
the SEC’s website at www.sec.gov.
Subject to availability, you may authorize us to provide prospectuses, prospectus supplements, annual reports and other information, or documents, electronically by so indicating on your subscription agreement, or by
sending us instructions in writing in a form acceptable to us to receive such documents electronically. Unless you elect in writing to receive documents electronically, all documents will be provided in paper form by mail. You must have internet
access to use electronic delivery. While we impose no additional charge for this service, there may be potential costs associated with electronic delivery, such as on-line charges. Documents will be available through our website. You may access and
print all documents provided through this service. As documents become available, we will notify you of this by sending you an e-mail message that will include instructions on how to retrieve the document. If our e-mail notification is returned to
us as “undeliverable,” we will contact you to obtain your updated e-mail address. If we are unable to obtain a valid e-mail address for you, we will resume sending a paper copy by regular U.S. mail to your address of record. You may revoke your
consent for electronic delivery at any time and we will resume sending you a paper copy of all required documents. However, in order for us to be properly notified, your revocation must be given to us a reasonable time before electronic delivery
has commenced. We will provide you with paper copies at any time upon request. Such request will not constitute revocation of your consent to receive required documents electronically.
Conflict with Applicable Law or Regulation
Our Declaration of Trust provides that, if and to the extent that any provision of our Declaration of Trust conflicts with any provision of the 1940 Act, the regulated investment company provisions of the Code or
with other applicable laws or regulations, the conflicting provision shall be deemed never to have constituted a part of our Declaration of Trust.
Mandatory Redemption at the Option of the Trust
Pursuant to the Declaration of Trust, the Fund shall have the right at its option and at any time to redeem Shares from any shareholder at the NAV thereof if at such time, and as a result of one or more redemptions
of one or more Shares by such shareholder or the transfer of one or more Shares by such shareholder, the aggregate NAV of the Shares in such shareholder’s account with the Fund or any class of Shares is, as a result (in whole or part) of a
redemption or transfer of Shares, less than the minimum initial investment amount then applicable for investments in the Fund or the applicable class of Shares, or such lesser amount, as the Trustees may from time to time determine. In addition,
the Board of Trustees may authorize the repurchase of Shares, or any portion of them, of a shareholder or any person acquiring Shares from or through a shareholder, without consent or other action by the shareholder or other person, for any reason,
including, without limitation, if the Board of Trustees in its sole discretion determines that (a) Shares have been transferred in violation of the Declaration of Trust or the By-Laws; (b) ownership of the Shares by a shareholder or other person is
likely to cause the Fund to be in violation of, or subject the Fund to new or additional registration or regulation under the securities, commodities or other laws of the United States or any other relevant jurisdiction; (c) continued ownership of
the Shares by a shareholder may be harmful or injurious to the business or reputation of the Fund, or may subject the Fund or any shareholder to an undue risk of adverse tax or other fiscal or regulatory consequences; or (d) any of the
representations and warranties made by a shareholder or other person in connection with the acquisition of Shares was not true when made or has ceased to be true.
We determine our NAV for each class of shares each month as of the last day of each calendar month. The NAV per share for each class of shares is determined by dividing the value of total assets attributable to the
class minus liabilities attributable to the class by the total number of Common Shares outstanding of the class at the date as of which the determination is made.
As discussed in further detail herein, although the Fund will determine its NAV monthly, such NAV is subject to valuation risk. The Board of Trustees has designated the Investment Adviser as the Valuation Designee
for the Fund pursuant to the provisions of Rule 2a-5 under the 1940 Act. The Valuation Designee has adopted and the Board of Trustees has approved, Valuation Procedures pursuant to which the Valuation Designee will value the Fund’s investments. In
accordance with the Valuation Procedures, the Fund’s investments for which market quotations are readily available are valued at market value. Market values for various types of securities and other instruments are determined on the basis of
closing prices or last sale prices on an exchange or other market.
When market quotations are not readily available or are deemed to be inaccurate or unreliable, the Fund values its investments at fair value as determined in good faith pursuant to the Valuation Procedures.
Valuation of securities held by the Fund is as follows:
Fixed Income Investments. Fixed income securities are generally valued using such securities’ most recent bid prices provided directly from one or more broker-dealers, market
makers, or independent third-party pricing services which may use matrix pricing and valuation models to derive values, each in accordance with the Valuation Procedures. Pricing services generally value fixed-income securities assuming orderly
transactions of an institutional round lot size, but may be held or transactions may be conducted in such securities in smaller, odd lot sizes. Odd lots may trade at lower prices than institutional round lots. The amortized cost method of valuation
may be used with respect to debt obligations with sixty days or less remaining to maturity unless the Valuation Designee determines such method does not represent fair value. Loan participation notes are generally valued at the mean of the last
available bid prices from one or more brokers or dealers as obtained from independent third-party pricing services. Certain fixed income investments including ABS and mortgage-related securities may be valued based on valuation models that consider
the estimated cash flows of each tranche of the entity, establish a benchmark yield and develop an estimated tranche specific spread to the benchmark yield based on the unique attributes of the tranche. Fixed income securities for which market
quotations are not readily available may be valued by third-party pricing services that make a valuation determination by securing transaction data (e.g., recent representative bids), credit quality information, perceived market movements, news,
and other relevant information and by other methods, which may include consideration of: yields or prices of securities of comparable quality, coupon, maturity and type; indications as to values from dealers; and general market conditions.
Options, Futures, Swaps and Other Derivatives. Exchange-traded equity options for which market quotations are readily available are valued at the mean of the last bid and ask
prices as quoted on the exchange or the board of trade on which such options are traded. In the event that there is no mean price available for an exchange traded equity option held by the Fund on a day on which the Fund values such option, the
last bid (long positions) or ask (short positions) price, if available, will be used as the value of such option. If no bid or ask price is available on a day on which the Fund values such option, the prior day’s price will be used, unless the
Valuation Designee determines that such prior day’s price no longer reflects the fair value of the option in which case such option will be treated as a fair value asset. OTC derivatives may be valued using a mathematical model that may incorporate
a number of market data factors. Financial futures contracts and options thereon, which are traded on exchanges, are valued at their last sale price or settle price as of the close of such exchanges. Swap agreements and other derivatives are
generally valued monthly based upon quotations from market makers or by a pricing service in accordance with the Valuation Procedures.
General Valuation Information. In determining the market value of portfolio investments, the Valuation Designee may utilize independent third party pricing services, which may
use, without limitation, a matrix or formula method that takes into consideration market indexes, matrices, yield curves and other specific adjustments. This may result in the securities being valued at a price different from the price that would
have been determined had the matrix or formula method not been used. All cash, receivables and current payables are carried on the Fund’s books at their face value.
Prices obtained from independent third party pricing services, broker-dealers or market makers to value the Fund’s securities and other assets and liabilities are based on information available at the time of
valuation of the Fund’s assets and liabilities. In the event that a pricing service quotation is revised or updated subsequent to the day on which such security is valued, the revised pricing service quotation generally will be applied
prospectively. Such determination shall be made considering pertinent facts and circumstances surrounding such revision.
In the event that application of the methods of valuation discussed above result in a price for a security which is deemed not to be representative of the fair market value of such security, the security will be
valued in accordance with a method specified by the Valuation Designee as reflecting fair value. All other assets and liabilities (including securities for which market quotations are not readily available) held by the Fund (including restricted
securities) are valued at fair value as determined in good faith by the Valuation Designee. Any assets and liabilities which are denominated in a foreign currency are translated into U.S. dollars at the prevailing rates of exchange. As a result,
the NAV of the Fund’s shares may be affected by changes in the value of currencies in relation to the U.S. dollar. International markets are sometimes open on days when U.S. markets are closed, which means that the value of foreign securities owned
by the Fund could change on days when Fund shares cannot be bought or sold. The value of investments traded in markets outside the U.S. or denominated in currencies other than the U.S. dollar may be affected significantly on a day that the NYSE is
closed, and the NAV of the Fund’s shares may change on days when an investor is not able to purchase shares or have their shares repurchased by the Fund. The calculation of the Fund’s NAV may not take place contemporaneously with the determination
of the prices of foreign securities used in NAV calculations.
Fair Value. When market quotations are not readily available or are believed by the Valuation Designee to be inaccurate or unreliable, the Fund’s investments are valued at
fair value (“Fair Value Assets”). Fair Value Assets are valued by the Investment Adviser in accordance with the Valuation Procedures. The Valuation Designee may conclude that a market quotation is not readily available, inaccurate or unreliable if
a security or other asset or liability does not have a price source due to its complete lack of trading, if the Valuation Designee believes a market quotation from a broker-dealer or other source is unreliable (e.g., where it varies significantly
from a recent trade, or no longer reflects the fair value of the security or other asset or liability subsequent to the most recent market quotation), where the security or other asset or liability is only thinly traded or due to the occurrence of
a significant event subsequent to the most recent market quotation. For this purpose, a “significant event subsequent to the most recent market quotation” is deemed to occur if the Valuation Designee determines, in its business judgment prior to or
at the time of pricing the Fund’s assets or liabilities, that it is likely that the event will cause a material change to the last exchange closing price or closing market price of one or more assets or liabilities held by the Fund. Examples of
these events could include cases where a security trades infrequently causing a quoted purchase or sale price to become stale, where markets quotations vary substantially among market makers, or where there is a wide bid-ask spread or significant
increase in the bid-ask spread. On any date the NYSE is open and the primary exchange on which a foreign asset or liability is traded is closed, such asset or liability will be valued using the prior day’s price, provided that the Valuation
Designee is not aware of any significant event or other information that would cause such price to no longer reflect the fair value of the asset or liability, in which case such asset or liability would be treated as a Fair Value Asset. For certain
foreign securities, a third-party vendor supplies evaluated, systematic fair value pricing based upon the movement of a proprietary multi-factor model after the relevant foreign markets have closed. This systematic fair value pricing methodology is
designed to correlate the prices of foreign securities following the close of the local markets to the price that might have prevailed as of the Fund’s pricing time.
A substantial portion of the Fund’s assets are expected to consist of securities of private companies for which there are no readily available market quotations. The information available in the marketplace for such
companies, their securities and the status of their businesses and financial conditions is often extremely limited, outdated and difficult to confirm. Such securities are valued by the Fund monthly at fair value as determined pursuant to the
principles and methods of valuation set forth in the Valuation Designee's policies and procedures adopted for the Fund by the Valuation Designee and approved by the Board of Trustees. In determining fair value each month, the Valuation Designee is
required to consider all appropriate factors relevant to value and all indicators of value available to the Fund. The determination of fair value necessarily involves judgment in evaluating this information in order to determine the price that the
Fund might reasonably expect to receive for the security upon its current sale. The most relevant information may often be that information which is provided by the issuer of the securities. Fair valuations, particularly those of private companies
and privately originated instruments, often reflect only periodic information received by the Investment Adviser about the issuer’s financial condition and/or business operations, which may be on a lagged basis and can be based on estimates. Given
the nature, timeliness, amount and reliability of information provided by the issuer, fair valuations may become more difficult and uncertain as such information is unavailable or becomes outdated. Because the Fund will value all of its assets
monthly, the Fund is subject to greater risk that the information available to determine fair value on any given day is uncertain, incomplete and potentially unreliable and, as a result, that the prices assigned to fair valued securities may not in
fact represent approximately the price that the Fund could receive upon their current sale.
Certain investments for which market quotations are not readily available or for which market quotations are deemed not to represent fair value are valued on a monthly basis utilizing a market approach, an income
approach, or both approaches, as appropriate. The market approach uses prices and other relevant information generated by market transactions involving identical or comparable assets or liabilities (including a business). The income approach uses
valuation techniques to convert future amounts (for example, cash flows or earnings) to a single present amount (discounted). The measurement is based on the value indicated by current market expectations about those future amounts. In following
these approaches, the types of factors that the Valuation Designee may take into account in determining the fair value of Fund investments include, as relevant and among other factors: available current market data (e.g., information available
through regulatory filings, press releases, news feeds and financial press), including relevant and applicable market trading and transaction comparables, applicable market yields and multiples, information provided by the company (e.g., letters to
investors, financials, information provided pursuant to financial document reporting obligations), security covenants, call protection provisions, information rights, the nature and realizable value of any collateral, the portfolio company’s
ability to make payments, its earnings and discounted cash flows, the markets in which the portfolio company does business, comparisons of financial ratios of peer companies that are public, M&A comparables and enterprise values.
With respect to the Fund’s investments for which market quotations are not readily available or for which market quotations are deemed not to represent fair value, the Valuation Designee has approved a valuation
process that takes into account a variety of inputs.
When determining the price for a Fair Value Asset, the Valuation Designee shall seek to determine the price that the Fund might reasonably expect to receive from the current sale of that asset or liability in an
arm’s-length transaction. The price generally may not be determined based on what the Fund might reasonably expect to receive for selling an asset or liability at a later time or if it holds the asset or liability to maturity. Fair value
determinations shall be based upon all available factors that the Valuation Designee deems relevant at the time of the determination, and may be based on analytical values determined by the Investment Adviser using proprietary or third party
valuation models.
Fair value represents a good faith approximation of the value of an asset or liability. The fair value of one or more assets or liabilities may not, in retrospect, be the price at which those assets or liabilities
could have been sold during the period in which the particular fair values were used in determining the Fund’s NAV, and the differences between the fair value of the assets and the prices at which those assets are ultimately sold may be
significant. As a result, the Fund’s sale or repurchase of its shares at NAV, at a time when a holding or holdings are valued at fair value, may have the effect of diluting or increasing the economic interest of existing shareholders. Information
that becomes known to the Fund or its agents after the NAV has been calculated in a particular month will not be used to retroactively adjust the price of a security or the NAV determined earlier that month.
The Fund’s annual audited financial statements, which are prepared in accordance with U.S. GAAP, follow the requirements for valuation set forth in ASC 820, which defines and establishes a hierarchical disclosure
framework for measuring fair value under U.S. GAAP and expands financial statement disclosure requirements relating to fair value measurements.
The three-level hierarchy for fair value measurement is defined as follows:
Level 1: Quoted prices in active markets for identical assets
Level 2: Other direct and indirect observable market inputs (for example, quoted prices in inactive markets or quotes for comparable investments)
Level 3: Independent third-party valuation sources that employ significant unobservable inputs
As of December 31, 2025, none of our investments were categorized as Level 1, 26.9% were categorized as Level 2 and 73.1% were Level 3 investments valued based on valuations by independent third party sources.
In certain cases, the inputs used to measure fair value may fall into different levels of the fair value hierarchy. In such cases, an investment’s level within the fair value hierarchy is based on the lowest level of
input that is significant to the overall fair value measurement. The Valuation Designee’s assessment of the significance of a particular input to the fair value measurement in its entirety requires judgment and consideration of factors specific to
the investment.
The Fund expects that it will hold a high proportion of Level 3 investments relative to its total investments, which is directly related to the Fund’s investment philosophy and target portfolio.
Generally, ASC 820 and other accounting rules applicable to BDCs and various assets in which they invest are evolving and subject to change. Such changes may adversely affect the Fund. For example, the evolution of
rules governing the determination of the fair market value of assets or liabilities to the extent such rules become more stringent would tend to increase the cost and/or reduce the availability of third-party determinations of fair market value.
This may in turn increase the costs associated with selling assets or affect their liquidity due to the Fund’s inability to obtain a third-party determination of fair market value.
The Investment Adviser and its affiliates act as investment advisers to other clients that may invest in securities for which no public market price exists. Valuation determinations by the Investment Adviser or its
affiliates for other clients may result in different values than those ascribed to the same security owned by the Fund. Consequently, the fees charged to the Fund may be different than those charged to other clients, given that the method of
calculating the fees takes the value of all assets, including assets carried at different valuations, into consideration.
The Fund reserves the right to reprocess purchase or repurchase transactions that were initially processed at an NAV that is subsequently adjusted and to recover amounts from (or distribute amounts to) shareholders
accordingly based on the adjusted NAV. There are various scenarios in which the Fund may reprocess a purchase or repurchase transaction, including, but not limited to, a material NAV error resulting from incorrect or late pricing of a security or
to effect an as-of trade. In these instances, all transactions occurring subsequent to an incorrect NAV are reprocessed with the corrected NAV through the current date.
Determination of fair value involves subjective judgments and estimates.
We will report our NAV per share as of the last day of each month generally within 20 business days of the last day of each month. Our most recently determined NAV per share for each class of shares will be available
through our website: www.bdebt.com.
General
We are offering a maximum of $5,000,000,000 in Common Shares pursuant to this prospectus on a “best efforts” basis through BlackRock Investments, LLC, the Distributor, a registered broker-dealer affiliated with the
Investment Adviser. Because this is a “best efforts” offering, the Distributor must only use its best efforts to sell the shares, which means that no underwriter, broker or other person will be obligated to purchase any shares. The Distributor is
headquartered at 50 Hudson Yards, New York, New York 10001.
The shares are being offered on a “best efforts” basis, which means generally that the Distributor is required to use only its best efforts to sell the shares and it has no firm commitment or obligation to purchase
any of the shares. The Fund intends that the Common Shares offered pursuant to this prospectus will not be listed on any national securities exchange, and neither the Distributor nor the participating brokers intend to act as market-makers with
respect to our Common Shares. Because no public market is expected for the shares, shareholders will likely have limited ability to sell their shares until there is a liquidity event for the Fund.
We are offering to the public three classes of Common Shares: Class S shares, Class D shares and Institutional shares. We are offering to sell any combination of share classes with a dollar value up to the maximum
offering amount. All investors must meet the suitability standards discussed in the section of this prospectus entitled “Suitability Standards.” The share classes have different ongoing shareholder servicing and/or distribution fees.
Class S shares and Class D shares are available through brokerage and transactional-based accounts. Institutional shares are generally available for purchase in this offering only (1) through fee-based programs, also
known as wrap accounts, that provide access to Institutional shares, (2) by endowments, foundations, pension funds and other institutional investors, (3) through participating brokers that have alternative fee arrangements with their clients to
provide access to Institutional shares, (4) through certain registered investment advisers, (5) by our executive officers and trustees and their immediate family members, as well as officers and employees of the Advisers, BlackRock or other
affiliates and their immediate family members, and joint venture partners, consultants and other service providers, or (6) other categories of investors that we name in an amendment or supplement to this prospectus. In certain cases, where a holder
of Class S or Class D shares exits a relationship with a participating broker for this offering and does not enter into a new relationship with a participating broker for this offering, such holder’s shares may be exchanged into an equivalent NAV
amount of Institutional shares. We may also offer Institutional shares to certain feeder vehicles primarily created to hold our Institutional shares, which in turn offer interests in themselves to investors; we expect to conduct such offerings
pursuant to exceptions to registration under the Securities Act and not as a part of this offering. Such feeder vehicles may have additional costs and expenses, which would be disclosed in connection with the offering of their interests. We may
also offer Institutional shares to other investment vehicles. The minimum initial investment for Institutional shares is $1,000,000, unless waived by the Distributor. If you are eligible to purchase all three classes of shares, then in most cases
you should purchase Institutional shares because participating brokers will not charge transaction or other fees, including upfront placement fees or brokerage commissions, on Institutional shares, and Institutional shares have no shareholder
servicing or distribution fees, which will reduce the NAV or distributions of the other share classes. However, Institutional shares will not receive shareholder services. Before making your investment decision, please consult with your financial
intermediary regarding your account type and the classes of Common Shares you may be eligible to purchase. Investors should also inquire with their financial intermediary about what additional fees they may charge with respect to the share class
under consideration or with respect to the type of account in which the shares will be held, as that is also an important consideration when selecting a share class. Neither the Distributor nor its affiliates will directly or indirectly compensate
any person engaged as an investment advisor or bank trust department by a potential investor as an inducement for such investment advisor or bank trust department to advise favorably for an investment in us.
Without limiting the foregoing, the Distributor waives or reduces to $10,000 or less investment minimums for purchases of Institutional shares: (1) through fee-based programs, also known as wrap accounts, sponsored
by participating brokers or other intermediaries that provide access to Institutional shares, (2) through participating brokers that have alternative fee arrangements with their clients to provide access to Institutional shares, (3) through
transaction/brokerage platforms at participating brokers, (4) by our executive officers and Trustees and their immediate family members, as well as officers and employees of the Adviser or other affiliates and their immediate family members, and,
if approved by our Board, joint venture partners, consultants and other service providers, and (5) by other categories of investors that we name in an amendment or supplement to this prospectus. The foregoing categories of investors who are granted
waivers or reductions by the Distributor from the investment minimums for Institutional shares include investors described in the foregoing sentence who make purchases for eligible retirement plans and IRAs. Waivers and reductions are subject to
the terms and conditions of agreements that the Distributor enters into with participating intermediaries, as applicable.
The number of shares we have registered pursuant to the Registration Statement of which this prospectus forms a part is the number that we reasonably expect to be offered and sold within two years from the initial
effective date of the Registration Statement. Under applicable SEC rules, we may extend this offering one additional year if all of the shares we have registered are not yet sold within two years. With the filing of a registration statement for a
subsequent offering, we may also be able to extend this offering beyond three years until the follow-on registration statement is declared effective. Pursuant to this prospectus, we are offering to the public all of the shares that we have
registered. Although we have registered a fixed dollar amount of our shares, we intend effectively to conduct a continuous offering of an unlimited number of Common Shares over an unlimited time period by filing a new registration statement prior
to the end of the three-year period described in Rule 415. In such a circumstance, the issuer may also choose to enlarge the continuous offering by including on such new registration statement a further amount of securities, in addition to any
unsold securities covered by the earlier registration statement.
This offering must be registered in every state in which we offer or sell shares. Generally, such registrations are for a period of one year. Thus, we may have to stop selling shares in any state in which our
registration is not renewed or otherwise extended annually. We reserve the right to terminate this offering at any time and to extend our offering term to the extent permissible under applicable law.
Purchase Price
Shares of each class of our Common Shares are issued on a monthly basis at a price per share equal to the NAV per share for such class, as described in “Determination of Net Asset Value.” Each class of shares may
have a different NAV per share because shareholder servicing and/or distribution fees differ with respect to each class.
Underwriting Compensation
We entered into a Distribution Agreement with the Distributor, pursuant to which the Distributor agreed to, among other things, manage our relationships with financial advisors, third- party brokers engaged by the
Distributor to participate in the distribution of Common Shares, which we refer to as “participating brokers,” and other financial intermediaries. The Distributor also coordinates our marketing and distribution efforts with participating brokers
and their registered representatives and other financial intermediaries with respect to communications related to the terms of the offering, our investment strategies, material aspects of our operations and subscription procedures. We will not pay
referral or similar fees to any accountants, attorneys or other persons in connection with the distribution of our shares.
Upfront Sales Loads
Class S, Class D and Institutional shares. No upfront sales load will be paid with respect to Class S shares, Class D shares or Institutional shares; however, if you buy Class
S shares or Class D shares through certain financial intermediaries, they may directly charge you transaction or other fees, including upfront placement fees or brokerage commissions, in such amount as they may determine, provided that selling
agents limit such charges to a 3.5% cap on NAV for Class S shares, and a 1.5% cap on NAV for Class D shares. Selling agents will not charge such fees on Institutional shares.
Shareholder Servicing and/or Distribution Fees
The following table shows the shareholder servicing and/or distribution fees we pay the Distributor with respect to the Class S, Class D and Institutional on an annualized basis as a percentage of our NAV for such
class. The shareholder servicing and/or distribution fees will be calculated monthly using the NAV of the applicable class as of the beginning of the first calendar day of the month.
|
Shareholder Servicing
and/or Distribution Fee
as a % of NAV
|
|
|
Class S shares
|
0.85%
|
|
Class D shares
|
0.25%
|
|
Institutional shares
|
0.00%
|
Subject to FINRA and other limitations on underwriting compensation described in “-Limitations on Underwriting Compensation” below, we will pay a shareholder servicing and/or distribution fee equal to: (a) for Class
S shares, a shareholder servicing and/or distribution fee equal to 0.85% per annum of the aggregate NAV of the Class S shares calculated monthly as of the beginning of the first calendar day of the month and (b) for Class D shares, a shareholder
servicing fee equal to 0.25% per annum of the aggregate NAV of the Class D shares calculated monthly as of the beginning of the first calendar day of the month. The shareholder servicing and/or distribution fee is payable monthly in arrears.
Eligibility to receive the ongoing servicing fee is conditioned on a participating broker or other intermediary providing the following ongoing services with respect to the Class S or Class D shares: responding to customer inquiries of a general
nature regarding the Fund; crediting distributions from us to customer accounts; arranging for bank wire transfer of funds to or from a customer’s account; responding to customer inquiries and requests regarding shareholder reports, notices,
proxies and proxy statements, and other Fund documents; forwarding prospectuses, tax notices and annual and quarterly reports to beneficial owners of our shares; assisting us in establishing and maintaining shareholder accounts and records;
assisting customers in changing account options, account designations and account addresses; and providing such other similar services as we may reasonably request to the extent an authorized service provider is permitted to do so under applicable
statutes, rules or regulations. The Distributor will reallow (pay) all or a portion of the shareholder servicing and/or distribution fees to participating brokers and servicing brokers or intermediaries for ongoing shareholder services performed by
such brokers or intermediaries, and will waive shareholder servicing and/or distribution fees to the extent a broker or intermediary is not eligible to receive it for failure to provide such services. Because the shareholder servicing and/or
distribution fees with respect to Class S and Class D shares are calculated based on the aggregate NAV for all of the outstanding shares of each such class, it reduces the NAV with respect to all shares of each such class, including shares issued
under our distribution reinvestment plan. Shareholder servicing and/or distribution fees are similar to a commission in that the amount an investor pays may exceed the value of services they receive.
Other Compensation
We or the Investment Adviser may also pay directly, or reimburse the Distributor if the Distributor pays on our behalf, any organization and offering expenses (other than any upfront selling commissions and
shareholder servicing and/or distribution fees).
Limitations on Underwriting Compensation
We will cease paying the shareholder servicing and/or distribution fee on the Class S and Class D shares on the earlier to occur of the following: (i) a listing of Institutional shares, (ii) our merger or
consolidation with or into another entity, or the sale or other disposition of all or substantially all of our assets, or (iii) the date following the completion of the primary portion of this offering on which, in the aggregate, underwriting
compensation from all sources in connection with this offering, including the shareholder servicing and/or distribution fee and other underwriting compensation, is equal to 10% of the gross proceeds from our primary offering.
In addition, consistent with exemptive relief allowing us to offer multiple classes of shares, at the end of the month in which the Distributor in conjunction with the transfer agent determines that total transaction
or other fees, including upfront placement fees or brokerage commissions, and shareholder servicing and/or distribution fees paid with respect to any single share held in a shareholder’s account would exceed, in the aggregate, 10% of the gross
proceeds from the sale of such share (or a lower limit as determined by the Distributor or the applicable selling agent), we will cease paying the shareholder servicing and/or distribution fee on all Class S and Class D shares in such shareholder’s
account. We may modify this requirement if permitted by applicable exemptive relief. At the end of the month in which such 10% (or lower) limit is met, the applicable Class S shares and Class D shares in such shareholder’s account will convert into
a number of Institutional shares (including any fractional shares), with an equivalent aggregate NAV as such Class S and Class D shares.
This offering is being made in compliance with FINRA Rule 2310. Under the rules of FINRA, all items of underwriting compensation, including any upfront selling commissions, Distributor fees, reimbursement fees for
bona fide due diligence expenses, training and education expenses, non-transaction based compensation paid to registered persons associated with the Distributor in connection with the wholesaling of our offering and all other forms of underwriting
compensation, will not exceed 10% of the gross offering proceeds (excluding shares purchased through our distribution reinvestment plan).
Term of the Distribution Agreement
Either party may terminate the Distribution Agreement upon 60 days’ written notice to the other party or immediately upon notice to the other party in the event such other party failed to comply with a material
provision of the Distribution Agreement. Our obligations under the Distribution Agreement to pay the shareholder servicing and/or distribution fees with respect to the Class S and Class D shares distributed in this offering as described therein
shall survive termination of the agreement until such shares are no longer outstanding (including such shares that have been converted into Institutional shares, as described above).
Indemnification
To the extent permitted by law and our Declaration of Trust, we will indemnify the participating brokers and the Distributor against some civil liabilities, including certain liabilities under the Securities Act, and
liabilities arising from an untrue statement of material fact contained in, or omission to state a material fact in, this prospectus or the Registration Statement of which this prospectus is a part, blue sky applications or approved sales
literature.
Supplemental Sales Material
In addition to this prospectus, we will use sales material in connection with the offering of shares, although only when accompanied by or preceded by the delivery of this prospectus. Some or all of the sales
material may not be available in certain jurisdictions. This sales material may include information relating to this offering, the past performance of the Advisers and their affiliates, property brochures and articles and publications concerning
real estate. In addition, the sales material may contain quotes from various publications without obtaining the consent of the author or the publication for use of the quoted material in the sales material.
We are offering shares only by means of this prospectus. Although the information contained in the sales material will not conflict with any of the information contained in this prospectus, the sales material does
not purport to be complete and should not be considered as a part of this prospectus or the Registration Statement of which this prospectus is a part, or as incorporated by reference in this prospectus or the Registration Statement, or as forming
the basis of the offering of the Common Shares.
Share Distribution Channels and Special Discounts
We expect our Distributor to use multiple distribution channels to sell our shares. These channels may charge different transaction and other fees, including upfront placement fees or brokerage commissions, for
purchases of our shares. Our Distributor is expected to engage participating brokers in connection with the sale of the shares of this offering in accordance with participating broker agreements.
Offering Restrictions
Notice to Non-U.S. Investors
The shares described in this prospectus have not been registered and are not expected to be registered under the laws of any country or jurisdiction outside of the United States except as otherwise described in this
prospectus. To the extent you are a citizen of, or domiciled in, a country or jurisdiction outside of the United States, please consult with your advisors before purchasing or disposing of shares.
Country-Specific Legends
Notice to Residents in Argentina
In case the Common Shares are offered to Argentine investors from outside of Argentina, this would be an offer of securities without sufficient contact with Argentina under the
terms of Section III, Chapter I, Title XX of the Regulations of the Argentine Securities and Exchange Commission, and therefore is not authorized by the Argentine Securities and Exchange Commission, and the placement of the Common Shares is not
subject to its general and periodic reporting and control regime. The Argentine Securities and Exchange Commission has not passed judgment on the information contained herein or in any offering document of the Common Shares or on the veracity of
any accounting, financial and economic information, or any other information provided herein or therein, which is the sole responsibility of the issuer and other parties involved in the distribution of the Common Shares. Notice to Residents in
Australia
This Registration Statement is not a product disclosure statement, prospectus or any form of disclosure document for the purposes of Australian law. Accordingly, the Common Shares may not be offered, issued, sold or
distributed in Australia by the adviser, or any other person, under the Registration Statement other than by way of or pursuant to an offer or invitation that does not need disclosure to investors under Chapter 6D or Part 7.9 of the Australian
Corporations Act 2001 (cth) (“Corporations Act”), whether by reason of the investor being a “professional investor”, “sophisticated investor” or a “wholesale client” (as defined under the Corporations Act). This Registration Statement does not
constitute or involve a recommendation to acquire, an offer or invitation for issue or sale, an offer or invitation to arrange the issue or sale, or an issue or sale, of interests to a “retail client” (as defined under the Corporations Act). The
persons referred to in this Registration Statement may not hold an Australian financial services licence. Cooling off rights do not apply to an investment in the interests. This offering memorandum does not take into account the investment
objectives, financial situation or particular needs of any particular person. Before making any investment decision, prospective investors should assess whether the acquisition of the Common Shares is appropriate in light of their own financial
circumstances or seek professional advice. It is a term of the issue of the Common Shares that an investor may not transfer or offer to transfer their Common Shares to any person located in, or a resident of Australia for a period of 12 months
after the issue, unless the person is a person to whom a disclosure document is not required to be given under either Chapter 6D or Part 7.9 of the Corporations Act.
Notice to Residents in Bahamas
Common Shares shall not be offered or sold on or from The Bahamas except in circumstances that do not constitute an offer to the public. Common Shares may only be offered to “accredited
investors” as that term is defined in the Securities Industry Regulations, 2012 by an investment fund incorporated, registered or established outside The Bahamas.
Notice to Residents in Bermuda
The Common Shares being offered hereby are being offered on a private basis to investors who satisfy the criteria outlined in this Prospectus. This Prospectus does not constitute and under no circumstances is to be
construed as, an offer or an invitation to the public in Bermuda to subscribe for Common Shares.
Common Shares may be offered or sold in Bermuda only in compliance with the provisions of the Investment Business Act 2003, the Companies Act 1981 and the Investment Funds Act 2006 of Bermuda (each as amended), which
regulate the sale or promotion of fund interests or securities in Bermuda. This Prospectus has not been and will not be filed with the Registrar of Companies in Bermuda pursuant to Part III of the Companies Act 1981. This Prospectus is not subject
to and has not received approval from either the Bermuda Monetary Authority or the Registrar of Companies in Bermuda and no statement to the contrary, explicit or implicit, is authorized to be made in this regard.
Non-Bermudian persons (including companies) may not carry on or engage in any trade or business in Bermuda unless such persons are permitted to do so under applicable Bermuda legislation. Engaging in the activity of
offering or marketing the Common Shares in Bermuda to persons in Bermuda may be deemed to be carrying on business in Bermuda. The Fund is not carrying out promotion in or from Bermuda and as such it is not required to and has not been designated as
an Overseas Fund under the Investment Funds Act 2006 (as amended) by the Bermuda Monetary Authority.
Notice to Residents in Brazil
In Brazil, this material is intended for Professional Clients only. This material is solely for educational purposes and does not constitute an offer or a solicitation to sell or a solicitation of an offer to buy any
shares of any fund (nor shall any such shares be offered or sold to any person) in Brazil where such offer, solicitation, purchase, or sale would be unlawful under applicable Brazilian securities law. If any funds are mentioned or inferred to in
this material, it is possible that they have not been registered with the Brazilian Securities and Exchange Commission (Comissão de Valores Mobiliários – CVM) and therefore may not be publicly offered in Brazil. The CVM has not reviewed or approved
the accuracy of any information contained herein. No information discussed herein can be provided to the general public in Brazil.
Notice to Residents of Canada
The Prospectus constitutes an offering of Common Shares only in those jurisdictions and to those persons where and to whom they may be lawfully offered for sale, and therein only by persons
permitted to sell such securities. This is not, and under no circumstances is to be construed as, a prospectus, an advertisement or a public offering of the securities described herein in Canada. No securities commission or similar authority in
Canada has reviewed or in any way passed upon the Prospectus or the merits of the securities described herein, and any representation to the contrary is an offence. Representations of Canadian Purchasers
Each purchaser of Common Shares located and resident in Canada will be deemed to have represented, covenanted and acknowledged to the Fund, the Investment Adviser and any dealer serving as the Fund’s placement agent
(the “Canadian Placement Agent” and collectively, the “Fund Parties”) that:
| (a) |
the purchaser is located and resident in, and was offered the Common Shares in, one of the provinces of Ontario, Quebec, Alberta and British Columbia, and the purchaser is not subject to the requirements of the securities laws of any
other province or territory of Canada, or any other jurisdiction in connection with its purchase of the Common Shares;
|
| (b) |
the purchaser is basing its investment decision solely on the Prospectus which has been provided to the purchaser and not on any other information concerning the Fund or the offering;
|
| (c) |
the purchaser is purchasing the Common Shares as principal for its own account or is deemed to be purchasing the Common Shares as principal for its own account in accordance with applicable securities laws;
|
| (d) |
The Common Shares have not been and will not be qualified for sale to the public by prospectus under applicable Canadian securities laws and, accordingly, any sale of the Common Shares in Canada will only be made on a basis which is
exempt from the prospectus requirements of Canadian securities laws. Even if the Prospectus states that the Common Shares may be transferred by the purchaser, any such transfer may only be effected pursuant to a prospectus exemption under
Canadian securities laws, or in a transaction not subject to the prospectus requirements of Canadian securities laws. In addition, such transfer may only be effected by a person not required to register as a dealer under Canadian securities
laws or through a dealer that is appropriately registered or exempt from registration in the jurisdiction of the transfer;
|
| (e) |
the purchaser is an “accredited investor” as defined in Section 1.1 of National Instrument 45-106 Prospectus Exemptions (“NI 45-106”) or Section
|
73.3 of the Securities Act (Ontario); and
| (f) |
the purchaser is a “permitted client” as defined in Section 1.1 of National Instrument 31-103 Registration Requirements, Exemptions and Ongoing Registrant Obligations, as modified by Multilateral
Instrument 32-102 Registration Exemptions for Non-Resident Investment Fund Managers.
|
Enforcement of Legal Rights
Each Fund Party and its respective directors and officers, as well as any experts named in the Prospectus, are or may be located outside of Canada and, as a result, it may not be possible for purchasers to effect
service of process within Canada upon the Fund Parties or those persons. All or a substantial portion of the assets of the Fund Parties or those persons may be located outside of Canada and, as a result, it may not be possible to satisfy a judgment
against the Fund Parties or those persons in Canada or to enforce a judgment obtained in Canadian courts against the Fund Parties or those persons outside of Canada.
International Investment Fund Manager
The Investment Adviser is considered to be an investment fund manager for purposes of Canadian securities laws; however, the Investment Adviser is not registered as an investment fund manager in any province or
territory of Canada, and is relying on an exemption from registration as an investment fund manager in Ontario and Québec. All or substantially all of the assets of the Investment Adviser may be situated outside of Canada and there may be
difficulty enforcing legal rights against the Investment Adviser for these reasons. The head office of the Investment Adviser is located at 100 Bellevue Parkway, Wilmington, Delaware 19809, United States of America. The agent for service of process
of the Investment Adviser in Ontario is BlackRock Asset Management Canada Limited, 161 Bay Street, Suite 2500, P.O. Box 614, Toronto, ON M5J 2S1 and the agent for service of process of the Investment Adviser in Québec is BlackRock Asset Management
Canada Limited, 1000 Sherbrooke Street West, Suite 1730, Montreal, QC H3A 3G4.
International Dealer Exemption
The Canadian Placement Agent is not registered as a securities broker or as a securities dealer or in any other capacity in any province or territory in Canada. All or substantially all of the assets of the Canadian
Placement Agent may be situated outside of Canada and there may be difficulty enforcing legal rights against the Canadian Placement Agent for these reasons. The location of the Canadian Placement Agent’s head office and the address of its agent for
service of process in your jurisdiction of residence are set out in the Canadian Placement Agent’s client disclosure document which has been delivered to you by the Canadian Placement Agent.
Rights of Action
In connection with this distribution of Common Shares which constitute “eligible foreign securities” as defined in Ontario Securities Commission Rule 45-501 Ontario Prospectus and
Registration Exemptions and Multilateral Instrument 45-107 Listing Representations and Statutory Rights of Action Disclosure Exemptions or other applicable provisions, a Fund Party has delivered
to the purchaser the Prospectus which may constitute an offering memorandum under applicable securities laws in Canada. The purchaser may have, depending on the province or territory of Canada in which the trade was made to the purchaser, remedies
for rescission or damages if the Prospectus contains a misrepresentation, provided that the remedies for rescission or damages are exercised by the purchaser within the time limit prescribed by the securities legislation of the purchaser’s province
or territory. The purchaser should refer to any applicable provisions of the securities legislation of the purchaser’s province or territory for particulars of these rights or consult with a legal advisor.
French Language Waiver
The Fund Parties and the purchaser shall be deemed to have confirmed that the subscription documents, Prospectus, and all documents, notices and other communications relating to the Fund shall be in English. Il est la volonté expresse des parties que le contrat et tous les documents, avis et autres communications qui concernent le contrat soient rédigés en langue anglaise. If you are a resident of or subject to the
laws of Quebec, the parties agree that this document and any other agreement entered into in connection with the Prospectus shall be effective only upon its execution or acceptance by the Fund or the Investment Adviser outside of Quebec and that,
accordingly, all such agreements shall be deemed to be entered into outside of Quebec.
Suppression of Terrorism and Canadian Sanctions
The purchaser shall be deemed to have confirmed that to the best of the purchaser’s knowledge, the funds being used to purchase the Common Shares: (i) were not obtained or derived, directly or indirectly, as a result
of illegal activities; (ii) are not intended to be used, directly or indirectly, in order to carry out a criminal offence, a terrorist activity or for the benefit of a terrorist group, (iii) are not owned or controlled by a terrorist group; and
(iv) are not being tendered on behalf of a person or entity who has not been identified to the purchaser.
The purchaser shall be deemed to have confirmed that the purchaser is not a person or entity identified on a list established under section 83.05 of the Criminal Code (Canada)
or in any Regulations made under the United Nations Act (Canada), the Freezing Assets of Corrupt Foreign Officials Act (Canada), the Justice for Victims of Corrupt Foreign Officials Act (Sergei Magnitsky Law) (Canada), the Special Economic Measures Act (Canada) or any other Canadian statutes or regulations which take
legislative measures against terrorist financing and against financial dealings with certain sanctioned individuals and entities (collectively, “STCS Legislation”).
Each Fund Party may in the future be required by law to disclose the purchaser’s name and other information relating to the purchaser, on a confidential basis, pursuant to STCS Legislation and the purchaser is deemed
to have agreed to the foregoing.
The purchaser shall promptly notify the Fund Parties if the purchaser discovers that any such representations cease to be true, and shall provide the Fund Parties with appropriate information in connection therewith.
Indirect Collection of Personal Information
By purchasing the Common Shares, the purchaser shall be deemed to have acknowledged that information such as its name and other specified information, including specific purchase details, will be disclosed to
Canadian securities regulatory authorities as part of a Report of Exempt Distribution on Form 45-106F1 (the “Report”) and may become available to the public in accordance with the requirements of applicable laws. The purchaser consents to the
disclosure of that information.
The purchaser is hereby notified that the following personal information about the purchaser will be disclosed to Canadian securities regulatory authorities in the Report: his or her full legal name, residential
street address, telephone number, email address (if available), specific purchase details and details of the prospectus exemption relied on. Such information is collected on behalf of and used by the securities regulatory authority or regulator
under the authority granted in securities legislation for the purposes of the administration and enforcement of the securities legislation. By purchasing the Common Shares the purchaser authorizes this indirect collection of information by the
securities regulatory authorities and regulators. Questions about the collection and use of this information should be directed to the securities regulatory authority or regulator in the province where the purchaser is located or resident, as
listed below.
|
Alberta Securities Commission
Suite 600, 250 – 5th Street SW
Calgary, Alberta T2P 0R4
Telephone: 403-297-6454
Toll free in Canada: 1-877-355-0585
Facsimile: 403-297-2082
Public official contact regarding indirect collection of information: FOIP Coordinator
|
Ontario Securities Commission
20 Queen Street West, 22nd Floor
Toronto, Ontario M5H 3S8
Telephone: 416-593-8314
Toll free in Canada: 1-877-785-1555
Facsimile: 416-593-8122
Email: exemptmarketfilings@osc.gov.on.ca
Public official contact regarding indirect collection of information: Inquiries Officer
|
|
British Columbia Securities Commission
P.O. Box 10142, Pacific Centre
701 West Georgia Street
Vancouver, British Columbia V7Y 1L2
Inquiries: 604-899-6854
Toll free in Canada: 1-800-373-6393
Facsimile: 604-899-6581
Email: FOI-privacy@bcsc.bc.ca
Public official contact regarding indirect collection of information: FOI Inquiries
|
Autorité des marchés financiers
800, rue du Square-Victoria, 22e étage
C.P. 246, tour de la Bourse
Montréal, Québec H4Z 1G3
Telephone: 514-395-0337 or 1-877-525-0337
Facsimile: 514-873-6155 (For filing purposes only)
Facsimile: 514-864-6381 (For privacy requests only)
Email: financementdessocietes@lautorite.qc.ca (For corporate finance issuers); fonds_dinvestissement@lautorite.qc.ca (For investment fund issuers)
Public official contact regarding indirect collection of information: Corporate Secretary
|
Canadian Tax Considerations
THE PROSPECTUS DOES NOT ADDRESS THE CANADIAN TAX CONSEQUENCES OF THE ACQUISITION, HOLDING OR DISPOSITION OF THE COMMON SHARES. PROSPECTIVE PURCHASERS OF INTERESTS ARE STRONGLY ADVISED TO CONSULT THEIR OWN TAX
ADVISORS WITH RESPECT TO THE CANADIAN AND OTHER TAX CONSIDERATIONS APPLICABLE TO THEM.
Conversion of Amounts into Canadian Dollar Equivalent
Unless specifically stated otherwise, all dollar amounts contained in the Prospectus are in U.S. dollars and must be converted into Canadian dollars based on the prevailing relevant foreign exchange rate at the time
such amounts arise.
Financial Information
Financial information contained in the Prospectus may have been prepared in accordance with accounting practices which differ in certain respects from those accounting principles used in other jurisdictions,
including Canada. Prospective purchasers should conduct their own investigation and analysis of the business, data and transaction described herein and consult their own financial advisers.
Responsibility
Except as otherwise expressly required by applicable law or as agreed to in contract, no representation, warranty or undertaking (express or implied) is made and no responsibilities or liabilities of any kind or
nature whatsoever are accepted by any dealer as to the accuracy or completeness of the information contained in the Prospectus or any other information provided by the issuer in connection with the offering of these securities in Canada.
Investing in these securities involves risks. Prospective investors should refer to the risk factors set forth in the Prospectus for additional information concerning these risks.
Notice to Prospective Investors in the Cayman Islands
These Shares have not been registered with the securities regulator of the Cayman Islands, and thus, may not be publicly offered in the Cayman Islands. The Prospectus is not an invitation to the public in the Cayman
Islands to subscribe for Common Shares. Engaging in marketing, offering or selling any fund from within the Cayman Islands to persons or entities in the Cayman Islands may be deemed carrying on business in the Cayman Islands. The Fund does not
intend to establish a place of business or otherwise intend to carry on business in or from within the Cayman Islands, including offering Shares to the public in the Islands (as defined under Cayman law). Accordingly, the fund should not be subject
to the supervision of any Cayman Islands authority.
Notice to Residents of Certain Caribbean Jurisdictions
These Common Shares have not been registered with the securities regulators of Dominica, the British Virgin Islands, Grenada, St. Kitts and Nevis or any jurisdiction in the Organisation of Eastern Caribbean States,
and thus, may not be publicly offered in any such jurisdiction.
This prospectus and any other document or material issued in connection with the offer or sale of Common Shares of the Fund does not constitute or form part of any investment advice or an offer or solicitation of an
offer to buy any investment products in the Caribbean, including the jurisdictions of the Eastern Caribbean States. Any resident of the jurisdictions named herein that receives a copy of this prospectus should note that there may be restrictions or
limitations as to whom these materials may be made available. This prospectus is directed at and intended for institutional investors (as such term is defined in the applicable jurisdictions). This prospectus is provided on a confidential basis and
may not be reproduced in any form. Before acting on any information in this prospectus, prospective clients should inform themselves of and observe all applicable laws and regulations of any relevant jurisdictions, including, inter alia, any
foreign exchange restrictions that may be relevant thereto. Any entity responsible for forwarding this material to other parties takes responsibility for ensuring compliance with applicable securities laws and regulations.
Notice to Residents in Chile
This private offer commences on the date indicated on the cover page of this Prospectus and it avails itself of the General Regulation No. 336 of the Superintendence of Securities and Insurances (currently the
Financial Markets Commission). This offer relates to securities not registered with the Securities Registry or the Registry of Foreign Securities of the Financial Markets Commission, and therefore such securities are not subject to oversight by the
latter. Being unregistered securities, there is no obligation on the issuer to provide public information in Chile regarding such securities. These securities may not be subject to a public offer until they are registered in the corresponding
Securities Registry
ESTA OFERTA PRIVADA SE INICIA EL DÍA INDICADO EN LA PORTADA DE ESTE PROSPECTO Y SE ACOGE A LAS DISPOSICIONES DE LA NORMA DE CARÁCTER GENERAL Nº 336 DE LA SUPERINTENDENCIA DE VALORES Y SEGUROS, HOY COMISIÓN PARA EL
MERCADO FINANCIERO.
ESTA OFERTA VERSA SOBRE VALORES NO INSCRITOS BAJO LA LEY DE MERCADO DE VALORES EN EL REGISTRO DE VALORES O EN EL REGISTRO DE VALORES EXTRANJEROS QUE LLEVA LA COMISIÓN PARA EL MERCADO FINANCIERO, POR LO QUE TALES
VALORES NO ESTÁN SUJETOS A LA FISCALIZACIÓN DE ÉSTA;
POR TRATARSE DE VALORES NO INSCRITOS, NO EXISTE OBLIGACIÓN POR PARTE DEL EMISOR DE ENTREGAR EN CHILE INFORMACIÓN PÚBLICA RESPECTO DE LOS VALORES SOBRE LOS QUE VERSA ESTA OFERTA;
ESTOS VALORES NO PODRÁN SER OBJETO DE OFERTA PÚBLICA en chile MIENTRAS NO SEAN INSCRITOS EN EL REGISTRO DE VALORES CORRESPONDIENTE
Notice To Residents of China
No invitation to offer, or offer for, or sale of, the Shares will be made in the People’s Republic of China (“PRC”) (which, for such purpose, does not include the Hong Kong or Macau Special Administrative Regions or
Taiwan) or by any means that would be deemed public under the laws of the PRC. The information relating to the Shares contained in the Prospectus has not been submitted to or approved by the China Securities Regulatory Commission, the Asset
Management Association of China or any other relevant governmental authority in the PRC. The Shares may only be offered or sold to investors in the PRC that are expressly authorized under the laws and regulations of the PRC to buy and sell
securities denominated in a currency other than the Renminbi (or RMB), which is the official currency of the PRC. Potential investors who are resident in the PRC may be subject to foreign exchange control approval and filing requirements under the
relevant Chinese foreign exchange regulations, as well as offshore investment approval requirements, and are responsible for obtaining such required approvals and/or filings from all relevant government authorities in the PRC, including, but not
limited to, the State Administration of Foreign Exchange, before purchasing the Shares. No offering material or information contained in this document relating to the Shares may be supplied to the public in China or used in connection with any
offer for the subscription or sale of Shares to the public in the PRC.
Neither this document nor the information contained in this document constitutes any securities or investment advice to citizens of the PRC, or nationals with permanent residence in the PRC, or to any corporation,
Fund, or other entity incorporated or established in the PRC.
Notice to Residents in Colombia
This document does not constitute a public offer in the Republic of Colombia. The offer of the Fund is addressed to less than one hundred specifically identified investors, and the Fund may not
be promoted or marketed in Colombia or to Colombian residents unless such promotion and marketing is made in compliance with Decree 2555 of 2010 and other applicable rules and regulations related to the promotion of foreign securities in Colombia.
Each recipient that is a resident in Colombia acknowledges and agrees that it has contacted the Fund at its own initiative and not as a result of any promotion or publicity by the Fund or any of
its respective agents or representatives. Colombian residents acknowledge that (1) the receipt of this prospectus does not constitute a solicitation from the Fund, and (2) they are not receiving from the Fund any direct or indirect promotion or
marketing.
The information contained in this Prospectus is for general guidance only, and it is the responsibility of any person or persons in possession of this Prospectus and wishing to make application
for Common Shares to inform themselves of, and to observe, all applicable laws and regulations of any relevant jurisdiction. Prospective applicants for Common Shares should inform themselves of any applicable legal requirements, exchange control
regulations and applicable taxes in the countries of their respective citizenship, residence or domicile.
Notice to Residents in Costa Rica
This is an individual and private offer which is made in Costa Rica upon reliance on an exemption from registration before the General Superintendence of Securities (“SUGEVAL”), pursuant to
article 6 of the Regulations on the Public Offering of Securities (“Reglamento sobre Oferta Pública de Valores”). This information is confidential, and is not to be reproduced or distributed to third parties as this is NOT a public offering of
securities in Costa Rica.
The Common Shares are not intended for the Costa Rican public or market and neither are they registered or will be registered before the SUGEVAL, nor can they be traded in the secondary market
in Costa Rica.
As this is NOT a public offering of securities under the definition set forth in the Securities Market Statute (“Ley Reguladora del Mercado de Valores”), the Fund is not intended for the Costa
Rican public or market and neither is registered or will be registered before the SUGEVAL and, accordingly, it is not covered by the supervision, disciplinary regime and protections afforded to local investors by the Securities Market Statute with
regards to the public offerings of securities, and it is not registered in the National Registry of Securities and Intermediaries (“Registro Nacional de Valores e Intermediarios”).
As this is a private offering of securities, the investor will not have access to ongoing reporting required by the regulations set forth by the National Council for Supervision of the Financial
System (“CONASSIF”) and the SUGEVAL.
Notice to Residents in the Dominican Republic
Any circulation and offering of the Fund in the Dominican Republic has a strictly private character, falling beyond the scope of Law 249-17 as amended or as may be amended or superseded from
time to time, and including any regulations promulgated thereunder (the "Dominican Securities Law"). The Fund may only be offered or sold in the Dominican Republic pursuant to an exemption from the registration requirements of the Dominican
Securities Law, and consequently the Fund has not been (and may not be) offered in any public manner in the Dominican Republic. Since no governmental authorizations are required in the issuance, circulation and offering of the Fund, this has not
been and will not be registered with the Superintendency of the Stock Market of the Dominican Republic (Superintendencia del Mercado de Valores de la República Dominicana).
BlackRock is not an authorized entity under Dominican law, and all its activities are performed out of the Dominican Republic on a strictly private character, falling beyond the scope of the
Dominican Securities Law.
Notice to Residents in El Salvador
If any recipient of this documentation receives this document in El Salvador, such recipient acknowledges that the same has been delivered upon his request and instructions, and on a private
placement basis.
This Prospectus is made available on the condition that it is for the use only by the recipient and may not be passed on to any other person or be reproduced in any part. The Common Shares have
not been and will not be offered in the course of a public offering or of equivalent marketing in El Salvador and therefore, the provisions of the Stock Market Law of 1994 (Ley del Mercado de Valores) as amended, relating to registration
requirements and to prospectus requirements do not apply. The Common Shares have neither been registered for public distribution in El Salvador with the Stock Superintendency nor been the subject matter of a prospectus compliant with the Stock
Market Law. Any subscription application by any person other than the initial recipient of the Prospectus may be rejected.
Distribution in the European Economic area (Norway and Iceland)
In relation to each member state of the EEA (each a “Relevant State”) which has implemented the Alternative Investment Fund Managers Directive (Directive(2011/61/EU)) (the “AIFMD”), this
Prospectus may only be distributed and Shares may only be offered or placed in a Relevant State to the extent that: (1) the Fund is permitted to be marketed to professional investors in the Relevant State in accordance with AIFMD (as implemented
into the local law/regulation / as it forms part of local law of the Relevant State); or (2) this Prospectus may otherwise be lawfully distributed and the Shares may otherwise be lawfully offered or placed in that Relevant State (including at the
initiative of the investor).
Notice to Residents in Guatemala
This communication and any accompanying information (the “Materials”) are intended solely for informational purposes and do not constitute (and should not be interpreted to constitute) the offering, selling, or
conducting of business with respect to such securities, products or services in Guatemala, or the conducting of any brokerage, banking or other similarly regulated activities (“Financial Activities”) in Guatemala. Neither BlackRock, nor the
securities, products and services described herein, are registered (or intended to be registered) in Guatemala. Furthermore, neither BlackRock, nor the securities, products, services or activities described herein, are regulated or supervised by
any governmental or similar authority in Guatemala. The Materials are private, confidential and are sent by BlackRock only for the exclusive use of the addressee. The Materials must not be publicly distributed and any use of the Materials by anyone
other than the addressee is not authorized. The addressee is required to comply with all applicable laws in Guatemala, including, without limitation, tax laws and exchange control regulations, if any.
Notice to Residents in Honduras
The information contained herein does not describe any product that is supervised or regulated by the National Banking and Insurance Commission (CNBS) in Honduras. The Common Shares described herein may not be
offered in Honduras except in circumstances which do not constitute a public offer. Therefore any investment described herein is done at the investor’s own risk.
Notice To Residents Of Hong Kong SAR
Warning - The contents of the Prospectus have not been reviewed nor endorsed by any regulatory authority in Hong Kong. Hong Kong residents are advised to exercise caution in relation to the offer. If you are in any
doubt about any of the contents of the Prospectus, you should obtain independent professional advice. The Fund is not authorized by the Securities and Futures Commission (“SFC”) in Hong Kong pursuant to Section 104 of the Securities and Futures
Ordinance (“SFO”). The Prospectus has not been approved by the SFC in Hong Kong, nor has a copy of it been registered with the Registrar of Companies in Hong Kong. The Prospectus does not constitute an offer or invitation to the public in Hong Kong
to acquire the Shares. Accordingly: 1. Shares may not be offered or sold in Hong Kong by means of the Prospectus or any other document other than to “professional investors” within the meaning of Part I of Schedule 1 to the SFO and any rules made
under the SFO, or in other circumstances which do not result in the document being a “prospectus” as defined in the Hong Kong Companies (Winding Up and Miscellaneous Provisions) Ordinance (Chapter 32 of the Laws of Hong Kong) (“CWUMPO”) or which do
not constitute an offer or invitation to the public for the purposes of the CWUMPO or the SFO; and 2. No person shall issue or possess for the purpose of issue, whether in Hong Kong or elsewhere, any advertisement, invitation or document relating
to the Shares which is directed at, or the contents of which are likely to be accessed or read by, the public in Hong Kong (except if permitted to do so in (1) above or under the laws of Hong Kong) other than with respect to Shares which are or are
intended to be disposed of only to persons outside Hong Kong or only to “professional investors”. The Prospectus is distributed on a confidential basis and may not be reproduced in any form or transmitted to any person other than the person to whom
it is addressed. No Shares in the Fund will be issued to any person other than the person to whom the Prospectus has been addressed and no person other than such addressee may treat the same as constituting an invitation for him to invest.
Notice to Prospective Investors in Israel
The Shares described in this Prospectus have not been registered and are not expected to be registered under the Israeli Securities Law 1968 (the “Israeli Securities Law”) or under the Israeli Joint Investment Trust
Law 1994. Accordingly, the shares described herein may only be offered and sold in Israel pursuant to applicable private placement exemptions to “qualified investors” described in the first addendum to the Israeli Securities Law. None of the
Adviser, the Sub-Adviser, the Distributor or any participating broker is a licensed investment marketer or advisor under the provisions of the Regulation of Investment Advice, Marketing Investments and Portfolio Management 1995.
Notice to Residents of Jersey
This Prospectus relates to a private placement and does not constitute an offer to the public in Jersey to subscribe for the Common Shares offered hereby. No regulatory approval has been sought to the offer in Jersey
and it must be distinctly understood that the Jersey Financial Services Commission does not accept any responsibility for the financial soundness of or any representations made in connection with the Fund. The offer of Common Shares is personal to
the person to whom this Prospectus is being delivered by or on behalf of the Fund, and a subscription for the Common Shares will only be accepted from such person. The Prospectus may not be reproduced or used for any other purpose.
Notice to Residents of Kuwait
This Prospectus is not for general circulation to the public in Kuwait. The Shares have not been licensed for offering in Kuwait by the Kuwait Capital Markets Authority or any other relevant Kuwait government agency
or regulatory authority. The offering of the Shares in Kuwait on the basis of a private placement or public offering is, therefore, restricted in accordance with Law No. 7 of 2010 and the bylaws thereto (as amended). No private or public offering
of the Shares is being made in Kuwait, and no agreement relating to the sale of the Shares will be concluded in Kuwait. No marketing or solicitation or inducement activities are being used to offer or market the Shares in Kuwait.
This document is provided from outside of Kuwait on the basis of an unsolicited reverse enquiry and by viewing this document, you hereby acknowledge that you have made such an unsolicited reverse enquiry.
Notice to Prospective Investors in Malaysia
No action has been, or will be, taken to comply with Malaysian laws for making available, offering for subscription or purchase, or issuing any invitation to subscribe for or purchase or sale of, the Common Shares in
Malaysia or to persons in Malaysia as the Common Shares are not intended by the Fund to be made available, or made the subject of any offer or invitation to subscribe or purchase, in Malaysia.
Neither this Prospectus nor any document or other material in connection with the Common Shares should be distributed, caused to be distributed or circulated in Malaysia. No person should make available or make any
invitation or offer or invite to sell or purchase the Common Shares in Malaysia unless such person takes the necessary action to comply with Malaysian laws.
Notice to Residents in Mexico
The Shares have not been, and will not be, registered with the Mexican National Securities Registry (Registro Nacional de Valores) maintained by the Mexican National Banking and Securities Commission (Comisión
Nacional Bancaria y de Valores) and may not be publicly offered or sold in the United Mexican States, except that the Shares may be sold to Mexican Institutional and Qualified investors (as defined under Mexican law) solely pursuant to the private
placement exemption set forth in Article 8 of the Mexican Securities Market Law (Ley del Mercado de Valores). This Prospectus may not be distributed publicly in Mexico and the Shares may not be traded in Mexico. The CNBV has not reviewed or
approved this Prospectus. This is not a public offering of securities in Mexico.
This prospectus is shared for informational purposes only, does not constitute investment advice, and is being shared in the understanding that the addressee is an Institutional or Qualified investor. Each potential
investor shall make its own investment decision based on their own analysis of the available information. Please note that by receiving these materials, it shall be construed as a representation by the receiver that it is an Institutional or
Qualified investor.
Notice to Residents of New Zealand
This document and the information contained in or accompanying this document are not, and are under no circumstances to be construed as, an offer of financial products for issue requiring disclosure to an investor
under Part 3 of the Financial Markets Conduct Act 2013 (N.Z.) (the “Financial Markets Conduct Act (N.Z.)”). This document and the information contained in or accompanying this document have not been registered, filed with or approved by any New
Zealand regulatory authority or under or in accordance with the Financial Markets Conduct Act (N.Z.). This document and the information contained in or accompanying this document are not a disclosure document under New Zealand law and do not
contain all the information that a disclosure document is required to contain under New Zealand law.
Notice to Residents in Panama
The Common Shares, as well as their offer, sale or their trading procedures, have not been and will not be registered with the Superintendence of Capital Markets of the Republic
of Panama (Superintendencia del Mercado de Capitales de la República de Panamá), under the Unified Text of the Law Decree N°1 of July 8, 1999, as amended from time to time (the “Panamanian Securities Act”) and may not be publicly offered or sold
within Panama, except in certain limited transactions exempt from the registration requirements of the Panamanian Securities Act. The Common Shares are exempt from registration pursuant to Article 129, Item 3 of the Panamanian Securities Act.
Consequently, the Common Shares do not benefit from the tax treatment set forth in Articles 334 to 336 of the Panamanian Securities Act, and they are not subject to regulation or supervision by the Superintendence of Capital Markets of the Republic
of Panama. Notice to Residents in Peru
This private offer does not constitute a public offer, and is not registered with the Securities Market Public Registry of the Peruvian Securities Market Commission (Superintendencia del Mercado de Valores, or the
“SMV”) or the Lima Stock Exchange (Bolsa de Valores de Lima). The information included in this Prospectus is for use only with institutional investors, and is not for public distribution. In making an investment decision, institutional investors
must rely on their own examination of the terms of the offering of the Common Shares to determine their ability to invest in the Common Shares. The SMV does not exercise any supervision over this Fund or its management.
Accordingly, the Common Shares may not be offered or sold in Peru except, among others, if such offering is considered a private offer under the securities laws and regulations
of Peru. The Common Shares cannot be offered or sold in Peru except in compliance with the securities laws thereof. Notice to Prospective Investors in the Philippines
For Funds not registered with the Securities and Exchange Commission of the Philippines.
Under Republic Act No. 8799, known as the Securities Regulation Code of the Philippines (the “Code”), and its implementing rules, securities, such as the Common Shares, are not permitted to be sold or offered for
sale or distribution within the Philippines unless such securities are approved for registration by the Securities and Exchange Commission of the Philippines (“SEC”) or are otherwise exempt securities or sold pursuant to an exempt transaction.
The offer and sale of the Common Shares qualify as an exempt transaction pursuant to section 10.1(l) of the Code and by purchase of the Common Shares, the investor will be deemed to acknowledge that the issue of,
offer for subscription or purchase of, or invitation to subscribe for or purchase of such Common Shares was made outside the Philippines. A confirmation of exemption from the SEC that the offer and sale of the Common Shares in the Philippines
qualify as an exempt transaction under the Code is not required to be, and will not be, obtained.
THE SECURITIES BEING OFFERED OR SOLD HEREIN HAVE NOT BEEN REGISTERED WITH THE SECURITIES AND EXCHANGE COMMISSION UNDER THE SECURITIES REGULATION CODE OF THE PHILIPPINES. ANY FUTURE OFFER OR SALE
THEREOF IS SUBJECT TO REGISTRATION REQUIREMENTS UNDER THE CODE UNLESS SUCH OFFER OR SALE QUALIFIES AS AN EXEMPT TRANSACTION.
Notice to Residents of Qatar
Nothing in this Registration Statement constitutes, is intended to constitute, shall be treated as constituting or shall be deemed to constitute, any offer or sale of securities in the State of Qatar or in the Qatar
Financial Centre (“QFC”) to the public or the inward marketing of securities or an attempt to do business or conduct activities, as a bank, an investment company or otherwise in the State of Qatar or in the QFC.
This Registration Statement, the shares and any related documents have not been reviewed, approved, registered or licensed by or with the Qatar Central Bank, the Qatar Financial Centre Regulatory Authority, the Qatar
Financial Markets Authority or any other regulator in the State of Qatar, the QFC or under any laws of the State of Qatar or the QFC.
No transaction will be concluded in your jurisdiction. Recourse against the dealer, and those involved with it, may be limited or difficult and may have to be pursued in a jurisdiction outside Qatar and the QFC.
Any distribution of this Registration Statement by the recipient to third parties in Qatar or the QFC beyond the terms hereof is not authorised and shall be at the liability of such recipient.
Note to Prospective Investors in Saudi Arabia
This document may not be distributed in the Kingdom of Saudi Arabia except to such persons as are permitted under the Investment Funds Regulations issued by the Capital Market Authority. The Capital Market Authority
does not make any representation as to the accuracy or completeness of this document, and expressly disclaims any liability whatsoever for any loss arising from, or incurred in reliance upon, any part of this document. Prospective subscribers of
the securities offered hereby should conduct their own due diligence on the accuracy of the information relating to the securities to be offered. If you do not understand the contents of this document, you should consult an authorised financial
adviser.
Notice to Prospective Investors in Singapore
The Fund is not authorized under Section 286 of the Securities and Futures Act 2001 (as amended from time to time) (the “SFA”) or recognized under Section 287 of the SFA and the Common Shares are not allowed to be
offered to the retail public. This document and any other material issued in connection with the offer or sale is not a “prospectus” as defined in the SFA and accordingly, statutory liability under the SFA in relation to the content of prospectuses
does not apply, and you should consider carefully whether the investment is suitable for you.
This document has not been registered as a prospectus with the Monetary Authority of Singapore (“MAS”). Accordingly, this Prospectus and any other document or material in connection with the offer or sale, or
invitation for subscription or purchase, of Common Shares may not be circulated or distributed, nor may the Common Shares be offered or sold, or be made the subject of an invitation for subscription or purchase, pursuant to this Prospectus whether
directly or indirectly, to persons in Singapore other than (i) to an institutional investor pursuant to Section 304 of the SFA, (ii) a relevant person pursuant to Section 305(1), or any person pursuant to Section 305(2), and in accordance with the
conditions specified in Section 305 of the SFA, or (iii) otherwise pursuant to, and in accordance with the conditions of, any other applicable provision of the SFA. Common Shares subscribed or purchased pursuant to Sections 304 or 305 of the SFA
may only be transferred in accordance with provisions of Sections 304A and 305A of the SFA respectively.
Where the Common Shares are subscribed or purchased under Section 305 of the SFA by a relevant person which is:
| (a) |
a corporation (which is not an accredited investor (as defined in Section 4A of the SFA)) the sole business of which is to hold investments and the entire share capital of which is owned by one or more individuals, each of whom is an
accredited investor; or
|
| (b) |
a trust (where the trustee is not an accredited investor) whose sole purpose is to hold investments and each beneficiary of the trust is an individual who is an accredited investor, securities (as defined in Section 2 of the SFA) of that
corporation or the beneficiaries’ rights and interest (howsoever described) in that trust shall not be transferred within six months after that corporation or that trust has acquired the Common Shares pursuant to an offer made under Section
305 of the SFA except:
|
| i. |
to an institutional investor or to a relevant person defined in Section 305(5) of the SFA, or to any person arising from an offer referred to in Section 275(1A) or Section 305A(3)( i)(B) of the SFA;
|
| ii. |
where no consideration is or will be given for the transfer;
|
| iii. |
where the transfer is by operation of law;
|
| iv. |
as specified in Section 305A(5) of the SFA; or
|
| v. |
as specified in Regulation 36 of the Securities and Futures (Offers of Investments) (Collective Investment Schemes) Regulations 2005 of Singapore.
|
By accepting receipt of this document, a person in Singapore represents and warrants that he is entitled to receive such document in accordance with the restrictions set forth above and agrees to be bound by the
limitations contained herein.
Notice to Residents of South Korea
In South Korea: This document is issued to you upon your specific request and is provided for your internal use and informational purposes only. This is intended for use by
Professional Investors only. Neither the Fund nor BlackRock is making any representation with respect to the eligibility of any recipients of these materials to acquire interests in the Fund under the laws of Korea, including but without limitation
the Foreign Exchange Transaction Act and Regulations thereunder. Interests in the Fund may not be offered, sold or delivered, or offered or sold to any person for re-offering or resale, directly or indirectly, in Korea or to any resident of Korea
except pursuant to applicable laws and regulations of Korea. This document contains general information only and is not intended to represent general or specific investment advice. The information does not take into account your financial
circumstances. An assessment should be made as to whether the information is appropriate for you having regard to your objectives, financial situation and needs.
Notice to Prospective Investors in Switzerland
The Fund may not be publicly offered or marketed in Switzerland within the meaning of the Swiss Financial Services Act (“FinSA”). Neither this document nor any other offering or marketing material relating to the
fund constitute or will constitute a prospectus pursuant to the FinSA, and neither this document nor any other offering or marketing material relating to the Fund may be publicly distributed or otherwise made publicly available in Switzerland. The
Fund has not been registered with the Swiss Financial Market Supervisory Authority (“FINMA”) and no Swiss representative or paying agent has been appointed with respect to the Fund. Accordingly, neither this document nor any other offering or
marketing material relating to the Fund have been filed with or approved by FINMA.
Notice to Prospective Investors in Thailand
The Fund’s Common Shares have not been granted permission by the Securities and Exchange Commission (SEC) of Thailand to be publicly offered in Thailand. No interests in the Common Shares may be advertised or offered
for sale to the general public in Thailand or marketed to the public in Thailand through any means of communication to any resident of Thailand to whom it is not addressed.
All the Common Shares’ materials were prepared by the Fund for informational purposes, and the contents of this Prospectus have not been reviewed by the SEC. The contents contained in these materials should not be
construed as a public offer of the Common Shares in Thailand, and shall not be used as part of any prospectus, offering memorandum or other disclosure attributable to the Fund.
This Prospectus is distributed on a confidential basis to the person to whom it is addressed. This Prospectus may not be reproduced in any form or transmitted to any person other than the person to whom it is
addressed. Transmission of this Prospectus to the person to whom it is addressed shall not constitute solicitation in Thailand by the Fund or any of its representatives or agents to invest in the Common Shares.
Notice to Residents of the United Arab Emirates (including the Dubai International Financial Centre and Abu Dhabi Global Market)
The Common Shares described in this Registration Statement are not being offered, sold, promoted, marketed or otherwise made available, whether directly or indirectly, in the United Arab Emirates (including onshore
UAE, the Dubai International Financial Centre and the Abu Dhabi Global Market). No approval, verification or authorisation of this Registration Statement or the securities has been or will be obtained from, or filed with, the UAE Capital Markets
Authority, the Central Bank of the UAE, the Dubai Financial Services Authority or the Financial Services Regulatory Authority of Abu Dhabi Global Market. Any reference to these authorities is for identification only and does not imply any form of
review, approval or oversight.
This Registration Statement is provided from outside the UAE solely on the basis of a reverse enquiry and does not constitute, and shall not be treated as constituting, an offer of securities, a public offering, a
financial promotion, marketing, invitation or solicitation to the public or to any person in the UAE (including within the financial free zones). No sale, subscription, commitment or other agreement to purchase or subscribe for the securities will
be concluded in the UAE. Any onward distribution or provision of this Registration Statement in or from the UAE is unauthorised and is at the sole responsibility of the person making such distribution.
Prospective investors in the UAE should conduct their own due diligence. If you do not understand the contents of this document, you should consult an appropriately authorised financial adviser. Nothing in this
Registration Statement is intended to, or shall, create or imply any licensed financial service activity in or from the UAE.
References in this legend to onshore UAE law, to “Financial Free Zones”, and to the identification of domestic financial regulators reflect the current federal legal framework and recognition of financial free zones
under UAE law as at the date of this Registration Statement.
Notice to Residents of the United Kingdom
The Fund is a collective investment scheme pursuant to Section 235 of the Financial Services and Markets Act 2000 (“FSMA”). The Fund has not been authorised, or otherwise recognised or approved, by the Financial
Conduct Authority (“FCA”) and, as an unregulated scheme, cannot be promoted in the United Kingdom to the general public. The communication of this Prospectus is exempt from the restriction in Section 238 of FSMA which prohibits the communication of
an invitation or inducement to engage in investment activity on the grounds that the communication of this Prospectus is directed at, and interests are available only to persons considered to be professional clients ((as defined in Article 2(1)(8)
of regulation (EU) 600/2014 on Markets In Financial Instruments, as amended and it has effect in UK law), where such communication (i) is made pursuant to Section 16(2) of the Financial Services and Markets Act 2000 (Promotion of Collective
Investment Schemes) (Exemptions) Order 2001 (Communications Authorised by the AIFMR), or (ii) may otherwise be lawfully made. Persons of any other description should not act upon this Prospectus. None of Investment Advisers are authorised to carry
on investment business in the UK and potential investors are advised that all, or most, of the protections afforded by the UK regulatory system will not apply to any activities of Investment Advisers and that compensation will not be available
under the UK financial services compensation scheme in relation thereto.
Notice to Residents of Uruguay
The sale of Common Shares of the Fund qualifies as a private placement pursuant to section 2 of Uruguayan Law Nº 18,627. The Common Shares are not and will not be registered with the Financial Services
Superintendency of the Central Bank of Uruguay. The Common Shares are not and will not be offered publicly in or from Uruguay and are not and will not be traded on any Uruguayan stock exchange. This offer has not been and will not be announced to
the public and offering materials will not be made available to the general public except in circumstances which do not constitute a public offering of securities in Uruguay, in compliance with the requirements of the Uruguayan Securities Market
Law (Law Nº 18.627 and Decree 322/011). The Common Shares correspond to a fund that is not an investment fund regulated by Uruguayan Law Nº 16,774, dated September 27, 1996, as amended.
Additional Payments to Intermediaries
In certain circumstances, the Distributor or its affiliates may pay or reimburse intermediaries for distribution and/or shareholder services out of the Distributor’s or its affiliates’ own assets. Such activities by
the Distributor or its affiliates may provide incentives to intermediaries to purchase or market Common Shares of the Fund. Additionally, these activities may give the Distributor or its affiliates additional access to sales representatives of such
Dealers, which may increase sales of Shares. The payments described in this paragraph may be significant to payors and payees. The intermediaries receiving additional payments may change over time, and the Distributor or its affiliates may pay
intermediaries or their affiliates other types of additional payments in the future. Please contact your intermediary to determine whether it or its affiliate currently may be receiving such additional payments and to obtain further information
regarding any such payments.
You may buy Common Shares through your financial advisor, a participating broker or other financial intermediary that has a selling agreement with the Distributor. Because an investment in our Common Shares involves
many considerations, your financial advisor or other financial intermediary may help you with this decision. Due to the illiquid nature of investments in originated loans, our Common Shares are only suitable as a long-term investment. Because there
is no public market for our shares, shareholders may have difficulty selling their shares if we choose to repurchase only some, or even none, of the shares in a particular quarter, or if our Board of Trustees amends or suspends our share repurchase
program.
Investors who meet the suitability standards described herein may subscribe to purchase Common Shares. See “Suitability Standards” in this prospectus. Investors seeking to purchase Common Shares must proceed as
follows:
| • |
Read this entire prospectus and any appendices and supplements accompanying this prospectus.
|
| • |
Complete the execution copy of the subscription agreement. A specimen copy of the subscription agreement, including instructions for completing it, is filed as an exhibit to this Registration Statement. Subscription agreements may be
executed manually or by electronic signature except where the use of such electronic signature has not been approved by the Distributor. Should you execute the subscription agreement electronically, your electronic signature, whether
digital or encrypted, included in the subscription agreement is intended to authenticate the subscription agreement and to have the same force and effect as a manual signature.
|
| • |
Submit a wire transfer, instruct your broker to make payment from your brokerage account or otherwise deliver funds for the full purchase price of the Common Shares being subscribed for along with the completed subscription agreement to
the participating broker. Wire transfers should be directed to “BlackRock Private Credit Fund.” For Class S shares and Class D shares, after you have satisfied the applicable minimum purchase requirement of $2,500, additional purchases must
be in increments of $500. For Institutional shares, after you have satisfied the applicable minimum purchase requirement of $1,000,000 (which is waived or reduced by the Distributor to $10,000 or less for certain investors as described
below under “Plan of Distribution”), additional purchases must be in increments of $500. The minimum subsequent investment does not apply to purchases made under our distribution reinvestment plan. In addition, the Distributor may elect to
accept smaller initial and subsequent investments in its discretion. Financial intermediaries may impose their own minimum investment requirements for initial and/or subsequent investments in excess of those described in this Prospectus.
|
| • |
By executing the subscription agreement and paying the total purchase price for the Common Shares subscribed for, each investor attests that he or she meets the suitability standards as stated in the subscription agreement and agrees to
be bound by all of its terms. Certain financial advisors, participating brokers or other intermediaries may require additional documentation.
|
A sale of the shares to a subscriber may not be completed until at least five business days after the subscriber receives our final prospectus. On each business day, our transfer agent will collect subscription
requests. Subscriptions to purchase our Common Shares may be made on an ongoing basis, but investors may only purchase our Common Shares as of the first business day of each month (based on the NAV per share as determined as of the last day of the
preceding month) pursuant to subscription orders accepted by the Fund. To be accepted, a subscription request must be made with a completed and executed subscription agreement in good order, including satisfying any additional requirements imposed
by the subscriber’s broker or other intermediary, and payment of the full purchase price of our Common Shares. A subscription request including the full subscription amount must be received by the Fund in good order at least five business days
prior to the first business day of the month (unless waived by the Distributor). If a subscription request is received less than five business days prior to the first business day of the month (unless waived by the Distributor) the subscription
request, if accepted by the Fund, will be executed at the next month’s closing at the transaction price applicable to that month. As a result of this process, the price per share at which your order is executed may be different than the price per
share for the month for which you initially submitted your subscription request.
For example, if you wish to subscribe for Common Shares in October, your subscription request must be received in good order at least five business days before November 1. Notice of each share transaction will be
furnished to shareholders (or their financial representatives) as soon as practicable but not later than seven business days after the
Fund’s NAV as of October 31 is determined and credited to the shareholder’s account, together with information relevant for personal and tax records. While a shareholder will not know our NAV applicable on the
effective date of the share purchase, our NAV applicable to a purchase of shares will be available through our website at www.bdebt.com generally within 20 business days after the effective date of the share purchase; at that time, the
number of shares based on that NAV and each shareholder’s purchase will be determined and shares are credited to the shareholder’s account as of the effective date of the share purchase. In this example, if accepted by the Fund, your subscription
would be effective on the first business day of November.
Your financial advisor, broker or other financial intermediary may impose additional deadlines to receive and transmit to the Fund your subscription request. Contact your financial advisor, broker or other financial
intermediary for information regard any additional deadlines or requirements for the transmittal of subscription requests. The method of delivery of a subscription agreement, including any failure of an intermediary to transmit a subscription
request in proper form or in a timely manner, is at the election and risk of the subscribing investor.
Completed subscription requests will not be accepted by us any earlier than two business days before the first business day of each month.
Subscription amounts will be held in a non-interest-bearing account by the Fund’s transfer agent, prior to the subscription being accepted by the Fund.
Notwithstanding the submission of a subscription request, we can reject subscriptions for any reason, even if a prospective investor meets the minimum suitability requirements outlined in our prospectus.
Subscribers are not committed to purchase shares at the time their subscription orders are submitted and any subscription may be canceled at any time before the time it has been accepted as described in the previous
sentence. You may withdraw your purchase request by notifying the transfer agent, through your financial intermediary or directly on our toll-free, automated telephone line, (888) 204-3956.
If for any reason we reject the subscription, or if the subscription request is withdrawn or canceled before it is accepted, we will return the subscription agreement and the related funds, without interest or
deduction, within ten business days after such rejection, cancellation or withdrawal. If you place an order to buy shares and your payment is not received and collected, your purchase may be canceled and you could be liable for any losses or fees
we have incurred.
Common Shares purchased by a fiduciary or custodial account may be registered in the name of the fiduciary account and not in the name of the beneficiary.
You have the option of placing a transfer on death (TOD), designation on your shares purchased in this offering. A TOD designation transfers the ownership of the shares to your designated beneficiary upon your death.
This designation may only be made by individuals, not entities, who are the sole or joint owners with right to survivorship of the shares. If you would like to place a TOD designation on your shares, you must check the TOD box on the subscription
agreement and you must complete and return a TOD form, which you may obtain from your financial advisor, in order to effect the designation.
Purchase Price
Shares of each class of our Common Shares are issued on a monthly basis at a price per share equal to the NAV per share for such class, as described in “Determination of Net Asset Value.” Each class of shares may
have a different NAV per share because shareholder servicing and/or distribution fees differ with respect to each class.
While a shareholder will not know our NAV applicable on the effective date of the share purchase, our NAV applicable to a purchase of shares will be available at our website at www.bdebt.com generally within
20 business days after the effective date of the share purchase; at that time, the number of shares based on that NAV and each shareholder’s purchase will be determined and shares are credited to the shareholder’s account as of the effective date
of the share purchase.
You will receive a confirmation statement of each new transaction in your account as soon as practicable but generally not later than seven business days after the shareholder transactions are settled when the
applicable NAV per share is determined. The confirmation statement will include information on how to obtain information we have filed with the SEC and made publicly available through our website, www.bdebt.com, including supplements to the
prospectus.
If you participate in our distribution reinvestment plan, the cash distributions attributable to the class of shares that you purchase in our primary offering will be automatically invested in additional shares of
the same class. The purchase price for shares purchased under our distribution reinvestment plan will be equal to the most recent available NAV per share for such shares at the time the distribution is payable.
Our NAV may vary significantly from one month to the next. Through our website at www.bdebt.com, you will have information about the most recently available NAV per share.
In contrast to securities traded on an exchange or over-the-counter, where the price often fluctuates as a result of, among other things, the supply and demand of securities in the trading market, our NAV will be
calculated once monthly using our valuation methodology, and the price at which we sell new shares will not change depending on the level of demand by investors or the volume of requests for repurchases.
We do not intend to list our shares on a securities exchange and we do not expect there to be a public market for our shares. As a result, if you purchase our Common Shares, your ability to sell your shares will be
limited.
The Fund has commenced a share repurchase program in which the Fund, at the discretion of our Board of Trustees, intends to repurchase, in each quarter, up to 5% of the Fund’s Common Shares outstanding (either by
number of shares or aggregate NAV) as of the close of the previous calendar quarter. The Fund does not intend to commence a share repurchase offer during any calendar quarter for which our liquid assets plus available and undrawn leverage are less
than 25% of our net assets as of the date of the most recent publicly available NAV prior to the commencement of such calendar quarter. For purposes of this calculation, “undrawn leverage” is equal to (x) the lesser of (a) the maximum amount the
Fund may borrow under its then effective credit agreement or other borrowing facility or (b) the maximum amount the Fund may borrow under the 1940 Act, less (y) the Fund’s then outstanding borrowings. We intend to conduct such repurchase offers in
accordance with the requirements of Rule 13e-4 promulgated under the Exchange Act and the 1940 Act.
As a hypothetical example, if as of the date of the most recent publicly available NAV, the Fund had (i) $100 million in net assets, (ii) $18 million in liquid assets, (iii) a credit facility under which the Fund
could borrow up to $45 million, and (iv) outstanding borrowings under that credit facility of $25 million, the Fund’s ability to conduct a repurchase offer would not be limited by the foregoing policy, as liquid assets of $18 million plus undrawn
leverage of $20 million would equal 38% of the Fund’s net assets.
In addition, our Board of Trustees has complete discretion to determine whether we will engage in any share repurchase and may amend or suspend the share repurchase program if it deems such action to be in our best
interest and the best interest of our shareholders. As a result, share repurchases may not be available each quarter. Following a determination by the Board of Trustees to suspend the share repurchase program or materially amend the share
repurchase program in a manner that reduces liquidity available to shareholders, the Board of Trustees will consider, at least quarterly, whether the continued suspension of the program or operation of the program under such amended terms or the
resumption of the program as described herein would be in the best interest of the Fund and our shareholders.
Under our share repurchase plan, to the extent we offer to repurchase shares in any particular quarter pursuant to a tender offer, we expect to repurchase shares pursuant to tender offers on or around the last
business day of that quarter using a purchase price equal to the NAV per share as of the last day of the applicable quarter, except that shares that have not been outstanding for at least one year will be repurchased at 98% of such NAV (an “Early
Repurchase Deduction”). The one-year holding period is measured as of the subscription closing date immediately following the valuation date of the applicable tender offer. The Early Repurchase Deduction may be waived at the Fund’s or Distributor’s
discretion (a) in the case of repurchase requests arising from the death, divorce or qualified disability of the holder, (b) due to trade or operational error, or (c) for repurchase requests with respect to shares held in accounts of asset
allocation programs, such as model portfolio management programs (and similar arrangements). The Early Repurchase Deduction will be waived in the event that a shareholder’s shares are purchased because the shareholder has failed to maintain the
$500 minimum account balance. In addition, the Fund’s Common Shares are sold to certain feeder vehicles primarily created to hold the Fund’s Common Shares that in turn offer interests in such feeder vehicles to non-U.S. persons. For such feeder
vehicles and similar arrangements in certain markets, the Fund may not apply the Early Repurchase Deduction to the feeder vehicles or underlying investors, often because of administrative or systems limitations. The Early Repurchase Deduction will
be retained by the Fund for the benefit of remaining shareholders.
If during any Four Quarter Period, there is not at least one quarter in which the Fund fully accepts all properly submitted tenders in a repurchase offer, the Investment Adviser intends to recommend that the Board
approve a plan pursuant to which the Fund will not make any new investments (excluding investment in any transactions for which there are binding written agreements (including investments funded in phases), follow-on investments made in existing
portfolio companies, revolver or credit facility, letter of credit or similar credit support drawdowns, and obligations under any existing Fund guarantee and except as necessary for the Fund to (i) preserve its status as a RIC under the Code and as
a BDC, (ii) repay indebtedness to allow for distributions or (iii) comply with applicable law) and will use all “capital available for investing” to accept properly submitted tenders until such time that all properly submitted tenders in any one
repurchase offer have been fully accepted; provided that the Investment Adviser does not intend to make such recommendations to the Board if the Fund has, during such Four Quarter Period, accepted repurchase offers for at least (i) 5% of the
aggregate Common Shares outstanding (either by number of shares or aggregate NAV) in each of the quarters in such Four Quarter Period or (ii) the equivalent aggregate percentage (i.e. 20%) of Common Shares outstanding (either by number of shares or
aggregate NAV)) during such Four Quarter Period.
For these purposes, “capital available for investing” will be determined based on the amount of cash on hand, less Fund expenses, including, without limitation, management fees, amounts that may become due under any
borrowing or other financings or similar obligations, amounts needed to meet current or anticipated debt covenants, obligations imposed by law, including the requirement under the NASAA Omnibus Guidelines that the Fund not impair its capital or
operations, courts, or arbitration or indemnity obligations. The purpose of this recommendation would be to allow the Fund to satisfy as many properly submitted tender requests as possible and it is expected that during this time, Fund management
and the Board would also consider additional ways to improve shareholder liquidity.
If, during any Four Quarter Period, there is not at least one quarter in which the Fund fully accepts all properly submitted tenders in a repurchase offer, then beginning at the end of such Four Quarter Period the
Investment Adviser will defer its incentive fee until all properly submitted tenders in any one repurchase offer have been accepted, after which such deferred incentive fee will become payable and no further incentive fee amounts will be required
to be deferred; provided that the Investment Adviser is not required to defer its incentive fee if the Fund has, during such Four Quarter Period, accepted repurchase offers for at least (i) 5% of the aggregate Common Shares outstanding (either by
number of shares or aggregate NAV) in each of the quarters in such Four Quarter Period or (ii) the equivalent aggregate percentage (i.e. 20%) of Common Shares outstanding (either by number of shares or aggregate NAV)) during such Four Quarter
Period.
You may tender all of the Common Shares that you own. There is no repurchase priority for a shareholder under the circumstances of death or disability of such shareholder.
In the event the amount of shares tendered exceeds the repurchase offer amount, shares will be repurchased on a pro rata basis. All unsatisfied repurchase requests must be resubmitted in the next quarterly tender
offer, or upon the recommencement of the share repurchase plan, as applicable. We will have no obligation to repurchase shares, including if the repurchase would violate the restrictions on distributions under federal law or Delaware law. The
limitations and restrictions described above may prevent us from accommodating all repurchase requests made in any quarter. Our share repurchase program has many limitations, including the limitations described above, and should not in any way be
viewed as the equivalent of a secondary market.
We will offer to repurchase shares on such terms as may be determined by our Board of Trustees in its complete and absolute discretion unless, in the judgment of our Independent Trustees, such repurchases would not
be in the best interests of our shareholders or would violate applicable law. There is no assurance that our Board of Trustees will exercise its discretion to offer to repurchase shares or that there will be sufficient funds available to
accommodate all of our shareholders’ requests for repurchase. As a result, we may repurchase less than the full amount of shares that you request to have repurchased. If we do not repurchase the full amount of your shares that you have requested to
be repurchased, or we determine not to make repurchases of our shares, you will likely not be able to dispose of your shares, even if we under-perform. Any periodic repurchase offers will be subject in part to our available cash and compliance with
the RIC qualification and diversification rules and the 1940 Act. Shareholders will not pay a fee to us in connection with our repurchase of shares under the share repurchase program.
The Fund will repurchase shares from shareholders pursuant to written tenders on terms and conditions that the Board of Trustees determines to be fair to the Fund and to all shareholders. When the Board of Trustees
determines that the Fund will repurchase shares, notice will be provided to shareholders describing the terms of the offer, containing information shareholders should consider in deciding whether to participate in the repurchase opportunity and
containing information on how to participate. Shareholders deciding whether to tender their shares during the period that a repurchase offer is open may obtain the Fund’s most recent NAV per share through our website at: www.bdebt.com. However, our
repurchase offers will generally use the NAV on or around the last day of a calendar quarter, which will not be available until after the expiration of the applicable tender offer, so you will not know the exact price of shares in the tender offer
when you make your decision whether to tender your shares.
Repurchases of shares from shareholders by the Fund will be paid in cash promptly after the determination of the relevant NAV per share is finalized. Repurchases will be effective after receipt and acceptance by the
Fund of eligible written tenders of shares from shareholders by the applicable repurchase offer deadline. The Fund does not impose any charges in connection with repurchases of shares. All shares purchased by us pursuant to the terms of each tender
offer will be retired and thereafter will be authorized and unissued shares.
The majority of our assets will consist of instruments that cannot generally be readily liquidated without impacting our ability to realize full value upon their disposition. Therefore, we may not always have
sufficient liquid resources to make repurchase offers. In order to provide liquidity for share repurchases, we intend to generally maintain under normal circumstances an allocation to syndicated loans and other liquid investments. We may fund
repurchase requests from sources other than cash flow from operations, including, without limitation, the sale of assets, borrowings, return of capital or offering proceeds, and, subject to certain limitations imposed under the NASAA Omnibus
Guidelines, we have no limits on the amounts we may pay from such sources. However, we do not intend to commence a share repurchase offer during any calendar quarter for which our liquid assets plus available and undrawn leverage are less than 25%
of our net assets as of the date of the most recent publicly available NAV prior to the commencement of such calendar quarter. For purposes of the foregoing calculation, our liquid assets are those that we reasonably expect can be sold in current
market conditions within seven calendar days without significantly changing the market price of the investment. In addition, should making repurchase offers, in our judgment, place an undue burden on our liquidity, adversely affect our operations
or risk having an adverse impact on the Fund as a whole, or should we otherwise determine that investing our liquid assets in originated loans or other illiquid investments rather than repurchasing our shares is in the best interests of the Fund as
a whole, then we may choose to offer to repurchase fewer shares than described above, or none at all.
In the event that any shareholder fails to maintain the minimum balance of $500 of our shares, we may repurchase all of the shares held by that shareholder at the repurchase price in effect on the date we determine
that the shareholder has failed to meet the minimum balance. Minimum account repurchases will apply even in the event that the failure to meet the minimum balance is caused solely by a decline in our NAV. In the event of a minimum account
repurchase, the Early Repurchase Deduction will be waived.
Payment for repurchased shares may require us to liquidate portfolio holdings earlier than our Advisers would otherwise have caused these holdings to be liquidated, potentially resulting in losses, and may increase
our investment-related expenses as a result of higher portfolio turnover rates. Our Advisers intend to take measures, subject to policies as may be established by our Board of Trustees, to attempt to avoid or minimize potential losses and expenses
resulting from the repurchase of shares.
We have adopted a distribution reinvestment plan, pursuant to which we will reinvest all cash dividends declared by the Board of Trustees on behalf of our shareholders who do not elect to receive their dividends in
cash as provided below. As a result, if the Board of Trustees authorizes, and we declare, a cash dividend or other distribution, then our shareholders who have not opted out of our distribution reinvestment plan will have their cash distributions
automatically reinvested in additional shares as described below, rather than receiving the cash dividend or other distribution. Distributions on fractional shares will be credited to each participating shareholder’s account to three decimal
places.
No action is required on the part of a registered shareholder to have his, her or its cash dividend or other distribution reinvested in our shares, except shareholders in certain states. Shareholders can elect to
“opt out” of the Fund’s distribution reinvestment plan in their subscription agreements (other than Alabama, Arkansas, California Idaho, Kansas, Kentucky, Maine, Maryland, Massachusetts, Nebraska, New Jersey, North Carolina, Ohio, Oregon,
Tennessee, Vermont and Washington investors and clients of certain participating brokers that do not permit automatic enrollment in our distribution reinvestment plan). Alabama, Arkansas, California, Idaho, Kansas, Kentucky, Maine, Maryland,
Massachusetts, Nebraska, New Jersey, North Carolina, Ohio, Oregon, Tennessee, Vermont and Washington investors and clients of certain participating brokers that do not permit automatic enrollment in our distribution reinvestment plan will
automatically receive their distributions in cash unless they elect to have their cash distributions reinvested in additional Common Shares.
If any shareholder initially elects not to participate, they may later become a participant by subsequently completing and executing an enrollment form or any distribution authorization form as may be available from
the Fund or State Street Bank and Trust Company (the “Plan Administrator”). Participation in the distribution reinvestment plan will begin with the next distribution payable after acceptance of a participant’s subscription, enrollment or
authorization. Shares will be purchased under the distribution reinvestment plan as of the first business day of the month following the record date of the distribution.
If a shareholder seeks to terminate its participation in the distribution reinvestment plan, notice of termination must be received by the Plan Administrator five business days in advance of the first business day of
the next month in order for a shareholder’s termination to be effective for such month. Any transfer of shares by a participant to a non-participant will terminate participation in the distribution reinvestment plan with respect to the transferred
shares. If a participant elects to tender its Common Shares in full, any Common Shares issued to the participant under the Plan subsequent to the expiration of the tender offer will be considered part of the participant’s prior tender, and
participant’s participation in the distribution reinvestment plan will be terminated as of the valuation date of the applicable tender offer. Any distributions to be paid to such shareholder on or after such date will be paid in cash on the
scheduled distribution payment date.
If you elect to opt out of the distribution reinvestment plan, you will receive any distributions we declare in cash. There will be no upfront selling commissions or Distributor fees charged to you if you participate
in the distribution reinvestment plan. We will pay the Plan Administrator fees under the distribution reinvestment plan. If your shares are held by a broker or other financial intermediary, you may change your election by notifying your broker or
other financial intermediary of your election.
Any purchases of our shares pursuant to our distribution reinvestment plan are dependent on the continued registration of our securities or the availability of an exemption from registration in the recipient’s home
state.
The purchase price for shares purchased under our distribution reinvestment plan will be equal to the most recent available NAV per share for such shares at the time the distribution is payable. Common Shares issued
pursuant to our distribution reinvestment plan will have the same voting rights as the Common Shares offered pursuant to this prospectus.
See our Distribution Reinvestment Plan, which is filed as an exhibit to our Registration Statement for this offering, for more information. You may also obtain information about the Distribution Reinvestment Plan by
contacting the Plan Administrator at State Street Bank and Trust Company, ATTN: BlackRock Alternative Funds, 1776 Heritage Drive, JAB3, North Quincy, MA 02171 or at (888) 204-3956.
The Fund has filed an election to be regulated as a BDC under the 1940 Act. The 1940 Act contains prohibitions and restrictions relating to transactions between BDCs and their affiliates (including any investment
advisers or co-advisers), principal underwriters and affiliates of those affiliates or underwriters and requires that a majority of the directors be persons other than “interested persons,” as that term is defined in the 1940 Act. In addition, the
1940 Act provides that the Fund may not change the nature of the Fund’s business so as to cease to be, or to withdraw the Fund’s election as, a BDC unless approved by a majority of the Fund’s outstanding voting securities, which is defined in the
1940 Act as the lesser of a majority of the outstanding voting securities or 67% or more of the securities voting if a quorum of a majority of the outstanding voting securities is present.
The Fund may invest up to 100% of its assets in securities acquired directly from issuers in privately negotiated transactions. With respect to such securities, the Fund may, for the purpose of public resale, be
deemed an “underwriter” as that term is defined in the Securities Act.
The Fund may acquire securities issued by other investment companies in accordance with the limits of the 1940 Act and the rules and regulations promulgated thereunder. The Fund generally may acquire up to 3% of the
voting stock of any investment company, may invest in up to 5% of the value of its total assets in the securities of one investment company and may invest up to 10% of the value of its total assets in the securities of more than one investment
company. Subject to certain exemptive rules, including Rule 12d1-4, the Fund may, subject to certain conditions, invest in other investment companies in excess of such thresholds. With regard to that portion of the Fund’s portfolio invested in
securities issued by investment companies, it should be noted that such investments might indirectly subject shareholders to additional expenses as they will indirectly be responsible for the costs and expenses of such companies. None of the Fund’s
investment policies are fundamental and generally may be changed without shareholder approval. The Fund’s policy to invest at least 80% of its total assets (net assets plus borrowings for investment purposes) in private credit investments (loans,
bonds and other credit instruments that are issued in private offerings or issued by private companies) may be changed by the Board without prior shareholder approval under certain circumstances, with at least 60 days’ prior notice by the Fund.
Exemptive Order and SEC Guidance. The Advisers and the Fund believe that, in certain circumstances, it may be in the Fund’s best interests to be able to co-invest with
registered funds, unregistered funds and business development companies managed now or in the future by the Advisers and their affiliates, along with certain affiliates of the Advisers acting in a principal capacity, in order to be able to
participate in a wider range of transactions. Currently, SEC regulations and interpretations would permit the Fund to co-invest with registered and unregistered funds that are managed by the Advisers and/or their affiliates, along with certain
affiliates of the Advisers acting in a principal capacity, in publicly traded securities and also in private placements where (i) the Advisers negotiate only the price, interest rate and similar price-related terms of the securities and not matters
such as covenants, collateral or management rights and (ii) each relevant account acquires and sells the securities at the same time in pro rata amounts (subject to exceptions approved by compliance personnel after considering the reasons for the
requested exception). Such regulations and interpretations also permit the Fund to co-invest in other private placements with registered investment funds affiliated with the Advisers in certain circumstances, some of which would require certain
findings by the Fund’s Independent Trustees and the independent directors of each other eligible registered fund. Under current SEC regulations, in the absence of an exemption or other guidance from the SEC, the Fund may be prohibited from
co-investing in certain private placements where terms in addition to price are negotiated with certain clients of the Advisers or their affiliates, as well as with certain affiliates of the Advisers acting in a principal capacity.
To the extent permitted by the 1940 Act and interpretations of the staff of the SEC, and subject to the Allocation Policies of the Investment Adviser, the Investment Adviser may deem it appropriate for the Fund to
participate in an investment opportunity alongside certain affiliates of the Investment Adviser and other Client Accounts. On May 6, 2025, the SEC granted the Order, which provides exemptive relief to the Investment Adviser, and certain
affiliates, and the Fund that permits the Fund, subject to satisfaction of certain conditions, to co-invest in certain privately negotiated investment transactions with certain affiliates of the Investment Adviser and certain Client Accounts
managed by the Investment Adviser and other BlackRock Entities. Any of these co-investment opportunities may give rise to conflicts of interest or perceived conflicts of interest among us and the other participating funds and/or accounts. To
mitigate these conflicts, the Investment Adviser and its affiliates managing other funds and accounts participating in transactions under the Order will seek to allocate such transactions for all of the participating investment accounts, including
the Fund, on a fair and equitable basis and in accordance with their respective allocation policies. The Board has reviewed, and expects to in the future, review the Allocation Policies of the Investment Adviser. In addition, pursuant to such
order, the Board is required to maintain oversight of our participation in the co-investment program permitted by such order in the exercise of the Board’s reasonable business judgment, and under certain circumstances, such as in the case of
non-pro rata acquisitions and dispositions, or in the case of pre-existing investments in an issuer by certain affiliated funds or accounts, approve certain co-investment transactions.
The Advisers and their affiliates may spend substantial time on other business activities, including investment management and advisory activities for entities with the same or overlapping investment objectives,
investing for their own account with the Fund, financial advisory services (including services for entities in which the Fund invests), and acting as directors, officers, creditor committee members or in similar capacities. Subject to the
requirements of the 1940 Act, the Advisers and their affiliates and associates intend to engage in such activities and may receive compensation from third parties for their services. Subject to the same requirements, such compensation may be
payable by entities in which the Fund invests in connection with actual or contemplated investments, and the Advisers may receive fees and other compensation in connection with structuring investments which they will share.
The Advisers and their partners, officers, directors, stockholders, members, managers, employees, affiliates and agents may be subject to certain potential or actual conflicts of interest in connection with the
activities of, and investments by, the Fund.
No-Action Relief from Registration as a Commodity Pool Operator. The Fund is relying on a no-action letter (the “No-Action Letter”) issued by the staff of the CFTC as a basis
to avoid registration with the CFTC as a commodity pool operator (“CPO”). The No-Action Letter allows an entity to engage in CFTC-regulated transactions (“commodity interest transactions”) that are “bona fide hedging” transactions (as that term is
defined and interpreted by the CFTC and its staff), but prohibit an entity from entering into commodity interest transactions if they are non-bona fide hedging transactions, unless immediately after entering such non-bona fide hedging transaction
(a) the sum of the amount of initial margin deposits on the entity’s existing futures or swaps positions and option or swaption premiums does not exceed 5% of the market value of the entity’s liquidation value, after taking into account unrealized
profits and unrealized losses on any such transactions, or (b) the aggregate net notional value of the entity’s commodity interest transactions would not exceed 100% of the market value of the entity’s liquidation value, after taking into account
unrealized profits and unrealized losses on any such transactions. The Fund is required to operate pursuant to these trading restrictions if it intends to continue to rely on the No-Action Letter as a basis to avoid CPO registration.
Other. The Fund may also be prohibited under the 1940 Act from knowingly participating in certain transactions with the Fund’s affiliates without the prior approval of the
Independent Trustees and, in some cases, prior approval by the SEC.
The Fund is subject to periodic examination by the SEC for compliance with the 1940 Act.
The Fund is required to provide and maintain a bond issued by a reputable fidelity insurance company to protect the Fund against larceny and embezzlement. Furthermore, as a BDC, the Fund is prohibited from protecting
any director or officer against any liability to the Fund or shareholders arising from willful misfeasance, bad faith, gross negligence or reckless disregard of the duties involved in the conduct of such person’s office.
The Fund and the Advisers are required to adopt and implement written policies and procedures reasonably designed to prevent violation of relevant federal securities laws, review these policies and procedures
annually for their adequacy and the effectiveness of their implementation, and designate a chief compliance officer to be responsible for administering these policies and procedures.
Qualifying Assets
Under the 1940 Act, a BDC may not acquire any asset other than assets of the type listed in section 55(a) of the 1940 Act, which are referred to as qualifying assets, unless, at the time the acquisition is made,
qualifying assets represent at least 70% of the company’s total assets. The principal categories of qualifying assets relevant to the Fund’s proposed business are the following:
| • |
Securities purchased in transactions not involving any public offering from the issuer of such securities, which issuer (subject to certain limited exceptions) is an eligible portfolio company, or from any person who is, or has been
during the preceding 13 months, an affiliated person of an eligible portfolio company, or from any other person, subject to such rules as may be prescribed by the SEC. An eligible portfolio company is defined in the 1940 Act as any issuer
which:
|
| • |
is organized under the laws of, and has its principal place of business in, the United States;
|
| • |
is not an investment company (other than a small business investment company wholly owned by the BDC) or a company that would be an investment company but for certain exclusions under the 1940 Act; and
|
| • |
satisfies either of the following:
|
| • |
has a market capitalization of less than $250.0 million or does not have any class of securities listed on a national securities exchange; or
|
| • |
has been controlled by a BDC or a group of companies including a BDC, the BDC actually exercises a controlling influence over the management or policies of the eligible portfolio company, and, as a result thereof, the BDC has an
affiliated person who is a director of the eligible portfolio company.
|
| • |
Securities of any eligible portfolio company which the Fund controls.
|
| • |
Securities purchased in a private transaction from a U.S. issuer that is not an investment company or from an affiliated person of the issuer, or in transactions incident thereto, if the issuer is in bankruptcy and subject to
reorganization or if the issuer, immediately prior to the purchase of its securities was unable to meet its obligations as they came due without material assistance other than conventional lending or financing arrangements.
|
| • |
Securities of an eligible portfolio company purchased from any person in a private transaction if there is no ready market for such securities and the Fund already owns 60% of the outstanding equity of the eligible portfolio company.
|
| • |
Securities received in exchange for or distributed on or with respect to securities described above, or pursuant to the exercise of warrants or rights relating to such securities.
|
| • |
Cash, cash equivalents, U.S. Government securities or high-quality debt securities maturing in one year or less from the time of investment.
|
Managerial Assistance to Portfolio Companies
A BDC must have been organized and have its principal place of business in the United States and must be operated for the purpose of making investments in the types of securities described in “Qualifying Assets”
above. However, in order to count portfolio securities as qualifying assets for the purpose of the 70% test, the BDC must either control the issuer of the securities or must offer to make available to the issuer of the securities significant
managerial assistance. Where the BDC purchases such securities in conjunction with one or more other persons acting together, the BDC will satisfy this test if one of the other persons in the group makes available such managerial assistance,
although reliance on other investors may not be the sole method by which the BDC satisfies the requirement to make available managerial assistance. Making available managerial assistance means, among other things, any arrangement whereby the BDC,
through its investment manager, directors, officers or employees, offers to provide, and, if accepted, does so provide, significant guidance and counsel concerning the management, operations or business objectives and policies of a portfolio
company.
Temporary Investments
Pending investment in other types of Qualifying Assets, as described above, our investments can consist of cash, cash equivalents, U.S. government securities or high-quality debt securities maturing in one year or
less from the time of investment, which are referred to herein, collectively, as temporary investments, so that 70% of our assets would be Qualifying Assets.
Warrants
Under the 1940 Act, a BDC is subject to restrictions on the issuance, terms and amount of warrants, options or rights to purchase shares that it may have outstanding at any time. In particular, the amount of shares
that would result from the conversion or exercise of all outstanding warrants, options or rights to purchase shares cannot exceed 25% of the BDC’s total outstanding shares.
Leverage and Senior Securities; Coverage Ratio
Under Section 61(a) of the 1940 Act, a BDC is generally not permitted to issue senior securities unless after giving effect thereto the BDC meets a coverage ratio of total assets, less liabilities and indebtedness
not represented by senior securities, to total senior securities, which includes all borrowings of the BDC, of at least 200%. Provided that a BDC meets certain disclosure requirements and obtains certain approvals, the asset coverage requirement
applicable to such BDC is reduced from 200% to 150%. The reduced asset coverage requirement permits a BDC to have a ratio of total consolidated assets to outstanding indebtedness of 2:1 as compared to a maximum of 1:1 under the 200% asset coverage
requirement. On March 16, 2022, our sole shareholder approved the adoption of this 150% threshold pursuant to Section 61(a)(2) of the 1940 Act and such election became effective the following day.
We are permitted, under specified conditions, to issue multiple classes of indebtedness and one class of shares senior to our Common Shares if our asset coverage, as defined in the 1940 Act, would at least equal 150%
immediately after each such issuance.
While any senior securities remain outstanding, we will be required to make provisions to prohibit any dividend distribution to our shareholders or the repurchase of such securities or shares unless we meet the
applicable asset coverage ratios at the time of the dividend distribution or repurchase. We will also be permitted to borrow amounts up to 5% of the value of our total assets for temporary or emergency purposes, which borrowings would not be
considered senior securities.
We have established one or more credit facilities and may enter into other credit facilities, subscription facilities or other financing arrangements to facilitate investments and the timely payment of our expenses.
It is anticipated that any such credit facilities will bear interest at floating rates at to be determined spreads over SOFR or another reference benchmark. We cannot assure shareholders that we will be able to enter into an additional credit
facility. Shareholders will indirectly bear the costs associated with any borrowings under any additional credit facility or otherwise. In connection with any additional credit facility or other borrowings, lenders may require us to pledge assets,
commitments and/or drawdowns (and the ability to enforce the payment thereof) and may ask to comply with positive or negative covenants that could have an effect on our operations. In addition, from time to time, our losses on leveraged investments
may result in the liquidation of other investments held by us and may result in additional drawdowns to repay such amounts.
We may also create leverage by securitizing our assets (including in CLOs) and retaining the equity portion of the securitized vehicle. See “Risk Factors—We may form one or more CLOs, which may subject us to certain
structured financing risks.” We may also from time to time make secured loans of our marginable securities to brokers, dealers and other financial institutions.
Brokerage Allocations and Other Practices
Subject to the supervision of the Board of Trustees, decisions to buy and sell securities and bank debt for the Fund and decisions regarding brokerage commission rates are made by the Advisers. Transactions on stock
exchanges involve the payment by the Fund of brokerage commissions. In certain instances, the Fund may make purchases of underwritten issues at prices which include underwriting fees.
In selecting a broker to execute each particular transaction, the Advisers will take the following into consideration: the best net price available; the reliability, integrity and financial condition of the broker;
the size and difficulty in executing the order, and the value of the expected contribution of the broker to the investment performance of the Fund on a continuing basis. Accordingly, the cost of the brokerage commissions to the Fund in any
transaction may be greater than that available from other brokers if the difference is reasonably justified by other aspects of the portfolio execution services offered. The extent to which the Advisers make use of statistical, research and other
services furnished by brokers may be considered by the Advisers in the allocation of brokerage business, but there is not a formula by which such business is allocated. The Advisers do so in accordance with its judgment of the best interests of the
Fund and its shareholders.
One or more of the other investment funds or accounts which the Advisers manages may own from time to time some of the same investments as the Fund. When two or more companies or accounts seek to purchase or sell the
same securities, the securities actually purchased or sold and any transaction costs will be allocated among the companies and accounts on a good faith equitable basis by the Advisers in its discretion in accordance with the accounts’ various
investment objectives, subject to the allocation procedures adopted by the Board of Trustees related to privately placed securities (including an implementation of any co-investment exemptive relief obtained by the Fund and the Investment Adviser).
In some cases, this system may adversely affect the price or size of the position obtainable for the Fund. In other cases, however, the ability of the Fund to participate in volume transactions may produce better execution for the Fund. It is the
opinion of the Board of Trustees that this advantage, when combined with the other benefits available due to the Advisers’ organization, outweighs any disadvantages that may be said to exist from exposure to simultaneous transactions.
Code of Ethics
The Fund adopted a code of ethics pursuant to Rule 17j-1 under the 1940 Act that establishes procedures for personal investments and restricts certain personal securities transactions. Personnel subject to such code
may invest in securities for their personal investment accounts, including securities that may be purchased or held by the Fund, so long as such investments are made in accordance with the code’s requirements. The code of ethics is attached as an
exhibit to this Registration Statement and is available on the EDGAR Database on the SEC’s Internet site at https://www.sec.gov.
Proxy Voting Policies and Procedures
The Fund has delegated proxy voting responsibility to the Investment Adviser. A summary of the Proxy Voting Policies and Procedures of the Investment Adviser are set forth below. The guidelines are reviewed
periodically by the Investment Adviser and the Fund’s non-interested directors, and, accordingly, are subject to change.
The Investment Adviser is registered under the Advisers Act and has a fiduciary duty to act solely in the best interests of its clients. As part of this duty, it recognizes that it must vote securities held by its
clients in a timely manner free of conflicts of interest. These policies and procedures for voting proxies for investment advisory clients are intended to comply with Section 206 of, and Rule 206(4)-6 under, the Advisers Act.
The Investment Adviser votes proxies relating to the Fund’s portfolio securities in the best interest of shareholders. The Investment Adviser reviews on a case-by-case basis each proposal submitted for a proxy vote
to determine its impact on the Fund’s investments. Although it generally votes against proposals that may have a negative impact on the Fund’s investments, it may vote for such a proposal if there are compelling long-term reasons to do so.
The proxy voting decisions of the Investment Adviser are made by the senior officers who are responsible for monitoring each of the Fund’s investments. To ensure that the Fund’s vote is not the product of a conflict
of interest, it requires that: (i) anyone involved in the decision making process disclose to the Investment Adviser any potential conflict that he or she is aware of and any contact that he or she has had with any interested party regarding a
proxy vote; and (ii) employees involved in the decision making process or vote administration are generally prohibited from revealing how the Fund intends to vote on a proposal in order to reduce any attempted influence from interested parties.
You may obtain information about how the Fund voted proxies by making a written request for proxy voting information to the Fund, at 50 Hudson Yards, New York, New York 10001, Attention: Investor Relations.
Affiliated Transactions
We may be prohibited under the 1940 Act from conducting certain transactions with our affiliates without the prior approval of our Trustees who are not interested persons and, in some cases, the prior approval of the
SEC. We have received an exemptive order from the SEC that permits us, among other things, to co-invest with certain other persons, including certain affiliates of the Investment Adviser and certain funds managed and controlled by the Investment
Adviser and its affiliates, subject to certain terms and conditions.
Reporting Obligations
Our internet address is www.bdebt.com. We make available free of charge on our website our annual report on Form 10-K, quarterly reports on Form 10-Q, current reports on Form 8-K, proxy statement and amendments to
those reports as soon as reasonably practicable after we electronically file such material with, or furnish it to, the SEC. This information will also be available on the SEC’s website at www.sec.gov.
Other
We will be periodically examined by the SEC for compliance with the 1940 Act, and be subject to the periodic reporting and related requirements of the Exchange Act.
We are also required to provide and maintain a bond issued by a reputable fidelity insurance company to protect against larceny and embezzlement. Furthermore, as a BDC, we are prohibited from protecting any Trustee
or officer against any liability to our shareholders arising from willful misfeasance, bad faith, gross negligence or reckless disregard of the duties involved in the conduct of such person’s office.
We are also required to designate a chief compliance officer and to adopt and implement written policies and procedures reasonably designed to prevent violation of the federal securities laws and to review these
policies and procedures annually for their adequacy and the effectiveness of their implementation.
We are not permitted to change the nature of our business so as to cease to be, or to withdraw our election as, a BDC unless approved by a majority of our outstanding voting securities. A majority of the outstanding
voting securities of a company is defined under the 1940 Act as the lesser of: (i) 67% or more of such company’s shares present at a meeting if more than 50% of the outstanding shares of such company are present or represented by proxy, or (ii)
more than 50% of the outstanding shares of such company.
Sarbanes-Oxley Act of 2002
The Sarbanes-Oxley Act of 2002 imposes a wide variety of regulatory requirements on publicly-held companies and their insiders. While certain of these requirements are not applicable to the Fund (see “JOBS Act”),
many of these requirements affect the Fund. For example:
| • |
Pursuant to Rule 13a-14 of the Exchange Act, the Fund’s Chief Executive Officer and Chief Financial Officer must certify the accuracy of the financial statements contained in the Fund’s periodic reports;
|
| • |
Pursuant to Item 307 of Regulation S-K, the Fund’s periodic reports must disclose the Fund’s conclusions about the effectiveness of disclosure controls and procedures;
|
| • |
Pursuant to Rule 13a-15 of the Exchange Act, Fund management must prepare a report regarding its assessment of internal control over financial reporting; and
|
| • |
Pursuant to Item 308 of Regulation S-K and Rule 13a-15 of the Exchange Act, the Fund’s periodic reports must disclose whether there were significant changes in internal controls or in other factors that could significantly affect these
controls subsequent to the date of their evaluation, including any corrective actions with regard to significant deficiencies and material weaknesses.
|
The Sarbanes-Oxley Act requires the Fund to review its current policies and procedures to determine whether the Fund complies with the Sarbanes-Oxley Act and the regulations promulgated thereunder. The Fund will
continue to monitor compliance with all regulations that are adopted under the Sarbanes-Oxley Act and will take actions necessary to ensure that the Fund is in compliance therewith.
JOBS Act
The Fund currently is and expects to remain an “emerging growth company,” as defined in the JOBS Act, until the earliest of:
| • |
The last day of the Fund’s fiscal year in which the fifth anniversary of an initial public offering of shares of common stock occurs;
|
| • |
The end of the fiscal year in which the Fund’s total annual gross revenues first exceed $1.235 billion;
|
| • |
The date on which the Fund has, during the prior three-year period, issued more than $1.0 billion in non-convertible debt; and
|
| • |
The last day of a fiscal year in which the Fund (1) has an aggregate worldwide market value of Common Shares held by non-affiliates of $700 million or more, computed at the end of each fiscal year as of the last business day of the
Fund’s most recently completed second fiscal quarter and (2) has been an Exchange Act reporting company for at least one year (and filed at least one annual report under the Exchange Act).
|
Under the JOBS Act and the Dodd-Frank Act, the Fund is exempt from the provisions of Section 404(b) of the Sarbanes-Oxley Act, which would require that the Fund’s independent registered public accounting firm provide
an attestation report on the effectiveness of internal control over financial reporting, until such time as the Fund ceases to be an emerging growth company and becomes an accelerated filer as defined in Rule 12b-2 under the Exchange Act. This may
increase the risk that material weaknesses or other deficiencies in the Fund’s internal control over financial reporting go undetected.
Under the JOBS Act, emerging growth companies can delay adopting new or revised accounting standards until such time as those standards apply to private companies. The Fund has made an irrevocable election not to
take advantage of this exemption from new or revised accounting standards. The Fund therefore is subject to the same new or revised accounting standards as other public companies that are not emerging growth companies.
The following is a summary of U.S. federal income tax considerations generally applicable to a shareholder who purchases Common Shares in an offering pursuant to this prospectus. This summary reflects applicable
income tax laws of the United States as of the date of this prospectus, which are subject to change by legislative, judicial or administrative action, and any change may be retroactive. The discussion does not purport to deal with all of the U.S.
federal income tax consequences applicable to the Fund, or which may be important to particular shareholders in light of their individual investment circumstances or to shareholders subject to special tax rules, such as shareholders subject to the
alternative minimum tax, financial institutions, broker-dealers, insurance companies, tax-exempt organizations, a shareholder whose “functional currency” is not the U.S. dollar, persons who have elected mark-to-market treatment for their Common
Shares, partnerships or other pass-through entities, persons holding common stock in connection with a hedging, straddle, conversion or other integrated transaction, persons engaged in a trade or business in the United States or persons who have
ceased to be U.S. citizens or to be taxed as resident aliens. This summary does not discuss any aspects of U.S. estate or gift tax or foreign, state or local tax. This discussion assumes that the shareholder holds its common stock as a capital
asset for U.S. federal income tax purposes (generally, assets held for investment). No attempt is made to present a detailed explanation of all U.S. federal income tax aspects affecting the Fund and the Fund’s shareholders, and the discussion set
forth herein does not constitute tax advice. No ruling has been or will be sought from the Internal Revenue Service (the “IRS”) regarding any matter discussed herein. No assurance can be given that the IRS would not assert, or that a court would
not sustain, a position contrary to any of the tax aspects set forth below.
In view of the complexity of the tax matters relating to the Fund, the tax consequences of an investment in the Common Shares will depend on the investor’s particular situation. Shareholders are urged to consult
their tax advisors to determine the U.S. federal, state, local and foreign tax consequences to them of investing in the Common Shares.
Taxation of the Fund
The Fund has elected and expects to qualify annually to be taxed as a RIC under the Code. To qualify as a RIC, the Fund must, among other things, (a) qualify to be treated as a business development company or be
registered as a management investment company under the 1940 Act at all times during the taxable year; (b) derive in each taxable year at least 90 percent of its gross income from dividends, interest (including tax-exempt interest), payments with
respect to certain securities loans, gains from the sale or other disposition of stock, securities or foreign currencies, other income (including but not limited to gain from options, futures and forward contracts) derived with respect to the
Fund’s business of investing in stock, securities or currencies, or net income derived from an interest in a “qualified publicly traded partnership” (a “QPTP”); and (c) diversify the Fund’s holdings so that, at the end of each quarter of each
taxable year (i) at least 50 percent of the market value of the Fund’s total assets is represented by cash and cash items, U.S. Government securities, the securities of other regulated investment companies and other securities, with other
securities limited, in respect of any one issuer, to an amount not greater than five percent of the value of the Fund’s total assets and not more than 10 percent of the outstanding voting securities of such issuer, and (ii) not more than 25 percent
of the market value of the Fund’s total assets is invested in the securities (other than U.S. Government securities and the securities of other RICs) (A) of any issuer, (B) of any two or more issuers that the Fund controls and that are determined
to be engaged in the same business or similar or related trades or businesses, or (C) of one or more QPTPs. The Fund may generate certain income that might not qualify as good income for purposes of the 90% annual gross income requirement described
above. The Fund will monitor its transactions to endeavor to prevent its disqualification as a RIC.
For purposes of determining whether the Fund satisfies the 90% gross income test described in clause (a) above, the character of the Fund’s distributive share of items of income, gain and loss derived through any
subsidiary or investment that is classified as a partnership for U.S. federal income tax purposes (other than a QPTP) generally will be determined as if the Fund realized such tax items directly.
If the Fund fails to satisfy the 90% annual gross income requirement or the asset diversification requirements discussed above in any taxable year, the Fund may be eligible for relief provisions if the failures are
due to reasonable cause and not willful neglect and if a penalty tax is paid with respect to each failure to satisfy the applicable requirements.
Additionally, relief is provided for certain de minimis failures of the asset diversification requirements where the Fund corrects the failure within a specified period. If the applicable relief provisions are not
available or cannot be met, all of the Fund’s income would be subject to corporate-level U.S. federal income tax as described below. The Fund cannot provide assurance that the Fund would qualify for any such relief should the Fund fail the 90%
annual gross income requirement or the asset diversification requirements discussed above.
As a RIC, in any taxable year with respect to which the Fund timely distributes at least 90% of the sum of the Fund’s (i) investment company taxable income (which includes, among other items, dividends, interest and
the excess of any net short-term capital gain over net long-term capital loss and other taxable income (other than any net capital gain), reduced by deductible expenses) determined without regard to the deduction for dividends and distributions
paid and (ii) net tax exempt interest income (which is the excess of the Fund’s gross tax exempt interest income over certain disallowed deductions) (the “Annual Distribution Requirement”), the Fund (but not its shareholders) generally will not be
subject to U.S. federal income tax on investment company taxable income and net capital gain (generally, net long-term capital gain in excess of short-term capital loss) that the Fund distributes to its shareholders. The Fund intends to distribute
annually all or substantially all of such income on a timely basis. To the extent that the Fund retains net capital gain for investment or any investment company taxable income, the Fund will be subject to U.S. federal income tax at regular
corporate income tax rates. The Fund may choose to retain net capital gains for investment or any investment company taxable income, and pay the associated U.S. federal corporate income tax, including the U.S. federal excise tax described below.
Amounts not distributed on a timely basis in accordance with a calendar year distribution requirement are subject to a nondeductible 4% U.S. federal excise tax payable by the Fund. To avoid this tax, the Fund must
distribute (or be deemed to have distributed) during each calendar year an amount equal to the sum of:
| 1) |
at least 98% of the Fund’s ordinary income (not taking into account any capital gains or losses) for the calendar year;
|
| 2) |
at least 98.2% of the amount by which the Fund’s capital gains exceed its capital losses (adjusted for certain ordinary losses) for a one-year period generally ending on October 31 of the calendar year (unless an election is made by the
Fund to use its taxable year); and
|
| 3) |
certain undistributed amounts from previous years on which the Fund paid no U.S. federal income tax.
|
While the Fund intends to distribute any income and capital gains in the manner necessary to minimize imposition of the four percent U.S. federal excise tax, sufficient amounts of the Fund’s taxable income and
capital gains may not be distributed to avoid entirely the imposition of the tax. In that event, the Fund will be liable for the tax only on the amount by which the Fund does not meet the foregoing distribution requirement.
If, in any particular taxable year, the Fund does not satisfy the Annual Distribution Requirement or otherwise was to fail to qualify as a RIC (for example, because the Fund fails the 90% annual gross income
requirement described above), and relief is not available as discussed above, all of the Fund’s taxable income (including net capital gains) will be subject to tax at regular corporate rates without any deduction for distributions to shareholders,
and distributions generally will be taxable to the shareholders as ordinary dividends to the extent of the Fund’s current and accumulated earnings and profits.
The Fund may decide to be taxed as a regular corporation even if it would otherwise qualify as a RIC if the Fund determines that treatment as a corporation for a particular year would be in the Fund’s best interests.
Except as otherwise expressly indicated, the remainder of this discussion assumes the Fund will continue to qualify as a RIC.
As a RIC, the Fund is permitted to carry forward a net capital loss realized in a taxable year to offset its capital gain, if any, realized in future years. If future capital gain is offset by carried forward capital
losses, such future capital gain is not subject to fund-level U.S. federal income tax, regardless of whether it is distributed to shareholders. A RIC cannot carry back or carry forward any net operating losses.
Fund Investments
Certain of the Fund’s investment practices are subject to special and complex U.S. federal income tax provisions that may, among other things, (i) disallow, suspend or otherwise limit the allowance of certain losses
or deductions, including the dividends received deduction, (ii) convert lower taxed long-term capital gain and qualified dividend income into higher taxed short-term capital gain or ordinary income, (iii) convert ordinary loss or a deduction into
capital loss (the deductibility of which is more limited), (iv) cause the Fund to recognize income or gain without a corresponding receipt of cash, (v) adversely affect the time as to when a purchase or sale of stock or securities is deemed to
occur, (vi) adversely alter the characterization of certain complex financial transactions and (vii) produce income that will not qualify as “good income” for purposes of the 90% annual gross income requirement described above. These tax provisions
could therefore affect the amount, timing and character of distributions to shareholders. The Fund will monitor its transactions and may make certain tax elections and may be required to borrow money or dispose of securities to mitigate the effect
of these rules and prevent disqualification of the Fund as a RIC.
Investments the Fund makes in securities issued at a discount or providing for deferred interest or PIK interest are subject to special tax rules that will affect the amount, timing and character of distributions to
shareholders. For example, with respect to such securities, the Fund will generally be required to accrue daily as income “original issue discount” with respect to such securities and to distribute such income on a timely basis each year to
maintain the Fund’s qualification as a RIC and to avoid U.S. federal income and excise taxes. Since in these and potentially in other circumstances the Fund may recognize income before or without receiving cash representing such income, the Fund
may have difficulty making distributions in the amounts necessary to satisfy the requirements for maintaining RIC status and for avoiding U.S. federal income and excise taxes. Accordingly, the Fund may have to sell some of its investments at times
the Fund would not consider advantageous, raise additional debt or equity capital or reduce new investment originations to meet these distribution requirements. If the Fund is not able to obtain cash from other sources, the Fund may fail to qualify
as a RIC and thereby be subject to corporate-level income tax.
Furthermore, a portfolio company in which the Fund invests may face financial difficulty that requires the Fund to work-out, modify or otherwise restructure its investment in the portfolio company. Any such
restructuring may result in unusable capital losses and future non-cash income. Any such restructuring may also result in the Fund’s recognition of a substantial amount of non-qualifying income for purposes of the 90% gross income requirement or
the Fund receiving assets that would not be qualifying for purposes of the asset diversification requirements.
The Fund may invest in preferred securities or other securities the U.S. federal income tax treatment of which may be unclear or may be subject to recharacterization by the IRS. To the extent the tax treatment of
such securities or the income from such securities differs from the expected tax treatment, it could affect the timing or character of income recognized, requiring the Fund to purchase or sell securities, or otherwise change the Fund’s portfolio,
in order to comply with the tax rules applicable to RICs under the Code.
Gain or loss recognized by the Fund from warrants acquired by the Fund as well as any loss attributable to the lapse of such warrants generally will be treated as capital gain or loss. Such gain or loss generally
will be long-term or short-term, depending on how long the Fund held a particular warrant.
In the event the Fund invests in foreign securities, the Fund may be subject to withholding and other foreign taxes with respect to those securities. Shareholders will generally not be entitled to claim a U.S.
foreign tax credit or deduction with respect to foreign taxes paid by the Fund.
If the Fund purchases shares in a “passive foreign investment company” (a “PFIC”), the Fund may be subject to U.S. federal income tax on a portion of any “excess distribution” or gain from the disposition of such
shares even if such income is distributed as a taxable dividend by the Fund to shareholders. Additional charges in the nature of interest may be imposed on the Fund in respect of deferred taxes arising from such distributions or gains. If the Fund
invests in a PFIC and elects to treat the PFIC as a “qualified electing fund” under the Code (a “QEF”), in lieu of the foregoing requirements, the Fund will be required to include in income each year a portion of the ordinary earnings and net
capital gain of the QEF, even if such income is not distributed to the Fund. Alternatively, the Fund can elect to mark-to-market at the end of each taxable year the Fund’s shares in a PFIC; in this case, the Fund will recognize as ordinary income
any increase in the value of such shares, and as ordinary loss any decrease in such value to the extent it does not exceed prior increases included in income. The Fund’s ability to make either election will depend on factors beyond its control.
Under either election, the Fund may be required to recognize in a year income in excess of the Fund’s distributions from PFICs and proceeds from dispositions of PFIC stock during that year, and such income will nevertheless be subject to the Annual
Distribution Requirement and will be taken into account for purposes of the 4% excise tax.
The Fund’s functional currency is the U.S. dollar for U.S. federal income tax purposes. Under Section 988 of the Code, gains or losses attributable to fluctuations in exchange rates between the time the Fund accrues
income, expenses or other liabilities denominated in a foreign currency and the time the Fund actually collects such income or pay such expenses or liabilities are generally treated as ordinary income or loss. Similarly, gains or losses on foreign
currency forward contracts and the disposition of debt denominated in a foreign currency, to the extent attributable to fluctuations in exchange rates between the acquisition and disposition dates, are also treated as ordinary income or loss.
If the Fund borrows money, the Fund may be prevented by loan covenants from declaring and paying dividends in certain circumstances. Limits on the Fund’s payment of dividends may prevent the Fund from meeting the
Annual Distribution Requirement, and may, therefore, jeopardize the Fund’s qualification for taxation as a RIC, or subject the Fund to the 4% excise tax.
Even if the Fund is authorized to borrow funds and to sell assets in order to satisfy distribution requirements, under the 1940 Act, the Fund is not permitted to make distributions to shareholders while its debt
obligations and senior securities are outstanding unless certain “asset coverage” tests are met. This may also jeopardize the Fund’s qualification for taxation as a RIC or subject the Fund to the 4% excise tax.
Moreover, the Fund’s ability to dispose of assets to meet its distribution requirements may be limited by (1) the illiquid nature of its portfolio and (2) other requirements relating to its status as a RIC, including
the asset diversification requirements. If the Fund disposes of assets to meet the Annual Distribution Requirement, the asset diversification requirements, or the 4% excise tax, the Fund may make such dispositions at times that, from an investment
standpoint, are not advantageous.
Some of the income that the Fund might otherwise earn, such as lease income, management fees, or income recognized in a work-out or restructuring of a portfolio investment, may not satisfy the 90% gross income
requirement. To manage the risk that such income might disqualify the Fund as a RIC for a failure to satisfy the 90% gross income requirement, one or more of the Fund’s subsidiaries treated as U.S. corporations for U.S. federal income tax purposes
may be employed to earn such income. Such corporations will be required to pay U.S. corporate income tax on their earnings, which ultimately will reduce the yield to investors on such income and fees.
Taxation of U.S. Shareholders
For purposes of this discussion, a “U.S. Shareholder” (or in this section, a “Shareholder”) is a holder or a beneficial holder of shares which is for U.S. federal income tax purposes (1) a person who is a citizen or
resident of the United States, (2) a corporation (or other entity taxable as a corporation for U.S. federal income tax purposes) created or organized in or under the laws of the United States, any State thereof, or the District of Columbia, (3) an
estate whose income is subject to U.S. federal income tax regardless of its source, or (4) a trust if (a) a U.S. court is able to exercise primary supervision over the trust’s administration and one or more U.S. persons are authorized to control
all substantial decisions of the trust or (b) the trust has in effect a valid election to be treated as a domestic trust for U.S. federal income tax purposes. If a partnership or other entity or arrangement classified as a partnership for U.S. tax
purposes holds the shares, the tax treatment of the partnership and each partner generally will depend on the status of the partner and the activities of the partnership. Partnerships acquiring shares, and partners in such partnerships, should
consult their own tax advisors. Prospective investors that are not U.S. Shareholders should refer to the section “Non-U.S. Shareholders” below and are urged to consult their tax advisors with respect to the U.S. federal income tax consequences of
an investment in the Common Shares, including the potential application of U.S. withholding taxes.
Distributions the Fund pays to you from its ordinary income or from an excess of net short-term capital gain over net long-term capital loss (together referred to hereinafter as “ordinary income dividends”) are
generally taxable to you as ordinary income to the extent of the Fund’s earnings and profits. Provided that certain holding period and other requirements are met, such distributions (if properly reported by the Fund) may qualify (i) for the
dividends received deduction available to corporations, but only to the extent that the Fund’s income consists of dividend income from U.S. corporations and (ii) in the case of individual shareholders, as qualified dividend income eligible to be
taxed at long-term capital gain rates to the extent that the Fund receives qualified dividend income (generally, dividend income from taxable domestic corporations and certain qualified foreign corporations). Due to the Fund’s expected investments,
distributions are generally not expected to be eligible for the dividends received deduction allowed to corporate Shareholders or qualify for the reduced rates of tax for qualified dividend income allowed to individuals.
Distributions made to you from an excess of net long-term capital gain over net short-term capital loss (“capital gain dividends”), including capital gain dividends credited to you but retained by the Fund (as
described below), are taxable to you as long-term capital gain if they have been properly reported by the Fund, regardless of the length of time you have owned Common Shares. Generally, following the end of each taxable year, you will be provided
with a written notice of the amount of any ordinary income dividends and capital gain dividends or other distributions. Distributions in excess of the Fund’s earnings and profits will first reduce the adjusted tax basis of your shares and, after
the adjusted tax basis is reduced to zero, will constitute capital gain to you (assuming the shares are held as a capital asset).
In the event that the Fund retains any net capital gain, the Fund may designate the retained amounts as undistributed capital gain in a notice to Shareholders. If a designation is made, Shareholders would include in
income, as long-term capital gain, their proportionate share of the undistributed amounts, but would be allowed a credit or refund, as the case may be, for their proportionate share of the corporate tax paid by the Fund. A Shareholder that is not
subject to U.S. federal income tax or otherwise is not required to file a U.S. federal income tax return would be required to file a U.S. federal income tax return on the appropriate form in order to claim a refund for the taxes the Fund paid. In
addition, the tax basis of shares owned by a Shareholder would be increased by an amount equal to the difference between (i) the amount included in the Shareholder’s income as long-term capital gain and (ii) the Shareholder’s proportionate share of
the corporate tax paid by the Fund.
Properly reported dividends paid by the Fund that are attributable to the Fund’s “qualified REIT dividends” (generally, ordinary income dividends paid by a “real estate investment trust,” not including capital gain
dividends or dividends treated as qualified dividend income) may be eligible for the 20% deduction described in Section 199A of the Code in the case of non-corporate U.S. Shareholders, provided that certain holding period and other requirements are
met by the shareholder and the Fund. There can be no assurance as to what portion, if any, of the Fund’s distributions will qualify for such deduction. Subject to any further regulatory guidance to the contrary, any distribution attributable to
income from the Fund’s investments in publicly traded partnerships, if any, will not qualify for the 20% deduction that could be available to a noncorporate shareholder were the shareholder to own such partnership interests directly.
Certain distributions reported by the Fund as section 163(j) interest dividends may be treated as interest income by shareholders for purposes of the tax rules applicable to interest expense limitations under Section
163(j) of the Code. Such treatment by the shareholder is generally subject to holding period requirements and other potential limitations. The amount that we are eligible to report as a section 163(j) dividend for a tax year is generally limited to
the excess of our business interest income over the sum of our (i) business interest expense and (ii) other deductions properly allocable to our business interest income.
Except as described below with respect to repurchases, a Shareholder will recognize gain or loss on the sale, exchange or other taxable disposition of the Fund’s Common Shares (including pursuant to a liquidation of
the Fund) in an amount equal to the difference between the Shareholder’s adjusted basis in the shares sold or exchanged and the amount realized on their disposition. Generally, gain recognized by a Shareholder on the sale or other disposition of
common stock will result in capital gain or loss to you, and will be a long-term capital gain or loss if the shares have been held for more than one year at the time of sale. Any loss upon the sale or exchange of shares held for six months or less
will be treated as a long-term capital loss to the extent of any capital gain dividends received (including amounts credited as an undistributed capital gain dividend) by you. A loss realized on a sale or exchange of shares will be disallowed if
other substantially identical shares are acquired (whether through additional subscriptions or otherwise) within a 61-day period beginning 30 days before and ending 30 days after the date that the shares are disposed of. In this case, the basis of
the shares acquired will be adjusted to reflect the disallowed loss.
For non-corporate Shareholders, long-term capital gains are currently taxed at preferential rates. Present law taxes both long-term and short-term capital gains of corporations at the rates applicable to ordinary
income. The deductibility of capital losses is subject to a number of limitations under the Code.
Non-corporate Shareholders with income in excess of certain thresholds are, in general, subject to an additional 3.8% Medicare tax on their “net investment income,” which ordinarily includes taxable distributions
from the Fund and taxable gain on the disposition of Common Shares.
The Fund may be required to withhold U.S. federal income tax (“backup withholding”) from all taxable distributions to any non-corporate Shareholder (1) who fails to furnish the Fund with a correct taxpayer
identification number or a certificate that such Shareholder is exempt from backup withholding or (2) with respect to whom the IRS notifies the Fund that such Shareholder has failed to properly report certain interest and dividend income to the IRS
and to respond to notices to that effect. An individual’s taxpayer identification number is his or her social security number. Any amount withheld under backup withholding is allowed as a credit against the Shareholder’s U.S. federal income tax
liability and may entitle such Shareholder to a refund, provided that proper information is timely provided to the IRS.
Under U.S. Treasury regulations, if a Shareholder recognizes a loss with respect to shares of $2 million or more for a non-corporate Shareholder or $10 million or more for a corporate Shareholder in any single
taxable year (or a greater loss over a combination of years), the Shareholder must file with the IRS a disclosure statement on Form 8886. Direct Shareholders of portfolio securities in many cases are excepted from this reporting requirement, but
under current guidance, Shareholders of a RIC are not excepted. Future guidance may extend the current exception from this reporting requirement to Shareholders of most or all RICs. The fact that a loss is reportable under these regulations does
not affect the legal determination of whether the taxpayer’s treatment of the loss is proper. Significant monetary penalties apply to a failure to comply with this reporting requirement. States may also have a similar reporting requirement.
Shareholders should consult their own tax advisors to determine the applicability of these regulations in light of their individual circumstances.
Shareholders should consult their tax advisors with respect to the U.S. federal income tax and withholding tax, and state, local and foreign tax consequences of an investment in the Fund’s shares.
From time to time, the Fund may offer to repurchase its outstanding Common Shares. Shareholders who tender all Common Shares of the Fund held, or considered to be held, by them will be treated as having sold their
Common Shares and generally will realize a capital gain or loss. If a shareholder tenders fewer than all of its shares or fewer than all shares tendered are repurchased, such shareholder may be treated as having received a taxable dividend upon the
tender of its Common Shares. In such a case, there is a risk that non-tendering shareholders, and shareholders who tender some but not all of their shares or fewer than all of whose shares are repurchased, in each case whose percentage interests in
the Fund increase as a result of such tender, will be treated as having received a taxable distribution from the Fund. The extent of such risk will vary depending upon the particular circumstances of the tender offer and the change in the
shareholder’s ownership of the Fund.
Taxation of Non-U.S. Shareholders
The following discussion only applies to non-U.S. Shareholders. A “non-U.S. Shareholder” is a holder, other than a partnership (or other entity or arrangement treated as a partnership for U.S. federal income tax
purposes), that is not a U.S. Shareholder for U.S. federal income tax purposes. Whether an investment in the shares is appropriate for a non-U.S. Shareholder will depend upon that person’s particular circumstances. An investment in the shares by a
non-U.S. Shareholder may have adverse tax consequences. Non-U.S. Shareholders should consult their tax advisors before investing in the Fund’s shares.
Distributions of ordinary income dividends to non-U.S. Shareholders, subject to the discussion below, will generally be subject to withholding of U.S. federal tax at a 30% rate (or lower rate provided by an
applicable treaty) to the extent of the Fund’s current and accumulated earnings and profits. Different tax consequences may result if the non-U.S. Shareholder is engaged in a trade or business in the United States (and, if an income tax treaty
applies, if the distributions are attributable to a permanent establishment maintained by the non-U.S. Shareholder in the United States). Special certification requirements apply to a non-U.S. Shareholder that is a foreign partnership or a foreign
trust, and such entities are urged to consult their own tax advisors.
Actual or deemed distributions of the Fund’s net capital gain to a non-U.S. Shareholder, and gain recognized by a non-U.S. Shareholder upon the sale of the Fund’s Common Shares, generally will not be subject to U.S.
federal withholding tax and will not be subject to U.S. federal income tax unless (i) the distributions or gain, as the case may be, are effectively connected with a U.S. trade or business of the non-U.S. Shareholder (and, if an income tax treaty
applies, are attributable to a permanent establishment maintained by the non-U.S. Shareholder in the United States), (ii) in the case of an individual, the individual is present in the United States for 183 days or more during a taxable year and
certain other conditions are met or (iii) subject to certain exceptions, the Fund is or during prescribed testing periods has been a “United States real property holding corporation” or, in the case of certain distributions, a “qualified investment
entity,” each within the meaning of the Foreign Investments in Real Property Tax Act of 1980. Although the Fund does not expect to be a “United States property holding corporation” or “qualified investment entity,” no assurance can be given in that
regard.
Properly reported distributions from a RIC to non-U.S. Shareholders are generally exempt from the 30% U.S. federal withholding tax described above where they (i) are paid in respect of the RIC’s “qualified net
interest income” (generally, U.S.-source interest income, other than certain contingent interest and interest from obligations of a corporation or partnership in which the RIC is at least a 10% shareholder, reduced by expenses that are allocable to
such income) or (ii) are paid in respect of the RIC’s “qualified short-term capital gains” (generally, the excess of net short-term capital gain over the Fund’s long-term capital loss for such taxable year). Depending on the Fund’s circumstances,
the Fund may report all, some or none of the Fund’s potentially eligible dividends as such qualified net interest income or as qualified short-term capital gains, and/or treat such dividends, in whole or in part, as ineligible for this exemption
from withholding. In order to qualify for this exemption from withholding, a non-U.S. Shareholder needs to comply with applicable certification requirements relating to its non-U.S. status (including, in general, furnishing an IRS Form W-8BEN,
W-8BEN-E or substitute form). In the case of shares held through an intermediary, the intermediary may withhold even if the Fund reports the payment as qualified net interest income or qualified short-term capital gain. Non-U.S. Shareholders should
contact their intermediaries with respect to the application of these rules to their accounts. There can be no assurance as to what portion of the Fund’s distributions will qualify for favorable treatment as qualified net interest income or
qualified short-term capital gains.
If the Fund distributes net capital gains in the form of deemed rather than actual distributions (which the Fund may do in the future), a non-U.S. Shareholder will generally be entitled to a U.S. federal income tax
credit or tax refund equal to the Shareholder’s allocable share of the tax the Fund pays on the capital gains deemed to have been distributed. In order to obtain the refund, the non-U.S. Shareholder must obtain a U.S. taxpayer identification number
and file a U.S. federal income tax return even if the non-U.S. Shareholder is not otherwise required to obtain a U.S. taxpayer identification number or file a U.S. federal income tax return. For a corporate non-U.S. Shareholder, distributions (both
actual and deemed), and gains realized upon the sale of common stock that are effectively connected with a U.S. trade or business (or, where an applicable treaty applies, are attributable to a permanent establishment in the United States) may,
under certain circumstances, be subject to an additional “branch profits tax” at a 30% rate (or at a lower rate if provided for by an applicable tax treaty). Accordingly, an investment in the shares may not be appropriate for certain non-U.S.
Shareholders.
A repurchase of the Fund’s Common Shares that is not treated as a sale or exchange will be taxed in the same manner as regular distributions under the rules described above. See “—Taxation of U.S. Shareholders” for a
general discussion of when a redemption will be treated as a sale or exchange and related matters.
Certain provisions of the Code referred to as “FATCA” require withholding at a rate of 30% on dividends in respect of common stock held by or through certain foreign financial institutions (including investment
funds), unless such institution enters into an agreement with the Treasury to report, on an annual basis, information with respect to interests in, and accounts maintained by, the institution to the extent such interests or accounts are held by
certain U.S. persons and by certain non-U.S. entities that are wholly or partially owned by U.S. persons and to withhold on certain payments. Accordingly, the entity through which common stock is held will affect the determination of whether such
withholding is required. Similarly, dividends in respect of common stock held by an investor that is a non-financial non-U.S. entity that does not qualify under certain exemptions will be subject to withholding at a rate of 30%, unless such entity
either (i) certifies to the Fund that such entity does not have any “substantial United States owners” or (ii) provides certain information regarding the entity’s “substantial United States owners,” which the applicable withholding agent will in
turn provide to the Secretary of the Treasury. An intergovernmental agreement between the United States and an applicable foreign country, or future Treasury regulations or other guidance, may modify these requirements. The Fund will not pay any
additional amounts to Shareholders in respect of any amounts withheld. Shareholders are encouraged to consult their tax advisors regarding the possible implications of the legislation on their investment in the Fund’s Common Shares.
A non-U.S. Shareholder who is a non-resident alien individual, and who is otherwise subject to withholding of U.S. federal income tax, may be subject to backup withholding of U.S. federal income tax on dividends
unless the non-U.S. Shareholder provides the Fund or the dividend paying agent with an IRS Form W-8BEN or IRS Form W-8BEN-E (or an acceptable substitute form) or otherwise meets documentary evidence requirements for establishing that it is a
non-U.S. Shareholder or otherwise establishes an exemption from backup withholding. Backup withholding is not an additional tax. Any amounts withheld from payments made to you may be refunded or credited against your U.S. federal income tax
liability, if any, provided that the required information is furnished to the IRS. Non-U.S. Shareholders may also be subject to information reporting.
Failure to Qualify as a RIC
If the Fund was unable to qualify for treatment as a RIC, and relief is not available as discussed above, the Fund would be subject to tax on all of its taxable income at regular corporate rates. The Fund would not
be able to deduct distributions to shareholders nor would the Fund be required to make distributions for tax purposes. Distributions would generally be taxable to shareholders as ordinary dividend income eligible to be treated as “qualified
dividend income” for non-corporate shareholders to the extent of the Fund’s current and accumulated earnings and profits.
Subject to certain limitations under the Code, corporate U.S. shareholders would be eligible for the dividends received deduction. Distributions in excess of the Fund’s current and accumulated earnings and profits
would be treated first as a return of capital to the extent of the shareholder’s tax basis (reducing that basis accordingly) and thereafter as a capital gain. A return of capital distribution is a return to shareholders of a portion of their
original investment in the Fund and does not represent income or capital gains. To qualify again to be taxed as a RIC in a subsequent year, the Fund would be required to distribute to its shareholders its accumulated earnings and profits
attributable to non-RIC years. In addition, if the Fund failed to qualify as a RIC for a period greater than two taxable years, then, in order to qualify as a RIC in a subsequent year, the Fund would be required to elect to recognize and pay tax on
any net built-in gain (the excess of aggregate gain, including items of income, over aggregate loss that would have been realized if the Fund had been liquidated) or, alternatively, be subject to taxation on such built-in gain recognized for a
period of five years.
Each prospective investor that is, or is acting on behalf of, any (i) “employee benefit plan” (within the meaning of Section 3(3) of ERISA) subject to Title I of ERISA, (ii) “plan” described in Section 4975(e)(1) of
the Code, subject to Section 4975 of the Code (including for e.g., IRA and a “Keogh” plan), (iii) plan, account or other arrangement that is subject to provisions under any Similar Laws, or (iv) entity whose underlying assets are considered to
include the assets of any of the foregoing described in clauses (i), (ii) and (iii), pursuant to ERISA or otherwise (each of the foregoing described in clauses (i), (ii), (iii) and (iv) referred to herein as a “Plan”), must independently determine
that our Common Shares are an appropriate investment, taking into account its obligations under ERISA, the Code and applicable Similar Laws.
In contemplating an investment in the Fund, each fiduciary of the Plan who is responsible for making such an investment should carefully consider, taking into account the facts and circumstances of the Plan, whether
such investment is consistent with the applicable provisions of ERISA, the Code or any Similar Law relating to a fiduciary’s duties to the Plan including, without limitation, the applicable prudence, diversification, delegation of control,
conflicts of interest and prohibited transaction provisions of ERISA, the Code and any other applicable Similar Laws. Furthermore, absent an exemption, the fiduciaries of a Plan should not invest in the Fund with the assets of any Plan if the
Advisers or any of their affiliates is a fiduciary with respect to such assets of the Plan.
In contemplating an investment in the Fund, fiduciaries of a Plan that is a Benefit Plan Investor (defined below) subject to Title I of ERISA or Section 4975 of the Code should also carefully consider the definition
of the term “plan assets” in ERISA and the Plan Asset Regulations. Under ERISA and the Plan Asset Regulations, when a Benefit Plan Investor invests in an equity interest of an entity that is neither a “publicly-offered security” (within the meaning
of the Plan Asset Regulations) nor a security issued by an investment company registered under the 1940 Act, the Benefit Plan Investors’ assets include both the equity interest and an undivided interest in each of the entity’s underlying assets,
unless it is established that the entity is an “operating company” or that equity participation in the entity by “benefit plan investors” (“Benefit Plan Investors”) is not “significant” (each within the meaning of the Plan Asset Regulations). The
term “Benefit Plan Investor” is defined in the Plan Asset Regulations to include (a) any employee benefit plan (as defined in section 3(3) of ERISA) subject to the provisions of Title I of ERISA, (b) any plan described in section 4975(e)(1) of the
Code subject to Section 4975 of the Code, and (c) any entity whose underlying assets are deemed under ERISA and the Plan Asset Regulations to include plan assets by reason of such an employee benefit plans or plan’s investment in the entity.
Under the Plan Asset Regulations, equity participation in an entity by Benefit Plan Investors is “significant” on any date if, immediately after the most recent acquisition of any equity interest in the entity, 25%
or more of the total value of any class of equity interests is held by Benefit Plan Investors. For purposes of this determination, the value of equity interests held by a person (other than a Benefit Plan Investor) who has discretionary authority
or control with respect to the assets of the entity or that provides investment advice for a fee (direct or indirect) with respect to such assets (or any affiliate of such a person) is disregarded (each such person, a “controlling person”).
The Plan Assets Regulations define the term “publicly-offered security” as a security that is “widely-held,” “freely transferrable” and either part of a class of securities registered under the Exchange Act or sold
pursuant to an effective registration statement under the Securities Act if the securities are registered under the Exchange Act within 120 days after the end of the fiscal year of the issuer during which the public offering occurred. A security is
considered “widely held” only if it is part of a class of securities that is owned by 100 or more investors independent of the issuer and of one another. A security will not fail to be “widely held” because the number of independent investors falls
below 100 subsequent to the initial public offering as a result of events beyond the issuer’s control. The Plan Assets Regulations provide that whether a security is “freely transferable” is a factual question to be determined on the basis of all
relevant facts and circumstances.
If the assets of the Fund were deemed to be “plan assets” under the Plan Asset Regulations, this would result, among other things, in (i) the application of the prudence and other fiduciary responsibility standards
of ERISA to investments made by the Fund, and (ii) the possibility that certain transactions in which the Fund might seek to engage could constitute “prohibited transactions” under ERISA and the Code. If a prohibited transaction occurs for which no
exemption is available, among other things, the Advisers and/or any other fiduciary that has engaged in the prohibited transaction could be required to (i) restore to the applicable Benefit Plan Investor any profit realized on the transaction and
(ii) reimburse the Benefit Plan Investor for any losses suffered by the Benefit Plan Investor as a result of the investment. In addition, each disqualified person (within the meaning of Section 4975 of the Code) involved could be subject to an
excise tax equal to 15% of the amount involved in the prohibited transaction for each year the transaction continues and, unless the transaction is corrected within statutorily required periods, to an additional tax of 100%. Fiduciaries of Benefit
Plan Investors who decide to invest in the Fund could, under certain circumstances, be liable for prohibited transactions or other violations as a result of their investment in the Fund or as co-fiduciaries for actions taken by or on behalf of the
Fund or the Advisers. With respect to an IRA that invests in the Fund, the occurrence of a non-exempt prohibited transaction involving the individual who established the IRA, or his or her beneficiaries, would cause the IRA to lose its tax-exempt
status.
Accordingly, for so long as any class of our Common Shares are not considered “publicly-offered securities” within the meaning of the Plan Asset Regulations, the Fund intends to limit Benefit Plan Investor
investments in our Common Shares so that holdings by Benefit Plan Investors are not “significant” within the meaning of the Plan Asset Regulations. In this regard, in order to avoid the possibility that our assets could be treated as “plan assets,”
within the meaning of the Plan Asset Regulations, until such time as each class of our Common Shares constitutes “publicly-offered securities” within the meaning of the Plan Asset Regulations we will (i) require any person proposing to acquire
Common Shares to furnish such information as may be necessary to determine whether such person is a Benefit Plan Investor or a controlling person and (ii) have the power to (a) exclude any shareholder or potential shareholder from purchasing or
transferring Common Shares; (b) prohibit any redemption of Common Shares; and (c) redeem some or all Common Shares held by any shareholder if, and to the extent that, our Board of Trustees determines that there is a substantial risk that such
shareholder’s purchase, ownership, transfer or redemption of Common Shares would result in our assets being characterized as plan assets for purposes of the fiduciary responsibility or prohibited transaction provisions of ERISA or Section 4975 of
the Code, and all Common Shares of the Fund shall be subject to such terms and conditions.
Our securities are held under a custody agreement by State Street Bank and Trust Company. The address of the custodian is 100 Summer Street, Floor 5, Boston, MA 02110. State Street Bank and Trust Company will act as our transfer agent,
distribution paying agent and registrar. The principal business address of our transfer agent is One Congress Street, Suite 1, Boston, Massachusetts 02114-2016.
The financial statements included in this prospectus for the fiscal years ended December 31, 2024 and 2025 have been audited by Deloitte & Touche LLP, an independent registered public accounting firm, and has
been so included in reliance on the report of such firm given upon their authority as experts in auditing and accounting.
Simpson Thacher & Bartlett LLP, New York, New York and Washington, DC, acts as counsel to the Fund.
We have filed with the SEC a Registration Statement on Form N-2, together with all amendments and related exhibits, under the Securities Act, with respect to the Common Shares offered by this prospectus. The
Registration Statement contains additional information about us and the Common Shares being offered by this prospectus.
We are required to file with or submit to the SEC annual, quarterly and current reports, proxy statements and other information meeting the informational requirements of the Exchange Act. The SEC maintains an
internet site that contains reports, proxy and information statements and other information filed electronically by us with the SEC, which are available on the SEC’s website at https://www.sec.gov. Copies
of these reports, proxy and information statements and other information may be obtained, after paying a duplicating fee, by electronic request at the following e-mail address: publicinfo@sec.gov.
The Fund is committed to maintaining the privacy of shareholders and to safeguarding their nonpublic personal information. The following information is provided to help you understand what personal information the
Fund collects, how the Fund protects that information and why, in certain cases, the Fund may share information with select other parties.
In the case of shareholders who are record holders of the Fund, the Fund receives personal non-public information on account applications or other forms. With respect to these shareholders, the Fund also has access
to specific information regarding their transactions in the Fund.
The Fund does not disclose any nonpublic personal information about shareholders or former shareholders to anyone, except as permitted by law or as is necessary in order to service shareholder accounts (for example,
to a transfer agent).
The Fund restricts access to nonpublic personal information about shareholders to BlackRock employees with a legitimate business need for the information. The Fund maintains physical, electronic and procedural
safeguards designed to protect the nonpublic personal information of our shareholders.
INDEX TO FINANCIAL STATEMENTS
|
Page
|
|
|
F-2
|
|
|
F-3
|
|
|
F-5
|
|
|
F-6
|
|
|
F-7
|
|
|
F-8
|
|
|
F-34
|
To the shareholders and the Board of Trustees of BlackRock Private Credit Fund
Opinion on the Financial Statements
We have audited the accompanying consolidated statements of assets and liabilities of BlackRock Private Credit Fund and subsidiaries (the "Fund"), including the consolidated schedules of investments, as of
December 31, 2025 and 2024, the related consolidated statements of operations, cash flows, and changes in net assets for each of the three years in the period then ended, financial highlights (in
Note 9) for each of the three years in the period then ended and for the period from March 18, 2022 (inception) through December 31, 2022, and the related notes (collectively referred to as the “financial statements”). In our opinion,
the financial statements present fairly, in all material respects, the financial position of the Fund as of December 31, 2025 and 2024, and the results of its operations, changes in net assets, and cash flows for each of the three years
in the period then ended, and the financial highlights for each of the three years in the period then ended and for the period from March 18, 2022 (inception) through December 31, 2022 in conformity with accounting principles generally
accepted in the United States of America.
Basis for Opinion
These financial statements are the responsibility of the Fund’s management. Our responsibility is to express an opinion on the Fund’s financial statements based on our audits. We are a public accounting firm
registered with the Public Company Accounting Oversight Board (United States) (PCAOB) and are required to be independent with respect to the Fund in accordance with the U.S. federal securities laws and the applicable rules and
regulations of the Securities and Exchange Commission and the PCAOB.
We conducted our audits in accordance with the standards of the PCAOB. Those standards require that we plan and perform the audit to obtain reasonable assurance about whether the financial statements are free
of material misstatement, whether due to error or fraud. The Fund is not required to have, nor were we engaged to perform, an audit of its internal control over financial reporting. As part of our audits, we are required to obtain an
understanding of internal control over financial reporting but not for the purpose of expressing an opinion on the effectiveness of the Fund’s internal control over financial reporting. Accordingly, we express no such opinion.
Our audits included performing procedures to assess the risks of material misstatement of the financial statements, whether due to error or fraud, and performing procedures that respond to those risks. Such
procedures included examining, on a test basis, evidence regarding the amounts and disclosures in the financial statements. Our audits also included evaluating the accounting principles used and significant estimates made by management,
as well as evaluating the overall presentation of the financial statements. Our procedures included confirmation of investments owned as of December 31, 2025 and 2024, by correspondence with the custodian, loan agents, and borrowers;
when replies were not received, we performed other auditing procedures. We believe that our audits provide a reasonable basis for our opinion.
/s/ Deloitte & Touche LLP
Los Angeles, California
March 2, 2026
We have served as the Fund’s auditor since 2022.
|
December 31, 2025
|
December 31, 2024
|
|||||||
|
Assets
|
||||||||
|
Investments, at fair value:
|
||||||||
|
Non-controlled, non-affiliated investments (cost of $2,254,646,820 and $1,035,050,829, respectively)
|
$
|
2,244,701,289
|
$
|
1,040,393,586
|
||||
|
Total investments (cost of $2,254,646,820 and $1,035,050,829, respectively)
|
2,244,701,289
|
1,040,393,586
|
||||||
|
|
||||||||
|
Cash and cash equivalents
|
221,222,080
|
41,078,437
|
||||||
|
Receivable for investments sold
|
22,267,609
|
7,996,181
|
||||||
|
Interest, dividends and fees receivable
|
14,713,952
|
6,523,832
|
||||||
|
Deferred debt issuance costs
|
5,936,159
|
4,147,931
|
||||||
|
Prepaid expenses and other assets
|
9,070,139
|
2,314,798
|
||||||
|
Total assets
|
2,517,911,228
|
1,102,454,765
|
||||||
|
|
||||||||
|
Liabilities
|
||||||||
|
Debt (net of deferred issuance costs of $1,864,718 and $866,702, respectively)
|
834,215,865
|
389,133,298
|
||||||
|
Payable for investments purchased
|
65,091,915
|
43,346,561
|
||||||
|
Interest and debt related payables
|
14,992,092
|
4,009,503
|
||||||
|
Distribution payable
|
12,831,110
|
6,009,553
|
||||||
|
Incentive fees payable
|
4,430,296
|
3,978,275
|
||||||
|
Management fees payable
|
4,290,672
|
1,791,192
|
||||||
|
Reimbursements due to the Investment Adviser
|
140,296
|
1,125,355
|
||||||
|
Accrued capital gains incentive fees
|
—
|
498,552
|
||||||
|
Accrued expenses and other liabilities
|
3,186,235
|
1,370,802
|
||||||
|
Total liabilities
|
$
|
939,178,481
|
$
|
451,263,091
|
||||
|
|
||||||||
|
Commitments and contingencies (Note 5)
|
||||||||
|
|
||||||||
|
Net assets
|
$
|
1,578,732,747
|
$
|
651,191,674
|
||||
|
|
||||||||
|
Composition of net assets applicable to common shareholders
|
||||||||
|
Common shares of beneficial interest, $0.001 par value; 65,915,332 and 26,269,689 shares issued and outstanding as of December 31, 2025 and December 31, 2024,
respectively
|
$
|
65,914
|
$
|
26,269
|
||||
|
Paid-in capital in excess of par
|
1,605,160,851
|
648,200,991
|
||||||
|
Distributable earnings (loss)
|
(26,494,018
|
)
|
2,964,414
|
|||||
|
Total net assets
|
1,578,732,747
|
651,191,674
|
||||||
|
Total liabilities and net assets
|
$
|
2,517,911,228
|
$
|
1,102,454,765
|
||||
|
|
||||||||
|
Net assets per share
|
$
|
23.95
|
$
|
24.79
|
||||
See accompanying notes to the consolidated financial statements.
Consolidated Statements of Assets and Liabilities
|
December 31, 2025
|
December 31, 2024
|
|||||||
|
NET ASSET VALUE PER SHARE
|
||||||||
|
Institutional Shares:
|
||||||||
|
Net assets
|
$
|
1,461,960,470
|
$
|
603,211,729
|
||||
|
Common shares outstanding ($0.001 par value, unlimited shares authorized)
|
61,039,850
|
24,334,133
|
||||||
|
Net asset value per share
|
$
|
23.95
|
$
|
24.79
|
||||
|
Class S Shares:
|
||||||||
|
Net assets
|
$
|
114,536,454
|
$
|
44,822,335
|
||||
|
Common shares outstanding ($0.001 par value, unlimited shares authorized)
|
4,782,132
|
1,808,175
|
||||||
|
Net asset value per share
|
$
|
23.95
|
$
|
24.79
|
||||
|
Class D Shares:
|
||||||||
|
Net assets
|
$
|
2,235,823
|
$
|
3,157,610
|
||||
|
Common shares outstanding ($0.001 par value, unlimited shares authorized)
|
93,350
|
127,381
|
||||||
|
Net asset value per share
|
23.95
|
24.79
|
||||||
See accompanying notes to the consolidated financial statements.
BlackRock Private Credit Fund
|
For the Year Ended December 31,
|
||||||||||||
|
|
2025
|
2024
|
2023
|
|||||||||
|
Investment income
|
||||||||||||
|
Interest income:
|
||||||||||||
|
Non-controlled, non-affiliated investments
|
$
|
160,771,247
|
$
|
73,019,203
|
$
|
33,655,119
|
||||||
|
PIK income:
|
||||||||||||
|
Non-controlled, non-affiliated investments
|
2,686,735
|
1,305,287
|
583,204
|
|||||||||
|
Total investment income
|
163,457,982
|
74,324,490
|
34,238,323
|
|||||||||
|
|
||||||||||||
|
Operating expenses
|
||||||||||||
|
Interest and other debt expenses
|
43,125,784
|
15,678,170
|
8,398,203
|
|||||||||
|
Incentive fees earned
|
13,692,577
|
6,276,956
|
3,332,075
|
|||||||||
|
Management fees
|
12,272,372
|
4,852,983
|
2,041,069
|
|||||||||
|
Amortization of continuous offering costs
|
2,539,429
|
—
|
—
|
|||||||||
|
Administrative expenses
|
1,468,248
|
1,076,464
|
1,289,972
|
|||||||||
|
Professional fees
|
1,349,031
|
798,480
|
658,223
|
|||||||||
|
Custody Fees
|
1,253,435
|
417,858
|
224,751
|
|||||||||
|
Distribution and servicing fees
|
||||||||||||
|
Class S
|
725,009
|
136,105
|
—
|
|||||||||
|
Class D
|
8,868
|
1,953
|
—
|
|||||||||
|
Director fees
|
284,593
|
315,451
|
271,500
|
|||||||||
|
Organizational expenses
|
161,704
|
—
|
—
|
|||||||||
|
Insurance expense
|
32,666
|
28,930
|
28,933
|
|||||||||
|
Incentive fees on capital gains (1)
|
(498,552
|
)
|
498,552
|
—
|
||||||||
|
Other operating expenses
|
1,475,316
|
802,451
|
426,002
|
|||||||||
|
Total operating expenses
|
77,890,480
|
30,884,353
|
16,670,728
|
|||||||||
|
Expense Support (Note 3)
|
(10,779,084
|
)
|
—
|
—
|
||||||||
|
Incentive fee waivers
|
(1,347,386
|
)
|
—
|
(3,332,075
|
)
|
|||||||
|
Management fee waivers
|
—
|
—
|
(2,041,069
|
)
|
||||||||
|
Net operating expenses
|
65,764,010
|
30,884,353
|
11,297,584
|
|||||||||
|
|
||||||||||||
|
Net investment income before taxes
|
97,693,972
|
43,440,137
|
22,940,739
|
|||||||||
|
Excise tax expense
|
—
|
—
|
106,746
|
|||||||||
|
Net investment income
|
97,693,972
|
43,440,137
|
22,833,993
|
|||||||||
|
|
||||||||||||
|
Realized and unrealized gain (loss) on investments and foreign currency
|
||||||||||||
|
Net realized gain (loss):
|
||||||||||||
|
Non-controlled, non-affiliated investments
|
(3,971,809
|
)
|
(1,431,808
|
)
|
77,570
|
|||||||
|
Foreign currency translation
|
(738,734
|
)
|
—
|
—
|
||||||||
|
Net realized gain (loss)
|
(4,710,543
|
)
|
(1,431,808
|
)
|
77,570
|
|||||||
|
|
||||||||||||
|
Net change in unrealized appreciation (depreciation):
|
||||||||||||
|
Non-controlled, non-affiliated investments
|
(15,776,725
|
)
|
3,345,673
|
5,346,656
|
||||||||
|
Foreign currency translation
|
288,149
|
—
|
—
|
|||||||||
|
Net change in unrealized appreciation (depreciation)
|
(15,488,576
|
)
|
3,345,673
|
5,346,656
|
||||||||
|
|
||||||||||||
|
Net realized and unrealized gain (loss)
|
(20,199,119
|
)
|
1,913,865
|
5,424,226
|
||||||||
|
|
||||||||||||
|
Net increase (decrease) in net assets resulting from operations
|
$
|
77,494,853
|
$
|
45,354,002
|
$
|
28,258,219
|
||||||
(1) Net investment income amounts displayed above are net of the accrual for incentive fees on capital gains which is reflected on a hypothetical liquidation basis in accordance with Generally Accepted
Accounting Principles (“GAAP”) for the years ended December 31, 2025, 2024 and 2023 (see Note 3).
See accompanying notes to the consolidated financial statements.
|
Common Shares
|
Paid in Capital
|
Distributable
|
Total Net
|
||||||||||||||||||
|
|
Shares
|
Par Amount
|
in Excess of Par
|
Earnings (loss)
|
Assets
|
||||||||||||||||
|
Balance at December 31, 2022
|
4,968,576
|
$
|
4,969
|
$
|
120,449,278
|
$
|
(2,768,970
|
)
|
$
|
117,685,277
|
|||||||||||
|
|
|||||||||||||||||||||
|
Share Transactions
|
|||||||||||||||||||||
|
Institutional Class:
|
|||||||||||||||||||||
|
Issuance of common shares
|
3,934,546
|
3,934
|
96,733,131
|
—
|
96,737,065
|
||||||||||||||||
|
Issuance of common shares from dividend reinvestment plan
|
705,362
|
705
|
17,294,622
|
—
|
17,295,327
|
||||||||||||||||
|
Net investment income
|
—
|
—
|
—
|
22,833,993
|
22,833,993
|
||||||||||||||||
|
Net realized and unrealized gain (loss)
|
—
|
—
|
—
|
5,424,226
|
5,424,226
|
||||||||||||||||
|
Dividends paid to common shareholders
|
|||||||||||||||||||||
|
Institutional Class
|
—
|
—
|
(21,171,862
|
)
|
(21,171,862
|
)
|
|||||||||||||||
|
Tax reclassification of shareholders' equity in accordance with generally accepted accounting principles
|
—
|
—
|
(106,746
|
)
|
106,746
|
—
|
|||||||||||||||
|
Balance at December 31, 2023
|
9,608,484
|
$
|
9,608
|
$
|
234,370,285
|
$
|
4,424,133
|
$
|
238,804,026
|
||||||||||||
|
Share Transactions
|
|||||||||||||||||||||
|
Institutional Class:
|
|||||||||||||||||||||
|
Issuance of common shares
|
13,602,003
|
13,602
|
337,855,788
|
—
|
337,869,390
|
||||||||||||||||
|
Issuance of common shares from dividend reinvestment plan
|
1,270,509
|
1,271
|
31,573,617
|
—
|
31,574,888
|
||||||||||||||||
|
Repurchase of common shares
|
(146,864
|
)
|
(147
|
)
|
(3,643,569
|
)
|
—
|
(3,643,716
|
)
|
||||||||||||
|
Class S:
|
|||||||||||||||||||||
|
Issuance of common shares
|
1,806,766
|
1,807
|
44,854,193
|
—
|
44,856,000
|
||||||||||||||||
|
Issuance of common shares from dividend reinvestment plan
|
1,410
|
1
|
35,009
|
—
|
35,010
|
||||||||||||||||
|
Class D:
|
|||||||||||||||||||||
|
Issuance of common shares
|
127,369
|
127
|
3,155,373
|
—
|
3,155,500
|
||||||||||||||||
|
Issuance of common shares from dividend reinvestment plan
|
12
|
—
|
295
|
—
|
295
|
||||||||||||||||
|
Net investment income
|
—
|
—
|
—
|
43,440,137
|
43,440,137
|
||||||||||||||||
|
Net realized and unrealized gain (loss)
|
—
|
—
|
—
|
1,913,865
|
1,913,865
|
||||||||||||||||
|
Dividends paid to common shareholders:
|
|||||||||||||||||||||
|
Institutional Class
|
—
|
—
|
—
|
(45,083,816
|
)
|
(45,083,816
|
)
|
||||||||||||||
|
Class S
|
—
|
—
|
—
|
(1,645,327
|
)
|
(1,645,327
|
)
|
||||||||||||||
|
Class D
|
—
|
—
|
—
|
(84,578
|
)
|
(84,578
|
)
|
||||||||||||||
|
Balance at December 31, 2024
|
26,269,689
|
$
|
26,269
|
$
|
648,200,991
|
$
|
2,964,414
|
$
|
651,191,674
|
||||||||||||
|
|
|||||||||||||||||||||
|
Share Transactions
|
|||||||||||||||||||||
|
Institutional Class:
|
|||||||||||||||||||||
|
Issuance of common shares
|
35,326,769
|
35,327
|
855,506,225
|
—
|
855,541,552
|
||||||||||||||||
|
Issuance of common shares from dividend reinvestment plan
|
2,102,102
|
2,102
|
51,061,701
|
—
|
51,063,803
|
||||||||||||||||
|
Share transfers between classes
|
179,403
|
179
|
4,340,912
|
—
|
4,341,091
|
||||||||||||||||
|
Repurchase of common shares
|
(902,557
|
)
|
(903
|
)
|
(21,852,225
|
)
|
—
|
(21,853,128
|
)
|
||||||||||||
|
Class S:
|
|||||||||||||||||||||
|
Issuance of common shares
|
3,040,787
|
3,041
|
73,983,770
|
—
|
73,986,811
|
||||||||||||||||
|
Issuance of common shares from dividend reinvestment plan
|
44,165
|
44
|
1,068,217
|
—
|
1,068,261
|
||||||||||||||||
|
Repurchase of common shares
|
(110,995
|
)
|
(111
|
)
|
(2,664,310
|
)
|
—
|
(2,664,421
|
)
|
||||||||||||
|
Class D:
|
|||||||||||||||||||||
|
Issuance of common shares
|
140,964
|
141
|
3,429,457
|
—
|
3,429,598
|
||||||||||||||||
|
Issuance of common shares from dividend reinvestment plan
|
4,408
|
4
|
106,426
|
—
|
106,430
|
||||||||||||||||
|
Share transfers between classes
|
(179,403
|
)
|
(179
|
)
|
(4,340,912
|
)
|
—
|
(4,341,091
|
)
|
||||||||||||
|
Net investment income
|
—
|
—
|
—
|
97,693,972
|
97,693,972
|
||||||||||||||||
|
Net realized and unrealized gain (loss)
|
—
|
—
|
—
|
(20,199,119
|
)
|
(20,199,119
|
)
|
||||||||||||||
|
Dividends paid to common shareholders:
|
|||||||||||||||||||||
|
Institutional Class
|
—
|
—
|
—
|
(102,041,540
|
)
|
(102,041,540
|
)
|
||||||||||||||
|
Class S
|
—
|
—
|
—
|
(8,251,187
|
)
|
(8,251,187
|
)
|
||||||||||||||
|
Class D
|
—
|
—
|
—
|
(339,959
|
)
|
(339,959
|
)
|
||||||||||||||
|
Tax reclassification of shareholders' equity in accordance with generally accepted accounting principles
|
—
|
—
|
(3,679,401
|
)
|
3,679,401
|
—
|
|||||||||||||||
|
Balance at December 31, 2025
|
65,915,332
|
$
|
65,914
|
$
|
1,605,160,851
|
$
|
(26,494,018
|
)
|
$
|
1,578,732,747
|
|||||||||||
See accompanying notes to the consolidated financial statements.
BlackRock Private Credit Fund
|
For the Year Ended December 31,
|
||||||||||||
|
2025
|
2024
|
2023
|
||||||||||
|
Operating activities
|
||||||||||||
|
Net increase (decrease) in net assets resulting from operations
|
$
|
77,494,853
|
$
|
45,354,002
|
$
|
28,258,219
|
||||||
|
Adjustments to reconcile net increase (decrease) in net assets resulting
from operations to net cash provided by (used in) operating activities:
|
||||||||||||
|
Net realized (gain) loss
|
4,710,543
|
1,431,808
|
(77,570
|
)
|
||||||||
|
Change in net unrealized (appreciation) depreciation of investments
|
14,549,554
|
(3,345,673
|
)
|
(5,346,656
|
)
|
|||||||
|
Net amortization of investment discounts and premiums
|
(6,534,656
|
)
|
(5,020,865
|
)
|
(3,167,347
|
)
|
||||||
|
Interest and dividend income paid in kind
|
(2,758,282
|
)
|
(1,375,308
|
)
|
(694,111
|
)
|
||||||
|
Amortization of deferred debt issuance costs
|
1,333,663
|
438,149
|
193,554
|
|||||||||
|
Changes in assets and liabilities:
|
||||||||||||
|
Purchases of investments
|
(1,620,367,679
|
)
|
(773,893,941
|
)
|
(248,934,358
|
)
|
||||||
|
Proceeds from disposition of investments
|
406,092,817
|
142,736,794
|
64,848,048
|
|||||||||
|
Decrease (increase) in interest, dividends and fees receivable
|
(8,190,120
|
)
|
(3,124,063
|
)
|
(2,134,446
|
)
|
||||||
|
Decrease (increase) in receivable for investments sold
|
(14,271,428
|
)
|
(7,377,342
|
)
|
(596,291
|
)
|
||||||
|
Decrease (increase) in prepaid expenses and other assets
|
(6,755,341
|
)
|
(1,541,422
|
)
|
(489,986
|
)
|
||||||
|
Increase (decrease) in interest and debt related payables
|
10,982,589
|
1,843,476
|
1,075,837
|
|||||||||
|
Increase (decrease) in incentive fees payable
|
452,021
|
3,978,275
|
—
|
|||||||||
|
Increase (decrease) in management fees payable
|
2,499,480
|
1,791,192
|
—
|
|||||||||
|
Increase (decrease) in accrued capital gains incentive fees
|
(498,552
|
)
|
498,552
|
—
|
||||||||
|
Increase (decrease) in reimbursements due to the Investment Adviser
|
(985,059
|
)
|
877,413
|
199,376
|
||||||||
|
Increase (decrease) in payable for investments purchased
|
21,745,354
|
29,486,011
|
6,686,087
|
|||||||||
|
Increase (decrease) in accrued expenses and other liabilities
|
1,815,433
|
6,822
|
214,362
|
|||||||||
|
Net cash provided by (used in) operating activities
|
(1,118,684,810
|
)
|
(567,236,120
|
)
|
(159,965,282
|
)
|
||||||
|
|
||||||||||||
|
Financing activities
|
||||||||||||
|
Proceeds from common shares sold
|
932,957,961
|
373,956,051
|
91,787,065
|
|||||||||
|
Contribution received in advance
|
—
|
—
|
11,924,839
|
|||||||||
|
Proceeds from issuance of Notes
|
255,110,000
|
70,000,000
|
—
|
|||||||||
|
Draws on credit facilities
|
1,010,890,948
|
396,000,000
|
121,000,000
|
|||||||||
|
Repayments of credit facility draws
|
(819,920,365
|
)
|
(232,000,000
|
)
|
(60,000,000
|
)
|
||||||
|
Payments of debt issuance costs
|
(4,119,907
|
)
|
(3,546,409
|
)
|
(320,295
|
)
|
||||||
|
Dividends paid in cash to shareholders
|
(51,572,635
|
)
|
(12,845,227
|
)
|
(1,666,198
|
)
|
||||||
|
Payments of repurchased shares
|
(24,517,549
|
)
|
(3,643,716
|
)
|
—
|
|||||||
|
Net cash provided by (used in) financing activities
|
1,298,828,453
|
587,920,699
|
162,725,411
|
|||||||||
|
|
||||||||||||
|
Net increase (decrease) in cash and cash equivalents (including restricted cash)
|
180,143,643
|
20,684,579
|
2,760,129
|
|||||||||
|
Cash and cash equivalents (including restricted cash) at beginning of period
|
41,078,437
|
20,393,858
|
17,633,729
|
|||||||||
|
Cash and cash equivalents (including restricted cash) at end of period
|
$
|
221,222,080
|
$
|
41,078,437
|
$
|
20,393,858
|
||||||
|
|
||||||||||||
|
Supplemental cash flow information
|
||||||||||||
|
Interest payments
|
$
|
30,804,212
|
$
|
13,396,545
|
$
|
7,128,811
|
||||||
|
Excise tax payments
|
$
|
—
|
$
|
—
|
$
|
18,395
|
||||||
|
Distribution payable
|
$
|
12,831,110
|
$
|
6,009,553
|
$
|
3,651,224
|
||||||
|
Reinvestment of dividends during the period
|
$
|
52,238,494
|
$
|
31,610,193
|
$
|
17,295,327
|
||||||
See accompanying notes to the consolidated financial statements.
BlackRock Private Credit Fund
December 31, 2025
|
Issuer(F)
|
Company Address
|
Instrument
|
Ref(B)
|
Floor
|
Spread
|
Total
Coupon |
Maturity
|
Principal
|
Cost
|
Fair
Value |
% of Total
Cash and Investment |
Notes
|
||||||||||||||||||||||||
|
Debt Investments(A)
|
||||||||||||||||||||||||||||||||||||
|
Aerospace and Defense
|
||||||||||||||||||||||||||||||||||||
|
Arcline FM Holdings, LLC (Fairbanks Morse)
|
655 3rd St, Suite 301, Beloit, WI 53511
|
First Lien Term Loan
|
SOFR(Q)
|
0.75
|
%
|
2.75
|
%
|
6.42
|
%
|
6/23/2030
|
$
|
2,887,923
|
$
|
2,893,381
|
$
|
2,903,489
|
0.12
|
%
|
||||||||||||||||||
|
Cobham Ultra US Co-Borrower LLC (Ultra Electronics)
|
c/o The Corporation Trust Company, 1209 Orange Street, Wilmington, DE 19801
|
First Lien Term Loan
|
SOFR(S)
|
—
|
4.18
|
%
|
8.37
|
%
|
8/4/2029
|
$
|
3,228,596
|
3,230,317
|
3,242,721
|
0.13
|
%
|
|||||||||||||||||||||
|
Engineering Research Holding LLC (Astrion, Inc.)
|
1100 Redstone Gateway, Suite 230 & 300, Huntsville, AL 35806
|
First Lien Term Loan
|
SOFR(Q)
|
1.00
|
%
|
5.00
|
%
|
8.67
|
%
|
8/29/2031
|
$
|
22,807,353
|
22,528,778
|
16,649,368
|
0.68
|
%
|
E |
|
||||||||||||||||||
|
Kaman Corporation
|
1332 Blue Hills Ave, Bloomfield, CT 06002
|
First Lien Term Loan
|
SOFR(Q)
|
—
|
2.50
|
%
|
6.32
|
%
|
1/30/2032
|
$
|
5,772,929
|
5,754,549
|
5,803,266
|
0.24
|
%
|
|||||||||||||||||||||
|
Kaman Corporation
|
1332 Blue Hills Ave, Bloomfield, CT 06002
|
First Lien Delayed Draw Term Loan
|
SOFR(Q)
|
—
|
2.50
|
%
|
6.43
|
%
|
2/26/2032
|
$
|
52,283
|
49,913
|
55,158
|
—
|
||||||||||||||||||||||
|
Propulsion BC Finco Sarl (Luxembourg)
|
13, Rue Edward Steichen, Luxembourg, L-2540, Luxembourg
|
First Lien Term Loan
|
SOFR(Q)
|
—
|
5.00
|
%
|
8.69
|
%
|
11/20/2032
|
$
|
1,586,823
|
1,592,220
|
1,596,741
|
0.06
|
%
|
C |
|
|||||||||||||||||||
|
Skydio, Inc
|
3000 Clearview Way, Building E, San Mateo, CA 94402
|
First Lien Term Loan
|
SOFR(M)
|
2.50
|
%
|
2.75%
Cash
+2.75%
PIK
|
9.17
|
%
|
12/4/2029
|
$
|
7,711,220
|
7,652,362
|
7,641,819
|
0.31
|
%
|
E |
|
|||||||||||||||||||
|
Skydio, Inc
|
3000 Clearview Way, Building E, San Mateo, CA 94402
|
First Lien Delayed Draw Term Loan B
|
SOFR(M)
|
2.50
|
%
|
5.00% Cash
|
8.73
|
%
|
12/4/2029
|
$
|
—
|
(29,429
|
) |
(33,750
|
)
|
—
|
D/E
|
|
||||||||||||||||||
|
Skydio, Inc
|
3000 Clearview Way, Building E, San Mateo, CA 94402
|
First Lien Delayed Draw Term Loan A
|
SOFR(M)
|
2.50
|
%
|
5.00% Cash
|
8.73
|
%
|
12/4/2029
|
$
|
3,750,000
|
3,720,571
|
3,716,250
|
0.15
|
%
|
E |
|
|||||||||||||||||||
|
Signia Aerospace, LLC
|
1575 West 124th Avenue, Suite 210, Westminster, CO 80234, United States
|
First Lien Term Loan
|
SOFR(Q)
|
—
|
2.75
|
%
|
6.44
|
%
|
11/21/2031
|
$
|
5,459,791
|
5,473,122
|
5,486,708
|
0.22
|
%
|
|||||||||||||||||||||
|
Signia Aerospace, LLC
|
1575 West 124th Avenue, Suite 210, Westminster, CO 80234, United States
|
First Lien Delayed Draw Term Loan
|
SOFR(Q)
|
—
|
2.75
|
%
|
6.44
|
%
|
11/21/2031
|
$
|
—
|
659
|
590
|
—
|
||||||||||||||||||||||
|
|
|
52,866,443
|
|
47,062,360
|
1.91
|
% | ||||||||||||||||||||||||||||||
|
Automobiles
|
||||||||||||||||||||||||||||||||||||
|
ABC Technologies Inc. (TI Automotive) (Canada)
|
2 Norelco Drive, Toronto, Ontario M9L 2X6, Canada
|
First Lien Term Loan
|
EURIBOR(M)
|
0.75
|
%
|
5.88
|
%
|
7.78
|
%
|
8/22/2031
|
€
|
17,275,741
|
19,439,337
|
19,604,164
|
0.80
|
%
|
C/E
|
|
||||||||||||||||||
|
ABC Technologies Inc. (TI Automotive) (Canada)
|
2 Norelco Drive, Toronto, Ontario M9L 2X6, Canada
|
First Lien Term Loan
|
SOFR(Q)
|
0.75
|
%
|
5.75
|
%
|
9.47
|
%
|
8/22/2031
|
$
|
29,249,834
|
|
28,219,047
|
28,228,108
|
1.14
|
%
|
C/E
|
|
|||||||||||||||||
|
|
|
47,658,384
|
|
47,832,272
|
1.94
|
% | ||||||||||||||||||||||||||||||
|
Auto Components
|
||||||||||||||||||||||||||||||||||||
|
Clarios Global LP (Canada)
|
5757 N. Green Bay Ave., Glendale, WI 53209
|
First Lien Term Loan
|
SOFR(M)
|
—
|
2.75
|
%
|
6.47
|
%
|
1/14/2032
|
$
|
6,214,425
|
6,252,714
|
6,254,228
|
0.25
|
%
|
C |
|
|||||||||||||||||||
|
Beverages
|
||||||||||||||||||||||||||||||||||||
|
Triton Water Holdings Inc
|
900 Long Ridge Road, Building 2, Stamford, CT 06902, United States
|
First Lien Term Loan
|
SOFR(Q)
|
—
|
2.25
|
%
|
5.92
|
%
|
3/31/2028
|
$
|
622,540
|
622,540
|
625,033
|
0.03
|
%
|
|||||||||||||||||||||
|
Building Products
|
||||||||||||||||||||||||||||||||||||
|
Gulfside Supply Inc
|
2900 7th Avenue East, Suite 200, Tampa, FL 33605
|
First Lien Term Loan
|
SOFR(Q)
|
—
|
3.00
|
%
|
6.67
|
%
|
5/29/2031
|
$
|
1,599,360
|
1,594,580
|
1,580,376
|
0.06
|
%
|
|||||||||||||||||||||
|
TL Alpine Holding Corp.
|
605 Shiloh Road, Plano, Texas, 75074, United States
|
First Lien Term Loan
|
SOFR(M)
|
1.00
|
%
|
6.00
|
%
|
9.72
|
%
|
8/1/2030
|
$
|
9,624,423
|
9,477,443
|
9,662,921
|
0.39
|
%
|
E |
|
||||||||||||||||||
|
Trulite Holding Corp.
|
403 Westpark Court, Peachtree City, GA 30269
|
First Lien Term Loan
|
SOFR(Q)
|
1.00
|
%
|
6.00
|
%
|
9.98
|
%
|
3/1/2030
|
$
|
9,975,199
|
9,836,159
|
9,675,943
|
0.40
|
%
|
E |
|
||||||||||||||||||
|
Wilsonart LLC
|
2501 Wilsonart Dr, Temple, TX 76504, United States
|
First Lien Term Loan
|
SOFR(Q)
|
—
|
4.25
|
%
|
7.92
|
%
|
7/25/2031
|
$
|
5,261,473
|
5,189,992
|
5,109,259
|
0.21
|
%
|
|||||||||||||||||||||
|
Capital Markets
|
26,098,174
|
26,028,499
|
1.06
|
%
|
||||||||||||||||||||||||||||||||
|
Apex Group Treasury LLC
|
251 Little Falls Drive,
Wilmington, DE 19808
|
First Lien Term Loan
|
SOFR(Q)
|
—
|
3.50
|
%
|
7.39
|
% |
2/20/2032
|
$ |
1,005,419
|
$ |
983,504
|
$ |
950,121
|
0.04
|
% | |||||||||||||||||||
|
Ardonagh Group FinCo Pty Ltd (Australia)
|
2 Minster Court, Mincing Lane, London, EC3R 7PD, United Kingdom
|
First Lien Term Loan
|
SOFR(Q)
|
—
|
2.75
|
%
|
6.42
|
% |
2/27/2031
|
$ |
4,622,921
|
4,615,454
|
4,621,973
|
0.19
|
% | C |
||||||||||||||||||||
|
Ascensus Holdings, Inc
|
200 Dryden Road, Suite 4000, Dresher, PA 19025
|
First Lien Term Loan
|
SOFR(M)
|
0.50
|
% |
3.00
|
%
|
6.72
|
% |
8/2/2028
|
$ |
2,951,085
|
2,954,873
|
2,951,675
|
0.12
|
% | ||||||||||||||||||||
|
Allspring Buyer, LLC
|
1415 Vantage Park Drive, 3rd Floor, Charlotte, NC 28203
|
First Lien Term Loan
|
SOFR(Q)
|
— |
2.75
|
%
|
6.81
|
% |
11/1/2030
|
$ |
815,550
|
817,113
|
820,953
|
0.03
|
% | |||||||||||||||||||||
|
BCPE Pequod Buyer Inc. (Envestnet Inc.)
|
1000 Chesterbrook Blvd, Berwyn, PA 19312
|
First Lien Term Loan
|
SOFR(M)
|
— |
3.00
|
%
|
6.72
|
% |
9/19/2031
|
$ |
2,166,438
|
2,171,851
|
2,173,880
|
0.09
|
% | |||||||||||||||||||||
|
Brookfield Properties Retail Holding LLC
|
250 Vesey Street, 15th Floor, New York, NY 10281
|
First Lien Term Loan
|
SOFR(M)
|
— |
3.50
|
%
|
7.22
|
% |
5/28/2030
|
$ |
309,445
|
305,326
|
311,472
|
0.01
|
% | |||||||||||||||||||||
|
Focus Financial Partners, LLC
|
1325 Avenue of the Americas, 11th Floor, New York, NY 10019
|
First Lien Term Loan
|
SOFR(M)
|
—
|
2.50
|
%
|
6.22
|
% |
9/15/2031
|
$ |
6,308,415
|
6,312,705
|
6,326,142
|
0.26
|
% | |||||||||||||||||||||
|
Grant Thornton Advisors LLC
|
171 N. Clark Street, Suite 200, Chicago, IL 60601
|
First Lien Term Loan
|
SOFR(M)
|
—
|
2.75
|
%
|
6.47
|
% |
6/2/2031
|
$ |
5,352,996
|
5,347,282
|
5,369,751
|
0.22
|
% | |||||||||||||||||||||
|
Grant Thornton Advisors LLC
|
171 N. Clark Street, Suite 200, Chicago, IL 60601
|
First Lien Term Loan
|
SOFR(M)
|
—
|
3.00
|
%
|
6.72
|
% |
5/30/2031
|
$ |
919,695
|
909,316
|
924,459
|
0.04
|
% | |||||||||||||||||||||
BlackRock Private Credit Fund
December 31, 2025
|
Issuer(F)
|
Company Address
|
Instrument |
Ref(B)
|
Floor |
Spread |
Total Coupon |
Maturity |
Principal
|
Cost
|
Fair Value |
% of Total Cash and Investment |
Notes
|
|||||||||||||||||||||||||||
|
Debt Investments - Continued
|
|||||||||||||||||||||||||||||||||||||||
|
OVG Business Services LLC (Oak View)
|
5050 S Syracuse Street, Suite 800, Denver,
CO 80237
|
First Lien Term Loan
|
SOFR(M)
|
—
|
3.00
|
%
|
6.72
|
%
|
6/15/2031
|
$
|
1,828,491
|
1,828,360
|
1,834,205
|
0.07
|
%
|
||||||||||||||||||||||||
|
PMA Parent Holdings, LLC
|
380 Sentry Parkway, Blue Bell,
PA 19422
|
First Lien Term Loan
|
SOFR(Q)
|
0.75
|
%
|
4.75
|
%
|
8.42
|
%
|
1/31/2031
|
$
|
44,967,275
|
44,495,836
|
44,595,800
|
1.80
|
%
|
E |
||||||||||||||||||||||
|
PMA Parent Holdings, LLC
|
380 Sentry Parkway, Blue Bell,
PA 19422
|
First Lien Revolver
|
SOFR(Q)
|
0.75
|
%
|
4.75
|
%
|
8.42
|
%
|
1/31/2031
|
$
|
—
|
(53,869
|
)
|
(41,575
|
)
|
—
|
D/E
|
|||||||||||||||||||||
|
Wharf Street Rating Acquisition, LLC (KBRA)
|
805 3rd Ave, Floor 29, New York,
NY 10022, United States
|
First Lien Delayed
Draw Term Loan
|
SOFR(M)
|
0.75
|
%
|
4.75
|
%
|
8.47
|
%
|
9/16/2032
|
$
|
—
|
(38,662
|
)
|
(27,661
|
)
|
—
|
D/E
|
|||||||||||||||||||||
|
Wharf Street Rating Acquisition, LLC (KBRA)
|
805 3rd Ave, Floor 29, New York, NY
10022, United States
|
First Lien Revolver
|
SOFR(M)
|
0.75
|
%
|
4.75
|
%
|
8.47
|
%
|
9/16/2032
|
$
|
—
|
(37,713
|
)
|
(27,661
|
)
|
—
|
D/E
|
|||||||||||||||||||||
|
Wharf Street Rating Acquisition, LLC (KBRA)
|
805 3rd Ave, Floor 29, New York,
NY 10022, United States
|
First Lien Term Loan
|
SOFR(M)
|
0.75
|
%
|
4.75
|
%
|
8.47
|
%
|
9/16/2032
|
$
|
35,437,574
|
35,098,029
|
35,188,625
|
1.43
|
%
|
E |
||||||||||||||||||||||
|
105,709,405
|
105,972,159
|
4.30
|
%
|
||||||||||||||||||||||||||||||||||||
|
Chemicals
|
|||||||||||||||||||||||||||||||||||||||
|
Advancion (f/k/a Aruba Investments Holdings, LLC)
|
1500 E Lake Cook Road, Buffalo Grove,
IL 60089
|
First Lien Term Loan
|
SOFR(M)
|
0.75
|
%
|
4.10
|
%
|
7.82
|
%
|
11/24/2027
|
$
|
1,230,720
|
1,227,201
|
1,133,801
|
0.05
|
%
|
|||||||||||||||||||||||
|
Ascend Learning, LLC
|
25 Mall Road, 6th Floor, Burlington,
MA 01803
|
First Lien Term Loan
|
SOFR(M)
|
—
|
3.00
|
%
|
6.72
|
%
|
12/11/2028
|
$
|
2,804,601
|
2,781,774
|
2,817,867
|
0.11
|
%
|
||||||||||||||||||||||||
|
CP Iris Holdco I, Inc
|
375 Park Avenue, 11th Floor, New York,
NY 10152
|
First Lien Delayed
Draw Term Loan
|
SOFR(M)
|
—
|
4.00
|
%
|
7.72
|
%
|
10/27/2032
|
$
|
74,543
|
74,693
|
73,048
|
—
|
|||||||||||||||||||||||||
|
CP Iris Holdco I, Inc
|
375 Park Avenue, 11th Floor, New York,
NY 10152
|
First Lien Term Loan
|
SOFR(M)
|
—
|
4.00
|
%
|
7.72
|
%
|
10/18/2032
|
$
|
2,625,211
|
2,630,656
|
2,615,366
|
0.11
|
%
|
||||||||||||||||||||||||
|
Derby Buyer LLC
|
200 Powder Mill Road, Building 308, Wilmington,
DE 19803
|
First Lien Term Loan
|
SOFR(M)
|
—
|
3.00
|
%
|
6.75
|
%
|
11/1/2030
|
$
|
4,719,861
|
4,727,660
|
4,740,345
|
0.18
|
%
|
||||||||||||||||||||||||
|
Discovery Purchaser Corporation
|
c/o The Corporation Trust Company, 1209 Orange Street,
Wilmington, DE 19801
|
First Lien Term Loan
|
SOFR(Q)
|
0.50
|
%
|
3.75
|
%
|
7.61
|
%
|
10/4/2029
|
$
|
3,808,974
|
3,755,238
|
3,669,547
|
0.15
|
%
|
|||||||||||||||||||||||
|
INEOS Composites International Holdings LLC (FORTIS)
|
38 Hans Crescent, Knightsbridge, London,
SW1X 0LZ, UK
|
First Lien Term Loan
|
SOFR(Q)
|
—
|
3.50
|
%
|
7.17
|
%
|
2/6/2032
|
$
|
722,370
|
720,757
|
717,313
|
0.03
|
%
|
||||||||||||||||||||||||
|
Olympus Water US Holding Corporation (Solenis)
|
2475 Pinnacle Drive, Wilmington,
DE 19803
|
First Lien Term Loan
|
SOFR(Q)
|
0.50
|
%
|
3.00
|
%
|
6.67
|
%
|
6/9/2031
|
$
|
4,227,335
|
4,215,451
|
4,197,067
|
0.17
|
%
|
|||||||||||||||||||||||
|
Sparta U.S. Holdco LLC
|
875 Third Avenue, 11th Floor, New York, NY 10022,
United States
|
First Lien Term Loan
|
SOFR(M)
|
0.75
|
%
|
3.00
|
%
|
6.86
|
%
|
8/2/2028
|
$
|
2,154,660
|
2,136,167
|
2,142,088
|
0.09
|
%
|
|||||||||||||||||||||||
|
W. R. Grace Holdings, LLC
|
7500 Grace Drive, Columbia, MD 21044,
United States
|
First Lien Term Loan
|
SOFR(Q)
|
0.50
|
%
|
3.00
|
%
|
6.67
|
%
|
8/19/2032
|
$
|
1,663,830
|
1,653,877
|
1,668,505
|
0.07
|
%
|
|||||||||||||||||||||||
|
23,923,474
|
23,774,947
|
0.96
|
%
|
||||||||||||||||||||||||||||||||||||
|
Commercial Services and Supplies
|
|||||||||||||||||||||||||||||||||||||||
| Allied Universal Holdco LLC | 251 Little Falls Drive, Wilmington, DE 19808 | First Lien Term Loan |
SOFR(M)
|
0.75 |
% |
3.25
|
% |
6.97
|
% |
8/5/2032
|
$ |
6,683,639
|
$ |
6,689,196
|
$ |
6,726,448
|
0.27
|
% | |||||||||||||||||||||
| Anticimex Inc. (Sweden) | Hälsingegatan 40, SE-113 43 Stockholm, Sweden | First Lien Term Loan |
SOFR(Q)
|
—
|
2.90
|
% |
6.81
|
% |
11/17/2031
|
$ |
184,729
|
$ |
184,729
|
185,884
|
0.01
|
% | C |
||||||||||||||||||||||
| Apollo Group Holdco, LLC (Topsail) | 6950 NW 77th Court, Doral, FL 33166 | First Lien Term Loan |
SOFR(Q)
|
1.00
|
% |
5.75
|
% |
9.42
|
% |
12/26/2030
|
$ |
15,477,503
|
15,220,345
|
15,353,683
|
0.62
|
% | E |
||||||||||||||||||||||
| Cohnreznick Advisory LLC |
1301 Avenue of the Americas, 10th Floor, New York,
NY 10019
|
First Lien Term Loan |
SOFR(Q)
|
— |
3.50
|
% |
7.17
|
% |
3/31/2032
|
$ |
21,081,233
|
21,006,950
|
21,226,272
|
0.85
|
% | ||||||||||||||||||||||||
| Cohnreznick Advisory LLC |
1301 Avenue of the Americas, 10th Floor, New York,
NY 10019
|
First Lien Delayed
Draw Term Loan
|
SOFR(Q)
|
— |
3.50
|
% |
7.17
|
% |
3/31/2032
|
$ |
(3,144
|
) |
(14,726
|
) |
19,937
|
—
|
D |
||||||||||||||||||||||
| Creative Artists Agency, LLC. |
2000 Avenue of the Stars, Los Angeles, CA 90067
|
First Lien Term Loan |
SOFR(M)
|
— |
2.50
|
% |
6.22
|
% |
10/1/2031
|
$ |
4,126,534
|
4,128,258
|
4,147,167
|
0.17
|
% | ||||||||||||||||||||||||
| Dealer Tire Financial, LLC | 7012 Euclid Ave, Cleveland, OH 44103 | First Lien Term Loan |
SOFR(M)
|
— |
3.00
|
% |
6.72
|
% |
7/2/2031
|
$ |
1,881,242
|
1,875,181
|
1,885,945
|
0.08
|
% | ||||||||||||||||||||||||
| EnergySolutions, LLC |
299 South Main Street, Suite 1700, Salt Lake City,
UT 84111
|
First Lien Term Loan |
SOFR(M)
|
0.50
|
% |
3.25
|
% |
6.97
|
% |
9/18/2030
|
$ |
647,427
|
644,621
|
652,687
|
0.03
|
% | |||||||||||||||||||||||
|
Ensemble RCM, LLC
|
11511 Reed Hartman Hwy, Blue Ash,
OH 45241
|
First Lien Term Loan B
|
SOFR(Q)
|
—
|
3.00
|
% |
6.84
|
% |
8/3/2029
|
$ |
5,337,605
|
5,343,943
|
5,370,004
|
0.22
|
% | ||||||||||||||||||||||||
|
GFL Environmental Services Inc (Canada)
|
100 New Park Place, Suite 500, Vaughan,
N L4K 0J3, Canada
|
First Lien Term Loan
|
SOFR(Q)
|
—
|
2.50
|
% |
6.27
|
% |
2/4/2032
|
$ |
6,194,475
|
6,216,156
|
6,228,545
|
0.25
|
% | C |
|||||||||||||||||||||||
| Interstate Waste Services Inc |
300 Frank W Burr Blvd, Suite 39, Teaneck, NJ 07666
|
First Lien Term Loan
|
SOFR(Q)
|
— |
3.25
|
%
|
6.92
|
% |
10/4/2030
|
$ |
1,360,475
|
1,362,286
|
1,364,733
|
0.06
|
% |
||||||||||||||||||||||||
|
Madison Safety & Flow LLC
|
444 W Lake Street, Chicago, IL 60606
|
First Lien Term Loan
|
SOFR(M)
|
— |
2.50
|
% |
6.23
|
% |
9/26/2031
|
$ |
3,753,631
|
3,764,526
|
3,784,918
|
0.15
|
% | ||||||||||||||||||||||||
|
Modigent, LLC (Pueblo)
|
410 N 44TH St, Suite 650, Phoenix,
AZ 85008
|
First Lien Delayed
Draw Term Loan
|
SOFR(Q)
|
0.75
|
% |
5.25
|
% |
8.92
|
% |
8/23/2028
|
$ |
5,451,836
|
5,389,531
|
5,380,537
|
0.22
|
% | E |
||||||||||||||||||||||
| Modigent, LLC (Pueblo) | 410 N 44TH St, Suite 650, Phoenix, AZ 85008 |
First Lien Term Loan
|
SOFR(Q)
|
0.75
|
% |
5.25
|
% |
8.92
|
% |
8/23/2028
|
$ |
1,415,717
|
1,400,135
|
1,397,202
|
0.06
|
% | E |
||||||||||||||||||||||
|
Modigent, LLC (Pueblo)
|
410 N 44TH St, Suite 650, Phoenix,
AZ 85008
|
First Lien Delayed
Draw Term Loan
|
SOFR(Q)
|
0.75
|
% |
5.25
|
% |
8.92
|
% |
8/23/2028
|
$ |
982,031
|
970,820
|
969,188
|
0.04
|
% | E |
||||||||||||||||||||||
|
Modigent, LLC (Pueblo)
|
410 N 44TH St, Suite 650, Phoenix,
AZ 85008
|
First Lien Revolver
|
SOFR(Q)
|
0.75
|
% |
5.25
|
% |
8.92
|
% |
8/23/2027
|
$ |
—
|
(10,153
|
) |
(9,853
|
) |
— |
D/E
|
|||||||||||||||||||||
|
TA TT Buyer, LLC (TouchTunes, Octave Music)
|
730 3rd Ave, Suite 21st Floor, New York,
NY 10017, United States
|
First Lien Tranche
B-1 Term Loan
|
SOFR(Q)
|
0.50
|
% |
4.75
|
% |
8.42
|
% |
4/1/2029
|
$
|
16,717,565
|
16,719,731
|
16,346,686
|
0.66
|
% | |||||||||||||||||||||||
|
90,891,529
|
91,029,983
|
3.69
|
% | ||||||||||||||||||||||||||||||||||||
|
Construction Materials
|
|||||||||||||||||||||||||||||||||||||||
|
Covia Holdings LLC
|
3 Summit Park Drive, Suite 700, Independence,
OH 44131
|
First Lien Term Loan
|
SOFR(Q)
|
— |
2.75
|
%
|
6.71
|
% |
2/12/2032
|
$
|
2,330,322
|
2,333,466
|
2,317,214
|
0.10
|
% | ||||||||||||||||||||||||
|
Potters Industries, LLC
|
3222 Phoenixville Pike, Suite 103, Malvern,
PA 19355
|
First Lien Term Loan
|
SOFR(Q)
|
—
|
2.50
|
% |
6.17
|
% |
12/9/2032
|
$ |
275,000
|
274,313
|
276,031
|
0.01
|
%
|
||||||||||||||||||||||||
|
2,607,779
|
2,593,245
|
0.11
|
% | ||||||||||||||||||||||||||||||||||||
BlackRock Private Credit Fund
Consolidated Schedule of Investments (Continued)
December 31, 2025
|
Issuer(F)
|
Company Address
|
Instrument
|
Ref(B)
|
Floor
|
Spread
|
Total
Coupon |
Maturity
|
Principal
|
Cost
|
Fair
Value |
% of Total
Cash and Investment |
Notes
|
|||||||||||||||||||||||||||
|
Debt Investments - Continued
|
|||||||||||||||||||||||||||||||||||||||
|
Construction and Engineering
|
|||||||||||||||||||||||||||||||||||||||
|
Brand Industrial Services Inc
|
600 Galleria Parkway SE, Suite 1100, Atlanta, GA 30339
|
First Lien Term Loan
|
SOFR(Q)
|
0.50
|
%
|
4.50
|
%
|
8.35
|
%
|
8/1/2030
|
$
|
4,645,232
|
$
|
4,605,767
|
$
|
4,245,626
|
0.17
|
%
|
|||||||||||||||||||||
|
Brown & Settle, Inc.
|
9400 Innovation Dr, Manassas, VA 20110
|
First Lien Term Loan
|
SOFR(Q)
|
1.00
|
%
|
6.25
|
%
|
10.26
|
%
|
5/16/2030
|
$
|
21,998,615
|
21,517,923
|
22,174,604
|
0.90
|
%
|
E |
||||||||||||||||||||||
|
Brown & Settle, Inc.
|
9400 Innovation Dr, Manassas, VA 20110
|
First Lien Revolver
|
SOFR(M)
|
1.00
|
%
|
6.25
|
%
|
10.12
|
%
|
5/16/2030
|
$
|
1,838,836
|
1,785,263
|
1,838,836
|
0.07
|
%
|
E |
||||||||||||||||||||||
|
Compsych Holdings Corp
|
130 East Randolph Street, Suite 700, Chicago, IL 60601
|
First Lien Term Loan
|
SOFR(Q)
|
0.75
|
%
|
4.75
|
%
|
8.61
|
%
|
7/22/2031
|
$
|
12,925,854
|
12,874,575
|
13,055,113
|
0.54
|
%
|
E |
||||||||||||||||||||||
|
Compsych Holdings Corp
|
130 East Randolph Street, Suite 700, Chicago, IL 60601
|
First Lien Delayed Draw Term Loan
|
SOFR(Q)
|
0.75
|
%
|
4.75
|
%
|
8.61
|
%
|
7/22/2031
|
$
|
—
|
(7,414
|
)
|
37,376
|
—
|
D/E | ||||||||||||||||||||||
|
JF Acquisition, LLC (JF Petroleum)
|
100 Perimeter Park Dr, #H, Morrisville, NC 27560
|
First Lien Term Loan
|
SOFR(M)
|
1.00
|
%
|
5.75
|
%
|
9.48
|
%
|
6/18/2030
|
$
|
35,990,440
|
35,422,152
|
35,630,536
|
1.44
|
%
|
E |
||||||||||||||||||||||
|
JF Acquisition, LLC (JF Petroleum)
|
100 Perimeter Park Dr, #H, Morrisville, NC 27560
|
First Lien Revolver
|
SOFR(M)
|
1.00
|
%
|
5.75
|
%
|
9.48
|
%
|
6/18/2030
|
$
|
—
|
(75,397
|
)
|
(41,587
|
)
|
—
|
D/E | |||||||||||||||||||||
|
JF Acquisition, LLC (JF Petroleum)
|
100 Perimeter Park Dr, #H, Morrisville, NC 27560
|
First Lien Delayed Draw Term Loan
|
SOFR(M)
|
1.00
|
%
|
5.75
|
%
|
9.48
|
%
|
6/18/2030
|
$
|
—
|
(110,852
|
)
|
(67,232
|
)
|
—
|
D/E | |||||||||||||||||||||
|
LJ Avalon Holdings, LLC (Ardurra)
|
1000 NW 57th Ct., Suite 800, Miami, FL 33126
|
First Lien Delayed Draw Term Loan
|
SOFR(Q)
|
1.00
|
%
|
4.50
|
%
|
8.34
|
%
|
2/1/2030
|
$
|
2,381,164
|
2,364,060
|
2,381,164
|
0.10
|
%
|
E |
||||||||||||||||||||||
|
LJ Avalon Holdings, LLC (Ardurra)
|
1000 NW 57th Ct., Suite 800, Miami, FL 33126
|
First Lien Term Loan
|
SOFR(Q)
|
1.00
|
%
|
4.50
|
%
|
8.46
|
%
|
2/1/2030
|
$
|
1,648,177
|
1,633,251
|
1,648,177
|
0.07
|
%
|
E |
||||||||||||||||||||||
|
LJ Avalon Holdings, LLC (Ardurra)
|
1000 NW 57th Ct., Suite 800, Miami, FL 33126
|
First Lien Delayed Draw Term Loan
|
SOFR(Q)
|
1.00
|
%
|
4.50
|
%
|
8.27
|
%
|
2/1/2030
|
$
|
983,549
|
959,834
|
983,549
|
0.04
|
%
|
E |
||||||||||||||||||||||
|
LJ Avalon Holdings, LLC (Ardurra)
|
1000 NW 57th Ct., Suite 800, Miami, FL 33126
|
First Lien Revolver
|
SOFR(Q)
|
1.00
|
%
|
4.50
|
%
|
8.29
|
%
|
2/1/2029
|
$
|
—
|
(1,898
|
)
|
—
|
—
|
D/E | ||||||||||||||||||||||
|
Legence Holdings LLC (Refficiency)
|
345 Park Avenue, 43rd Floor, New York, NY 10154
|
First Lien Term Loan
|
SOFR(M)
|
—
|
2.25
|
%
|
5.97
|
%
|
12/16/2031
|
$
|
3,028,997
|
3,039,748
|
3,053,608
|
0.12
|
%
|
||||||||||||||||||||||||
|
Pioneer Acquisitionco, LLC
|
251 Little Falls Drive, Wilmington, DE 19808
|
First Lien Term Loan
|
SOFR(Q)
|
—
|
3.25
|
%
|
6.94
|
%
|
10/23/2032
|
$
|
188,000
|
187,540
|
189,058
|
0.01
|
%
|
||||||||||||||||||||||||
|
RBS Buyer Inc.
|
5901 Stewart Pkwy Douglasville, GA 30135
|
First Lien Delayed Draw Term Loan
|
SOFR(Q)
|
1.00
|
%
|
5.00
|
%
|
8.84
|
%
|
7/31/2031
|
$
|
—
|
(19,794
|
)
|
34,064
|
—
|
D/E | ||||||||||||||||||||||
|
RBS Buyer Inc.
|
5901 Stewart Pkwy Douglasville, GA 30135
|
First Lien Revolver
|
SOFR(Q)
|
1.00
|
%
|
5.00
|
%
|
8.84
|
%
|
7/31/2031
|
$
|
—
|
(65,979
|
)
|
—
|
—
|
D/E | ||||||||||||||||||||||
|
RBS Buyer Inc.
|
5901 Stewart Pkwy Douglasville, GA 30135
|
First Lien Term Loan
|
SOFR(Q)
|
1.00
|
%
|
5.00
|
%
|
8.84
|
%
|
7/31/2031
|
$
|
19,254,896
|
19,031,127
|
19,447,445
|
0.79
|
%
|
E |
||||||||||||||||||||||
|
Titan Home Improvement, LLC (Renuity)
|
1447 S Tryon St, Charlotte, NC 28203
|
First Lien Term Loan
|
SOFR(Q)
|
1.00
|
%
|
4.75
|
%
|
8.57
|
%
|
5/31/2030
|
$
|
9,533,188
|
9,392,997
|
9,628,520
|
0.39
|
%
|
E |
||||||||||||||||||||||
|
Titan Home Improvement, LLC (Renuity)
|
1447 S Tryon St, Charlotte, NC 28203
|
First Lien Delayed Draw Term Loan
|
SOFR(Q)
|
1.00
|
%
|
4.75
|
%
|
8.57
|
%
|
5/31/2030
|
$
|
—
|
(13,309
|
)
|
18,101
|
—
|
D/E | ||||||||||||||||||||||
|
Titan Home Improvement, LLC (Renuity)
|
1447 S Tryon St, Charlotte, NC 28203
|
First Lien Revolver
|
SOFR(Q)
|
1.00
|
%
|
4.75
|
%
|
8.57
|
%
|
5/31/2030
|
$
|
—
|
(22,172
|
)
|
—
|
—
|
D/E | ||||||||||||||||||||||
|
Tecta America Corp.
|
9450 Bryn Mawr Ave, Ste 500, Rosemont, IL 60018-5274, United States
|
First Lien Term Loan
|
SOFR(M)
|
1.00
|
%
|
2.75
|
%
|
6.47
|
%
|
2/18/2032
|
$
|
1,376,085
|
1,381,131
|
1,383,069
|
0.06
|
%
|
|||||||||||||||||||||||
|
Vortex Companies, LLC
|
18150 Imperial Valley Dr, Houston, TX 77060
|
First Lien Delayed Draw Term Loan
|
SOFR(M)
|
1.00
|
%
|
5.00
|
%
|
8.72
|
%
|
9/4/2029
|
$
|
11,069,460
|
10,940,583
|
11,124,807
|
0.45
|
%
|
E |
||||||||||||||||||||||
|
Vortex Companies, LLC
|
18150 Imperial Valley Dr, Houston, TX 77060
|
First Lien Term Loan
|
SOFR(M)
|
1.00
|
%
|
5.00
|
%
|
8.72
|
%
|
9/4/2029
|
$
|
4,972,668
|
4,914,773
|
4,997,531
|
0.20
|
%
|
E | ||||||||||||||||||||||
|
Vortex Companies, LLC
|
18150 Imperial Valley Dr, Houston, TX 77060
|
First Lien Term Loan
|
SOFR(M)
|
1.00
|
%
|
5.00
|
%
|
8.72
|
%
|
9/4/2029
|
$
|
2,671,969
|
2,671,969
|
2,685,329
|
0.11
|
%
|
E |
||||||||||||||||||||||
|
Vortex Companies, LLC
|
18150 Imperial Valley Dr, Houston, TX 77060
|
First Lien Term Loan
|
SOFR(M)
|
1.00
|
%
|
5.00
|
%
|
8.72
|
%
|
9/4/2029
|
$
|
943,685
|
930,012
|
948,403
|
0.04
|
%
|
E |
||||||||||||||||||||||
|
Vortex Companies, LLC
|
18150 Imperial Valley Dr, Houston, TX 77060
|
First Lien Term Loan
|
SOFR(M)
|
1.00
|
%
|
5.00
|
%
|
8.72
|
%
|
9/4/2029
|
$
|
9,086,694
|
8,970,998
|
9,132,127
|
0.37
|
%
|
E |
||||||||||||||||||||||
|
Vortex Companies, LLC
|
18150 Imperial Valley Dr, Houston, TX 77060
|
First Lien Delayed Draw Term Loan
|
SOFR(M)
|
1.00
|
%
|
5.00
|
%
|
8.72
|
%
|
9/4/2029
|
$
|
2,587,408
|
2,551,505
|
2,600,345
|
0.11
|
%
|
E |
||||||||||||||||||||||
|
Vortex Companies, LLC
|
18150 Imperial Valley Dr, Houston, TX 77060
|
First Lien Delayed Draw Term Loan
|
SOFR(M)
|
1.00
|
%
|
5.00
|
%
|
8.72
|
%
|
9/4/2029
|
$
|
611,620
|
602,754
|
614,678
|
0.02
|
%
|
E |
||||||||||||||||||||||
|
Vortex Companies, LLC
|
18150 Imperial Valley Dr, Houston, TX 77060
|
First Lien Delayed Draw Term Loan
|
SOFR(M)
|
1.00
|
%
|
5.00
|
%
|
8.72
|
%
|
9/4/2029
|
$
|
832,881
|
762,966
|
860,337
|
0.03
|
%
|
E |
||||||||||||||||||||||
|
Vortex Companies, LLC
|
18150 Imperial Valley Dr, Houston, TX 77060
|
First Lien Revolver
|
SOFR(M)
|
1.00
|
%
|
5.00
|
%
|
8.72
|
%
|
9/4/2029
|
$
|
839,464
|
815,675
|
839,464
|
0.03
|
%
|
E |
||||||||||||||||||||||
|
|
147,039,788
|
149,443,048
|
6.06
|
%
|
|||||||||||||||||||||||||||||||||||
|
Debt Investments - Continued
|
|||||||||||||||||||||||||||||||||||||||
|
Consumer Finance
|
|||||||||||||||||||||||||||||||||||||||
|
Lucky US BuyerCo, LLC (Global Payments)
|
3550 Lenox Road, Atlanta, GA 30326
|
First Lien Term Loan
|
SOFR(Q)
|
1.00
|
%
|
7.50
|
%
|
11.22
|
%
|
3/30/2029
|
$
|
3,118,582
|
$
|
3,067,974
|
$
|
3,069,259
|
0.13
|
%
|
E |
||||||||||||||||||||
|
Lucky US BuyerCo, LLC (Global Payments)
|
3550 Lenox Road, Atlanta, GA 30326
|
First Lien Revolver
|
SOFR(Q)
|
1.00
|
%
|
7.50
|
%
|
11.22
|
%
|
3/30/2029
|
$
|
371,870
|
365,203
|
365,393
|
0.01
|
%
|
E |
||||||||||||||||||||||
|
|
3,433,177
|
3,434,652
|
0.14
|
%
|
|||||||||||||||||||||||||||||||||||
|
Containers and Packaging
|
|||||||||||||||||||||||||||||||||||||||
|
Charter Next Generation, Inc. (fka Charter NEX US, Inc.)
|
300 N. LaSalle Drive, Suite 1575, Chicago, IL 60654
|
First Lien Term Loan
|
SOFR(M)
|
—
|
2.75
|
%
|
6.50
|
%
|
12/1/2030
|
$
|
8,161,664
|
8,156,985
|
8,188,802
|
0.33
|
%
|
||||||||||||||||||||||||
|
Clydesdale Acquisition Holdings, Inc
|
251 Little Falls Drive, Wilmington, DE 19808
|
First Lien Term Loan
|
SOFR(M)
|
—
|
3.25
|
%
|
6.97
|
%
|
4/13/2029
|
$
|
1,123,954
|
1,123,738
|
1,124,353
|
0.05
|
%
|
||||||||||||||||||||||||
|
Clydesdale Acquisition Holdings, Inc
|
251 Little Falls Drive, Wilmington, DE 19808
|
First Lien Delayed Draw Term Loan
|
SOFR(M)
|
—
|
3.25
|
%
|
6.97
|
%
|
4/13/2029
|
$
|
17,881
|
17,647
|
(4,852
|
)
|
—
|
D |
|||||||||||||||||||||||
|
Mauser Packaging Solutions Holding Co
|
1515 W. 22nd Street, Suite 1100, Oak Brook, IL 60523
|
First Lien Term Loan
|
SOFR(Q)
|
—
|
5.00
|
%
|
8.69
|
%
|
4/15/2030
|
$
|
800,000
|
780,339
|
786,168
|
0.03
|
%
|
||||||||||||||||||||||||
|
10,078,709
|
10,094,471
|
0.41
|
%
|
||||||||||||||||||||||||||||||||||||
BlackRock Private Credit Fund
Consolidated Schedule of Investments (Continued)
December 31, 2025
|
Issuer(F)
|
Company Address
|
Instrument
|
Ref(B)
|
Floor
|
Spread
|
Total
Coupon |
Maturity
|
Principal
|
Cost
|
Fair
Value |
% of Total
Cash and Investment |
|
Notes | ||||||||||||||||||||||||||
|
Debt Investments - Continued
|
|||||||||||||||||||||||||||||||||||||||
|
Communications Equipment
|
|||||||||||||||||||||||||||||||||||||||
|
Digicert Inc
|
2801 N Thanksgiving Way, Suite 500, Lehi, UT 84043
|
First Lien Term Loan
|
SOFR(M)
|
0.75
|
%
|
5.75
|
%
|
9.47
|
%
|
7/30/2030
|
$
|
33,854,115
|
33,378,564
|
33,471,665
|
1.36
|
%
|
E |
||||||||||||||||||||||
|
Distributors
|
|||||||||||||||||||||||||||||||||||||||
|
Bradyplus Holdings LLC
|
7055 S. Lindell Road, Las Vegas, NV 89118
|
First Lien Term Loan
|
SOFR(Q)
|
—
|
3.50
|
%
|
7.26
|
%
|
12/13/2032
|
$
|
652,000
|
642,220
|
646,158
|
0.03
|
%
|
||||||||||||||||||||||||
|
Diversified Consumer Services
|
|||||||||||||||||||||||||||||||||||||||
|
Belron Finance 2019 LLC (United Kingdom)
|
Milton Park, Stroude Road, Egham, Surrey, TW20 9EL, UK
|
First Lien Term Loan
|
SOFR(Q)
|
—
|
2.25
|
%
|
6.12
|
%
|
10/16/2031
|
$
|
2,054,837
|
2,072,303
|
2,068,964
|
0.08
|
%
|
C |
|||||||||||||||||||||||
|
Express Wash Acquisition Company,
LLC (Whistle)
|
5821 Fairview Road, Suite 400, Charlotte, NC, 28209
|
First Lien Term Loan
|
SOFR(Q)
|
1.00
|
%
|
6.25
|
%
|
10.18
|
%
|
4/10/2031
|
$
|
21,560,745
|
21,371,400
|
20,137,736
|
0.81
|
%
|
E |
||||||||||||||||||||||
|
Express Wash Acquisition Company,
LLC (Whistle)
|
5821 Fairview Road, Suite 400, Charlotte, NC, 28209
|
First Lien Revolver
|
SOFR(Q)
|
1.00
|
%
|
6.25
|
%
|
10.18
|
%
|
4/10/2031
|
$
|
—
|
(11,194
|
)
|
(84,124
|
)
|
—
|
D/E |
|||||||||||||||||||||
|
Fusion Holding Corp. (Finalsite)
|
655 Winding Brook Drive, Glastonbury, CT 06033
|
First Lien Term Loan
|
SOFR(Q)
|
0.75
|
%
|
6.25
|
%
|
9.92
|
%
|
9/29/2028
|
$
|
4,409,996
|
4,357,511
|
4,088,410
|
0.17
|
%
|
E |
||||||||||||||||||||||
|
Fusion Holding Corp. (Finalsite)
|
655 Winding Brook Drive, Glastonbury, CT 06033
|
First Lien Revolver
|
Prime
|
0.75
|
%
|
5.25
|
%
|
12.00
|
%
|
9/15/2027
|
$
|
204,123
|
201,279
|
189,355
|
0.01
|
%
|
E |
||||||||||||||||||||||
|
Planet US Buyer LLC
|
9 W 57th Street, 32nd Floor, New York, NY 10019
|
First Lien Term Loan
|
SOFR(Q)
|
—
|
3.00
|
%
|
6.82
|
%
|
1/31/2031
|
$
|
1,118,644
|
1,121,092
|
1,127,330
|
0.05
|
%
|
||||||||||||||||||||||||
|
|
29,112,391
|
27,527,671
|
1.12
|
%
|
|||||||||||||||||||||||||||||||||||
|
Diversified Financial Services
|
|||||||||||||||||||||||||||||||||||||||
|
Accuserve Solutions, Inc.
|
5611 Hudson Dr, Suite 300, Hudson, OH 44236
|
First Lien Term Loan
|
SOFR(Q)
|
1.00
|
%
|
5.25
|
%
|
9.09
|
%
|
3/15/2030
|
$
|
494,954
|
494,954
|
438,034
|
0.02
|
%
|
E |
||||||||||||||||||||||
|
Beekeeper Buyer Inc. (Archway)
|
8888 Keystone Crossing, Suite 1400, Indianapolis, IN 46240
|
First Lien Term Loan
|
SOFR(Q)
|
0.75
|
%
|
5.25
|
%
|
8.92
|
%
|
6/30/2031
|
$
|
5,809,164
|
5,755,977
|
5,814,973
|
0.24
|
%
|
E |
||||||||||||||||||||||
|
Beekeeper Buyer Inc. (Archway)
|
8888 Keystone Crossing, Suite 1400, Indianapolis, IN 46240
|
First Lien Revolver
|
SOFR(Q)
|
0.75
|
%
|
5.25
|
%
|
8.92
|
%
|
6/30/2031
|
$
|
—
|
(13,297
|
)
|
—
|
—
|
D/E |
||||||||||||||||||||||
|
EdgeCo Buyer, Inc.
|
1251 Waterfront Place, Suite 510, Pittsburgh, PA 15222
|
First Lien Delayed Draw Term Loan E
|
SOFR(Q)
|
1.00
|
%
|
4.50
|
%
|
8.17
|
%
|
6/1/2028
|
$
|
4,934,075
|
4,893,263
|
4,890,246
|
0.20
|
%
|
E |
||||||||||||||||||||||
|
EdgeCo Buyer, Inc.
|
1251 Waterfront Place, Suite 510, Pittsburgh, PA 15222
|
First Lien Term Loan B
|
SOFR(Q)
|
1.00
|
%
|
4.50
|
%
|
8.17
|
%
|
6/1/2028
|
$
|
2,522,567
|
2,504,839
|
2,503,673
|
0.10
|
%
|
E |
||||||||||||||||||||||
|
EdgeCo Buyer, Inc.
|
1251 Waterfront Place, Suite 510, Pittsburgh, PA 15222
|
First Lien Term Loan
|
SOFR(Q)
|
—
|
4.50
|
%
|
8.17
|
%
|
6/1/2028
|
$
|
1,102,343
|
1,094,596
|
1,094,086
|
0.04
|
%
|
E |
|||||||||||||||||||||||
|
EdgeCo Buyer, Inc.
|
1251 Waterfront Place, Suite 510, Pittsburgh, PA 15222
|
First Lien Revolver
|
SOFR(Q)
|
1.00
|
%
|
4.50
|
%
|
8.17
|
%
|
6/1/2028
|
$
|
—
|
(4,116
|
)
|
(4,387
|
)
|
—
|
D/E |
|||||||||||||||||||||
|
EdgeCo Buyer, Inc.
|
1251 Waterfront Place, Suite 510, Pittsburgh, PA 15222
|
First Lien Delayed Draw Term Loan A
|
SOFR(Q)
|
1.00
|
%
|
4.50
|
%
|
8.17
|
%
|
6/1/2028
|
$
|
214,467
|
212,960
|
212,861
|
0.01
|
%
|
E |
||||||||||||||||||||||
|
EdgeCo Buyer, Inc.
|
1251 Waterfront Place, Suite 510, Pittsburgh, PA 15222
|
First Lien Delayed Draw Term Loan B
|
SOFR(Q)
|
1.00
|
%
|
4.50
|
%
|
8.17
|
%
|
6/1/2028
|
$
|
186,266
|
184,957
|
184,871
|
0.01
|
%
|
E |
||||||||||||||||||||||
|
EdgeCo Buyer, Inc.
|
1251 Waterfront Place, Suite 510, Pittsburgh, PA 15222
|
First Lien Delayed Draw Term Loan C
|
SOFR(Q)
|
1.00
|
%
|
4.50
|
%
|
8.17
|
%
|
6/1/2028
|
$
|
61,928
|
61,492
|
61,464
|
—
|
E |
|||||||||||||||||||||||
|
GC Champion Acquisition LLC (Numerix)
|
100 Park Avenue, 15th Floor, New York, NY 10017
|
First Lien Delayed Draw Term Loan
|
SOFR(S)
|
1.00
|
%
|
5.00
|
%
|
9.22
|
%
|
8/19/2028
|
$
|
—
|
$
|
(36,363
|
)
|
$
|
(28,487
|
)
|
—
|
D/E |
|||||||||||||||||||
|
GC Champion Acquisition LLC (Numerix)
|
100 Park Avenue, 15th Floor, New York, NY 10017
|
First Lien Incremental Term Loan
|
SOFR(S)
|
1.00
|
%
|
5.00
|
%
|
9.22
|
%
|
8/21/2028
|
$
|
8,786,733
|
8,649,295
|
8,718,768
|
0.35
|
%
|
E |
||||||||||||||||||||||
|
GC Champion Acquisition LLC (Numerix)
|
100 Park Avenue, 15th Floor, New York, NY 10017
|
First Lien Term Loan
|
SOFR(S)
|
1.00
|
%
|
5.00
|
%
|
9.22
|
%
|
8/21/2028
|
$
|
10,031,377
|
10,011,156
|
9,953,784
|
0.40
|
%
|
E |
||||||||||||||||||||||
|
GC Champion Acquisition LLC (Numerix)
|
100 Park Avenue, 15th Floor, New York, NY 10017
|
First Lien Delayed Draw Term Loan
|
SOFR(S)
|
1.00
|
%
|
5.00
|
%
|
9.22
|
%
|
8/21/2028
|
$
|
639,841
|
634,224
|
634,892
|
0.03
|
%
|
E |
||||||||||||||||||||||
|
GC Waves Holdings, Inc. (Mercer)
|
1200 17th Street, Suite 500, Denver, CO 80202
|
First Lien Term Loan
|
SOFR(M)
|
0.75
|
%
|
4.50
|
%
|
8.22
|
%
|
9/30/2030
|
$
|
18,925,793
|
18,925,793
|
19,115,051
|
0.78
|
%
|
E |
||||||||||||||||||||||
|
GC Waves Holdings, Inc. (Mercer)
|
1200 17th Street, Suite 500, Denver, CO 80202
|
First Lien Revolver
|
SOFR(M)
|
0.75
|
%
|
4.50
|
%
|
8.22
|
%
|
8/10/2029
|
$
|
—
|
—
|
—
|
—
|
E |
|||||||||||||||||||||||
|
GC Waves Holdings, Inc. (Mercer)
|
1200 17th Street, Suite 500, Denver, CO 80202
|
First Lien Delayed Draw Term Loan
|
SOFR(M)
|
0.75
|
%
|
4.50
|
%
|
8.22
|
%
|
10/4/2030
|
$
|
1,536,670
|
1,393,142
|
1,838,101
|
0.07
|
%
|
E |
||||||||||||||||||||||
|
Gryphon Debt Merger Sub Inc.
(Altera Corporation LLC)
|
c/o The Corporation Trust Company, 1209 Orange
Street, Wilmington, DE 19801
|
First Lien Term Loan
|
SOFR(S)
|
—
|
3.00
|
%
|
6.88
|
%
|
8/17/2028
|
$
|
840,000
|
835,829
|
846,741
|
0.03
|
%
|
||||||||||||||||||||||||
|
HP PHRG Borrower LLC
|
c/o The Corporation Trust Company, 1209 Orange Street, Wilmington, DE 19801
|
First Lien Term Loan
|
SOFR(Q)
|
—
|
4.00
|
%
|
7.67
|
%
|
2/20/2032
|
$
|
19,216,009
|
19,045,554
|
19,135,974
|
0.78
|
%
|
||||||||||||||||||||||||
|
Orion Us Finco Inc.
|
73 Front Street, 5th Floor, Hamilton, HM 12, Bermuda
|
First Lien Term Loan
|
SOFR(Q)
|
—
|
3.50
|
%
|
7.43
|
%
|
10/10/2032
|
$
|
442,000
|
439,852
|
444,590
|
0.02
|
%
|
||||||||||||||||||||||||
|
Oak Funding LLC
|
101 Hudson Street, 17th Floor, Jersey City, NJ 07302
|
First Lien Term Loan
|
SOFR(Q)
|
0.50
|
%
|
4.50
|
%
|
8.29
|
%
|
12/2/2032
|
$
|
17,487,635
|
17,315,538
|
17,314,735
|
0.70
|
%
|
E |
||||||||||||||||||||||
|
Oak Funding LLC
|
101 Hudson Street, 17th Floor, Jersey City, NJ 07302
|
First Lien Delayed Draw Term Loan
|
SOFR(Q)
|
0.50
|
%
|
4.50
|
%
|
8.29
|
%
|
12/2/2032
|
$
|
—
|
(16,861
|
)
|
(16,868
|
)
|
—
|
D/E |
|||||||||||||||||||||
|
Payroc, LLC
|
7840 Graphic Drive, Suite 200, Tinley Park, IL 60477
|
First Lien Term Loan
|
SOFR(M)
|
1.00
|
%
|
4.75
|
%
|
8.47
|
%
|
11/1/2027
|
$
|
7,515,599
|
7,460,323
|
7,500,568
|
0.30
|
%
|
E |
||||||||||||||||||||||
|
Payroc, LLC
|
7840 Graphic Drive, Suite 200, Tinley Park, IL 60477
|
First Lien Revolver
|
SOFR(M)
|
1.00
|
%
|
4.75
|
%
|
8.47
|
%
|
11/1/2027
|
$
|
—
|
(1,231
|
)
|
(333
|
)
|
—
|
D/E |
|||||||||||||||||||||
|
Payroc, LLC
|
7840 Graphic Drive, Suite 200, Tinley Park, IL 60477
|
First Lien Term Loan
|
SOFR(M)
|
1.00
|
%
|
4.75
|
%
|
8.47
|
%
|
10/31/2027
|
$
|
540,952
|
538,574
|
539,870
|
0.02
|
%
|
E |
||||||||||||||||||||||
|
SitusAMC Holdings Corporation
|
Tower 49, 12 East 49th Street, 34th Floor, New York,
NY 10017
|
First Lien Term Loan
|
SOFR(Q)
|
0.75
|
%
|
5.50
|
%
|
9.17
|
%
|
5/14/2031
|
$
|
14,798,438
|
14,775,028
|
14,902,027
|
0.60
|
%
|
E |
||||||||||||||||||||||
|
SitusAMC Holdings Corporation
|
Tower 49, 12 East 49th Street, 34th Floor, New York,
NY 10017
|
First Lien Term Loan
|
SOFR(Q)
|
0.75
|
%
|
5.50
|
%
|
9.17
|
%
|
5/14/2031
|
$
|
32,535,805
|
32,435,058
|
32,763,556
|
1.33
|
%
|
E |
||||||||||||||||||||||
BlackRock Private Credit Fund
Consolidated Schedule of Investments (Continued)
December 31, 2025
|
Issuer(F)
|
Company Address
|
Instrument
|
Ref(B)
|
Floor
|
Spread
|
Total
Coupon |
Maturity
|
Principal
|
Cost
|
Fair
Value |
% of Total
Cash and Investment |
Notes
|
|||||||||||||||||||||||||||
|
Debt Investments - Continued
|
|||||||||||||||||||||||||||||||||||||||
|
Diversified Financial Services (Continued)
|
|||||||||||||||||||||||||||||||||||||||
|
Wealth Enhancement Group, LLC
|
505 N Hwy 169, Ste 900, Plymouth, MN 55441, United States
|
First Lien Delayed Draw Term Loan
|
SOFR(Q)
|
1.00
|
%
|
4.50
|
%
|
8.49
|
%
|
10/4/2028
|
$
|
13,961,875
|
13,961,875
|
13,898,907
|
0.56
|
%
|
E | ||||||||||||||||||||||
|
Wealth Enhancement Group, LLC
|
505 N Hwy 169, Ste 900, Plymouth, MN 55441, United States
|
First Lien Delayed Draw Term Loan
|
SOFR(Q)
|
1.00
|
%
|
4.50
|
%
|
8.17
|
%
|
10/2/2028
|
$
|
2,669,859
|
2,657,834
|
2,640,245
|
0.11
|
%
|
E | ||||||||||||||||||||||
|
Wealth Enhancement Group, LLC
|
505 N Hwy 169, Ste 900, Plymouth, MN 55441, United States
|
First Lien Delayed Draw Term Loan
|
SOFR(Q)
|
1.00
|
%
|
4.50
|
%
|
8.49
|
%
|
10/4/2028
|
$
|
3,629,871
|
3,610,401
|
3,613,500
|
0.15
|
%
|
E | ||||||||||||||||||||||
|
Wealth Enhancement Group, LLC
|
505 N Hwy 169, Ste 900, Plymouth, MN 55441, United States
|
First Lien Delayed Draw Term Loan
|
SOFR(Q)
|
1.00
|
%
|
4.50
|
%
|
8.49
|
%
|
10/2/2028
|
$
|
1,082,893
|
1,082,893
|
1,078,009
|
0.04
|
%
|
E | ||||||||||||||||||||||
|
Wealth Enhancement Group, LLC
|
505 N Hwy 169, Ste 900, Plymouth, MN 55441, United States
|
First Lien Revolver
|
SOFR(Q)
|
1.00
|
%
|
4.50
|
%
|
8.17
|
%
|
10/4/2028
|
$
|
—
|
(612
|
)
|
(5,948
|
)
|
—
|
D/E | |||||||||||||||||||||
|
Wealth Enhancement Group, LLC
|
505 N Hwy 169, Ste 900, Plymouth, MN 55441, United States
|
First Lien Delayed Draw Term Loan
|
SOFR(Q)
|
1.00
|
%
|
4.50
|
%
|
8.17
|
%
|
10/2/2028
|
$
|
—
|
$
|
(16,919
|
)
|
$
|
(34,318
|
)
|
—
|
D/E | |||||||||||||||||||
|
White Cap Supply Holdings, LLC
|
6250 Brook Hollow Parkway, Norcross, GA 30071, United States
|
First Lien Tranche B Term Loan
|
SOFR(M)
|
—
|
3.25
|
%
|
6.97
|
%
|
10/19/2029
|
$
|
7,797,923
|
7,770,114
|
7,838,511
|
0.32
|
%
|
||||||||||||||||||||||||
|
|
176,656,122
|
177,887,696
|
7.21
|
%
|
|||||||||||||||||||||||||||||||||||
|
Diversified Telecommunication Services
|
|||||||||||||||||||||||||||||||||||||||
|
Level 3 Financing Inc.
|
1601 Las Plumas Avenue, San Jose, CA 95133
|
First Lien Term Loan
|
SOFR(M)
|
—
|
3.25
|
%
|
6.97
|
%
|
3/27/2032
|
$
|
1,664,000
|
1,665,077
|
1,670,864
|
0.07
|
%
|
||||||||||||||||||||||||
|
Venga Finance Sarl (Luxembourg)
|
18 Rue Dicks, 1417 Luxembourg, Luxembourg
|
First Lien Term Loan
|
SOFR(Q)
|
—
|
4.01
|
%
|
7.83
|
%
|
6/28/2029
|
$
|
1,246,851
|
1,250,735
|
1,252,618
|
0.05
|
%
|
C | |||||||||||||||||||||||
|
|
2,915,812
|
2,923,482
|
0.12
|
%
|
|||||||||||||||||||||||||||||||||||
|
Electrical Equipment
|
|||||||||||||||||||||||||||||||||||||||
|
Griffon Bidco Inc. (Layerzero)
|
1500 Danner Drive, Aurora, OH 44202
|
First Lien Delayed Draw Term Loan
|
SOFR(Q)
|
0.75
|
%
|
5.00
|
%
|
8.67
|
%
|
7/31/2031
|
$
|
—
|
(41,944
|
)
|
—
|
0.00
|
%
|
D/E | |||||||||||||||||||||
|
Griffon Bidco Inc. (Layerzero)
|
1500 Danner Drive, Aurora, OH 44202
|
First Lien Revolver
|
SOFR(Q)
|
0.75
|
%
|
5.00
|
%
|
8.67
|
%
|
7/31/2031
|
$
|
—
|
(41,944
|
)
|
—
|
0.00
|
%
|
D/E | |||||||||||||||||||||
|
Griffon Bidco Inc. (Layerzero)
|
1500 Danner Drive, Aurora, OH 44202
|
First Lien Term Loan
|
SOFR(Q)
|
0.75
|
%
|
5.00
|
%
|
8.67
|
%
|
7/31/2031
|
$
|
25,285,726
|
25,048,459
|
25,285,726
|
1.04
|
%
|
E | ||||||||||||||||||||||
|
Spark Buyer, LLC (Sparkstone)
|
133 N Swift Road, Addison, IL 60101
|
First Lien Term Loan
|
SOFR(Q)
|
0.75
|
%
|
5.25
|
%
|
9.13
|
%
|
10/15/2031
|
$
|
11,636,468
|
11,492,173
|
9,472,085
|
0.38
|
%
|
E | ||||||||||||||||||||||
|
Spark Buyer, LLC (Sparkstone)
|
133 N Swift Road, Addison, IL 60101
|
First Lien Revolver
|
SOFR(Q)
|
0.75
|
%
|
5.25
|
%
|
8.94
|
%
|
10/15/2031
|
$
|
799,273
|
770,122
|
362,024
|
0.01
|
%
|
E | ||||||||||||||||||||||
|
Spark Buyer, LLC (Sparkstone)
|
133 N Swift Road, Addison, IL 60101
|
First Lien Delayed Draw Term Loan
|
SOFR(Q)
|
0.75
|
%
|
5.25
|
%
|
8.94
|
%
|
10/15/2031
|
$
|
—
|
(58,301
|
)
|
(874,498
|
)
|
-0.04
|
%
|
D/E | ||||||||||||||||||||
|
|
|
37,168,565 |
|
34,245,337 |
|
|
1.39 | % | |||||||||||||||||||||||||||||||
|
Energy Equipment and Services
|
|||||||||||||||||||||||||||||||||||||||
|
PG Polaris Bidco SARL (Rosen Group) (Luxembourg)
|
35D, Avenue John F. Kennedy, 1855 Luxembourg
|
First Lien Term Loan
|
SOFR(Q)
|
—
|
2.25
|
%
|
5.92
|
%
|
3/26/2031
|
$
|
2,735,825
|
2,745,388
|
2,748,437
|
0.11
|
%
|
C | |||||||||||||||||||||||
|
Entertainment
|
|||||||||||||||||||||||||||||||||||||||
|
City Football Group Ltd (United Kingdom)
|
400 Ashton New Road, Manchester, England, M11 4TQ
|
First Lien Term Loan
|
SOFR(Q)
|
0.50
|
%
|
3.26
|
%
|
6.93
|
%
|
7/21/2030
|
$
|
2,074,734
|
2,076,369
|
2,077,327
|
0.08
|
%
|
C | ||||||||||||||||||||||
|
Endeavor Operating Company LLC
|
9601 Wilshire Blvd, Beverly Hills, CA 90210
|
First Lien Term Loan
|
SOFR(M)
|
—
|
3.00
|
%
|
6.72
|
%
|
1/28/2032
|
$
|
6,270,323
|
6,269,522
|
6,314,215
|
0.26
|
%
|
||||||||||||||||||||||||
|
International Entertainment JJJCO 3 Ltd (ATG Entertainment LLC) (United Kingdom)
|
72 Welbeck Street, London, W1G 0AY, United Kingdom
|
First Lien Term Loan
|
SOFR(Q)
|
—
|
3.00
|
%
|
6.84
|
%
|
4/19/2032
|
$
|
457,703
|
455,622
|
455,987
|
0.02
|
%
|
C/E | |||||||||||||||||||||||
|
Renaissance Holding Corp.
|
1384 Broadway, 22nd Floor, New York, NY 10018, United States
|
First Lien Term Loan
|
SOFR(M)
|
—
|
4.00
|
%
|
7.72
|
%
|
12/11/2031
|
$
|
960,202
|
941,381
|
841,324
|
0.03
|
%
|
||||||||||||||||||||||||
|
|
|
9,742,894 |
|
9,688,853 |
|
|
0.39 | % |
|||||||||||||||||||||||||||||||
|
Food Products
|
|||||||||||||||||||||||||||||||||||||||
|
Sauer Brands Inc
|
2000 West Broad Street, Richmond, VA 23220, United States
|
First Lien Term Loan
|
SOFR(M)
|
—
|
3.00
|
%
|
6.72
|
%
|
2/4/2032
|
$
|
251,574
|
251,106
|
252,936
|
0.01
|
%
|
||||||||||||||||||||||||
|
Saratoga Food Specialties LLC (Solina France SASU) (France)
|
201 Rue des Écotais, 35310 Bréal-sous-Montfort, Bretagne, France
|
First Lien Term Loan
|
SOFR(Q)
|
—
|
3.25
|
%
|
6.98
|
%
|
3/7/2029
|
$
|
932,950
|
936,157
|
941,500
|
0.04
|
%
|
C | |||||||||||||||||||||||
|
Wellness Pet LLC (Woof)
|
77 S Bedford St, Suite 500, Burlington, MA 01803, United States
|
First Lien First Out Term Loan
|
SOFR(Q)
|
—
|
3.95
|
%
|
7.62
|
%
|
12/1/2029
|
$
|
479,108
|
443,529
|
295,849
|
0.01
|
%
|
||||||||||||||||||||||||
|
|
|
1,630,792 |
|
1,490,285 |
|
|
0.06 | % | |||||||||||||||||||||||||||||||
|
Health Care Equipment and Supplies
|
|||||||||||||||||||||||||||||||||||||||
|
Avalara, Inc.
|
512 Mangum Street, Suite 100, Durham, NC 27701, US
|
First Lien Term Loan
|
SOFR(Q)
|
—
|
2.75
|
% |
6.42 | % | 3/26/2032 | $ |
462,678 | 460,615 | 465,216 | 0.02 | % |
||||||||||||||||||||||||
|
Chariot Buyer, LLC
|
c/o The Corporation Trust Company, 1209 Orange Street, Wilmington, DE 19801
|
First Lien Term Loan
|
SOFR(M)
|
0.50
|
% |
2.75 | % | 6.47 | % | 7/22/2032 | $ |
5,442,636 | 5,420,839 | 5,460,216 |
0.23
|
% |
|||||||||||||||||||||||
|
Opal Bidco SAS (Opella) (France)
|
157 av. Charles de Gaulle, 92200, Neuilly-sur-Seine, France.
|
First Lien Term Loan
|
SOFR(Q)
|
—
|
3.00 | % | 6.69 | % | 4/23/2032 | $ |
6,503,700 | 6,528,276 | 6,552,478 |
0.26
|
% |
C |
|||||||||||||||||||||||
| 12,409,730 | 12,477,910 |
0.51
|
% |
||||||||||||||||||||||||||||||||||||
|
Healthcare Providers and Services
|
|||||||||||||||||||||||||||||||||||||||
|
Acp Tara Holdings Inc. (Arcadia)
|
251 Little Falls Drive, Wilmington, DE 19808
|
First Lien Term Loan
|
SOFR(Q)
|
— |
3.25
|
% |
6.97
|
% |
9/17/2032
|
$ |
152,000
|
151,621
|
153,045
|
0.01
|
% |
E |
|||||||||||||||||||||||
|
AHP Health Partners, Inc.
|
1452 Hughes Rd, Suite 350, Grapevine, TX 76051
|
First Lien Term Loan
|
SOFR(M)
|
— |
2.25
|
% |
5.97
|
% |
9/20/2032
|
$ |
1,915,200
|
1,922,456
|
1,918,494
|
0.08
|
% |
||||||||||||||||||||||||
|
CHG Healthcare Services, Inc.
|
7259 S Bingham Junction Blvd, Midvale, UT 84047
|
First Lien Term Loan
|
SOFR(Q)
|
— |
2.75
|
% |
6.59
|
% |
9/29/2028
|
$ |
2,711,392
|
2,694,913
|
2,726,955
|
0.11
|
% |
||||||||||||||||||||||||
BlackRock Private Credit Fund
Consolidated Schedule of Investments (Continued)
December 31, 2025
|
Issuer(F)
|
Company Address
|
Instrument
|
Ref(B)
|
Floor
|
Spread
|
Total
Coupon |
Maturity
|
Principal
|
Cost
|
Fair
Value |
% of Total
Cash and Investment |
Notes
|
|||||||||||||||||||||||||||
|
Debt Investments - Continued
|
|||||||||||||||||||||||||||||||||||||||
|
Health Care Equipment and Supplies (Continued)
|
|||||||||||||||||||||||||||||||||||||||
|
Electron Bidco Inc.
|
100 N Main St, Ann Arbor, MI 48104
|
First Lien Term Loan
|
SOFR(M)
|
—
|
2.50
|
%
|
6.22
|
%
|
10/7/2028
|
$
|
2,059,385
|
2,064,427
|
2,072,493
|
0.08
|
%
|
||||||||||||||||||||||||
|
LifePoint Health Inc
|
330 Seven Springs Way, Brentwood, TN 37027
|
First Lien Term Loan
|
SOFR(M)
|
—
|
3.50
|
%
|
7.33
|
%
|
5/19/2031
|
$
|
1,525,099
|
1,525,113
|
1,529,232
|
0.06
|
%
|
||||||||||||||||||||||||
|
LifePoint Health Inc
|
330 Seven Springs Way, Brentwood, TN 37027
|
First Lien Term Loan
|
SOFR(Q)
|
—
|
3.75
|
%
|
7.65
|
%
|
5/16/2031
|
$
|
1,917,929
|
1,918,013
|
1,926,368
|
0.08
|
%
|
||||||||||||||||||||||||
|
Ingenovis Health, Inc.
|
9997 Carver Rd, Suite 300, Blue Ash, Ohio 45242
|
First Lien Term Loan
|
SOFR(Q)
|
0.75
|
%
|
4.25
|
%
|
8.19
|
%
|
3/5/2028
|
$
|
238,091
|
236,197
|
69,939
|
—
|
||||||||||||||||||||||||
|
IvyRehab Intermediate II, LLC
|
1311 Mamaroneck Ave., Suite 140, White Plains, NY 10605
|
First Lien Delayed Draw Term Loan
|
SOFR(Q)
|
0.75
|
%
|
5.35
|
%
|
9.02
|
%
|
4/23/2029
|
$
|
14,014,906
|
13,863,384
|
14,014,906
|
0.56
|
%
|
E |
||||||||||||||||||||||
|
IvyRehab Intermediate II, LLC
|
1311 Mamaroneck Ave., Suite 140, White Plains, NY 10605
|
First Lien Delayed Draw Term Loan
|
SOFR(Q)
|
0.75
|
%
|
5.10
|
%
|
8.77
|
%
|
4/23/2029
|
$
|
9,317,238
|
8,934,995
|
9,135,995
|
0.36
|
%
|
E |
||||||||||||||||||||||
|
Raven Acquisition Holdings LLC (R1 RCM)
|
433 W Ascension Way, Suite 200, Murray, UT 84123, United States
|
First Lien Term Loan
|
SOFR(M)
|
—
|
3.00
|
%
|
6.72
|
%
|
11/19/2031
|
$
|
1,890,777
|
1,890,578
|
1,899,125
|
0.08
|
%
|
||||||||||||||||||||||||
|
Raven Acquisition Holdings LLC (R1 RCM)
|
433 W Ascension Way, Suite 200, Murray, UT 84123, United States
|
First Lien Delayed Draw Term Loan
|
SOFR(M)
|
—
|
3.00
|
%
|
6.72
|
%
|
11/19/2031
|
$
|
—
|
235
|
602
|
—
|
|||||||||||||||||||||||||
|
Surgery Partners Holdings, LLC
|
340 Seven Springs Way, Suite 600, Brentwood, TN 37027, United States
|
First Lien Term Loan
|
SOFR(M)
|
—
|
2.50
|
%
|
6.22
|
%
|
12/19/2030
|
$
|
3,363,047
|
3,375,052
|
3,380,165
|
0.15
|
%
|
||||||||||||||||||||||||
|
|
38,576,984 |
|
38,827,319 |
|
1.57
|
% |
|||||||||||||||||||||||||||||||||
|
Health Care Technology
|
|||||||||||||||||||||||||||||||||||||||
|
Athenahealth Group Inc.
|
80 Guest Street, Boston, MA 02135
|
First Lien Term Loan
|
SOFR(M)
|
0.50
|
%
|
2.75
|
%
|
6.47
|
%
|
2/15/2029
|
$
|
9,924,727
|
9,918,729
|
9,955,742
|
0.40
|
%
|
|||||||||||||||||||||||
|
Cotiviti Holdings, Inc
|
10701 S River Front Pkwy, Suite 200, South Jordan, UT 84095
|
First Lien Term Loan
|
SOFR(M)
|
—
|
2.75
|
%
|
6.62
|
%
|
2/24/2031
|
$
|
1,540,082
|
1,528,655
|
1,483,615
|
0.06
|
%
|
||||||||||||||||||||||||
|
Cotiviti Holdings, Inc
|
10701 S River Front Pkwy, Suite 200, South Jordan, UT 84095
|
First Lien Term Loan
|
SOFR(M)
|
—
|
2.75
|
%
|
6.62
|
%
|
2/13/2032
|
$
|
906,947
|
898,813
|
872,941
|
0.04
|
%
|
||||||||||||||||||||||||
|
MRO Parent Corporation
|
1000 Madison Avenue, Suite 100, Norristown, PA 19403
|
First Lien Term Loan
|
SOFR(M)
|
0.75
|
%
|
4.50
|
%
|
8.22
|
%
|
6/9/2032
|
$
|
34,673,825
|
34,195,620
|
34,465,782
|
1.40
|
%
|
E |
||||||||||||||||||||||
|
MRO Parent Corporation
|
1000 Madison Avenue, Suite 100, Norristown, PA 19403
|
First Lien Revolver
|
SOFR(M)
|
0.75
|
%
|
4.50
|
%
|
8.22
|
%
|
6/9/2032
|
$
|
—
|
(41,687
|
)
|
(18,136
|
)
|
—
|
D/E
|
|||||||||||||||||||||
|
MRO Parent Corporation
|
1000 Madison Avenue, Suite 100, Norristown, PA 19403
|
First Lien Delayed Draw Term Loan
|
SOFR(M)
|
0.75
|
%
|
4.50
|
%
|
8.22
|
%
|
6/9/2032
|
$
|
—
|
(20,844
|
)
|
(18,136
|
)
|
—
|
D/E
|
|||||||||||||||||||||
|
Mpulse Mobile Inc.
|
21255 Burbank Blvd., Los Angeles, CA 91367
|
First Lien Delayed Draw Term Loan
|
SOFR(Q)
|
0.75
|
%
|
3.25
|
%
|
6.97
|
%
|
8/26/2032
|
$
|
—
|
(36,284
|
)
|
(36,732
|
)
|
—
|
D/E | |||||||||||||||||||||
|
Mpulse Mobile Inc.
|
21255 Burbank Blvd., Los Angeles, CA 91367
|
First Lien Revolver
|
SOFR(Q)
|
0.75
|
%
|
4.75
|
%
|
8.42
|
%
|
8/26/2032
|
$
|
—
|
(54,426
|
)
|
(55,201
|
)
|
—
|
D/E | |||||||||||||||||||||
|
Mpulse Mobile Inc.
|
21255 Burbank Blvd., Los Angeles, CA 91367
|
First Lien Term Loan
|
SOFR(Q)
|
0.75
|
%
|
4.75
|
%
|
8.42
|
%
|
8/26/2032
|
$
|
40,121,205
|
39,746,068
|
39,735,520
|
1.61
|
%
|
E |
||||||||||||||||||||||
|
Polaris Newco, LLC
|
4000 Legato Rd., Suite 600, Fairfax, VA 22033
|
First Lien Term Loan
|
SOFR(Q)
|
0.50
|
%
|
3.75
|
%
|
7.85
|
%
|
6/2/2028
|
$
|
2,920,685
|
$
|
2,921,313
|
$
|
2,823,222
|
0.11
|
%
|
|||||||||||||||||||||
|
PointClickCare Technologies Inc. (Canada)
|
5570 Explorer Drive, Mississauga, ON L4W 0C4, Canada
|
First Lien Term Loan
|
SOFR(Q)
|
—
|
2.75
|
%
|
6.42
|
%
|
11/3/2031
|
$
|
4,393,621
|
4,401,487
|
4,408,274
|
0.18
|
%
|
C |
|||||||||||||||||||||||
|
Press Ganey Holdings, Inc.
|
1173 Ignition Drive, South Bend, IN 46601
|
First Lien Term Loan
|
SOFR(M)
|
—
|
3.00
|
%
|
6.72
|
%
|
4/30/2031
|
$
|
2,049,918
|
2,052,850
|
2,056,324
|
0.08
|
%
|
||||||||||||||||||||||||
|
Zelis Healthcare Corp
|
149 Newbury Street, 5th Floor, Boston, MA 02116, United States
|
First Lien Term Loan
|
SOFR(M)
|
—
|
2.75
|
%
|
6.47
|
%
|
9/15/2029
|
$
|
1,946,433
|
1,935,510
|
1,930,219
|
0.08
|
%
|
||||||||||||||||||||||||
|
|
97,445,804 |
|
97,603,434 |
|
3.96
|
% |
|||||||||||||||||||||||||||||||||
|
Hotels, Restaurants and Leisure
|
|||||||||||||||||||||||||||||||||||||||
|
Alterra Mountain Company
|
3501 Wazee Street, Suite 400, Denver, CO 80216
|
First Lien Term Loan
|
SOFR(Q)
|
—
|
5.00
|
%
|
8.69
|
%
|
5/31/2030
|
$
|
1,246,875
|
1,255,994
|
1,254,668
|
0.05
|
%
|
E |
|||||||||||||||||||||||
|
Fertitta Entertainment, LLC
|
1510 West Loop South, Houston, TX 77027
|
First Lien Term Loan
|
SOFR(M)
|
0.50
|
%
|
3.25
|
%
|
6.97
|
%
|
1/27/2029
|
$
|
7,914,353
|
7,892,164
|
7,921,555
|
0.32
|
%
|
|||||||||||||||||||||||
|
Great Canadian Gaming Corp. (Canada)
|
39 Wynford Drive, Toronto, ON M3C 3K5, Canada
|
First Lien Term Loan
|
SOFR(Q)
|
—
|
4.75
|
%
|
8.44
|
%
|
11/1/2029
|
$
|
429,281
|
429,243
|
423,110
|
0.02
|
%
|
C |
|||||||||||||||||||||||
|
Herschend Entertainment Company LLC
|
157 Technology Parkway Suite 100, Peachtree Corners, GA 30092
|
First Lien Term Loan
|
SOFR(M)
|
—
|
3.25
|
%
|
6.97
|
%
|
5/20/2032
|
$
|
2,484,600
|
2,490,526
|
2,505,048
|
0.10
|
%
|
||||||||||||||||||||||||
|
Motion Finco LLC
|
c/o The Corporation Trust Company, 1209 Orange Street, Wilmington, DE 19801
|
First Lien Term Loan B
|
SOFR(Q)
|
—
|
3.50
|
%
|
7.17
|
%
|
11/12/2029
|
$
|
686,692
|
689,218
|
610,730
|
0.02
|
%
|
||||||||||||||||||||||||
|
Scientific Games Holdings LP
|
1500 Bluegrass Lakes Pkwy, Alpharetta, GA 30004, United States
|
First Lien Term Loan
|
SOFR(Q)
|
0.50
|
%
|
3.00
|
%
|
6.93
|
%
|
4/4/2029
|
$
|
3,887,771
|
3,869,912
|
3,824,614
|
0.16
|
%
|
|||||||||||||||||||||||
|
Showtime Acquisition LLC (World Choice)
|
850 New Burton Road, Suite 201, Dover, DE 19904, United States
|
First Lien Term Loan
|
SOFR(Q)
|
—
|
4.75
|
%
|
8.63
|
%
|
8/13/2031
|
$
|
44,822,847
|
44,458,777
|
44,442,122
|
1.80
|
%
|
E |
|||||||||||||||||||||||
|
Stonebridge Companies, LLC
|
4949 South Niagara Street, Suite 300, Denver, CO 80237
|
First Lien Term Loan
|
SOFR(M)
|
0.75
|
%
|
5.00
|
%
|
8.72
|
%
|
5/16/2031
|
$
|
6,274,616
|
6,190,377
|
6,299,714
|
0.26
|
%
|
E |
||||||||||||||||||||||
|
Stonebridge Companies, LLC
|
4949 South Niagara Street, Suite 300, Denver, CO 80237
|
First Lien Revolver
|
SOFR(M)
|
0.75
|
%
|
5.00
|
%
|
8.72
|
%
|
5/16/2030
|
$
|
—
|
(15,669
|
)
|
—
|
—
|
D/E
|
||||||||||||||||||||||
|
Stonebridge Companies, LLC
|
4949 South Niagara Street, Suite 300, Denver, CO 80237
|
First Lien Delayed Draw Term Loan
|
SOFR(M)
|
0.75
|
%
|
5.00
|
%
|
8.72
|
%
|
5/16/2031
|
$
|
—
|
(12,034
|
)
|
7,171
|
—
|
D/E
|
||||||||||||||||||||||
|
TRQ Sales LLC
|
100 St. Paul Street, Denver, CO 80206, United States
|
First Lien Term Loan
|
SOFR(Q)
|
—
|
3.25
|
%
|
6.94
|
%
|
8/13/2032
|
$
|
1,050,000
|
1,038,980
|
1,038,188
|
0.04
|
%
|
E |
|||||||||||||||||||||||
|
Voyager Parent LLC
|
9 West 57th Street, 41st Floor, New York, NY 10019, United States
|
First Lien Term Loan
|
SOFR(Q)
|
—
|
4.75
|
%
|
8.42
|
%
|
5/8/2032
|
$
|
1,754,603
|
1,740,873
|
1,758,060
|
0.07
|
%
|
||||||||||||||||||||||||
|
Whatabrands LLC
|
300 Concord Plaza Dr, San Antonio, TX 78216, United States
|
First Lien Term Loan
|
SOFR(Q)
|
—
|
2.50
|
%
|
6.46
|
%
|
8/3/2028
|
$
|
1,236,877
|
1,241,974
|
1,241,534
|
0.05
|
%
|
||||||||||||||||||||||||
|
71,270,335
|
71,326,514
|
2.89
|
%
|
||||||||||||||||||||||||||||||||||||
BlackRock Private Credit Fund
Consolidated Schedule of Investments (Continued)
December 31, 2025
|
Issuer(F)
|
Company Address
|
Instrument
|
Ref(B)
|
Floor
|
Spread
|
Total
Coupon |
Maturity
|
Principal
|
Cost
|
Fair
Value |
% of Total
Cash and Investment |
|
Notes | ||||||||||||||||||||||||||
|
Debt Investments - Continued
|
|||||||||||||||||||||||||||||||||||||||
|
Household Durables
|
|||||||||||||||||||||||||||||||||||||||
|
Hunter Douglas Holding BV (Netherlands)
|
Blaak 555, 3011 GB Rotterdam, Netherlands
|
First Lien Term Loan
|
SOFR(Q)
|
—
|
3.00
|
%
|
6.21
|
%
|
1/17/2032
|
$
|
4,092,307
|
4,087,429
|
4,120,073
|
0.17
|
%
|
C | |||||||||||||||||||||||
|
Pye-Barker Fire & Safety LLC
|
2500 Northwinds Parkway, Suite 200, Alpharetta, GA 30009, United States
|
First Lien Term Loan
|
SOFR(M)
|
—
|
2.50
|
%
|
6.21
|
%
|
12/10/2032
|
$
|
848,250
|
844,022
|
854,523
|
0.03
|
%
|
||||||||||||||||||||||||
|
Pye-Barker Fire & Safety LLC
|
2500 Northwinds Parkway, Suite 200, Alpharetta, GA 30009, United States
|
First Lien Delayed Draw Term Loan
|
SOFR(M)
|
—
|
2.50
|
%
|
7.74
|
%
|
12/10/2032
|
$
|
—
|
—
|
937
|
—
|
|||||||||||||||||||||||||
|
Weber Stephen Products, LLC
|
1415 S. Roselle Road, Palatine, IL 60067
|
First Lien Term Loan
|
SOFR(Q)
|
—
|
3.75
|
%
|
0.00
|
%
|
9/17/2032
|
$
|
1,244,000
|
1,235,289
|
1,247,421
|
0.05
|
%
|
||||||||||||||||||||||||
|
|
6,166,740 |
6,222,954 |
0.25 |
% | |||||||||||||||||||||||||||||||||||
|
Industrial Conglomerates
|
|||||||||||||||||||||||||||||||||||||||
|
Beach Acquisition Bidco LLC
|
251 Little Falls Drive, Wilmington, DE 19808
|
First Lien Term Loan
|
SOFR(Q)
|
—
|
3.25
|
%
|
7.23
|
%
|
6/25/2032
|
$
|
582,000
|
$
|
580,604
|
$
|
587,459
|
0.02
|
%
|
||||||||||||||||||||||
|
Chromalloy Holdings LLC
|
3999 RCA Boulevard, Palm Beach Gardens, FL 33410
|
First Lien Term Loan
|
SOFR(Q)
|
—
|
3.25
|
%
|
6.91
|
%
|
3/31/2031
|
$
|
3,801,758
|
3,817,350
|
3,828,788
|
0.16
|
%
|
||||||||||||||||||||||||
|
Cube Industrials Buyer Inc. (Circor)
|
30 Corporate Drive, Suite 200, Burlington, MA 01803
|
First Lien Term Loan
|
SOFR(Q)
|
—
|
3.00
|
%
|
7.37
|
%
|
10/20/2031
|
$
|
934,947
|
933,594
|
942,151
|
0.04
|
%
|
||||||||||||||||||||||||
|
LSF12 Crown US Commercial Bidco, LLC
|
6688 N. Central Expressway, Suite 1600, Dallas, Texas 75206
|
First Lien Term Loan
|
SOFR(M)
|
—
|
3.50
|
%
|
0.00
|
%
|
12/2/2031
|
$
|
842,313
|
843,713
|
848,630
|
0.03
|
%
|
||||||||||||||||||||||||
|
|
|
6,175,261 |
|
6,207,028
|
|
|
0.25 | % |
|||||||||||||||||||||||||||||||
|
Insurance
|
|||||||||||||||||||||||||||||||||||||||
|
Alliant Holdings Intermediate, LLC
|
18100 Von Karman Avenue, 10th Floor, Irvine, CA 92612
|
First Lien Term Loan
|
SOFR(M)
|
—
|
2.50
|
%
|
8.79
|
%
|
9/19/2031
|
$
|
11,973,302
|
11,938,624
|
12,013,832
|
0.49
|
%
|
||||||||||||||||||||||||
|
AmeriLife Holdings, LLC
|
2650 McCormick Drive, Clearwater, FL 33759
|
First Lien Term Loan
|
SOFR(Q)
|
0.75
|
%
|
5.00
|
%
|
8.79
|
%
|
8/31/2029
|
$
|
23,732,225
|
23,521,749
|
23,732,225
|
0.95
|
%
|
E | ||||||||||||||||||||||
|
AmeriLife Holdings, LLC
|
2650 McCormick Drive, Clearwater, FL 33759
|
First Lien Delayed Draw Term Loan
|
SOFR(Q)
|
0.75
|
%
|
5.00
|
%
|
8.79
|
%
|
8/31/2029
|
$
|
—
|
(12,678
|
)
|
—
|
—
|
D/E | ||||||||||||||||||||||
|
AmeriLife Holdings, LLC
|
2650 McCormick Drive, Clearwater, FL 33759
|
First Lien Revolver
|
SOFR(Q)
|
0.75
|
%
|
5.00
|
%
|
8.79
|
%
|
8/31/2028
|
$
|
322,848
|
313,299
|
322,848
|
0.01
|
%
|
E | ||||||||||||||||||||||
|
AmeriLife Holdings, LLC
|
2650 McCormick Drive, Clearwater, FL 33759
|
First Lien Delayed Draw Term Loan
|
SOFR(Q)
|
0.75
|
%
|
5.00
|
%
|
6.67
|
%
|
8/31/2029
|
$
|
921,627
|
910,113
|
921,627
|
0.04
|
%
|
E | ||||||||||||||||||||||
|
Amynta Agency Borrower Inc. (Mayfield)
|
909 3rd Avenue, 33rd Floor, New York, NY 10022
|
First Lien Term Loan
|
SOFR(M)
|
—
|
2.75
|
%
|
8.67
|
%
|
12/29/2031
|
$
|
4,312,013
|
4,316,591
|
4,326,825
|
0.18
|
%
|
||||||||||||||||||||||||
|
EBS Parent Holdings Inc. (The Difference Card)
|
200 Business Park, Suite 311, Armonk, NY 10504
|
First Lien Term Loan
|
SOFR(Q)
|
0.75
|
%
|
5.00
|
%
|
8.67
|
%
|
7/1/2032
|
$
|
14,565,788
|
14,430,612
|
14,420,130
|
0.58
|
%
|
E | ||||||||||||||||||||||
|
EBS Parent Holdings Inc. (The Difference Card)
|
200 Business Park, Suite 311, Armonk, NY 10504
|
First Lien Revolver
|
SOFR(Q)
|
0.75
|
%
|
5.00
|
%
|
8.67
|
%
|
7/1/2032
|
$
|
—
|
(11,265
|
)
|
(12,138
|
)
|
—
|
D/E | |||||||||||||||||||||
|
EBS Parent Holdings Inc. (The Difference Card)
|
200 Business Park, Suite 311, Armonk, NY 10504
|
First Lien Delayed Draw Term Loan
|
SOFR(Q)
|
0.75
|
%
|
5.00
|
%
|
8.17
|
%
|
7/1/2032
|
$
|
—
|
(16,897
|
)
|
(36,414
|
)
|
—
|
D/E | |||||||||||||||||||||
|
Galway Borrower LLC
|
3000 Executive Parkway, Suite 325, San Ramon, CA 94583
|
First Lien Delayed Draw Term Loan
|
SOFR(Q)
|
1.00
|
%
|
4.50
|
%
|
8.17
|
%
|
9/29/2028
|
$
|
5,227,629
|
5,178,749
|
5,227,629
|
0.21
|
%
|
E | ||||||||||||||||||||||
|
Galway Borrower LLC
|
3000 Executive Parkway, Suite 325, San Ramon, CA 94583
|
First Lien Term Loan
|
SOFR(Q)
|
—
|
4.50
|
%
|
8.22
|
%
|
9/29/2028
|
$
|
3,154,034
|
3,122,047
|
3,154,034
|
0.13
|
%
|
E | |||||||||||||||||||||||
|
Higginbotham Insurance Agency, Inc.
|
500 W 13th Street, Fort Worth, TX 76102
|
First Lien Term Loan
|
SOFR(M)
|
1.00
|
%
|
4.50
|
%
|
8.22
|
%
|
6/11/2031
|
$
|
15,352,328
|
15,352,328
|
15,352,328
|
0.62
|
%
|
E | ||||||||||||||||||||||
|
Higginbotham Insurance Agency, Inc.
|
500 W 13th Street, Fort Worth, TX 76102
|
First Lien Delayed Draw Term Loan
|
SOFR(M)
|
1.00
|
%
|
4.50
|
%
|
8.22
|
%
|
9/30/2026
|
$
|
—
|
(59,373
|
)
|
—
|
—
|
D/E | ||||||||||||||||||||||
|
Higginbotham Insurance Agency, Inc.
|
500 W 13th Street, Fort Worth, TX 76102
|
First Lien Delayed Draw Term Loan
|
SOFR(M)
|
1.00
|
%
|
4.50
|
%
|
8.82
|
%
|
12/10/2027
|
$
|
—
|
—
|
—
|
—
|
E | |||||||||||||||||||||||
|
Integrity Marketing Acquisition, LLC
|
1445 Ross Avenue, 40th Floor, Dallas, TX 75202
|
First Lien Term Loan
|
SOFR(Q)
|
0.75
|
%
|
5.00
|
%
|
8.82
|
%
|
8/25/2028
|
$
|
9,690,530
|
9,665,397
|
9,615,380
|
0.39
|
%
|
E | ||||||||||||||||||||||
|
Integrity Marketing Acquisition, LLC
|
1445 Ross Avenue, 40th Floor, Dallas, TX 75202
|
First Lien Delayed Draw Term Loan
|
SOFR(Q)
|
—
|
5.00
|
%
|
8.82
|
%
|
8/26/2033
|
$
|
—
|
(8,979
|
)
|
(21,013
|
)
|
—
|
D/E | ||||||||||||||||||||||
|
Integrity Marketing Acquisition, LLC
|
1445 Ross Avenue, 40th Floor, Dallas, TX 75202
|
First Lien Revolver
|
SOFR(Q)
|
0.75
|
%
|
5.00
|
%
|
6.78
|
%
|
8/25/2028
|
$
|
—
|
(84,775
|
)
|
(32,452
|
)
|
—
|
D/E | |||||||||||||||||||||
|
Jones Deslauriers Insurance Management Inc (Canada)
|
2375 Skymark Ave, Mississauga, ON L4W 4Y6, Canada
|
First Lien Term Loan
|
SOFR(Q)
|
—
|
3.00
|
%
|
7.42
|
%
|
12/9/2032
|
$
|
1,113,988
|
1,111,295
|
1,116,773
|
0.05
|
%
|
C | |||||||||||||||||||||||
|
Summit Acquisition Inc.
|
1 Glenlake Pkwy Ste 1075 Atlanta, GA, 30328-7267 United States
|
First Lien Term Loan
|
SOFR(M)
|
—
|
3.50
|
%
|
6.22
|
%
|
10/16/2031
|
$
|
151,620
|
151,620
|
152,947
|
0.01
|
%
|
E | |||||||||||||||||||||||
|
Sedgwick Claims Management Services, Inc. (Lightning Cayman Merger Sub, Ltd.)
|
8125 Sedgwick Way, Memphis, TN 38125, United States
|
First Lien Term Loan
|
SOFR(M)
|
—
|
2.50
|
%
|
6.42
|
%
|
7/13/2031
|
$
|
7,667,052
|
7,665,578
|
7,699,829
|
0.31
|
%
|
||||||||||||||||||||||||
|
Truist Insurance Holdings, LLC
|
550 South Caldwell St, 15th Floor, Charlotte, NC 28202, United States
|
First Lien Term Loan
|
SOFR(Q)
|
—
|
2.75
|
%
|
0.00
|
%
|
5/6/2031
|
$
|
7,663,726
|
7,678,281
|
7,686,104
|
0.31
|
%
|
||||||||||||||||||||||||
|
|
105,162,316 | 105,640,494 |
4.28 |
% |
|||||||||||||||||||||||||||||||||||
|
Internet and Catalog Retail
|
|||||||||||||||||||||||||||||||||||||||
|
Syndigo, LLC
|
141 W Jackson Blvd, Suite 1375, Chicago, IL 60604
|
First Lien Revolver
|
SOFR(Q)
|
0.75
|
%
|
5.00
|
%
|
8.82
|
%
|
9/2/2032
|
$
|
—
|
$
|
(40,084
|
)
|
$
|
(46,283
|
)
|
—
|
D/E | |||||||||||||||||||
|
Syndigo, LLC
|
141 W Jackson Blvd, Suite 1375, Chicago, IL 60604
|
First Lien Term Loan
|
SOFR(Q)
|
0.75
|
%
|
5.00
|
%
|
0.00
|
%
|
9/2/2032
|
$
|
31,304,022
|
31,005,795
|
30,959,678
|
1.25
|
%
|
E | ||||||||||||||||||||||
|
|
30,965,711
|
30,913,395
|
1.25
|
%
|
|||||||||||||||||||||||||||||||||||
|
Internet and Direct Marketing Retail
|
|||||||||||||||||||||||||||||||||||||||
|
Pug LLC
|
c/o The Corporation Trust Company, 1209 Orange Street, Wilmington, DE 19801
|
First Lien Term Loan
|
SOFR(M)
|
—
|
4.75
|
%
|
0.00
|
%
|
3/15/2030
|
$
|
3,698,286
|
3,693,285
|
3,672,860
|
0.15
|
%
|
||||||||||||||||||||||||
BlackRock Private Credit Fund
Consolidated Schedule of Investments (Continued)
December 31, 2025
|
Issuer(F)
|
Instrument
|
Ref(B)
|
Floor
|
Spread
|
Total
Coupon |
Maturity
|
Principal
|
Cost
|
Fair
Value |
% of Total
Cash and Investment |
Notes
|
|||||||||||||||||||||||
|
Debt Investments - Continued
|
||||||||||||||||||||||||||||||||||
|
Internet Software and Services
|
||||||||||||||||||||||||||||||||||
|
Bynder Bidco B.V. (Netherlands)
|
First Lien Term Loan B
|
SOFR(Q)
|
1.00
|
%
|
6.00
|
%
|
9.86
|
%
|
1/26/2029
|
$
|
2,110,569
|
$
|
2,078,217
|
$
|
2,113,064
|
0.09
|
%
|
C/E
|
||||||||||||||||
|
Bynder Bidco B.V. (Netherlands)
|
First Lien Revolver B
|
SOFR(Q)
|
1.00
|
%
|
6.00
|
%
|
9.86
|
%
|
1/26/2029
|
$
|
—
|
(723
|
)
|
—
|
—
|
C/D/E
|
||||||||||||||||||
|
Bynder Bidco, Inc. (Netherlands)
|
First Lien Term Loan A
|
SOFR(Q)
|
1.00
|
%
|
6.00
|
%
|
9.86
|
%
|
1/26/2029
|
$
|
582,226
|
573,301
|
582,914
|
0.02
|
%
|
C/E
|
||||||||||||||||||
|
Bynder Bidco, Inc. (Netherlands)
|
First Lien Revolver A
|
SOFR(Q)
|
1.00
|
%
|
6.00
|
%
|
9.86
|
%
|
1/26/2029
|
$
|
—
|
(2,624
|
)
|
—
|
—
|
C/D/E
|
||||||||||||||||||
|
Civicplus LLC
|
First Lien Term Loan
|
SOFR(Q)
|
0.75
|
%
|
6.00
|
%
|
9.82
|
%
|
8/24/2030
|
$
|
10,703,864
|
10,633,609
|
10,625,758
|
0.43
|
%
|
E
|
||||||||||||||||||
|
Civicplus LLC
|
First Lien Revolver
|
SOFR(Q)
|
0.75
|
%
|
5.50
|
%
|
9.20
|
%
|
8/24/2030
|
$
|
—
|
(4,436
|
)
|
(5,098
|
)
|
—
|
D/E
|
|||||||||||||||||
|
Civicplus LLC
|
First Lien Delayed Draw Term Loan
|
SOFR(Q)
|
0.75
|
%
|
5.50
|
%
|
9.20
|
%
|
8/24/2030
|
$
|
3,664,069
|
3,609,472
|
3,619,138
|
0.15
|
%
|
E
|
||||||||||||||||||
|
e-Discovery Acquireco, LLC (Reveal)
|
First Lien Term Loan
|
SOFR(Q)
|
1.00
|
%
|
6.25
|
%
|
10.07
|
%
|
8/23/2029
|
$
|
8,579,230
|
8,448,506
|
8,665,022
|
0.35
|
%
|
E
|
||||||||||||||||||
|
e-Discovery Acquireco, LLC (Reveal)
|
First Lien Initial Term Loan
|
SOFR(Q)
|
1.00
|
%
|
5.50
|
%
|
9.32
|
%
|
9/1/2028
|
$
|
6,640,840
|
6,640,840
|
6,592,362
|
0.27
|
%
|
E
|
||||||||||||||||||
|
e-Discovery Acquireco, LLC (Reveal)
|
First Lien Revolver
|
SOFR(Q)
|
1.00
|
%
|
6.25
|
%
|
10.07
|
%
|
8/23/2029
|
$
|
768,775
|
751,774
|
768,775
|
0.03
|
%
|
E
|
||||||||||||||||||
|
Gympass US, LLC
|
First Lien Term Loan
|
SOFR(M)
|
1.00
|
%
|
3.25% Cash + 3.25% PIK
|
10.34
|
%
|
8/29/2029
|
$
|
2,849,124
|
2,841,564
|
2,877,615
|
0.12
|
%
|
E
|
|||||||||||||||||||
|
Gympass US, LLC
|
First Lien Delayed Draw Term Loan
|
SOFR(M)
|
1.00
|
%
|
3.25% Cash + 3.25% PIK
|
10.34
|
%
|
8/29/2029
|
$
|
12,792,857
|
12,729,836
|
12,920,786
|
0.51
|
%
|
E
|
|||||||||||||||||||
|
Magenta Buyer, LLC (McAfee)
|
First Lien Term Loan
|
SOFR(M)
|
—
|
3.00
|
%
|
6.72
|
%
|
3/1/2029
|
$
|
2,282,612
|
2,279,594
|
2,114,007
|
0.09
|
%
|
||||||||||||||||||||
|
Spartan Bidco Pty Ltd (StarRez) (Australia)
|
First Lien Incremental Term Loan
|
SOFR(Q)
|
0.75
|
%
|
6.65
|
%
|
10.51
|
%
|
1/24/2028
|
$
|
10,038,061
|
9,935,064
|
10,018,186
|
0.41
|
%
|
C/E
|
||||||||||||||||||
|
Spartan Bidco Pty Ltd (StarRez) (Australia)
|
First Lien Revolver
|
SOFR(S)
|
0.75
|
%
|
6.50
|
%
|
10.23
|
%
|
1/24/2028
|
$
|
187,753
|
180,990
|
186,667
|
0.01
|
%
|
C/E
|
||||||||||||||||||
|
|
60,694,984
|
61,079,196
|
2.48
|
%
|
||||||||||||||||||||||||||||||
|
IT Services
|
||||||||||||||||||||||||||||||||||
|
Anthracite Buyer, Inc. (Coalfire)
|
First Lien Term Loan
|
SOFR(Q)
|
0.75
|
%
|
4.50
|
%
|
8.34
|
%
|
12/3/2032
|
$
|
17,151,957
|
17,067,169
|
17,066,197
|
0.68
|
%
|
E
|
||||||||||||||||||
|
Anthracite Buyer, Inc. (Coalfire)
|
First Lien Revolver
|
SOFR(Q)
|
0.75
|
%
|
4.50
|
%
|
8.34
|
%
|
12/3/2032
|
$
|
—
|
(21,197
|
)
|
(21,440
|
)
|
—
|
D/E
|
|||||||||||||||||
|
CrewLine Buyer, Inc. (New Relic)
|
First Lien Term Loan
|
SOFR(Q)
|
1.00
|
%
|
6.75
|
%
|
10.59
|
%
|
11/8/2030
|
$
|
9,559,143
|
9,393,531
|
9,520,906
|
0.39
|
%
|
E
|
||||||||||||||||||
|
CrewLine Buyer, Inc. (New Relic)
|
First Lien Revolver
|
SOFR(Q)
|
1.00
|
%
|
6.75
|
%
|
10.59
|
%
|
11/8/2030
|
$
|
—
|
(17,251
|
)
|
(3,983
|
)
|
—
|
D/E
|
|||||||||||||||||
|
Ensono Holdings, Inc.
|
First Lien Term Loan
|
SOFR(M)
|
0.75
|
%
|
4.11
|
%
|
7.83
|
%
|
5/26/2028
|
$
|
18,852,332
|
18,734,370
|
18,870,807
|
0.76
|
%
|
|||||||||||||||||||
|
Fortress Intermediate 3, Inc
|
First Lien Term Loan
|
SOFR(M)
|
—
|
3.00
|
%
|
6.78
|
%
|
6/27/2031
|
$
|
3,130,808
|
3,140,604
|
3,137,680
|
0.13
|
%
|
||||||||||||||||||||
|
Intercept Bidco, Inc.
|
First Lien Term Loan
|
SOFR(Q)
|
1.00
|
%
|
6.00
|
%
|
9.77
|
%
|
6/3/2030
|
$
|
11,229,177
|
11,063,738
|
11,094,427
|
0.45
|
%
|
E
|
||||||||||||||||||
|
Intercept Bidco, Inc.
|
First Lien Revolver
|
SOFR(Q)
|
1.00
|
%
|
6.00
|
%
|
9.77
|
%
|
6/3/2030
|
$
|
—
|
(25,452
|
)
|
(20,731
|
)
|
—
|
D/E
|
|||||||||||||||||
|
Intercept Bidco, Inc.
|
First Lien Delayed Draw Term Loan
|
SOFR(Q)
|
1.00
|
%
|
6.00
|
%
|
9.77
|
%
|
6/3/2030
|
$
|
—
|
(19,089
|
)
|
(31,096
|
)
|
—
|
D/E
|
|||||||||||||||||
|
Madison Logic Holdings, Inc.
|
First Lien Term Loan
|
SOFR(M)
|
1.00
|
%
|
4.73% Cash + 2.37% PIK
|
10.72
|
%
|
12/29/2028
|
$
|
2,274,371
|
2,241,294
|
1,976,428
|
0.08
|
%
|
E
|
|||||||||||||||||||
|
Madison Logic Holdings, Inc.
|
First Lien Revolver
|
SOFR(M)
|
1.00
|
%
|
4.73% Cash + 2.37% PIK
|
10.72
|
%
|
12/30/2027
|
$
|
—
|
(1,026
|
)
|
(11,240
|
)
|
—
|
D/E
|
||||||||||||||||||
|
Neon Maple US Debt Mergersub Inc.
|
First Lien Term Loan
|
SOFR(M)
|
—
|
2.50
|
%
|
6.22
|
%
|
11/17/2031
|
$
|
1,738,048
|
1,736,053
|
1,742,315
|
0.07
|
%
|
||||||||||||||||||||
|
Research Now Group, LLC (Dynata)
|
Second Out Term Loan
|
SOFR(Q)
|
1.00
|
%
|
5.76
|
%
|
9.64
|
%
|
10/15/2028
|
$
|
1,649,563
|
1,501,552
|
1,025,311
|
0.04
|
%
|
|||||||||||||||||||
|
Research Now Group, LLC (Dynata)
|
First Lien Term Loan
|
SOFR(Q)
|
—
|
5.26
|
%
|
9.14
|
%
|
7/15/2028
|
$
|
232,897
|
218,770
|
232,082
|
0.01
|
%
|
||||||||||||||||||||
|
Serrano Parent, LLC (Sumo Logic)
|
First Lien Term Loan
|
SOFR(Q)
|
1.00
|
%
|
6.50
|
%
|
10.36
|
%
|
5/12/2030
|
$
|
4,099,217
|
4,035,397
|
3,849,165
|
0.16
|
%
|
E
|
||||||||||||||||||
|
Serrano Parent, LLC (Sumo Logic)
|
First Lien Revolver
|
SOFR(Q)
|
1.00
|
%
|
6.50
|
%
|
10.36
|
%
|
5/12/2030
|
$
|
—
|
(6,382
|
)
|
(25,005
|
)
|
—
|
D/E
|
|||||||||||||||||
|
Trident Technologies LLC
|
First Lien Term Loan
|
SOFR(M)
|
—
|
4.50
|
%
|
8.42
|
%
|
2/6/2032
|
$
|
7,350,703
|
7,293,674
|
7,283,297
|
0.30
|
%
|
||||||||||||||||||||
|
|
76,335,755
|
75,685,120
|
3.07
|
%
|
||||||||||||||||||||||||||||||
|
Life Sciences Tools and Services
|
||||||||||||||||||||||||||||||||||
|
Alcami Corporation
|
First Lien Term Loan
|
SOFR(Q)
|
1.00
|
%
|
7.15
|
%
|
10.97
|
%
|
12/21/2028
|
$
|
968,857
|
952,064
|
968,857
|
0.04
|
%
|
E
|
||||||||||||||||||
|
Alcami Corporation
|
First Lien Delayed Draw Term Loan
|
SOFR(M)
|
1.00
|
%
|
7.10
|
%
|
10.83
|
%
|
12/21/2028
|
$
|
71,311
|
70,075
|
71,311
|
—
|
E
|
|||||||||||||||||||
BlackRock Private Credit Fund
Consolidated Schedule of Investments (Continued)
December 31, 2025
|
Issuer(F)
|
Instrument
|
Ref(B)
|
Floor
|
Spread
|
Total
Coupon |
Maturity
|
Principal
|
Cost
|
Fair
Value |
% of Total
Cash and Investment |
Notes
|
|||||||||||||||||||||||
|
Debt Investments - Continued
|
||||||||||||||||||||||||||||||||||
|
Life Sciences Tools and Services (Continued)
|
||||||||||||||||||||||||||||||||||
|
Alcami Corporation
|
First Lien Revolver
|
SOFR(M)
|
1.00
|
%
|
7.10
|
%
|
10.83
|
%
|
12/21/2028
|
$
|
28,300
|
$
|
25,993
|
$
|
28,300
|
—
|
E
|
|||||||||||||||||
|
DNAnexus, Inc
|
First Lien Delayed Draw Term Loan
|
SOFR(M)
|
3.00
|
%
|
5.25
|
%
|
8.98
|
%
|
12/18/2029
|
$
|
1,199,513
|
1,056,775
|
1,163,528
|
0.05
|
%
|
E
|
||||||||||||||||||
|
DNAnexus, Inc
|
First Lien Term Loan
|
SOFR(M)
|
3.00
|
%
|
5.25
|
%
|
8.98
|
%
|
12/20/2029
|
$
|
5,997,566
|
5,949,829
|
5,985,571
|
0.24
|
%
|
E
|
||||||||||||||||||
|
Parexel International, Inc.
|
First Lien Term Loan
|
SOFR(Q)
|
—
|
2.75
|
%
|
6.53
|
%
|
12/9/2031
|
$
|
1,450,000
|
1,458,127
|
1,456,648
|
0.06
|
%
|
||||||||||||||||||||
|
Star Parent Inc
|
First Lien Term Loan
|
SOFR(Q)
|
—
|
4.00
|
%
|
7.67
|
%
|
9/27/2030
|
$
|
2,274,213
|
2,276,858
|
2,279,455
|
0.09
|
%
|
||||||||||||||||||||
|
Sotera Health Holdings, LLC
|
First Lien Term Loan
|
SOFR(Q)
|
—
|
2.50
|
%
|
6.34
|
%
|
5/30/2031
|
$
|
2,889,682
|
2,899,316
|
2,909,563
|
0.12
|
%
|
||||||||||||||||||||
|
|
14,689,037
|
14,863,233
|
0.60
|
%
|
||||||||||||||||||||||||||||||
|
Machinery
|
||||||||||||||||||||||||||||||||||
|
AI Aqua Merger Sub, Inc. (Osmosis Buyer) (United Kingdom)
|
First Lien Term Loan
|
SOFR(Q)
|
1.00
|
%
|
3.00
|
%
|
6.85
|
%
|
7/30/2028
|
$
|
7,129,546
|
7,101,267
|
7,153,287
|
0.30
|
%
|
C
|
||||||||||||||||||
|
Coorstek Inc.
|
First Lien Term Loan
|
SOFR(Q)
|
—
|
3.00
|
%
|
6.86
|
%
|
10/28/2032
|
$
|
670,000
|
666,722
|
676,285
|
0.03
|
%
|
||||||||||||||||||||
|
Filtration Group Corporation
|
First Lien Term Loan
|
SOFR(M)
|
0.50
|
%
|
2.75
|
%
|
6.47
|
%
|
10/23/2028
|
$
|
5,400,776
|
5,421,623
|
5,436,205
|
0.22
|
%
|
|||||||||||||||||||
|
Hobbs & Associates, LLC
|
First Lien Term Loan
|
SOFR(M)
|
—
|
2.75
|
%
|
6.47
|
%
|
7/23/2031
|
$
|
2,065,643
|
2,058,618
|
2,067,905
|
0.08
|
%
|
||||||||||||||||||||
|
Hobbs & Associates, LLC
|
First Lien Delayed Draw Term Loan
|
SOFR(M)
|
—
|
2.75
|
%
|
6.47
|
%
|
7/23/2031
|
$
|
—
|
200
|
—
|
—
|
E
|
||||||||||||||||||||
|
Husky Injection Molding Systems Ltd. (Canada)
|
First Lien Term Loan
|
SOFR(M)
|
—
|
3.75
|
%
|
7.47
|
%
|
2/15/2029
|
$
|
5,213,162
|
5,223,223
|
5,259,142
|
0.21
|
%
|
C
|
|||||||||||||||||||
|
Indicor, LLC (Roper Industrial Pro)
|
First Lien Term Loan
|
SOFR(Q)
|
—
|
2.75
|
%
|
6.42
|
%
|
11/22/2029
|
$
|
3,365,634
|
3,373,403
|
3,389,816
|
0.14
|
%
|
||||||||||||||||||||
|
KKR Apple Bidco, LLC
|
First Lien Term Loan
|
SOFR(M)
|
—
|
2.50
|
%
|
6.22
|
%
|
9/23/2031
|
$
|
331,196
|
331,196
|
333,278
|
0.01
|
%
|
||||||||||||||||||||
|
Madison IAQ LLC
|
First Lien Term Loan
|
SOFR(Q)
|
—
|
2.75
|
%
|
6.64
|
%
|
11/8/2032
|
$
|
5,450,022
|
5,439,238
|
5,491,197
|
0.22
|
%
|
||||||||||||||||||||
|
TK Elevator US Newco Inc
|
First Lien Term Loan
|
SOFR(S)
|
0.50
|
%
|
2.75
|
%
|
6.95
|
%
|
4/30/2030
|
$
|
3,484,743
|
3,485,427
|
3,510,373
|
0.14
|
%
|
|||||||||||||||||||
|
|
33,100,917
|
33,317,488
|
1.35
|
%
|
||||||||||||||||||||||||||||||
|
Media
|
||||||||||||||||||||||||||||||||||
|
Kid Distro Holdings, LLC
|
First Lien Term Loan
|
SOFR(S)
|
1.00
|
%
|
5.00
|
%
|
9.20
|
%
|
10/1/2029
|
$
|
16,657,453
|
16,657,453
|
16,504,204
|
0.66
|
%
|
E
|
||||||||||||||||||
|
Kid Distro Holdings, LLC
|
First Lien Term Loan
|
SOFR(S)
|
1.00
|
%
|
5.00
|
%
|
9.20
|
%
|
10/1/2029
|
$
|
1,121,303
|
1,121,303
|
1,110,987
|
0.05
|
%
|
E
|
||||||||||||||||||
|
Kid Distro Holdings, LLC
|
First Lien Revolver
|
SOFR(S)
|
1.00
|
%
|
5.00
|
%
|
9.20
|
%
|
10/1/2029
|
$
|
—
|
—
|
(14,227
|
)
|
—
|
D/E
|
||||||||||||||||||
|
Speedster Bidco GMBH (Germany)
|
First Lien Term Loan
|
SOFR(Q)
|
—
|
5.00
|
%
|
8.69
|
%
|
12/10/2031
|
$
|
3,110,000
|
3,130,647
|
3,121,663
|
0.13
|
%
|
C
|
|||||||||||||||||||
|
Streamland Media Midco LLC
|
First Out Term Loan
|
SOFR(Q)
|
1.00
|
%
|
6.76% PIK
|
10.43
|
%
|
3/31/2029
|
$
|
1,461,957
|
1,461,957
|
1,461,957
|
0.06
|
%
|
E
|
|||||||||||||||||||
|
Streamland Media Midco LLC
|
Last Out Term Loan
|
SOFR(Q)
|
—
|
6.76% PIK
|
10.43
|
%
|
3/31/2029
|
$
|
1,331,823
|
1,263,126
|
969,567
|
0.04
|
%
|
E/G
|
||||||||||||||||||||
|
Streamland Media Midco LLC
|
First Lien Delayed Draw Term Loan
|
SOFR(Q)
|
1.00
|
%
|
6.76% PIK
|
10.43
|
%
|
3/31/2029
|
$
|
116,958
|
116,958
|
116,958
|
—
|
E
|
||||||||||||||||||||
|
Streamland Media Midco LLC
|
First Lien Revolver
|
SOFR(Q)
|
—
|
6.76% PIK
|
10.43
|
%
|
3/31/2029
|
$
|
206,470
|
206,470
|
206,470
|
0.01
|
%
|
E
|
||||||||||||||||||||
|
TL Voltron Purchaser, LLC (GES)
|
First Lien Term Loan
|
SOFR(Q)
|
1.00
|
%
|
5.25
|
%
|
9.09
|
%
|
12/31/2030
|
$
|
11,637,067
|
11,443,205
|
11,474,148
|
0.47
|
%
|
E
|
||||||||||||||||||
|
Zayo Group Holdings, Inc.
|
First Lien Term Loan
|
SOFR(M)
|
—
|
3.11
|
%
|
6.83
|
%
|
3/11/2030
|
$
|
267,470
|
265,488
|
254,583
|
0.01
|
%
|
||||||||||||||||||||
|
|
35,666,607
|
35,206,310
|
1.43
|
%
|
||||||||||||||||||||||||||||||
|
Metals and Mining
|
||||||||||||||||||||||||||||||||||
|
Grinding Media Inc. (Molycop LTD)
|
First Lien Term Loan
|
SOFR(Q)
|
0.75
|
%
|
3.50
|
%
|
7.34
|
%
|
10/21/2028
|
$
|
978,838
|
982,953
|
980,673
|
0.04
|
%
|
E
|
||||||||||||||||||
|
|
||||||||||||||||||||||||||||||||||
|
Oil, Gas and Consumable Fuels
|
||||||||||||||||||||||||||||||||||
|
Deep Blue Operating I, LLC
|
First Lien Term Loan
|
SOFR(M)
|
—
|
2.75
|
%
|
6.59
|
%
|
3/31/2029
|
$
|
1,151,000
|
1,152,661
|
1,156,513
|
0.04
|
%
|
||||||||||||||||||||
|
Palmdale Oil Company, LLC
|
First Lien Term Loan
|
SOFR(Q)
|
—
|
4.75
|
%
|
8.38
|
%
|
12/12/2031
|
$
|
763,292
|
759,492
|
759,476
|
0.03
|
%
|
E
|
|||||||||||||||||||
|
Palmdale Oil Company, LLC
|
First Lien Delayed Draw Term Loan
|
SOFR(Q)
|
—
|
4.75
|
%
|
8.38
|
%
|
12/12/2031
|
$
|
—
|
—
|
—
|
0.01
|
%
|
E
|
|||||||||||||||||||
|
Palmdale Oil Company, LLC
|
First Lien Delayed Draw Term Loan
|
SOFR(Q)
|
—
|
4.75
|
%
|
8.38
|
%
|
12/12/2031
|
$
|
—
|
—
|
—
|
—
|
E
|
||||||||||||||||||||
|
Stakeholder Midstream, LLC
|
First Lien Term Loan
|
SOFR(S)
|
—
|
4.00
|
%
|
8.04
|
%
|
8/19/2032
|
$
|
461,843
|
457,224
|
464,586
|
0.02
|
%
|
||||||||||||||||||||
|
|
2,369,377
|
2,380,575
|
0.10
|
%
|
||||||||||||||||||||||||||||||
BlackRock Private Credit Fund
Consolidated Schedule of Investments (Continued)
December 31, 2025
|
Issuer(F)
|
Instrument
|
Ref(B)
|
Floor
|
Spread
|
Total
Coupon |
Maturity
|
Principal
|
Cost
|
Fair
Value |
% of Total
Cash and Investment |
Notes
|
|||||||||||||||||||||||
|
Debt Investments - Continued
|
||||||||||||||||||||||||||||||||||
|
Paper and Forest Products
|
||||||||||||||||||||||||||||||||||
|
Alpine Acquisition Corp II (48Forty)
|
First Lien 2nd Incremental Term Loan
|
SOFR(Q)
|
1.00
|
%
|
6.15
|
%
|
9.94
|
%
|
11/30/2029
|
$
|
5,011,624
|
$
|
4,909,789
|
$
|
2,153,996
|
0.09
|
%
|
E/G
|
||||||||||||||||
|
Alpine Acquisition Corp II (48Forty)
|
First Lien Term Loan
|
SOFR(Q)
|
1.00
|
%
|
6.15
|
%
|
9.94
|
%
|
11/30/2029
|
$
|
210,389
|
206,324
|
90,425
|
—
|
E/G
|
|||||||||||||||||||
|
FSK Pallet Holding Corp. (Kamps)
|
First Lien Term Loan
|
SOFR(Q)
|
1.25
|
%
|
6.75
|
%
|
10.83
|
%
|
12/23/2026
|
$
|
1,462,677
|
1,451,859
|
1,453,164
|
0.06
|
%
|
E
|
||||||||||||||||||
|
FSK Pallet Holding Corp. (Kamps)
|
First Lien Term Loan
|
SOFR(Q)
|
1.00
|
%
|
6.40
|
%
|
10.09
|
%
|
12/23/2026
|
$
|
1,168,766
|
1,168,766
|
1,163,317
|
0.05
|
%
|
E
|
||||||||||||||||||
|
|
7,736,738
|
4,860,902
|
0.20
|
%
|
||||||||||||||||||||||||||||||
|
Professional Services
|
||||||||||||||||||||||||||||||||||
|
Allied Benefit Systems Intermediate, LLC
|
First Lien Term Loan
|
SOFR(Q)
|
0.75
|
%
|
5.00
|
%
|
8.73
|
%
|
10/31/2030
|
$
|
41,671,397
|
41,472,491
|
41,254,683
|
1.67
|
%
|
E
|
||||||||||||||||||
|
Allied Benefit Systems Intermediate, LLC
|
First Lien Delayed Draw Term Loan
|
SOFR(Q)
|
0.75
|
%
|
5.00
|
%
|
8.73
|
%
|
10/31/2030
|
$
|
—
|
—
|
(51,631
|
)
|
—
|
D/E
|
||||||||||||||||||
|
Applause App Quality, Inc.
|
First Lien Term Loan
|
SOFR(Q)
|
1.50
|
%
|
5.75
|
%
|
9.43
|
%
|
10/24/2029
|
$
|
15,007,034
|
14,778,230
|
14,931,999
|
0.61
|
%
|
E
|
||||||||||||||||||
|
Applause App Quality, Inc.
|
First Lien Revolver
|
SOFR(Q)
|
1.50
|
%
|
5.75
|
%
|
9.69
|
%
|
10/24/2029
|
$
|
300,140
|
282,404
|
292,636
|
0.01
|
%
|
E
|
||||||||||||||||||
|
Acuren Delaware Holdco Inc.
|
First Lien Term Loan
|
SOFR(M)
|
0.75
|
%
|
2.75
|
%
|
6.47
|
%
|
1/31/2030
|
$
|
171,136
|
171,136
|
172,238
|
0.01
|
%
|
|||||||||||||||||||
|
Bullhorn, Inc.
|
First Lien Delayed Draw Term Loan
|
SOFR(M)
|
—
|
5.00
|
%
|
8.72
|
%
|
9/30/2029
|
$
|
12,136,269
|
12,125,167
|
12,075,588
|
0.49
|
%
|
E
|
|||||||||||||||||||
|
Bullhorn, Inc.
|
First Lien Term Loan
|
SOFR(M)
|
1.00
|
%
|
5.00
|
%
|
8.72
|
%
|
10/1/2029
|
$
|
10,262,184
|
10,244,292
|
10,210,873
|
0.41
|
%
|
E
|
||||||||||||||||||
|
Bullhorn, Inc.
|
First Lien Delayed Draw Term Loan
|
SOFR(M)
|
1.00
|
%
|
5.00
|
%
|
8.72
|
%
|
9/30/2029
|
$
|
—
|
—
|
(5,620
|
)
|
—
|
D/E
|
||||||||||||||||||
|
Bullhorn, Inc.
|
First Lien Revolver
|
SOFR(M)
|
1.00
|
%
|
5.00
|
%
|
8.72
|
%
|
10/1/2029
|
$
|
197,141
|
195,213
|
152,784
|
0.01
|
%
|
E
|
||||||||||||||||||
|
Bullhorn, Inc.
|
First Lien Delayed Draw Term Loan
|
SOFR(M)
|
1.00
|
%
|
5.00
|
%
|
8.72
|
%
|
9/30/2029
|
$
|
1,400,965
|
1,398,570
|
1,393,960
|
0.06
|
%
|
E
|
||||||||||||||||||
|
Cherry Bekaert Advisory, LLC
|
First Lien Term Loan
|
SOFR(M)
|
0.75
|
%
|
4.50
|
%
|
8.22
|
%
|
6/28/2030
|
$
|
2,114,842
|
2,091,101
|
2,094,529
|
0.08
|
%
|
E
|
||||||||||||||||||
|
Cherry Bekaert Advisory, LLC
|
First Lien Delayed Draw Term Loan
|
SOFR(M)
|
0.75
|
%
|
4.50
|
%
|
8.22
|
%
|
6/28/2030
|
$
|
871,417
|
861,628
|
863,047
|
0.03
|
%
|
E
|
||||||||||||||||||
|
Cherry Bekaert Advisory, LLC
|
First Lien Delayed Draw Term Loan
|
SOFR(M)
|
0.75
|
%
|
4.50
|
%
|
8.22
|
%
|
6/28/2030
|
$
|
960,698
|
950,545
|
951,470
|
0.04
|
%
|
E
|
||||||||||||||||||
|
Cherry Bekaert Advisory, LLC
|
First Lien Term Loan
|
SOFR(M)
|
0.75
|
%
|
4.50
|
%
|
8.22
|
%
|
6/28/2030
|
$
|
737,825
|
730,027
|
730,738
|
0.03
|
%
|
E
|
||||||||||||||||||
|
Cherry Bekaert Advisory, LLC
|
First Lien Revolver
|
SOFR(M)
|
0.75
|
%
|
4.50
|
%
|
8.22
|
%
|
6/28/2030
|
$
|
—
|
(5,021
|
)
|
(4,296
|
)
|
—
|
D/E
|
|||||||||||||||||
|
Cherry Bekaert Advisory, LLC
|
First Lien Term Loan
|
SOFR(M)
|
0.75
|
%
|
4.50
|
%
|
8.22
|
%
|
6/28/2030
|
$
|
7,868,480
|
7,793,151
|
7,792,903
|
0.32
|
%
|
E
|
||||||||||||||||||
|
Cherry Bekaert Advisory, LLC
|
First Lien Delayed Draw Term Loan
|
SOFR(M)
|
0.75
|
%
|
4.50
|
%
|
8.22
|
%
|
6/28/2030
|
$
|
4,241,111
|
4,165,781
|
4,165,534
|
0.17
|
%
|
E
|
||||||||||||||||||
|
Chronicle Parent LLC (Lexitas)
|
First Lien Term Loan
|
SOFR(Q)
|
1.00
|
%
|
5.00
|
%
|
8.90
|
%
|
4/15/2031
|
$
|
30,633,102
|
30,363,262
|
30,663,735
|
1.24
|
%
|
E
|
||||||||||||||||||
|
Chronicle Parent LLC (Lexitas)
|
First Lien Revolver
|
SOFR(Q)
|
1.00
|
%
|
5.00
|
%
|
8.87
|
%
|
4/15/2031
|
$
|
—
|
(28,547
|
)
|
—
|
—
|
D/E
|
||||||||||||||||||
|
Chronicle Parent LLC (Lexitas)
|
First Lien Delayed Draw Term Loan
|
SOFR(Q)
|
1.00
|
%
|
5.00
|
%
|
8.87
|
%
|
4/15/2031
|
$
|
797,222
|
754,402
|
806,944
|
0.03
|
%
|
E
|
||||||||||||||||||
|
Citrin Cooperman Advisors LLC
|
First Lien Term Loan
|
SOFR(Q)
|
—
|
3.00
|
%
|
6.67
|
%
|
3/6/2032
|
$
|
4,814,692
|
4,811,784
|
4,834,745
|
0.20
|
%
|
||||||||||||||||||||
|
CoreLogic, Inc. (fka First American Corporation)
|
First Lien Term Loan
|
SOFR(M)
|
0.50
|
%
|
3.61
|
%
|
7.33
|
%
|
6/2/2028
|
$
|
7,153,055
|
7,114,789
|
7,169,292
|
0.29
|
%
|
|||||||||||||||||||
|
DTI Holdco, Inc. (Epiq)
|
First Lien Term Loan
|
SOFR(M)
|
0.75
|
%
|
4.00
|
%
|
7.72
|
%
|
4/26/2029
|
$
|
21,995,849
|
21,923,040
|
20,597,573
|
0.83
|
%
|
|||||||||||||||||||
|
Element Materials Technology Group US Holdings Inc.
|
First Lien Term Loan
|
SOFR(Q)
|
0.50
|
%
|
3.68
|
%
|
7.35
|
%
|
6/24/2029
|
$
|
1,867,430
|
1,864,930
|
1,886,104
|
0.08
|
%
|
|||||||||||||||||||
|
GI Consilio Parent LLC (Skopima Consilio Parent LLC)
|
First Lien Term Loan
|
SOFR(M)
|
0.50
|
%
|
3.75
|
%
|
7.47
|
%
|
5/12/2028
|
$
|
20,552,215
|
20,422,673
|
18,830,967
|
0.76
|
%
|
|||||||||||||||||||
|
HSI Halo Acquisitions, Inc.
|
First Lien Term Loan
|
SOFR(Q)
|
0.75
|
%
|
5.00
|
%
|
8.84
|
%
|
6/28/2031
|
$
|
6,119,117
|
6,100,467
|
6,119,117
|
0.25
|
%
|
E
|
||||||||||||||||||
|
HSI Halo Acquisitions, Inc.
|
First Lien Revolver
|
SOFR(Q)
|
0.75
|
%
|
5.00
|
%
|
8.84
|
%
|
6/28/2031
|
$
|
—
|
—
|
—
|
—
|
E
|
|||||||||||||||||||
|
HSI Halo Acquisitions, Inc.
|
First Lien Delayed Draw Term Loan
|
SOFR(Q)
|
0.75
|
%
|
5.00
|
%
|
8.84
|
%
|
6/28/2031
|
$
|
549,054
|
549,054
|
549,054
|
0.02
|
%
|
E
|
||||||||||||||||||
|
Huckabee Acquisition, LLC (MOREgroup)
|
First Lien Term Loan
|
SOFR(Q)
|
1.00
|
%
|
5.25
|
%
|
8.94
|
%
|
1/16/2030
|
$
|
4,611,775
|
4,549,667
|
4,611,775
|
0.19
|
%
|
E
|
||||||||||||||||||
|
Huckabee Acquisition, LLC (MOREgroup)
|
First Lien Delayed Draw Term Loan
|
SOFR(Q)
|
1.00
|
%
|
5.25
|
%
|
8.94
|
%
|
1/16/2030
|
$
|
—
|
(13,742
|
)
|
—
|
—
|
D/E
|
||||||||||||||||||
|
Huckabee Acquisition, LLC (MOREgroup)
|
First Lien Revolver
|
SOFR(Q)
|
1.00
|
%
|
5.25
|
%
|
8.94
|
%
|
1/16/2030
|
$
|
—
|
(8,245
|
)
|
—
|
—
|
D/E
|
||||||||||||||||||
|
ICIMS, Inc.
|
First Lien Incremental Term Loan
|
SOFR(Q)
|
0.75
|
%
|
6.25
|
%
|
10.11
|
%
|
8/18/2028
|
$
|
1,152,092
|
1,142,984
|
1,114,762
|
0.05
|
%
|
E
|
||||||||||||||||||
|
Lighthouse Parent Holdings, Inc (Aperture)
|
First Lien Term Loan
|
SOFR(Q)
|
0.75
|
%
|
4.75
|
%
|
8.65
|
%
|
12/20/2031
|
$
|
5,564,864
|
5,505,485
|
5,531,475
|
0.22
|
%
|
E
|
||||||||||||||||||
|
Lighthouse Parent Holdings, Inc (Aperture)
|
First Lien Delayed Draw Term Loan
|
SOFR(Q)
|
0.75
|
%
|
4.75
|
%
|
8.51
|
%
|
12/20/2031
|
$
|
1,007,798
|
993,330
|
991,550
|
0.04
|
%
|
E
|
||||||||||||||||||
BlackRock Private Credit Fund
Consolidated Schedule of Investments (Continued)
December 31, 2025
|
Issuer(F)
|
Company Address
|
Instrument
|
Ref(B)
|
Floor
|
Spread
|
Total
Coupon |
Maturity
|
Principal
|
Cost
|
Fair
Value |
% of Total
Cash and Investment |
Notes
|
|||||||||||||||||||
|
Debt Investments - Continued
|
|||||||||||||||||||||||||||||||
|
Professional Services (Continued)
|
|||||||||||||||||||||||||||||||
|
Lighthouse Parent Holdings, Inc (Aperture)
|
2000 E Lamar Blvd, Suite 550, Arlington, TX 76006
|
First Lien Revolver
|
SOFR(Q)
|
0.75
|
%
|
4.75
|
%
|
8.51
|
%
|
12/20/2031
|
$
|
—
|
(11,596
|
)
|
(6,511
|
)
|
—
|
D/E
|
|||||||||||||
|
OMNIA Partners, LLC
|
5001 Aspen Grove Drive, Franklin, TN 37067
|
First Lien Term Loan
|
SOFR(Q)
|
1.00
|
%
|
2.75
|
%
|
6.45
|
%
|
7/25/2030
|
$
|
1,651,160
|
1,656,312
|
1,659,713
|
0.07
|
%
|
|||||||||||||||
|
Secretariat Advisors LLC
|
1175 Peachtree Street NE, 100 Colony Square, Suite 400, Atlanta, GA 30361, United States
|
First Lien Term Loan
|
SOFR(Q)
|
—
|
4.00
|
%
|
7.67
|
%
|
2/24/2032
|
$
|
7,296,808
|
7,265,420
|
7,326,470
|
0.30
|
%
|
||||||||||||||||
|
Secretariat Advisors LLC
|
1175 Peachtree Street NE, 100 Colony Square, Suite 400, Atlanta, GA 30361, United States
|
First Lien Delayed Draw Term Loan
|
SOFR(Q)
|
—
|
4.00
|
%
|
7.67
|
%
|
2/24/2032
|
$
|
—
|
—
|
3,601
|
—
|
|||||||||||||||||
|
Vensure Employer Services, Inc.
|
2600 W Geronimo Place, Suite 100, Chandler, AZ 85224-4996, United States
|
First Lien Term Loan
|
SOFR(Q)
|
0.75
|
%
|
5.00
|
%
|
8.67
|
%
|
9/27/2031
|
$
|
15,618,411
|
15,517,365
|
15,398,847
|
0.62
|
%
|
E | ||||||||||||||
|
Vensure Employer Services, Inc.
|
2600 W Geronimo Place, Suite 100, Chandler, AZ 85224-4996, United States
|
First Lien Delayed Draw Term Loan
|
SOFR(Q)
|
0.75
|
%
|
5.00
|
%
|
8.67
|
%
|
9/19/2031
|
$
|
—
|
281
|
(3,519
|
)
|
—
|
D/E
|
||||||||||||||
|
|
227,727,830
|
225,107,129
|
9.13
|
% |
|||||||||||||||||||||||||||
|
Pharmaceuticals
|
|||||||||||||||||||||||||||||||
|
Boots Group Finco LP
|
c/o The Corporation Trust Company, 1209 Orange Street, Wilmington, DE 19801
|
First Lien Term Loan
|
SOFR(Q)
|
—
|
3.50
|
%
|
7.21
|
%
|
7/22/2032
|
$
|
2,056,000
|
2,061,125
|
2,069,703
|
0.08
|
%
|
||||||||||||||||
|
|
|||||||||||||||||||||||||||||||
|
Real Estate Management and Development
|
|||||||||||||||||||||||||||||||
|
Community Merger Sub Debt LLC (CINC Systems)
|
3055 Breckinridge Blvd, Suite 310, Duluth, GA 30096
|
First Lien Term Loan
|
SOFR(M)
|
0.75
|
%
|
5.25
|
%
|
8.97
|
%
|
1/18/2030
|
$
|
10,119,171
|
9,997,913
|
10,137,375
|
0.41
|
%
|
E | ||||||||||||||
|
Community Merger Sub Debt LLC (CINC Systems)
|
3055 Breckinridge Blvd, Suite 310, Duluth, GA 30096
|
First Lien Revolver
|
SOFR(M)
|
0.75
|
%
|
5.25
|
%
|
8.97
|
%
|
1/18/2030
|
$
|
—
|
(26,952
|
)
|
—
|
—
|
D/
|
||||||||||||||
|
|
9,970,961
|
10,137,375
|
0.41
|
% | |||||||||||||||||||||||||||
|
Road and Rail
|
|||||||||||||||||||||||||||||||
|
Motive Technologies, Inc. (Keep Truckin)
|
55 Hawthorne Street, Suite #500, San Francisco, CA 94105
|
First Lien Term Loan
|
SOFR(M)
|
1.00
|
%
|
7.36
|
%
|
11.08
|
%
|
4/8/2027
|
$
|
44,864,231
|
44,204,127
|
44,774,503
|
1.82
|
%
|
E | ||||||||||||||
|
Software
|
|||||||||||||||||||||||||||||||
|
Applied Systems, Inc.
|
320 N Sangamon St, #750, Chicago, Illinois 60607
|
First Lien Term Loan
|
SOFR(Q)
|
0.50
|
%
|
2.50
|
%
|
6.17
|
%
|
2/24/2031
|
$
|
489,434
|
489,433
|
492,774
|
0.02
|
%
|
|||||||||||||||
|
Barracuda Parent LLC
|
3175 Winchester Blvd, Campbell, CA 95008
|
First Lien Term Loan
|
SOFR(Q)
|
—
|
4.50
|
%
|
8.34
|
%
|
8/15/2029
|
$
|
671,201
|
661,134
|
549,442
|
0.02
|
%
|
||||||||||||||||
|
Bluefin Holding, LLC (Allvue)
|
396 Alhambra Circle, 11th Floor, Coral Gables, FL 33134
|
First Lien Term Loan
|
SOFR(Q)
|
1.00
|
%
|
4.25
|
%
|
7.98
|
%
|
9/12/2029
|
$
|
17,648,902
|
17,397,772
|
17,754,795
|
0.72
|
%
|
E | ||||||||||||||
|
Bluefin Holding, LLC (Allvue)
|
396 Alhambra Circle, 11th Floor, Coral Gables, FL 33134
|
First Lien Revolver
|
SOFR(Q)
|
1.00
|
%
|
4.25
|
%
|
7.98
|
%
|
9/12/2029
|
$
|
—
|
$
|
(18,333
|
)
|
$
|
—
|
—
|
D/E
|
||||||||||||
|
Boxer Parent Company, Inc.
|
c/o The Corporation Trust Company, 1209 Orange Street, Wilmington, DE 19801
|
First Lien Term Loan
|
SOFR(Q)
|
—
|
3.00
|
%
|
6.82
|
%
|
7/30/2031
|
$
|
4,863,121
|
4,871,237
|
4,856,191
|
0.20
|
%
|
||||||||||||||||
|
Cart.Com, Inc.
|
1334 Brittmoore Rd., Suite 225, Houston, TX 77043
|
First Lien Term Loan (2.5% Exit Fee)
|
SOFR(M)
|
1.50
|
%
|
7.75
|
%
|
11.47
|
%
|
5/30/2029
|
$
|
12,000,000
|
11,910,944
|
11,772,000
|
0.48
|
%
|
E/H
|
||||||||||||||
|
Cart.Com, Inc.
|
1334 Brittmoore Rd., Suite 225, Houston, TX 77043
|
First Lien Term Loan (2.5% Exit Fee)
|
SOFR(M)
|
1.50
|
%
|
7.75
|
%
|
11.47
|
%
|
5/30/2029
|
$
|
5,876,756
|
5,827,063
|
5,788,605
|
0.23
|
%
|
E/H
|
||||||||||||||
|
Central Parent, Inc.
|
11809 Domain Dr Austin, TX 78758
|
First Lien Term Loan
|
SOFR(Q)
|
—
|
3.25
|
%
|
6.92
|
%
|
7/6/2029
|
$
|
980,094
|
968,930
|
833,364
|
0.03
|
%
|
||||||||||||||||
|
Clever Devices Ltd.
|
300 Crossways Park Drive, Woodbury, NY 11797
|
First Lien Term Loan
|
SOFR(M)
|
1.00
|
%
|
6.00
|
%
|
9.72
|
%
|
6/12/2030
|
$
|
2,192,902
|
2,152,292
|
2,162,201
|
0.09
|
%
|
E | ||||||||||||||
|
Clever Devices Ltd.
|
300 Crossways Park Drive, Woodbury, NY 11797
|
First Lien Revolver
|
SOFR(M)
|
1.00
|
%
|
6.00
|
%
|
9.72
|
%
|
6/12/2030
|
$
|
494,733
|
477,554
|
481,746
|
0.02
|
%
|
E | ||||||||||||||
|
Cloudera, Inc.
|
5470 Great America Parkway, Santa Clara, CA 95054
|
First Lien Term Loan
|
SOFR(M)
|
0.50
|
%
|
3.85
|
%
|
7.57
|
%
|
10/8/2028
|
$
|
3,927,576
|
3,894,639
|
3,773,536
|
0.15
|
%
|
|||||||||||||||
|
Clover Holding 2, LLC (COHESITY)
|
2625 Augustine Dr., Santa Clara, CA 95054
|
First Lien Term Loan
|
SOFR(M)
|
—
|
4.00
|
%
|
7.77
|
%
|
10/31/2031
|
$
|
6,790,603
|
6,796,169
|
6,804,388
|
0.28
|
%
|
||||||||||||||||
|
Connectwise LLC
|
400 N Tampa Street, Suite 130, Tampa, FL 33602
|
First Lien Term Loan
|
SOFR(Q)
|
—
|
3.76
|
%
|
7.43
|
%
|
9/30/2028
|
$
|
1,305,465
|
1,308,773
|
1,285,074
|
0.05
|
%
|
||||||||||||||||
|
Delta Topco, Inc
|
1001 17th St, Suite 100, Denver, CO 80202
|
First Lien Term Loan
|
SOFR(Q)
|
—
|
2.75
|
%
|
6.44
|
%
|
12/24/2029
|
$
|
3,918,760
|
3,924,292
|
3,905,005
|
0.16
|
%
|
||||||||||||||||
|
Deepl Se (Germany)
|
Maarweg 165 Cologne, North Rhine-Westphalia 50825, Germany
|
First Lien Term Loan
|
SOFR(Q)
|
2.50
|
%
|
5.00
|
%
|
8.69
|
%
|
6/26/2030
|
$
|
16,895,175
|
16,677,365
|
16,658,643
|
0.68
|
%
|
C/E
|
||||||||||||||
|
Deepl Se (Germany)
|
Maarweg 165 Cologne, North Rhine-Westphalia 50825, Germany
|
First Lien Delayed Draw Term Loan
|
SOFR(Q)
|
2.50
|
%
|
5.00
|
%
|
8.69
|
%
|
6/26/2030
|
$
|
—
|
—
|
(206,966
|
)
|
-0.01
|
%
|
C/D/E
|
|||||||||||||
|
Deepl Se (Germany)
|
Maarweg 165 Cologne, North Rhine-Westphalia 50825, Germany
|
First Lien Delayed Draw Term Loan
|
SOFR(Q)
|
2.50
|
%
|
5.00
|
%
|
8.69
|
%
|
6/26/2030
|
$
|
—
|
—
|
20,832
|
—
|
C/E
|
|||||||||||||||
|
Douglas Holdings, Inc (Docupace)
|
101 Crawfords Corner Road, Suite 1324, Holmdel, NJ 07733
|
First Lien Term Loan
|
SOFR(Q)
|
1.00
|
%
|
5.75
|
%
|
9.44
|
%
|
8/27/2030
|
$
|
8,550,747
|
8,451,287
|
8,431,037
|
0.34
|
%
|
E | ||||||||||||||
|
Douglas Holdings, Inc (Docupace)
|
101 Crawfords Corner Road, Suite 1324, Holmdel, NJ 07733
|
First Lien Delayed Draw Term Loan B
|
SOFR(Q)
|
1.00
|
%
|
5.75
|
%
|
9.44
|
%
|
8/27/2030
|
$
|
223,063
|
210,955
|
197,039
|
0.01
|
%
|
E | ||||||||||||||
|
Douglas Holdings, Inc (Docupace)
|
101 Crawfords Corner Road, Suite 1324, Holmdel, NJ 07733
|
First Lien PIK Delayed Draw Term Loan
|
SOFR(Q)
|
1.00
|
%
|
5.75
|
%
|
9.44
|
%
|
8/27/2030
|
$
|
774,174
|
774,174
|
759,392
|
0.03
|
%
|
E | ||||||||||||||
|
Douglas Holdings, Inc (Docupace)
|
101 Crawfords Corner Road, Suite 1324, Holmdel, NJ 07733
|
First Lien Revolver
|
SOFR(Q)
|
1.00
|
%
|
5.75
|
%
|
9.44
|
%
|
8/27/2030
|
$
|
—
|
(8,649
|
)
|
(10,410
|
)
|
—
|
D/E
|
|||||||||||||
|
Dragos, Inc.
|
1745 Dorsey Road, Hanover, MD 21076
|
First Lien Term Loan
|
SOFR(Q)
|
1.00
|
%
|
5.25
|
%
|
8.85
|
%
|
6/30/2030
|
$
|
29,886,213
|
29,617,630
|
29,587,351
|
1.21
|
%
|
E | ||||||||||||||
|
Dragos, Inc.
|
1745 Dorsey Road, Hanover, MD 21076
|
First Lien Delayed Draw Term Loan
|
SOFR(Q)
|
1.00
|
%
|
5.25
|
%
|
8.85
|
%
|
6/30/2030
|
$
|
—
|
(179,055
|
)
|
(199,241
|
)
|
-0.01
|
%
|
D/E
|
||||||||||||
|
Dragos, Inc.
|
1745 Dorsey Road, Hanover, MD 21076
|
First Lien Delayed Draw Term Loan
|
SOFR(Q)
|
1.00
|
%
|
5.25
|
%
|
8.85
|
%
|
6/30/2030
|
$
|
—
|
—
|
(73,152
|
)
|
—
|
D/E
|
||||||||||||||
|
Dawn Bidco, LLC
|
3311 East Old Shakopee Road, Minneapolis, MN 55425
|
First Lien Term Loan
|
SOFR(Q)
|
—
|
3.00
|
%
|
6.66
|
%
|
10/7/2032
|
$
|
2,083,000
|
2,078,012
|
2,079,292
|
0.08
|
%
|
||||||||||||||||
BlackRock Private Credit Fund
Consolidated Schedule of Investments (Continued)
December 31, 2025
|
Issuer(F)
|
|
Company Address
|
Instrument
|
Ref(B)
|
Floor
|
Spread
|
Total
Coupon
|
Maturity
|
Principal
|
Cost
|
Fair
Value
|
% of Total
Cash and
Investment
|
Notes
|
||||||||||||||||||
|
Debt Investments - Continued
|
|||||||||||||||||||||||||||||||
|
Software (Continued)
|
|
|
|
|
|||||||||||||||||||||||||||
|
Darktrace Finco US LLC
|
1601 Willow Road, Menlo Park, CA 94025 |
First Lien Term Loan
|
SOFR(Q)
|
—
|
3.25
|
%
|
7.19
|
%
|
10/9/2031
|
$ | 384,033 | 383,329 | 385,921 | 0.02 | % | ||||||||||||||||
|
Emburse Inc.
|
633 W 5th Street, Suite 650, Los Angeles, CA 90071
|
First Lien Term Loan
|
SOFR(Q)
|
0.75
|
%
|
4.25
|
%
|
7.92
|
%
|
4/10/2032
|
$ | 26,049,261 | 25,989,690 | 26,492,098 |
1.07
|
%
|
E |
||||||||||||||
|
Emburse Inc.
|
633 W 5th Street, Suite 650, Los Angeles, CA 90071
|
First Lien Revolver
|
SOFR(Q)
|
0.75
|
%
|
4.25
|
%
|
7.92
|
%
|
5/28/2032
|
$ | — | (5,319 | ) | — |
—
|
D/E
|
||||||||||||||
|
Emburse Inc.
|
633 W 5th Street, Suite 650, Los Angeles, CA 90071
|
First Lien Delayed Draw Term Loan
|
SOFR(Q)
|
0.75
|
%
|
4.25
|
%
|
7.92
|
%
|
5/28/2032
|
$ | — | (10,638 | ) | 79,078 | — |
D/E
|
||||||||||||||
|
Epicor Software Corporation (fka Eagle Parent Inc.)
|
807 Las Cimas Pkwy, Suite 400, Austin, TX 78746
|
First Lien Term Loan
|
SOFR(M)
|
0.75
|
%
|
2.50
|
%
|
6.22
|
%
|
5/30/2031
|
$ | 6,780,761 | 6,759,900 | 6,810,596 |
0.28
|
%
|
|||||||||||||||
|
Flexport Capital, LLC
|
760 Market Street, 8th Floor, San Francisco, CA 94102
|
First Lien Term Loan
|
SOFR(M)
|
2.00
|
%
|
5.50
|
%
|
9.25
|
%
|
6/30/2029
|
$
|
25,317,664
|
$
|
25,095,107
|
$
|
25,140,440
|
1.02
|
%
|
E | ||||||||||||
|
Flexport Capital, LLC
|
760 Market Street, 8th Floor, San Francisco, CA 94102
|
First Lien Delayed Draw Term Loan
|
SOFR(M)
|
2.00
|
%
|
5.50
|
%
|
9.25
|
%
|
6/30/2029
|
$
|
—
|
(170,175
|
)
|
(135,524
|
)
|
-0.01
|
%
|
D/E
|
||||||||||||
|
Fusion Risk Management, Inc.
|
2 North Riverside Plaza, Suite 1000, Chicago, IL 60606
|
First Lien Term Loan
|
SOFR(Q)
|
1.00
|
%
|
6.00
|
%
|
9.82
|
%
|
5/22/2029
|
$
|
4,036,148
|
3,997,679
|
4,052,293
|
0.16
|
%
|
E |
||||||||||||||
|
Fusion Risk Management, Inc.
|
2 North Riverside Plaza, Suite 1000, Chicago, IL 60606
|
First Lien Revolver
|
SOFR(M)
|
1.00
|
%
|
6.00
|
%
|
9.72
|
%
|
5/22/2029
|
$
|
122,027
|
114,837
|
122,027
|
—
|
E |
|||||||||||||||
|
FirstUp, Inc
|
123 Mission Street, 25th Floor, San Francisco, CA 94105
|
First Lien Term Loan
|
SOFR(Q)
|
1.00
|
%
|
6.25
|
%
|
9.92
|
%
|
7/13/2027
|
$
|
9,817,959
|
9,754,457
|
9,759,051
|
0.40
|
%
|
E | ||||||||||||||
|
FirstUp, Inc
|
123 Mission Street, 25th Floor, San Francisco, CA 94105
|
First Lien Term Loan
|
SOFR(Q)
|
1.00
|
%
|
6.25
|
%
|
9.92
|
%
|
7/13/2027
|
$
|
1,009,278
|
1,002,750
|
1,003,222
|
0.04
|
%
|
E | ||||||||||||||
|
FirstUp, Inc
|
123 Mission Street, 25th Floor, San Francisco, CA 94105
|
First Lien Revolver
|
SOFR(Q)
|
1.00
|
%
|
6.25
|
%
|
9.92
|
%
|
7/13/2027
|
$
|
—
|
(5,876
|
)
|
(5,451
|
)
|
—
|
D/E
|
|||||||||||||
|
Finastra USA Inc.
|
10800 Parkridge Boulevard, Suite 400, Reston, VA 20191
|
First Lien Term Loan
|
SOFR(Q)
|
—
|
4.00
|
%
|
7.72
|
%
|
7/30/2032
|
$
|
2,097,000
|
2,076,684
|
2,056,769
|
0.08
|
%
|
||||||||||||||||
|
Freedom Bidco Limited (Ireland)
|
6th Floor, 2 Grand Canal Square, Dublin 2, Ireland
|
First Lien Delayed Draw Term Loan
|
SOFR(Q)
|
0.75
|
%
|
6.28
|
%
|
10.12
|
%
|
12/31/2028
|
$
|
20,829,384
|
20,589,601
|
20,589,575
|
0.83
|
%
|
C/E
|
||||||||||||||
|
GTY Technology Holdings Inc.
|
1155 Perimeter Center West, Suite 500, Sandy Springs, GA 30338
|
First Lien Term Loan
|
SOFR(Q)
|
1.00
|
%
|
2.50% Cash +4.13% PIK
|
10.30
|
%
|
7/9/2029
|
$
|
3,821,002
|
3,781,306
|
3,773,515
|
0.15
|
%
|
E | |||||||||||||||
|
GTY Technology Holdings Inc.
|
1155 Perimeter Center West, Suite 500, Sandy Springs, GA 30338
|
First Lien Delayed Draw Term Loan
|
SOFR(Q)
|
1.00
|
%
|
2.50% Cash +4.13% PIK
|
10.30
|
%
|
7/9/2029
|
$
|
1,306,234
|
1,294,733
|
1,290,000
|
0.05
|
%
|
E | |||||||||||||||
|
GTY Technology Holdings Inc.
|
1155 Perimeter Center West, Suite 500, Sandy Springs, GA 30338
|
First Lien Delayed Draw Term Loan
|
SOFR(Q)
|
0.75
|
%
|
2.50% Cash +4.13% PIK
|
10.30
|
%
|
7/9/2029
|
$
|
1,134,951
|
1,121,283
|
1,120,846
|
0.05
|
%
|
E | |||||||||||||||
|
GTY Technology Holdings Inc.
|
1155 Perimeter Center West, Suite 500, Sandy Springs, GA 30338
|
First Lien Revolver
|
SOFR(Q)
|
1.00
|
%
|
2.50% Cash +4.13% PIK
|
10.30
|
%
|
7/9/2029
|
$
|
—
|
(12,269
|
)
|
(13,125
|
)
|
—
|
D/E
|
||||||||||||||
|
Guardian US Holdco LLC
|
c/o The Corporation Trust Company, 1209 Orange Street, Wilmington, DE 19801
|
First Lien Term Loan
|
SOFR(Q)
|
0.50
|
%
|
3.50
|
%
|
7.17
|
%
|
1/31/2030
|
$
|
2,289,084
|
2,288,260
|
2,295,757
|
0.09
|
%
|
|||||||||||||||
|
G-3 Apollo Acquisition Corp (Appriss Retail)
|
220 Progress, Suite 175, Irvine, CA 92618
|
First Lien Term Loan
|
SOFR(Q)
|
1.00
|
%
|
5.00
|
%
|
8.74
|
%
|
3/10/2031
|
$
|
13,326,632
|
13,153,830
|
13,313,305
|
0.54
|
%
|
E | ||||||||||||||
|
G-3 Apollo Acquisition Corp (Appriss Retail)
|
220 Progress, Suite 175, Irvine, CA 92618
|
First Lien Delayed Draw Term Loan
|
SOFR(Q)
|
1.00
|
%
|
5.00
|
%
|
8.69
|
%
|
3/10/2031
|
$
|
—
|
(27,911
|
)
|
(2,870
|
)
|
—
|
D/E
|
|||||||||||||
|
G-3 Apollo Acquisition Corp (Appriss Retail)
|
220 Progress, Suite 175, Irvine, CA 92618
|
First Lien Revolver
|
SOFR(Q)
|
1.00
|
%
|
5.00
|
%
|
8.69
|
%
|
3/10/2031
|
$
|
287,006
|
249,791
|
284,136
|
0.01
|
%
|
E | ||||||||||||||
|
Genesys Cloud Services Inc.
|
1302 El Camino Real, Suite 300, Menlo Park, CA 94025
|
First Lien Term Loan
|
SOFR(M)
|
—
|
2.50
|
%
|
6.22
|
%
|
1/23/2032
|
$
|
2,047,631
|
2,038,638
|
2,046,034
|
0.08
|
%
|
||||||||||||||||
|
Honey Intermediate, Inc. (iLobby) (Canada)
|
5255 Yonge Street, Suite 1500, North York, ON M2N 6P4, Canada
|
First Lien Term Loan
|
SOFR(M)
|
1.00
|
%
|
2.88% Cash +3.38% PIK
|
9.97
|
%
|
9/30/2030
|
$
|
14,656,842
|
14,484,145
|
14,422,333
|
0.58
|
%
|
C/E
|
|||||||||||||||
|
Honey Intermediate, Inc. (iLobby) (Canada)
|
5255 Yonge Street, Suite 1500, North York, ON M2N 6P4, Canada
|
First Lien Revolver
|
SOFR(M)
|
1.00
|
%
|
2.88% Cash +3.38% PIK
|
9.97
|
%
|
9/26/2030
|
$
|
—
|
(21,007
|
)
|
(29,958
|
)
|
—
|
C/D/E
|
||||||||||||||
|
Hyphen Solutions, LLC
|
1507 LBJ Freeway, Suite 300, Dallas, TX 75234
|
First Lien Delayed Draw Term Loan
|
SOFR(M)
|
1.00
|
%
|
4.50
|
%
|
8.22
|
%
|
8/6/2032
|
$
|
—
|
(15,115
|
)
|
—
|
—
|
D/E
|
||||||||||||||
|
Hyphen Solutions, LLC
|
1507 LBJ Freeway, Suite 300, Dallas, TX 75234
|
First Lien Revolver
|
SOFR(M)
|
1.00
|
%
|
4.50
|
%
|
8.22
|
%
|
8/6/2032
|
$
|
—
|
(18,138
|
)
|
—
|
—
|
D/E
|
||||||||||||||
|
Hyphen Solutions, LLC
|
1507 LBJ Freeway, Suite 300, Dallas, TX 75234
|
First Lien Term Loan
|
SOFR(M)
|
1.00
|
%
|
4.50
|
%
|
8.22
|
%
|
8/6/2032
|
$
|
34,655,092
|
34,491,845
|
34,655,092
|
1.42
|
%
|
E | ||||||||||||||
|
JOBVITE, Inc. (Employ, Inc.)
|
1730 Blake Street, Suite #445, Denver, CO, 80202
|
First Lien Last Out Term Loan
|
SOFR(Q)
|
0.75
|
%
|
7.50
|
%
|
11.37
|
%
|
8/5/2028
|
$
|
2,321,515
|
2,295,910
|
2,165,904
|
0.09
|
%
|
E | ||||||||||||||
|
IQN Holding Corporation (Beeline)
|
5011 Gate Parkway Building 100, Suite 250, Jacksonville, FL 32256
|
First Lien Delayed Draw Term Loan
|
SOFR(Q)
|
0.75
|
%
|
2.63% Cash +3.13% PIK
|
9.42
|
%
|
5/2/2029
|
$
|
38,464,385
|
38,145,879
|
38,129,745
|
1.56
|
%
|
E | |||||||||||||||
|
IVXS UK Limited (ComplyAdvantage) (United Kingdom)
|
86-90 Paul Street, London, EC2A 4NE, United Kingdom
|
First Lien Term Loan (4.5% Exit Fee)
|
SOFR(Q)
|
4.00
|
% |
5.75
|
% |
9.75
|
% |
5/19/2029
|
$
|
9,466,533
|
$
|
9,385,993
|
9,450,440
|
0.38
|
C/E/H
|
||||||||||||||
|
IVXS UK Limited (ComplyAdvantage) (United Kingdom)
|
86-90 Paul Street, London, EC2A 4NE, United Kingdom
|
First Lien Delayed Draw Term Loan (4.5% Exit Fee)
|
SOFR(Q)
|
4.00
|
% |
5.75
|
% |
9.75
|
% |
5/19/2029
|
$ | — |
(26,847
|
) |
(5,364
|
) | — |
C/D/E/H
|
|||||||||||||
|
ION Platform Finance US Inc.
|
1345 Ave of the Americas, New York, NY 10105
|
First Lien Term Loan
|
SOFR(Q)
|
—
|
3.75
|
% |
7.42
|
% |
9/30/2032
|
$
|
1,702,000
|
1,679,204
|
1,602,314
|
0.06
|
% | ||||||||||||||||
|
Kaseya, Inc.
|
333 SE 2nd Ave., 35th Floor, Miami, FL 33131
|
First Lien Term Loan
|
SOFR(M)
|
—
|
3.00
|
% |
6.72
|
% |
3/20/2032
|
$
|
2,475,595
|
2,474,995
|
2,480,695
|
0.10
|
% | ||||||||||||||||
|
Logicmonitor, Inc
|
98 San Jacinto Blvd, Suite 1300, Austin, TX 78701
|
First Lien Term Loan
|
SOFR(Q)
|
0.75
|
% |
5.50
|
% |
9.34
|
% |
11/19/2031
|
$
|
36,628,138
|
36,287,873
|
36,188,600
|
1.48
|
% | E | ||||||||||||||
|
Logicmonitor, Inc
|
98 San Jacinto Blvd, Suite 1300, Austin, TX 78701
|
First Lien Revolver
|
SOFR(Q)
|
0.75
|
% |
5.50
|
% |
9.34
|
% |
11/19/2031
|
$
|
—
|
(15,614
|
) |
(22,278
|
) |
—
|
D/E | |||||||||||||
|
Logicmonitor, Inc
|
98 San Jacinto Blvd, Suite 1300, Austin, TX 78701
|
First Lien Delayed Draw Term Loan
|
SOFR(Q)
|
0.75
|
% |
5.50
|
% |
9.34
|
% |
10/7/2032
|
$
|
—
|
(40,379
|
) |
(130,656
|
) |
-0.01
|
% | D/E | ||||||||||||
|
MH Sub I, LLC (Micro Holding Corp.)
|
909 N Pacific Coast Highway, 11th floor, El Segundo, CA 90245
|
First Lien Term Loan
|
SOFR(M)
|
—
|
4.25
|
% | 7.97 | % |
12/11/2031
|
$
|
2,392,390
|
2,377,074
|
2,058,580
|
0.08
|
% | ||||||||||||||||
|
MH Sub I, LLC (Micro Holding Corp.)
|
909 N Pacific Coast Highway, 11th floor, El Segundo, CA 90245
|
First Lien 2023 Incremental Term Loan
|
SOFR(Q)
|
1.00
|
% |
4.25
|
% |
7.97
|
% |
5/3/2028
|
$
|
2,159,635
|
2,158,392
|
2,014,400
|
0.08
|
% | |||||||||||||||
|
Mitchell International Inc
|
9771 Clairemont Mesa Blvd, Suite A, San Diego, CA 92124
|
First Lien Term Loan
|
SOFR(M)
|
0.50
|
% |
3.25
|
% |
6.97
|
% |
6/17/2031
|
$
|
3,049,177
|
3,040,693
|
3,062,914
|
0.12
|
% | |||||||||||||||
|
Planview Parent, Inc.
|
12301 Research Blvd, Bldg V, Suite 400, Austin, TX 78759
|
First Lien Term Loan
|
SOFR(Q)
|
—
|
3.50
|
% |
7.17
|
% |
12/17/2027
|
$
|
3,262,299
|
3,251,543
|
3,139,457
|
0.13
|
% | ||||||||||||||||
|
Project Boost Purchaser, LLC (JD Power, AutoData Inc)
|
320 East Big Beaver Road, Troy, MI 48083
|
First Lien Term Loan
|
SOFR(Q)
|
—
|
2.75
|
% |
6.42
|
% |
7/2/2031
|
$
|
4,833,200
|
4,835,604
|
4,850,720
|
0.20
|
% | ||||||||||||||||
BlackRock Private Credit Fund
Consolidated Schedule of Investments (Continued)
December 31, 2025
|
Issuer(F)
|
Company Address
|
Instrument
|
Ref(B)
|
Floor
|
Spread
|
Total
Coupon |
Maturity
|
Principal
|
Cost
|
Fair
Value |
% of Total
Cash and Investment |
Notes
|
||||||||||||||||||
|
Debt Investments - Continued
|
||||||||||||||||||||||||||||||
|
Software (Continued)
|
||||||||||||||||||||||||||||||
|
Ping Identity Holding Corp
|
1001 17th Street, Suite 100, Denver, CO 80202
|
First Lien Term Loan
|
SOFR(Q)
|
—
|
2.75
|
%
|
6.59
|
%
|
11/5/2032
|
$
|
1,657,000
|
1,661,442
|
1,663,214
|
0.07
|
%
|
|||||||||||||||
|
Proofpoint, Inc.
|
925 W Maude Ave, Sunnyvale, CA 94085
|
First Lien Term Loan
|
SOFR(Q)
|
—
|
3.00
|
%
|
6.67
|
%
|
8/21/2028
|
$
|
5,062,196
|
5,052,025
|
5,096,644
|
0.21
|
%
|
|||||||||||||||
|
Pyramid Analytics BV (Netherlands)
|
Jollemanhof 22, 1019 GW Amsterdam, Netherlands
|
First Lien Delayed Draw Term Loan
|
SOFR(Q)
|
4.25
|
%
|
6.50
|
%
|
10.75
|
%
|
5/14/2029
|
$
|
722,984
|
714,145
|
771,527
|
0.03
|
%
|
C/E
|
|||||||||||||
|
Qlik Technologies Inc. (Project Alpha)
|
150 North Radnor Chester Road, Radnor Township, PA 19087
|
First Lien Term Loan
|
SOFR(Q)
|
—
|
3.25
|
%
|
6.92
|
%
|
10/28/2030
|
$
|
1,001,805
|
1,003,854
|
1,001,374
|
0.04
|
%
|
|||||||||||||||
|
RealPage, Inc
|
2201 Lakeside Blvd, Richardson, TX 75082
|
First Lien Term Loan
|
SOFR(Q)
|
—
|
3.75
|
%
|
7.42
|
%
|
4/22/2028
|
$
|
5,699,105
|
5,708,283
|
5,724,637
|
0.23
|
%
|
|||||||||||||||
|
Shackleton Bidco Inc. (Payworks) (Canada)
|
1700 - 360 Main Street, Winnipeg, Manitoba R3C 3Z3, Canada
|
First Lien Revolver
|
CORRA (Q)
|
0.75
|
%
|
4.50
|
%
|
6.76
|
%
|
11/5/2032
|
CAD$ -
|
(37,370
|
)
|
(37,370
|
)
|
—
|
C/D/E
|
|||||||||||||
|
Shackleton Bidco Inc. (Payworks) (Canada)
|
1700 - 360 Main Street, Winnipeg, Manitoba R3C 3Z3, Canada
|
First Lien Delayed Draw Term Loan
|
CORRA (Q)
|
0.75
|
%
|
4.50
|
%
|
6.76
|
%
|
11/5/2032
|
CAD$ -
|
(149,481
|
)
|
(149,481
|
)
|
-0.01
|
%
|
C/D/E
|
||||||||||||
|
Shackleton Bidco Inc. (Payworks) (Canada)
|
1700 - 360 Main Street, Winnipeg, Manitoba R3C 3Z3, Canada
|
First Lien Term Loan
|
CORRA (Q)
|
0.75
|
%
|
4.50
|
%
|
6.76
|
%
|
10/25/2032
|
CAD$ 43,064,004
|
30,311,270
|
31,109,089
|
1.26
|
%
|
C/E
|
||||||||||||||
|
Sophia, L.P. (Ellucian)
|
2003 Edmund Halley Dr, Reston, VA 20191-3496
|
First Lien Term Loan
|
SOFR(M)
|
0.50
|
%
|
2.75
|
%
|
6.47
|
%
|
10/7/2029
|
$
|
5,630,975
|
5,627,127
|
5,669,688
|
0.23
|
%
|
||||||||||||||
|
Thunder Purchaser, Inc. (Vector Solutions)
|
4890 W Kennedy Blvd, Suite 300, Tampa, FL 33609
|
First Lien Incremental Delayed Draw Term Loan
|
SOFR(Q)
|
1.00
|
%
|
5.40
|
%
|
9.07
|
%
|
6/30/2028
|
$
|
1,016,317
|
1,007,067
|
1,006,006
|
0.04
|
%
|
E | |||||||||||||
|
Thunder Purchaser, Inc. (Vector Solutions)
|
4890 W Kennedy Blvd, Suite 300, Tampa, FL 33609
|
First Lien Incremental Term Loan
|
SOFR(Q)
|
1.00
|
%
|
5.40
|
%
|
9.07
|
%
|
6/30/2028
|
$
|
569,137
|
565,262
|
564,817
|
0.02
|
%
|
E | |||||||||||||
|
TIBCO Software Inc.
|
3303 Hillview Avenue, Palo Alto, CA 94304
|
First Lien Term Loan
|
SOFR(M)
|
—
|
3.25
|
%
|
6.92
|
%
|
8/13/2032
|
$
|
1,754,561
|
1,750,580
|
1,758,807
|
0.07
|
%
|
|||||||||||||||
|
Trintech, Inc.
|
5600 Granite Parkway, Suite 10000, Plano, TX 75024
|
First Lien Term Loan
|
SOFR(M)
|
1.00
|
%
|
5.50
|
%
|
9.22
|
%
|
7/25/2029
|
$
|
9,218,393
|
9,054,253
|
9,214,761
|
0.37
|
%
|
E | |||||||||||||
|
Trintech, Inc.
|
5600 Granite Parkway, Suite 10000, Plano, TX 75024
|
First Lien Revolver
|
SOFR(M)
|
1.00
|
%
|
5.50
|
%
|
9.22
|
%
|
7/25/2029
|
$
|
206,737
|
$
|
193,853
|
$
|
206,452
|
0.01
|
%
|
E | |||||||||||
|
UKG Inc.
|
2250 N. Commerce Parkway, Weston, FL 33326, United States
|
First Lien Term Loan
|
SOFR(Q)
|
—
|
2.50
|
%
|
6.34
|
%
|
1/30/2031
|
$
|
1,377,103
|
1,377,007
|
1,380,140
|
0.06
|
%
|
|||||||||||||||
|
Xplor T1, LLC
|
11330 Olive Blvd., Suite 200, Creve Coeur, MO 63141, United States
|
First Lien Term Loan
|
SOFR(Q)
|
—
|
3.50
|
%
|
7.34
|
%
|
10/28/2032
|
$
|
1,450,365
|
1,447,636
|
1,453,991
|
0.06
|
%
|
E | ||||||||||||||
|
|
457,802,308
|
458,627,865
|
18.60
|
%
|
||||||||||||||||||||||||||
|
Specialty Retail
|
||||||||||||||||||||||||||||||
|
Mavis Tire Express Services Topco Corp
|
100 Hillside Ave, White Plains, NY 10603
|
First Lien Term Loan
|
SOFR(M)
|
0.75
|
%
|
3.00
|
%
|
6.72
|
%
|
5/4/2028
|
$
|
5,635,663
|
5,630,686
|
5,662,630
|
0.23
|
%
|
||||||||||||||
|
Trading Companies and Distributors
|
||||||||||||||||||||||||||||||
|
BCPE Empire Holdings, Inc.
|
4001 Kennett Pike, Suite 302, Wilmington, DE 19807
|
First Lien Term Loan
|
SOFR(M)
|
—
|
3.25
|
%
|
6.97
|
%
|
12/11/2030
|
$
|
1,207,478
|
1,204,722
|
1,196,913
|
0.05
|
%
|
|||||||||||||||
|
Flow Merger Sub Inc.
|
251 Little Falls Drive, Wilmington, DE 19808
|
First Lien Term Loan
|
SOFR(Q)
|
—
|
3.25
|
%
|
7.55
|
%
|
3/31/2028
|
$
|
52,000
|
52,000
|
52,270
|
—
|
||||||||||||||||
|
Veritiv Corp.
|
1000 Abernathy Rd Bldg 400 Ste 1700, Atlanta, GA 30328-5658, United States
|
First Lien Term Loan
|
SOFR(Q)
|
—
|
4.00
|
%
|
7.67
|
%
|
11/17/2030
|
$
|
394,491
|
392,861
|
395,006
|
0.02
|
%
|
|||||||||||||||
|
1,649,583
|
1,644,189
|
0.07
|
% |
|||||||||||||||||||||||||||
|
Textiles, Apparel and Luxury Goods
|
||||||||||||||||||||||||||||||
|
WH Borrower, LLC (WHP)
|
530 5th Avenue, New York, NY 10036, United States
|
First Lien Term Loan
|
SOFR(Q)
|
0.50
|
%
|
4.50
|
%
|
8.39
|
%
|
2/20/2032
|
$
|
26,648,628
|
26,531,577
|
26,808,919
|
1.09
|
%
|
||||||||||||||
|
Technology Hardware, Storage and Peripherals
|
||||||||||||||||||||||||||||||
|
SumUp Holdings Luxembourg S.A.R.L. (Luxembourg)
|
32-34 Great Marlborough St, London, W1F 7JB, United Kingdom
|
First Lien Delayed Draw Term Loan
|
SOFR(Q)
|
1.00
|
%
|
6.00
|
%
|
9.82
|
%
|
4/25/2031
|
$
|
12,800,000
|
12,733,172
|
12,876,800
|
0.52
|
%
|
C/E
|
|||||||||||||
|
Transportation Infrastructure
|
||||||||||||||||||||||||||||||
|
Bleriot US Bidco Inc.
|
4001 Kennett Pike, Suite 302, Wilmington, DE 19807
|
First Lien Term Loan
|
SOFR(Q)
|
—
|
2.50
|
%
|
6.17
|
%
|
10/30/2026
|
$
|
3,298,317
|
3,298,220
|
3,318,239
|
0.13
|
%
|
|||||||||||||||
|
Brown Group Holding, LLC
|
251 Little Falls Drive, Wilmington, DE 19808
|
First Lien Term Loan
|
SOFR(Q)
|
—
|
2.50
|
%
|
6.22
|
%
|
7/1/2031
|
$
|
1,236,877
|
1,236,877
|
1,244,471
|
0.05
|
%
|
|||||||||||||||
|
Brown Group Holding, LLC
|
251 Little Falls Drive, Wilmington, DE 19808
|
First Lien Term Loan
|
SOFR(Q)
|
—
|
2.75
|
%
|
6.57
|
%
|
7/2/2029
|
$
|
2,882,702
|
2,900,419
|
2,900,416
|
0.12
|
%
|
|||||||||||||||
|
7,435,516
|
7,463,126
|
0.30
|
%
|
|||||||||||||||||||||||||||
BlackRock Private Credit Fund
Consolidated Schedule of Investments (Continued)
December 31, 2025
|
Issuer(F)
|
Company Address
|
Instrument
|
Ref(B)
|
Floor
|
Spread
|
Total
Coupon |
Maturity
|
Principal
|
Cost
|
Fair
Value |
% of Total
Cash and Investment |
Notes
|
||||||||||||||||||
|
Debt Investments - Continued
|
||||||||||||||||||||||||||||||
|
Wireless Telecommunication Services
|
||||||||||||||||||||||||||||||
|
OpenMarket, Inc. (Infobip) (United Kingdom)
|
35 - 38 New Bridge Street, London EC4V 6BW, United Kingdom
|
First Lien Term Loan
|
SOFR(Q)
|
0.75
|
%
|
5.50
|
%
|
9.17
|
%
|
6/11/2029
|
$
|
43,800,168
|
43,235,290
|
43,368,561
|
1.76
|
%
|
C/E
|
|||||||||||||
|
|
||||||||||||||||||||||||||||||
|
Total Debt Investments - 142.2% of Net Assets
|
2,253,599,573
|
2,244,580,686
|
91.04
|
% |
||||||||||||||||||||||||||
|
Equity Securities
|
||||||||||||||||||||||||||||||
|
IT Services
|
||||||||||||||||||||||||||||||
|
New Insight Holdings, Inc. (Dynata)
|
55 East 52nd Street, 34th Floor New York, NY 10055
|
Common Stock
|
$
|
22,972
|
$
|
402,032
|
$
|
120,603
|
—
|
I/J
|
||||||||||||||||||||
|
Media
|
||||||||||||||||||||||||||||||
|
Streamland Media Holdings LLC
|
3900 W Alameda Ave, 10th Floor, Burbank, CA 91505
|
Common Units
|
$
|
12,363
|
645,215
|
—
|
—
|
E/I/J
|
||||||||||||||||||||||
|
Paper and Forest Products
|
||||||||||||||||||||||||||||||
|
48forty Intermediate Holdings, Inc.
|
3650 Mansell Rd, Suite 100, Alpharetta, GA 30022
|
Common Stock
|
$
|
685
|
—
|
—
|
—
|
E/I/J
|
||||||||||||||||||||||
|
|
||||||||||||||||||||||||||||||
|
Total Equity Securities - 0.0% of Net Assets
|
1,047,247
|
120,603
|
— | |||||||||||||||||||||||||||
|
|
||||||||||||||||||||||||||||||
|
Total Investments - 142.2% of Net Assets
|
2,254,646,820
|
2,244,701,289
|
91.04
|
% |
||||||||||||||||||||||||||
|
|
||||||||||||||||||||||||||||||
|
Cash and Cash Equivalents - 14.0% of Net Assets
|
221,222,080
|
8.96
|
% |
|||||||||||||||||||||||||||
|
|
||||||||||||||||||||||||||||||
|
Total Cash and Investments - 156.2% of Net Assets
|
2,465,923,369
|
100.00
|
% |
|||||||||||||||||||||||||||
BlackRock Private Credit Fund
Consolidated Schedule of Investments (Continued)
December 31, 2025
Notes to Schedule of Investments:
|
(A)
|
Debt investments include investments in bank debt that generally are bought and sold among institutional investors in transactions not subject to registration under the
Securities Act of 1933 (the “Securities Act”). Such transactions are generally subject to contractual restrictions, such as approval of the agent or borrower.
|
|
(B)
|
100.0% of the fair value of total senior secured loans in the Fund’s portfolio bear interest at a floating rate that may be determined by reference to the Secured Overnight
Financing Rate (“SOFR”), “S”, or other base rate (commonly the Federal Funds Rate or the Prime Rate), “P”. In addition, 80.0% of the fair value of such senior secured loans have floors of 0.50% to 4.25%, with a weighted
average of 0.90%. The borrower under a senior secured loan generally has the option to select from interest reset periods of one, two, three or six months and may alter that selection at the end of any reset period. The stated
interest rate represents the weighted average interest rate at December 31, 2025 of all contracts within the specified loan facility. SOFR resets monthly (M), quarterly (Q) or semiannually (S).
|
|
(C)
|
Non-U.S. company or principal place of business outside the U.S. and as a result, the investment is not a qualifying asset under Section 55(a) of the Investment Company Act
of 1940 (the “1940 Act”). Under the 1940 Act, the Fund may not acquire any non-qualifying asset unless, at the time such acquisition is made, qualifying assets represent at least 70% of the Fund's total assets.
|
|
(D)
|
Negative balances represent unfunded commitments that were acquired and/or valued at a discount.
|
|
(E)
|
Investments are considered Level 3 in accordance with ASC Topic 820 (see Note 2).
|
|
(F)
|
The Fund generally uses GICS codes to identify the industry groupings.
|
|
(G)
|
Non-accruing debt investment.
|
|
(H)
|
In addition to the stated coupon, investment has an exit fee payable upon repayment of the loan in an amount equal to the percentage of the original principal amount shown.
|
|
(I)
|
Restricted security (See Note 2).
|
|
(J)
|
Non-income producing investment.
|
|
(K)
|
Deemed an investment company under Section 3(c) of the 1940 Act and as a result, the investment is not a qualifying asset under Section 55(a) of the 1940 Act. Under the
1940 Act, the Fund may not acquire any non-qualifying asset unless, at the time such acquisition is made, qualifying assets represent at least 70% of the Fund's total assets
|
|
(L)
|
Publicly traded company with a market capitalization greater than $250 million and as a result the investment is not a qualifying asset under Section 55(a) of the 1940 Act.
Under the 1940 Act, the Company may not acquire any non-qualifying asset unless, at the time such acquisition is made, qualifying assets represent at least 70% of the Company's total assets.
|
Aggregate acquisitions and aggregate dispositions of investments totaled $1,623,125,961 and $406,092,817, respectively for the year ended December 31, 2025. Aggregate acquisitions
include investment assets received as payment in kind. Aggregate dispositions include principal paydowns on investments. The total value of restricted securities and bank debt as of December 31, 2025 was $2,244,701,289 or 91.0% of
total cash and investments of the Fund. As of December 31, 2025, approximately 10.8% of the total assets of the Fund were not qualifying assets under Section 55(a) of the 1940 Act.
See accompanying notes to the consolidated financial statements.
BlackRock Private Credit Fund
Consolidated Schedule of Investments (Continued)
December 31, 2025
|
Issuer(F)
|
Instrument
|
Ref(B)
|
Floor
|
Spread
|
Total Coupon
|
Maturity
|
Principal
|
Cost
|
Fair
Value |
% of Total Cash and Investment
|
Notes
|
||||||||||||||||||||||
|
Debt Investments(A)
|
|||||||||||||||||||||||||||||||||
|
Aerospace and Defense
|
|||||||||||||||||||||||||||||||||
|
Arcline FM Holdings, LLC (Fairbanks Morse, LLC)
|
First Lien Term Loan
|
SOFR(Q)
|
—
|
4.50
|
%
|
9.05
|
%
|
6/28/2028
|
$
|
19,830,256
|
$
|
19,684,547
|
$
|
19,974,819
|
1.85
|
%
|
|||||||||||||||||
|
Engineering Research Holding LLC (Astrion, Inc.)
|
First Lien Term Loan
|
SOFR(Q)
|
1.00
|
%
|
5.00
|
%
|
9.51
|
%
|
8/29/2031
|
$
|
23,037,731
|
22,705,627
|
22,980,137
|
2.11
|
%
|
E
|
|||||||||||||||||
|
Peraton Corp.
|
First Lien Term Loan
|
SOFR(M)
|
0.75
|
%
|
3.75
|
%
|
8.21
|
%
|
2/1/2028
|
$
|
1,352,374
|
1,332,242
|
1,261,792
|
0.12
|
%
|
||||||||||||||||||
|
Signia Aerospace LLC
|
First Lien Term Loan
|
SOFR(Q)
|
0.50
|
%
|
3.00
|
%
|
7.40
|
%
|
11/21/2031
|
$
|
1,388,260
|
1,384,807
|
1,390,870
|
0.13
|
%
|
||||||||||||||||||
|
Signia Aerospace LLC
|
First Lien Delayed Draw Term Loan
|
SOFR(Q)
|
0.50
|
%
|
3.00
|
%
|
7.40
|
%
|
11/21/2031
|
$
|
—
|
(288
|
)
|
217
|
—
|
D
|
|||||||||||||||||
|
Skydio, Inc
|
First Lien Term Loan
|
SOFR(M)
|
2.50
|
%
|
2.75% Cash + 2.75% PIK
|
10.02
|
%
|
12/4/2029
|
$
|
7,500,000
|
7,426,150
|
7,425,000
|
0.69
|
%
|
E
|
||||||||||||||||||
|
Skydio, Inc
|
First Lien Delayed Draw Term Loan B
|
SOFR(M)
|
2.50
|
%
|
2.75% Cash + 2.75% PIK
|
10.02
|
%
|
12/4/2029
|
$
|
—
|
(36,925
|
)
|
(37,500
|
)
|
—
|
D/E
|
|||||||||||||||||
|
Skydio, Inc
|
First Lien Delayed Draw Term Loan A
|
SOFR(M)
|
2.50
|
%
|
2.75% Cash + 2.75% PIK
|
10.02
|
%
|
12/4/2029
|
$
|
—
|
(36,925
|
)
|
(37,500
|
)
|
—
|
D/E
|
|||||||||||||||||
|
|
52,459,235
|
52,957,835
|
4.90
|
%
|
|||||||||||||||||||||||||||||
|
Automobiles
|
|||||||||||||||||||||||||||||||||
|
Wand Newco 3, Inc. (aka Caliber Collision)
|
First Lien Term Loan
|
SOFR(M)
|
1.00
|
%
|
3.25
|
%
|
7.61
|
%
|
1/30/2031
|
$
|
1,380,008
|
1,377,872
|
1,387,377
|
0.13
|
%
|
||||||||||||||||||
|
|
|||||||||||||||||||||||||||||||||
|
Beverages
|
|||||||||||||||||||||||||||||||||
|
Triton Water Holdings Inc
|
First Lien Term Loan
|
SOFR(Q)
|
—
|
3.51
|
%
|
7.84
|
%
|
3/31/2028
|
$
|
827,856
|
827,701
|
835,414
|
0.08
|
%
|
|||||||||||||||||||
|
|
|||||||||||||||||||||||||||||||||
|
Building Products
|
|||||||||||||||||||||||||||||||||
|
Air Distribution Technologies Inc
|
First Lien Term Loan
|
SOFR(M)
|
1.00
|
%
|
6.00
|
%
|
10.55
|
%
|
8/1/2030
|
$
|
9,721,886
|
9,541,026
|
9,605,223
|
0.89
|
%
|
E
|
|||||||||||||||||
|
Trulite Holding Corp.
|
First Lien Term Loan
|
SOFR(Q)
|
1.00
|
%
|
6.00
|
%
|
10.59
|
%
|
2/22/2030
|
$
|
10,235,988
|
10,059,052
|
10,223,193
|
0.94
|
%
|
E
|
|||||||||||||||||
|
Wilsonart LLC
|
First Lien Term Loan
|
SOFR(Q)
|
—
|
4.25
|
%
|
8.58
|
%
|
7/25/2031
|
$
|
3,307,363
|
3,270,315
|
3,319,567
|
0.31
|
%
|
|||||||||||||||||||
|
|
22,870,393
|
23,147,983
|
2.14
|
%
|
|||||||||||||||||||||||||||||
|
Capital Markets
|
|||||||||||||||||||||||||||||||||
|
BCPE Pequod Buyer Inc. (Envestnet Inc.)
|
First Lien Term Loan
|
SOFR(M)
|
—
|
3.50
|
%
|
7.86
|
%
|
9/19/2031
|
$
|
453,000
|
450,735
|
457,288
|
0.04
|
%
|
|||||||||||||||||||
|
Focus Financial Partners, LLC
|
First Lien Term Loan
|
SOFR(M)
|
—
|
3.25
|
%
|
7.61
|
%
|
9/10/2031
|
$
|
2,222,733
|
2,222,554
|
2,245,927
|
0.21
|
%
|
|||||||||||||||||||
|
Focus Financial Partners, LLC
|
First Lien Delayed Draw Term Loan
|
SOFR(M)
|
—
|
3.25
|
%
|
7.61
|
%
|
9/10/2031
|
$
|
—
|
313
|
2,491
|
—
|
||||||||||||||||||||
|
Grant Thornton Advisors LLC
|
First Lien Term Loan
|
SOFR(M)
|
—
|
3.25
|
%
|
7.61
|
%
|
6/2/2031
|
$
|
827,925
|
831,160
|
829,142
|
0.08
|
%
|
|||||||||||||||||||
|
Grant Thornton Advisors LLC
|
First Lien Term Loan
|
SOFR(M)
|
—
|
3.25
|
%
|
7.61
|
%
|
6/2/2031
|
$
|
286,474
|
286,474
|
286,895
|
0.03
|
%
|
|||||||||||||||||||
|
Grant Thornton Advisors LLC
|
First Lien Term Loan
|
SOFR(M)
|
—
|
3.25
|
%
|
7.61
|
%
|
6/2/2031
|
$
|
—
|
—
|
51
|
—
|
||||||||||||||||||||
|
Learning Care Group (US) No. 2 Inc.
|
First Lien Initial Term Loan
|
SOFR(Q)
|
0.50
|
%
|
4.00
|
%
|
8.33
|
%
|
8/11/2028
|
$
|
29,626
|
29,303
|
29,959
|
—
|
|||||||||||||||||||
|
OVG Business Services LLC (Oak View)
|
First Lien Term Loan
|
SOFR(M)
|
—
|
3.00
|
%
|
7.36
|
%
|
6/15/2031
|
$
|
498,750
|
498,145
|
500,620
|
0.05
|
%
|
|||||||||||||||||||
|
PMA Parent Holdings, LLC
|
First Lien Term Loan
|
SOFR(Q)
|
0.75
|
%
|
5.25
|
%
|
9.58
|
%
|
1/31/2031
|
$
|
8,869,062
|
8,714,989
|
8,886,800
|
0.81
|
%
|
E
|
|||||||||||||||||
|
PMA Parent Holdings, LLC
|
First Lien Revolver
|
SOFR(Q)
|
0.75
|
%
|
5.25
|
%
|
9.58
|
%
|
1/31/2031
|
$
|
—
|
(22,066
|
)
|
—
|
—
|
D/E
|
|||||||||||||||||
|
|
13,011,607
|
13,239,173
|
1.22
|
%
|
|||||||||||||||||||||||||||||
|
Chemicals
|
|||||||||||||||||||||||||||||||||
|
Advancion (f/k/a Aruba Investments Holdings, LLC)
|
First Lien Term Loan
|
SOFR(M)
|
0.75
|
%
|
4.10
|
%
|
8.46
|
%
|
11/24/2027
|
$
|
1,243,573
|
1,238,142
|
1,249,791
|
0.12
|
%
|
||||||||||||||||||
|
CP Iris Holdco I, Inc
|
First Lien Term Loan
|
SOFR(M)
|
0.50
|
%
|
3.50
|
%
|
7.86
|
%
|
9/21/2028
|
$
|
1,243,606
|
1,244,991
|
1,252,355
|
0.12
|
%
|
||||||||||||||||||
|
Discovery Purchaser Corporation
|
First Lien Term Loan
|
SOFR(Q)
|
0.50
|
%
|
4.38
|
%
|
8.95
|
%
|
10/4/2029
|
$
|
1,494,518
|
1,446,957
|
1,505,450
|
0.14
|
%
|
||||||||||||||||||
|
LSF11 A5 Holdco LLC
|
First Lien Term Loan
|
SOFR(M)
|
0.50
|
%
|
3.61
|
%
|
7.97
|
%
|
10/15/2028
|
$
|
997,436
|
998,635
|
1,004,827
|
0.09
|
%
|
||||||||||||||||||
|
Momentive Performance Materials, Inc.
|
First Lien Term Loan
|
SOFR(M)
|
—
|
4.00
|
%
|
8.36
|
%
|
3/22/2028
|
$
|
1,232,056
|
1,213,886
|
1,247,457
|
0.12
|
%
|
E
|
||||||||||||||||||
|
Olympus Water US Holding Corporation (Solenis)
|
First Lien Term Loan
|
SOFR(M)
|
0.50
|
%
|
3.00
|
%
|
7.34
|
%
|
6/9/2031
|
$
|
1,700,241
|
1,706,017
|
1,707,680
|
0.16
|
%
|
||||||||||||||||||
|
W. R. Grace Holdings LLC
|
First Lien Term Loan
|
SOFR(Q)
|
0.50
|
%
|
3.75
|
%
|
7.58
|
%
|
9/22/2028
|
$
|
2,068,474
|
2,061,088
|
2,088,642
|
0.18
|
%
|
||||||||||||||||||
|
|
9,909,716
|
10,056,202
|
0.93
|
%
|
|||||||||||||||||||||||||||||
|
Commercial Services and Supplies
|
|||||||||||||||||||||||||||||||||
|
Allied Universal Holdco LLC
|
First Lien Term Loan
|
SOFR(M)
|
0.50
|
%
|
3.85
|
%
|
8.21
|
%
|
5/12/2028
|
$
|
1,004,807
|
996,104
|
1,009,339
|
0.09
|
%
|
||||||||||||||||||
|
Apollo Group Holdco, LLC (Topsail)
|
First Lien Term Loan
|
SOFR(Q)
|
1.00
|
%
|
6.00
|
%
|
10.33
|
%
|
12/26/2030
|
$
|
16,292,109
|
15,967,158
|
15,966,267
|
1.48
|
%
|
E
|
|||||||||||||||||
BlackRock Private Credit Fund
Consolidated Schedule of Investments (Continued)
December 31, 2025
|
Issuer(F)
|
Instrument
|
Ref(B)
|
Floor
|
Spread
|
Total
Coupon
|
Maturity
|
Principal
|
Cost
|
Fair
Value |
% of Total
Cash and
Investment
|
Notes
|
||||||||||||||||||||||
|
Debt Investments - Continued
|
|||||||||||||||||||||||||||||||||
|
Commercial Services and Supplies (Continued)
|
|||||||||||||||||||||||||||||||||
|
Creative Artists Agency, LLC.
|
First Lien Term Loan
|
SOFR(M)
|
—
|
2.75
|
%
|
7.11
|
%
|
10/1/2031
|
$
|
1,490,577
|
$
|
1,484,293
|
$
|
1,499,580
|
0.14
|
%
|
|||||||||||||||||
|
Dealer Tire Financial, LLC
|
First Lien Term Loan
|
SOFR(M)
|
—
|
3.50
|
%
|
7.86
|
%
|
7/2/2031
|
$
|
2,490,008
|
2,469,138
|
2,498,574
|
0.23
|
%
|
|||||||||||||||||||
|
Ensemble RCM, LLC
|
First Lien Term Loan B
|
SOFR(Q)
|
—
|
3.00
|
%
|
7.59
|
%
|
8/3/2029
|
$
|
2,236,608
|
2,239,831
|
2,255,765
|
0.21
|
%
|
|||||||||||||||||||
|
Madison Safety & Flow LLC
|
First Lien Term Loan
|
SOFR(M)
|
—
|
3.25
|
%
|
7.61
|
%
|
9/26/2031
|
$
|
460,845
|
459,730
|
464,806
|
0.04
|
%
|
|||||||||||||||||||
|
Modigent, LLC (Pueblo)
|
First Lien Term Loan
|
SOFR(Q)
|
0.75
|
%
|
6.50
|
%
|
10.83
|
%
|
8/23/2028
|
$
|
1,430,349
|
1,408,653
|
1,411,883
|
0.13
|
%
|
E
|
|||||||||||||||||
|
Modigent, LLC (Pueblo)
|
First Lien Revolver
|
SOFR(Q)
|
0.75
|
%
|
6.50
|
%
|
10.83
|
%
|
8/23/2027
|
$
|
859,755
|
843,415
|
847,906
|
0.08
|
%
|
E
|
|||||||||||||||||
|
Modigent, LLC (Pueblo)
|
First Lien Delayed Draw Term Loan
|
SOFR(Q)
|
0.75
|
%
|
6.50
|
%
|
10.83
|
%
|
8/23/2028
|
$
|
2,465,375
|
2,370,235
|
2,364,438
|
0.22
|
%
|
E
|
|||||||||||||||||
|
Modigent, LLC (Pueblo)
|
First Lien Delayed Draw Term Loan
|
SOFR(Q)
|
0.75
|
%
|
6.50
|
%
|
10.83
|
%
|
8/23/2028
|
$
|
992,123
|
976,512
|
979,315
|
0.09
|
%
|
E
|
|||||||||||||||||
|
TA TT Buyer, LLC (TouchTunes, Octave Music)
|
First Lien Tranche B-1 Term Loan
|
SOFR(Q)
|
0.50
|
%
|
4.75
|
%
|
9.08
|
%
|
4/1/2029
|
$
|
16,887,287
|
16,890,118
|
16,959,058
|
1.57
|
%
|
||||||||||||||||||
|
|
46,105,187
|
46,256,931
|
4.28
|
%
|
|||||||||||||||||||||||||||||
|
Construction and Engineering
|
|||||||||||||||||||||||||||||||||
|
Brand safway (Brand Industrial Services)
|
First Lien Term Loan
|
SOFR(Q)
|
0.50
|
%
|
4.50
|
%
|
9.07
|
%
|
8/1/2030
|
$
|
3,391,195
|
3,384,435
|
3,306,737
|
0.31
|
%
|
||||||||||||||||||
|
Compsych Holdings Corp
|
First Lien Term Loan
|
SOFR(Q)
|
0.75
|
%
|
4.75
|
%
|
9.38
|
%
|
7/22/2031
|
$
|
13,056,670
|
12,995,550
|
13,017,500
|
1.19
|
%
|
E
|
|||||||||||||||||
|
Compsych Holdings Corp
|
First Lien Delayed Draw Term Loan
|
SOFR(Q)
|
0.75
|
%
|
4.75
|
%
|
9.38
|
%
|
7/22/2031
|
$
|
—
|
(8,748
|
)
|
(11,213
|
)
|
—
|
D/E
|
||||||||||||||||
|
Groupe Solmax Inc. (Canada), Solmax U.S. LP
|
First Lien Term Loan
|
SOFR(M)
|
1.00
|
%
|
4.86
|
%
|
9.22
|
%
|
6/27/2028
|
$
|
2,395,034
|
2,308,018
|
2,212,029
|
0.20
|
%
|
C
|
|||||||||||||||||
|
Legence Holdings LLC (Refficiency)
|
First Lien Term Loan
|
SOFR(M)
|
0.75
|
%
|
3.60
|
%
|
7.96
|
%
|
12/16/2027
|
$
|
931,387
|
930,135
|
936,510
|
0.09
|
%
|
||||||||||||||||||
|
LJ Avalon Holdings, LLC (Ardurra)
|
First Lien Term Loan
|
SOFR(Q)
|
1.00
|
%
|
5.00
|
%
|
9.53
|
%
|
2/1/2030
|
$
|
745,634
|
729,388
|
748,617
|
0.07
|
%
|
E
|
|||||||||||||||||
|
LJ Avalon Holdings, LLC (Ardurra)
|
First Lien Revolver
|
SOFR(Q)
|
1.00
|
%
|
5.00
|
%
|
9.53
|
%
|
2/1/2029
|
$
|
—
|
(2,513
|
)
|
—
|
—
|
D/E
|
|||||||||||||||||
|
LJ Avalon Holdings, LLC (Ardurra)
|
First Lien Delayed Draw Term Loan
|
SOFR(Q)
|
1.00
|
%
|
5.00
|
%
|
9.51
|
%
|
2/1/2030
|
$
|
305,228
|
298,567
|
306,449
|
0.03
|
%
|
E
|
|||||||||||||||||
|
LJ Avalon Holdings, LLC (Ardurra)
|
First Lien Delayed Draw Term Loan
|
SOFR(Q)
|
1.00
|
%
|
5.00
|
%
|
9.51
|
%
|
2/1/2030
|
$
|
—
|
(10,569
|
)
|
9,198
|
—
|
D/E
|
|||||||||||||||||
|
PlayPower, Inc
|
First Lien Term Loan
|
SOFR(Q)
|
0.75
|
%
|
5.25
|
%
|
9.58
|
%
|
8/28/2030
|
$
|
13,662,118
|
13,468,972
|
13,593,807
|
1.25
|
%
|
E
|
|||||||||||||||||
|
PlayPower, Inc
|
First Lien Revolver
|
SOFR(Q)
|
0.75
|
%
|
5.25
|
%
|
9.58
|
%
|
8/28/2030
|
$
|
—
|
(29,270
|
)
|
(27,329
|
)
|
—
|
D/E
|
||||||||||||||||
|
Titan Home Improvement, LLC (Renuity)
|
First Lien Term Loan
|
SOFR(Q)
|
1.00
|
%
|
5.75
|
%
|
10.26
|
%
|
5/31/2030
|
$
|
9,629,727
|
9,456,031
|
9,639,357
|
0.89
|
%
|
E
|
|||||||||||||||||
|
Titan Home Improvement, LLC (Renuity)
|
First Lien Revolver
|
SOFR(Q)
|
1.00
|
%
|
5.75
|
%
|
10.26
|
%
|
5/31/2030
|
$
|
—
|
(27,196
|
)
|
—
|
—
|
D/E
|
|||||||||||||||||
|
Titan Home Improvement, LLC (Renuity)
|
First Lien Delayed Draw Term Loan
|
SOFR(Q)
|
1.00
|
%
|
5.75
|
%
|
10.26
|
%
|
5/31/2030
|
$
|
—
|
(16,325
|
)
|
1,810
|
—
|
D/E
|
|||||||||||||||||
|
Vortex Companies, LLC
|
First Lien Term Loan
|
SOFR(M)
|
1.00
|
%
|
5.00
|
%
|
9.36
|
%
|
9/4/2029
|
$
|
5,022,897
|
4,948,512
|
4,972,668
|
0.46
|
%
|
E
|
|||||||||||||||||
|
Vortex Companies, LLC
|
First Lien Term Loan
|
SOFR(M)
|
1.00
|
%
|
5.00
|
%
|
9.36
|
%
|
9/4/2029
|
$
|
2,699,234
|
2,699,234
|
2,672,242
|
0.25
|
%
|
E
|
|||||||||||||||||
|
Vortex Companies, LLC
|
First Lien Term Loan
|
SOFR(M)
|
1.00
|
%
|
5.00
|
%
|
9.36
|
%
|
9/4/2029
|
$
|
953,339
|
935,769
|
943,806
|
0.09
|
%
|
E
|
|||||||||||||||||
|
Vortex Companies, LLC
|
First Lien Revolver
|
SOFR(M)
|
1.00
|
%
|
5.00
|
%
|
9.36
|
%
|
9/4/2029
|
$
|
187,537
|
157,278
|
168,522
|
0.02
|
%
|
E
|
|||||||||||||||||
|
Vortex Companies, LLC
|
First Lien Delayed Draw Term Loan
|
Prime
|
1.00
|
%
|
5.00
|
%
|
12.50
|
%
|
9/4/2029
|
$
|
3,527,190
|
3,361,890
|
3,415,570
|
0.32
|
%
|
E
|
|||||||||||||||||
|
Vortex Companies, LLC
|
First Lien Delayed Draw Term Loan
|
SOFR(M)
|
1.00
|
%
|
5.00
|
%
|
9.36
|
%
|
9/4/2029
|
$
|
2,613,625
|
2,567,493
|
2,587,489
|
0.24
|
%
|
E
|
|||||||||||||||||
|
Vortex Companies, LLC
|
First Lien Delayed Draw Term Loan
|
SOFR(M)
|
1.00
|
%
|
5.00
|
%
|
9.36
|
%
|
9/4/2029
|
$
|
617,867
|
606,474
|
611,688
|
0.06
|
%
|
E
|
|||||||||||||||||
|
|
58,753,125
|
59,105,457
|
5.47
|
%
|
|||||||||||||||||||||||||||||
|
Consumer Finance
|
|||||||||||||||||||||||||||||||||
|
Freedom Financial Network Funding, LLC
|
First Lien Term Loan
|
SOFR(S)
|
1.00
|
%
|
9.25
|
%
|
13.53
|
%
|
9/21/2027
|
$
|
2,608,485
|
2,572,925
|
2,543,273
|
0.24
|
%
|
E
|
|||||||||||||||||
|
Freedom Financial Network Funding, LLC
|
First Lien Delayed Draw Term Loan
|
SOFR(S)
|
1.00
|
%
|
9.25
|
%
|
13.66
|
%
|
9/21/2027
|
$
|
869,495
|
857,642
|
847,758
|
0.08
|
%
|
E
|
|||||||||||||||||
|
Lucky US BuyerCo, LLC (Global Payments)
|
First Lien Term Loan
|
SOFR(Q)
|
1.00
|
%
|
7.50
|
%
|
11.83
|
%
|
3/30/2029
|
$
|
3,150,649
|
3,083,709
|
3,090,031
|
0.28
|
%
|
E
|
|||||||||||||||||
|
Lucky US BuyerCo, LLC (Global Payments)
|
First Lien Revolver
|
SOFR(Q)
|
1.00
|
%
|
7.50
|
%
|
11.83
|
%
|
3/30/2029
|
$
|
245,729
|
237,000
|
237,849
|
0.02
|
%
|
E
|
|||||||||||||||||
|
|
6,751,276
|
6,718,911
|
0.62
|
%
|
|||||||||||||||||||||||||||||
|
Containers and Packaging
|
|||||||||||||||||||||||||||||||||
|
Charter Next Generation, Inc. (fka Charter NEX US, Inc.)
|
First Lien Term Loan
|
SOFR(M)
|
—
|
3.00
|
%
|
7.53
|
%
|
12/1/2030
|
$
|
5,396,046
|
5,378,790
|
5,431,903
|
0.50
|
%
|
|||||||||||||||||||
|
|
|||||||||||||||||||||||||||||||||
|
Diversified Consumer Services
|
|||||||||||||||||||||||||||||||||
|
Ascend Learning, LLC
|
First Lien Term Loan
|
SOFR(M)
|
0.50
|
%
|
3.60
|
%
|
7.96
|
%
|
12/11/2028
|
$
|
1,412,404
|
1,379,990
|
1,421,789
|
0.13
|
%
|
||||||||||||||||||
BlackRock Private Credit Fund
Consolidated Schedule of Investments (Continued)
December 31, 2025
|
Issuer(F)
|
Instrument
|
Ref(B)
|
Floor
|
Spread
|
Total
Coupon
|
Maturity
|
Principal
|
Cost
|
Fair
Value
|
% of Total
Cash and
Investment
|
Notes
|
||||||||||||||||||||||
|
Debt Investments - Continued
|
|||||||||||||||||||||||||||||||||
|
Diversified Consumer Services (Continued)
|
|||||||||||||||||||||||||||||||||
|
Fusion Holding Corp. (Finalsite)
|
First Lien Term Loan
|
SOFR(Q)
|
0.75
|
%
|
6.25
|
%
|
10.58
|
%
|
9/14/2029
|
$
|
4,455,460
|
$
|
4,388,119
|
$
|
4,379,584
|
0.41
|
%
|
E
|
|||||||||||||||
|
Fusion Holding Corp. (Finalsite)
|
First Lien Revolver
|
SOFR(Q)
|
0.75
|
%
|
6.25
|
%
|
10.58
|
%
|
9/15/2027
|
$
|
—
|
(4,514
|
)
|
(5,085
|
)
|
—
|
D/E
|
||||||||||||||||
|
|
5,763,595
|
5,796,288
|
0.54
|
%
|
|||||||||||||||||||||||||||||
|
Diversified Financial Services
|
|||||||||||||||||||||||||||||||||
|
Accordion Partners LLC
|
First Lien Term Loan
|
SOFR(Q)
|
0.75
|
%
|
5.25
|
%
|
9.58
|
%
|
11/15/2031
|
$
|
19,076,087
|
18,982,496
|
18,980,707
|
1.76
|
%
|
E
|
|||||||||||||||||
|
Accordion Partners LLC
|
First Lien Revolver
|
SOFR(Q)
|
0.75
|
%
|
5.25
|
%
|
9.58
|
%
|
11/15/2031
|
$
|
—
|
(10,399
|
)
|
(10,598
|
)
|
—
|
D/E
|
||||||||||||||||
|
Accordion Partners LLC
|
First Lien Delayed Draw Term Loan
|
SOFR(Q)
|
0.75
|
%
|
5.25
|
%
|
9.58
|
%
|
11/15/2031
|
$
|
—
|
(31,197
|
)
|
(15,897
|
)
|
—
|
D/E
|
||||||||||||||||
|
Accuserve Solutions, Inc.
|
First Lien Term Loan
|
SOFR(S)
|
1.00
|
%
|
5.25
|
%
|
10.03
|
%
|
3/15/2030
|
$
|
436,231
|
436,231
|
439,721
|
0.04
|
%
|
E
|
|||||||||||||||||
|
Accuserve Solutions, Inc.
|
First Lien Delayed Draw Term Loan
|
SOFR (Q)
|
1.00
|
%
|
5.25
|
%
|
10.03
|
%
|
3/15/2030
|
$
|
—
|
(2,101
|
)
|
3,885
|
—
|
D/E
|
|||||||||||||||||
|
Acuris Finance US, Inc.
|
First Lien Term Loan
|
SOFR(Q)
|
—
|
3.75
|
%
|
8.08
|
%
|
2/16/2028
|
$
|
602,673
|
585,494
|
607,401
|
0.06
|
%
|
|||||||||||||||||||
|
EdgeCo Buyer, Inc.
|
First Lien Term Loan B
|
SOFR(Q)
|
1.00
|
%
|
4.50
|
%
|
8.83
|
%
|
6/1/2028
|
$
|
2,554,499
|
2,529,116
|
2,529,056
|
0.23
|
%
|
E
|
|||||||||||||||||
|
EdgeCo Buyer, Inc.
|
First Lien Term Loan
|
SOFR(Q)
|
1.00
|
%
|
4.60
|
%
|
8.93
|
%
|
6/1/2026
|
$
|
1,113,943
|
1,102,973
|
1,102,848
|
0.10
|
%
|
E
|
|||||||||||||||||
|
EdgeCo Buyer, Inc.
|
First Lien Revolver
|
SOFR(Q)
|
1.00
|
%
|
4.60
|
%
|
8.93
|
%
|
6/1/2028
|
$
|
—
|
(5,819
|
)
|
(5,833
|
)
|
—
|
D/E
|
||||||||||||||||
|
EdgeCo Buyer, Inc.
|
First Lien Delayed Draw Term Loan E
|
SOFR(Q)
|
1.00
|
%
|
4.60
|
%
|
8.93
|
%
|
6/1/2028
|
$
|
—
|
(58,148
|
)
|
(58,334
|
)
|
(0.01
|
)%
|
D/E
|
|||||||||||||||
|
EdgeCo Buyer, Inc.
|
First Lien Delayed Draw Term Loan C
|
SOFR(Q)
|
1.00
|
%
|
4.50
|
%
|
8.83
|
%
|
6/1/2028
|
$
|
62,571
|
61,949
|
61,948
|
0.01
|
%
|
E
|
|||||||||||||||||
|
EdgeCo Buyer, Inc.
|
First Lien Delayed Draw Term Loan B
|
SOFR(Q)
|
1.00
|
%
|
4.50
|
%
|
8.83
|
%
|
6/1/2028
|
$
|
188,196
|
186,326
|
186,322
|
0.02
|
%
|
E
|
|||||||||||||||||
|
EdgeCo Buyer, Inc.
|
First Lien Delayed Draw Term Loan A
|
SOFR(Q)
|
1.00
|
%
|
4.50
|
%
|
8.83
|
%
|
6/1/2028
|
$
|
216,724
|
214,571
|
214,565
|
0.02
|
%
|
E
|
|||||||||||||||||
|
GC Champion Acquisition LLC (Numerix)
|
First Lien Term Loan
|
SOFR(Q)
|
1.00
|
%
|
5.25
|
%
|
9.87
|
%
|
8/21/2028
|
$
|
2,326,991
|
2,298,821
|
2,294,855
|
0.21
|
%
|
E
|
|||||||||||||||||
|
GC Champion Acquisition LLC (Numerix)
|
First Lien Incremental Term Loan
|
SOFR(Q)
|
1.00
|
%
|
5.25
|
%
|
9.87
|
%
|
8/21/2028
|
$
|
8,876,623
|
8,685,234
|
8,754,037
|
0.81
|
%
|
E
|
|||||||||||||||||
|
GC Champion Acquisition LLC (Numerix)
|
First Lien Delayed Draw Term Loan
|
SOFR(Q)
|
1.00
|
%
|
5.25
|
%
|
9.87
|
%
|
8/19/2028
|
$
|
7,806,611
|
7,650,171
|
7,647,941
|
0.71
|
%
|
E
|
|||||||||||||||||
|
GC Champion Acquisition LLC (Numerix)
|
First Lien Delayed Draw Term Loan
|
SOFR(Q)
|
1.00
|
%
|
5.25
|
%
|
9.87
|
%
|
8/21/2028
|
$
|
646,386
|
638,561
|
637,459
|
0.06
|
%
|
E
|
|||||||||||||||||
|
GC Waves Holdings, Inc. (Mercer)
|
First Lien Term Loan
|
SOFR(M)
|
0.75
|
%
|
4.85
|
%
|
9.21
|
%
|
9/30/2030
|
$
|
19,120,659
|
19,120,659
|
19,311,866
|
1.78
|
%
|
E
|
|||||||||||||||||
|
GC Waves Holdings, Inc. (Mercer)
|
First Lien Revolver
|
SOFR(M)
|
0.75
|
%
|
4.85
|
%
|
9.21
|
%
|
8/10/2029
|
$
|
—
|
—
|
—
|
—
|
E
|
||||||||||||||||||
|
Payroc, LLC
|
First Lien Term Loan
|
SOFR(M)
|
1.00
|
%
|
4.75
|
%
|
9.11
|
%
|
11/1/2027
|
$
|
7,591,707
|
7,505,408
|
7,530,973
|
0.70
|
%
|
E
|
|||||||||||||||||
|
Payroc, LLC
|
First Lien Revolver
|
SOFR(M)
|
1.00
|
%
|
4.75
|
%
|
9.11
|
%
|
11/1/2027
|
$
|
—
|
(1,903
|
)
|
(1,332
|
)
|
—
|
D/E
|
||||||||||||||||
|
Rialto Management Group, LLC
|
First Lien Term Loan
|
SOFR(M)
|
0.75
|
%
|
5.00
|
%
|
9.53
|
%
|
12/5/2030
|
$
|
11,472,352
|
11,359,042
|
11,357,628
|
1.05
|
%
|
E/K
|
|||||||||||||||||
|
Rialto Management Group, LLC
|
First Lien Revolver
|
SOFR(M)
|
0.75
|
%
|
5.00
|
%
|
9.53
|
%
|
12/5/2030
|
$
|
—
|
(3,907
|
)
|
(3,956
|
)
|
—
|
D/E/K
|
||||||||||||||||
|
SitusAMC Holdings Corporation
|
First Lien Term Loan B
|
SOFR(Q)
|
0.75
|
%
|
5.60
|
%
|
9.93
|
%
|
6/28/2025
|
$
|
7,963,710
|
7,928,268
|
8,027,420
|
0.74
|
%
|
E
|
|||||||||||||||||
|
SitusAMC Holdings Corporation
|
First Lien Term Loan
|
SOFR(Q)
|
0.75
|
%
|
5.60
|
%
|
9.93
|
%
|
11/30/2027
|
$
|
16,871,817
|
16,798,112
|
17,006,792
|
1.57
|
%
|
E
|
|||||||||||||||||
|
Wealth Enhancement Group, LLC
|
First Lien Revolver
|
SOFR(Q)
|
1.00
|
%
|
5.00
|
%
|
9.50
|
%
|
10/4/2028
|
$
|
—
|
(1,928
|
)
|
(10,309
|
)
|
—
|
D/E
|
||||||||||||||||
|
Wealth Enhancement Group, LLC
|
First Lien Delayed Draw Term Loan
|
SOFR(Q)
|
1.00
|
%
|
5.00
|
%
|
9.50
|
%
|
10/4/2028
|
$
|
14,104,849
|
14,104,849
|
13,996,524
|
1.29
|
%
|
E
|
|||||||||||||||||
|
Wealth Enhancement Group, LLC
|
First Lien Delayed Draw Term Loan
|
SOFR(Q)
|
1.00
|
%
|
5.00
|
%
|
9.41
|
%
|
10/4/2028
|
$
|
2,625,146
|
2,598,281
|
2,597,245
|
0.24
|
%
|
E
|
|||||||||||||||||
|
Wealth Enhancement Group, LLC
|
First Lien Delayed Draw Term Loan
|
SOFR(Q)
|
1.00
|
%
|
5.00
|
%
|
9.50
|
%
|
10/4/2028
|
$
|
1,094,115
|
1,094,115
|
1,085,712
|
0.10
|
%
|
E
|
|||||||||||||||||
|
Wealth Enhancement Group, LLC
|
First Lien Delayed Draw Term Loan
|
SOFR(Q)
|
1.00
|
%
|
5.00
|
%
|
9.41
|
%
|
10/2/2028
|
$
|
—
|
(32,793
|
)
|
(50,115
|
)
|
—
|
D/E
|
||||||||||||||||
|
White Cap Supply Holdings, LLC
|
First Lien Tranche B Term Loan
|
SOFR(M)
|
—
|
3.25
|
%
|
7.61
|
%
|
10/19/2029
|
$
|
3,672,241
|
3,651,189
|
3,683,864
|
0.34
|
%
|
|||||||||||||||||||
|
|
127,383,671
|
127,902,395
|
11.83
|
%
|
|||||||||||||||||||||||||||||
|
Electrical Equipment
|
|||||||||||||||||||||||||||||||||
|
Spark Buyer, LLC (Sparkstone)
|
First Lien Term Loan
|
SOFR(Q)
|
0.75
|
%
|
5.25
|
%
|
9.77
|
%
|
10/15/2031
|
$
|
11,754,008
|
11,583,078
|
11,612,960
|
1.08
|
%
|
E
|
|||||||||||||||||
|
Spark Buyer, LLC (Sparkstone)
|
First Lien Revolver
|
SOFR(Q)
|
0.75
|
%
|
5.25
|
%
|
9.77
|
%
|
10/15/2031
|
$
|
—
|
(34,186
|
)
|
(28,210
|
)
|
—
|
D/E
|
||||||||||||||||
BlackRock Private Credit Fund
Consolidated Schedule of Investments (Continued)
December 31, 2025
|
Issuer(F)
|
Instrument
|
Ref(B)
|
Floor
|
Spread
|
Total
Coupon
|
Maturity
|
Principal
|
Cost
|
Fair
Value |
% of Total
Cash and
Investment
|
Notes
|
||||||||||||||||||||||
|
Debt Investments - Continued
|
|||||||||||||||||||||||||||||||||
|
Electrical Equipment (Continued)
|
|||||||||||||||||||||||||||||||||
|
Spark Buyer, LLC (Sparkstone)
|
First Lien Delayed Draw Term Loan
|
SOFR(Q)
|
0.75
|
%
|
5.25
|
%
|
9.77
|
%
|
10/15/2031
|
$
|
—
|
$
|
(68,372
|
)
|
$
|
(56,419
|
)
|
(0.01
|
)%
|
D/E
|
|||||||||||||
|
|
11,480,520
|
11,528,331
|
1.07
|
%
|
|||||||||||||||||||||||||||||
|
Energy Equipment and Services
|
|||||||||||||||||||||||||||||||||
|
Liquid Tech Solutions Holdings, LLC (Diesel Direct)
|
First Lien Term Loan
|
SOFR(Q)
|
—
|
3.75
|
%
|
8.12
|
%
|
3/18/2028
|
$
|
13,581,250
|
13,581,250
|
13,615,203
|
1.25
|
%
|
E
|
||||||||||||||||||
|
Liquid Tech Solutions Holdings, LLC (Diesel Direct)
|
First Lien Term Loan
|
SOFR(M)
|
0.75
|
%
|
4.75
|
%
|
9.44
|
%
|
3/20/2028
|
$
|
6,418,750
|
6,328,091
|
6,434,797
|
0.60
|
%
|
E
|
|||||||||||||||||
|
|
19,909,341
|
20,050,000
|
1.85
|
%
|
|||||||||||||||||||||||||||||
|
Environmental, Maintenance and Security Services
|
|||||||||||||||||||||||||||||||||
|
TruGreen Limited Partnership
|
First Lien Term Loan
|
SOFR(M)
|
0.75
|
%
|
4.10
|
%
|
8.46
|
%
|
11/2/2027
|
$
|
475,454
|
467,898
|
464,162
|
0.04
|
%
|
||||||||||||||||||
|
|
|||||||||||||||||||||||||||||||||
|
Food Products
|
|||||||||||||||||||||||||||||||||
|
Chobani, LLC
|
First Lien Term Loan
|
SOFR(M)
|
1.00
|
%
|
3.36
|
%
|
7.72
|
%
|
10/25/2027
|
$
|
572,518
|
553,418
|
577,742
|
0.05
|
%
|
||||||||||||||||||
|
Chobani, LLC
|
First Lien Term Loan
|
SOFR(M)
|
1.00
|
%
|
3.75
|
%
|
8.11
|
%
|
10/25/2027
|
$
|
291,060
|
289,992
|
293,789
|
0.03
|
%
|
||||||||||||||||||
|
|
843,410
|
871,531
|
0.08
|
%
|
|||||||||||||||||||||||||||||
|
Health Care Equipment and Supplies
|
|||||||||||||||||||||||||||||||||
|
Chariot Buyer, LLC
|
First Lien Term Loan
|
SOFR(M)
|
0.50
|
%
|
3.25
|
%
|
7.71
|
%
|
11/3/2028
|
$
|
1,747,101
|
1,714,193
|
1,759,663
|
0.16
|
%
|
||||||||||||||||||
|
|
|||||||||||||||||||||||||||||||||
|
Healthcare Providers and Services
|
|||||||||||||||||||||||||||||||||
|
CHG Healthcare Services, Inc.
|
First Lien Term Loan
|
SOFR(Q)
|
—
|
3.00
|
%
|
7.40
|
%
|
9/29/2028
|
$
|
1,990,121
|
1,966,525
|
1,999,793
|
0.18
|
%
|
|||||||||||||||||||
|
CHG Healthcare Services, Inc.
|
First Lien Term Loan
|
SOFR(Q)
|
—
|
3.76
|
%
|
8.28
|
%
|
9/30/2028
|
$
|
388,040
|
388,040
|
391,757
|
0.04
|
%
|
|||||||||||||||||||
|
CNT Holdings I Corp.
|
First Lien Term Loan
|
SOFR(Q)
|
0.75
|
%
|
3.50
|
%
|
8.09
|
%
|
11/8/2027
|
$
|
806,850
|
803,755
|
813,131
|
0.08
|
%
|
||||||||||||||||||
|
ImageFirst Holdings, LLC
|
First Lien Term Loan
|
Prime
|
—
|
4.25
|
%
|
8.58
|
%
|
4/27/2028
|
$
|
8,246,732
|
8,130,888
|
8,267,349
|
0.77
|
%
|
E
|
||||||||||||||||||
|
Ingenovis Health, Inc.
|
First Lien Term Loan
|
SOFR(Q)
|
0.75
|
%
|
4.25
|
%
|
9.03
|
%
|
3/5/2028
|
$
|
240,591
|
237,767
|
142,951
|
0.01
|
%
|
||||||||||||||||||
|
IvyRehab Intermediate II, LLC
|
First Lien Delayed Draw Term Loan
|
SOFR(Q)
|
0.75
|
%
|
5.35
|
%
|
9.68
|
%
|
4/23/2029
|
$
|
5,425,261
|
5,226,361
|
5,288,217
|
0.49
|
%
|
E
|
|||||||||||||||||
|
Raven Acquisition Holdings LLC (R1 RCM)
|
First Lien Term Loan
|
SOFR(M)
|
—
|
3.25
|
%
|
7.61
|
%
|
11/19/2031
|
$
|
1,475,731
|
1,478,485
|
1,480,903
|
0.14
|
%
|
|||||||||||||||||||
|
Raven Acquisition Holdings LLC (R1 RCM)
|
First Lien Delayed Draw Term Loan
|
SOFR(M)
|
—
|
3.25
|
%
|
7.61
|
%
|
11/19/2031
|
$
|
—
|
195
|
370
|
—
|
||||||||||||||||||||
|
RecordXTechnologies, LLC (Ontellus)
|
First Lien Term Loan
|
SOFR(Q)
|
1.00
|
%
|
5.25
|
%
|
9.58
|
%
|
5/20/2030
|
$
|
4,328,938
|
4,292,858
|
4,350,583
|
0.40
|
%
|
E
|
|||||||||||||||||
|
U.S. Anesthesia Partners, Inc.
|
First Lien Term Loan
|
SOFR(M)
|
0.50
|
%
|
4.25
|
%
|
8.92
|
%
|
9/23/2028
|
$
|
2,430,904
|
2,379,480
|
2,422,335
|
0.22
|
%
|
||||||||||||||||||
|
|
24,904,354
|
25,157,389
|
2.33
|
%
|
|||||||||||||||||||||||||||||
|
Health Care Technology
|
|||||||||||||||||||||||||||||||||
|
Athenahealth Group Inc.
|
First Lien Term Loan
|
SOFR(M)
|
0.50
|
%
|
3.25
|
%
|
7.61
|
%
|
2/15/2029
|
$
|
4,935,187
|
4,922,934
|
4,957,223
|
0.45
|
%
|
||||||||||||||||||
|
Cotiviti Holdings, Inc
|
First Lien Term Loan
|
SOFR(M)
|
—
|
2.75
|
%
|
7.30
|
%
|
2/24/2031
|
$
|
3,456,152
|
3,465,785
|
3,479,930
|
0.32
|
%
|
|||||||||||||||||||
|
PointClickCare Technologies Inc. (Canada)
|
First Lien Term Loan
|
SOFR(Q)
|
—
|
3.25
|
%
|
7.58
|
%
|
10/16/2031
|
$
|
1,588,777
|
1,589,002
|
1,600,693
|
0.15
|
%
|
C
|
||||||||||||||||||
|
Polaris Newco, LLC
|
First Lien Term Loan
|
SOFR(Q)
|
0.50
|
%
|
4.00
|
%
|
8.85
|
%
|
6/2/2028
|
$
|
3,449,921
|
3,417,855
|
3,460,495
|
0.32
|
%
|
||||||||||||||||||
|
Press Ganey Holdings Inc
|
First Lien Term Loan
|
SOFR(M)
|
—
|
3.25
|
%
|
7.61
|
%
|
4/24/2031
|
$
|
498,750
|
499,057
|
500,777
|
0.05
|
%
|
|||||||||||||||||||
|
|
13,894,633
|
13,999,118
|
1.29
|
%
|
|||||||||||||||||||||||||||||
|
Hotels, Restaurants and Leisure
|
|||||||||||||||||||||||||||||||||
|
Fertitta Entertainment, LLC
|
First Lien Term Loan
|
SOFR(M)
|
0.50
|
%
|
3.50
|
%
|
7.86
|
%
|
1/27/2029
|
$
|
3,840,518
|
3,816,646
|
3,859,529
|
0.36
|
%
|
||||||||||||||||||
|
Great Canadian Gaming Corp. (Canada)
|
First Lien Term Loan
|
SOFR(Q)
|
—
|
4.75
|
%
|
9.09
|
%
|
11/1/2029
|
$
|
695,760
|
693,899
|
696,195
|
0.06
|
%
|
C
|
||||||||||||||||||
|
Motion Acquisition (Merlin Finco)
|
First Lien Term Loan B
|
SOFR(Q)
|
—
|
3.50
|
%
|
7.83
|
%
|
11/12/2029
|
$
|
845,755
|
849,671
|
838,177
|
0.08
|
%
|
|||||||||||||||||||
|
Scientific Games Lottery
|
First Lien Term Loan
|
SOFR(Q)
|
0.50
|
%
|
3.00
|
%
|
7.59
|
%
|
4/4/2029
|
$
|
2,068,815
|
2,067,722
|
2,076,314
|
0.19
|
%
|
||||||||||||||||||
|
Showtime Acquisition LLC (World Choice)
|
First Lien Term Loan
|
SOFR(Q)
|
—
|
4.75
|
%
|
9.24
|
%
|
8/13/2031
|
$
|
29,281,978
|
28,933,179
|
29,006,141
|
2.68
|
%
|
E
|
||||||||||||||||||
|
|
36,361,117
|
36,476,356
|
3.37
|
%
|
|||||||||||||||||||||||||||||
|
Household Durables
|
|||||||||||||||||||||||||||||||||
|
Bad Boy Mowers JV Acquisition, LLC
|
First Lien Term Loan
|
SOFR(M)
|
1.00
|
%
|
6.00
|
%
|
10.45
|
%
|
11/9/2029
|
$
|
7,434,959
|
7,283,856
|
7,472,134
|
0.69
|
%
|
E
|
|||||||||||||||||
BlackRock Private Credit Fund
Consolidated Schedule of Investments (Continued)
December 31, 2025
|
Issuer(F)
|
Instrument
|
Ref(B)
|
Floor
|
Spread
|
Total
Coupon
|
Maturity
|
Principal
|
Cost
|
Fair
Value |
% of Total
Cash and
Investment
|
Notes
|
||||||||||||||||||||||
|
Debt Investments - Continued
|
|||||||||||||||||||||||||||||||||
|
Industrial Conglomerates
|
|||||||||||||||||||||||||||||||||
|
Cube Industrials Buyer Inc. (Circor)
|
First Lien Term Loan
|
SOFR(Q)
|
—
|
3.50
|
%
|
8.13
|
%
|
10/9/2031
|
$
|
332,000
|
$
|
331,191
|
$
|
334,628
|
0.03
|
%
|
|||||||||||||||||
|
LSF12 Crown US Commercial Bidco LLC
|
First Lien Term Loan
|
SOFR(Q)
|
—
|
4.25
|
%
|
8.80
|
%
|
12/2/2031
|
$
|
597,000
|
597,641
|
597,003
|
0.06
|
%
|
|||||||||||||||||||
|
|
928,832
|
931,631
|
0.09
|
%
|
|||||||||||||||||||||||||||||
|
Insurance
|
|||||||||||||||||||||||||||||||||
|
Alera Group, Inc.
|
First Lien Term Loan
|
SOFR(M)
|
0.75
|
%
|
5.25
|
%
|
9.61
|
%
|
9/30/2028
|
$
|
271,583
|
268,237
|
271,583
|
0.03
|
%
|
E
|
|||||||||||||||||
|
Alera Group, Inc.
|
First Lien Delayed Draw Term Loan
|
SOFR(M)
|
0.75
|
%
|
5.75
|
%
|
10.09
|
%
|
11/17/2025
|
$
|
8,498,033
|
8,428,966
|
8,587,819
|
0.79
|
%
|
E
|
|||||||||||||||||
|
Alera Group, Inc.
|
First Lien Delayed Draw Term Loan
|
SOFR(M)
|
0.75
|
%
|
5.25
|
%
|
9.61
|
%
|
9/30/2028
|
$
|
544,797
|
538,085
|
544,797
|
0.05
|
%
|
E
|
|||||||||||||||||
|
Alliant Holdings Intermediate, LLC
|
First Lien Term Loan
|
SOFR(M)
|
—
|
2.75
|
%
|
7.11
|
%
|
9/19/2031
|
$
|
2,954,012
|
2,934,863
|
2,965,267
|
0.27
|
%
|
|||||||||||||||||||
|
AmeriLife Holdings, LLC
|
First Lien Term Loan
|
SOFR(S)
|
0.75
|
%
|
5.00
|
%
|
9.70
|
%
|
8/31/2029
|
$
|
14,615,944
|
14,392,901
|
14,615,944
|
1.35
|
%
|
E
|
|||||||||||||||||
|
AmeriLife Holdings, LLC
|
First Lien Revolver
|
SOFR(S)
|
0.75
|
%
|
5.00
|
%
|
9.70
|
%
|
8/31/2028
|
$
|
—
|
(4,614
|
)
|
—
|
—
|
D/E
|
|||||||||||||||||
|
AmeriLife Holdings, LLC
|
First Lien Delayed Draw Term Loan
|
SOFR(S)
|
0.75
|
%
|
5.00
|
%
|
9.70
|
%
|
8/31/2029
|
$
|
931,031
|
916,227
|
931,031
|
0.09
|
%
|
E
|
|||||||||||||||||
|
Amynta Agency Borrower Inc. (Mayfield)
|
First Lien Term Loan
|
SOFR(M)
|
—
|
3.00
|
%
|
7.34
|
%
|
12/16/2031
|
$
|
2,985,067
|
2,990,709
|
2,988,798
|
0.28
|
%
|
|||||||||||||||||||
|
AssuredPartners, Inc.
|
First Lien Term Loan
|
SOFR(M)
|
0.50
|
%
|
3.50
|
%
|
7.86
|
%
|
12/27/2031
|
$
|
5,310,819
|
5,328,231
|
5,328,238
|
0.49
|
%
|
||||||||||||||||||
|
Galway Borrower LLC
|
First Lien Term Loan
|
SOFR(Q)
|
—
|
4.50
|
%
|
8.83
|
%
|
9/29/2028
|
$
|
3,189,674
|
3,145,541
|
3,197,648
|
0.30
|
%
|
E
|
||||||||||||||||||
|
Galway Borrower LLC
|
First Lien Delayed Draw Term Loan
|
SOFR(Q)
|
1.00
|
%
|
4.50
|
%
|
8.82
|
%
|
9/29/2028
|
$
|
5,281,629
|
5,214,254
|
5,294,833
|
0.49
|
%
|
E
|
|||||||||||||||||
|
Higginbotham Insurance Agency, Inc.
|
First Lien Term Loan
|
SOFR(M)
|
1.00
|
%
|
4.50
|
%
|
8.86
|
%
|
11/25/2028
|
$
|
14,560,321
|
14,479,586
|
14,472,959
|
1.33
|
%
|
E
|
|||||||||||||||||
|
Higginbotham Insurance Agency, Inc.
|
First Lien Delayed Draw Term Loan
|
SOFR(M)
|
1.00
|
%
|
4.75
|
%
|
9.11
|
%
|
11/25/2026
|
$
|
373,653
|
362,869
|
373,653
|
0.03
|
%
|
E
|
|||||||||||||||||
|
HUB International Limited
|
First Lien Term Loan
|
SOFR(Q)
|
0.75
|
%
|
2.75
|
%
|
7.37
|
%
|
6/20/2030
|
$
|
4,478,631
|
4,485,177
|
4,511,415
|
0.42
|
%
|
||||||||||||||||||
|
Integrity Marketing Acquisition, LLC
|
First Lien Term Loan
|
SOFR(Q)
|
0.75
|
%
|
5.00
|
%
|
9.51
|
%
|
8/25/2028
|
$
|
7,973,881
|
7,928,417
|
8,005,777
|
0.74
|
%
|
E
|
|||||||||||||||||
|
Integrity Marketing Acquisition, LLC
|
First Lien Revolver
|
SOFR(Q)
|
0.75
|
%
|
5.00
|
%
|
9.51
|
%
|
8/25/2028
|
$
|
—
|
(121,196
|
)
|
—
|
—
|
D/E
|
|||||||||||||||||
|
Integrity Marketing Acquisition, LLC
|
First Lien Delayed Draw Term Loan
|
SOFR(Q)
|
0.75
|
%
|
5.00
|
%
|
9.51
|
%
|
8/25/2028
|
$
|
—
|
(29,687
|
)
|
30,747
|
—
|
D/E
|
|||||||||||||||||
|
Peter C. Foy & Associates Insurance Services, LLC (PCF Insurance)
|
First Lien Term Loan
|
SOFR(M)
|
0.75
|
%
|
6.50
|
%
|
10.86
|
%
|
7/19/2030
|
$
|
3,388,616
|
3,339,505
|
3,422,502
|
0.32
|
%
|
E
|
|||||||||||||||||
|
Peter C. Foy & Associates Insurance Services, LLC (PCF Insurance)
|
First Lien Delayed Draw Term Loan
|
SOFR(Q)
|
0.75
|
%
|
5.50
|
%
|
9.83
|
%
|
11/1/2028
|
$
|
6,262,360
|
6,196,232
|
6,246,744
|
0.58
|
%
|
E
|
|||||||||||||||||
|
RSC Acquisition, Inc. (Risk Strategies)
|
First Lien Initial Term Loan
|
SOFR(Q)
|
0.75
|
%
|
4.75
|
%
|
9.08
|
%
|
11/1/2029
|
$
|
1,626,202
|
1,626,202
|
1,628,235
|
0.15
|
%
|
||||||||||||||||||
|
RSC Acquisition, Inc. (Risk Strategies)
|
First Lien Initial Term Loan
|
SOFR(Q)
|
1.00
|
%
|
4.75
|
%
|
9.08
|
%
|
11/1/2029
|
$
|
1,100,172
|
1,100,172
|
1,101,547
|
0.10
|
%
|
||||||||||||||||||
|
RSC Acquisition, Inc. (Risk Strategies)
|
First Lien Initial Term Loan
|
SOFR(Q)
|
0.75
|
%
|
4.75
|
%
|
9.08
|
%
|
11/1/2029
|
$
|
764,696
|
764,696
|
765,652
|
0.07
|
%
|
||||||||||||||||||
|
RSC Acquisition, Inc. (Risk Strategies)
|
First Lien Delayed Draw Term Loan
|
SOFR(Q)
|
0.75
|
%
|
4.75
|
%
|
9.08
|
%
|
11/1/2029
|
$
|
656,214
|
656,214
|
656,214
|
0.06
|
%
|
E
|
|||||||||||||||||
|
RSC Acquisition, Inc. (Risk Strategies)
|
First Lien Delayed Draw Term Loan
|
SOFR(Q)
|
0.75
|
%
|
4.75
|
%
|
9.08
|
%
|
11/1/2029
|
$
|
182,652
|
182,652
|
182,880
|
0.02
|
%
|
||||||||||||||||||
|
Sedgwick Claims Management Services, Inc. (Lightning Cayman Merger Sub, Ltd.)
|
First Lien Term Loan
|
SOFR(Q)
|
—
|
3.00
|
%
|
7.59
|
%
|
7/13/2031
|
$
|
4,423,240
|
4,399,976
|
4,455,375
|
0.41
|
%
|
|||||||||||||||||||
|
Truist Insurance Holdings, LLC
|
First Lien Term Loan
|
SOFR(Q)
|
—
|
2.75
|
%
|
7.08
|
%
|
5/6/2031
|
$
|
1,483,726
|
1,488,305
|
1,490,447
|
0.14
|
%
|
|||||||||||||||||||
|
|
91,012,520
|
92,070,105
|
8.51
|
%
|
|||||||||||||||||||||||||||||
|
Internet and Catalog Retail
|
|||||||||||||||||||||||||||||||||
|
Syndigo, LLC
|
First Lien Term Loan
|
SOFR(Q)
|
0.75
|
%
|
4.76
|
%
|
9.28
|
%
|
12/14/2027
|
$
|
6,233,436
|
6,227,516
|
6,252,915
|
0.58
|
%
|
E
|
|||||||||||||||||
|
|
|||||||||||||||||||||||||||||||||
|
Internet and Direct Marketing Retail
|
|||||||||||||||||||||||||||||||||
|
Pug LLC
|
First Lien Term Loan
|
SOFR(M)
|
—
|
4.75
|
%
|
9.11
|
%
|
3/15/2030
|
$
|
2,747,463
|
$
|
2,735,065
|
$
|
2,757,766
|
0.26
|
%
|
|||||||||||||||||
|
|
|||||||||||||||||||||||||||||||||
|
Internet Software and Services
|
|||||||||||||||||||||||||||||||||
|
Bynder Bidco B.V. (Netherlands)
|
First Lien Term Loan B
|
SOFR(Q)
|
1.00
|
%
|
6.00
|
%
|
10.62
|
%
|
1/26/2029
|
$
|
2,110,569
|
$
|
2,067,684
|
$
|
2,113,693
|
0.20
|
%
|
C/E
|
|||||||||||||||
|
Bynder Bidco B.V. (Netherlands)
|
First Lien Revolver B
|
SOFR(Q)
|
1.00
|
%
|
6.00
|
%
|
10.62
|
%
|
1/26/2029
|
$
|
—
|
$
|
(958
|
)
|
$
|
—
|
—
|
C/D/E
|
|||||||||||||||
BlackRock Private Credit Fund
Consolidated Schedule of Investments (Continued)
December 31, 2025
|
Issuer(F)
|
Instrument
|
Ref(B)
|
Floor
|
Spread
|
Total Coupon
|
Maturity
|
Principal
|
Cost
|
Fair
Value |
% of Total Cash and Investment
|
Notes
|
||||||||||||||||||||||
|
Debt Investments - Continued
|
|||||||||||||||||||||||||||||||||
|
Internet Software and Services (Continued)
|
|||||||||||||||||||||||||||||||||
|
Bynder Bidco, Inc. (Netherlands)
|
First Lien Term Loan A
|
SOFR(Q)
|
1.00
|
%
|
6.00
|
%
|
10.62
|
%
|
1/26/2029
|
$
|
582,226
|
$
|
570,396
|
$
|
583,088
|
0.05
|
%
|
C/E
|
|||||||||||||||
|
Bynder Bidco, Inc. (Netherlands)
|
First Lien Revolver A
|
SOFR(Q)
|
1.00
|
%
|
6.00
|
%
|
10.62
|
%
|
1/26/2029
|
$
|
—
|
(3,478
|
)
|
—
|
—
|
C/D/E
|
|||||||||||||||||
|
e-Discovery Acquireco, LLC (Reveal)
|
First Lien Term Loan
|
SOFR(Q)
|
1.00
|
%
|
6.25
|
%
|
10.76
|
%
|
8/29/2029
|
$
|
8,579,230
|
8,412,792
|
8,750,815
|
0.81
|
%
|
E
|
|||||||||||||||||
|
e-Discovery Acquireco, LLC (Reveal)
|
First Lien Revolver
|
SOFR(Q)
|
1.00
|
%
|
6.25
|
%
|
10.76
|
%
|
8/29/2029
|
$
|
—
|
(21,646
|
)
|
—
|
—
|
D/E
|
|||||||||||||||||
|
e-Discovery Acquireco, LLC (Reveal)
|
First Lien Initial Term Loan
|
SOFR(Q)
|
1.00
|
%
|
5.50
|
%
|
10.01
|
%
|
9/1/2028
|
$
|
6,640,840
|
6,585,752
|
6,612,683
|
0.61
|
%
|
E
|
|||||||||||||||||
|
Gympass US, LLC
|
First Lien Term Loan
|
SOFR(M)
|
1.00
|
%
|
3.25% Cash + 3.25% PIK
|
10.97
|
%
|
8/29/2029
|
$
|
2,757,392
|
2,744,842
|
2,762,907
|
0.26
|
%
|
E
|
||||||||||||||||||
|
Gympass US, LLC
|
First Lien Delayed Draw Term Loan
|
SOFR(M)
|
1.00
|
%
|
3.25% Cash + 3.25% PIK
|
10.97
|
%
|
8/29/2029
|
$
|
12,376,482
|
12,271,865
|
12,401,235
|
1.14
|
%
|
E
|
||||||||||||||||||
|
Magenta Buyer, LLC (McAfee)
|
Second Lien Third Out Term Loan
|
SOFR(Q)
|
0.75
|
%
|
1.76% Cash + 5.50% PIK
|
11.85
|
%
|
7/27/2028
|
$
|
338,404
|
317,820
|
119,045
|
0.01
|
%
|
G
|
||||||||||||||||||
|
Magenta Buyer, LLC (McAfee)
|
Second Lien Second Out Term Loan
|
SOFR(Q)
|
0.75
|
%
|
1.76% Cash + 6.25% PIK
|
12.60
|
%
|
7/27/2028
|
$
|
1,073,332
|
1,039,698
|
645,786
|
0.06
|
%
|
|||||||||||||||||||
|
Magenta Buyer, LLC (McAfee)
|
First Lien Term Loan
|
SOFR(Q)
|
—
|
3.00
|
%
|
7.37
|
%
|
3/1/2029
|
$
|
4,643,769
|
4,628,527
|
4,653,637
|
0.43
|
%
|
|||||||||||||||||||
|
Magenta Buyer, LLC (McAfee)
|
First Lien Term Loan
|
SOFR(Q)
|
0.75
|
%
|
7.01
|
%
|
11.60
|
%
|
7/27/2028
|
$
|
1,393,410
|
1,349,154
|
1,288,904
|
0.12
|
%
|
||||||||||||||||||
|
Magenta Buyer, LLC (McAfee)
|
First Lien Term Loan
|
SOFR(Q)
|
0.75
|
%
|
6.25
|
%
|
10.84
|
%
|
7/27/2028
|
$
|
405,750
|
401,156
|
413,993
|
0.04
|
%
|
||||||||||||||||||
|
Oranje Holdco, Inc. (KnowBe4)
|
First Lien Term Loan
|
SOFR(Q)
|
1.00
|
%
|
7.75
|
%
|
12.32
|
%
|
2/1/2029
|
$
|
1,445,490
|
1,420,893
|
1,451,272
|
0.13
|
%
|
E
|
|||||||||||||||||
|
Oranje Holdco, Inc. (KnowBe4)
|
First Lien Revolver
|
SOFR(Q)
|
1.00
|
%
|
7.75
|
%
|
12.32
|
%
|
2/1/2029
|
$
|
—
|
(3,075
|
)
|
—
|
—
|
D/E
|
|||||||||||||||||
|
Oranje Holdco, Inc. (KnowBe4)
|
First Lien Incremental Term Loan
|
SOFR(Q)
|
1.00
|
%
|
7.25
|
%
|
11.82
|
%
|
2/1/2029
|
$
|
1,116,745
|
1,096,909
|
1,102,227
|
0.10
|
%
|
E
|
|||||||||||||||||
|
Spartan Bidco Pty Ltd (StarRez) (Australia)
|
First Lien Revolver
|
SOFR(M)
|
0.75
|
%
|
6.90
|
%
|
11.25
|
%
|
1/24/2028
|
$
|
—
|
(10,042
|
)
|
(1,393
|
)
|
—
|
C/D/E
|
||||||||||||||||
|
Spartan Bidco Pty Ltd (StarRez) (Australia)
|
First Lien Incremental Term Loan
|
SOFR(Q)
|
0.75
|
%
|
0.90% Cash + 6.25% PIK
|
11.78
|
%
|
1/24/2028
|
$
|
9,951,664
|
9,798,741
|
9,899,074
|
0.92
|
%
|
C/E
|
||||||||||||||||||
|
|
52,667,030
|
52,796,966
|
4.88
|
%
|
|||||||||||||||||||||||||||||
|
IT Services
|
|||||||||||||||||||||||||||||||||
|
Avalara, Inc.
|
First Lien Term Loan
|
SOFR(Q)
|
0.75
|
%
|
6.25
|
%
|
10.58
|
%
|
10/19/2028
|
$
|
3,776,510
|
3,716,797
|
3,804,834
|
0.35
|
%
|
E
|
|||||||||||||||||
|
Avalara, Inc.
|
First Lien Revolver
|
SOFR(Q)
|
0.75
|
%
|
6.25
|
%
|
10.58
|
%
|
10/19/2028
|
$
|
—
|
(5,971
|
)
|
—
|
—
|
D/E
|
|||||||||||||||||
|
CrewLine Buyer, Inc. (New Relic)
|
First Lien Term Loan
|
SOFR(Q)
|
1.00
|
%
|
6.75
|
%
|
11.35
|
%
|
11/8/2030
|
$
|
9,559,143
|
9,359,418
|
9,683,412
|
0.90
|
%
|
E
|
|||||||||||||||||
|
CrewLine Buyer, Inc. (New Relic)
|
First Lien Revolver
|
SOFR(Q)
|
1.00
|
%
|
6.75
|
%
|
11.35
|
%
|
11/8/2030
|
$
|
—
|
(20,805
|
)
|
—
|
—
|
D/E
|
|||||||||||||||||
|
Fortress Intermediate 3, Inc
|
First Lien Term Loan
|
SOFR(M)
|
—
|
3.50
|
%
|
7.86
|
%
|
6/9/2031
|
$
|
1,246,875
|
1,249,794
|
1,252,336
|
0.12
|
%
|
|||||||||||||||||||
|
Intercept Bidco, Inc.
|
First Lien Term Loan
|
SOFR(Q)
|
1.00
|
%
|
6.00
|
%
|
10.47
|
%
|
6/3/2030
|
$
|
11,229,177
|
11,026,324
|
10,993,364
|
1.02
|
%
|
E
|
|||||||||||||||||
|
Intercept Bidco, Inc.
|
First Lien Revolver
|
SOFR(Q)
|
1.00
|
%
|
6.00
|
%
|
10.47
|
%
|
6/3/2030
|
$
|
—
|
(31,208
|
)
|
(36,279
|
)
|
—
|
D/E
|
||||||||||||||||
|
Intercept Bidco, Inc.
|
First Lien Delayed Draw Term Loan
|
SOFR(Q)
|
1.00
|
%
|
6.00
|
%
|
10.47
|
%
|
6/3/2030
|
$
|
—
|
(23,406
|
)
|
(54,418
|
)
|
(0.01
|
)%
|
D/E
|
|||||||||||||||
|
Madison Logic Holdings, Inc.
|
First Lien Term Loan
|
SOFR(M)
|
1.00
|
%
|
5.59% Cash + 1.51% PIK
|
11.84
|
%
|
12/29/2028
|
$
|
2,243,977
|
2,199,411
|
2,156,462
|
0.20
|
%
|
E
|
||||||||||||||||||
|
Madison Logic Holdings, Inc.
|
First Lien Revolver
|
SOFR(M)
|
1.00
|
%
|
7.50
|
%
|
11.84
|
%
|
12/30/2027
|
$
|
—
|
(1,541
|
)
|
(3,346
|
)
|
—
|
D/E
|
||||||||||||||||
|
Research Now Group, LLC (Dynata)
|
First Lien Term Loan
|
SOFR(Q)
|
1.00
|
%
|
5.76
|
%
|
10.29
|
%
|
10/15/2028
|
$
|
1,666,310
|
1,463,189
|
1,559,566
|
0.14
|
%
|
||||||||||||||||||
|
Research Now Group, LLC (Dynata)
|
First Lien Term Loan
|
SOFR(Q)
|
—
|
5.26
|
%
|
9.79
|
%
|
5/22/2028
|
$
|
235,262
|
215,461
|
236,635
|
0.02
|
%
|
|||||||||||||||||||
|
Serrano Parent, LLC (Sumo Logic)
|
First Lien Term Loan
|
SOFR(S)
|
1.00
|
%
|
6.50
|
%
|
10.92
|
%
|
5/13/2030
|
$
|
4,099,217
|
4,020,774
|
4,119,713
|
0.38
|
%
|
E
|
|||||||||||||||||
|
Serrano Parent, LLC (Sumo Logic)
|
First Lien Revolver
|
SOFR(S)
|
1.00
|
%
|
6.50
|
%
|
10.92
|
%
|
5/13/2030
|
$
|
—
|
(7,844
|
)
|
—
|
—
|
D/E
|
|||||||||||||||||
|
|
33,160,393
|
33,712,279
|
3.12
|
%
|
|||||||||||||||||||||||||||||
|
Life Sciences Tools and Services
|
|||||||||||||||||||||||||||||||||
|
Alcami Corporation
|
First Lien Term Loan
|
SOFR(Q)
|
1.00
|
%
|
7.15
|
%
|
11.66
|
%
|
12/21/2028
|
$
|
978,845
|
956,172
|
985,697
|
0.09
|
%
|
E
|
|||||||||||||||||
|
Alcami Corporation
|
First Lien Revolver
|
SOFR(M)
|
1.00
|
%
|
7.10
|
%
|
11.44
|
%
|
12/21/2028
|
$
|
9,988
|
6,905
|
9,988
|
—
|
E
|
||||||||||||||||||
|
Alcami Corporation
|
First Lien Delayed Draw Term Loan
|
SOFR(M)
|
1.00
|
%
|
7.10
|
%
|
11.55
|
%
|
12/21/2028
|
$
|
72,037
|
70,369
|
72,541
|
0.01
|
%
|
E
|
|||||||||||||||||
|
Curia Global, Inc.
|
First Lien Term Loan
|
SOFR(Q)
|
0.75
|
%
|
3.75
|
%
|
8.44
|
%
|
8/30/2026
|
$
|
997,111
|
982,002
|
956,085
|
0.09
|
%
|
||||||||||||||||||
|
DNAnexus, Inc
|
First Lien Term Loan
|
SOFR(M)
|
3.00
|
%
|
5.25
|
%
|
9.62
|
%
|
12/20/2029
|
$
|
5,997,566
|
5,937,590
|
5,937,590
|
0.55
|
%
|
E
|
|||||||||||||||||
|
DNAnexus, Inc
|
First Lien Delayed Draw Term Loan
|
SOFR(M)
|
3.00
|
%
|
5.25
|
%
|
9.62
|
%
|
12/20/2029
|
$
|
1,199,513
|
1,019,586
|
1,019,586
|
0.09
|
%
|
E
|
|||||||||||||||||
|
Parexel International, Inc.
|
First Lien Term Loan
|
SOFR(M)
|
0.50
|
%
|
3.00
|
%
|
7.36
|
%
|
11/15/2028
|
$
|
1,240,988
|
1,236,936
|
1,251,071
|
0.12
|
%
|
||||||||||||||||||
|
|
10,209,560
|
10,232,558
|
0.95
|
%
|
|||||||||||||||||||||||||||||
|
Machinery
|
|||||||||||||||||||||||||||||||||
|
AI Aqua Merger Sub, Inc. (Osmosis Buyer) (United Kingdom)
|
First Lien Term Loan
|
SOFR(M)
|
0.50
|
%
|
3.50
|
%
|
8.05
|
%
|
7/31/2028
|
$
|
2,158,837
|
2,126,591
|
2,163,349
|
0.20
|
%
|
C
|
|||||||||||||||||
BlackRock Private Credit Fund
Consolidated Schedule of Investments (Continued)
December 31, 2025
|
Issuer(F)
|
Instrument
|
Ref(B)
|
Floor
|
Spread
|
Total
Coupon
|
Maturity
|
Principal
|
Cost
|
Fair
Value |
% of Total
Cash and
Investment
|
Notes
|
||||||||||||||||||||||
|
Debt Investments - Continued
|
|||||||||||||||||||||||||||||||||
|
Machinery (Continued)
|
|||||||||||||||||||||||||||||||||
|
Alliance Laundry Systems, LLC
|
First Lien Term Loan B
|
SOFR(M)
|
—
|
3.50
|
%
|
7.84
|
%
|
8/19/2031
|
$
|
129,000
|
$
|
128,388
|
$
|
130,026
|
0.01
|
%
|
|||||||||||||||||
|
Blackbird Purchaser, Inc.
|
First Lien Term Loan
|
Prime
|
0.75
|
%
|
5.50
|
%
|
9.83
|
%
|
12/19/2030
|
$
|
2,370,874
|
2,330,485
|
2,328,198
|
0.22
|
%
|
E
|
|||||||||||||||||
|
Blackbird Purchaser, Inc.
|
First Lien Revolver
|
SOFR(Q)
|
0.75
|
%
|
5.50
|
%
|
9.83
|
%
|
12/19/2030
|
$
|
78,777
|
73,560
|
73,105
|
0.01
|
%
|
E
|
|||||||||||||||||
|
Blackbird Purchaser, Inc.
|
First Lien Delayed Draw Term Loan
|
Prime
|
0.75
|
%
|
5.50
|
%
|
9.83
|
%
|
12/19/2030
|
$
|
161,348
|
153,418
|
152,970
|
0.01
|
%
|
E
|
|||||||||||||||||
|
Filtration group corporation
|
First Lien Term Loan
|
SOFR(M)
|
—
|
3.50
|
%
|
7.97
|
%
|
10/21/2028
|
$
|
1,236,804
|
1,239,550
|
1,248,090
|
0.12
|
%
|
|||||||||||||||||||
|
Husky Injection Molding Systems Ltd. (Canada)
|
First Lien Term Loan
|
SOFR(S)
|
—
|
4.50
|
%
|
8.78
|
%
|
2/15/2029
|
$
|
4,329,734
|
4,345,337
|
4,371,689
|
0.40
|
%
|
C
|
||||||||||||||||||
|
Indicor, LLC (Roper Industrial Pro)
|
First Lien Term Loan
|
SOFR(Q)
|
—
|
2.75
|
%
|
7.08
|
%
|
11/22/2029
|
$
|
492,537
|
490,209
|
494,384
|
0.05
|
%
|
|||||||||||||||||||
|
INNIO North American Holding Inc.
|
First Lien Term Loan
|
SOFR(Q)
|
—
|
3.25
|
%
|
7.90
|
%
|
11/2/2028
|
$
|
1,221,889
|
1,226,038
|
1,230,296
|
0.11
|
%
|
|||||||||||||||||||
|
Madison IAQ LLC
|
First Lien Term Loan
|
SOFR(S)
|
0.50
|
%
|
2.75
|
%
|
7.89
|
%
|
6/21/2028
|
$
|
1,016,304
|
976,834
|
1,021,228
|
0.09
|
%
|
||||||||||||||||||
|
|
13,090,410
|
13,213,335
|
1.22
|
%
|
|||||||||||||||||||||||||||||
|
Media
|
|||||||||||||||||||||||||||||||||
|
Kid Distro Holdings, LLC
|
First Lien Term Loan
|
SOFR(Q)
|
1.00
|
%
|
4.90
|
%
|
9.49
|
%
|
10/1/2029
|
$
|
6,374,983
|
6,374,983
|
6,374,983
|
0.59
|
%
|
E
|
|||||||||||||||||
|
Kid Distro Holdings, LLC
|
First Lien Term Loan
|
SOFR(Q)
|
1.00
|
%
|
4.90
|
%
|
9.49
|
%
|
10/1/2029
|
$
|
1,132,492
|
1,132,492
|
1,132,934
|
0.10
|
%
|
E
|
|||||||||||||||||
|
Kid Distro Holdings, LLC
|
First Lien Revolver
|
SOFR(Q)
|
1.00
|
%
|
4.90
|
%
|
9.49
|
%
|
10/1/2029
|
$
|
—
|
—
|
—
|
—
|
E
|
||||||||||||||||||
|
NEP Group, Inc. et al
|
First Lien Term Loan (2.0% Exit Fee)
|
SOFR(M)
|
1.00
|
%
|
3.36% Cash + 1.50% PIK
|
9.22
|
%
|
8/19/2026
|
$
|
4,431,352
|
4,206,444
|
4,061,334
|
0.38
|
%
|
H
|
||||||||||||||||||
|
Streamland Media Midco LLC
|
First Lien Term Loan
|
SOFR(Q)
|
1.00
|
%
|
9.76% PIK
|
14.09
|
%
|
3/31/2025
|
$
|
3,487,343
|
3,487,374
|
2,095,893
|
0.19
|
%
|
E
|
||||||||||||||||||
|
Streamland Media Midco LLC
|
First Lien Term Loan
|
SOFR(Q)
|
1.00
|
%
|
9.76% PIK
|
14.09
|
%
|
3/31/2025
|
$
|
204,289
|
204,289
|
204,289
|
0.02
|
%
|
E
|
||||||||||||||||||
|
Streamland Media Midco LLC
|
First Lien Term Loan
|
SOFR(Q)
|
1.00
|
%
|
9.76% PIK
|
14.09
|
%
|
3/31/2025
|
$
|
204,289
|
204,289
|
204,289
|
0.02
|
%
|
E
|
||||||||||||||||||
|
Streamland Media Midco LLC
|
First Lien Term Loan
|
SOFR(M)
|
1.00
|
%
|
9.76% PIK
|
14.09
|
%
|
3/31/2025
|
$
|
134,867
|
134,838
|
134,867
|
0.01
|
%
|
E
|
||||||||||||||||||
|
TL Voltron Purchaser, LLC (GES)
|
First Lien Term Loan
|
SOFR(M)
|
1.00
|
%
|
5.25
|
%
|
9.61
|
%
|
12/31/2030
|
$
|
11,754,613
|
11,519,612
|
11,519,521
|
1.07
|
%
|
E
|
|||||||||||||||||
|
Zayo Group Holdings, Inc.
|
First Lien Term Loan
|
SOFR(M)
|
0.50
|
%
|
4.25
|
%
|
8.61
|
%
|
3/9/2027
|
$
|
709,925
|
701,285
|
668,618
|
0.06
|
%
|
||||||||||||||||||
|
|
27,965,606
|
26,396,728
|
2.44
|
%
|
|||||||||||||||||||||||||||||
|
Metals and Mining
|
|||||||||||||||||||||||||||||||||
|
Grinding Media Inc. (Molycop LTD)
|
First Lien Term Loan
|
SOFR(Q)
|
0.75
|
%
|
3.50
|
%
|
8.02
|
%
|
10/21/2028
|
$
|
498,750
|
499,989
|
501,867
|
0.05
|
%
|
||||||||||||||||||
|
|
|||||||||||||||||||||||||||||||||
|
Oil, Gas and Consumable Fuels
|
|||||||||||||||||||||||||||||||||
|
Palmdale Oil Company, LLC
|
First Lien Term Loan
|
SOFR(M)
|
1.00
|
%
|
6.75
|
%
|
11.23
|
%
|
10/2/2029
|
$
|
1,264,178
|
1,233,616
|
1,259,121
|
0.12
|
%
|
E
|
|||||||||||||||||
|
|
|||||||||||||||||||||||||||||||||
|
Paper and Forest Products
|
|||||||||||||||||||||||||||||||||
|
Alpine Acquisition Corp II (48Forty)
|
First Lien Term Loan
|
SOFR(M)
|
1.00
|
%
|
1.00 Cash + 5.33% PIK
|
10.65
|
%
|
11/30/2026
|
$
|
4,841,951
|
4,713,974
|
4,211,529
|
0.38
|
%
|
E
|
||||||||||||||||||
|
Alpine Acquisition Corp II (48Forty)
|
First Lien Term Loan
|
SOFR(M)
|
1.00
|
%
|
1.00 Cash + 5.33% PIK
|
10.65
|
%
|
11/30/2026
|
$
|
203,569
|
198,453
|
177,064
|
0.02
|
%
|
E
|
||||||||||||||||||
|
FSK Pallet Holding Corp. (Kamps)
|
First Lien Term Loan
|
SOFR(Q)
|
1.25
|
%
|
6.65
|
%
|
11.33
|
%
|
12/23/2026
|
$
|
1,570,713
|
1,547,185
|
1,571,970
|
0.15
|
%
|
E
|
|||||||||||||||||
|
FSK Pallet Holding Corp. (Kamps)
|
First Lien Term Loan
|
SOFR(Q)
|
1.00
|
%
|
6.15
|
%
|
10.48
|
%
|
12/19/2025
|
$
|
1,255,570
|
1,255,570
|
1,255,570
|
0.12
|
%
|
E
|
|||||||||||||||||
|
|
7,715,182
|
7,216,133
|
0.67
|
%
|
|||||||||||||||||||||||||||||
|
Professional Services
|
|||||||||||||||||||||||||||||||||
|
Allied Benefit Systems Intermediate, LLC
|
First Lien Term Loan
|
SOFR(M)
|
0.75
|
%
|
5.25
|
%
|
9.61
|
%
|
10/31/2030
|
$
|
7,925,903
|
7,826,914
|
8,005,162
|
0.74
|
%
|
E
|
|||||||||||||||||
|
Allied Benefit Systems Intermediate, LLC
|
First Lien Delayed Draw Term Loan
|
SOFR(M)
|
0.50
|
%
|
5.25
|
%
|
9.73
|
%
|
10/31/2030
|
$
|
1,453,512
|
1,435,359
|
1,468,047
|
0.14
|
%
|
E
|
|||||||||||||||||
|
Applause App Quality, Inc.
|
First Lien Term Loan
|
SOFR(Q)
|
1.50
|
%
|
6.00
|
%
|
10.33
|
%
|
10/24/2029
|
$
|
15,007,034
|
14,718,235
|
14,721,900
|
1.35
|
%
|
E
|
|||||||||||||||||
|
Applause App Quality, Inc.
|
First Lien Revolver
|
SOFR(Q)
|
1.50
|
%
|
6.00
|
%
|
10.33
|
%
|
10/24/2029
|
$
|
—
|
(28,062
|
)
|
(28,513
|
)
|
—
|
D/E
|
||||||||||||||||
|
Bullhorn, Inc.
|
First Lien Term Loan
|
SOFR(M)
|
1.00
|
%
|
5.00
|
%
|
9.36
|
%
|
10/1/2029
|
$
|
10,262,184
|
10,239,522
|
10,262,184
|
0.95
|
%
|
E
|
|||||||||||||||||
|
Bullhorn, Inc.
|
First Lien Revolver
|
SOFR(M)
|
1.00
|
%
|
5.00
|
%
|
9.36
|
%
|
10/1/2029
|
$
|
—
|
(2,442
|
)
|
(29,571
|
)
|
—
|
D/E
|
||||||||||||||||
|
Bullhorn, Inc.
|
First Lien Delayed Draw Term Loan
|
SOFR(M)
|
—
|
5.00
|
%
|
9.36
|
%
|
9/30/2029
|
$
|
11,721,795
|
11,717,757
|
11,721,795
|
1.08
|
%
|
E
|
||||||||||||||||||
|
Bullhorn, Inc.
|
First Lien Delayed Draw Term Loan
|
SOFR(M)
|
1.00
|
%
|
5.00
|
%
|
9.36
|
%
|
9/30/2029
|
$
|
414,474
|
411,440
|
414,474
|
0.04
|
%
|
E
|
|||||||||||||||||
|
Cherry Bekaert Advisory, LLC
|
First Lien Term Loan
|
SOFR(M)
|
0.75
|
%
|
5.25
|
%
|
9.61
|
%
|
6/30/2028
|
$
|
2,136,757
|
2,111,880
|
2,110,069
|
0.20
|
%
|
E
|
|||||||||||||||||
|
Cherry Bekaert Advisory, LLC
|
First Lien Term Loan
|
SOFR(M)
|
0.75
|
%
|
5.25
|
%
|
9.61
|
%
|
6/30/2028
|
$
|
745,373
|
734,340
|
736,063
|
0.07
|
%
|
E
|
|||||||||||||||||
BlackRock Private Credit Fund
Consolidated Schedule of Investments (Continued)
December 31, 2025
|
Issuer(F)
|
Instrument
|
Ref(B)
|
Floor
|
Spread
|
Total Coupon
|
Maturity
|
Principal
|
Cost
|
Fair
Value |
% of Total Cash and Investment
|
Notes
|
||||||||||||||||||||||
|
Debt Investments - Continued
|
|||||||||||||||||||||||||||||||||
|
Professional Services (Continued)
|
|||||||||||||||||||||||||||||||||
|
Cherry Bekaert Advisory, LLC
|
First Lien Revolver
|
SOFR(M)
|
0.75
|
%
|
5.25
|
%
|
9.61
|
%
|
6/30/2028
|
$
|
—
|
$
|
(5,207
|
)
|
$
|
(5,586
|
)
|
—
|
D/E
|
||||||||||||||
|
Cherry Bekaert Advisory, LLC
|
First Lien Delayed Draw Term Loan
|
SOFR(M)
|
0.75
|
%
|
5.25
|
%
|
9.61
|
%
|
6/30/2028
|
$
|
880,362
|
870,106
|
869,366
|
0.08
|
%
|
E
|
|||||||||||||||||
|
Cherry Bekaert Advisory, LLC
|
First Lien Delayed Draw Term Loan
|
SOFR(M)
|
0.75
|
%
|
5.25
|
%
|
9.61
|
%
|
6/30/2028
|
$
|
859,867
|
845,510
|
847,754
|
0.08
|
%
|
E
|
|||||||||||||||||
|
CoreLogic, Inc. (fka First American Corporation)
|
First Lien Term Loan
|
SOFR(M)
|
0.50
|
%
|
3.61
|
%
|
7.97
|
%
|
6/2/2028
|
$
|
2,481,838
|
2,467,179
|
2,455,022
|
0.23
|
%
|
||||||||||||||||||
|
Deerfield Dakota Holding, LLC
|
First Lien Term Loan
|
SOFR(M)
|
1.00
|
%
|
3.75
|
%
|
8.08
|
%
|
4/9/2027
|
$
|
2,646,803
|
2,595,083
|
2,594,701
|
0.24
|
%
|
||||||||||||||||||
|
DTI Holdco, Inc. (Epiq)
|
First Lien Term Loan
|
SOFR(M)
|
0.75
|
%
|
4.75
|
%
|
9.11
|
%
|
4/26/2029
|
$
|
16,577,937
|
16,490,822
|
16,733,355
|
1.54
|
%
|
||||||||||||||||||
|
Element Materials Technology Group US Holdings Inc.
|
First Lien Term Loan
|
SOFR(Q)
|
0.50
|
%
|
3.75
|
%
|
8.08
|
%
|
6/24/2029
|
$
|
686,681
|
682,812
|
692,047
|
0.06
|
%
|
||||||||||||||||||
|
GI Consilio Parent LLC (Skopima Consilio Parent LLC)
|
First Lien Term Loan
|
SOFR(M)
|
0.50
|
%
|
4.61
|
%
|
9.19
|
%
|
5/14/2029
|
$
|
10,917,500
|
10,760,180
|
10,972,088
|
1.01
|
%
|
||||||||||||||||||
|
GI Consilio Parent LLC (Skopima Consilio Parent LLC)
|
First Lien Term Loan
|
SOFR(M)
|
0.50
|
%
|
3.75
|
%
|
8.12
|
%
|
5/15/2028
|
$
|
9,082,500
|
9,059,794
|
9,127,913
|
0.84
|
%
|
||||||||||||||||||
|
HSI Halo Acquisitions, Inc.
|
First Lien Term Loan
|
SOFR(Q)
|
0.75
|
%
|
5.00
|
%
|
9.59
|
%
|
6/28/2031
|
$
|
6,180,927
|
6,133,675
|
6,211,832
|
0.57
|
%
|
E
|
|||||||||||||||||
|
HSI Halo Acquisitions, Inc.
|
First Lien Revolver
|
SOFR(Q)
|
0.75
|
%
|
5.00
|
%
|
9.59
|
%
|
6/28/2031
|
$
|
—
|
—
|
—
|
—
|
E
|
||||||||||||||||||
|
HSI Halo Acquisitions, Inc.
|
First Lien Delayed Draw Term Loan
|
SOFR(Q)
|
0.75
|
%
|
5.00
|
%
|
9.64
|
%
|
6/28/2031
|
$
|
191,314
|
191,314
|
196,833
|
0.02
|
%
|
E
|
|||||||||||||||||
|
Huckabee Acquisition, LLC (MOREgroup)
|
First Lien Term Loan
|
SOFR(Q)
|
1.00
|
%
|
5.25
|
%
|
9.58
|
%
|
1/16/2030
|
$
|
4,658,714
|
4,580,459
|
4,640,079
|
0.43
|
%
|
E
|
|||||||||||||||||
|
Huckabee Acquisition, LLC (MOREgroup)
|
First Lien Revolver
|
SOFR(Q)
|
1.00
|
%
|
5.25
|
%
|
9.58
|
%
|
1/16/2030
|
$
|
—
|
(10,284
|
)
|
(2,449
|
)
|
—
|
D/E
|
||||||||||||||||
|
Huckabee Acquisition, LLC (MOREgroup)
|
First Lien Delayed Draw Term Loan
|
SOFR(Q)
|
1.00
|
%
|
5.25
|
%
|
9.58
|
%
|
1/16/2030
|
$
|
—
|
(17,140
|
)
|
(4,082
|
)
|
—
|
D/E
|
||||||||||||||||
|
ICIMS, Inc.
|
First Lien Incremental Term Loan
|
SOFR(Q)
|
0.75
|
%
|
6.25
|
%
|
10.88
|
%
|
8/18/2028
|
$
|
1,152,092
|
1,139,521
|
1,137,576
|
0.11
|
%
|
E
|
|||||||||||||||||
|
Lighthouse Parent Holdings, Inc (Aperture)
|
First Lien Term Loan
|
SOFR(M)
|
0.75
|
%
|
5.00
|
%
|
9.37
|
%
|
12/20/2031
|
$
|
5,606,915
|
5,537,076
|
5,536,829
|
0.51
|
%
|
E
|
|||||||||||||||||
|
Lighthouse Parent Holdings, Inc (Aperture)
|
First Lien Revolver
|
SOFR(M)
|
0.75
|
%
|
5.00
|
%
|
9.37
|
%
|
12/20/2031
|
$
|
—
|
(13,539
|
)
|
(13,565
|
)
|
—
|
D/E
|
||||||||||||||||
|
Lighthouse Parent Holdings, Inc (Aperture)
|
First Lien Delayed Draw Term Loan
|
SOFR(M)
|
0.75
|
%
|
5.00
|
%
|
9.37
|
%
|
12/20/2031
|
$
|
—
|
(16,923
|
)
|
(33,913
|
)
|
—
|
D/E
|
||||||||||||||||
|
OMNIA Partners, LLC
|
First Lien Term Loan
|
SOFR(Q)
|
1.00
|
%
|
2.75
|
%
|
7.37
|
%
|
7/25/2030
|
$
|
484,560
|
482,416
|
487,545
|
0.05
|
%
|
||||||||||||||||||
|
Secretariat Advisors LLC
|
First Lien Term Loan
|
SOFR(M)
|
0.75
|
%
|
4.86
|
%
|
9.22
|
%
|
12/16/2028
|
$
|
1,290,315
|
1,293,521
|
1,288,702
|
0.12
|
%
|
E
|
|||||||||||||||||
|
Secretariat Advisors LLC
|
First Lien Delayed Draw Term Loan
|
SOFR(M)
|
0.75
|
%
|
4.86
|
%
|
9.22
|
%
|
12/16/2028
|
$
|
205,834
|
206,346
|
205,577
|
0.02
|
%
|
E
|
|||||||||||||||||
|
Vensure Employer Services, Inc.
|
First Lien Term Loan
|
SOFR(Q)
|
0.75
|
%
|
5.00
|
%
|
9.33
|
%
|
9/27/2031
|
$
|
13,266,446
|
13,146,345
|
13,140,415
|
1.21
|
%
|
E
|
|||||||||||||||||
|
Vensure Employer Services, Inc.
|
First Lien Delayed Draw Term Loan
|
SOFR(Q)
|
0.75
|
%
|
5.00
|
%
|
9.33
|
%
|
9/19/2031
|
$
|
—
|
13,333
|
(26,170
|
)
|
—
|
D/E
|
|||||||||||||||||
|
|
125,597,342
|
126,433,479
|
11.69
|
%
|
|||||||||||||||||||||||||||||
|
Real Estate Management and Development
|
|||||||||||||||||||||||||||||||||
|
Community Merger Sub Debt LLC (CINC Systems)
|
First Lien Term Loan
|
SOFR(M)
|
0.75
|
%
|
5.75
|
%
|
10.11
|
%
|
1/18/2030
|
$
|
7,324,992
|
7,201,932
|
7,213,872
|
0.67
|
%
|
E
|
|||||||||||||||||
|
Community Merger Sub Debt LLC (CINC Systems)
|
First Lien Revolver
|
SOFR(M)
|
0.75
|
%
|
5.75
|
%
|
10.11
|
%
|
1/18/2030
|
$
|
—
|
(33,608
|
)
|
(30,305
|
)
|
—
|
D/E
|
||||||||||||||||
|
Forest City Enterprises, L.P.
|
First Lien Term Loan
|
SOFR(M)
|
—
|
3.61
|
%
|
7.96
|
%
|
12/8/2025
|
$
|
902,764
|
897,353
|
886,966
|
0.08
|
%
|
|||||||||||||||||||
|
|
8,065,677
|
8,070,533
|
0.75
|
%
|
|||||||||||||||||||||||||||||
|
Software
|
|||||||||||||||||||||||||||||||||
|
Applied Systems, Inc.
|
First Lien Term Loan
|
SOFR(Q)
|
0.50
|
%
|
3.00
|
%
|
7.33
|
%
|
9/19/2026
|
$
|
1,243,894
|
1,244,605
|
1,257,396
|
0.12
|
%
|
||||||||||||||||||
|
Barracuda Parent LLC
|
First Lien Term Loan
|
SOFR(Q)
|
—
|
4.50
|
%
|
9.09
|
%
|
8/15/2029
|
$
|
678,120
|
665,149
|
629,085
|
0.06
|
%
|
|||||||||||||||||||
|
Bluefin Holding, LLC (Allvue)
|
First Lien Term Loan
|
SOFR(Q)
|
1.00
|
%
|
6.25
|
%
|
10.64
|
%
|
9/12/2029
|
$
|
17,648,902
|
17,329,874
|
17,666,551
|
1.62
|
%
|
E
|
|||||||||||||||||
|
Bluefin Holding, LLC (Allvue)
|
First Lien Revolver
|
SOFR(Q)
|
1.00
|
%
|
6.25
|
%
|
10.64
|
%
|
9/12/2029
|
$
|
—
|
(23,289
|
)
|
—
|
—
|
D/E
|
|||||||||||||||||
|
Boxer Parent Company, Inc.
|
First Lien Term Loan
|
SOFR(Q)
|
—
|
3.75
|
%
|
8.34
|
%
|
7/30/2031
|
$
|
2,465,147
|
2,469,162
|
2,488,541
|
0.23
|
%
|
|||||||||||||||||||
|
Cart.Com, Inc.
|
First Lien Term Loan (2.5% Exit Fee)
|
SOFR(M)
|
1.50
|
%
|
7.75
|
%
|
12.11
|
%
|
5/22/2029
|
$
|
12,000,000
|
11,894,137
|
11,856,000
|
1.10
|
%
|
E, H
|
|||||||||||||||||
|
Central Parent, Inc.
|
First Lien Term Loan
|
SOFR(Q)
|
—
|
3.25
|
%
|
7.58
|
%
|
7/6/2029
|
$
|
990,019
|
975,531
|
978,203
|
0.09
|
%
|
|||||||||||||||||||
|
Clever Devices Ltd.
|
First Lien Term Loan
|
SOFR(Q)
|
1.00
|
%
|
6.00
|
%
|
10.66
|
%
|
6/12/2030
|
$
|
2,215,165
|
2,164,917
|
2,237,317
|
0.21
|
%
|
E
|
|||||||||||||||||
|
Clever Devices Ltd.
|
First Lien Revolver
|
SOFR(M)
|
1.00
|
%
|
6.00
|
%
|
10.36
|
%
|
6/12/2030
|
$
|
371,050
|
350,008
|
371,050
|
0.03
|
%
|
E
|
|||||||||||||||||
|
Cloudera, Inc.
|
First Lien Term Loan
|
SOFR(M)
|
0.50
|
%
|
3.85
|
%
|
8.21
|
%
|
10/8/2028
|
$
|
3,527,723
|
3,480,306
|
3,524,971
|
0.33
|
%
|
||||||||||||||||||
|
Clover Holding 2, LLC (COHESITY)
|
First Lien Term Loan
|
SOFR(Q)
|
—
|
4.00
|
%
|
8.43
|
%
|
10/31/2031
|
$
|
4,954,000
|
4,941,618
|
5,015,925
|
0.46
|
%
|
E
|
||||||||||||||||||
|
Connectwise
|
First Lien Term Loan
|
SOFR(Q)
|
—
|
3.76
|
%
|
8.09
|
%
|
9/30/2028
|
$
|
1,477,796
|
1,482,874
|
1,489,345
|
0.14
|
%
|
|||||||||||||||||||
BlackRock Private Credit Fund
Consolidated Schedule of Investments (Continued)
December 31, 2025
|
Issuer(F)
|
Instrument
|
Ref(B)
|
Floor
|
Spread
|
Total
Coupon
|
Maturity
|
Principal
|
Cost
|
Fair
Value |
% of Total
Cash and
Investment
|
Notes
|
||||||||||||||||||||||
|
Debt Investments - Continued
|
|||||||||||||||||||||||||||||||||
|
Software (Continued)
|
|||||||||||||||||||||||||||||||||
|
Delta Topco, Inc
|
First Lien Term Loan
|
SOFR(S)
|
—
|
3.50
|
%
|
8.20
|
%
|
12/24/2029
|
$
|
3,450,899
|
$
|
3,464,158
|
$
|
3,482,181
|
0.32
|
%
|
|||||||||||||||||
|
Disco Parent, Inc. (Duck Creek Technologies)
|
First Lien Term Loan
|
SOFR(Q)
|
1.00
|
%
|
7.50
|
%
|
12.01
|
%
|
3/30/2029
|
$
|
2,780,810
|
2,731,101
|
2,791,933
|
0.26
|
%
|
E
|
|||||||||||||||||
|
Disco Parent, Inc. (Duck Creek Technologies)
|
First Lien Revolver
|
SOFR(Q)
|
1.00
|
%
|
7.50
|
%
|
12.01
|
%
|
3/30/2029
|
$
|
—
|
(4,111
|
)
|
—
|
—
|
D/E
|
|||||||||||||||||
|
Douglas Holdings, Inc (Docupace)
|
First Lien Term Loan
|
SOFR(Q)
|
1.00
|
%
|
5.75% Cash + 0.38% PIK
|
10.45
|
%
|
8/27/2030
|
$
|
8,550,747
|
8,429,920
|
8,431,037
|
0.78
|
%
|
E
|
||||||||||||||||||
|
Douglas Holdings, Inc (Docupace)
|
First Lien Revolver
|
SOFR(Q)
|
1.00
|
%
|
5.75% Cash + 0.38% PIK
|
10.45
|
%
|
8/27/2030
|
$
|
—
|
(10,507
|
)
|
(10,410
|
)
|
—
|
D/E
|
|||||||||||||||||
|
Douglas Holdings, Inc (Docupace)
|
First Lien PIK Delayed Draw Term Loan
|
SOFR(Q)
|
1.00
|
%
|
5.75% Cash + 0.38% PIK
|
10.45
|
%
|
8/27/2030
|
$
|
165,063
|
165,064
|
150,281
|
0.01
|
%
|
E
|
||||||||||||||||||
|
Douglas Holdings, Inc (Docupace)
|
First Lien Delayed Draw Term Loan B
|
SOFR(Q)
|
1.00
|
%
|
5.75% Cash + 0.38% PIK
|
10.45
|
%
|
8/27/2030
|
$
|
—
|
(13,133
|
)
|
(26,024
|
)
|
—
|
D/E
|
|||||||||||||||||
|
Douglas Holdings, Inc (Docupace)
|
First Lien Delayed Draw Term Loan A
|
SOFR(Q)
|
1.00
|
%
|
5.75% Cash + 0.38% PIK
|
10.45
|
%
|
8/27/2030
|
$
|
—
|
(14,447
|
)
|
(28,626
|
)
|
—
|
D/E
|
|||||||||||||||||
|
Epicor Software Corporation (fka Eagle Parent Inc.)
|
First Lien Term Loan
|
SOFR(M)
|
0.75
|
%
|
2.75
|
%
|
7.11
|
%
|
5/30/2031
|
$
|
3,769,936
|
3,742,530
|
3,801,547
|
0.35
|
%
|
||||||||||||||||||
|
Fusion Risk Management, Inc.
|
First Lien Term Loan
|
SOFR(Q)
|
1.00
|
%
|
3.00% Cash + 3.25% PIK
|
11.08
|
%
|
5/22/2029
|
$
|
4,036,148
|
3,983,233
|
3,975,606
|
0.37
|
%
|
E
|
||||||||||||||||||
|
Fusion Risk Management, Inc.
|
First Lien Revolver
|
SOFR(Q)
|
1.00
|
%
|
3.00% Cash + 3.25% PIK
|
11.08
|
%
|
5/22/2029
|
$
|
—
|
(9,889
|
)
|
(6,864
|
)
|
—
|
D/E
|
|||||||||||||||||
|
Greeneden U.S. Holdings II, LLC (Genesys Telecommunications Laboratories Inc)
|
First Lien Term Loan
|
SOFR(M)
|
—
|
3.00
|
%
|
7.36
|
%
|
12/1/2027
|
$
|
3,130,662
|
3,101,596
|
3,160,857
|
0.29
|
%
|
|||||||||||||||||||
|
GTY Technology Holdings Inc.
|
First Lien Term Loan
|
SOFR(Q)
|
1.00
|
%
|
2.58% Cash + 4.30% PIK
|
11.21
|
%
|
7/9/2029
|
$
|
1,619,552
|
1,600,751
|
1,577,185
|
0.15
|
%
|
E
|
||||||||||||||||||
|
GTY Technology Holdings Inc.
|
First Lien Revolver
|
SOFR(Q)
|
1.00
|
%
|
2.58% Cash + 4.30% PIK
|
11.21
|
%
|
7/9/2029
|
$
|
—
|
(3,419
|
)
|
(6,916
|
)
|
—
|
D/E
|
|||||||||||||||||
|
GTY Technology Holdings Inc.
|
First Lien Delayed Draw Term Loan
|
SOFR(Q)
|
1.00
|
%
|
2.58% Cash + 4.30% PIK
|
11.21
|
%
|
7/9/2029
|
$
|
1,252,635
|
1,237,862
|
1,219,866
|
0.11
|
%
|
E
|
||||||||||||||||||
|
GTY Technology Holdings Inc.
|
First Lien Delayed Draw Term Loan
|
SOFR(Q)
|
0.75
|
%
|
2.67% Cash + 4.55% PIK
|
11.68
|
%
|
7/9/2029
|
$
|
325,564
|
308,014
|
306,895
|
0.03
|
%
|
E
|
||||||||||||||||||
|
Honey Intermediate, Inc. (iLobby) (Canada)
|
First Lien Term Loan
|
SOFR(M)
|
1.00
|
%
|
2.88% Cash + 3.38% PIK
|
10.61
|
%
|
9/26/2030
|
$
|
14,164,479
|
13,961,736
|
13,980,341
|
1.28
|
%
|
C/E
|
||||||||||||||||||
|
Honey Intermediate, Inc. (iLobby) (Canada)
|
First Lien Revolver
|
SOFR(M)
|
1.00
|
%
|
2.88% Cash + 3.38% PIK
|
10.61
|
%
|
9/26/2030
|
$
|
—
|
(26,612
|
)
|
(24,341
|
)
|
—
|
C/D/E
|
|||||||||||||||||
|
JOBVITE, Inc. (Employ, Inc.)
|
First Lien Term Loan
|
SOFR(Q)
|
0.75
|
%
|
7.50
|
%
|
12.02
|
%
|
8/5/2028
|
$
|
2,321,515
|
2,286,062
|
2,284,881
|
0.21
|
%
|
E
|
|||||||||||||||||
|
Kong Inc.
|
First Lien Term Loan
|
SOFR(M)
|
1.00
|
%
|
5.50% Cash + 3.25% PIK
|
13.42
|
%
|
11/1/2027
|
$
|
970,973
|
958,382
|
970,488
|
0.09
|
%
|
E
|
||||||||||||||||||
|
Kong Inc.
|
First Lien Delayed Draw Term Loan
|
SOFR(M)
|
1.00
|
%
|
5.50% Cash + 3.25% PIK
|
13.42
|
%
|
11/1/2027
|
$
|
515,193
|
506,867
|
514,935
|
0.05
|
%
|
E
|
||||||||||||||||||
|
Logicmonitor, Inc
|
First Lien Term Loan
|
SOFR(Q)
|
0.75
|
%
|
5.50
|
%
|
9.99
|
%
|
11/19/2031
|
$
|
14,852,100
|
14,705,970
|
14,669,419
|
1.35
|
%
|
E
|
|||||||||||||||||
|
Logicmonitor, Inc
|
First Lien Revolver
|
SOFR(Q)
|
0.75
|
%
|
5.50
|
%
|
9.99
|
%
|
11/19/2031
|
$
|
—
|
(18,266
|
)
|
(22,835
|
)
|
—
|
D/E
|
||||||||||||||||
|
Maverick Bidco, Inc. (Mitratech)
|
First Lien No. 2 Term Loan
|
SOFR(Q)
|
0.75
|
%
|
4.51
|
%
|
9.10
|
%
|
5/18/2028
|
$
|
12,312,500
|
12,112,627
|
12,327,891
|
1.14
|
%
|
||||||||||||||||||
|
MH Sub I, LLC (Micro Holding Corp.)
|
First Lien Term Loan
|
SOFR(M)
|
—
|
4.25
|
%
|
8.82
|
%
|
12/11/2031
|
$
|
—
|
(1,417
|
)
|
(1,887
|
)
|
—
|
D
|
|||||||||||||||||
|
MH Sub I, LLC (Micro Holding Corp.)
|
First Lien 2023 Incremental Term Loan
|
SOFR(M)
|
1.00
|
%
|
4.25
|
%
|
8.82
|
%
|
5/3/2028
|
$
|
2,750,375
|
2,729,707
|
2,754,913
|
0.25
|
%
|
||||||||||||||||||
|
Mitchell International Inc
|
First Lien Term Loan
|
SOFR(M)
|
0.50
|
%
|
3.25
|
%
|
7.61
|
%
|
6/17/2031
|
$
|
1,678,793
|
1,674,123
|
1,681,781
|
0.16
|
%
|
||||||||||||||||||
|
Planview Parent, Inc.
|
First Lien Term Loan
|
SOFR(Q)
|
—
|
3.50
|
%
|
7.83
|
%
|
12/17/2027
|
$
|
2,255,857
|
2,244,641
|
2,274,772
|
0.21
|
%
|
|||||||||||||||||||
|
Project Boost Purchaser, LLC (JD Power, AutoData Inc)
|
First Lien Term Loan
|
SOFR(Q)
|
—
|
3.50
|
%
|
8.15
|
%
|
7/2/2031
|
$
|
1,361,559
|
1,362,612
|
1,372,935
|
0.13
|
%
|
|||||||||||||||||||
|
Proofpoint, Inc.
|
First Lien Term Loan
|
SOFR(M)
|
0.50
|
%
|
3.00
|
%
|
7.36
|
%
|
8/21/2028
|
$
|
4,824,141
|
4,804,348
|
4,853,110
|
0.45
|
%
|
||||||||||||||||||
|
Qlik Technologies Inc. (Project Alpha)
|
First Lien Term Loan
|
SOFR(Q)
|
—
|
3.25
|
%
|
7.58
|
%
|
10/28/2030
|
$
|
1,243,750
|
1,249,042
|
1,253,271
|
0.12
|
%
|
|||||||||||||||||||
|
Qlik Technologies Inc. (Project Alpha)
|
First Lien Term Loan
|
SOFR(Q)
|
—
|
3.25
|
%
|
7.58
|
%
|
10/26/2030
|
$
|
353,000
|
352,118
|
355,702
|
0.03
|
%
|
|||||||||||||||||||
|
RealPage, Inc
|
First Lien Term Loan
|
SOFR(Q)
|
—
|
3.75
|
%
|
8.08
|
%
|
4/22/2028
|
$
|
648,000
|
644,781
|
651,849
|
0.06
|
%
|
|||||||||||||||||||
|
Sophia, L.P. (Ellucian)
|
First Lien Term Loan
|
SOFR(M)
|
0.50
|
%
|
3.00
|
%
|
7.36
|
%
|
10/7/2029
|
$
|
2,003,526
|
2,008,353
|
2,019,554
|
0.19
|
%
|
||||||||||||||||||
|
Sovos Compliance, LLC (fka Taxware, LLC)
|
First Lien Term Loan
|
SOFR(M)
|
0.50
|
%
|
4.61
|
%
|
8.97
|
%
|
8/11/2028
|
$
|
306,383
|
301,738
|
309,012
|
0.03
|
%
|
||||||||||||||||||
|
Thunder Purchaser, Inc. (Vector Solutions)
|
First Lien Incremental Term Loan
|
SOFR(Q)
|
1.00
|
%
|
5.25
|
%
|
9.58
|
%
|
6/30/2028
|
$
|
574,886
|
569,404
|
564,998
|
0.05
|
%
|
E
|
|||||||||||||||||
|
Thunder Purchaser, Inc. (Vector Solutions)
|
First Lien Incremental Delayed Draw Term Loan
|
SOFR(Q)
|
1.00
|
%
|
5.25
|
%
|
9.58
|
%
|
6/30/2028
|
$
|
—
|
(13,054
|
)
|
(23,543
|
)
|
—
|
D/E
|
||||||||||||||||
|
TIBCO Software Inc.
|
First Lien Term Loan
|
SOFR(Q)
|
—
|
3.50
|
%
|
7.83
|
%
|
3/30/2029
|
$
|
3,289,752
|
3,289,752
|
3,303,585
|
0.31
|
%
|
|||||||||||||||||||
|
TIBCO Software Inc.
|
First Lien Term Loan
|
SOFR(Q)
|
—
|
3.75
|
%
|
8.08
|
%
|
3/21/2031
|
$
|
870,400
|
870,400
|
874,286
|
0.08
|
%
|
|||||||||||||||||||
BlackRock Private Credit Fund
Consolidated Schedule of Investments (Continued)
December 31, 2025
|
Issuer(F)
|
Instrument
|
Ref(B)
|
Floor
|
Spread
|
Total
Coupon
|
Maturity
|
Principal
|
Cost
|
Fair
Value |
% of Total
Cash and
Investment
|
Notes
|
||||||||||||||||||||||
|
Debt Investments - Continued
|
|||||||||||||||||||||||||||||||||
|
Software (Continued)
|
|||||||||||||||||||||||||||||||||
|
Trintech, Inc.
|
First Lien Term Loan
|
SOFR(M)
|
1.00
|
%
|
5.50
|
%
|
9.86
|
%
|
7/25/2029
|
$
|
9,312,458
|
$
|
9,100,124
|
$
|
9,076,853
|
0.84
|
%
|
E
|
|||||||||||||||
|
Trintech, Inc.
|
First Lien Revolver
|
SOFR(M)
|
1.00
|
%
|
5.50
|
%
|
9.86
|
%
|
7/25/2029
|
$
|
206,737
|
190,238
|
188,430
|
0.02
|
%
|
E
|
|||||||||||||||||
|
UKG Inc.
|
First Lien Term Loan
|
SOFR(Q)
|
—
|
3.00
|
%
|
7.62
|
%
|
1/30/2031
|
$
|
5,406,199
|
5,389,588
|
5,451,097
|
0.50
|
%
|
|||||||||||||||||||
|
VS Buyer, LLC
|
First Lien Term Loan
|
SOFR(M)
|
—
|
2.75
|
%
|
7.12
|
%
|
4/12/2031
|
$
|
1,496,250
|
1,503,220
|
1,509,342
|
0.14
|
%
|
|||||||||||||||||||
|
Zendesk Inc.
|
First Lien Term Loan
|
SOFR(Q)
|
0.75
|
%
|
5.00
|
%
|
9.33
|
%
|
11/22/2028
|
$
|
2,501,299
|
2,469,693
|
2,526,312
|
0.23
|
%
|
E
|
|||||||||||||||||
|
Zendesk Inc.
|
First Lien Revolver
|
SOFR(Q)
|
0.75
|
%
|
5.00
|
%
|
9.33
|
%
|
11/22/2028
|
$
|
—
|
(3,262
|
)
|
—
|
—
|
D/E
|
|||||||||||||||||
|
Zendesk Inc.
|
First Lien Delayed Draw Term Loan
|
SOFR(Q)
|
0.75
|
%
|
5.00
|
%
|
9.33
|
%
|
11/22/2028
|
$
|
—
|
(3,961
|
)
|
6,109
|
—
|
D/E
|
|||||||||||||||||
|
|
160,902,569
|
162,036,192
|
14.98
|
%
|
|||||||||||||||||||||||||||||
|
Specialty Retail
|
|||||||||||||||||||||||||||||||||
|
Fender Musical Instruments Corp.
|
First Lien Term Loan B
|
SOFR(M)
|
0.50
|
%
|
4.10
|
%
|
8.46
|
%
|
12/1/2028
|
$
|
1,657,878
|
1,609,359
|
1,628,873
|
0.15
|
%
|
||||||||||||||||||
|
Les Schwab Tire Centers (LS Group)
|
First Lien Term Loan
|
SOFR(M)
|
—
|
3.00
|
%
|
7.36
|
%
|
4/17/2031
|
$
|
1,243,750
|
1,248,106
|
1,251,523
|
0.12
|
%
|
|||||||||||||||||||
|
Mavis Discount Tire Inc
|
First Lien Term Loan
|
SOFR(M)
|
—
|
3.50
|
%
|
7.86
|
%
|
5/4/2028
|
$
|
1,231,790
|
1,231,790
|
1,241,607
|
0.11
|
%
|
|||||||||||||||||||
|
Woof Holdings, Inc.
|
First Lien Term Loan
|
SOFR(Q)
|
0.75
|
%
|
4.01
|
%
|
8.34
|
%
|
12/21/2027
|
$
|
934,908
|
916,966
|
601,263
|
0.06
|
%
|
||||||||||||||||||
|
|
5,006,221
|
4,723,266
|
0.44
|
%
|
|||||||||||||||||||||||||||||
|
Trading Companies and Distributors
|
|||||||||||||||||||||||||||||||||
|
BCPE Empire Holdings, Inc.
|
First Lien Term Loan
|
SOFR(M)
|
—
|
3.50
|
%
|
7.86
|
%
|
2/1/2027
|
$
|
1,240,780
|
1,237,324
|
1,249,186
|
0.12
|
%
|
|||||||||||||||||||
|
Foundation Building Materials, Inc
|
First Lien Term Loan
|
SOFR(Q)
|
—
|
4.00
|
%
|
8.59
|
%
|
1/29/2031
|
$
|
1,996,317
|
1,979,128
|
1,970,125
|
0.17
|
%
|
|||||||||||||||||||
|
Veritiv Corp.
|
First Lien Term Loan
|
SOFR(Q)
|
—
|
4.50
|
%
|
8.83
|
%
|
11/17/2030
|
$
|
490,767
|
488,327
|
492,914
|
0.05
|
%
|
|||||||||||||||||||
|
|
3,704,779
|
3,712,225
|
0.34
|
%
|
|||||||||||||||||||||||||||||
|
Textiles, Apparel and Luxury Goods
|
|||||||||||||||||||||||||||||||||
|
WH Borrower, LLC (WHP)
|
First Lien Term Loan
|
SOFR(Q)
|
0.50
|
%
|
5.50
|
%
|
10.15
|
%
|
2/15/2027
|
$
|
99,494
|
(150,506
|
)
|
100,986
|
0.01
|
%
|
D/E
|
||||||||||||||||
|
|
|||||||||||||||||||||||||||||||||
|
Technology Hardware, Storage and Peripherals
|
|||||||||||||||||||||||||||||||||
|
SumUp Holdings Luxembourg S.A.R.L. (Luxembourg)
|
First Lien Delayed Draw Term Loan
|
SOFR(Q)
|
1.00
|
%
|
6.50
|
%
|
11.01
|
%
|
4/25/2031
|
$
|
12,800,000
|
12,688,337
|
12,976,000
|
1.20
|
%
|
C/E
|
|||||||||||||||||
|
|
|||||||||||||||||||||||||||||||||
|
Transportation Infrastructure
|
|||||||||||||||||||||||||||||||||
|
Apple Bidco, LLC
|
First Lien Term Loan
|
SOFR(M)
|
0.50
|
%
|
3.50
|
%
|
7.86
|
%
|
9/22/2028
|
$
|
440,425
|
439,563
|
443,490
|
0.04
|
%
|
||||||||||||||||||
|
Bleriot US Bidco Inc.
|
First Lien Term Loan
|
SOFR(Q)
|
—
|
2.75
|
%
|
7.08
|
%
|
10/30/2026
|
$
|
1,657,849
|
1,651,141
|
1,668,600
|
0.15
|
%
|
|||||||||||||||||||
|
Brown Group Holding, LLC
|
First Lien Term Loan
|
SOFR(M)
|
0.50
|
%
|
2.50
|
%
|
6.86
|
%
|
7/2/2029
|
$
|
1,857,499
|
1,846,465
|
1,865,105
|
0.18
|
%
|
||||||||||||||||||
|
|
3,937,169
|
3,977,195
|
0.37
|
%
|
|||||||||||||||||||||||||||||
|
|
|||||||||||||||||||||||||||||||||
|
Total Debt Investments - 159.7% of Net Assets
|
1,034,648,797
|
1,039,985,833
|
96.19
|
%
|
|||||||||||||||||||||||||||||
|
|
|||||||||||||||||||||||||||||||||
|
Equity Securities
|
|||||||||||||||||||||||||||||||||
|
IT Services
|
|||||||||||||||||||||||||||||||||
|
New Insight Holdings, Inc. (Dynata)
|
Common Stock
|
$
|
22,972
|
402,032
|
407,753
|
0.04
|
%
|
E, I, J
|
|||||||||||||||||||||||||
|
|
|||||||||||||||||||||||||||||||||
|
Paper and Forest Products
|
|||||||||||||||||||||||||||||||||
|
48forty Intermediate Holdings, Inc.
|
Common Stock
|
$
|
362
|
—
|
—
|
—
|
E, I, J
|
||||||||||||||||||||||||||
|
|
|||||||||||||||||||||||||||||||||
|
Total Equity Securities - 0.1% of Net Assets
|
402,032
|
407,753
|
0.04
|
%
|
|||||||||||||||||||||||||||||
|
|
|||||||||||||||||||||||||||||||||
|
Total Investments - 159.8% of Net Assets
|
1,035,050,829
|
1,040,393,586
|
96.23
|
%
|
|||||||||||||||||||||||||||||
|
|
|||||||||||||||||||||||||||||||||
|
Cash and Cash Equivalents - 6.3% of Net Assets
|
41,078,437
|
3.77
|
%
|
||||||||||||||||||||||||||||||
|
|
|||||||||||||||||||||||||||||||||
|
Total Cash and Investments - 166.1% of Net Assets
|
1,081,472,023
|
100.00
|
%
|
||||||||||||||||||||||||||||||
BlackRock Private Credit Fund
Consolidated Schedule of Investments (Continued)
December 31, 2024
Notes to Schedule of Investments:
| (A) |
Debt investments include investments in bank debt that generally are bought and sold among institutional investors in transactions not subject to registration under the Securities Act of 1933 (the
“Securities Act”). Such transactions are generally subject to contractual restrictions, such as approval of the agent or borrower.
|
| (B) |
100.0% of the fair value of total senior secured loans in the Fund’s portfolio bear interest at a floating rate that may be determined by reference to the Secured Overnight Financing Rate (“SOFR”),
“S”, or other base rate (commonly the Federal Funds Rate or the Prime Rate), “P”. In addition, 81.2% of the fair value of such senior secured loans have floors of 0.50% to 2.00%. The borrower under a senior secured loan generally
has the option to select from interest reset periods of one, two, three or six months and may alter that selection at the end of any reset period. The stated interest rate represents the weighted average interest rate at December
31, 2024 of all contracts within the specified loan facility. SOFR resets monthly (M), quarterly (Q) or semiannually (S).
|
| (C) |
Non-U.S. company or principal place of business outside the U.S. and as a result, the investment is not a qualifying asset under Section 55(a) of the Investment Company Act of 1940 (the “1940 Act”).
Under the 1940 Act, the Fund may not acquire any non-qualifying asset unless, at the time such acquisition is made, qualifying assets represent at least 70% of the Fund's total assets.
|
| (D) |
Negative balances represent unfunded commitments that were acquired and/or valued at a discount.
|
| (E) |
Investments are considered Level 3 in accordance with ASC Topic 820 (see Note 2).
|
| (F) |
As of December 31, 2024, the Fund generally uses GICS codes to identify the industry groupings.
|
| (G) |
Non-accruing debt investment.
|
| (H) |
In addition to the stated coupon, investment has an exit fee payable upon repayment of the loan in an amount equal to the percentage of the original principal amount shown.
|
| (I) |
Restricted security (See Note 12).
|
| (J) |
Non-income producing investment.
|
| (K) |
Deemed an investment company under Section 3(c) of the 1940 Act and as a result, the investment is not a qualifying asset under Section 55(a) of the 1940 Act. Under the 1940 Act, the Fund may not
acquire any non-qualifying asset unless, at the time such acquisition is made, qualifying assets represent at least 70% of the Fund's total assets
|
Aggregate acquisitions and aggregate dispositions of investments totaled $775,269,249 and $142,736,794, respectively for the year ended December 31, 2024. Aggregate acquisitions include
investment assets received as payment in kind. Aggregate dispositions include principal paydowns on investments. The total value of restricted securities and bank debt as of December 31, 2024 was $1,040,393,586 or 96.2% of total cash and
investments of the Fund. As of December 31, 2024, approximately 5.7% of the total assets of the Fund were not qualifying assets under Section 55(a) of the 1940 Act.
See accompanying notes to the consolidated financial statements.
BlackRock Private Credit Fund (“BDEBT” or the “Fund”), is a Delaware statutory trust formed on December 23, 2021. The Fund is a non-diversified, closed-end management
investment company that has elected to be regulated as a business development company (“BDC”) under the Investment Company Act of 1940 (the “1940 Act”). The Fund is externally managed by BlackRock Capital Investment Advisors, LLC (the
“Investment Adviser”). BlackRock Advisors, LLC (the “Sub-Adviser” and, together with the Investment Adviser, the “Advisers”) serves as the Fund’s sub-adviser. The Advisers are subsidiaries of BlackRock, Inc. (together with its subsidiaries,
including but not limited to the Advisers, “BlackRock”). BlackRock Financial Management, Inc. serves as the administrator of the Fund (the “Administrator”), and is affiliated with the Advisers.
The Fund has elected to be treated for federal income tax purposes, and intends to qualify annually, as a regulated investment company (“RIC”) as defined under
Subchapter M of the Internal Revenue Code of 1986, as amended (the “Code”). As a RIC, the Fund will not be taxed on its income to the extent that it distributes such income each year and satisfies other applicable income tax requirements.
The Fund’s investment objective is to target high risk-adjusted returns produced primarily from current income generated by investing primarily in directly originated,
senior secured corporate debt instruments. The Fund intends to meet its investment strategy by focusing primarily on originating and making loans to U.S. middle market companies. BDEBT defines “middle market companies” to generally mean
companies with earnings before interest expense, income tax expense, depreciation and amortization, or “EBITDA”, between $10 million and $250 million annually and/or annual revenue of $50 million to $2.5 billion at the time of investment.
The Fund generally targets the core segment of the middle market, which is defined as companies with EBITDA of between $25 million and $75 million, though the Fund may invest in smaller or larger companies if an attractive opportunity
presents itself, especially where there are dislocations in the capital markets. While BDEBT focuses its investments in U.S. companies, the Fund may make investments in portfolio companies that are domiciled outside of the United States.
The Fund invests in senior secured or unsecured loans, subordinated loans or mezzanine loans and, to a lesser extent, equity and equity-related securities which includes common and preferred stock, securities convertible into common stock,
and warrants.
The Fund offers on a continuous basis up to $5.0 billion of common shares of beneficial interest (“Common Shares”) pursuant to an offering registered with the
Securities and Exchange Commission. The Fund offers to sell any combination of three classes of Common Shares, Institutional Class shares, Class S shares and Class D shares, with a dollar value up to the maximum offering amount. The share
classes have different ongoing shareholder servicing and/or distribution fees. The initial purchase price for the Institutional Class shares was $25.00 per share. Thereafter, the purchase price per share for each class of Common Shares
equals the net asset value per share, as of the effective date of the monthly share purchase date. The Fund also engages in private offerings of its Common Shares.
2. Summary of Significant Accounting Policies
Basis of Presentation
The consolidated financial statements of the Fund have been prepared in accordance with accounting principles generally accepted in the United States (“GAAP”). The Fund
is an investment company following accounting and reporting guidance in Financial Accounting Standards Board (“FASB”) Accounting Standards Codification (“ASC”) Topic 946, Financial Services—Investment
Companies (“ASC Topic 946”). The Fund has consolidated the results of its wholly owned subsidiaries in its consolidated financial statements in accordance with ASC Topic 946. The following is a summary of the significant
accounting policies of the Fund.
Reclassifications
Certain prior period balances in the investment level tables were reclassified to conform to the current period presentation.
Use of Estimates
The preparation of the consolidated financial statements in conformity with GAAP requires management to make estimates and assumptions that affect the reported amounts
of assets and liabilities and disclosure of contingent assets and liabilities at the date of the consolidated financial statements, as well the reported amounts of revenues and expenses during the reporting periods presented. Although
management believes these estimates and assumptions to be reasonable, actual results could differ from those estimates and such differences could be material.
Investment Valuation
Pursuant to Rule 2a-5 under the 1940 Act, which establishes requirements for determining fair value in good faith for purposes of the 1940 Act, the Fund's board of
trustees (the "Board of Trustees") designated the Investment Adviser as the Fund's valuation designee (the "Valuation Designee") to perform certain fair value functions, including performing fair value determinations. As required by the
Rule 2a-5, the Valuation
F-34
2. Summary of Significant Accounting Policies (Continued)
Designee provides periodic fair valuation reporting and notifications on behalf of the Fund to the Board of Trustees to facilitate the Board of Trustees' oversight duties.
The Valuation Designee values investments at fair value in accordance with GAAP, based upon the principles and methods of valuation set forth in the Valuation
Designee's policies and procedures adopted for the Fund by the Valuation Designee and approved by the Board of Trustees. Fair value is generally defined as the amount for which an investment would be sold in an orderly transaction between
market participants at the measurement date.
All investments are valued at least monthly based on quotations or other affirmative pricing from independent third-party sources, with the exception of investments
priced directly by the Valuation Designee which in the aggregate comprise less than 5% of the capitalization of the Fund. Investments listed on a recognized exchange or market quotation system, whether U.S. or foreign, are valued using the
closing price on the date of valuation.
Investments not listed on a recognized exchange or market quotation system, but for which reliable market quotations are readily available are valued using prices
provided by a nationally recognized pricing service or by using quotations from broker-dealers.
Investments for which market quotations are either not readily available or are determined to be unreliable are priced at fair value using affirmative valuations
performed by independent valuation services approved by the Valuation Designee or, for investments aggregating less than 5% of the total assets of the Fund, using valuations determined directly by the Valuation Designee. Such valuations are
determined under documented valuation policies and procedures reviewed and approved by a committee established by the Valuation Designee (the "Valuation Committee").
Generally, to increase objectivity in valuing the investments, the Valuation Designee will utilize external measures of value, such as public markets or third-party
transactions, whenever possible. The Valuation Designee’s valuation is not based on long-term work-out value, immediate liquidation value, nor incremental value for potential changes that may take place in the future. The values assigned to
investments are based on available information and do not necessarily represent amounts that might ultimately be realized, as these amounts depend on future circumstances and cannot reasonably be determined until the individual investments
are actually liquidated. Such circumstances may include macroeconomic, geopolitical and other events, rising interest rates and risks related to inflation that may significantly impact the profitability or viability of businesses in which
the Fund is invested, and therefore may significantly impact the return on and realizability of the Fund’s investments. The foregoing policies apply to all investments, including any in companies and groups of affiliated companies
aggregating more than 5% of the Fund’s assets.
Fair valuations of investments in each asset class are determined using one or more methodologies including market quotations, the market approach, income approach, or,
in the case of recent investments, the cost approach, as appropriate. The market approach uses prices and other relevant information generated by market transactions involving identical or comparable assets. Such information may include
observed multiples of earnings and/or revenues at which transactions in securities of comparable companies occur, with appropriate adjustments for differences in company size, operations or other factors affecting comparability.
The income approach uses valuation techniques to convert future amounts (for example, cash flows or earnings) to a single present value amount (discounted). The
measurement is based on the value indicated by current market expectations about those future amounts. The discount rates used for such analyses reflect market yields for comparable investments, considering such factors as relative credit
quality, capital structure, and other factors.
In following these approaches, the types of factors that may be taken into account also include, as relevant and among other factors: available current market data,
including relevant and applicable market trading and transaction comparables, security covenants, call protection provisions, information rights, the nature and realizable value of any collateral, the portfolio company’s ability to make
payments, its earnings and cash flows, the markets in which the portfolio company does business, comparisons of financial ratios of peer companies that are public, merger and acquisition comparables, comparable costs of capital, the
principal market in which the investment trades and enterprise values.
Investments may be categorized based on the types of inputs used in valuing such investments. The level in the GAAP valuation hierarchy in which an investment falls is
based on the lowest level input that is significant to the valuation of the investment in its entirety. Transfers between levels are recognized as of the beginning of the reporting period.
F-35
2. Summary of Significant Accounting Policies (Continued)
At December 31, 2025, the Fund’s investments were categorized as follows:
|
Level
|
Basis for Determining Fair Value
|
Broadly Syndicated
Loans(1)
|
Middle Market Loans(2)
|
Equity Securities
|
Total
|
||||||||||||||
|
1
|
Quoted prices in active markets for identical assets
|
$
|
—
|
$
|
—
|
$
|
—
|
$
|
—
|
||||||||||
|
2
|
Other direct and indirect observable market inputs(3)
|
446,946,363
|
157,707,896
|
120,603
|
604,774,862
|
||||||||||||||
|
3
|
Valuation sources that employ significant unobservable inputs
|
5,489,499
|
1,634,436,928
|
—
|
1,639,926,427
|
||||||||||||||
|
Total
|
$
|
452,435,862
|
$
|
1,792,144,824
|
$
|
120,603
|
$
|
2,244,701,289
|
|||||||||||
| (1) |
Includes senior secured loans that are broadly syndicated
|
| (2) |
Includes other senior secured loans
|
| (3) |
For example, quoted prices in inactive markets or quotes for comparable investments
|
Unobservable inputs used in the fair value measurement of Level 3 investments as of December 31, 2025 included the following:
|
Asset Type
|
Fair Value
|
Valuation Technique
|
Unobservable Input
|
Weighted Average Range(1)
|
||||||
|
Broadly Syndicated Loans
|
$
|
5,489,499
|
Market Quotations
|
Indicative bid/ask quotes
|
1 (1)
|
|||||
|
Middle Market Loans
|
1,525,958,709
|
Income Approach
|
Discount rate
|
7.7% - 17.2% (9.6%)
|
||||||
|
2,244,421
|
Market Comparable Companies
|
EBITDA Multiple
|
10.0x (10.0x)
|
|||||||
|
2,754,952
|
Market Comparable Companies
|
Revenue Multiple
|
0.9x (0.9x)
|
|||||||
|
85,674,613
|
Market Quotations
|
Indicative bid/ask quotes
|
1 (1)
|
|||||||
|
17,804,233
|
Transaction Approach
|
N/A
|
N/A
|
|||||||
|
Equity Securities
|
—
|
Market Comparable Companies
|
EBITDA Multiple
|
10.0x (10.0x)
|
||||||
|
—
|
Market Comparable Companies
|
Revenue Multiple
|
0.9x (0.9x)
|
|||||||
|
$
|
1,639,926,427
|
|||||||||
| (1) |
Representing the weighted average of each significant unobservable input range at the investment level by fair value.
|
During the year ended December 31, 2025, two senior debt positions with an aggregate fair value of $8.4 million transitioned from market quotes to an income approach, and one senior debt position
with a fair value of $0.8 million transitioned from an income approach to a transaction price valuation model. The changes in approach were driven by considerations given to the financial performance of each portfolio company.
Certain fair value measurements may employ more than one valuation technique, with each valuation technique receiving a relative weight between 0% and 100%. Generally,
a change in an unobservable input may result in a change to the value of an investment as follows:
|
Input
|
Impact to Value if Input Increases
|
Impact to Value if Input Decreases
|
||
|
Discount rate
|
Decrease
|
Increase
|
||
|
Revenue multiples
|
Increase
|
Decrease
|
||
|
EBITDA multiples
|
Increase
|
Decrease
|
||
|
Book value multiples
|
Increase
|
Decrease
|
||
|
Implied volatility
|
Increase
|
Decrease
|
||
|
Term
|
Increase
|
Decrease
|
||
|
Yield
|
Increase
|
Decrease
|
F-36
2. Summary of Significant Accounting Policies (Continued)
Changes in investments categorized as Level 3 for the year ended December 31, 2025 were as follows:
|
Independent Third-Party Valuation
|
||||||||||||||||
|
Broadly Syndicated
Loans
|
Middle Market
Loans
|
Equity
Securities
|
Total
|
|||||||||||||
|
Beginning balance
|
$
|
6,263,383
|
$
|
742,747,140
|
$
|
407,753
|
$
|
749,418,276
|
||||||||
|
Net realized and unrealized gains (losses)
|
(30,579
|
)
|
(10,269,471
|
)
|
(645,215
|
)
|
(10,945,265
|
)
|
||||||||
|
Acquisitions(1)
|
5,020,358
|
1,085,718,520
|
645,215
|
1,091,384,093
|
||||||||||||
|
Dispositions
|
(1,249,605
|
)
|
(183,759,261
|
)
|
—
|
(185,008,866
|
)
|
|||||||||
|
Transfers into Level 3(2)
|
501,867
|
—
|
—
|
501,867
|
||||||||||||
|
Transfers out Level 3(3)
|
(5,015,925
|
)
|
—
|
(407,753
|
)
|
(5,423,678
|
)
|
|||||||||
|
Ending balance
|
$
|
5,489,499
|
$
|
1,634,436,928
|
$
|
—
|
$
|
1,639,926,427
|
||||||||
|
Net change in unrealized appreciation/depreciation during the period on investments still held at period end (included in net realized and unrealized
gains/losses, above)
|
$
|
1,570
|
$
|
(8,394,514
|
)
|
$
|
(645,215
|
)
|
$
|
(9,038,159
|
)
|
|||||
| (1) |
Includes payments received in kind and accretion of original issue and market discounts.
|
| (2) |
Comprised of one investment that was transferred from Level 2 to Level 3 due to decreased observable market activity.
|
| (3) |
Comprised of two investments that were transferred from Level 3 to Level 2 due to increased observable market activity.
|
At December 31, 2024, the Fund’s investments were categorized as follows:
|
Level
|
Basis for Determining Fair Value
|
Broadly Syndicated
Loans(1)
|
Middle Market
Loans(2)
|
Equity
Securities
|
Total
|
||||||||||||||
|
1
|
Quoted prices in active markets for identical assets
|
$
|
—
|
$
|
—
|
$
|
—
|
$
|
—
|
||||||||||
|
2
|
Other direct and indirect observable market inputs(3)
|
182,811,825
|
108,163,485
|
—
|
290,975,310
|
||||||||||||||
|
3
|
Valuation sources that employ significant unobservable inputs
|
6,263,383
|
742,747,140
|
407,753
|
749,418,276
|
||||||||||||||
|
Total
|
$
|
189,075,208
|
$
|
850,910,625
|
$
|
407,753
|
$
|
1,040,393,586
|
|||||||||||
| (1) |
Includes senior secured loans that are broadly syndicated
|
| (2) |
Includes other senior secured loans
|
| (3) |
For example, quoted prices in inactive markets or quotes for comparable investments
|
Unobservable inputs used in the fair value measurement of Level 3 investments as of December 31, 2024 included the following:
|
Asset Type
|
Fair Value
|
Valuation Technique
|
Unobservable Input
|
Weighted Average Range(1)
|
||||||
|
Broadly Syndicated Loans
|
$
|
6,263,383
|
Market Quotations
|
Indicative bid/ask quotes
|
1 (1)
|
|||||
|
Middle Market Loans
|
610,403,130
|
Income Approach
|
Discount rate
|
8.6% - 14.0% (10.2%)
|
||||||
|
4,388,593
|
Asset Approach
|
EBITDA Multiple
|
7.50x (7.50x)
|
|||||||
|
125,316,079
|
Market Quotations
|
Indicative bid/ask quotes
|
1 (1)
|
|||||||
|
2,639,338
|
Market Comparable Companies
|
Revenue Multiple
|
0.9x (0.9x)
|
|||||||
|
Equity Securities
|
—
|
Asset Approach
|
EBITDA Multiple
|
7.50x (7.50x)
|
||||||
|
407,753
|
Market Quotations
|
Indicative bid/ask quotes
|
1 (1)
|
|||||||
|
$
|
749,418,276
|
|||||||||
(1) Representing the weighted average of each significant unobservable input range at the investment level by fair value.
F-37
2. Summary of Significant Accounting Policies (Continued)
Changes in investments categorized as Level 3 for the year ended December 31, 2024 were as follows:
|
Independent Third-Party Valuation
|
||||||||||||||||
|
Broadly Syndicated
Loans
|
Middle Market
Loans
|
Equity
Securities
|
Total
|
|||||||||||||
|
Beginning balance
|
$
|
960,209
|
$
|
248,713,244
|
$
|
—
|
$
|
249,673,453
|
||||||||
|
Net realized and unrealized gains (losses)
|
99,709
|
2,910,742
|
5,721
|
3,016,172
|
||||||||||||
|
Acquisitions(1)
|
5,394,954
|
569,899,492
|
402,032
|
575,696,478
|
||||||||||||
|
Dispositions
|
(966,986
|
)
|
(67,725,568
|
)
|
—
|
(68,692,554
|
)
|
|||||||||
|
Transfers into Level 3(2)
|
775,497
|
2,370,776
|
—
|
3,146,273
|
||||||||||||
|
Transfers out Level 3(3)
|
—
|
(13,421,546
|
)
|
—
|
(13,421,546
|
)
|
||||||||||
|
Ending balance
|
$
|
6,263,383
|
$
|
742,747,140
|
$
|
407,753
|
$
|
749,418,276
|
||||||||
|
Net change in unrealized appreciation/depreciation during the period on investments still held at period end (included in net realized and unrealized
gains/losses, above)
|
$
|
2,034
|
$
|
1,747,385
|
$
|
5,721
|
$
|
1,755,140
|
||||||||
| (1) |
Includes payments received in kind and accretion of original issue and market discounts.
|
| (2) |
Comprised of three investments that were transferred from Level 2 to Level 3 due to decreased observable market activity.
|
| (3) |
Comprised of two investments that were transferred from Level 3 to Level 2 due to increased observable market activity.
|
F-38
2. Summary of Significant Accounting Policies (Continued)
Investment Transactions
Investment transactions are accounted for on the trade date, except for private transactions that have conditions to closing, which are recorded on the closing date. The
cost of investments purchased is based upon the purchase price plus those professional fees which are specifically identifiable to the investment transaction. Realized gains and losses on investments are recorded based on the specific
identification method, which typically allocates the highest cost inventory to the basis of investments sold.
Cash and Cash Equivalents
Cash consists of amounts held in accounts with the custodian bank. Cash equivalents consist of highly liquid investments with an original maturity of generally 60 days
or less and may not be insured by the FDIC or may exceed federally insured limits. Cash equivalents are classified as Level 1 in the GAAP valuation hierarchy. At December 31, 2025, included in cash and cash equivalents was $201.4
million (12.8% of net assets) held in the JPMorgan U.S. Treasury Plus Money Market Fund with a 7-day yield of 3.63%. At December 31, 2024, included in cash and cash equivalents was $19.7 million (3.0% of net assets) held in the JPMorgan
U.S. Treasury Plus Money Market Fund with a 7-day yield of 4.35%.
Restricted Investments
The Fund may invest without limitation in instruments that are subject to legal or contractual restrictions on resale. These instruments generally may be resold to
institutional investors in transactions exempt from registration or to the public if the securities are registered. Disposal of these investments may involve time-consuming negotiations and additional expense, and prompt sale at an
acceptable price may be difficult. Information regarding restricted investments is included at the end of the Schedules of Investments. Restricted investments, including any restricted investments in affiliates, are valued in accordance
with the investment valuation policies discussed above.
Foreign Currency Investments
The Fund may invest in instruments traded in foreign countries and denominated in foreign currencies. Foreign currency denominated investments comprised approximately
2.3% and 0.0% of total investments at December 31, 2025 and December 31, 2024, respectively. Such positions were converted at the respective closing foreign exchange rates in effect at December 31, 2025 and reported in U.S. dollars.
Purchases and sales of investments and income and expense items denominated in foreign currencies, when they occur, are translated into U.S. dollars based on the foreign exchange rates in effect on the respective dates of such
transactions. The portion of gains and losses on foreign investments resulting from fluctuations in foreign currencies is included in net realized and unrealized gain or loss from investments.
F-39
2. Summary of Significant Accounting Policies (Continued)
Investments in foreign companies and securities of foreign governments may involve special risks and considerations not typically associated with investing in U.S.
companies and securities of the U.S. Government. These risks include, among other things, revaluation of currencies, less reliable information about issuers, different transaction clearance and settlement practices, and potential future
adverse political and economic developments. Moreover, investments in foreign companies and securities of foreign governments and their markets may be less liquid and their prices more volatile than those of comparable U.S. companies
and the U.S. Government.
Organization and Offering Costs
The Fund entered into a Fee Waiver and Expense Support and Reimbursement Agreement (the “Expense Support Agreement”) with the Investment Adviser. Pursuant to the Expense
Support Agreement, the Investment Adviser paid all of the Fund’s organizational and offering expenses on the Fund’s behalf (each, an “Expense Support Agreement Expense Payment”).
During each of the 36 months following the commencement of the Fund’s operations (the "Reimbursement Period"), the Fund agreed to reimburse the Investment Adviser for
any and all Expense Support Agreement Expense Payments incurred by the Investment Adviser under the Expense Support Agreement to the extent that the Fund’s annual Operating Expenses (as defined below) did not exceed 1.25% of the value
of the Fund’s net assets, calculated monthly based on month-end net assets. “Operating Expenses” for purposes of the Expense Support Agreement means all annual operating expenses of the Fund incurred in the ordinary course of business,
excluding offering costs incurred by the Fund, interest expense and other financing costs, portfolio transaction and other investment-related costs, base management fee and incentive fee payable pursuant to the Advisory Agreement,
shareholder servicing and/or distribution fees, taxes and any other extraordinary expenses not incurred in the ordinary course of business (including, without limitation, litigation expenses). The Reimbursement Period expired on March
18, 2025. From inception of the Fund through the expiration of the Reimbursement Period, the Fund reimbursed the Investment Adviser for $0.2 million related to organizational expenses and $0.6 million related to offering expenses of the
Fund pursuant to the Expense Support Agreement.
Deferred Debt Issuance Costs
Certain costs incurred in connection with the issuance of debt of the Fund were capitalized and are being amortized on a straight-line basis over the estimated life of
the respective instruments. The impact of utilizing the straight-line amortization method versus the effective-interest method is not material to the operations of the Fund.
Revenue Recognition
Interest and dividend income, including income paid in kind, is recorded on an accrual basis, when such amounts are considered collectible. Origination, structuring,
closing, commitment and other upfront fees, including original issue discounts, earned with respect to capital commitments are generally amortized or accreted into interest income over the life of the respective debt investment, as are
end-of-term or exit fees receivable upon repayment of a debt investment. Other fees, including certain amendment fees, prepayment fees and commitment fees on broken deals, are recognized as earned. Prepayment fees and similar income due
upon the early repayment of a loan or debt security are recognized when earned and are included in interest income.
Certain debt investments are purchased at a discount to par as a result of the underlying credit risks and financial results of the issuer, as well as general market
factors that influence the financial markets as a whole. Discounts on the acquisition of corporate bonds are generally amortized using the effective-interest or constant-yield method assuming there are no questions as to collectability.
When principal payments on a loan are received in an amount in excess of the loan’s amortized cost, the excess principal payments are recorded as interest income.
Debt investments are generally placed on non-accrual status when it is probable that principal or interest will not be collected according to the contractual terms. When
a debt investment is placed on non-accrual status, accrued and unpaid interest (including any accrued PIK interest) is generally reversed, and discount accretion or premium amortization is discontinued. The Fund does not reverse
previously capitalized PIK income. Payments received on non-accrual investments may be recognized as income or applied to principal depending upon the Fund's judgment regarding collectability of the outstanding principal and interest.
Non-accrual investments are restored to accrual status if past due principal and interest are paid or, in the Fund's judgement, the repayment of the remaining contractual principal and interest is expected. The Fund may opt not to place
a distressed debt investment on non-accrual status if principal and interest are secured through sufficient collateral value and are in the process of collection through legal actions or other efforts that are expected to result in
repayment of principal and interest.
F-40
2. Summary of Significant Accounting Policies (Continued)
Income Taxes
The Fund elected to be regulated as a BDC under the 1940 Act. The Fund also has elected to be treated as a RIC under the Code. So long as the Fund maintains its status
as a RIC, it generally will not pay corporate-level U.S. federal income taxes on any ordinary income or capital gains that it distributes at least annually to its shareholders as dividends. Rather, any tax liability related to income
earned and distributed by the Fund would represent obligations of the Fund’s investors and would not be reflected in the consolidated financial statements of the Fund.
The Fund evaluates tax positions taken or expected to be taken in the course of preparing its consolidated financial statements to determine whether the tax positions
are “more-likely-than-not” to be sustained by the applicable tax authority. Tax positions not deemed to meet the “more likely- than-not” threshold are reserved and recorded as a tax benefit or expense in the current year. All penalties
and interest associated with income taxes are included in income tax expense. Conclusions regarding tax positions are subject to review and may be adjusted at a later date based on factors including, but not limited to, on-going
analyses of tax laws, regulations and interpretations thereof.
To qualify for and maintain qualification as a RIC, the Fund must, among other things, meet certain source-of-income and asset diversification requirements. In addition,
to qualify for RIC tax treatment, the Fund must distribute to its shareholders, for each taxable year, at least 90% of the sum of (i) its “investment company taxable income” for that year (without regard to the deduction for dividends
paid), which is generally its ordinary income plus the excess, if any, of its realized net short-term capital gains over its realized net long-term capital losses and (ii) its net tax exempt income, if any.
In addition, based on the excise tax distribution requirements, the Fund is subject to a 4% nondeductible federal excise tax on undistributed income unless the Fund
distributes in a timely manner in each taxable year an amount at least equal to the sum of (1) 98% of its ordinary income for the calendar year, (2) 98.2% of capital gain net income (both long-term and short-term) for the one-year
period ending October 31 in that calendar year and (3) any income realized, but not distributed, in prior years. For this purpose, however, any ordinary income or capital gain net income retained by the Fund that is subject to corporate
income tax is considered to have been distributed.
U.S. GAAP requires that certain components of net assets be adjusted to reflect permanent differences between financial and tax reporting. These reclassifications have
no effect on net assets or net asset values per share. As of December 31, 2025 and December 31, 2024, permanent difference attributable to non-deductible expenses were reclassified to the following accounts:
|
December 31, 2025
|
December 31, 2024
|
|||||||
|
Paid-in capital
|
$
|
(3,679,401
|
)
|
$
|
-
|
|||
|
Accumulated earnings
|
3,679,401
|
-
|
||||||
The tax character of distributions paid were as follows:
|
December 31, 2025
|
December 31, 2024
|
|||||||
|
Ordinary income
|
$
|
110,388,295
|
$
|
46,687,309
|
||||
|
Long Term Capital Gains
|
-
|
126,412
|
||||||
|
Return of Capital
|
244,391
|
-
|
||||||
|
Total
|
$
|
110,632,686
|
$
|
46,813,721
|
||||
As of December 31, 2025 and December 31, 2024, the tax components of accumulated net earnings (losses) were as follows:
|
December 31, 2025
|
December 31, 2024
|
|||||||
|
Undistributed ordinary income
|
$
|
-
|
$
|
-
|
||||
|
Capital Loss Carryforward (1)
|
(2,743,063
|
)
|
(255,056
|
)
|
||||
|
Net unrealized gains (losses)(2)
|
(23,750,955
|
)
|
3,219,470
|
|||||
|
Total accumulated earnings (losses)
|
$
|
(26,494,018
|
)
|
2,964,414
|
||||
(1) Amount available to offset future realized capital gains.
(2) The difference between book-basis and tax-basis net unrealized gains (losses) was attributable primarily to amortization methods on fixed income securities and the accrual of income on securities in
default.
F-41
2. Summary of Significant Accounting Policies (Continued)
Important Tax Information
As of December 31, 2025 and 2024, gross unrealized appreciation and depreciation based on cost of investments (including short positions and derivatives, if any) for
U.S. federal income tax purposes were as follows:
|
December 31, 2025
|
December 31, 2024
|
|||||||
|
Tax basis of investments
|
$
|
2,255,420,846
|
$
|
1,035,957,647
|
||||
|
Unrealized appreciation
|
14,461,831
|
9,539,829
|
||||||
|
Unrealized depreciation
|
(25,181,388
|
)
|
(5,103,890
|
)
|
||||
|
Net unrealized appreciation (depreciation)
|
$
|
(10,719,557
|
)
|
$
|
4,435,939
|
|||
The Fund hereby designates the following amount, or maximum amount allowable by law, as interest income eligible to be treated as a Section 163(j) interest dividend for
the fiscal years ended December 31, 2025:
|
December 31, 2025
|
||||
|
Interest Dividends
|
$
|
99,583,035
|
||
The fund hereby designates the following amounts, or maximum amounts allowable by law, as interest-related dividends eligible for exemption from U.S. withholding tax for
nonresident aliens and foreign corporations for the fiscal years ended December 31, 2025:
|
December 31, 2025
|
||||
|
Interest-Related Dividends
|
$
|
93,397,470
|
||
F-42
2. Summary of Significant Accounting Policies (Continued)
Allocation of Income, Expenses, Gains and Losses
Income, expenses (other than those attributable to a specific class), gains and losses are allocated to each class of shares based upon the relative proportion of net
assets represented by such class. Operating expenses directly attributable to a specific class are charged against the operations of that class.
Distributions
Distributions to shareholders are recorded on the record date. All distributions will be paid at the discretion of the Board and will depend on the Fund’s earnings,
financial condition, maintenance of the Fund’s tax treatment as a RIC, compliance with applicable BDC regulations and such other factors as the Board may deem relevant from time to time. Although the gross distribution per share is
generally equivalent for each share class, the net distribution for each share class is reduced for any class specific expenses, including distribution and shareholder servicing fees, if any.
Recent Accounting Pronouncements
The Fund considers the applicability and impact of all accounting standard updates ("ASU") issued by the Financial Accounting Standards Board (the "FASB"). ASUs not
listed were assessed by the Fund and either determined to be not applicable or expected to have minimal impact on its consolidated financial statements.
In December 2023, the FASB issued ASU 2023-09, Income Taxes (Topic 740): Improvements to Income Tax Disclosures (“ASU 2023-09”), which intends to improve the
transparency of income tax disclosures. ASU 2023-09 is effective for fiscal years beginning after December 15, 2024 and permits early adoption. The Fund adopted the ASU 2023-09 for the annual reporting period beginning on January 1,
2025 and concluded that the application of this guidance did not have any material impact on its consolidated financial statements.
In November 2024, the FASB issued ASU 2024-03, “Income Statement—Reporting Comprehensive Income—Expense Disaggregation Disclosures (Subtopic 2200-40),” which requires
disaggregated disclosure of certain costs and expenses, including purchases of inventory, employee compensation, depreciation, amortization and depletion, in each relevant expense caption. ASU 2024-03 is effective for fiscal years
beginning after December 15, 2026, and interim reporting periods beginning after December 15, 2027. Early adoption and retrospective application is permitted. The Fund is currently assessing the impact of this guidance, however, the
Company does not expect a material impact on its consolidated financial statements.
3. Management Fees, Incentive Fees and Other Expenses
Investment Advisory Agreement
On March 16, 2022, the Fund entered into an Investment Advisory Agreement (the “Advisory Agreement”) with the Investment Adviser. Under the terms of the Advisory
Agreement, the Investment Adviser determines the composition of the Fund’s portfolio, the nature and timing of the changes to the Fund’s portfolio and the manner of implementing such changes; identifies, evaluates and negotiates the
structure of the investments the Fund makes (including performing due diligence on prospective portfolio companies); and closes, monitors and administers the investments the Fund makes, including the exercise of any voting or consent
rights.
Pursuant to the Advisory Agreement, the Fund pays the Investment Adviser compensation for investment advisory and management services consisting of base management
fee and incentive fee (together, the “Advisory Fee”), which are further described below.
F-43
3. Management Fees, Incentive Fees and Other Expenses (Continued)
Base Management Fee
The management fee is calculated at an annual rate of 1.25% of the value of the Fund’s net assets at the end of the most recently completed calendar month and payable
monthly in arrears. For purposes of calculating the base management fee, “net assets” means the Fund’s total assets less liabilities determined on a consolidated basis in accordance with GAAP. The Investment Adviser waived its
management fee for the first twelve months following the date of the commencement of the Fund's operations. On April 25, 2023, the Fund's Board of Trustees approved an amendment of the Amended and Restated Fee Waiver and Expense Support
and Reimbursement Agreement, which extended the waiver through December 31, 2023.
For the years ended December 31, 2025 and 2024, the Investment Adviser earned $12.3 million and $4.9 million in management fees, respectively. For the year ended
December 31, 2023, the Investment Adviser earned and waived $2.0 million in management fees.
Incentive Fees
Incentive compensation is payable to the Investment Adviser pursuant to the Advisory Agreement. The incentive fee consists of two components, an income component and a
capital gains component. Each component of the incentive fee will be calculated and, if due, will be payable quarterly in arrears. The Investment Adviser waived all incentive fee for the first twelve months following the commencement of
the Fund's operations. On April 25, 2023, the Fund's Board of Trustees approved an amendment of the Expense Support Agreement, which extended the waiver through December 31, 2023.
The income component of the incentive fee will be the amount, if positive, equal to 12.5% of the aggregate net investment income before incentive compensation earned for
the most recent calendar quarter and the preceding eleven calendar quarters (or if shorter, the number of calendar quarters that have occurred since commencement of the Fund), less aggregate income incentive compensation previously paid
in with respect to the first eleven calendar quarters (or the portion thereof) included in the relevant trailing twelve quarters.
The income component of the incentive fee is subject to a 5.0% total return hurdle on daily weighted average unreturned capital contributions (the “Hurdle Rate”). As
such, the Fund will not be obligated to pay any income incentive fee to the extent the annualized trailing twelve quarter (or if shorter, the number of calendar quarters that have occurred since the commencement of the Fund) total
return of the Fund (as defined below), including net realized gains and losses and net unrealized appreciation and depreciation, does not exceed the Hurdle Rate. To the extent that the Fund’s
annualized total return for the relevant period exceeds the Hurdle Rate, but is less than approximately 5.71% of daily weighted average unreturned capital contributions, the income incentive fee will be subject to a “catch up”,
calculated as 100% of the aggregate net investment income before incentive compensation earned in excess of Hurdle Rate for the relevant period. To the extent that the Fund’s annualized total return for the relevant period exceeds
approximately 5.71%, the income component of the incentive fee will be equal to 12.5% of net investment income before incentive compensation earned in excess of this total return threshold.
For purposes of calculating the income incentive fee, (i) “total return” means the amount equal to the combination of net investment income before incentive
compensation, realized capital gains and losses and unrealized capital appreciation and depreciation of the Fund for the period in question; (ii) “unreturned capital contributions” means the proceeds to the Fund of all issuances of
common shares, less all distributions by the Fund to shareholders representing a return of capital.
The capital gains component of the incentive fee will be the amount, if positive, equal to the lesser of (i) 12.5% of the aggregate realized capital gains (computed net
of realized losses and net of unrealized capital depreciation, if any) for the most recent calendar quarter and the preceding eleven calendar quarters (or if shorter, the number of calendar quarters that have occurred since commencement
of the Fund), less capital gains incentive compensation previously paid or distributed in respect of the first eleven calendar quarters (or the portion thereof) included in the relevant trailing twelve quarters or (ii) 12.5% of
cumulative aggregate realized capital gains (computed net of realized losses and net of unrealized capital depreciation, if any) since commencement of the Fund, less capital gains incentive compensation previously paid or distributed
since commencement of the Fund. The capital gains component will be paid in full prior to payment of the income component.
In any case, incentive fee (including both the income and capital gains components) will only be paid to the extent the trailing twelve quarter (or if shorter, the
number of calendar quarters that have occurred since commencement of the fund) total return of the Fund after incentive compensation and including such payment would equal or exceed a 5% annual total return on daily weighted average
unreturned contributed capital contributions for such period.
The Adviser has agreed to waive any portion of the income component of the Incentive Fee attributable to the inclusion of Expense Payments (as set forth in the Expense
Support and Conditional Reimbursement Agreement) in the calculation of (i) aggregate net investment income before incentive compensation or (ii) total return.
F-44
3. Management Fees, Incentive Fees and Other Expenses (Continued)
In addition, GAAP requires that the capital gains incentive fees accrual consider the cumulative aggregate unrealized capital appreciation in the calculation, as a
capital gains incentive fees would be payable if such unrealized capital appreciation were realized, even though such unrealized capital appreciation is not permitted to be considered in calculating the fee actually payable under the
Advisory Agreement. This GAAP accrual is calculated using the aggregate cumulative realized capital gains and losses and aggregate cumulative unrealized capital appreciation and depreciation. If such amount is positive at the end of a
period, then GAAP requires the Fund to record a capital gains incentive fee equal to 12.5% of such cumulative amount, less the aggregate amount of actual capital gains incentive fee paid or capital gains incentive fee accrued under GAAP
in all prior periods. The resulting accrual for any capital gains incentive fee under GAAP in a given period may result in an additional expense if such cumulative amount is greater than in the prior period or a reversal of previously
recorded expense if such cumulative amount is less than in the prior period. If such cumulative amount is negative, then there is no accrual. There can be no assurance that such unrealized capital appreciation will be realized in the
future.
For the year ended December 31, 2025, the Investment Adviser earned $13.7 million and waived $(1.3) million in incentive fees. For the year ended December 31, 2024, the
Investment Adviser earned $6.3 million and for the year ended December 31, 2023, the Investment Adviser earned and waived $(3.3) million in incentive fees. For the year ended December 31, 2025, the Fund reversed the $0.5 million accrual
reserve for incentive fees on capital gains accrued on a liquidation basis (but not payable) under GAAP on a cumulative basis. For the years ended December 31, 2024 and 2023, incentive fees on capital gains accrued on a liquidation
basis (but not payable) under GAAP were $0.5 million and $0.0 million on a cumulative basis, respectively.
Sub-Advisory Fees
Pursuant to the sub-advisory agreement, dated as of May 31, 2022 (the “Sub-Advisory Agreement”), the Investment Adviser, and not the Fund, will pay a portion of the
management fee received by the Investment Adviser to the Sub-Adviser as a sub-advisory fee in an amount equal to a percentage of the average daily value of the Fund’s assets allocated to the Sub-Adviser.
Distribution Agreement
The Fund has entered into a Distribution Agreement (the “Distribution Agreement”) with BlackRock Investments, LLC (the “Distributor”), a registered broker-dealer
affiliated with the Investment Adviser. No upfront sales load will be paid with respect to Class S shares, Class D shares or Institutional shares; however, if shareholders buy Class S shares or Class D shares through certain financial
intermediaries, they may directly charge transaction or other fees, including upfront placement fees or brokerage commissions, in such amount as they may determine, provided that selling agents limit such charges to a 3.5% cap on NAV
for Class S shares, and a 1.5% cap on NAV for Class D shares. Selling agents will not charge such fees on Institutional shares.
Either party may terminate the Distribution Agreement upon 60 days’ written notice to the other party or immediately upon notice to the other party in the event such
other party failed to comply with a material provision of the Distribution Agreement.
Distribution and Servicing Plan
On February 27, 2024, the Fund’s Board of Trustees approved a distribution and servicing plan (the “Distribution and Servicing Plan”). The following table shows the
shareholder servicing and/or distribution fees the Fund pays the Distributor with respect to Institutional, Class S and Class D shares on an annualized basis as a percentage of the Fund’s NAV for such class.
|
Shareholder Servicing and/or
Distribution Fee as a % of NAV
|
||||
|
Class S Shares
|
0.85
|
%
|
||
|
Class D Shares
|
0.25
|
%
|
||
|
Institutional Shares
|
—
|
|||
The shareholder servicing and/or distribution fees are paid monthly in arrears, calculated using the NAV of the applicable class as of the beginning of the first
calendar day of the month and subject to FINRA and other limitations on underwriting compensation.
F-45
3. Management Fees, Incentive Fees and Other Expenses (Continued)
The Distributor will reallow (pay) all or a portion of the shareholder servicing and/or distribution fees to participating brokers and servicing brokers for ongoing
shareholder services performed by such brokers, and will waive shareholder servicing and/or distribution fees to the extent a broker is not eligible to receive them for failure to provide such services. Because the shareholder servicing
and/or distribution fees with respect to Class S shares and Class D shares are calculated based on the aggregate NAV for all of the outstanding shares of each such class, the fees reduce the NAV with respect to all shares of each such
class, including shares issued under the Fund’s distribution reinvestment plan.
Eligibility to receive the shareholder servicing and/or distribution fee is conditioned on a broker providing the following ongoing services with respect to the Class S
or Class D shares, as applicable: assistance with recordkeeping, answering investor inquiries regarding the Fund, including regarding distribution payments and reinvestments, helping investors understand their investments upon their
request, and assistance with share repurchase requests. If the applicable broker is not eligible to receive the shareholder servicing and/or distribution fee due to failure to provide these services, the Distributor will waive the
shareholder servicing and/or distribution fee that broker would have otherwise been eligible to receive. The shareholder servicing and/or distribution fees are ongoing fees that are not paid at the time of purchase.
The Fund will cease paying the shareholder servicing and/or distribution fee on the Class S and Class D shares on the earlier to occur of the following: (i) a listing of
Institutional shares, (ii) our merger or consolidation with or into another entity, or the sale or other disposition of all or substantially all of our assets or (iii) the date following the completion of the primary portion of this
offering on which, in the aggregate, underwriting compensation from all sources in connection with this offering, including the shareholder servicing and/or distribution fee and other underwriting compensation, is equal to 10% of the
gross proceeds from our primary offering. In addition, consistent with exemptive relief allowing us to offer multiple classes of shares, at the end of the month in which the Distributor in conjunction with the transfer agent determines
that total transaction or other fees, including upfront placement fees or brokerage commissions, and shareholder servicing and/or distribution fees paid with respect to any single share held in a shareholder’s account would exceed, in
the aggregate, 10% of the gross proceeds from the sale of such share (or a lower limit as determined by the Distributor or the applicable selling agent), we will cease paying the shareholder servicing and/or distribution fee on all
Class S and Class D shares in such shareholder’s account. We may modify this requirement if permitted by applicable exemptive relief. At the end of the month in which such 10% (or lower) limit is met, the applicable Class S shares and
Class D shares in such shareholder’s account will convert into a number of Institutional shares (including any fractional shares), with an equivalent aggregate NAV as such Class S and Class D shares.
For the year ended December 31, 2025, the Fund accrued distribution and shareholder servicing fees of $725,009 and $8,868, respectively, which were attributable to Class S and Class D
shares. For the year ended December 31, 2024, the Fund accrued distribution and shareholder servicing fees of $136,105 and $1,953, which were attributable to Class S and Class D shares, respectively. For the year ended December 31,
2023, the Fund did not accrue any distribution and shareholder servicing fees.
Expense Support and Conditional Reimbursement Agreement
On August 26, 2025, the Fund entered into an Expense Support and Conditional Reimbursement Agreement (the “Expense Support and Conditional Reimbursement Agreement”) with
the Investment Adviser. Pursuant to the Expense Support and Conditional Reimbursement Agreement, the Investment Adviser may elect to pay certain expenses on the Fund’s behalf (an “Expense Payment”), provided that no portion of an
Expense Payment will be used to pay any interest expense or shareholder servicing and/or distribution fees of the Fund. Any Expense Payment that the Investment Adviser has committed to pay shall be paid by the Investment Adviser to the
Fund in any combination of cash or other immediately available funds no later than seventy-five days after such commitment was made in writing, and/or offset against amounts due from the Fund to the Investment Adviser or its affiliates.
Following any calendar month in which Available Operating Funds (as defined below) exceed the cumulative distributions accrued to the Fund’s shareholders based on
distributions declared with respect to record dates occurring in such calendar month (the amount of such excess being hereinafter referred to as “Excess Operating Funds”), the Fund shall pay such Excess Operating Funds, or a portion
thereof, as applicable, to the Investment Adviser until such time as all Expense Payments made by the Investment Adviser to the Fund within three years prior to the last business day of such calendar month have been reimbursed. Any
payments required to be made by the Fund shall be referred to herein as a “Reimbursement Payment.”
“Available Operating Funds” means the sum of (i) the Fund’s net investment company taxable income (including net short-term capital gains reduced by net long-term
capital losses), (ii) the Fund’s net capital gains (including the excess of net long-term capital gains over net short-term capital losses), and (iii) dividends and other distributions paid to the Fund on account of investments in
portfolio companies (to the extent such amounts listed in clause (iii) are not included under clauses (i) and (ii) above).
F-46
3. Management Fees, Incentive Fees and Other Expenses (Continued)
No Reimbursement Payment for any month shall be made if: (1) the Effective Rate of Distributions Per Share declared by the Fund at the time of such Reimbursement Payment
is lower than the Effective Rate of Distributions Per Share at the time the related Expense Payment was made, provided that to the extent that the Effective Rate of Distributions Per Share declared by the Fund at the time of such
Reimbursement Payment has declined relative to the Effective Rate of Distributions Per Share declared by the Fund at the time of the related Expense Payment in an amount (measured in basis points) equal to or less than a corresponding
decline in the 3-month Secured Overnight Financing Rate (measured in basis points) over the same period, this condition (1) shall not restrict the payment of such Reimbursement Payment; or (2) the Fund’s Operating Expense Ratio at the
time of such Reimbursement Payment is greater than the Operating Expense Ratio at the time the related Expense Payment was made. “Effective Rate of Distributions Per Share” means the annualized rate of regular cash distributions per
share exclusive of returns of capital, distribution rate reductions due to shareholder servicing and/or distribution fees, and declared special dividends or special distributions, if any. The “Operating Expense Ratio” is calculated by
dividing Operating Expenses, less organizational and offering expenses, base management and incentive fees owed to the Investment Adviser, shareholder servicing and/or distribution fees, and interest expense, by the Fund’s net assets.
“Operating Expenses” means all of the Fund’s operating costs and expenses incurred, as determined in accordance with generally accepted accounting principles for investment companies. The Investment Adviser has waived any portion of the
income component of the Incentive Fee attributable to the inclusion of Expense Payments in the calculation of (i) aggregate net investment income before incentive compensation or (ii) total return.
The Fund’s obligation to make a Reimbursement Payment shall automatically become a liability of the Fund on the last business day of the applicable calendar month,
except to the extent the Investment Adviser has waived its right to receive such payment for the applicable month.
The following table presents a summary of Expense Payments and the related Reimbursement Payments since the Fund’s commencement of operations:
|
For the Year Ended
|
Expense Payments by Adviser
|
Reimbursement Payments to Adviser
|
Unreimbursed Expense Payments
|
|||||||||
|
December 31, 2025
|
$
|
10,779,084
|
$
|
-
|
$
|
10,779,084
|
||||||
|
Total
|
$
|
10,779,084
|
$
|
-
|
$
|
10,779,084
|
||||||
Other Expenses
The Fund bears all expenses incurred in connection with its business, including fees and expenses outside of contracted services, such as custodian, administrative,
legal, audit and tax preparation fees, costs of valuing investments, insurance costs, brokers’ and finders’ fees relating to investments, and any other transaction costs associated with the purchase and sale of investments.
4. Debt
Debt is comprised of a $650.0 million capacity revolving credit and term loan facility (the “Credit Facility”), a $365.0 million revolving credit facility (the
“Revolving Credit Facility”), a $200.0 million revolving credit facility (the “SG Revolving Credit Facility”), $70.0 million in 7.14% Series 2024A Senior Notes, Tranche A (the “Tranche A Notes”), $55.0 million in 7.33% Series 2024A
Senior Notes, Tranche B (the “Tranche B Notes”), $0.1 million in 12.00% Promissory Notes (the “Promissory Notes”), $50.0 million in 5.78% Series 2025A Senior Notes, Tranche A (the “2025A Tranche A Notes”), and $150.0 million in 6.14%
Series 2025A Senior Notes, Tranche B (the “2025A Tranche B Notes” and, together with all the other Notes, the “Notes”).
F-47
4. Debt (Continued)
Total debt outstanding and available at December 31, 2025 was as follows:
|
|
Maturity
|
Rate
|
Carrying Value
|
Available
|
Total Capacity
|
|||||||||||||
|
Credit Facility
|
2033
|
SOFR+1.97%(1)
|
$
|
260,000,000
|
$
|
390,000,000
|
$
|
650,000,000
|
||||||||||
|
Revolving Credit Facility
|
2030
|
SOFR+1.88%(2)
|
50,970,583
|
314,029,417
|
365,000,000
|
(3) | ||||||||||||
|
SG Revolving Credit Facility
|
2027
|
SOFR+1.15%
|
200,000,000
|
—
|
200,000,000
|
|||||||||||||
|
Tranche A Notes
|
2027
|
7.14
|
%
|
70,000,000
|
—
|
70,000,000
|
||||||||||||
|
Tranche B Notes
|
2030
|
7.33
|
%
|
55,000,000
|
—
|
55,000,000
|
||||||||||||
|
Promissory Notes
|
2055
|
12.00
|
%
|
110,000
|
—
|
110,000
|
||||||||||||
|
2025A Tranche B Notes
|
2030
|
6.14
|
%
|
150,000,000
|
—
|
150,000,000
|
||||||||||||
|
2025A Tranche A Notes
|
2028
|
5.78
|
%
|
50,000,000
|
—
|
50,000,000
|
||||||||||||
|
Total leverage
|
$
|
836,080,583
|
704,029,417
|
1,540,110,000
|
||||||||||||||
|
Unamortized issuance costs
|
(1,864,718
|
)
|
||||||||||||||||
|
Debt, net of unamortized issuance costs
|
$
|
834,215,865
|
||||||||||||||||
(1) The outstanding amount was subject to a SOFR credit adjustment of 0.20%.
(2) As of December 31, 2025, $20.0 million of the outstanding amount bore interest at a rate of EURIBOR + 1.88%. $31.0 million of the outstanding amount bore interest at a
rate of CORRA + 1.88%, and was subject to a CORRA credit spread adjustment of 0.30%.
(3) Revolving Credit Facility includes an accordion provision to permit increases to a total facility amount of up to $600.0 million.
Total debt outstanding and available at December 31, 2024 was as follows:
|
Maturity
|
Rate
|
Carrying Value
|
Available
|
Total Capacity
|
||||||||||||||
|
Credit Facility
|
2033
|
SOFR+1.97%
|
$
|
320,000,000
|
$
|
130,000,000
|
$
|
450,000,000
|
||||||||||
|
Revolving Credit Facility
|
2029
|
SOFR+2.00%
|
—
|
150,000,000
|
150,000,000
|
|||||||||||||
|
Tranche A Notes
|
2027
|
7.14
|
%
|
70,000,000
|
—
|
70,000,000
|
||||||||||||
|
Total leverage
|
390,000,000
|
$
|
280,000,000
|
$
|
670,000,000
|
|||||||||||||
|
Unamortized issuance costs
|
(866,702
|
)
|
||||||||||||||||
|
Debt, net of unamortized issuance costs
|
$
|
389,133,298
|
||||||||||||||||
The combined weighted-average interest rate excluding fees on total debt outstanding at December 31, 2025 and December 31, 2024 was 5.91% and 6.62%. Outstanding debt is
carried at amortized cost in the Consolidated Statements of Assets and Liabilities. As of December 31, 2025, the estimated fair value of the outstanding debt approximated their carrying value.
Total expenses related to debt included the following:
|
For the Year Ended December 31,
|
||||||||||||
|
2025
|
2024
|
2023
|
||||||||||
|
Interest expense
|
$
|
39,879,848
|
$
|
14,390,928
|
$
|
7,725,732
|
||||||
|
Amortization of deferred debt issuance costs
|
1,333,663
|
438,149
|
193,554
|
|||||||||
|
Commitment fees
|
1,912,273
|
849,093
|
478,917
|
|||||||||
|
Total
|
$
|
43,125,784
|
$
|
15,678,170
|
$
|
8,398,203
|
||||||
Credit Facility
On June 3, 2022, BlackRock Private Credit Fund Leverage I, LLC (the “Borrower”), a Delaware limited liability company and wholly-owned subsidiary of the Fund,
established a $200.0 million combined revolving credit and term loan facility with PNC Bank, National Association as facility agent (the “Credit Facility”). The Credit Facility matures on June 3, 2032 and generally bears interest at
three-month Term SOFR, plus (a) 1.55% if the aggregate balance of “Middle Market Loans” (as defined in Exhibit 10.1) is less than or equal to 25%, (b) 1.65% if the aggregate balance of Middle Market Loans is above 25% and less than or
equal to 50%, (c) 1.80% if the aggregate balance of Middle Market Loans is above 50% and less than or equal to 75%, or (d) 1.90% if the aggregate balance of Middle Market Loans is above 75%.
F-48
4. Debt (Continued)
On September 8, 2023, the Borrower entered into Amendment No. 1 to the Credit Facility (the “Amendment”). The Amendment extended the term commitment termination date
under the Credit Facility with respect to term commitments entered into on the closing date to December 8, 2023. The Credit Facility is secured by all of the assets held by the Borrower. Under the Credit Facility, the Borrower has made
certain customary representations and warranties, and is required to comply with various covenants, reporting requirements and other customary requirements for similar credit facilities. The Credit Facility includes usual and customary
events of default for credit facilities of this nature. Borrowings under the Credit Facility are considered borrowings of the Fund for purposes of complying with the asset coverage requirements under the 1940 Act. On December 15, 2023,
the Borrower entered into Amendment No. 2 to the Credit Facility (the "Second Amendment"). The Second Amendment increased the total revolving commitments from $50.0 million to $75.0 million, increased total term commitments from $150.0
million to $225.0 million. The Second Amendment increased the facility margin level with (a) 1.62% if the aggregate balance of “Middle Market Loans” (as defined in Exhibit 10.1) is less than or equal to 25%, (b) 1.77% if the aggregate
balance of Middle Market Loans is above 25% and less than or equal to 50%, (c) 1.96% if the aggregate balance of Middle Market Loans is above 50% and less than or equal to 75%, or (d) 2.12% if the aggregate balance of Middle Market
Loans is above 75%.
On November 27, 2024, the Borrower entered into Amendment No. 3 to the Credit Facility (the "First Amended and Restated Credit and Security Agreement"). The amendment
increased the total revolving commitments from $75.0 million to $125.0 million, increased total term commitments from $225.0 million to $325.0 million, and modified certain other terms of the Credit Facility, including (i) extending the
final maturity date to June 3, 2033, (ii) extending the reinvestment period to June 3, 2026, and (iii) extending the delayed draw term loan commitment termination date until December 15, 2025. The credit facility commitment fees accrual
rate was amended at a rate equal to 0.35% per annum, if as of such date the outstanding principal amount of the Revolving Advances is greater than 50% of the Revolving Commitment otherwise the rate is 0.50% per annum. The rate for Term
Commitment was amended at 0.35% per annum for the first three months following any Incremental Commitment Effective Date, and thereafter 0.50% per annum. The Credit Facility includes usual and customary events of default for credit
facilities of this nature. Borrowings under the Credit Facility are considered our borrowings for purposes of complying with the asset coverage requirements under the 1940 Act.
On May 2, 2025, the Fund entered into Amendment No. 1 to the First Amended and Restated Credit and Security Agreement (the “Credit Facility Amendment”). Pursuant to the
Credit Facility Amendment, under the Credit Facility, the total revolving commitments increased from $125.0 million to $150.0 million, and the total term commitments increased from $325.0 million to $500.0 million. The Credit Facility
Amendment modified certain other terms of the Credit Facility, including extending the prepayment lockout period until the first anniversary of the closing date of the Credit Facility Amendment.
On December 12, 2025, the Fund entered into Amendment No. 2 to First Amended and Restated Credit and Security Agreement (the “Second Amendment”) to extend the commitment
period for certain undrawn term loan commitments to May 2, 2026.
Revolving Credit Facility
On April 19, 2024, the Fund entered into a Senior Secured Credit Agreement for a $75.0 million revolving credit facility (the “Revolving Credit Facility”) with Sumitomo
Mitsui Banking Corporation, as administrative agent, and the lenders and issuing banks from time to time parties thereto. The Revolving Credit Facility matures on April 19, 2029 and generally bears interest at either (i) term SOFR plus
a credit spread adjustment plus margin of 2.00% or 1.875% per annum or (ii) the prime rate plus a margin of 2.00% or 1.875% per annum, in each case subject to certain conditions. The Fund may elect either the term SOFR or prime rate at
the time of drawdown. The Revolving Credit Facility is guaranteed by certain domestic subsidiaries of the Fund that are formed or acquired by the Fund in the future (collectively, the “Guarantors”). The Revolving Credit Facility is
secured by substantially all of the portfolio investments held by the Fund and each Guarantor, subject to certain exceptions. On November 4, 2024, the Fund increased the commitment on the Revolving Credit Facility from $75 million to
$150 million.
On August 7, 2025, the Fund entered into the First Amendment to the Revolving Credit Facility (the “First Amendment”), which, among other things, (i) extends the
revolver availability period from April 2028 to August 2029, (ii) extends the scheduled maturity date from April 2029 to August 2030, (iii) increases the accordion provision to permit increases to a total facility amount of up to $600.0
million, (iv) increases the total facility amount from $150.0 million to $315.0 million, and (v) resets the minimum shareholders’ equity test.
F-49
4. Debt (Continued)
On December 5, 2025, the Fund entered into a joinder agreement (“Joinder Agreement”), which increased the aggregate amount of outstanding total revolving commitments
under the Revolving Credit Facility to $365.0 million. The other material terms of the Revolving Credit Facility remain unchanged.
SG Revolving Credit Facility
On May 28, 2025, BlackRock Private Credit Fund Leverage II, LLC (the “SG Borrower”), a Delaware limited liability company and wholly-owned subsidiary of the Fund,
established the SG Revolving Credit Facility, a $200.0 million revolving credit facility with Societe Generale as Administrative agent. The SG Revolving Credit Facility matures on May 29, 2027 and generally bears interest at term SOFR
plus, for a period of 1 year from the date of entry into the SG Revolving Credit Facility, 1.15% and, thereafter 1.25%. The proceeds of the SG Revolving Credit Facility were used to acquire a portfolio of broadly syndicated leveraged
loans (the “SG Portfolio Assets”). Pursuant to a collateral management agreement between the SG Borrower and the Fund, the Fund was responsible for the selection, management and reporting of the SG Portfolio Assets. The SG Revolving
Credit Facility includes customary covenants, including certain limitations on the incurrence by the SG Borrower of additional indebtedness and on the SG Borrower’s ability to make distributions, as well as customary events of default.
As of December 31, 2025, the SG Borrower was in full compliance with such covenants.
Notes
On November 18, 2024, the Fund entered into a Master Note Purchase Agreement (the “Master Note Purchase Agreement”), governing the issuance (a) on November 18, 2024, of
$70.0 million aggregate principal amount of its 7.14% Series 2024A Senior Notes, Tranche A, due November 18, 2027 (the “Tranche A Notes”), and (b) on January 22, 2025 (subject to customary closing conditions), of $55.0 million aggregate
principal amount of its 7.33% Series 2024A Senior Notes, Tranche B, due January 22, 2030 (the “Tranche B Notes” and, together with the Tranche A Notes, the “Notes”), to qualified institutional investors in a private placement. The
Tranche A Notes bear interest at a rate equal to 7.14% per annum that is payable semi-annually on May 18 and November 18 of each year, beginning on May 18, 2025. The Tranche B Notes bear interest at a rate equal to 7.33% per annum that
is payable semi-annually on January 22 and July 22 of each year, beginning on July 22, 2025. The Notes will be guaranteed by certain domestic subsidiaries of the Fund that are formed or acquired by the Fund in the future (collectively,
the “Guarantors”). The Tranche A Notes were issued at a closing on November 18, 2024, and the Tranche B Notes were issued at a closing on January 22, 2025, subject to customary closing conditions.
2025A Notes
On October 8, 2025, the Fund entered into the First Supplement (the “First Supplement”) to the Master Note Purchase Agreement, dated November 18, 2024, as supplemented by the First Supplement, the
“Purchase Agreement”), governing the issuance (a) on October 8, 2025, of $150.0 million aggregate principal amount of its 6.14% Series 2025A Senior Notes, Tranche B, due October 8, 2030 (the “2025A Tranche B Notes”), and (b) on December
17, 2025 (subject to customary closing conditions), of $50.0 million aggregate principal amount of its 5.78% Series 2025A Senior Notes, Tranche A, due December 17, 2028 (the “2025A Tranche A Notes” and, together with the 2025A Tranche B
Notes, the “2025A Notes”), to qualified institutional investors in a private placement. The 2025A Tranche B Notes were issued on October 8, 2025 and the 2025A Tranche A Notes were issued on December 17, 2025, subject to customary
closing conditions.
The 2025A Tranche B Notes bear an interest rate of 6.14% per year and are payable semi-annually on April 8 and October 8, beginning April 8, 2026. The 2025A Tranche A Notes bear an interest
rate of 5.78% per year payable semi-annually on June 17 and December 17 of each year, beginning on June 17, 2026. The 2025A Notes may be redeemed in whole or in part at any time or from time to time at the Fund’s option at par plus
accrued interest to the prepayment date and, if applicable, a make-whole premium. In addition, the Fund is obligated to offer to prepay the 2025A Notes at par plus accrued and unpaid interest up to, but excluding, the date of
prepayment, if certain change in control events occur. The 2025A Notes are general unsecured obligations of the Fund that rank pari passu with all outstanding and future unsecured and unsubordinated indebtedness issued by the Fund.
F-50
4. Debt (Continued)
Promissory Notes
On October 1, 2025, the Fund closed on an offering 110 promissory notes due October 1, 2055 (the “Promissory Notes”) in a private offering, with each Promissory Note being issued in connection with the
issuance of one common share of the Fund (the “Promissory Notes Offering”) to accredited investors (as that term is defined in Rule 501(a) of Regulation D under the Securities Act of 1933, as amended (“Securities Act”). The aggregate
principal amount of the Promissory Notes is $110,000 less the net asset value, as of October 1, 2025, of the common shares issued in the Promissory Notes Offering. The Fund will pay an interest totaling $120 per year on each outstanding
Promissory Note, with such interest to be paid semi-annually on or before June 30 and December 31 each year, beginning on December 31, 2025.
F-51
5. Commitments and Contingencies
The Fund conducts business with brokers and dealers that are primarily headquartered in New York and Los Angeles and are members of the major securities exchanges.
Banking activities are conducted with a firm headquartered in the Boston area.
In the normal course of business, investment activities involve executions, settlement and financing of various transactions resulting in receivables from, and payables
to, brokers, dealers, and the custodian. These activities may expose the Fund to risk in the event that such parties are unable to fulfill contractual obligations. Management does not anticipate any material losses from counterparties
with whom it conducts business. Consistent with standard business practice, the Fund enters into contracts that contain a variety of indemnifications and is engaged from time to time in various legal actions. The maximum exposure under
these arrangements and activities is unknown. However, management expects the risk of material loss to be remote.
The Consolidated Schedule of Investments include certain revolving loan facilities and other commitments with unfunded balances at December 31, 2025 and December 31,
2024 as follows:
|
Unfunded Balances
|
||||||||||
|
Issuer
|
Maturity Date
|
December 31, 2025
|
December 31, 2024
|
|||||||
|
Accordion Partners LLC
|
11/15/2031
|
N/A
|
$
|
3,179,348
|
||||||
|
Accordion Partners LLC
|
11/15/2031
|
N/A
|
2,119,565
|
|||||||
|
Accuserve Solutions, Inc.
|
3/15/2030
|
N/A
|
485,658
|
|||||||
|
Alcami Corporation
|
12/21/2028
|
104,876
|
123,188
|
|||||||
|
Alera Group, Inc.
|
11/17/2025
|
N/A
|
480,558
|
|||||||
|
AmeriLife Holdings, LLC
|
8/31/2029
|
3,119,196
|
N/A
|
|||||||
|
AmeriLife Holdings, LLC
|
8/31/2028
|
1,614,244
|
377,494
|
|||||||
|
Applause App Quality, Inc.
|
10/24/2029
|
1,200,563
|
1,500,703
|
|||||||
|
Avalara, Inc.
|
10/19/2028
|
N/A
|
377,651
|
|||||||
|
Anthracite Buyer, Inc. (Coalfire)
|
12/3/2032
|
4,287,989
|
N/A
|
|||||||
|
Allied Benefit Systems Intermediate, LLC
|
10/31/2030
|
5,163,116
|
N/A
|
|||||||
|
Blackbird Purchaser, Inc.
|
12/19/2030
|
N/A
|
304,079
|
|||||||
|
Blackbird Purchaser, Inc.
|
12/19/2030
|
N/A
|
236,331
|
|||||||
|
Bluefin Holding, LLC (Allvue)
|
9/12/2029
|
1,190,668
|
1,190,668
|
|||||||
|
Bullhorn, Inc.
|
10/1/2029
|
1,281,416
|
1,478,557
|
|||||||
|
Bullhorn, Inc.
|
9/30/2029
|
1,124,030
|
2,524,995
|
|||||||
|
Bynder Bidco B.V. (Netherlands)
|
1/26/2029
|
171,174
|
171,174
|
|||||||
|
Bynder Bidco, Inc. (Netherlands)
|
1/26/2029
|
47,160
|
47,160
|
|||||||
|
Beekeeper Buyer Inc. (Archway)
|
6/30/2031
|
1,452,291
|
N/A
|
|||||||
|
Brown & Settle, Inc.
|
5/16/2030
|
612,946
|
N/A
|
|||||||
|
Chronicle Parent LLC (Lexitas)
|
4/15/2031
|
8,925,000
|
N/A
|
|||||||
|
Chronicle Parent LLC (Lexitas)
|
4/15/2031
|
3,240,741
|
N/A
|
|||||||
|
Civicplus LLC
|
8/24/2030
|
2,546,218
|
N/A
|
|||||||
|
Civicplus LLC
|
8/24/2030
|
698,657
|
N/A
|
|||||||
|
Cherry Bekaert Advisory, LLC
|
6/28/2030
|
447,254
|
447,254
|
|||||||
|
Cherry Bekaert Advisory, LLC
|
6/30/2028
|
N/A
|
109,986
|
|||||||
|
Cherry Bekaert Advisory, LLC
|
6/28/2030
|
3,627,369
|
N/A
|
|||||||
|
Clever Devices Ltd.
|
6/12/2030
|
432,891
|
556,574
|
|||||||
|
Clydesdale Acquisition Holdings, Inc
|
4/13/2029
|
4,852
|
N/A
|
|||||||
|
Cohnreznick Advisory LLC
|
3/31/2032
|
3,357,941
|
N/A
|
|||||||
|
Community Merger Sub Debt LLC (CINC Systems)
|
1/18/2030
|
1,997,725
|
1,997,725
|
|||||||
|
Compsych Holdings Corp
|
7/22/2031
|
3,737,596
|
3,737,596
|
|||||||
F-52
5. Commitments and Contingencies (Continued)
|
Unfunded Balances (Continued)
|
||||||||||
|
Issuer
|
Maturity Date
|
December 31, 2025
|
December 31, 2024
|
|||||||
|
CrewLine Buyer, Inc. (New Relic)
|
11/8/2030
|
$
|
995,744
|
$
|
995,744
|
|||||
|
CP Iris Holdco I, Inc
|
10/27/2032
|
324,100
|
N/A
|
|||||||
|
Disco Parent, Inc. (Duck Creek Technologies)
|
3/30/2029
|
N/A
|
232,723
|
|||||||
|
DNAnexus, Inc
|
12/18/2029
|
16,793,184
|
16,793,184
|
|||||||
|
Douglas Holdings, Inc (Docupace)
|
8/27/2030
|
1,635,795
|
1,858,858
|
|||||||
|
Douglas Holdings, Inc (Docupace)
|
8/27/2030
|
281,657
|
890,768
|
|||||||
|
Douglas Holdings, Inc (Docupace)
|
8/27/2030
|
743,543
|
743,543
|
|||||||
|
Douglas Holdings, Inc (Docupace)
|
8/27/2030
|
N/A
|
2,044,744
|
|||||||
|
Deepl Se (Germany)
|
6/26/2030
|
14,783,278
|
N/A
|
|||||||
|
Deepl Se (Germany)
|
6/26/2030
|
4,166,336
|
N/A
|
|||||||
|
Dragos, Inc.
|
6/30/2030
|
19,924,142
|
N/A
|
|||||||
|
Dragos, Inc.
|
6/30/2030
|
7,315,247
|
N/A
|
|||||||
|
EBS Parent Holdings Inc. (The Difference Card)
|
7/1/2032
|
3,641,447
|
N/A
|
|||||||
|
EBS Parent Holdings Inc. (The Difference Card)
|
7/1/2032
|
1,213,816
|
N/A
|
|||||||
|
Emburse Inc.
|
5/28/2032
|
4,651,654
|
N/A
|
|||||||
|
Emburse Inc.
|
5/28/2032
|
4,651,654
|
N/A
|
|||||||
|
Express Wash Acquisition Company, LLC (Whistle)
|
4/10/2031
|
1,274,611
|
N/A
|
|||||||
|
e-Discovery AcquireCo, LLC (Reveal)
|
8/23/2029
|
672,678
|
1,441,453
|
|||||||
|
EdgeCo Buyer, Inc.
|
6/1/2028
|
585,680
|
585,680
|
|||||||
|
EdgeCo Buyer, Inc.
|
6/1/2028
|
917,566
|
5,856,804
|
|||||||
|
FirstUp, Inc
|
7/13/2027
|
908,548
|
N/A
|
|||||||
|
Flexport Capital, LLC
|
6/30/2029
|
19,360,567
|
N/A
|
|||||||
|
Focus Financial Partners, LLC
|
9/10/2031
|
N/A
|
238,727
|
|||||||
|
Fusion Holding Corp. (Finalsite)
|
9/15/2027
|
167,010
|
371,133
|
|||||||
|
Fusion Risk Management, Inc.
|
5/22/2029
|
335,574
|
457,601
|
|||||||
|
G-3 Apollo Acquisition Corp (Appriss Retail)
|
3/10/2031
|
2,870,057
|
N/A
|
|||||||
|
G-3 Apollo Acquisition Corp (Appriss Retail)
|
3/10/2031
|
2,583,051
|
N/A
|
|||||||
|
GC Champion Acquisition LLC (Numerix)
|
8/19/2028
|
3,682,906
|
3,682,906
|
|||||||
|
GC Waves Holdings, Inc. (Mercer)
|
8/10/2029
|
831,419
|
831,419
|
|||||||
|
Grant Thornton Advisors LLC
|
6/2/2031
|
N/A
|
34,936
|
|||||||
|
GTY Technology Holdings Inc.
|
7/9/2029
|
1,056,080
|
264,374
|
|||||||
|
GTY Technology Holdings Inc.
|
7/9/2029
|
N/A
|
770,655
|
|||||||
|
GC Waves Holdings, Inc. (Mercer)
|
10/4/2030
|
28,606,431
|
N/A
|
|||||||
|
Griffon Bidco Inc. (Layerzero)
|
7/31/2031
|
4,597,405
|
N/A
|
|||||||
|
Griffon Bidco Inc. (Layerzero)
|
7/31/2031
|
4,597,405
|
N/A
|
|||||||
F-53
5. Commitments and Contingencies (Continued)
|
Unfunded Balances (Continued)
|
||||||||||
|
Issuer
|
Maturity Date
|
December 31, 2025
|
December 31, 2024
|
|||||||
|
Higginbotham Insurance Agency, Inc.
|
11/25/2026
|
N/A
|
$
|
917,024
|
||||||
|
Higginbotham Insurance Agency, Inc.
|
9/30/2026
|
12,000,000
|
N/A
|
|||||||
|
Higginbotham Insurance Agency, Inc.
|
12/10/2027
|
345,585
|
N/A
|
|||||||
|
Honey Intermediate, Inc. (iLobby) (Canada)
|
9/26/2030
|
1,872,401
|
1,872,401
|
|||||||
|
HSI Halo Acquisitions, Inc.
|
6/28/2031
|
551,868
|
912,423
|
|||||||
|
HSI Halo Acquisitions, Inc.
|
6/28/2031
|
735,825
|
735,825
|
|||||||
|
Huckabee Acquisition, LLC (MOREgroup)
|
1/16/2030
|
1,020,417
|
1,020,417
|
|||||||
|
Huckabee Acquisition, LLC (MOREgroup)
|
1/16/2030
|
612,250
|
612,250
|
|||||||
|
Hyphen Solutions, LLC
|
8/6/2032
|
6,417,610
|
N/A
|
|||||||
|
Hyphen Solutions, LLC
|
8/6/2032
|
3,850,566
|
N/A
|
|||||||
|
Hobbs & Associates, LLC
|
7/23/2031
|
414,167
|
N/A
|
|||||||
|
Integrity Marketing Acquisition, LLC
|
8/26/2033
|
2,709,613
|
7,686,777
|
|||||||
|
Integrity Marketing Acquisition, LLC
|
8/25/2028
|
4,184,623
|
4,319,357
|
|||||||
|
Intercept Bidco, Inc.
|
6/3/2030
|
2,591,349
|
2,591,349
|
|||||||
|
Intercept Bidco, Inc.
|
6/3/2030
|
1,727,566
|
1,727,566
|
|||||||
|
IVXS UK Limited (ComplyAdvantage) (United Kingdom)
|
5/19/2029
|
3,155,511
|
N/A
|
|||||||
|
IvyRehab Intermediate II, LLC
|
4/23/2029
|
21,548,457
|
N/A
|
|||||||
|
IvyRehab Intermediate II, LLC
|
4/23/2029
|
N/A
|
8,703,024
|
|||||||
|
JF Acquisition, LLC (JF Petroleum)
|
6/18/2030
|
6,723,169
|
N/A
|
|||||||
|
JF Acquisition, LLC (JF Petroleum)
|
6/18/2030
|
4,158,661
|
N/A
|
|||||||
|
Lighthouse Parent Holdings, Inc (Aperture)
|
12/20/2031
|
1,700,161
|
2,713,024
|
|||||||
|
Lighthouse Parent Holdings, Inc (Aperture)
|
12/20/2031
|
1,085,209
|
1,085,209
|
|||||||
|
LJ Avalon Holdings, LLC (Ardurra)
|
2/1/2030
|
N/A
|
2,299,429
|
|||||||
|
LJ Avalon Holdings, LLC (Ardurra)
|
2/1/2030
|
1,594,443
|
N/A
|
|||||||
|
LJ Avalon Holdings, LLC (Ardurra)
|
2/1/2029
|
689,596
|
123,067
|
|||||||
|
Logicmonitor, Inc
|
11/19/2031
|
1,856,512
|
1,856,512
|
|||||||
|
Logicmonitor, Inc
|
10/7/2032
|
10,888,019
|
N/A
|
|||||||
|
Lucky US BuyerCo, LLC (Global Payments)
|
3/30/2029
|
37,679
|
163,820
|
|||||||
|
Madison Logic Holdings, Inc.
|
12/30/2027
|
85,805
|
85,805
|
|||||||
|
MRO Parent Corporation
|
6/9/2032
|
3,022,672
|
N/A
|
|||||||
|
MRO Parent Corporation
|
6/9/2032
|
3,022,672
|
N/A
|
|||||||
|
MH Sub I, LLC (Micro Holding Corp.)
|
12/11/2031
|
N/A
|
262,398
|
|||||||
|
Modigent, LLC (Pueblo)
|
8/23/2027
|
1,021,491
|
161,736
|
|||||||
|
Modigent, LLC (Pueblo)
|
8/23/2028
|
N/A
|
5,353,117
|
|||||||
|
Mpulse Mobile Inc.
|
8/26/2032
|
3,821,067
|
N/A
|
|||||||
F-54
5. Commitments and Contingencies (Continued)
|
Unfunded Balances (Continued)
|
||||||||||
|
Issuer
|
Maturity Date
|
December 31, 2025
|
December 31, 2024
|
|||||||
|
Mpulse Mobile Inc.
|
8/26/2032
|
$
|
5,731,601
|
N/A
|
||||||
|
Kaman Corporation
|
2/26/2032
|
494,807
|
N/A
|
|||||||
|
Kid Distro Holdings, LLC
|
10/1/2029
|
1,546,384
|
585,700
|
|||||||
|
Oranje Holdco, Inc. (KnowBe4)
|
2/1/2029
|
N/A
|
180,686
|
|||||||
|
Oak Funding LLC
|
12/2/2032
|
1,706,111
|
N/A
|
|||||||
|
Payroc, LLC
|
11/1/2027
|
166,509
|
166,509
|
|||||||
|
PlayPower, Inc
|
8/28/2030
|
N/A
|
2,070,380
|
|||||||
|
Peter C. Foy & Associates Insurance Services, LLC (PCF Insurance)
|
11/1/2028
|
N/A
|
1,545,484
|
|||||||
|
PMA Parent Holdings, LLC
|
1/31/2031
|
5,032,725
|
1,270,184
|
|||||||
|
Pye-Barker Fire & Safety LLC
|
12/10/2032
|
126,750
|
N/A
|
|||||||
|
Palmdale Oil Company, LLC
|
12/12/2031
|
228,988
|
N/A
|
|||||||
|
Palmdale Oil Company, LLC
|
12/12/2031
|
763,292
|
N/A
|
|||||||
|
Pyramid Analytics BV (Netherlands)
|
5/14/2029
|
309,850
|
N/A
|
|||||||
|
Raven Acquisition Holdings LLC (R1 RCM)
|
11/19/2031
|
136,326
|
105,659
|
|||||||
|
Rialto Management Group, LLC
|
12/5/2030
|
N/A
|
395,598
|
|||||||
|
RBS Buyer Inc.
|
7/31/2031
|
3,406,439
|
N/A
|
|||||||
|
RBS Buyer Inc.
|
7/31/2031
|
5,677,398
|
N/A
|
|||||||
|
Secretariat Advisors LLC
|
2/24/2032
|
885,777
|
N/A
|
|||||||
|
Signia Aerospace LLC
|
11/21/2031
|
N/A
|
115,688
|
|||||||
|
Serrano Parent, LLC (Sumo Logic)
|
5/12/2030
|
409,922
|
409,922
|
|||||||
|
Skydio, Inc
|
12/4/2029
|
3,750,000
|
3,750,000
|
|||||||
|
Skydio, Inc
|
12/4/2029
|
N/A
|
3,750,000
|
|||||||
|
Spark Buyer, LLC (Sparkstone)
|
10/15/2031
|
4,701,603
|
4,701,603
|
|||||||
|
Spark Buyer, LLC (Sparkstone)
|
10/15/2031
|
1,551,529
|
2,350,802
|
|||||||
|
Spartan Bidco Pty Ltd (StarRez) (Australia)
|
1/24/2028
|
360,555
|
548,308
|
|||||||
|
Streamland Media Midco LLC
|
3/31/2029
|
57,174
|
N/A
|
|||||||
|
Stonebridge Companies, LLC
|
5/16/2031
|
1,792,747
|
N/A
|
|||||||
|
Stonebridge Companies, LLC
|
5/16/2030
|
1,195,165
|
N/A
|
|||||||
|
SumUp Holdings Luxembourg S.A.R.L. (Luxembourg)
|
4/25/2031
|
N/A
|
3,200,000
|
|||||||
|
Syndigo, LLC
|
9/2/2032
|
4,207,530
|
N/A
|
|||||||
|
Signia Aerospace, LLC
|
11/21/2031
|
119,638
|
N/A
|
|||||||
|
Shackleton Bidco Inc. (Payworks) (Canada)
|
11/5/2032
|
3,826,279
|
N/A
|
|||||||
|
Shackleton Bidco Inc. (Payworks) (Canada)
|
11/5/2032
|
15,305,116
|
N/A
|
|||||||
F-55
5. Commitments and Contingencies (Continued)
|
Unfunded Balances (Continued)
|
||||||||||
|
Issuer
|
Maturity Date
|
December 31, 2025
|
December 31, 2024
|
|||||||
|
Thunder Purchaser, Inc. (Vector Solutions)
|
6/30/2028
|
$
|
342,194
|
$
|
1,368,776
|
|||||
|
Titan Home Improvement, LLC (Renuity)
|
5/31/2030
|
1,810,099
|
1,810,099
|
|||||||
|
Titan Home Improvement, LLC (Renuity)
|
5/31/2030
|
1,508,416
|
1,508,416
|
|||||||
|
Trintech, Inc.
|
7/25/2029
|
516,842
|
516,842
|
|||||||
|
Vensure Employer Services, Inc.
|
9/19/2031
|
250,355
|
2,754,691
|
|||||||
|
Vortex Companies, LLC
|
9/4/2029
|
4,658,247
|
N/A
|
|||||||
|
Vortex Companies, LLC
|
9/4/2029
|
N/A
|
7,634,803
|
|||||||
|
Vortex Companies, LLC
|
9/4/2029
|
1,061,989
|
1,713,916
|
|||||||
|
Wealth Enhancement Group, LLC
|
10/2/2028
|
3,896,494
|
6,568,140
|
|||||||
|
Wealth Enhancement Group, LLC
|
10/4/2028
|
N/A
|
1,031,615
|
|||||||
|
Wealth Enhancement Group, LLC
|
10/4/2028
|
1,318,338
|
1,318,338
|
|||||||
|
Wealth Enhancement Group, LLC
|
10/2/2028
|
7,609,295
|
N/A
|
|||||||
|
Wharf Street Rating Acquisition, LLC (KBRA)
|
9/16/2032
|
3,937,508
|
N/A
|
|||||||
|
Wharf Street Rating Acquisition, LLC (KBRA)
|
9/16/2032
|
3,937,508
|
N/A
|
|||||||
|
Zendesk Inc.
|
11/22/2028
|
N/A
|
251,563
|
|||||||
|
Zendesk Inc.
|
11/22/2028
|
N/A
|
610,938
|
|||||||
|
Total Unfunded Balances
|
$
|
402,336,961
|
$
|
156,978,706
|
||||||
F-56
6. Other Related Party Transactions
The Investment Adviser paid all of the Fund’s organizational and offering expenses on the Fund’s behalf. During the Reimbursement Period, the Fund agreed to reimburse
the Investment Adviser for any and all Expense Support Agreement Expense Payments incurred by the Investment Adviser under the Expense Support Agreement to the extent that the Fund’s annual Operating Expenses did not exceed 1.25% of the
value of the Fund’s net assets, calculated monthly based on month-end net assets. The Reimbursement Period expired on March 18, 2025. From inception of the Fund through the expiration of the Reimbursement Period, the Fund reimbursed the
Investment Adviser for $0.8 million related to organizational and offering expenses of the Fund pursuant to the Expense Support Agreement.
From time to time, the Investment Adviser advances payments to third parties on behalf of the Fund and receives reimbursement from the Fund under the Expense Support and
Conditional Reimbursement Agreement. At December 31, 2025 and December 31, 2024, amounts reimbursable to the Investment Adviser under the Expense Support and Conditional Reimbursement Agreement totaled $0.1 million and $1.1 million,
respectively, as reflected in the Consolidated Statements of Assets and Liabilities. The Investment Adviser may also elect to pay certain expenses on the Fund’s behalf, provided that no portion of an Expense Payment will be used to pay
any interest expense or shareholder servicing and/or distribution fees of the Fund. For the year ended December 31, 2025, the Fund received $10.8 million in expense support from the Investment Adviser. There was no expense support
received for the years ended December 31, 2024 and 2023.
The Fund has entered into an administration agreement (the “Administration Agreement”) with the Administrator. Pursuant to the Administration Agreement, the
Administrator will perform (or oversee, or arrange for, the performance by third parties of) the administrative services necessary for the operation of the Fund, including but not limited to, determining and publishing the Fund's net
asset value (“NAV”), overseeing the preparation and filing of the Fund's tax returns, and the printing and dissemination of reports to shareholders of the Fund, and generally overseeing the payment of the Fund's expenses and the
performance of administrative and professional services rendered to the Fund by others. The Fund reimburses the Administrator for the costs and expenses incurred by the Administrator in performing its obligations and providing personnel
and facilities thereunder, including payments to the Administrator in an amount equal to the Fund’s allocable portion of overhead and other expenses incurred by the Administrator or its affiliate in performing its obligations and
services under the Administration Agreement, such as rent, license fees and other costs associated with computer software utilized in providing such obligations and services and the Fund’s allocable portion of the cost of personnel
attributable to performing such obligations and services, including, but not limited to, marketing, legal and other services performed by the Administrator for the Fund. The Administrator will also, on behalf of the Fund, arrange for
the services of, and oversee, custodians, depositories, transfer agents, dividend disbursing agents, other shareholders servicing agents, accountants, attorneys, underwriters, brokers and dealers, corporate fiduciaries, insurers, banks,
shareholders and such other persons in any such other capacity deemed to be necessary or desirable. For the years ended December 31, 2025, 2024 and 2023, the Fund incurred $1.5 million and $1.1 million and $1.3 million respectively, for
such administrative service expenses.
7. Stockholders’ Equity and Dividends
The Fund is offering on a continuous basis up to $5,000,000,000 of the Fund’s common shares of beneficial interest (“Common Shares”). The Fund is offering to sell any
combination of three classes of Common Shares, Class D shares, Class S shares and Institutional shares, with a dollar value up to the maximum offering amount. The share classes have different ongoing shareholder servicing and/or
distribution fees. The purchase price per share for each class of Common Shares equals the Fund’s NAV per share, as of the effective date of the monthly share purchase date. The Fund’s offering is a “best efforts” offering, which means
that BlackRock Investments, LLC, the distributor for the offering, will use its best efforts to sell shares, but is not obligated to purchase or sell any specific amount of shares of such offering.
F-57
7. Stockholders’ Equity and Dividends (Continued)
The Fund has the authority to issue an unlimited number of Common Shares of any class and an unlimited number of shares of preferred shares, at a par value $0.001 per
share. As of December 31, 2025, the Fund had 61,039,850 Institutional shares, 4,782,132 Class S shares, and 93,350 Class D shares issued and outstanding.
The following table summarizes transactions in Common Shares for the years ended December 31, 2025 and 2024:
|
Year ended December 31, (1)
|
||||||||||||||||
|
2025
|
2024
|
|||||||||||||||
|
Shares
|
Amount
|
Shares
|
Amount
|
|||||||||||||
|
Institutional Class
|
||||||||||||||||
|
Subscriptions
|
35,326,769
|
$
|
855,541,552
|
13,602,003
|
$
|
337,869,390
|
||||||||||
|
Share transfers between classes
|
179,403
|
4,341,091
|
—
|
—
|
||||||||||||
|
Distributions reinvested
|
2,102,102
|
51,063,803
|
1,270,509
|
31,574,888
|
||||||||||||
|
Share Repurchases
|
(902,557
|
)
|
(21,853,128
|
)
|
(146,864
|
)
|
(3,643,716
|
)
|
||||||||
|
Net Increase (Decrease)
|
36,705,717
|
$
|
889,093,318
|
14,725,648
|
$
|
365,800,562
|
||||||||||
|
Class S
|
||||||||||||||||
|
Subscriptions
|
3,040,787
|
73,986,811
|
1,806,766
|
44,856,000
|
||||||||||||
|
Distributions reinvested
|
44,165
|
1,068,261
|
1,410
|
35,010
|
||||||||||||
|
Share Repurchases
|
(110,995
|
)
|
(2,664,421
|
)
|
—
|
—
|
||||||||||
|
Net Increase (Decrease)
|
2,973,957
|
$
|
72,390,651
|
1,808,176
|
$
|
44,891,010
|
||||||||||
|
Class D
|
||||||||||||||||
|
Subscriptions
|
140,964
|
3,429,598
|
127,369
|
3,155,500
|
||||||||||||
|
Share transfers between classes
|
(179,403
|
)
|
(4,341,091
|
)
|
—
|
—
|
||||||||||
|
Distributions reinvested
|
4,408
|
106,430
|
12
|
295
|
||||||||||||
|
Net Increase (Decrease)
|
(34,031
|
)
|
$
|
(805,063
|
)
|
127,381
|
$
|
3,155,795
|
||||||||
| (1) |
Class S commenced operations on June 1, 2024 and Class D commenced operations on August 1, 2024.
|
We expect to determine our NAV for each class of shares each month as of the last day of each calendar month. The NAV per share for each class of shares is determined by
dividing the value of total assets attributable to the class minus liabilities attributable to the class by the total number of Common Shares outstanding of the class at the date as of which the determination is made. Shares are issued
at an offering price equivalent to the most recent NAV per share available for each share class, which will be the prior calendar day NAV per share (i.e. the prior month-end NAV). The following table presents our monthly NAV per share
for each of the three classes of shares since our inception through December 31, 2025.
F-58
7. Stockholders’ Equity and Dividends (Continued)
|
NAV per Share
|
||||||||||||
|
For the Month Ended
|
Institutional Class
|
Class S
|
Class D
|
|||||||||
|
June 30, 2022
|
$
|
23.49
|
N/A
|
N/A
|
||||||||
|
July 31, 2022
|
24.40
|
N/A
|
N/A
|
|||||||||
|
August 31, 2022
|
24.86
|
N/A
|
N/A
|
|||||||||
|
September 30, 2022
|
23.74
|
N/A
|
N/A
|
|||||||||
|
October 31, 2022
|
23.89
|
N/A
|
N/A
|
|||||||||
|
November 30, 2022
|
23.93
|
N/A
|
N/A
|
|||||||||
|
December 31, 2022
|
23.69
|
N/A
|
N/A
|
|||||||||
|
January 31, 2023
|
24.28
|
N/A
|
N/A
|
|||||||||
|
February 28, 2023
|
24.25
|
N/A
|
N/A
|
|||||||||
|
March 31, 2023
|
24.23
|
N/A
|
N/A
|
|||||||||
|
April 30, 2023
|
24.38
|
N/A
|
N/A
|
|||||||||
|
May 31, 2023
|
24.05
|
N/A
|
N/A
|
|||||||||
|
June 30, 2023
|
24.49
|
N/A
|
N/A
|
|||||||||
|
July 31, 2023
|
24.73
|
N/A
|
N/A
|
|||||||||
|
August 31, 2023
|
24.85
|
N/A
|
N/A
|
|||||||||
|
September 30, 2023
|
24.99
|
N/A
|
N/A
|
|||||||||
|
October 31, 2023
|
24.70
|
N/A
|
N/A
|
|||||||||
|
November 30, 2023
|
24.87
|
N/A
|
N/A
|
|||||||||
|
December 31, 2023
|
24.85
|
N/A
|
N/A
|
|||||||||
|
January 31, 2024
|
24.92
|
N/A
|
N/A
|
|||||||||
|
February 29, 2024
|
24.93
|
N/A
|
N/A
|
|||||||||
|
March 31, 2024
|
24.98
|
N/A
|
N/A
|
|||||||||
|
April 30, 2024
|
24.93
|
N/A
|
N/A
|
|||||||||
|
May 31, 2024
|
24.95
|
N/A
|
N/A
|
|||||||||
|
June 30, 2024
|
24.84
|
24.84
|
N/A
|
|||||||||
|
July 31, 2024
|
24.75
|
24.75
|
N/A
|
|||||||||
|
August 31, 2024
|
24.79
|
24.79
|
24.79
|
|||||||||
|
September 30, 2024
|
24.77
|
24.77
|
24.77
|
|||||||||
|
October 31, 2024
|
24.83
|
24.83
|
24.83
|
|||||||||
|
November 30, 2024
|
24.84
|
24.84
|
24.84
|
|||||||||
|
December 31, 2024
|
24.79
|
24.79
|
24.79
|
|||||||||
|
January 31, 2025
|
24.77
|
24.77
|
24.77
|
|||||||||
|
February 28, 2025
|
24.64
|
24.64
|
24.64
|
|||||||||
|
March 31, 2025
|
24.42
|
24.42
|
24.42
|
|||||||||
|
April 30, 2025
|
24.11
|
24.11
|
24.11
|
|||||||||
|
May 31, 2025
|
24.27
|
24.27
|
24.27
|
|||||||||
|
June 30, 2025
|
24.24
|
24.24
|
24.24
|
|||||||||
|
July 31, 2025
|
24.22
|
24.22
|
24.22
|
|||||||||
|
August 31, 2025
|
24.20
|
24.20
|
24.20
|
|||||||||
|
September 30, 2025
|
24.07
|
24.07
|
24.07
|
|||||||||
|
October 31, 2025
|
23.99
|
23.99
|
23.99
|
|||||||||
|
November 30, 2025
|
23.98
|
23.98
|
23.98
|
|||||||||
|
December 31, 2025
|
23.95
|
23.95
|
23.95
|
|||||||||
Dividends and distributions to common shareholders are recorded on the ex-dividend date. Distributions are declared considering net investment income available for
distribution to shareholders, at the discretion of our Board of Trustees.
F-59
7. Stockholders’ Equity and Dividends (Continued)
Institutional Class
The following tables summarize the Fund's dividends declared for the Institutional Class shares for the years ended December 31, 2025 and 2024:
|
Date Declared
|
Record Date
|
Payment Date
|
Type
|
Amount Per Share
|
Total Amount
|
|||||||||
|
January 26, 2024
|
January 30, 2024
|
February 27, 2024
|
Regular
|
$
|
0.2300
|
$
|
2,348,876
|
|||||||
|
February 23, 2024
|
February 28, 2024
|
March 27, 2024
|
Regular
|
0.2300
|
2,471,608
|
|||||||||
|
March 26, 2024
|
March 28, 2024
|
April 26, 2024
|
Regular
|
0.2300
|
2,572,189
|
|||||||||
|
April 24, 2024
|
April 29, 2024
|
May 29, 2024
|
Regular
|
0.2300
|
2,817,179
|
|||||||||
|
May 24, 2024
|
May 30, 2024
|
June 26, 2024
|
Regular
|
0.2300
|
2,983,344
|
|||||||||
|
June 26, 2024
|
June 27, 2024
|
July 29, 2024
|
Regular
|
0.2300
|
3,183,325
|
|||||||||
|
July 26, 2024
|
July 30, 2024
|
August 28, 2024
|
Regular
|
0.2300
|
3,812,774
|
|||||||||
|
August 23, 2024
|
August 29, 2024
|
September 26, 2024
|
Regular
|
0.2300
|
4,370,691
|
|||||||||
|
September 25, 2024
|
September 27, 2024
|
October 29, 2024
|
Regular
|
0.2300
|
4,658,792
|
|||||||||
|
October 24, 2024
|
October 30, 2024
|
November 27, 2024
|
Regular
|
0.2300
|
4,925,216
|
|||||||||
|
November 25, 2024
|
November 27, 2024
|
December 27, 2024
|
Regular
|
0.2300
|
5,342,972
|
|||||||||
|
December 20, 2024
|
December 30, 2024
|
January 29, 2025
|
Regular
|
0.2300
|
5,596,850
|
|||||||||
|
$
|
2.7600
|
$
|
45,083,816
|
|||||||||||
|
January 24, 2025
|
January 30, 2025
|
February 26, 2025
|
Regular
|
$
|
0.2300
|
$
|
5,923,347
|
|||||||
|
February 25, 2025
|
February 27, 2025
|
March 27, 2025
|
Regular
|
0.2300
|
6,249,265
|
|||||||||
|
March 24, 2025
|
March 28, 2025
|
April 28, 2025
|
Regular
|
0.2300
|
6,588,559
|
|||||||||
|
April 24, 2025
|
April 29, 2025
|
May 28, 2025
|
Regular
|
0.2300
|
7,190,565
|
|||||||||
|
May 23, 2025
|
May 29, 2025
|
June 26, 2025
|
Regular
|
0.2300
|
7,422,523
|
|||||||||
|
June 26, 2025
|
June 27, 2025
|
July 29, 2025
|
Regular
|
0.2300
|
7,802,691
|
|||||||||
|
July 25, 2025
|
July 30, 2025
|
August 27, 2025
|
Regular
|
0.2300
|
9,024,581
|
|||||||||
|
August 22, 2025
|
August 28, 2025
|
September 26, 2025
|
Regular
|
0.1980
|
8,822,622
|
|||||||||
|
September 26, 2025
|
September 29, 2025
|
October 29, 2025
|
Regular
|
0.1976
|
9,423,839
|
|||||||||
|
October 24, 2025
|
October 30, 2025
|
November 26, 2025
|
Regular
|
0.1966
|
10,429,938
|
|||||||||
|
November 26, 2025
|
November 28, 2025
|
December 29, 2025
|
Regular
|
0.1959
|
11,205,904
|
|||||||||
|
December 23, 2025
|
December 30, 2025
|
January 28, 2026
|
Regular
|
0.1959
|
11,957,706
|
|||||||||
|
$
|
2.5940
|
$
|
102,041,540
|
|||||||||||
F-60
7. Stockholders’ Equity and Dividends (Continued)
Class S Shares
The following table summarizes the Fund's dividends declared for the Class S shares for the years ended December 31, 2025 and 2024.
|
Date Declared (1)
|
Record Date
|
Payment Date
|
Type
|
Gross Amount
Per Share
|
Amount Per Share Net
of Shareholder
Servicing
and/or Distribution
Fees
|
Gross
Amount
|
Net
Amount
|
||||||||||||||||
|
June 26, 2024
|
June 27, 2024
|
July 29, 2024
|
Regular
|
$
|
0.2300
|
$
|
0.2100
|
$
|
68,922
|
$
|
63,626
|
||||||||||||
|
July 26, 2024
|
July 30, 2024
|
August 28, 2024
|
Regular
|
0.2300
|
0.2100
|
142,491
|
131,591
|
||||||||||||||||
|
August 23, 2024
|
August 29, 2024
|
September 26, 2024
|
Regular
|
0.2300
|
0.2100
|
201,157
|
185,825
|
||||||||||||||||
|
September 25, 2024
|
September 27, 2024
|
October 29, 2024
|
Regular
|
0.2300
|
0.2100
|
255,347
|
235,807
|
||||||||||||||||
|
October 24, 2024
|
October 30, 2024
|
November 27, 2024
|
Regular
|
0.2300
|
0.2100
|
320,062
|
295,709
|
||||||||||||||||
|
November 25, 2024
|
November 27, 2024
|
December 27, 2024
|
Regular
|
0.2300
|
0.2100
|
377,573
|
348,681
|
||||||||||||||||
|
December 20, 2024
|
December 30, 2024
|
January 29, 2025
|
Regular
|
0.2300
|
0.2100
|
415,880
|
384,088
|
||||||||||||||||
|
.
|
$
|
1.6100
|
$
|
1.4700
|
$
|
1,781,432
|
$
|
1,645,327
|
|||||||||||||||
|
January 24, 2025
|
January 30, 2025
|
February 26, 2025
|
Regular
|
$
|
0.2300
|
$
|
0.2124
|
$
|
472,537
|
$
|
436,377
|
||||||||||||
|
February 25, 2025
|
February 27, 2025
|
March 27, 2025
|
Regular
|
0.2300
|
0.2125
|
527,138
|
487,029
|
||||||||||||||||
|
March 24, 2025
|
March 28, 2025
|
April 28, 2025
|
Regular
|
0.2300
|
0.2125
|
599,042
|
553,463
|
||||||||||||||||
|
April 24, 2025
|
April 29, 2025
|
May 28, 2025
|
Regular
|
0.2300
|
0.2127
|
683,484
|
632,083
|
||||||||||||||||
|
May 23, 2025
|
May 29, 2025
|
June 26, 2025
|
Regular
|
0.2300
|
0.2129
|
731,457
|
677,139
|
||||||||||||||||
|
June 26, 2025
|
June 27, 2025
|
July 29, 2025
|
Regular
|
0.2300
|
0.2128
|
783,555
|
724,982
|
||||||||||||||||
|
July 25, 2025
|
July 30, 2025
|
August 27, 2025
|
Regular
|
0.2300
|
0.2128
|
847,411
|
784,161
|
||||||||||||||||
|
August 22, 2025
|
August 28, 2025
|
September 26, 2025
|
Regular
|
0.1980
|
0.1808
|
783,407
|
715,516
|
||||||||||||||||
|
September 26, 2025
|
September 29, 2025
|
October 29, 2025
|
Regular
|
0.1976
|
0.1805
|
836,967
|
764,370
|
||||||||||||||||
|
October 24, 2025
|
October 30, 2025
|
November 26, 2025
|
Regular
|
0.1966
|
0.1796
|
864,300
|
789,349
|
||||||||||||||||
|
November 26, 2025
|
November 28, 2025
|
December 29, 2025
|
Regular
|
0.1959
|
0.1789
|
910,079
|
831,135
|
||||||||||||||||
|
December 23, 2025
|
December 30, 2025
|
January 28, 2026
|
Regular
|
0.1959
|
0.1789
|
936,819
|
855,583
|
||||||||||||||||
|
$
|
2.5940
|
$
|
2.3873
|
$
|
8,976,196
|
$
|
8,251,187
|
||||||||||||||||
| (1) |
Class S commenced operations on June 1, 2024.
|
F-61
7. Stockholders’ Equity and Dividends (Continued)
Class D Shares
The following table summarizes the Fund's dividends declared for the Class D shares for the years ended December 31, 2025 and 2024.
|
Date Declared (1)
|
Record Date
|
Payment Date
|
Type
|
Gross Amount
Per Share
|
Amount Per Share Net
of Shareholder
Servicing
and/or Distribution
Fees
|
Gross
Amount
|
Net
Amount
|
||||||||||||||||
|
August 23, 2024
|
August 29, 2024
|
September 26, 2024
|
Regular
|
$
|
0.2300
|
$
|
0.2248
|
$
|
28
|
$
|
27
|
||||||||||||
|
September 25, 2024
|
September 27, 2024
|
October 29, 2024
|
Regular
|
0.2300
|
0.2248
|
51
|
50
|
||||||||||||||||
|
October 24, 2024
|
October 30, 2024
|
November 27, 2024
|
Regular
|
0.2300
|
0.2200
|
27,906
|
27,275
|
||||||||||||||||
|
November 25, 2024
|
November 27, 2024
|
December 27, 2024
|
Regular
|
0.2300
|
0.2200
|
29,249
|
28,588
|
||||||||||||||||
|
December 20, 2024
|
December 30, 2024
|
January 29, 2025
|
Regular
|
0.2300
|
0.2200
|
29,297
|
28,638
|
||||||||||||||||
|
.
|
$
|
1.1500
|
$
|
1.0996
|
$
|
86,531
|
$
|
84,578
|
|||||||||||||||
|
January 24, 2025
|
January 30, 2025
|
February 26, 2025
|
Regular
|
$
|
0.2300
|
$
|
0.2248
|
$
|
30,170
|
$
|
29,488
|
||||||||||||
|
February 25, 2025
|
February 27, 2025
|
March 27, 2025
|
Regular
|
0.2300
|
0.2248
|
32,328
|
31,597
|
||||||||||||||||
|
March 24, 2025
|
March 28, 2025
|
April 28, 2025
|
Regular
|
0.2300
|
0.2249
|
34,059
|
33,304
|
||||||||||||||||
|
April 24, 2025
|
April 29, 2025
|
May 28, 2025
|
Regular
|
0.2300
|
0.2249
|
37,499
|
36,670
|
||||||||||||||||
|
May 23, 2025
|
May 29, 2025
|
June 26, 2025
|
Regular
|
0.2300
|
0.2250
|
37,558
|
36,737
|
||||||||||||||||
|
June 26, 2025
|
June 27, 2025
|
July 29, 2025
|
Regular
|
0.2300
|
0.2249
|
46,315
|
45,297
|
||||||||||||||||
|
July 25, 2025
|
July 30, 2025
|
August 27, 2025
|
Regular
|
0.2300
|
0.2250
|
24,559
|
23,409
|
||||||||||||||||
|
August 22, 2025
|
August 28, 2025
|
September 26, 2025
|
Regular
|
0.1980
|
0.1930
|
24,447
|
23,762
|
||||||||||||||||
|
September 26, 2025
|
September 29, 2025
|
October 29, 2025
|
Regular
|
0.1976
|
0.1926
|
22,624
|
21,940
|
||||||||||||||||
|
October 24, 2025
|
October 30, 2025
|
November 26, 2025
|
Regular
|
0.1966
|
0.1916
|
22,433
|
21,861
|
||||||||||||||||
|
November 26, 2025
|
November 28, 2025
|
December 29, 2025
|
Regular
|
0.1959
|
0.1909
|
18,547
|
18,073
|
||||||||||||||||
|
December 23, 2025
|
December 30, 2025
|
January 28, 2026
|
Regular
|
0.1959
|
0.1909
|
18,287
|
17,821
|
||||||||||||||||
|
$
|
2.5940
|
$
|
2.5332
|
$
|
348,827
|
$
|
339,959
|
||||||||||||||||
| (1) |
Class D commenced operations on August 1, 2024.
|
Character of Distributions
The Fund may fund its cash distributions to shareholders from any source of funds available to the Fund, including but not limited to offering proceeds, net investment
income from operations, capital gains proceeds from the sale of assets, dividends or other distributions paid to it on account of preferred and common equity investments in portfolio companies and expense support from the Investment
Adviser, which is subject to recoupment.
Through October 31, 2024, all of the Fund’s distributions resulted from net investment income. From November 1, 2024 through July 31, 2025, certain of the Fund's
distributions were from sources other than net investment income. Through December 31, 2025, a portion of the Fund's distributions resulted and future distributions may result from expense support from the Investment Adviser, which is
subject to repayment by the Fund within three years from the date of payment. Any such distribution may not be based solely on the Fund’s investment performance, and can only be sustained if the Fund achieves positive investment
performance in future periods and/or the Investment Adviser continues to provide expense support. The Fund’s future repayments of expense support will reduce the distributions that they would otherwise receive. There can be no assurance
that the Fund will achieve the performance necessary to sustain these distributions, or be able to pay distributions at all.
Sources of distributions, other than net investment income and realized gains on a GAAP basis, may include required adjustments to GAAP net investment income in the
current period to determine taxable income available for distributions. The following tables present the sources of cash distributions on a GAAP basis that the Fund has declared on its common shares:
F-62
7. Stockholders’ Equity and Dividends (Continued)
|
For the Year Ended December 31, 2025 (1)
|
||||||||||||||||||||||||
|
Institutional Class
|
Class S
|
Class D
|
||||||||||||||||||||||
|
Source of Distribution
|
Per Share
|
Amount
|
Per Share
|
Amount
|
Per Share
|
Amount
|
||||||||||||||||||
|
Net investment income
|
$
|
2.22
|
$
|
90,252,681
|
$
|
2.01
|
$
|
7,158,550
|
$
|
2.15
|
$
|
282,743
|
||||||||||||
|
Net realized gains
|
0.38
|
11,788,859
|
0.38
|
1,092,637
|
0.38
|
57,216
|
||||||||||||||||||
|
Total
|
$
|
2.59
|
$
|
102,041,540
|
$
|
2.39
|
$
|
8,251,187
|
$
|
2.53
|
$
|
339,959
|
||||||||||||
|
For the Year Ended December 31, 2024 (1)
|
||||||||||||||||||||||||
|
Institutional Class
|
Class S
|
Class D
|
||||||||||||||||||||||
|
Source of Distribution
|
Per Share
|
Amount
|
Per Share
|
Amount
|
Per Share
|
Amount
|
||||||||||||||||||
|
Net investment income
|
$
|
2.71
|
$
|
44,015,387
|
$
|
1.42
|
$
|
1,568,515
|
$
|
1.05
|
$
|
78,816
|
||||||||||||
|
Net realized gains
|
0.05
|
1,068,429
|
0.05
|
76,812
|
0.05
|
5,762
|
||||||||||||||||||
|
Total
|
$
|
2.76
|
$
|
45,083,816
|
$
|
1.47
|
$
|
1,645,327
|
$
|
1.10
|
$
|
84,578
|
||||||||||||
| (1) |
Class S commenced operations on June 1, 2024 and Class D commenced operations on August 1, 2024.
|
8. Share Repurchase Program
At the discretion of the Fund’s Board of Trustees, the Fund is conducting a share repurchase program in which the Fund is repurchasing, in each quarter, up to 5% of the Fund’s Common Shares
outstanding (either by number of shares or aggregate NAV) as of the close of the previous calendar quarter. The Fund does not intend to conduct a share repurchase offer during any calendar quarter for which our liquid assets plus
available and undrawn leverage are less than 25% of our net assets as of the date of the most recent publicly available NAV prior to the commencement of such calendar quarter. In addition, our Board of Trustees may amend, suspend or
terminate the share repurchase program at any time if it deems such action to be in our best interest and the best interest of our shareholders. As a result, share repurchases may not be available each quarter. We intend to conduct such
repurchase offers in accordance with the requirements of Rule 13e-4 promulgated under the Securities Exchange Act of 1934 and the 1940 Act. All shares purchased by us pursuant to the terms of each tender offer will be retired and
thereafter will be authorized and unissued shares.
Under the Fund’s share repurchase plan, to the extent the Fund offers to repurchase shares in any particular quarter, the Fund expects to repurchase shares pursuant to tender offers on or
around the last business day of that quarter using a purchase price equal to the NAV per share as of the last business day of the applicable quarter, except that shares that have not been outstanding for at least one year will be
repurchased at 98% of such NAV (an “Early Repurchase Deduction”). The one-year holding period is measured as of the subscription closing date immediately following the valuation date of the applicable tender offer. The Early Repurchase
Deduction may be waived at the Fund’s or Distributor’s discretion (a) in the case of repurchase requests arising from the death, divorce or qualified disability of the holder, (b) due to trade or operational error, or (c) for repurchase
requests with respect to shares held in accounts of asset allocation programs, such as model portfolio management programs (and similar arrangements). The Early Repurchase Deduction will be waived in the event that a shareholder’s
shares are repurchased because the shareholder has failed to maintain the $500 minimum account balance. In addition, the Fund’s Common Shares are sold to certain feeder vehicles primarily created to hold the Fund’s Common Shares that in
turn offer interests in such feeder vehicles to non-U.S. persons. For such feeder vehicles and similar arrangements in certain markets, the Fund may not apply the Early Repurchase Deduction to the feeder vehicles or underlying
investors, often because of administrative or systems limitations. The Early Repurchase Deduction will be retained by the Fund for the benefit of remaining shareholders. The Fund commenced its initial quarterly repurchase offer on April
28, 2023.
The following table presents information with respect to the Fund's repurchases for the years ended December 31, 2025 and 2024 :
|
Repurchase Offer
Commencement
Date
|
Repurchase request
deadline
|
Number of Shares
Repurchased
(All Classes)
|
Percentage of
Outstanding Shares
Repurchased(1)
|
Price Paid
Per Share
|
Repurchase Pricing
Date
|
Amount
Repurchased
(All Classes)(2)
|
Maximum number of shares that
may yet be repurchased(3)
|
||||||||||||||||
|
January 31, 2025
|
February 28, 2025
|
139,189
|
0.5
|
%
|
$
|
24.42
|
March 31, 2025
|
$
|
3,398,946
|
—
|
|||||||||||||
|
April 30, 2025
|
May 28, 2025
|
265,506
|
0.7
|
%
|
$
|
24.24
|
June 30, 2025
|
$
|
6,434,733
|
—
|
|||||||||||||
|
July 31, 2025
|
August 27, 2025
|
552,561
|
1.1
|
%
|
$
|
24.07
|
September 30, 2025
|
$
|
13,290,207
|
—
|
|||||||||||||
|
October 31, 2025
|
November 28, 2025
|
1,215,939
|
1.8
|
%
|
$
|
23.95
|
December 31, 2025
|
$
|
29,116,490
|
—
|
|||||||||||||
| (1) |
Percentage is based on total shares as of the close of the previous calendar quarter.
|
| (2) |
Net of Early Repurchase Deduction (if any).
|
F-63
8. Share Repurchase Program (Continued)
| (3) |
All repurchase requests were satisfied in full.
|
|
Repurchase Offer
Commencement Date
|
Repurchase request
deadline
|
Number of Shares
Repurchased
(All Classes)
|
Percentage of
Outstanding Shares
Repurchased(1)
|
Price Paid
Per Share
|
Repurchase Pricing
Date
|
Amount
Repurchased
(All Classes)(2)
|
Maximum number of shares that
may yet be repurchased(3)
|
|||||||||||||||||
|
January 31, 2024
|
February 29, 2024
|
23,540
|
0.2
|
%
|
$
|
24.98
|
March 31, 2024
|
$
|
588,036
|
—
|
||||||||||||||
|
April 30, 2024
|
May 31, 2024
|
11,023
|
0.1
|
%
|
$
|
24.84
|
June 30, 2024
|
$
|
273,818
|
—
|
||||||||||||||
|
July 31, 2024
|
August 30, 2024
|
112,301
|
0.5
|
%
|
$
|
24.77
|
September 30, 2024
|
$
|
2,781,862
|
—
|
||||||||||||||
|
October 31, 2024
|
November 29, 2024
|
56,295
|
0.2
|
%
|
$
|
24.79
|
December 31, 2024
|
$
|
1,393,661
|
—
|
||||||||||||||
(1) Percentage is based on total shares as of the close of the previous calendar quarter.
(2) Net of Early Repurchase Deduction (if any).
(3) All repurchase requests were satisfied in full.
F-64
9. Financial Highlights
The following are the financial highlights for the years ended December 31, 2025, 2024 and 2023. No Class S shares were outstanding between January 1, 2024 and May 31,
2024. No Class D shares were outstanding between January 1, 2024 and July 31, 2024.
|
For the Year Ended December 31,
|
||||||||||||||||||||||||||||
|
2025
|
2024 (1)
|
2023
|
||||||||||||||||||||||||||
|
Institutional Class
|
Class S
|
Class D
|
Institutional Class
|
Class S
|
Class D
|
Institutional Class
|
||||||||||||||||||||||
|
Per Common Share
|
||||||||||||||||||||||||||||
|
Per share NAV at beginning of period
|
$
|
24.79
|
$
|
24.79
|
$
|
24.79
|
$
|
24.85
|
$
|
24.95
|
$
|
24.75
|
$
|
23.69
|
||||||||||||||
|
Investment operations: (2)
|
||||||||||||||||||||||||||||
|
Net investment income before excise taxes
|
2.22
|
2.01
|
2.15
|
—
|
—
|
—
|
—
|
|||||||||||||||||||||
|
Excise taxes
|
—
|
—
|
—
|
—
|
—
|
—
|
—
|
|||||||||||||||||||||
|
Net investment income
|
2.22
|
2.01
|
2.15
|
2.60
|
1.35
|
0.99
|
3.18
|
|||||||||||||||||||||
|
Net realized and unrealized gain (loss)
|
(0.46
|
)
|
(0.46
|
)
|
(0.46
|
)
|
0.10
|
(0.04
|
)
|
0.15
|
0.85
|
|||||||||||||||||
|
Total from investment operations
|
1.76
|
1.55
|
1.69
|
2.70
|
1.31
|
1.14
|
4.03
|
|||||||||||||||||||||
|
|
||||||||||||||||||||||||||||
|
Dividends to common shareholders
|
(2.60
|
)
|
(2.39
|
)
|
(2.53
|
)
|
(2.76
|
)
|
(1.47
|
)
|
(1.10
|
)
|
(2.87
|
)
|
||||||||||||||
|
Per share NAV at end of period
|
$
|
23.95
|
$
|
23.95
|
$
|
23.95
|
$
|
24.79
|
$
|
24.79
|
$
|
24.79
|
$
|
24.85
|
||||||||||||||
|
|
||||||||||||||||||||||||||||
|
Total return based on net asset value: (3)
|
7.10
|
%
|
6.25
|
%
|
6.82
|
%
|
10.87
|
%
|
5.25
|
%
|
4.61
|
%
|
17.01
|
%
|
||||||||||||||
|
|
||||||||||||||||||||||||||||
|
Shares outstanding at end of period
|
61,039,850
|
4,782,132
|
93,350
|
24,334,133
|
1,808,175
|
127,381
|
9,608,484
|
|||||||||||||||||||||
|
Ratios to average net asset value: (4)
|
||||||||||||||||||||||||||||
|
Net investment income(5)
|
9.58
|
%
|
8.73
|
%
|
8.79
|
%
|
10.66
|
%
|
9.86
|
%
|
10.38
|
%
|
13.50
|
%
|
||||||||||||||
|
Expenses before incentive fee (6)
|
5.16
|
%
|
6.19
|
%
|
5.96
|
%
|
5.89
|
%
|
5.84
|
%
|
5.24
|
%
|
6.70
|
%
|
||||||||||||||
|
Expenses and incentive fee (7)(8)(9)
|
6.31
|
%
|
7.36
|
%
|
7.07
|
%
|
7.54
|
%
|
6.79
|
%
|
5.91
|
%
|
6.70
|
%
|
||||||||||||||
|
|
||||||||||||||||||||||||||||
|
Ending net asset value
|
$
|
1,461,960,470
|
$
|
114,536,454
|
$
|
2,235,823
|
$
|
603,211,729
|
$
|
44,822,335
|
$
|
3,157,610
|
$
|
238,804,026
|
||||||||||||||
|
Weighted-average number of common shares
|
40,231,661
|
3,524,337
|
132,688
|
16,353,680
|
1,107,732
|
75,396
|
7,055,915
|
|||||||||||||||||||||
|
|
||||||||||||||||||||||||||||
|
Fund-level Supplemental Data
|
||||||||||||||||||||||||||||
|
Portfolio turnover rate
|
24.53
|
%
|
22.89
|
%
|
23.13
|
%
|
||||||||||||||||||||||
|
Weighted-average debt outstanding
|
$
|
637,922,451
|
$
|
201,243,169
|
$
|
110,172,603
|
||||||||||||||||||||||
|
Weighted-average interest rate on debt
|
6.25
|
%
|
7.15
|
%
|
7.01
|
%
|
||||||||||||||||||||||
|
Weighted-average debt per share
|
$
|
9.68
|
$
|
7.66
|
$
|
11.47
|
||||||||||||||||||||||
| (1) |
Class S commenced operations on June 1, 2024 and Class D commenced operations on August 1, 2024.
|
| (2) |
Per share changes in net asset value are computed based on the actual number of shares outstanding during the time such activity occurred.
|
| (3) |
Not annualized for periods less than one year. Total return based on net asset value equals the change in net asset value per share during the period plus declared dividends per share during the
period, divided by the beginning net asset value per share at the beginning of the period.
|
| (4) |
Annualized for periods less than one year except for incentive fees and other certain non-recurring expenses.
|
| (5) |
Net of incentive fees and excise taxes.
|
| (6) |
Includes interest and other debt costs but excludes excise taxes.
|
| (7) |
Includes incentive fees and all Fund expenses including interest and other debt costs but excludes excise taxes.
|
| (8) |
For the year ended December 31, 2025, amounts are annualized except for organizational costs, management fee and income based incentive fee waivers by the Investment Adviser. For the year ended
December 31, 2025, the ratio of total operating expenses to average net assets was 7.50%, 8.49%, and 7.75% on Institutional Class, Class S and Class D respectively, on an annualized basis, excluding the effect of expense
support/(recoupment) and income based incentive fee waivers by the Investment Adviser which represented 1.19%, 1.13% and 0.68% on Institutional Class, Class S and Class D, respectively, of average net assets.
|
| (9) |
For the year ended December 31, 2023, the ratio of total operating expenses to average was 9.86% on Institutional Class, on an annualized basis, excluding the effect of management fee and income
based incentive fee waivers by the Investment Adviser which represented 3.18% on Institutional Class of average net assets.
|
F-65
10. Senior Securities
Information about the Fund's senior securities is shown in the following table for each of the years ended December 31, 2025, 2024, 2023 and the period from March 18,
2022 (Inception) to December 31, 2022.
|
Class and Year
|
Total Amount
Outstanding(1)
|
Asset
Coverage
Per Unit(2)
|
Involuntary
Liquidating
Preference
Per Unit(3)
|
Average
Market
Value Per
Unit(4)
|
||||||||||||
|
Credit Facility
|
||||||||||||||||
|
Fiscal year 2025
|
$
|
260,000,000
|
$
|
4,657
|
—
|
N/A
|
||||||||||
|
Fiscal year 2024
|
320,000,000
|
3,229
|
—
|
N/A
|
||||||||||||
|
Fiscal year 2023
|
156,000,000
|
2,510
|
—
|
N/A
|
||||||||||||
|
Fiscal year 2022
|
95,000,000
|
2,225
|
—
|
N/A
|
||||||||||||
|
Revolving Credit Facility
|
||||||||||||||||
|
Fiscal year 2025
|
$
|
50,970,583
|
$
|
4,657
|
—
|
N/A
|
||||||||||
|
Fiscal year 2024
|
—
|
3,229
|
—
|
N/A
|
||||||||||||
|
SG Revolving Credit Facility
|
||||||||||||||||
|
Fiscal year 2025
|
$
|
200,000,000
|
$
|
4,657
|
—
|
N/A
|
||||||||||
|
Tranche A Notes
|
||||||||||||||||
|
Fiscal year 2025
|
$
|
70,000,000
|
$
|
2,859
|
—
|
N/A
|
||||||||||
|
Fiscal year 2024
|
70,000,000
|
2,656
|
—
|
N/A
|
||||||||||||
|
Tranche B Notes
|
||||||||||||||||
|
Fiscal year 2025
|
$
|
55,000,000
|
$
|
2,859
|
—
|
N/A
|
||||||||||
|
Promissory Notes
|
||||||||||||||||
|
Fiscal year 2025
|
$
|
110,000
|
$
|
2,859
|
—
|
N/A
|
||||||||||
|
2025A Tranche B Notes
|
||||||||||||||||
|
Fiscal year 2025
|
$
|
150,000,000
|
$
|
2,859
|
—
|
N/A
|
||||||||||
|
2025A Tranche A Notes
|
||||||||||||||||
|
Fiscal year 2025
|
$
|
50,000,000
|
$
|
2,859
|
—
|
N/A
|
||||||||||
| (1) |
Total amount of each class of senior securities outstanding at the end of the period presented.
|
| (2) |
The asset coverage ratio for a class of senior securities representing indebtedness is calculated as our total assets, less all liabilities and indebtedness not represented by senior securities,
divided by senior securities representing indebtedness. The asset coverage ratio with respect to indebtedness is multiplied by $1,000 to determine the Asset Coverage Per Unit.
|
| (3) |
The amount to which such class of senior security would be entitled upon the voluntary liquidation of the issuer in preference to any security junior to it. The “—” in this column indicates that
the SEC expressly does not require this information to be disclosed for certain types of senior securities.
|
| (4) |
The Fund's senior securities are not registered for public trading.
|
F-66
11. Subsequent Events
On January 2, 2026, the Fund accepted $33.2 million of additional subscriptions, to purchase $30.0 million of additional Institutional shares, $3.1 million of additional
Class S shares and $0.1 million of additional Class D shares, par value $0.001 per share. On January 21, 2026, the number of shares being purchased was fixed when the purchase price of $23.95 per Institutional, Class S shares and Class
D shares were determined by the Fund. As a result, the Fund issued 1.3 million Institutional shares, 0.1 million Class S shares and 0.0 million Class D shares and received $33.2 million in proceeds.
On January 26, 2026, the Fund declared a regular distribution as follows:
|
Gross Distribution
|
Shareholder Servicing and/or Distribution Fee
|
Net Distribution
|
||||||||||
|
Institutional Shares
|
$
|
0.1956
|
$
|
—
|
$
|
0.1956
|
||||||
|
Class S Shares
|
0.1956
|
0.0170
|
0.1786
|
|||||||||
|
Class D Shares
|
0.1956
|
0.0050
|
0.1906
|
|||||||||
The distribution was paid on February 25, 2026 to shareholders of record at the close of business on January 29, 2026. The distribution was paid in cash or reinvested in
Fund shares for shareholders participating in the Fund’s distribution reinvestment plan.
On February 2, 2026, the Fund accepted $48.4 million of additional subscriptions, to purchase $45.1 million of additional Institutional shares, $3.3 million of
additional Class S shares and $0.0 million of additional Class D shares, par value $0.001 per share. On February 20, 2026, the number of shares being purchased was fixed when the purchase price of $23.90 per Institutional, Class S
shares and Class D shares were determined by the Fund. As a result, the Fund issued 1.9 million Institutional shares, 0.1 million Class S shares and 0.0 million Class D shares and received $48.4 million in proceeds.
On February 24, 2026, the Fund declared a regular distribution as follows:
|
Gross Distribution
|
Shareholder Servicing and/or Distribution Fee
|
Net Distribution
|
||||||||||
|
Institutional Shares
|
$
|
0.1951
|
$
|
—
|
$
|
0.1951
|
||||||
|
Class S Shares
|
0.1951
|
0.0169
|
0.1782
|
|||||||||
|
Class D Shares
|
0.1951
|
0.0050
|
0.1901
|
|||||||||
The distribution will be payable to shareholders of record at the close of business on February 26, 2026 and will be paid on March 27, 2026. The distribution will be
paid in cash or reinvested in Fund shares for shareholders participating in the Fund’s distribution reinvestment plan.
12. Segment Reporting
The Fund's chief executive officer and chief financial officer act as the Fund's chief operating decision maker ("CODM"). The CODM is responsible for assessing
performance, allocating resources and making operating decisions of the Fund on a consolidated basis based on the net increase (decrease) in net assets resulting from operations (“net income”) of the Fund. The CODM has concluded that
the Fund operates through a single operating and reporting segment with an investment objective to generate both current income and capital appreciation through debt and equity investments. In addition to numerous other factors and
metrics, the CODM utilizes net income as a key metric in determining the amount of dividends to be distributed to the Fund's shareholders. As the Fund's operations comprise of a single reporting segment, the segment assets are reflected
on the accompanying Consolidated Statements of Assets and Liabilities as “total assets” and the significant segment expenses are listed on the accompanying Consolidated Statements of Operations.
BlackRock Private Credit Fund
Consolidated Schedule of Restricted Securities of Unaffiliated Issuers
December 31, 2025
|
Investment
|
Acquisition Date
|
|
|
New Insight Holdings, Inc. (Dynata), Common Shares
|
7/15/2024
|
|
|
48forty Intermediate Holdings, Inc., Common Shares
|
11/5/2024
|
|
|
Streamland Media Holdings LLC, Common Units
|
3/31/2025
|
BlackRock Private Credit Fund
Consolidated Schedule of Restricted Securities of Unaffiliated Issuers
December 31, 2024
|
Investment
|
Acquisition Date
|
|
|
New Insight Holdings, Inc. (Dynata), Common Shares
|
7/15/2024
|
|
|
48forty Intermediate Holdings, Inc., Common Shares
|
11/5/2024
|
BlackRock Private Credit Fund
Maximum Offering of $5,000,000,000 in Common Shares
PROSPECTUS
You should rely only on the information contained in this prospectus. No intermediary, salesperson or other person is authorized to make any representations other than those contained in this
prospectus and supplemental literature authorized by BlackRock Private Credit Fund and referred to in this prospectus, and, if given or made, such information and representations must not be relied upon. This prospectus is not an offer to sell nor
is it seeking an offer to buy these securities in any jurisdiction where the offer or sale is not permitted. The information contained in this prospectus is accurate only as of the date of this prospectus, regardless of the time of delivery of this
prospectus or any sale of these securities. You should not assume that the delivery of this prospectus or that any sale made pursuant to this prospectus implies that the information contained in this prospectus will remain fully accurate and
correct as of any time subsequent to the date of this prospectus.
April 24, 2026
PART C
Other Information
|
Item 25.
|
Financial Statements And Exhibits
|
| (1) |
Financial Statements
|
The following financial statements of the Registrant are included in Part A of this Registration Statement.
Index of Financial Statements
|
Page
|
|
|
Report of Independent Registered Public Accounting Firm (PCAOB ID 34)
|
F-2
|
|
Consolidated Statements of Assets and Liabilities as of December 31, 2025 and 2024
|
F-3
|
|
Consolidated Statements of Operations for the year ended December 31, 2025, 2024 and 2023
|
F-5
|
|
Consolidated Statements of Changes in Net Assets for the year ended December 31, 2025, 2024 and 2023
|
F-6
|
|
Consolidated Statements of Cash Flows for the year ended December 31, 2025, 2024 and 2023
|
F-7
|
|
Consolidated Schedule of Investments as of December 31, 2025 and 2024
|
F-8
|
|
Notes to Financial Statements
|
F-34
|
|
(2)
|
Exhibits
|
|
Certificate of Trust of the Registrant(1)
|
|
|
Amended and Restated Agreement and Declaration of Trust of the Registrant(2)
|
|
|
Second Amended and Restated Agreement and Declaration of Trust of the Registrant(3)
|
|
|
Third Amended and Restated Agreement and Declaration of Trust of the Registrant(5)
|
|
|
Fourth Amended and Restated Agreement and Declaration of Trust of the Registrant(6)
|
|
|
Amendment No.1 to the Fourth Amended and Restated Agreement and Declaration of Trust of the Registrant(17)
|
|
|
Bylaws of the Registrant(2)
|
|
|
Amended and Restated Bylaws of the Registrant(3)
|
|
|
Second Amended and Restated Bylaws of the Registrant(19)
|
|
|
Amendment No. 1 to the Second Amended and Restated Bylaws of the Registrant(17)
|
|
|
Form of Subscription Agreement(5)
|
|
|
Distribution Reinvestment Plan(5)
|
|
|
Second Amended and Restated Advisory Agreement(10)
|
|
|
Amended and Restated Sub-Advisory Agreement(5)
|
|
Distribution Agreement(5)
|
|
|
Form of Broker-Dealer Agreement(2)
|
|
|
Amended and Restated Distribution and Shareholder Servicing Plan of the Registrant(12)
|
|
|
Custodian Agreement(2)
|
|
|
Amended and Restated Administration Agreement(18)
|
|
|
Transfer Agency Agreement(2)
|
|
|
Amended and Restated Multi-Class Plan(20)
|
|
|
Second Amended and Restated Fee Waiver and Expense Support and Reimbursement Agreement by and between the Registrant and Adviser(7)
|
|
|
Expense Support and Conditional Reimbursement Agreement, dated August 26, 2025, by and between the Registrant and Adviser (21)
|
|
|
Credit and Security Agreement, dated June 3, 2022, among BlackRock Private Credit Fund Leverage I, LLC, PNC Bank, National Association, as Facility Agent, State Street Bank and Trust Company, as Collateral Agent and Custodian, and the
lenders from time to time parties thereto (4)
|
|
|
Amendment No. 1 to Credit and Security Agreement among BlackRock Private Credit Fund Leverage I, LLC and PNC Bank, National Association as revolving lender, term lender, facility agent and calculation agent (8)
|
|
|
Amendment No. 2 to Credit and Security Agreement among BlackRock Private Credit Fund Leverage I, LLC and PNC Bank, National Association as revolving lender, term lender, facility agent and calculation agent (11)
|
|
|
Senior Secured Credit Agreement among BlackRock Private Credit Fund, Sumitomo Mitsui Banking Corporation, as administrative agent, and the lenders and issuing banks parties thereto(13)
|
|
|
First Amendment to Senior Secured Credit Agreement, dated as of August 7, 2025, between BlackRock Private Credit Fund, as borrower, the lenders and issuing banks party thereto and Sumitomo Mitsui Banking Corporation, as administrative
agent, and collateral agent(22)
|
|
|
Joinder Agreement, dated as of November 4, 2024, by and among BlackRock Private Credit Fund, Sumitomo Mitsui Banking Corporation, as administrative agent and issuing bank, and BNP Paribas and Morgan Stanley Bank, N.A., as the assuming
lenders(14)
|
|
|
Joinder Agreement, dated as of December 5, 2025, by and among BlackRock Private Credit Fund, Sumitomo Mitsui Banking Corporation, as administrative agent and issuing bank, and BNP Paribas, Morgan Stanley Bank, N.A., and State Street Bank
and Trust Company as the assuming lenders(23)
|
|
|
Master Note Purchase Agreement, dated as of November 18, 2024, by and among BlackRock Private Credit Fund and the purchasers party thereto(15)
|
|
|
First Supplement to Master Note Purchase Agreement, dated October 8, 2025, by and among BlackRock Private Credit Fund and the additional purchasers party thereto(24)
|
|
Loan Agreement, dated as of May 28, 2025, by and among BlackRock Private Credit Fund Leverage II, LLC, as borrower, Société Generale, as administrative agent, BlackRock Private Credit Fund, as collateral manager, the lenders party
thereto and the investors party thereto(25)
|
|
|
Warehouse Collateral Management Agreement, dated as of May 28, 2025, between BlackRock Private Credit Fund Leverage II, LLC as borrower and BlackRock Private Credit Fund as collateral manager(25)
|
|
|
Master Participation Agreement, dated as of May 28, 2025, between BlackRock Private Credit Fund Leverage I, LLC, as seller, and BlackRock Private Credit Fund Leverage II, LLC, as buyer(25)
|
|
|
First Amended and Restated Credit and Security Agreement, dated as of November 27, 2024, by and among BlackRock Private Credit Fund Leverage I, LLC, PNC Bank, National Association as facility agent, State Street Bank and Trust Company as
collateral agent and custodian and the lenders party from time to time(16)
|
|
|
Amendment No. 1 to the First Amended and Restated Credit and Security Agreement by and among BlackRock Private Credit Fund Leverage I, LLC, PNC Bank, National Association, as facility agent, State Street Bank and Trust Company as
collateral agent and custodian and the lenders party thereto from time to time(26)
|
|
|
Amendment No. 2 to First Amended and Restated Credit and Security Agreement, dated as of December 12, 2025, by and among BlackRock Private Credit Fund Leverage I, LLC as borrower, PNC Bank, National Association as facility agent and
lender, and State Street Bank and Trust Company as collateral agent and custodian(27)
|
|
|
Loan and Security Agreement, dated as of March 13, 2026, by and among BlackRock Private Credit Fund Leverage III, LLC as borrower, Bank of Montreal, the lenders party thereto from time to time, BlackRock Private Credit Fund as collateral
manager and as equityholder, and State Street Bank and Trust Company as collateral custodian(28)
|
|
|
Opinion of Skadden, Arps, Slate, Meagher & Flom LLP(29)
|
|
|
Consent of Independent Registered Public Accounting Firm*
|
|
|
Subscription Agreement for Seed Capital(5)
|
|
|
Code of Ethics of the Fund and the Adviser(2)
|
|
|
Calculation of Filing Fee Tables(29)
|
|
|
Powers of Attorney*
|
| * |
Filed herewith.
|
| (1) |
Previously filed as an exhibit to the Registrant’s Registration Statement on Form N-2 (File No. 333-262035) filed on January 6, 2022 and incorporated herein by reference.
|
| (2) |
Previously filed as an exhibit to Pre-Effective Amendment No. 1 to the Registrant’s Registration Statement on Form N-2 (File No. 333-262035) filed on April 14, 2022 and incorporated herein by reference.
|
| (3) |
Previously filed as an exhibit to Pre-Effective Amendment No. 2 to the Registrant’s Registration Statement on Form N-2 (File No. 333-262035) filed on May 20, 2022 and incorporated herein by reference.
|
| (4) |
Previously filed with the Registrant’s Form 8-K dated as of June 10, 2022 and incorporated herein by reference.
|
| (5) |
Previously filed as an exhibit to Post-Effective Amendment No. 1 to the Registrant’s Registration Statement on Form N-2 (File No. 333-262035) filed on August 30, 2022 and incorporated herein by reference.
|
| (6) |
Previously filed with the Registrant’s Form 8-K filed dated as of November 2, 2022 and incorporated herein by reference.
|
| (7) |
Previously filed as an exhibit to Post-Effective Amendment No. 3 to the Registrant’s Registration Statement on Form N-2 (File No. 333-262035) filed on April 28, 2023 and incorporated herein by reference.
|
| (8) |
Previously filed with the Registrant’s Form 8-K dated as of September 11, 2023 and incorporated herein by reference.
|
| (9) |
Previously filed with the Registrant’s Form 8-K dated as of December 19, 2023 and incorporated herein by reference.
|
| (10) |
Previously filed with the Registrant’s Form 8-K dated as of February 29, 2024 and incorporated herein by reference.
|
| (11) |
Previously filed with the Registrant’s Form 8-K dated as of December 19, 2023 and incorporated herein by reference.
|
| (12) |
Previously filed as Exhibit (h)(3) to the Registrant’s Post-Effective Amendment No. 6 to Form N-2 filed on April 22, 2024 and incorporated herein by reference.
|
| (13) |
Previously filed with the Registrant’s Form 8-K dated as of April 25, 2024 and incorporated herein by reference.
|
| (14) |
Previously filed with the Registrant’s Form 8-K dated as of November 8, 2024 and incorporated herein by reference.
|
| (15) |
Previously filed with the Registrant’s Form 8-K dated as of November 18, 2024 and incorporated herein by reference.
|
| (16) |
Previously filed with the Registrant’s Form 8-K dated as of November 29, 2024 and incorporated herein by reference.
|
| (17) |
Previously filed with the Registrant’s Form 8-K dated as of August 1, 2025 and incorporated herein by reference.
|
| (18) |
Previously filed with the Registrant’s Form 10-K dated as of February 28, 2025 and incorporated herein by reference.
|
| (19) |
Previously filed with the Registrant’s Form 8-K dated as of August 2, 2024 and incorporated herein by reference.
|
| (20) |
Previously filed with the Registrant’s Form 10-K dated as of March 2, 2026 and incorporated herein by reference.
|
| (21) |
Previously filed with the Registrant’s Form 8-K dated as of August 26, 2025 and incorporated herein by reference.
|
| (22) |
Previously filed with the Registrant’s Form 10-Q dated as of August 8, 2025 and incorporated herein by reference.
|
| (23) |
Previously filed with the Registrant’s Form 8-K dated as of December 10, 2025 and incorporated herein by reference.
|
| (24) |
Previously filed with the Registrant’s Form 8-K dated as of October 8, 2025 and incorporated herein by reference.
|
| (25) |
Previously filed with the Registrant’s Form 8-K dated as of June 3, 2025 and incorporated herein by reference.
|
| (26) |
Previously filed with the Registrant’s Form 10-Q dated as of May 8, 2025 and incorporated herein by reference.
|
| (27) |
Previously filed with the Registrant’s Form 8-K dated as of December 18, 2025 and incorporated herein by reference.
|
| (28) |
Previously filed with the Registrant’s Form 8-K dated as of March 19, 2026 and incorporated herein by reference.
|
| (29) |
Previously filed as an exhibit to the Registrant’s Registration Statement on Form N-2 (File No. 333-262035) filed on June 3, 2024 and incorporated herein by reference.
|
| Item 26. |
Marketing Arrangements
|
The information contained under the heading “Plan of Distribution” in this Registration Statement is incorporated herein by reference.
| Item 27. |
Other Expenses Of Issuance And Distribution
|
|
SEC registration fee
|
$
|
369,000
|
||
|
FINRA filing fee
|
$
|
225,500
|
||
|
Legal
|
$
|
1,700,000
|
||
|
Printing
|
$
|
200,000
|
||
|
Accounting
|
$
|
100,000
|
||
|
Blue Sky Expenses
|
$
|
125,000
|
||
|
Advertising and sales literature
|
$
|
350,000
|
||
|
Due Diligence
|
$
|
150,000
|
||
|
Miscellaneous fees and expenses
|
$
|
400,000
|
||
|
Total
|
$
|
3,619,500
|
||
| Item 28. |
Persons Controlled By Or Under Common Control
|
BlackRock Financial Management, Inc. a Delaware corporation, provided seed capital to the Fund and as of March 31, 2026 owns approximately 8.5% of the outstanding common shares of the Registrant. Following the
completion of this offering, BlackRock Financial Management, Inc.’s share ownership is expected to represent less than 1% of the Registrant’s outstanding common shares. See “Control Persons and Principal Shareholders” in the Prospectus contained
herein.
As of March 31, 2026, the following list sets forth entities in which the Registrant owns a controlling interest, the state under whose laws the entity is organized, and the percentage of voting securities or
membership interests owned by the Registrant in such entity.
|
Name of Entity and Place of Jurisdiction
|
% of Voting Securities Owned
|
|
|
BlackRock Private Credit Fund Leverage I, LLC (Delaware)
|
100%
|
|
|
BDEBT Subsidiary LLC
|
100%
|
|
|
BlackRock Private Credit Fund Leverage I, LLC
|
100%
|
|
|
BlackRock Private Credit Fund Leverage II, LLC
|
100%
|
|
|
BlackRock Private Credit Fund Leverage III, LLC
|
100%
|
| Item 29. |
Number Of Holders Of Securities
|
The following table sets forth the number of record holders of the Registrant’s common shares at March 31, 2026.
|
Title of Class
|
Number of Record Holders
|
|
|
Class S Shares
|
1,044
|
|
|
Class D Shares
|
90
|
|
|
Institutional Shares
|
1,149
|
| Item 30. |
Indemnification
|
The information contained under the headings “Description of our Shares,” “Advisory Agreement, Sub-Advisory Agreement and Administration Agreement” and “Plan of Distribution-Indemnification” in this Registration
Statement is incorporated herein by reference.
Insofar as indemnification for liabilities arising under the Securities Act may be permitted to Trustees, officers and controlling persons of the Registrant pursuant to the provisions described above, or otherwise,
the Registrant has been advised that in the opinion of the Securities and Exchange Commission such indemnification is against public policy as expressed in the Securities Act and is, therefore, unenforceable. In the event that a claim for
indemnification against such liabilities (other than the payment by the Registrant of expenses incurred or paid by a Trustee, officer or controlling person in the successful defense of an action suit or proceeding) is asserted by a Trustee, officer
or controlling person in connection with the securities being registered, the Registrant will, unless in the opinion of its counsel the matter has been settled by controlling precedent, submit to a court of appropriate jurisdiction the question
whether such indemnification by it is again public policy as expressed in the Securities Act and will be governed by the final adjudication of such issue.
The Registrant expects to obtain liability insurance for the benefit of its Trustees and officers (other than with respect to claims resulting from the willful misfeasance, bad faith, gross negligence or reckless
disregard of the duties involved in the conduct of his or her office) on a claims-made basis.
| Item 31. |
Business and Other Connections of Adviser
|
A description of any other business, profession, vocation or employment of a substantial nature in which BlackRock Capital Investment Advisors, LLC, and each managing director, director or executive officer of
BlackRock Capital Investment Advisors, LLC, is or has been, during the past two fiscal years, engaged in for his or her own account or in the capacity of director, officer, employee, partner or trustee, is set forth in Part A of this Registration
Statement in the section entitled “Management of the Fund.” Additional information regarding BlackRock Capital Investment Advisors, LLC and its officers and managing member is set forth in its Form ADV, as filed with the Securities and Exchange
Commission (SEC File No. 801-112118), and is incorporated herein by reference.
BlackRock Advisors, LLC serves as sub-adviser to the Registrant. The Registrant is fulfilling the requirement of this Item 31 to provide to provide a list of the officers and directors of BlackRock Advisors, LLC,
together with information as to any other business, profession, vocation or employment of a substantial nature engaged in by BlackRock Advisors, LLC or those officers and directors during the past two years, by incorporating by reference the
information contained in the Form ADV of BlackRock Advisors, LLC, filed with the Securities and Exchange Commission pursuant to the Investment Advisors Act of 1940 (SEC File No. 801-47710).
| Item 32. |
Location of Accounts and Records
|
All accounts, books and other documents required to be maintained by Section 31(a) of the Investment Company Act of 1940, and the rules thereunder are maintained at the offices of:
| (1) |
the Registrant;
|
| (2) |
the transfer agent;
|
| (3) |
the Custodian;
|
| (4) |
the Adviser; and
|
| (5) |
the Administrator.
|
| Item 33. |
Management Services
|
Not Applicable.
| Item 34. |
Undertakings
|
We hereby undertake:
| (1) |
to file, during any period in which offers or sales are being made, a post-effective amendment to this Registration Statement
|
| (i) |
to include any prospectus required by Section 10(a)(3) of the Securities Act;
|
| (ii) |
to reflect in the prospectus any facts or events after the effective date of the Registration Statement (or the most recent post-effective amendment thereof) which, individually or in the aggregate, represent a fundamental change in the
information set forth in the Registration Statement; and
|
| (iii) |
to include any material information with respect to the plan of distribution not previously disclosed in the Registration Statement or any material change to such information in the Registration Statement.
|
| (2) |
that, for the purpose of determining any liability under the Securities Act, each such post-effective amendment will be deemed to be a new registration statement relating to the securities offered therein, and the offering of those
securities at that time will be deemed to be the initial bona fide offering thereof;
|
| (3) |
to remove from registration by means of a post-effective amendment any of the securities being registered which remain unsold at the termination of the offering;
|
| (4) |
that, for the purpose of determining liability under the Securities Act to any purchaser, if the Registrant is subject to Rule 430C 17 CFR 230.430C: Each prospectus filed pursuant to Rule 424(b) under the Securities Act as part of a
registration statement relating to an offering, other than prospectuses filed in reliance on Rule 430A under the Securities Act 17 CFR 230.430A will be deemed to be part of and included in the registration statement as of the date it is
first used after effectiveness. Provided, however, that no statement made in a registration statement or prospectus that is part of the registration statement or made in a document incorporated or deemed incorporated by reference into the
registration statement or prospectus that is part of the registration statement will, as to a purchaser with a time of contract of sale prior to such first use, supersede or modify any statement that was made in the registration statement
or prospectus that was part of the registration statement or made in any such document immediately prior to such date of first use; and
|
| (5) |
that for the purpose of determining liability of the Registrant under the Securities Act to any purchaser in the initial distribution of securities, the undersigned Registrant undertakes that in an offering of securities of the
undersigned Registrant pursuant to this Registration Statement, regardless of the underwriting method used to sell the securities to the purchaser, if the securities are offered or sold to such purchaser by means of any of the following
communications, the undersigned Registrant will be a seller to the purchaser and will be considered to offer or sell such securities to the purchaser:
|
| (i) |
any preliminary prospectus or prospectus of the undersigned Registrant relating to the offering required to be filed pursuant to Rule 424;
|
| (ii) |
the portion of any advertisement pursuant to Rule 482 under the Securities Act 17 CFR 230.482 relating to the offering containing material information about the undersigned Registrant or its securities provided by or on behalf of the
undersigned Registrant; and
|
| (iii) |
any other communication that is an offer in the offering made by the undersigned Registrant to the purchaser.
|
SIGNATURES
Pursuant to the requirements of the Securities Act of 1933, as amended (the “Securities Act”), the Registrant certifies that this Post-Effective Amendment to the Registration Statement on Form N-2 meets all of the
requirements for effectiveness under Rule 486(b) under the Securities Act and has caused this Post-Effective Amendment to the Registration Statement to be signed on its behalf by the undersigned, thereunto duly authorized, in the City of New York,
State of New York on the 24th day of April, 2026.
|
BLACKROCK PRIVATE CREDIT FUND
|
||
|
By:
|
/s/ Diana Huffman
|
|
|
Name:
|
Diana Huffman
|
|
|
Title:
|
Secretary
|
|
Pursuant to the requirements of the Securities Act of 1933, this Post-Effective Amendment to the Registration Statement has been signed by the following persons in the capacities set forth below on the 24th
day of April, 2026.
|
Name
|
Title
|
|
|
*
|
Chief Executive Officer (Principal Executive Officer), Trustee and Co-Chief
|
|
|
Philip Tseng
|
Investment Officer
|
|
|
*
|
Chief Financial Officer and Treasurer (Principal Financial and
|
|
|
Erik L. Cuellar
|
Accounting Officer)
|
|
|
*
|
||
|
John M. Perlowski
|
Trustee
|
|
|
*
|
||
|
Eric J. Draut
|
Trustee
|
|
|
*
|
||
|
Andrea L. Petro
|
Trustee
|
|
|
*
|
||
|
Maureen K. Usifer
|
Trustee
|
* By: /s/ Diana Huffman
Signed by Diana Huffman, on behalf of those identified pursuant to her designation as attorney-in-fact signed by Messrs. Draut, Perlowski, Tseng and Cuellar and Mses. Petro and Usifer on April 23, 2026.
Exhibit Index
|
Consent of Independent Registered Public Accounting Firm
|
|
|
Powers of Attorney
|