T U E S D AY M AY 2 0 , 2 0 2 5
This presentation contains forward-looking statements about nCino's financial and operating results, which include statements regarding nCino’s first quarter fiscal 2026 financial results, future performance, outlook, guidance, the assumptions underlying those statements, the benefits from the use of nCino’s solutions, our strategies, and general business conditions. Forward- looking statements generally include actions, events, results, strategies and expectations and are often identifiable by use of the words “believes,” “expects,” “intends,” “anticipates,” “plans,” “seeks,” “estimates,” “projects,” “may,” “will,” “could,” “might,” or “continues” or similar expressions and the negatives thereof. Any forward-looking statements contained in this presentation are based upon nCino’s historical performance and its current plans, estimates, and expectations and are not a representation that such plans, estimates, or expectations will be achieved. These forward-looking statements represent nCino’s expectations as of the date of this presentation. Subsequent events may cause these expectations to change and, except as may be required by law, nCino does not undertake any obligation to update or revise these forward-looking statements. These forward-looking statements are subject to known and unknown risks and uncertainties that may cause actual results to differ materially including, but not limited to risks associated with (i) adverse changes in the financial services industry, including as a result of customer consolidation or bank failures; (ii) adverse changes in economic, regulatory, or market conditions, including as a direct or indirect consequence of higher interest rates; (iii) risks associated with the acquisitions, (iv) breaches in our security measures or unauthorized access to our customers’ or their clients' data; (v) the accuracy of management’s assumptions and estimates; (vi) our ability to attract new customers and succeed in having current customers expand their use of our solution, including in connection with our migration to an asset-based pricing model; (vii) competitive factors, including pricing pressures, consolidation among competitors, entry of new competitors, the launch of new products and marketing initiatives by our competitors, and difficulty securing rights to access or integrate with third party products or data used by our customers; (viii) the rate of adoption of our newer solutions and the results of our efforts to sustain or expand the use and adoption of our more established solutions; (ix) fluctuation of our results of operations, which may make period-to-period comparisons less meaningful; (x) our ability to manage our growth effectively including expanding outside of the United States; (xi) adverse changes in our relationship with Salesforce; (xii) our ability to successfully acquire new companies and/or integrate acquisitions into our existing organization; (xiii) the loss of one or more customers, particularly any of our larger customers, or a reduction in the number of users our customers purchase access and use rights for; (xiv) system unavailability, system performance problems, or loss of data due to disruptions or other problems with our computing infrastructure or the infrastructure we rely on that is operated by third parties; (xv) our ability to maintain our corporate culture and attract and retain highly skilled employees; and (xvi) the outcome and impact of legal proceedings and related fees and expenses. Additional risks and uncertainties that could affect nCino’s business and financial results are included in our reports filed with the U.S. Securities and Exchange Commission (available on our web site at www.ncino.com or the SEC's web site at www.sec.gov). Further information on potential risks that could affect actual results will be included in other filings nCino makes with the SEC from time to time. In addition to financial information presented in accordance with U.S. generally accepted accounting principles (“GAAP”), this presentation includes certain non-GAAP financial measures, including Non-GAAP Operating Loss. Any non-GAAP measure is presented for supplemental informational purposes only and should not be considered a substitute for financial information presented in accordance with GAAP. Non-GAAP measures have limitations as analytical tools and should not be considered in isolation or as substitutes for analysis of other GAAP financial measures. A reconciliation of these measures to the most directly comparable GAAP measures is included at the end of this presentation. This presentation also contains statistical data, estimates and forecasts that are based on independent industry publications or other publicly available information, as well as other information based on our internal sources. This information involves many assumptions and limitations, and you are cautioned not to give undue weight to such information. We have not independently verified the accuracy or completeness of the information contained in the industry publications and other publicly available information. Accordingly, we make no representations as to the accuracy or completeness of that information nor do we undertake to update such information after the date of this presentation. Cautionary Note Regarding Forward-Looking Statements, Disclaimers and Financial Measures
Agenda 3 1 S E A N D E S M O N D , C E O Powering a New Era in Financial Services Financial Update G R E G O R E N S T E I N , C F O 2 3 Q&A
Powering a New Era in Financial Services 4 Sean Desmond President and Chief Executive Officer
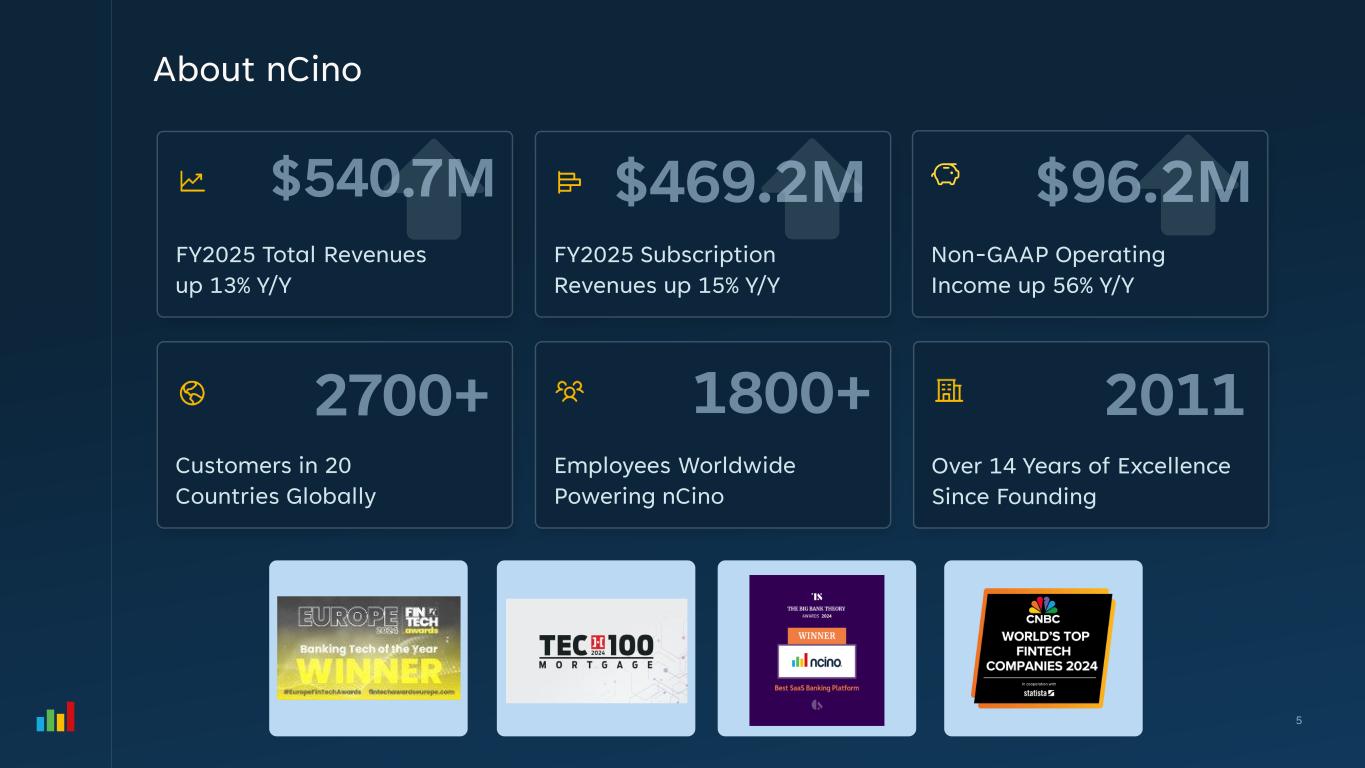
5 About nCino FY2025 Total Revenues up 13% Y/Y Employees Worldwide Powering nCino FY2025 Subscription Revenues up 15% Y/Y Non-GAAP Operating Income up 56% Y/Y Over 14 Years of Excellence Since Founding Customers in 20 Countries Globally
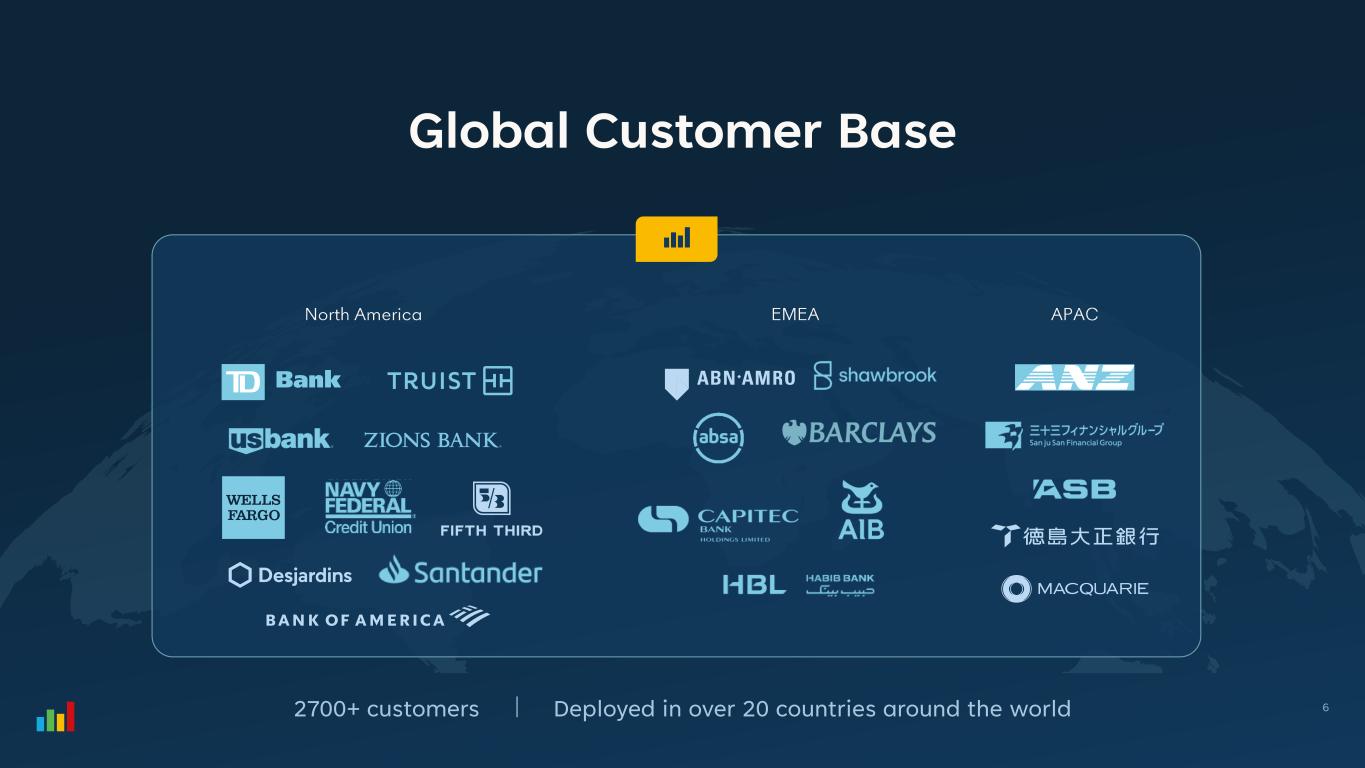
6 Global Customer Base
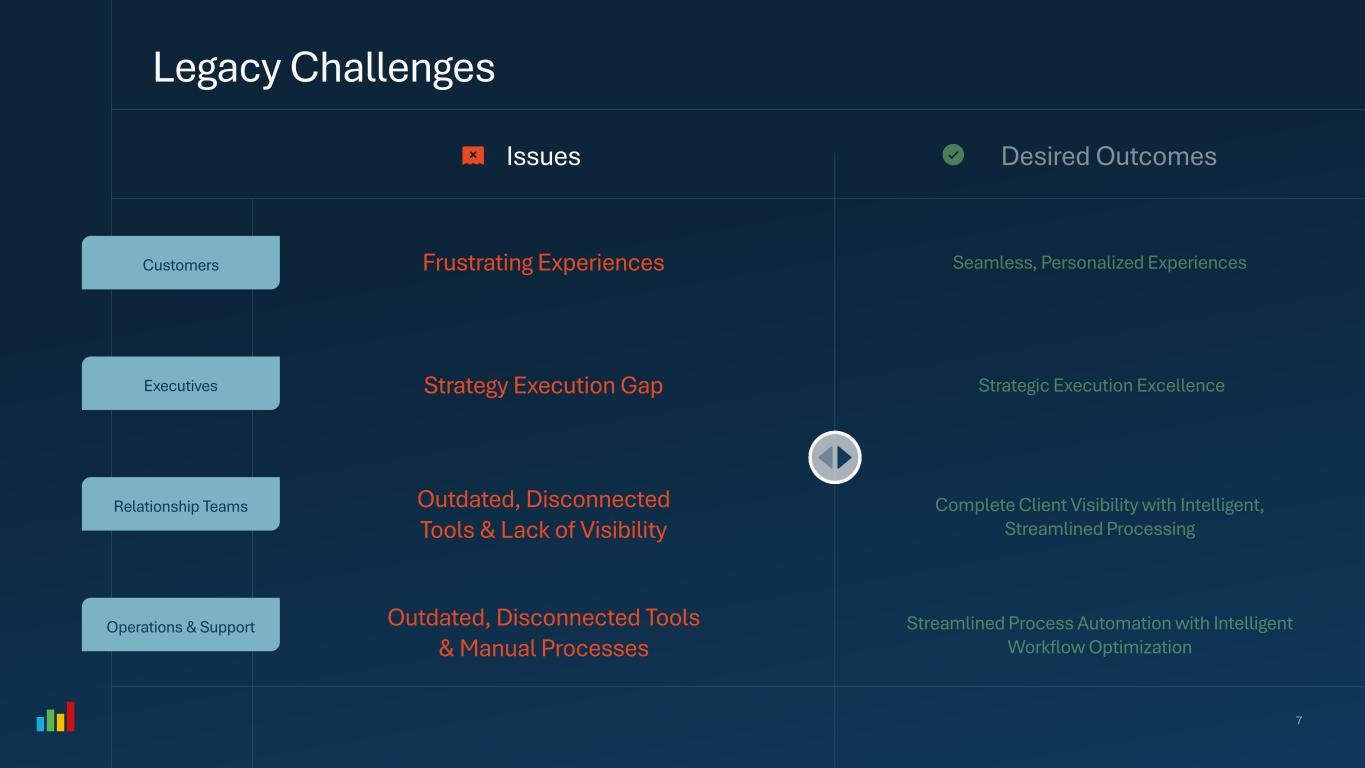
Legacy Challenges Issues Customers Executives Relationship Teams Operations & Support Frustrating Experiences Strategy Execution Gap Outdated, Disconnected Tools & Lack of Visibility Outdated, Disconnected Tools & Manual Processes 7
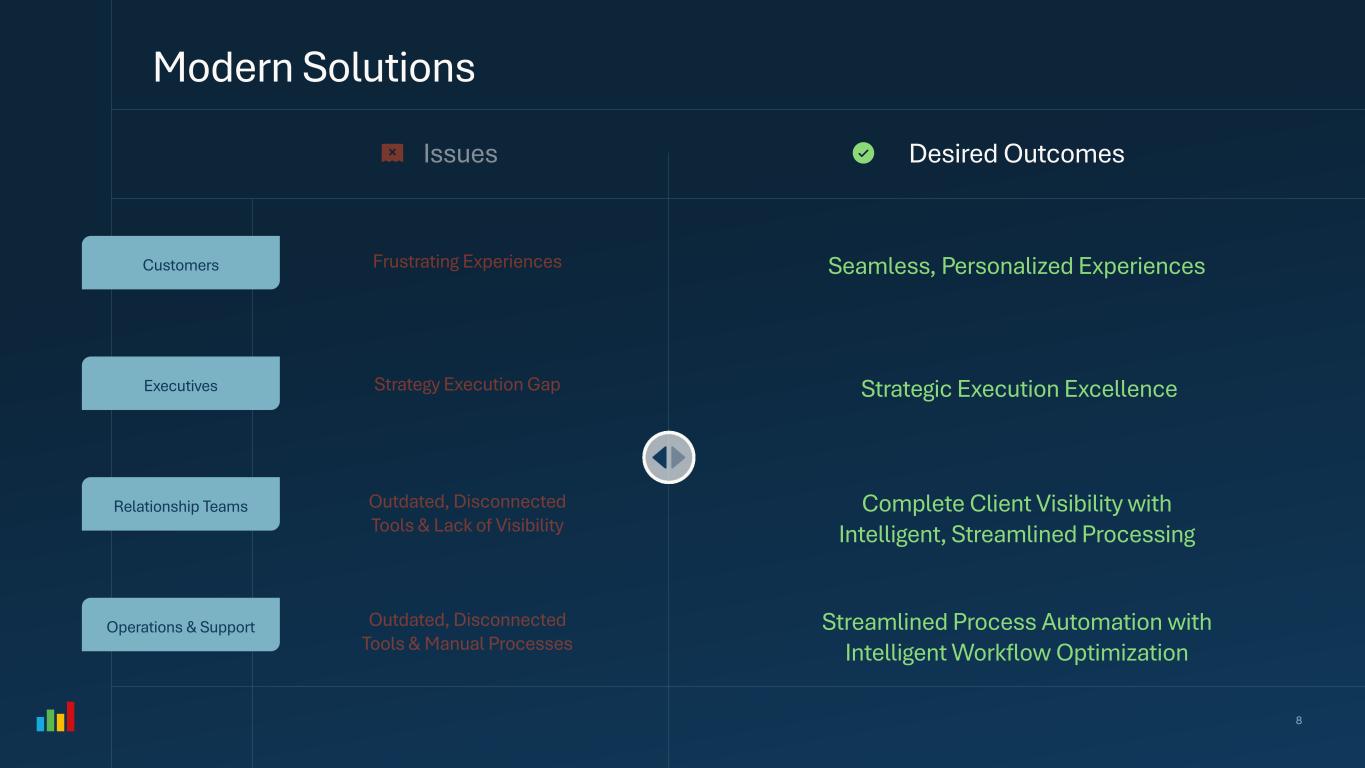
Modern Solutions Desired Outcomes Seamless, Personalized Experiences Strategic Execution Excellence Complete Client Visibility with Intelligent, Streamlined Processing Streamlined Process Automation with Intelligent Workflow Optimization Customers Executives Relationship Teams Operations & Support 8
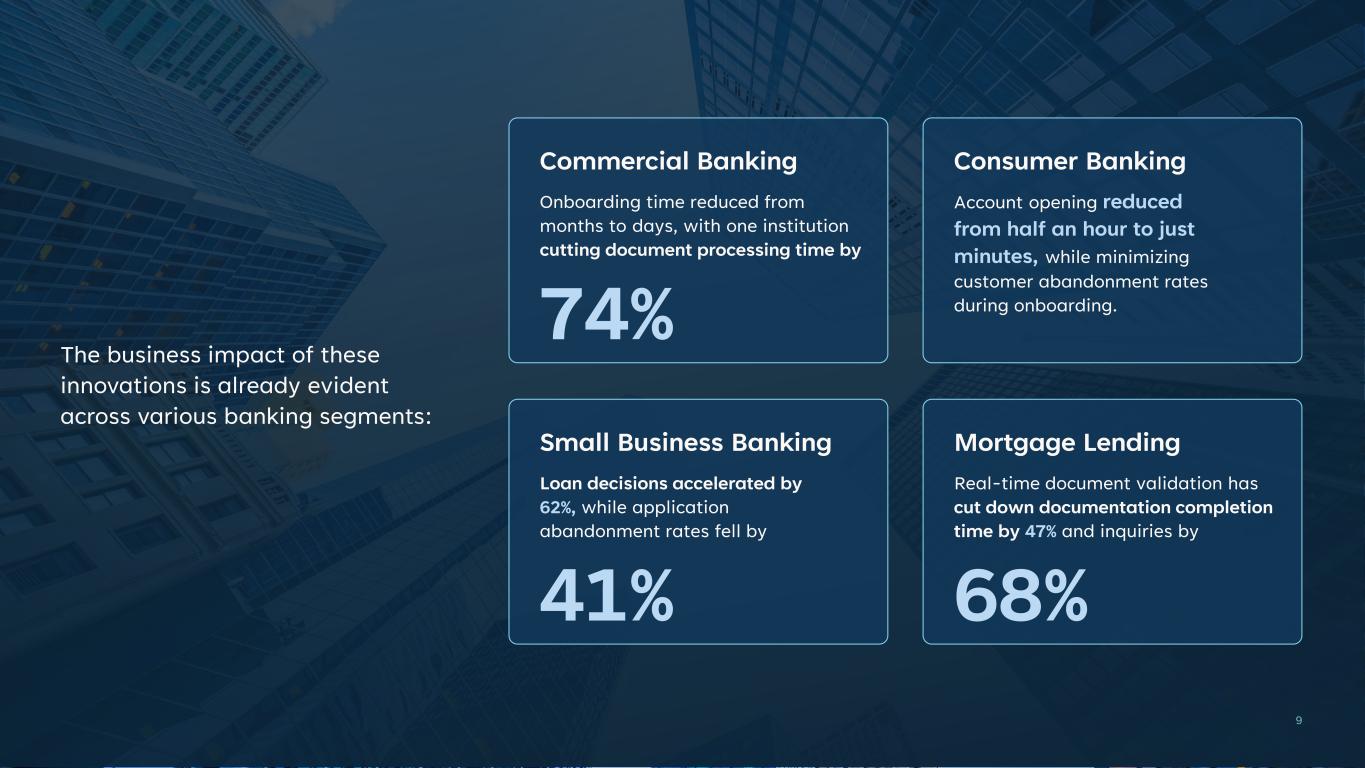
The business impact of these innovations is already evident across various banking segments: Commercial Banking Onboarding time reduced from months to days, with one institution cutting document processing time by 74% Consumer Banking Account opening reduced from half an hour to just minutes, while minimizing customer abandonment rates during onboarding. Small Business Banking Loan decisions accelerated by 62%, while application abandonment rates fell by 41% Mortgage Lending Real-time document validation has cut down documentation completion time by 47% and inquiries by 68% 9
One partnership that explains Schramm’s thinking is the deployment of commercial loan operations systems provided by financial tech provider nCino. Building that same system at Fifth Third would have taken five times longer and probably cost twice as much. J U D E S C H R A M M Chief Information Officer Fifth Third Bank
The investment in emerging technology has created tangible, economical value for the company and has transformed how the bank conducts business. […] Recent projects include adopting nCino, designed to reduce navigation for internal work. That deployment has cut 1,500 hours in staff work on a yearly basis, 44% fewer screens, 21% fewer clicks and 20% fewer required fields when filling out digital forms for internal tasks. B R Y A N J O R D A N Chairman, President, and CEO First Horizon
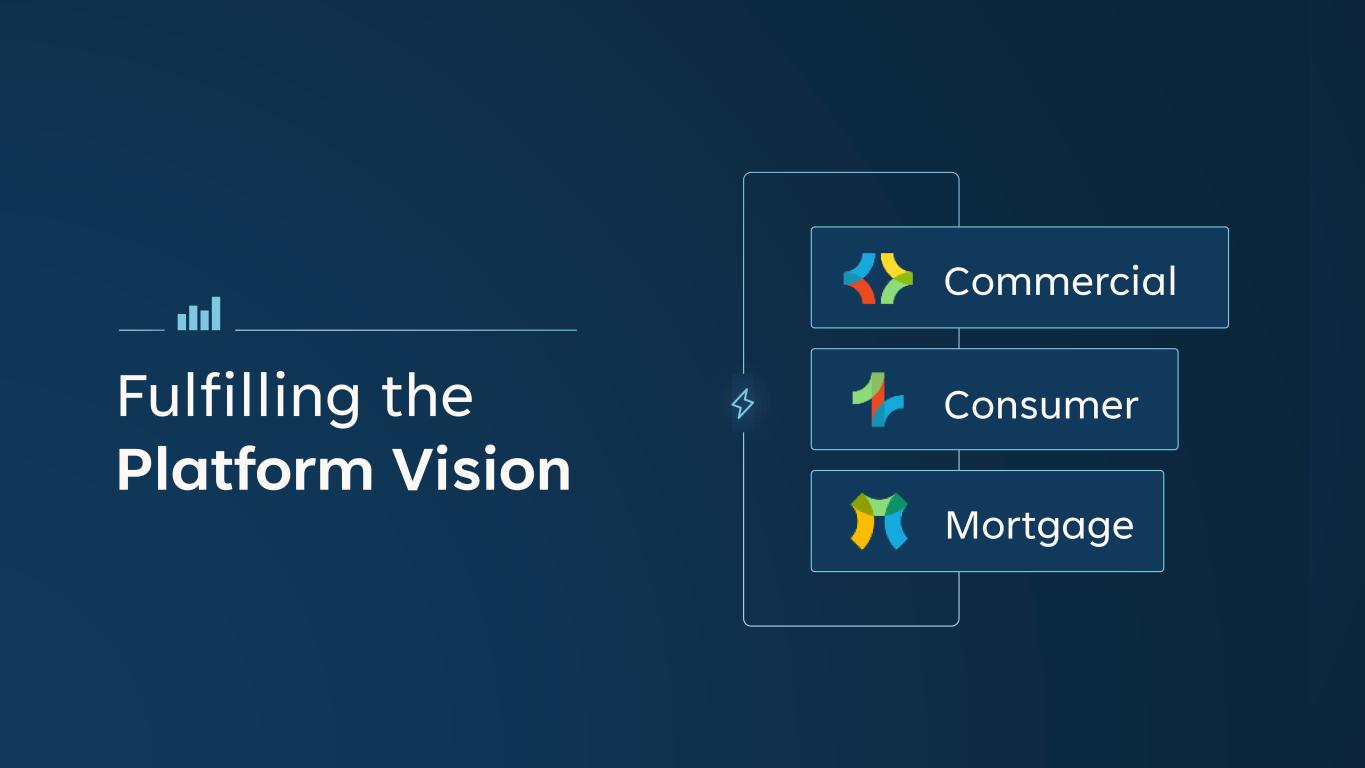
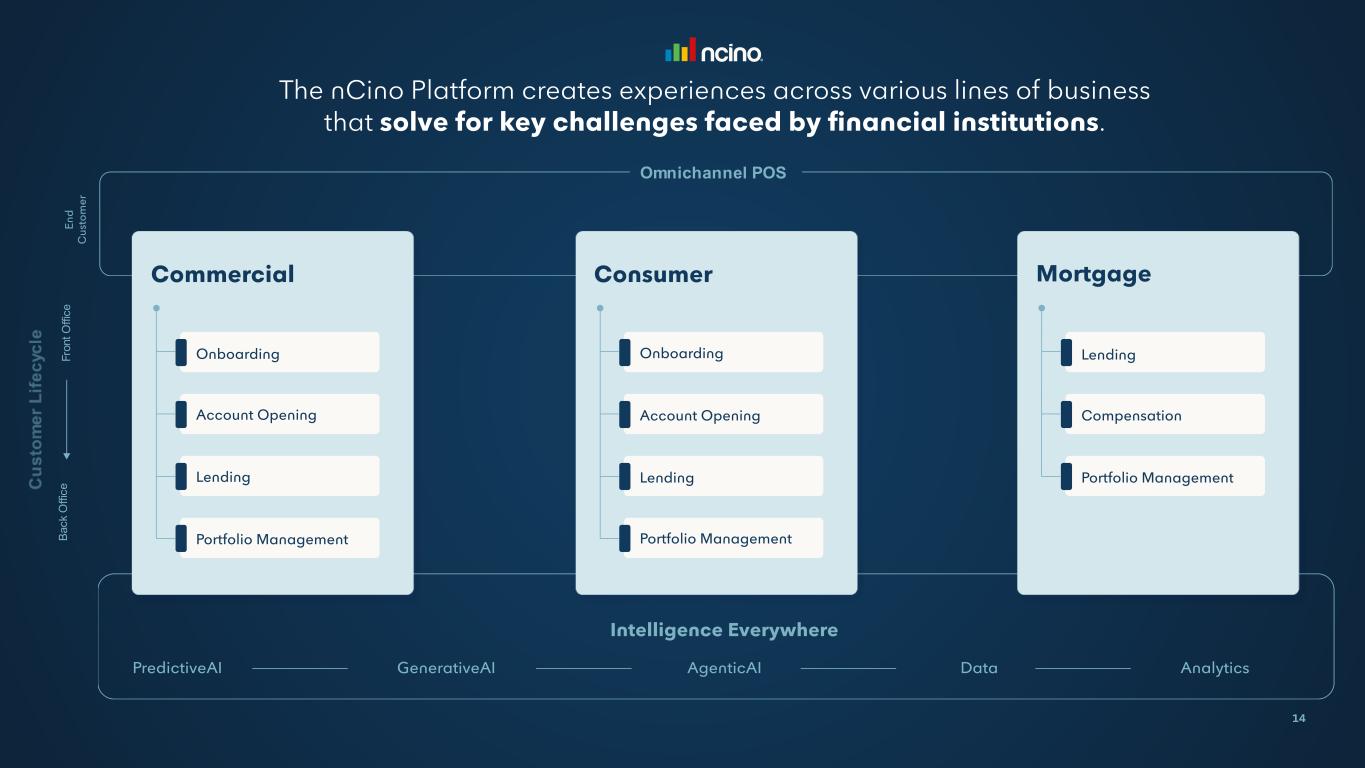
Fulfilling the Platform Vision Commercial Consumer Mortgage
14
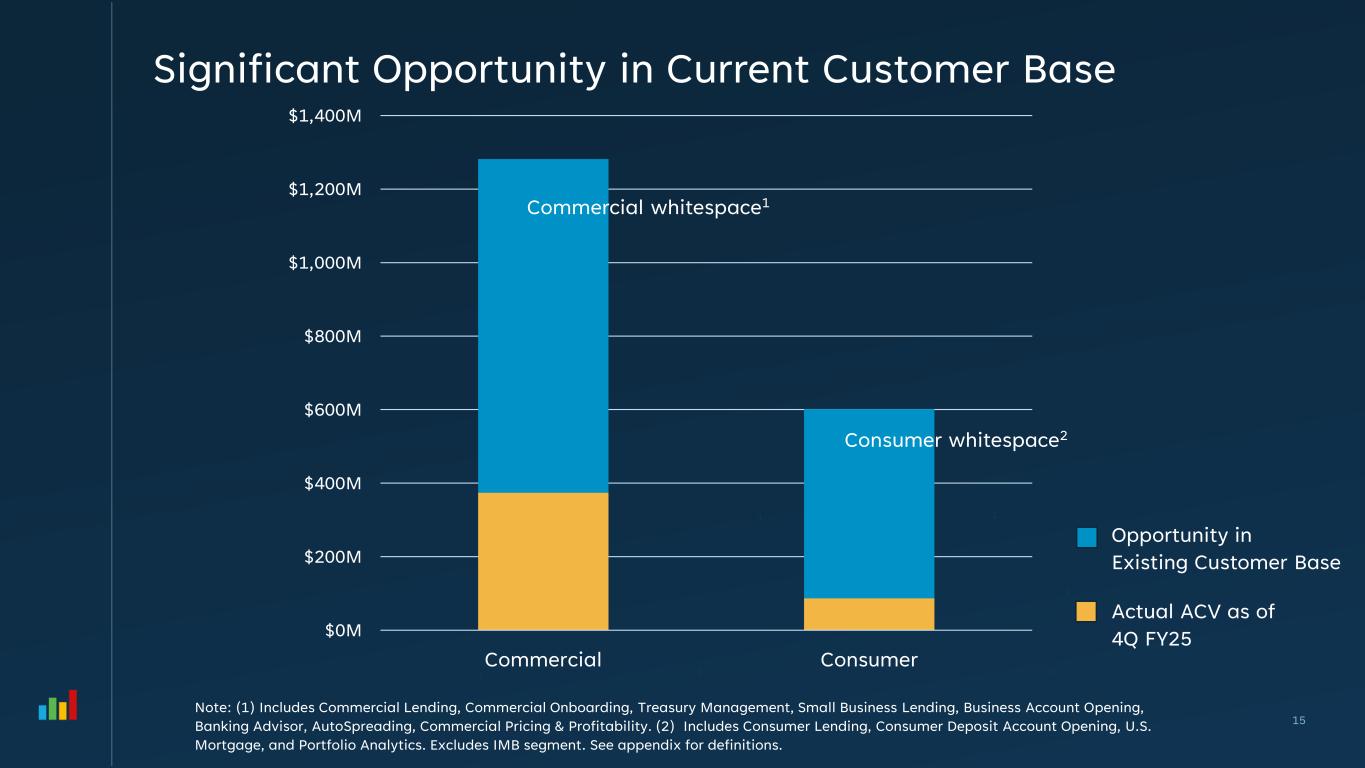
$0M $200M $400M $600M $800M $1,000M $1,200M $1,400M Commercial Consumer Opportunity in Existing Customer Base Significant Opportunity in Current Customer Base 15 Note: (1) Includes Commercial Lending, Commercial Onboarding, Treasury Management, Small Business Lending, Business Account Opening, Banking Advisor, AutoSpreading, Commercial Pricing & Profitability. (2) Includes Consumer Lending, Consumer Deposit Account Opening, U.S. Mortgage, and Portfolio Analytics. Excludes IMB segment. See appendix for definitions. Actual ACV as of 4Q FY25 1 1 32 2 3 Commercial whitespace1 Consumer whitespace2
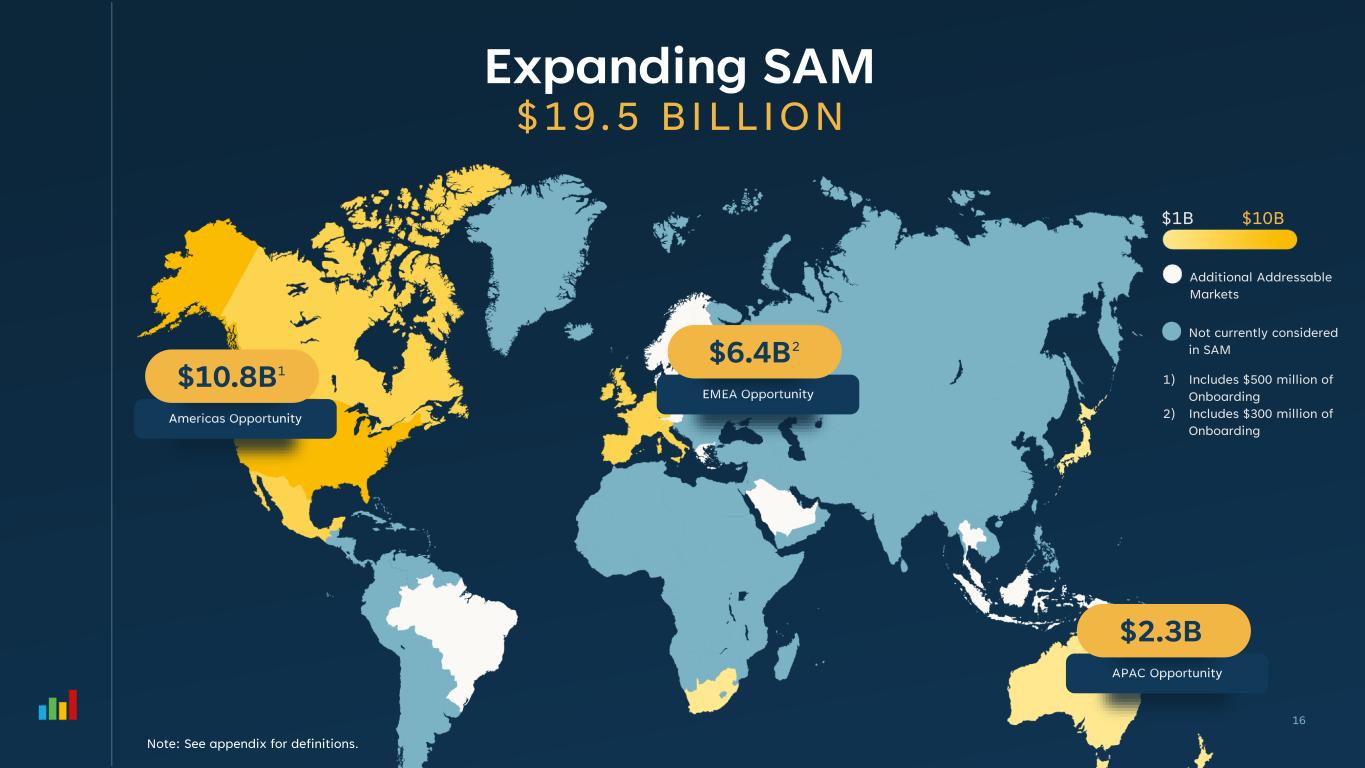
Expanding SAM $19.5 BILLION $1B $10B Additional Addressable Markets Americas Opportunity Not currently considered in SAM 1) Includes $500 million of Onboarding 2) Includes $300 million of Onboarding $10.8B1 EMEA Opportunity $6.4B2 APAC Opportunity $2.3B 16 Note: See appendix for definitions.
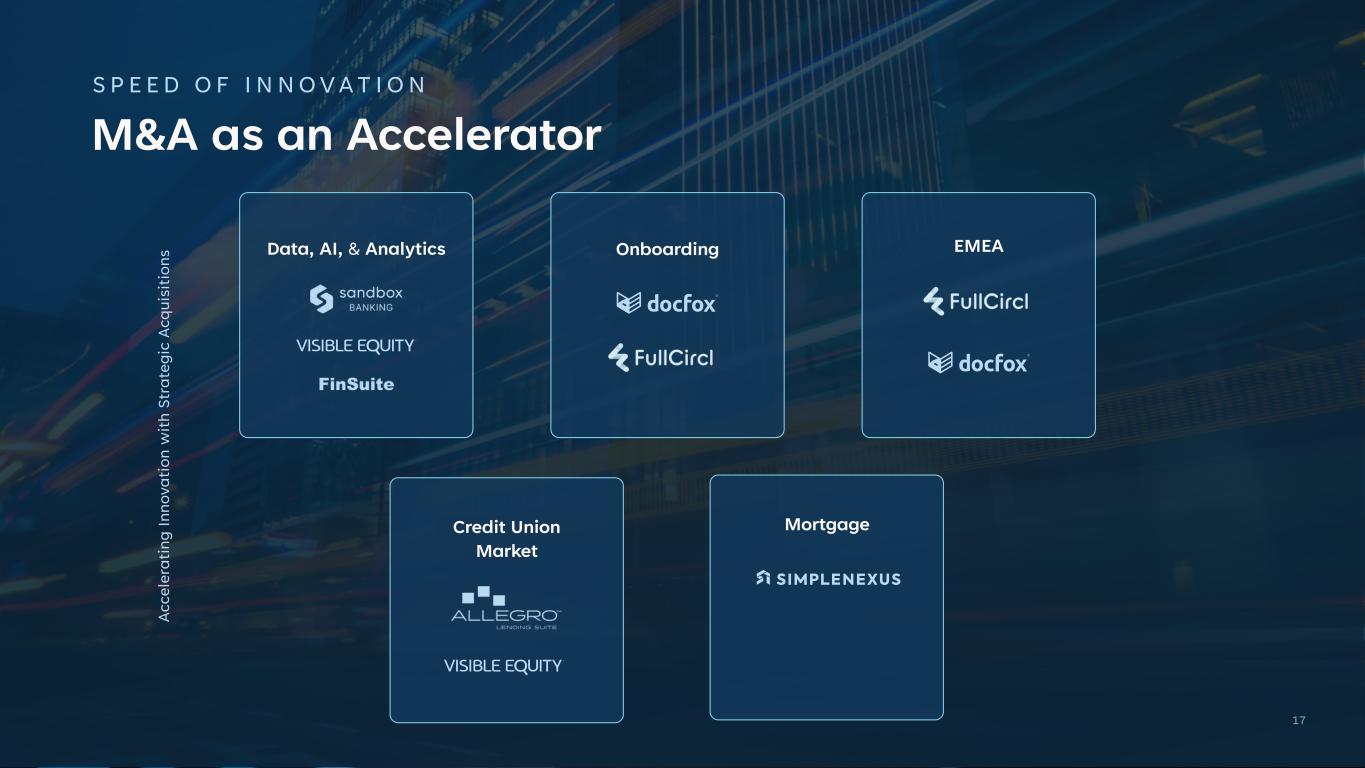
M&A as an Accelerator S P E E D O F I N N O VAT I O N A c c e le ra ti n g I n n o v a ti o n w it h S tr a te g ic A c q u is it io n s Data, AI, & Analytics Onboarding Credit Union Market EMEA Mortgage 17
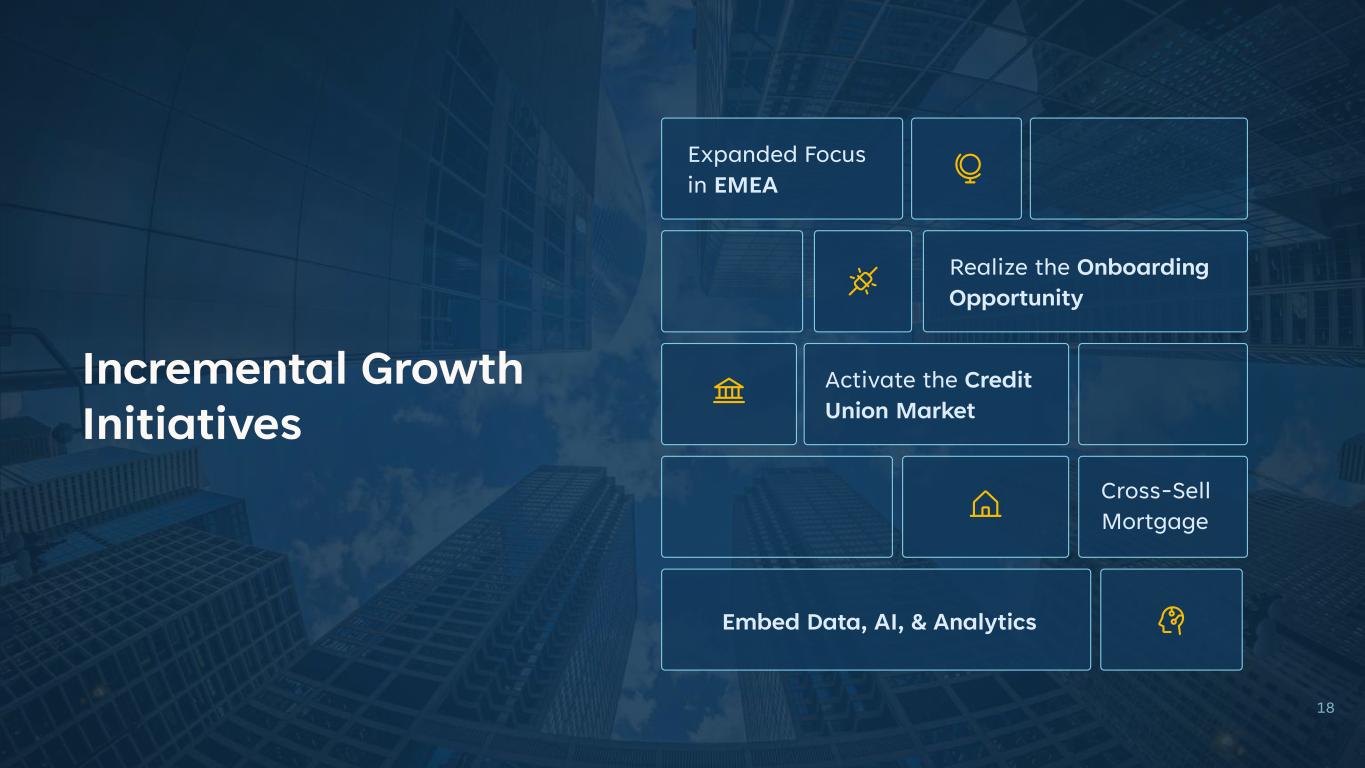
Incremental Growth Initiatives 18 Expanded Focus in EMEA Realize the Onboarding Opportunity Activate the Credit Union Market Cross-Sell Mortgage Embed Data, AI, & Analytics

Embed Data, AI, & Analytics Across the Platform 1
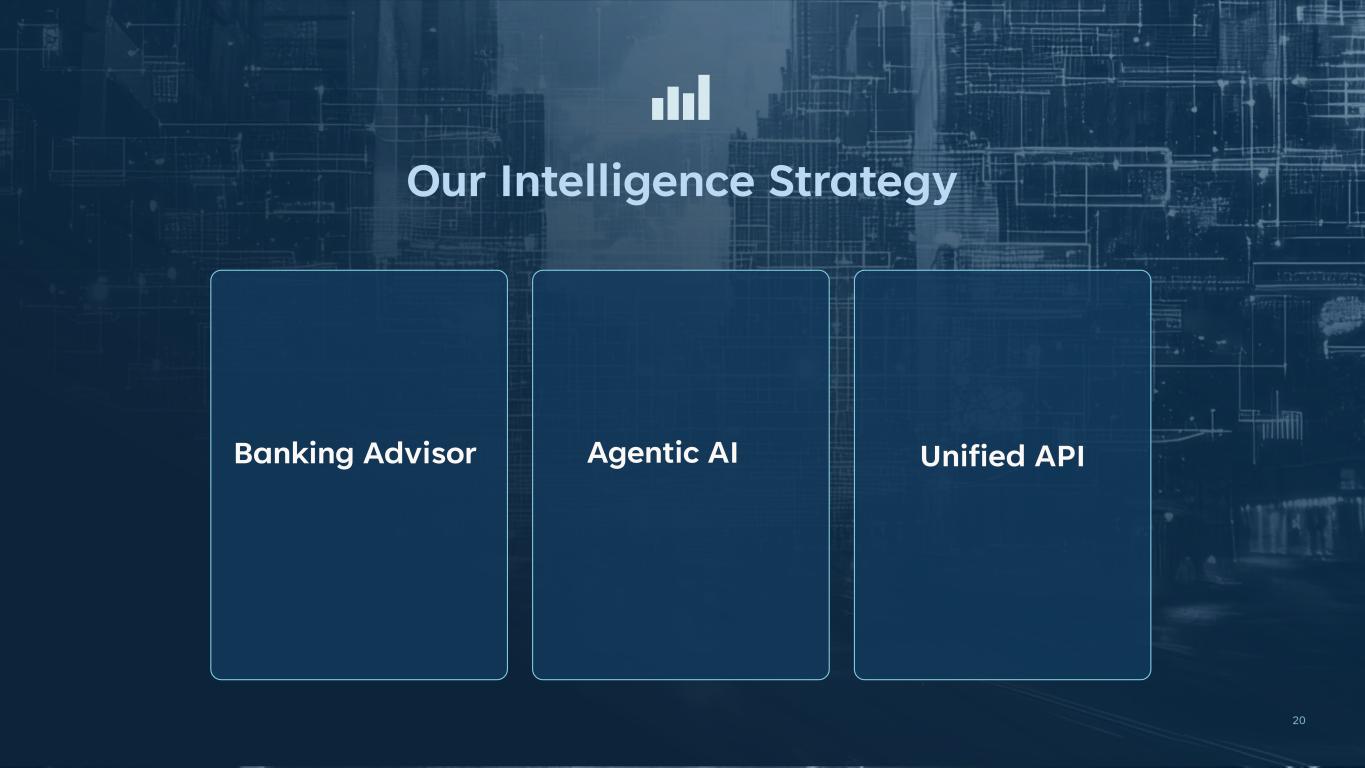
Our Intelligence Strategy Banking Advisor Agentic AI Unified API 20
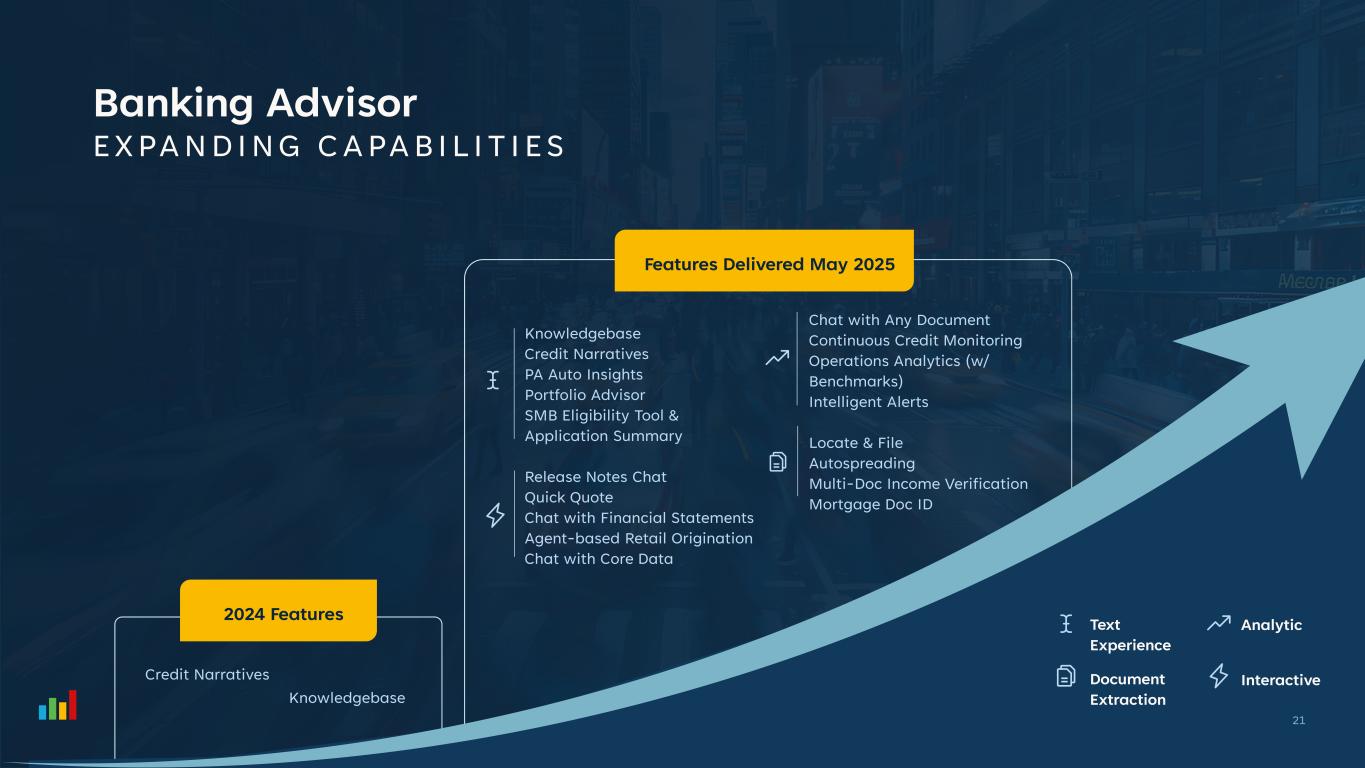
Banking Advisor EXPANDING CAPABIL IT IES 2024 Features Knowledgebase Credit Narratives Features Delivered May 2025 Interactive Text Experience Document Extraction Analytic Knowledgebase Credit Narratives PA Auto Insights Portfolio Advisor SMB Eligibility Tool & Application Summary Release Notes Chat Quick Quote Chat with Financial Statements Agent-based Retail Origination Chat with Core Data Chat with Any Document Continuous Credit Monitoring Operations Analytics (w/ Benchmarks) Intelligent Alerts Locate & File Autospreading Multi-Doc Income Verification Mortgage Doc ID 21
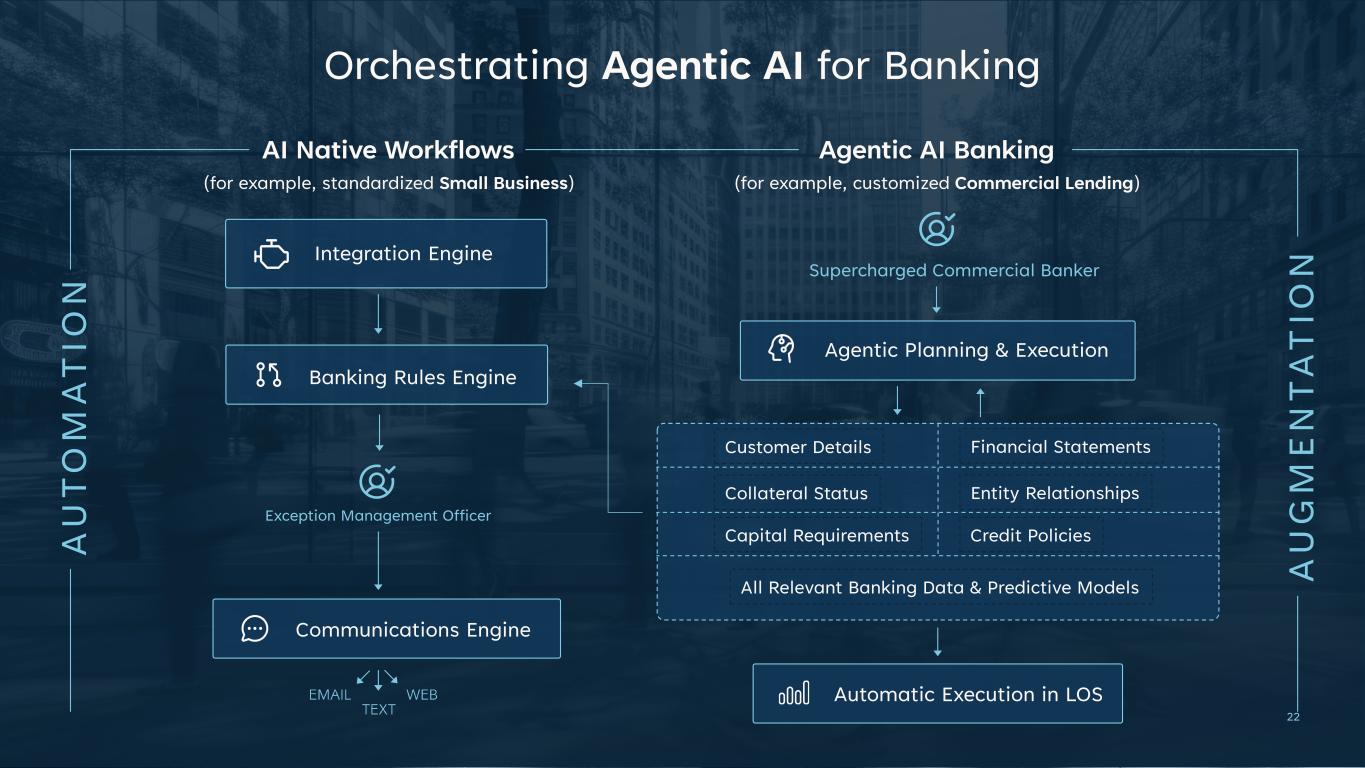
Orchestrating Agentic AI for Banking A U T O M A T IO N A U G M E N T A T IO N Agentic AI Banking (for example, customized Commercial Lending) AI Native Workflows (for example, standardized Small Business) Exception Management Officer Integration Engine Banking Rules Engine Communications Engine Supercharged Commercial Banker Agentic Planning & Execution All Relevant Banking Data & Predictive Models Capital Requirements Credit Policies Collateral Status Entity Relationships Customer Details Financial Statements Automatic Execution in LOS 22
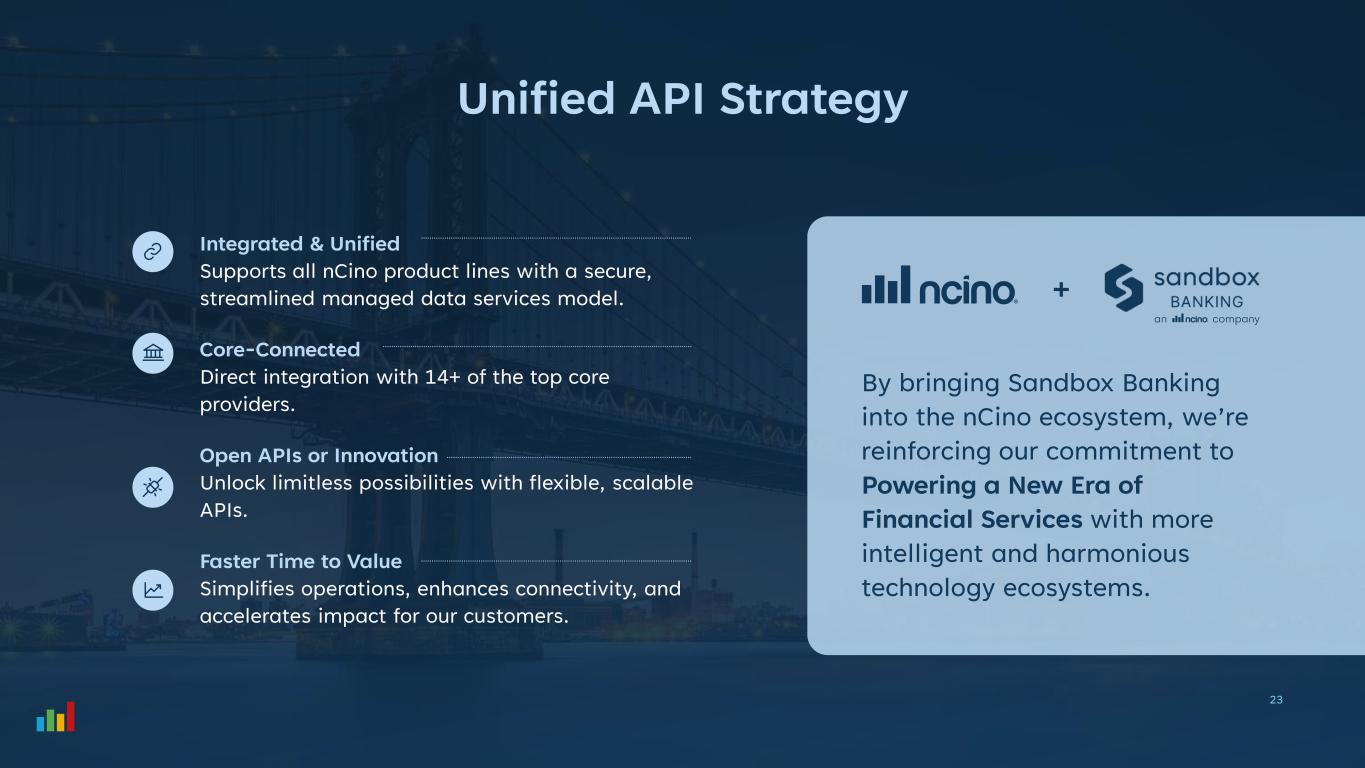
Unified API Strategy By bringing Sandbox Banking into the nCino ecosystem, we’re reinforcing our commitment to Powering a New Era of Financial Services with more intelligent and harmonious technology ecosystems. Integrated & Unified Supports all nCino product lines with a secure, streamlined managed data services model. Core-Connected Direct integration with 14+ of the top core providers. Open APIs or Innovation Unlock limitless possibilities with flexible, scalable APIs. Faster Time to Value Simplifies operations, enhances connectivity, and accelerates impact for our customers. 23

Expanding Focus in EMEA 2
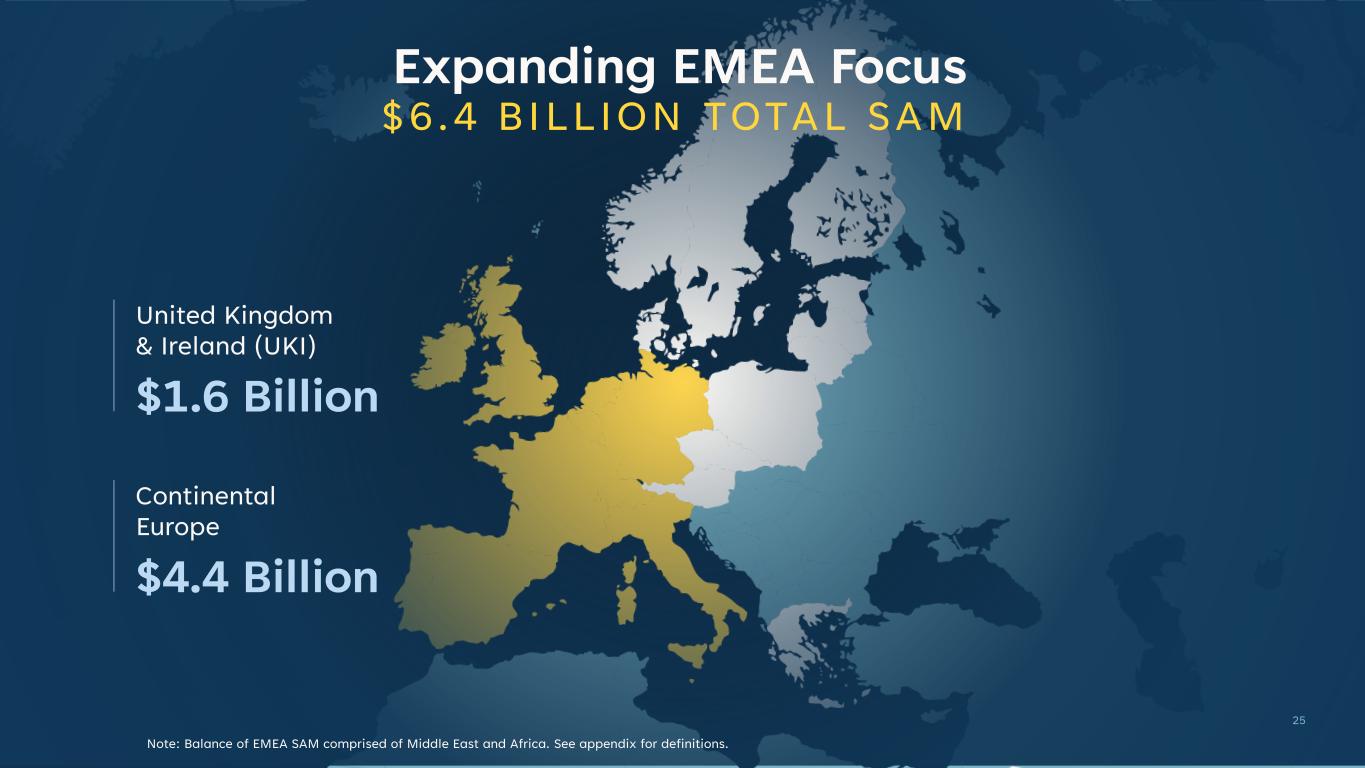
United Kingdom & Ireland (UKI) Expanding EMEA Focus $6.4 BILLION TOTAL SAM $1.6 Billion Continental Europe $4.4 Billion 25 Note: Balance of EMEA SAM comprised of Middle East and Africa. See appendix for definitions.

Realizing the Onboarding Opportunity 3
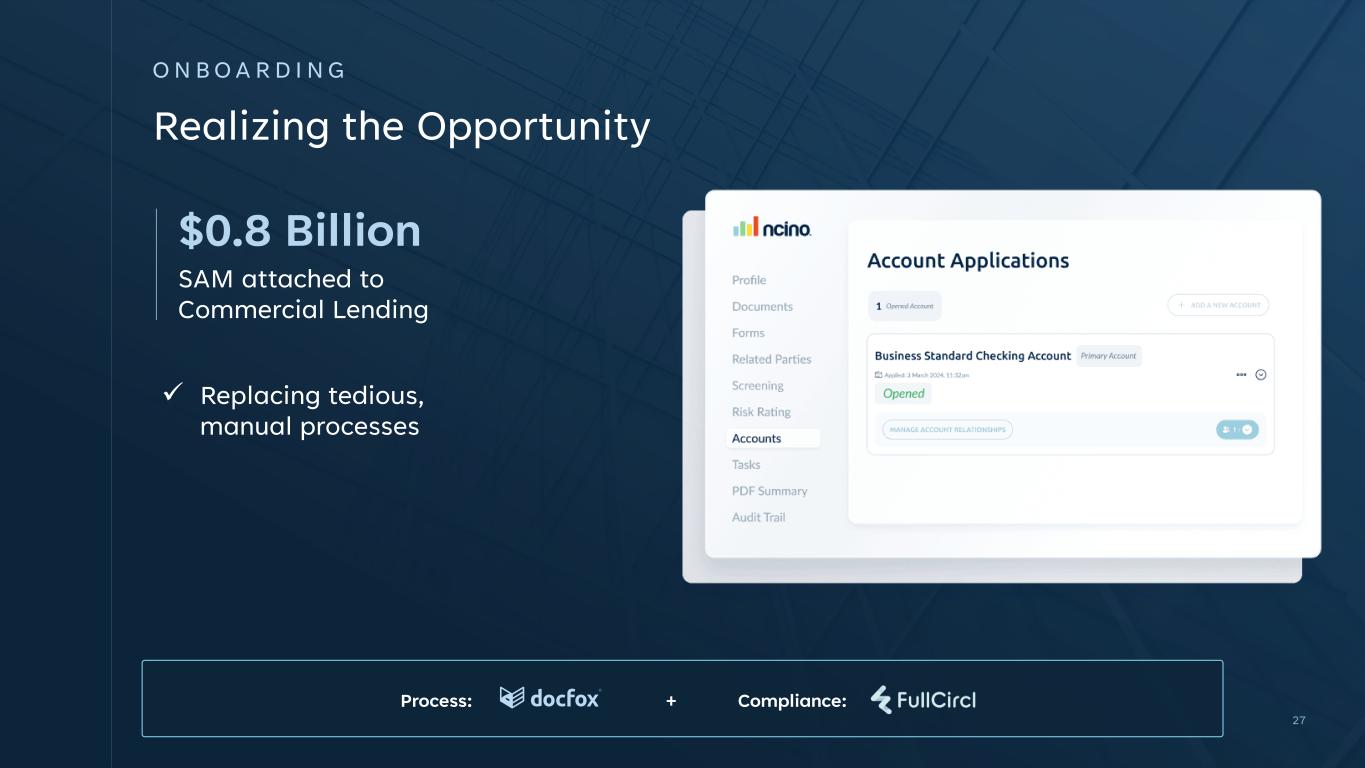
Realizing the Opportunity 27 Process: Compliance:+ SAM attached to Commercial Lending $0.8 Billion O N B O A R D I N G ✓ Replacing tedious, manual processes
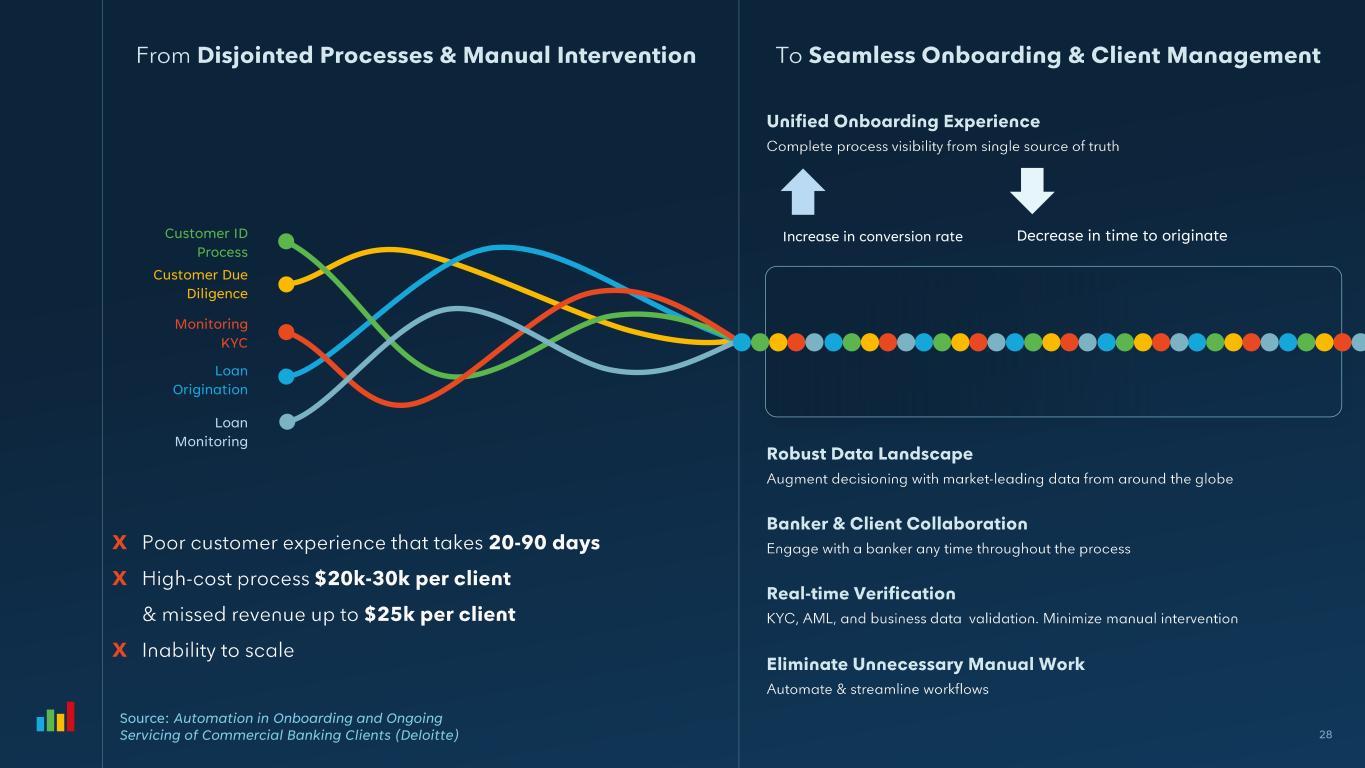
28 Increase in conversion rate Decrease in time to originate Source: Automation in Onboarding and Ongoing Servicing of Commercial Banking Clients (Deloitte) Customer ID Process Customer Due Diligence Monitoring KYC Loan Origination Loan Monitoring

Activating the Credit Union Market 4
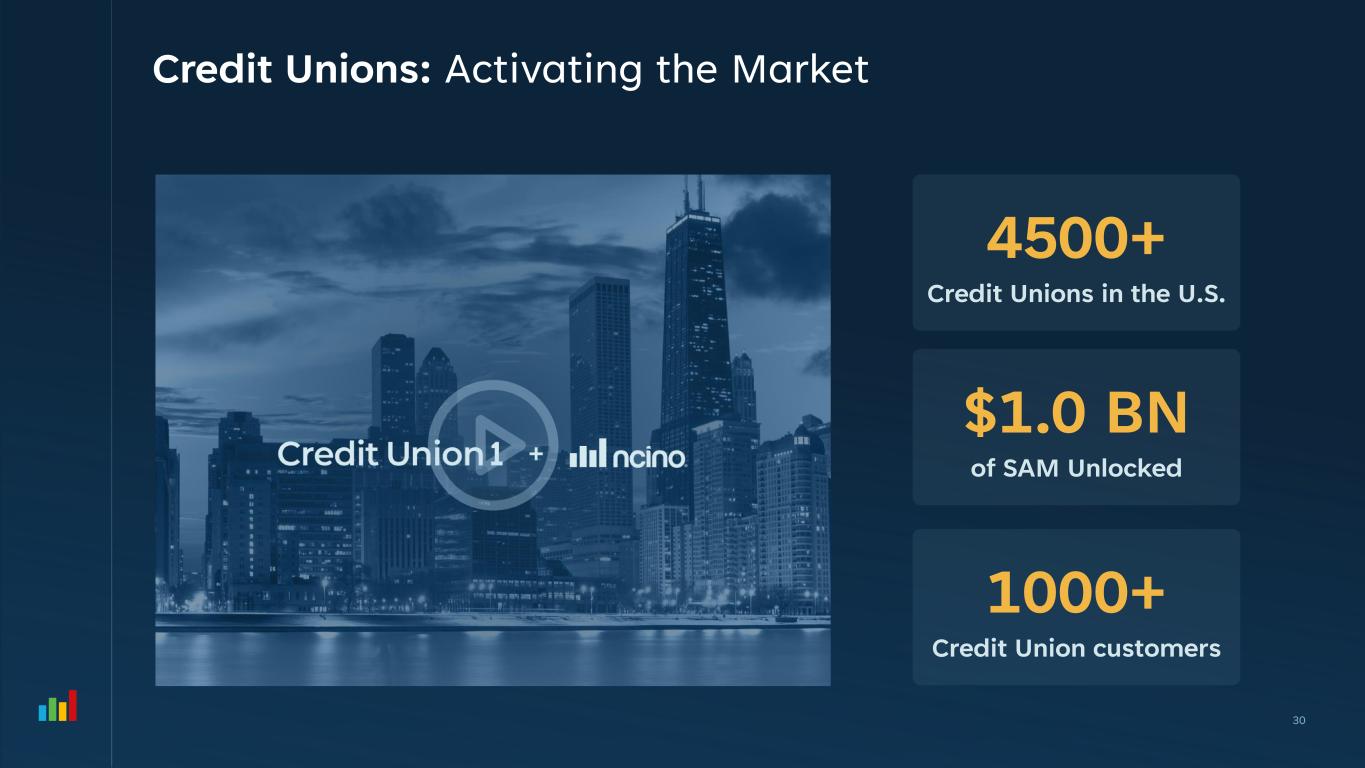
Credit Unions: Activating the Market 30 4500+ Credit Unions in the U.S. $1.0 BN of SAM Unlocked 1000+ Credit Union customers

Cross-Selling Mortgage 5
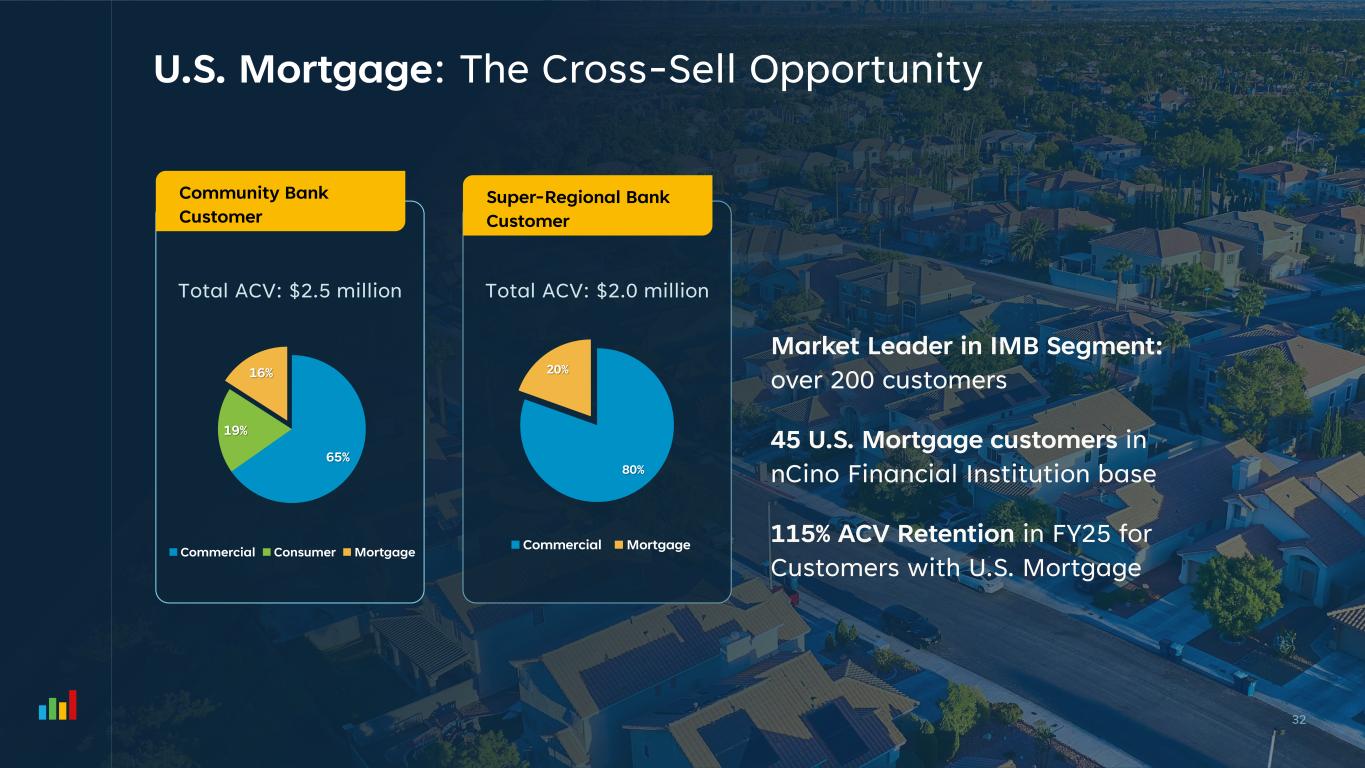
U.S. Mortgage: The Cross-Sell Opportunity 32 Total ACV: $2.0 million 80% 20% Commercial Mortgage Market Leader in IMB Segment: over 200 customers 45 U.S. Mortgage customers in nCino Financial Institution base 115% ACV Retention in FY25 for Customers with U.S. Mortgage Total ACV: $2.5 million 65% 19% 16% Commercial Consumer Mortgage Community Bank Customer Super-Regional Bank Customer
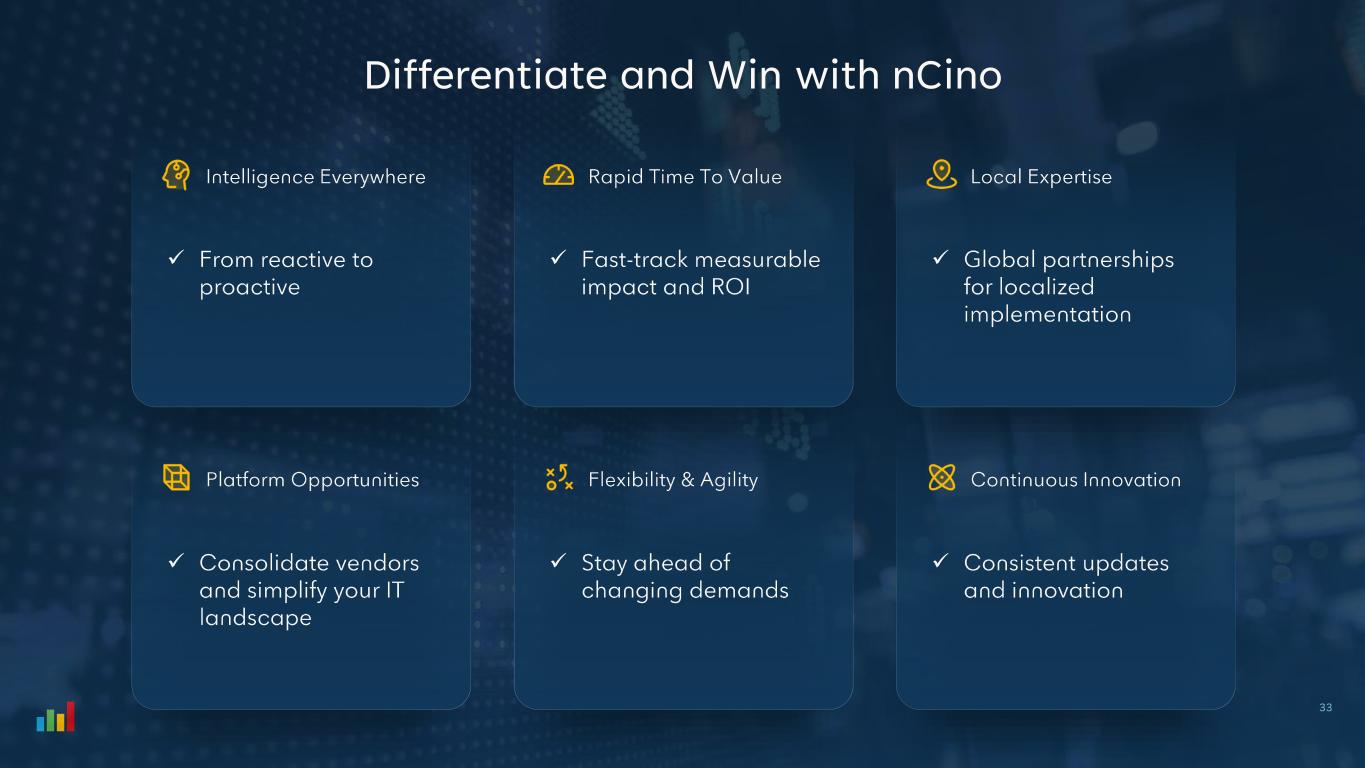
Differentiate and Win with nCino ✓ ✓ ✓ ✓ ✓ ✓ 33
Financial Update 34 Greg Orenstein Chief Financial Officer
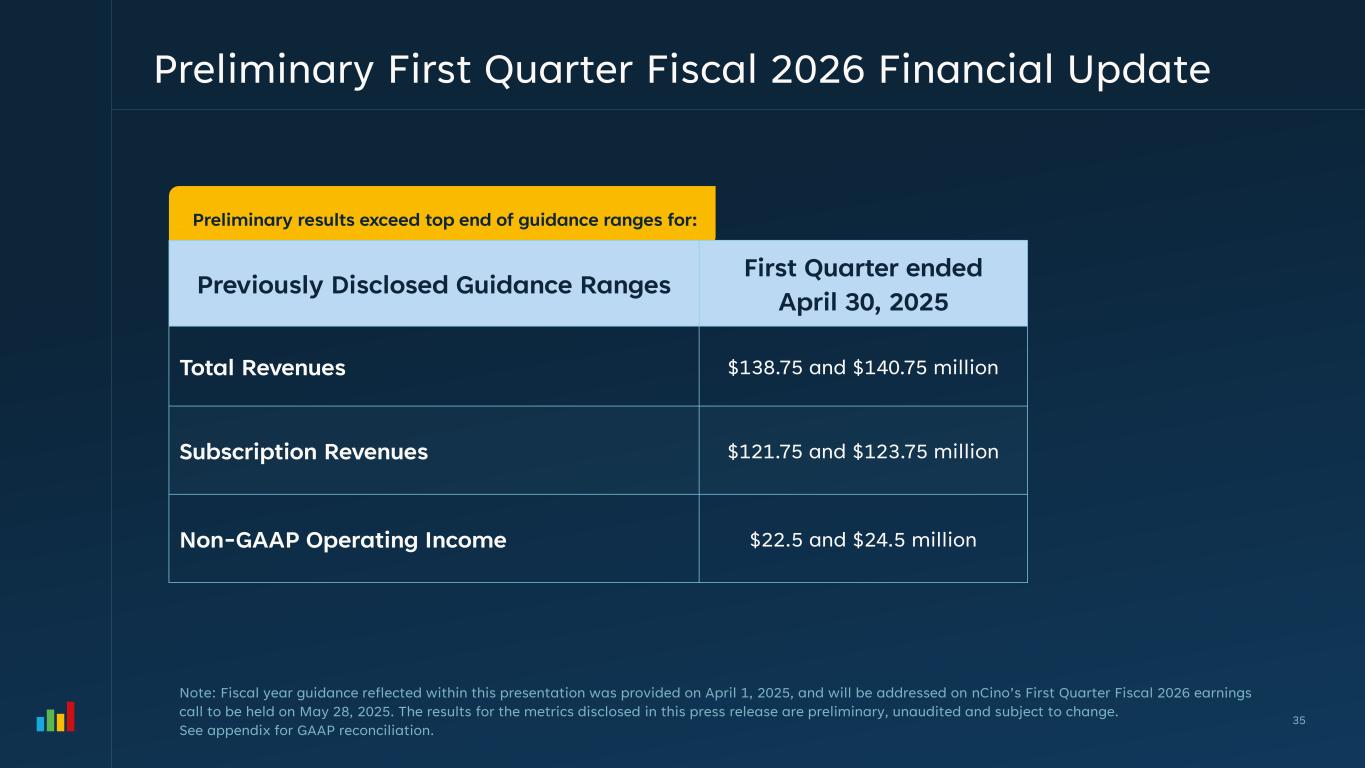
Preliminary results exceed top end of guidance ranges for: Preliminary First Quarter Fiscal 2026 Financial Update 35 Note: Fiscal year guidance reflected within this presentation was provided on April 1, 2025, and will be addressed on nCino’s First Quarter Fiscal 2026 earnings call to be held on May 28, 2025. The results for the metrics disclosed in this press release are preliminary, unaudited and subject to change. See appendix for GAAP reconciliation. Previously Disclosed Guidance Ranges First Quarter ended April 30, 2025 Total Revenues $138.75 and $140.75 million Subscription Revenues $121.75 and $123.75 million Non-GAAP Operating Income $22.5 and $24.5 million
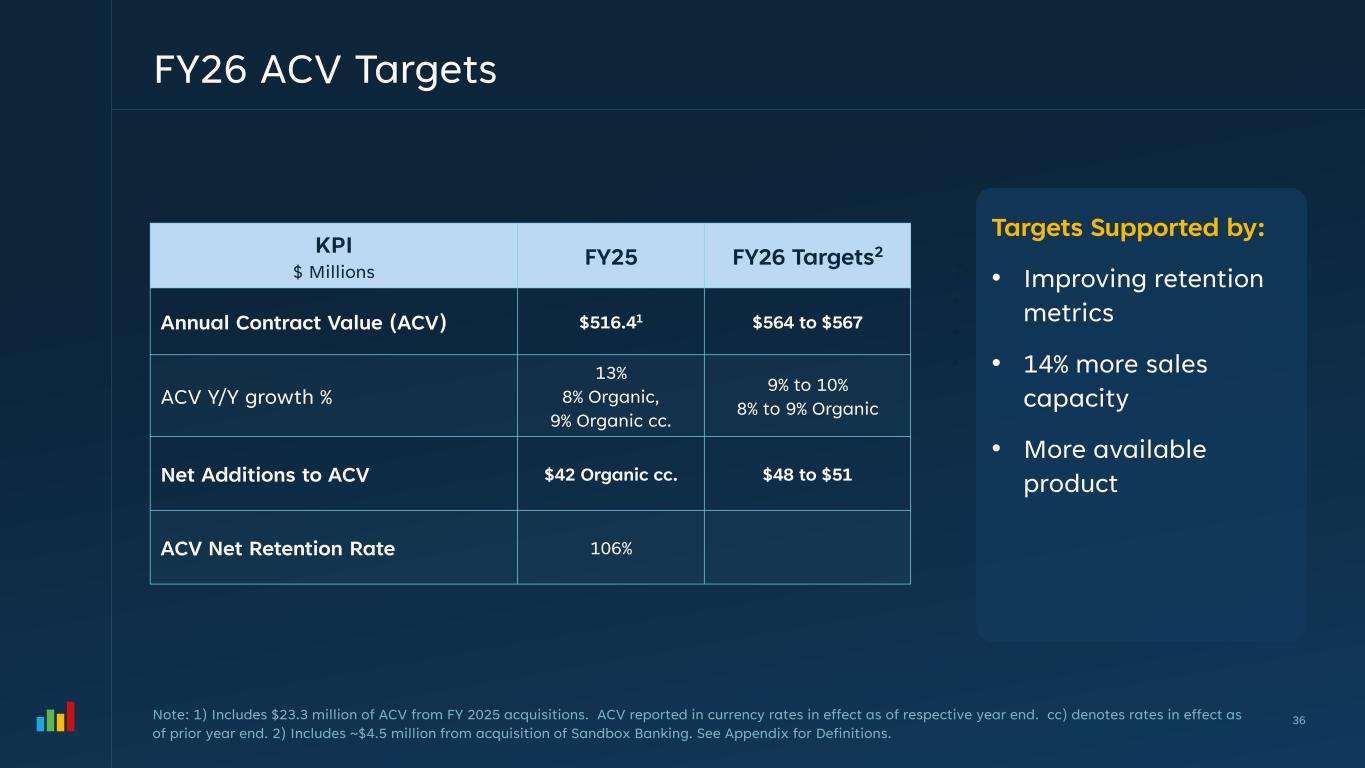
Targets Supported by: • Improving retention metrics • 14% more sales capacity • More available product FY26 ACV Targets 36 KPI $ Millions FY25 FY26 Targets2 Annual Contract Value (ACV) $516.41 $564 to $567 ACV Y/Y growth % 13% 8% Organic, 9% Organic cc. 9% to 10% 8% to 9% Organic Net Additions to ACV $42 Organic cc. $48 to $51 ACV Net Retention Rate 106% Note: 1) Includes $23.3 million of ACV from FY 2025 acquisitions. ACV reported in currency rates in effect as of respective year end. cc) denotes rates in effect as of prior year end. 2) Includes ~$4.5 million from acquisition of Sandbox Banking. See Appendix for Definitions. Targets Supported by: • Improving retention metrics • 14% more sales capacity • More available product
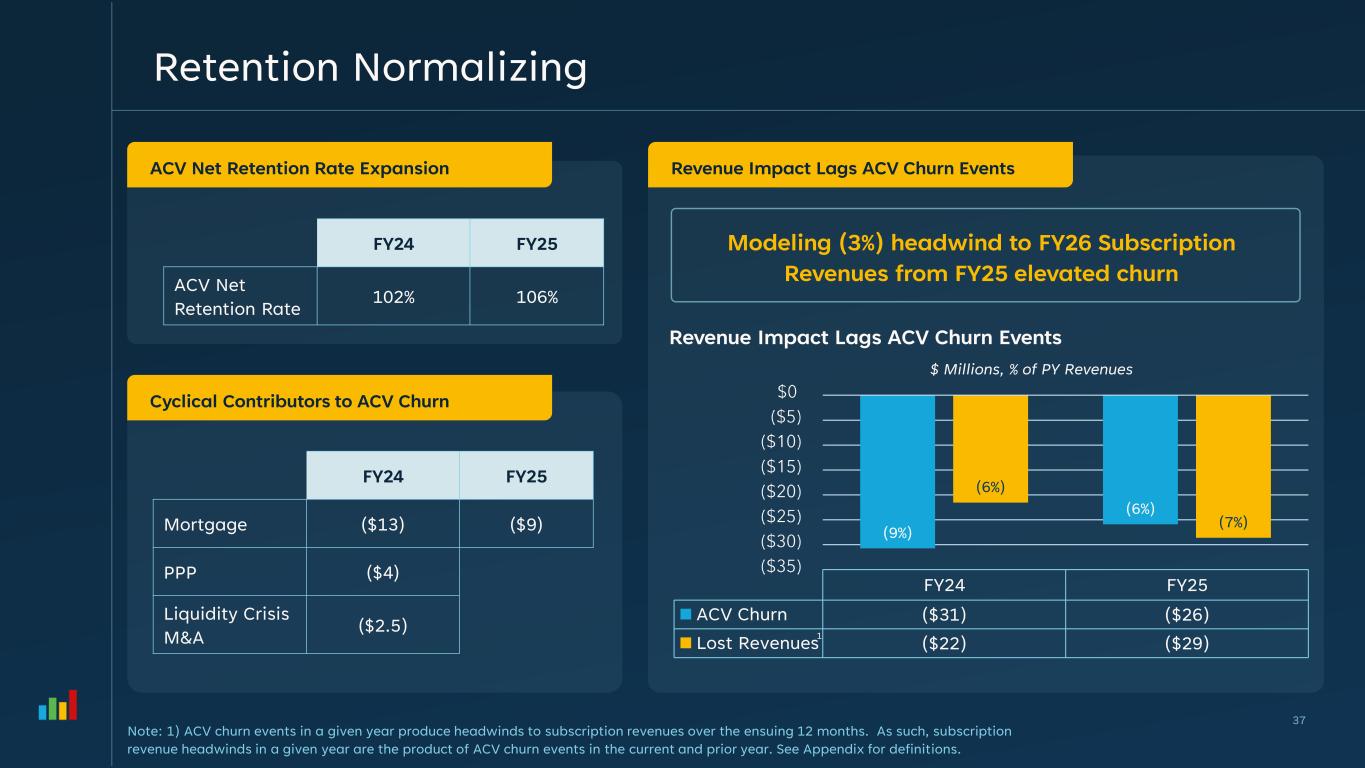
Retention Normalizing 37 $ Millions, % of PY Revenues Modeling (3%) headwind to FY26 Subscription Revenues from FY25 elevated churn FY24 FY25 Mortgage ($13) ($9) PPP ($4) Liquidity Crisis M&A ($2.5) Note: 1) ACV churn events in a given year produce headwinds to subscription revenues over the ensuing 12 months. As such, subscription revenue headwinds in a given year are the product of ACV churn events in the current and prior year. See Appendix for definitions. FY24 FY25 ACV Churn ($31) ($26) Lost Revenues ($22) ($29) (9%) (6%) (6%) (7%) Revenue Impact Lags ACV Churn Events 1 Cyclical Contributors to ACV Churn Revenue Impact Lags ACV Churn Events FY24 FY25 ACV Net Retention Rate 102% 106% ACV Net Retention Rate Expansion
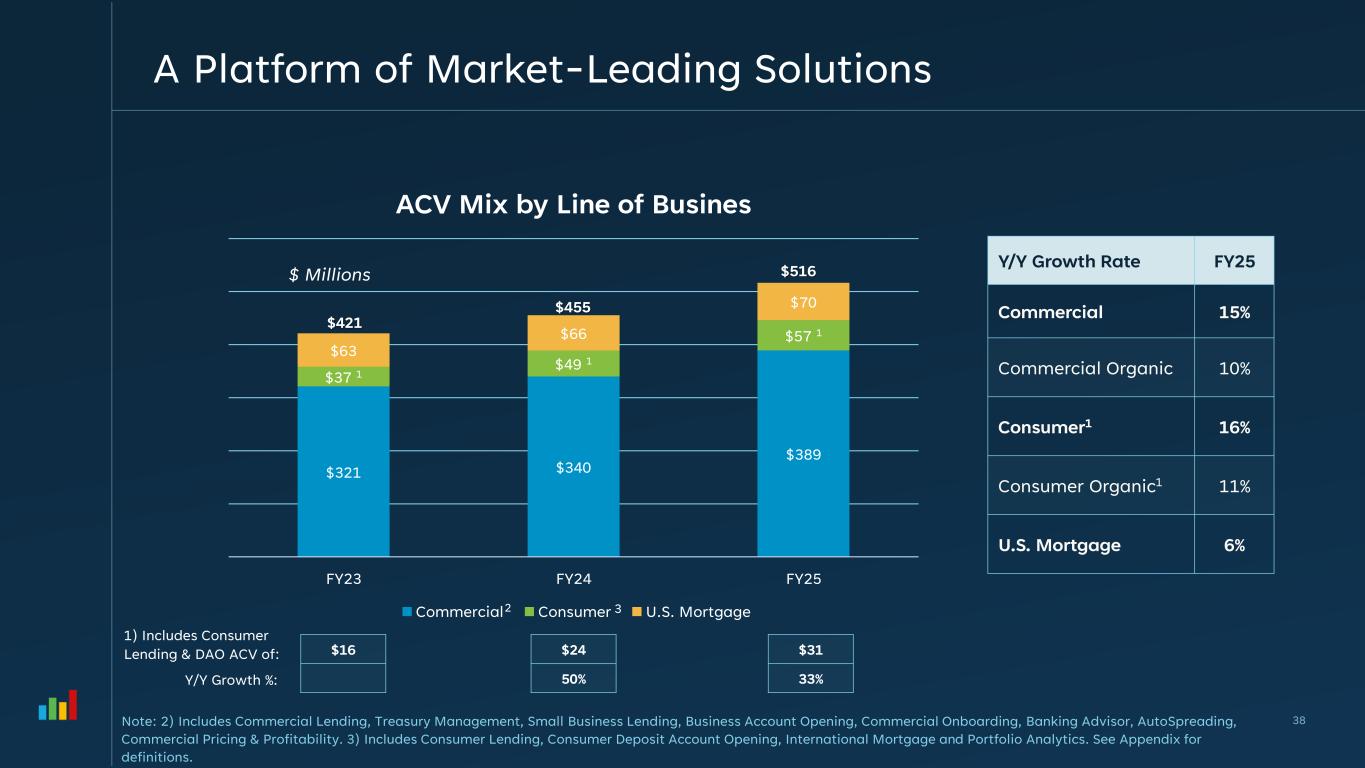
A Platform of Market-Leading Solutions 38Note: 2) Includes Commercial Lending, Treasury Management, Small Business Lending, Business Account Opening, Commercial Onboarding, Banking Advisor, AutoSpreading, Commercial Pricing & Profitability. 3) Includes Consumer Lending, Consumer Deposit Account Opening, International Mortgage and Portfolio Analytics. See Appendix for definitions. $321 $340 $389 $37 1 $49 1 $57 1 $63 $66 $70 FY23 FY24 FY25 ACV Mix by Line of Busines Commercial Consumer U.S. Mortgage $ Millions $421 $455 $516 Y/Y Growth Rate FY25 Commercial 15% Commercial Organic 10% Consumer1 16% Consumer Organic1 11% U.S. Mortgage 6% 2 3 $16 $24 50% $31 33% 1) Includes Consumer Lending & DAO ACV of: Y/Y Growth %:
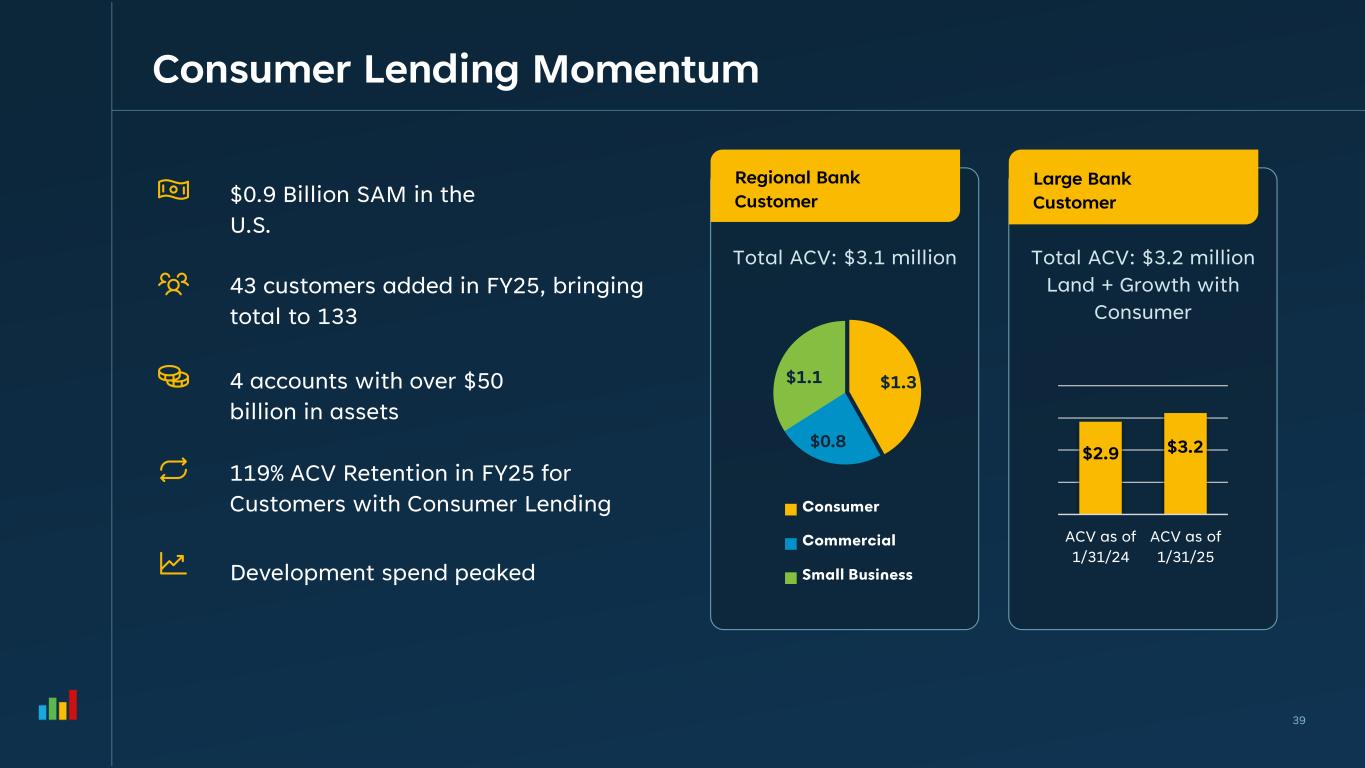
Consumer Lending Momentum 39 Total ACV: $3.1 million Total ACV: $3.2 million Land + Growth with Consumer $2.9 $3.2 ACV as of 1/31/24 ACV as of 1/31/25 $1.3 $0.8 $1.1 $0.9 Billion SAM in the U.S. 43 customers added in FY25, bringing total to 133 4 accounts with over $50 billion in assets 119% ACV Retention in FY25 for Customers with Consumer Lending Development spend peaked Regional Bank Customer Large Bank Customer
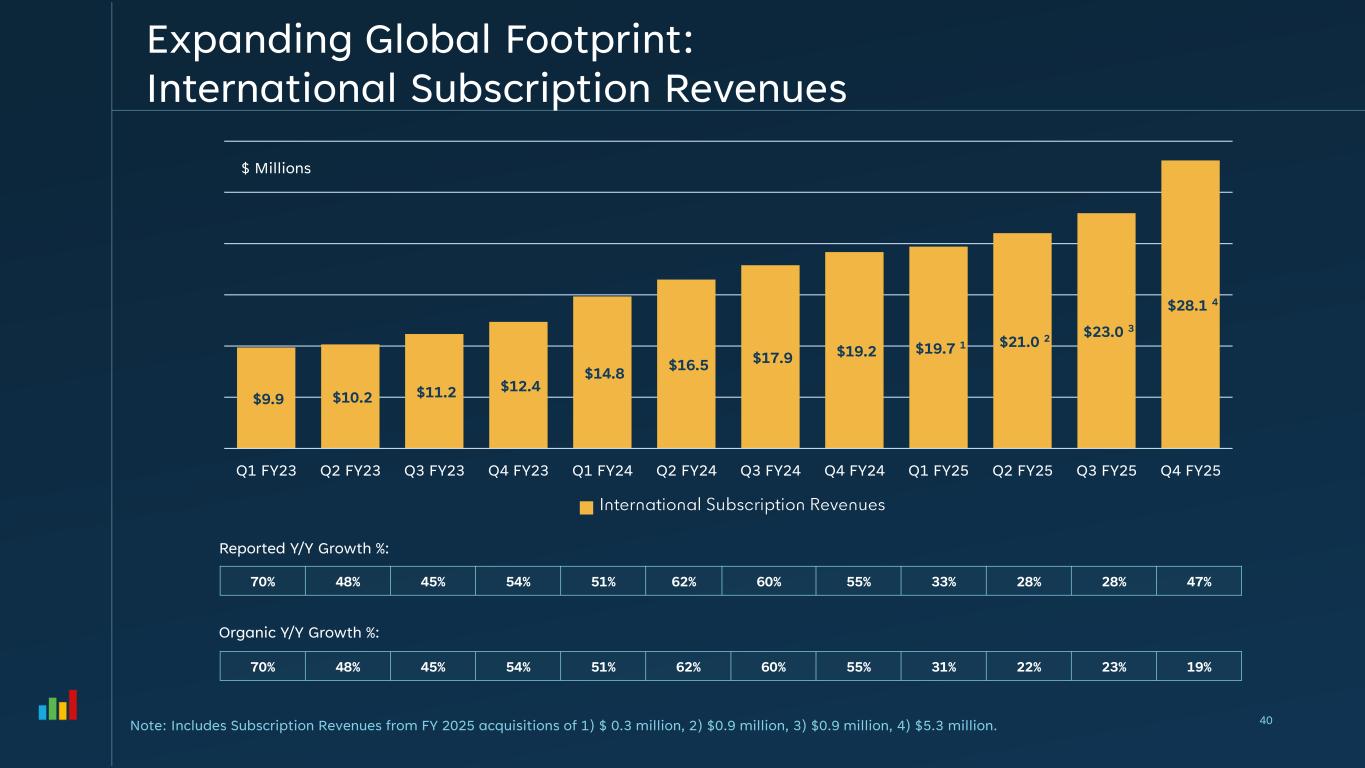
$9.9 $10.2 $11.2 $12.4 $14.8 $16.5 $17.9 $19.2 $19.7 1 $21.0 2 $23.0 3 $28.1 4 Q1 FY23 Q2 FY23 Q3 FY23 Q4 FY23 Q1 FY24 Q2 FY24 Q3 FY24 Q4 FY24 Q1 FY25 Q2 FY25 Q3 FY25 Q4 FY25 $ Millions Note: Includes Subscription Revenues from FY 2025 acquisitions of 1) $ 0.3 million, 2) $0.9 million, 3) $0.9 million, 4) $5.3 million. Expanding Global Footprint: International Subscription Revenues 70% 48% 45% 54% 51% 62% 60% 55% 33% 28% 28% 47% Reported Y/Y Growth %: Organic Y/Y Growth %: 70% 48% 45% 54% 51% 62% 60% 55% 31% 22% 23% 19% 40
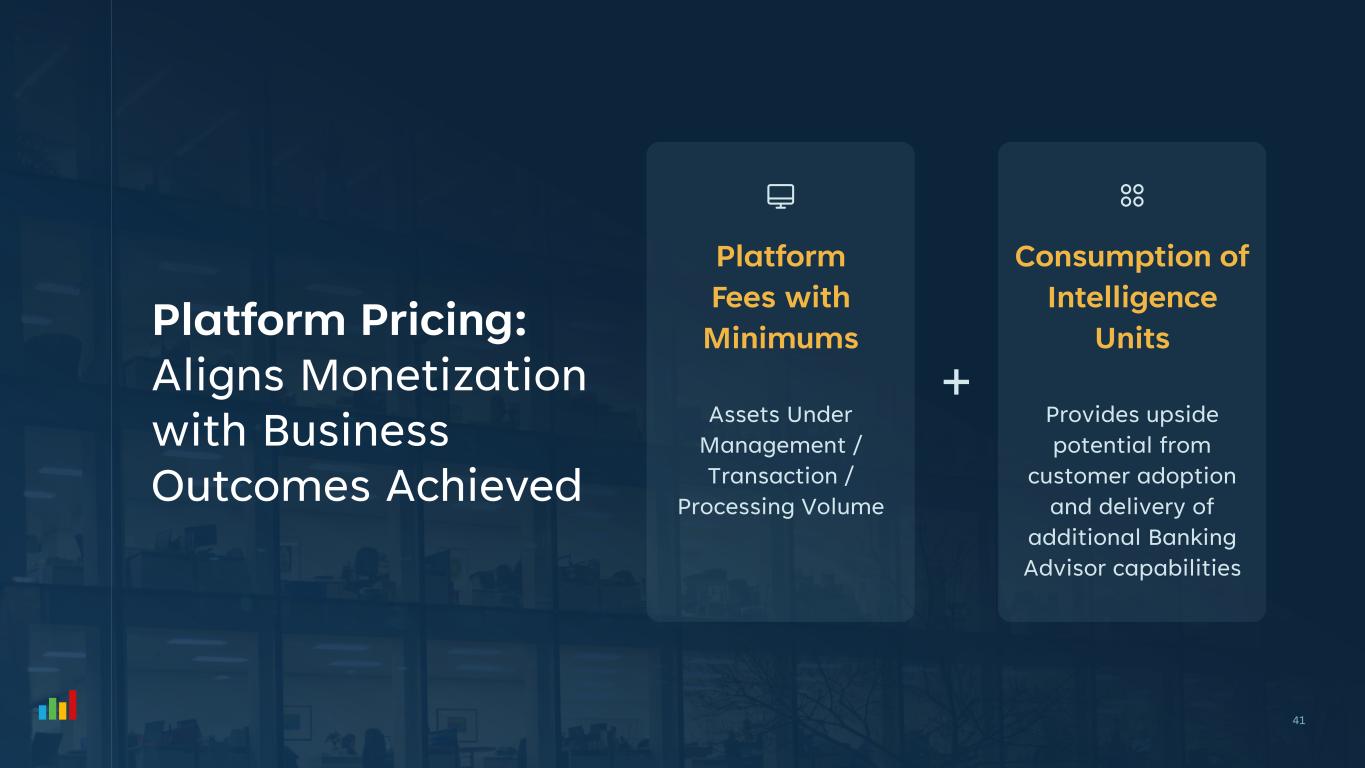
Platform Fees with Minimums Assets Under Management / Transaction / Processing Volume Consumption of Intelligence Units Provides upside potential from customer adoption and delivery of additional Banking Advisor capabilities Platform Pricing: Aligns Monetization with Business Outcomes Achieved 41
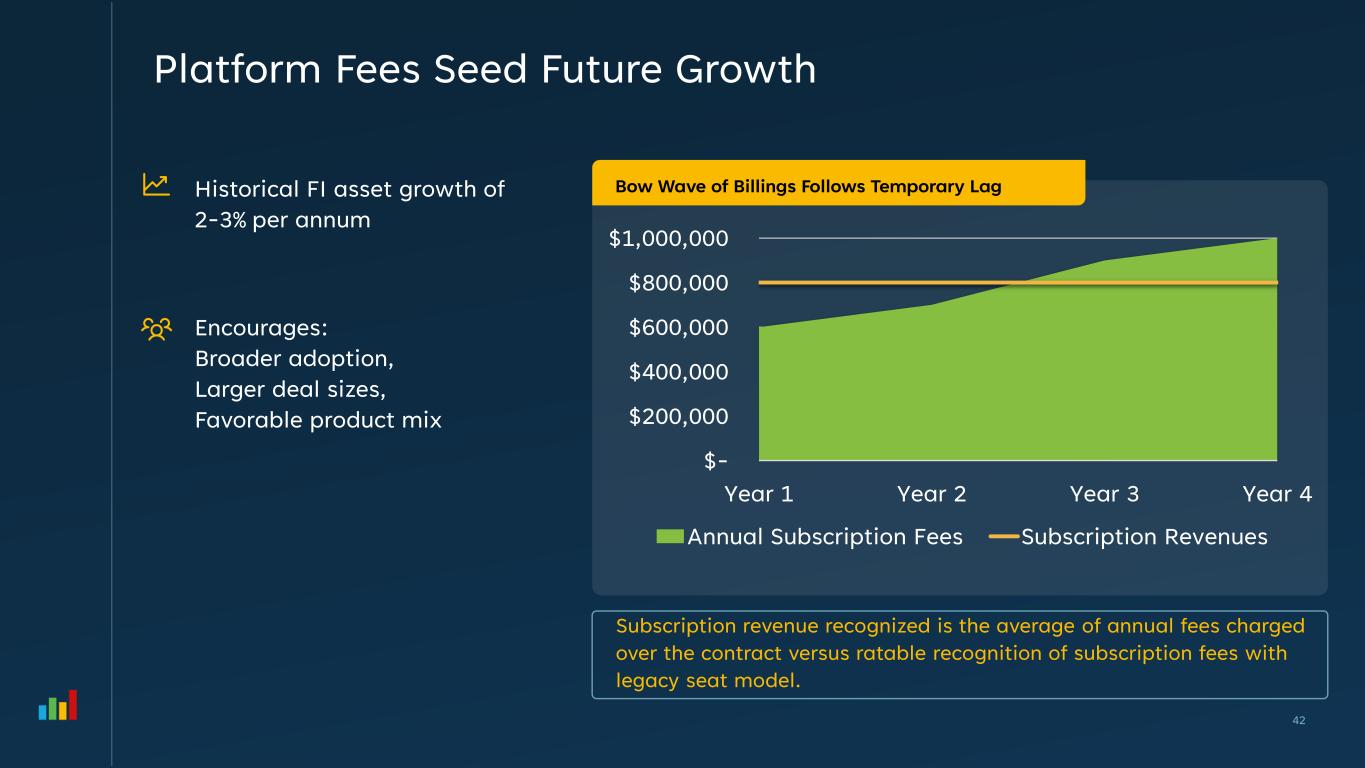
Bow Wave of Billings Follows Temporary Lag Platform Fees Seed Future Growth 42 $- $200,000 $400,000 $600,000 $800,000 $1,000,000 Year 1 Year 2 Year 3 Year 4 Annual Subscription Fees Subscription Revenues Historical FI asset growth of 2-3% per annum Encourages: Broader adoption, Larger deal sizes, Favorable product mix Subscription revenue recognized is the average of annual fees charged over the contract versus ratable recognition of subscription fees with legacy seat model.
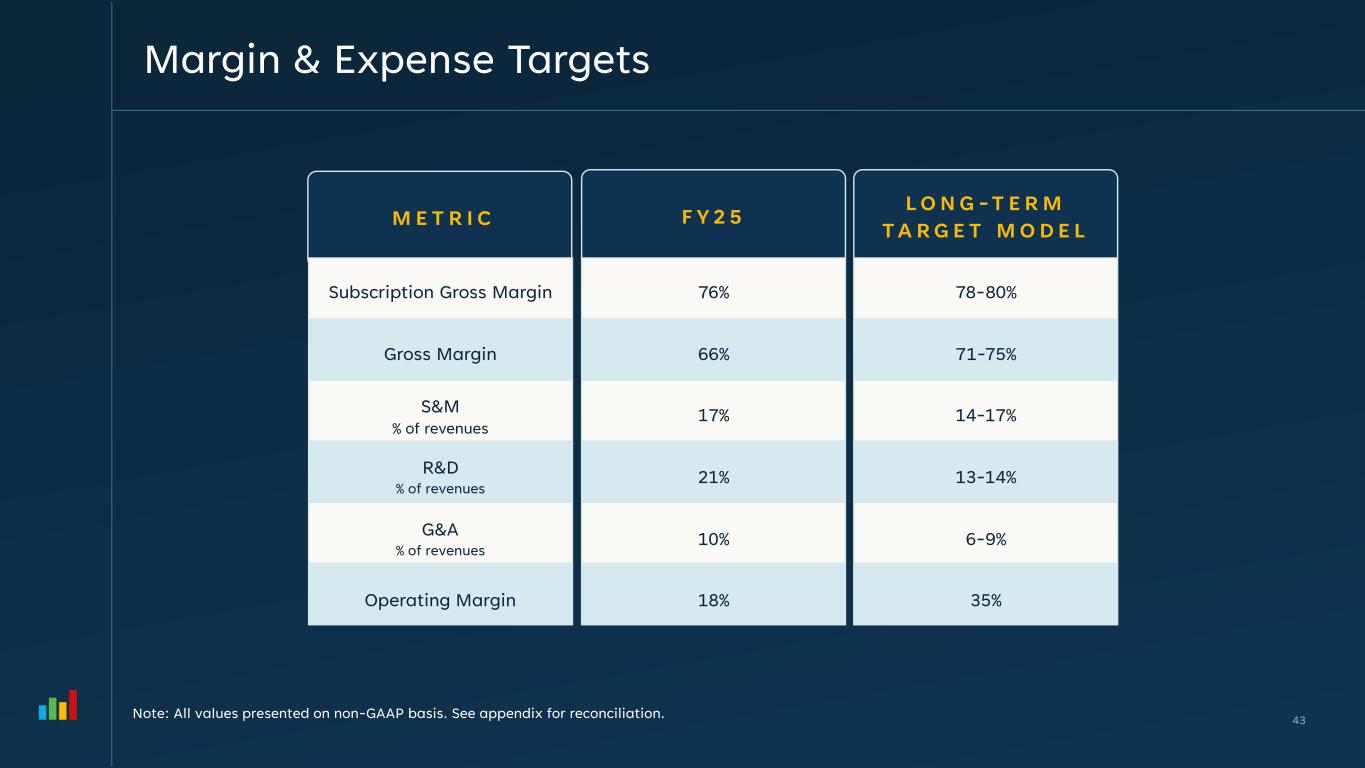
Margin & Expense Targets Note: All values presented on non-GAAP basis. See appendix for reconciliation. Subscription Gross Margin Gross Margin G&A % of revenues R&D % of revenues S&M % of revenues Operating Margin M E T R I C 76% 66% 18% F Y 2 5 17% 21% 10% 78-80% 71-75% 35% L O N G -T E R M T A R G E T M O D E L 14-17% 13-14% 6-9% 43

Margin Levers on Path to Rule of 40 44 Gross Margin Optimize Product Mix & Leverage AI to Improve Delivery Times R&D Maturation of Product Investments & AI
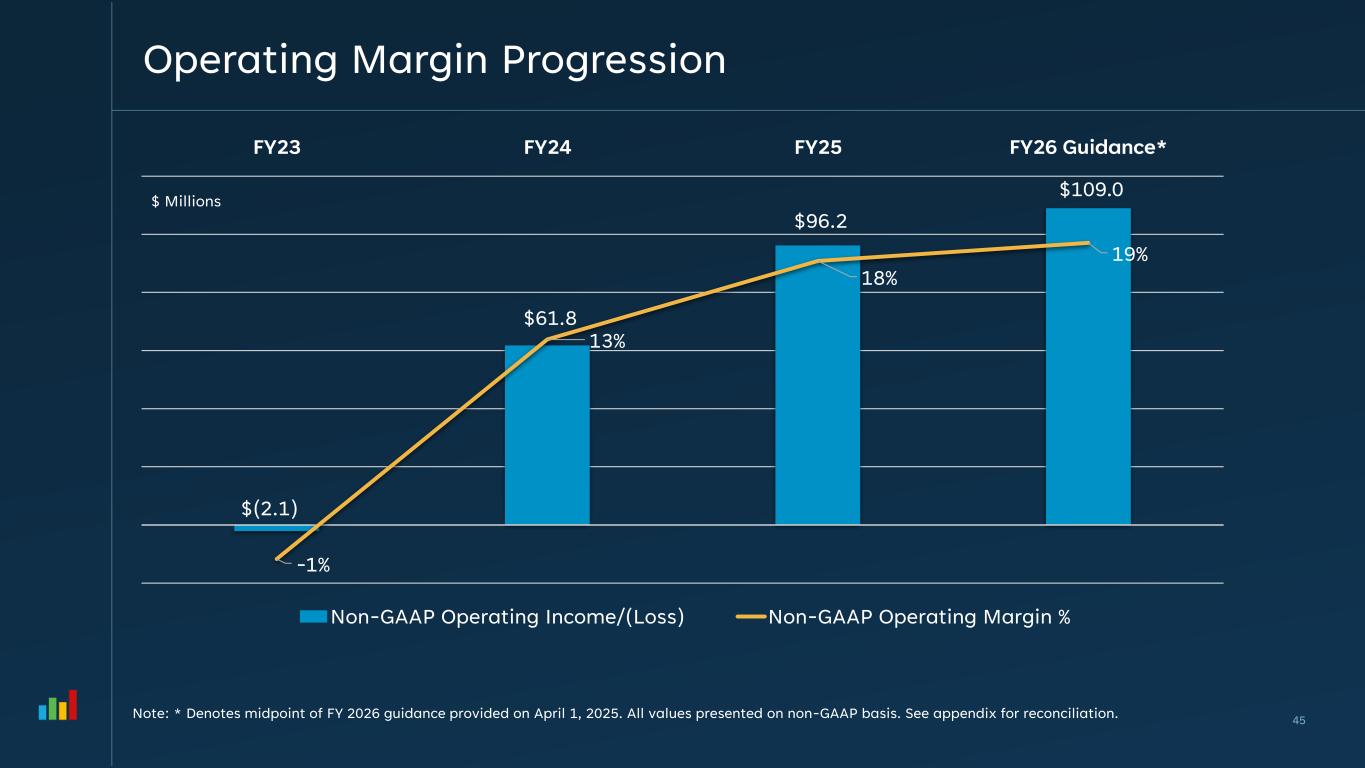
Operating Margin Progression Note: * Denotes midpoint of FY 2026 guidance provided on April 1, 2025. All values presented on non-GAAP basis. See appendix for reconciliation. $(2.1) $61.8 $96.2 $109.0 -1% 13% 18% 19% FY23 FY24 FY25 FY26 Guidance* Non-GAAP Operating Income/(Loss) Non-GAAP Operating Margin % 45 $ Millions

APPENDIX 48
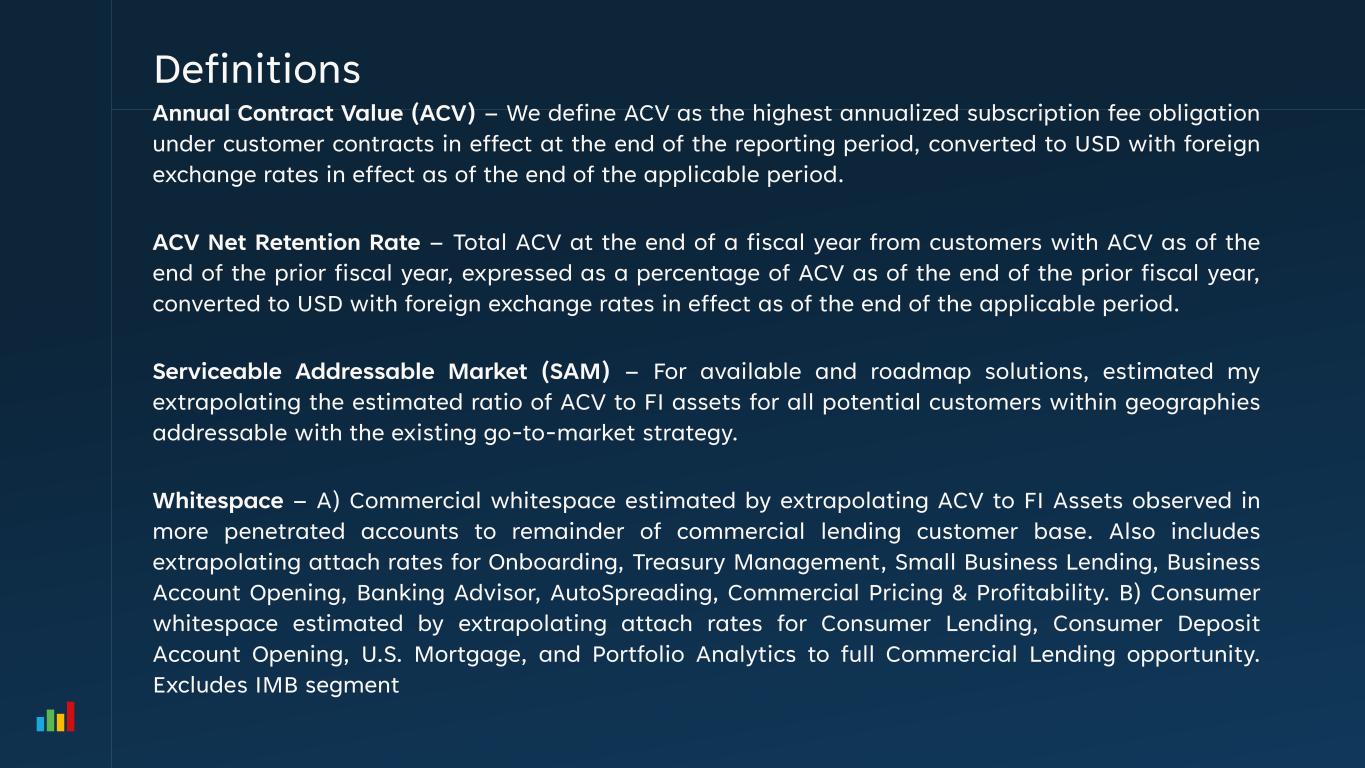
Annual Contract Value (ACV) – We define ACV as the highest annualized subscription fee obligation under customer contracts in effect at the end of the reporting period, converted to USD with foreign exchange rates in effect as of the end of the applicable period. ACV Net Retention Rate – Total ACV at the end of a fiscal year from customers with ACV as of the end of the prior fiscal year, expressed as a percentage of ACV as of the end of the prior fiscal year, converted to USD with foreign exchange rates in effect as of the end of the applicable period. Serviceable Addressable Market (SAM) – For available and roadmap solutions, estimated my extrapolating the estimated ratio of ACV to FI assets for all potential customers within geographies addressable with the existing go-to-market strategy. Whitespace – A) Commercial whitespace estimated by extrapolating ACV to FI Assets observed in more penetrated accounts to remainder of commercial lending customer base. Also includes extrapolating attach rates for Onboarding, Treasury Management, Small Business Lending, Business Account Opening, Banking Advisor, AutoSpreading, Commercial Pricing & Profitability. B) Consumer whitespace estimated by extrapolating attach rates for Consumer Lending, Consumer Deposit Account Opening, U.S. Mortgage, and Portfolio Analytics to full Commercial Lending opportunity. Excludes IMB segment Definitions
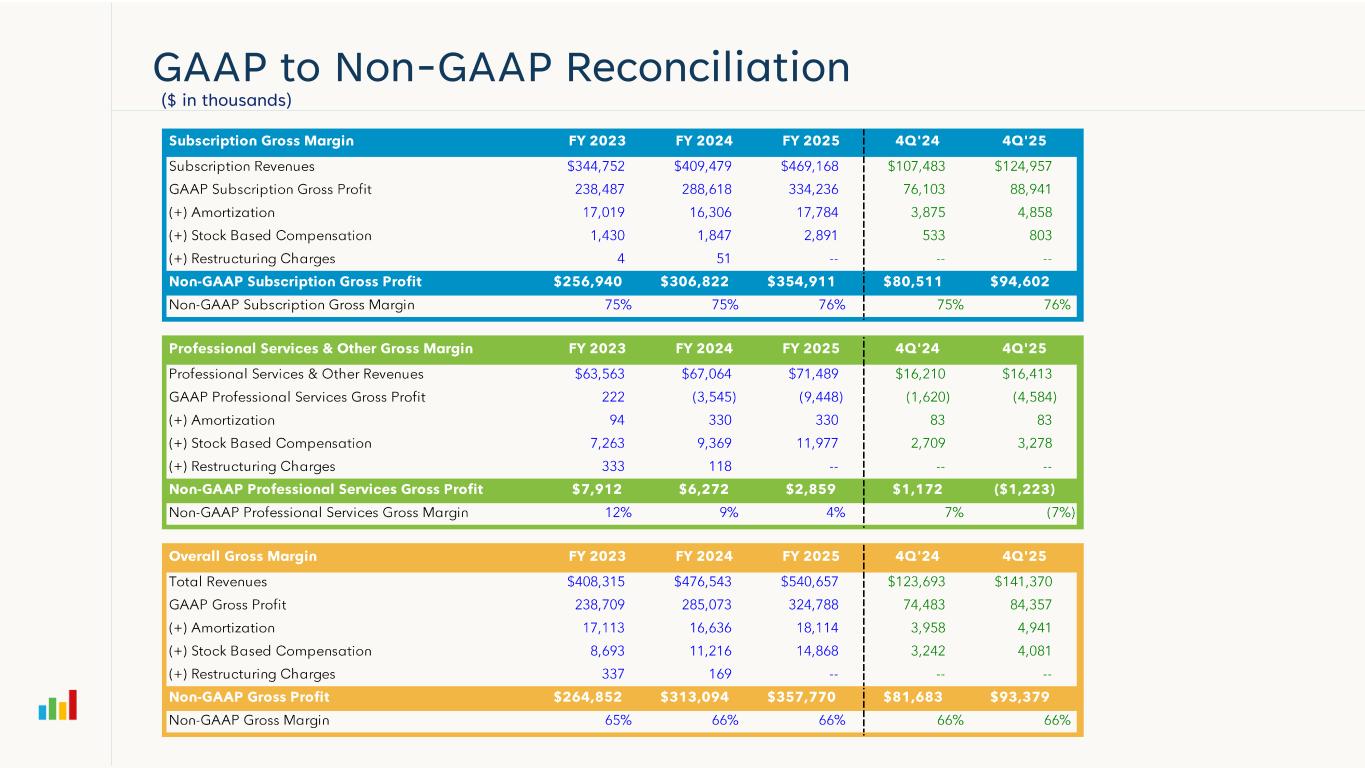
GAAP to Non-GAAP Reconciliation ($ in thousands)
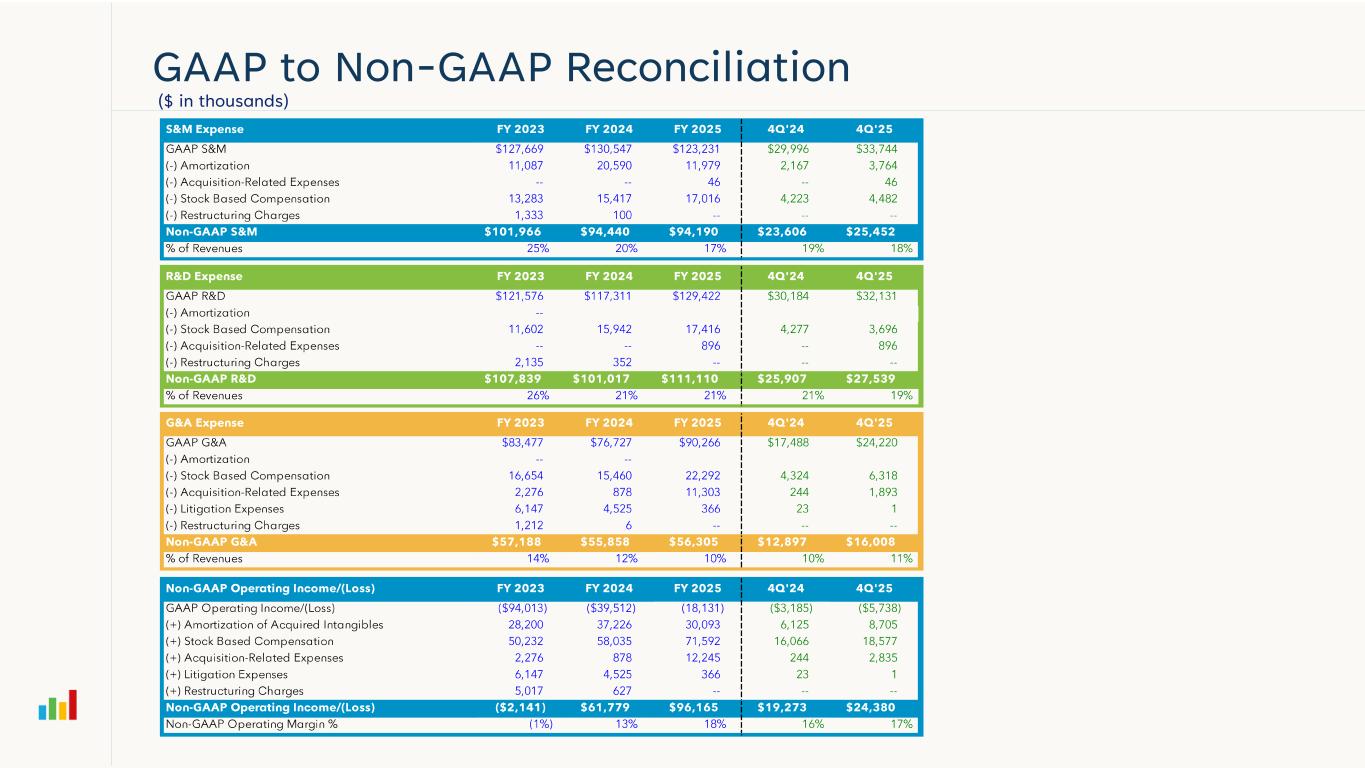
GAAP to Non-GAAP Reconciliation ($ in thousands)
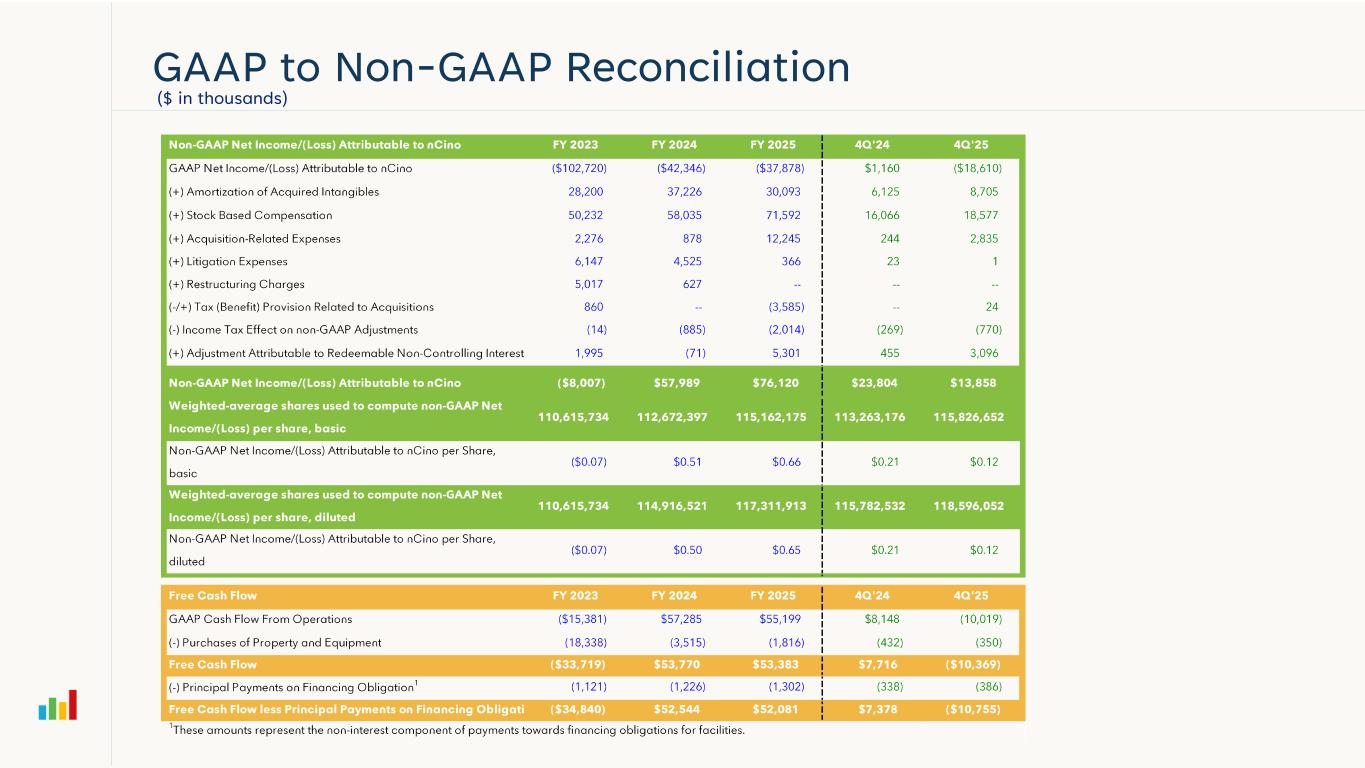
GAAP to Non-GAAP Reconciliation ($ in thousands)