Annual Report Pursuant to Section 13 or 15(d) of the Securities Exchange Act of 1934 for the fiscal year ended December 31, 2025 or
o
Transition Report Pursuant to Section 13 or 15(d) of the Securities Exchange Act of 1934 for the transition period from __________ to __________
Commission File Number: 001-41710
Atmus Filtration Technologies Inc.
(Exact name of registrant as specified in its charter)
Delaware
88-1611079
(State or other jurisdiction of incorporation or organization)
(I.R.S. Employer Identification No.)
26 Century Boulevard, Nashville, Tennessee37214
(Address of principal executive offices) (Zip Code)
Registrant’s telephone number, including area code: (615) 514-7339
Securities registered pursuant to Section 12(b) of the Act:
Title of each class
Trading Symbol(s)
Name of each exchange on which registered
Common Stock, $0.0001 par value
ATMU
New York Stock Exchange
Securities registered pursuant to Section 12(g) of the Act: None
Indicate by check mark if the registrant is a well-known seasoned issuer, as defined in Rule 405 of the Securities Act. xYeso No
Indicate by check mark if the registrant is not required to file reports pursuant to Section 13 or Section 15(d) of the Act. o Yes xNo
Indicate by check mark whether the registrant (1) has filed all reports required to be filed by Section 13 or 15(d) of the Securities Exchange Act of 1934 during the preceding 12 months (or for such shorter period that the registrant was required to file such reports), and (2) has been subject to such filing requirements for the past 90 days. xYeso No
Indicate by check mark whether the registrant has submitted electronically every Interactive Data File required to be submitted pursuant to Rule 405 of Regulation S-T (§232.405 of this chapter) during the preceding 12 months (or for such shorter period that the registrant was required to submit such files). xYeso No
Indicate by check mark whether the registrant is a large accelerated filer, an accelerated filer, a non-accelerated filer, a smaller reporting company, or an emerging growth company. See the definitions of “large accelerated filer,” “accelerated filer,” “smaller reporting company,” and “emerging growth company” in Rule 12b-2 of the Exchange Act.
If an emerging growth company, indicate by check mark if the registrant has elected not to use the extended transition period for complying with any new or revised financial accounting standards provided pursuant to Section 13(a) of the Exchange Act. o
Indicate by check mark whether the registrant has filed a report on and attestation to its management’s assessment of the effectiveness of its internal control over financial reporting under Section 404(b) of the Sarbanes-Oxley Act (15 U.S.C. 7262(b)) by the registered public accounting firm that prepared or issued its audit report. x
If securities are registered pursuant to Section 12(b) of the Act, indicate by check mark whether the financial statements of the registrant included in the filing reflect the correction of an error to previously issued financial statements. o
Indicate by check mark whether any of those error corrections are restatements that required a recovery analysis of incentive-based compensation received by any of the registrant’s executive officers during the relevant recovery period pursuant to §240.10D-1(b). o
Indicate by check mark whether the registrant is a shell company (as defined in Rule 12b-2 of the Act). o Yes x No
As of June 30, 2025, the last business day of the registrant’s most recently completed second fiscal quarter, the aggregate market value of common stock held by non-affiliates of the registrant was $2,992.2 million (based on the closing price of $36.42 as reported on the New York Stock Exchange as of that date).
As of January 31, 2026, 81,508,591 shares of the registrant’s common stock, par value $0.0001 per share, were outstanding.
Documents Incorporated by Reference
Part III of this Annual Report on Form 10-K incorporates information from certain portions of the registrant’s definitive proxy statement relating to the registrant’s 2026 annual meeting of shareholders, which will be filed with the Securities and Exchange Commission on Schedule 14A within 120 days after the fiscal year to which this report relates.
Atmus is one of the global leaders of filtration products for on-highway commercial vehicles and off-highway agriculture, construction, mining and power generation vehicles and equipment. Atmus designs and manufactures advanced filtration products, principally under the Fleetguard brand, that enable lower emissions and provide superior asset protection. Atmus estimates that approximately 14% of Atmus’ net sales in 2025 were generated through first-fit sales to original equipment manufacturers (“OEM”s), where Atmus’ products are installed as components for new vehicles and equipment, and approximately 86% were generated in the aftermarket, where Atmus’ products are installed as replacement or repair parts, leading to a strong recurring revenue base. Building on Atmus’ more than 65-year history, Atmus continues to grow and differentiate itself through its global footprint, comprehensive offering of premium products, technology leadership and multi-channel path to market.
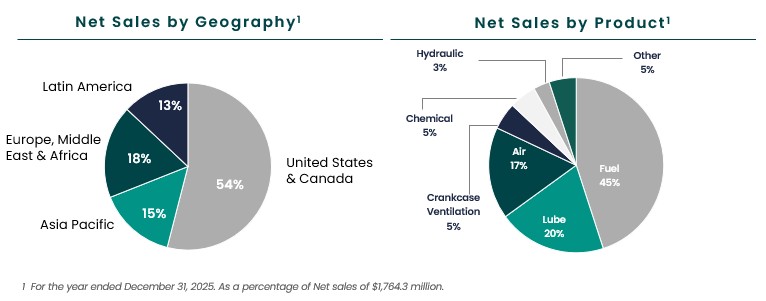
For the year ended December 31, 2025, Atmus generated $1,764.3 million in Net sales, $207.4 million in Net income and $353.5 million in Adjusted EBITDA. See “Management’s Discussion and Analysis of Financial Condition and Results of Operations - Non-GAAP Measures” in this Annual Report on Form 10-K for a description of Adjusted EBITDA and a reconciliation of Adjusted EBITDA to Net income, the most directly comparable financial measure calculated in accordance with U.S. GAAP.
Atmus’ Business Strategy
The company has four pillars as part of its strategy to create value for customers and drive profitable growth. Below are each of the priorities and areas of focus related to each priority.
Grow share in first-fit in core markets
•Grow market share with leading OEMs.
•Enhanced product content per vehicle.
•Accelerate new product development.
•Support technology transitions with leading OEMs.
•Use analytics to target and capture growth opportunities.
•Expand reach through multi-channel distribution.
•Invest in product technology advantage to enhance value and protect revenue.
Transform Atmus’ supply chain
•Drive services and availability.
•Optimize network.
•Transform cost structure.
•Invest in capabilities for the future.
Expand into Industrial Filtration Markets
•Build sustainable growth by expanding and diversifying into the industrial filtration market.
•Leverage global footprint and existing technical capabilities to open new opportunities for growth.
•Develop capabilities, whether organically or through acquisitions or strategic partnerships, to enter new markets with long-term growth prospects.
Atmus’ Global Footprint
Atmus serves end-users globally, with approximately 46% of its Net sales in 2025 from outside of the United States and Canada. Atmus believes that it, together with its joint ventures in China and India, has a leading position in its core markets, based on Net sales in 2025. Atmus maintains strong global customer relationships, supported by an established salesforce with work locations in over 25 countries as of December 31, 2025. Also, as of December 31, 2025, Atmus operates through 11 distribution centers, 10 manufacturing facilities and five technical facilities plus 10 manufacturing facilities and two technical facilities operated by its joint ventures, giving Atmus presence on six continents.
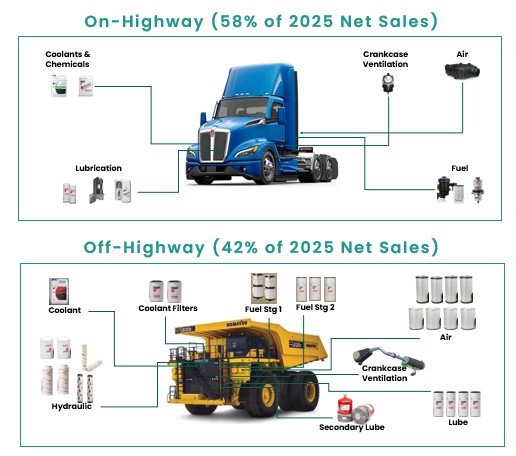
Atmus offers a full spectrum of filtration solutions that enable lower emissions and provide superior asset protection. Atmus’ filtration products provide comprehensive and differentiated solutions, which allow its end-users to extend service intervals, reduce maintenance costs and increase uptime. Atmus’ products include fuel filters, lube filters, air filters, crankcase ventilation, hydraulic filters and coolants and other chemicals. Atmus’ broad range of products in each of its core markets enables one-stop shopping, which Atmus believes is a key competitive advantage.
Atmus’ Competitive Strengths
Technology leadership and deep industry knowledge enable Atmus to deliver better customer solutions
Atmus combines a culture of innovation with deep-seated experience in its industry to deliver superior filtration solutions for its customers. Atmus’ technical team develops a range of filtration technologies, including filtration media, filter element formation, filtration systems integration and service-related solutions such as remote digital diagnostic and prognostic platforms and analytics. Atmus’ technical team of approximately 350 engineers, scientists and technical specialists are located in five technical centers around the world, with approximately 25% holding advanced technical degrees. Atmus’ team draws on a more than 65-year history focused on filtration and media technologies. Atmus has a broad IP portfolio with approximately 1,200 worldwide active or pending patents and patent applications and over 650 worldwide trademark registrations and applications as of December 31, 2025.
Atmus has leveraged this expertise not only to develop its cutting-edge filters, filter systems and filtration media but also to manufacture a large portion of its proprietary filtration media. This allows Atmus to move swiftly from development to application of filtration technologies that protect and enhance the operation of its customer’s equipment and machines. StrataPore, NanoNet, NanoForce, NanoNet Plus and most recently, NanoNet N3 product families have enabled engines and equipment to meet continually changing emissions and performance requirements.
Atmus’ technical team works closely with Atmus’ customers to develop and apply filtration technologies that help them improve their operations. Atmus’ technology allows it to deliver performance-enabling and customized filtration solutions for its end-users, which creates long-lasting partnerships with its customers.
Iconic Fleetguard brand with premium products
Atmus believes that Fleetguard is a premium, leading brand that is strongly associated with reliability and strong performance. Atmus offers a full suite of Fleetguard-branded filtration products. With its broad line of high-quality filtration products, Atmus’ Fleetguard brand provides filters for nearly all makes of vehicles and equipment in its core markets, which further enhances Atmus’ availability, visibility and brand recognition. Atmus’ Fleetguard brand is further supported by a competitive warranty that gives Atmus’ customers and end-users high confidence in the performance and durability of its products.
Partnering with leading OEMs
Atmus has a strong history as a supplier to leading OEMs, including Cummins, Daimler, Deere, Doosan, Foton, Komatsu, Paccar/DAF, the Traton Group, Stellantis and Volvo. Atmus sells both first-fit and aftermarket products to these customers and has been selling to each of them for at least 10 years. These customers in the aggregate accounted for approximately 70% of Atmus’ net sales in 2025 and have consistently accounted for more than 67% of Atmus’ net sales in each of the last five years. Atmus has written agreements with most of its key customers that specify certain purchase parameters, but do not obligate them to specific volumes. Atmus invests in its relationships and utilizes its technical strengths to win first-fit business with these OEMs, which drives Atmus’ installed base, yielding strong recurring revenue streams in the aftermarket. The OEMs also provide Atmus with early insight into technological developments and evolving product requirements within the broader engine and industrial application industry, allowing Atmus to be well positioned as the world shifts towards more complex modular filtration systems and filtration for other power sources.
Cummins is Atmus’ largest customer and accounted for approximately 18.8% of Atmus’ net sales in 2025. This relationship is defined by the first-fit supply agreement and the aftermarket supply agreement. Atmus maintains its strong relationship with Cummins, supported by these contractual relationships and due to its 65 year history embedded with Cummins. This gives Atmus a deep understanding of Cummins needs, which enables Atmus to deliver high-quality, higher-performance products that deliver value to Cummins.
Multi-channel path to diverse global markets
Atmus’ global presence provides a diverse and stable customer base across truck, bus, agriculture, construction, mining and power generation vehicles and equipment markets. Atmus’ current core markets are on-highway and off-highway, representing approximately 58% and 42% of Atmus’ net sales in 2025, respectively.
Atmus estimates that approximately 86% of Atmus’ net sales in 2025 were generated in the aftermarket.
To drive these net sales, Atmus has developed a multi-channel path to global markets that ensures broad product availability and provides end-users with choice and flexibility in purchasing. Atmus distributes its products through a broad range of OEM dealers, independent distributors, and retail outlets, including truck stops.
The dealers of the OEMs are typically the channel preferred by customers in many markets. Atmus’ close relationships with the OEMs and strong first-fit installed base position Atmus well with the OEM dealer network and large fleet customers. For example, the dealers of four of the largest North America on-highway OEMs carry a significant range of Atmus’ products at their dealerships.
In addition, independent distributors and retailers enable Atmus to reach a broader end-user market and create additional points of sale or service. Atmus also works directly with major customers of its channel partners (such as large fleets or mining companies), across its end markets, to create strong brand preference, which, in turn, leads to strong demand for its products and generates recurring revenue. Atmus continues to increase geographic coverage within regions to better serve its customers by investing in distribution expansion.
Atmus typically ships directly from its 11 distribution centers (as of December 31, 2025) worldwide to its channel partners, which provides direct connection and detailed understanding of Atmus’ customer and end-user base. Atmus’ comprehensive distribution and market coverage are vital to maintaining its broad reach, global presence and brand recognition.
Experienced leadership team with a proven track record of driving growth
Atmus is led by an energized and experienced senior leadership team with extensive industry experience with Cummins and other leading industrial companies. Atmus’ strategic vision and culture are directed by its executive leadership team under the leadership of its Chief Executive Officer and President, Stephanie J. Disher, its Senior Vice President, Chief Financial Officer and Chief Accounting Officer, Jack M. Kienzler, its Senior Vice President and Chief People Officer, Renee M. Swan, its Senior Vice President and President, Power Solutions, Charles E. Masters, and its Senior Vice President, Chief Legal Officer and Corporate Secretary, Laura Heltebran. Stephanie J. Disher joined Cummins in 2013 and has over 20 years of experience in leadership positions, including international assignments in Australia, Asia, and the United States. Prior to her current role, Stephanie J. Disher served as Vice President, Cummins and President, Cummins Filtration where she has demonstrated a continued track record of strong business performance, innovation and operational excellence. Jack M. Kienzler joined Cummins in 2014 and has over 15 years of finance experience. He most recently served as the Executive Director of Investor Relations at Cummins, having formerly led the Corporate Development team. Renee M. Swan joined Atmus in August 2023 and has over 20 years of experience in human resources and talent management. Charles E. Masters joined Cummins in 2003 and has over 20 years of experience in global sales and operational leadership roles within Cummins. Laura Heltebran joined Atmus in May 2025 and brings over 25 years of legal, ethics and compliance experience with public companies across several industries including, technology, hospitality, and aviation. Atmus’ leadership team has the ability to develop and execute its strategic vision and aims to create long-term shareholder value. Atmus benefits from its team’s industry knowledge and track record of successful product innovation and financial performance. Additionally, members of Atmus’ senior leadership team have strong experience executing and integrating acquisitions and strategic partnerships to drive accelerated growth and improved profitability.
Supply
The performance of the end-to-end supply chain, extending through to Atmus’ suppliers, is foundational to its ability to meet customers’ expectations and support long-term growth. Atmus is committed to having a robust strategy for how it selects and manages its suppliers to enable a market focused supply chain. This requires Atmus to continuously evaluate and upgrade its supply base, as necessary, as Atmus strives to ensure it is meeting the needs of its customers.
Atmus uses a combination of proactive and reactive methodologies to enhance its understanding of supply base risks, which guide its development of risk monitoring and sourcing strategies. Atmus’ category sourcing strategy process (a process designed to create the most value for the company) supports the review of its long-term needs and guides decisions on what it makes internally and what it purchases externally. For the items Atmus decides to purchase externally, the strategies also identify the suppliers it should partner with long-term to provide the best technology, the lowest total cost and highest supply chain performance. Key suppliers are managed through long-term supply agreements that secure capacity, delivery, quality and ensure cost requirements are met over an extended period.
Other important elements of Atmus’ sourcing strategy include:
•selecting and managing suppliers to comply with its Supplier Code of Conduct; and
•assuring its suppliers comply with its prohibited and restricted materials policy.
Atmus monitors supply chain disruptions and conducts structured supplier risk and resiliency assessments. Atmus performs formal and informal supplier engagements to address potentially impactful supply base constraints and enhanced collaboration to develop specific countermeasures to mitigate risks. Atmus’ global team, located in different regions of the world, uses various approaches to identify and resolve threats to supply continuity.
Supply chain disruptions can impact Atmus’ business as well as its suppliers and customers, resulting in longer lead times in some areas of its business. Orders are typically issued as rolling releases with a specific lead time. When these orders are on backlog, they are often subject to cancellation on reasonable notice without cancellation charges, and therefore are not considered firm.
Materials
The principal materials that Atmus uses directly in manufacturing its products are steel, filter media and petrochemical-based products, including plastic, rubber and adhesives products. Atmus expects these materials to be available from numerous sources in quantities sufficient to meet our requirements. In 2025, material costs represented approximately 60% of Atmus’ cost of sales, compared to 61% of Atmus’ cost of sales in 2024.
Customer Concentration
Atmus has thousands of customers around the world and has developed long-standing business relationships with many of them. Cummins is Atmus’ largest customer, accounting for approximately 18.8% of Atmus’ net sales in 2025, 17.6% in 2024 and 17.4% in 2023, respectively. In connection with the Separation, Atmus entered into a first-fit supply agreement and an aftermarket supply agreement with Cummins for Atmus’ first-fit and aftermarket products. These agreements provide for continuation of Atmus’ supply to Cummins for all of its first-fit applications that Atmus currently supports, commitment to first-fit supply for certain upcoming product launches, and continued supply to Cummins of its full line of aftermarket filtration needs. It does not commit a specific volume of filters or related products. The loss of this customer or a significant decline in the production level of Cummins engines that use Atmus’ filters would have an adverse effect on Atmus’ business, financial condition, results of operations or cash flows.
In addition to the agreement Atmus entered into with Cummins, Atmus has long-term agreements with many of its largest customers. Collectively, Atmus’ net sales from its next four top customers, other than Cummins, was approximately 40% of Atmus’ net sales in 2025 and approximately 40% in 2024 and 39% in 2023, respectively. Excluding Cummins, two other customers, PACCAR and the Traton Group, accounted for more than 10% of Atmus’ net sales in 2025. Atmus’ customer agreements typically contain standard purchase and sale agreement terms covering filter pricing, quality and delivery commitments, as well as engineering product support obligations. The basic nature of Atmus’ agreements with OEM customers is that they are long-term price and operations agreements that provide for the availability of Atmus’ products to each customer through the duration of the respective agreements. Where Atmus has such agreements in place, its customers typically place purchase orders with it pursuant to these agreements. Agreements with most OEMs contain bilateral termination provisions giving either party the right to terminate in the event of a material breach, change of control or insolvency or bankruptcy of the other party.
Intellectual Property
Atmus owns or controls a broad range of intellectual property rights, including a significant number of patents, trademarks, copyrights, trade secrets and other forms of intellectual property rights in the United States and foreign countries. Atmus has a broad IP portfolio with approximately 1,200 worldwide active or pending patents and patent applications and over 650 worldwide trademark registrations and applications as of December 31, 2025, which were granted and registered over a period of years. Atmus’ leading brand house trademark is Fleetguard. Atmus protects its innovations that arise from research and development through patent filings, as well as through trade secrets. Although these patents, trademarks and trade secrets are
generally considered beneficial to Atmus’ operations, Atmus does not believe any patent, group of patents, trademark or trade secret is solely responsible for protecting its products.
Research, Development and Engineering
In 2025, Atmus continued to invest in future critical technologies and products. Atmus will continue to make investments to develop new technologies and improve its current products to meet increasing and changing emissions and engine performance requirements globally for diesel and hydrocarbon-powered equipment. In addition to building on its core technologies, Atmus is making investments in filtration and separation technologies required and used by electric powered vehicles, hydrogen production and other industrial systems.
Atmus’ research, development and engineering programs are focused on product improvements, product extensions, innovations and cost reductions for its customers. Research, development and engineering expenditures include salaries, contractor fees, building costs, utilities, testing, technical IT, administrative expenses and allocation of corporate costs and are expensed when incurred. Research, development and engineering expenses were $40.7 million, $40.6 million, and $42.5 million for the years ended December 31, 2025, 2024 and 2023, respectively.
Seasonality
Many of the Company’s end markets are generally stronger in the first half of the Company’s fiscal year. In addition, the second half of the fiscal year contains more holiday periods, which typically includes more customer closures. Also, individual product lines may experience modest seasonal variation in production, this does not, however, have material impact on demand on a quarterly basis.
Competition
Atmus is a leading global participant in the filtration engine products markets. Atmus’ products include fuel filters, lube filters, air filters, crankcase ventilation, hydraulic filters and coolants and other chemicals. Key global participants in this market include MANN+HUMMEL, Donaldson, Parker and MAHLE. The rest of the market is highly fragmented and occupied by various specialized and regional players. Most of the large global players serve both first-fit and aftermarket channels, while smaller, regional players tend to focus on the aftermarket. The filtration market offers a unique multi-channel path to market, and diversification across first-fit, OEM service and aftermarket. The recurring revenue model and mission-critical role of filters drive consistent demand across regions and end markets.
Principal methods of competition in the filtration markets are product quality and performance, price, geographic and application coverage, availability, customer service, ease of doing business and brand reputation. Atmus believes it is a market leader within many of its product lines, including filters in Atmus’ on-highway and off-highway markets, and that its success in the market is due to its technology, its iconic Fleetguard brand, its global footprint, strong customer relationships and the talent within its organization.
Human Capital Resources
As of December 31, 2025, Atmus employed approximately 4,500 persons worldwide. As of December 31, 2025, approximately 53% of Atmus’ employees worldwide were represented by various unions under collective bargaining agreements. Among these collective bargaining agreements, those for the employees in Mexico, Brazil and France are renewed annually after compensation negotiations, while the collective bargaining agreement for the Cookeville, Tennessee plant typically has a four- to five-year term. Collective bargaining for Brazil Annual Profit Sharing will take place on February 19, 2026. Annual term collective bargaining for Mexico and France were recently successfully completed. These collective bargaining agreements have terms that will expire between December 2026 and February 2027. Contract negotiations at the Cookeville, Tennessee plant took place in February of 2024 resulting in a new four year contract that will expire at the end of its four year term on February 29, 2028.
Throughout Atmus’ more than 65-year history, Atmus has always recognized that people are the strength of its business and drive its ability to effectively serve its customers and sustain its competitive position. Atmus believes that the composition of its workforce gives it advantages relating to cost and capability when compared to its peers. Atmus empowers managers and employees to make decisions and generate positive results,
increases employee communication and interaction with senior leadership and enhances a work environment that is inclusive, transparent, agile and team-oriented.
Purpose and Core Values
Atmus is a purpose-driven company. Atmus’ purpose is ‘Creating a better future by protecting what is important.’ Atmus creates and innovates every day. With a forward focus, Atmus never sits still. Atmus realizes the world is bigger than it, and it aspires for a better future for shared humanity. Atmus’ products protect its customers, their equipment and their livelihoods. Atmus protects what is important to its people, the planet, and its customers.
Atmus’ culture is shaped by its core values:
•Build Trust in every relationship every day.
•Have Courage to speak up, take action and shape the future.
•Be Inclusive by embracing differences and building a community where everyone feels valued.
•Show Caring by engaging with kindness and consideration for the wellbeing of others.
Leadership and Talent Management
The capability of Atmus’ people and their ability to work effectively in agile teams is a primary enabler of Atmus’ success. Atmus strives to create a leadership culture that is authentic, transparent and approachable. By minimizing organizational layers, simplifying its organizational structure and process, Atmus empowers its employees to have an increased impact on its results. Atmus’ leaders are tasked with providing their employees with the support, development and encouragement needed to be successful. Further, Atmus’ leaders connect Atmus’ people and their work to Atmus’ purpose, values, brand promise and strategies. Atmus will continue to invest in leadership development. Atmus will maintain the emphasis that the primary role of leaders at all levels is to focus on people development, supporting the unique needs of each employee in reaching their greatest positive impact at work, in the community and at home.
Atmus’ talent management approach seeks to develop the skills and capabilities of a diverse, global workforce and utilize Atmus’ talent to deliver excellent results. Atmus advances and invests in its people based on strong performance, demonstration of core values in how work is accomplished and the individual motivation to have a larger impact on organization results.
Competitive Pay and Benefits
To attract and retain the best employees, Atmus maintains a positive work environment that is grounded in its core values, a leadership culture that supports the development of its people and competitive pay and benefits.
When designing its base pay compensation ranges, Atmus completes market analyses to maintain pay ranges that are current and related to the work it performs. Atmus also completes annual compensation studies to assess market movement for key skills as well as internal pay equity. Atmus incorporates living wage assessment into its annual compensation reviews to ensure that current and new hires are not below this threshold. Collectively, Atmus’ global wage assessments seek to ensure Atmus is fair, equitable and competitive in its ability to attract and retain the best talent. Everywhere possible, individual performance is the primary path for Atmus’ employees to advance their earning potential. In addition, all employees also participate in annual variable compensation plans that encourage collaboration in the achievement of overall business results.
Atmus’ benefit programs are aligned with Atmus’ values, including health insurance, retirement plans and wellness programs. The U.S. medical benefits include a tiered cost-sharing structure based on salary. This is in place to make healthcare more affordable for lower income employees and helps to attract and retain talent across the organization.
Atmus has a health, safety and environment commitment to protect what is important - its people, the planet and its customers. Every day, Atmus is committed to continually improving the health and safety of its work environment, taking action to achieve its goal that nobody gets hurt.
In pursuit of this goal, Atmus embraces a positive safety culture that encourages its employees to recognize potentially unsafe situations, report concerns and work together to remove potential hazards from the work environment before incidents occur. Additionally, Atmus’ Global Health and Safety Policy sets the standard for Atmus’ facilities based on best practices that often exceed regulatory requirements. Atmus manages its sites using the International Standards for Health, Safety and Environment to create a strong framework for risk reduction and continual improvement, with certification to ISO45001 and ISO14001.
Atmus encourages its leaders to promote safety through strategic planning, enforcement and accountability, fostering the right environment, and influencing employees and other stakeholders. Atmus encourages its employees to promote safety through personal accountability, managing risk, and adopting positive behaviors. By employing these safety guidelines, Atmus seeks to maintain its goal of zero serious injury fatalities caused by machinery safety hazards due to the lack of or failure of safety control measures.
Where Atmus identifies a risk, it ensures that improvement actions are shared across the organization to promote a learning-oriented culture where Atmus’ employees are empowered to make their work environment safer and better. Using leading indicators of performance, Atmus recognizes the contribution of individuals and teams to reinforce safe work behaviors in the workplace, homes and communities.
Inclusion and Diversity
Inclusion and diversity of perspective at all levels of Atmus are critical to its ability to innovate, win in the marketplace and create sustainable success. Having inclusive and diverse workplaces allows Atmus to attract and retain the best employees to deliver results for its shareholders. Building on a long history that has emphasized inclusion and diversity, Atmus will continue to seek opportunities and invest in processes that attract, develop and retain diverse talent, globally. Atmus will ensure that all employees can benefit from being a part of Atmus. This begins with the leadership team at Atmus. At this time, three out of Atmus’ eight directors are female, including its Chief Executive Officer, and two out of its eight directors are ethnically diverse. In addition, 43% of Atmus’ executive team is female, including its Chief Executive Officer, and 14% is ethnically diverse.
Regulatory Matters
Atmus faces extensive government regulation both within and outside the United States relating to the development, manufacture, marketing, sale and distribution of its products, including regulations relating to data privacy, trade compliance, anti-corruption and anti-bribery. These are not the only regulations with which Atmus must comply. For a description of risks related to the regulations that Atmus is subject to, please refer to the section entitled “Risks Related to Government Regulation.”
Available Information
The Company makes its annual reports on Form 10-K, quarterly reports on Form 10-Q, current reports on Form 8-K, proxy statements and other information, including amendments to those reports, available free of charge through its website at investors.atmus.com, as soon as reasonably practicable after it electronically files such material with, or furnishes such material to, the Securities and Exchange Commission (SEC). These filings are available on the SEC’s website at www.sec.gov.
The following table sets forth information, as of February 13, 2026, regarding the individuals who serve as Atmus’ executive officers, followed by a biography of each executive officer.
Name
Age
Positions
Stephanie J. Disher
50
Chief Executive Officer and President
Jack M. Kienzler
40
Senior Vice President, Chief Financial Officer and Chief Accounting Officer
Laura B. Heltebran
61
Senior Vice President, Chief Legal Officer and Corporate Secretary
Charles E. Masters
53
Senior Vice President and President, Power Solutions
Renee M. Swan
45
Senior Vice President and Chief People Officer
Stephanie J. Dishercurrently serves as Atmus’ Chief Executive Officer and President. Ms. Disher previously served as Vice President, Cummins and President, Cummins Filtration. Prior to that role, Ms. Disher served in various leadership roles since joining Cummins in 2013, including as Operations Director and Managing Director for Cummins in the South Pacific region. Ms. Disher holds a bachelor’s degree in Commerce from the University of Western Sydney and a Master of Business Administration from the University of Melbourne.
Jack M. Kienzlercurrently serves as Atmus’ Senior Vice President, Chief Financial Officer and Chief Accounting Officer. Mr. Kienzler previously oversaw the financial activities of Cummins Filtration Inc. as its Chief Financial Officer. Mr. Kienzler served in various leadership roles since joining Cummins in 2014. Mr. Kienzler holds a Bachelor of Science in Finance and Accounting from Indiana University and a Master of Business Administration from the Indiana University Kelley School of Business.
Laura B. Heltebran currently serves as Atmus’ Senior Vice President, Chief Legal Officer and Corporate Secretary. Ms. Heltebran previously served as Executive Vice President, Chief Legal Office and Corporate Secretary with Wheels Up. Prior to Wheels Up, Ms. Heltebran served as Senior Vice President and Deputy General Counsel at Hilton Worldwide. Ms. Heltebran holds a Bachelor of Arts degree from George Mason University and a Juris Doctor degree from Antonin Scalia Law School, George Mason University.
Charles E. Masterscurrently serves as Atmus’ Senior Vice President and President, Power Solutions and previously served as Executive Director of Global Sales and Marketing of Cummins Filtration Inc. Prior to that role, Mr. Masters served in various leadership roles since joining Cummins in 2003, including as General Manager of Eaton Cummins Automated Transmission Technologies from 2018 to 2021 and as President of Cummins Western Canada from 2016 to 2018. Mr. Masters holds a Bachelor of Commerce from the University of Alberta and a Master of Business Administration from Harvard Business School.
Renee M. Swancurrently serves as Atmus’ Senior Vice President and Chief People Officer. Ms. Swan previously served as Vice President of Human Resources for the communication systems segment of L3Harris Technologies, Inc. Ms. Swan has over two decades of experience in human resources disciplines, having spent time with Kennametal, Honeywell International, and Eaton Corporation in progressive human resources responsibilities. Ms. Swan has a Master of Professional Studies in Human Resource Management from Cornell University, a Master of Business Administration degree from Point Park University and a Bachelor's in Communications from the University of Pittsburgh.
These risk factors could materially affect our business, financial condition, results of operations and cash flows. These risk factors are not exhaustive and investors are encouraged to perform their own investigation with respect to the business, financial condition and prospects of our business. You should carefully consider the following risk factors in addition to the other information included in this Annual Report on Form 10-K for the fiscal-year ended December 31, 2025, and should also carefully consider the matters addressed in the section herein entitled “Cautionary Statements and Risk Factor Summary.” We may face additional risks and uncertainties that are not presently known to us, or that we currently deem immaterial, which may also impair our business, financial condition, results of operation or cash flows. The following discussion should be read in conjunction with the “Management’s Discussion and Analysis of Financial Condition and Results of Operations,” and our financial statements and notes to the financial statements included herein.
Summary of Risk Factors
The following summarizes the risks facing our business, all of which are more fully described below. This summary should be read in conjunction with the risk factors below and should not be relied upon as an exhaustive summary of the material risks facing our business. The order of presentation is not necessarily indicative of the level of risk that each factor poses to us.
Risks Related to Our Business Operations
•Significant customer concentration among Cummins, PACCAR, and the Traton Group.
•The loss of a top OEM relationship or changes in the preferences of Atmus' aftermarket end-users.
•Deriving significant earnings from investees that Atmus does not directly control.
•Significant competition in the markets Atmus serves.
•Ability to attract and retain qualified personnel.
•Strategic transactions, such as acquisitions, divestitures, and joint ventures.
•Management of productivity improvements.
•Work stoppages and other labor matters.
•Variability in material and commodity costs.
•Interruptions in the supply of critical materials and components.
•Complexity of supply chain and manufacturing.
•Customers operating in cyclical industries and the current economic conditions in these industries.
•Exposure to potential claims related to warranties and claims for support outside of standard warranty obligations.
•Products being subject to recall for performance or safety-related issues.
•Inability or failure to adequately protect and enforce Atmus’ intellectual property rights and the cost of protecting or enforcing Atmus' intellectual property rights.
Risks Related to Legal and Regulatory Issues
•Sales of counterfeit versions of products, as well as unauthorized sales of products.
•Statutory and regulatory requirements that can significantly increase costs.
•Changes in international, national and regional trade laws, regulations and policies affecting international trade.
•Unanticipated changes in Atmus' effective tax rate, the adoption of new tax legislation or exposure to additional income tax liabilities, as well as audits by tax authorities resulting in additional tax payments for prior periods.
•Significant compliance costs and reputational and legal risks imposed by Atmus' global operations and the laws and regulations to which these are subject.
•Effects of climate change may cause Atmus to incur increased costs.
•Operations being subject to increasingly stringent environmental laws and regulations as well as to laws requiring cleanup of contaminated property.
Risks Related to Cybersecurity and Information Technology Infrastructure
•Potential system or data security breaches or other disruptions.
Risks Related to Finance and Financial Market Conditions
•Foreign currency exchange rate.
•Potential economic downturns that could cause the balances of recorded goodwill to decrease.
Risks Related to Macroeconomic and Geopolitical Conditions
•Increased tariffs or the imposition of other barriers to international trade.
•Political, economic, and social uncertainty in geographies where Atmus has significant operations or large offerings of products.
Risks Related to Atmus’ Relationship with Cummins
•Atmus or Cummins fail to perform under various transaction agreements that were executed as part of the IPO.
•We may have received better terms from unaffiliated third parties than the terms we received in our agreements with Cummins.
Risks Related to Atmus’ Capital Structure
•Changes in capital and credit markets.
•Substantial indebtedness consisting of Atmus’ term loan and revolving credit facility, which may impact Atmus' ability to service all its indebtedness and react to changes in the industry.
•Substantially all Atmus' assets pledged as security for its term loan and revolving credit facility.
Risks Related to Ownership of Atmus Common Stock
•Fluctuations in the price of Atmus common stock.
•Atmus’ stock repurchase program may be suspended or terminated at any time.
•No guarantee of the payment, timing or amount of any dividend.
•Applicable laws and regulations, provisions of Atmus' Second Amended and Restated Certificate of Incorporation (the “Charter”) and Atmus' Amended and Restated Bylaws (the “Bylaws”) and certain contractual rights granted to Cummins that may discourage takeover attempts and business combinations that shareholders might consider in their best interests.
•The designation of the Court of Chancery in the State of Delaware and the federal district courts for the District of Delaware as exclusive forums provision in Atmus’ Charter.
We have significant customer concentration, with Cummins, PACCAR and the Traton Group respectively accounting for approximately 18.8%, 16.3% and 11.5% of our net sales for the year ended December 31, 2025. The loss of such net sales to any of such significant customers would have a material and adverse effect on our business, financial condition, results of operations and cash flows.
For the year ended December 31, 2025, net sales to Cummins, our largest customer, accounted for approximately 18.8% of our net sales. Sales to Cummins joint ventures and to distributors that Cummins has a relationship with also account for a portion of our net sales. A portion of our net sales is dependent upon customer acceptance of, and demand for, Cummins’ engines or generators that use our filters. This customer concentration increases the risk of fluctuations in our operating results and our sensitivity to any material adverse developments experienced by Cummins. While our relationship with Cummins is defined by our first-fit supply agreement and aftermarket supply agreement, we may fail in the future to renew these contracts, and, moreover, even if renewed, Cummins’ purchasing power may give it the ability to make greater demands on us with regard to pricing and contractual terms in general. In addition, Cummins may procure supplemental supply of top volume aftermarket products from alternative suppliers for a limited time if we fail to meet certain delivery performance requirements or if we do not offer a product or similar product for sale.
Cummins historically did not seek competitive bids for filtration products. However, prior to the completion of the IPO, Cummins initiated a competitive process to source a selective group of future first-fit programs and associated aftermarket products from its filtration product suppliers, including us. Subsequently, we were successful in being awarded this business. In the future, we expect that Cummins will continue to seek competitive bids for new filtration products. While we will have a preferred supplier relationship with Cummins, we will have to successfully win bids through Cummins’ bidding process in order to maintain or grow our current level of sales to Cummins and cannot guarantee that Cummins will always select our products. The loss of, or any substantial reduction in sales to, Cummins would have a material adverse effect on our business, financial condition, results of operations and cash flows. In addition, our association with Cummins has contributed to the relationships we have with certain significant customers due to the relationship those customers had with Cummins. We may not be able to attract new customers of Cummins, or retain existing customers, without Cummins’ support.
For the year ended December 31, 2025, net sales to PACCAR and the Traton Group accounted for approximately 16.3% and 11.5%, respectively, of our net sales. We cannot guarantee that PACCAR or the Traton Group will always choose to purchase our products. The loss or substantial reduction of sales to PACCAR or the Traton Group could materially and adversely affect our business, financial condition, results of operations or cash flows.
The loss of a top OEM relationship, or changes in the preferences of our aftermarket end-users, could adversely impact the recurring nature of our aftermarket sales.
We supply filtration products to many of the largest OEMs for both first-fit and aftermarket, which results in recurring revenue for our products. Our relationships with these OEMs also allow us to be closely attuned to our customers' requirements and preferences and react quickly to any changes. The use of our filtration products as a standard first-fit component creates a steady demand for that product in the aftermarket, as end-users often return to the OEM for aftermarket service for multiple years and may continue to prefer our products as replacement or repair parts.
We may not be able to maintain our current top OEM relationships in the future or may not become the preferred supplier for additional OEMs. In addition, our channel partners’ and end-users’ preferences for replacement or repair filtration products may change in the future. The loss of a top OEM relationship, or changes in the preferences of our aftermarket end-users, could adversely impact the recurring nature of our aftermarket sales.
We derive significant earnings from investees that we do not directly control.
We earn equity, royalty and interest income from our joint venture in China — Shanghai Fleetguard Filter Co. Ltd., where we indirectly hold 50% of the economic interest. We also earn equity, royalty and interest income from our joint ventures in India — Fleetguard Filter Private Ltd. (“FFPL”), where we directly hold 49.491% of the economic interest (and 50% of the voting interest), and Filtrum Fibretechnologies Pvt. Ltd.,
where we hold, directly or indirectly, 49.75% of the economic interests (25% directly and 24.75% indirectly through our proportionate ownership of FFPL’s 50% ownership interest). For the year ended December 31, 2025, we recognized $33.8 million of equity, royalty and interest income from investees, compared to $34.3 million for the year ended December 31, 2024 and $33.6 million for the year ended December 31, 2023. Although a significant percentage of our net income is derived from these unconsolidated entities, we do not unilaterally control their management or their operations, which puts a substantial portion of our net income and cash flow through dividend payments at risk from the actions or inactions of these entities. A significant reduction in the level of contribution by these entities to our net income would likely have a material adverse effect on our business, financial condition, results of operations or cash flows.
We face significant competition in the markets we serve and maintaining a competitive advantage requires consistent investment with uncertain returns.
The businesses and product lines in which we participate are very competitive and we risk losing business based on a wide range of factors, including price, quality, technological and engineering capability, manufacturing and distribution capability, innovation, performance, reliability and availability, geographic coverage, delivery and customer service. Our customers continue to seek technological innovation, productivity gains and competitive prices from us and our other suppliers. As a result of these and other factors, if we do not meet our customers’ expectations, we may not be able to compete effectively. The competitive environment in which we operate is also subject to change. There is no guarantee that we will be successful in implementing new product expansions, as we may fail to successfully complete product development or achieve the level of sales for these products that we expect. There may also be unexpected costs for such new product offerings, which would lower our margins.
Additionally, we operate in highly competitive markets and have numerous competitors who are well-established in those markets. Our competitors include companies that may have greater name recognition or financial, technical, operational, marketing or other resources than us. We expect our competitors to continue improving the design and performance of their products and to introduce new products that could be competitive in both price and performance. We believe that we have certain technological advantages over our competitors in the markets in which we operate, but maintaining these advantages requires us to consistently invest in research and development, sales and marketing and customer service and support. There is no guarantee that we will be successful in maintaining these advantages.
Evolving customer needs and developing technologies may threaten our existing business and growth.
The ongoing energy transition away from fossil fuels and the increased adoption of electrified powertrains in some market segments could result in lower demand for current diesel or natural gas engines and components and, over time, reduce the demand for related parts and service revenues. Specifically, our core markets may be impacted by technology transitions, including the transition to battery-electric vehicles, hydrogen-powered internal combustion engines, fuel cell electric vehicles and alternate power sources. Substantially all of our net sales are related to internal combustion engine filtration products. Concerns regarding the effects of emissions of GHG on the climate have driven (and will likely continue to drive) international, national, regional and local legislative and regulatory responses, including those imposing more stringent emissions standards, requiring higher fuel efficiency and/or banning sales of gas-powered vehicles in the future. Such responses may generate or accelerate changes in technology and in customer and end-user preference, including wider adoption of, and preference for, technologies providing alternatives to diesel engines, such as electrification of equipment, which could reduce or eliminate the demand for our products.
For example, Cummins, our largest customer, has established 2030 environmental sustainability goals to, among other things, reduce its Scope 3 absolute lifetime GHG emissions from newly sold products, and partner with its customers to reduce its indirect GHG emissions from its products. These goals may result in Cummins preferring products that reduce its direct and/or indirect GHG emissions. As a result of these risks, and as we have seen OEMs begin to invest in these new technologies and launch new non internal combustion engines, we have been working, and continue to work, to expand our product offerings across industries and application types. However, there can be no assurance that we will be successful in doing so, or even if we are successful, that such new products will generate the same revenue or margin as internal combustion engine filtration products. Some of these technologies, such as battery electric vehicles, may not utilize as much filtration content. Additionally, there can be no assurance that our expectations regarding new and developing alternate fuel technologies, including with respect to which technologies will prevail and the development of filtration
content for those technologies, will prove to be accurate. Such disruptive innovation could create new markets for others and displace existing companies and products. If we are unsuccessful in adapting our technologies or expanding into adjacent markets, these disruptions could result in significant negative consequences for us. Our future growth is dependent on properly addressing future customer and end-user needs and adapting our products in line with global technology trends.
Our ability to attract and retain qualified personnel is critical to our success.
Our success depends on the skills, institutional knowledge, working relationships and continued services and contributions of qualified personnel, including our executive leadership team. Our ability to achieve our operating and strategic goals depends on our ability to identify, hire, train and retain qualified individuals and successfully execute management transitions at leadership levels of the Company. We compete with other companies, both within and outside of our industry, for talented personnel and we may lose key personnel or fail to attract, train and retain other talented personnel. Any such loss or failure could have material adverse effects on our business, financial condition, results of operations or cash flows.
Our continued success will depend in part on our ability to retain the talents and dedication of technical employees. As of December 31, 2025, we employed approximately 355 total technical employees and 51% of our technical employees were employed outside the United States, in India, China and France. If enough technical employees terminate their employment or become ill or otherwise cannot work, our business activities may be adversely affected and our management team’s attention may be diverted. In addition, we may not be able to locate suitable replacements for any technical employees who leave.
We face risks from strategic transactions, such as acquisitions, divestitures, joint ventures and other similar arrangements that we may pursue or undertake.
We are actively evaluating potential strategic acquisitions or investment opportunities and consider divestitures of non-strategic business lines, and we have historically pursued and undertaken certain of those opportunities. For instance, in 2026 we closed the acquisition of a business in the industrial filtration market and in 1987 and 1994, we established our joint ventures in India and China, respectively, for our entry into those two markets. Acquisitions, joint ventures and strategic investments could negatively impact our profitability and financial condition due to operating and integration inefficiencies, the incurrence of debt, contingent liabilities and amortization of expenses related to intangible assets. There are also a number of other risks inherent to acquisitions, including the potential loss of key customers and suppliers of the acquired businesses or adverse effects on relationships with existing customers and suppliers; the inability to identify all issues or potential liabilities during due diligence; difficulties or delays in integrating and assimilating the acquired operations and products or in realizing projected efficiencies, growth prospects, cost savings and synergies; the loss of key employees; the potential increase in exposure to more onerous or costly legal and regulatory requirements and the diversion of management’s time and attention away from other business matters, which may prevent us from realizing the anticipated return on our investment. Additionally, we may require substantial additional capital, which could be raised pursuant to debt or equity financings, to pursue acquisitions and other business ventures, if any, in the future. We cannot assure you that we will be able to raise such additional capital on commercially reasonable terms, or at all.
Divestitures may involve significant challenges and risks, such as difficulty separating out portions of our business or the potential loss of revenue or negative impacts on margins. Divestitures may also result in ongoing financial or legal proceedings, such as retained liabilities, which could have an adverse impact on our business, financial condition, results of operations and cash flows. Further, during the pendency of a proposed transaction, we may be subject to risks related to a decline in the business, loss of employees, customers or suppliers and the risk that the transaction may not close, any of which could adversely impact our business. Additionally, because acquisitions, divestitures, joint ventures, strategic partnerships and other similar arrangements are inherently risky, any such transaction may not be successful and may, in some cases, harm our business, financial condition, results of operations or cash flows. Failure to complete any such planned transaction may adversely impact our business, financial condition, results of operations or cash flows.
Our long term performance targets assume certain ongoing productivity improvements; if we do not successfully manage productivity improvements, we may not realize the expected benefits.
Our long-term performance targets assume certain ongoing productivity improvements as a key component of our business strategy to, among other things, contain operating expenses, increase operating efficiencies
and align manufacturing capacity to demand. We may not be able to realize the expected benefits and cost savings if we do not successfully execute these plans while continuing to invest in business growth. Factors that can cause us to not realize expected benefits or execute our plans for productivity improvements include, but are not limited to unforeseen complications arising from leveraging existing filtration technology to new industries, global commodities pricing and availability, manufacturing costs and delays, inflationary pressures and labor availability. If any of these, or other, difficulties are encountered, expected benefits of such cost savings may not otherwise be realized, which could adversely impact our business, financial condition, results of operations or cash flows.
We may be adversely impacted by work stoppages and other labor matters.
As of December 31, 2025, we employed approximately 4,500 persons worldwide and approximately 53% were represented by various unions under collective bargaining agreements. Agreements covering employees in Mexico, Brazil and France are renewed annually following compensation negotiations, which were recently completed for Mexico and Brazil and will begin in February 2026 for Brazil, with terms expiring between December 2026 and February 2027. The collective bargaining agreement for our Cookeville, Tennessee plant was renegotiated in February 2024 and will remain in effect through February 29, 2028. While we have no reason to believe that we will be materially impacted by work stoppages or other labor matters, we have experienced such issues and there can be no assurance that future issues with our labor unions will be resolved favorably or that we will not encounter future strikes, work stoppages, or other types of conflicts with labor unions or our employees. Any of these consequences may have an adverse effect on us or may limit our flexibility in dealing with our workforce. In addition, many of our customers and suppliers have unionized work forces. Work stoppages or slowdowns experienced by us, our customers or suppliers could result in slowdowns or closures that would have a material adverse effect on our business, financial condition, results of operations or cash flows.
Our products are exposed to variability in material and commodity costs.
Our business establishes prices with our customers in accordance with contractual timeframes; however, the timing of material and commodity market price increases may prevent us from passing these additional costs on to our customers through timely pricing actions, which may lead to an adverse impact on our profit margins. Additionally, higher material and commodity costs around the world may offset our efforts to reduce our cost structure. In recent years, economies around the world have also generally seen significant inflationary pressures. While those inflationary pressures have stabilized, we are still subject to the risk of material and commodity cost increases and there can be no assurances that such cost increases do not return. As of the date of this Annual Report on Form 10-K, we have not entered into any hedging arrangements or agreements with respect to the purchase of the commodities used in our products. While we customarily have contractual pricing adjustment mechanisms with our first-fit customers that attempt to address some of these risks (notably with respect to steel and resins), there can be no assurance that material and commodity price fluctuations will not adversely affect our business, financial condition, results of operations or cash flows. In addition, while the use of contractual pricing adjustments may provide us with some protection from adverse fluctuations in commodity prices, we potentially forego the benefits that might result from favorable fluctuations in costs. As a result, higher material and commodity costs could result in declining margins.
Interruptions in the supply of critical materials and components could materially and adversely affect our business.
We source a significant number of parts and raw materials critical to our business operations. Any delay in our suppliers’ deliveries may adversely affect our operations at multiple manufacturing locations, forcing us to seek alternative supply sources to avoid serious disruptions. Delays may be caused by factors affecting our suppliers (including pandemics, capacity constraints, port congestion, labor disputes, economic downturns, availability of credit, impaired financial condition and geopolitical turmoil), suppliers’ allocations to other purchasers, weather emergencies, natural disasters, acts of government or acts of war or terrorism. In particular, if there are extended periods of commercial, transportation or other restrictions we could incur global supply disruptions. Any extended delay in receiving critical supplies could impair our ability to deliver products to our customers and have a material adverse effect on our business, financial condition, results of operations or cash flows.
Complexity of supply chain and manufacturing could perpetuate the inability to meet demand and result in the loss of customers.
Our ability to fulfill customer orders is dependent on our manufacturing and distribution operations. Although we forecast demand, additional plant capacity takes significant time to bring online and thus changes in demand could result in longer lead times. We cannot guarantee that we will be able to adjust manufacturing capacity, in the short-term, to meet higher customer demand. Efficient operations require streamlining processes, which we may not be capable of achieving. Unacceptable levels of service for key customers may result if we are not able to fulfill orders on a timely basis or if product quality, warranty, or safety issues result from compromised production. Due to the complexity of our manufacturing operations, we may be unable to timely respond to fluctuations in demand, which could adversely impact our business, financial condition, results of operations or cash flows.
A number of our customers operate in similar cyclical industries and economic conditions in these industries could impact our sales.
A substantial portion of our sales is tied to customers that serve highly cyclical end markets, including on‑highway and off‑highway industries such as truck and bus, construction, agriculture, mining, oil and gas, power generation and recreational vehicles. Demand in these industries is affected by macroeconomic factors such as freight activity, infrastructure investment, commodity prices, and interest rates. As these industries experience fluctuations, our customers’ production schedules and purchasing patterns may vary significantly, which exposes our business to additional risk based on the economic conditions in the markets our customers serve. Any downturn or prolonged softness in the industries in which our customers operate could reduce demand for our products and materially and adversely impact our business, financial condition, results of operations or cash flows.
Our business is exposed to potential claims related to warranties and claims for support outside of standard warranty obligations.
We face an inherent business risk of exposure to warranty claims if our products fail to perform to specification, or are alleged to result in property damage. At any given time, we are subject to various and multiple warranty claims, any one of which, if decided adversely to us, may have a material adverse effect on our business, financial condition, results of operations and cash flows in the period in which our liability with respect to any such claim is recognized. This can include customer claims for support outside of standard warranty obligations.
Our products are subject to recall for performance or safety-related issues.
Our products are subject to recall for performance or safety-related issues. Product recalls subject us to reputational risk, loss of current and future customers, reduced revenue and product recall costs. Product recall costs are incurred when we decide, either voluntarily or involuntarily, to recall a product through a formal campaign to solicit the return of specific products due to known or suspected performance or safety issues. Any significant product recalls could have material adverse effects on our business, financial condition, results of operations and cash flows. Additionally, any significant returns or warranty claims, as well as the timing of such returns or claims, could result in significant additional costs to us and could adversely affect our business, financial condition, results of operations or cash flows.
Inability or failure to adequately protect or enforce our intellectual property could reduce or eliminate any competitive advantage and reduce our sales and profitability and the cost of protecting or enforcing our intellectual property may be significant.
Our long-term success depends on our ability to market innovative competitive products. We own a number of patents, trade secrets, copyrights, trademarks, trade names and other forms of intellectual property related to our products and services throughout the world and the operation of our business, on which we rely to distinguish our services and solutions from those of our competitors. Patents have a limited life and, in some cases, have expired or will expire in the near future. We also have non-exclusive rights to intellectual property owned by others in certain of our markets. For example, some of our products may include components that are manufactured by our competitors. Our intellectual property may be challenged, opposed, invalidated, diluted, cancelled, declared generic, stolen, circumvented, infringed or otherwise violated upon by third parties or we may be unable to maintain, renew or enter into new license agreements with third-party owners of intellectual
property on reasonable terms, or at all. In addition, the global nature of our business increases the risk that our intellectual property may be subject to infringement, theft or other unauthorized use or disclosure by others. Our ability to protect and enforce intellectual property rights, including through litigation or other legal proceedings, also varies across jurisdictions. In some cases, our ability to protect or enforce our intellectual property rights by legal recourse or otherwise may be limited, particularly in countries where laws or enforcement practices are less protective than those in the United States. Our inability to obtain sufficient protection for our intellectual property, or to effectively maintain or enforce our intellectual property rights, could lead to reputational harm and/or adversely impact our competitive position, business, financial condition, results of operations or cash flows.
Competitors and others may also initiate litigation or other proceedings to challenge the scope, validity or enforceability of our intellectual property or allege that we infringed, misappropriated or otherwise violated their intellectual property. Any litigation or proceedings to defend us against allegations of infringement, misappropriation, or other violations of intellectual property rights, regardless of merit, could be costly, divert attention of management and may not ultimately be resolved in our favor. If we are unable to successfully defend against claims that we have infringed the intellectual property rights of others, we may be prevented from using certain intellectual property or offering certain products, or may be liable for substantial damages. We may also be required to develop an alternative, non-infringing product that could be costly, time-consuming or impossible, or seek a license from a third party, which may not be available on terms that are favorable to us, or at all. Any of the foregoing could have a material adverse effect on our business, financial condition, results of operations or cash flows.
Unexpected events, including natural disasters, may increase our cost of doing business or disrupt our operations.
There could be an occurrence of one or more unexpected events, including a terrorist attack, war or civil unrest, a weather event, an earthquake, a pandemic, cyber-attack or other catastrophe in countries in which we operate.
Such an event could result in physical damage to and complete or partial closure of one or more of our headquarters, manufacturing facilities or distribution centers, as well as disruptions to the transport of our products to customers and to our information systems. The insurance coverage we maintain, may not provide protection for all costs that may arise from any such event. Any disruption in our operations could have an adverse impact on our ability to meet customer needs or require us to incur additional expenses to produce sufficient inventory. Certain unexpected events could adversely impact our business, financial condition, results of operations or cash flows.
Risks Related to Legal and Regulatory Issues
Sales of counterfeit versions of our products, as well as unauthorized sales of our products, may adversely affect our business, financial condition, results of operations or cash flows.
Third parties may illegally make, distribute and sell counterfeit versions of our products that do not meet the standards of our design, development, manufacturing and distribution processes. Such counterfeit products divert sales from genuine products, often are of lower cost and quality and may pose safety risks. If illegal sales of counterfeit products result in adverse product liability or negative consumer experiences, we may be associated with negative publicity resulting from such incidents. Although we proactively monitor the existence of counterfeit products and initiate actions to seize, remove them from sale or destroy, we may not be able to prevent third parties from manufacturing, selling or purporting to sell counterfeit products competing with our products, which may negatively impact our sales, brand reputation, business, financial condition, results of operations or cash flows.
Our products are subject to statutory and regulatory requirements that can significantly increase our costs and could have a material adverse impact on our business, financial condition, results of operations or cash flows.
Our products are subject to many laws and regulations in the jurisdictions in which we operate. We routinely incur costs to comply with these laws and regulations. We may be adversely impacted by new or changing laws and regulations that affect both our operations and our ability to develop and sell products that meet our
customers’ requirements. The discovery of noncompliance issues could have a material adverse impact on our reputation, brand, business, financial condition, results of operations or cash flows.
Developing products to meet more stringent and changing regulatory requirements, with different implementation timelines and requirements, makes developing products efficiently for multiple markets complicated and could result in substantial additional costs that may be difficult to recover in certain markets. The successful development and introduction of new and enhanced products in order to comply with new regulatory requirements are subject to other risks, such as delays in product development, cost overruns and unanticipated technical and manufacturing difficulties.
In addition to these risks, the nature and timing of government implementation and enforcement of increasingly stringent regulatory standards in our worldwide markets are unpredictable and subject to change. Any delays in implementation or enforcement could result in a loss of our competitive advantage and could have a material adverse impact on our business, financial condition, results of operations or cash flows.
We operate our business on a global basis and changes in international, national and regional trade laws, regulations, and policies affecting and/or restricting international trade could adversely impact the demand for our products and our competitive position.
We manufacture, sell and service products globally and rely upon a global supply chain to deliver the raw materials, components, systems and parts that we need to manufacture and service our products. Changes in laws, regulations and government policies on foreign trade and investment, including as a result of changes in U.S. presidential administration, can affect the demand for our products and services, causing customers and end-users to shift preferences toward domestically manufactured or branded products and impact the competitive position of our products or prevent us from being able to sell products in certain countries. Our business benefits from free trade agreements, such as the United States-Mexico-Canada Agreement, the U.S. trade relationships with China, Brazil and France and the Comprehensive Economic Partnership Agreement between India and South Korea. Efforts to withdraw from, or substantially modify such agreements or arrangements, in addition to the implementation of more restrictive trade policies, such as more detailed inspections, higher tariffs (including, but not limited to, additional tariffs on the import of steel or aluminum and imposition of new or retaliatory tariffs against certain countries, including based on developments in U.S.-China, U.S.-Mexico, U.S.-Canada, U.S.-Russia and EU-Russia relations), import or export licensing requirements, and exchange controls or new barriers to entry, could limit our ability to capitalize on current and future growth opportunities in international markets, impair our ability to ship media from our plant in South Korea directly to our joint venture partners, impair our ability to expand the business by offering new technologies, products, and services, and could adversely impact our production costs, customer and end-user demand and our relationships with customers and suppliers. Any of these consequences could have a material adverse effect on our business, financial condition, results of operations or cash flows.
Embargoes, sanctions and export controls imposed by the U.S. and other governments restricting or prohibiting transactions with certain persons or entities, including financial institutions, to certain countries or regions, or involving certain products, may limit the sales of our products. Embargoes, sanctions, and export control laws are changing rapidly for certain geographies, including with respect to China and Russia. In particular, changing U.S. and European export controls and sanctions on China, as well as other restrictions affecting transactions involving China and Chinese parties and Russia and Russian parties, could affect our ability to collect receivables, provide aftermarket and warranty support for our products, sell products, and otherwise impact our reputation and business, any of which could have a material adverse effect on our business, financial condition, results of operations or cash flows. Moreover, the enforceability of contracts in China, especially with governmental entities, including state-owned enterprises, is relatively uncertain. If counterparties repudiated our contracts or defaulted on their obligations, we might not have adequate remedies. Such uncertainties or inability to enforce our contracts could materially and adversely affect our business, financial condition, results of operations or cash flows.
Unanticipated changes in our effective tax rate, the adoption of new tax legislation or exposure to additional income tax liabilities could adversely affect our profitability and cash flow. In addition, audits by tax authorities could result in additional tax payments for prior periods.
We are subject to income taxes in the U.S. and numerous international jurisdictions. Our income tax provision and cash tax liability in the future could be adversely affected by the adoption of new tax legislation,
changes in the amounts or composition of earnings in countries with differing statutory tax rates, changes in the valuation of deferred tax assets and liabilities and the discovery of new information in the course of our tax return preparation process. Additionally, we have been subject to tax audits. These audits can involve complex issues, which may require an extended period of time to resolve and can be highly judgmental. Tax authorities may disagree with certain tax reporting positions taken by us and, as a result, assess additional taxes against us. We may have to engage in litigation to achieve the results reflected in our tax estimates, and such litigation may be time consuming and expensive. We regularly assess the likely outcomes of any audits in order to determine the appropriateness of our tax provision. The amounts ultimately paid upon resolution of these or subsequent tax audits could be materially different from the amounts previously included in our income tax provisions and accruals, which could materially and adversely affect our business, financial condition, results of operations or cash flows.
Changes in tax law relating to multinational corporations could adversely affect our tax position.
The U.S. Congress, government agencies in non-U.S. jurisdictions where we and our affiliates do business, and the Organisation for Economic Co-operation and Development (“OECD”) have recently focused on issues related to the taxation of multinational corporations. One example is in the area of “base erosion and profit shifting,” where profits are claimed to be earned for tax purposes in low-tax jurisdictions, or payments are made between affiliates from a jurisdiction with high tax rates to a jurisdiction with lower tax rates. The OECD has released several components of its comprehensive plan to create an agreed set of international rules for addressing base erosion and profit shifting. As a result, the tax laws in the United States and other countries in which we do business could change on a prospective or retroactive basis, including as a result of the recent change in U.S. presidential administration, and any such changes could adversely affect our business, financial condition, results of operations or cash flows.
Our global operations are subject to laws and regulations that impose significant compliance costs and create reputational and legal risk.
Due to the international scope of our operations, we are subject to a complex system of commercial regulations around the world. Recent years have seen an increase in the development and enforcement of laws regarding trade compliance, as well as new regulatory requirements regarding privacy and data protection, such as the European Union General Data Protection Regulation. For example, in January 2024, the Tax Administration Service in Mexico amended the customs requirements for transactions between a maquiladora in Mexico shipping its manufactured goods to a domestic Mexican company resulting in increased costs for our Mexican operations. Our foreign subsidiaries and affiliates are governed by laws, rules and business practices that differ from those of the U.S. The activities of these entities may not comply with U.S. laws or business practices or our Code of Business Conduct. Violations of these laws may result in severe criminal or civil sanctions, could disrupt our business and result in an adverse effect on our reputation, business, financial condition, results of operations or cash flows. We cannot predict the nature, scope or effect of future regulatory requirements, or the ability to obtain any government certification or permit pursuant to any regulatory requirement, to which our operations might be subject or the manner in which existing laws might be administered or interpreted.
We are subject to national and international anti-corruption laws and regulations laws, such as the U.S. Foreign Corrupt Practices Act (“FCPA”), the U.K. Bribery Act (the “Bribery Act”) and export controls and economic sanctions programs, including those administered by the U.S. Treasury Department’s Office of Foreign Assets Control (“OFAC”), relating to our business and our employees. As part of our business, we deal with state-owned business enterprises, the employees of which are considered foreign officials for purposes of the FCPA’s prohibition on providing anything of value to foreign officials for the purposes of obtaining or retaining business or securing any improper business advantage. In addition, the provisions of the Bribery Act extend beyond bribery of foreign public officials and also apply to transactions with individuals that a government does not employ. Some of the international locations in which we operate lack a developed legal system and have higher than normal levels of corruption.
Our continued expansion outside the United States, including in China, India and developing countries, and our development of new partnerships worldwide, could increase the risk of FCPA, OFAC or Bribery Act violations in the future. Despite our policies, procedures and compliance programs, our internal control and compliance systems may not be able to protect from prohibited acts willfully committed by our employees, agents or business partners that would violate such applicable laws and regulations. Additionally, there can be
no assurance that our policies and procedures will effectively prevent us from violating these regulations in every transaction in which we may engage or provide a defense to any alleged violation. For example, actions taken by OFAC in response to the Russia-Ukraine War have included the imposition of export controls and broad financial and economic sanctions against Russia, Belarus and specific areas of Ukraine. Any violation or alleged violation of these laws and regulations, even if prohibited by our policies, could result in criminal or civil sanctions, reputational damage or other substantial costs and penalties, any of which could adversely affect our business, financial condition, results of operations or cash flows. In particular, we may be held liable for actions that our joint venture partners take inside or outside of the United States, even though our partners may not be subject to these laws. Any such improper acts could damage our reputation, subject us to civil or criminal judgments, fines or penalties, and could otherwise disrupt our business.
Our operations are also subject to certain antitrust and competition laws in the jurisdictions in which we conduct our business, in particular the United States and Europe. These laws prohibit, among other things, anticompetitive agreements and practices. If any of our commercial agreements or practices are found to violate or infringe such laws, we may be subject to civil and other penalties. We may also be subject to third-party claims for damages. Further, agreements that infringe antitrust and competition laws may be void and unenforceable, in whole or in part, or require modification in order to be lawful and enforceable. Accordingly, any violation of these laws could harm our reputation and could have a material adverse effect on our business, financial condition, results of operations or cash flows.
From time to time, we are subject to litigation or other commercial disputes and other legal and regulatory proceedings relating to our business, including actual or perceived failure to comply with the laws and regulations mentioned above. Due to the inherent uncertainties of any litigation, commercial disputes or other legal or regulatory proceedings, we cannot accurately predict their ultimate outcome, including the outcome of any related appeals. An unfavorable outcome could materially adversely impact our business, financial condition, results of operations or cash flows. Furthermore, as required by U.S. GAAP, we establish reserves based on our assessment of contingencies, including contingencies related to legal claims asserted against us. Subsequent developments in legal proceedings may affect our assessment and estimates of the loss contingency recorded as a reserve and require us to make payments in excess of our reserves, which could have an adverse effect on our business, financial condition, results of operations or cash flows.
We may be adversely impacted by the effects of climate change and may incur increased costs and experience other impacts due to climate change.
The scientific consensus indicates that emissions of GHG continue to alter the composition of Earth’s atmosphere in ways that are affecting, and are expected to continue to affect, the global climate. The potential impacts of climate change on our customers and end-users, product offerings, operations, facilities and suppliers are accelerating and uncertain, as they will be particular to local, customer-specific circumstances. These potential impacts may include, among other things, rising sea levels and the frequency and severity of weather events as well as customer and end-user product changes either through preference or regulation.
Concerns regarding climate change may lead to additional international, national, regional and local legislative and regulatory responses. For example, enhanced mandatory climate reporting requirements came into force in 2019 and again in 2022 in the United Kingdom and broader sustainability reporting requirements (including climate) will apply to certain European Union entities on a staged basis from 2024 and to their non-European Union parent undertakings from 2028. We believe these reporting requirements could increase our reporting and compliance costs. Various stakeholders, including legislators and regulators, shareholders and non-governmental organizations, are continuing to look for ways to reduce GHG emissions, including limits on GHG emissions, bans on future sales of gas-powered vehicles, and measures intended to incentivize GHG reduction such as fuel taxes, carbon taxes and subsidies. As the impact of any future GHG legislative or regulatory requirements on our global businesses and products is dependent on the timing, scope and design of the mandates or standards, we are currently unable to predict the potential impact. Moreover, as discussed in “— Risks Related to our Business Operations — Evolving customer needs and developing technologies may threaten our existing business and growth”, certain consequences of climate change, such as shifts in customer and end-user preferences and the pace and extent to which customers and end-users adopt alternative power, including electrified vehicles, could impact demand for our products and could have a material adverse effect on our business, financial condition, results of operations or cash flows.
Our operations are subject to increasingly stringent environmental laws and regulations, and we are also subject to laws requiring cleanup of contaminated property.
Our plants and operations are subject to increasingly stringent environmental laws and regulations in all of the countries in which we operate, including laws and regulations governing air emissions, wastewater and storm water discharges and the generation, handling, storage, transportation, treatment and disposal of waste materials. While we believe that we are in compliance in all material respects with these environmental laws and regulations, there can be no assurance that we will not be adversely impacted by costs, liabilities or claims with respect to existing or subsequently acquired operations, under either present laws and regulations or those that may be adopted or imposed in the future. We are also subject to laws requiring the cleanup of contaminated property, including laws that impose strict liability for contamination at owned property and for hazardous materials or wastes generated by our plants and operations or those of our predecessors. If a release of hazardous substances occurs at or from any of our (or our predecessors’) current or former properties or at a landfill or another location where we or our predecessors have disposed of (or arranged for the disposal of) hazardous materials, we may be held liable for the contamination and the amount of such liability could be material. We may become subject to additional evolving regulations related to the cleanup of contaminated property.
Risks Related to Cybersecurity and Information Technology Infrastructure
Our information technology environment and our products are exposed to potential security or data breaches or other disruptions, which may adversely impact our operations.
We rely on the capacity, reliability and security of our information technology environment and data security infrastructure in connection with various aspects of our business activities. We also rely on our ability to expand and continually update these technologies and related infrastructure in response to the changing needs of our business. As we implement new technologies, they may not perform as expected. We face the challenge of supporting our older technologies and implementing necessary upgrades. In addition, some of these technologies are managed by third-party service providers and are not under our direct control. If we experience a problem with an important technology, including during upgrades and/or new implementations of technologies, the resulting disruptions could have an adverse effect on our business and reputation. As customers and end-users adopt and rely on cloud-based digital technologies and services we offer, any disruption of the confidentiality, integrity or availability of those services could have an adverse effect on our business and reputation.
Our operations routinely involve collecting, receiving, storing, processing and transmitting personal, sensitive and other confidential information pertaining to our business, customers, end-users, dealers, suppliers, employees and other sensitive matters. The data handled by our technologies is vulnerable to security threats. In addition, our products contain interconnected and increasingly complex technologies that monitor and transmit data and these technologies are potentially subject to cyber-attacks and disruption. For example, we have developed the filtration intelligence technology (FIT) system, which embeds sensors and software within the filtration equipment system designed to optimize filtration maintenance and monitor equipment health. In addition, we provide opportunities for remote working to our employees, which may pose additional information technology risks. The impact of a significant information technology event on either our information technology environment or our products could negatively affect the performance of our products, our reputation, and competitive position.
While we continually work to safeguard our information technology environment and mitigate potential risks, there is no assurance that these actions will be sufficient to timely detect or prevent information technology security threats, such as security breaches, computer malware, ransomware attacks and other cyber-attacks, which are increasing in both frequency and sophistication, along with power outages or hardware failures. These threats could result in unauthorized access, use, modification, disclosure, loss or theft of information, including intellectual property, costly investigations, remediation efforts, notification requirements, privacy or data protection-related compliance obligations, legal claims or proceedings, government enforcement actions, civil or criminal penalties, fines, diversion of management attention, operational changes or other response measures, loss of customer confidence in our security measures, loss of business partners, and negative publicity that could adversely affect our brand, reputation, business, financial condition, results of operations or cash flows. Our cyber insurance policies may not cover, or may cover only a portion of, any potential claims related to such events or may not be adequate to indemnify us for all or any portion of liabilities that may be
imposed or defense costs incurred. We also cannot be certain that we will be able to maintain insurance coverage, on acceptable terms or in amounts sufficient to cover the potentially significant losses that may result from a security incident or breach, or that the insurer will not deny coverage of any future claim.
In addition, data we collect, store and process are subject to a variety of U.S. and international laws and regulations, such as the European Union's General Data Protection Regulation, which may carry significant potential penalties for noncompliance.
A number of our operations depend on information technology infrastructure and assets that are increasing in complexity, which are undergoing changes as a result of the Separation.
In order to support the new business processes under the terms of our transition services agreement with Cummins, we made significant configuration, process and data changes within many of the information technology systems that we use. If our information technology systems and processes were not sufficient to support our business and financial reporting functions, or if we failed to properly implement our new business processes, manufacturing, shipping, invoicing or other critical operating activities may be interrupted or negatively affected, and our financial reporting may be delayed or inaccurate and, as a result, our business, financial condition, results of operations or cash flows may be materially adversely affected. Even if we were able to successfully configure and change our systems, all technology systems, even with implementation of security measures, are vulnerable to disability, failures or unauthorized access. If our information technology systems were to fail or be breached, this could materially adversely affect our reputation and our ability to perform critical business functions, and sensitive and confidential data could be compromised.
Risks Related to Finance and Financial Market Conditions
We are subject to foreign currency exchange rate and other related risks.
We conduct operations in many areas of the world involving transactions denominated in a variety of currencies. We are subject to foreign currency exchange rate risk to the extent that our costs are denominated in currencies other than those in which we earn revenues. In addition, since our financial statements are denominated in U.S. dollars, changes in foreign currency exchange rates between the U.S. dollar and other currencies have had, and will continue to have, an impact on our business, financial condition, results of operations or cash flows. For example, 37% of our net sales in 2025 were denominated in a currency other than the U.S. dollar. Additionally, the appreciation of the U.S. dollar against foreign currencies has had and could continue to have a negative impact on our consolidated results of operations due to translation impacts. We currently manage exchange rate and other related risks through the selective use of derivatives, but there can be no assurance that fluctuations in exchange rates and other related risks will not have a material adverse effect upon our business, financial condition, results of operations or cash flows.
We have recorded goodwill as a result of prior acquisitions, and an economic downturn could cause these balances to become impaired, requiring write-downs that would reduce our operating income.
Goodwill amounted to approximately $84.7 million as of December 31, 2025. As required under current accounting rules, we assess goodwill for impairment at least annually and whenever changes in circumstances indicate that the carrying amount may not be recoverable from estimated future cash flows. As of December 31, 2025, management has deemed there is no impairment of our recorded goodwill. However, if future operating performance at one or more of our operating units were to fall significantly below forecast levels or if market conditions for one or more of our acquired businesses were to decline, we could be required to incur a non-cash charge to operating income for impairment. Management will continue to monitor our operating results, our market capitalization, and the impact of the economy to determine if there is an impairment of goodwill in future periods.
Risks Related to Macroeconomic and Geopolitical Conditions
Increased tariffs or the imposition of other barriers to international trade could impact the cost of our products, demand for our products and our competitive position.
Changes to trade protection measures and import or export licensing requirements; the imposition of new, additional, or retaliatory tariffs, quotas, exchange controls, sanctions, trade barriers or other restrictions; and the withdrawal from or modification of trade agreements or the negotiation of new trade agreements, in countries
where we operate, particularly in Mexico, Canada, China, and India, could impact the cost of our products, demand for our products and the competitive position of our products. Our largest global manufacturing facility is in San Luis Potosi, Mexico, and it supplies products to our U.S. and global markets. There can be no assurance that the consequences of these actions, given our global operations, will not have a material adverse effect upon our business, financial condition, results of operations or cash flows.
For example, since February 2025, the U.S. presidential administration has announced new and substantial tariff increases on imports to the United States from China, Mexico, Canada and India. Since then, various modifications and delays to these tariffs have been implemented, with further changes anticipated. These modifications include additional sector-specific tariffs or other measures. These actions have prompted a variety of tariff responses by countries, which have the potential to affect our business. Several tariff announcements have been followed by announcements of temporary pauses and limited exemptions, such as the temporary exemption for goods that enter the U.S. as qualifying goods under the United States-Mexico-Canada Agreement (“USMCA”), for which the majority of our products from Mexico for the U.S. market are certified compliant, or expected to be certified compliant. These temporary exemptions, including those we are availing ourselves to under the USMCA, may be reduced or eliminated in the future. The ongoing trade disputes associated with these tariff measures and the potential escalation of trade disputes would pose a significant risk to our business and would affect our revenue and cost of goods sold. For instance, we have raised the prices of certain of our products in response to cost increases we have incurred on purchases of finished and other goods and some raw materials due to tariffs. The extent and duration of the tariffs and the resulting impact on general economic conditions and our business are uncertain and depend on various factors, such as negotiations between the U.S. and affected countries, the responses of other countries or regions, exemptions or exclusions that may be granted, availability and cost of alternative sources of supply, and demand for our products in affected markets. Further, actions we take to adapt to new tariffs or trade restrictions, including raising the prices of our products or shifting supply sourcing or production locations, may cause us to modify our operations, lose customers, experience increased costs, or forgo business opportunities.
Political, economic and social uncertainty in geographies where we have significant operations or large offerings of our products could significantly change the dynamics of our competition, customer and end-user base and product offerings and impact our growth opportunities globally.
Our business is subject to the political, economic and other risks that are inherent in operating in numerous countries, including:
•public health crises, including the spread of a contagious disease and other catastrophic events;
•the difficulty of enforcing agreements and collecting receivables through foreign legal systems;
•the imposition of taxes on foreign income and tax rates in certain foreign countries that exceed those in the U.S.;
•difficulty in staffing and managing widespread operations and the application of foreign labor regulations;
•required compliance with a variety of foreign laws and regulations; and
•changes in general economic and political conditions, including changes in relationship with the U.S. in countries where we operate, particularly in Mexico, Canada, China, India and other emerging markets.
As we continue to operate and grow our business globally, our success will depend, in part, on our ability to anticipate and effectively manage these and other related risks. There can be no assurance that the consequences of these and other factors relating to our multinational operations will not have a material adverse effect upon our business, financial condition, results of operations or cash flows.
Risks arising from uncertainty in worldwide and regional market and economic conditions may harm our business and make it difficult to project long-term performance.
Our business is sensitive to global macroeconomic conditions. Future macroeconomic downturns may have an adverse effect on our business, financial condition, results of operations or cash flows, as well as on our distributors, customers, end-users and suppliers, and on activity in many of the industries and markets we
serve. Among the economic factors which may have such an effect are: public health crises such as pandemics and epidemics, currency exchange rates, difficulties entering new markets, tariffs and governmental trade and monetary policies, and general economic conditions such as inflation, deflation, interest rates and credit availability.
In addition, we face several risks associated with international business and are subject to global events beyond our control, including war, trade disputes, economic sanctions, trade wars and their collateral impacts and other international events. Any of these events could have a material adverse effect on our reputation, business, financial condition, results of operations or cash flows. There may be changes to our business if there is instability, disruption or destruction in a significant geographic region, regardless of cause, including war, terrorism, riot, civil insurrection or social unrest; and natural or man-made disasters, including famine, flood, fire, earthquake, storm or disease.
Risks Related to our Relationship with Cummins
We, or Cummins, may fail to perform under various transaction agreements that were executed as part of the IPO.
The separation agreement and other agreements executed in connection with the IPO determined the allocation of assets and liabilities between Cummins and us following the IPO for those respective areas and include certain indemnifications related to liabilities and obligations. We will rely on Cummins to satisfy Cummins’ performance and payment obligations under these agreements. If Cummins is unable to satisfy its obligations under these agreements, including its indemnification obligations, we could incur operational difficulties or losses that could have an adverse effect on our business, financial condition, results of operations or cash flows.
We may have received better terms from unaffiliated third parties than the terms we received in our agreements with Cummins.
The agreements we entered with Cummins in connection with the separation, including the employee matters agreement, tax matters agreement, intellectual property license agreement, first-fit supply agreement, aftermarket supply agreement, and transitional trademark license agreement, were prepared in the context of our separation from Cummins while we were still a wholly-owned subsidiary of Cummins. Accordingly, during the period in which the terms of those agreements were prepared, we did not have an independent board of directors or a management team that was independent of Cummins. As a result, the terms of those agreements may not reflect terms that would have resulted from arm’s-length negotiations between unaffiliated third parties. Arm’s-length negotiations between Cummins and an unaffiliated third party in another form of transaction, such as a buyer in a sale of a business transaction, may have resulted in more favorable terms to the unaffiliated third party.
Risks Related to our Capital Structure
Changes in the capital and credit markets may negatively affect our ability to access financing to support strategic initiatives.
Disruption of the global financial and credit markets may have an effect on our long-term liquidity and financial condition. Our operations, investment opportunities, access to capital and ability to enforce the obligations of counterparties may be adversely affected by disruptions to the banking system and other financial market volatility. There can be no assurance that the cost or availability of future borrowings will not be impacted by future capital market disruptions. Our term loan agreement and revolving credit facility each contain covenants to maintain certain financial ratios that, under certain circumstances, could restrict our ability to incur additional indebtedness, make investments and other restricted payments, create liens and sell assets.
We have substantial indebtedness and may incur substantial additional debt from time to time, which may impact our ability to service all our indebtedness and react to changes in our industry and limit our ability to seek further financing on favorable terms.
We have approximately $570.0 million of outstanding indebtedness consisting of proceeds of the term loan as of December 31, 2025. See “Description of Material Indebtedness of Atmus.”
Our ability to make scheduled payments on or refinance our debt obligations depends on our financial condition and operating performance, which are subject to prevailing economic and competitive conditions and to certain financial, business, legislative, regulatory and other factors beyond our control. We may be unable to maintain a level of cash flows from operating activities sufficient to permit us to pay the principal and interest on our indebtedness.
If our cash flows and capital resources are insufficient to fund our debt service obligations, we could face substantial liquidity problems and could be forced to reduce or delay investments and capital expenditures or to dispose of material assets or operations, alter our dividend policy, seek additional debt or equity capital or restructure or refinance our indebtedness. We may not be able to affect any such alternative measures on commercially reasonable terms or at all and, even if successful, those alternative actions may not allow us to meet our scheduled debt service obligations. The instruments that will govern our indebtedness may restrict our ability to dispose of assets and may restrict the use of proceeds from those dispositions and may also restrict our ability to raise debt or equity capital to be used to repay other indebtedness when it becomes due. We may not be able to consummate those dispositions or to obtain proceeds in an amount sufficient to meet any debt service obligations when due.
In addition, we conduct operations through our subsidiaries and joint ventures. Accordingly, repayment of our indebtedness will depend on the generation of cash flow by these entities, and their ability to make such cash available to us, by dividend, debt repayment or otherwise. These entities may not have any obligation to pay amounts due on our indebtedness or to make funds available for that purpose. These entities may not be able to, or may not be permitted to, make adequate distributions to enable us to make payments in respect of our indebtedness. Each of these entities is a distinct legal entity and, under certain circumstances, legal, tax and contractual restrictions may limit our ability to obtain cash from them. In the event that we do not receive distributions from these entities, we may be unable to make required principal and interest payments on our indebtedness.
Our inability to generate sufficient cash flows to satisfy our debt obligations, or to refinance our indebtedness on commercially reasonable terms or at all, may materially adversely affect our business, financial condition, results of operations and cash flows and our ability to satisfy our obligations under our indebtedness or pay dividends on our common stock.
We may incur substantial additional debt from time to time, including secured indebtedness, to finance working capital, capital expenditures, research and development, investments or acquisitions or for other purposes. If we do so, the risks related to our high level of debt could intensify. Specifically, our high level of debt could have important consequences, including:
•making it more difficult for us to satisfy our obligations with respect to our debt;
•limiting our ability to obtain additional financing to fund future working capital, capital expenditures, business development or other general corporate requirements, including dividends;
•increasing our vulnerability to general adverse economic and industry conditions;
•exposing us to the risk of increased interest rates as certain of our borrowings are and may in the future be at variable rates of interest;
•limiting our flexibility in planning for and reacting to changes in our industry;
•impacting our effective tax rate; and
•increasing our cost of borrowing.
Substantially all of our assets, subject to certain exceptions, are pledged as security for our term loan and revolving credit facility, and if we default on our obligations, we may suffer adverse consequences, including foreclosure on our assets.
In connection with the revolving credit facility and term loan, we signed a pledge and security agreement, whereby all of our assets, subject to certain exceptions, are pledged as collateral to secure borrowings thereunder. If we default on our obligations under such facilities, the lenders may have the right to foreclose
upon and sell, or otherwise transfer, the collateral subject to their security interests or their superior claim. In such event, we may be forced to sell our investments to raise funds to repay our outstanding borrowings in order to avoid foreclosure and these forced sales may be at times and at prices we would not consider advantageous. Moreover, such deleveraging of us could significantly impair our ability to effectively operate our business in the manner in which we intend to operate. As a result, we could be forced to curtail or cease new investment activities and lower or eliminate any dividends that we may pay to our shareholders in the future.
In addition, if the lenders exercise their right to sell the assets pledged under our secured credit facilities, such sales may be completed at distressed sale prices, thereby diminishing or potentially eliminating the amount of cash available to us after repayment of the amounts outstanding under such facilities.
Risks Related to Ownership of our Common Stock
The price of our common stock may fluctuate substantially, and you could lose all or part of your investment in our common stock as a result.
There may be wide fluctuations in the market value of our common stock as a result of many factors. Factors that may cause the market price of our common stock to fluctuate, some of which may be beyond our control, include:
•our quarterly or annual earnings, or those of other companies in our industry;
•actual or anticipated fluctuations in our operating results;
•changes in earnings estimated by securities analysts or our ability to meet those estimates;
•the operating and stock price performance of other comparable companies;
•changes to the regulatory and legal environment in which we operate;
•overall market fluctuations and domestic and worldwide economic conditions; and
•other factors described in these “Risk Factors” and elsewhere in this Annual Report on Form 10-K.
Stock markets in general have experienced volatility that has often been unrelated to the operating performance of a particular company. These broad market fluctuations may adversely affect the trading price of our common stock. In the past, following periods of volatility in the overall market and the market price of a company’s securities, securities class action litigation has often been instituted against these companies. Such litigation, if instituted against us, could result in substantial costs and a diversion of our management’s attention and resources.
Our stock repurchase program could affect the price of our common stock and may be suspended or terminated at any time, which may result in a decrease in the trading price of our common stock.
Our repurchase program does not have an expiration date and we are not obligated to repurchase a specified number or dollar value of shares. Further, our stock repurchase program may be suspended, delayed or discontinued at any time, which could cause the market price of our common stock to decline. Repurchases pursuant to our stock repurchase program could affect our stock price and the existence of our stock repurchase program could also cause our stock price to be higher than it would be in the absence of such a program. There can be no assurance that any stock repurchases will enhance shareholder value because the market price of our common stock may decline below the levels at which we repurchased shares of common stock.
We cannot guarantee the payment of dividends on our common stock, or the timing, or amount of any such dividends.
We have no obligation to continue paying a quarterly cash dividend to holders of our common stock, and our dividend policy may change at any time without notice to our shareholders. The payment of any dividends in the future to our shareholders, and the timing and amount thereof, will fall within the discretion of our board of directors. Our board of directors’ decisions regarding the payment of dividends will depend on many factors, such as our financial condition, earnings, capital requirements, debt service obligations, restrictive covenants in
the agreements governing our indebtedness, general economic business conditions, industry practice, legal requirements and other factors that our board of directors may deem relevant. Our ability to pay dividends will depend on our ongoing ability to generate cash from operations and on our access to the capital markets. We cannot assure you that we will pay our anticipated dividend in the same amount or frequency, or at all, in the future.
Applicable laws and regulations and provisions of our Charter and Bylaws may discourage takeover attempts and business combinations that shareholders might consider in their best interests.
Applicable laws and provisions of our Charter and Bylaws may delay, deter, prevent or render more difficult a takeover attempt that our shareholders might consider in their best interests. For example, they may prevent our shareholders from receiving the benefit from any premium to the market price of our common stock offered by a bidder in a takeover context. Even in the absence of a takeover attempt, the existence of these provisions may adversely affect the prevailing market price of our common stock if they are viewed as discouraging takeover attempts in the future.
Our Charter and Bylaws provide provisions that are intended to encourage prospective acquirers to negotiate with our board of directors and management team, rather than to attempt a hostile takeover, which could deter coercive takeover practices and inadequate takeover bids. These provisions provide for:
•advance notice requirements regarding how our shareholders may present proposals or nominate directors for election at shareholder meetings;
•the right of our board of directors to issue one or more series of preferred stock with such powers, rights and preferences as the board of directors shall determine; and
•the inability of shareholders to call special meetings of shareholders and the requirement that all shareholder action be taken at a meeting rather than by written consent.
Under the tax matters agreement with Cummins, we are subject to certain restrictions, including restrictions on our ability to enter into acquisition, merger, liquidation, sale and stock redemption transactions with respect to our stock. These restrictions may limit our ability to pursue certain strategic transactions or other transactions that it may believe to be in the best interests of our shareholders or that might increase the value of our business.
We are also subject to Section 203 of the Delaware General Corporation Law (the “DGCL”), an anti-takeover statute. In general, Section 203 of the DGCL prohibits a publicly held Delaware corporation from engaging in a “business combination” with an “interested stockholder” for a period of three years following the time the person became an interested stockholder.
These limitations may adversely affect the prevailing market price and market for our Common Stock if they are viewed as limiting the liquidity of our stock or discouraging takeover attempts in the future.
The provision of our Charter designating the Court of Chancery in the State of Delaware and the federal district courts for the District of Delaware as the exclusive forums for certain types of lawsuits may have the effect of discouraging lawsuits against our directors and officers.
Our Charter provides that, unless we consent in writing to the selection of an alternative forum, to the extent permitted by law, the Court of Chancery of the State of Delaware (or, if the Court of Chancery does not have jurisdiction, the federal district court for the District of Delaware) shall be the sole and exclusive forum for: (i) any derivative action or proceeding brought on behalf of us, (ii) any action asserting a claim of breach of fiduciary duty owed by any director, officer or other employee of us to us or our shareholders, (iii) any action arising pursuant to any provision of the DGCL, our Charter or our Bylaws or (iv) any action asserting a claim governed by the internal affairs doctrine. It further provides that, unless we consent in writing to the selection of an alternative forum, to the extent permitted by law, the federal district courts of the U.S. shall be the exclusive forum for the resolution of any complaint asserting a cause of action arising under the Securities Act of 1933, as amended (the “Securities Act”). The exclusive forum clauses described above shall not apply to suits brought to enforce a duty or liability created by the Securities Exchange Act of 1934, as amended (the “Exchange Act”) or any other claim for which the federal courts have exclusive jurisdiction. Any person or entity purchasing or
otherwise acquiring any interest in shares of our common stock will be deemed to have notice of, and consented to, the exclusive forum provisions in our Charter.
Although we believe these provisions benefit us by providing increased consistency in the application of applicable law in the types of lawsuits to which they apply, the provisions may have the effect of discouraging lawsuits against our directors and officers and may limit a shareholder’s ability to bring a claim in a judicial forum it finds favorable for disputes with us or our directors, officers or employees. The enforceability of similar choice of forum provisions in other companies’ certificates of incorporation has been challenged in legal proceedings and there is uncertainty as to whether a court would enforce such provisions, in particular with respect to causes of action arising under the Securities Act. In addition, investors cannot waive compliance with the federal securities laws and the rules and regulations thereunder. It is possible that, in connection with any applicable action brought against us, a court could find the choice of forum provisions contained in our Charter to be inapplicable or unenforceable in such action. If so, we may incur additional costs associated with resolving such action in other jurisdictions, which could adversely affect our business, financial condition, results of operations or cash flows.
Item 1B. Unresolved Staff Comments
None.
Item 1C. Cybersecurity
Our management and board of directors (the “Board”) recognize the importance of maintaining the capacity, reliability and security of our information technology environment and data security infrastructure to deliver on the expectations, and maintain the trust and confidence, of our customers, clients, business partners, employees and investors. The Board is actively involved in our risk management practices, including oversight of our overall enterprise risk management (“ERM”) framework, in which cybersecurity risk management is reviewed by the Board on at least an annual basis. Our cybersecurity and privacy programs align with the recognized frameworks established by the National Institute of Standards and Technology and leverage the International Organization for Standardization and other applicable industry standards. The focus of our cybersecurity program is preserving the confidentiality, security and availability of our systems and data, preventing and mitigating cybersecurity threats and effectively responding to cybersecurity incidents when they occur.
Cybersecurity Risk Management and Strategy
We have established and implemented processes to assess, identify and manage material cybersecurity risks. Cybersecurity risks are assessed, identified, and managed by our Executive Director of Cybersecurity and Infrastructure, with direct supervision by our Chief Information Officer (“CIO”) and with the assistance of our internal audit and legal teams. Our Executive Director of Cybersecurity and Infrastructure shares information regarding such risks with our management’s senior level information security council (the “Information Security Council”), which consists of our CIO, Senior Vice President and Chief Financial Officer, Vice President and Chief Technical Officer, Senior Vice President and Chief Legal Officer & Corporate Secretary, Senior Vice President of Strategy and President, Industrial Solutions and Director of Internal Audit & Enterprise Risk Management, which supports the Audit Committee’s oversight of cybersecurity risk, including by providing regular reports on various cybersecurity matters.
We have in place robust physical, technical, administrative and organizational controls for the securing of our information systems.
We maintain a comprehensive, risk-based, third-party risk management process to identify, assess and manage cybersecurity risks associated with third-party service providers. Third-party service providers undergo thorough pre-engagement due diligence, including security and privacy assessments. All contracts with such third-party service providers are required to contain security and data processing terms no less stringent than those employed by us in safeguarding our own data. Any third-party service providers with access to confidential or sensitive data are subject to ongoing oversight activities, including assessments and audits, throughout the lifetime of the engagement.
Additionally, we maintain an incident response plan (the “Incident Response Plan”), which establishes a comprehensive, effective, and repeatable process for identifying, escalating and responding to cybersecurity
incidents. We test and evaluate the Incident Response Plan, including contingency and recovery plans, on a regular basis, and we develop, implement and review contingency and recovery plans for information systems, both internal and vendor managed. The results of such assessments drive changes and enhancements to governance, policies, procedures, technologies, and partner decisions to continuously monitor and improve our cybersecurity risk management. The Information Security Council practices the procedures of the Incident Response Plan through tabletop exercises facilitated by external consultants. We also leverage third-party support, including vendors, consultants, and assessors, to analyze risk exposure, to identify remediation opportunities and to reduce our overall cybersecurity risk.
Previous cybersecurity incidents have not materially affected us, including our business strategy, financial condition, results of operations or cash flows. However, risks from cybersecurity threats, including but not limited to security breaches, computer malware, ransom attacks, other cyber-attacks, or other similar threats may materially affect us, including our business, financial condition, results of operations or cash flows.
Governance
The Board oversees the Company’s overall ERM process, including the management of risks arising from cybersecurity threats. The Audit Committee is responsible for overseeing our risk exposure to information security, cybersecurity and data protection, as well as the steps management has taken to monitor and control such exposures, and regularly provides reports to the Board on cybersecurity risk management. The Audit Committee Charter explicitly sets forth the Audit Committee’s responsibility for such oversight.The Audit Committee receives regular presentations and reports from our Executive Director of Cybersecurity and Infrastructure and our CIO on cybersecurity risks and prompt and timely information regarding any cybersecurity incident that meets established reporting thresholds. Our Executive Director of Cybersecurity and Infrastructure and our CIO also report to the Board at least annually and to the Audit Committee at least quarterly on current internal and external developments in cybersecurity, as part of the Board’s enterprise risk management review, and the Board receives reports of Audit Committee discussions regarding its oversight of cybersecurity risk. We have protocols by which certain cybersecurity incidents that meet established reporting thresholds are escalated internally and, where appropriate, reported to the Audit Committee or the Board in a timely manner.
Our Global Cybersecurity Operations function is a global team led by our Executive Director of Cybersecurity and Infrastructure, who reports to our CIO. In turn, our CIO reports to our Chief Financial Officer. The Information Security Council provides additional oversight for assessing and managing cybersecurity risk.
Our Executive Director of Cybersecurity and Infrastructure has over 15 years of cybersecurity and information technology experience, including as Director of Cybersecurity for various institutions. Our Executive Director of Cybersecurity and Infrastructure has a Bachelor of Science in Information Science and Technology and a Master’s of Science in Information Sciences, Cybersecurity, and Information Assurance, and a Doctorate in Cybersecurity; he also has a Certified Information Systems Security Professional certification, a GIAC Information Security Professional certification and a CompTIA Security+ certification. Our CIO has over 30 years of experience in information technology, having held multiple executive leadership roles, including CIO positions at several organizations. Our CIO holds a bachelor’s degree in computer science. Each of the other members of the Information Security Council have relevant educational and industry experience, including managing risks at our Company and at similar companies.
Atmus maintains strong global customer relationships, supported by an established salesforce with work locations in over 25 countries as of December 31, 2025. Also, as of December 31, 2025, Atmus operates through 11 distribution centers, 10 manufacturing facilities and five technical facilities plus 10 manufacturing facilities and two technical facilities operated by its joint ventures, giving Atmus presence on six continents. Our corporate headquarters are located in Nashville, Tennessee. We consider our properties to be suitable for their present purposes, well-maintained and in good operating condition.
Our headquarters and principal facilities are as follows:
The matters described under Legal Proceedings in Note 14, Commitments and Contingencies to the Consolidated Financial Statements are incorporated herein by reference.
Item 5. Market for Registrant’s Common Equity, Related Shareholder Matters and Issuer Purchases of Equity Securities
The Company’s common stock is traded on the New York Stock Exchange under the symbol “ATMU.” As of January 31, 2026, there were 8 registered shareholders of common stock. This does not include the number of persons whose stock is in nominee or “street” name accounts through brokers.
We did not sell any equity securities during 2025 in offerings that were not registered under the Securities Act.
We did not have any stock repurchase activity for each of the three months in the quarter ended December 31, 2025.
On July 17, 2024, our Board of Directors authorized a $150 million share repurchase program. The program does not have an expiration date and may be suspended or discontinued at any time. Since the inception of the program, we repurchased approximately $80.7 million of common stock pursuant to this authorization and as of December 31, 2025, we had approximately $69.3 million of share repurchase authorization remaining. See related information in Note 16, Share Repurchase Program. While not considered repurchases of shares, the Company does at times withhold shares that would otherwise be issued under stock-based awards to pay the related taxes for grants of stock-based awards that vested.
Comparison of Cumulative Total Return
The following graph compares the cumulative total return on our common stock with the cumulative total return to the S&P 500 Index and S&P 500 Industrial Index. The graph assumes, in each case, that an initial investment of $100 is made as of May 26, 2023, our first day of trading. The cumulative total return reflects market prices at the end of each fiscal year post May 26, 2023.
Item 6. Reserved
Reserved.
Item 7. Management’s Discussion and Analysis of Financial Condition and Results of Operations
The discussion and analysis presented below provides information which management believes is relevant to an assessment and understanding of Atmus Filtration Technologies Inc. (the “Company,” “Atmus,” “we,” “our” and “us”) consolidated results of operations and financial condition. The discussion should be read in conjunction with Atmus’ consolidated financial statements and notes thereto included elsewhere in this Annual Report on Form 10-K. This discussion contains forward-looking statements and involves numerous risks and uncertainties, including, but not limited to, those described under the heading “Risk Factors.” Actual results may differ materially from those contained in any forward-looking statements. Unless the context otherwise requires, references in this “Management’s Discussion and Analysis of Financial Condition and Results of Operations” to
“Atmus” is intended to mean the business and operations of Atmus Filtration Technologies Inc. and its consolidated subsidiaries.
The following is the discussion and analysis of changes in the financial condition and results of operations for the year ended December 31, 2025 compared to the year ended December 31, 2024. A discussion of the changes in the financial condition and results of operations for the year ended December 31, 2024 compared to the year ended December 31, 2023 can be found in Part II, “Item 7. Management’s Discussion and Analysis of Financial Condition and Results of Operations” of the Company’s Annual Report on Form 10-K for the year ended December 31, 2024, which was filed with the SEC on February 21, 2025.
This Annual Report on Form 10-K contains forward-looking statements within the meaning of the safe harbor provisions of the United States Private Securities Litigation Reform Act of 1995, including, without limitation, those that are based on current expectations, estimates and projections about the industries in which we operate and management’s views, plans, objectives, projections, beliefs and assumptions. Forward-looking statements may be identified by the use of words such as “anticipates,” “expects,” “forecasts,” “intends,” “plans,” “believes,” “seeks,” “estimates,” “could,” “should,” “may” or words of similar meaning. Examples of forward-looking statements include, but are not limited to, statements we make regarding the outlook for our future business and financial performance, discussions of future operations, impact of planned acquisitions and dispositions, our strategy for growth, product development activities, regulatory approvals, market position, expenditures and the effects of the Separation and IPO (each as defined in Note 1, Description of the Business, to our Consolidated Financial Statements included herein). These statements are not guarantees of future performance and involve certain risks, uncertainties and assumptions, which we refer to as “future factors,” which are difficult to predict. If the underlying assumptions prove correct, or known or unknown risks or uncertainties materialize, our actual outcomes, results and financial condition may differ materially from what is expressed, implied or forecasted in such forward-looking statements. Risks and uncertainties include, but are not limited to:
•Significant customer concentration among Cummins, PACCAR, and the Traton Group;
•The loss of a top OEM relationship or changes in the preferences of Atmus' aftermarket end-users;
• Deriving significant earnings from investees that Atmus does not directly control;
•Significant competition in the markets Atmus serves;
•Ability to attract and retain qualified personnel;
•Strategic transactions, such as acquisitions, divestitures, and joint ventures;
•Management of productivity improvements;
•Work stoppages and other labor matters;
•Variability in material and commodity costs;
•Interruptions in the supply of critical materials and components;
•Complexity of supply chain and manufacturing;
•Atmus’ customers operating in cyclical industries and the current economic conditions in these industries;
•Exposure to potential claims related to warranties and claims for support outside of standard warranty obligations;
•Products being subject to recall for performance or safety-related issues;
•Inability or failure to adequately protect and enforce Atmus’ intellectual property rights and the cost of protecting or enforcing Atmus' intellectual property rights;
•Sales of counterfeit versions of products, as well as unauthorized sales of products;
•Statutory and regulatory requirements that can significantly increase costs;
•Changes in international, national and regional trade laws, regulations and policies affecting international trade;
•Unanticipated changes in Atmus' effective tax rate, the adoption of new tax legislation or exposure to additional income tax liabilities, as well as audits by tax authorities resulting in additional tax payments for prior periods;
•Significant compliance costs and reputational and legal risks imposed by Atmus' global operations and the laws and regulations to which these are subject;
•Effects of climate change may cause Atmus to incur increased costs;
•Operations being subject to increasingly stringent environmental laws and regulations as well as to laws requiring cleanup of contaminated property;
•Potential system or data security breaches or other disruptions;
•Foreign currency exchange rate;
•Potential economic downturns that could cause the balances of recorded goodwill to decrease;
•Increased tariffs or the imposition of other barriers to international trade;
•Political, economic, and social uncertainty in geographies where Atmus has significant operations or large offerings of products;
•Potential failure of performance by Atmus or Cummins under transaction agreements executed as part of the IPO;
•Terms from unaffiliated third parties may have been better than what Atmus received in agreements with Cummins;
•Changes in capital and credit markets;
•Substantial indebtedness consisting of Atmus’ term loan and revolving credit facility, which may impact Atmus' ability to service all its indebtedness and react to changes in the industry; and
•Substantially all Atmus' assets pledged as security for its term loan and revolving credit facility.
Additional information about these future factors and the material factors or assumptions underlying such forward-looking statements may be found under the section entitled Risk Factors in this Annual Report on Form 10-K. It is not possible to predict or identify all such factors, and the risks described above should not be considered a complete statement of all potential risks and uncertainties. Readers are urged to consider these factors carefully in evaluating forward-looking statements and are cautioned not to place undue reliance on forward-looking statements. The forward-looking statements made herein are made only as of the date hereof and we undertake no obligation to publicly update or to revise any forward-looking statement, whether as a result of new information, future developments or otherwise, except as may be required by law.
General Overview
Company Overview
We are one of the global leaders of filtration products for on-highway commercial vehicles and off-highway agriculture, construction, mining and power generation vehicles and equipment. We design and manufacture advanced filtration products, principally under the Fleetguard brand, that provide superior asset protection and enable lower emissions. We estimate that approximately 14% of our net sales in 2025 were generated through first-fit sales to OEMs, where our products are installed as components for new vehicles and equipment. We estimate that approximately 86% of our net sales in 2025 were generated in the aftermarket, where our
products are installed as replacement or repair parts, leading to a strong recurring revenue base. Building on our more than 65-year history, we continue to grow and differentiate ourselves through our global footprint, comprehensive offering of premium products, technology leadership and multi-channel path to market.
Separation from Cummins
In April 2022, Cummins Inc. (“Cummins”) announced its intention to separate its filtration business (the “Filtration Business”) into a standalone publicly traded company (the “Separation”). We were incorporated in Delaware on April 1, 2022, as a wholly-owned subsidiary of Cummins, in anticipation of the Separation, and prior to the completion of our initial public offering (the “IPO”), Cummins completed, in all material respects, the transfer of the assets and liabilities of the Filtration Business to us and our subsidiaries.
Our Registration Statement on Form S-1, as amended, filed on May 16, 2023, was declared effective on May 25, 2023, and our common shares began trading on the New York Stock Exchange under the symbol “ATMU” on May 26, 2023. On May 30, 2023, the IPO was completed through Cummins’ exchange of 16,243,070 shares of our common stock, including the underwriters’ full exercise of their option to purchase 2,118,661 shares to cover over-allotments. None of the proceeds of the IPO were for the benefit of Atmus. As of the closing of the IPO, Cummins owned approximately 80.5% of the outstanding shares of our common stock.
On September 30, 2022, and as amended on February 15, 2023, Atmus entered into a $1.0 billion credit agreement (“Credit Agreement”) with a syndicate of banks, providing for a $600 million term loan facility (the “term loan”) and a $400 million revolving credit facility (the “revolving credit facility”), in anticipation of the Separation. Borrowings under the Credit Agreement did not become available until the IPO occurred. Upon completion of the IPO, we borrowed $650 million, consisting of proceeds of the term loan and amounts drawn under the revolving credit facility, and paid such amounts to Cummins in partial consideration for the Separation.
In connection with the Separation, we entered into various agreements with Cummins, including a separation agreement. In the separation agreement, there were certain assets and liabilities identified in the schedules which were retained by Cummins, and those that were transferred to the Company. These agreements comprehensively provide a framework for our relationship with Cummins and govern various interim and ongoing relationships between us and Cummins post IPO.
On February 14, 2024, Cummins announced an exchange offer whereby Cummins shareholders could exchange all or a portion of Cummins common stock for shares of Atmus common stock owned by Cummins. The divestiture of Atmus shares by Cummins was completed on March 18, 2024 and resulted in the full separation of Atmus and divestitures of Cummins’ entire ownership and voting interest in Atmus (“Full Separation”).
Following full separation, Cummins continued to provide certain services to Atmus under the transition services agreement. The transition services agreement related primarily to administrative services for which Atmus paid Cummins mutually agreed upon fees. These services were provided through and ended in September 2025.
Basis of Presentation
For the periods prior to the IPO, the discussion below relates to the financial position and results of operations of a combination of entities under common control that have been “carved out” of Cummins’ historical consolidated financial statements and accounting records. The historical combined financial statements reflect our historical financial position, results of operations and cash flows, in conformity with generally accepted accounting principles in the United States of America (“U.S. GAAP”). Refer to Note 2, Basis of Presentation, to the Consolidated Financial Statements included elsewhere in this report for additional information.
For the period subsequent to our IPO on May 26, 2023, as a standalone public company, we present our financial statements on a consolidated basis. The Consolidated Financial Statements have been prepared in conformity with U.S. GAAP.
Our financial performance depends, in large part, on varying conditions in the markets we serve. Demand in these markets tends to fluctuate in response to overall economic conditions. Our revenues may also be impacted by OEM inventory levels, production schedules, commodity prices, work stoppages and supply chain challenges. Economic downturns in markets we serve generally result in reduced sales of our products and can result in price reductions in certain products and/or markets. As a worldwide business, our operations are also affected by currency exchange rate changes, political and economic uncertainty, public health crises (epidemics or pandemics) and regulatory matters, including adoption and enforcement of environmental and emission standards in the countries we serve. Some of the more important factors affecting our performance are briefly discussed below.
Market demand
Aftermarket demand remained soft throughout 2025. We continue to be in a period of slow growth in global aftermarkets, and this trend is expected to continue into 2026. First-fit experienced reduced demand in 2025 reflecting depressed market conditions. First-fit demand is expected to remain at reduced levels in 2026 based on overall market cyclicality.
Global supply chain
Overall supply chain conditions remained largely stable during 2025 with minimal disruptions being experienced. Logistics costs increased during 2025, primarily due to the transition to a standalone distribution network as part of the Separation and the impact of tariffs. Our management team continues to monitor and evaluate all of these factors and the related impacts of our business and operations, and we are diligently working to continue to minimize any supply chain impacts to our business and to our customers.
Commodity prices, labor, inflation and foreign currency exchange rates
We have experienced general variability in direct material costs during 2025. While the costs of our principal materials fluctuate, generally we believe there will continue to be an adequate supply of the materials we use and they will remain available.
Labor and people related costs have remained stable with increases primarily driven by annual merit and variable compensation programs.
Additionally, the appreciation of the U.S. dollar against foreign currencies has had an unfavorable impact on our consolidated results of operations in 2025. There can be no assurances as to the impact of foreign currency exchange rates on our results in 2026.
Standalone costs
We have incurred additional costs associated with becoming a standalone public company. During the year ended December 31, 2025, we incurred approximately $15.5 million related to one-time separation costs including $11.2 million within Cost of Sales and $4.3 million within Selling, general and administrative expenses. In addition, we have incurred capital expenditures in connection with the Separation of approximately $9.5 million. These expenses and capital expenditures primarily relate to the establishment of functions previously co-mingled with Cummins, such as information technologies, distribution centers, manufacturing and human resources. The one-time costs incurred during the year ended December 31, 2025, were primarily associated with establishing our own distribution network and our technology transformation and modernization project. The transition services agreement under which Cummins had continued to provide certain services related primarily to administrative services ended in September 2025. With the conclusion of this agreement, we do not expect to incur any additional one-time expenses or capital expenditures in future periods in connection with becoming a standalone public company.
Operating results were as follows (in millions, except per share amounts):
Years Ended December 31,
Favorable
(Unfavorable)
2025 vs. 2024
Favorable
(Unfavorable)
2024 vs. 2023
2025
2024
2023
Amount
%
Amount
%
NET SALES
$
1,764.3
$
1,669.6
$
1,628.1
$
94.7
5.7
%
$
41.5
2.5
%
Cost of sales
1,266.0
1,207.5
1,195.4
(58.5)
(4.8)
%
(12.1)
(1.0)
%
GROSS MARGIN
498.3
462.1
432.7
36.2
7.8
%
29.4
6.8
%
OPERATING EXPENSES AND INCOME
Selling, general and administrative expenses
184.3
187.6
174.7
3.3
1.8
%
(12.9)
(7.4)
%
Research, development and engineering expenses
40.7
40.6
42.5
(0.1)
(0.2)
%
1.9
4.5
%
Equity, royalty and interest income from investees
33.8
34.3
33.6
(0.5)
(1.5)
%
0.7
2.1
%
Other operating expense, net
8.1
2.0
0.7
(6.1)
(305.0)
%
(1.3)
(185.7)
%
OPERATING INCOME
299.0
266.2
248.4
32.8
12.3
%
17.8
7.2
%
Interest expense
33.4
40.6
25.8
7.2
17.7
%
(14.8)
(57.4)
%
Other income, net
0.6
9.2
3.8
(8.6)
(93.5)
%
5.4
142.1
%
INCOME BEFORE INCOME TAXES
266.2
234.8
226.4
31.4
13.4
%
8.4
3.7
%
Income tax expense
58.8
49.2
55.1
(9.6)
(19.5)
%
5.9
10.7
%
NET INCOME
$
207.4
$
185.6
$
171.3
$
21.8
11.7
%
$
14.3
8.3
%
PER SHARE DATA:
Basic earnings per share
$
2.52
$
2.23
$
2.06
$
0.29
13.0
%
$
0.17
8.3
%
Diluted earnings per share
$
2.50
$
2.22
$
2.05
$
0.28
12.6
%
$
0.17
8.3
%
Years Ended December 31,
Favorable
(Unfavorable)
2025 vs. 2024
Favorable
(Unfavorable)
2024 vs. 2023
Percent of Net sales
2025
2024
2023
Percentage Points
Percentage Points
Gross margin
28.2
%
27.7
%
26.6
%
0.5
%
1.1
%
Selling, general and administrative expenses
10.4
%
11.2
%
10.7
%
0.8
%
(0.5)
%
Research, development and engineering expenses
2.3
%
2.4
%
2.6
%
0.1
%
0.2
%
2025 vs. 2024
Net sales
Net sales were $1,764.3 million for the year ended December 31, 2025, an increase of $94.7 million compared to $1,669.6 million for the year ended December 31, 2024. The increase in Net sales was mainly due to higher volumes of $51.9 million and favorable pricing impacts of $50.0 million, partially offset by unfavorable impacts of currency of $7.3 million. The favorable impact from pricing is primarily driven by normal pricing initiatives and select increases as a result of tariffs.
Gross margin
Gross margin was $498.3 million for the year ended December 31, 2025, an increase of $36.2 million compared to $462.1 million for the year ended December 31, 2024. The increase in Gross margin was mainly due to favorable pricing of $50.0 million as described above, favorable volumes of $21.0 million, a $7.7 million decrease in manufacturing and other costs and a $0.9 million reduction in one-time restructuring and separation costs, partially offset by unfavorable logistics and duties costs of $36.2 million, $5.8 million in unfavorable currency impacts and a $1.4 million increase in warranty costs. Gross margin as
a percentage of Net sales was 28.2%, an increase of 0.5 percentage points compared to 27.7%. The increase in Gross margin as a percentage of Net sales was primarily due to the items noted above.
Selling, general and administrative expenses
Selling, general and administrative expenses were $184.3 million for the year ended December 31, 2025, a decrease of $3.3 million compared to $187.6 million for the year ended December 31, 2024. The decrease was primarily driven by lower one-time separation and restructuring costs of $11.6 million, partially offset by increased people-related and consulting expenses and an increase in amortization of internal-use software. Selling, general and administrative expenses as a percentage of Net sales were 10.4% for the year ended December 31, 2025, a decrease of 0.8 percentage points compared to 11.2% for the year ended December 31, 2024. The decrease in Selling, general and administrative expenses as a percentage of Net sales was primarily driven by the items noted above.
Research, development and engineering expenses
Research, development and engineering expense was generally consistent for the year ended December 31, 2025 compared the year ended December 31, 2024.
Equity, royalty and interest income from investees
Equity, royalty and interest income from investees was generally consistent for the year ended December 31, 2025 compared to the year ended December 31, 2024.
Other operating expense, net
Other operating expense, net was $8.1 million for the year ended December 31, 2025, an increase of $6.1 million compared to $2.0 million for the year ended December 31, 2024. The increase was primarily due to long-lived asset impairment charges on idled machinery, equipment and fixtures.
Interest expense
Interest expense was $33.4 million for the year ended December 31, 2025, a decrease of $7.2 million compared to $40.6 million for the year ended December 31, 2024. The decrease in interest expense was primarily driven by a reduction to the interest rate on our borrowing and lower outstanding borrowings on our Credit Agreement as principal payments were made.
Other income, net
Other income, net was $0.6 million for the year ended December 31, 2025, a decrease of $8.6 million compared to $9.2 million for the year ended December 31, 2024. The decrease in Other income, net was due to an increase in the net loss on foreign exchange rate hedging which offset interest income that remained stable between the comparable periods.
Income tax expense
Our effective tax rate for the year ended December 31, 2025 was 22.1%, an increase of 1.1 percentage points compared to 21.0% for the year ended December 31, 2024. The increase in the effective tax rate was driven by unfavorable changes in the mix of earnings and lower U.S. credits and incentives following cash tax planning around recent U.S. tax law changes, partially offset by a valuation allowance release on foreign deferred tax assets. Our effective tax rate differs from the U.S. statutory rate primarily due to differences in rates applicable to foreign subsidiaries, withholding taxes and state income taxes.
Our facilities under the Credit Agreement provide for $1.0 billion in total capacity, which includes a $600 million term loan and a $400 million revolving credit facility. As of December 31, 2025, we have outstanding borrowings of $570.0 million on the term loan and zero on the revolving credit facility. As a result, we had capacity under our revolving credit facility of $400 million as of December 31, 2025. Subsequent to current year end, on January 7, 2026, the Company entered into an Amended and Restated Credit Agreement which provided for a term loan facility of $1.0 billion and $500 million revolving credit facility, both of which mature on January 7, 2031. The term loan facility was drawn on fully for the amount of $1.0 billion with proceeds used to refinance the outstanding term loan facility and to finance in part the acquisition of Koch Filter Corporation. Refer to Note 21, Subsequent Events, to the Consolidated Financial Statements for more information.
We believe that cash from operations and the facilities under our Credit Agreement will continue to provide sufficient liquidity for our working capital needs, planned capital expenditures and future payments of our contractual, tax and benefit plan obligations and payments for share repurchases and quarterly dividends in both the short and long term. Overall, we do not expect negative effects to our funding sources that would have a material effect on our liquidity. However, if a serious economic or credit market crisis ensues or other adverse developments arise, it could have a material adverse effect on our liquidity, financial condition, results of operations and cash flows.
Our most significant ongoing short-term cash requirements relate primarily to funding operations (including expenditures for raw materials, labor, manufacturing and distribution, trade and promotions, advertising and marketing, tax liabilities, benefit plan obligations and lease expenses) as well as periodic expenditures for anticipated capital investments, shareholder returns (such as dividend payments and share repurchases), interest payments on our long-term debt and supporting any future acquisitions.
Long-term cash requirements primarily relate to funding long-term debt repayments and our long-term benefit plan obligations.
Cash Flow
Our management reviews our liquidity needs in determining any and all indebtedness options. We have the ability to access the capital markets following the IPO, and we continue to generate substantial cash from operating activities and believe that our operating cash flow and other sources of liquidity will be sufficient to allow us to manage our business and give us flexibility to meet our short- and long-term financial commitments. Our cash flow activity is noted below:
For the Years Ended December 31,
2025
2024
2023
(in millions)
Net cash provided by operating activities
$
202.7
$
105.4
$
189.0
Net cash used in investing activities
(53.9)
(48.6)
(45.8)
Net cash (used in) provided by financing activities
(101.7)
(35.8)
24.8
Operating Cash Flow
Net cash provided by operating activities was $202.7 million for the year ended December 31, 2025, an increase of $97.3 million compared to Net cash provided by operating activities of $105.4 million for the year ended December 31, 2024. The increase was driven primarily by a favorable change in working capital requirements of $40.1 million, a favorable change in deferred taxes of $26.4 million and higher net income of $21.8 million. During the year ended December 31, 2025, higher working capital requirements resulted in a cash outflow of $63.2 million compared to a cash outflow of $103.3 million for the year ended December 31, 2024, mainly due to higher trade accounts payable and lower prepaids, partially offset by higher trade and other receivables including VAT receivables.
Dividends received from our unconsolidated equity investees were $21.0 million, $25.5 million and $19.8 million for the years ended December 31, 2025, December 31, 2024 and December 31, 2023, respectively. Dividends are included in Net cash provided by operating activities.
Net cash used in investing activities for each fiscal year presented was primarily used for capital expenditures. Our capital expenditures were $53.9 million (of which approximately $9.5 million related to one-time separation costs) and $48.6 million (of which approximately $15.0 million related to one-time separation costs) for the years ended December 31, 2025 and December 31, 2024, respectively, corresponding to approximately 3.1% and 2.9% of Net sales in 2025 and 2024, respectively.
Financing Cash Flow
Net cash used in financing activities for the year ended December 31, 2025 consisted primarily of repurchases of common stock of $60.7, payments made on our term loan of $22.5 million and dividends paid of $17.3 million. Net cash used in financing activities for the year ended December 31, 2024 consisted primarily of repurchases of common stock of $20.0 million, dividends paid of $8.3 million and payments made on our term loan of $7.5 million.
Dividends
We paid dividends of $17.3 million in 2025, $8.3 million in 2024 and none in 2023. The first quarter 2025 dividend of $0.05 per share, declared on February 19, 2025 for shareholders of record as of March 4, 2025, was paid on March 19, 2025. The second quarter of 2025 dividend of $0.05 per share, declared on May 21, 2025 for shareholders of record as of June 3, 2025, was paid on June 18, 2025. The third quarter 2025 dividend of $0.055 per share, declared on August 13, 2025 for shareholders of record as of August 26, 2025, was paid on September 10, 2025. The fourth quarter dividend of $0.055 per share, declared on November 12, 2025 for shareholders of record as of November 25, 2025, was paid on December 10, 2025. The declaration of dividends is subject to the discretion of our Board of Directors and depends on various factors, including our net earnings, financial condition, cash requirements, future prospects and other factors that our Board of Directors deems relevant to its analysis and decision making.
2025 distributions have been characterized as dividends under the U.S. federal income tax rules. The final determination was made on an IRS Form 1099-DIV issued in early 2026.
Contractual Obligations
Our commitments consist of lease obligations for real estate and equipment. For more information regarding our lease obligations, see Note 9, Leases, to the Consolidated Financial Statements, which provides a summary of our future minimum lease payments.
Debt
Our total debt outstanding was $570.0 million at December 31, 2025, was $592.5 million at December 31, 2024, and was $600.0 million at December 31, 2023. At December 31, 2025, the weighted-average term of our outstanding long-term debt was 1.9 years. Refer to Note 12, Debt and Borrowing Arrangements, and Note 21, Subsequent Events, to the Consolidated Financial Statements for more information on our debt and debt covenants.
We use non-GAAP financial information and believe it is useful to investors as it provides additional information to facilitate comparisons of historical operating results, identify trends in our underlying operating results and provide additional insight and transparency on how we evaluate our business. We use non-GAAP financial measures to budget, make operating and strategic decisions and evaluate our performance. We have detailed the non-GAAP adjustments that we make in our non-GAAP definitions below. We believe the non-GAAP measures should always be considered along with the related U.S. GAAP financial measures. We have provided the reconciliations between the U.S. GAAP and non-GAAP financial measures below, and we also discuss our underlying U.S. GAAP results throughout our Management’s Discussion and Analysis of Financial Condition and Results of Operations in this Annual Report on Form 10-K.
Our primary non-GAAP financial measures are listed below and reflect how we evaluate our current and prior-year operating results. As new events or circumstances arise, these definitions could change. When our definitions change, we provide the updated definitions and present the related non-GAAP historical results on a comparable basis.
•“EBITDA” is defined as earnings or losses before interest expense, income taxes, depreciation and amortization and “EBITDA margin” is defined as EBITDA as a percent of Net sales. We believe EBITDA and EBITDA margin are useful measures of our operating performance as they assist investors and debt holders in comparing our performance on a consistent basis without regard to financing methods, capital structure, income taxes or depreciation and amortization methods, which can vary significantly depending upon many factors. Additionally, we believe these metrics are widely used by investors, securities analysts, ratings agencies and others in our industry in evaluating performance.
•“Adjusted EBITDA” is defined as EBITDA after adding back certain one-time expenses, reflected in Cost of sales and Selling, general and administrative expenses, associated with becoming a standalone public company, one-time restructuring costs and long-lived asset impairment charges and “Adjusted EBITDA margin” is defined as Adjusted EBITDA as a percent of Net sales. We believe Adjusted EBITDA and Adjusted EBITDA margin are useful measures of our operating performance as they allow investors and debt holders to compare our performance on a consistent basis without regard to one-time costs attributable to our becoming a standalone public company and non-recurring long-lived asset impairment charges.
•“Adjusted earnings per share” is defined as diluted earnings per share (the most comparable U.S. GAAP financial measure) after adding back certain one-time expenses, reflected in Cost of sales and Selling, general and administrative expenses, associated with becoming a standalone public company, one-time restructuring costs and long-lived asset impairment charges less the related tax impact of the same one-time expenses and asset impairment charges. We believe Adjusted earnings per share provides improved comparability of underlying operating results.
•“Free cash flow” is defined as cash flows provided by (used for) operating activities less capital expenditures and “Adjusted free cash flow” is defined as Free cash flow after adding back certain one-time capital expenditures and other separation related costs associated with becoming a standalone public company and one-time restructuring costs. We believe Free cash flow and Adjusted free cash flow are useful metrics used by management and investors to analyze our ability to service and repay debt and return value to shareholders.
The metrics defined above are not in accordance with, or alternatives for, U.S. GAAP financial measures and may not be consistent with measures used by other companies. The metrics should be considered supplemental data; however, the amounts included in the EBITDA, EBITDA margin, Adjusted EBITDA, Adjusted EBITDA margin, Adjusted earnings per share, Free cash flow and Adjusted free cash flow calculations are derived from amounts included in the consolidated statements of net income and cash flows. We do not consider our non-GAAP financial measures as superior to, or a substitute for, the equivalent measures calculated and presented in accordance with GAAP. Some of the limitations are:
•such measures do not reflect our cash expenditures, or future requirements for capital expenditures or contractual commitments;
•such measures do not reflect changes in, or cash requirements for, our working capital needs;
•such measures do not reflect the interest expense or the cash requirements necessary to service interest or principal payments on our debt;
•although depreciation and amortization are non-cash charges, the assets being depreciated and amortized will often have to be replaced in the future and such measures do not reflect any cash requirements for such replacements; and
•other companies in our industry may calculate such measures differently than we do, limiting their usefulness as comparative measures.
To properly and prudently evaluate our business, we encourage you to review the consolidated financial statements included elsewhere in this report and not rely on a single financial measure to evaluate our business.
A reconciliation of Net income to EBITDA and Adjusted EBITDA is shown in the table below:
For the Years Ended December 31,
2025
2024
2023
(in millions)
NET INCOME
$
207.4
$
185.6
$
171.3
Plus:
Interest expense
33.4
40.6
25.8
Income tax expense
58.8
49.2
55.1
Depreciation and amortization
30.0
24.8
21.5
EBITDA (non-GAAP)
$
329.6
$
300.2
$
273.7
Plus:
Impairment charges - Long-lived assets(a)
$
8.4
$
—
$
—
One-time restructuring costs
—
4.1
—
One-time separation costs(b)
15.5
25.2
28.6
Adjusted EBITDA (non-GAAP)
$
353.5
$
329.5
$
302.3
Net sales
$
1,764.3
$
1,669.6
$
1,628.1
Net income margin
11.8
%
11.1
%
10.5
%
EBITDA margin (non-GAAP)
18.7
%
18.0
%
16.8
%
Adjusted EBITDA margin (non-GAAP)
20.0
%
19.7
%
18.6
%
(a)During 2025, Atmus recognized fixed asset impairment charges on idled machinery, equipment and fixtures. We do not expect the idling of the assets to have a material adverse effect on our financial position, results of operations, cash flows, liquidity or capital resources.
(b)Primarily comprised of one-time expenses related to Information Technology, warehousing, manufacturing and Human Resources separation costs.
A reconciliation of Diluted earnings per share to Adjusted earnings per share is shown in the table below:
For the Years Ended December 31,
2025
2024
2023
(per share)
Diluted earnings per share
$
2.50
$
2.22
$
2.05
Plus:
Impairment charges - Long-lived assets(a)
$
0.10
$
—
$
—
One-time restructuring costs(b)
—
0.05
—
One-time separation costs(b)
0.19
0.30
0.34
Less:
Tax impact of impairment charges(a)
$
0.02
$
—
$
—
Tax impact of one-time restructuring costs(b)
—
0.01
—
Tax impact of one-time separation costs(b)
0.04
0.06
0.08
Adjusted earnings per share (non-GAAP)
$
2.73
$
2.50
$
2.31
(a)During 2025, Atmus recognized fixed asset impairment charges on idled machinery, equipment and fixtures. The tax impact of the impairment charges for the year ended December 31, 2025, was $1.9 million.
(b)Primarily comprised of one-time expenses related to Information Technology, warehousing, manufacturing, restructuring and Human Resources separation costs and the related tax impact of those expenses. The tax impact of one-time restructuring costs for the year ended December 31, 2024 was $0.9 million and the tax impact of one-time separation costs for the years ended December 31, 2025, 2024 and 2023 were $3.4 million, $5.3 million and $6.9 million, respectively.
A reconciliation of Net cash provided by operating activities to Free cash flow and Adjusted free cash flow is shown in the table below:
For the Years Ended December 31,
2025
2024
2023
(in millions)
Cash provided by operating activities
$
202.7
$
105.4
$
189.0
Less:
Capital expenditures
$
53.9
$
48.6
$
45.8
Free cash flow (non-GAAP)
$
148.8
$
56.8
$
143.2
Plus:
One-time restructuring costs
$
—
$
4.1
$
—
One-time separation capital expenditures
9.5
15.0
9.2
Other one-time separation related(a)
—
38.6
—
Adjusted free cash flow (non-GAAP)
$
158.3
$
114.5
$
152.4
(a)Primarily comprised of one-time working capital inefficiencies associated with the move from intercompany settlement terms with Cummins to standalone practices.
Critical Accounting Policies and Estimates
We prepare our Consolidated Financial Statements in conformity with U.S. GAAP. The preparation of our financial statements requires the use of estimates, judgments and assumptions that affect the reported amounts of assets and liabilities at the date of the financial statements and reported amounts of revenues and expenses during the periods presented. Actual results could differ from those estimates and assumptions. See Note 3, Summary of Significant Accounting Policies, in the notes accompanying Atmus’ financial statements included elsewhere herein for a summary of Atmus’ significant accounting policies, and discussion of recent accounting pronouncements. Atmus believes that the following discussion addresses Atmus’ most critical accounting policies, which are those that are most important to the portrayal of Atmus’ financial condition and results of operations and require management’s most difficult, subjective and complex judgments.
We sell to customers either through long-term arrangements or standalone purchase orders. Our long-term arrangements generally do not include committed volumes until underlying purchase orders are issued. Typically, we recognize revenue on the products we sell at a point in time, in accordance with shipping terms or other contractual arrangements.
The transaction price of a contract could be reduced by variable consideration, including aftermarket rebates, volume and growth rebates and sales returns. At the time of sale to a customer, we record an estimate of variable consideration as a reduction from gross sales. We primarily rely on historical experience and anticipated future performance to estimate the variable consideration. Revenue is recognized to the extent that it is probable that a significant reversal of revenue will not occur when the contingency is resolved.
For aftermarket rebates and volume and growth rebates, management estimates are based on the terms of the arrangements with customers, historical payment experience, volume in quantity or mix of purchases of product during a specified time period and expectations for changes in relevant trends in the future. Adjustments to rebate accruals are made as actual usage becomes known in order to properly estimate the amounts necessary to generate consumer demand based on market conditions as of the balance sheet date.
For product returns, some aftermarket customers are permitted to return small amounts of parts and filters each year. An estimate of future returns is accounted for at the time of sale as a reduction in the overall sales revenue based on historical return rates.
Accounting for Income Taxes
We determine our income tax expense using the asset and liability method. Under this method, deferred tax assets and liabilities are recognized for the future tax effects of temporary differences between the financial statement carrying amounts of existing assets and liabilities and their respective tax basis. We recognize the tax impact of including certain foreign earnings in U.S. taxable income as a period cost. Future tax benefits of net operating loss and credit carryforwards are also recognized as deferred tax assets. We evaluate the recoverability of our deferred tax assets each quarter by assessing the likelihood of future profitability and available tax planning strategies that could be implemented to realize our net deferred tax assets. At December 31, 2025, we recorded net deferred tax assets of $0.9 million. The assets included $9.7 million for the value of net operating loss and credit carryforwards. A valuation allowance of $6.7 million was recorded to reduce the tax assets to the net value management believed was more likely than not to be realized. In the event our operating performance deteriorates, future assessments could conclude that a larger valuation allowance will be needed to further reduce the deferred tax assets.
In addition, we operate within multiple taxing jurisdictions and are subject to tax audits in these jurisdictions. These audits can involve complex issues, which may require an extended period of time to resolve. We accrue for the estimated additional tax and interest that may result from tax authorities disputing uncertain tax positions. We believe we made adequate provisions for income taxes for all years that are subject to audit based upon the latest information available. A more complete description of our income taxes and the future benefits of our net operating loss and credit carryforwards is disclosed in Note 6, Income Taxes, to our Consolidated Financial Statements included herein.
Item 7A. Quantitative and Qualitative Disclosures About Market Risk
Foreign Currency Exchange Risk
As a result of our international business presence, we are exposed to foreign currency exchange rate risks. We transact business in foreign currencies and, as a result, our income and financial condition are exposed to movements in foreign currency exchange rates. This risk is closely monitored and managed through the use of financial derivative instruments. Financial derivatives are used by Atmus expressly for hedging purposes and under no circumstances are they used for speculative purposes. Substantially all of Atmus’ derivative contracts are subject to master netting arrangements, which provide the option to settle certain contracts on a net basis when they settle on the same day with the same currency. In addition, these arrangements provide for a net settlement of all contracts with a given counterparty in the event that the arrangement is terminated due to the occurrence of default or a termination event.
To minimize the income volatility resulting from the remeasurement of net monetary assets and liabilities denominated in a currency other than the functional currency, Atmus enters into foreign currency forward contracts, which are considered economic hedges and are not designated as hedges for accounting purposes. The objective is to offset the gain or loss from remeasurement with the gain or loss from the fair market valuation of the forward contract.
The potential gain or loss in the fair value of our outstanding foreign currency contracts, assuming a hypothetical 10% fluctuation in the currencies of such contracts would be approximately $10.3 million for the year ended December 31, 2025 and would not have a material impact on the consolidated financial statements for the years ended December 31, 2024 and 2023. The sensitivity analysis of the effects of changes in foreign currency exchange rates assumes the notional value to remain constant for the next 12 months. The analysis ignores the impact of foreign exchange movements on our competitive position and potential changes in sales levels. Any change in the value of the contracts, real or hypothetical, would be significantly offset by an inverse change in the value of the underlying hedged items.
Interest Rate Risk
Our interest rate risk relates primarily to our $600 million term loan facility and our five-year $400 million revolving credit facility. Borrowings under these facilities bear interest at varying rates, depending on the type of loan and, in some cases, the rates of designated benchmarks and the applicable election made by us. Generally, U.S. dollar-denominated loans bear interest at an adjusted term SOFR (which includes a 0.10 percent credit spread adjustment to SOFR) for the applicable interest period plus a rate ranging from 1.125 percent to 1.75 percent depending on our net leverage ratio. Based on our outstanding borrowings at December 31, 2025, a 0.125% change in SOFR would have a $0.7 million annual impact on interest expense. Refer to Note 12, Debt and Borrowing Arrangements, to the Consolidated Financial Statements for further information.
Report of Independent Registered Public Accounting Firm
To the Board of Directors and Shareholders of Atmus Filtration Technologies Inc.
Opinions on the Financial Statements and Internal Control over Financial Reporting
We have audited the accompanying consolidated balance sheets of Atmus Filtration Technologies Inc. and its subsidiaries (the "Company") as of December 31, 2025 and 2024, and the related consolidated statements of net income, of comprehensive income, of changes in equity and of cash flows for each of the three years in the period ended December 31, 2025, including the related notes (collectively referred to as the "consolidated financial statements"). We also have audited the Company's internal control over financial reporting as of December 31, 2025, based on criteria established in Internal Control - Integrated Framework (2013) issued by the Committee of Sponsoring Organizations of the Treadway Commission (COSO).
In our opinion, the consolidated financial statements referred to above present fairly, in all material respects, the financial position of the Company as of December 31, 2025 and 2024, and the results of its operations and its cash flows for each of the three years in the period ended December 31, 2025 in conformity with accounting principles generally accepted in the United States of America. Also in our opinion, the Company maintained, in all material respects, effective internal control over financial reporting as of December 31, 2025, based on criteria established in Internal Control - Integrated Framework (2013) issued by the COSO.
Basis for Opinions
The Company's management is responsible for these consolidated financial statements, for maintaining effective internal control over financial reporting, and for its assessment of the effectiveness of internal control over financial reporting, included in Management’s Report on Internal Control over Financial Reporting appearing under Item 9A. Our responsibility is to express opinions on the Company’s consolidated financial statements and on the Company's internal control over financial reporting based on our audits. We are a public accounting firm registered with the Public Company Accounting Oversight Board (United States) (PCAOB) and are required to be independent with respect to the Company in accordance with the U.S. federal securities laws and the applicable rules and regulations of the Securities and Exchange Commission and the PCAOB.
We conducted our audits in accordance with the standards of the PCAOB. Those standards require that we plan and perform the audits to obtain reasonable assurance about whether the consolidated financial statements are free of material misstatement, whether due to error or fraud, and whether effective internal control over financial reporting was maintained in all material respects.
Our audits of the consolidated financial statements included performing procedures to assess the risks of material misstatement of the consolidated financial statements, whether due to error or fraud, and performing procedures that respond to those risks. Such procedures included examining, on a test basis, evidence regarding the amounts and disclosures in the consolidated financial statements. Our audits also included evaluating the accounting principles used and significant estimates made by management, as well as evaluating the overall presentation of the consolidated financial statements. Our audit of internal control over financial reporting included obtaining an understanding of internal control over financial reporting, assessing the risk that a material weakness exists, and testing and evaluating the design and operating effectiveness of internal control based on the assessed risk. Our audits also included performing such other procedures as we considered necessary in the circumstances. We believe that our audits provide a reasonable basis for our opinions.
Definition and Limitations of Internal Control over Financial Reporting
A company’s internal control over financial reporting is a process designed to provide reasonable assurance regarding the reliability of financial reporting and the preparation of financial statements for external purposes in accordance with generally accepted accounting principles. A company’s internal control over financial reporting includes those policies and procedures that (i) pertain to the maintenance of records that, in reasonable detail, accurately and fairly reflect the transactions and dispositions of the assets of the company; (ii) provide reasonable assurance that transactions are recorded as necessary to permit preparation of financial statements in accordance with generally accepted accounting principles, and that receipts and expenditures of the company are being made only in accordance with authorizations of management and directors of the company; and (iii) provide reasonable assurance regarding prevention or timely detection of unauthorized acquisition, use, or disposition of the company’s assets that could have a material effect on the financial statements.
Because of its inherent limitations, internal control over financial reporting may not prevent or detect misstatements. Also, projections of any evaluation of effectiveness to future periods are subject to the risk that controls may become inadequate because of changes in conditions, or that the degree of compliance with the policies or procedures may deteriorate.
Critical Audit Matters
The critical audit matter communicated below is a matter arising from the current period audit of the consolidated financial statements that was communicated or required to be communicated to the audit committee and that (i) relates to accounts or disclosures that are material to the consolidated financial statements and (ii) involved our especially challenging, subjective, or complex judgments. The communication of critical audit matters does not alter in any way our opinion on the consolidated financial statements, taken as a whole, and we are not, by communicating the critical audit matter below, providing a separate opinion on the critical audit matter or on the accounts or disclosures to which it relates.
Revenue Recognition
As described in Notes 3 and 4 to the consolidated financial statements, for the year ended December 31, 2025, the Company’s net sales were $1,764.3 million. The Company sells to customers either through long-term arrangements or standalone purchase orders. The Company’s long-term arrangements generally do not include committed volumes until underlying purchase orders are issued. Typically, revenue is recognized on the products the Company sells at a point in time, in accordance with shipping terms or other contractual arrangements.
The principal consideration for our determination that performing procedures relating to revenue recognition is a critical audit matter is a high degree of auditor effort in performing procedures related to the Company’s revenue recognition.
Addressing the matter involved performing procedures and evaluating audit evidence in connection with forming our overall opinion on the consolidated financial statements. These procedures included testing the effectiveness of controls relating to the revenue recognition process. These procedures also included, among others (i) testing certain revenue transactions by developing an independent expectation of revenue and comparing the independent expectation to the amount recorded, and testing the completeness and accuracy of certain data provided by management; (ii) testing certain revenue transactions, on a sample basis, by obtaining and inspecting source documents, such as purchase orders, invoices, shipping documentation, and subsequent cash receipts; and (iii) confirming, on a sample basis, outstanding customer invoice balances as of December 31, 2025 and, for confirmations not returned, obtaining and inspecting source documents, such as purchase orders, invoices, shipping documentation, and subsequent cash receipts.
/s/ PricewaterhouseCoopers LLP
Nashville, Tennessee
February 13, 2026
We have served as the Company’s auditor since 2021.
ATMUS FILTRATION TECHNOLOGIES INC. AND SUBSIDIARIES
CONSOLIDATED STATEMENTS OF NET INCOME
(in millions of U.S. dollars, except per share data)
For the Years Ended December 31,
2025
2024
2023
NET SALES(a)
$
1,764.3
$
1,669.6
$
1,628.1
Cost of sales
1,266.0
1,207.5
1,195.4
GROSS MARGIN
498.3
462.1
432.7
OPERATING EXPENSES AND INCOME
Selling, general and administrative expenses
184.3
187.6
174.7
Research, development and engineering expenses
40.7
40.6
42.5
Equity, royalty and interest income from investees
33.8
34.3
33.6
Other operating expense, net
8.1
2.0
0.7
OPERATING INCOME
299.0
266.2
248.4
Interest expense
33.4
40.6
25.8
Other income, net
0.6
9.2
3.8
INCOME BEFORE INCOME TAXES
266.2
234.8
226.4
Income tax expense
58.8
49.2
55.1
NET INCOME
$
207.4
$
185.6
$
171.3
PER SHARE DATA:
Weighted-average shares for basic EPS
82.2
83.2
83.3
Weighted-average shares for diluted EPS
82.8
83.6
83.4
Basic earnings per share
$
2.52
$
2.23
$
2.06
Diluted earnings per share
$
2.50
$
2.22
$
2.05
(a)Includes sales to related parties of $57.1 million, $121.9 million and $390.8 million for the years ended December 31, 2025, 2024 and 2023, respectively.
ATMUS FILTRATION TECHNOLOGIES INC. AND SUBSIDIARIES
CONSOLIDATED BALANCE SHEETS
(in millions of U.S. dollars, except share data)
December 31, 2025
December 31, 2024
ASSETS
Cash and cash equivalents
$
236.4
$
184.3
Trade and other receivables, net
320.1
254.2
Inventories
282.3
266.6
Prepaid expenses and other current assets
53.6
49.9
Total current assets
892.4
755.0
Property, plant and equipment, net
197.1
186.2
Investments and advances related to equity method investees
89.2
84.9
Goodwill
84.7
84.7
Other assets
87.3
79.5
TOTAL ASSETS
$
1,350.7
$
1,190.3
LIABILITIES
Accounts payable
$
201.9
$
193.1
Accrued compensation, benefits and retirement costs
37.9
37.2
Current portion of accrued product warranty
5.4
4.9
Current maturities of long-term debt
30.0
22.5
Other accrued expenses
93.0
87.2
Total current liabilities
368.2
344.9
Long-term debt
540.0
570.0
Accrued product warranty
8.0
7.3
Other liabilities
56.0
40.7
TOTAL LIABILITIES
972.2
962.9
Commitments and contingencies (Note 14)
EQUITY
Common stock, $0.0001 par value (2,000,000,000 shares authorized, 83,504,555 and 83,403,813 shares issued at December 31, 2025 and December 31, 2024, respectively)
—
—
Additional paid-in capital
72.7
61.9
Retained earnings
454.6
264.5
Accumulated other comprehensive loss
(68.1)
(79.0)
Treasury stock, at cost (1,995,964 shares at December 31, 2025 and 537,643 shares at December 31, 2024)
ATMUS FILTRATION TECHNOLOGIES INC. AND SUBSIDIARIES
NOTES TO CONSOLIDATED FINANCIAL STATEMENTS
NOTE 1. DESCRIPTION OF THE BUSINESS
Atmus Filtration Technologies Inc. (“Atmus” or the “Company”) is one of the global leaders of filtration products for on-highway commercial vehicles and off-highway agriculture, construction, mining and power generation vehicles and equipment. Atmus designs and manufactures advanced filtration products, principally under the Fleetguard brand, that provide superior asset protection and enable lower emissions. Approximately 14% of Atmus’ net sales in 2025 were generated through first-fit sales to OEMs, where its products are installed as components for new vehicles and equipment. Approximately 86% of Atmus’ net sales in 2025 were generated in the aftermarket, where its products are installed as replacement or repair parts, leading to a strong recurring revenue base. Building on its more than 65-year history, Atmus continues to grow and differentiate itself through its global footprint, comprehensive offering of premium products, technology leadership and multi-channel path to market.
In April 2022, Cummins Inc. (“Cummins”) announced its intention to separate its filtration business (the “Filtration Business”) into a standalone publicly traded company (the “Separation”). In preparation for the Separation from Cummins, Atmus, as its predecessor in interest, was incorporated as a wholly-owned subsidiary of Cummins in Delaware on April 1, 2022 in connection with the planned Separation. Prior to the completion of Atmus’ initial public offering (the “IPO”), Cummins completed, in all material respects, the transfer of the assets and liabilities of the Filtration Business to Atmus and its subsidiaries as detailed in the separation agreement Atmus entered into with Cummins.
On September 30, 2022, and as amended on February 15, 2023, Atmus entered into a $1.0 billion credit agreement (“Credit Agreement”) with a syndicate of banks, providing for a $600 million term loan facility (the “term loan”) and a $400 million revolving credit facility (the “revolving credit facility”), in anticipation of the Separation. Borrowings under the Credit Agreement did not become available until the IPO occurred. The facilities covered by the Credit Agreement will mature on September 30, 2027.
Atmus’ Registration Statement on Form S-1, as amended, filed with the Securities and Exchange Commission (“Commission”) on May 16, 2023, was declared effective on May 25, 2023, and Atmus’ common shares began trading on the New York Stock Exchange under the symbol “ATMU” on May 26, 2023. On May 30, 2023, the IPO was completed through the sale on behalf of certain commercial paper holders of Cummins of 16,243,070 shares of common stock, including the underwriters’ full exercise of their 30-day option to purchase an additional 2,118,661 shares to cover over-allotments. None of the proceeds of the IPO were for the benefit of Atmus. As of the closing of the IPO, Cummins owned approximately 80.5% of the outstanding shares of Atmus common stock.
Upon completion of the IPO, Atmus borrowed $650 million, consisting of proceeds of the term loan and amounts drawn under the revolving credit facility, and paid such amounts to Cummins in partial consideration for the Separation.
On February 14, 2024, Cummins announced an exchange offer whereby Cummins shareholders could exchange all or a portion of Cummins common stock for shares of Atmus common stock owned by Cummins. The divestiture of Atmus shares by Cummins was completed on March 18, 2024 and resulted in the full separation of Atmus and divestiture of Cummins’ entire ownership and voting interest in Atmus (“Full Separation”).
NOTE 2. BASIS OF PRESENTATION
As Atmus became a publicly traded company upon the IPO, its financial statements are now presented on a consolidated basis. In preparation for the IPO, the Company’s historical combined financial statements were prepared on a standalone basis, which reflected a combination of entities under common control that had been “carved out” of and derived from the historical consolidated financial statements and accounting records of Cummins.
The financial statements for all periods presented, including the historical results of the Company prior to May 26, 2023, are now referred to as “Consolidated Financial Statements”, and have been prepared in
accordance with generally accepted accounting principles in the United States of America (GAAP). All intercompany balances and transactions are eliminated in consolidation.
Periods Prior to the IPO
Prior to the IPO, Atmus, previously the Filtration Business of Cummins, functioned as part of the larger group of businesses controlled by Cummins and accordingly, utilized centralized functions of Cummins, such as facilities and information technology, to support its operations. A portion of the shared service costs were historically allocated to the Filtration Business. Cummins also performed certain corporate functions for the Filtration Business. The corporate expenses related to the Filtration Business were allocated from Cummins. These allocated costs primarily related to certain governance and corporate functions, including finance, human resources, investor relations, legal, tax, treasury and certain other costs. Where it was possible to specifically attribute such expenses to activities of the Filtration Business, these amounts were charged or credited directly to the Filtration Business without allocation or apportionment. Allocation of other such expenses was based on a reasonable reflection of the utilization of the service provided or benefit received by the Filtration Business for the periods presented prior to the Separation, on a consistent basis, such as a relative percentage of headcount and third-party sales. The aggregate costs allocated for these functions to the Filtration Business are included within the Consolidated Statements of Net Income for the periods presented prior to the Separation.
Management believes these cost allocations were a reasonable reflection of the utilization of services provided to, or the benefit derived by, the Filtration Business during the period prior to the IPO, though the allocations may not be indicative of the actual costs that would have been incurred had the Filtration Business operated as a standalone public company. Actual costs that may have been incurred if the Filtration Business had been a standalone company would depend on a number of factors, including the chosen organizational structure, whether functions were outsourced or performed by the Filtration Business employees, and strategic decisions made in areas such as manufacturing, selling and marketing, research and development, information technology and infrastructure.
Historically, Atmus’ cash was transferred to Cummins on a daily basis. This arrangement was not reflective of the manner in which Atmus would have been able to finance its operations had it been a standalone business separate from Cummins during each of the periods presented.
Cummins’ debt and related interest expense were not allocated to Atmus for any of the periods presented since Atmus was not the legal obligor of the debt and Cummins’ borrowings were not directly attributable to Atmus.
As the separate legal entities that made up the Filtration Business were not historically held by a single legal entity, Cummins’ net investment in this business (“Net Parent Investment”) was presented in lieu of a controlling interest’s equity in the Consolidated Financial Statements.
For the Filtration Business, transactions with Cummins affiliates were included in the Consolidated Statements of Net Income and related balances were reflected as related party receivables and related party payables. Other balances between the Filtration Business and Cummins were considered to be effectively settled in the Consolidated Financial Statements at the time the transactions were recorded.
As of the IPO Date
In connection with the Separation, Atmus entered into various agreements with Cummins, including a separation agreement. In the separation agreement, there were certain assets and liabilities identified in the schedules, including leases and unrecognized tax liabilities, which were retained by Cummins and were reflected as Net Parent Investment in the Company’s Consolidated Financial Statements, and those that were transferred to the Company, including additional pension assets, other compensation obligations and certain other assets and liabilities, which were transferred to the Company through Net Parent Investment in the Company’s Consolidated Financial Statements. These various agreements comprehensively provide a
framework for our relationship with Cummins and govern various interim and ongoing relationships between us and Cummins post IPO.
As part of the Separation, Net Parent Investment was reclassified as Additional Paid-in Capital.
Periods Post IPO
Following the IPO, certain services continue to be provided by Cummins under the transition services agreement. The Company incurred certain costs in its establishment as a standalone public company and expects to incur ongoing additional costs associated with operating as an independent, publicly traded company.
Post IPO, Atmus filed a consolidated Federal income tax return and returns in certain other jurisdictions with Cummins.
Post IPO, Retained earnings began to accumulate and the balance reflected on the Consolidated Balance Sheets reflects earnings for the period May 26, 2023 through December 31, 2025.
Periods Post Full Separation
Following Full Separation, Cummins continued to provide certain services to Atmus under the transition services agreement. The transition services agreement related primarily to administrative services, which were provided through September 2025. Atmus paid Cummins mutually agreed upon fees for these services.
Post Full Separation, Cummins is no longer considered a related party and activity post March 18, 2024, between Atmus and Cummins has been treated as arm’s-length transactions.
Atmus files tax returns in all jurisdictions on its own behalf post Full Separation, and tax balances and effective income tax rates may differ from the amounts reported in the historical periods.
NOTE 3. SUMMARY OF SIGNIFICANT ACCOUNTING POLICIES
Investments in Equity Investees
We use the equity method to account for our investments in joint ventures, affiliated companies and alliances in which we have the ability to exercise significant influence, generally represented by equity ownership or partnership equity of at least 20 percent but not more than 50 percent. Generally, under the equity method, original investments in these entities are recorded at cost and subsequently adjusted by our share of equity in income or losses after the date of acquisition. Equity in income or losses of each investee is recorded according to our level of ownership; if losses accumulate, we record our share of losses until our investment has been fully depleted. If our investment has been fully depleted, we recognize additional losses only when we are the primary funding source. We eliminate (to the extent of our ownership percentage) in our Consolidated Financial Statements the profit in inventory held by our equity method investees that has not yet been sold to a third-party. Dividends received from equity method investees reduce the amount of our investment when received and do not impact our earnings. Our investments are classified as “Investments and advances related to equity method investees” in our Consolidated Balance Sheets. Our share of the results from joint ventures, affiliated companies and alliances is reported in our Consolidated Statements of Net Income as “Equity, royalty and interest income from investees” and is reported net of all applicable income taxes. Our foreign equity investees are presented net of applicable foreign income taxes in our Consolidated Statements of Net Income. See Note 5, Investments in Equity Investees, for additional information.
Use of Estimates in the Preparation of the Consolidated Financial Statements
Preparation of financial statements requires management to make estimates and assumptions that affect reported amounts presented and disclosed in our Consolidated Financial Statements. Significant estimates and assumptions in these Consolidated Financial Statements require the exercise of judgment and are used for, but not limited to, estimates of future cash flows and other assumptions associated with goodwill and long-lived asset impairment tests, useful lives for depreciation and amortization, warranty programs, restructuring costs, income taxes, deferred tax valuation allowances, contingencies and allowances for doubtful accounts. Due to
the inherent uncertainty involved in making estimates, actual results reported in future periods may be different from these estimates.
Revenue From Contracts with Customers
Revenue Recognition Sales of Products
We sell to customers either through long-term arrangements or standalone purchase orders. Our long-term arrangements generally do not include committed volumes until underlying purchase ordersare issued. Typically, we recognize revenue on the products we sell at a point in time, in accordance with shipping terms or other contractual arrangements. All related shipping and handling costs are accrued at the time the related performance obligation has been satisfied.
Our sales arrangements may include the collection of sales and other similar taxes that are then remitted to the related taxing authority. We have elected to present the amounts collected for these taxes net of the related tax expense rather than presenting them as additional revenue.
We grant credit limits and terms to customers based upon traditional practices and competitive conditions. Typical terms vary by market, but payments are generally due in 60 days or less from invoicing for most of our product sales.
Sales Incentives
We provide various sales incentives to both our distribution network and OEM customers. These programs are designed to promote the sale of our products or encourage the usage of our products by OEM customers. When there is uncertainty surrounding these sales incentives, we may reduce the amount of revenue we recognize under a contract through an incentive accrual. When the uncertainty has been resolved the accrual will be adjusted accordingly. Sales incentives primarily fall into three categories:
•Aftermarket rebates;
•Volume and growth rebates; and
•Marketing Development Fund (“MDF”).
For aftermarket rebates, we provide incentives to promote sales to certain dealers and end-markets. These rebates are typically paid on a quarterly, or more frequent, basis. At the time of the sale, we consider the expected amount of these rebates when determining the overall transaction price. Estimates are adjusted at the end of each month or quarter based sales and historical experience.
For volume and growth rebates, we provide certain customers with rebate opportunities for attaining specified volumes during a particular quarter or year. We consider the expected amount of these rebates at the time of the original sale as we determine the sales revenue. We update our assessment of the amount of rebates that will be earned on a monthly or quarterly basis based on our best estimate of the volume levels the customer will reach during the measurement period.
For MDF’s, these are funds to support our customers primarily for business development, marketing and advertising programs, promotional items jointly developed, dealer incentives and partnering programs. Depending on the agreement, the funds are accrued for and paid on a quarterly basis, annual basis, or as agreed with those customers receiving these funds.
Sales Returns
The initial determination of the sales revenue may also be impacted by product returns. Rights of return do not exist for the majority of our sales other than for quality issues. We do offer certain return rights in our aftermarket business, where some aftermarket customers are permitted to return a small amount of filters each year. An estimate of future returns is accounted for at the time of sale as a reduction in the overall sales revenue based on historical return rates.
We translate assets and liabilities of foreign entities to U.S. dollars, where the local currency is the functional currency, at month-end exchange rates. We translate income and expenses to U.S. dollars using weighted-average exchange rates. We record adjustments resulting from translation in a separate component of accumulated other comprehensive loss and include the adjustments in net income only upon sale, loss of controlling financial interest or liquidation of the underlying foreign investment.
Foreign currency transaction gains and losses are included in net income. For foreign entities where the U.S. dollar is the functional currency, including those operating in highly inflationary economies when applicable, we remeasure non-monetary balances and the related income statement amounts using historical exchange rates. We include the resulting gains and losses in net income, including the effect of derivatives in our Consolidated Statements of Net Income, which combined with transaction (losses) gains amounted to $(4.6) million, $2.8 million and $(3.3) million for the years ended December 31, 2025, 2024 and 2023, respectively.
Income Tax Accounting
We determine our income tax expense using the asset and liability method. Under this method, deferred tax assets and liabilities are recognized for the future tax effects of temporary differences between the financial statement carrying amounts of existing assets and liabilities and their respective tax basis. Future tax benefits of net operating loss and credit carryforwards are also recognized as deferred tax assets. We evaluate the recoverability of our deferred tax assets each quarter by assessing the likelihood of future profitability and available tax planning strategies that could be implemented to realize our net deferred tax assets. A valuation allowance is recorded to reduce the tax assets to the net value management believes is more likely than not to be realized. In the event our operating performance deteriorates, future assessments could conclude that a larger valuation allowance will be needed to further reduce the deferred tax assets. In addition, we operate within multiple taxing jurisdictions and are subject to tax audits in these jurisdictions. These audits can involve complex issues, which may require an extended period of time to resolve. We accrue for the estimated additional tax and interest that may result from tax authorities disputing uncertain tax positions. We believe we made adequate provisions for income taxes for all years that are subject to audit based upon the latest information available.
Our income tax provision was prepared following the separate return method, which applies Accounting Standards Codification (“ASC”) 740 to the standalone financial statements of each member of the combined group as if the group member were a separate and standalone enterprise. Due to this treatment, tax transactions included in the Consolidated Financial Statements of the Parent may not be included in the separated Consolidated Financial Statements of the Company. Similarly, there may be certain tax attributes within the Consolidated Financial Statements of the Company that would not be found in the Consolidated Financial Statements and tax returns of the Parent. Examples of such items include net operating losses, tax credits carry forwards and valuation allowances, which may exist in the standalone financial statements but not in the Parent’s Consolidated Financial Statements.
The international tax framework introduced by the Organization for Economic Co-operation (“OECD”) and Development under its Pillar Two initiative includes a global minimum tax of 15 percent. Legislation adopting these provisions has been enacted in certain jurisdictions where the Company operates and was effective for the Company's 2025 fiscal year. The Company has assessed this legislation and does not anticipate any incremental taxes for the 2025 tax year.
In January 2026, the OECD released administrative guidance establishing a ‘Side-by-Side’ safe harbor for eligible U.S.-headquartered multinational groups, effective for fiscal years beginning on or after January 1, 2026. If elected, this safe harbor generally reduces Pillar Two top-up tax exposure under the Income Inclusion Rule and Undertaxed Profits Rule to zero, while Qualified Domestic Minimum Top-up Taxes in jurisdictions where we operate may continue to apply. The Company continues to monitor and evaluate ”the ‘Side-by-Side’ safe harbor and, where appropriate, expect to leverage applicable safe harbor provisions beginning with the fiscal year starting on or January 1, 2026.
On July 4, 2025, the On Big Beautiful Bill Act (“OBBBA”) was enacted in the U.S. The OBBBA includes significant provisions, such as the permanent extension of certain expiring provision of the Tax Cut and Jobs Act, modifications to the international tax framework and the restoration of favorable tax treatment for certain business provisions. The legislation has multiple effective dates, with certain provisions effective in 2025 and
others implemented through 2027. The Company has evaluated the OBBBA and reflected its impact on the consolidated financial statements. We will continue to evaluate the full impact of these legislative changes as additional guidance become available.
A more complete description of our income taxes and the future benefits of our net operating loss and credit carryforwards is disclosed in Note 6, Income Taxes.
Cash and Cash Equivalents
Cash and cash equivalents consist of bank checking accounts and money market accounts. Atmus considers all highly liquid investments with original maturities of three months or less at the time of purchase to be cash equivalents. Cash and cash equivalents are carried at cost, which approximates fair value.
Trade and Other Accounts Receivable
Trade accounts receivable represent amounts billed to customers and not yet collected or amounts that have been earned but may not be billed until the passage of time and are recorded when the right to consideration becomes unconditional. Trade accounts receivable are recorded at the invoiced amount, which approximates net realizable value and generally do not bear interest. Other receivables primarily represent Value-added tax (“VAT”) receivables. Atmus’ purchases, sales and intercompany transfers of goods are subject to VAT. We offset qualified VAT payments to suppliers against our output VAT liabilities. We believe we are entitled to the full VAT amount and that it will be received. The VAT receivable balances were $41.2 million and $19.3 million at December 31, 2025 and 2024, respectively.
Allowance for Doubtful Accounts
The allowance for doubtful accounts is our best estimate of the amount of expected credit losses in our existing accounts receivable. We determine the allowance based on our historical collection experience and by performing an analysis of our accounts receivable in light of the current economic environment. This estimate of expected losses reflects those losses expected to occur over the contractual life of the receivable. We review our allowance for doubtful accounts at least quarterly, and more frequently as needed. In addition, when necessary, we provide an allowance for the full amount of specific accounts deemed to be uncollectible. Account balances are charged off against the allowance in the period in which we determine that it is probable the receivable will not be recovered. The allowance for doubtful accounts balances were $3.4 million and$3.0 million at December 31, 2025 and 2024, respectively. Bad debt write-offs were not material during the three years ended December 31, 2025.
Inventories
Our inventories are stated at the lower of cost or net realizable value. As of December 31, 2025 and 2024, approximately 32.0% and 30.3%, respectively, of our inventories were valued using the last-in, first-out (LIFO) cost method. The cost of other inventories is generally valued using the first-in, first-out (FIFO) cost method. Our inventories include estimates for adjustments related to annual physical inventory results and for inventory cost changes under the LIFO cost method. Due to significant movements of partially-manufactured components and parts between manufacturing plants, we do not internally measure, nor do our accounting systems provide, a meaningful segregation between raw materials and work-in-process. See Note 7, Inventories, for additional information.
Property, Plant and Equipment
We record property, plant and equipment at cost, inclusive of finance lease assets, with the adoption of ASC 842. We depreciate the cost of the majority of our property, plant and equipment using the straight-line method with depreciable lives ranging from 20 to 40 years for buildings and 3 to 15 years for machinery, equipment and fixtures. Finance lease asset amortization is recorded in depreciation expense. We expense normal maintenance and repair costs as incurred. Depreciation expense totaled $26.6 million, $24.8 million and $21.5 million for the years ended December 31, 2025, 2024 and 2023, respectively. See Note 8, Property, Plant and Equipment and Note 9, Leases, for additional information.
We review our long-lived assets for possible impairment whenever events or circumstances indicate that the carrying value of an asset or asset group may not be recoverable. We assess the recoverability of the carrying value of the long-lived assets at the lowest level for which identifiable cash flows are largely independent of the cash flows of other assets and liabilities. An impairment of a long-lived asset or asset group exists when the expected future pre-tax cash flows (undiscounted and without interest charges) estimated to be generated by the asset or asset group is less than its carrying value. If these cash flows are less than the carrying value of such asset or asset group, an impairment loss is measured based on the difference between the estimated fair value and carrying value of the asset or asset group. Assumptions and estimates used to estimate cash flows in the evaluation of impairment and the fair values used to determine the impairment are subject to a degree of judgment and complexity. Any changes to the assumptions and estimates resulting from changes in actual results or market conditions from those anticipated may affect the carrying value of long-lived assets and could result in a future impairment charge. During the year ended December 31, 2025, we recognized impairment charges totaling $8.4 million on idled machinery, equipment, and fixtures. The impairment charges are reflected in the Consolidated Financial Statements as a component of Other operating expense, net.
Leases
We determine if an arrangement contains a lease in whole or in part at the inception of the contract. Right-of-use (“ROU”) assets represent our right to use an underlying asset for the lease term while lease liabilities represent our obligation to make lease payments arising from the lease. All leases greater than 12 months result in the recognition of a ROU asset and a liability at the lease commencement date based on the present value of the lease payments over the lease term. As most of our leases do not provide the information required to determine the implicit rate, we use our incremental borrowing rate based on the information available at commencement date in determining the present value of lease payments. This rate is determined considering factors such as the lease term, our credit standing and the economic environment of the location of the lease. We use the implicit rate when readily determinable.
Our lease terms include all non-cancelable periods and may include options to extend (or to not terminate) the lease when it is reasonably certain that we will exercise that option. Leases that have aterm of 12 months or less at the commencement date are expensed on a straight-line basis over the lease term and do not result in the recognition of an asset or a liability.
Lease expense for operating leases is recognized on a straight-line basis over the lease term. Lease expense for finance leases is generally front-loaded as the finance lease ROU asset is depreciated on a straight-line basis, but interest expense on the liability is recognized utilizing the interest method that results in more expense during the early years of the lease. We have lease agreements with lease and non-lease components, primarily related to real estate, vehicle and information technology (“IT”) assets. For vehicle and real estate leases, we account for the lease and non-lease components as a single lease component. For IT leases, we allocate the payment between the lease and non-lease components based on the relative value of each component. See Note 9, Leases, for additional information.
Goodwill
We have the option to first assess qualitative factors to determine whether it is more likely than not that the fair value of a reporting unit is less than its carrying value as a basis for determining whether it is necessary to perform an annual quantitative goodwill impairment test. We have elected this option for our reporting unit. In addition, the carrying value of goodwill must be tested for impairment on an interim basis in certain circumstances where impairment may be indicated.
When we are required or opt to perform the quantitative impairment test, the fair value of our reporting unit is estimated with either the market approach or the income approach using a discounted cash flow model. Our income approach method uses a discounted cash flow model in which cash flows anticipated over several periods, plus a terminal value at the end of that time horizon, are discounted to their present value using an appropriate rate of return.
The discounted cash flow model requires us to make projections of revenue, gross margin, operating expenses, working capital investment and fixed asset additions for our reporting unit over a multi-year period.
Additionally, management must estimate a weighted-average cost of capital, which reflects a market rate, for our reporting unit for use as a discount rate. The discounted cash flows are compared to the carrying value of the reporting unit and, if less than the carrying value, the difference is recorded as a goodwill impairment loss. In addition, we also perform a sensitivity analysis to determine how much our forecasts can fluctuate before the fair value of a reporting unit would be lower than its carrying amount.
We perform the required procedures as of the end of our fiscal third quarter.
Changes in our projections or estimates, a deterioration of our operating results and the related cash flow effect or a significant increase in the discount rate could decrease the estimated fair value of our reporting unit and result in a future impairment of goodwill. See Note 10, Goodwill, for additional information.
Warranty
We estimate and record a liability for standard warranty programs at the time our products are sold. Our estimates are based on historical experience and reflect management’s best estimates of expected costs at the time products are sold and subsequent adjustment to those expected costs when actual costs differ. As a result of the uncertainty surrounding the nature and frequency of product campaigns, the liability for such campaigns is recorded when we commit to a recall action or when a recall becomes probable and estimable, which generally occurs when it is announced. We review and assess the liability for these programs on a quarterly basis. See Note 11, Product Warranty Liability, for additional information.
Research, Development and Engineering
Our research, development and engineering programs are focused on product improvements, product extensions, innovations and cost reductions for our customers. Research, development and engineering expenditures include salaries, contractor fees, building costs, utilities, testing, technical IT, administrative expensesand allocation of corporate costs and are expensed, net of contract reimbursements, when incurred. Research, development and engineering expenses were $40.7 million, $40.6 million and $42.5 million for the years ended December 31, 2025, 2024 and 2023, respectively.
Related Party Transactions
In accordance with the provisions of various joint venture agreements, we may purchase products and components from our joint ventures, sell products and components to our joint ventures and our joint ventures may sell products and components to unrelated parties. Joint venture transfer prices may differ from normal selling prices. Certain joint venture agreements transfer product at cost, some transfer product on a cost-plus basis, and others transfer product at market value. These purchases and sales take place on terms resulting in margins within a reasonable range of market rates. See Note 17, Relationship with Parent and Related Parties, for additional information.
Segment Information
We operate our business as one operating segment and also one reportable segment based on the manner in which we review and evaluate operating performance. The types of products from which revenue is derived are the same as those described in the description of the business section and the accounting policies are the same as those described in the summary of significant accounting policies.
The operating results are regularly reviewed by Atmus’ chief operating decision maker on a consolidated basis. The chief operating decision maker is our Chief Executive Officer. The chief operating decision maker assesses performance for our business and decides how to allocate resources based on net income that also is reported on the income statement as consolidated net income and is regularly provided with consolidated expense information from the income statement. All expense categories reported within the consolidated income statement are significant expenses. The measurement of business assets is reported on the balance sheet as total consolidated assets.
The chief operating decision maker uses net income predominately in the annual budget and forecasting process. The chief operating decision maker considers budget-to-actual in deciding whether to reinvest profit into the operating segment or for other entity initiatives, such as acquisitions, paying dividends, or share
repurchases. The chief operating decision maker also uses the profit or loss measure for determining compensation of certain employees.
Stock-Based Compensation
We maintain a share-based compensation plan, which authorizes the granting of various equity-based incentives, including restricted stock units (“RSU”s) and performance share units (“PSU”s). Stock compensation expense is generally amortized on a straight line basis over the service period during which awards are expected to vest, generally three years.
RSUs are typically granted to selected employees on an annual basis and vest over three years. Dividend equivalents are paid during the vesting period. The fair value of our RSUs and other stock-based awards is measured at the market price of our Common Stock on the grant date.
PSUs vest based on varying performance, market and service conditions. The fair value of our PSUs is measured at the market price of our Common Stock on the grant date. The final award may equal 0-200 percent of the target grant, based on our actual performance during the vesting period.
Forfeitures are estimated on the grant date for all of our stock-based compensation awards.
Pensions and other Postretirement Benefits
Atmus provides a range of benefits, including pensions, postretirement and post-employment benefits to eligible current and former employees, of which certain of our employees participate. For purposes of Atmus’ Consolidated Financial Statements, participation in Atmus plans are treated as single-employer plans. See Note 13, Pensions and Other Postretirement Benefits, for more information.
Net Parent Investment
Net Parent Investment represents Cummins’ historical investment in us, our accumulated net earnings after taxes and the net effect of transactions with and allocations from Cummins prior to the IPO.
The Consolidated Statements of Changes in Equity include net cash transfers between Cummins and Atmus pursuant to the centralized cash management and other treasury-related functions performed by Cummins for the periods prior to the IPO. The Net Parent Investment account includes the settlement and net effect of transactions with and corporate allocations from Cummins including administrative expenses such as corporate finance, accounting and field shared services, information services, human resources, marketing, corporate office and other services.
In the separation agreement, there were certain assets and liabilities which were retained by Cummins and were reflected as Net Parent Investment in the Company’s Consolidated Financial Statements, and those that were transferred to the Company through Net Parent Investment in the Company’s Consolidated Financial Statements.
The net effect of other assets and liabilities and related income and expenses recorded at the corporate level and pushed down to Atmus are also included in Net Parent Investment.
All transactions reflected in Net Parent Investment in the historical Consolidated Balance Sheets have been considered cash receipts and payments for purposes of the Consolidated Statements of Cash Flows and are reflected in financing activities in the accompanying Consolidated Statements of Cash Flows with the exception of certain non-cash items related to an unrecognized tax liability for FIN48 reserves and leased assets and related depreciation, which were retained by Cummins upon completion of Atmus’ IPO. These items have been included as supplemental information to the Consolidated Statements of Cash Flows.
Recently Adopted Accounting Standards
Income Taxes (Topic 740): Improvements to Income Tax Disclosures
In December 2023, the FASB issued ASU No. 2023-09, Income Taxes (Topic 740): Improvements to Income Tax Disclosures, that requires entities to disclose additional information about federal, state, and foreign income taxes primarily related to the income tax rate reconciliation and income taxes paid. The new standard also
eliminates certain existing disclosure requirements related to uncertain tax positions and unrecognized deferred tax liabilities. The guidance is effective for our fiscal year ending December 31, 2025, with early adoption permitted. The guidance does not affect recognition or measurement in our consolidated financial statements. We adopted this standard in the fourth quarter of 2025 on a prospective basis and it did not have a material impacts to our results of operations, cash flows and financial condition.
Recent Accounting Pronouncements Not Yet Adopted
Income Statement - Reporting Comprehensive Income - Expense Disaggregation Disclosures (Subtopic 220-40): Disaggregation of Income Statement Expenses
In November 2024, the FASB issued ASU No. 2024-03, Income Statement - Reporting Comprehensive Income - Expense Disaggregation Disclosures (Subtopic 220-40): Disaggregation of Income Statement Expenses, which requires disclosure of certain costs and expenses on an interim and annual basis in the notes to the consolidated financial statements. The guidance is effective for annual reporting periods beginning after December 15, 2026 and interim periods within annual reporting periods beginning after December 15, 2027. Early adoption is permitted. The guidance is to be applied either prospectively to financial statements issued for reporting periods after the effective date or retrospectively to any or all prior periods presented in the financial statements. We are currently evaluating the potential impact of adopting this new guidance on our consolidated financial statements and related disclosures.
Intangibles - Goodwill and Other - Internal-Use Software (Subtopic 350-40) - Targeted Improvements to the Accounting for Internal Use-Software
In September 2025, the FASB issued ASU No. 2025-06, Intangibles - Goodwill and Other - Internal-Use Software (Subtopic 350-40) - Targeted Improvement to the Accounting for Internal-Use Software, which modernizes the accounting for software costs that are accounted for under ASC 350-40, Intangibles - Goodwill and Other Internal Use-Software. The guidance is effective for annual reporting periods beginning after December 15, 2027, and interim periods within those annual reporting periods. The guidance can be applied on a prospective basis, a modified basis, a modified basis for in-process projects or on retrospective basis. We are assessing the effect of this update on our consolidated financial statements and related disclosures.
Derivatives and Hedging (Topic 815) - Hedge Accounting Improvement
In November 2025, the FASB issued ASU No. 2025-09, Derivatives and Hedging (Topic 815) - Hedge Accounting Improvements, to better portray the economic results of an entity’s risk management activities in its financial statements and to make certain targeted improvements to simplify the application of the hedge accounting guidance. The guidance is effective for annual reporting periods beginning after December 15, 2026, and interim periods within those annual reporting periods. The guidance should be applied on a prospective basis for all hedging relationships. We are assessing the effect of this update on our consolidated financial statements and related disclosures.
NOTE 4. REVENUE FROM CONTRACTS WITH CUSTOMERS
Disaggregation of Revenue
Revenue by Geographic Area
The table below presents our consolidated sales by geographic area. Net sales attributed to geographic areas were based on the location of the customer.
The table below presents our consolidated sales by product category.
Years ended December 31,
In millions
2025
2024
2023
Fuel
$
797.6
$
720.2
$
705.2
Lube
348.8
326.8
305.4
Air
301.5
288.6
282.4
Other
316.4
334.0
335.1
Total net sales
$
1,764.3
$
1,669.6
$
1,628.1
Revenue by Major Customer
For the years ended December 31, 2025, 2024 and 2023, three external customers, Cummins, PACCAR and the Traton Group, each represented greater than 10% of our annual net sales. These customers represented 18.8% ,16.3% and 11.5% of net sales in 2025, 17.6%, 16.5% and 12.2% of net sales in 2024 and 17.4%, 15.6% and 11.8% of net sales in 2023. No other customers exceeded 10% of net sales in the three years presented.
NOTE 5. INVESTMENTS IN EQUITY INVESTEES
Investments and advances related to equity method investees and our ownership percentages were as follows:
December 31,
In millions
Ownership Percentage
2025
2024
Shanghai Fleetguard Filter Co. Ltd.
50.0
%
$
25.9
$
24.3
Fleetguard Filters Pvt. Ltd.
49.5
%
61.0
58.5
Filtrum Fibretechnologies Pvt. Ltd.
49.7
%
2.3
2.1
Investments and advances related to equity method investees
$
89.2
$
84.9
Dividends received from our unconsolidated equity investees were $21.0 million, $25.5 million and $19.8 million in 2025, 2024 and 2023, respectively.
Equity, royalty and interest income from investees, net of applicable taxes, was as follows:
Years ended December 31,
In millions
2025
2024
2023
Shanghai Fleetguard Filter Co. Ltd
$
6.4
$
5.9
$
5.9
Fleetguard Filters Pvt. Ltd.
20.8
21.8
21.5
Filtrum Fibretechnologies Pvt. Ltd
0.3
0.4
0.2
Atmus share of net income
$
27.5
$
28.1
$
27.6
Royalty and interest income
6.3
6.2
6.0
Equity, royalty and interest income from investees
$
33.8
$
34.3
$
33.6
Our joint ventures are primarily intended to allow us to increase our market penetration in geographic regions, reduce capital spending, streamline our supply chain management and develop technologies. The results and investments in our joint ventures in which we have 50 percent or less ownership are included in “Equity, royalty and interest income from investees” and “Investments and advances related to equity method investees” in our Consolidated Statements of Net Income and Consolidated Balance Sheets, respectively.
•Shanghai Fleetguard Filter Co. Ltd. — Shanghai Fleetguard Filter Co. Ltd. is a limited liability company (Sinoforeign joint venture) incorporated in Shanghai of the People’s Republic of China on
April 27, 1994 by Dongfeng Motor Parts and Components Group Co., Ltd. and Cummins (China) Investment Co. with 50% partnership. Shanghai Fleetguard Filter Co. Ltd.’s approved scope of business operations includes the manufacture and sales of various filters and filter spare parts for diesel engines, trucks, buses, mining, excavators and other construction equipment to customers in China and exports to Atmus. Shanghai Fleetguard Filter Co. Ltd. has three manufacturing sites, Shanghai, Wuhan and Shiyan, with Shanghai being the primary location.
•Fleetguard Filters Pvt. Ltd. — Fleetguard Filters Pvt. Ltd. is a limited company incorporated in 1987 by Perfect Sealing Systems Private Limited (India) and Cummins Filtration Inc. (USA) which set a benchmark by providing premium filtration solutions for both on and off-highway applications from Air, Lube, Fuel, Hydraulic and Water Filtration to Coolants & Chemicals. They focus on supplies to first fit and aftermarket customers in India and exports to Atmus. The Head Office of Fleetguard Filters Pvt. Ltd. is located at Baner, in Pune, Maharashtra, India and has seven manufacturing plants in different states of India — Dharwad in Karnataka, Hosur in Tamil Nadu, Jamshedpur in Jharkhand, Nandur, Wadki and Loni Khalbhor in Maharashtra, and Sitarganj in Uttarakhand.
Equity Investee Financial Summary
Summary financial information for our equity investees was as follows:
Years ended December 31,
In millions
2025
2024
2023
Net sales
$
441.9
$
456.7
$
435.2
Gross margin
175.3
183.0
170.0
Net income
54.2
57.4
56.2
Atmus share of net income
27.5
28.1
27.6
Royalty and interest income
6.3
6.2
6.0
Total equity, royalty and interest income from investees
The Company adopted ASU 2023-09 on a prospective basis as of January 1, 2025. A reconciliation of the statutory U.S. federal income tax rate beginning with a computed income tax expense amount calculated by applying income before income taxes to the US Federal income tax rate to the effective tax rate and income tax expense amount was as follow:
Year ended December 31, 2025
Amount
Percent
(in millions)
U.S. Federal Statutory Tax Rate
$
55.9
21.0
%
Domestic Federal
Cross-Border Tax Laws
Other
0.9
0.3
%
Tax Credits
Research Credits
(1.6)
(0.6)
%
Changes in valuation allowances
1.1
0.4
%
Other
(1.8)
(0.7)
%
State and Local Income Taxes, Net of Federal Income Tax Effect(1)
3.3
1.3
%
Foreign Tax Effects
India
Equity in Earnings - Joint Ventures
(4.4)
(1.7)
%
Withholding Taxes
2.9
1.1
%
Other
(0.1)
—
%
South Africa
Changes in valuation allowances
(3.1)
(1.2)
%
Other
(0.5)
(0.2)
%
Other foreign jurisdictions
5.8
2.3
%
Worldwide changes in unrecognized tax benefits
0.4
0.1
%
Effective Tax Rate
$
58.8
22.1
%
(1)The states that contribute to the majority (greater than 50%) of the tax effect in this category include California, Illinois, Indiana, Kentucky, Pennsylvania, and Tennessee.
A reconciliation of the statutory U.S. federal income tax rate to the effective tax rate for the periods before the adoption of the ASU 2023-09 was as follows:
Years ended December 31,
2024
2023
Statutory U.S. federal income tax rate
21.0
%
21.0
%
State income tax, net of federal effect
1.3
%
1.4
%
Differences in rates and taxability of foreign subsidiaries and joint ventures
(0.7)
%
3.9
%
Research tax credits
(1.1)
%
(1.3)
%
Foreign derived intangible income
(1.3)
%
(1.7)
%
Valuation allowance
2.0
%
—
%
Uncertain tax positions
0.1
%
0.1
%
Other, net
(0.3)
%
0.9
%
Effective tax rate
21.0
%
24.3
%
Our effective tax rate for 2025 was 22.1%, compared to 21.0% for 2024 and 24.3% for 2023. The increase in the effective tax rate from 2024 to 2025 was driven by unfavorable changes in the mix of earnings and lower U.S. credits and incentives following cash tax planning around recent U.S. tax law changes, partially offset by a valuation allowance release on foreign deferred tax assets.
At December 31, 2025, $181.3 million of non-U.S. earnings are considered indefinitely reinvested in operations outside the U.S. for which deferred taxes have not been provided. Determination of the related deferred tax liability, if any, is not practicable because of the complexities associated with the hypothetical calculation.
Carryforward tax benefits and the tax effect of temporary differences between financial and tax reporting that give rise to net deferred tax assets (liabilities) were as follows:
December 31,
In millions
2025
2024
Deferred tax assets
Employee benefit plans
$
9.9
$
8.2
Foreign carryforward benefits
9.7
8.6
Accrued expenses
10.0
10.8
Warranty expenses
2.7
3.1
Lease liabilities
10.3
10.8
Research and development capitalization
2.4
19.2
Other
4.1
3.0
Gross deferred tax assets
49.1
63.7
Valuation allowance
(6.7)
(8.5)
Total deferred tax assets
42.4
55.2
Deferred tax liabilities
Property, plant and equipment
14.1
11.6
Unremitted income of foreign subsidiaries and joint ventures
17.0
16.2
Lease assets
9.8
9.8
Other
0.6
0.7
Total deferred tax liabilities
41.5
38.3
Net deferred tax assets
$
0.9
$
16.9
Our foreign carryforward benefits as of December 31, 2025 may be carried forward indefinitely, subject to certain utilization limitations.
A valuation allowance is recorded to reduce the gross deferred tax assets to an amount we believe is more likely than not to be realized. The valuation allowance is primarily attributable to the uncertainty regarding the realization of foreign net operating loss, foreign currency loss and foreign tax credits.
A reconciliation of the valuation allowance for the years ended December 31, 2025, 2024 and 2023 was as follows:
Years ended December 31,
In millions
2025
2024
2023
Balance at beginning of year
$
8.5
$
3.7
$
16.4
Additions charged to tax expense
2.8
5.4
0.1
Valuation allowance reversal
(4.6)
(0.6)
—
Other(1)
—
—
(12.8)
Balance at end of year
$
6.7
$
8.5
$
3.7
(1)Pursuant to the Separation Agreement, includes certain assets and liabilities, including deferred tax assets, and corresponding valuation allowances which were retained by Cummins and includes the impact of currency changes and the expiration of net operating losses for which a full valuation allowance was recorded.
Our Consolidated Balance Sheets contain the following tax related items:
December 31,
In millions
2025
2024
Prepaid expenses and other current assets
Refundable income taxes
$
20.5
$
14.2
Other assets
Deferred income tax assets
$
14.0
$
18.5
Other accrued expenses
Income tax payable
$
9.4
$
6.8
Other liabilities
Deferred income tax liabilities
$
13.1
$
1.4
A reconciliation of unrecognized tax benefits for the years ended December 31, 2025, 2024 and 2023 was as follows:
December 31,
In millions
2025
2024
2023
Balance at beginning of year
$
0.4
$
0.2
$
22.2
Additions to current year tax positions
0.4
0.2
0.2
Reductions to prior years’ tax positions(1)
—
—
(22.2)
Balance at end of year
$
0.8
$
0.4
$
0.2
(1)Pursuant to the Separation Agreement, includes certain assets and liabilities, including contingency reserves which were retained by Cummins
The total amount of unrecognized tax benefits in 2025, 2024 and 2023, if recognized, would favorably impact the effective tax rate in future periods.
We have accrued interest expense related to the unrecognized tax benefits of $0.1 million, $0 million and $0 million as of December 31, 2025, 2024 and 2023, respectively. We recognize potential accrued interest and penalties related to unrecognized tax benefits in income tax expense.
Audit outcomes and the timing of audit settlements are subject to significant uncertainty. Although we believe that adequate provision has been made for such issues, there is the possibility that the ultimate resolution of such issues could have an adverse effect on our earnings. Conversely, if these issues are resolved favorably in the future, the related provision would be reduced, thus having a positive impact on earnings.
As a result of our global operations, we file income tax returns in various jurisdictions including U.S. federal, state and foreign jurisdictions. We are routinely subject to examination by taxing authorities throughout the world, including Australia, Belgium, Brazil, Canada, China, France, India, Mexico, the U.K. and the U.S. With few exceptions, our U.S. federal, major state and foreign jurisdictions are no longer subject to income tax assessments for years before 2020.
Total income taxes paid were approximately $66.9 million and $41.3 million in 2024 and 2023, respectively.
NOTE 7. INVENTORIES
Inventories are stated at the lower of cost or net realizable value. Inventories included the following:
December 31,
In millions
2025
2024
Finished products
$
217.2
$
213.3
Work-in-process and raw materials
97.2
91.1
Inventories at FIFO cost
314.4
304.4
Excess of FIFO over LIFO
(32.1)
(37.8)
Total inventories
$
282.3
$
266.6
NOTE 8. PROPERTY, PLANT AND EQUIPMENT
Details of our property, plant and equipment balance were as follows:
December 31,
In millions
2025
2024
Land and buildings
$
76.4
$
69.9
Machinery, equipment and fixtures
398.7
361.0
Construction in process
38.9
42.4
Property, plant and equipment, gross
514.0
473.3
Less: Accumulated depreciation
(316.9)
(287.1)
Property, plant and equipment, net
$
197.1
$
186.2
NOTE 9. LEASES
Our lease portfolio consists primarily of real estate and equipment leases. Our real estate leases primarily consist of land, office, distribution, warehousing and manufacturing facilities. These leases typically range in term from 2 to 50 years and may contain renewal options for periods up to 10 years at our discretion. Our equipment lease portfolio consists primarily of vehicles, fork trucks and IT equipment. These leases typically range in term from two years to three years and may contain renewal options. Our leases generally do not contain variable lease payments other than (1) certain foreign real estate leases which have payments indexed
to inflation and (2) certain real estate executory costs (such as taxes, insurance and maintenance), which are paid based on actual expenses incurred by the lessor during the year. Our leases generally do not include residual value guarantees.
Our operating lease cost was $20.5 million, $15.7 million, and $10.5 million for the years ended December 31, 2025, 2024 and 2023, respectively. Our variable lease cost was $0.8 million and $1.0 million for the years ended December 31, 2025 and 2024 and was immaterial for the year December 31, 2023. Our finance lease cost and short-term lease cost were immaterial for the years ended December 31, 2025, 2024 and 2023.
Supplemental balance sheet information related to leases:
December 31,
In millions
2025
2024
Balance Sheet Location
Assets
Operating
$
39.5
$
37.3
Other assets
Finance(1)
2.1
1.5
Property, plant and equipment, net
Total lease assets
$
41.6
$
38.8
Liabilities
Current
Operating
$
17.1
$
12.0
Other accrued expenses
Finance
0.9
0.5
Other accrued expenses
Long-term
Operating
$
23.8
$
26.6
Other liabilities
Finance
1.2
1.0
Other liabilities
Total lease liabilities
$
43.0
$
40.1
(1)Finance lease assets were recorded net of accumulated amortization of $2.1 million and $1.2 million at December 31, 2025 and 2024.
Supplemental cash flow and other information related to leases:
Years ended December 31,
In millions
2025
2024
2023
Cash paid for amounts included in the measurement of lease liabilities
Operating cash flows from operating leases
$
17.9
$
14.3
$
8.8
Right-of-use assets obtained in exchange for lease obligations
Operating leases
$
10.8
$
14.5
$
11.8
Finance leases
$
1.7
$
1.1
$
0.2
Additional information related to leases:
December 31,
2025
2024
Weighted-average remaining lease term (in years)
Operating leases
3.2
3.3
Finance leases
2.7
3.2
Weighted-average discount rate
Operating leases
4.5
%
4.6
%
Finance leases
4.5
%
4.4
%
Following is a summary of the future minimum lease payments due to finance and operating leases with terms of more than one year at lease commencement at December 31, 2025, together with the net present value of the minimum payments:
Goodwill is not amortized but it is subject to impairment testing at the reporting unit on an annual basis, or more often if events or circumstances indicate there may be impairment. We perform a goodwill impairment evaluation for our reporting unit annually. There was no impairment of goodwill during the periods covered by these Consolidated Financial Statements.
NOTE 11. PRODUCT WARRANTY LIABILITY
A tabular reconciliation of the product warranty liability, including accrued product campaigns, was as follows:
For the Years Ended December 31,
In millions
2025
2024
2023
Balance, beginning of year
$
12.2
$
14.0
$
15.5
Provision for base warranties issued
7.6
5.4
8.6
Payments made during period
(4.9)
(5.7)
(6.0)
Changes in estimates for pre-existing product warranties
(2.0)
(1.4)
(4.0)
Foreign currency translation and other
0.5
(0.1)
(0.1)
Balance, end of year
$
13.4
$
12.2
$
14.0
Warranty liabilities on our Consolidated Balance Sheets were as follows:
December 31,
In millions
2025
2024
Current portion
$
5.4
$
4.9
Long-term portion
8.0
7.3
Total
$
13.4
$
12.2
NOTE 12. DEBT AND BORROWING ARRANGEMENTS
Atmus entered into the Credit Agreement with a syndicate of banks, providing for a term loan and a revolving credit facility, in anticipation of the Separation. Borrowings under the Credit Agreement did not become available under the Credit Agreement until the IPO occurred. The facilities covered by the Credit Agreement will mature on September 30, 2027.
Upon completion of the IPO, we borrowed $650 million under the Credit Agreement, consisting of proceeds of the term loan and amounts drawn under the revolving credit facility, and paid such amounts to Cummins in partial consideration for the Separation.
Borrowings under the Credit Agreement bear interest at varying rates, depending on the type of loan and, in some cases, the rates of designated benchmarks and the applicable election made. Generally, U.S. dollar-
denominated loans bear interest at an adjusted term Secured Overnight Financing Rate (“SOFR”) (which includes a 0.10 percent credit spread adjustment to SOFR) for the applicable interest period plus a rate ranging from 1.125 percent to 1.75 percent depending on Atmus’ net leverage ratio. As of December 31, 2025, $570.0 million has been drawn on the term loan and no amount was drawn on the revolving credit facility. The revolving credit facility includes an allowance of up to $50.0 million for outstanding letters of credit drawn under the facility that reduces the availability of funds. As of December 31, 2025, no letters of credit were outstanding. These amounts are included within Long-term debt and Current maturities of long-term debt on the Balance Sheet. As of December 31, 2025, Atmus’ fair value of Long-term debt was approximately$570.0 million, which was derived from Level 2 input measures.
Our credit lines available as of December 31, 2025 and December 31, 2024 include:
As of December 31, 2025
As of December 31, 2024
Facility Amount
Borrowed Amount
Facility Amount
Borrowed Amount
(in millions)
Credit facilities:
Term loan
September 30, 2027(1)
$
600.0
$
570.0
$
600.0
$
592.5
Revolving credit facility
September 30, 2027(1)
400.0
—
400.0
—
(1)Atmus maintains a term loan facility and a revolving credit facility as part of the Credit Agreement. The Credit Agreement includes financial covenants that Atmus maintain certain net leverage, secured net leverage and interest coverage ratios. At December 31, 2025, Atmus was in compliance with all financial covenants under the Credit Agreement. The Credit Agreement also contains customary representations, events of default and covenants, including restrictions on the level of borrowing.
Over the next five years, aggregate principal maturities of our long-term debt are (in millions):
2026
2027
2028
2029
Thereafter
Total
$
30.0
$
540.0
$
—
$
—
$
—
$
570.0
NOTE 13. PENSIONS AND OTHER POSTRETIREMENT BENEFITS
Pension Plans
Atmus has defined benefit pension plans, which provide retirement benefits to eligible participants and are collectively referred to as the “Atmus Plans.” The plans’ benefits are primarily based on employee earnings and credited service.
Plans in two countries, Belgium and Mexico, were newly established in 2023.
The total Atmus Plans’ defined benefit pension plan expenses were $2.5 million in 2025, $1.7 million in 2024 and $0.9 million in 2023. Service costs allocated to Atmus were $1.7 million in 2025, $1.3 million in 2024 and $0.6 million in 2023. These costs are reflected in the Consolidated Financial Statements as a component of Cost of sales, Research, development and engineering expenses and Selling, general and administrative expenses. The non-service costs allocated to Atmus were immaterial for each of the years ended December 31, 2025, 2024 and 2023. These non-service costs are reflected in the Consolidated Financial Statements as a component of Other income, net.
The aggregate status of all over funded plans is recognized as an asset and the aggregate status of all underfunded plans is recognized as a liability in the Consolidated Balance Sheets. The liabilities were $13.8 million and $11.0 million as of December 31, 2025 and 2024, respectively, and are reflected in the Consolidated Financial Statements as a component of Other liabilities. The current portion of the liabilities were immaterial as of December 31, 2025 and 2024. The amounts recognized as assets were $2.3 million and $2.1 million as of December 31, 2025 and 2024, respectively, and are reflected in the Consolidated Financial Statements as a component of Other assets.
The Company is subject to lawsuits and claims arising out of the ordinary course of its business. The Company does not have any currently pending lawsuits or claims that the Company believes, individually or in the aggregate, will have a material adverse effect on its financial position, results of operations, cash flows, liquidity or capital resources. The Company carries various forms of commercial, property and casualty, product liability and other forms of insurance; however, such insurance may not be applicable or adequate to cover the costs associated with a judgment against the Company with respect to these lawsuits, claims and proceedings. While the Company believes it has established adequate accruals for our expected future liability with respect to pending lawsuits, claims and proceedings, where the nature and extent of any such liability can be reasonably estimated based upon presently available information, there can be no assurance that the final resolution of any existing or future lawsuits, claims or proceedings will not have a material adverse effect on Atmus’ business, results of operations, financial condition or cash flows.
Indemnifications
Periodically, Atmus enters various contractual arrangements where it agrees to indemnify a third-party against certain types of losses. Atmus regularly evaluates the probability of having to incur costs associated with these indemnities and accrue for expected losses that are probable. Because the indemnifications are not related to specified known liabilities, and due to their uncertain nature, Atmus is unable to estimate the maximum amount of the potential loss associated with these indemnifications.
Following are the changes in accumulated other comprehensive income (loss) by component:
For the Years Ended December 31,
2025
2024
2023
(in millions)
Currency translation adjustments:
Balance at beginning of period
$
(79.4)
$
(56.1)
$
(56.7)
Currency translation adjustments
12.3
(23.3)
0.6
Other comprehensive income (loss), net
12.3
(23.3)
0.6
Balance at end of period
(67.1)
(79.4)
(56.1)
Pensions and other benefit plans:
Balance at beginning of period
$
0.4
$
(0.1)
$
0.9
Change in pensions and other benefit plans
(1.8)
0.6
(1.5)
Tax benefit/(expense)
0.5
(0.1)
0.5
Other comprehensive (loss) income, net
(1.3)
0.5
(1.0)
Balance at end of period
(0.9)
0.4
(0.1)
Unrealized loss on derivatives:
Balance at beginning of period
$
—
$
—
$
—
Unrealized loss during period
(0.1)
—
—
Other comprehensive loss, net
(0.1)
—
—
Balance at end of period
(0.1)
—
—
Accumulated other comprehensive loss:
Balance at beginning of period
$
(79.0)
$
(56.2)
$
(55.8)
Total other comprehensive income (loss), net
10.9
(22.8)
(0.4)
Balance at end of period
$
(68.1)
$
(79.0)
$
(56.2)
NOTE 16. SHARE REPURCHASE PROGRAM
Effective July 17, 2024, Atmus’ Board of Directors authorized a $150.0 million share repurchase program. The program does not have an expiration date and may be suspended or discontinued at any time. Repurchases under the program are determined by management and are wholly discretionary.
Since inception of the program, the Company repurchased approximately 2.0 million shares of common stock at an average cost of $40.41 per share, or an aggregate cost of approximately $80.7 million. During the year ended December 31, 2025, the Company repurchased 1.5 million shares of Common stock at an average cost of $41.58 per share, or an aggregate cost of approximately $60.7 million, all of which was paid during the period. All share repurchases were funded through available cash on hand. As of December 31, 2025, the Company had approximately $69.3 million in remaining share repurchase capacity.
NOTE 17. RELATIONSHIP WITH RELATED PARTIES
As described in Note 1, Description of the Business, Atmus had been managed and operated in the normal course of business with other subsidiaries of Cummins until March 18, 2024, when the Full Separation was completed. Accordingly, certain shared costs prior to the IPO have been allocated to Atmus and reflected as expenses in the Consolidated Financial Statements. Management of Cummins and Atmus consider the allocation methodologies used to be reasonable and appropriate reflections of historical expenses of Cummins attributable to Atmus for purposes of the Consolidated Financial Statements; however, the expenses reflected in the Consolidated Financial Statements may not be indicative of the actual expenses that would have been incurred during the periods presented if Atmus historically operated as a separate, stand-alone entity. In addition, the expenses reflected in the Consolidated Financial Statements may not be indicative of expenses that will be incurred in the future by Atmus.
The Company entered into the separation agreement and transition services agreement with Cummins, among other transaction agreements, all of which will govern the parties relationship following the IPO and Full Separation. This relationship includes services provided by Cummins to the Company for a fixed term on a service-by-service basis. We paid Cummins mutually agreed-upon fees for the services provided under the transition services agreement, which were provided through September 2025. The fees paid to Cummins may not be indicative of costs for the same services provided by another provider.
Corporate Costs/Allocations
The Consolidated Financial Statements include corporate costs incurred by Cummins for services that were provided to or on behalf of Atmus for the period prior to IPO. Such costs represent shared services and infrastructure provided by Cummins, including administrative, finance, human resources, information technology, legal, and other corporate and infrastructure services.
The corporate costs reflected in the Consolidated Financial Statements consist of direct charges to the business and indirect allocations to Atmus. The costs that were directly charged to Atmus, such as the shared services for finance provided by Cummins Business Services, were primarily determined based on actual usage.
Indirect allocations are related to shared services and infrastructure provided by Cummins that would benefit Atmus but were not directly charged to Atmus in a manner discussed above. These corporate costs were allocated to Atmus using methods management believes are consistent and reasonable. The primary allocation factor was third-party revenue; however, other relevant metrics were also utilized based on the nature of the underlying activities. For example, headcount was used as the allocation driver to allocate the human resource departmental costs.
The expenses allocated and directly charged reflect all expenses that Cummins incurred on behalf of the Company. The expenses reflected in the Consolidated Financial Statements prior to the IPO may not be indicative of the actual expenses that would have been incurred during the period presented if Atmus historically operated as a separate, stand-alone entity. All corporate charges and allocations have been deemed paid by Atmus to Cummins in the period in which the cost was recognized in the Consolidated Statements of Income.
Total corporate costs allocated to Atmus were $0 million, $0 million and $13.7 million for the years ended December 31, 2025, 2024 and 2023, respectively. Allocated corporate costs are included in Net sales, Cost of sales, Selling, general and administrative expenses, Research, development and engineering expenses and Other income, net. Post-IPO, Atmus has and will continue to incur its own corporate costs associated with being a standalone publicly traded company.
Related Party Balances
Following the full separation, Cummins is no longer considered a related party. Atmus’ sales to Cummins from January 1, 2024 through the date of full separation, March 18, 2024, were $65.4 million compared to $282.5 million for the year ended December 31, 2023.
NOTE 18. STOCK-BASED COMPENSATION
Under the Atmus 2022 Omnibus Incentive Plan, Atmus is authorized to issue a maximum of 7.5 million shares of common stock to Atmus employees and non-employee directors.
Restricted Stock Units and Performance Share Units
During the years ended December 31, 2025, 2024, and 2023, Atmus recognized compensation expense related to RSUs and PSUs, as a component of Selling, general, and administrative expense, in its Consolidated Statements of Income of $12.4 million, $11.9 million, and $5.5 million, respectively. The unamortized compensation expense related to Atmus RSUs and PSUs was $16.0 million and is expected to be recognized over a weighted-average period of 1.7 years.
Basic net earnings per share (“EPS”) is computed by dividing net earnings by the weighted average number of outstanding common shares. Diluted net EPS reflects the increase in weighted average common shares outstanding that would result from the assumed exercise of outstanding stock incentive plan awards calculated using the treasury stock method.
Basic and diluted EPS were calculated as follows:
For the Years Ended December 31,
2025
2024
2023
(in millions, except per share data)
Net income
$
207.4
$
185.6
$
171.3
Weighted-average shares for basic EPS
82.2
83.2
83.3
Plus incremental shares from assumed conversions of long-term incentive plan shares
Geographic data for long-lived assets, excluding deferred taxes, goodwill, intangible assets and equity method investments, included the following:
December 31, 2025
December 31, 2024
(in millions)
United States
$
102.4
$
103.5
Mexico
43.5
42.6
France
30.8
25.9
Korea
26.2
25.6
Other international
33.7
25.8
Long-lived assets
$
236.6
$
223.4
Other accrued expenses included the following:
December 31, 2025
December 31, 2024
(in millions)
Marketing accruals
$
55.0
$
46.9
Current portion of operating lease liabilities
17.1
12.0
Income taxes payable
9.4
6.8
Other taxes payables
4.5
14.9
Current portion of finance lease liabilities
0.9
0.5
Other
6.1
6.1
Other accrued expenses
$
93.0
$
87.2
Other liabilities included the following:
December 31, 2025
December 31, 2024
(in millions)
Long-term portion of operating lease liabilities
$
23.8
$
26.6
Deferred income taxes
13.1
1.4
Long-term income taxes
0.8
0.4
Other long-term liabilities
18.3
12.3
Other liabilities
$
56.0
$
40.7
NOTE 21. SUBSEQUENT EVENTS
2026 Acquisition - Koch Filter Corporation
On November 21, 2025, the Company entered into a stock purchase agreement to acquire Koch Filter Corporations (“Koch Filter”). The transaction closed on January 7, 2026, whereby the Company purchased all of the issued and outstanding shares of Koch Filter for approximately $450 million in cash at closing, net of working capital adjustments. Koch Filter is a U.S. manufacturer of essential air filtration solutions for various end-markets, including industrial and commercial HVAC, data centers, and power generation. Koch Filter provides the Company a substantial platform for expanding into the industrial air filtration market. The acquired business will be reported in the Company’s Industrial Solutions segment, a reportable segment created with the acquisition of Koch Filter.
Credit Agreement
On January 7, 2026, the Company entered into an Amended and Restated Credit Agreement (the “2026 Credit Agreement”) with a syndicate of banks. The 2026 Credit Agreement amended and restated the Company’s previously existing credit agreement, which provided for a $600 million term loan facility, of which
approximately $570 million was outstanding as of the Closing Date, and a $400 million revolving credit facility. The 2026 Credit Agreement provides for a term loan facility of $1.0 billion and $500 million revolving credit facility, both of which mature on January 7, 2031. The term loan facility was drawn on fully for the amount of $1.0 billion.
The term loan facility will amortize in quarterly installments due on the last business day of each fiscal quarter, commencing with the fifth full fiscal quarter after the Closing Date, in an aggregate annual amount of 2.50% of the original aggregate principal amount of the term loan facility incurred on the Closing Date, increasing on the last business day of the ninth full fiscal quarter after the Closing Date to an aggregate annual amount equal to 5.00% of the original aggregate principal amount of the term loan facility incurred on the Closing Date, with the balance, plus accrued interest, due and payable on the term loan maturity date.
Borrowings under the 2026 Credit Agreement bear interest at varying rates, depending on the type of loan and, in some cases, the rates of designated benchmarks and the applicable election made. Generally, U.S. dollar-denominated loans bear interest at daily SOFR for the applicable interest period plus a rate ranging from 1.125% to 1.750% depending on Atmus’ net leverage ratio.
Item 9. Changes in and Disagreements with Accountants on Accounting and Financial Disclosure
None.
Item 9A. Controls and Procedures
Evaluation of Disclosure Controls and Procedures
The Company's disclosure controls and procedures are designed to ensure that information required to be disclosed by the Company in the reports that it files or submits under the Securities Exchange Act of 1934, as amended (the “Exchange Act”) is recorded, processed, summarized and reported within the time periods specified in the SEC’s rules and forms, and that such information is accumulated and communicated to management, including its Chief Executive Officer and Chief Financial Officer, as appropriate to allow timely decisions regarding required disclosure.
As required by Rules 13a-15 and 15d-15 under the Exchange Act, management, including our Chief Executive Officer and Chief Financial Officer, carried out an evaluation of the effectiveness of our disclosure controls and procedures as of December 31, 2025. Based upon their evaluation, our Chief Executive Officer and Chief Financial Officer concluded that our disclosure controls and procedures (as defined in Rules 13a-15(e) and 15d-15(e) under the Exchange Act) were effective as of December 31, 2025.
Report of Management on Internal Control over Financial Reporting
Management is responsible for establishing and maintaining adequate internal control over financial reporting as defined in Rules 13a-15(f) and 15d-15(f) under the Exchange Act. Our internal control over financial reporting is a process designed by, or under the supervision of, our Chief Executive Officer and Chief Financial Officer, or persons performing similar functions, and effected by the Company’s Board of Directors, management and other personnel to provide reasonable assurance regarding the reliability of financial reporting and the preparation of financial statements for external purposes in accordance with generally accepted accounting principles. Our internal control over financial reporting includes those written policies and procedures that:
•Pertain to the maintenance of records that, in reasonable detail, accurately and fairly reflect the transactions and dispositions of assets;
•Provide reasonable assurance that transactions are recorded as necessary to permit preparation of financial statements in accordance with generally accepted accounting principles;
•Provide reasonable assurance that receipts and expenditures are being made only in accordance with management and director authorization; and
•Provide reasonable assurance regarding prevention or timely detection of unauthorized acquisition, use or disposition of assets that could have a material effect on the consolidated financial statements.
Because of its inherent limitations, internal control over financial reporting may not prevent or detect misstatements. Also, projections of any evaluation of effectiveness to future periods are subject to the risk that controls may become inadequate because of changes in conditions, or that the degree of compliance with the policies or procedures may deteriorate.
Management assessed the effectiveness of our internal control over financial reporting as of December 31, 2025. Management based this assessment on the criteria described in “Internal Control - Integrated Framework” (2013) issued by the Committee of Sponsoring Organizations of the Treadway Commission (“COSO”).
Based on this assessment, management concluded that the Company’s internal control over financial reporting is effective as of December 31, 2025, based on the criteria in Internal Control - Integrated Framework issued by the COSO.
PricewaterhouseCoopers LLP, an independent registered public accounting firm, has audited the effectiveness of the Company’s internal control over financial reporting as of December 31, 2025, as stated in their report that appears under Item 8.
Changes in Internal Control over Financial Reporting
The Company is in the process of implementing a broad, multi-year, technology transformation project to modernize enterprise resource planning, middleware and legacy systems to achieve better process efficiencies across customer service, merchandising, sourcing, payroll and accounting through the use of various solutions. There have been no material additional implementations during the quarter ended December 31, 2025. As the Company’s technology transformation project continues, the Company continues to emphasize the maintenance of effective internal controls and assessment of the design and operating effectiveness of key control activities throughout development and deployment of each phase and will evaluate as additional phases are deployed.
There was no other change in the Company’s internal control over financial reporting (as defined in Rule 13a-15(f) under the Exchange Act) that occurred during the quarter ended December 31, 2025 that materially affected, or is reasonably likely to materially affect, Atmus’ internal control over financial reporting.
Item 9B. Other Information
(b) 10b5-1 Trading Arrangements
During the three months ended December 31, 2025, no director or executive officer of the Company adopted, modified or terminated a “Rule 10b5-1 trading arrangement” or “non-Rule 10b5-1 trading arrangement,” as each term is defined in Item 408(a) of Regulation S-K.
Item 9C. Disclosure Regarding Foreign Jurisdictions that Prevent Inspections
Item 10. Directors, Executive Officers and Corporate Governance
The information required by this Item, not already provided herein under Item 1. Business – Management, will be included in our Proxy Statement for the 2026 Annual Meeting of Shareholders (the “2026 Proxy Statement”). The 2026 Proxy Statement will be filed within 120 days after the close of the fiscal year ended December 31, 2025. Except as otherwise specifically incorporated by reference, our Proxy Statement is not deemed to be filed as part of this Annual Report.
Item 11. Executive Compensation
The information required by this Item will be included in the 2026 Proxy Statement. The 2026 Proxy Statement will be filed within 120 days after the close of the fiscal year ended December 31, 2025 and such information is incorporated herein by reference.
Item 12. Security Ownership of Certain Beneficial Owners and Management and Related Shareholder Matters
The information required by this Item will be included in the 2026 Proxy Statement. The 2026 Proxy Statement will be filed within 120 days after the close of the fiscal year ended December 31, 2025 and such information is incorporated herein by reference.
Item 13. Certain Relationships and Related Transactions and Director Independence
The information required by this Item will be included in the 2026 Proxy Statement. The 2026 Proxy Statement will be filed within 120 days after the close of the fiscal year ended December 31, 2025 and such information is incorporated herein by reference.
Item 14. Principal Accounting Fees and Services
The information required by this Item will be included in the 2026 Proxy Statement. The 2026 Proxy Statement will be filed within 120 days after the close of the fiscal year ended December 31, 2025 and such information is incorporated herein by reference.
All other schedules (Schedules I, II, III, IV and V) for which provision is made in the applicable accounting regulations of the SEC are not required under the related instruction, or are inapplicable and therefore have been omitted or the required information is shown in the consolidated financial statements or the accompanying notes to the consolidated financial statements.
Inline XBRL Instance Document - the instance document does not appear in the Interactive Data File because its XBRL tags are embedded within the Inline XBRL document.
Cover Page Interactive Data File (embedded with the Inline XBRL Document).
+
Identifies each management contract or compensatory plan or arrangement.
#
Certain exhibits and schedules have been omitted pursuant to Item 601(a)(5) of Regulation S-K. The registrant hereby undertakes to furnish supplementally a copy of any omitted exhibit or schedule upon request by the Commission.
*
Filed with this annual report on Form 10-K are the following materials formatted in iXBRL (Inline Extensible Business Reporting Language): (i) the Consolidated Statements of Net Income for the years ended December 31, 2025, 2024, and 2023, (ii) the Consolidated Statements of Comprehensive Income for the years ended December 31, 2025, 2024 and 2023, (iii) the Consolidated Balance Sheets at December 31, 2025 and December 31, 2024, (iv) the Consolidated Statements of Cash Flows for the years ended December 31, 2025, 2024 and 2023, (v) the Consolidated Statements of Changes in Equity for the years ended December 31, 2025, 2024 and 2023, and (vi) Notes to Consolidated Financial Statements.
Pursuant to the requirements of Section 13 or 15(d) of the Securities Exchange Act of 1934, the registrant has duly caused this report to be signed on its behalf by the undersigned, thereunto duly authorized, on February 13, 2026.
ATMUS FILTRATION TECHNOLOGIES INC.
By
/s/ Jack M. Kienzler
Jack M. Kienzler
Senior Vice President, Chief Financial Officer and Chief Accounting Officer
(Principal Financial Officer)
Pursuant to the requirements of the Securities Exchange Act of 1934, this report has been signed below by the following persons on behalf of the Registrant and in the capacities indicated, on February 13, 2026.
Signature
Title
/s/ Stephanie J. Disher
Chief Executive Officer and President (Principal Executive Officer) and Director