Adi Leviatan, CEO of Enlight Renewable Energy: “The third quarter financial results reflect impressive achievements above our expectations, underscoring the Company's strength,
the dedication of team, and our focused business strategy. Enlight is well positioned for continued accelerated global growth, capitalizing on opportunities in the renewable energy market, which continues to benefit from favorable fundamentals. We
will continue to operate with innovation and responsibility to develop the clean energy sector and strengthen our position as a leading player in the global energy market.”
This quarter we continued to expand our portfolio and advance our projects through the various phases of development. Enlight’s total portfolio is comprised of 20.4 GW of
generation capacity and 58.1 GWh energy storage (totaling 37.0 FGW2), an increase of 23% from the total portfolio of 30.2 FGW at the end of 2024. Of this, the Mature portfolio component (including operating
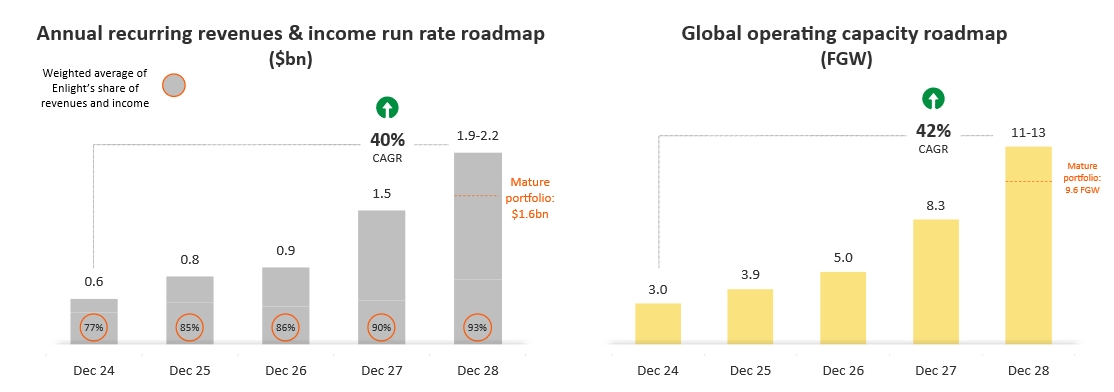
projects, projects under construction or in pre-construction) contains 6.2 GW generation capacity and 11.8 GWh of storage (9.6 FGW in total), an increase of 12% from the Mature portfolio of 8.6 FGW at the end of 2024.
Enlight has achieved safe harbor status for its entire U.S. Mature portfolio (5.6 FGW), as well as for an additional 3.3 FGW of projects in its Advanced Development and
Development portfolios. An additional 5-8 FGW of projects are expected to achieve safe harbor status by July 2026, of which 2-4 FGW are expected to be safe harbored by the end of this year.
With the completion of the current Mature portfolio’s pre-construction and under construction projects, Enlight’s
operating capacity is expected to rise to 9.6 FGW and to generate an annualized revenue and income run rate of $1.6bn by the end of 2028.
Roadmap to Revenues and Income Run-Rate of ~$2.0bn by the end of 20285
Project and Corporate Finance
|
• |
During the quarter, the Company secured project finance from multiple sources to support our U.S. expansion plans:
|
|
o |
Financial close totaling approximately $1.4bn of loans for the Snowflake A project (1.1 FGW), the largest in the Company's history. Snowflake A is expected to reach COD by 2H27, and generate revenues and
income of $223-229m and EBITDA of $199-204m in its first full year of operation.
|
|
o |
Tax equity financing for the Roadrunner and Quail Ranch projects (0.8 FGW combined) totaling approximately $470m. Both projects are expected to reach COD by the end of this year, and together generate revenues
and income of $143-147m and EBITDA of $124-127m in their first full year of operation.
|
5 Expected Adjusted EBITDA margin of approximately 70%-80% (including tax
benefits) for the years shown. FGW (Factored GW) is a consolidated metric combining generation and storage capacity into a uniform figure based on the ratio of construction costs. The company’s current weighted average construction cost ratio
is 3.5 GWh of storage per 1 GW of generation: FGW = GW + GWh / 3.5. The expected growth in 2028 encompasses the Company’s operations in all geographies. Expected growth relies on business plans which rely on development conditions and
assumptions regarding electricity prices, and are contingent on current trends known to the Company at this time. The company's revenues from tax benefits are estimated at approximately 19-23% of the total revenues & income run rate for
December 2025; approximately 24-28% of the total revenue run rate for December 2026, and approximately 28-33% of the total revenues & income run rate for December 2027 and December 2028.
|
o |
Completion of a $350m mezzanine loan with competitive margins of 2.7% - 3.2% above SOFR and flexible drawdown and repayment terms, supporting the development and operational needs of projects now under
construction in the U.S.
|
|
• |
Raising approximately $300m in share equity through a private placement to Israeli institutional investors.
|
|
• |
Cash and cash equivalents at the “topco” level6 were $387m as at the balance sheet date.
|
|
• |
As at the balance sheet date, the Company maintained $525m of credit facilities, of which $109m have been drawn. In addition, we have approximately $1.4bn of LC and surety bond facilities supporting our global
expansion, of which $590m has been drawn at end of the quarter.
|
2025 Guidance
Construction and commissioning
|
• |
We expect commissioning of Roadrunner and Quail Ranch, with a combined capacity of 0.8 FGW, toward the end of 2025.
|
Raising financial guidance ranges
|
• |
Total revenues and income7 for 2025 are now expected to range between $555m and $565m, up 6.0% at the midpoint from the previous range of $520m to $535m.
|
|
• |
Adjusted EBITDA8 for 2025 is expected to range between $405m and $415m, up 4.5% at the midpoint from the previous range of $385m to $400m.
|
|
• |
Approximately 90% of the electricity volumes expected to be generated in 2025 will be sold at fixed prices through PPAs or hedges.
|
6 Including Enlight Renewable Energy, headquarter companies in Europe and the U.S. and Clenera, and excluding
other subsidiaries and project-linked entities.
7 Total revenues and income include revenues from the sale of electricity along with income from tax benefits from
US projects amounting to $80m-$90m.
8 EBITDA is a non-IFRS financial measure. The Company is unable to provide a reconciliation of EBITDA to Net
Income on a forward-looking basis without unreasonable effort because items that impact this IFRS financial measure are not within the Company’s control and/or cannot be reasonably predicted. Please refer to the reconciliation table in Appendix
2.
Financial Results Analysis
|
Revenues & Income by Segment
|
|
($ millions)
|
For the three months ended
|
For the nine months ended
|
|
Segment
|
30/09/2025
|
30/09/2024
|
% change
|
30/09/2025
|
30/09/2024
|
% change
|
|
MENA
|
78
|
55
|
40%
|
173
|
122
|
42%
|
|
Europe
|
45
|
46
|
(2%)
|
145
|
147
|
(2%)
|
|
U.S.
|
42
|
9
|
379%
|
111
|
19
|
493%
|
|
Other
|
0
|
3
|
(92%)
|
1
|
7
|
(82%)
|
|
Total Revenues & Income
|
165
|
113
|
46%
|
430
|
295
|
46%
|
Revenues & Income
In the third quarter of 2025, the Company’s total revenues and income increased to $165m, up from $113m last year, a growth rate of 46% year over year.
This was composed of revenues from the sale of electricity, which rose 27% to $139m compared to $109m in the same period of 2024, as well as recognition of $27m in income from tax benefits compared to $4m in 3Q24.
The Company benefited from the revenues and income contribution of newly operational projects. In the past 12 months 106 MW and 1,435 MWh of new projects
were connected to the grid and began selling electricity, including Atrisco in the U.S, various projects in Israel, Pupin in Serbia, and Tapolca in Hungary. The most notable increases in revenue from the sale of electricity originated at Atrisco,
which added $11m, followed by Israeli projects with $7m, while Pupin contributed $4m. In total, new projects contributed $22m to revenues from the sale of electricity. Recognition of tax benefit income increased by $23m due to the initial
commissioning of Atrisco. Revenues and income for the quarter were distributed between MENA (27%), Europe (47%), and the US (26%).
Net Income
In the third quarter of 2025, the Company reported net income of $32m, representing a 33% increase from $24m in the same period last year. New projects
contributed $12m to net income, while the refinancing of the Gecama wind project added an additional $10m to net income. This was offset by a $5m rise in operating expenses and a decline of $7m other income, all after tax.
Adjusted EBITDA9
The Company’s Adjusted EBITDA grew by 23% to $112m in the third quarter of 2025, compared to $91m for the same period in 2024. Growth in revenues and income contributed $52m.
This was offset by an increase of $17m in COGS linked to the addition of new projects, and an increase of $7m in G&A expenses. During the quarter, the Company recognized $3m in compensation linked to turbine failures at the Björnberget project
in Sweden, compared the recognition of $10m in compensation at the same project during 3Q24.
9 The Company is unable to provide a reconciliation of Adjusted EBITDA to Net Income on a forward-looking basis without unreasonable effort because items that
impact this IFRS financial measure are not within the Company’s control and/or cannot be reasonably predicted. Please refer to the reconciliation table in Appendix 2.
Conference Call Information
Enlight plans to hold its Third Quarter 2025 Conference Call and Webcasts on Wednesday, November 12, 2025 to review its financial
results and business outlook in both English and Hebrew. Management will deliver prepared remarks followed by a question-and-answer session. Participants can join by dial-in or webcast:
| • |
English Conference Call at 8:00am ET / 3:00pm Israel:
|
Please pre-register to join by conference call using the following link:
https://register-conf.media-server.com/register/BIc02636ac75af4b9b962a688d1f9e8115
Upon registering, you will be emailed a dial-in number, direct passcode and unique PIN.
| • |
English Webcast at 8:00am ET / 3:00pm Israel:
|
Please register and join by webcast at the following link:
https://edge.media-server.com/mmc/p/ovpd9nik
| • |
Hebrew Webcast at 6:00am ET / 1:00pm Israel:
|
Please join the webcast at the following link:
https://enlightenergy-co-il.zoom.us/webinar/register/WN__wcPWrTGTXyuXG6P-eO3dw
The press release with the financial results as well as the
investor presentation materials will be accessible from the Company’s website prior to the conference call. An archived version of the webcast will be available on the Company’s investor relations website at https://enlightenergy.co.il/info/investors/.
Supplemental Financial and Other Information
We intend to announce material information to the public through the Enlight investor
relations website at https://enlightenergy.co.il/info/investors, SEC filings, press releases, public conference calls, and public webcasts. We use these channels to communicate with our investors, customers, and the public about our
company, our offerings, and other issues. As such, we encourage investors, the media, and others to follow the channels listed above, and to review the information disclosed through such channels. Any updates to the list of disclosure channels
through which we will announce information will be posted on the investor relations page of our website.
Non-IFRS Financial Measures
This release presents Adjusted EBITDA, a financial metric, which is provided as a complement to the results provided in accordance with the International
Financial Reporting Standards as issued by the International Accounting Standards Board (“IFRS”). A reconciliation of the non-IFRS financial information to the most directly comparable IFRS financial measure is provided in the accompanying tables
found at the end of this release.
We define Adjusted EBITDA as net income (loss) plus depreciation and amortization, share based compensation, finance expenses, taxes on income and share
in losses of equity accounted investees and minus finance income and non-recurring portions of other income, net. For the purposes of calculating Adjusted EBITDA, compensation for inadequate performance of goods and services procured by the Company
are included in other income, net. Compensation for inadequate performance of goods and services reflects the profits the Company would have generated under regular operating conditions and is therefore included in Adjusted EBITDA. With respect to
gains (losses) from asset disposals, as part of Enlight’s strategy to accelerate growth and reduce the need for equity financing, the Company sells parts of or the entirety of selected renewable project assets from time to time, and therefore
includes realized gains or losses from these asset disposals in Adjusted EBITDA. In the case of partial assets disposals, Adjusted EBITDA includes only the actual consideration less the book value of the assets sold. Our management believes
Adjusted EBITDA is indicative of operational performance and ongoing profitability and uses Adjusted EBITDA to evaluate the operating performance and for planning and forecasting purposes.
Non-IFRS financial measures have limitations as analytical tools and should not be considered in isolation or as substitutes for financial information
presented under IFRS. There are a number of limitations related to the use of non-IFRS financial measures versus comparable financial measures determined under IFRS. For example, other companies in our industry may calculate the non-IFRS financial
measures that we use differently or may use other measures to evaluate their performance. All of these limitations could reduce the usefulness of our non-IFRS financial measures as analytical tools. Investors are encouraged to review the related
IFRS financial measure, Net Income, and the reconciliations of Adjusted EBITDA provided below to Net Income and to not rely on any single financial measure to evaluate our business.
Special Note Regarding Forward-Looking Statements
This press release contains forward-looking statements within the meaning of the U.S. Private Securities Litigation Reform Act of 1995. We intend such
forward-looking statements to be covered by the safe harbor provisions for forward-looking statements as contained in Section 27A of the Securities Act of 1933, as amended, and Section 21E of the Securities Exchange Act of 1934, as amended. All
statements contained in this press release other than statements of historical fact, including, without limitation, statements regarding the Company’s business strategy and plans, capabilities of the Company’s project portfolio and achievement of
operational objectives, market opportunity, utility demand and potential growth, discussions with commercial counterparties and financing sources, pricing trends for materials, progress of Company projects, including anticipated timing of related
approvals and project completion and anticipated production delays, the Company’s future financial results, expected impact from various regulatory developments and anticipated trade sanctions, expectations regarding wind production, electricity
prices and windfall taxes, and Revenues and Income and Adjusted EBITDA guidance, the expected timing of completion of our ongoing projects, and the Company’s anticipated cash requirements and financing plans , are forward-looking statements. The
words “may,” “might,” “will,” “could,” “would,” “should,” “expect,” “plan,” “anticipate,” “intend,” “target,” “seek,” “believe,” “estimate,” “predict,” “potential,” “continue,” “contemplate,” “possible,” “forecasts,” “aims” or the negative of these
terms and similar expressions are intended to identify forward-looking statements, though not all forward-looking statements use these words or expressions.
These statements are neither promises nor guarantees, but involve known and unknown risks, uncertainties and other important factors that may cause our
actual results, performance or achievements to be materially different from any future results, performance or achievements expressed or implied by the forward-looking statements, including, but not limited to, the following: our ability to site
suitable land for, and otherwise source, renewable energy projects and to successfully develop and convert them into Operational Projects; availability of, and access to, interconnection facilities and transmission systems; our ability to obtain
and maintain governmental and other regulatory approvals and permits, including environmental approvals and permits; construction delays, operational delays and supply chain disruptions leading to increased cost of materials required for the
construction of our projects, as well as cost overruns and delays related to disputes with contractors; disruptions in trade caused by political, social or economic instability in regions where our components and materials are made; our suppliers’
ability and willingness to perform both existing and future obligations; competition from traditional and renewable energy companies in developing renewable energy projects; potential slowed demand for renewable energy projects and our ability to
enter into new offtake contracts on acceptable terms and prices as current offtake contracts expire; offtakers’ ability to terminate contracts or seek other remedies resulting from failure of our projects to meet development, operational or
performance benchmarks; exposure to market prices in some of our offtake contracts; various technical and operational challenges leading to unplanned outages, reduced output, interconnection or termination issues; the dependence of our production
and revenue on suitable meteorological and environmental conditions, and our ability to accurately predict such conditions; our ability to enforce warranties provided by our counterparties in the event that our projects do not perform as expected;
government curtailment, energy price caps and other government actions that restrict or reduce the profitability of renewable energy production; electricity price volatility, unusual weather conditions (including the effects of climate change,
could adversely affect wind and solar conditions), catastrophic weather-related or other damage to facilities, unscheduled generation outages, maintenance or repairs, unanticipated changes to availability due to higher demand, shortages,
transportation problems or other developments, environmental incidents, or electric transmission system constraints and the possibility that we may not have adequate insurance to cover losses as a result of such hazards; our dependence on certain
operational projects for a substantial portion of our cash flows; our ability to continue to grow our portfolio of projects through successful acquisitions; changes and advances in technology that impair or eliminate the competitive advantage of
our projects or upsets the expectations underlying investments in our technologies; our ability to effectively anticipate and manage cost inflation, interest rate risk, currency exchange fluctuations and other macroeconomic conditions that impact
our business; our ability to retain and attract key personnel; our ability to manage legal and regulatory compliance and litigation risk across our global corporate structure; our ability to protect our business from, and manage the impact of,
cyber-attacks, disruptions and security incidents, as well as acts of terrorism or war; changes to existing renewable energy industry policies and regulations that present technical, regulatory and economic barriers to renewable energy projects;
the reduction, elimination or expiration of government incentives or benefits for, or regulations mandating the use of, renewable energy; our ability to effectively manage the global expansion of the scale of our business operations; our ability to
perform to expectations in our new line of business involving the construction of PV systems for municipalities in Israel; our ability to effectively manage our supply chain and comply with applicable regulations with respect to international trade
relations, the impact of tariffs on the cost of construction and our ability to mitigate such impact, sanctions, export controls and anti-bribery and anti-corruption laws; our ability to effectively comply with Environmental Health and Safety and
other laws and regulations and receive and maintain all necessary licenses, permits and authorizations; our performance of various obligations under the terms of our indebtedness (and the indebtedness of our subsidiaries that we guarantee) and our
ability to continue to secure project financing on attractive terms for our projects; limitations on our management rights and operational flexibility due to our use of tax equity arrangements; potential claims and disagreements with partners,
investors and other counterparties that could reduce our right to cash flows generated by our projects; our ability to comply with increasingly complex tax laws of various jurisdictions in which we currently operate as well as the tax laws in
jurisdictions in which we intend to operate in the future; the unknown effect of the dual listing of our ordinary shares on the price of our ordinary shares; various risks related to our incorporation and location in Israel, including the ongoing
war in Israel, where our headquarters and some of our wind energy and solar energy projects are located; the costs and requirements of being a public company, including the diversion of management’s attention with respect to such requirements;
certain provisions in our Articles of Association and certain applicable regulations that may delay or prevent a change of control; and other risk factors set forth in the section titled “Risk factors” in our Annual Report on Form 20-F for the
fiscal year ended December 31, 2024, filed with the Securities and Exchange Commission (the “SEC”), as may be updated in our other documents filed with or furnished to the SEC.
These statements reflect management’s current expectations regarding future events and operating performance and speak only as of
the date of this press release. You should not put undue reliance on any forward-looking statements. Although we believe that the expectations reflected in the forward-looking statements are reasonable, we cannot guarantee that future results,
levels of activity, performance and events and circumstances reflected in the forward-looking statements will be achieved or will occur. Except as required by applicable law, we undertake no obligation to update or revise publicly any
forward-looking statements, whether as a result of new information, future events or otherwise, after the date on which the statements are made or to reflect the occurrence of unanticipated events.
About Enlight
Founded in 2008, Enlight develops, finances, constructs, owns, and operates utility-scale renewable energy projects. Enlight operates across the three
largest renewable segments today: solar, wind and energy storage. A global platform, Enlight operates in the United States, Israel and 11 European countries. Enlight has been traded on the Tel Aviv Stock Exchange since 2010 (TASE: ENLT) and
completed its U.S. IPO (Nasdaq: ENLT) in 2023.
Company Contacts
Limor Gruber
Director IR
investors@enlightenergy.co.il
Yonah Weisz
Director IR
investors@enlightenergy.co.il
Erica Mannion or Mike Funari
Sapphire Investor Relations, LLC
+1 617 542 6180
investors@enlightenergy.co.il
Information related to Segmental Reporting
| |
|
For the nine months
ended September 30, 2024
|
|
| |
|
|
|
|
|
|
|
|
|
|
Total reportable segments
|
|
|
|
|
|
|
|
| |
|
|
|
|
Revenues
|
|
|
121,607
|
|
|
|
147,164
|
|
|
|
8,611
|
|
|
|
277,382
|
|
|
|
7,208
|
|
|
|
284,590
|
|
|
Tax benefits
|
|
|
|
|
|
|
|
|
|
|
|
|
|
|
|
|
|
|
|
|
|
|
|
|
|
Total revenues and income
|
|
|
|
|
|
|
|
|
|
|
|
|
|
|
|
|
|
|
|
|
|
|
|
|
| |
|
|
|
|
|
|
|
|
|
|
|
|
|
|
|
|
|
|
|
|
|
|
|
|
|
Segment adjusted EBITDA
|
|
|
|
|
|
|
|
|
|
|
|
|
|
|
|
|
|
|
|
|
|
|
|
|
| |
|
|
|
|
|
|
Reconciliations of unallocated amounts:
|
|
|
|
|
|
|
Headquarter costs (*)
|
|
|
|
(25,108
|
)
|
|
Intersegment profit
|
|
|
|
112
|
|
|
Depreciation and amortization and share-based compensation
|
|
|
|
(84,004
|
)
|
|
Other incomes not attributed to segments
|
|
|
|
|
|
|
Operating profit
|
|
|
|
|
|
|
Finance income
|
|
|
|
18,299
|
|
|
Finance expenses
|
|
|
|
(85,836
|
)
|
|
Share in the losses of equity accounted investees
|
|
|
|
|
|
|
Profit before income taxes
|
|
|
|
|
|
(*) Including general and administrative and development expenses (excluding depreciation and amortization and share
based compensation).
Information related to Segmental Reporting
| |
|
For the three months
ended September 30, 2025
|
|
| |
|
|
|
|
|
|
|
|
|
|
Total reportable segments
|
|
|
|
|
|
|
|
| |
|
|
|
|
Revenues
|
|
|
77,543
|
|
|
|
45,319
|
|
|
|
15,448
|
|
|
|
138,310
|
|
|
|
226
|
|
|
|
138,536
|
|
|
Tax benefits
|
|
|
|
|
|
|
|
|
|
|
|
|
|
|
|
|
|
|
|
|
|
|
|
|
|
Total revenues and income
|
|
|
|
|
|
|
|
|
|
|
|
|
|
|
|
|
|
|
|
|
|
|
|
|
| |
|
|
|
|
|
|
|
|
|
|
|
|
|
|
|
|
|
|
|
|
|
|
|
|
|
Segment adjusted EBITDA
|
|
|
|
|
|
|
|
|
|
|
|
|
|
|
|
|
|
|
|
|
|
|
|
|
| |
|
|
|
|
|
|
Reconciliations of unallocated amounts:
|
|
|
|
|
|
|
Headquarter costs (*)
|
|
|
|
(14,818
|
)
|
|
Intersegment profit
|
|
|
|
45
|
|
|
Losses from projects disposals
|
|
|
|
(739
|
)
|
|
Depreciation and amortization and share-based compensation
|
|
|
|
|
|
|
Operating profit
|
|
|
|
|
|
|
Finance income
|
|
|
|
28,126
|
|
|
Finance expenses
|
|
|
|
(54,171
|
)
|
|
Share in the losses of equity accounted investees
|
|
|
|
|
|
|
Profit before income taxes
|
|
|
|
|
|
(*) Including general and administrative and development expenses (excluding depreciation and amortization and share
based compensation).
Information related to Segmental Reporting
| |
|
For the three months
ended September 30, 2024
|
|
| |
|
|
|
|
|
|
|
|
|
|
Total reportable segments
|
|
|
|
|
|
|
|
| |
|
|
|
|
Revenues
|
|
|
55,566
|
|
|
|
46,041
|
|
|
|
5,180
|
|
|
|
106,787
|
|
|
|
2,708
|
|
|
|
109,495
|
|
|
Tax benefits
|
|
|
|
|
|
|
|
|
|
|
|
|
|
|
|
|
|
|
|
|
|
|
|
|
|
Total revenues and income
|
|
|
|
|
|
|
|
|
|
|
|
|
|
|
|
|
|
|
|
|
|
|
|
|
| |
|
|
|
|
|
|
|
|
|
|
|
|
|
|
|
|
|
|
|
|
|
|
|
|
|
Segment adjusted EBITDA
|
|
|
|
|
|
|
|
|
|
|
|
|
|
|
|
|
|
|
|
|
|
|
|
|
| |
|
|
|
|
|
|
Reconciliations of unallocated amounts:
|
|
|
|
|
|
|
Headquarter costs (*)
|
|
|
|
(9,479
|
)
|
|
Intersegment loss
|
|
|
|
(9
|
)
|
|
Depreciation and amortization and share-based compensation
|
|
|
|
(29,033
|
)
|
|
Other incomes not attributed to segments
|
|
|
|
|
|
|
Operating profit
|
|
|
|
|
|
|
Finance income
|
|
|
|
3,234
|
|
|
Finance expenses
|
|
|
|
(36,525
|
)
|
|
Share in the losses of equity accounted investees
|
|
|
|
|
|
|
Profit before income taxes
|
|
|
|
|
|
(*) Including general and administrative and development expenses (excluding depreciation and amortization and share
based compensation).
|
($ thousands)
|
|
For the nine months
|
|
For the three months
|
| |
|
ended September 30
|
|
ended September 30
|
|
|
|
2025
|
|
2024
|
|
2025
|
|
2024
|
|
Net Income
|
|
139,629
|
|
58,133
|
|
32,257
|
|
24,189
|
|
Depreciation and amortization
|
|
110,159
|
|
77,977
|
|
39,142
|
|
27,091
|
|
Share based compensation
|
|
5,047
|
|
6,027
|
|
2,053
|
|
1,942
|
|
Finance income
|
|
(36,292)
|
|
(18,299)
|
|
(28,126)
|
|
(3,234)
|
|
Finance expenses
|
|
136,457
|
|
85,836
|
|
54,171
|
|
36,525
|
|
Gains from projects disposals (*)
|
|
(54,597)
|
|
-
|
|
739
|
|
-
|
|
Non-recurring other income, net (**)
|
|
-
|
|
(3,693)
|
|
-
|
|
(3,693)
|
|
Share of losses of equity accounted investees
|
|
3,904
|
|
1,737
|
|
2,259
|
|
1,288
|
|
Taxes on income
|
|
35,083
|
|
16,154
|
|
9,477
|
|
7,024
|
|
Adjusted EBITDA
|
|
339,390
|
|
223,872
|
|
111,972
|
|
91,132
|
|
* Profit from revaluation linked to partial sale of asset.
** Recognition of income related to lower earn-out payments offset by a revaluation in the value of
financial assets.
|
Appendix 3 – Debentures Covenants
Debentures Covenants
As of September 30, 2025, the Company was in compliance with all of its financial covenants under the indenture for the Series C, D, F, G and H
Debentures, based on having achieved the following in its consolidated financial results:
Minimum equity
The company's equity shall be maintained at no less than NIS 375 million so long as debentures F remain outstanding, NIS 1,250 million so long as
debentures C and D remain outstanding, and USD 600 million so long as debentures G and H remain outstanding.
As of September 30, 2025, the company’s equity amounted to NIS 6,474 million (USD 1,958 million).
Net financial debt to net CAP
The ratio of standalone net financial debt to net CAP shall not exceed 70% for two consecutive financial periods so long as debentures F remain
outstanding and shall not exceed 65% for two consecutive financial periods so long as debentures C, D, G and H remain outstanding.
As of September 30, 2025, the net financial debt to net CAP ratio, as defined above, stands at 34%.
Net financial debt to EBITDA
So long as debentures F remain outstanding, standalone financial debt shall not exceed NIS 10 million, and the consolidated financial debt to EBITDA
ratio shall not exceed 18 for more than two consecutive financial periods.
For as long as debentures C and D remain outstanding, the consolidated financial debt to EBITDA ratio shall not exceed 15 for more than two consecutive
financial periods.
For as long as debentures G and H remain outstanding, the consolidated financial debt to EBITDA ratio shall not exceed 17 for more than two consecutive
financial periods.
As of September 30, 2025, the net financial debt to EBITDA ratio, as defined above, stands at 6.
Equity to balance sheet
The standalone equity to total balance sheet ratio shall be maintained at no less than 20% ,25% and 28%, respectively, for two consecutive financial
periods for as long as debentures F, debentures C and D and debentures G and H remain outstanding.
As of September 30, 2025, the equity to balance sheet ratio, as defined above, stands at 58%.
Appendix 5
a) Segment information: Operational projects
|
($ thousands)
|
|
9 Months ended September 30
|
3 Months ended September 30
|
|
Operational
Project
Segments
|
Installed Capacity (MW)
|
Installed Storage (MWh)
|
Generation
(GWh)
|
Revenues and
income
|
Segment Adjusted
EBITDA*
|
Generation
(GWh)
|
Reported Revenue
|
Segment Adjusted
EBITDA*
|
| |
|
|
2025
|
2024
|
2025
|
2024
|
2025
|
2024
|
2025
|
2024
|
2025
|
2024
|
2025
|
2024
|
|
MENA
|
675
|
819
|
1,158
|
1,012
|
173,180
|
121,607
|
115,514
|
99,659
|
463
|
432
|
77,544
|
55,566
|
51,127
|
44,786
|
|
Europe
|
1,327
|
-
|
1,912
|
1,994
|
144,502
|
147,164
|
117,428
|
129,386
|
559
|
598
|
45,318
|
46,041
|
35,202
|
46,133
|
|
USA
|
470
|
1,200
|
790
|
226
|
110,948
|
8,611
|
98,171
|
5,863
|
271
|
153
|
41,968
|
5,180
|
38,258
|
4,558
|
|
Total Consolidated
|
2,472
|
2,019
|
3,860
|
3,232
|
428,630
|
277,382
|
331,113
|
234,908
|
1,293
|
1,183
|
164,830
|
106,787
|
124,587
|
95,477
|
|
Unconsolidated
at Share
|
42
|
41
|
|
|
|
|
|
|
|
|
|
|
|
|
Total
|
2,514
|
2,060
|
|
|
|
|
|
|
|
|
|
|
|
b) Operational Projects Further Detail
|
($ thousands)
|
|
|
|
9 Months ended September 30, 2025
|
3 Months ended September 30, 2025
|
|
|
Operational Project
|
Segment
|
Installed Capacity (MW)
|
Installed Storage (MWh)
|
Revenues and
income
|
Segment Adjusted
EBITDA*
|
Reported Revenue
|
Segment Adjusted EBITDA*
|
Debt balance as of September 30, 2025
|
Ownership %**
|
|
MENA Wind
|
MENA
|
316
|
-
|
72,682
|
|
30,716
|
|
507,082
|
49%
|
|
MENA PV
|
MENA
|
359
|
819
|
100,498
|
|
46,828
|
|
555,038
|
85%
|
|
Total MENA
|
|
675
|
819
|
173,180
|
115,514
|
77,544
|
51,127
|
1,062,120
|
|
|
Europe Wind
|
Europe
|
1,184
|
-
|
131,369
|
|
39,697
|
|
888,306
|
65%
|
|
Europe PV
|
Europe
|
143
|
-
|
13,133
|
|
5,621
|
|
73,959
|
71%
|
|
Total Europe
|
|
1,327
|
-
|
144,502
|
117,428
|
45,318
|
35,202
|
962,265
|
|
|
USA PV
|
USA
|
470
|
1,200
|
110,948
|
|
41,968
|
|
261,205
|
100%
|
|
Total USA
|
470
|
1,200
|
110,948
|
98,171
|
41,968
|
38,258
|
261,205
|
|
|
Total Consolidated Projects
|
2,472
|
2,019
|
428,630
|
331,113
|
164,830
|
124,587
|
2,285,590
|
|
|
Uncons. Projects at share
|
42
|
41
|
|
|
|
|
|
50%
|
|
Total
|
|
2,514
|
2,060
|
428,630
|
331,113
|
164,830
|
124,587
|
2,285,590
|
|
* EBITDA results included $11m in the 9 months ended September 25 and $3m in the 3 months ended September 25, of compensation
recognized from Björnberget project
** Ownership % is calculated based on the project's share of total revenues