Enlight Renewable Energy Ltd.
January 7, 2026
New Rating
‘ilA’ Issuer Rating Assigned, Outlook Stable;
‘ilA’ Rating Assigned To Unsecured Bonds,
‘ilA+’ Rating Assigned to Secured Private Loan
Primary Credit Analyst:
Evgeni Silishtian 972-3-7539733 evgeni.silishtian@spglobal.com
Secondary Contact:
Ayelet Matzov 972-3-7539712 ayelet.matzov@spglobal.com
|
Please note that this translation was made for convenience purposes and for the company's use only and under no circumstances shall obligate S&P Global Ratings
Maalot Ltd. The translation has no legal status and S&P Global Ratings Maalot Ltd. does not assume any responsibility whatsoever as to its accuracy and is not bound by its contents. In the case of any discrepancy with the official Hebrew
version published on January 7, 2025, the Hebrew version shall apply.
|
Table of Contents
|
|
2
|
|
|
3
|
|
|
5
|
|
|
5
|
|
|
6
|
|
|
6
|
|
|
6
|
|
|
7
|
|
|
7
|
|
|
8
|
|
|
8
|
|
|
8
|
|
|
8
|
|
|
8
|
|
|
9
|
|
|
10
|
|
|
11
|
|
• |
Enlight Renewable Energy Ltd. ("Enlight" or “the Company") is a public company traded on the Tel Aviv Stock Exchange and NASDAQ, and operates in the renewable energy sector. The
Company is engaged in the development, construction and operation of facilities for power production from solar and wind energy and for energy storage, and holds an income-producing portfolio with production capacity of about 2.5 GW and
storage capacity of about 2 GWh as of September 30, 2025, alongside a large backlog of projects in advanced stages of construction and development.
|
|
• |
In our opinion, Enlight's business risk profile is underpinned by the growth in its operations in recent years, by its geographical distribution between Israel, Europe and the U.S.,
and by its business model which is largely based on long-term PPAs that contribute to revenue stability and visibility. The large backlog supports our assessment of the Company's ability to continue to grow its operations, but at this stage,
the weight of development activity constrains our business risk profile assessment.
|
|
• |
The Company's financial risk profile is supported by its deleveraging in recent years and reflects our assessment that in the next two years its adjusted debt-to-EBITDA ratio will
average about 9x, and its adjusted EBITDA interest coverage will exceed 2.0x. Our financial risk assessment also reflects our assessment that the accelerated growth will be financed not only through debt but also through equity sources, in
line with management's approach to continue the growth strategy while maintaining current financial ratios.
|
|
• |
Accordingly, on January 7, 2026, S&P Maalot assigned its 'ilA' issuer rating to Enlight Renewable Energy Ltd. S&P Maalot also assigned its 'ilA' rating to the Company's
unsecured bonds and an 'ilA+' rating to a private loan to finance a cluster of photovoltaic and storage projects under market arrangement.
|
|
• |
The stable outlook reflects our assessment that in the next 12 months Enlight will maintain its competitive position and its geographical spread, while implementing its growth
strategy in accordance with our base case scenario. Given the current and expected mix and scope of operations, we believe that an adjusted debt-to-EBITDA ratio of about 9x and adjusted EBITDA interest coverage of about 2.0x on average are
commensurate with the rating.
|
Enlight Renewable Energy Ltd.
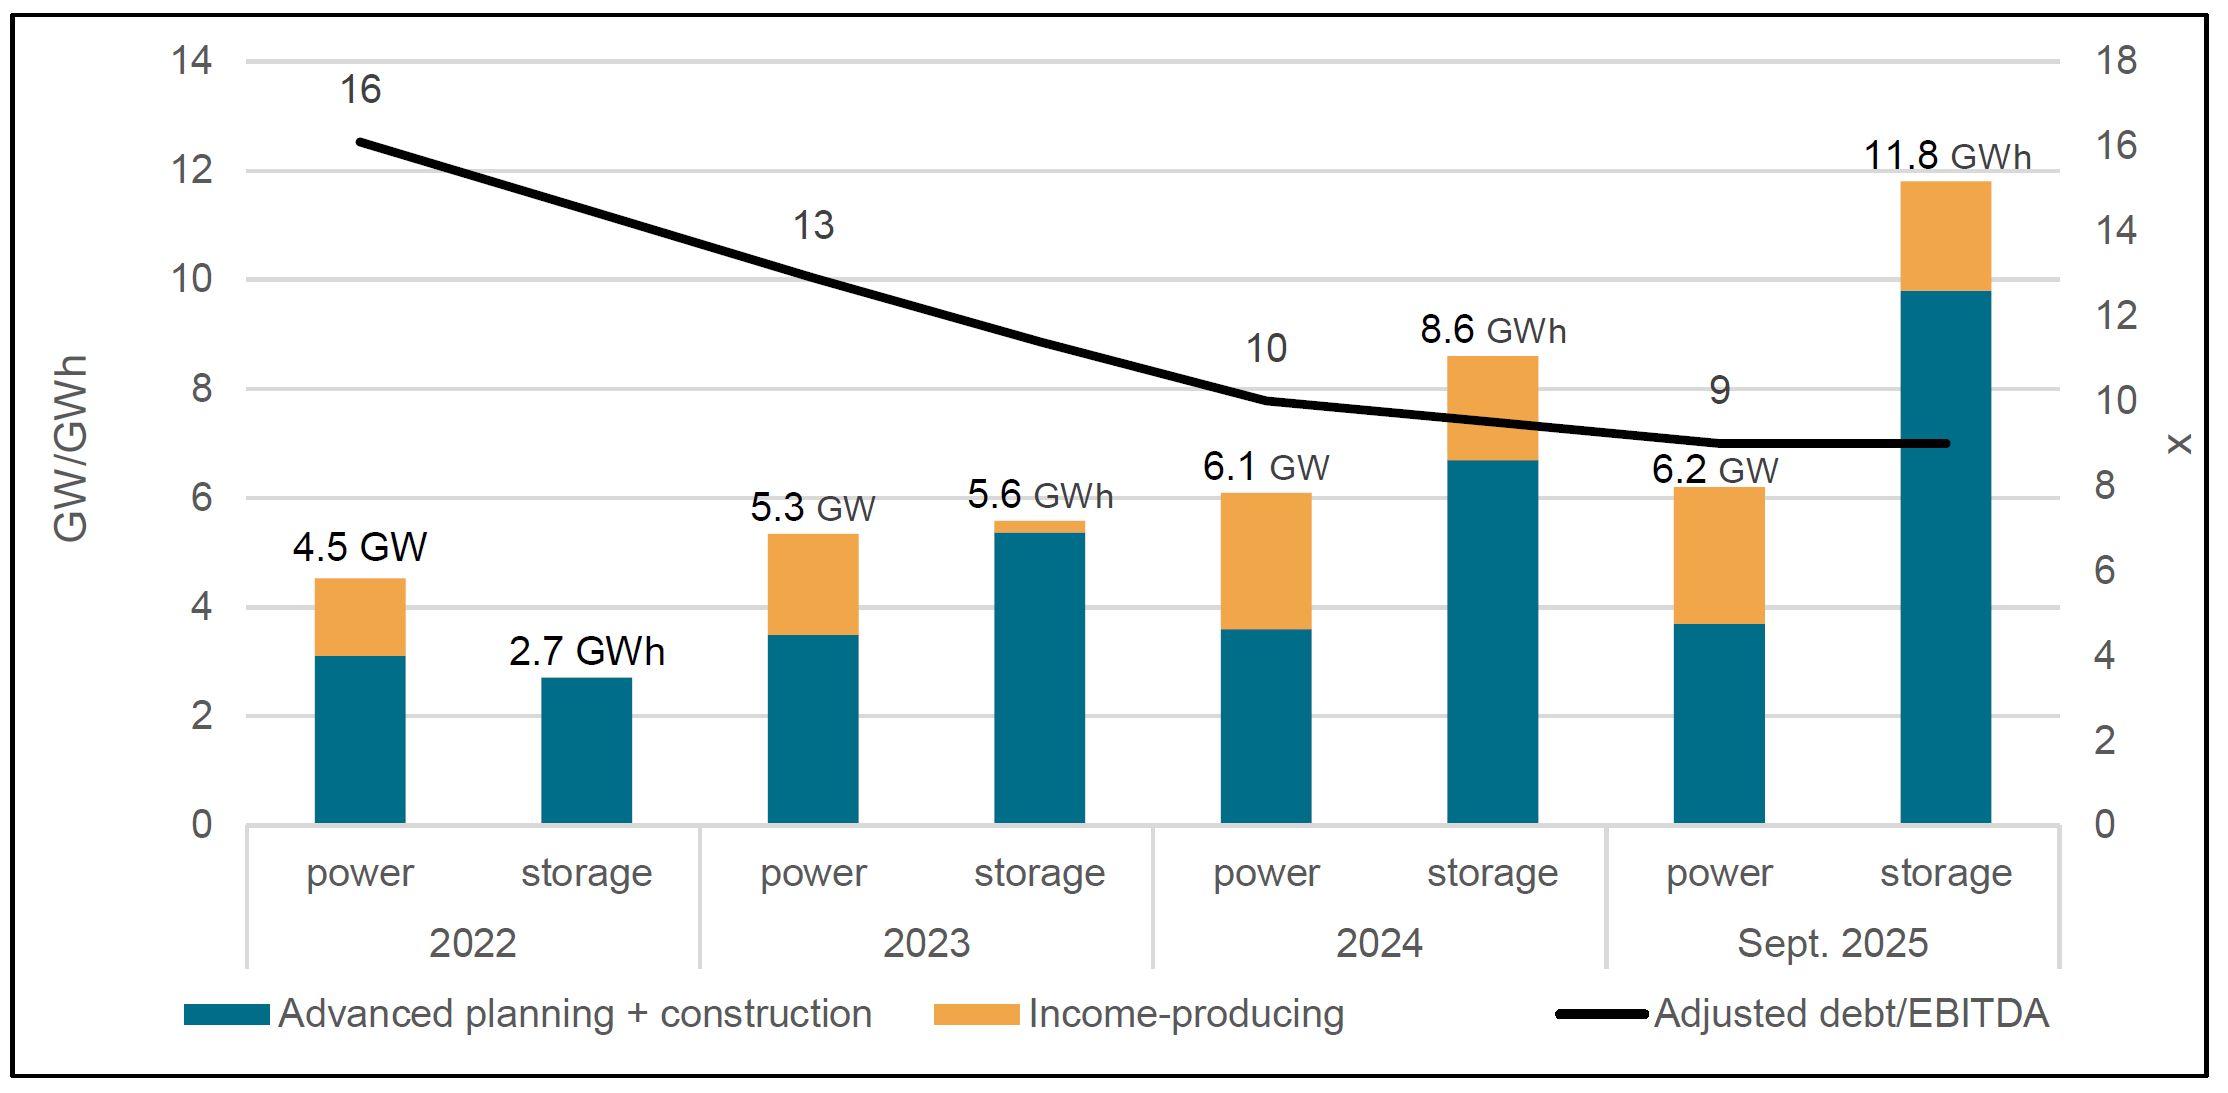
Enlight posted significant growth in operations in recent years, and given its backlog of projects in development and planning stages, we
believe this trend will continue. At the end of Q3 2025, the Company’s income-producing projects under construction and nearing construction amounted to a production capacity of about 6.2 GW (of which about 2.5 GW in commercial operation)
and a storage capacity of about 11.8 GWh (of which about 2 GWh in commercial operation), compared to about 6.1 GWh (of which about 2.5 GWh in commercial operation) and about 8.6 GWh (of which about 1.9 GWh in commercial operation) at year-end 2024.
The increase in production capacity led to improved operating performance, reflected in an increase in revenue to about $430 million in the first nine months of 2025, compared to about $399 million in 2024, and an increase in adjusted EBITDA to about
$300 million in this period, compared to about $283 million in 2024 as a whole.
In the coming years, we expect the Company to continue significantly growing its operations while increasing production capacity, supported by a backlog of projects in
advanced stages of construction and development. Inter alia, we believe that the Quail Ranch and Roadrunner projects in the U.S., with an aggregate capacity of about 418 MW of production and about 1,340 MWh of storage, are expected to start
commercial operation by early 2026 and contribute about $70 million - $80 million in revenue in a full year of operation (excluding tax benefits). In addition, the Snowflake A project in the
U.S., with a capacity of about 600 MW of production and about 1,900 MWh of storage, is expected to start commercial operation in 2027 and contribute about $120 million - $130 million in revenue in a full year of operation (excluding tax benefits).
These projects, alongside other projects the development of which was recently completed, support our assessment of Enlight's ability to successfully implement its growth strategy.
The substantial scope of the projects in various stages of development exposes the Company to development risks. In addition, the Company operates in an environment with
increasing competition, low barriers to entry and exposure to changes in policy and regulation in some of its regions of operation. However, we estimate that the projects’ relatively short construction period and lack of engineering complexity,
alongside the geographical spread of the Company’s operatoins and a revenue model largely based on long-term contracts, contribute to mitigating these risks. Enlight also benefits from a high level of control over the value chain of its operations,
which includes all stages of project development, planning, financing, construction and operation. This model provides operational flexibility, cost control and value creation throughout the project’s life.
Enlight Renewable Energy Ltd.
We believe that successful implementation of Enlight’s growth strategy will support continuously larger geographic spread and solidify
Enlight's competitive position in light of growing demand for electricity. In the first nine months of 2025, about 40% of the Company's revenue originated in Israel, about 35% in Europe and about 25% in the U.S. We believe the geographic
spread reduces dependence on a single market and exposes operations to markets with different demand and regulatory characteristics, contributing to revenue and cash flow stability. The Company operates in a supportive regulatory environment in most
of its regions of operation, including markets with incentive mechanisms for renewable energy, policies to encourage private electricity production and long-term emission reduction plans. We believe that Enlight's operations will be positively
impacted by growing demand for electricity, including from tech companies and data centers, which will support demand for large-scale generation and storage solutions, on which the Company focuses. We expect revenue from U.S. projects to continue
growing, based on the Company’s backlog of projects in various stages of development, and considering the Company’s compliance with criteria that qualify these projects as “Safe Harbors”, which guarantess the Company’s eligibility for tax benefits
under the IRA law. The expected growth in the Company's U.S. commercial portfolio will increase its share of total revenue, supporting its competitive position, in our view. According to the information provided by the Company, as of Q3 2025 all
income-generating projects, projects under construction and projects nearing construction in the U.S. have secured their eligibility to qualify as “Safe Harbors”, in addition to about 45% of projects in advanced development stages and about 6% of
projects in development.
Enlight's revenue model is largely based on long-term electricity sale contracts that support revenue stability and cash flow visibility. As
of the end of Q3 2025, about 65% of existing capacity and additional capacity to be connected by 2028 are based on fixed-price PPAs, about 8% on linked contracts, about 10% on sales at a regulated rate in Israel, and about 17% of the revenues are
exposed to market prices. In our opinion, this mix provides a balance between a substantial component of stable revenues and some exposure to electricity prices, which on the one hand increases volatility risk, but on the other hand allows the
Company to benefit from an expected increase in electricity prices in existing contracts and not only in new projects. In addition, the Company benefits from adequate customer and supplier diversification, which contributes to reducing operating and
supply risks.
Enlight's financial risk profile reflects its growth strategy and financial policy, which include large investments taken alongside equity
issuances. The Company’s leverage decreased in recent years, such that its adjusted debt-to-EBITDA ratio was about 10x in 2024 compared with about 13x in 2023. Given the growth in operating performance in the first three quarters of 2025,
the Company's annual investment budget and the ~$300 million equity issuance completed in August, we believe that the Company’s leverage will continue to decline, and its adjusted debt-to-EBITDA ratio will be about 8.5x-9.5x in 2025-2026. We believe
that the continued implementation of the extensive investment plan in projects in advanced stages of construction and development is expected to lead to a continued increase in debt, but, given the Company's financial policy and its ability to
finance part of the growth through equity issuances, supports our financial risk assessment.
Enlight Renewable Energy Ltd.
Chart 1: Growth in the mature portfolio alongside lower leverage
The Company’s EBITDA interest coverage was about 2.2x in 2024, and about 1.9x in the first three quarters of 2025. We believe Enlight will post an
adjusted coverage ratio above 2.0x in the next two years, which supports the rating. Our assessment is based, among other things, on the expectation that the Company’s EBITDA will grow faster that the growth in interest expense due to the expected
increase in debt.
The stable outlook reflects our assessment that in the next 12 months Enlight will maintain its competitive position and its geographical spread, while implementing its
growth strategy in accordance with our base case scenario. Given the current and expected mix and scope of operations, we believe that an adjusted debt-to-EBITDA ratio of about 9x and adjusted EBITDA interest coverage of about 2.0x on average are
commensurate with the rating.
We will consider a positive rating action if Enlight substantially increases the scope of its operations, while gradually transitioning to a more mature activity profile
that relies on a higher share of income- producing assets and reducing the relative share of development activity, alongside establishing a competitive position in core markets. We will also consider a positive rating action in the event of a
significant improvement in the Company’s financial risk profile, to be reflected in a decrease in adjusted debt-to-EBITDA towards 5x over time and as part of financial policy.
Enlight Renewable Energy Ltd.
We may take a negative rating action in case of a material deviation from our base case scenario, such that adjusted debt-to-EBITDA exceeds 10x over time. Such a scenario
may materialize, for example, in the event of an unexpected increase in investments, without adequate equity issuances, which would lead to significantly higher debt and, accordingly, to higher leverage. Downside pressure on the rating may also occur
if the Company’s operating performance weakens, if the regulatory environment in material regions in which the Company operates is not supportive, or in the event of significant delays in projects in development and construction.
Enlight Renewable Energy Ltd. is a public company engaged in the development, financing, construction and operation of facilities for power production from solar energy and
wind energy and for energy storage, and the sale of electricity produced in these facilities. The Company has over 100 income-generating projects in Israel, the U.S. and several European countries (some of them in clusters), with aggregate production
capacity of 2.5 GW and aggregate storage capacity of about 2 GWh as of September 30, 2025. The Company was founded in Israel in 2008, and has been traded on the Tel Aviv Stock Exchange since 2010 and on NASDAQ since 2023. The Company's ownership
structure is decentralized with no controlling shareholder. About 45.1% of the Company’s shares are held by the public, about 53.6% by institutional investors and hedge funds and about 1.3% by stakeholders.
Our base case scenario is underpinned by the following assumptions:
|
• |
Following are the main macro-economic indicators according to S&P Global Ratings' forecasts:
|
| |
Real GDP growth
|
Inflation rate
|
Unemployment rate
|
| |
2025
|
2026
|
2027
|
2025
|
2026
|
2027
|
2025
|
2026
|
2027
|
|
Israel
|
2.5%
|
5.0%
|
3.8%
|
3.0%
|
2.2%
|
2.0%
|
3.0%
|
3.2%
|
3.1%
|
|
Eurozone
|
1.3%
|
1.2%
|
1.4%
|
2.1%
|
1.8%
|
1.9%
|
6.3%
|
6.2%
|
5.9%
|
|
U.S.A.
|
2.0%
|
2.0%
|
1.9%
|
2.7%
|
2.6%
|
2.4%
|
4.2%
|
4.5%
|
4.3%
|
Enlight Renewable Energy Ltd.
|
• |
Growth in the Company's revenue to about $530 million - $570 million in 2025 and about $630 million - $680 million in 2026
(including already-recognized tax benefits), given our expectations for organic growth and contribution from projects expected to start commercial operation.
|
|
• |
Adjusted EBITDA of about $350 million - $400 million in 2025 and about $420 million - $470 million in 2026 (including
already-recognized tax benefits).
|
|
• |
Total investments of $2.0 billion - $2.2 billion in 2025-2026, excluding expected receipts from tax partners.
|
Under our base case scenario, the expected adjusted ratios in 2025-2026 are as follows:
|
• |
Adjusted debt to EBITDA of about 8.5x-9.5x
|
|
• |
Adjusted EBITDA interest coverage above 2x
|
We assess the Company’s liquidity as “adequate”. We expect the ratio between the Company's sources and uses to exceed 1.2x in the 12 months starting October 1, 2025. Our
assessment is supported by Enlight's access to a variety of financing sources, including working with a large number of financing entities in Israel, Europe and the U.S., and its track record of completing large-scale project financial closings, e.g.
a project financing agreement of about $1.4 billion for the Snowflake A project, alongside the signing of significant tax partnerships and large bond and equity issuances that the Company completed in the past year.
Following are the Company’s main sources and uses for the 12 months starting October 1, 2025:
|
Principal Liquidity Sources
|
Principal Liquidity Uses
|
|
• About $680 million in cash and cash equivalents.
• Available committed credit facilities totaling about $690 million.
• About $250 million - $270 million in
cash FFO (funds from operations).
|
• Short-term debt and current maturities of long-term debt totaling about $780 million.
• Minimal capital expenditure (capex) of about $200 million.
• Dividend distribution for non-controlling interests of about $60 million - $65 million.
|
The Company has several covenants vis-à-vis bond holders, banks and financial institutions. We understand that, as of September 30, 2025, the Company has sufficient
headroom on its financial covenants, and we estimate that it will maintain sufficient headroom in the short term.
Enlight Renewable Energy Ltd.
Diversification/portfolio effect: Neutral (no impact)
Capital structure: Neutral (no impact)
Liquidity: Adequate (no impact)
Financial policy: Neutral (no impact)
Management and governance: Neutral (no impact)
Comparable ratings analysis: Positive (positive impact)
Environmental, Social, And Governance
ESG factors are an overall neutral consideration in our credit rating analysis of Enlight Renewable Energy Ltd. The Company operates in the renewable energy sector, and is
well positioned compared to companies in the conventional energy sector in terms of its environmental impact and social perception.
|
• |
We are assigning our ‘ilA+’ rating, one notch above the issuer rating, to a secured private loan for a cluster of photo-voltaic and energy storage projects that the Company is
developing in Israel. The recovery rating for this loan is '2', reflecting our assessment that in the case of a hypothetical default, the recovery rate would be 70%-90%.
|
|
• |
We are assigning our ‘ilA’ rating, identical to the issuer rating, to Enlight’s unsecured bond series (Series 3, 4, 6, 7 and 8). The recovery rating for these series is '3',
reflecting our assessment that in the hypothetical default scenario, the recovery rate would be 50%-70%.
|
|
• |
The Company's debt recovery analysis was determined, among other things, based on its consolidated statements and according to the EBITDA multiple method, given our assessment of the
life expectancy of the Company's assets.
|
Simulated Default
Assumptions
|
• |
Simulated year of default: 2029
|
|
• |
A deep recession in the economies in which the Company operates, significant failures in material projects or unusual weather events will lead to a prolonged shutdown of production
facilities, causing revenues and profitability to decline such that the volume of cash flows used to service principal and interest payments will decrease substantially and the Company's ability to service its debts will be impaired.
|
Enlight Renewable Energy Ltd.
|
• |
The Company will continue operating as a going concern, as it is likely to attempt a debt restructuring in light of the facilities’ continued operation.
|
|
• |
In the hypothetical deterioration path, the Company will use about 50%-85% of its credit lines (including its mezzanine facility).
|
|
• |
EBITDA on emergence: about $520 million
|
|
• |
EBITDA multiplier: 5.5x
|
|
• |
Gross enterprise value as going concern: about $2.85 billion
|
|
• |
Administrative costs: 5%
|
|
• |
Available value to cover debt: about $2.7 billion
|
|
• |
Total senior bank and institutional investor debt: about $1.9 billion
|
|
• |
Enterprise value available for secured private loan for a cluster of photo-voltaic and energy storage projects in Israel: about $200 million
|
|
• |
Secured private loan for a cluster of photo-voltaic and energy storage projects in Israel: about $227 million
|
|
• |
Recovery expectations for secured private loan: 70%-90%
|
|
• |
Recovery rating for secured private loan (1 to 6): 2
|
|
• |
Net value available for unsecured debt: about $590 million
|
|
• |
Total unsecured debt (Series 3, 4, 6, 7, 8): about $1.1 billion
|
|
• |
Unsecured debt recovery expectation: 50%-70%
|
|
• |
Unsecured debt recovery rating (1 to 6): 3
|
All debt amounts include six months' prepetition interest.
|
Mapping Recovery Perc entages To Recovery Ratings
|
|
Recovery expectations (%)
|
Description
|
Recovery rating
|
Notching above/below issuer rating
|
|
100%
|
Full recovery
|
1+
|
+3 notches
|
|
90%-100%
|
Very high recovery
|
1
|
+2 notches
|
|
70%-90%
|
Substantial recovery
|
2
|
+1 notch
|
|
50%-70%
|
Meaningful recovery
|
3
|
0 notches
|
|
30%-50%
|
Average recovery
|
4
|
0 notches
|
|
10%-30%
|
Modest recovery
|
5
|
-1 notch
|
|
0%-10%
|
Negligible recovery
|
6
|
-2 notches
|
Recovery ratings are capped in certain countries to adjust for reduced creditor recovery prospects in these jurisdictions. Recovery ratings on unsecured debt issues are
generally also subject to caps (see Step 6, paragraphs 90-98 of Recovery Rating Criteria For Speculative-Grade Corporate Issuers, December 7, 2016, for further detail). ICR--Issuer credit rating.
Enlight Renewable Energy Ltd.
Related Criteria And Research
|
• |
Principles
Of Credit Ratings, February 16, 2011
|
|
• |
Methodology:
Industry Risk, November 19, 2013
|
|
• |
Country
Risk Assessment Methodology And Assumptions, November 19, 2013
|
|
• |
Methodology
And Assumptions: Liquidity Descriptors For Global Corporate Issuers, December 16, 2014
|
|
• |
Recovery
Rating Criteria For Speculative-Grade Corporate Issuers, December 7, 2016
|
|
• |
Corporate
Methodology: Ratios And Adjustments, April
1, 2019
|
|
• |
Group
Rating Methodology, July 1, 2019
|
|
• |
Environmental,
Social, And Governance Principles In Credit Ratings, October 10, 2021
|
|
• |
Methodology
For National And Regional Scale Credit Ratings, June 8, 2023
|
|
• |
Corporate
Methodology, January 7, 2024
|
|
• |
Methodology:
Management And Governance Credit Factors For Corporate Entities And Insurers, January 7, 2024
|
|
• |
Sector-Specific
Corporate Methodology, July 7, 2025
|
|
• |
S&P
Global Ratings Definitions, December 2, 2024
|
Enlight Renewable Energy Ltd.
|
Enlight Renewable Energy Ltd.
|
Rating
|
Date when the rating was first published
|
Date when the rating was last updated
|
|
Issuer rating(s)
|
|
|
|
|
Long term
|
ilA/Stable
|
07/01/2026
|
07/01/2026
|
| |
|
|
|
|
Issue rating(s)
|
|
|
|
|
Senior Secured Debt
|
|
|
|
|
Loan to finance a cluster of PV and
storage projects under market arrangement
|
ilA+
|
|
|
| |
07/01/2026
|
07/01/2026
|
|
Senior Unsecured Debt
|
|
|
|
|
Series 3
|
ilA
|
07/01/2026
|
07/01/2026
|
|
Series 4
|
ilA
|
07/01/2026
|
07/01/2026
|
|
Series 6
|
ilA
|
07/01/2026
|
07/01/2026
|
|
Series 7
|
ilA
|
07/01/2026
|
07/01/2026
|
|
Series 8
|
ilA
|
07/01/2026
|
07/01/2026
|
| |
|
|
|
|
Issuer Credit Rating history
|
|
|
|
|
Long term
|
|
|
|
|
January 7, 2025
|
ilA/Stable
|
|
|
|
Additional details
|
|
Time of the event
|
07.01.2026 08:47
|
|
Time when the event was learned of
|
07.01.2026 08:47
|
|
Rating requested by
|
Issuer
|
Enlight Renewable Energy Ltd.
S&P Maalot is the commercial name of S&P Global Ratings Maalot Ltd. For a list of the most up-to- date ratings and for additional information regarding S&P
Maalot’s surveillance policy, see S&P Global Ratings Maalot Ltd. website at maalot.co.il.
All rights reserved © No content (including ratings, credit-related analyses and data, valuations, model, software or other application or output therefrom) or any part
thereof (collectively, “the Content”) may be modified, reverse engineered, reproduced or distributed in any form by any means, or stored in a database or retrieval system, without the prior written permission of S&P Global Ratings Maalot Ltd. or
its affiliates (collectively, S&P). The Content shall not be used for any unlawful or unauthorized purposes. &P and any third-party providers, as well as their directors, officers, shareholders, employees or agents (collectively, “S&P
Parties”) do not guarantee the accuracy, completeness, timeliness or availability of the Content. S&P Parties are not responsible for any errors or omissions (negligent or otherwise), regardless of the cause, for the results obtained from the use
of the Content, or for the security or maintenance of any data input by the user. The Content is provided on an "as is" basis. S&P PARTIES DISCLAIM ANY AND ALL EXPRESS OR IMPLIED WARRANTIES, INCLUDING, BUT NOT
LIMITED TO, ANY WARRANTIES OF MERCHANTABILITY OR FITNESS FOR A PARTICULAR PURPOSE OR USE, FREEDOM FROM BUGS, SOFTWARE ERRORS OR DEFECTS, THAT THE CONTENT’S FUNCTIONING WILL BE UNINTERRUPTED OR THAT THE CONTENT WILL OPERATE WITH ANY SOFTWARE OR
HARDWARE CONFIGURATION. In no event shall S&P Parties be liable to any party for any direct, indirect, incidental, exemplary, compensatory, punitive, special or consequential damages, costs, expenses, legal fees, or losses (including,
without limitation, lost income or lost profits and opportunity costs or losses caused by negligence) in connection with any use of the Content even if advised of the possibility of such damages.
Credit-related and other analyses, including ratings, and statements in the Content are statements of opinion as of the date they are expressed and not statements of fact.
S&P’s ratings and other analyses are not recommendations to purchase, hold, or sell any securities or to make any investment decisions, and do not address the suitability of any security. S&P assumes no obligation to update the Content
following publication in any form or format. The Content should not be relied on in making investment decisions or any other business decision, and is not a substitute for the skill, judgment and experience of the user, its management, employees,
advisors and/or clients when making such decisions. S&P does not act as a fiduciary or an investment advisor except where registered as such. Rating reports are correct as of the time of their publication. S&P updates rating reports following
ongoing surveillance of events or annual surveillance.
While S&P obtains information from sources it believes to be reliable, S&P does not perform an audit and undertakes no duty of due diligence or independent
verification of any information it receives. S&P publishes rating-related reports for a variety of reasons that are not necessarily dependent on action by rating committees, including, but not limited to, the publication of a periodic update on a
credit rating and related analyses.
S&P keeps certain activities of its business units separate from each other in order to preserve the independence and objectivity of their respective activities.
S&P has established policies and procedures to maintain the confidentiality of certain non-public information received in connection with each analytical process.
S&P receives compensation for its ratings and certain analyses, normally from issuers or underwriters of securities or from obligors. S&P reserves the right to
disseminate its opinions and analyses. S&P's public ratings and analyses are made available on S&P Maalot’s website, maalot.co.il and on S&P Global’s website, spglobal.com/ratings, and may be distributed through other means,
including via S&P publications and third-party redistributors.