|
Earnings Release
|
 |
ENLIGHT RENEWABLE ENERGY REPORTS
FIRST QUARTER 2026 FINANCIAL RESULTS
All of the amounts disclosed in this press release are in U.S. dollars unless otherwise noted
TEL AVIV, ISRAEL, May 5, 2026 – Enlight Renewable Energy (NASDAQ: ENLT, TASE: ENLT) today reported financial results for the quarter ended March 31, 2026.
Registration links for the Company’s earnings English and Hebrew conference call and webcasts can be found at the end of this earnings release.
|
The entire suite of the Company’s 1Q26 financial results can be found on our IR website at https://enlightenergy.com/data/financial-reports/
|
Financial Highlights
| • |
Total revenues and income1 of $200 million, an increase of 54% compared to the same period last year.
|
| • |
Net income of $38 million, compared to $102 million in the same period last year. Excluding a gain of approximately $81 million from the sale of a 44% stake in the Sunlight cluster and
deconsolidation in the first quarter of 2025, net income increased by approximately 76%, compared to net income of approximately $21 million in the first quarter of 2025.
|
| • |
Adjusted EBITDA2 of $154 million, compared to $132 million in the same period last year. Excluding a gain of approximately $42 million from the sale of a 44% stake in the Sunlight
cluster in the first quarter of 2025 and a gain of approximately $12 million from a follow-on transaction for the sale of an additional 11% stake in the current quarter, Adjusted EBITDA totaled $142 million, compared to $89 million in the
same period last year, an increase of 58%.
|
| • |
Cash flow from operating activities3 of $100 million, an increase of 58% compared to the same period last year.
|
| • |
The Company reaffirms its 2026 guidance of total revenues and income4 in the range of $755 million to $785 million, representing 32% growth compared to 2025, and Adjusted EBITDA in the
range of $545 million to $565 million, representing 27% growth compared to 2025.
|
1Total revenues and income include revenues from the sale of electricity, as well as income from tax benefits from U.S. projects; 2Adjusted
EBITDA is a non-IFRS measure. Please refer to the appendices for the reconciliation to net income. The Company is unable to provide a reconciliation of “Adjusted EBITDA” to net income on a forward-looking basis without unreasonable effort because
items that impact this IFRS financial measure are not within the Company’s control and/or cannot be reasonably predicted; 3Interest payments and receipts are classified as cash flows from financing and investing activities,
respectively, instead of cash flows from operating activities. Adjustments were made to comparative figures due to a change in accounting policy; for further details, see Appendix No. 4; 4Total revenues and income include revenues from
the sale of electricity along with income from tax benefits from US projects amounting to $160-180m.
Summary of key financial results:
| For the three months ended | |||
|
($ millions)
|
March 31, 2026
|
March 31, 2025
|
% change
|
|
Revenues and Income
|
200
|
130
|
54%
|
|
Net Income
|
38
|
102
|
(63%)
|
|
Net Income excluding Sunlight
|
38
|
21
|
76%
|
|
Adjusted EBITDA
|
154
|
132
|
17%
|
|
Adjusted EBITDA excluding Sunlight
|
142
|
89
|
58%
|
|
Cash Flow from Operating Activities
|
100
|
63
|
58%
|
Adi Leviatan, CEO of Enlight Renewable Energy: “2026 is off to a strong start, reflected in consistent and impressive over 50% growth across Enlight’s financial
metrics. The Company improved output and achieved key milestones, despite geopolitical instability and challenges in global markets. These strong results are a direct testament to the structural resilience of the renewable energy sector, and to
Enlight’s proven execution capabilities in particular. Our ability to generate meaningful value for shareholders even under complex conditions underscores the strength of our strategy and our unwavering commitment to leading the global transition
to clean and sustainable energy.”
Portfolio Review
During the first quarter and through the date of this release, Enlight continued to expand its portfolio and advance projects through the various phases of
development. As of the earning release date, Enlight’s total portfolio is comprised of 21.5 GW of generation capacity and 69 GWh energy storage (totaling 41.25 FGW), representing an increase of approximately 8% compared to the total
portfolio at year-end 2025 (38 FGW). The generation component increased by approximately 4% and the storage component increased by approximately 13% compared to the previous quarter, reflecting Enlight’s strategy to lead in energy storage as a
response to the significant shortage in the sector.
The mature component of the portfolio (operating projects, projects under construction, and projects in pre-construction) comprises 6.4 GW of generation capacity and
17.9 GWh of storage capacity, totaling 11.6 FGW, compared to 11.4 FGW at the end of the previous quarter. Approximately 56% of the mature component is in the U.S., 28% in Europe, and approximately 16% in MENA.
The advanced development and development components comprise of 15 GW of generation capacity and 51.1 GWh of storage capacity, totaling 29.6 FGW, an increase of 11%
compared to year-end 2025, supporting Enlight’s growth potential beyond 2028. Approximately 71% of this component is located in the U.S., 16% in MENA, and 13% in Europe.
5FGW (Factored GW) is the company’s consolidated metric combining generation and storage capacity into a uniform figure based on the ratio of construction costs. Current
weighted average construction cost ratio is 3.5 GWh of storage per 1 GW of generation: FGW = GW + GWh / 3.5.
The composition of Enlight’s portfolio appears in the following table:
|
Component
|
Status
|
FGW
|
Annual revenues & income run rate ($m)
|
|
Operating
|
Commercial operation
|
3.9
|
~750-770
|
|
Under construction
|
Under construction
|
4.0
|
~770
|
|
Pre-construction
|
0-12 months to start of construction
|
3.7
|
~540
|
|
Total Mature Portfolio
|
Mature
|
11.6
|
~$2,060-2,080m
|
|
Advanced development
|
13-24 months to start of construction
|
7.3
|
N/A
|
|
Development
|
24+ months to start of construction
|
22.3
|
N/A
|
|
Total Portfolio
|
|
41.2
|
N/A
|
| • |
Operating component of the portfolio: 3.9 FGW
|
| o |
The operating component totals 3.9 FGW, of which approximately 41% is in the U.S., 34% in Europe, and 25% in Israel. 90% of operating capacity is contracted under PPAs, of which approximately 24%
is under indexed linked PPAs.
|
| o |
The operating portfolio generates annualized revenues and income run rate of approximately $750-770 million.
|
| • |
Under construction component of the portfolio: 4.0 FGW
|
| o |
The under-construction component includes six projects in the U.S. (Phases 1 through 3 of the CO Bar complex, Country Acres, Crimson Orchard, Snowflake A) with total capacity of 3.4 FGW, four
projects in Europe totaling approximately 400 FMW, and projects in Israel totaling approximately 170 FMW.
|
| o |
Storage projects (stand-alone or co-located) account for approximately 35% of total capacity.
|
| o |
This component increased quarter-over-quarter by approximately 0.5 FGW (approximately 14%), driven by continued progress at the CO Bar complex, including the start of construction of CO Bar 3, with
planned generation capacity of 473 MW. Together with Phases 1 and 2, which began construction at the beginning of the year, 1.4 FGW is currently under construction out of an expected total of 2.4 FGW for the complex.
|
| o |
The Company estimates that during the remainder of 2026 it will begin construction of projects totaling approximately 3 FGW, such that over 90% of the mature component is expected to be either
operating or under construction by the end of 2026.
|
| o |
Under-construction projects are expected to contribute approximately $770 million to the annual revenues and income in their first full year of operation.
|
| • |
Pre-construction component of the portfolio: 3.7 FGW
|
| o |
The pre-construction component includes six projects in the U.S. totaling 1.5 FGW, five projects in Europe totaling approximately 1.5 FGW, and projects in Israel totaling 0.7 FGW.
|
| o |
Storage projects account for 75% of total capacity.
|
| o |
During the quarter, projects totaling approximately 90 FMW in Israel transitioned from advanced development to pre-construction.
|
| o |
Pre-construction projects are expected to contribute approximately $540 million to the annual revenues and income in their first full year of operation.
|
| • |
Advanced development component of the portfolio: 7.3 FGW
|
| o |
This component includes 5.3 FGW in the U.S., 1.2 FGW in Europe, and 0.8 FGW in MENA.
|
| o |
Projects totaling approximately 1.3 FGW advanced from development to advanced development, of which 67% are in the U.S., 18% in Europe, and 15% in MENA.
|
| o |
Storage projects account for approximately 47% of total capacity.
|
| o |
Over the past three months, approximately 1.0 FGW completed a System Impact Study in the U.S.; as of the earnings release date, 5.2 FGW (approximately 96% of this component’s capacity in the U.S.)
has a high likelihood of achieving grid interconnection.
|
| o |
Approximately 4.1 FGW of U.S. capacity met Safe Harbor6 requirements (approximately 77% of this component’s capacity in the U.S.), securing eligibility for tax benefits. The Company
estimates that by the end of June 2026, the remaining approximately 1.3 FGW in advanced development is expected to meet Safe Harbor requirements.
|
| • |
Development component of the portfolio: 22.3 FGW
|
| o |
This component includes 15.6 FGW in the U.S., with broad geographic presence including projects in the PJM, WECC, SPP, and MISO regions, 3.8 FGW in MENA, and 2.9 FGW in Europe.
|
| o |
Over the past three months, projects totaling approximately 4.2 FGW were added to the development component, of which approximately 82% are in the U.S.
|
| o |
Storage projects account for approximately 50% of total capacity.
|
6Securing Safe Harbor status and grid interconnection agreement do not guarantee the project's completion. Actual project completion is subject to meeting development
milestones and market conditions
| o |
Over the past three months, approximately 1.0 FGW completed a System Impact Study in the U.S.; as of the earnings release date, 8.3 FGW (approximately 53% of this component’s capacity in the U.S.)
has a high likelihood of achieving grid interconnection.
|
| o |
Approximately 2.7 FGW of U.S. capacity met Safe Harbor requirements (approximately 17% of this component’s capacity in the U.S.), securing eligibility for tax benefits. The Company estimates that
by the end of June 2026, an additional approximately 0.7 to 2.7 FGW of the remaining U.S. development pipeline is expected to meet Safe Harbor requirements.
|
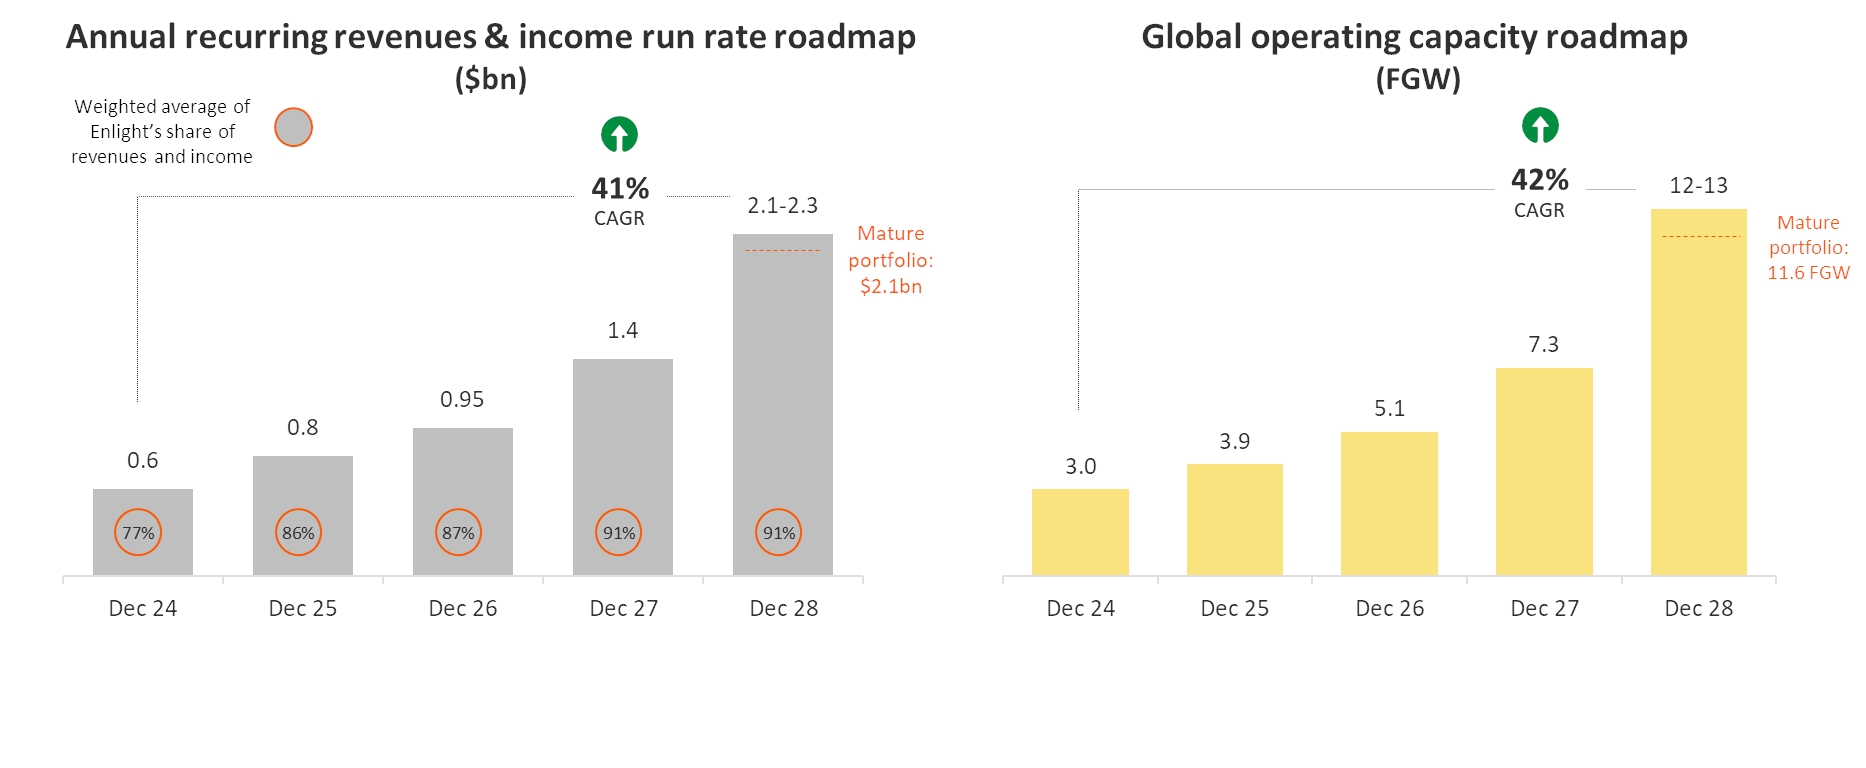
With completion of the current mature portfolio by year-end 2028, Enlight’s operating capacity is expected to reach 12–13 FGW, and total annual revenues and income run
rate is expected to reach $2.1 to $2.3 billion by the end of 2028, reflecting a 41% compound annual growth rate between 2024 to 2028.
7The expected growth in 2028 encompasses the Company’s operations in all geographies. Expected growth relies on business plans which rely on development
conditions and assumptions regarding electricity prices and are contingent on current trends known to the Company at this time; Expected Adjusted EBITDA margin of approximately 70%-80% (including tax benefits) for the years shown. The company's
revenues from tax benefits are estimated at approximately 22-26% of the total revenues & income run rate for December 2026 and approximately 30-31% of the total revenues & income run rate for December 2027 and December 2028.
Project and Corporate Finance
During the quarter, the Company raised financing sources totalling approximately $740 million:
| • |
An issuance of approximately 6 million shares totaling approximately $422 million.
|
| • |
Project financing of $304 million for the Crimson Orchard project in Idaho, U.S., with 120 MW of solar capacity and 400 MWh of storage capacity (approximately 230 FMW). The project is expected to
reach commercial operation during the second quarter of 2027.
|
| • |
A follow-on transaction for the sale of an additional 11% stake in the Sunlight cluster generated cash flow of $16 million. Following the balance sheet date, an additional approximately 15% was
sold, completing the sale of 70% of the cluster.
|
| • |
As of the balance sheet date, cash and cash equivalents at the “topco”8 level amounted to $709 million. In addition, cash and cash equivalents held by Enlight’s subsidiaries amounted to
$270 million.
|
| • |
As of the balance sheet date, the Company maintained $525 million of credit facilities, of which $162 million has been drawn.
|
| • |
As of the balance sheet date, the Company maintained approximately $1.6 billion of letter of credit and surety bond facilities, of which $591 million has been utilized.
|
Financial Results Analysis
Revenues and Income by Segment:
|
($ millions)
|
For the three months ended
|
||
|
Segment
|
March 31, 2026
|
March 31, 2025
|
% change
|
|
MENA
|
65
|
43
|
50%
|
|
Europe
|
61
|
51
|
19%
|
|
U.S.
|
74
|
35
|
111%
|
|
Total Revenues & Income
|
200
|
130
|
54%
|
Revenues & Income
In the first quarter of 2026, the Company’s total revenues and income increased by 54% to approximately $200 million, compared to approximately $130 million in the
same period last year. Revenues from the sale of electricity increased by 43% to $156 million, and income from tax benefits totaled approximately $43 million, compared to approximately $20 million in the same period last year.
8Including Enlight Renewable Energy, headquarter companies in Europe and the U.S. and Clenera, and excluding other subsidiaries and project-linked
entities.
Key contributors to the increase include the Roadrunner and Quail Ranch projects in the U.S., which were connected toward the end of the fourth quarter of 2025 and
contributed approximately $16 million to electricity revenues. Higher output from existing projects contributed approximately $14 million to the increase, primarily due to stronger-than-average wind conditions in projects in Israel and Europe.
Electricity trading activity in Israel doubled compared to the same period last year and contributed approximately $6 million to the increase. Depreciation of the U.S. dollar against the Israeli shekel and the euro contributed approximately $12
million to electricity revenues. The increase in income from tax benefits is primarily attributable to the operation of newly commissioned projects in the U.S.
Net Income
Net income for the first quarter of 2026 totaled $38 million, compared to $102 million in the same period last year, or $21 million excluding $81 million gain from
the sale of a 44% stake in the Sunlight cluster and deconsolidation in the same period last year.
The increase of approximately $17 million is primarily attributable to the increase of $70 million in total revenues and income, offset by an increase of
approximately $18 million in cost of sales (mainly due to increased electricity trading activity in Israel and the commissioning of new projects), an increase of $17 million in depreciation and amortization, and an increase of approximately $9
million in general and administrative and development expenses, partially offset by an increase of approximately $5 million in other income. In addition, finance expenses increased by $12 million (as a result of newly connected projects) and income
taxes increased by $4 million (excluding the tax impact of the Sunlight transaction).
Adjusted EBITDA
Adjusted EBITDA for the first quarter of 2026 totaled approximately $154 million, compared to approximately $132 million in the same period last year. Excluding a $42 million
contribution from the sale of a 44% stake in the Sunlight cluster in the first quarter of 2025 and a $12 million contribution from the sale of an additional 11% stake in the current quarter, Adjusted EBITDA increased by $52 million, representing
58% growth.
The increase was driven by the $70 million increase in total revenues and income and a $5 million increase in
other income, partially offset by a $17 million increase in cost of sales and a $6 million increase in general and administrative and development expenses (excluding share-based compensation expense).
Conference Call Information
English Conference Call & Webcast at 8:00am ET / 3:00pm Israel:
Please pre-register to join the live conference call:
https://register-conf.media-server.com/register/BI298036fe28364be9a3420ef6404be876
Upon registering, you will be emailed a dial-in number, direct passcode and unique PIN.
To join by webcast, please use the following link:
https://edge.media-server.com/mmc/p/jwtsutqs
Hebrew Webcast at 6:00am ET / 1:00pm Israel:
Please pre-register to join the live webcast:
https://enlightenergy-co-il.zoom.us/webinar/register/WN_W3VsvHjFSV65eV_zLuCaIA
The press release with the financial results as well as the investor
presentation materials will be accessible from the Company’s website prior to the conference call. An archived version of the webcast will be available on the Company’s investor relations website at https://enlightenergy.com/info/investors/
Supplemental Financial and Other Information
We intend to announce material information to the public through the Enlight investor
relations website at https://enlightenergy.com/info/investors, SEC filings, press releases, public conference calls, and public webcasts. We use these channels to communicate with our investors,
customers, and the public about our company, our offerings, and other issues. As such, we encourage investors, the media, and others to follow the channels listed above, and to review the information disclosed through such channels. Any updates
to the list of disclosure channels through which we will announce information will be posted on the investor relations page of our website.
Non-IFRS Financial Measures
This release presents Adjusted EBITDA, a non-IFRS financial metric, which is provided as a complement to the results provided in accordance with the International
Financial Reporting Standards as issued by the International Accounting Standards Board (“IFRS”). A reconciliation of the non-IFRS financial information to the most directly comparable IFRS financial measure is provided in the accompanying tables
found at the end of this release.
We define Adjusted EBITDA as net income (loss) plus depreciation and amortization, share based compensation, finance expenses, taxes on income and share in losses of
equity accounted investees and minus finance income and non-recurring portions of other income, net. For the purposes of calculating Adjusted EBITDA, compensation for inadequate performance of goods and services procured by the Company are included
in other income, net. Compensation for inadequate performance of goods and services reflects the profits the Company would have generated under regular operating conditions and is therefore included in Adjusted EBITDA. With respect to gains
(losses) from asset disposals, as part of Enlight’s strategy to accelerate growth and reduce the need for equity financing, the Company sells parts of or the entirety of selected renewable project assets from time to time, and therefore includes
realized gains or losses from these asset disposals in Adjusted EBITDA. In the case of partial assets disposals, Adjusted EBITDA includes only the actual consideration less the book value of the assets sold. Our management believes Adjusted EBITDA
is indicative of operational performance and ongoing profitability and uses Adjusted EBITDA to evaluate the operating performance and for planning and forecasting purposes.
Non-IFRS financial measures have limitations as analytical tools and should not be considered in isolation or as substitutes for financial information presented
under IFRS. There are a number of limitations related to the use of non-IFRS financial measures versus comparable financial measures determined under IFRS. For example, other companies in our industry may calculate the non-IFRS financial measures
that we use differently or may use other measures to evaluate their performance. All of these limitations could reduce the usefulness of our non-IFRS financial measures as analytical tools. Investors are encouraged to review the related IFRS
financial measure, Net Income, and the reconciliations of Adjusted EBITDA provided below to Net Income and to not rely on any single financial measure to evaluate our business.
Special Note Regarding Forward-Looking Statements
This press release contains forward-looking statements within the meaning of the U.S. Private Securities Litigation Reform Act of 1995. We intend such
forward-looking statements to be covered by the safe harbor provisions for forward-looking statements as contained in Section 27A of the Securities Act of 1933, as amended, and Section 21E of the Securities Exchange Act of 1934, as amended. All
statements contained in this press release other than statements of historical fact, including, without limitation, statements regarding the Company’s business strategy and plans, capabilities of the Company’s project portfolio and the Company’s
expectation relating to projects, including their timeline, financing and the achievement of operational and financial objectives, market opportunity, utility demand and potential growth, discussions with commercial counterparties and financing
sources, pricing trends for materials, progress of Company projects, including anticipated timing of related approvals and project completion and anticipated production delays, the Company’s future financial results, expected impact from various
regulatory developments and anticipated trade sanctions, expectations regarding wind production, electricity prices and windfall taxes, and expected Revenues, Income and Adjusted EBITDA guidance, the expected timing of completion of our ongoing
projects, and the Company’s anticipated cash requirements and financing plans , are forward-looking statements. The words “may,” “might,” “will,” “could,” “would,” “should,” “expect,” “plan,” “anticipate,” “intend,” “target,” “seek,” “believe,”
“estimate,” “predict,” “potential,” “continue,” “contemplate,” “possible,” “forecasts,” “aims” or the negative of these terms and similar expressions are intended to identify forward-looking statements, though not all forward-looking statements use
these words or expressions.
These statements are neither promises nor guarantees, but involve known and unknown risks, uncertainties and other important factors that may cause our actual
results, performance or achievements to be materially different from any future results, performance or achievements expressed or implied by the forward-looking statements, including, but not limited to, the following: our ability to site suitable
land for, and otherwise source, renewable energy projects and to successfully develop and convert them into Operational Projects, as well as timing of construction of any project; availability of, and access to, interconnection facilities and
transmission systems; our ability to obtain and maintain governmental and other regulatory approvals and permits, including environmental approvals and permits; construction delays, operational delays and supply chain disruptions leading to
increased cost of materials required for the construction of our projects, as well as cost overruns and delays related to disputes with contractors; disruptions in trade caused by political, social or economic instability in regions where our
components and materials are made; our suppliers’ ability and willingness to perform both existing and future obligations; competition from traditional and renewable energy companies in developing renewable energy projects; potential slowed demand
for renewable energy projects and our ability to enter into new offtake contracts on acceptable terms and prices as current offtake contracts expire; offtakers’ ability to terminate contracts or seek other remedies resulting from failure of our
projects to meet development, operational or performance benchmarks; exposure to market prices in some of our offtake contracts; various technical and operational challenges leading to unplanned outages, reduced output, interconnection or
termination issues; the dependence of our production and revenue on suitable meteorological and environmental conditions, and our ability to accurately predict such conditions; our ability to enforce warranties provided by our counterparties in the
event that our projects do not perform as expected; government curtailment, energy price caps and other government actions that restrict or reduce the profitability of renewable energy production; electricity price volatility, unusual weather
conditions (including the effects of climate change, could adversely affect wind and solar conditions), catastrophic weather-related or other damage to facilities, unscheduled generation outages, maintenance or repairs, unanticipated changes to
availability due to higher demand, shortages, transportation problems or other developments, environmental incidents, or electric transmission system constraints and the possibility that we may not have adequate insurance to cover losses as a
result of such hazards; our dependence on certain operational projects for a substantial portion of our cash flows; our ability to continue to grow our portfolio of projects through successful acquisitions; changes and advances in technology that
impair or eliminate the competitive advantage of our projects or upsets the expectations underlying investments in our technologies; our ability to effectively anticipate and manage cost inflation, interest rate risk, currency exchange fluctuations
and other macroeconomic conditions that impact our business; our ability to retain and attract key personnel; our ability to manage legal and regulatory compliance and litigation risk across our global corporate structure; our ability to protect
our business from, and manage the impact of, cyber-attacks, disruptions and security incidents, as well as acts of terrorism or war; changes to existing renewable energy industry policies and regulations that present technical, regulatory and
economic barriers to renewable energy projects; the reduction, elimination or expiration of government incentives for, or regulations mandating the use of, renewable energy; our ability to effectively manage the global expansion of the scale of our
business operations; our ability to perform to expectations in our new line of business involving the construction of PV systems for municipalities in Israel; our ability to effectively manage our supply chain and comply with applicable regulations
with respect to international trade relations, the impact of tariffs on the cost of construction and our ability to mitigate such impact, sanctions, export controls and anti-bribery and anti-corruption laws; our ability to effectively comply with
Environmental Health and Safety and other laws and regulations and receive and maintain all necessary licenses, permits and authorizations; our performance of various obligations under the terms of our indebtedness (and the indebtedness of our
subsidiaries that we guarantee) and our ability to continue to secure project financing on attractive terms for our projects; limitations on our management rights and operational flexibility due to our use of tax equity arrangements; potential
claims and disagreements with partners, investors and other counterparties that could reduce our right to cash flows generated by our projects; our ability to comply with increasingly complex tax laws of various jurisdictions in which we currently
operate as well as the tax laws in jurisdictions in which we intend to operate in the future; our ability to obtain tax benefits and credits in the U.S. or other jurisdictions; the unknown effect of the dual listing of our ordinary shares on the
price of our ordinary shares; various risks related to our incorporation and location in Israel, including the ongoing war in Israel, where our headquarters and some of our wind energy and solar energy projects are located; the costs and
requirements of being a public company, including the diversion of management’s attention with respect to such requirements; certain provisions in our Articles of Association and certain applicable regulations that may delay or prevent a change of
control; and other risk factors set forth in the section titled “Risk factors” in our Annual Report on Form 20-F for the fiscal year ended December 31, 2025, filed with the Securities and Exchange Commission (the “SEC”), as may be updated in our
other documents filed with or furnished to the SEC.
These statements reflect management’s current expectations regarding future events and operating performance and speak only as of the date of
this press release. You should not put undue reliance on any forward-looking statements. Although we believe that the expectations reflected in the forward-looking statements are reasonable, we cannot guarantee that future results, levels of
activity, performance and events and circumstances reflected in the forward-looking statements will be achieved or will occur. Except as required by applicable law, we undertake no obligation to update or revise publicly any forward-looking
statements, whether as a result of new information, future events or otherwise, after the date on which the statements are made or to reflect the occurrence of unanticipated events.
About Enlight
Founded in 2008, Enlight develops, finances, constructs, owns, and operates utility-scale renewable energy projects. Enlight operates across the three largest
renewable segments today: solar, wind and energy storage. A global platform, Enlight operates in the United States, Israel and 12 European countries. Enlight has been traded on the Tel Aviv Stock Exchange since 2010 (TASE: ENLT) and completed its
U.S. IPO (Nasdaq: ENLT) in 2023.
Company Contacts
Limor Zohar Megen
Director IR
investors@enlightenergy.com
Erica Mannion or Mike Funari
Sapphire Investor Relations, LLC
+1 617 542 6180
investors@enlightenergy.com
Appendix 1 – Financial information
Consolidated Statements of Income
|
For the three months ended March 31
|
||||||||
|
2026
|
2025
|
|||||||
|
USD in
|
USD in
|
|||||||
|
thousands
|
thousands
|
|||||||
|
Revenues
|
156,487
|
109,758
|
||||||
|
Tax benefits
|
43,106
|
20,111
|
||||||
|
Total revenues and income
|
199,593
|
129,869
|
||||||
|
Cost of sales (*)
|
(44,279
|
)
|
(26,638
|
)
|
||||
|
Depreciation and amortization
|
(50,722
|
)
|
(33,789
|
)
|
||||
|
General and administrative expenses
|
(18,963
|
)
|
(11,846
|
)
|
||||
|
Development expenses
|
(3,999
|
)
|
(2,564
|
)
|
||||
|
Total operating expenses
|
(117,963
|
)
|
(74,837
|
)
|
||||
|
Gains from projects disposals
|
436
|
97,262
|
||||||
|
Other income (expenses), net
|
4,200
|
(1,105
|
)
|
|||||
|
Operating profit
|
86,266
|
151,189
|
||||||
|
Finance income
|
8,996
|
6,695
|
||||||
|
Finance expenses
|
(44,183
|
)
|
(30,203
|
)
|
||||
|
Total finance expenses, net
|
(35,187
|
)
|
(23,508
|
)
|
||||
|
Profit before tax and equity loss
|
51,079
|
127,681
|
||||||
|
Share of losses of equity accounted investees
|
(993
|
)
|
(1,227
|
)
|
||||
|
Profit before income taxes
|
50,086
|
126,454
|
||||||
|
Taxes on income
|
(12,278
|
)
|
(24,651
|
)
|
||||
|
Profit for the period
|
37,808
|
101,803
|
||||||
|
Profit for the period attributed to:
|
||||||||
|
Owners of the Company
|
24,073
|
94,458
|
||||||
|
Non-controlling interests
|
13,735
|
7,345
|
||||||
|
37,808
|
101,803
|
|||||||
|
Earnings per ordinary share (in USD) with a par value of
NIS 0.1, attributable to owners of the parent Company:
|
||||||||
|
Basic earnings per share
|
0.18
|
0.80
|
||||||
|
Diluted earnings per share
|
0.16
|
0.75
|
||||||
|
Weighted average of share capital used in the
calculation of earnings:
|
||||||||
|
Basic per share
|
135,133,959
|
118,783,541
|
||||||
|
Diluted per share
|
146,664,085
|
125,316,177
|
||||||
(*) Excluding depreciation and amortization.
|
Consolidated Statements of Financial Position as of
|
||||||||
|
March 31
|
December 31
|
|||||||
|
2026
|
2025
|
|||||||
|
USD in
|
USD in
|
|||||||
|
Thousands
|
Thousands
|
|||||||
|
Assets
|
||||||||
|
Current assets
|
||||||||
|
Cash and cash equivalents
|
978,761
|
528,497
|
||||||
|
Restricted cash
|
182,046
|
409,424
|
||||||
|
Trade receivables
|
97,088
|
95,118
|
||||||
|
Other receivables
|
101,113
|
62,286
|
||||||
|
Other financial assets
|
567
|
524
|
||||||
|
Total current assets
|
1,359,575
|
1,095,849
|
||||||
|
Non-current assets
|
||||||||
|
Restricted cash
|
127,464
|
130,358
|
||||||
|
Other long-term receivables
|
33,125
|
64,349
|
||||||
|
Deferred costs in respect of projects
|
290,516
|
235,615
|
||||||
|
Deferred borrowing costs
|
1,788
|
1,749
|
||||||
|
Loans to investee entities
|
89,723
|
85,131
|
||||||
|
Investments in equity accounted investees
|
47,464
|
59,310
|
||||||
|
Fixed assets, net
|
6,678,751
|
6,281,418
|
||||||
|
Intangible assets, net
|
300,424
|
303,971
|
||||||
|
Deferred taxes assets
|
3,544
|
4,692
|
||||||
|
Right-of-use asset, net
|
246,190
|
225,495
|
||||||
|
Financial assets at fair value through profit or loss
|
84,879
|
83,582
|
||||||
|
Other financial assets
|
50,502
|
58,383
|
||||||
|
Total non-current assets
|
7,954,370
|
7,534,053
|
||||||
|
Total assets
|
9,313,945
|
8,629,902
|
||||||
|
Consolidated Statements of Financial Position as of (Cont.)
|
||||||||
|
March 31
|
December 31
|
|||||||
|
2026
|
2025
|
|||||||
|
USD in
|
USD in
|
|||||||
|
Thousands
|
Thousands
|
|||||||
|
Liabilities and equity
|
||||||||
|
Current liabilities
|
||||||||
|
Credit and current maturities of loans from banks and other financial institutions
|
1,078,760
|
884,120
|
||||||
|
Trade payables
|
103,994
|
137,230
|
||||||
|
Other payables
|
376,080
|
405,741
|
||||||
|
Current maturities of debentures
|
175,317
|
173,571
|
||||||
|
Current maturities of lease liability
|
12,233
|
12,396
|
||||||
|
Other financial liabilities
|
9,564
|
16,147
|
||||||
|
Total current liabilities
|
1,755,948
|
1,629,205
|
||||||
|
Non-current liabilities
|
||||||||
|
Debentures
|
484,200
|
477,315
|
||||||
|
Other financial liabilities
|
175,861
|
378,303
|
||||||
|
Convertible debentures
|
273,329
|
273,801
|
||||||
|
Loans from banks and other financial institutions
|
3,010,968
|
2,981,786
|
||||||
|
Loans from non-controlling interests
|
85,793
|
86,946
|
||||||
|
Financial liabilities through profit or loss
|
27,141
|
26,946
|
||||||
|
Deferred taxes liabilities
|
82,387
|
77,688
|
||||||
|
Employee benefits
|
1,718
|
1,645
|
||||||
|
Lease liability
|
249,835
|
231,135
|
||||||
|
Deferred income related to tax equity
|
630,579
|
370,734
|
||||||
|
Asset retirement obligation
|
99,541
|
99,460
|
||||||
|
Total non-current liabilities
|
5,121,352
|
5,005,759
|
||||||
|
Total liabilities
|
6,877,300
|
6,634,964
|
||||||
|
Equity
|
||||||||
|
Ordinary share capital
|
3,938
|
3,711
|
||||||
|
Share premium
|
1,743,143
|
1,319,716
|
||||||
|
Capital reserves
|
86,103
|
99,311
|
||||||
|
Proceeds on account of convertible options
|
25,008
|
25,380
|
||||||
|
Accumulated profit
|
264,096
|
240,023
|
||||||
|
Equity attributable to shareholders of the Company
|
2,122,288
|
1,688,141
|
||||||
|
Non-controlling interests
|
314,357
|
306,797
|
||||||
|
Total equity
|
2,436,645
|
1,994,938
|
||||||
|
Total liabilities and equity
|
9,313,945
|
8,629,902
|
||||||
|
Consolidated Statements of Cash Flows
|
||||||||
|
For the three months ended
March 31 |
||||||||
|
2026
|
2025
|
|||||||
|
USD in
|
USD in
|
|||||||
|
Thousands
|
Thousands
|
|||||||
|
Cash flows for operating activities
|
||||||||
|
Profit for the period
|
37,808
|
101,803
|
||||||
|
Income and expenses not associated with cash flows:
|
||||||||
|
Depreciation and amortization
|
50,722
|
33,789
|
||||||
|
Finance expenses, net
|
34,703
|
22,388
|
||||||
|
Share-based compensation
|
5,101
|
1,710
|
||||||
|
Taxes on income
|
12,278
|
24,651
|
||||||
|
Tax benefits
|
(40,750
|
)
|
(20,111
|
)
|
||||
|
Other income (expenses), net
|
(1,751
|
)
|
1,105
|
|||||
|
Company’s share in losses of investee partnerships
|
993
|
1,227
|
||||||
|
Gains from projects disposals
|
(436
|
)
|
(97,262
|
)
|
||||
|
60,860
|
(32,503
|
)
|
||||||
|
Changes in assets and liabilities items:
|
||||||||
|
Change in other receivables
|
2,036
|
(856
|
)
|
|||||
|
Change in trade receivables
|
(1,477
|
)
|
(20,376
|
)
|
||||
|
Change in other payables
|
(4,026
|
)
|
8,604
|
|||||
|
Change in trade payables
|
6,729
|
7,802
|
||||||
|
3,262
|
(4,826
|
)
|
||||||
|
Income Tax paid
|
(1,585
|
)
|
(1,075
|
)
|
||||
|
Net cash from operating activities
|
100,345
|
63,399
|
||||||
|
Cash flows for investing activities
|
||||||||
|
Sale (Acquisition) of consolidated entities, net
|
(234
|
)
|
36,223
|
|||||
|
Changes in restricted cash and bank deposits, net
|
226,946
|
8,176
|
||||||
|
Purchase, development, and construction in respect of projects
|
(609,233
|
)
|
(255,862
|
)
|
||||
|
Interest receipts (*)
|
6,540
|
2,512
|
||||||
|
Loans provided and Investment in investees
|
(19,408
|
)
|
(7,430
|
)
|
||||
|
Repayments of loans from investees
|
14,370
|
30,815
|
||||||
|
Payments on account of acquisition of consolidated entity
|
-
|
(7,447
|
)
|
|||||
|
Purchase of financial assets measured at fair value through profit or loss, net
|
(2,264
|
)
|
(3,040
|
)
|
||||
|
Net cash used in investing activities
|
(383,283
|
)
|
(196,053
|
)
|
||||
|
Consolidated Statements of Cash Flows (Cont.)
|
||||||||
|
For the three months ended
March 31
|
||||||||
|
2026
|
2025
|
|||||||
|
USD in
|
USD in
|
|||||||
|
Thousands
|
Thousands
|
|||||||
|
Cash flows from financing activities
|
||||||||
|
Receipt of loans from banks and other financial institutions
|
778,165
|
143,578
|
||||||
|
Repayment of loans from banks and other financial institutions
|
(530,458
|
)
|
(108,922
|
)
|
||||
|
Interest paid (*)
|
(35,569
|
)
|
(22,298
|
)
|
||||
|
Issuance of debentures
|
-
|
125,838
|
||||||
|
Issuance of convertible debentures
|
-
|
114,685
|
||||||
|
Repayment of debentures
|
-
|
(21,994
|
)
|
|||||
|
Proceeds from investments by tax-equity investors
|
121,068
|
-
|
||||||
|
Repayment of tax-equity investment
|
(1,987
|
)
|
-
|
|||||
|
Deferred borrowing costs
|
(11,774
|
)
|
(35,199
|
)
|
||||
|
Receipt of loans from non-controlling interests
|
14
|
-
|
||||||
|
Increase in holding rights of consolidated entity
|
-
|
(1,392
|
)
|
|||||
|
Issuance of shares
|
419,317
|
-
|
||||||
|
Exercise of share options
|
17
|
11
|
||||||
|
Repayment of lease liability
|
(2,829
|
)
|
(4,058
|
)
|
||||
|
Proceeds from investment in entities by non-controlling interest
|
-
|
7,732
|
||||||
|
Net cash from financing activities
|
735,964
|
197,981
|
||||||
|
Increase in cash and cash equivalents
|
453,026
|
65,327
|
||||||
|
Balance of cash and cash equivalents at beginning of period
|
528,497
|
387,427
|
||||||
|
Effect of exchange rate fluctuations on cash and cash equivalents
|
(2,762
|
)
|
(3,224
|
)
|
||||
|
Cash and cash equivalents at end of period
|
978,761
|
449,530
|
||||||
(*) See Appendix 4 for additional information regarding the change in presentation of interest receipts and interest paid
Information related to Segmental Reporting
|
For the three months ended March 31, 2026
|
||||||||||||||||||||||||
|
MENA
|
Europe
|
USA
|
Total reportable segments
|
Others
|
Total
|
|||||||||||||||||||
|
USD in thousands
|
||||||||||||||||||||||||
|
Revenues
|
64,502
|
61,061
|
30,533
|
156,096
|
391
|
156,487
|
||||||||||||||||||
|
Tax benefits
|
-
|
-
|
43,106
|
43,106
|
-
|
43,106
|
||||||||||||||||||
|
Total revenues and income
|
64,502
|
61,061
|
73,639
|
199,202
|
391
|
199,593
|
||||||||||||||||||
|
Segment adjusted EBITDA
|
58,775
|
46,584
|
66,034
|
171,393
|
(454
|
)
|
170,939
|
|||||||||||||||||
|
Reconciliations of unallocated amounts:
|
||||||||||||||||||||||||
|
Headquarter costs (*)
|
(16,957
|
)
|
||||||||||||||||||||||
|
Intersegment profit
|
9
|
|||||||||||||||||||||||
|
Gains from projects disposals (**)
|
(11,902
|
)
|
||||||||||||||||||||||
|
Depreciation and amortization and share-based compensation
|
(55,823
|
)
|
||||||||||||||||||||||
|
Operating profit
|
86,266
|
|||||||||||||||||||||||
|
Finance income
|
8,996
|
|||||||||||||||||||||||
|
Finance expenses
|
(44,183
|
)
|
||||||||||||||||||||||
|
Share of the losses of equity accounted investees
|
(993
|
)
|
||||||||||||||||||||||
|
Profit before income taxes
|
50,086
|
|||||||||||||||||||||||
| (*) |
Including general and administrative and development expenses (excluding depreciation and amortization and share based compensation).
|
| (**) |
Reconciliation between EBITDA and operating profit reflecting the realization of revaluation gains from an asset revalued in 2025.
|
Information related to Segmental Reporting
|
For the three months ended March 31, 2025
|
||||||||||||||||||||||||
|
MENA
|
Europe
|
USA
|
Total reportable segments
|
Others
|
Total
|
|||||||||||||||||||
|
USD in thousands
|
||||||||||||||||||||||||
|
Revenues
|
42,867
|
51,384
|
14,678
|
108,929
|
829
|
109,758
|
||||||||||||||||||
|
Tax benefits
|
-
|
-
|
20,111
|
20,111
|
-
|
20,111
|
||||||||||||||||||
|
Total revenues and income
|
42,867
|
51,384
|
34,789
|
129,040
|
829
|
129,869
|
||||||||||||||||||
|
Segment adjusted EBITDA
|
68,017
|
44,663
|
30,549
|
143,229
|
81
|
143,310
|
||||||||||||||||||
|
Reconciliations of unallocated amounts:
|
||||||||||||||||||||||||
|
Headquarter costs (*)
|
(11,701
|
)
|
||||||||||||||||||||||
|
Intersegment loss
|
106
|
|||||||||||||||||||||||
|
Gains from projects disposals
|
54,973
|
|||||||||||||||||||||||
|
Depreciation and amortization and share-based compensation
|
(35,499
|
)
|
||||||||||||||||||||||
|
Operating profit
|
151,189
|
|||||||||||||||||||||||
|
Finance income
|
6,695
|
|||||||||||||||||||||||
|
Finance expenses
|
(30,203
|
)
|
||||||||||||||||||||||
|
Share of the losses of equity accounted investees
|
(1,227
|
)
|
||||||||||||||||||||||
|
Profit before income taxes
|
126,454
|
|||||||||||||||||||||||
| (*) |
Including general and administrative and development expenses (excluding depreciation and amortization and share based compensation).
|
|
Appendix 2 - Reconciliations between Net Income to Adjusted EBITDA
|
|
($ thousands)
|
|
For the three months ended
|
||
|
|
|
March 31, 2026
|
|
March 31, 2025
|
|
Net Income
|
|
37,808
|
101,803
|
|
|
Depreciation and amortization
|
|
50,722
|
33,789
|
|
|
Share based compensation
|
|
5,101
|
1,710
|
|
|
Finance income
|
|
(8,996)
|
(6,695)
|
|
|
Finance expenses
|
|
44,183
|
30,203
|
|
|
Gains from projects disposals
|
|
11,902 (**)
|
(54,973) (*)
|
|
|
Share of losses of equity accounted investees
|
|
993
|
1,227
|
|
|
Taxes on income
|
|
12,278
|
24,651
|
|
|
Adjusted EBITDA
|
|
153,991
|
131,715
|
|
|
* Net profit from deconsolidation and revaluation following the partial sale of an asset (Sunlight cluster).
** Contribution to Adjusted EBITDA from the sale of an additional stake in the deconsolidated asset (Sunlight
cluster). For more information regarding the composition of Adjusted EBITDA, refer to the description appearing in the “Non-IFRS financial measures” section of this press release.
|
Appendix 3 – Debentures Covenants
Debentures Covenants
As of March 31, 2026, the Company was in compliance with all of its financial covenants under the indenture for the Series C, D, F, G and H Debentures, based on
having achieved the following in its consolidated financial results:
Minimum equity
The company's equity shall be maintained at no less than NIS 375 million so long as debentures F remain outstanding, NIS 1,250 million so long as debentures C and D
remain outstanding, and USD 600 million so long as debentures G and H remain outstanding.
As of March 31, 2026, the company’s equity amounted to NIS 7,712 million (USD 2,437 million).
Net financial debt to net CAP
The ratio of standalone net financial debt to net CAP shall not exceed 70% for two consecutive financial periods so long as debentures F remain outstanding and shall
not exceed 65% for two consecutive financial periods so long as debentures C, D, G and H remain outstanding.
As of March 31, 2026, the net financial debt to net CAP ratio, as defined above, stands at 30%.
Net financial debt to EBITDA
So long as debentures F remain outstanding, standalone financial debt shall not exceed NIS 10 million, and the consolidated financial debt to EBITDA ratio shall not
exceed 18 for more than two consecutive financial periods.
For as long as debentures C and D remain outstanding, the consolidated financial debt to EBITDA ratio shall not exceed 15 for more than two consecutive financial
periods.
For as long as debentures G and H remain outstanding, the consolidated financial debt to EBITDA ratio shall not exceed 17 for more than two consecutive financial
periods.
As of March 31, 2026, the net financial debt to EBITDA ratio, as defined above, stands at 5.3.
Equity to balance sheet
The standalone equity to total balance sheet ratio shall be maintained at no less than 20% ,25% and 28%, respectively, for two consecutive financial periods for as
long as debentures F, debentures C and D and debentures G and H remain outstanding.
As of March 31, 2026, the equity to balance sheet ratio, as defined above, stands at 63%.
Appendix 4 – Change in accounting policy
Until September 30, 2025, interest paid and interest received were presented within cash flows from operating activities in the Consolidated Statements of Cash
Flows. In accordance with IAS 7 Statement of Cash Flows, entities are permitted to classify interest paid and interest received as operating, investing, or financing cash flows, provided that the selected
classification is applied consistently from period to period.
During the fourth quarter of 2025, management elected to change the classification of interest paid, including payments relating to interest rate swap (IRS)
instruments to cash flows used in financing activities, and interest received to cash flows from investing activities. Management believes that this change in presentation provides a more comprehensive view of the cost of financing the Company's
operations and better reflects management’s view of the financing nature of these transactions.
Accordingly, comparative information has been retrospectively adjusted to reflect this change in accounting policy in the Consolidated Statements of Cash Flows, as
presented below:
|
($ thousands)
|
For the three months ended
|
|||||
|
March 31, 2025
|
||||||
|
|
|
As reported
|
|
Adjustment
|
|
As adjusted
|
|
Net cash from operating activities
|
|
43,613
|
19,786
|
63,399
|
||
|
Net cash used in investing activities
|
|
(198,565)
|
2,512
|
(196,053)
|
||
|
Net cash from financing activities
|
|
220,279
|
(22,298)
|
197,981
|
||
|
Increase in cash and cash equivalents
|
|
65,327
|
-
|
65,327
|
||
Appendix 5
a) Segment information: Operational projects
|
($ thousands)
|
3 Months ended March 31
|
|||||||
|
Operational Project Segments
|
Installed Capacity (MW)
|
Installed Storage (MWh)
|
Generation
(GWh) |
Revenues and
income
|
Segment Adjusted
EBITDA1 |
|||
|
2026
|
2025
|
2026
|
2025
|
2026
|
2025
|
|||
|
MENA
|
676
|
819
|
373
|
317
|
64,502
|
42,867
|
43,192
|
25,750
|
|
Europe
|
1,327
|
-
|
860
|
704
|
61,061
|
51,384
|
46,584
|
44,663
|
|
USA
|
896
|
2,540
|
414
|
209
|
73,639
|
34,789
|
66,034
|
30,549
|
|
Total Consolidated
|
2,899
|
3,359
|
1,647
|
1,230
|
199,202
|
129,040
|
155,774
|
100,962
|
|
Unconsolidated at Share
|
38
|
51
|
|
|
Total
|
2,937
|
3,410
|
| b) |
Operational Projects Further Detail
|
|
($ thousands)
|
|
3 Months ended March 31, 2026
|
||||||||
|
Operational Project
|
Segment
|
Installed Capacity (MW)
|
Installed Storage (MWh)
|
Reported Revenue
|
Segment Adjusted EBITDA1
|
Debt balance as of March 31, 2026
|
Ownership %2
|
|||
|
MENA Wind
|
MENA
|
316
|
-
|
29,982
|
|
513,685
|
49%
|
|||
|
MENA PV + BESS
|
MENA
|
360
|
819
|
34,520
|
|
600,331
|
84%
|
|||
|
Total MENA
|
676
|
819
|
64,502
|
43,192
|
1,114,016
|
|
||||
|
Europe Wind
|
Europe
|
1,184
|
-
|
58,446
|
|
846,436
|
64%
|
|||
|
Europe PV
|
Europe
|
143
|
-
|
2,615
|
|
70,470
|
76%
|
|||
|
Total Europe
|
|
1,327
|
-
|
61,061
|
46,548
|
931,862
|
|
|||
|
USA PV + BESS
|
USA
|
896
|
2,540
|
73,639
|
|
786,129
|
100%
|
|||
|
Total USA
|
896
|
2,540
|
73,639
|
66,034
|
786,129
|
|||||
|
Total Consolidated Projects
|
2,899
|
3,359
|
199,202
|
155,774
|
2,817,050
|
|||||
|
Uncons. Projects at share
|
38
|
51
|
|
50%
|
||||||
|
Total
|
2,937
|
3,410
|
199,202
|
155,774
|
2,817,050
|
|||||
| 1) |
EBITDA results included $1m in the 3 months ended March 26, of compensation recognized from Björnberget; EBITDA results exclude $3m of compensation from Emek and $12m from Sunlight sale in 2026,
and $42m is 2025
|
| 2) |
Ownership % is calculated based on the project's share of total revenues
|
c) Projects under construction
|
($ millions)
Consolidated Projects
|
Country
|
Generation and energy storage Capacity (MW/MWh(
|
Est.
COD |
Est. Total
Project Cost |
Tax credit benefit- Qualifying category
|
Tax credit
benefit- Adders3
|
Discounted Value of Tax Benefit2
|
Est. Total
Project Cost net of tax benefit
|
Capital Invested as of March 31, 2026
|
Est. Equity Required (%)
|
Equity Invested as of March 31, 2026
|
Est. First Full Year Revenue4
|
Est. First Full Year EBITDA4,5
|
Ownership %1
|
|
Country Acres
|
USA
|
403/688
|
Q4 2026
|
807-848
|
ITC
|
DC (10%)
|
394-414
|
413-434
|
664
|
0%-10%6
|
91
|
61-65
|
48-50
|
100%
|
|
Co Bar 1
|
USA
|
258/824
|
H2 2027-H1 2028
|
637-667
|
ITC
|
EC (10%)
|
281-296
|
356-371
|
228
|
0%-10%
|
228
|
125-131
|
99-104
|
100%
|
|
Co Bar 2+3
|
USA
|
953/0
|
1,236-1,300
|
PTC
|
EC (10%)
|
545-573
|
691-727
|
100%
|
||||||
|
Crimson Orchard
|
USA
|
120/400
|
Q2 2027
|
319-335
|
ITC
|
EC (10%) +
DC (10% BESS only) |
164-173
|
155-162
|
56
|
0%-10%6
|
34
|
27-28
|
20-21
|
100%
|
|
Snowflake A
|
USA
|
594/1,900
|
H2 2027
|
1,493-1,569
|
ITC
|
EC (10%) +
DC (10% BESS only) |
759-798
|
734-771
|
611
|
0%-10%6
|
159
|
123-130
|
101-106
|
100%
|
|
Gecama Solar
|
Spain
|
227/220
|
Q4 2026
|
199-209
|
-
|
-
|
-
|
199-209
|
154
|
23%-28%7
|
154
|
36-38
|
29-31
|
72%
|
|
Sestanovac
|
Croatia
|
23/75
|
Q4 2026
|
35-36
|
-
|
-
|
-
|
35-36
|
6
|
30%-40%
|
6
|
6
|
5
|
100%
|
|
Tapolca Bess
|
Hungary
|
0/140
|
Q4 26
|
21-22
|
-
|
-
|
-
|
21-22
|
0
|
45%
|
0
|
7-8
|
6-7
|
100%
|
|
Bjornberget – BESS
|
Sweden
|
0/100
|
Q3 2026
|
24-25
|
-
|
-
|
-
|
24-25
|
15
|
100%
|
15
|
4
|
3
|
55%
|
|
Israel Construction
|
Israel
|
3/303
|
Q2 26-
Q1 27
|
39-41
|
-
|
-
|
-
|
39-41
|
7
|
20%-30%
|
7
|
10-11
|
6-7
|
74%
|
|
Total Consolidated Projects
|
|
2,581/
4,650
|
|
4,810-5,052
|
|
|
2,143-2,254
|
2,677-2,798
|
1,742
|
|
695
|
399-422
|
317-334
|
|
|
Unconsolidated Projects at share10
|
Israel
|
14/222
|
Q1 2026- Q1 2027
|
53-55
|
-
|
-
|
-
|
53-55
|
42
|
15%-20%
|
42
|
9
|
7
|
53%
|
|
Total
|
|
2,595/
4,872
|
|
4,863-5,107
|
|
|
2,143-2,254
|
2,720-2,853
|
1,784
|
|
737
|
408-431
|
324-341
|
d) Pre-Construction Projects (due to
commence construction within 12 months of the Approval Date)
|
($ millions)
Consolidated Projects |
Country
|
Generation and energy storage Capacity (MW/MWh)
|
Est.
COD |
Est. Total
Project Cost |
Tax Credit Benefit
|
Est. Total
Project Cost net of tax benefit |
Capital Invested as of March 31, 2026
|
Est. Equity Required (%)
|
Equity Invested as of March 31, 2026
|
Est. First Full Year Revenue4
|
Est. First Full Year EBITDA4,5
|
Ownership %1
|
||
|
Qualifying
Category
|
Adders3
|
Discounted Value of Tax Benefit2
|
||||||||||||
|
Co Bar 4+5
|
USA
|
0/3,176
|
H1 2028
|
985-1,036
|
ITC
|
EC (10%) +
DC (10%) |
592-622
|
393-414
|
11
|
0%-10%
|
11
|
129-136
|
107-112
|
100%
|
|
Nardo
|
Italy
|
104/872
|
2029
|
234-246
|
-
|
-
|
-
|
234-246
|
11
|
30%
|
11
|
39-41
|
32-33
|
100%
|
|
Jupiter
|
Germany
|
150/2,166
|
H2 2028
|
547-575
|
-
|
-
|
-
|
547-575
|
6
|
35%
|
6
|
98-103
|
81-85
|
51%
|
|
Bertikow
|
Germany
|
0/881
|
H1 2028
|
160-168
|
-
|
-
|
-
|
160-168
|
1
|
15%-25%
|
1
|
37-38
|
31-32
|
50%
|
|
Israel HV storage9
|
Israel
|
0/1,350
|
H2 2028
|
227-239
|
-
|
-
|
-
|
227-239
|
19
|
20%
|
19
|
15-16
|
7-8
|
100%
|
|
($ millions)
Additional Pre-Construction Projects |
MW Deployment
MW/MWh
|
Est. Total
Project Cost |
Tax Credit Benefit
|
Discounted Value of Tax Benefit2
|
Est. Total
Project Cost net of tax benefit |
Capital Invested as of March 31, 2026
|
Est. Equity Required (%)
|
Equity Invested as of March 31, 2026
|
Est. First Full Year Revenue4
|
Est. First Full Year EBITDA4,5
|
Ownership %1
|
|||
|
2027
|
2028
|
2029
|
Qualifying
Category
|
Adders3
|
||||||||||
|
United States
|
128/0
|
439/0
|
-
|
895-940
|
ITC
|
DC (10%) & EC (10%)8
|
447-470
|
448-470
|
51
|
10%-20%
|
51
|
61-64
|
48-50
|
100%
|
|
Europe
|
0/221
|
0/208
|
-
|
84-88
|
-
|
-
|
-
|
84-88
|
1
|
30%-40%
|
1
|
15-16
|
11-12
|
84%
|
|
MENA
|
7/510
|
84/125
|
0/50
|
233-245
|
-
|
-
|
-
|
233-245
|
11
|
30%-40%
|
11
|
40-42
|
21-22
|
88%
|
|
Total Consolidated Projects
|
135/731
|
523/333
|
0/50
|
3,365-3,365
|
1,039-1,092
|
2,326-2,445
|
112
|
|
112
|
434-456
|
339-354
|
|||
|
Unconsolidated
Projects at share10
|
0/41
|
-
|
0/14
|
8-9
|
-
|
-
|
-
|
8-9
|
1
|
15%-20%
|
1
|
2
|
1
|
56%
|
|
Total Pre-Construction
|
912MW +9,614MWh
|
3,373-3,546
|
1,039-1,092
|
2,334-2,454
|
113
|
|
113
|
436-458
|
340-355
|
|||||
1) The legal ownership share for all U.S. projects is 90%, but Enlight invests 100% of the equity in the project and entitled to 100% of the project distributions until full repayment
of Enlight's capital plus a preferred return
2) Value of tax benefits under the IRA: The PTC value is estimated based on the project’s expected annual production and a yearly CPI indexation of 2%, discounted by 8% to COD. In
assessing the value of the ITC, a step-up adjustment was made to reflect the full value of the tax credits, thus lowering net construction costs and enhancing the valuation and return of the project. The actual value attributed to tax benefits in
a tax equity transaction may differ from the value presented, subject to the structure of the transaction and prevailing market conditions.
3) The Energy Community (EC) Adder provides extra credits for renewable energy projects in areas impacted by fossil fuel reliance or economic
transition. The Domestic Content (DC) Adder rewards projects using U.S.-manufactured components, promoting local job creation and supply chain growth
4) Revenue and EBITDA for the first year of U.S. projects as presented above do not include income from tax benefits
5) EBITDA is a non-IFRS financial measure. This figure represents consolidated EBITDA for the project and excludes the share of project distributions to tax equity partners, as well as
ITC and PTC proceeds. These components of the tax equity transaction may differ from project to project, are subject to market conditions and commercial terms agreed upon reaching financial close
6) The required equity during construction is estimated at 10% and is expected to decrease to 0% at COD
7) Gecama Solar’s debt is held under Gecama Wind. As of March 31, 2026, the solar project had $41m USD drawn
8) Rustic hills 1+2 - DC (10%) + EC (10%); Coggon - DC (10%); Gemstone - DC (10%);
9) Two high voltage projects with total capacity of 1,350MWh. Estimated revenue for the first 5 years is $14-15m million per year. From year
6, the projects will move to a deregulated market, with revenue expected to be $55 million per year
10) All numbers, beside equity invested, reflects Enlight share only
e) Additional information on tax equity investments
|
Tax equity investment
|
Tax equity partner's share of project tax credits, cash flows, and taxable income
|
|||||||
|
($ millions)
Projects* |
Est. Total
Project Cost |
Upfront tax equity investment
|
Tax credit proceeds during the project's operation ("pay-go")
|
Share of ITC/PTC tax credit allocated to tax equity partner
|
Share of taxable income initial period
|
Duration of initial period for share of taxable income (years)
|
Share in project cash flow initial period (second period)
|
Duration of initial period for share in project cash flow (years)
|
|
Atrisco PV
|
369
|
198
|
55
|
Confidential
|
Confidential
|
Confidential
|
17.5% (5%)
|
10
|
|
Atrisco BESS
|
458
|
266
|
-
|
Confidential
|
Confidential
|
Confidential
|
23% (7%)
|
5
|
|
Quail Ranch
|
274
|
131
|
18
|
99%
|
99%
|
10
|
10% (5%)
|
10
|
|
Roadrunner
|
621
|
337
|
55
|
99%
|
99%
|
5-10
|
10%-12% (5%)
|
10
|
* Apex financing was structured as a sale and leaseback and therefore not included in the table above
Appendix 6 – cash and cash equivalents
|
($ thousands)
|
March 31, 2026
|
|
Cash and Cash Equivalents:
|
|
|
Enlight Renewable Energy Ltd, Enlight EU Energies Kft and Enlight Renewable LLC excluding subsidiaries (“Topco”)
|
709,041
|
|
Subsidiaries
|
269,720
|
|
Deposits:
|
|
|
Short term deposits
|
-
|
|
Restricted Cash:
|
|
|
Projects under construction
|
182,046
|
|
Reserves, including debt service, performance obligations and others
|
127,464
|
|
Total Cash
|
1,288,271
|
Appendix 7 – Corporate level (TopCo) debt
|
($ thousands)
|
March 31, 2026
|
|
Debentures:
|
|
|
Debentures
|
659,517*
|
|
Convertible debentures
|
273,329
|
|
Loans from banks and other financial institutions:
|
|
|
Credit and short-term loans from banks and other financial institutions
|
67,665
|
|
Loans from banks and other financial institutions
|
116,588
|
|
Total corporate level debt
|
1,117,099
|
* Including current maturities of debentures in the amount of 175,317
Appendix 8 – Functional Currency Conversion Rates:
The financial statements of each of the Company’s subsidiaries were prepared in the currency of the main economic environment in which it operates (hereinafter:
the “Functional Currency”). For the purpose of consolidating the financial statements, results and financial position of each of the Group’s member companies are translated into the Israeli shekel (“NIS”), which is the Company’s Functional
Currency. The Group’s consolidated financial statements are presented in U.S. dollars (“USD”).
| FX Rates to USD: | |||
| Date of the financial statements: |
Euro
|
NIS
|
|
| As of 31th March 2026 |
1.15
|
0.32
|
|
| As of 31th March 2025 |
1.08
|
0.27
|
|
| Average for the 3 months period ended: | |||
| March 2026 |
1.17
|
0.32
|
|
| March 2025 |
1.05
|
0.28
|