.2
Earnings Presentation First Quarter 2026
Legal disclaimer This presentation contains forward-looking statements within
the meaning of the U.S. Private Securities Litigation Reform Act of 1995. We intend such forward-looking statements to be covered by the safe harbor provisions for forward-looking statements as contained in Section 27A of the Securities Act
of 1933, as amended, and Section 21E of the Securities Exchange Act of 1934, as amended. All statements contained in this presentation other than statements of historical fact, including, without limitation, statements regarding Enlight
Renewable Energy's (the "Company") business strategy and plans, capabilities of the Company’s project portfolio and achievement of operational objectives, market opportunity and potential growth, discussions with commercial counterparties and
financing sources, pricing trends, progress of Company projects, including anticipated timing of related approvals and project completion, the Company’s future financial results, expected impact from various regulatory developments, Revenue
and Income, EBITDA, and Adjusted EBITDA guidance, the expected timing of completion of our ongoing projects, macroeconomic trends, and the Company’s anticipated cash requirements and financing plans, are forward-looking statements. The words
“may,” “might,” “will,” “could,” “would,” “should,” “expect,” “plan,” “anticipate,” “intend,” “target,” “seek,” “believe,” “estimate,” “predict,” “potential,” “continue,” “contemplate,” “possible,” “forecasts,” “aims” or the negative of these
terms and similar expressions are intended to identify forward-looking statements, though not all forward-looking statements use these words or expressions. These statements are neither promises nor guarantees, but involve known and unknown
risks, uncertainties and other important factors that may cause our actual results, performance or achievements to be materially different from any future results, performance or achievements expressed or implied by the forward-looking
statements, including, but not limited to, the following: our ability to site suitable land for, and otherwise source, renewable energy projects and to successfully develop and convert them into Operational Projects` the timing of
construction of any project; availability of, and access to, interconnection facilities and transmission systems; our ability to obtain and maintain governmental and other regulatory approvals and permits, including environmental approvals
and permits; construction delays, operational delays and supply chain disruptions leading to increased cost of materials required for the construction of our projects, as well as cost overruns and delays related to disputes with contractors;
disruptions in trade caused by political, social or economic instability in regions where our components and materials are made; our suppliers’ ability and willingness to perform both existing and future obligations; competition from
traditional and renewable energy companies in developing renewable energy projects; potential slowed demand for renewable energy projects and our ability to enter into new offtake contracts on acceptable terms and prices as current offtake
contracts expire; offtakers’ ability to terminate contracts or seek other remedies resulting from failure of our projects to meet development, operational or performance benchmarks; exposure to market prices in some of our offtake contracts;
various technical and operational challenges leading to unplanned outages, reduced output, interconnection or termination issues; the dependence of our production and revenue on suitable meteorological and environmental conditions, and our
ability to accurately predict such conditions; our ability to enforce warranties provided by our counterparties in the event that our projects do not perform as expected; government curtailment, energy price caps and other government actions
that restrict or reduce the profitability of renewable energy production; electricity price volatility, unusual weather conditions (including the effects of climate change, could adversely affect wind and solar conditions), catastrophic
weather-related or other damage to facilities, unscheduled generation outages, maintenance or repairs, unanticipated changes to availability due to higher demand, shortages, transportation problems or other developments, environmental
incidents, or electric transmission system constraints and the possibility that we may not have adequate insurance to cover losses as a result of such hazards; our dependence on certain operational projects for a substantial portion of our
cash flows; our ability to continue to grow our portfolio of projects through successful acquisitions; changes and advances in technology that impair or eliminate the competitive advantage of our projects or upsets the expectations underlying
investments in our technologies; our ability to effectively anticipate and manage cost inflation, interest rate risk, currency exchange fluctuations and other macroeconomic conditions that impact our business; our ability to retain and
attract key personnel; our ability to manage legal and regulatory compliance and litigation risk across our global corporate structure; our ability to protect our business from, and manage the impact of, cyber-attacks, disruptions and
security incidents, as well as acts of terrorism or war; health-related pandemics or outbreaks, including the COVID‑19 pandemic; changes to existing renewable energy industry policies and regulations that present technical, regulatory and
economic barriers to renewable energy projects; the reduction, elimination or expiration of government incentives for, or regulations mandating the use of, renewable energy; our ability to effectively manage the global expansion of the scale
of our business operations; our ability to perform to expectations in our new line of business involving the construction of PV systems for municipalities in Israel; our ability to effectively manage our supply chain and comply with
applicable regulations with respect to international trade relations, tariffs and our ability to mitigate their impacts, sanctions, export controls and anti-bribery and anti-corruption laws; our ability to effectively comply with
Environmental Health and Safety and other laws and regulations and receive and maintain all necessary licenses, permits and authorizations; our performance of various obligations under the terms of our indebtedness (and the indebtedness of
our subsidiaries that we guarantee) and our ability to continue to secure project financing on attractive terms for our projects; limitations on our management rights and operational flexibility due to our use of tax equity arrangements;
potential claims and disagreements with partners, investors and other counterparties that could reduce our right to cash flows generated by our projects; our ability to comply with increasingly complex tax laws of various jurisdictions in
which we currently operate as well as the tax laws in jurisdictions in which we intend to operate in the future; our ability to obtain tax benefits and credits in the U.S. or other jurisdictions; the unknown effect of the dual listing of our
ordinary shares on the price of our ordinary shares; various risks related to our incorporation and location in Israel, including the ongoing war in Israel, where our headquarters and some of our wind energy and solar energy projects are
located; the costs and requirements of being a public company, including the diversion of management’s attention with respect to such requirements; certain provisions in our Articles of Association and certain applicable regulations that may
delay or prevent a change of control; and other risk factors set forth in the section titled “Risk factors” in our Annual Report on Form 20-F for the fiscal year ended December 31, 2025 filed with the Securities and Exchange Commission (the
“SEC”), as may be updated in our other documents filed with or furnished to the SEC. These statements reflect management’s current expectations regarding future events and operating performance and speak only as of the date of this
presentation. You should not put undue reliance on any forward-looking statements. Although we believe that the expectations reflected in the forward-looking statements are reasonable, we cannot guarantee that future results, levels of
activity, performance and events and circumstances reflected in the forward-looking statements will be achieved or will occur. Except as required by applicable law, we undertake no obligation to update or revise publicly any forward-looking
statements, whether as a result of new information, future events or otherwise, after the date on which the statements are made or to reflect the occurrence of unanticipated events. Unless otherwise indicated, information contained in this
presentation concerning the industry, competitive position and the markets in which the Company operates is based on information from independent industry and research organizations, other third- party sources and management estimates.
Management estimates are derived from publicly available information released by independent industry analysts and other third-party sources, as well as data from the Company's internal research, and are based on assumptions made by the
Company upon reviewing such data, and the Company's experience in, and knowledge of, such industry and markets, which the Company believes to be reasonable. In addition, projections, assumptions and estimates of the future performance of the
industry in which the Company operates, and the Company's future performance are necessarily subject to uncertainty and risk due to a variety of factors, including those described above. These and other factors could cause results to differ
materially from those expressed in the estimates made by independent parties and by the Company. Industry publications, research, surveys and studies generally state that the information they contain has been obtained from sources believed to
be reliable, but that the accuracy and completeness of such information is not guaranteed. Forecasts and other forward-looking information obtained from these sources are subject to the same qualifications and uncertainties as the other
forward-looking statements in this presentation. Non-IFRS Financial Metrics This presentation presents Adjusted EBITDA, a non-IFRS financial metric, which is provided as a complement to the results provided in accordance with the
International Financial Reporting Standards as issued by the International Accounting Standards Board (“IFRS”). A reconciliation of Adjusted EBITDA to Net Income, its most directly comparable IFRS financial measure, is contained in the tables
at the end of this presentation. The Company is unable to provide a reconciliation of Adjusted EBITDA to Net Income on a forward-looking basis without unreasonable effort because items that impact this IFRS financial measure are not within
the Company’s control and/or cannot be reasonably predicted. These items may include, but are not limited to, forward-looking depreciation and amortization, share based compensation, other income, finance income, finance expenses, share of
losses of equity accounted investees and taxes on income. Such information may have a significant, and potentially unpredictable, impact on the Company’s future financial results. The trademarks included herein are the property of the owners
thereof and are used for reference purposes only. Such use should not be construed as an endorsement of the products or services of the Company.
1Revenues and income include revenues from the sale of electricity and income
from tax benefits income from U.S. projects; 2Adjusted EBITDA is a non-IFRS measure. Please see the appendix of this presentation for a reconciliation to Net Income; 3FGW (Factored GW) is the company’s consolidated metric combining generation
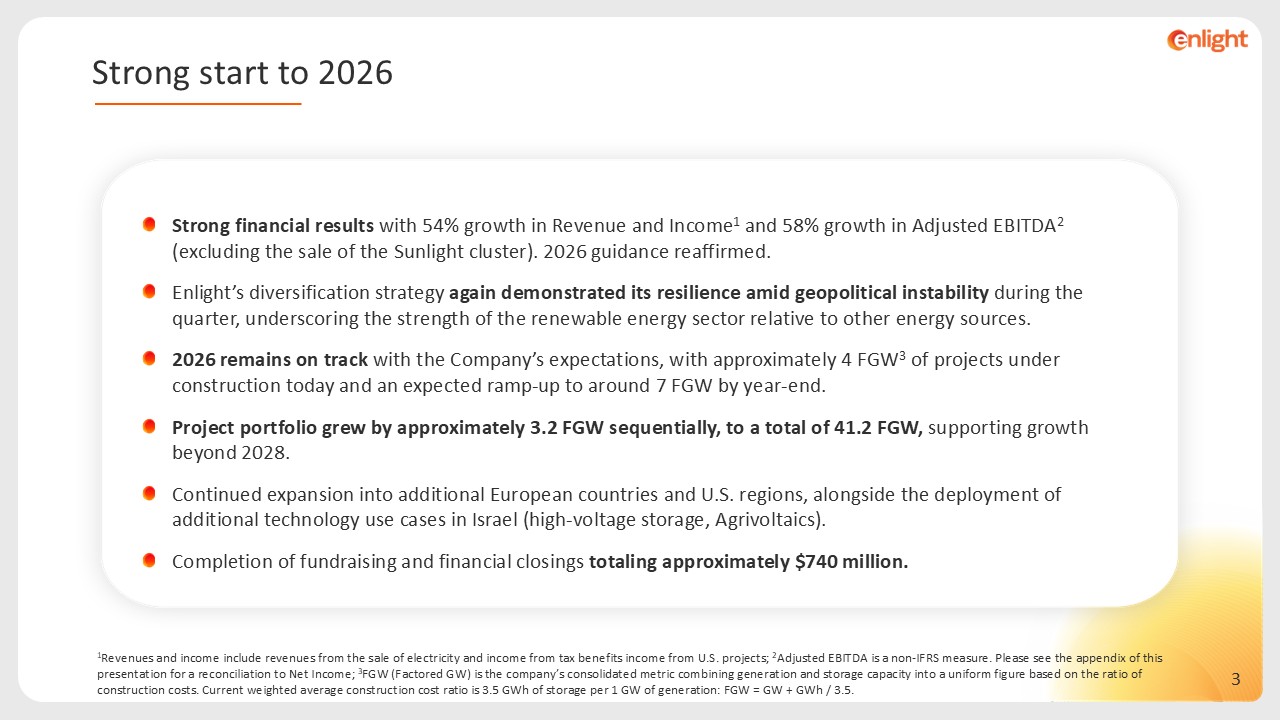
and storage capacity into a uniform figure based on the ratio of construction costs. Current weighted average construction cost ratio is 3.5 GWh of storage per 1 GW of generation: FGW = GW + GWh / 3.5. Strong financial results with 54%
growth in Revenue and Income1 and 58% growth in Adjusted EBITDA2 (excluding the sale of the Sunlight cluster). 2026 guidance reaffirmed. Enlight’s diversification strategy again demonstrated its resilience amid geopolitical instability
during the quarter, underscoring the strength of the renewable energy sector relative to other energy sources. 2026 remains on track with the Company’s expectations, with approximately 4 FGW3 of projects under construction today and an
expected ramp-up to around 7 FGW by year-end. Project portfolio grew by approximately 3.2 FGW sequentially, to a total of 41.2 FGW, supporting growth beyond 2028. Continued expansion into additional European countries and U.S. regions,
alongside the deployment of additional technology use cases in Israel (high-voltage storage, Agrivoltaics). Completion of fundraising and financial closings totaling approximately $740 million. Strong start to 2026

Financial Results – Growth Momentum Continues
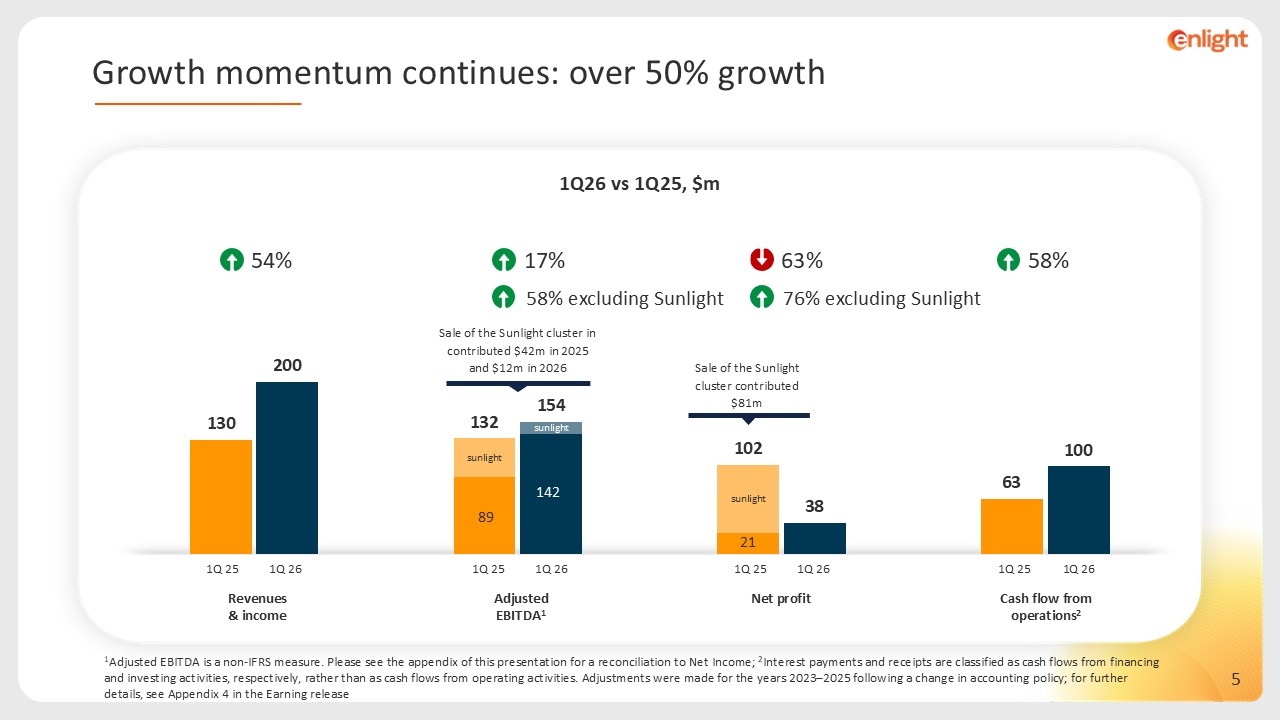
1Q26 vs 1Q25, $m Revenues & income Adjusted EBITDA1 Net profit Cash
flow from operations2 54% 17% 1Q 26 1Q 25 1Q 26 1Q 25 1Q 26 1Q 25 1Q 26 1Q 25 63% 58% Sale of the Sunlight cluster contributed $81m Sale of the Sunlight cluster in contributed $42m in 2025 and $12m in 2026 76% excluding
Sunlight sunlight 21 sunlight 89 58% excluding Sunlight sunlight 142 Growth momentum continues: over 50% growth 1Adjusted EBITDA is a non-IFRS measure. Please see the appendix of this presentation for a reconciliation to Net Income;
2Interest payments and receipts are classified as cash flows from financing and investing activities, respectively, rather than as cash flows from operating activities. Adjustments were made for the years 2023–2025 following a change in
accounting policy; for further details, see Appendix 4 in the Earning release
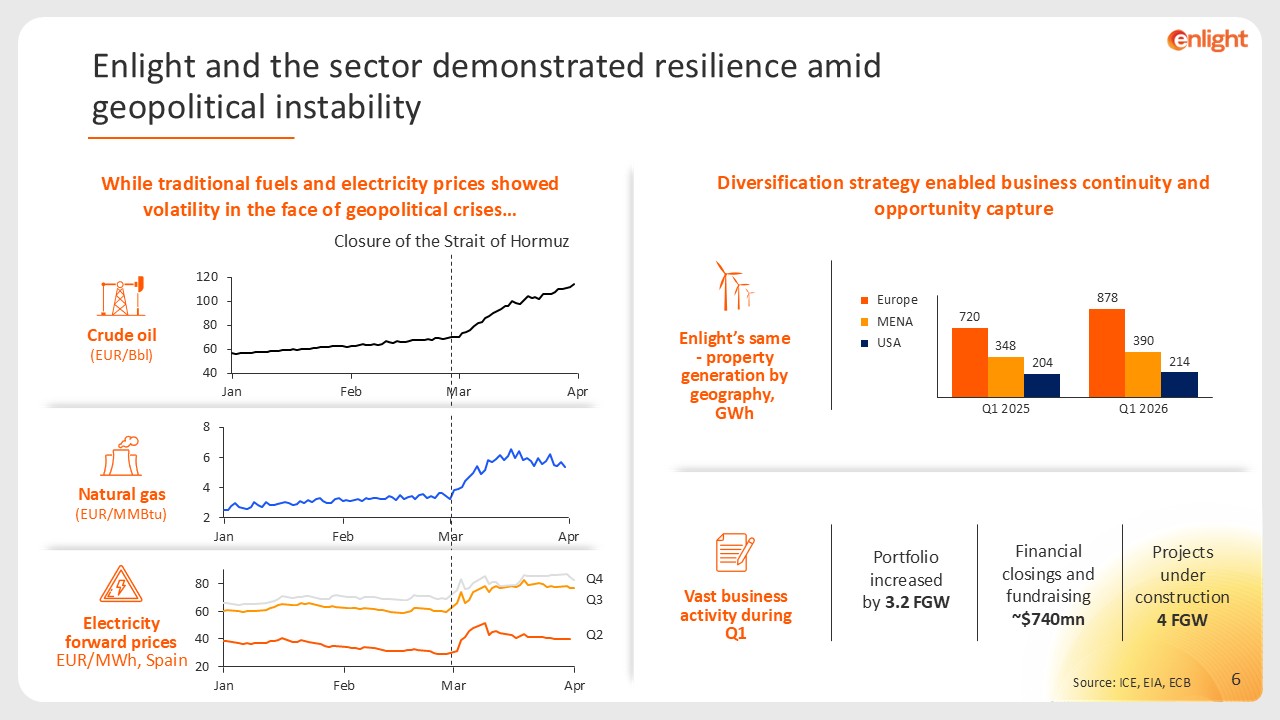
Enlight’s same- property generation by geography, GWh Source: ICE, EIA,
ECB Natural gas (EUR/MMBtu) Electricity forward prices EUR/MWh, Spain Jan Feb Mar Apr Q2 Q3 Q4 Jan Feb Mar Apr Jan Feb Mar Apr Closure of the Strait of Hormuz Crude oil (EUR/Bbl) While traditional fuels and electricity
prices showed volatility in the face of geopolitical crises… Diversification strategy enabled business continuity and opportunity capture Portfolio increased by3.2 FGW Projects under construction 4 FGW Financial closings and
fundraising ~$740mn Vast business activity during Q1 Enlight and the sector demonstrated resilience amid geopolitical instability Q1 2025 Q1 2026 720 348 204 878 390 214 Europe MENA USA
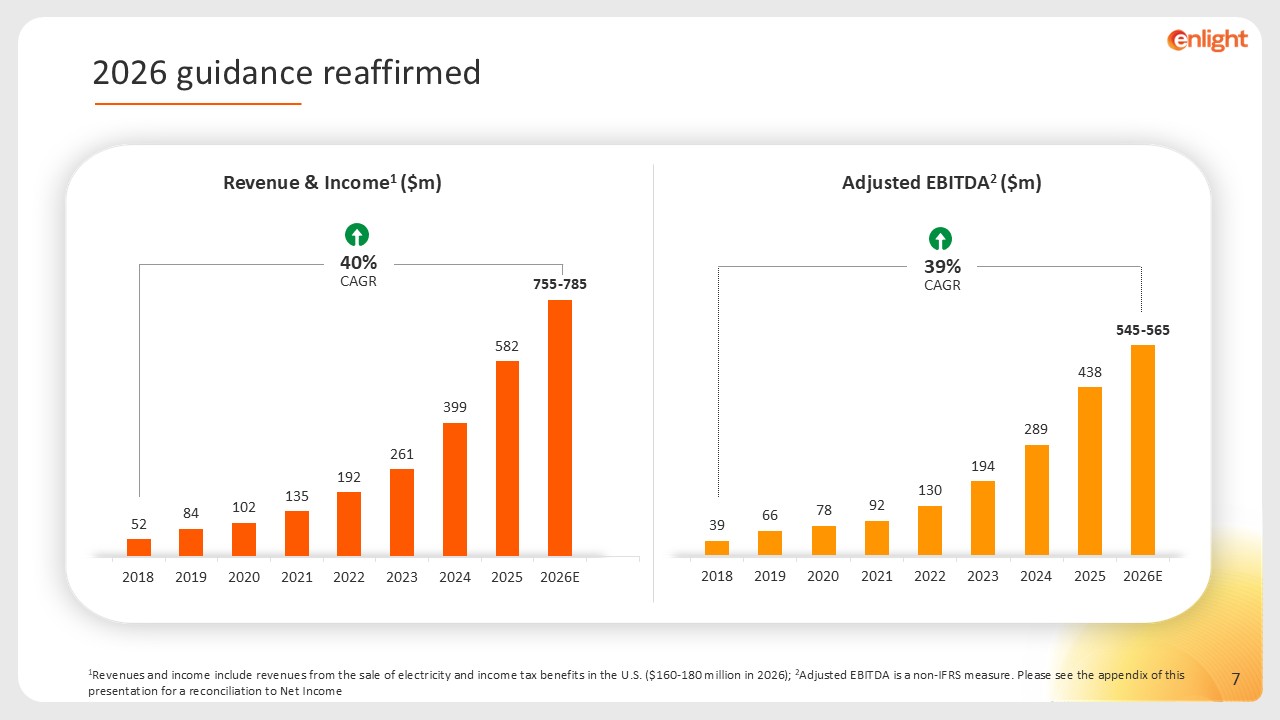
39% CAGR 40% CAGR Adjusted EBITDA2 ($m) Revenue & Income1
($m) 1Revenues and income include revenues from the sale of electricity and income tax benefits in the U.S. ($160-180 million in 2026); 2Adjusted EBITDA is a non-IFRS measure. Please see the appendix of this presentation for a reconciliation
to Net Income 2026 guidance reaffirmed

Significant milestones achieved
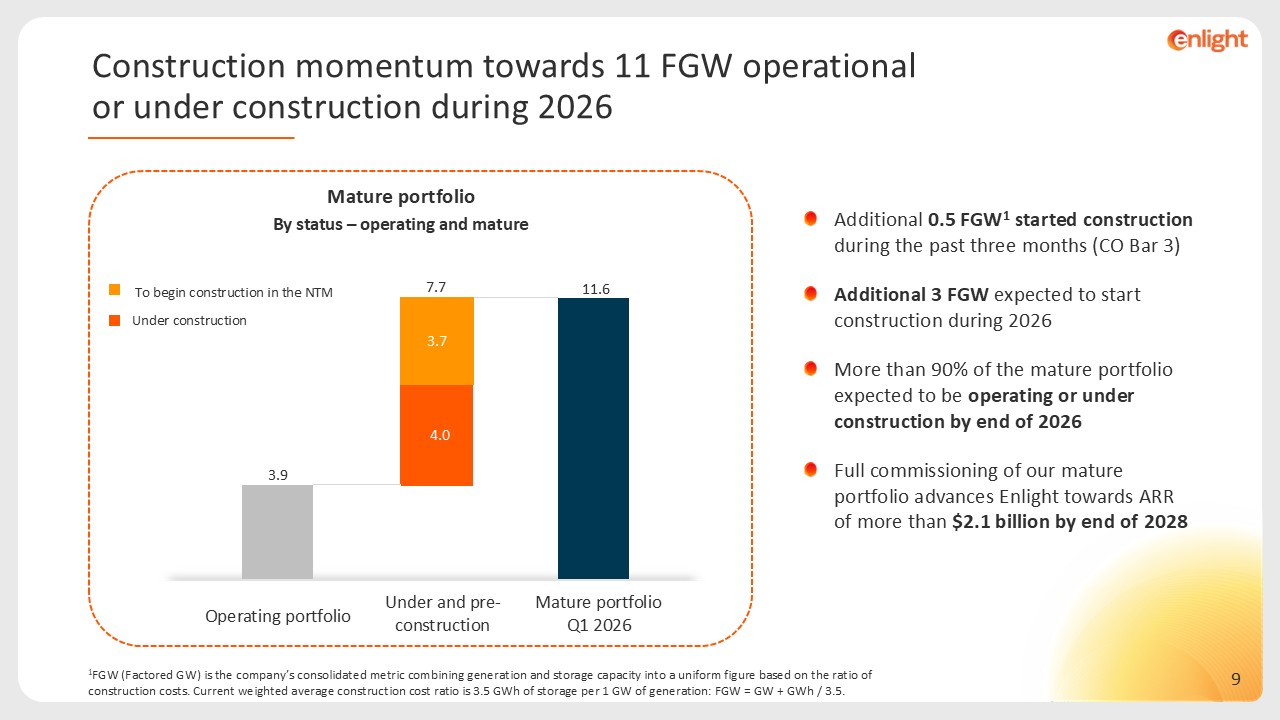
Additional 0.5 FGW1 started construction during the past three months (CO Bar
3) Additional 3 FGW expected to start construction during 2026 More than 90% of the mature portfolio expected to be operating or under construction by end of 2026 Full commissioning of our mature portfolio advances Enlight towards ARR of
more than $2.1 billion by end of 2028 11.6 Mature portfolio Under construction To begin construction in the NTM 7.7 By status – operating and mature Mature portfolio2026 Q1 Operating portfolio Under and pre-construction 4.0 1FGW
(Factored GW) is the company’s consolidated metric combining generation and storage capacity into a uniform figure based on the ratio of construction costs. Current weighted average construction cost ratio is 3.5 GWh of storage per 1 GW of
generation: FGW = GW + GWh / 3.5. 3.7 4.0 Construction momentum towards 11 FGW operational or under construction during 2026
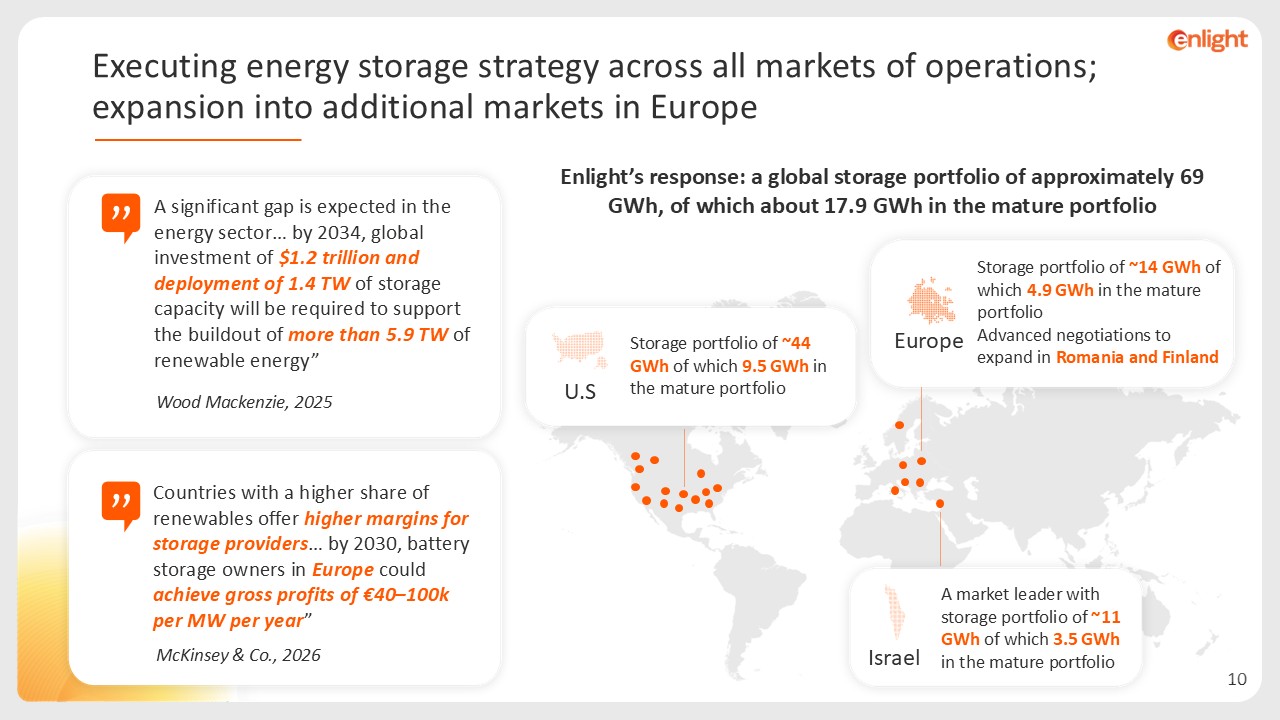
Enlight’s response: a global storage portfolio of approximately 69 GWh, of which
about 17.9 GWh in the mature portfolio Storage portfolio of ~14 GWh of which 4.9 GWh in the mature portfolio Advanced negotiations to expand in Romania and Finland Europe Storage portfolio of ~44 GWh of which 9.5 GWh in the mature
portfolio U.S A market leader with storage portfolio of ~11 GWh of which 3.5 GWh in the mature portfolio Israel A significant gap is expected in the energy sector… by 2034, global investment of $1.2 trillion and deployment of 1.4 TW of
storage capacity will be required to support the buildout of more than 5.9 TW of renewable energy” Wood Mackenzie, 2025 Countries with a higher share of renewables offer higher margins for storage providers… by 2030, battery storage owners
in Europe could achieve gross profits of €40–100k per MW per year” McKinsey & Co., 2026 Executing energy storage strategy across all markets of operations; expansion into additional markets in Europe
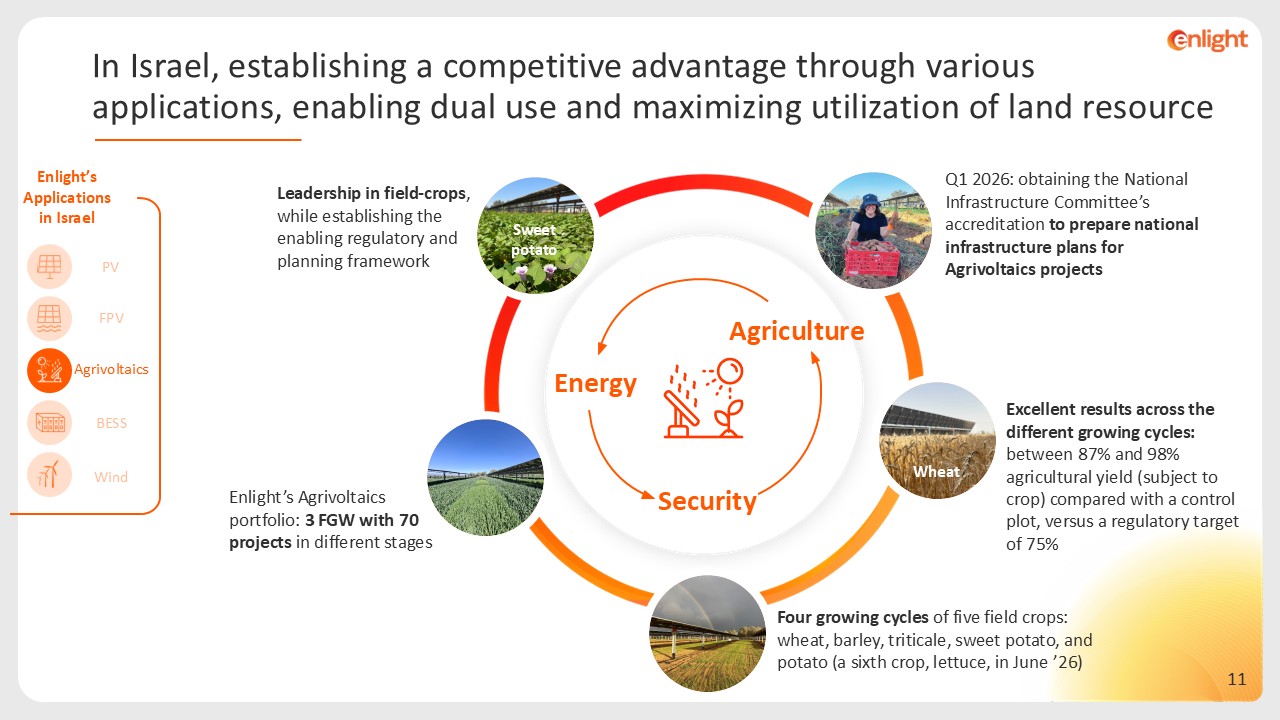
Energy Security Agriculture Wheat Excellent results across the different
growing cycles: between 87% and 98% agricultural yield (subject to crop) compared with a control plot, versus a regulatory target of 75% Enlight’s Agrivoltaics portfolio: 3 FGW with 70 projects in different stages Leadership in field-crops,
while establishing the enabling regulatory and planning framework Q1 2026: obtaining the National Infrastructure Committee’s accreditation to prepare national infrastructure plans for Agrivoltaics projects Sweet potato Enlight’s
Applicationsin Israel PV FPV Agrivoltaics BESS Wind Four growing cycles of five field crops: wheat, barley, triticale, sweet potato, and potato (a sixth crop, lettuce, in June ’26) In Israel, establishing a competitive advantage
through various applications, enabling dual use and maximizing utilization of land resource
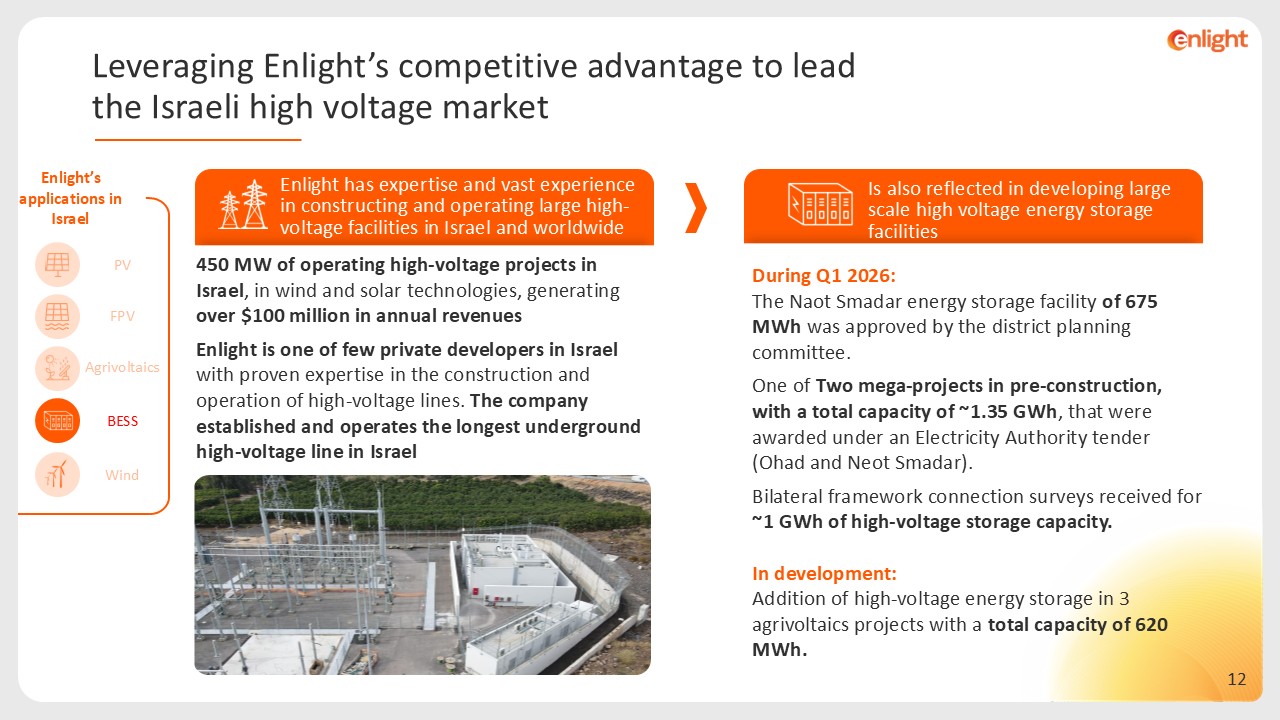
PV FPV Agrivoltaics BESS Wind During Q1 2026: The Naot Smadar energy
storage facility of 675 MWh was approved by the district planning committee. One of Two mega-projects in pre-construction, with a total capacity of ~1.35 GWh, that were awarded under an Electricity Authority tender (Ohad and Neot
Smadar). Bilateral framework connection surveys received for ~1 GWh of high-voltage storage capacity. In development: Addition of high-voltage energy storage in 3 agrivoltaics projects with a total capacity of 620 MWh. Enlight has
expertise and vast experience in constructing and operating large high-voltage facilities in Israel and worldwide 450 MW of operating high-voltage projects in Israel, in wind and solar technologies, generating over $100 million in annual
revenues Enlight is one of few private developers in Israel with proven expertise in the construction and operation of high-voltage lines. The company established and operates the longest underground high-voltage line in Israel Enlight’s
applications in Israel Is also reflected in developing large scale high voltage energy storage facilities Leveraging Enlight’s competitive advantage to lead the Israeli high voltage market
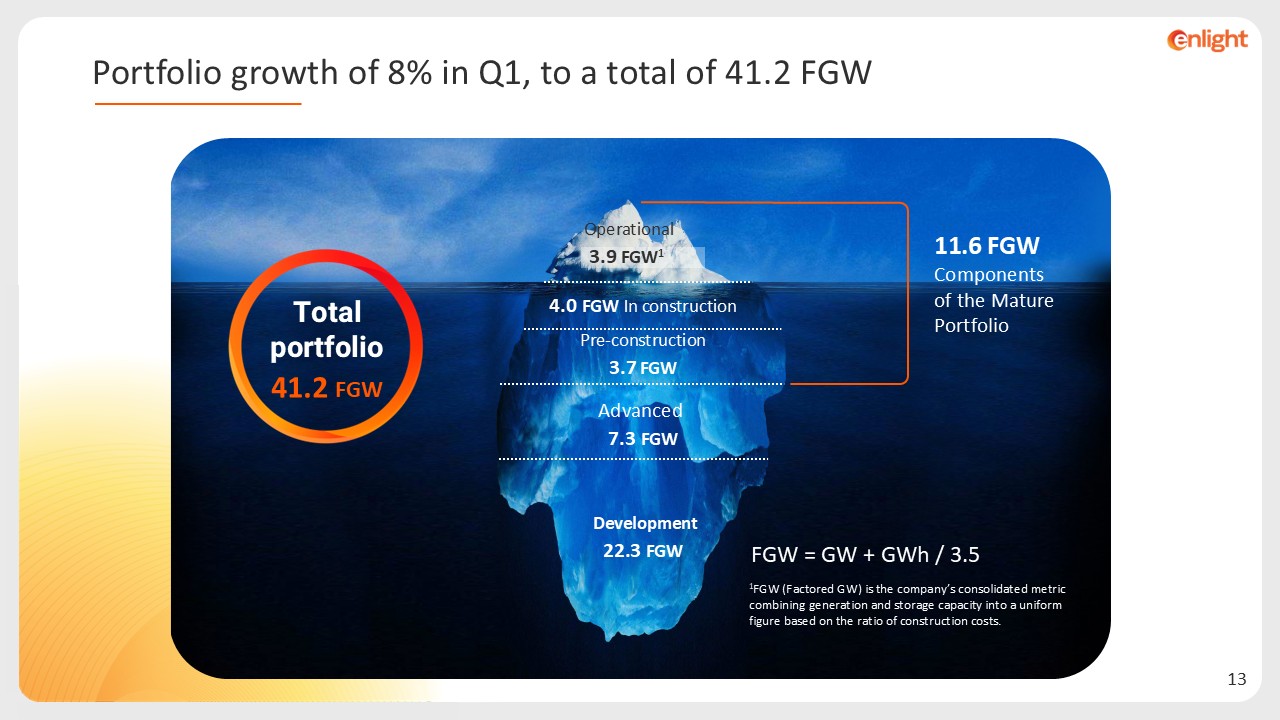
Operational FGW1 3.9 In construction FGW 4.0 Pre-construction FGW 3.7
Advanced FGW 7.3 Development FGW 22.3 Total portfolio FGW 41.2 FGW = GW + GWh / 3.5 Portfolio growth of 8% in Q1, to a total of 41.2 FGW 11.6 FGW Components of the Mature Portfolio 1FGW (Factored GW) is the company’s
consolidated metric combining generation and storage capacity into a uniform figure based on the ratio of construction costs.
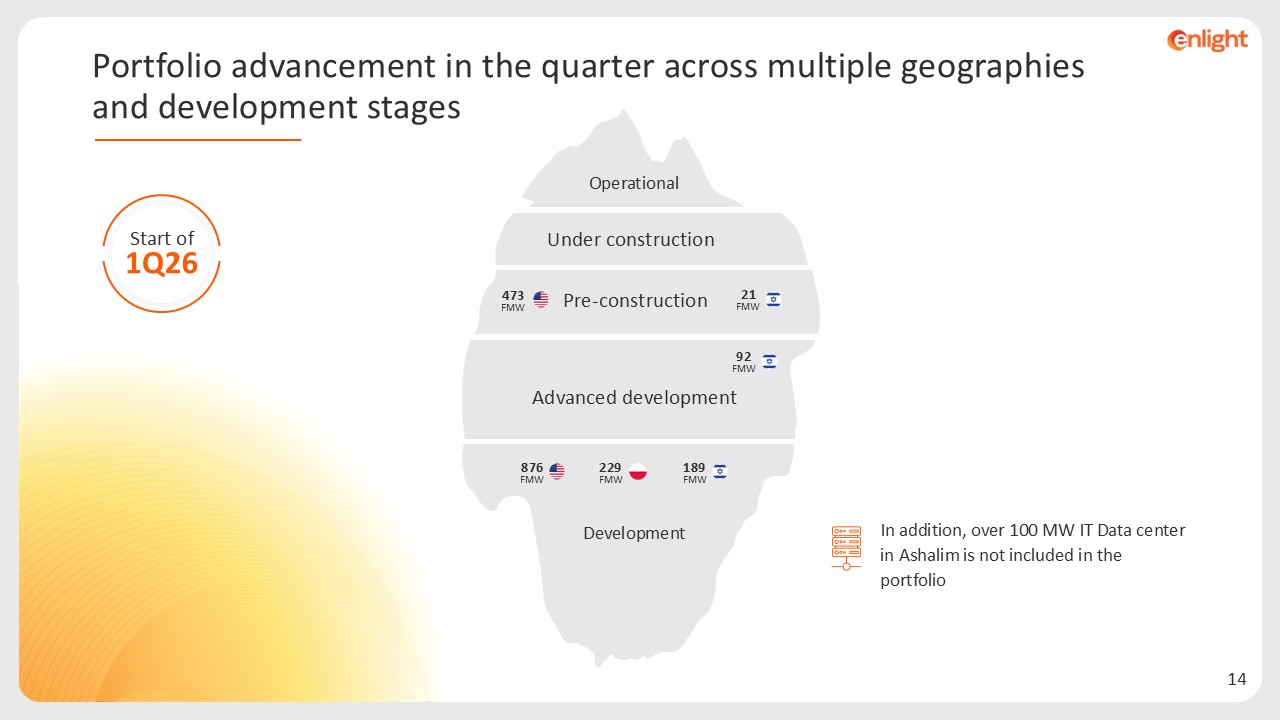
Development Under construction 473 FMW 21 FMW 92 FMW 876FMW 189
FMW 229 FMW Operational Portfolio advancement in the quarter across multiple geographies and development stages Start of 1Q26 In addition, over 100 MW IT Data center in Ashalim is not included in the portfolio Pre-construction Advanced
development
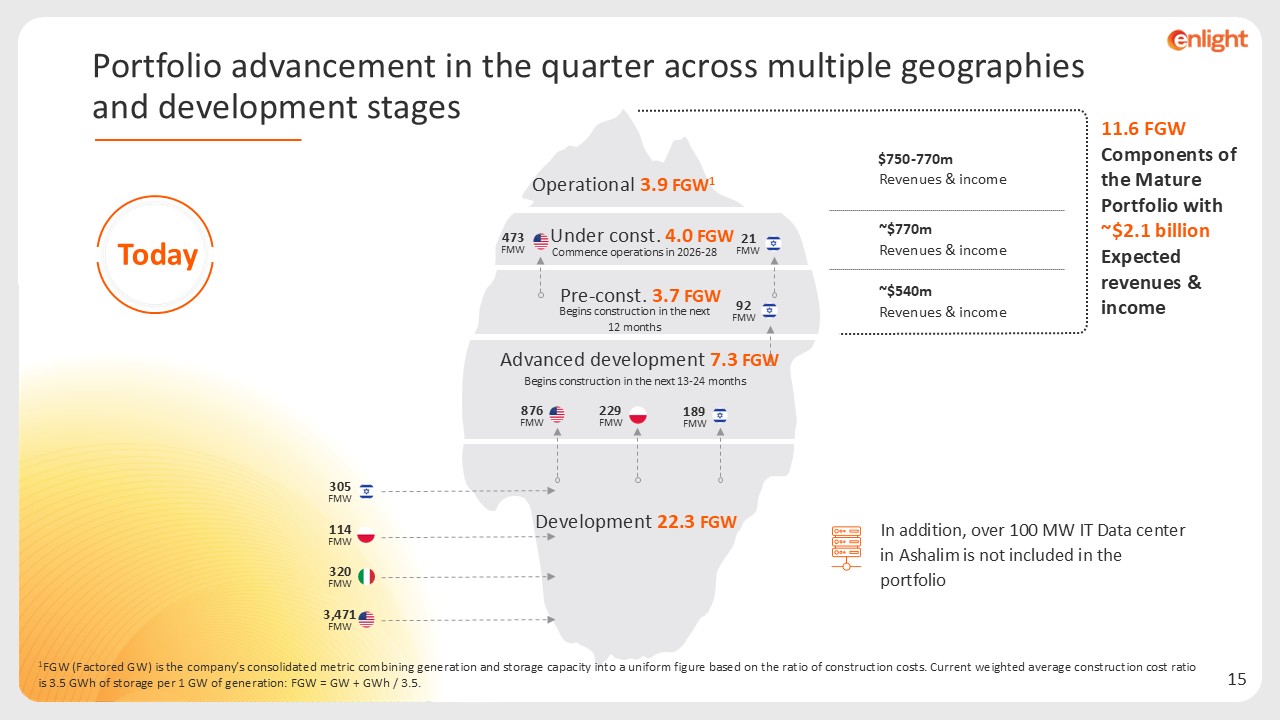
876FMW Today 473 FMW 1FGW (Factored GW) is the company’s consolidated metric
combining generation and storage capacity into a uniform figure based on the ratio of construction costs. Current weighted average construction cost ratio is 3.5 GWh of storage per 1 GW of generation: FGW = GW + GWh / 3.5. 229
FMW 114FMW 305 FMW 3,471FMW 320FMW 21 FMW 189 FMW Portfolio advancement in the quarter across multiple geographies and development stages $750-770m Revenues & income ~$770m Revenues & income ~$540m Revenues &
income 11.6 FGW Components of the Mature Portfolio with ~$2.1 billion Expected revenues & income Operational 3.9 FGW1 Under const. 4.0 FGW Pre-const. 3.7 FGW Advanced development 7.3 FGW Development 22.3 FGW In addition, over
100 MW IT Data center in Ashalim is not included in the portfolio Commence operations in 2026-28 Begins construction in the next 12 months Begins construction in the next 13-24 months 92 FMW
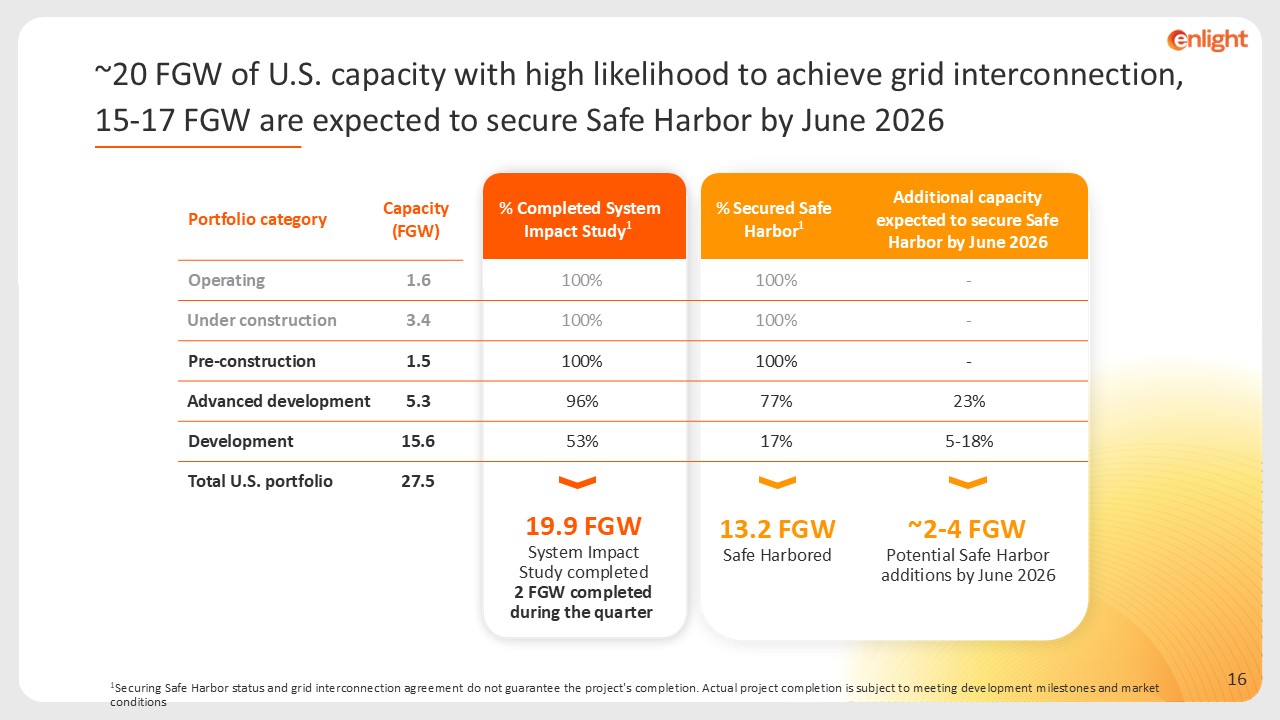
1Securing Safe Harbor status and grid interconnection agreement do not guarantee
the project's completion. Actual project completion is subject to meeting development milestones and market conditions ~20 FGW of U.S. capacity with high likelihood to achieve grid interconnection, 15-17 FGW are expected to secure Safe
Harbor by June 2026 13.2 FGW Safe Harbored ~2-4 FGW Potential Safe Harbor additions by June 2026 Portfolio category Capacity (FGW) % Completed System Impact Study1 % Secured Safe Harbor1 Additional capacity expected to secure Safe
Harbor by June 2026 Operating 1.6 100% 100% - Under construction 3.4 100% 100% - Pre-construction 1.5 100% 100% - Advanced development 5.3 96% 77% 23% Development 15.6 53% 17% 5-18% Total U.S. portfolio 27.5 19.9
FGW System Impact Study completed 2 FGW completed during the quarter
Business Plan: 3X growth in 3 years, reaching a revenue run-rate of over $2.1
billion1 by end-2028 1Based on 2026 guidance added to revenues & income (sale of electricity, tax benefits) of projects in the under construction and pre-construction portions of the Mature portfolio, and advanced development projects
with an expected COD in 2028
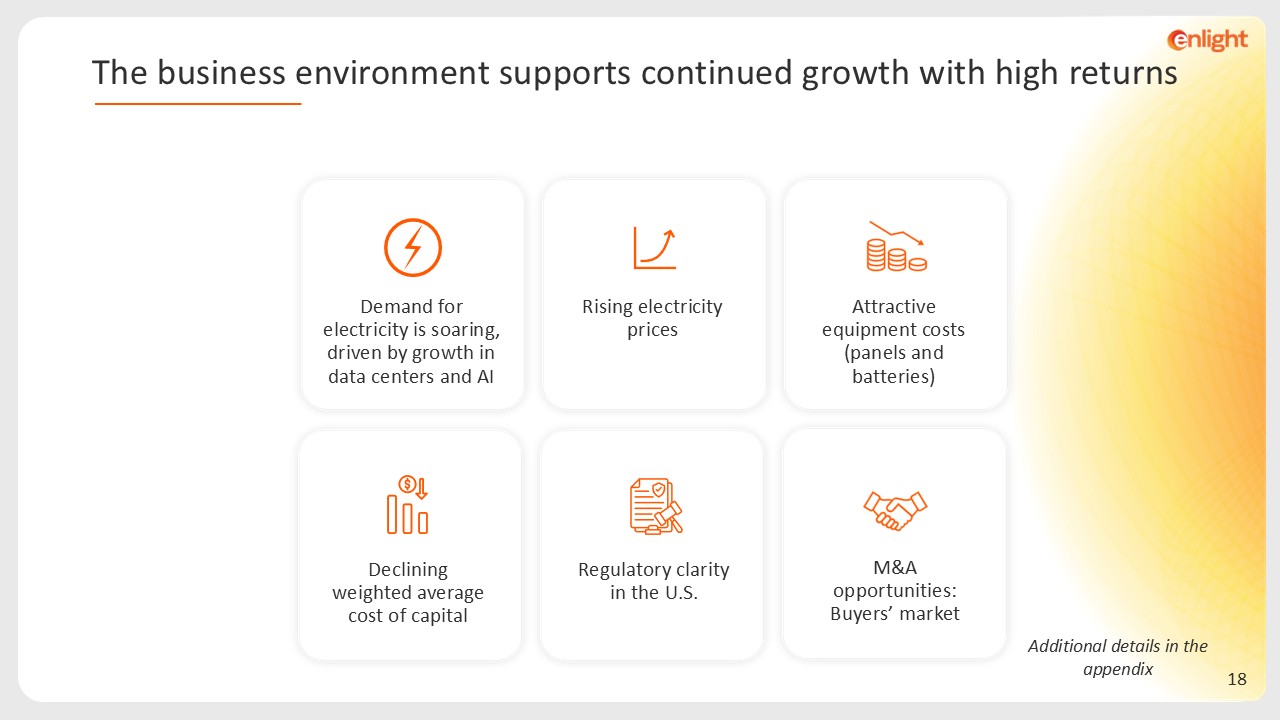
Additional details in the appendix Declining weighted average cost of
capital Rising electricity prices Demand for electricity is soaring, driven by growth in data centers and AI Attractive equipment costs (panels and batteries) Regulatory clarity in the U.S. M&A opportunities: Buyers’ market The
business environment supports continued growth with high returns
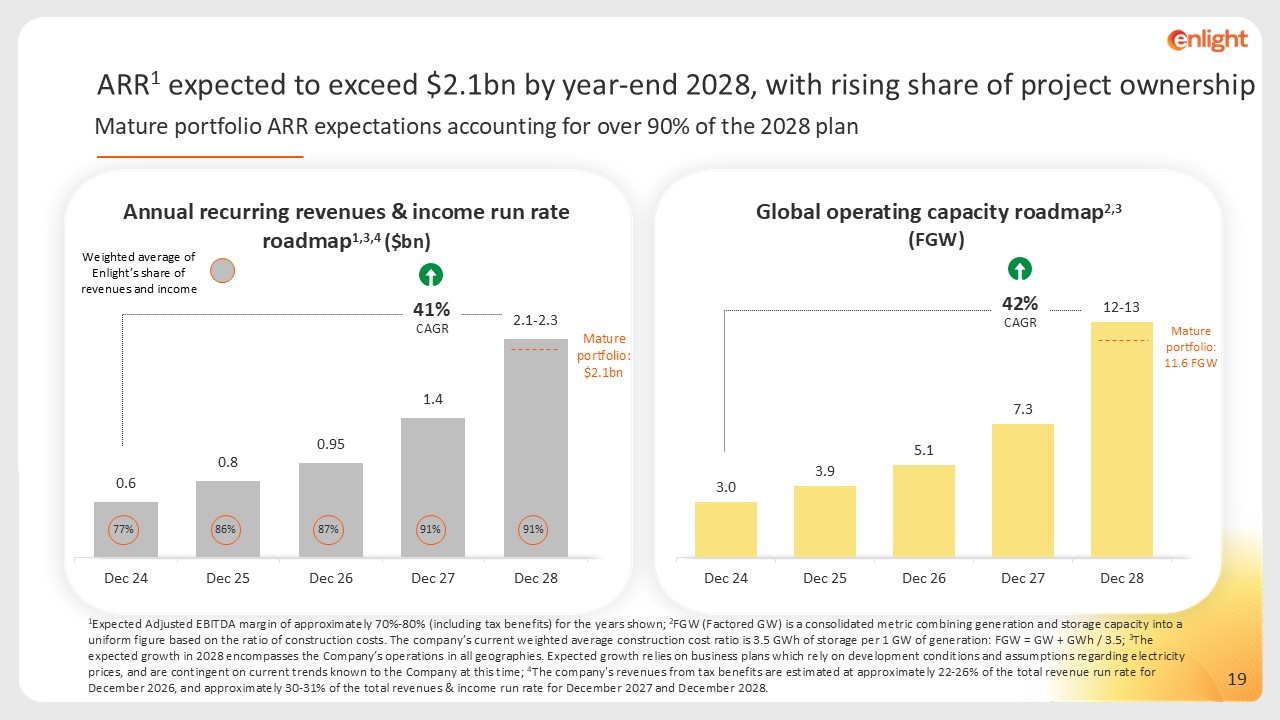
ARR1 expected to exceed $2.1bn by year-end 2028, with rising share of project
ownership Mature portfolio ARR expectations accounting for over 90% of the 2028 plan 1Expected Adjusted EBITDA margin of approximately 70%-80% (including tax benefits) for the years shown; 2FGW (Factored GW) is a consolidated metric
combining generation and storage capacity into a uniform figure based on the ratio of construction costs. The company’s current weighted average construction cost ratio is 3.5 GWh of storage per 1 GW of generation: FGW = GW + GWh / 3.5; 3The
expected growth in 2028 encompasses the Company’s operations in all geographies. Expected growth relies on business plans which rely on development conditions and assumptions regarding electricity prices, and are contingent on current trends
known to the Company at this time; 4The company's revenues from tax benefits are estimated at approximately 22-26% of the total revenue run rate for December 2026, and approximately 30-31% of the total revenues & income run rate for
December 2027 and December 2028. Weighted average of Enlight’s share of revenues and income Annual recurring revenues & income run rate roadmap1,3,4 ($bn) Global operating capacity roadmap2,3 (FGW) 41% CAGR
77% 86% 87% 91% Mature portfolio: $2.1bn 91% Mature portfolio: 11.6 FGW 42% CAGR
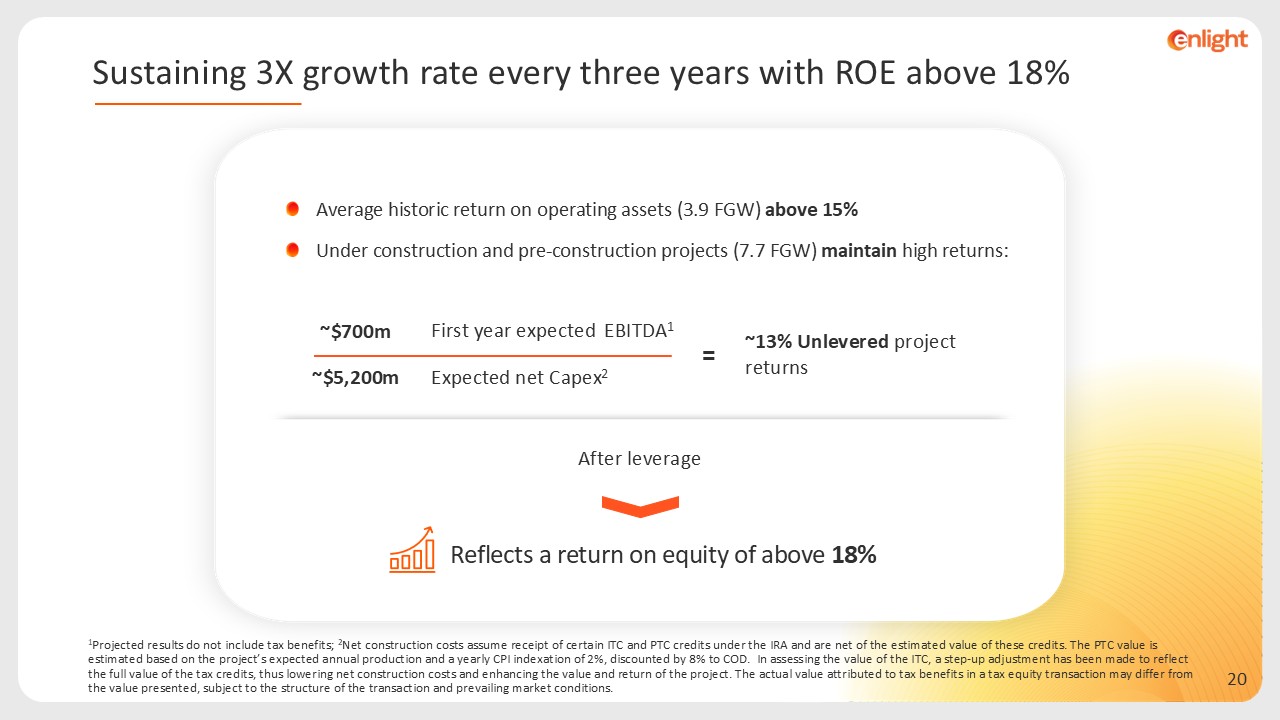
Average historic return on operating assets (3.9 FGW) above 15% Under
construction and pre-construction projects (7.7 FGW) maintain high returns: ~13% Unlevered project returns EBITDA1 First year expected ~$700m Expected net Capex2 ~$5,200m = Reflects a return on equity of above 18% After
leverage 1Projected results do not include tax benefits; 2Net construction costs assume receipt of certain ITC and PTC credits under the IRA and are net of the estimated value of these credits. The PTC value is estimated based on the
project’s expected annual production and a yearly CPI indexation of 2%, discounted by 8% to COD. In assessing the value of the ITC, a step-up adjustment has been made to reflect the full value of the tax credits, thus lowering net
construction costs and enhancing the value and return of the project. The actual value attributed to tax benefits in a tax equity transaction may differ from the value presented, subject to the structure of the transaction and prevailing
market conditions. Sustaining 3X growth rate every three years with ROE above 18%


Appendix
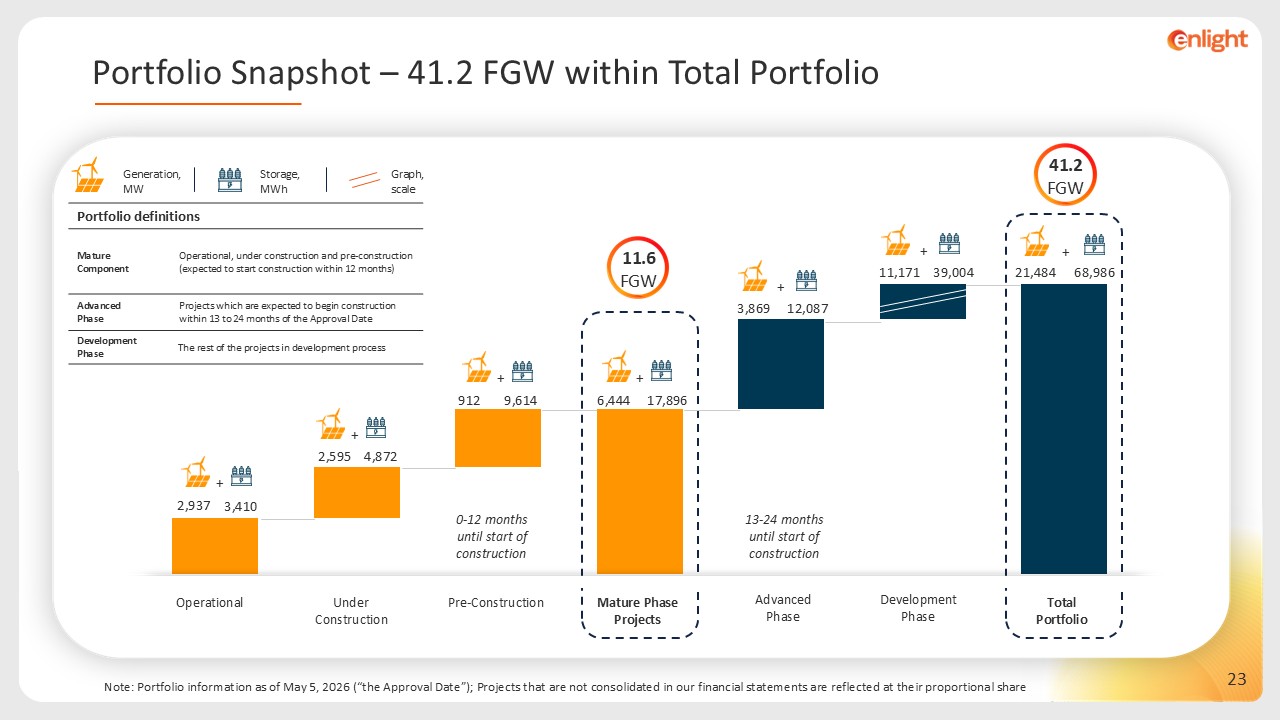
Graph, scale Generation, MW Storage, MWh Portfolio definitions Operational,
under construction and pre-construction (expected to start construction within 12 months) Mature Component Projects which are expected to begin construction within 13 to 24 months of the Approval Date Advanced Phase The rest of the
projects in development process Development Phase Note: Portfolio information as of May 5, 2026 (“the Approval Date”); Projects that are not consolidated in our financial statements are reflected at their proportional share
Advanced Phase Under Construction Operational Pre-Construction Mature Phase Projects Development Phase Total Portfolio 0-12 months until start of construction 13-24 months until start of
construction 2,937 6,444 912 9,614 2,595 39,004 12,087 68,986 17,896 4,872 11,171 3,869 21,484 3,410 + + + + + + + 41.2 FGW 11.6 FGW Portfolio Snapshot – 41.2 FGW within Total Portfolio
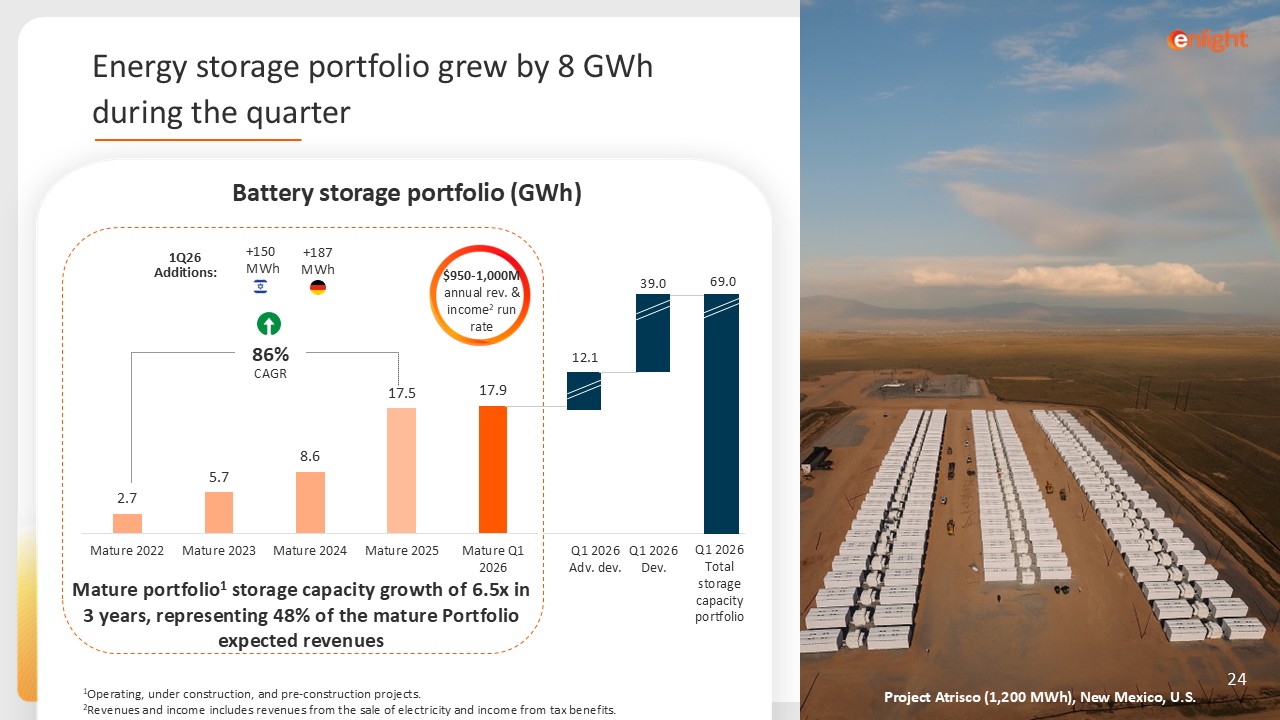
Project Atrisco (1,200 MWh), New Mexico, U.S. Mature portfolio1 storage
capacity growth of 6.5x in 3 years, representing 48% of the mature Portfolio expected revenues 1Q26 Additions: Q1 2026 Adv. dev. Q1 2026 Dev. Q1 2026 Total storage capacity portfolio 39.0 12.1 69.0 +187 MWh 86% CAGR
$950-1,000M annual rev. & income2 run rate 150+ MWh 1Operating, under construction, and pre-construction projects. 2Revenues and income includes revenues from the sale of electricity and income from tax benefits. 24 Battery
storage portfolio (GWh) Energy storage portfolio grew by 8 GWh during the quarter
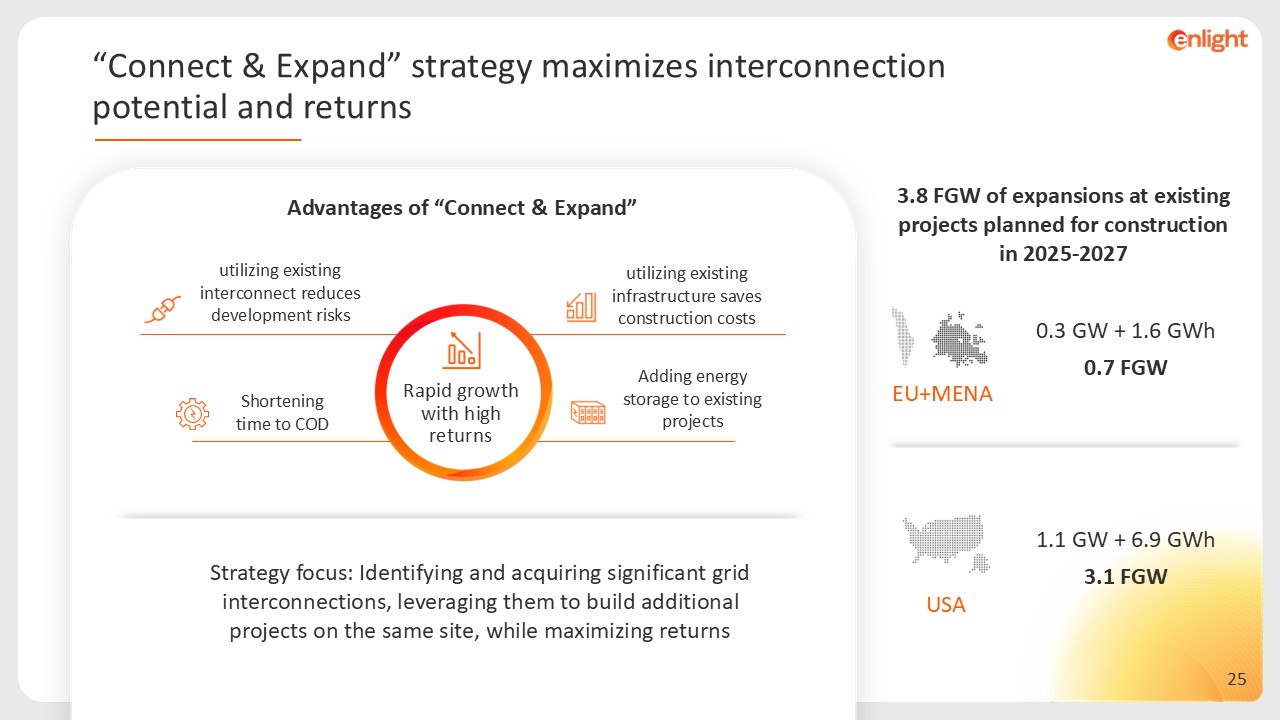
Advantages of “Connect & Expand” Shortening time to COD utilizing existing
infrastructure saves construction costs utilizing existing interconnect reduces development risks Adding energy storage to existing projects EU+MENA 1.1 GW + 6.9 GWh 3.1 FGW USA 0.3 GW + 1.6 GWh 0.7 FGW Rapid growth with high
returns 3.8 FGW of expansions at existing projects planned for construction in 2025-2027 Strategy focus: Identifying and acquiring significant grid interconnections, leveraging them to build additional projects on the same site, while
maximizing returns “Connect & Expand” strategy maximizes interconnection potential and returns
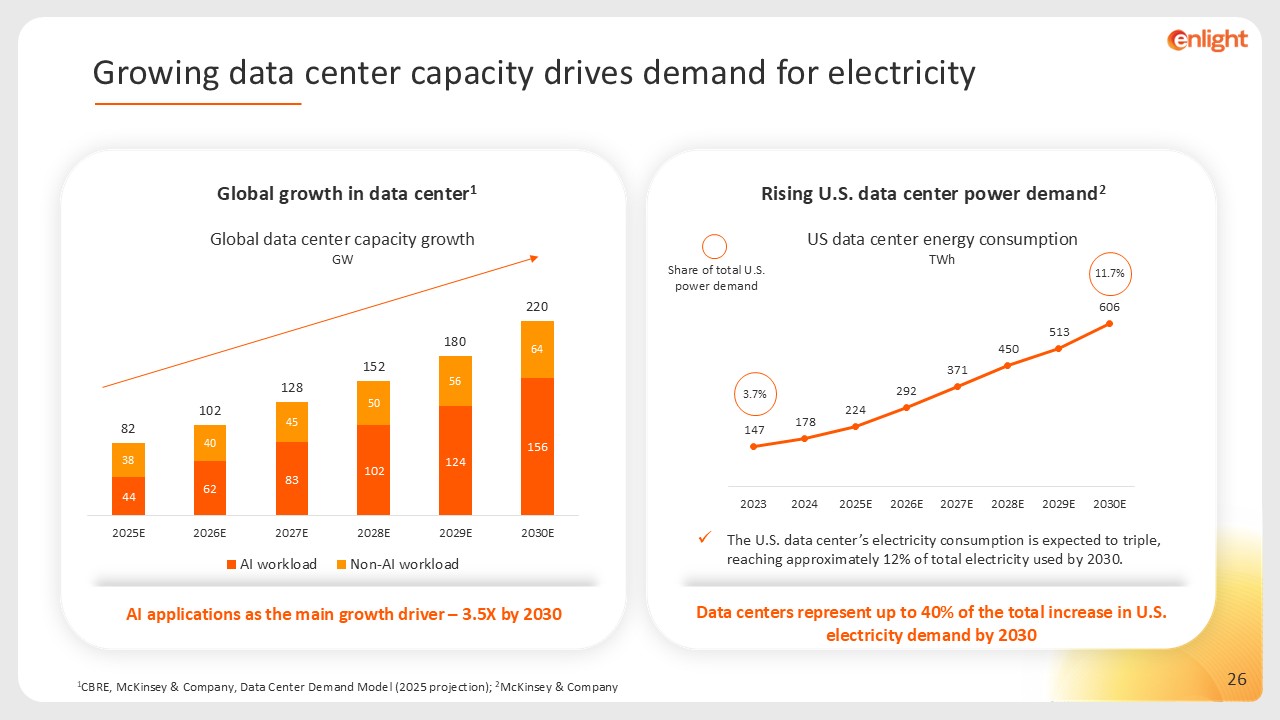
AI applications as the main growth driver – 3.5X by 2030 Global growth in data
center1 Global data center capacity growth GW 1CBRE, McKinsey & Company, Data Center Demand Model (2025 projection); 2McKinsey & Company Rising U.S. data center power demand2 The U.S. data center’s electricity consumption is
expected to triple, reaching approximately 12% of total electricity used by 2030. Data centers represent up to 40% of the total increase in U.S. electricity demand by 2030 US data center energy consumption TWh Share of total U.S. power
demand 3.7% 11.7% Growing data center capacity drives demand for electricity
1Ember, IEA; 2 U.S. Energy Information Administration, S&P
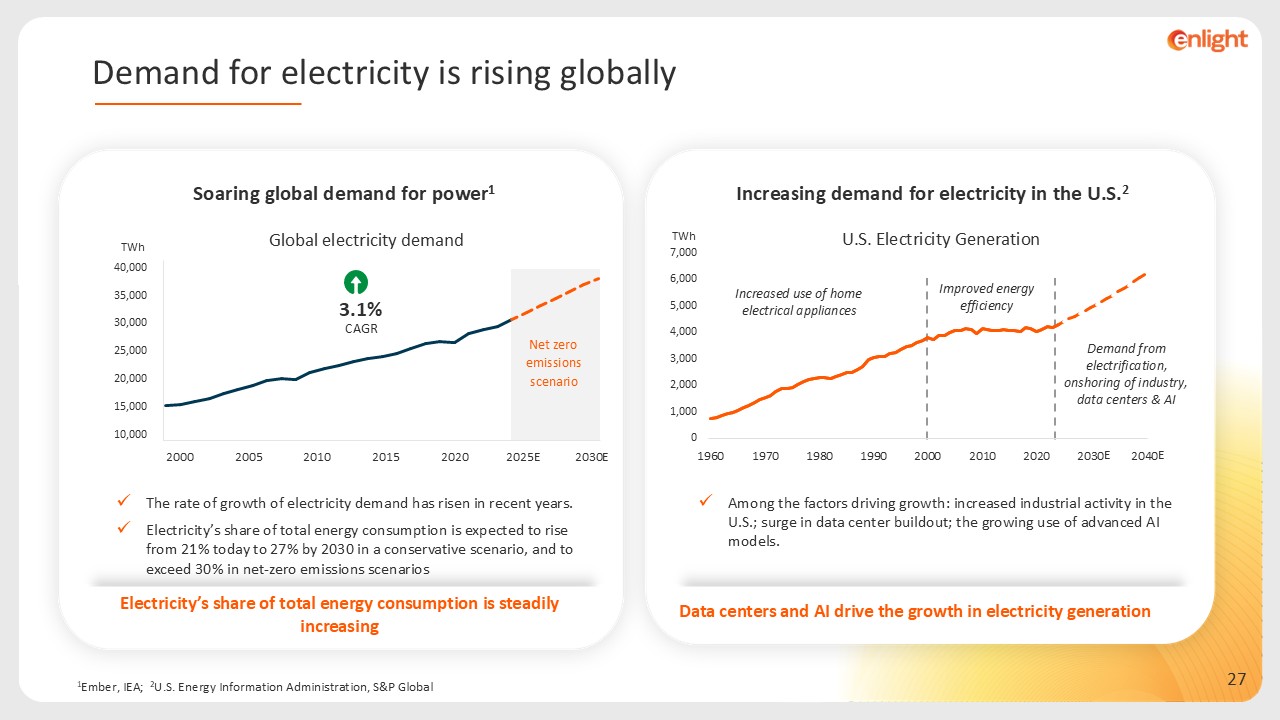
Global Electricity’s share of total energy consumption is steadily increasing Soaring global demand for power1 The rate of growth of electricity demand has risen in recent years. Electricity’s share of total energy consumption is
expected to rise from 21% today to 27% by 2030 in a conservative scenario, and to exceed 30% in net-zero emissions scenarios TWh Net zero emissions scenario 2000 2010 2020 2030E 2005 2015 2025E 3.1% CAGR Increasing demand for
electricity in the U.S.2 Among the factors driving growth: increased industrial activity in the U.S.; surge in data center buildout; the growing use of advanced AI models. Data centers and AI drive the growth in electricity
generation U.S. Electricity Generation TWh Increased use of home electrical appliances Improved energy efficiency Demand from electrification, onshoring of industry, data centers & AI E E Demand for electricity is rising globally
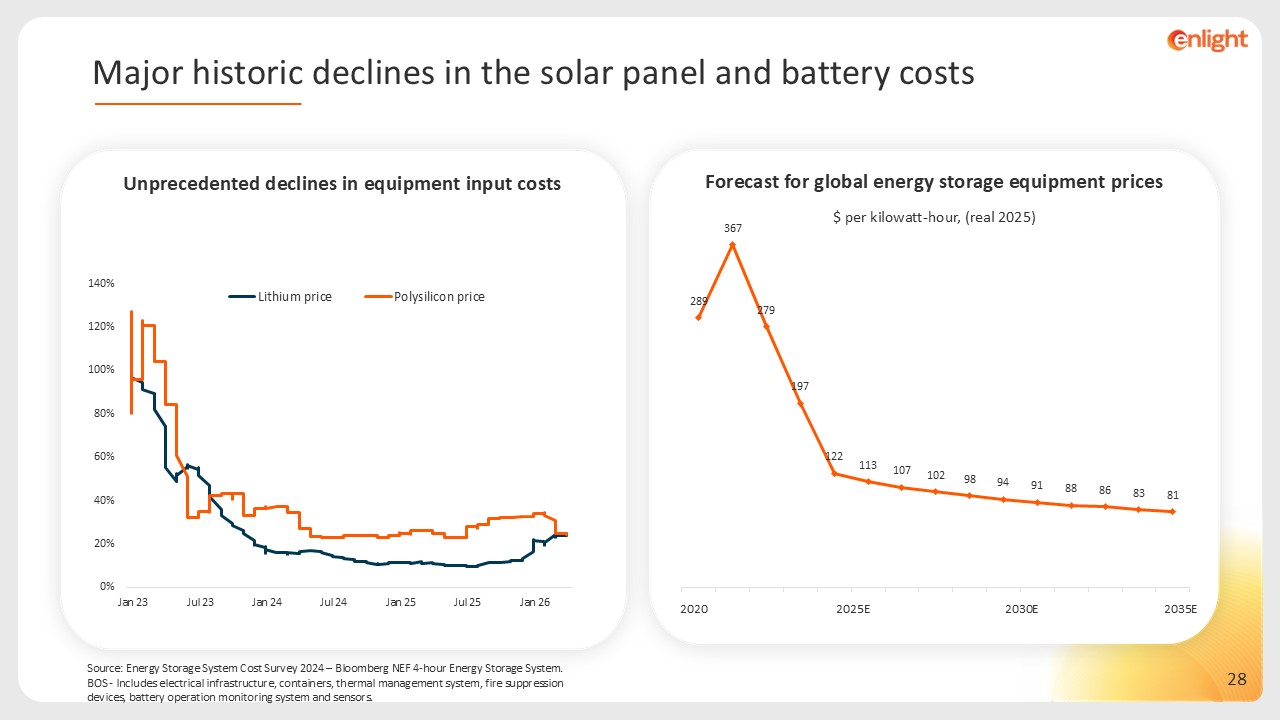
Source: Energy Storage System Cost Survey 2024 – Bloomberg NEF 4-hour Energy
Storage System. BOS - Includes electrical infrastructure, containers, thermal management system, fire suppression devices, battery operation monitoring system and sensors. Unprecedented declines in equipment input costs Forecast for global
energy storage equipment prices 2020 2035E 2025E 2030E $ per kilowatt-hour, (real 2025) Major historic declines in the solar panel and battery costs
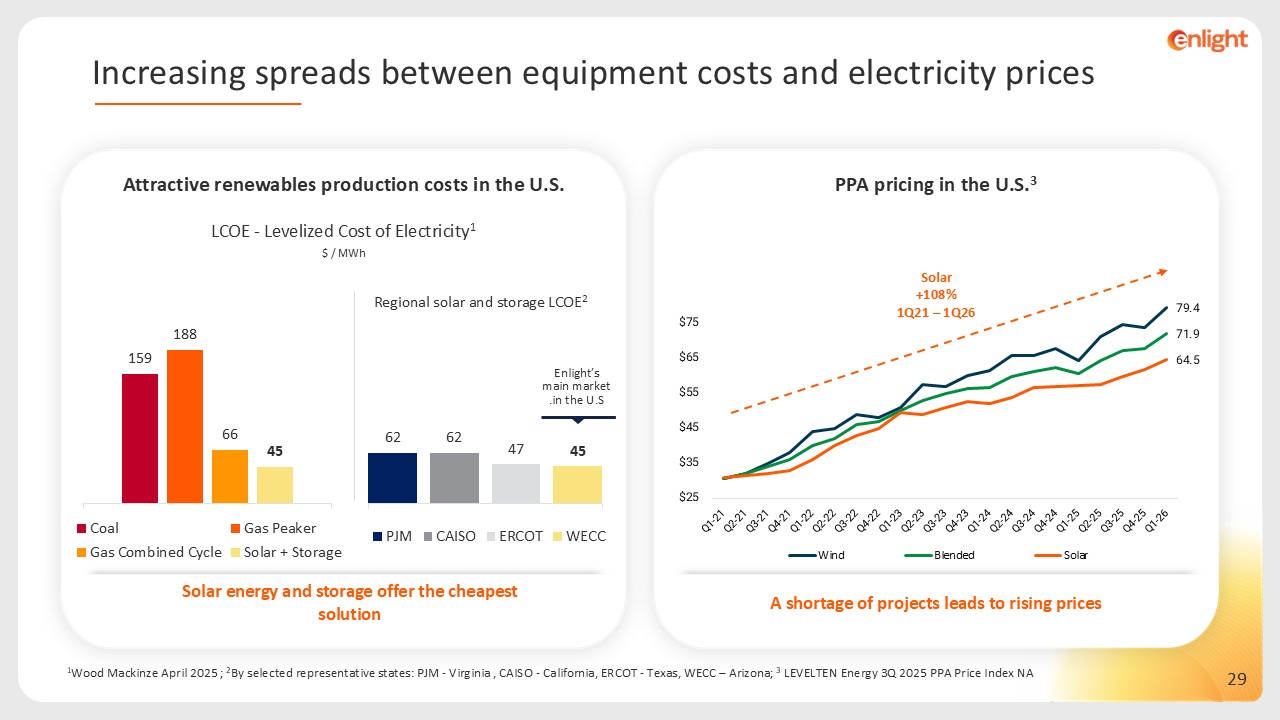
1Wood Mackinze April 2025 ; 2By selected representative states: PJM - Virginia ,
CAISO - California, ERCOT - Texas, WECC – Arizona; 3 LEVELTEN Energy 3Q 2025 PPA Price Index NA PPA pricing in the U.S.3 A shortage of projects leads to rising prices Solar +108%1Q21 – 1Q26 LCOE - Levelized Cost of
Electricity1 Attractive renewables production costs in the U.S. $ / MWh 2Regional solar and storage LCOE Enlight’s main market in the U.S. Solar energy and storage offer the cheapest solution Increasing spreads between equipment costs
and electricity prices
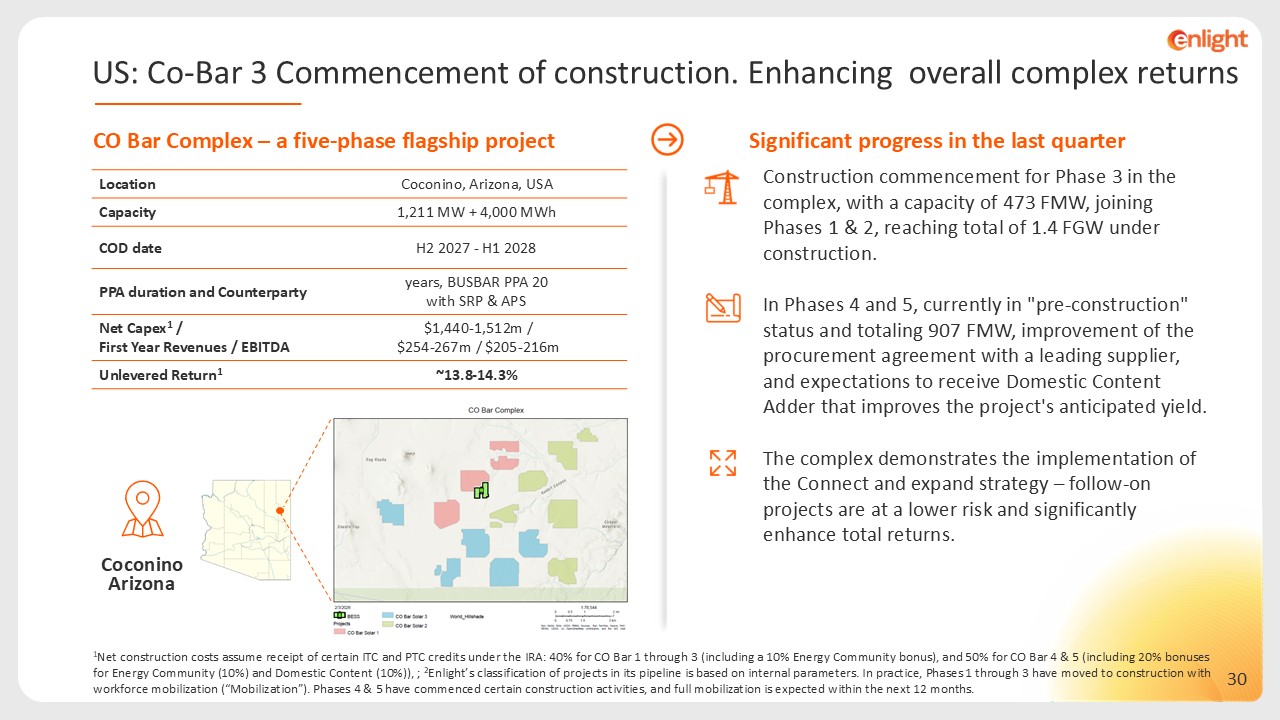
CO Bar Complex – a five-phase flagship project Significant progress in the last
quarter Construction commencement for Phase 3 in the complex, with a capacity of 473 FMW, joining Phases 1 & 2, reaching total of 1.4 FGW under construction. In Phases 4 and 5, currently in "pre-construction" status and totaling 907
FMW, improvement of the procurement agreement with a leading supplier, and expectations to receive Domestic Content Adder that improves the project's anticipated yield. The complex demonstrates the implementation of the Connect and expand
strategy – follow-on projects are at a lower risk and significantly enhance total returns. Coconino Arizona 1Net construction costs assume receipt of certain ITC and PTC credits under the IRA: 40% for CO Bar 1 through 3 (including a 10%
Energy Community bonus), and 50% for CO Bar 4 & 5 (including 20% bonuses for Energy Community (10%) and Domestic Content (10%)), ; 2Enlight’s classification of projects in its pipeline is based on internal parameters. In practice, Phases
1 through 3 have moved to construction with workforce mobilization (“Mobilization”). Phases 4 & 5 have commenced certain construction activities, and full mobilization is expected within the next 12 months. US: Co-Bar 3 Commencement of
construction. Enhancing overall complex returns Coconino, Arizona, USA Location 1,211 MW + 4,000 MWh Capacity H2 2027 - H1 2028 COD date 20 years, BUSBAR PPA with SRP & APS PPA duration and Counterparty $1,440-1,512m /
$254-267m / $205-216m Net Capex1 / First Year Revenues / EBITDA ~13.8-14.3% Unlevered Return1
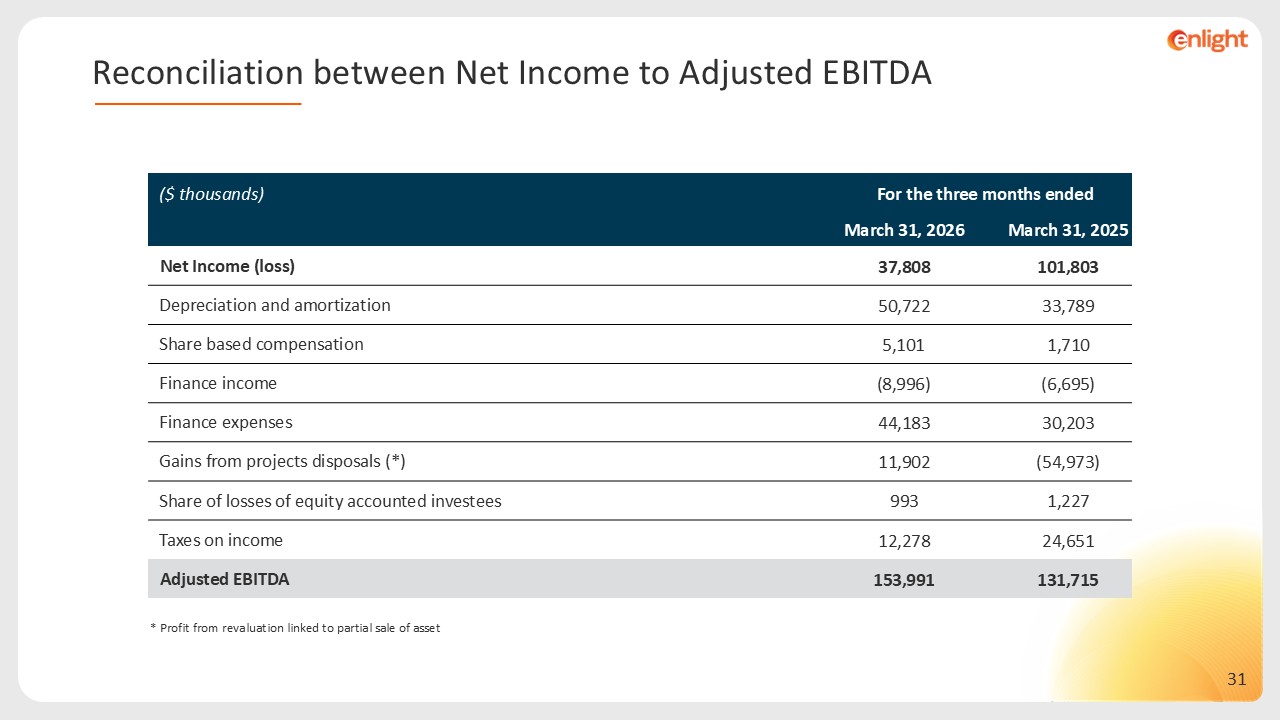
* Profit from revaluation linked to partial sale of asset ($ thousands) For
the three months ended March 31, 2026 March 31, 2025 Net Income (loss) 37,808 101,803 Depreciation and amortization 50,722 33,789 Share based compensation 5,101 1,710 Finance income (8,996) (6,695) Finance
expenses 44,183 30,203 Gains from projects disposals (*) 11,902 (54,973) Share of losses of equity accounted investees 993 1,227 Taxes on income 12,278 24,651 Adjusted EBITDA 153,991 131,715 Reconciliation
between Net Income to Adjusted EBITDA
