☒ | REGISTRATION STATEMENT PURSUANT TO SECTION 12(b) OR (g) OF THE SECURITIES EXCHANGE ACT OF 1934 |
☐ | ANNUAL REPORT PURSUANT TO SECTION 13 OR 15(d) OF THE SECURITIES EXCHANGE ACT OF 1934 |
☐ | TRANSITION REPORT PURSUANT TO SECTION 13 OR 15(d) OF THE SECURITIES EXCHANGE ACT OF 1934 |
☐ | SHELL COMPANY REPORT PURSUANT TO SECTION 13 OR 15(d) OF THE SECURITIES EXCHANGE ACT OF 1934 |
Title of each class | | | Trading Symbol | | | Name of each exchange on which registered |
Common shares, par value $1.00 per share | | | LNGC | | | New York Stock Exchange |
Large Accelerated Filer ☐ | | | Accelerated Filer ☐ | | | Non-accelerated Filer ☒ |
| | | | | Emerging Growth Company ☒ |
| | | ☒ | | | U.S. GAAP | |
| | | ☐ | | | International Financial Reporting Standards as issued by the International Accounting Standards Board | |
| | | ☐ | | | Other |
| | | | | | | Page | |||
| | | ||||||||
| | | ||||||||
| | | ||||||||
| | | | | ||||||
| | | | | | | ||||
| | | | | | | ||||
| | | | | | | ||||
| | | | | ||||||
| | | | | | | ||||
| | | | | | | ||||
| | | | | ||||||
| | | | | | | ||||
| | | | | | | ||||
| | | | | | | ||||
| | | | | | | ||||
| | | | | ||||||
| | | | | | | ||||
| | | | | | | ||||
| | | | | | | ||||
| | | | | | | ||||
| | | | | ||||||
| | | | | ||||||
| | | | | | | ||||
| | | | | | | ||||
| | | | | | | ||||
| | | | | | | ||||
| | | | | | | ||||
| | | | | ||||||
| | | | | | | ||||
| | | | | | | ||||
| | | | | | | ||||
| | | | | | | ||||
| | | | | | | ||||
| | | | | ||||||
| | | | | | | ||||
| | | | | | | ||||
| | | | | | | ||||
| | | | | ||||||
| | | | | | | ||||
| | | | | | | ||||
| | | | | ||||||
| | | | | | | ||||
| | | | | | | ||||
| | | | | | | ||||
| | | | | | | ||||
| | | | | | | ||||
| | | | | | | ||||
| | | | | | | Page | |||
| | | | | ||||||
| | | | | | | ||||
| | | | | | | ||||
| | | | | | | ||||
| | | | | | | ||||
| | | | | | | ||||
| | | | | | | ||||
| | | | | | | ||||
| | | | | | | ||||
| | | | | | | ||||
| | | | | ||||||
| | | | | ||||||
| | | | | | | ||||
| | | | | | | ||||
| | | | | | | ||||
| | | | | | | ||||
| | | ||||||||
| | | | | ||||||
| | | | | ||||||
| | | | | ||||||
| | | | | | | ||||
| | | | | | | ||||
| | | | | | | ||||
| | | | | | | ||||
| | | | | ||||||
| | | | | ||||||
| | | | | ||||||
| | | | | ||||||
| | | | | ||||||
| | | | | ||||||
| | | | | ||||||
| | | | | ||||||
| | | | | ||||||
| | | | | ||||||
| | | ||||||||
| | | | | ||||||
| | | | | ||||||
| | | | | ||||||
| | | ||||||||
• | plans to acquire vessels and any associated contracts thereof; |
• | expected trends in our industry, including those discussed under “Item 4. Information on the Company – B. Business Overview – Industry”; |
• | expected trends in the global fleet of LNG vessels, including expected scrapping; |
• | expected trends in LNG demand; |
• | expected market trends and expected impact of sanctions; |
• | expected trends in LNGC hire rates; |
• | intention to reduce carbon emissions intensity; and |
• | expected trends in scrapping and reduction of steam vessels. |
• | general economic, political and business conditions, including sanctions and other measures; |
• | general LNG market conditions, including fluctuations in charter hire rates and vessel values; |
• | changes in demand in the LNG shipping industry, including the market for eight modern tri-fuel diesel electric (“TFDE”) vessels we acquired from Golar (the “Original Vessels”) and the four modern two-stroke and TDFE vessels acquired from Quantum Crude Tankers Ltd (the “Acquisition Vessels”) (the Original Vessels and Acquisition Vessels are collectively referred to as the “Vessels”); |
• | changes in the supply of LNG vessels; |
• | our ability to successfully employ the Vessels; |
• | changes in our operating expenses, including fuel or cooling down prices and lay-up costs when vessels are not on charter, drydocking and insurance costs; |
• | compliance with, and our liabilities under, governmental, tax environmental and safety laws and regulations; |
• | changes in governmental regulation, tax and trade matters and actions taken by regulatory authorities; |
• | potential disruption of shipping routes and demand due to accidents, piracy or political events; |
• | vessel breakdowns and instances of loss of hire; |
• | vessel underperformance and related warranty claims; |
• | our expectations regarding the availability of vessel acquisitions and our ability to complete the acquisition of the Newbuild Vessels (as defined herein); |
• | our ability to procure or have access to financing and refinancing, including financing for the Newbuild Vessels; |
• | our continued borrowing availability under our credit facilities and compliance with the financial covenants therein; |
• | fluctuations in foreign currency exchange and interest rates; |
• | potential conflicts of interest involving our significant shareholders; |
• | our ability to pay dividends; |
• | our limited operating history under the CoolCo name; |
• | other factors that may affect our financial condition, liquidity and results of operations; and |
• | other risk factors discussed under “Item 3. Key Information – D. Risk Factors.” |
Identity of Directors, Senior Management and Advisers |
Directors and Senior Management |
Advisers |
Auditors |
OFFER STATISTICS AND EXPECTED TIMETABLE |
Offer Statistics |
Method And Expected Timetable |
KEY INFORMATION |
[Reserved] |
Capitalization and Indebtedness |
| | | As of September 30, 2022 | |
| | | (unaudited) | |
| | | (in thousands of $) | |
Cash: | | | |
Cash and cash equivalents | | | 94,790 |
Capitalization: | | | |
Liabilities: | | | |
Interest bearing debt (long term and short term), net of deferred charges (secured) | | | 657,378 |
Other Liabilities | | | 119,435 |
Total liabilities | | | 776,813 |
Equity: | | | |
Owners’ equity | | | 394,863 |
Accumulated retained earnings | | | 52,529 |
Total owners’ equity | | | 447,392 |
Non-controlling interests | | | 69,099 |
Total Equity | | | 516,491 |
Total Capitalization | | | 1,293,304 |
Reasons for the Offer and Use of Proceeds |
Risk Factors |
• | general economic, political and business conditions, including sanctions and other measures; |
• | general LNG market conditions, including fluctuations in charter hire rates and vessel values; |
• | changes in demand in the LNG shipping industry, including the market for our Vessels; |
• | changes in the supply of LNG vessels; |
• | our ability to successfully employ our Vessels; |
• | changes in our operating expenses, including fuel or cooling down prices and lay-up costs when vessels are not on charter, drydocking and insurance costs; |
• | compliance with, and our liabilities under, governmental, tax, environmental and safety laws and regulations; |
• | changes in governmental regulation, tax and trade matters and actions taken by regulatory authorities; |
• | potential disruption of shipping routes and demand due to accidents, piracy or political events; |
• | vessel breakdowns and instances of loss of hire; |
• | vessel underperformance and related warranty claims; |
• | our expectations regarding the availability of vessel acquisitions and our ability to complete the acquisition of the Newbuild Vessels; |
• | our ability to procure or have access to financing and refinancing, including financing for the Newbuild Vessels; |
• | our continued borrowing availability under our credit facilities and compliance with the financial covenants therein; |
• | fluctuations in foreign currency exchange and interest rates; |
• | potential conflicts of interest involving our significant shareholders; |
• | our ability to pay dividends; |
• | our limited operating history under the CoolCo name; |
• | other factors that may affect our financial condition, liquidity and results of operations; and |
• | other risk factors discussed under “Item 3. Key Information – D. Risk Factors.” |
• | price and availability of natural gas, LNG, crude oil and petroleum products; |
• | increases in the cost of natural gas derived from LNG relative to the cost of natural gas; |
• | further development of, or decreases in the cost of, alternative technologies for LNG transportation; |
• | increases in the production levels of low-cost natural gas in domestic natural gas consuming markets, which could further depress prices for natural gas in those markets and make LNG uneconomical; |
• | increases in the production of natural gas in areas linked by pipelines to consuming areas, the extension of existing, or the development of new, pipeline systems in markets we may serve, or the conversion of existing non-natural gas pipelines to natural gas pipelines in those markets; |
• | negative global or regional economic or political conditions, particularly in LNG-consuming regions, could reduce energy consumption or its growth; |
• | global and regional economic and political conditions and developments, armed conflicts, including the recent conflicts between Russia and Ukraine, and terrorist activities, trade wars, tariffs, embargoes and strikes; |
• | the impact of sanctions on LNG production; |
• | decreases in the consumption of natural gas due to increases in its price relative to other energy sources or other factors making consumption of natural gas less attractive; |
• | any significant explosion, spill or other incident involving an LNG facility or carrier, conventional land-based regasification or liquefaction system, or floating storage and regasification units (“FSRUs”); |
• | new taxes or regulations affecting LNG production or liquefaction that make LNG production less attractive; |
• | a significant increase in the number of LNGCs available, whether by a reduction in the scrapping of existing vessels or the increase in construction of vessels; |
• | increases in interest rates or other events that may affect the availability of sufficient financing for LNG projects on commercially reasonable terms; |
• | the inability of project owners or operators to obtain governmental approvals to construct or operate LNG facilities; |
• | local community resistance to proposed or existing LNG facilities based on safety, environmental or security concerns; |
• | labor or political unrest affecting existing or proposed areas of LNG production, liquefaction and regasification; |
• | availability of new, alternative energy sources, including renewables; and |
• | decrease in demand for LNG imports globally following any easing or lifting of sanctions and/or the continued import of Russian natural gas. |
• | the number of newbuilding orders and deliveries, as these may be impacted by the availability of financing for shipping activity; |
• | the number of shipyards, availability at shipyards and ability of shipyards to deliver vessels; |
• | scrapping of older vessels; |
• | speed of vessel operation; |
• | vessel casualties, including loss or material damage to, grounding or disabling of a vessel; |
• | the degree of recycling of older vessels; |
• | number of vessels that are out of service; |
• | availability of financing for new vessels and shipping activity; |
• | business disruptions, including supply chain disruptions and congestion, due to natural and other disasters, including the COVID-19 pandemic; |
• | changes in regulations that may effectively cause reductions in the carrying capacity of vessels or early obsolescence of vessels; and |
• | environmental concerns and uncertainty around new regulations relating to, among other things, new technologies which may delay the ordering of new vessels. |
• | limited downstream infrastructure limiting the development of new or expanded import terminals; |
• | local community resistance to proposed or existing LNG facilities based on safety, environmental, environmental justice or security concerns; |
• | any significant explosion, spill or similar incident involving an LNG facility or vessel involved in the LNG transportation, storage and regasification industry, including an LNGC (such as the major fire at the Freeport LNG facility in Quintana, Texas in June 2022, which significantly disrupted its operations and is expected to exacerbate global LNG shortages through the end of December 2022 on the basis of currently available information); and |
• | labor or political unrest affecting existing or proposed sites for LNG regasification terminals. |
• | at the end of a specified time period following certain events such as the outbreak of war or hostilities involving two or more major nations, if such war or hostilities materially and adversely affect the trading of the vessel for a certain period; |
• | a number of consecutive days off-hire in each year; |
• | loss of or requisition of the vessel; |
• | the occurrence of an insolvency event; and |
• | the occurrence of certain uncured, material breaches. |
• | marine disasters; |
• | piracy; |
• | environmental incidents; |
• | bad weather; |
• | mechanical failures; |
• | grounding, fire, explosions and collisions; |
• | human error; and |
• | war and terrorism. |
• | death or injury to persons, loss of property or damage to the environment, natural resources or protected species, and associated costs; |
• | suspension or termination of customer contracts, and resulting loss of revenues; |
• | governmental fines, penalties or restrictions on conducting business; |
• | higher insurance rates; and |
• | damage to our reputation and customer relationships generally, thereby threatening company viability. |
• | the cost of labor and materials; |
• | customer requirements; |
• | fleet size; |
• | the cost of replacement vessels; |
• | length of charters; |
• | governmental regulations and maritime self-regulatory organization standards relating to safety, security or the environment; |
• | competitive standards; and |
• | operating conditions, including adverse weather events, sea currents and natural disasters impacting performance, required maintenance and repair intervals and spending. |
• | our inability to secure adequate debt financing on acceptable terms; |
• | shortages of equipment, materials or skilled labor; |
• | delays in the receipt of necessary construction materials, such as steel, or equipment, such as engines or generators; |
• | failure of equipment to meet quality and/or performance standards; |
• | the shipyard’s over-committing to new ships to be constructed; |
• | changes in governmental regulations or maritime self-regulatory organization standards; |
• | financial or operating difficulties experienced by equipment vendors or the shipyard; |
• | required changes to the original ship specifications; |
• | inability to obtain required permits or approvals; |
• | disputes with the shipyard; |
• | work stoppages and other labor disputes; and |
• | adverse weather conditions, sea currents and natural disasters or any other disruptive events, such as an outbreak of war. |
• | identify attractive vessel acquisition opportunities and consummate such acquisitions; |
• | obtain newbuilding contracts at acceptable prices; |
• | obtain required financing on acceptable terms; |
• | secure charter arrangements on terms acceptable to our lenders; |
• | expand our relationships with existing customers and establish new customer relationships; |
• | recruit and retain additional suitably qualified and experienced seafarers and shore-based employees; |
• | continue to meet technical and safety performance standards; |
• | manage joint ventures; and |
• | manage the expansion of our operations to integrate the new ships into our Vessels. |
• | crew changes may be canceled or delayed due to port authorities denying or delaying disembarkation, a high potential of infection in countries where crew changes may otherwise have taken place, and the inability to repatriate crew members due to lack of international air transport or denial of re-entry by crew members’ home countries that have closed their borders; |
• | we may be unable to complete scheduled engine overhauls, routine maintenance work and management of equipment malfunctions; |
• | there may be shortages or a lack of access to required spare parts for our Vessels, and delays in repairs to, or scheduled or unscheduled maintenance or modifications or drydocking of, our Vessels, as a result of a lack of berths available at shipyards from a shortage in labor at shipyards or contractors or due to other business disruptions; |
• | we may be required to find new, remote means to complete vessel inspections and related certifications by class societies, customers or government agencies; |
• | there may be disruptions to our business from, or additional costs related to, new regulations, directives or practices implemented in response to the pandemic, such as travel restrictions, increased inspection regimes, hygiene measures (such as quarantining and physical distancing) or increased implementation of remote working arrangements; and |
• | our Vessels could be placed off-hire if prohibited from entering a port to load or discharge cargo due to COVID-19 restrictions. |
• | operational and logistical challenges in coordinating and maintaining offices across multiple regions; |
• | the diverse regulatory, financial and legal requirements in the countries where we are located or do business, and any changes to those requirements; |
• | challenges inherent in efficiently managing employees in diverse geographies, including the need to adapt systems, policies, benefits and compliance programs to differing labor and employment law and other regulations, as well as maintaining positive interactions with our unionized employees; and |
• | public health risks, such as COVID-19 and potential related effects on travel and employee health and availability to operate and manage offices. |
• | prevailing economic conditions in the LNG, natural gas and energy markets; |
• | a substantial or extended decline or increase in demand for LNG; |
• | increases in the supply of vessel capacity; |
• | the size and age of a vessel; |
• | the remaining term on existing time charters; and |
• | the cost of retrofitting or modifying existing vessels, as a result of technological advances in vessel design or equipment, changes in applicable environmental or other regulations or standards, customer requirements or otherwise. |
• | general market conditions; |
• | interest rates and the impact of inflation; |
• | ESG-related requirements and terms imposed by lenders; |
• | the market’s perception of our growth potential; |
• | our current debt levels; |
• | our ability to provide the requisite security to third-party lenders including corporate guarantees; |
• | our current and expected future earnings; |
• | restrictions in our customer contracts to pledge or place debt on our assets; |
• | risk allocation requirements for limited recourse financing vehicles; |
• | creditworthiness of customers; |
• | our cash flows; and |
• | the market price per share of our common shares. |
• | our ability to obtain additional financing, if necessary, for working capital, capital expenditures, acquisitions or other purposes may be limited, or such financing may not be available on favorable terms; |
• | we will need a substantial portion of our cash flows to make principal and interest payments on our debt, reducing the funds that would otherwise be available for operations and future business opportunities; |
• | our debt level may make us vulnerable to competitive pressures or a downturn in our business or the economy generally; and |
• | our debt level may limit our flexibility in responding to changing business and economic conditions. |
• | merge into, or consolidate with, any other entity or sell, or otherwise dispose of, all or substantially all of our assets; |
• | declare and/or pay dividends; |
• | incur additional indebtedness; or |
• | incur or make any capital expenditures. |
• | expanding regulations covering the reporting of GHG beyond CO2 (including methane (CH4) and nitrous oxides) as part of monitoring, reporting and verifying (MRV) reporting; |
• | broadening the EU ETS’ scope to cover smaller vessels over 5,000 gross tonnage between 2024 and 2027; |
• | closing the existing loophole that would allow vessels to reduce their carbon tax burden by calling at a nearby non-EU port (e.g., Turkey or the U.K.) before calling an EU port. If the nautical distance between the EU port and the non-EU port is fewer than 300 miles, the entire voyage would be subject to carbon tax (as opposed to simply half of the voyage); |
• | expanding the obligations and regulations under the EU ETS to cover all voyages between EU ports and non-EU ports if the applicable non-EU countries have not set up a system equivalent to the EU ETS; and |
• | allocating responsibility for paying carbon tax onto charterers by operation of law. |
• | The EU ETS, from 2023 (or 2024), will potentially include CH4 slip as a part of the MRV reporting. |
• | The FuelEU Maritime Initiative, from 2025, will set limits to the yearly average well-to-wake GHG intensity of energy used on-board vessels. The scope of this initiative will include CH4 slip and NO2 emissions in addition to CO2 emissions. |
• | The IMO fuel lifecycle carbon intensity guidelines are planned to be completed in 2023 and are likely to include methane slip considerations. Decisions on how and to which IMO regulations these guidelines should be applied will be subsequently decided. |
• | the likelihood that an active trading market for shares of our common shares will develop or be sustained; |
• | the liquidity of any such market; |
• | the ability of our shareholders to sell their shares of common shares; or |
• | the price that our shareholders may obtain for their common shares. |
• | institute a more comprehensive compliance function, including for financial reporting and disclosures; |
• | continue to prepare and distribute periodic public reports in compliance with our obligations under federal securities laws; |
• | comply with rules promulgated by the NYSE; |
• | continue to prepare and distribute periodic public reports in compliance with our obligations under federal securities laws; |
• | enhance our investor relations function; |
• | establish new internal policies, such as those relating to insider trading; and |
• | involve and retain to a greater degree outside counsel and accountants in the above activities. |
• | our operating and financial performance; |
• | quarterly variations in the rate of growth of our financial indicators, such as net income per share, net income and revenues; |
• | the public reaction to our press releases, our other public announcements and our filings with the SEC; |
• | strategic actions by our competitors; |
• | changes in revenue or earnings estimates, or changes in recommendations or withdrawals of research coverage, by equity research analysts; |
• | market and industry perception of our success, or lack thereof, in pursuing our growth strategies; |
• | introductions or announcements of new products offered by us or significant acquisitions, strategic partnerships, joint ventures or capital commitments by us or our competitors and the timing of such introductions or announcements; |
• | our ability to effectively manage our growth; |
• | the impact of pandemics on us and the national and global economies; |
• | speculation in the press or investment community; |
• | the failure of research analysts to cover our common shares; |
• | whether investors or securities analysts view our stock structure unfavorably, particularly any significant voting control of our executive officers, directors and their affiliates; |
• | our ability or inability to raise additional capital through the issuance of equity or debt or other arrangements and the relevant terms; |
• | additional shares of our common shares being sold into the market by us or our existing shareholders, or the anticipation of such sales; |
• | changes in accounting principles, policies, guidance, interpretations or standards; |
• | additions or departures of key management personnel; |
• | actions by our shareholders; |
• | changes in operating performance and stock market valuations of companies in our industry, including our vendors and competitors; |
• | trading volume of our common shares; |
• | price and volume fluctuations in the overall stock market, including as a result of trends in the economy as a whole and those resulting from natural disasters, severe weather events, terrorist attacks and responses to such events; |
• | lawsuits threatened or filed against us; |
• | economic, legal and regulatory factors unrelated to our performance; |
• | privacy or cybersecurity breaches, data theft or other security incidents or failure to comply with applicable data privacy laws, rules and regulations; |
• | our ability to obtain, maintain, protect, defend and enforce our intellectual property; and |
• | the realization of any risks described under this “Risk Factors” section. |
• | prevailing economic and market conditions in the natural gas and energy markets; |
• | negative global or regional economic or political conditions, particularly in LNG-consuming regions, which could reduce energy consumption or its growth; |
• | declines in demand for LNG or the services of LNGCs or; |
• | increases in the supply of LNGC capacity operating in the spot or term markets; |
• | marine disasters; war, piracy or terrorism; environmental accidents; or inclement weather conditions; |
• | mechanical failures or accidents involving any of our Vessels; and |
• | drydock scheduling, costs and capital expenditures. |
INFORMATION ON THE COMPANY |
History and Development of the Company |
Business Overview |
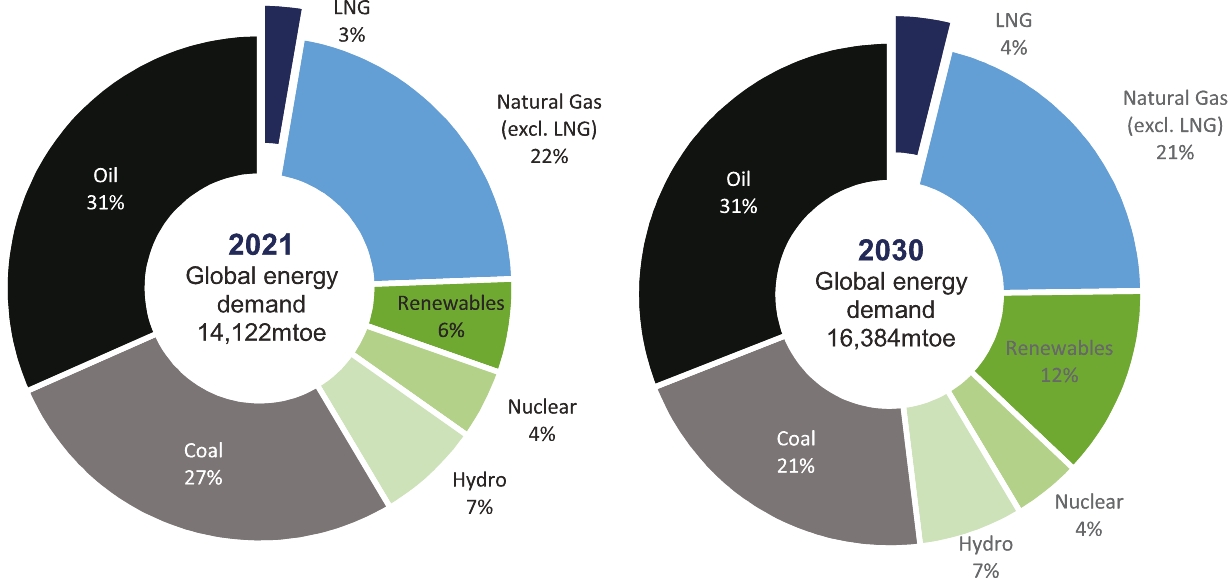
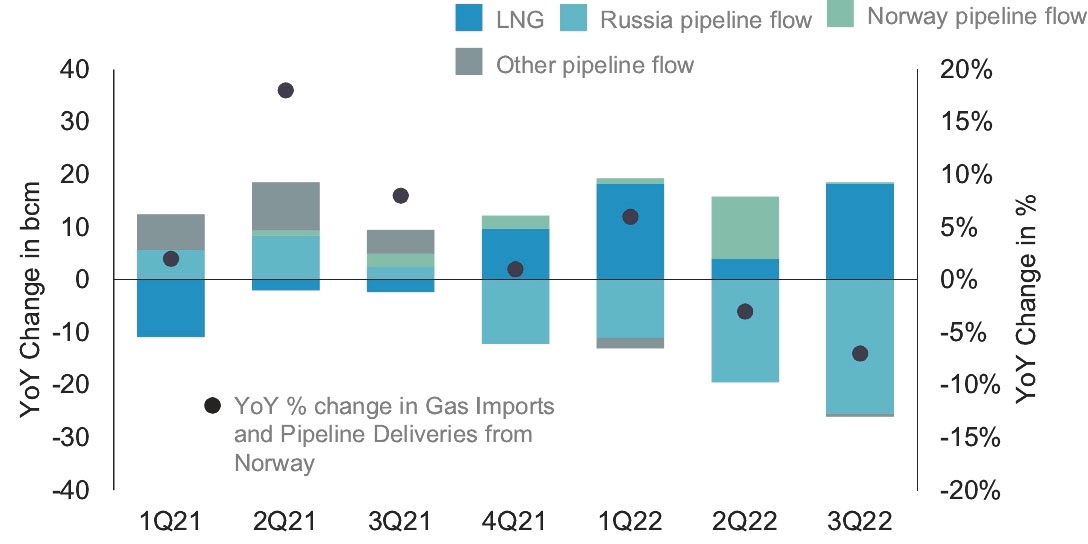
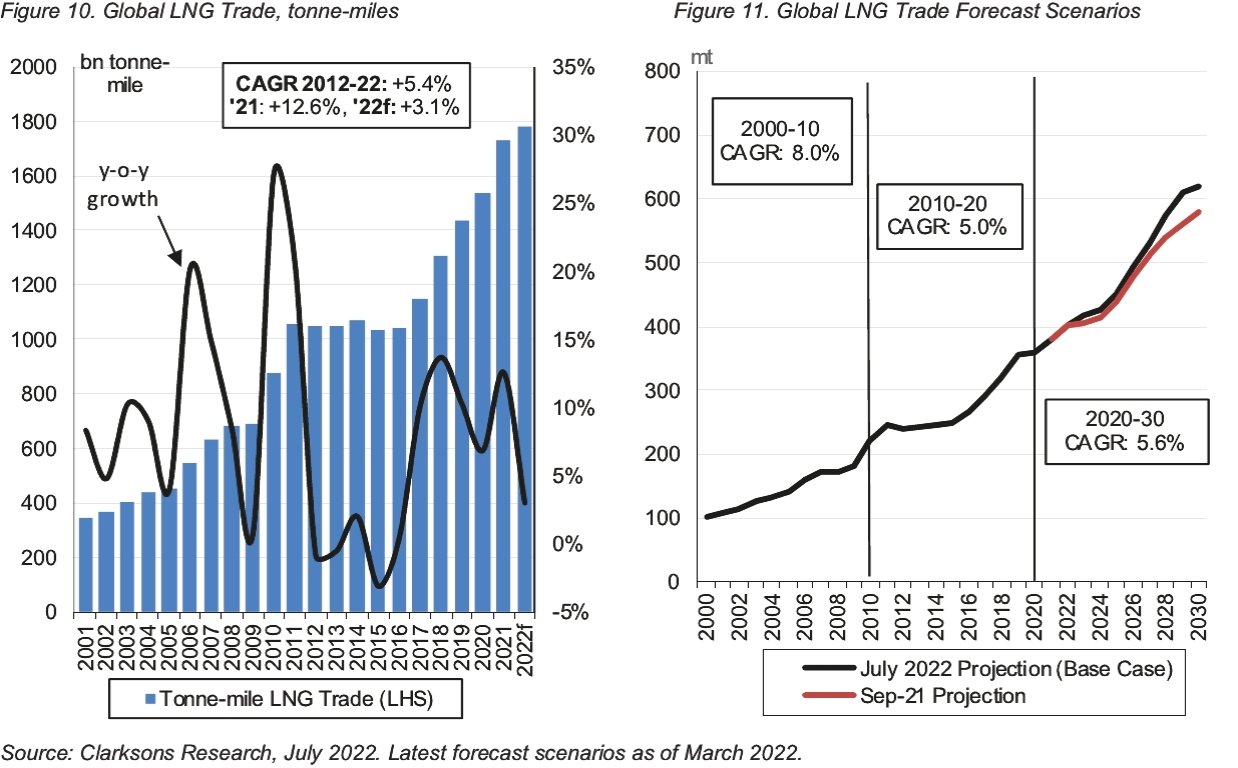
• | Energy security concerns are driving an accelerated growth in demand for natural gas and LNG. The LNG industry is currently experiencing a significant expansion phase, with a recent focus on energy security building on a fundamental outlook for growth that is supported by Asian gas demand, energy transition dynamics and significant LNG export projects. According to the IEA’s Global Gas Review 2021, global LNG trade expanded by 6% in 2021, slightly below the 7% average rate in the 2015-2020 period, but greater than the 1% increase in 2020. The IEA forecasts global LNG trade will increase 5% in 2022 with LNG exports from the United States expected to grow by 19% with smaller contributions from Africa, Europe, Central and South America and Eurasia offsetting small declines in the Asia-Pacific region and Middle East. |
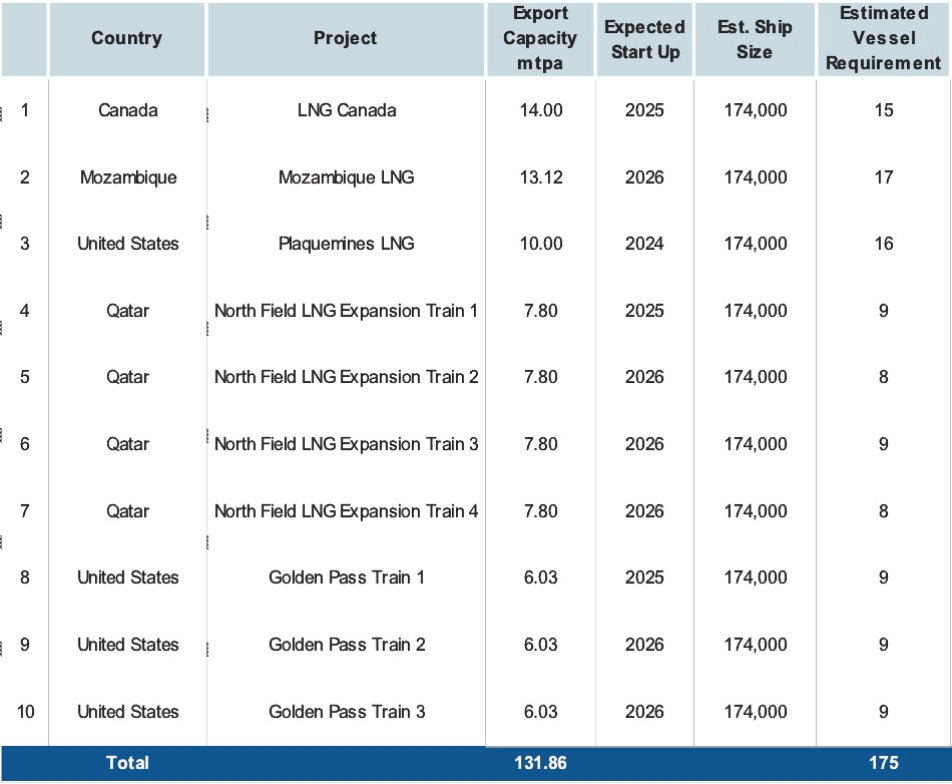
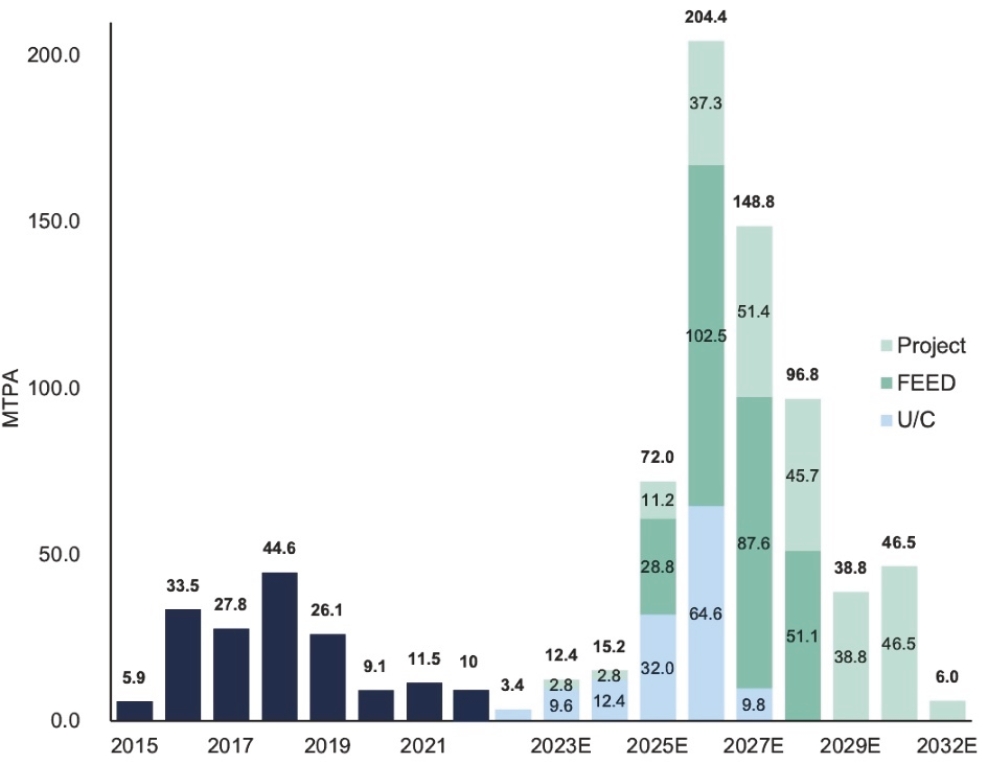
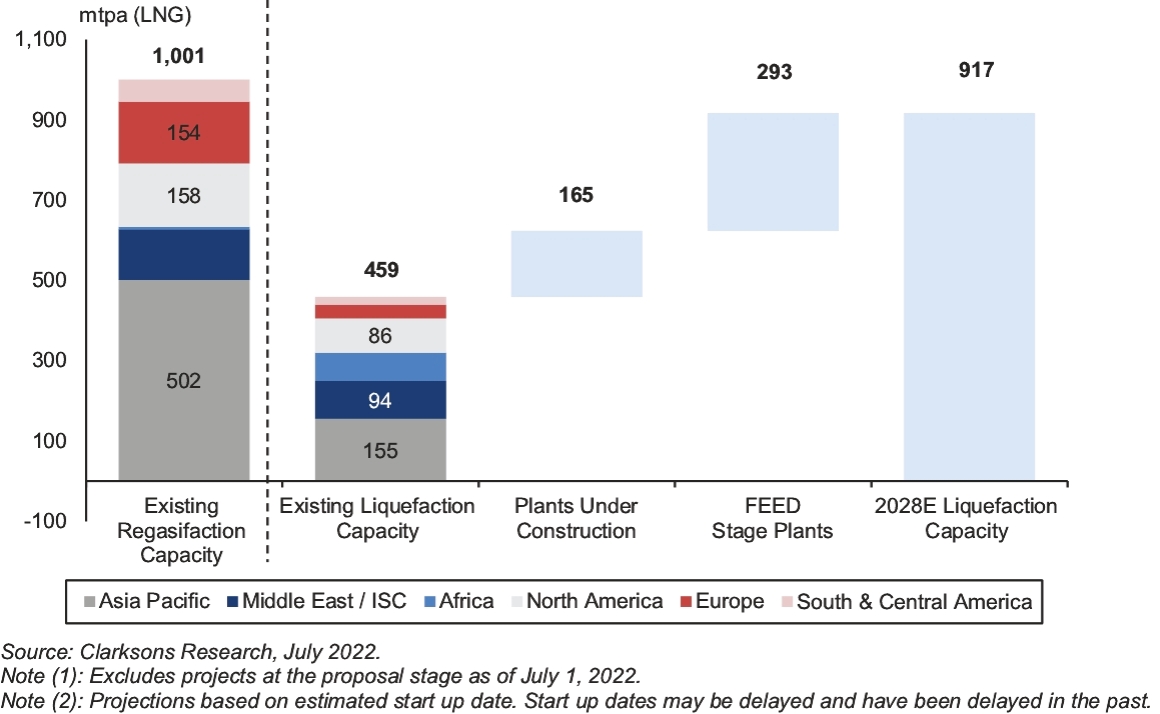
• | The demand for LNG shipping is experiencing significant growth. The transport of LNG has gained traction in recent years due to the flexibility and security that LNG offers over traditional pipeline trade, as well as the large distances between the supply and demand centers for natural gas. An increasing portion of natural gas traded (if not consumed in the producing region) is being transported in the form of LNG. LNG shipping has been increasing in importance over the last 20 years and, according to Clarksons Research, accounted for 41% of all natural gas traded in 2021, up sharply from 25% in 2000. Between 2001 and 2021, the volume of gas traded as LNG increased by a compound annual growth rate of 6.5% compared to 2.4% per annum for gas transported by pipeline over the same period. Planned capacity increases in liquefaction and regasification terminals are anticipated to increase export and import capacity significantly, requiring additional LNGCs to support trade activity. Based on the current project pipeline of liquefaction projects that are planned or under construction, a doubling in export liquefaction capacity is expected by 2028 from the current 459 mtpa (assuming |
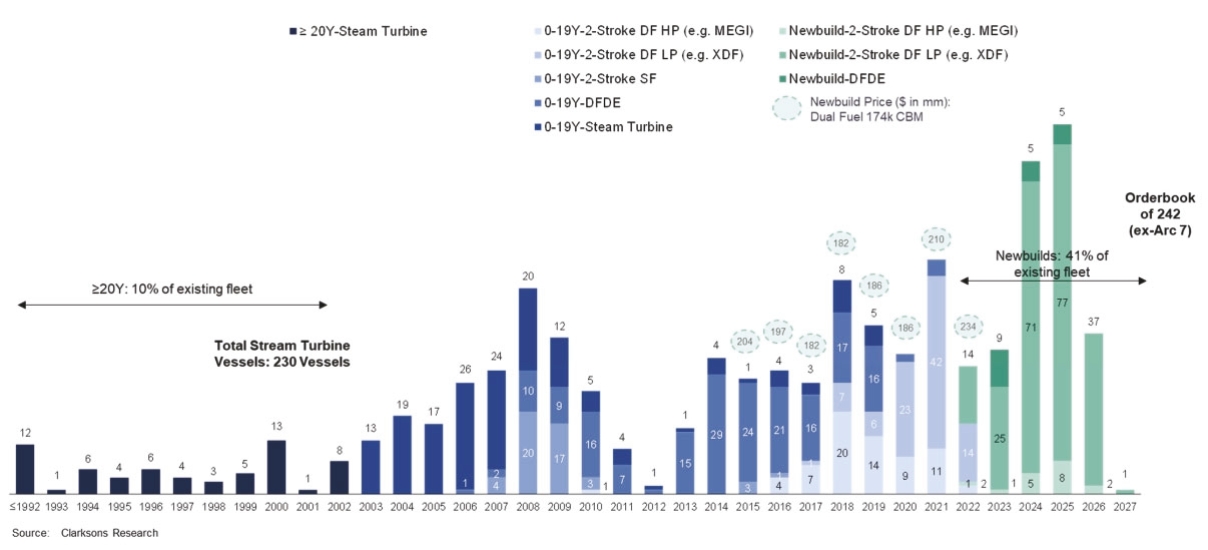
• | Industry preferences and regulatory standards favor more modern LNG vessels. We believe that significant barriers to entry exist in the LNG shipping industry, given the growing range of international environmental laws, regulations and treaties affecting the marine transportation industry, large capital requirements and the need for a high degree of technical management capabilities to operate vessels. Given such stringent requirements, we believe that charterers will continue to look to experienced technical operators with proven track records and strong reputations within the LNG shipping sector, including proof of high safety performance. According to Clarksons Research, it is estimated that 30%-40% of existing LNG shipping capacity is presently concentrated in older, steam turbine powered LNGCs, and it is anticipated that these vessels will continue to exit the market due to their lower efficiency and non-compliance with environmental standards that will be applicable beginning in 2023. The scrapping of some of these vessels is expected to add opportunities for CoolCo’s more modern vessels, and support a constructive LNGC rate environment. |
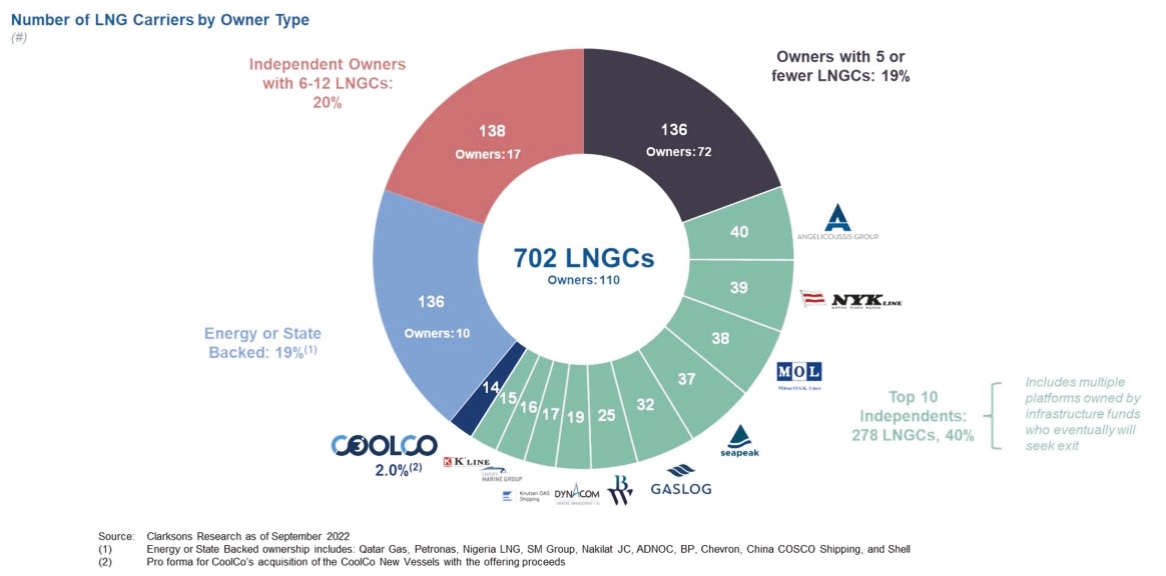
• | There is increasing ownership of the global LNGC fleet by independent owners. While fleet ownership in the LNG shipping industry has been historically characterized by a split between independent shipping companies and major energy and utility companies, independent owners have increased their share of the global LNGC fleet from approximately 43% in 2000, to 60% by October 2022. Given this trend, we believe private and state-owned energy companies will continue to seek high-quality independent owners for their growing LNG shipping requirements in the future, as they continue to divest non-core businesses (resulting in a reduction in the share of the LNG shipping fleet owned by such companies). |
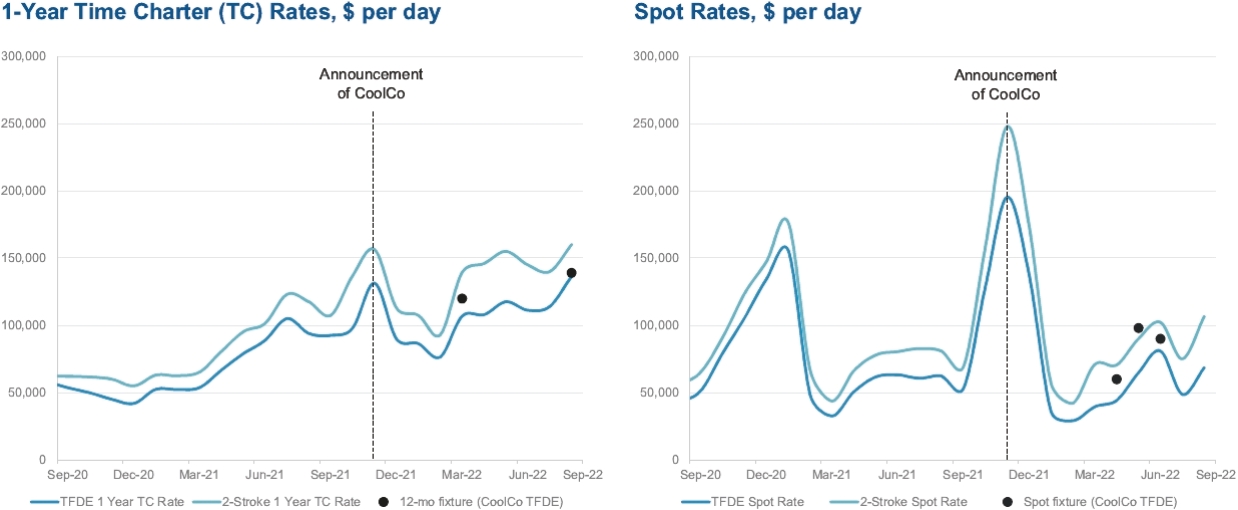
• | The charter market for LNG shipping contracts is at historically high levels. Current market trends allow owners to choose between longer- and shorter-term contracts and earn what we believe to be attractive rates. Such growth and development in the charter market has enabled owners to pursue a balanced chartering approach and strategy. |
• | Leading independent platform of LNGCs, benefitting from significant impact of strong industry shareholders. Our current fleet which includes the Acquisition Vessels is relatively young, with an average age of seven years, and includes no steam vessels. With the acquisition of the Acquisition Vessels, we are among the largest independent, publicly listed LNGC owners based on number of vessels, and our fleet size will increase if we exercise our option to purchase contracts to purchase the Newbuild Vessels. The option to acquire of the Newbuild Vessels provides for additional growth opportunities, particularly as the Newbuild Vessels will be delivered in 2025. |
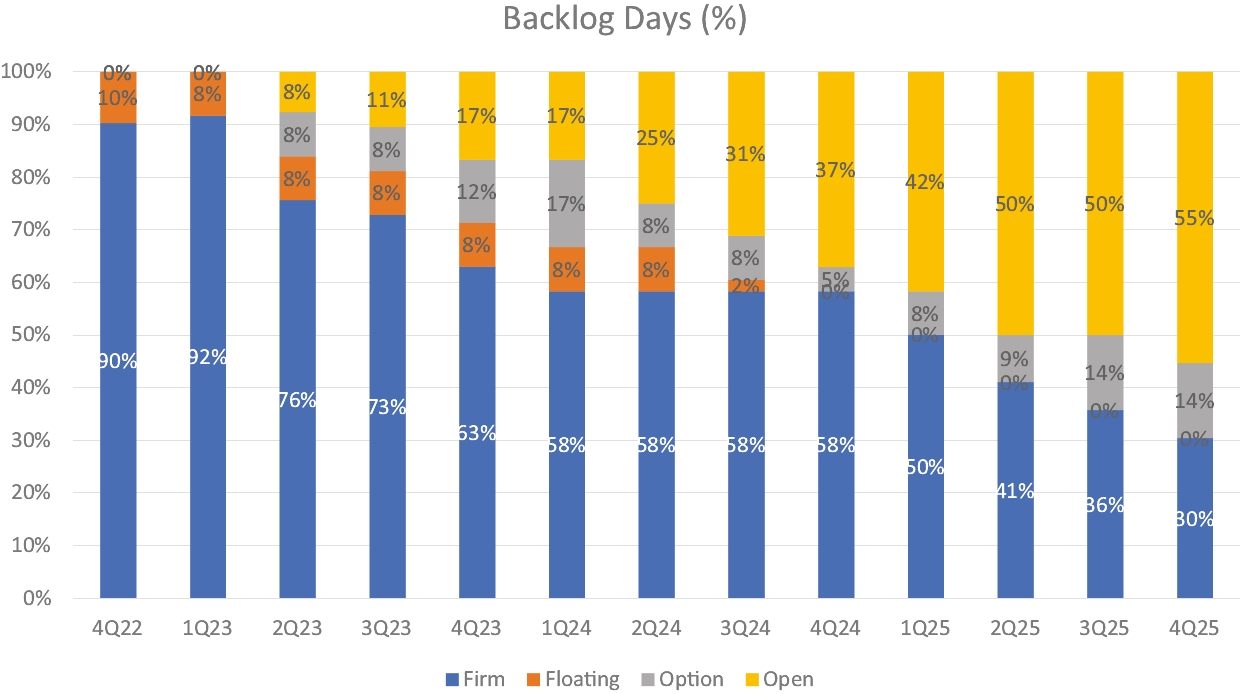
• | Balanced portfolio of secured charter arrangements. The time charters for the Original Vessels vary in duration and have staggered ending dates, with current terms that expire between 2022 and 2027, offering the potential for subsequent charters at improved rates. The charters on the Acquisition Vessels have staggered expiration dates, and the charterer has the option to extend. We believe our combination of near-term exposure to improved shipping rates and longer-term contracts represents a balanced portfolio optimized for risk and return. Since our Vessels operate under time charter contracts, voyage expenses such as bunker fuel, port charges and canal tolls are typically paid for by the charterer. |
• | Multiple growth opportunities. We believe that our operating experience, the scale of our ship management function and profile of our supportive shareholders gives us a unique industry presence that will provide us with a competitive advantage over other LNGC operators when competing for additional commercial opportunities in the growing LNG shipping sector. The acquisition of the Newbuild Vessels provides for additional growth, particularly as the Newbuild Vessels will be delivered in 2025. Due to the scale and sophistication of our established ship management operations, we expect to be able to effectively integrate these vessels and others into our fleet. We also believe that consolidation within the sector may provide future growth opportunities. |
• | In-house management company with a track record for efficiency, safety and operational performance. Our Vessels are technically managed through our wholly-owned subsidiary, Cool Company Management AS, which allows us to offer our customers high-quality performance, reliability and efficiency while maintaining a close control over operating costs. As the technical and commercial manager of our own Vessels and ships of third parties, we have developed significant experience and know-how in the operation of LNGCs and FSRUs. We provide comprehensive onboard training for our officers and crews. We believe that existing and prospective customers will continue to engage with our company for their chartering needs as a result of the combination of our safety track record, focus on efficiency, strong technical capabilities and reputation for high operating standards. The continued success of our in-house management company demonstrates our customers’ validation of our platform and service offerings. |
• | Experienced leadership team. Our leadership team and ship management personnel have extensive energy, shipping and LNG experience and a strong operational track record. In addition, our senior management and industry shareholders, have developed a broad network of relationships with major energy companies, leading LNG shipyards, global financial institutions and other key participants throughout the shipping industry. We believe these factors will collectively enhance our ability to attract new LNG business opportunities and implement our growth strategy. |
• | Capitalize on growing demand for LNG shipping. We believe that it is an opportune time to secure improved rates for our existing LNGCs and expand our fleet as demand for natural gas and LNG shipping is forecasted to grow. We expect that earnings generated from our Vessels will position us to capitalize on opportunities to meet the growing industry demand for LNG transportation. Furthermore, we aspire to become a capital markets leader offering investors pure-play LNG shipping exposure. We believe we present an attractive business proposition to public shareholders and investors as the LNG shipping industry has experienced multiple peers exiting the public capital markets by being taken private. |
• | Expand our fleet through accretive acquisitions. We intend to grow our current fleet through timely and selective acquisitions of additional vessels at attractive valuations, such as the Newbuild Vessels. In evaluating potential acquisitions, we consider and analyze, among other things, our expectation of fundamental developments in the LNG shipping industry, the level of liquidity in the resale and charter market, vessel condition, technology, expected remaining useful life and technical specifications, as well as the overall strategic positioning of our fleet and customer needs. We believe our industry reputation and relationships will allow us to further expand our owned fleet either through industry consolidation, additional newbuilds or through the acquisition of modern secondhand ships to the extent that such acquisitions are accretive to fleet quality and future returns. |
• | Pursue a balanced chartering strategy. Consistent with our chartering strategy aimed at outperforming sector benchmarks over time, our Vessels have a balanced portfolio of short- and long-term time charters. We believe that this strategy maximizes returns on our investments, while achieving cash-flow visibility aligned with our capital structure. When evaluating growth opportunities, we seek to assess the attractiveness of long and short-term employment opportunities to maximize returns in a risk-efficient manner. |
• | Provide high-quality customer service. Our safety and operational track records have played a pivotal role in fostering our existing customer relationships and, we believe, will be critical in attracting new customers. We seek to adhere to the highest standards with regards to safety, reliability, efficiency and operational excellence as we execute our fleet expansion plans. We will continue to be devoted to a “safety first” culture and will strive to minimize the environmental impact of our assets through technical innovation and strong operational competencies. We believe maintaining the highest safety and technical standards will give us greater commercial opportunities to service new and existing customers. |
• | Pursue a proactive approach to reducing emissions and increasing efficiency. Drawing on our in-house management experience and technical know-how, we have a strong commitment to reducing emissions and increasing efficiency. This includes the use of digitalization, upgrading vessels during scheduled drydocking maintenance and working in close collaboration with charterers on voyage optimization. CoolCo’s fleet is fully compliant with new Energy Efficiency Existing Index (“EEXI”) regulations with A or B Carbon Intensity Indicator (“CII”) efficiency ratings. Since charterers pay for bunker fuel under LNG charters, they benefit from efficiency savings on our Vessels, which makes these more attractive than less efficient vessels. |
• | Opportunistically seek to expand and diversify our customer base. We plan to maintain relationships with our current customer base and further cultivate relationships with a number of additional major energy companies, with an aim to supporting their growth programs and capitalizing on attractive opportunities these programs may offer. We will also explore opportunities to exploit our in-house commercial and technical management platform to assist and attract such customers. We believe our operational expertise, in combination with our reputation and track record in LNG shipping, positions us favorably to capture additional commercial growth opportunities in the LNG industry. |
Vessel Name | | | Cargo capacity / Containment system | | | Delivered | | | Yard | | | Boil-Off Rate (%) | | | Next dry-docking window |
Golar Bear | | | 160,000 Membrane (Mark III) | | | September 2014 | | | Samsung | | | 0.10% | | | 2024 |
Vessel Name | | | Cargo capacity / Containment system | | | Delivered | | | Yard | | | Boil-Off Rate (%) | | | Next dry-docking window |
Golar Crystal | | | 160,000 Membrane (Mark III) | | | May 2014 | | | Samsung | | | 0.10% | | | 2024 |
Golar Frost | | | 160,000 Membrane (Mark III) | | | October 2014 | | | Samsung | | | 0.10% | | | 2024 |
Golar Glacier | | | 162,000 Membrane (Mark III) | | | October 2014 | | | Hyundai | | | 0.10% | | | 2024 |
Golar Ice | | | 160,000 Membrane (Mark III) | | | February 2015 | | | Samsung | | | 0.10% | | | 2024 |
Golar Kelvin | | | 162,000 Membrane (Mark III) | | | January 2015 | | | Hyundai | | | 0.10% | | | 2024 |
Golar Seal | | | 160,000 Membrane (Mark III) | | | October 2013 | | | Samsung | | | 0.10% | | | 2023 |
Golar Snow | | | 160,000 Membrane (Mark III) | | | January 2015 | | | Samsung | | | 0.10% | | | 2024 |
Kool Orca | | | 174,000 Membrane (Mark III) | | | January 2021 | | | Hyundai Samho Heavy Industries | | | 0.085% | | | 2026 |
Kool Firn | | | 174,000 Membrane (Mark III) | | | September 2020 | | | Hyundai Samho Heavy Industries | | | 0.085% | | | 2025 |
Kool Boreas | | | 170,500 Membrane (NO96 Evo 2 GW) | | | January 2015 | | | STX Offshore & Shipbuilding Co. | | | 0.125% | | | 2025 |
Kool Baltic | | | 170,500 Membrane (NO96 Evo 2 GW) | | | April 2015 | | | STX Offshore & Shipbuilding Co. | | | 0.125% | | | 2025 |

| | | Q4 2022 | | | 2023 | | | 2024 | | | 2025 | |
Average fixed rate(1)(2) | | | $82,085 | | | $87,383 | | | $84,741 | | | $84,968 |
Average option rate | | | — | | | $61,297 | | | $67,807 | | | $72,869 |
Vessel days contracted at fixed rate | | | 852 | | | 3,315 | | | 2,562 | | | 1,915 |
Vessel days contracted at fixed rate (options) | | | — | | | 316 | | | 415 | | | 571 |
Contracted revenue (fixed rate only) ($ in thousands) | | | 69,937 | | | 289,675 | | | 217,107 | | | 162,714 |
Open and floating vessel days | | | 92 | | | 749 | | | 1,415 | | | 2,444 |
# of vessels(3) | | | 8 | | | 12 | | | 12 | | | 14 |
(1) | Data in this table is for our Vessels. It excludes the two vessels in the Cool Pool that we do not own, and it includes the Acquisition Vessels from January 1, 2023 and the Newbuild Vessels from January 1, 2025. |
(2) | We currently have seven Vessels on fixed rate charters and one Vessel on floating rate charter. This table assumes that the one Vessel currently on floating rate charter will remain on floating rate charter for all periods in this table. |
(3) | This table includes Acquisition Vessels from 2023 and Newbuild Vessels in 2025. Acquisition Vessels are on fixed rate charters for all periods in the table. The table assumes open days for the Newbuild Vessels in 2025. |
Vessel Name | | | Cargo capacity / Containment system | | | Delivered | | | Yard | | | Boil-Off Rate (%) | | | Next dry-docking window |
HHI#1 | | | 174,000 Membrane (Mark III) | | | January 2025 | | | Hyundai Samho Heavy Industries | | | 0.085% | | | N/A |
HHI#2 | | | 174,000 Membrane (Mark III) | | | February 2025 | | | Hyundai Samho Heavy Industries | | | 0.085% | | | N/A |

Vessel Name | | | Delivery Date | | | Capacity Cubic Meters | | | Type | | | Charterer/Pool Arrangement | | | Current Charter Expiration |
Golar Bear | | | September 2014 | | | 160,000 | | | LNGC membrane | | | Cool Pool | | | 2023 |
Golar Crystal | | | May 2014 | | | 160,000 | | | LNGC membrane | | | Cool Pool | | | 2023 |
Golar Frost | | | October 2014 | | | 160,000 | | | LNGC membrane | | | Cool Pool | | | 2027 |
Golar Glacier | | | October 2014 | | | 162,000 | | | LNGC membrane | | | Cool Pool | | | 2023 |
Golar Ice | | | February 2015 | | | 160,000 | | | LNGC membrane | | | Cool Pool | | | 2023 |
Golar Kelvin | | | January 2015 | | | 162,000 | | | LNGC membrane | | | Cool Pool | | | 2023 |
Golar Seal | | | October 2013 | | | 160,000 | | | LNGC membrane | | | Cool Pool | | | 2023 |
Golar Snow | | | January 2015 | | | 160,000 | | | LNGC membrane | | | Cool Pool | | | 2024 |
• | injury to, destruction or loss of, or loss of use of, natural resources and related assessment costs; |
• | injury to, or economic losses resulting from, the destruction of real and personal property; |
• | net loss of taxes, royalties, rents, fees or net profit revenues resulting from injury, destruction or loss of real or personal property, or natural resources; |
• | loss of subsistence use of natural resources that are injured, destroyed or lost; |
• | lost profits or impairment of earning capacity due to injury, destruction or loss of real or personal property or natural resources; and |
• | net cost of increased or additional public services necessitated by removal activities following a discharge of oil, such as protection from fire, safety or health hazards. |
a. | Ballast Water Management Convention |
b. | Clean Water Act |
c. | National Invasive Species Act |
• | The LNG industry is experiencing a significant expansion phase, with a recent focus on energy security building on a fundamental outlook for growth that is supported by Asian gas demand, energy transition dynamics and significant LNG export projects. |
• | LNG project programs could result in a doubling in current export liquefaction capacity (459 mtpa) by 2028, should capacity under construction (165 mtpa) and at FEED stage (293 mtpa) come online through 2028 as scheduled. |
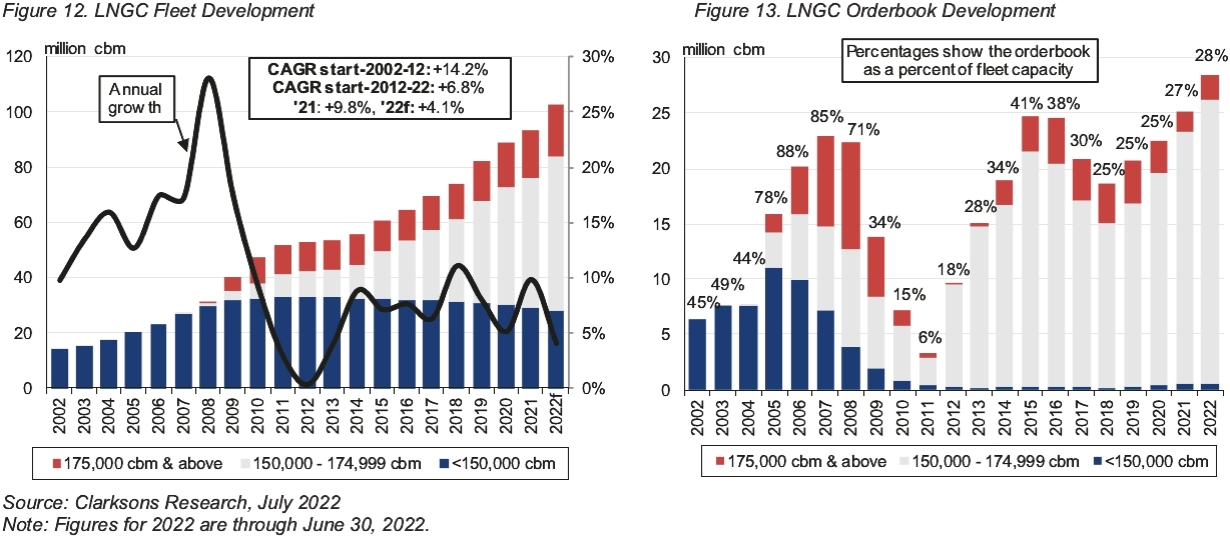
• | As of July 2022, the worldwide LNG shipping fleet is comprised of 696 vessels, with 32% of existing capacity concentrated in less efficient steam turbine vessels which are expected to be increasingly impacted by international and regional emission regulations. |
• | Strong newbuilding investment has increased the newbuilding orderbook to 40% of the existing LNG carrier fleet capacity (36% by number of vessels), with berth availability for new orders now restricted to 2025-2026 and newbuild prices increasing by 20% in the past 12 months. A proportion of this is effectively replacement capacity for steam vessels. |
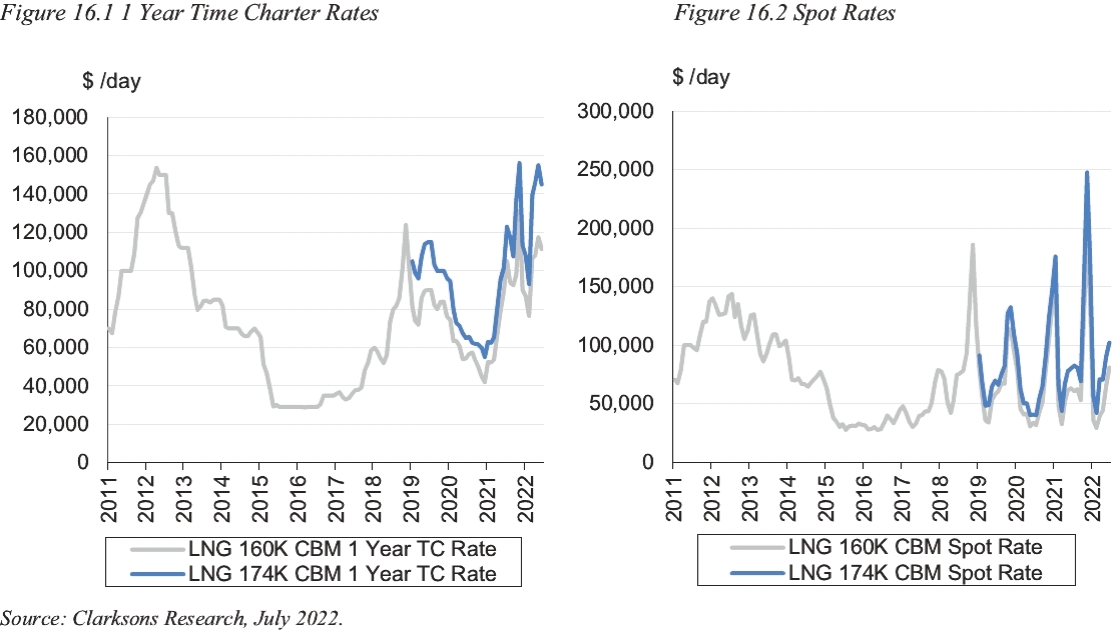
• | The charter market for multi-year contracts is at historically high levels, although there is some volatility in the short-term market. |

• | Liquefaction: Following the initial production of gas, natural gas is cooled to a temperature of -162ºC (-260ºF), which transforms it into a liquid. This reduces its volume to approximately 1/600th of its volume in a gaseous state and allows economical storage and transportation. |
• | Shipping: LNG is transported overseas from the liquefaction facility to the receiving terminal in specially designed LNGCs. |
• | Regasification: LNG is stored in specially designed facilities until regasified. LNG is returned to its gaseous state at a regasification facility, which can be located either onshore or aboard FSRUs. |
• | Distribution: Upon return to its gaseous state, the natural gas is transported to consumers through pipelines. |


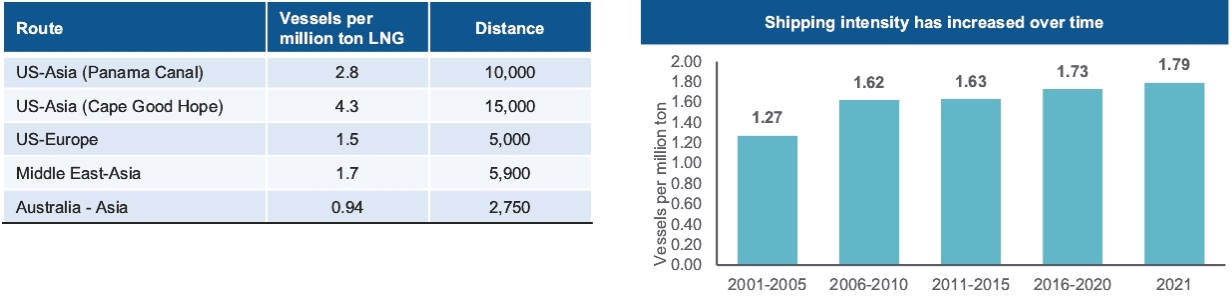
Figure 8. Vessels Required Per Million Tons of LNG Shipped | | | Figure 9. Shipping Intensity from 2001 to 2021 |


• | Vessels with two-stroke engines, typically with a carrying capacity of over 170,000 cubic meters (cbm). As of July 1, 2022, two-stroke vessels accounted for 37% of capacity in the LNGC fleet and 97% of capacity on order, with these vessels having gained popularity in recent years due to offering emissions reductions over other engine types. While all the two-stroke vessels on order are dual fuel vessels, there are 50 older single fuel two-stroke vessels in the fleet, which tend to be less carbon efficient than dual fuel vessels. |
• | Vessels with dual fuel diesel electric (DFDE) engines, typically with a carrying capacity of 150,000 to 170,000 cbm. As of July 1, 2022, DFDE vessels accounted for 30% of fleet capacity in the LNGC fleet and 3% of capacity on order. Although generally less efficient than 2-stroke vessels, DFDEs offer notable carbon emissions reductions over steam turbine powered LNGCs. |
• | Vessels with steam turbine engines, with a capacity less than 150,000 cbm. As of July 1, 2022, 32% of all LNGC capacity was powered by steam turbine engines (94% of this capacity being vessels smaller than 150,000 cbm), with these vessels generally being the least carbon efficient in the fleet due to the inability of these vessels to feed LNG fuel into the main engine, an older average age (17.8 years) and their use of Moss containment systems, which have a higher boil-off rate of LNG than more modern membrane containment systems. Due to the relative inefficiency and older average age of steam turbine vessels, increased scrapping of these vessels appears likely in the coming years, particularly following the implementation of key environmental regulation (e.g., EEXI, CII) from the start of 2023. |

| | | Fleet | | | Avg. Age | | | Orderbook | | | Orderbook as | |||||||||||||||||||
Size (CBM) | | | Number | | | % Of Total | | | CBM* | | | % Of Total | | | (Years) | | | Number | | | % Of Total | | | CBM* | | | % Of Total | | | % Of Fleet |
175,000+ | | | 92 | | | 13% | | | 18.8 | | | 18% | | | 8.5 | | | 24 | | | 9% | | | 4.5 | | | 11% | | | 23.9% |
150,000 – 174,999 | | | 343 | | | 49% | | | 57.5 | | | 55% | | | 5.8 | | | 211 | | | 83% | | | 36.7 | | | 88% | | | 63.9% |
<150,000 | | | 261 | | | 38% | | | 28.3 | | | 27% | | | 16.9 | | | 20 | | | 8% | | | 0.4 | | | | | 1.5% | |
Total | | | 696 | | | | | 104.6 | | | | | 10.3 | | | 255 | | | | | 41.6 | | | | | 39.8% | ||||
| | | Fleet | | | Avg. Age | | | Orderbook | | | Orderbook as | |||||||||||||||||||
Engine Type | | | Number | | | % Of Total | | | CBM* | | | % Of Total | | | (Years) | | | Number | | | % Of Total | | | CBM* | | | % Of Total | | | % Of Fleet |
Steam Turbine | | | 243 | | | 35% | | | 33.9 | | | 32% | | | 17.8 | | | | | | | | | | | |||||
Dual Fuel Diesel Electric (DFDE) | | | 203 | | | 29% | | | 31.8 | | | 30% | | | 7.6 | | | 10 | | | 4% | | | 0.7 | | | 2% | | | 2.3% |
2-S DF Low Pressure | | | 96 | | | 14% | | | 15.9 | | | 15% | | | 1.7 | | | 218 | | | 85% | | | 37.6 | | | 90% | | | 237.2% |
2-S DF High Pressure | | | 67 | | | 10% | | | 11.8 | | | 11% | | | 3.5 | | | 18 | | | 7% | | | 3.1 | | | 8% | | | 26.6% |
2-S Single Fuel | | | 50 | | | 7% | | | 10.8 | | | 10% | | | 13.0 | | | | | | | | | | | |||||
Other Type | | | 37 | | | 5% | | | 0.5 | | | 0% | | | 9.3 | | | 9 | | | 4% | | | 0.1 | | | 0.3% | | | 21.7% |
Total | | | 696 | | | | | 104.6 | | | | | 10.3 | | | 255 | | | | | 41.6 | | | | | 39.8% | ||||
* | In millions |


| | | NB Price | | | 5yo Price | | | 1 Yr Timecharter | | | Spot Rates | |||||||
| | | 174k CBM | | | 160k CBM | | | 160k CBM | | | 174k CBM | | | 160k CBM | | | 174k CBM | |
| | | $m | | | $m | | | $/day | | | $/day | | | $/day | | | $/day | |
2015 | | | 204 | | | 170 | | | 36,192 | | | | | 36,038 | | | ||
2016 | | | 197 | | | 163 | | | 31,104 | | | | | 33,528 | | | ||
2017 | | | 182 | | | 154 | | | 40,301 | | | | | 46,058 | | | ||
2018 | | | 182 | | | 158 | | | 77,396 | | | | | 88,692 | | | ||
2019 | | | 186 | | | 158 | | | 82,383 | | | 104,208 | | | 69,337 | | | 81,915 |
2020 | | | 186 | | | 145 | | | 56,250 | | | 68,183 | | | 59,269 | | | 71,173 |
2021 | | | 210 | | | 145 | | | 83,663 | | | 101,871 | | | 89,179 | | | 112,283 |
1H 2022 | | | 234 | | | 165 | | | 101,083 | | | 130,958 | | | 49,344 | | | 72,223 |
5 year avg | | | 190.79 | | | 154.00 | | | 74,612 | | | 97,069 | | | 71,189 | | | 85,720 |
10 year avg | | | 194.23 | | | 159.02 | | | 68,086 | | | | | 68,172 | | | ||


Organizational Structure |
Entity Name | | | Jurisdiction of Formation |
Golar Hull M2022 Corp. | | | Marshall Islands |
Golar LNG NB10 Corporation | | | Marshall Islands |
Golar Hull M2048 Corp. | | | Marshall Islands |
Golar LNG NB11 Corporation | | | Marshall Islands |
Golar Hull M2021 Corp. | | | Marshall Islands |
Golar Hull M2047 Corp. | | | Marshall Islands |
Golar Hull M2027 Corp. | | | Marshall Islands |
Golar LNG NB12 Corporation | | | Marshall Islands |
The Cool Pool Limited | | | Marshall Islands |
Cool Company Management d.o.o. | | | Croatia |
Cool Company Management AS | | | Norway |
Cool Company Management Ltd. | | | England and Wales |
CoolCo Management Sdn. bhd. | | | Malaysia |
Pernli Marine Ltd | | | Liberia |
Persect Marine Ltd | | | Liberia |
Felox Marine Ltd | | | Liberia |
Respent Marine Ltd | | | Liberia |
Property, Plants and Equipment |
UNRESOLVED STAFF COMMENTS |
OPERATING AND FINANCIAL REVIEW AND PROSPECTS |
Operating Results |
Vessels | | | 40 years |
Drydocking expenditure | | | 5 years |
Office equipment and fittings | | | 3 years |
• | LNGC vessel hire rates and the size of the global LNGC fleet as well as the newbuild order book and delivery and scrapping rates; |
• | the supply and demand for LNG shipping services, including the impact of greater competition in the LNG shipping market, and the number of vessels available in the short-term or spot LNGC charter market; |
• | the number of LNGCs in our owned and managed fleets; |
• | the acquisition of new vessels (and any financing thereof); |
• | the timely delivery of our newbuilds under construction and any delays to the shipbuilding process; |
• | the reliance on subcontractors and their progress in constructing newbuild vessels; |
• | the timing and duration of drydocking and any delays thereof; |
• | our ability to obtain acceptable financing in respect of our capital and financing and refinancing commitments and needs; |
• | our ability to maintain good working relationships with our existing charterers and our customers whose fleets we manage and our ability to increase the number of our customers and charterers through the development of new working relationships; |
• | the performance of our charterers and our customers whose fleets we manage; |
• | our ability to employ our Vessels, and other vessels that we acquire, at economically attractive rates; |
• | the effective and efficient technical and operational management of our Vessels and those of our customers whose fleets we manage; |
• | our ability to maintain the recruitment and retention of appropriately qualified seafarers and shore staff; |
• | our ability to obtain and maintain regulatory approvals and to satisfy technical, health, safety and compliance standards that meet our customers’ requirements; and |
• | economic, regulatory, political and governmental conditions that affect the LNG market and LNG shipping industries, which include geopolitical factors such as the imposition of trade tariffs and changes in the number of new LNG importing countries and regions, as well as structural LNG market changes impacting LNG supply and demand. |
• | the hire rate earned by our Vessels, including any of our Vessels that may trade in the short-term or spot market if we are unable to secure new time charter agreements; |
• | unscheduled off-hire days; |
• | the fees we receive for commercial and technical ship management services; |
• | the level of our ship operating expenses, including the costs of crewing, insurance and maintenance; |
• | our level of debt, the related interest expense and the timing of required payments of principal; and |
• | the level of our administrative expenses, including salaries and costs of consultants. |
| | | Year Ended December 31, | ||||
(in thousands of $) | | | Predecessor 2021 | | | Predecessor 2020 |
Net income | | | 48,368 | | | 32,384 |
Income taxes | | | 222 | | | 353 |
Depreciation and amortization | | | 43,389 | | | 44,328 |
Interest income | | | (7) | | | (70) |
Interest expense | | | 18,087 | | | 26,953 |
Other financial items | | | 380 | | | 895 |
Adjusted EBITDA | | | 110,439 | | | 104,843 |
| | | Nine Months Ended September 30, | ||||||||||
(in thousands of $, except operating days less scheduled off-hire days and average daily TCE rate) | | | Successor | | | Predecessor | | | Non-U.S. GAAP Combined(1) 2022 | | | Predecessor 2021 |
Time and voyage charter revenues | | | 104,535 | | | 37,289 | | | 141,824 | | | 119,323 |
Less: Voyage, charter hire and commission expenses, net | | | (1,212) | | | (1,229) | | | (2,441) | | | (2,443) |
Time and voyage charter revenues, net | | | 103,323 | | | 36,060 | | | 139,383 | | | 116,880 |
Operating days less scheduled off-hire days | | | 1,553 | | | 631 | | | 2,184 | | | 2,165 |
Average daily TCE rate (to closest $100) | | | 66,500 | | | 57,100 | | | 63,800 | | | 54,000 |
(1) | The combined results are not in accordance with U.S. GAAP and consists of the aggregate of selected financial data of the Successor and Predecessor periods. No other adjustments have been made to the combined presentation. |
| | | Year Ended December 31, | ||||
(in thousands of $, except operating days less scheduled off-hire days and average daily TCE rate) | | | Predecessor 2021 | | | Predecessor 2020 |
Time and voyage charter revenues | | | 161,958 | | | 164,740 |
Less: Voyage, charter hire and commission expenses, net | | | (709) | | | (11,228) |
Time and voyage charter revenues, net | | | 161,249 | | | 153,512 |
Operating days less scheduled off-hire days | | | 2,901 | | | 2,928 |
Average daily TCE rate (to closest $100) | | | 55,600 | | | 52,400 |
| | | Nine Months Ended September 30, | | | | | ||||||||||||
(in thousands of $, except average daily TCE rate) | | | Successor(1) | | | Predecessor(1) | | | Non-U.S. GAAP Combined(2) 2022 | | | Predecessor 2021 | | | Change | | | % Change |
Time and voyage charter revenues | | | 104,535 | | | 37,289 | | | 141,824 | | | 119,323 | | | 22,501 | | | 19% |
Vessel and other management fee revenues | | | 3,684 | | | 6,167 | | | 9,851 | | | 5,950 | | | 3,901 | | | 66% |
Amortization of intangible assets and liabilities arising from charter agreements, net | | | 14,504 | | | — | | | 14,504 | | | — | | | 14,504 | | | 100% |
Total operating revenues | | | 122,723 | | | 43,456 | | | 166,179 | | | 125,273 | | | 40,906 | | | — |
| | | | | | | | | | | | | |||||||
Vessel operating expenses | | | (24,781) | | | (7,706) | | | (32,487) | | | (36,021) | | | 3,534 | | | (10)% |
Voyage, charter hire and commission expenses, net | | | (1,212) | | | (1,229) | | | (2,441) | | | (2,443) | | | 2 | | | —% |
Administrative expenses | | | (6,262) | | | (5,422) | | | (11,684) | | | (12,810) | | | 1,126 | | | (9)% |
Depreciation and amortization | | | (28,413) | | | (5,745) | | | (34,158) | | | (32,553) | | | (1,605) | | | 5% |
Other operating income | | | — | | | 4,374 | | | 4,374 | | | 5,020 | | | (646) | | | (13)% |
Interest income | | | 389 | | | 4 | | | 393 | | | 4 | | | 389 | | | 9725% |
Interest expense | | | (15,172) | | | (4,725) | | | (19,897) | | | (16,799) | | | (3,098) | | | 18% |
Gains on derivative instruments | | | 9,527 | | | — | | | 9,527 | | | — | | | 9,527 | | | 100% |
Other financial items, net | | | (2,227) | | | 622 | | | (1,605) | | | (293) | | | (1,312) | | | 448% |
Income taxes | | | (141) | | | (385) | | | (526) | | | (158) | | | (368) | | | 233% |
| | | | | | | | | | | | | |||||||
Other Financial Data: | | | | | | | | | | | | | ||||||
Total time and voyage charter revenues minus voyage, charterhire and commission expenses, net | | | 103,323 | | | 36,060 | | | 139,383 | | | 116,880 | | | 22,503 | | | 19% |
Operating days less scheduled off-hire days | | | 1,553 | | | 631 | | | 2,184 | | | 2,165 | | | 19 | | | 1% |
Average daily TCE rate(3) (to the closest $100) | | | 66,500 | | | 57,100 | | | 63,800 | | | 54,000 | | | 9,800 | | | 18% |
(1) | The commencement of operations and funding of CoolCo and its acquisition of the eight TFDE LNG carriers, The Cool Pool Limited and the shipping and FSRU management organization from Golar was completed in phases. It commenced with the funding of CoolCo on January 27, 2022 and concluded with the acquisition of the LNG carrier and FSRU management organization on June 30, 2022, with vessel acquisitions taking place on different dates over that period. Results for the nine months that commenced January 1, 2022 and ended September 30, 2022 have therefore been split between (i) the period prior to the funding of CoolCo and various phased acquisitions (i.e., the “Predecessor” period) and (ii) the period subsequent to the various phased acquisitions of such vessels and management entities (i.e., the “Successor” period). |
(2) | The combined results are not in accordance with U.S. GAAP and consists of the aggregate of selected financial data of the Successor and Predecessor periods. No other adjustments have been made to the combined presentation. |
(3) | Average daily TCE rate is a non-U.S. GAAP financial measure and is calculated by taking the total time and voyage charter revenues minus voyage, charterhire and commission expenses, net divided by operating days during a reporting period. Operating days are calculated on a vessel-by-vessel basis and represent the calendar days in a given period that a vessel is in our possession less off-hire days as a result of scheduled repairs, scheduled dry docking or special or intermediate surveys and scheduled lay-ups. See “– How We Evaluate our Operations – Time charter equivalent (or “TCE“) rate”. |
(in thousands of $, except operating days less scheduled off-hire days and average daily TCE rate) | | | Predecessor 2021 | | | Predecessor 2020 | | | Change | | | % Change |
Time and voyage charter revenues | | | 161,958 | | | 164,740 | | | (2,782) | | | (2)% |
Vessel and other management fee revenues | | | 9,961 | | | 7,820 | | | 2,141 | | | 27% |
Total operating revenues | | | 171,919 | | | 172,560 | | | (641) | | | — |
| | | | | | | | | |||||
Vessel operating expenses | | | (48,048) | | | (45,314) | | | (2,734) | | | 6% |
Voyage, charter hire and commission expenses, net | | | (709) | | | (11,228) | | | 10,519 | | | (94)% |
Administrative expenses | | | (17,743) | | | (14,437) | | | (3,306) | | | 23% |
Depreciation and amortization | | | (43,389) | | | (44,328) | | | 939 | | | (2)% |
Other operating income | | | 5,020 | | | 3,262 | | | 1,758 | | | 54% |
Interest income | | | 7 | | | 70 | | | (63) | | | (90)% |
Interest expense | | | (18,087) | | | (26,953) | | | 8,866 | | | (33)% |
Other financial items | | | (380) | | | (895) | | | 515 | | | (58)% |
Income taxes | | | (222) | | | (353) | | | 131 | | | (37)% |
Net Income | | | 48,368 | | | 32,384 | | | 15,984 | | | 49% |
| | | | | | | | | |||||
Other Financial Data: | | | | | | | | | ||||
Adjusted EBITDA(1) | | | 110,439 | | | 104,843 | | | 5,596 | | | 5% |
Total time and voyage charter revenues minus voyage, charter hire and commission expenses, net | | | 161,249 | | | 153,512 | | | 7,737 | | | 5% |
Operating days less scheduled off-hire days | | | 2,901 | | | 2,928 | | | (27) | | | (1)% |
Average daily TCE rate(2) (to the closest $100) | | | 55,600 | | | 52,400 | | | 3,200 | | | 6% |
(1) | Adjusted EBITDA is a non-GAAP financial measure. Please see “– How We Evaluate Our Operations – Adjusted EBITDA”. |
(2) | Average daily TCE rate is a non-GAAP financial measure. Please see “– How We Evaluate Our Operations – Time charter equivalent (or “TCE”) rate”. |
• | a $12.6 million decrease in revenue from the Original Vessels (apart from the Golar Ice) for the year ended December 31, 2021 compared to the year ended December 31, 2020, due to lower charterhire rates for our Original Vessels; |
• | a partial offset by a $10.9 million increase in revenue from the Golar Ice due to: (i) 16 fewer off-hire days of 53 days in the year ended December 31, 2021 compared to 69 days in the year ended December 31, 2020 following her engine breakdown; and (ii) higher daily charter hire rates in the year ended December 31, 2021, compared to the year ended December 31, 2020. |
• | a net profit share of $6.0 million recognized for the year ended December 31, 2021 compared to a net expense share of $3.5 million in the year ended December 31, 2020, from the pooling arrangement; |
• | a $1.3 million reduction in voyage expenses relating to the chartering of an external vessel; and |
• | partially offset by a $1.1 million increase in bunker consumption while the Golar Ice was off-hire following the replacement of her engine in the yard in the year ended December 31, 2021. |
• | a $1.8 million increase in operating costs of the Golar Ice due to the purchase of a replacement engine in the year ended December 31, 2021. There was no comparable cost in the year ended December 31, 2020; and |
• | a $1.2 million increase in management fees recharged by Golar in the year ended December 31, 2021. |
• | a $2.1 million increase in salary costs in the management companies in the year ended December 31, 2021 compared to the year ended December 31, 2020; and |
• | a $1.7 million increase in corporate cost allocation. Administrative expenses were carved out from Golar’s administrative expenses and were allocated to us based on a weighted size of our vessel fleet in proportion to Golar’s entire fleet. |
Liquidity and Capital Resources |
| | | Nine Months ended September 30, | ||||||||||
(in thousands of $) | | | Successor(1) | | | Predecessor(1) | | | Non-U.S. GAAP Combined(2) 2022 | | | Predecessor 2021 |
Net cash provided by operating activities | | | 71,699 | | | 27,101 | | | 98,800 | | | 75,982 |
Net cash (used in) / provided by investing activities | | | (218,276) | | | — | | | (218,276) | | | 44 |
Net cash provided by / (used in) financing activities | | | 194,399 | | | (54,111) | | | 140,288 | | | (65,802) |
Net increase (decrease) in cash, cash equivalents and restricted cash | | | 47,822 | | | (27,010) | | | 20,812 | | | 10,224 |
Cash, cash equivalents and restricted cash at beginning of year | | | 50,892 | | | 77,902 | | | 77,902 | | | 57,945 |
Cash, cash equivalents and restricted cash at end of year | | | 98,714 | | | 50,892 | | | 98,714 | | | 50,892 |
(1) | Refer to footnote below financial and operating results table for basis of presentation of the Successor and Predecessor periods. |
(2) | The combined results are not in accordance with U.S. GAAP and consists of the aggregate of selected financial data of the Successor and Predecessor periods. No other adjustments have been made to the combined presentation. |
• | higher revenue contribution recognized from our participation in the Cool Pool due to higher utilization and charter rates from our vessels for the nine month period ended September 30, 2022, compared to the same period in 2021; and |
• | the improvement in the general timing of working capital for the nine month period ended September 30, 2022, compared to the same period in 2021. |
• | $570.0 million proceeds from the senior secured sustainability term loan facility, which refinanced six of the eight vessels acquired from Golar; |
• | $269.5 million net proceeds from equity raise as part of the Private Placement completed during the Successor period. |
• | $556.3 million debt repayments, which includes $498.8 million repayments made by our lessor VIE‘s to terminate five out of the seven sale and leaseback facilities during the Predecessor period; and |
• | $136.4 million repayments of Parent’s funding during the Predecessor period |
| | | Year ended December 31, | ||||
(in thousands of $) | | | Predecessor 2021 | | | Predecessor 2020 |
Net cash provided by operating activities | | | 110,378 | | | 85,057 |
Net cash used in investing activities | | | (41) | | | (51) |
Net cash used in financing activities | | | (90,380) | | | (85,996) |
Net increase (decrease) in cash, cash equivalents and restricted cash | | | 19,957 | | | (990) |
Cash, cash equivalents and restricted cash at beginning of year | | | 57,945 | | | 58,935 |
Cash, cash equivalents and restricted cash at end of year | | | 77,902 | | | 57,945 |
• | higher contribution recognized from our participation in the Cool Pool due to higher utilization and charter rates from the vessels in the pool collectively for the year ended December 31, 2021, compared to the year ended December 31, 2020; and |
• | the improvement in the general timing of working capital for the year ended December 31, 2021, compared to the same period in 2020. |
• | $156.4 million of scheduled debt repayments, which includes repayments made by our lessor VIEs (see note 5 “Variable Interest Entities” of our Audited Financial Statements included elsewhere herein); and |
• | $0.5 million of financing costs paid. |
• | $10.4 million of proceeds in borrowings made by our lessor VIEs (see note 5 “Variable Interest Entities” of our Audited Financial Statements included elsewhere herein); and |
• | $56.1 million in contributions from equity. |
• | $173.7 million of scheduled debt repayments, which includes repayments made by our lessor VIEs (see note 5 “Variable Interest Entities” of our Audited Financial Statements included elsewhere herein); |
• | $15.3 million in repayments of equity; and |
• | $1.8 million of financing costs paid. |
Vessel | | | Effective from | | | Lessor | | | Sales value (in $ millions) | | | Lease duration | | | First repurchase option (in $ millions) | | | Date of first repurchase option | | | Net repurchase obligation at the end of lease term (in $ millions) | | | End of lease term |
Golar Ice | | | February 2015 | | | ICBCL | | | 204.0 | | | 10 years | | | 173.8 | | | February 2020 | | | 71.0 | | | January 2025 |
Golar Kelvin | | | January 2015 | | | ICBCL | | | 204.0 | | | 10 years | | | 173.8 | | | January 2020 | | | 71.0 | | | January 2025 |
• | trading restrictions limiting the use of the chartered vessel to the transportation of LNG; |
• | the right to replace the commercial or technical manager of the vessel with the Owners’ prior consent and the Owner’s right to request the replacement of the technical or commercial manager; |
• | the requirement to keep the vessels insured during the charter period; |
• | the obligation to effect repairs and settle any costs associated with repair of the vessels that are not settled under the insurance agreements; |
• | restrictions on the SPVs using the vessels as a lien, though the Owners have a lien against all cargoes, sub-hires and sub-freights which belong to the SPVs; |
• | restrictions on assignment of the bareboat charter; and |
• | termination events, such as non-payment, a breach of obligations under the charter that remains unremedied after the expiry of a 30 business day notice from the Owner, a failure to pay or an |
| | | Successor | |||||||||||||
(in millions of $) | | | Total Obligation | | | Remainder of 2022 | | | Due in 2023 - 2024 | | | Due in 2025-2026 | | | Due Thereafter |
CoolCo short-term and long-term debt | | | 550.3 | | | 9.8 | | | 79.0 | | | 79.0 | | | 382.5 |
VIE short-term and long-term debt | | | 113.0 | | | 113.0 | | | — | | | — | | | — |
Interest commitments on long-term debt | | | 130.9 | | | 8.6 | | | 65.5 | | | 52.8 | | | 4.0 |
Operating lease obligations | | | 0.7 | | | 0.3 | | | 0.4 | | | — | | | — |
Total | | | 794.9 | | | 131.7 | | | 144.9 | | | 131.8 | | | 386.5 |
• | being permitted to provide only two years of audited financial statements in this registration statement, in addition to any required unaudited interim financial statements, with correspondingly reduced “Item 5. Operating and Financial Review and Prospects” disclosure; |
• | not being required to comply with the auditor attestation requirements in the assessment of our internal control over financial reporting under the Sarbanes-Oxley Act, for up to five years or until we no longer qualify as an emerging growth company; and |
• | not being required to comply with any requirement that may be adopted by the Public Company Accounting Oversight Board regarding mandatory audit firm rotation or a supplement to the auditor’s report providing additional information about the audit and the financial statements. |
• | the sections of the Exchange Act regulating the solicitation of proxies, consents or authorizations in respect of a security registered under the Exchange Act; |
• | the sections of the Exchange Act requiring insiders to file public reports of their ownership of common shares and trading activities and liability for insiders who profit from trades made in a short period of time; and |
• | the rules under the Exchange Act requiring the filing with the SEC of quarterly reports on Form 10-Q containing unaudited financial and other specified information, or current reports on Form 8-K, upon the occurrence of specified significant events. |
Research and Development, Patents and Licenses, etc. |
Trend Information |
Critical Accounting Estimates |
DIRECTORS, SENIOR MANAGEMENT AND EMPLOYEES |
Directors and Senior Management |
Name | | | Age | | | Position |
Richard Tyrrell | | | 49 | | | Chief Executive Officer |
Johannes P. Boots | | | 60 | | | Chief Financial Officer |
Cyril Ducau | | | 43 | | | Chairman of the Board |
Peter Anker | | | 64 | | | Director |
Antoine Bonnier | | | 39 | | | Director |
Neil Glass | | | 61 | | | Director |
Mi Hong Yoon | | | 51 | | | Director |
Compensation of Directors and Executive Officers |
| | | Number of Share Options Granted | | | Number of Restricted Stock Units Granted | |
Richard Tyrrell | | | 371,227 | | | 7,591 |
Johannes P. Boots | | | 123,742 | | | 3,916 |
Cyril Ducau | | | 49,497 | | | — |
Peter Anker | | | 49,497 | | | — |
Antoine Bonnier | | | 49,497 | | | — |
Neil Glass | | | 49,497 | | | — |
Mi Hong Yoon | | | 49,497 | | | |
Total | | | 742,454 | | | 11,507 |
Board Practices |
• | a duty to act in good faith in the best interests of the company; |
• | a duty not to make a personal profit from opportunities that arise from the office of director; |
• | a duty to avoid conflicts of interest; and |
• | a duty to exercise powers for the purpose for which such powers were intended. |
MAJOR SHAREHOLDERS AND RELATED PARTY TRANSACTIONS |
Major Shareholders |
• | each person, or group of affiliated persons, known by us to own beneficially 5% or more of our outstanding ordinary shares; |
• | each of our executive officers and members of our board of directors; and |
• | all of our executive officers and members of our board of directors as a group. |
| | | Number of Ordinary Shares Beneficially Owned | | | Percentage of Ordinary Shares Beneficially Owned | |
Executive Officers and Board Members | | | | | ||
Richard Tyrrell | | | 3,141 | | | * |
Johannes P. Boots | | | — | | | — |
Cyril Ducau | | | — | | | — |
Peter Anker | | | 100,000 | | | * |
Antoine Bonnier | | | — | | | — |
Neil Glass | | | — | | | — |
Mi Hong Yoon | | | — | | | — |
All Executive Officers and Board Members as a Group (7 individuals) | | | 103,141 | | | * |
| | | | | |||
5% Shareholders | | | | | ||
EPS Ventures Ltd.(2) | | | 26,831,737 | | | 49.9% |
Golar LNG Limited(3) | | | 4,463,846 | | | 8.3% |
(1) | The 26,831,737 common shares of Cool Company Ltd. are legally and beneficially owned by EPS Ventures Ltd, which is a wholly-owned subsidiary of Quantum Pacific Shipping Limited. The indirect ultimate owner of Quantum Pacific Shipping Limited is a discretionary trust in which Mr. Idan Ofer is the beneficiary. |
(2) | Golar LNG Limited is a Bermuda corporation whose common shares are listed on the Nasdaq Global Select Market. |
* | Represents ownership of less than 1% of our outstanding common shares. |
Related Party Transactions |
• | the amounts involved exceeded or will exceed $120,000; and |
• | any of our directors, executive officers or beneficial holders of more than 5% of any class of our share capital had or will have a direct or indirect material interest. |
• | any person who is, or at any time since the beginning of the Company’s last fiscal year was, a director or executive officer of the Company or a nominee to become a director of the Company; |
• | any person who is known to be the beneficial owner of more than 5% of any class of the Company’s voting securities; |
• | any immediate family member of any of the foregoing persons; and |
• | any firm, corporation or other entity in which any of the foregoing persons is employed or is a partner or principal or in a similar position or in which such person has a 5% or greater beneficial ownership interest. |
Interests of Experts and Counsel |
FINANCIAL INFORMATION |
Consolidated Statements and Other Financial Information |
Significant Changes |
THE OFFER AND LISTING |
Offering and Listing Details |
Plan of Distribution |
Markets |
Selling Shareholders |
Dilution |
Expenses of the Issue |
ADDITIONAL INFORMATION |
Share Capital |
Memorandum and Articles of Association |
Bermuda | | | Delaware | ||||||||||||
Shareholder meetings | |||||||||||||||
– | | | May be called by the Board of Directors and must be called upon the request of shareholders holding not less than 10% of the paid-up capital of the company carrying the right to vote at general meetings. | | | – | | | May be held at such time or place as designated in the certificate of incorporation or the bylaws, or if not so designated, as determined by the board of directors. | ||||||
– | | | May be held in or outside Bermuda. | | | – | | | May be held in or outside of Delaware. | ||||||
– | | | Notice: | | | – | | | Notice: | ||||||
| | | – | | | Shareholders must be given at least five days’ advance notice of a general meeting, but the accidental omission to give notice to any person does not invalidate the proceedings at a meeting. | | | | | – | | | Written notice shall be given not less than 10 nor more than 60 days before the meeting. | ||
| | | – | | | Notice of general meetings must specify the place, the day and hour of the meeting and in the case of special general meetings, the general nature of the business to be considered. | | | | | – | | | Whenever shareholders are required to take any action at a meeting, a written notice of the meeting shall be given which shall state the place, if any, date and hour of the meeting, and the means of remote communication, if any. | ||
Shareholder’s voting rights | |||||||||||||||
– | | | Shareholders may act by written consent to elect directors or appoint an auditor. Shareholders may not act by written consent to remove a director or auditor. | | | – | | | With limited exceptions, shareholders may act by written consent to elect directors. | ||||||
– | | | Generally, except as otherwise provided in the bye-laws, or the Companies Act, any action or resolution requiring approval of the shareholders may be passed by a simple majority of votes cast. Any person authorized to vote may authorize another person or persons to act for him or her by proxy, provided the instrument appointing the proxy is in the form specified by the bye-laws or such other form as the board of directors may determine. | | | – | | | Any person authorized to vote may authorize another person or persons to act for him or her by proxy. | ||||||
– | | | The voting rights of shareholders are regulated by the company’s bye-laws and, in certain circumstances, by the Companies Act. The bye-laws may specify the number to constitute a quorum and if the bye-laws permit, a general meeting of the shareholders of a company may be held with only one individual present if the requirement for a quorum is satisfied. | | | – | | | For stock corporations, the certificate of incorporation or bylaws may specify the number to constitute a quorum, but in no event shall a quorum consist of less than one-third of shares entitled to vote at a meeting. In the absence of such specifications, a majority of shares entitled to vote shall constitute a quorum. | ||||||
– | | | Our bye-laws provide that when a quorum is once present in general meeting it is not broken by the subsequent withdrawal of any shareholders. | | | – | | | When a quorum is once present to organize a meeting, it is not broken by the subsequent withdrawal of any shareholders. | ||||||
– | | | The bye-laws may provide for cumulative voting, although our bye-laws do not. | | | – | | | The certificate of incorporation may provide for cumulative voting. | ||||||
– | | | The amalgamation or merger of a Bermuda company with another company or corporation (other than certain affiliated companies) requires the | | | – | | | Any two or more corporations existing under the laws of the state may merge into a single corporation pursuant to a board resolution and | ||||||
Bermuda | | | Delaware | ||||||||||||
| | | amalgamation or merger agreement to be approved by the company’s Board of Directors and by its shareholders. Unless the company’s bye-laws provide otherwise, the approval of 75% of the shareholders voting at such meeting is required to approve the amalgamation or merger agreement, and the quorum for such meeting must be two or more persons holding or representing more than one-third of the issued shares of the company. | | | | | upon the majority vote by shareholders of each constituent corporation at an annual or special meeting. | ||||||||
– | | | Subject to its bye-laws, a company may at any meeting of its Board of Directors sell, lease or exchange all or substantially all of its property and assets as its Board of Directors deems expedient and in the best interests of the company to do so. | | | – | | | Every corporation may at any meeting of the board sell, lease or exchange all or substantially all of its property and assets as its board deems expedient and for the best interests of the corporation when so authorized by a resolution adopted by the holders of a majority of the outstanding stock of a corporation entitled to vote. | ||||||
– | | | Any company which is the wholly-owned subsidiary of a holding company, or one or more companies which are wholly-owned subsidiaries of the same holding company, may amalgamate or merge without the vote or consent of shareholders in accordance with the Companies Act, provided that the approval of the Board of Directors is obtained and that a director or officer of each such company signs a statutory solvency declaration in respect of the relevant company. | | | – | | | Any corporation owning at least 90% of the outstanding shares of each class of another corporation may merge the other corporation into itself and assume all of its obligations without the vote or consent of shareholders; however, in case the parent corporation is not the surviving corporation, the proposed merger shall be approved by a majority of the outstanding stock of the parent corporation entitled to vote at a duly called shareholder meeting. | ||||||
– | | | Any mortgage, charge or pledge of a company’s property and assets may be authorized without the consent of shareholders subject to any restrictions under the bye-laws. | | | – | | | Any mortgage or pledge of a corporation’s property and assets may be authorized without the vote or consent of shareholders, except to the extent that the certificate of incorporation otherwise provides. | ||||||
Directors | |||||||||||||||
– | | | The Board of Directors must consist of at least one director. | | | – | | | The board of directors must consist of at least one member. | ||||||
– | | | The number of directors is fixed by the bye-laws, and any changes to such number must be approved by the Board of Directors and/or the shareholders in accordance with the company’s bye-laws. | | | – | | | Number of board members shall be fixed by the bylaws, unless the certificate of incorporation fixes the number of directors, in which case a change in the number shall be made only by amendment of the certificate of incorporation. | ||||||
– | | | Removal: | | | – | | | Removal: | ||||||
| | | – | | | Under our bye-laws, any or all directors may be removed, only with cause, by the holders of a majority of the shares entitled to vote at a special meeting convened and held in accordance with the bye-laws for the purpose of such removal. | | | | | – | | | Any or all of the directors may be removed, with or without cause, by the holders of a majority of the shares entitled to vote unless the certificate of incorporation otherwise provides. | ||
| | | | | | | | | – | | | In the case of a classified board, shareholders may effect removal of any or all directors only for cause. | ||||
Bermuda | | | Delaware | ||||||||||||
Duties of directors | |||||||||||||||
– | | | The Companies Act authorizes the directors of a company, subject to its bye-laws, to exercise all powers of the company except those that are required by the Companies Act or the company’s bye-laws to be exercised by the shareholders of the company. Our bye-laws provide that our business is to be managed and conducted by our Board of Directors. At common law, members of a Board of Directors owe a fiduciary duty to the company to act in good faith in their dealings with or on behalf of the company and exercise their powers and fulfill the duties of their office honestly. This duty includes the following essential elements: | | | | | – | | | Under Delaware law, the business and affairs of a corporation are managed by or under the direction of its board of directors. In exercising their powers, directors are charged with a fiduciary duty of care to protect the interests of the corporation and a fiduciary duty of loyalty to act in the best interests of its shareholders. The duty of care requires that a director act in good faith, with the care that an ordinarily prudent person would exercise under similar circumstances. Under this duty, a director must inform himself of, and disclose to shareholders, all material information reasonably available regarding a significant transaction. The duty of loyalty requires that a director act in a manner he reasonably believes to be in the best interests of the corporation. He must not use his corporate position for personal gain or advantage. This duty prohibits self-dealing by a director and mandates that the best interest of the corporation and its shareholders take precedence over any interest possessed by a director, officer or controlling shareholder and not shared by the shareholders generally. | ||||
| | | – | | | a duty to act in good faith in the best interests of the company; | | |||||||||
| | | – | | | a duty not to make a personal profit from opportunities that arise from the office of director; | | |||||||||
| | | – | | | a duty to avoid conflicts of interest; and | | |||||||||
| | | – | | | a duty to exercise powers for the purpose for which such powers were intended. | | |||||||||
– | | | The Companies Act imposes a duty on directors and officers of a Bermuda company: | | | – | | | In general, actions of a director are presumed to have been made on an informed basis, in good faith and in the honest belief that the action taken was in the best interests of the corporation. However, this presumption may be rebutted by evidence of a breach of one of the fiduciary duties. Should such evidence be presented concerning a transaction by a director, a director must prove the procedural fairness of the transaction, and that the transaction was of fair value to the corporation. | ||||||
| | | – | | | to act honestly and in good faith with a view to the best interests of the company; and | | |||||||||
| | | – | | | to exercise the care, diligence and skill that a reasonably prudent person would exercise in comparable circumstances. | | |||||||||
– | | | The Companies Act also imposes various duties on directors and officers of a company with respect to certain matters of management and administration of the company. Under Bermuda law, directors and officers generally owe fiduciary duties to the company itself, not to the company’s individual shareholders, creditors or any class thereof. Our shareholders may not have a direct cause of action against our directors. | | | | | ||||||||
Bermuda | | | Delaware | ||||||||||||
Takeovers | |||||||||||||||
– | | | An acquiring party is generally able to acquire compulsorily the common shares of minority holders of a company in the following ways: | | | | | ||||||||
| | | – | | | By a procedure under the Companies Act known as a “scheme of arrangement.” A scheme of arrangement could be effected by obtaining the agreement of the company and of holders of common shares, representing in the aggregate a majority in number and at least 75% in value of the common shareholders present and voting at a court ordered meeting held to consider the scheme of arrangement. The scheme of arrangement must then be sanctioned by the Bermuda Supreme Court. If a scheme of arrangement receives all necessary agreements and sanctions, upon the filing of the court order with the Registrar, all holders of common shares could be compelled to sell their shares under the terms of the scheme of arrangement. | | | – | | | Delaware law provides that a parent corporation, by resolution of its board of directors and without any shareholder vote, may merge with any subsidiary of which it owns at least 90% of each class of its capital stock. Upon any such merger, and in the event the parent corporate does not own all of the stock of the subsidiary, dissenting shareholders of the subsidiary are entitled to certain appraisal rights. | ||||
| | | | | – | | | Delaware law also provides, subject to certain exceptions, that if a person acquires 15% of voting stock of a company, the person is an “interested shareholder” and may not engage in “business combinations” with the company for a period of three years from the time the person acquired 15% or more of voting stock. | ||||||||
| | | – | | | If the acquiring party is a company, it may compulsorily acquire all the shares of the target company by acquiring pursuant to a tender offer 90% of the shares or class of shares not already owned by, or by a nominee for, the acquiring party (the offeror), or any of its subsidiaries. If an offeror has, within four months after the making of an offer for all the shares or class of shares not owned by, or by a nominee for, the offeror, or any of its subsidiaries, obtained the approval of the holders of 90% or more of all the shares to which the offer relates, the offeror may, at any time within two months beginning with the date on which the approval was obtained, by notice compulsorily acquire the shares of any nontendering shareholder on the same terms as the original offer unless the Supreme Court of Bermuda (on application made within a one-month period from the date of the offeror’s notice of its intention to acquire such shares) orders otherwise. | | | | | ||||||
| | | – | | | Where the acquiring party or parties hold not less than 95% of the shares or a class of shares of the company, by acquiring, pursuant to a notice given to the remaining shareholders or class of shareholders, the shares of such remaining shareholders or class of shareholders. When this notice is given, the acquiring party is entitled and bound to acquire the shares of the remaining shareholders on the terms set out in the notice, unless a remaining shareholder, within one month of receiving such notice, applies to the Supreme Court of Bermuda for an appraisal of the value of | | | | | ||||||
Bermuda | | | Delaware | ||||||||||||
| | | | | their shares. This provision only applies where the acquiring party offers the same terms to all holders of shares whose shares are being acquired. | | | | | |||||||
Dissenter’s rights of appraisal | |||||||||||||||
– | | | A dissenting shareholder (that did not vote in favor of the amalgamation or merger and who is not satisfied that the fair value has been offered for his shares) of a Bermuda exempted company may, within one month of notice of the shareholders’ meeting, apply to the Bermuda Supreme Court to appraise the fair value of those shares. Note that each share of an amalgamating or merging company carries this right to vote in respect of the amalgamation or merger whether or not it otherwise carries the right to vote. | | | – | | | With limited exceptions, appraisal rights shall be available for the shares of any class or series of stock of a corporation in a merger or consolidation. | ||||||
| | | – | | | The certificate of incorporation may provide that appraisal rights are available for shares as a result of an amendment to the certificate of incorporation, any merger or consolidation or the sale of all or substantially all of the assets. | ||||||||||
Dissolution | |||||||||||||||
– | | | Under Bermuda law, a solvent company may be wound up by way of a shareholders’ voluntary liquidation. Prior to the company entering liquidation, a majority of the directors shall each make a statutory declaration, which states that the directors have made a full enquiry into the affairs of the company and have formed the opinion that the company will be able to pay its debts within a period of 12 months of the commencement of the winding up and must file the statutory declaration with the Registrar. The general meeting must be held within five weeks of the making of the declaration and will be convened primarily for the purposes of passing a resolution that the company be wound up voluntarily and appointing a liquidator. The winding up of the company is deemed to commence at the time of the passing of the resolution. | | | – | | | Under Delaware law, a corporation may voluntarily dissolve (i) if a majority of the board of directors adopts a resolution to that effect and the holders of a majority of the issued and outstanding shares entitled to vote thereon vote for such dissolution; or (ii) if all shareholders entitled to vote thereon consent in writing to such dissolution. | ||||||
Shareholder’s derivative actions | |||||||||||||||
– | | | Class actions and derivative actions are generally not available to shareholders under Bermuda law. Bermuda courts, however, would ordinarily be expected to permit a shareholder to commence an action in the name of a company to remedy a wrong to the company where the act complained of is alleged to be beyond the corporate power of the company or illegal, or would result in the violation of the company’s memorandum of association or bye-laws. Furthermore, consideration would be given by a Bermuda court to acts that are alleged to constitute a fraud against the minority shareholders or, for instance, where an act requires the approval of a greater percentage of the company’s shareholders than that which actually approved it. | | | – | | | In any derivative suit instituted by a shareholder of a corporation, it shall be averred in the complaint that the plaintiff was a shareholder of the corporation at the time of the transaction of which he complains or that such shareholder’s stock thereafter devolved upon such shareholder by operation of law. | ||||||
Material Contracts |
Exchange Controls |
Taxation |
(1) | it is organized in a “qualified foreign country,” which is a country that grants an “equivalent exemption” from tax to corporations organized in the United States in respect of each category of shipping income for which exemption is being claimed under Section 883; and |
(2) | either |
(a) | more than 50% of the value of its shares is beneficially owned, directly or indirectly, by “qualified shareholders,” which as defined includes individuals who are “residents” of a qualified foreign country; |
(b) | its shares are “primarily and regularly traded on an established securities market” in a qualified foreign country or in the United States; or |
(c) | it is a “controlled foreign corporation” and one or more qualified U.S. persons generally own more than 50 percent of the total value of all the outstanding stock. |
• | we had, or were considered to have, a fixed place of business in the United States involved in the earning of U.S.-source shipping income; and |
• | substantially all of our U.S.-source shipping income was attributable to regularly scheduled transportation, such as the operation of a vessel that follows a published schedule with repeated sailings at regular intervals between the same points for voyages that begin or end in the United States. |
• | certain financial institutions; |
• | dealers or traders in securities who use a mark-to-market method of tax accounting; |
• | persons holding our common shares as part of a hedging transaction, straddle, wash sale, conversion transaction or integrated transaction or persons entering into a constructive sale with respect to our common shares; |
• | persons whose functional currency for U.S. federal income tax purposes is not the U.S. dollar; |
• | entities classified as partnerships for U.S. federal income tax purposes; |
• | tax-exempt entities; |
• | persons holding common shares in accounts that offer certain tax advantages, including an “individual retirement account” or “Roth IRA”; |
• | persons that own or are deemed to own ten percent or more of our shares by vote or value; or |
• | persons holding common shares in connection with a trade or business conducted outside of the U.S. |
Dividends and Paying Agents |
Statement by Experts |
Documents on Display |
Subsidiary Information |
QUANTITATIVE AND QUALITATIVE DISCLOSURES ABOUT MARKET RISK |
DESCRIPTION OF SECURITIES OTHER THAN EQUITY SECURITIES |
Debt Securities |
Warrants and Rights |
Other Securities |
American Depositary Shares |
DEFAULTS, DIVIDEND ARREARAGES AND DELINQUENCIES |
MATERIAL MODIFICATIONS TO THE RIGHTS OF SECURITY HOLDERS AND USE OF PROCEEDS |
CONTROLS AND PROCEDURES |
Disclosure Controls and Procedures |
Management’s Annual Report on Internal Control Over Financial Reporting |
Attestation Report of the Registered Public Accounting Firm |
Changes in Internal Control Over Financial Reporting |
[RESERVED] |
AUDIT COMMITTEE FINANCIAL EXPERT |
CODE OF ETHICS |
PRINCIPAL ACCOUNTANT FEES AND SERVICES |
EXEMPTIONS FROM THE LISTING STANDARDS FOR AUDIT COMMITTEES |
PURCHASES OF EQUITY SECURITIES BY THE ISSUER AND AFFILIATED PURCHASERS |
CHANGE IN REGISTRANT’S CERTIFYING ACCOUNTANT |
CORPORATE GOVERNANCE |
FINANCIAL STATEMENTS |
EXHIBITS |
Exhibit No. | | | Description |
1.1* | | | Memorandum of Association of Cool Company Ltd. |
| | | ||
1.2* | | | Form of Amended and Restated Bye-laws of Cool Company Ltd. |
| | | ||
1.3* | | | Certificate of Incorporation of Cool Company Ltd. |
| | | ||
2.1*** | | | Form of Registration Rights Agreement |
| | | ||
2.2* | | | Facility Agreement dated February 17, 2022 for up to $570,000,000 Senior Secured Sustainability-Linked Amortizing Term Loan Facility |
| | | ||
2.3* | | | Loan Agreement dated January 26, 2022 by and between Golar LNG Limited and Cool Company Ltd. relating to a $25,000,000 Revolving Facility |
| | | ||
2.4** | | | Supplemental Agreement dated November 10, 2022 to the $520,000,000 Secured Loan Facility Agreement |
| | | ||
2.5** | | | Guarantee and Indemnity dated November 10, 2022 by Cool Company Ltd. in Favor of ING Bank. N.V., Singapore Branch |
| | | ||
4.1++* | | | Share Purchase Agreement dated January 26, 2022 by and between Cool Company Ltd. and Golar LNG Limited (incorporated by reference to Exhibit 4.29 filed with the Form 20-F filed by Golar LNG Limited on April 28, 2022) |
| | | ||
4.2++* | | | Amendment Agreement to Share Purchase Agreement dated February 25, 2022 by and between Cool Company Ltd. and Golar LNG Limited |
| | | ||
4.3++* | | | Share Purchase Agreement dated June 30, 2022 by and among Golar Management (Bermuda) Limited, Cool Company Ltd. and Golar LNG Limited |
| | | ||
4.4++* | | | Administrative Services Agreement dated June 30, 2022 between Golar Management Ltd. and Cool Company Management Ltd. |
| | | ||
4.5** | | | Master Sale Agreement dated November 3, 2022 between Quantum Crude Tankers Ltd and Cool Company Ltd. |
| | | ||
4.6** | | | Option Agreement dated November 3, 2022 by and among Cool Company Ltd., Geytech Marine Ltd and Joytech Marine Ltd |
| | |
Exhibit No. | | | Description |
8.1* | | | List of subsidiaries |
| | | ||
15.1*** | | | Consent of Ernst & Young LLP |
| | | ||
15.2*** | | | Consent of Clarkson Research Services Limited |
| | | ||
99.1** | | | Unaudited Pro Forma Condensed Combined Financial Information of Cool Company Ltd. |
* | Previously filed. |
** | Filed herewith. |
*** | To be filed by amendment. |
++ | Certain portions of this exhibit (indicated by “[***]”) have been omitted pursuant to Item 601(b)(10)(iv) of Regulation S-K because it is not material and is the type of information that the registrant treats as private or confidential. |
| | | | | Cool Company Ltd. | |||||
| | | | | | | ||||
Date: | | | | | By: | | | ||
| | | | | | | Name: Richard Tyrrell | |||
| | | | | | | Title: Chief Executive Officer | |||
| | | | | | | ||||
| | | | | | | ||||
| | | | | By: | | | |||
| | | | | | | Name: Johannes P. Boots | |||
| | | | | | | Title: Chief Financial Officer | |||
| | | Page | |
GOLAR SHIPPING AND VESSEL MANAGEMENT (a carve-out business of Golar LNG Limited) | | | |
| | | ||
AUDITED COMBINED CARVE-OUT FINANCIAL STATEMENTS | | | |
| | | ||
| | | ||
| | | ||
| | | ||
| | | ||
| | | ||
| | | ||
| | | ||
| | | ||
COOL COMPANY LTD. | | | |
| | | ||
UNAUDITED CONDENSED CONSOLIDATED AND COMBINED CARVE-OUT FINANCIAL STATEMENTS | | | |
| | | ||
| | | ||
| | | ||
| | | ||
| | | ||
| | | ||
| | | ||
| | | ||
PERNLI MARINE LIMITED(1) | | | |
| | | ||
UNAUDITED FINANCIAL STATEMENTS | | | |
| | | ||
| | | ||
| | | ||
| | | ||
| | | ||
| | | ||
| | |
(1) | The financial statements of Pernli Marine Limited, Persect Marine Limited, Felox Marine Limited and Respent Marine Limited are presented pursuant to Rule 3-05 of Regulation S-X. |
| | | Page | |
PERSECT MARINE LIMITED(1) | | | |
| | | ||
UNAUDITED FINANCIAL STATEMENTS | | | |
| | | ||
| | | ||
| | | ||
| | | ||
| | | ||
| | | ||
| | | ||
FELOX MARINE LIMITED(1) | | | |
| | | ||
UNAUDITED FINANCIAL STATEMENTS | | | |
| | | ||
| | | ||
| | | ||
| | | ||
| | | ||
| | | ||
| | | ||
RESPENT MARINE LIMITED(1) | | | |
| | | ||
UNAUDITED FINANCIAL STATEMENTS | | | |
| | | ||
| | | ||
| | | ||
| | | ||
| | | ||
| | |
(1) | The financial statements of Pernli Marine Limited, Persect Marine Limited, Felox Marine Limited and Respent Marine Limited are presented pursuant to Rule 3-05 of Regulation S-X. |
(in thousands of $) | | | Notes | | | Predecessor 2021 | | | Predecessor 2020 |
Time and voyage charter revenues | | | 6, 10 | | | 161,958 | | | 164,740 |
Vessel and other management fee revenues | | | 19 | | | 9,961 | | | 7,820 |
Total operating revenues | | | | | 171,919 | | | 172,560 | |
| | | | | | | ||||
Vessel operating expenses | | | 19, 14 | | | (48,048) | | | (45,314) |
Voyage, charter hire and commission expenses, net | | | 19 | | | (709) | | | (11,228) |
Administrative expenses | | | 19, 14 | | | (17,743) | | | (14,437) |
Depreciation and amortization | | | 12 | | | (43,389) | | | (44,328) |
Total operating expenses | | | | | (109,889) | | | (115,307) | |
| | | | | | | ||||
Other operating income | | | 7 | | | 5,020 | | | 3,262 |
Operating income | | | | | 67,050 | | | 60,515 | |
| | | | | | | ||||
Financial income/(expense) | | | | | | | |||
Interest income | | | | | 7 | | | 70 | |
Interest expense | | | 16 | | | (18,087) | | | (26,953) |
Other financial items | | | 8 | | | (380) | | | (895) |
Net financial expenses | | | | | (18,460) | | | (27,778) | |
| | | | | | | ||||
Income before income taxes and non-controlling interests | | | | | 48,590 | | | 32,737 | |
Income taxes | | | 9 | | | (222) | | | (353) |
| | | | | | | ||||
Net income | | | | | 48,368 | | | 32,384 | |
Net income attributable to non-controlling interests | | | | | (32,502) | | | (33,794) | |
Net income/(loss) attributable to Parent | | | | | 15,866 | | | (1,410) | |
| | | | | | | ||||
Basic and diluted earnings per share | | | 22 | | | $15.71 | | | $(1.40) |
(in thousands of $) | | | Predecessor 2021 | | | Predecessor 2020 |
COMPREHENSIVE INCOME | | | | | ||
Net income | | | 48,368 | | | 32,384 |
| | | | | |||
Comprehensive income | | | 48,368 | | | 32,384 |
| | | | | |||
Comprehensive income (loss) attributable to: | | | | | ||
Parent | | | 15,866 | | | (1,410) |
Non-controlling interests | | | 32,502 | | | 33,794 |
Comprehensive income | | | 48,368 | | | 32,384 |
(in thousands of $) | | | Notes | | | Predecessor 2021 | | | Predecessor 2020 |
ASSETS | | | | | | | |||
Current assets | | | | | | | |||
Cash and cash equivalents | | | | | 33,811 | | | 34,324 | |
Restricted cash and short-term deposits | | | 13 | | | 43,311 | | | 22,821 |
Trade accounts receivable | | | | | 767 | | | 4,445 | |
Amounts due from related parties | | | 19 | | | — | | | 15 |
Inventories | | | | | — | | | 915 | |
Other current assets | | | 11 | | | 1,404 | | | 1,936 |
Total current assets | | | | | 79,293 | | | 64,456 | |
| | | | | | | ||||
Non-current assets | | | | | | | |||
Restricted cash | | | 13 | | | 780 | | | 800 |
Vessels and equipment, net | | | 12 | | | 1,383,677 | | | 1,427,025 |
Other non-current assets | | | 10 | | | 2,758 | | | 3,374 |
Total assets | | | | | 1,466,508 | | | 1,495,655 | |
| | | | | | | ||||
LIABILITIES AND EQUITY | | | | | | | |||
Current liabilities | | | | | | | |||
Current portion of long-term debt and short-term debt | | | 16 | | | (338,501) | | | (453,159) |
Trade accounts payable | | | | | (2,441) | | | (1,750) | |
Accrued expenses | | | 14 | | | (59,094) | | | (49,549) |
Amounts due to related parties | | | 19 | | | (1,021) | | | (7,105) |
Other current liabilities | | | 15 | | | (16,396) | | | (9,100) |
Total current liabilities | | | | | (417,453) | | | (520,663) | |
| | | | | | | ||||
Non-current liabilities | | | | | | | |||
Long-term debt | | | 16 | | | (292,322) | | | (322,843) |
Other non-current liabilities | | | 17 | | | (13,678) | | | (10,369) |
Total liabilities | | | | | (723,453) | | | (853,875) | |
| | | | | | | ||||
Commitments and contingencies | | | 20 | | | | | ||
Equity | | | | | | | |||
Parent’s equity includes 1,010,000 common shares of $1.00 each issued and outstanding | | | | | (568,557) | | | (495,784) | |
Non-controlling interests | | | 5 | | | (174,498) | | | (145,996) |
Total equity | | | | | (743,055) | | | (641,780) | |
Total liabilities and equity | | | | | (1,466,508) | | | (1,495,655) |
(in thousands of $) | | | Notes | | | Predecessor 2021 | | | Predecessor 2020 |
Operating activities | | | | | | | |||
Net income | | | | | 48,368 | | | 32,384 | |
Adjustments to reconcile net income to net cash provided by operating activities: | | | | | | | |||
Depreciation and amortization expenses | | | 12 | | | 43,389 | | | 44,328 |
Amortization of deferred charges | | | | | 1,259 | | | 2,021 | |
Changes in assets and liabilities: | | | | | | | |||
Compensation cost related to share-based payment | | | | | 850 | | | 863 | |
Trade accounts receivable | | | | | 3,677 | | | (370) | |
Inventories | | | | | 915 | | | (908) | |
Other current and other non-current assets | | | | | 1,147 | | | (2,199) | |
Amounts due to/(from) related parties | | | | | (6,068) | | | 7,956 | |
Trade accounts payable | | | | | 691 | | | (1,254) | |
Accrued expenses | | | | | 9,545 | | | 6,740 | |
Other current and non-current liabilities | | | | | 6,605 | | | (4,504) | |
Net cash provided by operating activities | | | | | 110,378 | | | 85,057 | |
| | | | | | | ||||
Investing activities | | | | | | | |||
Additions to vessels and equipment | | | 12 | | | (41) | | | (51) |
Net cash used in investing activities | | | | | (41) | | | (51) | |
| | | | | | | ||||
Financing activities | | | | | | | |||
Proceeds from short-term and long-term debt | | | | | 10,402 | | | 104,806 | |
Repayments of short-term and long-term debt | | | | | (156,364) | | | (173,655) | |
Contributions from/(repayments of) Parent’s funding | | | | | 56,057 | | | (15,347) | |
Financing arrangement fees and other costs | | | | | (475) | | | (1,800) | |
Net cash used in financing activities | | | | | (90,380) | | | (85,996) | |
| | | | | | | ||||
Net increase (decrease) in cash, cash equivalents and restricted cash | | | | | 19,957 | | | (990) | |
Cash, cash equivalents and restricted cash at beginning of year | | | | | 57,945 | | | 58,935 | |
Cash, cash equivalents and restricted cash at end of year | | | | | 77,902 | | | 57,945 | |
| | | | | | | ||||
Supplemental disclosure of cash flow information: | | | | | | | |||
Cash paid during the year for: | | | | | | | |||
Interest paid | | | | | 5,676 | | | 11,115 | |
Tax paid | | | | | 370 | | | 432 |
(in thousands of $) | | | Notes | | | 2021 | | | 2020 | | | 2019 |
Cash and cash equivalents | | | | | 33,811 | | | 34,324 | | | 34,371 | |
Restricted cash and short-term deposits (current portion) | | | 13 | | | 43,311 | | | 22,821 | | | 23,787 |
Restricted cash (non-current portion) | | | 13 | | | 780 | | | 800 | | | 777 |
| | | | | 77,902 | | | 57,945 | | | 58,935 |
| | | Notes | | | Contributed Parent’s Equity | | | Retained deficit | | | Total Parent’s Equity | | | Non- controlling Interest | | | Total Equity | |
Combined carve-out predecessor balance at December 31, 2019 (Unaudited) | | | | | 872,251 | | | (360,573) | | | 511,678 | | | 117,202 | | | 628,880 | |
Net (loss) / income | | | | | — | | | (1,410) | | | (1,410) | | | 33,794 | | | 32,384 | |
Cash distributions | | | 5 | | | — | | | — | | | — | | | (5,000) | | | (5,000) |
Share based payments contribution | | | | | 863 | | | — | | | 863 | | | — | | | 863 | |
Repayments of Parent’s funding | | | 2a | | | (15,347) | | | — | | | (15,347) | | | — | | | (15,347) |
Combined carve-out predecessor balance at December 31, 2020 | | | | | 857,767 | | | (361,983) | | | 495,784 | | | 145,996 | | | 641,780 | |
Net income | | | | | — | | | 15,866 | | | 15,866 | | | 32,502 | | | 48,368 | |
Cash distributions | | | 5 | | | — | | | — | | | — | | | (4,000) | | | (4,000) |
Share based payments contribution | | | | | 850 | | | — | | | 850 | | | — | | | 850 | |
Capital reduction | | | 2a | | | (133,812) | | | 133,812 | | | — | | | — | | | — |
Contributions from Parent’s funding | | | 2a | | | 56,057 | | | — | | | 56,057 | | | — | | | 56,057 |
Combined carve-out predecessor balance at December 31, 2021 | | | | | 780,862 | | | (212,305) | | | 568,557 | | | 174,498 | | | 743,055 |
Date | | | Name | | | Purpose |
March 3, 2022 | | | Golar Hull M2022 Corp. | | | Owns and operates Golar Crystal |
March 7, 2022 | | | Golar LNG NB12 Corporation | | | Owns and operates Golar Frost |
March 9, 2022 | | | Golar Hull M2021 Corp. | | | Owns and operates Golar Seal |
March 10, 2022 | | | Golar Hull M2027 Corp. | | | Owns and operates Golar Bear |
April 1, 2022 | | | Golar LNG NB10 Corporation | | | Owns and operates Golar Glacier |
April 1, 2022 | | | Golar Hull M2047 Corp. | | | Owns and operates Golar Snow |
April 5, 2022 | | | Golar Hull M2048 Corp. | | | Owns and operates Golar Ice* |
April 5, 2022 | | | Golar LNG NB11 Corporation | | | Owns and operates Golar Kelvin* |
April 5, 2022 | | | The Cool Pool Limited | | | Commercial management company |
* | Golar agreed to remain as the guarantor of the payment obligations relating to LNG carriers of two of the acquired Golar subsidiaries, Golar Ice and Golar Kelvin, in exchange for a guarantee fee of 0.5% on the outstanding contractual balances. |
• | the right to obtain substantially all of the economic benefits from the use of the identified asset; and |
• | the right to direct the use of that identified asset. |
• | ownership of the asset is transferred at the end of the lease term; |
• | the contract contains an option to purchase the asset which is reasonably certain to be exercised; |
• | the lease term is for a major part of the remaining useful life of the asset, although contracts entered into the last 25% of the asset’s useful life are not subject to this criterion; |
• | the discounted value of the fixed payments under the lease represent substantially all of the fair value of the asset; or |
• | the asset is heavily customized such that it could not be used for another charter at the end of the term. |
Vessels | | | 40 years |
Drydocking expenditure | | | 5 years |
Office equipment and fittings | | | 3 years |
Standard | | | Description | | | Date of Adoption | | | Effect on our Combined Carve-out Financial Statements or Other Significant Matters |
ASU 2020-04 Reference Rate Reform (Topic 848): Facilitation of the Effects of Reference Rate Reform on Financial Reporting and ASU 2021-01 Reference Rate Reform (Topic 848). | | | The amendments provide temporary optional expedients and exceptions for applying U.S. GAAP to contracts, hedging relationships, and other transactions affected by reference rate reform if certain criteria are met. The applicable expedients for us are in relation to modifications of contracts within the scope of Topics 310, Receivables, 470, Debt, and 842, | | | January 1, 2022 | | | No impact as a result of the adoption of this ASU. |
Standard | | | Description | | | Date of Adoption | | | Effect on our Combined Carve-out Financial Statements or Other Significant Matters |
| | | Leases. This optional guidance may be applied prospectively from any date beginning March 12, 2020 and cannot be applied to modifications that occur after December 31, 2022. | | | | | |||
ASU 2021-08 Business Combinations (Topic 805): Accounting for Contract Assets and Contract Liabilities from Contracts with Customers. | | | The amendments provide guidance on the accounting for contract assets and contract liabilities from revenue contracts with customers in a business combination. The new guidance improves comparability after the business combination by providing consistent recognition and measurement guidance for revenue contracts with customers acquired in a business combination and revenue contracts with customers not acquired in a business combination. This guidance is effective prospectively from any date beginning December 15, 2022. | | | January 1, 2023 | | | No impacts are expected as a result of the adoption of this ASU. |
Name | | | Jurisdiction of Incorporation | | | Purpose |
Golar Hull M2022 Corp. | | | Marshall Islands | | | Leases Golar Crystal* |
Golar LNG NB10 Corporation | | | Marshall Islands | | | Leases Golar Glacier* |
Golar Hull M2048 Corp. | | | Marshall Islands | | | Leases Golar Ice* |
Golar LNG NB11 Corporation | | | Marshall Islands | | | Leases Golar Kelvin* |
Golar Hull M2021 Corp. | | | Marshall Islands | | | Leases Golar Seal* |
Golar Hull M2047 Corp. | | | Marshall Islands | | | Leases Golar Snow* |
Golar Hull M2027 Corp. | | | Marshall Islands | | | Leases Golar Bear* |
Golar LNG NB12 Corporation | | | Marshall Islands | | | Owns and operates Golar Frost |
The Cool Pool Limited | | | Marshall Islands | | | Commercial management company |
Cool Company Ltd. | | | Bermuda | | | Holding company |
Cool Company Management d.o.o. (formerly Golar Management d.o.o.) | | | Croatia | | | Vessel management company |
Cool Company Management AS (formerly Golar Management Norway AS) | | | Norway | | | Vessel management company |
* | The above table excludes the lessor VIEs that we have leased vessels from under finance leases. The lessor VIEs are wholly-owned, special purpose vehicles (“SPVs”) of financial institutions. While we do not hold any equity investments in these SPVs, we have concluded that we are the primary beneficiary of these lessor VIEs and accordingly have included these entities in our combined carve-out financial statements. See note 5 for further details. |
Vessel | | | Effective from | | | Lessor | | | Sales value (in $ millions) | | | Lease duration | | | First repurchase option (in $ millions) | | | Date of first repurchase option | | | Net repurchase obligation at end of lease term (in $ millions) | | | End of lease term |
Golar Glacier(1) | | | October 2014 | | | ICBCL | | | 204.0 | | | 10 years | | | 173.8 | | | October 2019(2) | | | 113.4 | | | April 2023 |
Golar Kelvin(1) | | | January 2015 | | | ICBCL | | | 204.0 | | | 10 years | | | 173.8 | | | January 2020(2) | | | 71.0 | | | January 2025 |
Golar Snow(1) | | | January 2015 | | | ICBCL | | | 204.0 | | | 10 years | | | 173.8 | | | January 2020(2) | | | 116.2 | | | April 2023 |
Golar Ice(1) | | | February 2015 | | | ICBCL | | | 204.0 | | | 10 years | | | 173.8 | | | February 2020(2) | | | 71.0 | | | January 2025 |
Golar Seal | | | March 2016 | | | CCBFL | | | 203.0 | | | 10 years | | | 132.8 | | | March 2018(2) | | | 63.4 | | | March 2026 |
Golar Crystal | | | March 2017 | | | COSCO | | | 187.0 | | | 10 years | | | 97.3 | | | March 2020(2) | | | 50.0 | | | March 2027 |
Golar Bear | | | June 2020 | | | AVIC | | | 160.0 | | | 7 years | | | 100.7 | | | June 2021(2) | | | 45.0 | | | June 2027 |
(1) | In June 2021, we entered into certain amendments to our ICBCL sale and leaseback facilities which includes (i) prepayment of $15.0 million for each sale and leaseback facility in July 2021; and (ii) brought forward our obligation to repurchase the Golar Glacier and Golar Snow to April 2023 from October 2024 and January 2025, respectively. |
(2) | We did not exercise the first repurchase options. |
(in thousands of $) | | | 2022 | | | 2023 | | | 2024 | | | 2025 | | | 2026 | | | 2027+ |
Golar Glacier | | | 17,100 | | | 4,451 | | | — | | | — | | | — | | | — |
Golar Kelvin | | | 19,710 | | | 19,710 | | | 18,468 | | | — | | | — | | | — |
Golar Snow | | | 17,100 | | | 3,608 | | | — | | | — | | | — | | | — |
Golar Ice | | | 19,710 | | | 19,710 | | | 19,764 | | | 162 | | | — | | | — |
Golar Seal(1) | | | 13,717 | | | 13,754 | | | 13,717 | | | 13,717 | | | — | | | — |
Golar Crystal(2) | | | 10,659 | | | 10,622 | | | 10,593 | | | 10,534 | | | 10,500 | | | 1,753 |
Golar Bear(2) | | | 15,755 | | | 15,153 | | | 14,562 | | | 13,949 | | | 13,347 | | | 2,721 |
(1) | In November 2021, we entered into another supplementary agreement with the existing lender CCBFL to extend further Golar Seal’s put option to January 2025. The last payment obligation relating to the Golar Seal has been presented in 2025 even though the maturity of the lease obligation is in March 2026, due to the put option maturing in January 2025 (note 16). |
(2) | The payment obligations relating to the Golar Crystal and Golar Bear above include variable rental payments due under the lease based on assumed LIBOR plus a margin. |
(in thousands of $) | | | Golar Glacier | | | Golar Kelvin | | | Golar Snow | | | Golar Ice | | | Golar Seal | | | Golar Crystal | | | Golar Bear | | | 2021 Total | | | 2020 Total |
Assets | | | | | | | | | | | | | | | | | | | |||||||||
Restricted cash and short-term deposits (note 13) | | | 4,340 | | | 5,068 | | | 4,410 | | | 6,689 | | | 3,432 | | | 4,611 | | | 14,156 | | | 42,706 | | | 20,206 |
| | | | | | | | | | | | | | | | | | | ||||||||||
Liabilities | | | | | | | | | | | | | | | | | | | |||||||||
Debt: | | | | | | | | | | | | | | | | | | | |||||||||
Current portion of long-term debt and short-term debt (note 16)(1) | | | (82,751) | | | (99,463) | | | (81,906) | | | (54,872) | | | — | | | (8,691) | | | — | | | (327,683) | | | (442,372) |
Long-term interest bearing debt – non-current portion (note 16)(1) | | | — | | | — | | | — | | | — | | | (78,540) | | | (66,109) | | | (104,044) | | | (248,693) | | | (268,396) |
| | | (82,751) | | | (99,463) | | | (81,906) | | | (54,872) | | | (78,540) | | | (74,800) | | | (104,044) | | | (576,376) | | | (710,768) | |
Other non-current liabilities(2) | | | — | | | — | | | — | | | — | | | — | | | (11,500) | | | — | | | (11,500) | | | (7,500) |
(1) | Where applicable, these balances are net of deferred finance charges (note 16). |
(2) | Other non-current liabilities relates to dividend payable for lessor VIE of $11.5 million and $7.5 million as of December 31, 2021 and 2020, respectively. The lessor VIE declared dividends of $4.0 million and $5.0 million for the years ended December 31, 2021 and 2020, respectively, which remain unpaid as of December 31, 2021. |
(in thousands of $) | | | 2021 | | | 2020 |
Combined carve-out statements of operations | | | | | ||
Interest expense | | | 16,268 | | | 20,059 |
| | | | | |||
Combined carve-out statements of cash flows | | | | | ||
Net debt repayments | | | (145,423) | | | (87,289) |
Net debt receipts | | | 10,402 | | | 104,806 |
Financing costs paid | | | (475) | | | (1,800) |
(in thousands of $) | | | 2021 | | | 2020 | ||||||
Singaporean trading house | | | 40,715 | | | 25% | | | 38,732 | | | 24% |
European trading house | | | 35,109 | | | 22% | | | 1,283 | | | 1% |
Dutch trading house | | | 21,577 | | | 13% | | | 43,536 | | | 26% |
International LNG trader | | | 19,896 | | | 12% | | | 1,027 | | | 1% |
Japanese trading house | | | 17,807 | | | 11% | | | 6,992 | | | 4% |
British trading house | | | — | | | —% | | | 23,686 | | | 14% |
(in thousands of $) | | | 2021 | | | 2020 |
Foreign exchange loss on operations | | | (40) | | | (35) |
Financing arrangement fees and other costs | | | (202) | | | (730) |
Other | | | (138) | | | (130) |
| | | (380) | | | (895) |
(in thousands of $) | | | 2021 | | | 2020 |
Current tax expense | | | 222 | | | 385 |
Deferred tax expense | | | — | | | (32) |
Total income tax expense | | | 222 | | | 353 |
(in thousands of $) | | | 2021 | | | 2020 |
Effect of movement in deferred tax balances | | | — | | | (32) |
Effect of adjustments in respect of current tax in prior periods | | | (43) | | | 81 |
Effect of taxable income in various countries | | | 265 | | | 304 |
Total tax expense | | | 222 | | | 353 |
(in thousands of $) | | | |
2022 | | | 159,133 |
2023 | | | 55,785 |
2024 | | | 34,322 |
2025 | | | 22,174 |
2026 and thereafter | | | 22,807 |
Total minimum contractual future revenues | | | 294,221 |
(in thousands of $) | | | 2021 | | | 2020 |
Operating lease income(1) | | | 145,833 | | | 163,114 |
Variable lease income(1)(2) | | | 16,125 | | | 1,626 |
Total operating lease income | | | 161,958 | | | 164,740 |
(1) | “Total operating lease income” is presented in “Time and voyage charter revenues”. During the years ended December 31, 2021 and 2020, we chartered in an external vessel and recognized operating lease income of $0.9 million and $nil, respectively. |
(2) | “Variable lease income” is excluded from lease payments that comprise the minimum contractual future revenues from non-cancellable operating leases. During the years ended December 31, 2021 and 2020, we chartered in a third party vessel and recognized $2.6 million and $4.6 million of variable lease income, respectively. |
(in thousands of $) | | | 2021 | | | 2020 |
Operating lease cost(1) | | | 3,744 | | | 4,745 |
Total operating lease cost | | | 3,744 | | | 4,745 |
(1) | “Operating lease cost” includes short-term lease cost. During the years ended December 31, 2021 and 2020, we sub-chartered out an external vessel and recognized $3.0 million and $3.8 million of cost respectively, presented in “Voyage, charterhire and commission expense, net”. The remaining balance in total operating lease cost is included in “Vessel operating expenses”. |
(in thousands of $) | | | |
2022 | | | 762 |
2023 | | | 630 |
2024 | | | 601 |
2025 | | | 467 |
2026 and thereafter | | | 480 |
Total minimum lease payments | | | 2,940 |
(in thousands of $) | | | 2021 | | | 2020 |
Prepaid expenses | | | 715 | | | 691 |
Other receivables | | | 689 | | | 1,245 |
| | | 1,404 | | | 1,936 |
| | | Year Ended December 31, 2021 | ||||||||||
(in thousands of $) | | | Vessels | | | Drydocking expenditure | | | Office equipment and fittings | | | Total |
Cost | | | | | | | | | ||||
As of January 1, 2021 | | | 1,658,995 | | | 24,688 | | | 342 | | | 1,684,025 |
Additions | | | — | | | — | | | 41 | | | 41 |
Write-off of fully depreciated asset | | | (87) | | | — | | | — | | | (87) |
As of December 31, 2021 | | | 1,658,908 | | | 24,688 | | | 383 | | | 1,683,979 |
| | | | | | | | | |||||
Depreciation and amortization | | | | | | | | | ||||
As of January 1, 2021 | | | (250,038) | | | (6,927) | | | (35) | | | (257,000) |
Charge for the year | | | (38,454) | | | (4,934) | | | (1) | | | (43,389) |
Write-off of fully depreciated asset | | | 87 | | | — | | | — | | | 87 |
As of December 31, 2021 | | | (288,405) | | | (11,861) | | | (36) | | | (300,302) |
| | | | | | | | | |||||
Net book value as of December 31, 2021 | | | 1,370,503 | | | 12,827 | | | 347 | | | 1,383,677 |
| | | Year Ended December 31, 2020 | ||||||||||
(in thousands of $) | | | Vessels | | | Drydocking expenditure | | | Office equipment and fittings | | | Total |
Cost | | | | | | | | | ||||
As of January 1, 2020 | | | 1,665,120 | | | 24,688 | | | 291 | | | 1,690,099 |
Additions | | | — | | | — | | | 51 | | | 51 |
Write-off of fully depreciated asset | | | (6,125) | | | — | | | — | | | (6,125) |
As of December 31, 2020 | | | 1,658,995 | | | 24,688 | | | 342 | | | 1,684,025 |
| | | | | | | | | |||||
Depreciation and amortization | | | | | | | | | ||||
As of January 1, 2020 | | | (216,773) | | | (1,993) | | | (31) | | | (218,797) |
Charge for the year | | | (39,390) | | | (4,934) | | | (4) | | | (44,328) |
Write-off of fully depreciated asset | | | 6,125 | | | — | | | — | | | 6,125 |
As of December 31, 2020 | | | (250,038) | | | (6,927) | | | (35) | | | (257,000) |
| | | | | | | | | |||||
Net book value as of December 31, 2020 | | | 1,408,957 | | | 17,761 | | | 307 | | | 1,427,025 |
(in millions of $) | | | As of December 31, 2021 | ||||||
Vessel | | | Market value(1) | | | Carrying value | | | Deficit |
Golar Bear | | | 156.0 | | | 172.8 | | | (16.8) |
Golar Crystal | | | 155.5 | | | 167.8 | | | (12.3) |
Golar Frost | | | 156.5 | | | 175.8 | | | (19.3) |
Golar Glacier | | | 158.0 | | | 172.0 | | | (14.0) |
Golar Ice | | | 160.8 | | | 179.2 | | | (18.4) |
Golar Kelvin | | | 160.3 | | | 173.5 | | | (13.2) |
Golar Seal | | | 153.3 | | | 163.0 | | | (9.7) |
Golar Snow | | | 161.8 | | | 179.2 | | | (17.4) |
(1) | Market values are determined using reference to average broker values provided by independent brokers. Broker values are considered an estimate of the market value for the purpose of determining whether an impairment trigger exists. Broker values are commonly used and accepted by our lenders in relation to determining compliance with relevant covenants in applicable credit facilities for the purpose of assessing security quality. |
(in thousands of $) | | | 2021 | | | 2020 |
Restricted cash and short-term deposits held by lessor VIEs(1) | | | 42,707 | | | 20,206 |
Restricted cash relating to the $1.125 billion debt facility(2) | | | 604 | | | 2,615 |
Restricted cash relating to office lease | | | 780 | | | 800 |
Total restricted cash and short-term deposits | | | 44,091 | | | 23,621 |
Less: Amounts included in current restricted cash and short-term deposits | | | (43,311) | | | (22,821) |
Long-term restricted cash | | | 780 | | | 800 |
(1) | These are amounts held by lessor VIEs that we are required to consolidate under U.S. GAAP into our combined carve-out financial statements as VIEs (note 5). |
(2) | This refers to cash deposits required under the $1.125 billion debt facility (note 16). |
(in thousands of $) | | | 2021 | | | 2020 |
Interest expense | | | 52,700 | | | 41,548 |
Vessel operating expenses | | | 3,974 | | | 5,957 |
Administrative expenses | | | 2,194 | | | 2,044 |
Current tax payable | | | 226 | | | — |
| | | 59,094 | | | 49,549 |
(in thousands of $) | | | 2021 | | | 2020 |
Deferred operating lease and charter hire revenue | | | 10,691 | | | 8,109 |
Current portion of operating lease liability (note 10) | | | 762 | | | 833 |
Other(1) | | | 4,943 | | | 158 |
| | | 16,396 | | | 9,100 |
(1) | Included in “Other” is an amount payable to Hygo as a result of the participation of its vessels in the Cool Pool of $4.8 million as of December 31, 2021. Following Golar’s sale of Hygo in April 2021, Hygo and its affiliates ceased to be related parties. |
(in thousands of $) | | | 2021 | | | 2020 |
Total long-term and short-term debt | | | 630,823 | | | 776,002 |
Less: current portion of long-term debt and short-term debt | | | (338,501) | | | (453,159) |
Long-term debt | | | 292,322 | | | 322,843 |
| | | GSVM debt | | | VIE debt(1) | | | Total debt | |
(in thousands of $) | | | | | | | |||
2022 | | | 10,942 | | | 328,047 | | | 338,989 |
2023 | | | 10,942 | | | 112,485 | | | 123,427 |
2024 | | | 32,824 | | | 7,679 | | | 40,503 |
2025 | | | — | | | 86,219 | | | 86,219 |
2026 and thereafter | | | — | | | 43,280 | | | 43,280 |
Total | | | 54,708 | | | 577,710 | | | 632,418 |
Deferred finance charges | | | (261) | | | (1,334) | | | (1,595) |
Total | | | 54,447 | | | 576,376 | | | 630,823 |
(1) | These amounts relate to certain lessor entities (for which legal ownership resides with financial institutions) that we are required to consolidate under U.S. GAAP into our combined carve-out financial statements as VIEs (note 5). |
(in thousands of $) | | | 2021 | | | 2020 | | | Maturity date |
$1.125 billion facility: | | | | | | | |||
- Golar Frost facility | | | 54,708 | | | 65,649 | | | 2024/2026(1) |
Subtotal (excluding lessor VIE loans) | | | 54,708 | | | 65,649 | | | |
| | | | | | | ||||
ICBCL VIE loans: | | | | | | | |||
- Golar Glacier facility | | | 82,816 | | | 110,625 | | | |
- Golar Kelvin facility | | | 99,537 | | | 128,562 | | | |
| | | | | | | Repayable on demand | |||
- Golar Ice facility | | | 54,947 | | | 83,857 | | | |
- Golar Snow facility | | | 81,970 | | | 111,108 | | | |
| | | | | | | ||||
CCBFL VIE loan: | | | | | | | |||
- Golar Seal facility | | | 78,540 | | | 90,177 | | | 2025 |
| | | | | | |
(in thousands of $) | | | 2021 | | | 2020 | | | Maturity date |
COSCO VIE loan: | | | | | | | |||
- Golar Crystal facility | | | 75,094 | | | 83,596 | | | 2027 |
| | | | | | | ||||
AVIC VIE loan: | | | | | | | |||
- Golar Bear facility | | | 104,806 | | | 104,806 | | | 2023 |
Total debt (gross) | | | 632,418 | | | 778,380 | | | |
Deferred finance charges | | | (1,595) | | | (2,378) | | | |
Total debt | | | 630,823 | | | 776,002 | | |
(1) | The commercial loan tranche matures at the earlier of the two dates, with the remaining balance maturing at the latter date. |
Tranche | | | Proportion of facility | | | Term of loan from date of drawdown | | | Repayment terms |
K-Sure | | | 40% | | | 12 years | | | Six-monthly installments |
KEXIM | | | 40% | | | 12 years | | | Six-monthly installments |
Commercial | | | 20% | | | 5 years | | | Six-monthly installments, unpaid balance to be refinanced after 5 years |
Facility | | | Effective from | | | SPV | | | Loan counterparty | | | Loan facility at inception (in $ millions) | | | Loan facility at December 31, 2021(in $ millions) | | | Loan duration/maturity | | | Interest |
Golar Glacier | | | October 2014 | | | Hai Jiao 1401 Limited | | | ICBCIL Finance Co.(1) | | | 184.8 | | | 82.8 | | | Repayable on demand | | | 2.11% - 2.65% |
Golar Snow | | | January 2015 | | | Hai Jiao 1402 Limited | | | ICBCIL Finance Co.(1) | | | 182.6 | | | 82.0 | | | Repayable on demand | | | 2.11% - 2.65% |
Golar Kelvin | | | January 2015 | | | Hai Jiao 1405 Limited | | | ICBCIL Finance Co.(1) | | | 182.5 | | | 99.5 | | | Repayable on demand | | | 2.11% - 2.65% |
Golar Ice | | | February 2015 | | | Hai Jiao 1406 Limited | | | ICBCIL Finance Co.(1) | | | 172.0 | | | 54.9 | | | Repayable on demand | | | 2.11% - 2.65% |
Golar Seal(2) | | | March 2016 | | | Compass Shipping 1 Corporation Limited | | | CCBFL | | | 162.4 | | | 78.5 | | | 2025 | | | 2.46% - 3.50% |
Golar Crystal | | | March 2017 | | | Oriental Fleet LNG 01 Limited | | | COSCO Shipping | | | 101.0 | | | 75.1 | | | 2027 | | | LIBOR plus margin |
Golar Bear(3) | | | June 2020 | | | Cool Bear Shipping Limited | | | AVIC | | | 110.0 | | | 104.8 | | | 2023 | | | 3.00% - 4.00% |
(1) | ICBCIL Finance Co. is a related party of ICBCL. |
(2) | The Golar Seal facility includes a put option that if exercised requires us to repay the facility if an appropriate long-term charter of 4 years or more is not entered into by January 2021. In November 2020, we agreed and executed an extension with CCBFL to extend such put option by one year. In November 2021, we entered into another supplemental agreement with existing lender to extend further the put option maturity to January 2025. Since then, we presented the maturity of the loan facility to January 2025 even though the maturity of the sale and leaseback arrangement is in March 2026 as the maturity date of the call option is the earlier of the two. |
(3) | The sale and leaseback arrangement for the Golar Bear has a term of seven years and bears an interest rate of LIBOR plus margin of 4.00%. However, the loan facility between Cool Bear Shipping Limited and AVIC has a term of three years and bears a fixed interest rate of 4.0%. We presented the maturity of the loan facility to be in 2023 even though the maturity of the sale and leaseback arrangement is in 2027 as the maturity date of the loan facility is the earlier of the two. |
(in thousands of $) | | | 2021 | | | 2020 |
Non-current portion of operating lease liability (note 10) | | | 2,178 | | | 2,869 |
Lessor VIE dividend payable | | | 11,500 | | | 7,500 |
| | | 13,678 | | | 10,369 |
| | | | | 2021 | | | 2021 | | | 2020 | | | 2020 | ||
(in thousands of $) | | | Fair value hierarchy | | | Carrying value | | | Fair value | | | Carrying value | | | Fair value |
Non-derivatives: | | | | | | | | | | | |||||
Cash and cash equivalents | | | Level 1 | | | 33,811 | | | 33,811 | | | 34,324 | | | 34,324 |
Restricted cash and short-term deposits | | | Level 1 | | | 44,091 | | | 44,091 | | | 23,621 | | | 23,621 |
Trade accounts receivable | | | Level 1 | | | 767 | | | 767 | | | 4,445 | | | 4,445 |
Trade accounts payable | | | Level 1 | | | (2,441) | | | (2,441) | | | (1,750) | | | (1,750) |
Amounts due to related parties | | | Level 1 | | | (1,021) | | | (1,021) | | | (7,090) | | | (7,089) |
Current portion of long-term debt and short-term debt(1)(2) | | | Level 2 | | | (338,988) | | | (338,988) | | | (453,412) | | | (453,412) |
Long-term debt(2) | | | Level 2 | | | (293,430) | | | (293,430) | | | (324,968) | | | (324,968) |
(1) | The carrying amounts of our short-term debt approximate their fair values because of the near term maturity of these instruments. |
(2) | Our debt obligations are recorded at amortized cost in the combined balance sheets. The amounts presented in the table above, are gross of the deferred charges amounting to $1.6 million and $2.4 million as of December 31, 2021 and 2020, respectively. |
• | The carrying value of cash and cash equivalents, which are highly liquid, is a reasonable estimate of fair value. |
• | The carrying value of restricted cash and short-term deposits is considered to be equal to the estimated fair value because of their near term maturity. |
• | The carrying value of trade accounts receivable, trade accounts payable and amounts due to related parties approximate fair values because of the near term maturity of these instruments. |
• | The estimated fair value for floating long-term debt is considered to be equal to the carrying value since they bear variable interest rates, which are adjusted on a quarterly basis. The fair value measurement of a liability must reflect the non-performance of the entity. |
(in thousands of $) | | | 2021 | | | 2020 |
Management fee revenue(i) | | | 6,468 | | | 7,820 |
Egyptian Company for Gas Services (“ECGS”)(ii) | | | 1,482 | | | — |
Ship and administrative management fees(i) | | | (5,001) | | | (4,546) |
Total | | | 2,949 | | | 3,274 |
(in thousands of $) | | | 2021 | | | 2020 |
Balances due from Golar Partners and its subsidiaries(iii) | | | — | | | 15 |
Balances due to Golar and its subsidiaries(iv) | | | (1,021) | | | (1,147) |
Balances due to Hygo and its affiliates(v) | | | — | | | (5,958) |
| | | (1,021) | | | (7,090) |
(i) | Ship management fees – Golar through its subsidiary, Golar Management Ltd., charged ship management fees to GSVM for the provision of technical and commercial management of the vessels. Each of our vessels is subject to management agreements pursuant to which certain commercial and technical management services are provided by Golar. We may terminate these agreements by providing 30 days’ written notice. In addition, Golar Management Ltd. also charged management fees to us for the provision of management and administrative services. The services provided are charged at cost plus a management fee equal to 5% of costs and expenses incurred in connection with providing these services. Where external service providers costs are incurred by Golar on behalf of us, these are recharged at cost. We may terminate the agreement by providing 120 days’ written notice. |
(ii) | ECGS – We chartered Golar Ice to ECGS, an affiliate of Golar’s during the year ended December 31, 2021. |
(iii) | Balances due from Golar Partners and its subsidiaries – Receivables and payables with Golar Partners and its subsidiaries are comprised primarily of unpaid management fees and expenses for management, advisory and administrative services. In addition, certain receivables and payables arise when we pay an invoice on behalf of a related party and vice versa. Receivables and payables are generally settled quarterly in arrears. Balances owing to or due from Golar Partners and its subsidiaries are unsecured, interest-free and intended to be settled in the ordinary course of business. Following Golar’s sale of Golar Partners in April 2021, Golar Partners and its affiliates ceased to be related parties. |
(iv) | Balances due to Golar and its subsidiaries – Receivables and payables with Golar and its subsidiaries are comprised primarily of unpaid management fees, advisory and administrative services. In addition, certain receivables and payables arise when Golar pays an invoice on our behalf. Receivables and payables are generally settled quarterly in arrears. Balances owing from Golar and its subsidiaries are unsecured, interest-free and intended to be settled in the ordinary course of business. |
(v) | Balances due to Hygo and its subsidiaries – Receivables and payables with Hygo and its subsidiaries are comprised primarily of unpaid management fees, advisory and administrative services. In addition, certain receivables and payables arise when we pay an invoice on behalf of a related party and vice versa. Receivables and payables are generally settled quarterly in arrears. Balances owing to or due from Hygo and its subsidiaries are unsecured, interest-free and intended to be settled in the ordinary course of business. Following Golar’s sale of Hygo in April 2021, Hygo and its affiliates ceased to be related parties. |
(in thousands of $) | | | 2021 | | | 2020 |
Carrying value of vessels secured against long-term loans | | | 1,383,330 | | | 1,426,718 |
• | The assumption for expected future volatility is based primarily on an analysis of historical volatility of Golar’s common shares. |
• | Where the criteria for using the simplified method are met, we have used this method to estimate the expected term of options based on the vesting period of the award that represents the period options granted are expected to be outstanding. Under the simplified method, the mid-point between the vesting date and the maximum contractual expiration date is used as the expected term. Where the criteria for using the simplified method are not met, we used the contractual term of the options. |
• | The dividend yield has been estimated at 0.0% as the exercise price of the options are reduced by the value of dividends, declared and paid on a per share basis. The exercise price of all options is reduced by the amount of Golar dividends declared and paid. |
| | | 2020 | |
Remaining performance period | | | 2.8 years |
Contractual term | | | 3.0 years |
Golar’s expected dividend yield | | | 0.0% |
Golar’s risk-free interest rate | | | 0.42% |
Golar share price volatility | | | 84.00% |
Golar share price at grant date | | | $7.49 |
(in thousands of $, except number of shares and per share data) | | | 2021 | | | 2020 |
Net income/(loss) attributable to Parent | | | $15,866 | | | $(1,410) |
Number of shares outstanding | | | 1,010,000 | | | 1,010,000 |
Basic and diluted earnings/(loss) per share | | | $15.71 | | | $(1.40) |
| | | Nine Months Ended September 30, | ||||||||||
| | | | | Successor (Consolidated) | | | Predecessor (Combined Carve-out) | | | Predecessor (Combined Carve-out) | ||
(in thousands of $, except per share amounts) | | | Notes | | | Phased period from January 27, 2022 to September 30, 2022(1) | | | Phased period from January 1, 2022 to June 30, 2022(1) | | | 2021 |
| | | | | | | | | |||||
Time and voyage charter revenues | | | 10 | | | 104,535 | | | 37,289 | | | 119,323 |
Vessel and other management fee revenues | | | 18 | | | 3,684 | | | 6,167 | | | 5,950 |
Amortization of intangible assets and liabilities arising from charter agreements, net | | | 9 | | | 14,504 | | | — | | | — |
Total operating revenues | | | | | 122,723 | | | 43,456 | | | 125,273 | |
| | | | | | | | | |||||
Vessel operating expenses | | | 18 | | | (24,781) | | | (7,706) | | | (36,021) |
Voyage, charter hire and commission expenses, net | | | | | (1,212) | | | (1,229) | | | (2,443) | |
Administrative expenses | | | | | (6,262) | | | (5,422) | | | (12,810) | |
Depreciation and amortization | | | 9, 12 | | | (28,413) | | | (5,745) | | | (32,553) |
Total operating expenses | | | | | (60,668) | | | (20,102) | | | (83,827) | |
| | | | | | | | | |||||
Other operating income | | | 6 | | | — | | | 4,374 | | | 5,020 |
Operating income | | | | | 62,055 | | | 27,728 | | | 46,466 | |
| | | | | | | | | |||||
Financial income/(expense) | | | | | | | | | ||||
Interest income | | | | | 389 | | | 4 | | | 4 | |
Interest expense | | | | | (15,172) | | | (4,725) | | | (16,799) | |
Gains on derivative instruments | | | | | 9,527 | | | — | | | — | |
Other financial items, net | | | 7 | | | (2,227) | | | 622 | | | (293) |
Net financial expenses | | | | | (7,483) | | | (4,099) | | | (17,088) | |
| | | | | | | | | |||||
Income before income taxes and non-controlling interests | | | | | 54,572 | | | 23,629 | | | 29,378 | |
Income taxes | | | 8 | | | (141) | | | (385) | | | (158) |
Net income | | | | | 54,431 | | | 23,244 | | | 29,220 | |
Net income attributable to non-controlling interests | | | | | (1,902) | | | (8,206) | | | (23,328) | |
Net income attributable to the Owners of Cool Company Ltd. / Predecessor’s Parent | | | | | 52,529 | | | 15,038 | | | 5,892 | |
| | | | | | | | | |||||
Basic and diluted earnings per share | | | 20 | | | $1.31 | | | $14.89 | | | $5.83 |
(1) | Refer to Note 2.a for the basis of preparation of the Successor and Predecessor periods. |
| | | Nine Months Ended September 30, | |||||||
| | | Successor (Consolidated) | | | Predecessor (Combined Carve-out) | | | Predecessor (Combined Carve-out) | |
| | | Phased period from January 27, 2022 to September 30, 2022(1) | | | Phased period from January 1, 2022 to June 30, 2022(1) | | | 2021 | |
(in thousands of $) | | | | | | | |||
Comprehensive income | | | | | | | |||
Net income | | | 54,431 | | | 23,244 | | | 29,220 |
| | | | | | | ||||
Comprehensive income | | | 54,431 | | | 23,244 | | | 29,220 |
| | | | | | | ||||
Comprehensive income attributable to: | | | | | | | |||
Owners of Cool Company Ltd. / Predecessor’s Parent | | | 52,529 | | | 15,038 | | | 5,892 |
Non-controlling interests | | | 1,902 | | | 8,206 | | | 23,328 |
Comprehensive income | | | 54,431 | | | 23,244 | | | 29,220 |
(1) | Refer to Note 2.a for the basis of preparation of the Successor and Predecessor periods. |
| | | | | Successor (Consolidated) | | | Predecessor (Combined Carve-out) | ||
(in thousands of $) | | | Notes | | | September 30, 2022 | | | December 31, 2021 |
ASSETS | | | | | | | |||
| | | | | | | ||||
Current assets | | | | | | | |||
Cash and cash equivalents | | | | | 94,790 | | | 33,811 | |
Restricted cash and short-term deposits | | | 5 | | | 3,468 | | | 43,311 |
Trade accounts receivable | | | | | 1,674 | | | 767 | |
Intangible assets, net | | | 9 | | | 6,338 | | | — |
Inventories | | | | | 4 | | | — | |
Other current assets | | | 11 | | | 4,611 | | | 1,404 |
Total current assets | | | | | 110,885 | | | 79,293 | |
| | | | | | | ||||
Non-current assets | | | | | | | |||
Restricted cash | | | 5 | | | 456 | | | 780 |
Vessels and equipment, net | | | 12 | | | 1,164,815 | | | 1,383,677 |
Intangible assets, net | | | 9 | | | 5,550 | | | — |
Other non-current assets | | | 13 | | | 11,598 | | | 2,758 |
Total assets | | | | | 1,293,304 | | | 1,466,508 | |
| | | | | | | ||||
LIABILITIES AND EQUITY | | | | | | | |||
| | | | | | | ||||
Current liabilities | | | | | | | |||
Current portion of long-term debt and short-term debt | | | 14 | | | 151,183 | | | 338,501 |
Trade accounts payable | | | | | 1,467 | | | 2,441 | |
Accrued expenses | | | | | 42,335 | | | 59,094 | |
Other current liabilities | | | 15 | | | 38,737 | | | 16,396 |
Amounts due to related parties | | | 18 | | | 8,196 | | | 1,021 |
Total current liabilities | | | | | 241,918 | | | 417,453 | |
| | | | | | | ||||
Non-current liabilities | | | | | | | |||
Long-term debt | | | 14 | | | 506,195 | | | 292,322 |
Other non-current liabilities | | | 16 | | | 28,700 | | | 13,678 |
Total liabilities | | | | | 776,813 | | | 723,453 | |
| | | | | | | ||||
Commitments and contingencies | | | 19 | | | | | ||
Equity | | | | | | | |||
Owners’ / Parent’s equity includes 40,010,000 (2021:1,010,000) common shares of $1.00 each issued and outstanding | | | | | 447,392 | | | 568,557 | |
Non-controlling interests | | | 5 | | | 69,099 | | | 174,498 |
Total equity | | | | | 516,491 | | | 743,055 | |
| | | | | | | ||||
Total liabilities and equity | | | | | 1,293,304 | | | 1,466,508 |
| | | Nine Months Ended September 30, | |||||||
| | | Successor (Consolidated) | | | Predecessor (Combined Carve-out) | | | Predecessor (Combined Carve-out) | |
(in thousands of $) | | | Phased period from January 27, 2022 to September 30, 2022(1) | | | Phased period from January 1, 2022 to June 30, 2022(1) | | | 2021 |
| | | | | | | ||||
Operating activities | | | | | | | |||
Net income | | | 54,431 | | | 23,244 | | | 29,220 |
Adjustments to reconcile net income to net cash provided by operating activities: | | | | | | | |||
Depreciation and amortization expenses | | | 28,413 | | | 5,745 | | | 32,553 |
Amortization of intangible assets and liabilities arising from charter agreements, net | | | (14,504) | | | — | | | — |
Amortization of deferred charges | | | 1,584 | | | 1,588 | | | 895 |
Compensation cost related to share-based payment | | | 67 | | | 238 | | | 618 |
Gains on derivative instruments | | | (9,527) | | | — | | | — |
Changes in assets and liabilities: | | | | | | | |||
Trade accounts receivable | | | (790) | | | (117) | | | 747 |
Inventories | | | (4) | | | — | | | 384 |
Other current and other non-current assets | | | 3,262 | | | (7,226) | | | 676 |
Amounts due to/(from) related parties | | | 3,583 | | | 1,252 | | | (5,566) |
Trade accounts payable | | | (574) | | | (400) | | | 202 |
Accrued expenses | | | 5,764 | | | (180) | | | 12,984 |
Other current and non-current liabilities | | | (6) | | | 2,957 | | | 3,269 |
Net cash provided by operating activities | | | 71,699 | | | 27,101 | | | 75,982 |
| | | | | | | ||||
Investing activities | | | | | | | |||
Additions to vessels and equipment | | | — | | | — | | | 44 |
Consideration for acquisition of vessels and management entities | | | (218,276) | | | — | | | — |
Net cash (used in) / provided by investing activities | | | (218,276) | | | — | | | 44 |
| | | | | | | ||||
Financing activities | | | | | | | |||
Proceeds from short-term and long-term debt | | | 570,000 | | | — | | | 10,073 |
Repayments of short-term and long-term debt | | | (57,507) | | | (498,832) | | | (126,670) |
(Repayments of)/Contributions from Parent’s funding | | | — | | | (136,351) | | | 51,270 |
Financing arrangement fees and other costs | | | (6,569) | | | — | | | (475) |
(Repayments to) / contributions from CoolCo in connection with acquisition, net of equity proceeds | | | (581,072) | | | 581,072 | | | — |
Net proceeds from equity raise | | | 269,547 | | | — | | | — |
Net cash from / (used in) financing activities | | | 194,399 | | | (54,111) | | | (65,802) |
| | | | | | | ||||
Net increase (decrease) in cash, cash equivalents and restricted cash | | | 47,822 | | | (27,010) | | | 10,224 |
Cash, cash equivalents and restricted cash at beginning of period | | | 50,892 | | | 77,902 | | | 57,945 |
Cash, cash equivalents and restricted cash at end of period | | | 98,714 | | | 50,892 | | | 68,169 |
(1) | Refer to Note 2.a for the basis of preparation of the Successor and Predecessor periods. |
| | | Successor (Consolidated) | | | Predecessor (Combined Carve-out) | | | Predecessor (Combined Carve-out) | | | Predecessor (Combined Carve-out) | |
(in thousands of $) | | | Phased period from January 27, 2022 to September 30, 2022(1) | | | Phased period from January 1, 2022 to June 30, 2022(1) | | | December 31, 2021 | | | September 30, 2021 |
Cash and cash equivalents | | | 94,790 | | | 28,919 | | | 33,811 | | | 25,984 |
Restricted cash and short-term deposits (current portion) | | | 3,468 | | | 21,973 | | | 43,311 | | | 41,400 |
Restricted cash (non-current portion) | | | 456 | | | — | | | 780 | | | 785 |
| | | 98,714 | | | 50,892 | | | 77,902 | | | 68,169 |
(1) | Refer to Note 2.a for the basis of preparation of the Successor and Predecessor periods. |
| | | Nine Month Period Ended September 30, 2021 | |||||||||||||
| | | Contributed Parent’s Equity | | | Retained deficit | | | Total Parent’s Equity | | | Non- controlling Interest | | | Total Equity | |
Combined carve-out predecessor(1) balance at December 31, 2020 (Unaudited) | | | 857,766 | | | (361,982) | | | 495,784 | | | 145,996 | | | 641,780 |
Net income for the period | | | — | | | 5,892 | | | 5,892 | | | 23,328 | | | 29,220 |
Cash distributions | | | — | | | — | | | — | | | (4,000) | | | (4,000) |
Share based payments contribution | | | 618 | | | — | | | 618 | | | — | | | 618 |
Contributions from Parent’s funding | | | 51,270 | | | — | | | 51,270 | | | — | | | 51,270 |
Combined carve-out predecessor(1) balance at September 30, 2021 | | | 909,654 | | | (356,090) | | | 553,564 | | | 165,324 | | | 718,888 |
| | | Nine Month Period Ended September 30, 2022 | |||||||||||||
| | | Contributed Parent’s / Owners’ Equity | | | Accumulated Retained (Losses)/Earnings | | | Total Parent’s / Owners’ Equity | | | Non- controlling Interest | | | Total Equity | |
Combined carve-out predecessor(1) balance at December 31, 2021 | | | 780,862 | | | (212,305) | | | 568,557 | | | 174,498 | | | 743,055 |
Net income for the period | | | — | | | 15,038 | | | 15,038 | | | 8,206 | | | 23,244 |
Fair value adjustment in relation to Vessel SPA(2) | | | (227,289) | | | — | | | (227,289) | | | — | | | (227,289) |
Share based payments contribution | | | 238 | | | — | | | 238 | | | — | | | 238 |
Deconsolidation of lessor VIEs(3) | | | — | | | — | | | — | | | (115,412) | | | (115,412) |
Combined carve-out predecessor(1) balance upon acquisition | | | 553,811 | | | (197,267) | | | 356,544 | | | 67,292 | | | 423,836 |
Adjustment to total equity upon consolidation(4) | | | (553,811) | | | 197,267 | | | (356,544) | | | (95) | | | (356,639) |
Net income for the period | | | — | | | 52,529 | | | 52,529 | | | 1,902 | | | 54,431 |
Share based payments contribution | | | 67 | | | — | | | 67 | | | — | | | 67 |
Issuance of shares to Owners, net(5) | | | 394,796 | | | — | | | 394,796 | | | — | | | 394,796 |
Consolidated successor(1) balance at September 30, 2022 | | | 394,863 | | | 52,529 | | | 447,392 | | | 69,099 | | | 516,491 |
(1) | Refer to Note 2.a for the basis of preparation of the Successor and Predecessor periods. |
(2) | As part of disposal of the eight LNGCs pursuant to the Vessel SPA, the Predecessor revalued the vessels to fair value as of the respective disposal dates. |
(3) | Following completion of the acquisition of all of the Original Vessels under the Vessel SPA in April 2022, only two of existing seven sale and leaseback arrangements were assumed by us. The equity attributable to the two Lessor SPVs is included in non-controlling interests in our consolidated successor balance as of September 30, 2022. See note 5. |
(4) | Adjustment to total equity upon consolidation during the Successor period, previously presented on a combined carve-out basis during the Predecessor period. |
(5) | Includes $127.9 million of equity issued to Golar in connection with the transfer of vessels and $275.0 million raised as part of the Private Placement. This was offset by issuance cost totalling $5.2 million. |
Date | | | Name | | | Purpose |
March 3, 2022 | | | Golar Hull M2022 Corp. | | | Owns and operates Golar Crystal |
March 7, 2022 | | | Golar LNG NB12 Corp. | | | Owns and operates Golar Frost |
March 9, 2022 | | | Golar Hull M2021 Corp. | | | Owns and operates Golar Seal |
March 10, 2022 | | | Golar Hull M2027 Corp. | | | Owns and operates Golar Bear |
April 1, 2022 | | | Golar LNG NB10 Corp. | | | Owns and operates Golar Glacier |
April 1, 2022 | | | Golar Hull M2047 Corp. | | | Owns and operates Golar Snow |
April 5, 2022 | | | Golar Hull M2048 Corp. | | | Leases Golar Ice* |
April 5, 2022 | | | Golar LNG NB11 Corp. | | | Leases Golar Kelvin* |
April 5, 2022 | | | The Cool Pool Limited. | | | Commercial management company |
* | Golar agreed to remain as the guarantor of the payment obligations relating to LNG carriers of two of the acquired Golar subsidiaries, Golar Ice and Golar Kelvin, in exchange for a guarantee fee of 0.5% on the outstanding contractual balances. |
a. | The successor period of CoolCo, commencing on January 27, 2022, reflects the funds raised from the Private Placement and the phased acquisition of the legal entities acquired from Golar on the respective acquisition dates until September 30, 2022 (the “Successor Period”). |
b. | The predecessor period reflects the combined carve-out financial statements of GSVM which included historical operations and results of each of the legal entities CoolCo acquired from Golar until the day prior to the respective acquisition date (the “Predecessor Period”) (see note 2.b). |
• | the right to obtain substantially all of the economic benefits from the use of the identified asset; and |
• | the right to direct the use of that identified asset. |
• | ownership of the asset is transferred at the end of the lease term; |
• | the contract contains an option to purchase the asset which is reasonably certain to be exercised; |
• | the lease term is for a major part of the remaining useful life of the asset, although contracts entered into the last 25% of the asset’s useful life are not subject to this criterion; |
• | the discounted value of the fixed payments under the lease represent substantially all of the fair value of the asset; or |
• | the asset is heavily customized such that it could not be used for another charter at the end of the term. |
Vessels | | | 30 years |
Drydocking expenditure | | | 5 years |
Office equipment and fittings | | | 3 years |
• | the eight TFDE LNG carriers acquired (note 12); |
• | favorable contract intangible assets and unfavorable contracts liabilities (note 9); |
• | customer relationship intangible asset (note 9); |
• | assembled workforce intangible asset (note 9); and |
• | other current assets (note 11) |
Standard | | | Description | | | Date of Adoption | | | Effect on our unaudited condensed consolidated Financial Statements or Other Significant Matters for the Successor Period |
ASU 2021-08 Business Combinations (Topic 805): Accounting for Contract Assets and Contract Liabilities from Contracts with Customers | | | Requires contract assets and contract liabilities (i.e., deferred revenue) acquired in a business combination to be recognized and measured by the acquirer on the acquisition date in accordance with ASC 606. Generally, this new guidance will result in the acquirer recognizing contract assets and contract liabilities at the same amounts recorded by the acquiree (rather than having such amounts recognized by the acquirer at fair value in acquisition accounting, as has been historical practice). | | | January 1, 2023 | | | No material impacts are currently expected as a result of the adoption of this ASU. |
ASU 2022-03 Fair Value Measurement (Topic 820) - Fair Value Measurement of Equity Securities Subject to Contractual Sale Restrictions | | | This amendment is intended to reduce diversity in practice in the measurement of the fair value of equity securities subject to contractual sale restrictions. For entities that have investments in equity securities that are subject to contractual sale restrictions, the contractual restriction on the sale is not considered part of the unit of account of the equity security, is not considered when measuring fair value and additional disclosures are required. This amendment is required to be applied prospectively from date of adoption; early adoption is permitted. | | | January 1, 2024 | | | No impact currently expected as a result of the adoption of this ASU. |
| | | | | Purpose | |||||
Name | | | Jurisdiction of Incorporation | | | Successor | | | Predecessor |
Golar Hull M2022 Corporation | | | Marshall Islands | | | Owns and operates Golar Crystal | | | Leases Golar Crystal* |
Golar LNG NB10 Corporation | | | Marshall Islands | | | Owns and operates Golar Glacier | | | Leases Golar Glacier* |
Golar Hull M2048 Corporation | | | Marshall Islands | | | Leases Golar Ice* | | | Leases Golar Ice* |
Golar LNG NB11 Corporation | | | Marshall Islands | | | Leases Golar Kelvin* | | | Leases Golar Kelvin* |
Golar Hull M2021 Corporation | | | Marshall Islands | | | Owns and operates Golar Seal | | | Leases Golar Seal* |
| | | | | Purpose | |||||
Name | | | Jurisdiction of Incorporation | | | Successor | | | Predecessor |
Golar Hull M2047 Corporation | | | Marshall Islands | | | Owns and operates Golar Snow | | | Leases Golar Snow* |
Golar Hull M2027 Corporation | | | Marshall Islands | | | Owns and operates Golar Bear | | | Leases Golar Bear* |
Golar LNG NB12 Corporation | | | Marshall Islands | | | Owns and operates Golar Frost | | | Owns and operates Golar Frost |
The Cool Pool Limited | | | Marshall Islands | | | Commercial management company | | | Commercial management company |
Cool Company Ltd. | | | Bermuda | | | Holding company | | | Holding company |
Cool Company Management d.o.o. (formerly Golar Management d.o.o.) | | | Croatia | | | Vessel management company | | | Vessel management company |
Cool Company Management AS (formerly Golar Management Norway AS) | | | Norway | | | Vessel management company | | | Vessel management company |
Cool Company Management Ltd | | | United Kingdom | | | Management company | | | not applicable** |
Cool Company Management Malaysia Sdn Bhd | | | Malaysia | | | Management company | | | not applicable** |
* | The above table excludes the lessor VIEs that we have leased vessels from under finance leases. The lessor VIEs are wholly-owned, special purpose vehicles (“SPVs”) of financial institutions. While we do not hold any equity investments in these SPVs, we have concluded that we are the primary beneficiary of these lessor VIEs and accordingly have included these entities in our unaudited condensed financial statements. See note 5 for further details. |
** | Cool Company Management Ltd and Cool Company Management Malaysia Sdn Bhd were formed and incorporated in January 2022 and March 2022, respectively, therefore, no historical results of operations of these entities are included within Predecessor period combined carve-out financial statements. |
Vessel | | | Effective from | | | Lessor | | | Sales value (in $ millions) | | | Lease duration | | | First repurchase option (in $ millions) | | | Date of first repurchase option(2) | | | Net repurchase obligation at end of lease term (in $ millions) | | | End of lease term |
Successor and Predecessor Period | ||||||||||||||||||||||||
Golar Kelvin | | | January 2015 | | | ICBCL | | | 204.0 | | | 10 years | | | 173.8 | | | January 2020 | | | 71.0 | | | January 2025 |
Golar Ice | | | February 2015 | | | ICBCL | | | 204.0 | | | 10 years | | | 173.8 | | | February 2020 | | | 71.0 | | | January 2025 |
| | | | | | | | | | | | | | | | | |||||||||
Predecessor Period | ||||||||||||||||||||||||
Golar Snow(1) | | | January 2015 | | | ICBCL | | | 204.0 | | | 10 years | | | 173.8 | | | January 2020 | | | 116.2 | | | April 2023 |
Golar Glacier(1) | | | October 2014 | | | ICBCL | | | 204.0 | | | 10 years | | | 173.8 | | | October 2019 | | | 113.4 | | | April 2023 |
Golar Seal | | | March 2016 | | | CCBFL | | | 203.0 | | | 10 years | | | 132.8 | | | March 2018 | | | 63.4 | | | March 2026 |
Golar Crystal | | | March 2017 | | | COSCO | | | 187.0 | | | 10 years | | | 97.3 | | | March 2020 | | | 50.0 | | | March 2027 |
Golar Bear | | | June 2020 | | | AVIC | | | 160.0 | | | 7 years | | | 100.7 | | | June 2021 | | | 45.0 | | | June 2027 |
(1) | In June 2021, the GSVM entered into certain amendments to the ICBCL sale and leaseback facilities which included (i) prepayment of $15.0 million for each sale and leaseback facility in July 2021; and (ii) brought forward the obligations to repurchase the Golar Glacier and Golar Snow to April 2023 from October 2024 and January 2025, respectively. |
(2) | For each of the sale and leaseback arrangements, the first repurchase options were not exercised. |
| | | Successor | | | Predecessor | |
(in thousands of $) | | | September 30, 2022 | | | December 31, 2021 |
Assets: | | | | | ||
Restricted cash and short term deposits | | | 3,468 | | | 42,706 |
| | | | | |||
Liabilities: | | | | | ||
Current portion of long term debt and short term debt (note 14)(1) | | | (113,035) | | | (327,683) |
Long term interest bearing debt non-current portion(1) | | | — | | | (248,693) |
Accrued expenses(2) | | | (32,637) | | | (52,391) |
Other non-current liabilities(3) | | | — | | | (11,500) |
| | | (145,672) | | | (640,267) |
(1) | Where applicable, these balances are net of deferred finance charges (note 14). |
(2) | Includes accrued interest of lessor VIEs which although consolidated into our results, we have no control over the arrangements negotiated by these lessor VIEs including repayment profiles. |
(3) | Other non-current liabilities relates to dividend payable for lessor VIE of $11.5 million as of December 31, 2021. The sale and leaseback arrangements related to those lessor VIEs that were terminated as part of the Vessel SPA acquisition. |
| | | Successor (Consolidated) | | | Predecessor (Combined Carve-out) | | | Predecessor (Combined Carve-out) | |
| | | Phased period from January 27, 2022 to September 30, 2022 | | | Phased period from January 1, 2022 to June 30, 2022 | | | 2021 | |
(in thousands of $) | | | | | | | |||
Foreign exchange loss on operations | | | (358) | | | (464) | | | (133) |
Financing arrangement fees and other costs, net | | | (1,721) | | | 1,102 | | | (84) |
Other | | | (148) | | | (16) | | | (76) |
Other financial items, net | | | (2,227) | | | 622 | | | (293) |
| | | Successor (Consolidated) | | | Predecessor (Combined Carve-out) | | | Predecessor (Combined Carve-out) | |
| | | Phased period from January 27, 2022 to September 30, 2022 | | | Phased period from January 1, 2022 to June 30, 2022 | | | 2021 | |
(in thousands of $) | | | | | | | |||
Current tax expense | | | 141 | | | 366 | | | 158 |
Deferred tax expense | | | — | | | 19 | | | — |
Total income tax expense | | | 141 | | | 385 | | | 158 |
| | | Favorable Contract Intangible Assets | | | Assembled Workforce | | | Customer Relationships | | | As of September 30, 2022 | |
| | | Note A | | | Note B | | | Note B | | | ||
(in thousands of $) | | | | | | | | | ||||
Cost | | | 13,482 | | | 4,600 | | | 3,600 | | | 21,682 |
Less: Accumulated amortization | | | (9,264) | | | (230) | | | (300) | | | (9,794) |
Net book value | | | 4,218 | | | 4,370 | | | 3,300 | | | 11,888 |
Presented as: | | | | | | | | | ||||
- Current | | | 4,218 | | | 920 | | | 1,200 | | | 6,338 |
- Non-current | | | — | | | 3,450 | | | 2,100 | | | 5,550 |
| | | 4,218 | | | 4,370 | | | 3,300 | | | 11,888 |
| | | Successor (Consolidated) | | | Predecessor (Combined Carve-out) | | | Predecessor (Combined Carve-out) | |
| | | Phased period from January 27, 2022 to September 30, 2022 | | | Phased period from January 1, 2022 to June 30, 2022 | | | 2021 | |
(in thousands of $) | | | | | | | |||
Operating lease income | | | 101,288 | | | 37,506 | | | 105,818 |
Variable lease income / (expense)(1) | | | 3,247 | | | (217) | | | 13,505 |
Total operating lease income(2) | | | 104,535 | | | 37,289 | | | 119,323 |
(1) | “Variable lease income” is excluded from lease payments that comprise the minimum contractual future revenues from non-cancellable operating leases. |
(2) | “Total operating lease income” is included within “Time and voyage charter revenues”. During the nine month period ended September 30, 2021, we chartered in an external vessel and recognized operating lease income of $0.9 million and $2.6 million of variable lease income. No similar external vessel was chartered for the nine month period ended September 30, 2022. |
| | | Successor | | | Predecessor | |
(in thousands of $) | | | September 30, 2022 | | | December 31, 2021 |
Prepaid expenses(1) | | | 2,780 | | | 715 |
Other receivables | | | 1,831 | | | 689 |
Other current assets | | | 4,611 | | | 1,404 |
(1) | Prepaid expenses include deferred costs, in connection with a proposed public offering of the Company's common shares on an international exchange, amounting to $2.0 million which primarily consists of direct and incremental fees for legal, professional and other third-party services relating to the proposed offering. Subsequent to third quarter of 2022, the Company completed a follow-on equity offering in a private placement and changed its intent from a proposed public offering to a direct listing only, resulting in such deferred costs to be recognized in the statement of operations in the fourth quarter. |
| | | Successor | | | Predecessor | |
(in thousands of $) | | | September 30, 2022 | | | December 31, 2021 |
Vessels(1) | | | 1,192,606 | | | 1,683,596 |
Office equipment and fittings | | | 423 | | | 383 |
Less: Accumulated depreciation and amortization(2) | | | (28,214) | | | (300,302) |
Total vessels and equipment, net | | | 1,164,815 | | | 1,383,677 |
(1) | Vessels includes the cost of drydocking expenditure. As part of the asset acquisition of the eight LNGCs pursuant to the Vessel SPA, we revalued the vessels to fair value as of the respective acquisition dates. Fair value was determined in accordance with ASC 820, using a market approach, considering third party vessel valuations and comparable acquisition transactions. |
(2) | Depreciation and amortization charges during the Successor Period includes the impact of remeasurement to fair value of the LNGCs acquired pursuant to the Vessel SPA. |
| | | Successor | | | Predecessor | |
(in thousands of $) | | | September 30, 2022 | | | December 31, 2021 |
Mark-to-market asset on interest rate swaps | | | 9,527 | | | — |
Operating lease right-of-use-assets | | | 993 | | | 2,443 |
Others | | | 1,078 | | | 315 |
Other non-current assets | | | 11,598 | | | 2,758 |
| | | Successor | | | Predecessor | |
(in thousands of $) | | | September 30, 2022 | | | December 31, 2021 |
Total long-term and short-term debt (1) | | | 657,378 | | | 630,823 |
Less: current portion of long-term debt and short-term debt(1) | | | (151,183) | | | (338,501) |
Long-term debt(1) | | | 506,195 | | | 292,322 |
| | | Successor | |||||||
(in thousands of $) | | | CoolCo debt | | | VIE Debt(2) | | | Total |
Current portion of long-term debt and short-term debt(1) | | | 38,148 | | | 113,035 | | | 151,183 |
Long-term debt (1) | | | 506,195 | | | — | | | 506,195 |
Total(1) | | | 544,343 | | | 113,035 | | | 657,378 |
(1) | The amounts presented in the table above, are net of the deferred charges amounting to $5.9 million and $1.6 million as of September 30, 2022 and December 31, 2021, respectively. |
(2) | This amount relates to the lessor VIEs (for which legal ownership resides with a financial institution) that we are required to consolidate under U.S. GAAP (see note 5). |
| | | Successor | | | Predecessor | |
(in thousands of $) | | | September 30, 2022 | | | December 31, 2021 |
Deferred operating lease and charter hire revenue | | | 13,170 | | | 10,691 |
Unfavorable contract intangibles (note 9) | | | 18,790 | | | — |
Current portion of operating lease liability | | | 616 | | | 762 |
Debt guarantee liability (note 18) | | | 993 | | | — |
Other payables (1) | | | 5,168 | | | 4,943 |
Other current liabilities | | | 38,737 | | | 16,396 |
(1) | Included in “Other Payables” is an amount payable to Hygo Energy Transition Ltd. (“Hygo”) as a result of the participation of its vessels in the Cool Pool of $5.0 million as of September 30, 2022 (December 31, 2021: $4.8 million). Following Golar’s sale of Hygo in April 2021, Hygo and its affiliates ceased to be related parties. |
| | | Successor | | | Predecessor | |
(in thousands of $) | | | September 30, 2022 | | | December 31, 2021 |
Unfavorable contract intangibles (note 9) | | | 27,124 | | | — |
Non-current portion of operating lease liability | | | 593 | | | 2,178 |
Lessor VIE dividend payable | | | — | | | 11,500 |
Others | | | 983 | | | — |
Other non-current liabilities | | | 28,700 | | | 13,678 |
Instrument (in thousands of $) | | | Notional amount | | | Maturity Dates | | | Fixed Interest Rates |
Interest rate swaps: | | | | | | | |||
Receiving Floating, pay fixed | | | 383,082 | | | February 2027 | | | 2.69% to 3.63% |
| | | | | Successor | | | Predecessor | ||||||||
| | | | | September 30, 2022 | | | December 31, 2021 | ||||||||
(in thousands of $) | | | Fair value hierarchy | | | Carrying value | | | Fair value | | | Carrying value | | | Fair value |
Non-derivatives: | | | | | | | | | | | |||||
Cash and cash equivalents(1) | | | Level 1 | | | 94,790 | | | 94,790 | | | 33,811 | | | 33,811 |
Restricted cash and short-term deposits | | | Level 1 | | | 3,924 | | | 3,924 | | | 44,091 | | | 44,091 |
Trade accounts receivable(2) | | | Level 1 | | | 1,674 | | | 1,674 | | | 767 | | | 767 |
Trade accounts payable(2) | | | Level 1 | | | (1,467) | | | (1,467) | | | (2,441) | | | (2,441) |
Current portion of long-term debt and short-term debt (3)(4) | | | Level 2 | | | (152,519) | | | (152,519) | | | (338,988) | | | (338,988) |
Long-term debt (4) | | | Level 2 | | | (510,774) | | | (510,774) | | | (293,430) | | | (293,430) |
Derivatives: | | | | | | | | | | | |||||
Interest rate swaps asset (5)(6) | | | Level 2 | | | 9,527 | | | 9,527 | | | — | | | — |
(1) | The carrying value of cash and cash equivalents, which are highly liquid, is a reasonable estimate of fair value. |
(2) | The carrying values of trade accounts receivable and trade accounts payable approximate fair values because of the near term maturity of these instruments. |
(3) | The carrying amounts of our short-term debt approximate their fair values because of the near term maturity of these instruments. |
(4) | Our debt obligations are recorded at amortized cost in the unaudited condensed consolidated and combined carve-out balance sheets. The amounts presented in the table above, are gross of the deferred charges amounting to $5.9 million and $1.6 million as of September 30, 2022 and December 31, 2021, respectively. |
(5) | Derivative assets are presented within other non-current assets on the condensed consolidated balance sheet. |
(6) | The fair value of certain derivative instruments is the estimated amount that we would receive or pay to terminate the agreements at the reporting date, taking into account current interest rates and our creditworthiness and that of our counterparties. |
• | The carrying value of restricted cash and short-term deposits is considered to be equal to the estimated fair value because of their near term maturity; and |
• | The estimated fair value for floating long-term debt is considered to be equal to the carrying value since it bears variable interest rates, which are adjusted on a quarterly basis. The fair value measurement of a liability must reflect the non-performance of the entity. |
| | | Successor (Consolidated) | | | Predecessor (Combined Carve-out) | | | Predecessor (Combined Carve-out) | |
| | | Phased period from January 27, 2022 to September 30, 2022 | | | Phased period from January 1, 2022 to June 30, 2022 | | | 2021 | |
(in thousands of $) | | | | | | | |||
Ship management fee revenue (a) | | | 1,193 | | | 1,342 | | | 3,983 |
Ship management and administrative services expense (a) | | | (3,500) | | | (730) | | | (3,754) |
Egyptian Company for Gas Services (“ECGS”) (b) | | | — | | | — | | | 1,482 |
Debt guarantee compensation (c) | | | (563) | | | — | | | — |
Commitment fee (d) | | | (86) | | | — | | | — |
| | | (2,956) | | | 612 | | | 1,711 |
| | | Successor | | | Predecessor | |
(in thousands of $) | | | September 30, 2022 | | | December 31, 2021 |
Balances due to Golar and its subsidiaries (e) | | | 4,346 | | | 1,021 |
Balances due to QPSL and its affiliates (f) | | | 3,850 | | | — |
| | | 8,196 | | | 1,021 |
(a) | Ship management fees revenue / Ship management and administrative services expense - Golar through its subsidiary, Golar Management Ltd. (“Golar Management”), charged ship management fees for the provision of technical and commercial management of the vessels. Each of our vessels is subject to management agreements pursuant to which certain commercial and technical management services were provided by Golar. This provision of technical and commercial management services includes management of four vessels owned by QPSL, subsequently acquired by the Company (note 21). On June 30, 2022, upon completion of the ManCo SPA, the ship management agreements were acquired by the Company. |
(b) | ECGS - We chartered Golar Ice to ECGS, an affiliate of Golar’s during the nine months period ended September 30, 2021. |
(c) | Debt guarantee compensation – Golar agreed to remain as the guarantor of the payment obligations of two of the acquired subsidiaries’ debt relating to two LNG carriers, Golar Ice and Golar Kelvin, in exchange for a guarantee fee of 0.5% on the outstanding principal balances, which as of September 30, 2022 was $218.6 million. The compensation amounted to $0.6 million for the nine month period ended September 30, 2022. |
(d) | Commitment fee – We obtained a two years revolving credit facility of $25.0 million from Golar, which remains undrawn as of September 30, 2022. The facility bears a fixed interest rate and commitment fee on the undrawn loan of 5% and 0.5% per annum, respectively. The commitment fee amounted to $0.1 million for the nine months ended September 30, 2022. |
(e) | Balances due to Golar and its subsidiaries - Receivables and payables with Golar and its subsidiaries are comprised primarily of unpaid management fees, advisory and administrative services. In addition, certain receivables and payables arise when Golar pays an invoice on our behalf. Receivables and payables are generally settled quarterly in arrears. Balances owing from Golar and its subsidiaries are unsecured, interest-free and intended to be settled in the ordinary course of business. |
(f) | Balances due to QPSL and its subsidiaries - Receivables and payables with QPSL and its subsidiaries are comprised primarily of management fees advances received for managing their vessels. We assumed these balances upon conclusion of the acquisition of the LNG carrier and FSRU management organization on June 30, 2022. |
| | | Successor (Consolidated) | | | Predecessor (Combined Carve-out) | | | Predecessor (Combined Carve-out) | |
| | | Phased period from January 27, 2022 to September 30, 2022 | | | Phased period from January 1, 2022 to June 30, 2022 | | | 2021 | |
(in thousands of $, except number of shares and per share data) | | | | | | | |||
Net income attributable to Owners of Cool Company Ltd. / Predecessor’s Parent | | | 52,529 | | | 15,038 | | | 5,892 |
Number of shares outstanding | | | 40,010,000 | | | 1,010,000 | | | 1,010,000 |
Basic and diluted earnings per share | | | $1.31 | | | $14.89 | | | $5.83 |
| | | September 30, 2022 | |
ASSETS | | | |
Current assets: | | | |
Amount due from related company, trade | | | $5,977,373 |
Amount due from immediate holding company, non-trade | | | 100 |
Prepaid expenses and other current assets | | | 1,188,968 |
Inventories | | | 218,328 |
Total current assets | | | 7,384,769 |
| | | ||
Noncurrent asset: | | | |
Vessel, net of accumulated depreciation of $2,297,754 | | | 146,753,066 |
Total noncurrent asset | | | 146,758,066 |
| | | ||
Total assets | | | $154,137,835 |
| | | ||
| | | ||
LIABILITIES AND EQUITY | | | |
Current liabilities: | | | |
Trade payable and accrued expenses | | | 1,939,531 |
Current portion of long-term debt | | | 10,636,749 |
Amount due to related party, non-trade | | | 29,500,000 |
Total current liabilities | | | 42,076,280 |
| | | ||
Noncurrent liability: | | | |
Long-term debt, net of deferred financing cost of $349,258 | | | 106,923,469 |
Total noncurrent liability | | | 106,923,469 |
| | | ||
Total liabilities | | | 148,999,749 |
| | | ||
Equity: | | | |
Common stock, no par value; 500 shares authorized, 100 shares issued and outstanding as of September 30, 2022 | | | 100 |
Accumulated earnings | | | 5,137,986 |
Total equity | | | 5,138,086 |
| | | ||
Total liabilities and equity | | | $ 154,137,835 |
| | | For the Period from April 29, 2022 to September 30, 2022 | |
Revenues | | | $11,042,745 |
| | | ||
Operating expenses: | | | |
Voyage expenses | | | 25,754 |
Vessel operating expenses | | | 1,918,114 |
Depreciation | | | 2,297,754 |
Total operating expenses | | | 4,241,622 |
| | | ||
Operating income | | | 6,801,123 |
| | | ||
Other income (expense): | | | |
Interest expense | | | (1,665,369) |
Foreign exchange gain, net | | | 2,232 |
Other expense, net | | | (1,663,137) |
| | | ||
Net income, representing comprehensive income | | | $5,137,986 |
| | | Share capital | | | Accumulated profits | | | Total | |
| | | US$ | | | US$ | | | US$ | |
| | | | | | | ||||
Balance at April 29, 2022, date of incorporation | | | $— | | | $— | | | $— |
| | | | | | | ||||
Issuance of shares on April 29, 2022, date of incorporation | | | 100 | | | — | | | 100 |
| | | | | | | ||||
Net income | | | — | | | 5,137,986 | | | 5,137,986 |
| | | | | | | ||||
Balance at September 30, 2022 | | | $100 | | | $5,137,986 | | | $5,138,086 |
| | | Period from April 29, 2022 to September 30, 2022 | |
Cashflows from operating activities: | | | |
Net income | | | $5,137,986 |
Adjustments to reconcile net income to net cash provided by operating activities: | | | |
Depreciation | | | 2,297,754 |
Amortization of deferred financing costs | | | 32,218 |
Changes in operating assets and liabilities: | | | |
Amount due from related company, trade | | | (6,716,163) |
Prepaid expenses and other current assets | | | (1,188,968) |
Inventories | | | (218,328) |
Trade payable and accrued expenses | | | 655,501 |
Net cash provided by operating activities | | | — |
| | | ||
Net increase in cash and cash equivalents | | | — |
| | | ||
Cash and cash equivalents at the beginning of period | | | — |
Cash and cash equivalents at end of period | | | — |
1 | GENERAL INFORMATION |
2 | SUMMARY OF SIGNIFICANT ACCOUNTING POLICIES |
3 | VESSEL, NET |
4 | LONG-TERM DEBT |
| | | 2022 | |
Principal amount | | | $118,000,000 |
Less: Unamortized deferred financing cost | | | (439,782) |
Less: Current portion | | | (10,636,749) |
Long-term debt, net | | | $106,923,469 |
| | | 2022 | |
Interest expense on bank loans | | | $1,627,420 |
Amortization of deferred financing cost | | | 32,218 |
Bank fee | | | 5,731 |
| | | $1,665,369 |
| | | Total | |
2023 | | | $10,727,273 |
2024 | | | 10,727,273 |
2025 | | | 10,727,273 |
2026 | | | 10,727,273 |
2027 | | | 10,727,273 |
Thereafter | | | 64,363,635 |
Total long-term debt | | | $118,000,000 |
5 | TRADE PAYABLES AND ACCRUED EXPENSES |
| | | 2022 | |
Trade payables | | | $27,658 |
Accrued vessel acquisition cost | | | 1,284,029 |
Accrued interest expense | | | 216,685 |
Accrued vessel operating expenses | | | 411,159 |
Trade payable and accrued expenses | | | $1,939,531 |
6 | FAIR VALUE OF FINANCIAL INSTRUMENT |
| | | 2022 | ||||
| | | Carrying value | | | Fair value | |
Principal amount of floating rate debt | | | $118,000,000 | | | $118,000,000 |
• | Level 1—Valuations based on quoted prices in active markets for identical instruments that the Company is able to access. Since valuations are based on quoted prices that are readily and regularly available in an active market, valuation of these instruments does not entail a significant degree of judgment. |
• | Level 2—Valuations based on quoted prices in active markets for instruments that are similar, or quoted prices in markets that are not active for identical or similar instruments, and model-derived valuations in which all significant inputs and significant value drivers are observable in active markets. |
• | Level 3—Valuations based on inputs that are unobservable and significant to the overall fair value measurement. |
7 | CASH FLOW INFORMATION |
8 | RELATED COMPANY AND PARTY TRANSACTIONS |
| | | 2022 | |
Receipts on behalf by related company: | | | |
Charter hire income | | | $11,018,991 |
| | | ||
Payments on behalf by related company: | | | |
Other expenses | | | (3,153,153) |
Loan interest and related fees | | | (1,888,465) |
Intercompany loan | | | (29,500,000) |
9 | COMMON STOCK |
10 | REVENUE |
| | | 2022 | |
2023 | | | $29,097,442 |
2024 | | | 29,177,161 |
2025 | | | 7,460,372 |
| | | $65,734,975 |
11 | SUBSEQUENT EVENTS |
| | | September 30, 2022 | |
ASSETS | | | |
Current assets: | | | |
Amount due from related company, trade | | | $5,885,311 |
Amount due from immediate holding company, non-trade | | | 100 |
Trade receivables | | | 2,630 |
Prepaid expenses and other current assets | | | 1,077,746 |
Inventories | | | 278,983 |
Total current assets | | | 7,244,770 |
| | | ||
Noncurrent asset: | | | |
Vessel, net of accumulated depreciation of $2,341,420 | | | 149,290,929 |
Total noncurrent asset | | | 149,290,929 |
| | | ||
Total assets | | | $156,535,699 |
| | | ||
| | | ||
LIABILITIES AND EQUITY | | | |
Current liabilities: | | | |
Trade payable and accrued expenses | | | 2,033,981 |
Current portion of long-term debt | | | 10,817,033 |
Amount due to related party, non-trade | | | 30,000,000 |
Total current liabilities | | | 42,851,014 |
| | | ||
Noncurrent liability: | | | |
Long-term debt, net of deferred financing cost of $355,178 | | | 108,735,731 |
Total noncurrent liability | | | 108,735,731 |
| | | ||
Total liabilities | | | 151,586,745 |
| | | ||
Equity: | | | |
Common stock, no par value; 500 shares authorized, 100 shares issued and outstanding as of September 30, 2022 | | | 100 |
Accumulated earnings | | | 4,948,854 |
Total equity | | | 4,948,954 |
| | | ||
Total liabilities and equity | | | $156,535,699 |
| | | For the Period from April 29, 2022 to September 30, 2022 | |
Revenues | | | $11,046,067 |
| | | ||
Operating expenses: | | | |
Voyage expenses | | | 126,080 |
Vessel operating expenses | | | 1,938,350 |
Depreciation | | | 2,341,420 |
Total operating expenses | | | 4,405,850 |
| | | ||
Operating income | | | 6,640,217 |
| | | ||
Other income (expense): | | | |
Interest expense | | | (1,693,595) |
Foreign exchange gain, net | | | 2,232 |
Other expense, net | | | (1,691,363) |
| | | ||
Net income, representing comprehensive income | | | $4,948,854 |
| | | Share capital | | | Accumulated profits | | | Total | |
| | | US$ | | | US$ | | | U$ | |
| | | | | | | ||||
Balance at April 29, 2022, date of incorporation | | | $— | | | $— | | | $— |
| | | | | | | ||||
Issuance of shares on April 29, 2022, date of incorporation | | | 100 | | | — | | | 100 |
| | | | | | | ||||
Net income | | | — | | | 4,948,854 | | | 4,948,854 |
| | | | | | | ||||
Balance at September 30, 2022 | | | $100 | | | $4,948,854 | | | $4,948,954 |
| | | Period from April 29, 2022 to September 30, 2022 | |
Cashflows from operating activities: | | | |
Net income | | | $4,948,854 |
Adjustments to reconcile net income to net cash provided by operating activities: | | | |
Depreciation | | | 2,341,420 |
Amortization of deferred financing costs | | | 32,764 |
Changes in operating assets and liabilities: | | | |
Amount due from related company, trade | | | (6,717,298) |
Prepaid expenses and other current assets | | | (1,077,746) |
Inventories | | | (278,983) |
Trade payable and accrued expenses | | | 753,619 |
Trade receivables | | | (2,630) |
Net cash provided by operating activities | | | — |
| | | ||
Net increase in cash and cash equivalents | | | — |
| | | ||
Cash and cash equivalents at the beginning of period | | | — |
Cash and cash equivalents at end of period | | | — |
1 | GENERAL INFORMATION |
2 | SUMMARY OF SIGNIFICANT ACCOUNTING POLICIES |
3 | VESSEL, NET |
4 | LONG-TERM DEBT |
| | | 2022 | |
Principal amount | | | $120,000,000 |
Less: Unamortized deferred financing cost | | | (447,236) |
Less: Current portion | | | (10,817,033) |
Long-term debt, net | | | $ 108,735,731 |
| | | 2022 | |
Interest expense on bank loans | | | $1,655,003 |
Amortization of deferred financing cost | | | 32,764 |
Bank fee | | | 5,828 |
| | | $1,693,595 |
| | | Total | |
2023 | | | $10,909,091 |
2024 | | | 10,909,091 |
2025 | | | 10,909,091 |
2026 | | | 10,909,091 |
2027 | | | 10,909,091 |
Thereafter | | | 65,454,545 |
Total long-term debt | | | $120,000,000 |
5 | TRADE PAYABLE AND ACCRUED EXPENSES |
| | | 2022 | |
Trade payables | | | $27,659 |
Accrued vessel acquisition cost | | | 1,280,362 |
Accrued interest expense | | | 220,358 |
Accrued vessel operating expenses | | | 505,602 |
Trade payable and accrued expenses | | | $2,033,981 |
6 | FAIR VALUE OF FINANCIAL INSTRUMENT |
| | | 2022 | ||||
| | | Carrying value | | | Fair value | |
Principal amount of floating rate debt | | | $120,000,000 | | | $120,000,000 |
• | Level 1—Valuations based on quoted prices in active markets for identical instruments that the Company is able to access. Since valuations are based on quoted prices that are readily and regularly available in an active market, valuation of these instruments does not entail a significant degree of judgment. |
• | Level 2—Valuations based on quoted prices in active markets for instruments that are similar, or quoted prices in markets that are not active for identical or similar instruments, and model-derived valuations in which all significant inputs and significant value drivers are observable in active markets. |
• | Level 3—Valuations based on inputs that are unobservable and significant to the overall fair value measurement. |
7 | CASH FLOW INFORMATION |
8 | RELATED COMPANY AND PARTY TRANSACTIONS |
| | | 2022 | |
Receipts on behalf by related company: | | | |
Charter hire income | | | $11,019,115 |
| | | ||
Payments on behalf by related company: | | | |
Other expenses | | | (3,213,332) |
Loan interest and related fees | | | (1,920,472) |
Intercompany loan | | | (30,000,000) |
9 | COMMON STOCK |
10 | REVENUE |
| | | 2022 | |
2023 | | | $29,097,442 |
2024 | | | 29,177,162 |
2025 | | | 19,985,226 |
| | | $78,259,830 |
11 | SUBSEQUENT EVENTS |
| | | September 30, 2022 | |
ASSETS | | | |
Current assets: | | | |
Amount due from related company, trade | | | $4,093,159 |
Amount due from immediate holding company, non-trade | | | 100 |
Prepaid expenses and other current assets | | | 897,708 |
Inventories | | | 276,040 |
Total current assets | | | 5,267,007 |
| | | ||
Noncurrent asset: | | | |
Vessel, net of accumulated depreciation of $2,273,692 | | | 173,544,592 |
Total noncurrent asset | | | 173,544,592 |
| | | ||
Total assets | | | $178,811,599 |
| | | ||
LIABILITIES AND EQUITY | | | |
Current liabilities: | | | |
Trade payable and accrued expenses | | | 1,051,744 |
Current portion of long-term debt | | | 8,653,368 |
Amount due to related party, non-trade | | | 35,000,000 |
Total current liabilities | | | 44,705,112 |
| | | ||
Noncurrent liability: | | | |
Long-term debt, net of deferred financing cost of $429,568 | | | 130,820,432 |
Total noncurrent liability | | | 130,820,432 |
| | | ||
Total liabilities | | | 175,525,544 |
| | | ||
Equity: | | | |
Common stock, no par value; 500 shares authorized, 100 shares issued and outstanding as of September 30, 2022 | | | 100 |
Accumulated earnings | | | 3,285,955 |
Total equity | | | 3,286,055 |
| | | ||
Total liabilities and equity | | | $178,811,599 |
| | | For the Period from April 29, 2022 to September 30, 2022 | |
Revenues | | | $9,219,948 |
| | | ||
Operating expenses: | | | |
Voyage expenses | | | 35,094 |
Vessel operating expenses | | | 1,656,010 |
Depreciation | | | 2,273,692 |
Total operating expenses | | | 3,964,796 |
| | | ||
Operating income | | | 5,255,152 |
| | | ||
Other income (expense): | | | |
Interest expense | | | (1,971,429) |
Foreign exchange gain, net | | | 2,232 |
Other expense, net | | | (1,969,197) |
| | | ||
Net income, representing comprehensive income | | | $3,285,955 |
| | | Share capital | | | Accumulated profits | | | Total | |
| | | US$ | | | US$ | | | U$ | |
Balance at April 29, 2022, date of incorporation | | | $— | | | $— | | | $— |
| | | | | | | ||||
Issuance of shares on April 29, 2022, date of incorporation | | | 100 | | | — | | | 100 |
| | | | | | | ||||
Net income | | | — | | | 3,285,955 | | | 3,285,955 |
| | | | | | | ||||
Balance at September 30, 2022 | | | $100 | | | $3,285,955 | | | $3,286,055 |
| | | Period from April 29, 2022 to September 30, 2022 | |
Cashflows from operating activities: | | | |
Net income | | | $3,285,955 |
Adjustments to reconcile net income to net cash provided by operating activities: | | | |
Depreciation | | | 2,273,692 |
Amortization of deferred financing costs | | | 33,800 |
Changes in operating assets and liabilities: | | | |
Amount due from related company, trade | | | (5,110,089) |
Prepaid expenses and other current assets | | | (897,708) |
Inventories | | | (276,040) |
Trade payable and accrued expenses | | | 690,390 |
Net cash provided by operating activities | | | — |
| | | ||
Net increase in cash and cash equivalents | | | — |
| | | ||
Cash and cash equivalents at the beginning of period | | | — |
Cash and cash equivalents at end of period | | | — |
| | | 2022 | |
Principal amount | | | $140,000,000 |
Less: Unamortized deferred financing cost | | | (526,200) |
Less: Current portion | | | (8,653,368) |
Long-term debt, net | | | $130,820,432 |
| | | 2022 | |
Interest expense on bank loans | | | $1,930,837 |
Amortization of deferred financing cost | | | 33,800 |
Bank fee | | | 6,792 |
| | | $1,971,429 |
| | | Total | |
2023 | | | $8,750,000 |
2024 | | | 8,750,000 |
2025 | | | 8,750,000 |
2026 | | | 8,750,000 |
2027 | | | 8,750,000 |
Thereafter | | | 96,250,000 |
Total long-term debt | | | $140,000,000 |
| | | 2022 | |
Trade payables | | | $27,106 |
Accrued vessel acquisition cost | | | 361,354 |
Accrued interest expense | | | 257,084 |
Accrued vessel operating expenses | | | 406,200 |
Trade payable and accrued expenses | | | $1,051,744 |
| | | 2022 | ||||
| | | Carrying value | | | Fair value | |
Principal amount of floating rate debt | | | $140,000,000 | | | $140,000,000 |
• | Level 1—Valuations based on quoted prices in active markets for identical instruments that the Company is able to access. Since valuations are based on quoted prices that are readily and regularly available in an active market, valuation of these instruments does not entail a significant degree of judgment. |
• | Level 2—Valuations based on quoted prices in active markets for instruments that are similar, or quoted prices in markets that are not active for identical or similar instruments, and model-derived valuations in which all significant inputs and significant value drivers are observable in active markets. |
• | Level 3—Valuations based on inputs that are unobservable and significant to the overall fair value measurement. |
| | | 2022 | |
Receipts on behalf by related company: | | | |
Charter hire income | | | $9,188,306 |
| | | ||
Payments on behalf by related company: | | | |
Other expenses | | | (2,854,602) |
Loan interest and related fees | | | (2,240,545) |
Intercompany loan | | | (35,000,000) |
| | | 2022 | |
2023 | | | $24,272,500 |
2024 | | | 24,339,000 |
2025 | | | 24,272,500 |
2026 | | | 24,272,500 |
2027 | | | 23,164,721 |
| | | $120,321,221 |
| | | September 30, 2022 | |
ASSETS | | | |
Current assets: | | | |
Amount due from related company, trade | | | $4,095,237 |
Amount due from immediate holding company, non-trade | | | 100 |
Prepaid expenses and other current assets | | | 902,994 |
Inventories | | | 245,750 |
Total current assets | | | 5,244,081 |
| | | ||
Noncurrent asset: | | | |
Vessel, net of accumulated depreciation of $2,228,774 | | | 176,085,550 |
Total noncurrent asset | | | 176,085,550 |
| | | ||
Total assets | | | $181,329,631 |
| | | ||
LIABILITIES AND EQUITY | | | |
Current liabilities: | | | |
Trade payable and accrued expenses | | | 1,359,181 |
Current portion of long-term debt | | | 8,256,160 |
Amount due to related party, non-trade | | | 35,500,000 |
Total current liabilities | | | 45,115,341 |
| | | ||
Noncurrent liability: | | | |
Long-term debt, net of deferred financing cost of $437,442 | | | 133,209,616 |
Total noncurrent liability | | | 133,209,616 |
| | | ||
Total liabilities | | | 178,324,957 |
| | | ||
Equity: | | | |
Common stock, no par value; 500 shares authorized, 100 shares issued and outstanding as of September 30, 2022 | | | 100 |
Accumulated earnings | | | 3,004,574 |
Total equity | | | 3,004,674 |
| | | ||
Total liabilities and equity | | | $ 181,329,631 |
| | | For the Period from April 29, 2022 to September 30, 2022 | |
Revenues | | | $9,213,021 |
| | | ||
Operating expenses: | | | |
Voyage expenses | | | 168,454 |
Vessel operating expenses | | | 1,814,370 |
Depreciation | | | 2,228,774 |
Total operating expenses | | | 4,211,598 |
| | | ||
Operating income | | | 5,001,423 |
| | | ||
Other income (expense): | | | |
Interest expense | | | (1,999,081) |
Foreign exchange gain, net | | | 2,232 |
Other expense, net | | | (1,996,849) |
| | | ||
Net income, representing comprehensive income | | | $3,004,574 |
| | | Share capital | | | Accumulated profits | | | Total | |
| | | US$ | | | US$ | | | US$ | |
| | | | | | | ||||
Balance at April 29, 2022, date of incorporation | | | $— | | | $— | | | $— |
| | | | | | | ||||
Issuance of shares on April 29, 2022, date of incorporation | | | 100 | | | — | | | 100 |
| | | | | | | ||||
Net income | | | — | | | 3,004,574 | | | 3,004,574 |
| | | | | | | ||||
Balance at September 30, 2022 | | | $100 | | | $3,004,574 | | | $3,004,674 |
| | | Period from April 29, 2022 to September 30, 2022 | |
Cashflows from operating activities: | | | |
Net income | | | $3,004,574 |
Adjustments to reconcile net income to net cash provided by operating activities: | | | |
Depreciation | | | 2,228,574 |
Amortization of deferred financing costs | | | 33,776 |
Changes in operating assets and liabilities: | | | |
Amount due from related company, trade | | | (5,021,603) |
Prepaid expenses and other current assets | | | (902,994) |
Inventories | | | (245,750) |
Trade payable and accrued expenses | | | 903,423 |
Net cash provided by operating activities | | | — |
| | | ||
Net increase in cash and cash equivalents | | | — |
| | | ||
Cash and cash equivalents at the beginning of period | | | — |
Cash and cash equivalents at end of period | | | — |
| | | 2022 | |
Principal amount | | | $142,000,000 |
Less: Unamortized deferred financing cost | | | (534,224) |
Less: Current portion | | | (8,256,160) |
Long-term debt, net | | | $132,209,616 |
| | | 2022 | |
Interest expense on bank loans | | | $1,958,421 |
Amortization of deferred financing cost | | | 33,776 |
Bank fee | | | 6,884 |
| | | $1,999,081 |
| | | Total | |
2023 | | | $8,352,941 |
2024 | | | 8,352,941 |
2025 | | | 8,352,941 |
2026 | | | 8,352,941 |
2027 | | | 8,352,941 |
Thereafter | | | 100,235,295 |
Total long-term debt | | | $142,000,000 |
| | | 2022 | |
Trade payables | | | $27,106 |
Accrued vessel acquisition cost | | | 455,758 |
Accrued interest expense | | | 260,757 |
Accrued vessel operating expenses | | | 615,560 |
Trade payable and accrued expenses | | | $1,359,181 |
| | | 2022 | ||||
| | | Carrying value | | | Fair value | |
Principal amount of floating rate debt | | | $142,000,000 | | | $142,000,000 |
• | Level 1—Valuations based on quoted prices in active markets for identical instruments that the Company is able to access. Since valuations are based on quoted prices that are readily and regularly available in an active market, valuation of these instruments does not entail a significant degree of judgment. |
• | Level 2—Valuations based on quoted prices in active markets for instruments that are similar, or quoted prices in markets that are not active for identical or similar instruments, and model-derived valuations in which all significant inputs and significant value drivers are observable in active markets. |
• | Level 3—Valuations based on inputs that are unobservable and significant to the overall fair value measurement. |
| | | 2022 | |
Receipts on behalf by related company: | | | |
Charter hire income | | | $9,191,763 |
| | | ||
Payments on behalf by related company: | | | |
Other expenses | | | (2,823,978) |
Loan interest and related fees | | | (2,272,548) |
Intercompany loan | | | (35,500,000) |
| | | 2022 | |
2023 | | | $24,272,500 |
2024 | | | 24,339,000 |
2025 | | | 24,272,500 |
2026 | | | 24,272,500 |
2027 | | | 24,272,500 |
Thereafter | | | 7,010,208 |
| | | $128,439,208 |