
| REIT | Real estate investment trust | ||||
| WPC | W. P. Carey Inc., a net-lease REIT (also our “Advisor”) | ||||
| Spin-Off | The spin-off of 59 office properties owned by WPC into NLOP, a separate publicly-traded REIT, which was completed on November 1, 2023 | ||||
| U.S. | United States | ||||
| ABR | Contractual minimum annualized base rent | ||||
| SEC | Securities and Exchange Commission | ||||
| NAREIT | National Association of Real Estate Investment Trusts (an industry trade group) | ||||
| WALT | Weighted-average lease term | ||||
| NLOP Mortgage Loan | Our $335.0 million senior secured mortgage loan | ||||
| NLOP Mezzanine Loan | Our $120.0 million mezzanine loan facility | ||||
| NLOP Financing Arrangements | The NLOP Mortgage Loan and NLOP Mezzanine Loan, which are collateralized by the assignment of certain of our previously unencumbered real estate properties | ||||
| SOFR | Secured Overnight Financing Rate | ||||
| Table of Contents | |||||
| Appendix | |||||
| Summary Metrics | |||||
| Financial Results | |||||||||||||||||||||||
| Revenues, including reimbursable costs – consolidated ($000s) | $ | 174,965 | |||||||||||||||||||||
| Net income attributable to NLOP ($000s) | (131,746) | ||||||||||||||||||||||
| Net loss attributable to NLOP per diluted share | (9.00) | ||||||||||||||||||||||
Normalized pro rata cash NOI ($000s) (a) (b) | 132,605 | ||||||||||||||||||||||
AFFO attributable to NLOP ($000s) (a) (b) | 93,928 | ||||||||||||||||||||||
AFFO attributable to NLOP per diluted share (a) (b) | 6.42 | ||||||||||||||||||||||
| Dividends declared per share – December 2023 | $ | 0.34 | |||||||||||||||||||||
| Balance Sheet and Capitalization | |||||||||||||||||||||||
| Equity market capitalization – based on quarter end share price of $18.48 ($000s) | $ | 270,195 | |||||||||||||||||||||
| Total consolidated debt ($000s) | 541,979 | ||||||||||||||||||||||
Gross assets ($000s) (c) | 1,518,123 | ||||||||||||||||||||||
| Total consolidated debt to gross assets | 35.7 | % | |||||||||||||||||||||
NLOP Mortgage Loan principal outstanding (as a % of original principal) (d) | 86.2 | % | |||||||||||||||||||||
NLOP Mezzanine Loan principal outstanding (as a % of original principal) (d) | 95.3 | % | |||||||||||||||||||||
| Advisory Fees and Reimbursements Paid to WPC | |||||||||||||||||||||||
Asset management fees (e) | $ | 1,245 | |||||||||||||||||||||
Administrative reimbursements (f) | 667 | ||||||||||||||||||||||
Portfolio (Pro Rata) (b) | |||||||||||||||||||||||
ABR (in thousands) (g) | $ | 142,438 | |||||||||||||||||||||
| Number of properties | 55 | ||||||||||||||||||||||
| Number of tenants | 59 | ||||||||||||||||||||||
| Occupancy | 97.0 | % | |||||||||||||||||||||
| Weighted-average lease term (in years) | 5.8 | ||||||||||||||||||||||
Leasable square footage (in thousands) (h) | 8,379 | ||||||||||||||||||||||
ABR from investment grade tenants as a % of total ABR (i) | 64.9 | % | |||||||||||||||||||||
| Dispositions – number of properties sold | 4 | ||||||||||||||||||||||
| Dispositions – gross proceeds (in thousands) | $ | 43,081 | |||||||||||||||||||||
Net Lease Office Properties | 1 | |||||
| Statement of Income | |||||
Year Ended December 31, 2023 | |||||
| Revenues | |||||
| Lease revenues | $ | 166,034 | |||
| Income from finance leases | 1,189 | ||||
| Other lease-related income | 7,742 | ||||
| 174,965 | |||||
| Operating Expenses | |||||
| Depreciation and amortization | 74,998 | ||||
Impairment charges — real estate (a) | 63,143 | ||||
Impairment charges — goodwill (b) | 62,456 | ||||
| Reimbursable tenant costs | 27,957 | ||||
General and administrative (c) | 13,610 | ||||
| Property expenses, excluding reimbursable tenant costs | 8,642 | ||||
Separation and distribution related costs and other (d) | 8,446 | ||||
Asset management fees (e) | 1,245 | ||||
| 260,497 | |||||
| Other Income and Expenses | |||||
| Interest expense | (42,613) | ||||
| Loss on sale of real estate, net | (3,608) | ||||
| Other gains and (losses) | 456 | ||||
| (45,765) | |||||
| Loss before income taxes | (131,297) | ||||
| Provision for income taxes | (425) | ||||
| Net Loss | (131,722) | ||||
| Net income attributable to noncontrolling interests | (24) | ||||
| Net Loss Attributable to NLOP | $ | (131,746) | |||
| Basic and Diluted Loss Per Share | $ | (9.00) | |||
| Weighted-Average Shares Outstanding | |||||
| Basic and Diluted | 14,631,265 | ||||
| Dividends Declared Per Share | $ | 0.34 | |||
Net Lease Office Properties | 2 | |||||
| FFO and AFFO, Combined and Consolidated | |||||
Year Ended December 31, 2023 | |||||
| Net loss attributable to NLOP | $ | (131,746) | |||
| Adjustments: | |||||
| Depreciation and amortization of real property | 74,998 | ||||
Impairment charges — real estate (a) | 63,143 | ||||
Impairment charges — goodwill (b) | 62,456 | ||||
| Loss on sale of real estate, net | 3,608 | ||||
Proportionate share of adjustments for noncontrolling interests (c) | (206) | ||||
| Total adjustments | 203,999 | ||||
FFO (as defined by NAREIT) Attributable to NLOP (d) | 72,253 | ||||
| Adjustments: | |||||
Separation and distribution related costs and other (e) | 8,446 | ||||
| Amortization of deferred financing costs | 7,672 | ||||
Above- and below-market rent intangible lease amortization, net | 4,335 | ||||
| Stock-based compensation | 2,904 | ||||
| Tax benefit – deferred and other | (1,200) | ||||
| Straight-line and other leasing and financing adjustments | (631) | ||||
| Other amortization and non-cash items | 547 | ||||
| Other (gains) and losses | (337) | ||||
Proportionate share of adjustments for noncontrolling interests (c) | (61) | ||||
| Total adjustments | 21,675 | ||||
AFFO Attributable to NLOP (d) | $ | 93,928 | |||
| Summary | |||||
FFO (as defined by NAREIT) attributable to NLOP (d) | $ | 72,253 | |||
FFO (as defined by NAREIT) attributable to NLOP per diluted share (d) | $ | 4.94 | |||
AFFO attributable to NLOP (d) | $ | 93,928 | |||
AFFO attributable to NLO per diluted share (d) | $ | 6.42 | |||
| Diluted weighted-average shares outstanding | 14,631,265 | ||||
Net Lease Office Properties | 3 | |||||
| Consolidated Balance Sheet | |||||
| December 31, 2023 | |||||
| Assets | |||||
| Investments in real estate: | |||||
| Land, buildings and improvements | $ | 1,203,991 | |||
| Net investments in finance leases | 10,522 | ||||
| In-place lease intangible assets and other | 357,788 | ||||
| Above-market rent intangible assets | 57,954 | ||||
| Investments in real estate | 1,630,255 | ||||
| Accumulated depreciation and amortization | (458,430) | ||||
| Net investments in real estate | 1,171,825 | ||||
| Restricted cash | 51,560 | ||||
| Cash and cash equivalents | 16,269 | ||||
| Other assets, net | 65,435 | ||||
| Total assets | $ | 1,305,089 | |||
| Liabilities and Equity | |||||
| Debt: | |||||
| NLOP Mortgage Loan, net | $ | 266,844 | |||
| NLOP Mezzanine Loan, net | 106,299 | ||||
| Non-recourse mortgages, net | 168,836 | ||||
| Debt, net | 541,979 | ||||
| Accounts payable, accrued expenses and other liabilities | 59,527 | ||||
| Below-market rent intangible liabilities, net | 10,643 | ||||
| Deferred income taxes | 10,450 | ||||
| Dividends payable | 1,060 | ||||
| Total liabilities | 623,659 | ||||
Preferred stock, $0.001 par value, 5,000,000 shares authorized; none issued | — | ||||
Common stock, $0.001 par value, 45,000,000 shares authorized; 14,620,919 shares issued and outstanding | 15 | ||||
| Additional paid-in capital | 855,554 | ||||
| Distributions in excess of accumulated earnings | (142,960) | ||||
| Accumulated other comprehensive loss | (35,600) | ||||
| Total shareholders' equity | 677,009 | ||||
| Noncontrolling interests | 4,421 | ||||
| Total equity | 681,430 | ||||
| Total liabilities and equity | $ | 1,305,089 | |||
Net Lease Office Properties | 4 | |||||
| Capitalization | |||||
| Total Enterprise Value | Shares | Share Price | Market Value | |||||||||||||||||||||||
| Equity | ||||||||||||||||||||||||||
| Common equity | 14,620,919 | $ | 18.48 | $ | 270,195 | |||||||||||||||||||||
| Total Equity Market Capitalization | 270,195 | |||||||||||||||||||||||||
Outstanding Balance (a) | ||||||||||||||||||||||||||
| Debt | ||||||||||||||||||||||||||
| NLOP Mortgage Loan | 288,895 | |||||||||||||||||||||||||
| NLOP Mezzanine Loan | 114,336 | |||||||||||||||||||||||||
| Non-recourse mortgages, net | 169,526 | |||||||||||||||||||||||||
| Total Debt | 572,757 | |||||||||||||||||||||||||
| Less: Cash and cash equivalents | (16,269) | |||||||||||||||||||||||||
| Net Debt | 556,488 | |||||||||||||||||||||||||
| Total Enterprise Value | $ | 826,683 | ||||||||||||||||||||||||
Net Lease Office Properties | 5 | |||||
| Debt Overview | |||||
| Maturity Date | Fixed / Floating | Interest Rate | Total Outstanding Balance (a) | % of Total | ||||||||||||||||||||||||||||
| NLOP Financing Arrangements | ||||||||||||||||||||||||||||||||
NLOP Mortgage Loan (b) | 11/9/2025 | Floating | 10.4 | % | $ | 288,895 | 50.4 | % | ||||||||||||||||||||||||
NLOP Mezzanine Loan (c) | 11/9/2028 | Fixed | 14.5 | % | 114,336 | 20.0 | % | |||||||||||||||||||||||||
| Other Mortgages (Tenant Listed) | ||||||||||||||||||||||||||||||||
AVT Technology Solutions LLC (d) | 1/6/2024 | Fixed | 5.1 | % | 13,184 | 2.3 | % | |||||||||||||||||||||||||
| Exelon Generation Company, LLC | 3/10/2024 | Fixed | 6.5 | % | 19,906 | 3.5 | % | |||||||||||||||||||||||||
| Orbital ATK, Inc. | 1/6/2025 | Fixed | 4.2 | % | 25,754 | 4.5 | % | |||||||||||||||||||||||||
| Midcontinent Independent Stm Op Inc | 5/6/2025 | Fixed | 4.0 | % | 9,123 | 1.6 | % | |||||||||||||||||||||||||
| Intuit Inc. | 5/6/2025 | Fixed | 4.1 | % | 21,900 | 3.8 | % | |||||||||||||||||||||||||
| Acosta, Inc. | 8/6/2025 | Fixed | 4.4 | % | 10,062 | 1.8 | % | |||||||||||||||||||||||||
Google, LLC (e) | 11/1/2025 | Fixed | 5.2 | % | 18,984 | 3.3 | % | |||||||||||||||||||||||||
| Siemens AS | 12/15/2025 | Floating | 4.8 | % | 42,446 | 7.4 | % | |||||||||||||||||||||||||
| Merative L.P. | 4/1/2026 | Fixed | 5.7 | % | 1,953 | 0.3 | % | |||||||||||||||||||||||||
| North American Lighting, Inc. | 5/6/2026 | Fixed | 4.8 | % | 6,214 | 1.1 | % | |||||||||||||||||||||||||
| Total Debt Outstanding | 9.5 | % | $ | 572,757 | 100.0 | % | ||||||||||||||||||||||||||
Net Lease Office Properties | 6 | |||||
| Dispositions | |||||
| Tenant / Lease Guarantor | Property Location(s) | Gross Sale Price | ABR | Closing Date | Gross Square Footage | |||||||||||||||||||||||||||
| 4Q23 | ||||||||||||||||||||||||||||||||
| Raytheon Company | Tucson, AZ | $ | 24,575 | $ | 1,978 | Dec-23 | 143,650 | |||||||||||||||||||||||||
| Carhartt, Inc. | Dearborn, MI | 9,806 | 748 | Dec-23 | 58,722 | |||||||||||||||||||||||||||
| BCBSM, Inc. | Eagan, MN | 2,500 | 298 | Dec-23 | 29,916 | |||||||||||||||||||||||||||
| AVL Michigan Holding Corporation | Plymouth, MI | 6,200 | 575 | Dec-23 | 70,000 | |||||||||||||||||||||||||||
| 4Q23 Total | 43,081 | 3,599 | 302,288 | |||||||||||||||||||||||||||||
| Year-to-Date Total Dispositions | $ | 43,081 | $ | 3,599 | 302,288 | |||||||||||||||||||||||||||
Net Lease Office Properties | 7 | |||||
| Capital Expenditures and Leasing Activity | |||||
| Tenant Improvements and Leasing Costs | |||||
| Tenant Improvements (Tenant Listed) | |||||
| CVS Health Corporation | $ | 819 | |||
| Xileh Holding, Inc. | 15 | ||||
| 834 | |||||
| Leasing Costs | — | ||||
| Tenant Improvements and Leasing Costs | 834 | ||||
| Maintenance Capital Expenditures (Tenant Listed) | |||||
| KBR, Inc. | 371 | ||||
| Exelon Generation Company, LLC | 67 | ||||
| Other | 36 | ||||
| 474 | |||||
| Total: Tenant Improvements and Leasing Costs, and Maintenance Capital Expenditures | $ | 1,308 | |||
Lease Renewals and Extensions (a) | Expected Tenant Improvements ($000s) | Leasing Commissions ($000s) | ||||||||||||||||||||||||||||||||||||||||||||||||
| ABR | ||||||||||||||||||||||||||||||||||||||||||||||||||
| Tenant | Location | Square Feet | Prior Lease ($000s) | New Lease ($000s) (b) | Rent Recapture | Incremental Lease Term | ||||||||||||||||||||||||||||||||||||||||||||
| BCBSM, Inc. (2 properties) | Eagan, MN | 347,472 | $ | 5,041 | $ | 4,663 | 92.5 | % | $ | 1,624 | $ | — | 10.0 years | |||||||||||||||||||||||||||||||||||||
| Nokia Corporation | Krakow, Poland | 53,400 | 1,096 | 829 | 75.6 | % | 995 | — | 5.0 years | |||||||||||||||||||||||||||||||||||||||||
| Merative L.P. | Hartland, WI | 81,082 | 909 | 669 | 73.6 | % | 1,650 | 559 | 10.0 years | |||||||||||||||||||||||||||||||||||||||||
Total / Weighted Average (c) | 481,954 | $ | 7,046 | $ | 6,161 | 87.4 | % | $ | 4,269 | $ | 559 | 9.4 years | ||||||||||||||||||||||||||||||||||||||
Net Lease Office Properties | 8 | |||||
| Top Ten Tenants | |||||
| Tenant / Lease Guarantor | State / Country | ABR | ABR % | Square Footage (a) | Number of Properties | Weighted-Average Lease Term (Years) | ||||||||||||||||||||||||||||||||
| KBR, Inc. | Texas | $ | 20,156 | 14.2 | % | 913,713 | 1 | 6.5 | ||||||||||||||||||||||||||||||
| BCBSM, Inc. | Minnesota | 13,007 | 9.1 | % | 1,029,966 | 5 | 5.4 | |||||||||||||||||||||||||||||||
| JPMorgan Chase Bank, N.A. | Florida, Texas | 8,891 | 6.2 | % | 666,869 | 3 | 5.4 | |||||||||||||||||||||||||||||||
| FedEx Corporation | Tennessee | 5,491 | 3.9 | % | 390,380 | 1 | 15.9 | |||||||||||||||||||||||||||||||
Total E&P Norge AS (b) | Norway | 5,185 | 3.6 | % | 275,725 | 1 | 7.5 | |||||||||||||||||||||||||||||||
Siemens AS (b) | Norway | 4,503 | 3.2 | % | 165,905 | 1 | 2.0 | |||||||||||||||||||||||||||||||
McKesson Corporation (US Oncology) (c) | Texas | 4,406 | 3.1 | % | 204,063 | 1 | 0.1 | |||||||||||||||||||||||||||||||
| CVS Health Corporation | Arizona | 4,300 | 3.0 | % | 354,888 | 1 | 15.0 | |||||||||||||||||||||||||||||||
| Pharmaceutical Product Development, LLC | North Carolina | 3,983 | 2.8 | % | 219,812 | 1 | 9.9 | |||||||||||||||||||||||||||||||
| Omnicom Group, Inc. | California | 3,961 | 2.8 | % | 120,000 | 1 | 4.8 | |||||||||||||||||||||||||||||||
Total (d) | $ | 73,883 | 51.9 | % | 4,341,321 | 16 | 6.9 | |||||||||||||||||||||||||||||||
Net Lease Office Properties | 9 | |||||
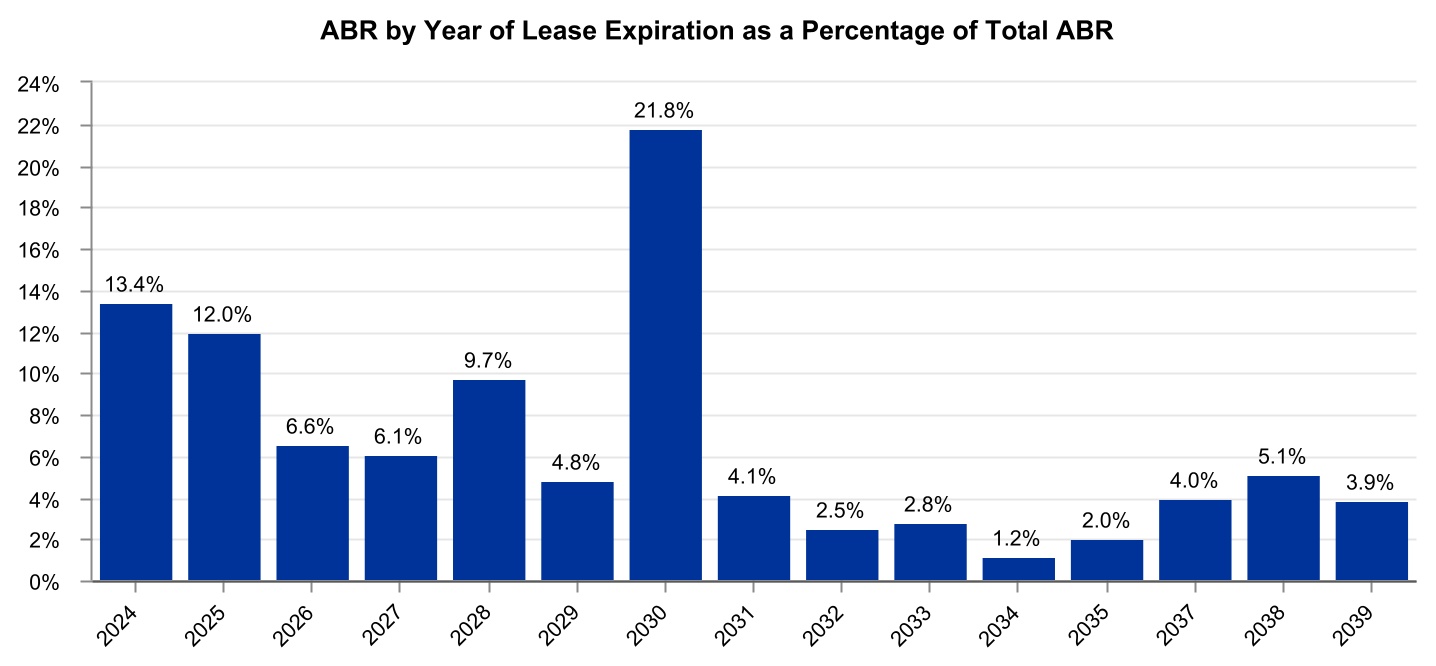
| Lease Expirations | |||||
Year of Lease Expiration (a) | Number of Leases Expiring | Number of Tenants with Leases Expiring | ABR | ABR % | Square Footage (b) | Square Footage % | ||||||||||||||||||||||||||||||||
| 2024 | 11 | 8 | $ | 19,081 | 13.4 | % | 1,199,405 | 14.3 | % | |||||||||||||||||||||||||||||
| 2025 | 13 | 13 | 17,158 | 12.0 | % | 859,031 | 10.2 | % | ||||||||||||||||||||||||||||||
| 2026 | 8 | 8 | 9,361 | 6.6 | % | 574,783 | 6.9 | % | ||||||||||||||||||||||||||||||
| 2027 | 7 | 6 | 8,652 | 6.1 | % | 499,571 | 6.0 | % | ||||||||||||||||||||||||||||||
| 2028 | 7 | 6 | 13,800 | 9.7 | % | 627,627 | 7.5 | % | ||||||||||||||||||||||||||||||
| 2029 | 5 | 4 | 6,768 | 4.8 | % | 358,013 | 4.3 | % | ||||||||||||||||||||||||||||||
| 2030 | 5 | 4 | 31,005 | 21.8 | % | 1,669,375 | 19.9 | % | ||||||||||||||||||||||||||||||
| 2031 | 2 | 2 | 5,785 | 4.1 | % | 326,325 | 3.9 | % | ||||||||||||||||||||||||||||||
| 2032 | 2 | 2 | 3,620 | 2.5 | % | 257,008 | 3.1 | % | ||||||||||||||||||||||||||||||
| 2033 | 1 | 1 | 3,983 | 2.8 | % | 219,812 | 2.6 | % | ||||||||||||||||||||||||||||||
| 2034 | 1 | 1 | 1,761 | 1.2 | % | 80,664 | 1.0 | % | ||||||||||||||||||||||||||||||
| 2035 | 2 | 2 | 2,911 | 2.0 | % | 201,229 | 2.4 | % | ||||||||||||||||||||||||||||||
| 2037 | 2 | 2 | 5,735 | 4.0 | % | 402,962 | 4.8 | % | ||||||||||||||||||||||||||||||
| 2038 | 2 | 2 | 7,327 | 5.1 | % | 459,486 | 5.5 | % | ||||||||||||||||||||||||||||||
| 2039 | 1 | 1 | 5,491 | 3.9 | % | 390,380 | 4.6 | % | ||||||||||||||||||||||||||||||
| Vacant | — | — | — | — | % | 253,791 | 3.0 | % | ||||||||||||||||||||||||||||||
Total (c) | 69 | $ | 142,438 | 100.0 | % | 8,379,462 | 100.0 | % | ||||||||||||||||||||||||||||||
Net Lease Office Properties | 10 | |||||
| Property List | |||||
| Encumbered Status | ||||||||||||||||||||||||||||||||||||||
| # | Primary Tenant | Industry | Credit (a) | City | State | Square Footage (b) | ABR | Rent Increase Type | Date of Next Increase | WALT (c) | NLOP Mortgage Loan | Other Mortgages | ||||||||||||||||||||||||||
| 1 | KBR, Inc. (d) (e) | Construction & Engineering | Non-IG | Houston | Texas | 1,064,788 | $21,280 | Fixed: One-time 7.78% | Jan-27 | 6.4 | ✓ | $— | ||||||||||||||||||||||||||
| 2 | FedEx Corporation | Air Freight & Logistics | IG | Collierville | Tennessee | 390,380 | $5,491 | Fixed: 0.75% annually | Oct-24 | 15.9 | ✓ | $— | ||||||||||||||||||||||||||
| 3 | BCBSM, Inc. | Managed Health Care | IG | Eagan | Minnesota | 442,542 | $4,952 | Fixed: 2.00% annually | Feb-24 | 0.5 | ✓ | $— | ||||||||||||||||||||||||||
| 4 | JPMorgan Chase Bank, N.A. | Diversified Banks | IG | Fort Worth | Texas | 386,154 | $4,661 | CPI: 0.0% Floor / 2.0% Cap | Mar-24 | 6.2 | ✓ | $— | ||||||||||||||||||||||||||
| 5 | McKesson Corporation (US Oncology) (f) | Health Care Distributors | IG | The Woodlands | Texas | 204,063 | $4,406 | Fixed: 4.88% every 3 yrs | N/A | 0.1 | ✓ | $— | ||||||||||||||||||||||||||
| 6 | CVS Health Corporation | Health Care Services | IG | Scottsdale | Arizona | 354,888 | $4,300 | Fixed: 2.00% annually | Est. 2025 (g) | 15.0 | ✓ | $— | ||||||||||||||||||||||||||
| 7 | Pharmaceutical Product Development, LLC | Pharmaceuticals | IG | Morrisville | North Carolina | 219,812 | $3,983 | Fixed: 2.00% annually | Oct-24 | 9.9 | ✓ | $— | ||||||||||||||||||||||||||
| 8 | Omnicom Group, Inc. | Advertising | IG | Playa Vista | California | 120,000 | $3,961 | None | N/A | 4.8 | ✓ | $— | ||||||||||||||||||||||||||
| 9 | Orbital ATK, Inc. | Aerospace & Defense | IG | Plymouth | Minnesota | 191,336 | $3,821 | Fixed: 2.00% annually | Dec-24 | 5.9 | $25,754 | |||||||||||||||||||||||||||
| 10 | R.R. Donnelley & Sons Company | Commercial Printing | Non-IG | Warrenville | Illinois | 167,215 | $3,327 | Fixed: 2.00% annually | Sep-24 | 3.7 | ✓ | $— | ||||||||||||||||||||||||||
| 11 | Caremark RX, L.L.C. (d) (e) | Health Care Services | IG | Chandler | Arizona | 183,000 | $3,271 | Fixed: $0.50/SF annually | N/A | 0.4 | ✓ | $— | ||||||||||||||||||||||||||
| 12 | Board of Regents, State of Iowa (h) | Government Related Services | IG | Coralville | Iowa | 191,700 | $3,254 | CPI: 0.0% Floor / No Cap | Nov-25 | 6.8 | $— | |||||||||||||||||||||||||||
| 13 | Bankers Financial Corporation (d) (e) | Property & Casualty Insurance | Non-IG | St. Petersburg | Florida | 167,581 | $3,150 | Fixed: 2.50% annually | Aug-24 | 4.6 | ✓ | $— | ||||||||||||||||||||||||||
| 14 | DMG MORI SEIKI U.S.A., INC. | Industrial Machinery | IG | Hoffman Estates | Illinois | 104,598 | $3,027 | Fixed: 3.00% annually | Jan-24 | 15.0 | ✓ | $— | ||||||||||||||||||||||||||
| 15 | Exelon Generation Company, LLC | Electric Utilities | IG | Warrenville | Illinois | 146,745 | $2,935 | Fixed: $0.50/SF annually | Jul-24 | 2.5 | $19,906 | |||||||||||||||||||||||||||
| 16 | JPMorgan Chase Bank, N.A. | Diversified Banks | IG | Tampa | Florida | 176,150 | $2,934 | CPI: 0.0% Floor / 2.0% Cap | Mar-24 | 6.2 | ✓ | $— | ||||||||||||||||||||||||||
| 17 | BCBSM, Inc. | Managed Health Care | IG | Eagan | Minnesota | 202,608 | $2,924 | Fixed: 2.00% annually | Jan-24 | 13.1 | ✓ | $— | ||||||||||||||||||||||||||
| 18 | Google, LLC | Internet Software & Services | IG | Venice | California | 67,681 | $2,844 | Fixed: 3.00% annually | Jan-24 | 1.8 | $18,984 | |||||||||||||||||||||||||||
| 19 | BCBSM, Inc. | Managed Health Care | IG | Eagan | Minnesota | 227,666 | $2,831 | Fixed: 2.00% annually | Feb-24 | 0.5 | ✓ | $— | ||||||||||||||||||||||||||
| 20 | ICU MEDICAL, INC. (d) | Health Care Supplies | Non-IG | Plymouth | Minnesota | 182,250 | $2,770 | Fixed: 3.25% annually | Feb-24 | 3.7 | ✓ | $— | ||||||||||||||||||||||||||
| 21 | Intuit Inc. | Internet Software & Services | IG | Plano | Texas | 166,033 | $2,577 | Fixed: 'One-time $2.00/SF in '21 | N/A | 2.5 | $21,900 | |||||||||||||||||||||||||||
| 22 | AVT Technology Solutions LLC (f) | Technology Distributors | IG | Tempe | Arizona | 132,070 | $2,405 | Fixed: 3.00% annually | N/A | 0.1 | $13,184 | |||||||||||||||||||||||||||
| 23 | Veritas Bermuda, LTD | Systems Software | Non-IG | Roseville | Minnesota | 136,125 | $2,211 | Fixed: 2.00% annually | Dec-24 | 8.9 | ✓ | $— | ||||||||||||||||||||||||||
Net Lease Office Properties | 11 | |||||
| 24 | BCBSM, Inc. | Managed Health Care | IG | Eagan | Minnesota | 144,864 | $2,117 | Fixed: 2.00% annually | Jan-24 | 13.1 | ✓ | $— | ||||||||||||||||||||||||||
| 25 | Cenlar FSB | Regional Banks | Non-IG | Yardley | Pennsylvania | 105,584 | $2,000 | Fixed: 2.70% annually | Jan-24 | 4.5 | ✓ | $— | ||||||||||||||||||||||||||
| 26 | iHeartCommunications, Inc. | Broadcasting | Non-IG | San Antonio | Texas | 120,147 | $1,971 | Fixed: 2.00% annually | Feb-24 | 11.1 | ✓ | $— | ||||||||||||||||||||||||||
| 27 | Cofinity, Inc./Aetna Life Insurance Co. (d) (e) | Multi-line Insurance | IG | Southfield | Michigan | 94,453 | $1,907 | Fixed: One-time 6.90% in '23 | N/A | 1.1 | ✓ | $— | ||||||||||||||||||||||||||
| 28 | Arbella Service Company, Inc. | Property & Casualty Insurance | IG | Quincy | Massachusetts | 132,160 | $1,850 | Fixed: 'One-time $1.00/SF in '22 | N/A | 3.4 | ✓ | $— | ||||||||||||||||||||||||||
| 29 | ICF Consulting Group, Inc. | IT Consulting & Other Services | Non-IG | Martinsville | Virginia | 93,333 | $1,725 | CPI: 0.0% Floor / No Cap | Jan-24 | 3.1 | ✓ | $— | ||||||||||||||||||||||||||
| 30 | Acosta, Inc. | Advertising | Non-IG | Jacksonville | Florida | 88,062 | $1,497 | Fixed: $0.50/SF annually | Jul-24 | 3.6 | $10,062 | |||||||||||||||||||||||||||
| 31 | Safelite Group, Inc. | Specialized Consumer Services | Non-IG | Rio Rancho | New Mexico | 94,649 | $1,473 | Fixed: 2.00% annually | Jan-24 | 5.4 | ✓ | $— | ||||||||||||||||||||||||||
| 32 | Master Lock Company, LLC | Building Products | Non-IG | Oak Creek | Wisconsin | 120,883 | $1,409 | Fixed: 2.00% annually | Jun-24 | 8.4 | ✓ | $— | ||||||||||||||||||||||||||
| 33 | JPMorgan Chase Bank, N.A. (d) (e) | Diversified Banks | IG | Tampa | Florida | 135,733 | $1,361 | CPI: 0.0% Floor / 2.0% Cap | Mar-24 | 1.2 | ✓ | $— | ||||||||||||||||||||||||||
| 34 | Midcontinent Independent Stm Op Inc. | Electric Utilities | IG | Eagan | Minnesota | 60,463 | $1,118 | Fixed: $0.25/SF annually | Mar-24 | 2.2 | $9,123 | |||||||||||||||||||||||||||
| 35 | Emerson Electric Co. | Industrial Machinery | IG | Houston | Texas | 52,144 | $1,082 | Fixed: $0.50/SF annually | Nov-24 | 1.8 | ✓ | $— | ||||||||||||||||||||||||||
| 36 | Radiate Holdings, L.P. | Cable & Satellite | Non-IG | San Marcos | Texas | 47,000 | $1,043 | CPI: 0.0% Floor / 3.0% Cap | Aug-24 | 4.7 | ✓ | $— | ||||||||||||||||||||||||||
| 37 | North American Lighting, Inc. | Auto Parts & Equipment | Non-IG | Farmington Hills | Michigan | 75,286 | $1,032 | Fixed: 2.50% annually | Apr-24 | 2.2 | $6,214 | |||||||||||||||||||||||||||
| 38 | Arcfield Acquisition Corporation | Aerospace & Defense | Non-IG | King of Prussia | Pennsylvania | 88,578 | $1,000 | Fixed: One-time 17.50% in '23 | N/A | 2.6 | ✓ | $— | ||||||||||||||||||||||||||
| 39 | Merative L.P. | IT Consulting & Other Services | Non-IG | Hartland | Wisconsin | 81,082 | $940 | CPI: 0.0% Floor / No Cap | Dec-24 | 11.9 | $1,953 | |||||||||||||||||||||||||||
| 40 | Pioneer Credit Recovery, Inc. (d) | Diversified Support Services | Non-IG | Moorestown | New Jersey | 65,567 | $899 | Fixed: 2.50% annually | Jan-24 | 1.1 | ✓ | $— | ||||||||||||||||||||||||||
| 41 | Charter Communications Operating, LLC | Cable & Satellite | Non-IG | Bridgeton | Missouri | 78,080 | $781 | Fixed: $0.50/SF annually | Apr-24 | 1.2 | ✓ | $— | ||||||||||||||||||||||||||
| 42 | Xileh Holding Inc. | Multi-Sector Holdings | IG | Auburn Hills | Michigan | 55,490 | $694 | Fixed: 2.50% annually | Jan-24 | 14.0 | ✓ | $— | ||||||||||||||||||||||||||
| 43 | Undisclosed – multi-national provider of industrial gases | Industrial Gases | IG | Houston | Texas | 49,821 | $605 | Fixed: 2.00% annually | Jan-24 | 2.0 | ✓ | $— | ||||||||||||||||||||||||||
| 44 | APCO Holdings, Inc. | Property & Casualty Insurance | Non-IG | Norcross | Georgia | 50,600 | $600 | Fixed: 2.50% annually | Mar-24 | 7.2 | ✓ | $— | ||||||||||||||||||||||||||
| 45 | Radiate Holdings, L.P. | Cable & Satellite | Non-IG | Waco | Texas | 30,699 | $459 | CPI: 0.0% Floor / 3.0% Cap | Aug-24 | 4.7 | $— | |||||||||||||||||||||||||||
| 46 | S&ME, Inc. | Environmental & Facilities Services | Non-IG | Raleigh | North Carolina | 27,770 | $430 | Fixed: 3.00% annually | N/A | 0.8 | ✓ | $— | ||||||||||||||||||||||||||
| 47 | Radiate Holdings, L.P. | Cable & Satellite | Non-IG | Corpus Christi | Texas | 20,717 | $344 | CPI: 0.0% Floor / 3.0% Cap | Aug-24 | 4.7 | $— | |||||||||||||||||||||||||||
| 48 | Radiate Holdings, L.P. | Cable & Satellite | Non-IG | Odessa | Texas | 21,193 | $230 | CPI: 0.0% Floor / 3.0% Cap | Aug-24 | 4.7 | $— | |||||||||||||||||||||||||||
| 49 | Radiate Holdings, L.P. | Cable & Satellite | Non-IG | San Marcos | Texas | 14,400 | $205 | CPI: 0.0% Floor / 3.0% Cap | Aug-24 | 4.7 | $— | |||||||||||||||||||||||||||
| 50 | BCBSM, Inc. | Managed Health Care | IG | Eagan | Minnesota | 12,286 | $183 | Fixed: 2.00% annually | Feb-24 | 0.5 | ✓ | $— | ||||||||||||||||||||||||||
U.S. Total (i) | 7,586,429 | $126,271 | 5.9 | |||||||||||||||||||||||||||||||||||
Net Lease Office Properties | 12 | |||||
| Encumbered Status | ||||||||||||||||||||||||||||||||||||||
| # | Primary Tenant | Industry | Credit (a) | City | Country | Square Footage | ABR | Rent Increase Type | Date of Next Increase | WALT (c) | NLOP Mortgage Loan | Other Mortgages | ||||||||||||||||||||||||||
| 1 | Total E&P Norge AS | Oil & Gas Exploration & Production | IG | Stavanger | Norway | 275,725 | $5,185 | Fixed: 2.50% annually | Jan-24 | 7.5 | $— | |||||||||||||||||||||||||||
| 2 | Siemens AS | Industrial Conglomerates | IG | Oslo | Norway | 165,905 | $4,503 | CPI: 0.0% Floor / No Cap | Jan-24 | 2.0 | $42,446 | |||||||||||||||||||||||||||
| 3 | E.On UK PLC | Internet Retail | IG | Houghton le Spring | United Kingdom | 217,339 | $3,623 | CPI: 2.0% Floor / 4.0% Cap | N/A | 1.6 | $— | |||||||||||||||||||||||||||
| 4 | Undisclosed – UK insurance company (j) | Property & Casualty Insurance | IG | Newport | United Kingdom | 80,664 | $1,761 | CPI: 2.0% Floor / 4.0% Cap | Jun-24 | 10.4 | $— | |||||||||||||||||||||||||||
| 5 | Nokia Corporation | Communications Equipment | IG | Krakow | Poland | 53,400 | $1,096 | CPI: 0.0% Floor / No Cap | Sep-24 | 5.7 | $— | |||||||||||||||||||||||||||
European Total (i) | 793,033 | $16,167 | 4.8 | |||||||||||||||||||||||||||||||||||
Net Lease Office Properties | 13 | |||||
Net Lease Office Properties | 14 | |||||
| Normalized Pro Rata Cash NOI | |||||
Year Ended December 31, 2023 | |||||
| Consolidated Lease Revenues and Other | |||||
| Total lease revenues – as reported | $ | 166,034 | |||
| Income from finance leases | 1,189 | ||||
Parking garage revenues (a) | 1,799 | ||||
| Less: Consolidated Reimbursable and Non-Reimbursable Property Expenses | |||||
| Reimbursable property expenses – as reported | 27,957 | ||||
| Non-reimbursable property expenses – as reported | 8,642 | ||||
| 132,423 | |||||
| Adjustments for Pro Rata Ownership of Real Estate Joint Ventures: | |||||
| Less: Pro rata share of NOI attributable to noncontrolling interests | (361) | ||||
| (361) | |||||
| 132,062 | |||||
| Adjustments for Pro Rata Non-Cash Items: | |||||
| Less: Straight-line and other leasing and financing adjustments | (631) | ||||
| Add: Above- and below-market rent intangible lease amortization | 4,335 | ||||
| Add: Other non-cash items | 385 | ||||
| 4,089 | |||||
Pro Rata Cash NOI (b) | 136,151 | ||||
Adjustment to normalize for intra-period dispositions (c) | (3,546) | ||||
Normalized Pro Rata Cash NOI (b) | $ | 132,605 | |||
Net Lease Office Properties | 15 | |||||
Year Ended December 31, 2023 | |||||
| Net Income attributable to NLOP | |||||
| Net income attributable to NLOP – as reported | $ | (131,746) | |||
| Adjustments for Consolidated Operating Expenses | |||||
| Add: Operating expenses – as reported | 260,497 | ||||
| Less: Property expenses, excluding reimbursable tenant costs – as reported | (8,642) | ||||
| 251,855 | |||||
| Adjustments for Other Consolidated Revenues and Expenses: | |||||
| Less: Other lease-related income (excluding parking garage revenues) | (5,943) | ||||
| Less: Reimbursable property expenses – as reported | (27,957) | ||||
| Add: Other income and (expenses) | 45,765 | ||||
| Add: Provision for income taxes | 425 | ||||
| 12,290 | |||||
| Other Adjustments: | |||||
| Less: Straight-line and other leasing and financing adjustments | (631) | ||||
| Add: Above- and below-market rent intangible lease amortization | 4,335 | ||||
| Add: Adjustments for pro rata ownership | (335) | ||||
Adjustment to normalize for intra-period dispositions (c) | (3,546) | ||||
| Add: Property expenses, excluding reimbursable tenant costs, non-cash | 383 | ||||
| 206 | |||||
Normalized Pro Rata Cash NOI (b) | $ | 132,605 | |||
Net Lease Office Properties | 16 | |||||
| Disclosures Regarding Non-GAAP and Other Metrics | |||||
Net Lease Office Properties | 17 | |||||
Net Lease Office Properties | 18 | |||||