
| REIT | Real estate investment trust | ||||
| WPC | W. P. Carey Inc., a net-lease REIT (also our “Advisor”) | ||||
| U.S. | United States | ||||
| ABR | Contractual minimum annualized base rent | ||||
| NAREIT | National Association of Real Estate Investment Trusts (an industry trade group) | ||||
| WALT | Weighted-average lease term | ||||
| NLOP Mortgage Loan | Our $335.0 million senior secured mortgage loan, which was fully repaid during the year ended December 31, 2024 | ||||
| NLOP Mezzanine Loan | Our $120.0 million mezzanine loan facility, which is collateralized by the assignment of certain of our previously unencumbered real estate properties | ||||
| NLOP Financing Arrangements | The NLOP Mortgage Loan and NLOP Mezzanine Loan | ||||
| Table of Contents | |||||
| Appendix | |||||
| Summary Metrics | |||||
| Financial Results | |||||||||||||||||||||||
| Revenues, including reimbursable costs – consolidated ($000s) | $ | 27,730 | |||||||||||||||||||||
| Net loss attributable to NLOP ($000s) | (35,785) | ||||||||||||||||||||||
| Net loss attributable to NLOP per diluted share | (2.42) | ||||||||||||||||||||||
Normalized pro rata cash NOI ($000s) (a) (b) | 17,114 | ||||||||||||||||||||||
AFFO attributable to NLOP ($000s) (a) (b) | 11,526 | ||||||||||||||||||||||
AFFO attributable to NLOP per diluted share (a) (b) | 0.78 | ||||||||||||||||||||||
| Balance Sheet and Capitalization | |||||||||||||||||||||||
| Equity market capitalization – based on quarter end share price of $31.21 ($000s) | $ | 462,347 | |||||||||||||||||||||
| Total consolidated debt ($000s) | 169,216 | ||||||||||||||||||||||
Gross assets ($000s) (c) | 957,136 | ||||||||||||||||||||||
| Total consolidated debt to gross assets | 17.7 | % | |||||||||||||||||||||
NLOP Mortgage Loan principal outstanding ($000s) (d) | $ | — | |||||||||||||||||||||
NLOP Mezzanine Loan principal outstanding ($000s) (d) | 61,141 | ||||||||||||||||||||||
| Advisory Fees and Reimbursements Paid to WPC | |||||||||||||||||||||||
Asset management fees (e) | $ | 1,375 | |||||||||||||||||||||
Administrative reimbursements (f) | 1,000 | ||||||||||||||||||||||
Portfolio (Pro Rata) (b) | |||||||||||||||||||||||
ABR (in thousands) (g) | $ | 88,124 | |||||||||||||||||||||
| Number of properties | 39 | ||||||||||||||||||||||
| Number of tenants | 43 | ||||||||||||||||||||||
| Occupancy | 85.2 | % | |||||||||||||||||||||
| Weighted-average lease term (in years) | 4.3 | ||||||||||||||||||||||
Leasable square footage (in thousands) (h) | 5,613 | ||||||||||||||||||||||
ABR from investment grade tenants as a % of total ABR (i) | 44.4 | % | |||||||||||||||||||||
| Dispositions – number of properties sold | 6 | ||||||||||||||||||||||
| Dispositions – gross proceeds (in thousands) | $ | 47,174 | |||||||||||||||||||||
| Subsequent to Quarter End | |||||||||||||||||||||||
NLOP Mezzanine Loan principal outstanding as of the date of this report ($000s) (j) | $ | 57,874 | |||||||||||||||||||||
Net Lease Office Properties | 1 | |||||
| Components of Net Asset Value | |||||
Three Months Ended December 31, 2024 | |||||
Normalized Pro Rata Cash NOI (a) (b) | $ | 17,114 | |||
| Balance Sheet – Selected Information | As of December 31, 2024 | ||||
| Assets | |||||
Book value of select real estate (c) | $ | 30,633 | |||
| Cash and cash equivalents | 25,121 | ||||
Restricted cash, including escrow (d) | 43,305 | ||||
| Other assets, net: | |||||
| Straight-line rent adjustments | $ | 20,489 | |||
| Accounts receivable | 2,216 | ||||
| Prepaid expenses | 2,213 | ||||
| Deferred charges | 2,123 | ||||
| Taxes receivable | 228 | ||||
| Other | 1,931 | ||||
| Total other assets, net | $ | 29,200 | |||
| Liabilities | |||||
Non-recourse mortgages, net (e) | $ | 110,841 | |||
NLOP Mezzanine Loan (f) | 61,141 | ||||
NLOP Mortgage Loan (g) | — | ||||
| Accounts payable, accrued expenses and other liabilities: | |||||
| Accounts payable and accrued expenses | $ | 12,713 | |||
| Prepaid and deferred rents | 11,064 | ||||
| Accrued taxes payable | 1,199 | ||||
| Tenant security deposits | 821 | ||||
| Operating lease liabilities | 259 | ||||
| Other | 18,089 | ||||
| Total accounts payable, accrued expenses and other liabilities | $ | 44,145 | |||
Net Lease Office Properties | 2 | |||||
| Consolidated Statement of Operations | |||||
Three Months Ended December 31, 2024 | |||||
| Revenues | |||||
| Lease revenues | $ | 25,419 | |||
| Other lease-related income | 2,311 | ||||
| 27,730 | |||||
| Operating Expenses | |||||
| Impairment charges — real estate | 31,786 | ||||
| Depreciation and amortization | 11,229 | ||||
| Reimbursable tenant costs | 6,716 | ||||
| Property expenses, excluding reimbursable tenant costs | 2,963 | ||||
General and administrative (a) | 1,898 | ||||
Asset management fees (b) | 1,375 | ||||
| 55,967 | |||||
| Other Income and Expenses | |||||
Interest expense (c) | (7,620) | ||||
| Other gains and (losses) | (2,060) | ||||
| Loss on sale of real estate, net | (1,087) | ||||
| (10,767) | |||||
| Loss before income taxes | (39,004) | ||||
| Benefit from income taxes | 3,240 | ||||
| Net Loss | (35,764) | ||||
| Net income attributable to noncontrolling interests | (21) | ||||
| Net Loss Attributable to NLOP | $ | (35,785) | |||
| Basic and Diluted Loss Per Share | $ | (2.42) | |||
| Weighted-Average Shares Outstanding | |||||
| Basic and Diluted | 14,802,703 | ||||
Net Lease Office Properties | 3 | |||||
| FFO and AFFO, Consolidated | |||||
Three Months Ended December 31, 2024 | |||||
| Net loss attributable to NLOP | $ | (35,785) | |||
| Adjustments: | |||||
| Impairment charges — real estate | 31,786 | ||||
| Depreciation and amortization of real property | 11,229 | ||||
| Loss on sale of real estate, net | 1,087 | ||||
Proportionate share of adjustments for noncontrolling interests (a) | (52) | ||||
| Total adjustments | 44,050 | ||||
FFO (as defined by NAREIT) Attributable to NLOP (b) | 8,265 | ||||
| Adjustments: | |||||
| Tax benefit — deferred and other | (2,900) | ||||
Other (gains) and losses (c) | 2,635 | ||||
| Amortization of deferred financing costs | 2,622 | ||||
Above- and below-market rent intangible lease amortization, net | 476 | ||||
| Straight-line and other leasing and financing adjustments | 309 | ||||
| Other amortization and non-cash items | 108 | ||||
| Stock-based compensation | 25 | ||||
Proportionate share of adjustments for noncontrolling interests (a) | (14) | ||||
| Total adjustments | 3,261 | ||||
AFFO Attributable to NLOP (b) | $ | 11,526 | |||
| Summary | |||||
FFO (as defined by NAREIT) attributable to NLOP (b) | $ | 8,265 | |||
FFO (as defined by NAREIT) attributable to NLOP per diluted share (b) | $ | 0.56 | |||
AFFO attributable to NLOP (b) | $ | 11,526 | |||
AFFO attributable to NLOP per diluted share (b) | $ | 0.78 | |||
| Diluted weighted-average shares outstanding | 14,802,703 | ||||
Net Lease Office Properties | 4 | |||||
| Consolidated Balance Sheets | |||||
| December 31, | |||||||||||
| 2024 | 2023 | ||||||||||
| Assets | |||||||||||
| Investments in real estate: | |||||||||||
| Land, buildings and improvements | $ | 730,345 | $ | 1,203,991 | |||||||
| Net investments in finance leases | — | 10,522 | |||||||||
| In-place lease intangible assets and other | 209,968 | 357,788 | |||||||||
| Above-market rent intangible assets | 30,512 | 57,954 | |||||||||
| Investments in real estate | 970,825 | 1,630,255 | |||||||||
| Accumulated depreciation and amortization | (292,679) | (458,430) | |||||||||
| Assets held for sale, net | 29,297 | — | |||||||||
| Net investments in real estate | 707,443 | 1,171,825 | |||||||||
| Restricted cash | 43,305 | 51,560 | |||||||||
| Cash and cash equivalents | 25,121 | 16,269 | |||||||||
| Other assets, net | 29,200 | 65,435 | |||||||||
| Total assets | $ | 805,069 | $ | 1,305,089 | |||||||
| Liabilities and Equity | |||||||||||
| Debt: | |||||||||||
| Non-recourse mortgages, net | $ | 111,259 | $ | 168,836 | |||||||
| NLOP Mezzanine Loan, net | 57,957 | 106,299 | |||||||||
| NLOP Mortgage Loan, net | — | 266,844 | |||||||||
| Debt, net | 169,216 | 541,979 | |||||||||
| Accounts payable, accrued expenses and other liabilities | 44,145 | 59,527 | |||||||||
| Below-market rent intangible liabilities, net | 6,305 | 10,643 | |||||||||
| Deferred income taxes | — | 10,450 | |||||||||
| Dividends payable | — | 1,060 | |||||||||
| Total liabilities | 219,666 | 623,659 | |||||||||
Preferred stock, $0.001 par value, 5,000,000 shares authorized; none issued | — | — | |||||||||
Common stock, $0.001 par value, 45,000,000 shares authorized; 14,814,075 and 14,620,919 shares, respectively, issued and outstanding | 15 | 15 | |||||||||
| Additional paid-in capital | 855,813 | 855,554 | |||||||||
| Distributions in excess of accumulated earnings | (234,443) | (142,960) | |||||||||
| Accumulated other comprehensive loss | (40,157) | (35,600) | |||||||||
| Total shareholders' equity | 581,228 | 677,009 | |||||||||
| Noncontrolling interests | 4,175 | 4,421 | |||||||||
| Total equity | 585,403 | 681,430 | |||||||||
| Total liabilities and equity | $ | 805,069 | $ | 1,305,089 | |||||||
Net Lease Office Properties | 5 | |||||
| Capitalization | |||||
| Total Enterprise Value | Shares | Share Price | Market Value | |||||||||||||||||||||||
| Equity | ||||||||||||||||||||||||||
| Common equity | 14,814,075 | $ | 31.21 | $ | 462,347 | |||||||||||||||||||||
| Total Equity Market Capitalization | 462,347 | |||||||||||||||||||||||||
Outstanding Balance (a) | ||||||||||||||||||||||||||
| Debt | ||||||||||||||||||||||||||
| Non-recourse mortgages | 110,841 | |||||||||||||||||||||||||
| NLOP Mezzanine Loan | 61,141 | |||||||||||||||||||||||||
| Total Debt | 171,982 | |||||||||||||||||||||||||
| Less: Cash and cash equivalents | (25,121) | |||||||||||||||||||||||||
| Net Debt | 146,861 | |||||||||||||||||||||||||
| Total Enterprise Value | $ | 609,208 | ||||||||||||||||||||||||
Net Lease Office Properties | 6 | |||||
| Debt Overview | |||||
| Maturity Date | Fixed / Floating | Interest Rate | Total Outstanding Balance (a) | % of Total | ||||||||||||||||||||||||||||
| NLOP Mezzanine Loan | ||||||||||||||||||||||||||||||||
NLOP Mezzanine Loan (b) | 11/9/2028 | Fixed | 14.5 | % | $ | 61,141 | 35.6 | % | ||||||||||||||||||||||||
| Other Mortgages (Tenant Listed) | ||||||||||||||||||||||||||||||||
Northrop Grumman Systems Corporation (c) | 1/6/2025 | Fixed | 4.2 | % | 25,220 | 14.7 | % | |||||||||||||||||||||||||
| Midcontinent Independent Stm Op Inc | 5/6/2025 | Fixed | 4.0 | % | 8,933 | 5.2 | % | |||||||||||||||||||||||||
| Intuit Inc. | 5/6/2025 | Fixed | 4.0 | % | 21,900 | 12.7 | % | |||||||||||||||||||||||||
| Acosta, Inc. | 8/6/2025 | Fixed | 4.4 | % | 9,869 | 5.7 | % | |||||||||||||||||||||||||
| Siemens AS | 12/15/2025 | Floating | 4.9 | % | 38,867 | 22.6 | % | |||||||||||||||||||||||||
| North American Lighting, Inc. | 5/6/2026 | Fixed | 6.3 | % | 6,052 | 3.5 | % | |||||||||||||||||||||||||
| Total Debt Outstanding | 8.1 | % | $ | 171,982 | 100.0 | % | ||||||||||||||||||||||||||
Net Lease Office Properties | 7 | |||||
| Dispositions | |||||
| Tenant / Lease Guarantor | Property Location(s) | Gross Sale Price | ABR (a) | Closing Date | Gross Square Footage | |||||||||||||||||||||||||||
| 4Q23 | ||||||||||||||||||||||||||||||||
| Raytheon Company | Tucson, AZ | $ | 24,575 | $ | 1,978 | Dec-23 | 143,650 | |||||||||||||||||||||||||
| Carhartt, Inc. | Dearborn, MI | 9,806 | 748 | Dec-23 | 58,722 | |||||||||||||||||||||||||||
| BCBSM, Inc. | Eagan, MN | 2,500 | 298 | Dec-23 | 29,916 | |||||||||||||||||||||||||||
| AVL Michigan Holding Corporation | Plymouth, MI | 6,200 | 575 | Dec-23 | 70,000 | |||||||||||||||||||||||||||
| 4Q23 Total | 43,081 | 3,599 | 302,288 | |||||||||||||||||||||||||||||
| 1Q24 | ||||||||||||||||||||||||||||||||
Undisclosed – UK insurance company (b) | Newport, United Kingdom | 10,497 | 1,761 | Jan-24 | 80,664 | |||||||||||||||||||||||||||
Total E&P Norge AS (b) | Stavanger, Norway | 33,072 | 5,185 | Mar-24 | 275,725 | |||||||||||||||||||||||||||
| 1Q24 Total | 43,569 | 6,946 | 356,389 | |||||||||||||||||||||||||||||
| 2Q24 | ||||||||||||||||||||||||||||||||
Exelon Generation Company, LLC (c) | Warrenville, IL | 19,830 | 2,935 | Apr-24 | 146,745 | |||||||||||||||||||||||||||
Vacant (formerly AVT Technology Solutions LLC) (c) | Tempe, AZ | 13,160 | — | Apr-24 | 132,070 | |||||||||||||||||||||||||||
| FedEx Corporation | Collierville, TN | 62,500 | 5,491 | Apr-24 | 390,380 | |||||||||||||||||||||||||||
| DMG MORI SEIKI U.S.A., INC. | Hoffman Estates, IL | 35,984 | 2,458 | Apr-24 | 104,598 | |||||||||||||||||||||||||||
| BCBSM, Inc. (2 properties) | Eagan, MN | 60,700 | 4,663 | Jun-24 | 347,472 | |||||||||||||||||||||||||||
| 2Q24 Total | 192,174 | 15,547 | 1,121,265 | |||||||||||||||||||||||||||||
| 3Q24 | ||||||||||||||||||||||||||||||||
| CVS Health Corporation | Scottsdale, AZ | 71,500 | 4,252 | Aug-24 | 354,888 | |||||||||||||||||||||||||||
| Xileh Holding Inc. | Auburn Hills, MI | 9,000 | 711 | Sep-24 | 55,490 | |||||||||||||||||||||||||||
| 3Q24 Total | 80,500 | 4,963 | 410,378 | |||||||||||||||||||||||||||||
| 4Q24 | ||||||||||||||||||||||||||||||||
E.On UK PLC (b) | Houghton le Spring, United Kingdom | 3,924 | 3,819 | Oct-24 | 217,339 | |||||||||||||||||||||||||||
| Vacant (formerly BCBSM, Inc.) | Eagan, MN | 11,650 | — | Nov-24 | 227,666 | |||||||||||||||||||||||||||
| Merative L.P. | Hartland, WI | 6,750 | 669 | Dec-24 | 81,082 | |||||||||||||||||||||||||||
| Charter Communications Operating, LLC | Bridgeton, MO | 7,350 | 820 | Dec-24 | 78,080 | |||||||||||||||||||||||||||
| Caremark RX, L.L.C. | Chandler, AZ | 15,000 | 1,645 | Dec-24 | 183,000 | |||||||||||||||||||||||||||
| Cofinity, Inc./ Aetna Life Insurance Co. | Southfield, MI | 2,500 | 1,833 | Dec-24 | 94,453 | |||||||||||||||||||||||||||
| 4Q24 Total | 47,174 | 8,786 | 881,620 | |||||||||||||||||||||||||||||
Total Dispositions (d) | $ | 406,498 | $ | 39,841 | 3,071,940 | |||||||||||||||||||||||||||
Net Lease Office Properties | 8 | |||||
| Capital Expenditures and Leasing Activity | |||||
| Tenant Improvements and Leasing Costs | |||||
| Tenant Improvements (Tenant Listed) | |||||
| Merative L.P. | $ | 767 | |||
| S&ME, Inc. | 447 | ||||
| Nokia Corporation | 245 | ||||
| 1,459 | |||||
| Leasing Costs | |||||
| CVS Health Corporation | $ | 480 | |||
| Caremark RX, L.L.C. | 415 | ||||
| 895 | |||||
| Tenant Improvements and Leasing Costs | 2,354 | ||||
| Maintenance Capital Expenditures (Tenant Listed) | |||||
| KBR, Inc. | 415 | ||||
| Pharmaceutical Product Development, LLC | 397 | ||||
| ICU MEDICAL, INC. | 258 | ||||
| Charter Communications Operating, LLC | 69 | ||||
| Other | 18 | ||||
| 1,157 | |||||
| Total: Tenant Improvements and Leasing Costs, and Maintenance Capital Expenditures | $ | 3,511 | |||
Lease Renewals and Extensions (a) | Expected Tenant Improvements ($000s) | Leasing Commissions ($000s) | ||||||||||||||||||||||||||||||||||||||||||||||||
| ABR | ||||||||||||||||||||||||||||||||||||||||||||||||||
| Tenant | Location | Square Feet | Prior Lease ($000s) | New Lease ($000s) (b) | Rent Recapture | Incremental Lease Term | ||||||||||||||||||||||||||||||||||||||||||||
Google, LLC (c) | Venice, CA | 67,681 | $ | 3,018 | $ | 3,108 | 103.0 | % | $ | — | $ | 357 | 5.0 years | |||||||||||||||||||||||||||||||||||||
Total / Weighted Average (d) | 67,681 | $ | 3,018 | $ | 3,108 | 103.0 | % | $ | — | $ | 357 | 5.0 years | ||||||||||||||||||||||||||||||||||||||
| New Leases | Expected Tenant Improvements ($000s) | Leasing Commissions ($000s) | ||||||||||||||||||||||||||||||||||||||||||
| ABR | ||||||||||||||||||||||||||||||||||||||||||||
| Tenant | Location | Square Feet | Number of Leases | New Lease ($000s) (b) | New Lease Term | |||||||||||||||||||||||||||||||||||||||
Phoenix Data Systems (e) | Southfield, MI | 6,431 | 1 | $ | 72 | $ | — | $ | — | 5.0 years | ||||||||||||||||||||||||||||||||||
CT Logic (e) | Southfield, MI | 1,668 | 1 | 24 | — | — | 3.0 years | |||||||||||||||||||||||||||||||||||||
Total / Weighted Average (f) | 8,099 | 2 | $ | 96 | $ | — | $ | — | 4.5 years | |||||||||||||||||||||||||||||||||||
Net Lease Office Properties | 9 | |||||
| Top Ten Tenants | |||||
| Tenant / Lease Guarantor | State / Country | ABR | ABR % | Square Footage | Number of Properties | Weighted-Average Lease Term (Years) | ||||||||||||||||||||||||||||||||
KBR, Inc. (a) | Texas | $ | 20,156 | 22.9 | % | 913,713 | 1 | 5.5 | ||||||||||||||||||||||||||||||
| JPMorgan Chase Bank, N.A. | Florida, Texas | 9,069 | 10.3 | % | 666,869 | 3 | 4.4 | |||||||||||||||||||||||||||||||
Siemens AS (b) | Norway | 4,198 | 4.8 | % | 165,905 | 1 | 1.0 | |||||||||||||||||||||||||||||||
| Pharmaceutical Product Development, LLC | North Carolina | 4,063 | 4.6 | % | 219,812 | 1 | 8.9 | |||||||||||||||||||||||||||||||
| Omnicom Group, Inc. | California | 3,961 | 4.5 | % | 120,000 | 1 | 3.7 | |||||||||||||||||||||||||||||||
| R.R. Donnelley & Sons Company | Illinois | 3,393 | 3.9 | % | 167,215 | 1 | 2.7 | |||||||||||||||||||||||||||||||
| Board of Regents, State of Iowa | Iowa | 3,254 | 3.7 | % | 191,700 | 1 | 5.8 | |||||||||||||||||||||||||||||||
| Bankers Financial Corporation | Florida | 3,228 | 3.6 | % | 111,357 | 1 | 0.6 | |||||||||||||||||||||||||||||||
| Google, LLC | California | 2,930 | 3.3 | % | 67,681 | 1 | 5.8 | |||||||||||||||||||||||||||||||
| Northrop Grumman Systems Corporation | Minnesota | 2,679 | 3.0 | % | 191,336 | 1 | 4.9 | |||||||||||||||||||||||||||||||
Total (c) | $ | 56,931 | 64.6 | % | 2,815,588 | 12 | 4.7 | |||||||||||||||||||||||||||||||
Net Lease Office Properties | 10 | |||||
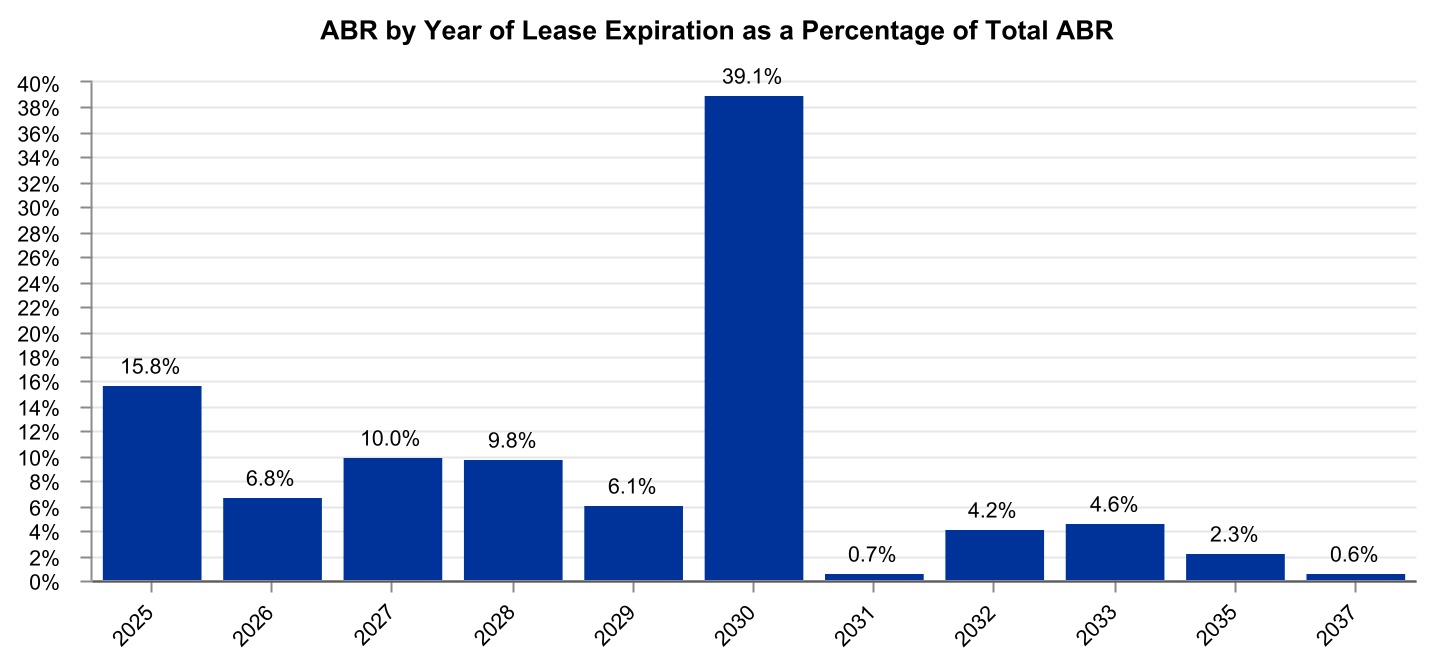
| Lease Expirations | |||||
Year of Lease Expiration (a) | Number of Leases Expiring | Number of Tenants with Leases Expiring | ABR | ABR % | Square Footage (b) | Square Footage % | ||||||||||||||||||||||||||||||||
| 2025 | 13 | 12 | $ | 13,890 | 15.8 | % | 730,062 | 13.0 | % | |||||||||||||||||||||||||||||
| 2026 | 7 | 7 | 6,014 | 6.8 | % | 369,460 | 6.6 | % | ||||||||||||||||||||||||||||||
| 2027 | 7 | 6 | 8,834 | 10.0 | % | 499,571 | 8.9 | % | ||||||||||||||||||||||||||||||
| 2028 | 5 | 4 | 8,628 | 9.8 | % | 371,447 | 6.6 | % | ||||||||||||||||||||||||||||||
| 2029 | 5 | 4 | 5,349 | 6.1 | % | 358,013 | 6.4 | % | ||||||||||||||||||||||||||||||
| 2030 | 7 | 6 | 34,484 | 39.1 | % | 1,772,623 | 31.6 | % | ||||||||||||||||||||||||||||||
| 2031 | 1 | 1 | 615 | 0.7 | % | 50,600 | 0.9 | % | ||||||||||||||||||||||||||||||
| 2032 | 2 | 2 | 3,692 | 4.2 | % | 257,008 | 4.6 | % | ||||||||||||||||||||||||||||||
| 2033 | 1 | 1 | 4,063 | 4.6 | % | 219,812 | 3.9 | % | ||||||||||||||||||||||||||||||
| 2035 | 1 | 1 | 2,010 | 2.3 | % | 120,147 | 2.1 | % | ||||||||||||||||||||||||||||||
| 2037 | 1 | 1 | 545 | 0.6 | % | 31,120 | 0.6 | % | ||||||||||||||||||||||||||||||
| Vacant | — | — | — | — | % | 833,297 | 14.8 | % | ||||||||||||||||||||||||||||||
Total (c) | 50 | $ | 88,124 | 100.0 | % | 5,613,160 | 100.0 | % | ||||||||||||||||||||||||||||||
Net Lease Office Properties | 11 | |||||
| Property List | |||||
| Encumbered Status | ||||||||||||||||||||||||||||||||||||||
| # | Primary Tenant | Industry | Credit (a) | City | State | Square Footage (b) | ABR | Rent Increase Type | Date of Next Increase | WALT (c) | NLOP Mezzanine Loan | Other Mortgages | ||||||||||||||||||||||||||
| 1 | KBR, Inc. (d) (e) | Construction & Engineering | Non-IG | Houston | Texas | 1,064,788 | $21,306 | Fixed: One-time 7.78% | Jan-27 | 5.4 | ✓ | $— | ||||||||||||||||||||||||||
| 2 | JPMorgan Chase Bank, N.A. | Diversified Banks | IG | Fort Worth | Texas | 386,154 | $4,755 | CPI: 0.0% Floor / 2.0% Cap | Mar-25 | 5.2 | ✓ | $— | ||||||||||||||||||||||||||
| 3 | Pharmaceutical Product Development, LLC | Pharmaceuticals | IG | Morrisville | North Carolina | 219,812 | $4,063 | Fixed: 2.00% annually | Oct-25 | 8.9 | ✓ | $— | ||||||||||||||||||||||||||
| 4 | Omnicom Group, Inc. | Advertising | IG | Playa Vista | California | 120,000 | $3,961 | None | N/A | 3.7 | ✓ | $— | ||||||||||||||||||||||||||
| 5 | R.R. Donnelley & Sons Company | Commercial Printing | Non-IG | Warrenville | Illinois | 167,215 | $3,393 | Fixed: 2.00% annually | Sep-25 | 2.7 | ✓ | $— | ||||||||||||||||||||||||||
| 6 | Board of Regents, State of Iowa (f) | Government Related Services | IG | Coralville | Iowa | 191,700 | $3,254 | CPI: 0.0% Floor / No Cap | Nov-25 | 5.8 | $— | |||||||||||||||||||||||||||
| 7 | Bankers Financial Corporation (d) (e) | Property & Casualty Insurance | Non-IG | St. Petersburg | Florida | 167,581 | $3,228 | Fixed: 2.50% annually | N/A | 0.6 | ✓ | $— | ||||||||||||||||||||||||||
| 8 | JPMorgan Chase Bank, N.A. | Diversified Banks | IG | Tampa | Florida | 176,150 | $2,993 | CPI: 0.0% Floor / 2.0% Cap | Mar-25 | 5.2 | ✓ | $— | ||||||||||||||||||||||||||
| 9 | Google, LLC (g) | Internet Software & Services | IG | Venice | California | 67,681 | $2,930 | Fixed: 3.00% annually | Jan-25 | 5.8 | $— | |||||||||||||||||||||||||||
| 10 | ICU MEDICAL, INC. (d) | Health Care Supplies | Non-IG | Plymouth | Minnesota | 182,250 | $2,840 | Fixed: 3.25% annually | Feb-25 | 0.8 | ✓ | $— | ||||||||||||||||||||||||||
| 11 | Northrop Grumman Systems Corporation | Aerospace & Defense | IG | Plymouth | Minnesota | 191,336 | $2,679 | Fixed: 2.00% annually | Dec-25 | 4.9 | $25,220 | |||||||||||||||||||||||||||
| 12 | Intuit Inc. | Internet Software & Services | IG | Plano | Texas | 166,033 | $2,577 | Fixed: One-time $2.00/SF in '21 | N/A | 1.5 | $21,900 | |||||||||||||||||||||||||||
| 13 | Veritas Bermuda, LTD | Systems Software | Non-IG | Roseville | Minnesota | 136,125 | $2,255 | Fixed: 2.00% annually | Dec-25 | 7.9 | ✓ | $— | ||||||||||||||||||||||||||
| 14 | Cenlar FSB | Regional Banks | Non-IG | Yardley | Pennsylvania | 105,584 | $2,052 | Fixed: 2.70% annually | Jan-25 | 3.5 | ✓ | $— | ||||||||||||||||||||||||||
| 15 | iHeartCommunications, Inc. | Broadcasting | Non-IG | San Antonio | Texas | 120,147 | $2,010 | Fixed: 2.00% annually | Feb-25 | 10.1 | ✓ | $— | ||||||||||||||||||||||||||
| 16 | Arbella Service Company, Inc. | Property & Casualty Insurance | IG | Quincy | Massachusetts | 132,160 | $1,850 | Fixed: One-time $1.00/SF in '22 | N/A | 2.4 | ✓ | $— | ||||||||||||||||||||||||||
| 17 | ICF Consulting Group, Inc. | IT Consulting & Other Services | Non-IG | Martinsville | Virginia | 93,333 | $1,785 | CPI: 0.0% Floor / No Cap | Jan-25 | 2.1 | ✓ | $— | ||||||||||||||||||||||||||
| 18 | Acosta, Inc. | Advertising | Non-IG | Jacksonville | Florida | 88,062 | $1,541 | Fixed: $0.50/SF annually | Jul-25 | 2.6 | $9,869 | |||||||||||||||||||||||||||
| 19 | Safelite Group, Inc. | Specialized Consumer Services | Non-IG | Rio Rancho | New Mexico | 94,649 | $1,500 | Fixed: 2.00% annually | Jan-25 | 4.4 | ✓ | $— | ||||||||||||||||||||||||||
| 20 | Master Lock Company, LLC | Building Products | Non-IG | Oak Creek | Wisconsin | 120,883 | $1,437 | Fixed: 2.00% annually | Jun-25 | 7.4 | ✓ | $— | ||||||||||||||||||||||||||
| 21 | JPMorgan Chase Bank, N.A. (d) (e) | Diversified Banks | IG | Tampa | Florida | 135,733 | $1,389 | CPI: 0.0% Floor / 2.0% Cap | N/A | 0.2 | ✓ | $— | ||||||||||||||||||||||||||
| 22 | Midcontinent Independent Stm Op Inc. | Electric Utilities | IG | Eagan | Minnesota | 60,463 | $1,133 | Fixed: $0.25/SF annually | Mar-25 | 1.2 | $8,933 | |||||||||||||||||||||||||||
Net Lease Office Properties | 12 | |||||
| 23 | Emerson Electric Co. | Industrial Machinery | IG | Houston | Texas | 52,144 | $1,108 | Fixed: $0.50/SF annually | N/A | 0.8 | ✓ | $— | ||||||||||||||||||||||||||
| 24 | Radiate Holdings, L.P. | Cable & Satellite | Non-IG | San Marcos | Texas | 47,000 | $1,074 | CPI: 0.0% Floor / 3.0% Cap | Aug-25 | 3.7 | $— | |||||||||||||||||||||||||||
| 25 | North American Lighting, Inc. | Auto Parts & Equipment | Non-IG | Farmington Hills | Michigan | 75,286 | $1,058 | Fixed: 2.50% annually | Apr-25 | 1.2 | $6,052 | |||||||||||||||||||||||||||
| 26 | Arcfield Acquisition Corporation | Aerospace & Defense | Non-IG | King of Prussia | Pennsylvania | 88,578 | $1,000 | Fixed: One-time 17.50% in '23 | N/A | 0.9 | ✓ | $— | ||||||||||||||||||||||||||
| 27 | Pioneer Credit Recovery, Inc. (d) | Diversified Support Services | Non-IG | Moorestown | New Jersey | 65,567 | $924 | Fixed: 2.50% annually | Jan-25 | 3.1 | ✓ | $— | ||||||||||||||||||||||||||
| 28 | Undisclosed – multi-national provider of industrial gases | Industrial Gases | IG | Houston | Texas | 49,821 | $617 | Fixed: 2.00% annually | Jan-25 | 1.0 | ✓ | $— | ||||||||||||||||||||||||||
| 29 | APCO Holdings, Inc. | Property & Casualty Insurance | Non-IG | Norcross | Georgia | 50,600 | $615 | Fixed: 2.50% annually | Mar-25 | 6.2 | ✓ | $— | ||||||||||||||||||||||||||
| 30 | S&ME, Inc. | Environmental & Facilities Services | Non-IG | Raleigh | North Carolina | 31,120 | $545 | Fixed: 2.75% annually | Mar-25 | 12.2 | ✓ | $— | ||||||||||||||||||||||||||
| 31 | Radiate Holdings, L.P. | Cable & Satellite | Non-IG | Waco | Texas | 30,699 | $473 | CPI: 0.0% Floor / 3.0% Cap | Aug-25 | 3.7 | $— | |||||||||||||||||||||||||||
| 32 | Radiate Holdings, L.P. | Cable & Satellite | Non-IG | Corpus Christi | Texas | 20,717 | $354 | CPI: 0.0% Floor / 3.0% Cap | Aug-25 | 3.7 | $— | |||||||||||||||||||||||||||
| 33 | Radiate Holdings, L.P. | Cable & Satellite | Non-IG | Odessa | Texas | 21,193 | $236 | CPI: 0.0% Floor / 3.0% Cap | Aug-25 | 3.7 | $— | |||||||||||||||||||||||||||
| 34 | Radiate Holdings, L.P. | Cable & Satellite | Non-IG | San Marcos | Texas | 14,400 | $212 | CPI: 0.0% Floor / 3.0% Cap | Aug-25 | 3.7 | ✓ | $— | ||||||||||||||||||||||||||
| 35 | Vacant (formerly BCBSM, Inc.) (h) | N/A | N/A | Eagan | Minnesota | 442,542 | $0 | N/A | N/A | 0.0 | ✓ | $— | ||||||||||||||||||||||||||
| 36 | Vacant (formerly McKesson Corporation) (h) | N/A | N/A | The Woodlands | Texas | 204,063 | $0 | N/A | N/A | 0.0 | ✓ | $— | ||||||||||||||||||||||||||
| 37 | Vacant (formerly BCBSM, Inc.) (h) | N/A | N/A | Eagan | Minnesota | 12,286 | $0 | N/A | N/A | 0.0 | ✓ | $— | ||||||||||||||||||||||||||
U.S. Total (i) | 5,393,855 | $83,147 | 4.5 | $71,974 | ||||||||||||||||||||||||||||||||||
| Encumbered Status | ||||||||||||||||||||||||||||||||||||||
| # | Primary Tenant | Industry | Credit (a) | City | Country | Square Footage | ABR | Rent Increase Type | Date of Next Increase | WALT (c) | NLOP Mezzanine Loan | Other Mortgages | ||||||||||||||||||||||||||
| 1 | Siemens AS | Industrial Conglomerates | IG | Oslo | Norway | 165,905 | $4,198 | CPI: 0.0% Floor / No Cap | Jan-25 | 1.0 | $38,867 | |||||||||||||||||||||||||||
| 2 | Nokia Corporation | Communications Equipment | IG | Krakow | Poland | 53,400 | $779 | CPI: 0.0% Floor / No Cap | Sep-25 | 4.7 | $— | |||||||||||||||||||||||||||
European Total (i) | 219,305 | $4,977 | 1.5 | $38,867 | ||||||||||||||||||||||||||||||||||
Net Lease Office Properties | 13 | |||||
Net Lease Office Properties | 14 | |||||
| Normalized Pro Rata Cash NOI | |||||
Three Months Ended December 31, 2024 | |||||
| Consolidated Lease Revenues and Other | |||||
| Total lease revenues – as reported | $ | 25,419 | |||
Parking garage revenues (a) | 545 | ||||
| Less: Consolidated Reimbursable and Non-Reimbursable Property Expenses | |||||
| Reimbursable property expenses – as reported | 6,716 | ||||
| Non-reimbursable property expenses – as reported | 2,963 | ||||
| 16,285 | |||||
| Adjustments for Pro Rata Ownership of Real Estate Joint Ventures: | |||||
| Less: Pro rata share of NOI attributable to noncontrolling interests | (90) | ||||
| (90) | |||||
| 16,195 | |||||
| Adjustments for Pro Rata Non-Cash Items: | |||||
| Add: Above- and below-market rent intangible lease amortization | 476 | ||||
| Less: Straight-line and other leasing and financing adjustments | 309 | ||||
| Add: Other non-cash items | 107 | ||||
| 892 | |||||
Pro Rata Cash NOI (b) | 17,087 | ||||
Adjustment to normalize for intra-period dispositions (c) | 27 | ||||
Normalized Pro Rata Cash NOI (b) | $ | 17,114 | |||
Net Lease Office Properties | 15 | |||||
Three Months Ended December 31, 2024 | |||||
| Net Loss Attributable to NLOP | |||||
| Net loss attributable to NLOP – as reported | $ | (35,785) | |||
| Adjustments for Consolidated Operating Expenses | |||||
| Add: Operating expenses – as reported | 55,967 | ||||
| Less: Property expenses, excluding reimbursable tenant costs – as reported | (2,963) | ||||
| 53,004 | |||||
| Adjustments for Other Consolidated Revenues and Expenses: | |||||
| Less: Other lease-related income (excluding parking garage revenues) | (1,766) | ||||
| Less: Reimbursable property expenses – as reported | (6,716) | ||||
| Add: Other income and (expenses) – as reported | 10,767 | ||||
| Add: Benefit from income taxes – as reported | (3,240) | ||||
| (955) | |||||
| Other Adjustments: | |||||
| Add: Above- and below-market rent intangible lease amortization | 476 | ||||
| Less: Straight-line and other leasing and financing adjustments | 309 | ||||
| Add: Property expenses, excluding reimbursable tenant costs, non-cash | 107 | ||||
| Add: Adjustments for pro rata ownership | (69) | ||||
Adjustment to normalize for intra-period dispositions (c) | 27 | ||||
| 850 | |||||
Normalized Pro Rata Cash NOI (b) | $ | 17,114 | |||
Net Lease Office Properties | 16 | |||||
| Disclosures Regarding Non-GAAP and Other Metrics | |||||
Net Lease Office Properties | 17 | |||||
Net Lease Office Properties | 18 | |||||