UNITED STATES
SECURITIES AND EXCHANGE COMMISSION
Washington, D.C. 20549
FORM
CERTIFIED SHAREHOLDER REPORT OF REGISTERED
MANAGEMENT INVESTMENT COMPANIES
Investment Company Act file number 811-23863
(Exact name of registrant as specified in charter)
Brookfield Place
225 Liberty Street, 35th Floor
New York, New York 10281-1048
(Address of principal executive offices) (Zip code)
Brian F. Hurley, Esq.
Brookfield Public Securities Group LLC
Brookfield Place
225 Liberty Street, 35th Floor
New York, New York 10281-1048
(Name and address of agent for service)
(855) 777-8001
Registrant’s telephone number, including area code
Date of fiscal year end: December 31
Date of reporting period: December 31, 2024
Item 1. Reports to Stockholders.
| (a) |
IN PROFILE
Brookfield Asset Management Private Institutional Capital Adviser (Canada), L.P., a Manitoba limited partnership (“BAM PIC Canada,” or the “Adviser”), provides investment advisory services to the Fund and certain public and private investment vehicles and programs that Brookfield currently manages and participates in, and may in the future manage and participate in, including co-investment vehicles, sidecar vehicles, separate accounts, region-specific vehicles, strategy-specific vehicles, sector-specific vehicles and Brookfield proprietary accounts (collectively, “Brookfield Accounts”). BAM PIC Canada is an indirect wholly-owned subsidiary of Brookfield Asset Management Ltd. (NYSE: BAM; TSX: BAMA) (“Brookfield Asset Management” or “BAM”). Brookfield Public Securities Group LLC ("PSG") serves as the Administrator to the Fund. PSG is an indirect wholly-owned subsidiary of BAM. Brookfield Corporation, a publicly traded company (NYSE: BN; TSX: BN), holds a 73% interest in BAM. Brookfield Asset Management is a leading global alternative asset manager focused on real estate, renewable power, infrastructure and private equity, with over $1 trillion of assets under management as of December 31, 2024.

TABLE OF CONTENTS
| Letter to Shareholders | 1 |
| Management Discussion of Fund Performance | 3 |
| Consolidated Schedule of Investments | 6 |
| Consolidated Statement of Assets and Liabilities | 14 |
| Consolidated Statement of Operations | 15 |
| Consolidated Statements of Changes in Net Assets | 16 |
| Consolidated Statement of Cash Flows | 17 |
| Consolidated Financial Highlights | 18 |
| Notes to Consolidated Financial Statements | 22 |
| Report of Independent Registered Public Accounting Firm | 40 |
| Tax Information | 41 |
| Information Concerning Directors and Officers | 42 |
| Dividend Reinvestment Plan | 46 |
| Joint Notice of Privacy Policy | 47 |
This report is for shareholder information. This is not a prospectus intended for use in the purchase or sale of Fund shares.
| NOT FDIC INSURED | MAY LOSE VALUE | NOT BANK GUARANTEED |
[THIS PAGE IS INTENTIONALLY LEFT BLANK]
LETTER TO SHAREHOLDERS
Dear Shareholders,
We are pleased to provide the Annual Report for Brookfield Infrastructure Income Fund Inc. (the “Fund” or “BII”) for the year ended December 31, 2024.
Deal activity trended positively as we advanced through the year. The capital markets continued to strengthen, fueled in part by easing inflationary pressures and many central banks around the world easing interest rates.
Despite the improving rate environment, geopolitical tensions continued to present a challenging backdrop to the macro environment. Moreover, with half of the world’s population participating in democratic elections during the year, culminating with the U.S. election in November, investors remained cautious amid the possibility of policy shifts.
The Fund posted a positive return during the year despite the mixed macroeconomic backdrop. Performance was underpinned by the strong cash flow profiles of our assets, with revenues being 90% either regulated or contracted and 75% with inflation-linked escalators. These characteristics helped provide consistency throughout different market environments, enabling the Fund to generate a consistent and positive return month over month.
Portfolio Update
BII deployed over $800 million in capital across 15 new deals, increasing the total number of investments in the Fund to 36 as of December 31, 2024. We’ve highlighted a few key transactions below:
Global Renewable Power (Neoen)
In May 2024, Brookfield entered into negotiations to acquire a majority stake in Neoen, a leading global renewable energy developer, with the ultimate goal of taking the company private. Following the completion of the block trade and market purchases in December, a mandatory tender offer was launched to acquire the remaining public stake. Neoen has a diversified portfolio of operating assets, with 8 gigawatts (“GW”) across wind, solar and battery storage along with an advanced development pipeline of 20 GW. Particularly, its battery energy storage systems are becoming increasingly crucial to stabilize the electric grid as renewable power starts to feed the grid at scale. Neoen has established a leadership position in fast growing renewables markets such as Australia, France and the Nordics, with supportive regulatory tailwinds.
U.S. Toll Road (SH 130)
The Fund made an equity investment in an entity that owns and operates 41 miles of SH 130, a toll road under a long-term concession agreement with the State of Texas. SH 130 serves the high-growth corridor between Austin and San Antonio, which covers many of the fastest growing cities and townships in the country. SH 130 provides average time savings of up to an hour during the afternoon rush, relative to the alternative route of interstate highway I-35. As the I-35 gets more congested, the value-for-money for the toll road users is only expected to increase over time.
U.K. & European Diversified Assets
BII acquired an interest in a diversified portfolio of seven U.K. and European transport, utility and renewable power businesses. Each asset provides an essential service, has high barriers to entry, contracted or regulated cash flows, and inflation-linked revenues – key attributes of BII’s investments. An overview of the three largest assets is provided below:
| ● | Associated British Ports (ABP) is the U.K.’s largest port group with 21 facilities across England, Wales and Scotland. Most of the company’s revenues are contracted, resulting in historically low sensitivity to market cycles. |
| ● | Cadent is the U.K.’s largest gas distribution network. Cadent generates a regulated return on the size of its Regulated Asset Value (“RAV”). The need to replace and upgrade iron mains pipes and enabling hydrogen for heating is expected to further increase RAV. |
| ● | Eurostar is a high-speed passenger train service, primarily recognized for its routes from the U.K. to France. Over time, the business has diversified its operations to several other destinations in continental Europe, many routes where it is the only service provider. Moreover, the company stands to benefit from the shift in European consumers’ preferences to take trains instead of flights for short-haul trips. |
| 2024 Annual Report | 1 |
LETTER TO SHAREHOLDERS (continued)
Outlook
The global economy continues to navigate a period of uncertainty. The focus is on the change of government in the U.S. and the resulting shift in policy, including the timing and magnitude of potential tariffs on foreign imports. Simultaneously, the U.S. economy is showing strength, and employment levels remain robust. Long-term interest rates have increased recently and remain at elevated levels as investors temper their expectations around future interest rate cuts and anticipate a prolonged period of higher inflation, a tailwind for infrastructure. Meanwhile, outside of the U.S., the markets we operate in continue to perform well, with global GDP expected to grow at 2-3%, supporting volume growth across our critical infrastructure networks and supply chains.
We often characterize BII as an investment for all seasons and cycles, independent of the economic cycle, policy changes or the direction of interest rates. We believe that we are largely insulated from volatility due to the inherent resiliency and essential nature of infrastructure as an asset class, which includes a high degree of long-term contracted or regulated cash flow, as well as inflation indexation.
The Fund benefits from diversification, across geographies, sectors and counterparties. Our investments are generally at least one step removed from the end customer or rate payer. This approach reduces the risk of political intervention when rates/tariffs increase. Moreover, the growth opportunities in our existing investments and our new investments pipeline are centered around the megatrends of digitalization, decarbonization, and deglobalization.
BII is entering 2025 with momentum and we are well positioned to capitalize on the current opportunity set and deliver strong value for our investors. Following significant capital deployment in the latter half of 2024, we are pleased to report that the Fund’s investment pipeline continues to be strong heading into 2025 as we are advancing multiple transactions that are in various stages of negotiations.
We welcome your questions and comments and encourage you to contact our Investor Relations team at (855) 777-8001 or visit us at www.brookfieldoaktree.com for more information. Thank you for your support.

Chloe Berry
President
Brookfield Infrastructure Income Fund Inc.
These views represent the opinions of Brookfield Asset Management Private Institutional Capital Adviser (Canada), L.P. and are not intended to predict or depict the performance of any investment. These views are primarily as of the close of business on December 31, 2024, and subject to change based on subsequent developments.
Past performance is no guarantee of future results.
Quasar Distributors, LLC is the distributor of Brookfield Infrastructure Income Fund Inc.
| 2 | Brookfield |
BROOKFIELD INFRASTRUCTURE INCOME FUND INC.
Fund Performance
MANAGEMENT DISCUSSION OF FUND PERFORMANCE
Brookfield Infrastructure Income Fund Inc. Class I shares returned 8.18% for the year ended December 31, 2024. The Fund’s positive return was supported by the continued success of certain value-add initiatives within the portfolio’s investments, as well as capital deployment during the year. Key drivers of the Fund’s performance include:
U.S. Hydros (Smoky Mountain)
Smoky Mountain is a portfolio of four hydroelectric assets and storage facilities located in the Smoky Mountain region of the U.S. The assets are connected to the electricity grid that powers thirteen southeastern U.S. states. The storage assets provide flexibility to optimize power pricing during periods of high demand. Brookfield renewed the assets’ contract with the Tennessee Valley Authority (“TVA”), a U.S. government corporation, which provides electricity to ten million people in the region. The existing contract, which was due to terminate at the end of this year, was renewed for a 10-year period as TVA was looking to secure renewable energy to power the data center build out expected in the region. Like the previous framework, all the power generated by the assets will be sold to TVA, de-risking the cash flows of this business over the next decade.
European Telecom Towers (GD Towers)
At GD Towers, our European Telecom Tower platform in Germany and Austria, EBITDA increased approximately 10% compared to the prior year primarily due to improved colocation, higher build-to-suit towers and continued cost management. In 2024, we entered into a 15-year commitment with Germany’s second largest mobile network operator to co-locate on 1,350 sites. Co-location is beneficial to the business because it is when multiple wireless service providers mount their mobile telecommunication equipment on an existing tower. Multiple wireless providers per tower results in a higher rental yield, without incurring significant additional operational expenses. With these latest developments, Brookfield has now secured approximately 95% of the total third-party revenue growth assumed in our initial underwriting from increasing our colocation or tenancy ratios.
Nuclear Services (Westinghouse)
Westinghouse, a global provider of technologies, products and services to the nuclear power industry, continues to outperform our underwriting, which assumed limited growth in demand for nuclear energy. Today, nuclear energy stands to benefit from the artificial intelligence tailwind as it is the only baseload carbon-free power at scale that exists with proven technologies and is viewed as part of the solution to address growing electricity demands from both corporate customers and centralized utilities.
Our investment in Westinghouse is well positioned to address this growth for several reasons. Firstly, the company is the largest designer, engineer and servicer of nuclear power plants in the U.S., as well as globally. Any growth in demand for nuclear services, capacity upgrades, asset life extensions or fuel supply, is positive for the business.
Secondly, Westinghouse has the leading large-scale nuclear reactor, the AP1000, as well as the leading small module reactor (“SMR”) technology, the AP300, which is a downsized version of the proven AP1000 technology. This positions Westinghouse well to be a major participant in any new reactor demand growth as it is ahead of the curve compared to other SMR technologies, which are nascent and can take several years to permit and commercialize.
These positive performances were partially offset by lower-than-expected power generation at our Canadian Wind Portfolio, Ontario Wind, and our Colombian Renewable Power business, Isagen. Isagen saw a recovery in the second half of the year with higher generation and realized pricing on the back of a robust energy price environment and we expect generation at Ontario Wind to rebound to long-term averages. There was also limited contribution from some mature investments in the Fund, for which we are in the process of selling partial stakes and thus holding valuations flat at the expected sale price.
| 2024 Annual Report | 3 |
BROOKFIELD INFRASTRUCTURE INCOME FUND INC.
Fund Performance
Overall, BII has delivered consistent and steady results over the last 12 months and we believe the Fund continues to demonstrate that owning high quality infrastructure assets is a strategy for all market environments. We believe an allocation to a high quality, diversified portfolio of infrastructure assets is essential to a client’s portfolio, especially when faced with uncertainty on multiple fronts.
We look forward to updating you on future developments in our portfolio throughout 2025.
INCEPTION TO DATE TOTAL RETURNS*
| As of December 31, 2024 | 1 Year | Since Inception† | Inception Date |
| Class I Shares | 8.18% | 8.32% | November 1, 2023 |
| Class S (Excluding Sales Charge) | 7.28% | 7.38% | December 1, 2023 |
| Class S (Including Sales Charge) | 3.56% | 3.94% | December 1, 2023 |
| Class D (Excluding Sales Charge) | N/A | 6.58% | March 1, 2024 |
| Class D (Including Sales Charge) | N/A | 4.49% | March 1, 2024 |
| FTSE Global Core Infrastructure 50/50 Index | 9.53% | 19.87% | November 1, 2023 |
| * | All returns shown in USD. |
| † | Returns for less than one year are not annualized. |
The graph below illustrates a hypothetical investment of $10,000 in the Fund—based on price from the commencement of investment operations on November 1, 2023 to December 31, 2024, compared to the FTSE Global Core Infrastructure 50/50 Index.
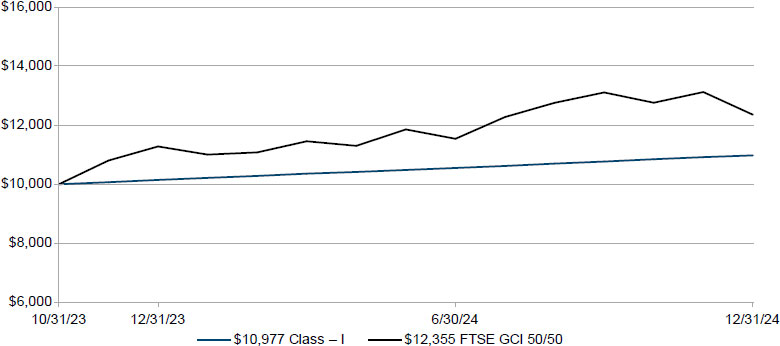
The table and graph above do not reflect the deduction of taxes that a shareholder would pay on Fund distributions or the redemption of Fund shares.
Disclosure
Past performance is no guarantee of future results.
All returns are shown in United States Dollars (“USD”).
| 4 | Brookfield |
BROOKFIELD INFRASTRUCTURE INCOME FUND INC.
Fund Performance
The FTSE Global Core Infrastructure 50/50 Index gives participants an industry-defined interpretation of infrastructure and adjusts the exposure to certain infrastructure sub-sectors. The constituent weights are adjusted as part of the semi-annual review according to three broad industry sectors—50% Utilities, 30% Transportation including capping of 7.5% for railroads/railways and a 20% mix of other sectors including pipelines, satellites and telecommunication towers. Company weights within each group are adjusted in proportion to their investable market capitalization.
An index does not reflect any fees, expenses or sales charges. It is not possible to invest directly into an index. Index performance is shown for illustrative purposes only and does not predict or depict the performance of the Fund.
The Fund’s portfolio holdings are subject to change without notice. The mention of specific securities is not a recommendation or solicitation for any person to buy, sell or hold any particular security. There is no assurance that the Fund currently holds these securities. Please refer to the Consolidated Schedule of Investments contained in this report for a full listing of the Fund’s holdings.
Investing in the Fund involves a high degree of risk, including possible loss of principal invested. There can be no assurance that the Fund will achieve its investment objective.
The Fund will subject Fund stockholders to greater risks associated with private market investments with potential limited liquidity. An investment in the Fund should be viewed as a long-term investment within a multi-asset personal portfolio and should not be viewed individually as a complete investment program.
Private infrastructure investments are subject to the risks incidental to the ownership and operation of infrastructure projects, including risks associated with the general economic climate, geographic or market concentration, government regulations and fluctuations in interest rates. Since investments in infrastructure securities, like many other types of long-term investments, have historically experienced significant fluctuations and cycles in value, specific market conditions may result in occasional or permanent reductions in the value of the these investments. Such specific market conditions could include, but are not limited to, the following: (i) demand for commodities, such as natural gas or minerals; (ii) impact of alternative technologies on our business and cyber security attacks; (iii) ability to successfully identify, complete and integrate acquisitions; (iv) competition with other market participants; (v) construction or expansion or projects, environmental damage and future capital expenditures; (vi) economic regulation and adverse regulatory decisions in the countries we operate, including nationalization or the imposition of new taxes; (vii) supply chain disruptions; and (viii) adverse claims or governmental rights or governmental rights asserted against the lands used for our infrastructure assets.
The Fund currently intends to use leverage from time to time to facilitate short-term working capital requirements and to seek to achieve its investment objectives. Leverage creates risks that may adversely affect the return for the stockholders.
Performance data quoted represents past performance results and does not guarantee future results. Current performance may be lower or higher than the performance data quoted.
These views represent the opinions of Brookfield Asset Management Private Institutional Capital Adviser (Canada), L.P. and are not intended to predict or depict the performance of any investment. These views are primarily as of the close of business on December 31, 2024 and subject to change based on subsequent developments.
| 2024 Annual Report | 5 |
BROOKFIELD INFRASTRUCTURE INCOME FUND INC.
Consolidated Schedule of Investments
December 31, 2024
| US$ THOUSANDS | DATE ACQUIRED1 | FOOTNOTE | LOCATION | COST2 | FAIR VALUE | |||||||||
| PRIVATE INVESTMENTS - 83.5% | ||||||||||||||
| PRIVATE EQUITY INVESTMENTS - 72.0% | ||||||||||||||
| Renewable Power & Transition 29.6% | ||||||||||||||
| Canadian Wind Portfolio (Ontario Wind) | November 2022 | 3,4,5 | North America | $ | 107,793 | $ | 110,639 | |||||||
| Colombian Renewable Power (Isagen) | December 2022 | 3,5,6 | Latin America | 102,221 | 98,584 | |||||||||
| Global Renewable Power (Neoen) | December 2024 | 3,5,6 | Europe | 212,513 | 209,459 | |||||||||
| Nuclear Services (Westinghouse) | November 2023 | 3,5,6 | North America | 114,765 | 148,820 | |||||||||
| Terraform Renewable Power (TERP) | November 2022 | 3,5,6 | Global | 171,280 | 162,481 | |||||||||
| U.K. Offshore Wind (Orsted) | December 2024 | 3,5,6 | Europe | 16,420 | 16,347 | |||||||||
| U.K. Wind & Solar (OnPath) | December 2023 | 3,5,6 | Europe | 16,440 | 18,400 | |||||||||
| U.S. Hydro (Smoky Mountain) | March 2023 | 3,4,5,7 | North America | 142,417 | 171,649 | |||||||||
| Total Renewable Power & Transition | 883,849 | 936,379 | ||||||||||||
| Transport 19.2% | ||||||||||||||
| European LNG Vessels (Knutsen LNG) | March 2023 | 5 | Europe | 37,652 | 31,682 | |||||||||
| Global Container Network (Triton International) | April 2023 | 3,5,6 | North America | 91,276 | 103,605 | |||||||||
| U.K. & European Diversified Infrastructure | October 2024 | 5,8 | Europe | 303,632 | 305,609 | |||||||||
| U.S. Toll Road (SH 130) | December 2024 | 5 | North America | 167,643 | 168,409 | |||||||||
| Total Transport | 600,203 | 609,305 | ||||||||||||
| Utilities 14.4% | ||||||||||||||
| Australian Utility (AusNet Services) | November 2022 | 3,4,5 | Asia Pacific | 92,214 | 99,058 | |||||||||
| North American Residential Infrastructure (Enercare) | November 2022 | 3,4,5 | North America | 118,092 | 136,303 | |||||||||
| North American Residential Infrastructure (Homeserve) | January 2023 | 3,5,6 | North America | 90,442 | 100,596 | |||||||||
| U.K. Utility (SGN) | November 2022 | 3,4,5 | Europe | 51,268 | 58,014 | |||||||||
| U.S. Utility (FirstEnergy Transmission) | November 2022 | 3,5,6 | North America | 56,033 | 60,588 | |||||||||
| Total Utilities | 408,049 | 454,559 | ||||||||||||
| Midstream 5.5% | ||||||||||||||
| Canadian Midstream (Inter Pipeline) | November 2022 | 3,4,5 | North America | 164,195 | 174,993 | |||||||||
| Total Midstream | 164,195 | 174,993 | ||||||||||||
| Data 3.3% | ||||||||||||||
| European Telecom Towers (GD Towers) | February 2023 | 3,5,6 | Europe | 91,367 | 98,380 | |||||||||
| U.S. Semiconductor Foundry (Intel Partnership) | January 2023 | 3,4,5 | North America | – | – | |||||||||
| U.S. Wireless Infrastructure (SVP) | December 2024 | 3,4,5 | North America | 7,500 | 7,500 | |||||||||
| Total Data | 98,867 | 105,880 | ||||||||||||
| Total PRIVATE EQUITY INVESTMENTS | 2,155,163 | 2,281,116 | ||||||||||||
| PRIVATE DEBT INVESTMENTS - 11.5% | ||||||||||||||
| BII BID Aggregator A L.P. | December 2023 | 3,5,9 | North America | 228,009 | 232,407 | |||||||||
| BII BID Aggregator B L.P. | December 2023 | 3,5,9 | North America | 84,193 | 85,476 | |||||||||
| BII BID Preferred Aggregator L.P. | May 2024 | 3,5,9 | North America | 45,074 | 45,997 | |||||||||
| Total PRIVATE DEBT INVESTMENTS | 357,276 | 363,880 | ||||||||||||
| Total PRIVATE INVESTMENTS | 2,512,439 | 2,644,996 | ||||||||||||
| US$ THOUSANDS | FOOTNOTE | LOCATION | PRINCIPAL AMOUNT | FAIR VALUE | ||||||||||
| LIQUID PORTFOLIO 22.6% | ||||||||||||||
| Corporate Bonds 18.4% | ||||||||||||||
| Infrastructure Services 1.1% | ||||||||||||||
| Republic Services, Inc., 2.90%, 07/01/2026 | North America | 9,405 | 9,195 | |||||||||||
| Waste Connections, Inc., 4.25%, 12/01/2028 | North America | 9,335 | 9,138 | |||||||||||
| Waste Management, Inc., 3.15%, 11/15/2027 | North America | 9,555 | 9,193 | |||||||||||
| Xylem, Inc., 1.95%, 01/30/2028 | North America | 6,740 | 6,180 | |||||||||||
| Total Infrastructure Services | 35,035 | 33,706 | ||||||||||||
See Notes to Consolidated Financial Statements.
| 6 | Brookfield |
BROOKFIELD INFRASTRUCTURE INCOME FUND INC.
Consolidated Schedule of Investments (continued)
December 31, 2024
| PRINCIPAL | FAIR | ||||||||||||
| US$ THOUSANDS | FOOTNOTE | LOCATION | AMOUNT | VALUE | |||||||||
| LIQUID PORTFOLIO 22.6% (continued) | |||||||||||||
| Corporate Bonds 18.4% (continued) | |||||||||||||
| Oil Gas Transportation & Distribution 6.1% | |||||||||||||
| Antero Midstream Partners LP, 5.75%, 03/01/2027 | 10 | North America | $ | 2,500 | $ | 2,488 | |||||||
| Boardwalk Pipelines LP, 4.45%, 07/15/2027 | North America | 9,200 | 9,104 | ||||||||||
| Buckeye Partners LP, 4.13%, 12/01/2027 | North America | 3,620 | 3,453 | ||||||||||
| Cheniere Corpus Christi Holdings LLC, 5.13%, 06/30/2027 | North America | 8,990 | 9,039 | ||||||||||
| Cheniere Energy, Inc., 4.63%, 10/15/2028 | North America | 6,715 | 6,575 | ||||||||||
| DCP Midstream Operating LP, 5.63%, 07/15/2027 | North America | 8,480 | 8,596 | ||||||||||
| DT Midstream, Inc., 4.13%, 06/15/2029 | 10 | North America | 4,565 | 4,263 | |||||||||
| Enbridge, Inc., 3.70%, 07/15/2027 | North America | 10,015 | 9,770 | ||||||||||
| Energy Transfer LP, 2.90%, 05/15/2025 | North America | 6,603 | 6,552 | ||||||||||
| Energy Transfer LP, 6.00%, 02/01/2029 | 10 | North America | 6,000 | 6,086 | |||||||||
| EnLink Midstream LLC, 5.38%, 06/01/2029 | North America | 4,360 | 4,360 | ||||||||||
| Enterprise Products Operating LLC, 3.70%, 02/15/2026 | North America | 3,615 | 3,580 | ||||||||||
| Enterprise Products Operating LLC, 3.95%, 02/15/2027 | North America | 5,475 | 5,398 | ||||||||||
| Enterprise Products Operating LLC, 4.60%, 01/11/2027 | North America | 2,950 | 2,951 | ||||||||||
| Gulfstream Natural Gas System LLC, 4.60%, 09/15/2025 | 10 | North America | 1,205 | 1,200 | |||||||||
| Gulfstream Natural Gas System LLC, 6.19%, 11/01/2025 | 10 | North America | 755 | 762 | |||||||||
| Hess Midstream Operations LP, 5.13%, 06/15/2028 | 10 | North America | 5,930 | 5,768 | |||||||||
| Kinder Morgan, Inc., 4.30%, 06/01/2025 | North America | 8,800 | 8,780 | ||||||||||
| Kinder Morgan, Inc., 4.30%, 03/01/2028 | North America | 1,570 | 1,541 | ||||||||||
| MPLX LP, 4.00%, 02/15/2025 | North America | 2,807 | 2,804 | ||||||||||
| MPLX LP, 4.00%, 03/15/2028 | North America | 6,280 | 6,092 | ||||||||||
| MPLX LP, 4.88%, 06/01/2025 | North America | 1,570 | 1,569 | ||||||||||
| NuStar Logistics LP, 6.00%, 06/01/2026 | North America | 2,990 | 2,994 | ||||||||||
| ONEOK, Inc., 3.20%, 03/15/2025 | North America | 1,865 | 1,857 | ||||||||||
| ONEOK, Inc., 4.55%, 07/15/2028 | North America | 5,085 | 5,012 | ||||||||||
| ONEOK, Inc., 5.85%, 01/15/2026 | North America | 1,965 | 1,982 | ||||||||||
| Parkland Corp., 5.88%, 07/15/2027 | 10 | North America | 3,050 | 3,021 | |||||||||
| Plains All American Pipeline LP, 3.55%, 12/15/2029 | North America | 1,500 | 1,395 | ||||||||||
| Plains All American Pipeline LP, 4.65%, 10/15/2025 | North America | 9,135 | 9,122 | ||||||||||
| Rockies Express Pipeline LLC, 3.60%, 05/15/2025 | 10 | North America | 1,240 | 1,227 | |||||||||
| Sabine Pass Liquefaction LLC, 5.63%, 03/01/2025 | North America | 536 | 536 | ||||||||||
| South Bow USA Infrastructure Holdings LLC, 4.91%, 09/01/2027 | 10 | North America | 11,570 | 11,530 | |||||||||
| Targa Resources Partners LP, 6.88%, 01/15/2029 | North America | 11,890 | 12,169 | ||||||||||
| Texas Eastern Transmission LP, 3.50%, 01/15/2028 | 10 | North America | 2,750 | 2,630 | |||||||||
| TransCanada PipeLines Ltd., 4.88%, 01/15/2026 | North America | 9,095 | 9,093 | ||||||||||
| Transcontinental Gas Pipe Line Co. LLC, 4.00%, 03/15/2028 | North America | 9,700 | 9,424 | ||||||||||
| Venture Global Calcasieu Pass LLC, 3.88%, 08/15/2029 | 10 | North America | 2,300 | 2,113 | |||||||||
| Western Midstream Operating LP, 4.75%, 08/15/2028 | North America | 9,518 | 9,351 | ||||||||||
| Total Oil Gas Transportation & Distribution | 196,194 | 194,187 | |||||||||||
| Telecommunications 3.4% | |||||||||||||
| American Tower Corp., 3.65%, 03/15/2027 | North America | 5,450 | 5,320 | ||||||||||
| American Tower Corp., 5.25%, 07/15/2028 | North America | 4,085 | 4,111 | ||||||||||
| AT&T, Inc., 1.70%, 03/25/2026 | North America | 11,045 | 10,646 | ||||||||||
| British Telecommunications plc, 5.13%, 12/04/2028 | Europe | 7,040 | 7,053 | ||||||||||
| CCO Holdings LLC, 6.38%, 09/01/2029 | 10 | North America | 1,790 | 1,775 | |||||||||
| Charter Communications Operating LLC, 4.91%, 07/23/2025 | North America | 3,854 | 3,849 | ||||||||||
| Charter Communications Operating LLC, 6.15%, 11/10/2026 | North America | 3,145 | 3,206 | ||||||||||
| Comcast Corp., 2.35%, 01/15/2027 | North America | 12,760 | 12,197 | ||||||||||
| Cox Communications, Inc., 3.50%, 08/15/2027 | 10 | North America | 6,175 | 5,970 | |||||||||
| Crown Castle, Inc., 4.00%, 03/01/2027 | North America | 1,180 | 1,159 | ||||||||||
| Crown Castle, Inc., 4.45%, 02/15/2026 | North America | 7,415 | 7,388 | ||||||||||
| Crown Castle, Inc., 5.00%, 01/11/2028 | North America | 2,998 | 2,995 | ||||||||||
| Digital Realty Trust LP, 3.70%, 08/15/2027 | North America | 6,265 | 6,089 | ||||||||||
See Notes to Consolidated Financial Statements.
| 2024 Annual Report | 7 |
BROOKFIELD INFRASTRUCTURE INCOME FUND INC.
Consolidated Schedule of Investments (continued)
December 31, 2024
| PRINCIPAL | FAIR | ||||||||||||
| US$ THOUSANDS | FOOTNOTE | LOCATION | AMOUNT | VALUE | |||||||||
| LIQUID PORTFOLIO 22.6% (continued) | |||||||||||||
| Corporate Bonds 18.4% (continued) | |||||||||||||
| Telecommunications 3.4% (continued) | |||||||||||||
| Equinix, Inc., 1.80%, 07/15/2027 | North America | $ | 2,425 | $ | 2,254 | ||||||||
| Frontier Communications Holdings LLC, 5.88%, 10/15/2027 | 10 | North America | 2,500 | 2,492 | |||||||||
| Rogers Communications, Inc., 3.20%, 03/15/2027 | North America | 8,860 | 8,557 | ||||||||||
| Sprint Capital Corp., 6.88%, 11/15/2028 | North America | 3,060 | 3,250 | ||||||||||
| TELUS Corp., 3.70%, 09/15/2027 | North America | 3,695 | 3,583 | ||||||||||
| T-Mobile USA, Inc., 3.50%, 04/15/2025 | North America | 7,905 | 7,869 | ||||||||||
| T-Mobile USA, Inc., 3.75%, 04/15/2027 | North America | 2,750 | 2,686 | ||||||||||
| Verizon Communications, Inc., 4.33%, 09/21/2028 | North America | 1,810 | 1,776 | ||||||||||
| Virgin Media Secured Finance plc, 5.50%, 05/15/2029 | 10 | Europe | 1,290 | 1,210 | |||||||||
| Vodafone Group plc, 4.38%, 05/30/2028 | Europe | 1,885 | 1,869 | ||||||||||
| Total Telecommunications | 109,382 | 107,304 | |||||||||||
| Transportation 1.1% | |||||||||||||
| Canadian National Railway Co., 2.75%, 03/01/2026 | North America | 4,075 | 3,993 | ||||||||||
| Canadian Pacific Railway Co., 1.75%, 12/02/2026 | North America | 5,340 | 5,056 | ||||||||||
| Canadian Pacific Railway Co., 2.90%, 02/01/2025 | North America | 3,325 | 3,319 | ||||||||||
| CSX Corp., 2.60%, 11/01/2026 | North America | 9,525 | 9,208 | ||||||||||
| Norfolk Southern Corp., 2.90%, 06/15/2026 | North America | 5,215 | 5,094 | ||||||||||
| Union Pacific Corp., 4.75%, 02/21/2026 | North America | 9,095 | 9,118 | ||||||||||
| Total Transportation | 36,575 | 35,788 | |||||||||||
| Utility 6.7% | |||||||||||||
| AEP Texas, Inc., 3.85%, 10/01/2025 | 10 | North America | 9,187 | 9,096 | |||||||||
| AES Corp. (The), 3.30%, 07/15/2025 | 10 | North America | 8,514 | 8,431 | |||||||||
| Ameren Corp., 1.75%, 03/15/2028 | North America | 7,110 | 6,434 | ||||||||||
| Black Hills Corp., 5.95%, 03/15/2028 | North America | 4,235 | 4,362 | ||||||||||
| CenterPoint Energy Resources Corp., 5.25%, 03/01/2028 | North America | 9,005 | 9,090 | ||||||||||
| Clearway Energy Operating LLC, 4.75%, 03/15/2028 | 10 | North America | 4,495 | 4,299 | |||||||||
| CMS Energy Corp., 3.45%, 08/15/2027 | North America | 7,525 | 7,283 | ||||||||||
| Consolidated Edison Co. of New York, Inc., 4.00%, 12/01/2028 | North America | 9,405 | 9,163 | ||||||||||
| Constellation Energy Generation LLC, 3.25%, 06/01/2025 | North America | 6,370 | 6,329 | ||||||||||
| Consumers Energy Co., 4.65%, 03/01/2028 | North America | 1,770 | 1,764 | ||||||||||
| Dominion Energy, Inc., 2.85%, 08/15/2026 | North America | 5,480 | 5,320 | ||||||||||
| DTE Energy Co., 1.05%, 06/01/2025 | North America | 10,105 | 9,949 | ||||||||||
| Duke Energy Corp., 2.65%, 09/01/2026 | North America | 9,350 | 9,049 | ||||||||||
| Edison International, 4.95%, 04/15/2025 | North America | 3,650 | 3,647 | ||||||||||
| Entergy Corp., 0.90%, 09/15/2025 | North America | 9,185 | 8,933 | ||||||||||
| Evergy Kansas Central, Inc., 2.55%, 07/01/2026 | North America | 4,715 | 4,575 | ||||||||||
| Evergy Kansas Central, Inc., 3.25%, 12/01/2025 | North America | 1,180 | 1,166 | ||||||||||
| Eversource Energy, 5.45%, 03/01/2028 | North America | 3,735 | 3,784 | ||||||||||
| Exelon Corp., 3.40%, 04/15/2026 | North America | 9,155 | 9,004 | ||||||||||
| FirstEnergy Corp., 3.90%, 07/15/2027 | North America | 4,230 | 4,119 | ||||||||||
| FirstEnergy Pennsylvania Electric Co., 5.20%, 04/01/2028 | 10 | North America | 3,000 | 3,014 | |||||||||
| Florida Power & Light Co., 3.13%, 12/01/2025 | North America | 3,210 | 3,168 | ||||||||||
| Fortis, Inc., 3.06%, 10/04/2026 | North America | 6,560 | 6,353 | ||||||||||
| NextEra Energy Capital Holdings, Inc., 1.90%, 06/15/2028 | North America | 5,065 | 4,588 | ||||||||||
| NextEra Energy Operating Partners LP, 3.88%, 10/15/2026 | 10 | North America | 2,500 | 2,390 | |||||||||
| NiSource, Inc., 3.49%, 05/15/2027 | North America | 6,300 | 6,133 | ||||||||||
| Pacific Gas and Electric Co., 3.15%, 01/01/2026 | North America | 4,410 | 4,332 | ||||||||||
| PPL Capital Funding, Inc., 3.10%, 05/15/2026 | North America | 8,990 | 8,782 | ||||||||||
| Public Service Electric and Gas Co., 3.00%, 05/15/2027 | North America | 8,585 | 8,284 | ||||||||||
| Sempra, 3.30%, 04/01/2025 | North America | 2,715 | 2,704 | ||||||||||
| Sempra, 3.40%, 02/01/2028 | North America | 3,000 | 2,868 | ||||||||||
| Southern Co. (The), 4.85%, 06/15/2028 | North America | 7,765 | 7,777 | ||||||||||
See Notes to Consolidated Financial Statements.
| 8 | Brookfield |
BROOKFIELD INFRASTRUCTURE INCOME FUND INC.
Consolidated Schedule of Investments (continued)
December 31, 2024
| US$ THOUSANDS | FOOTNOTE | LOCATION | PRINCIPAL AMOUNT | FAIR
VALUE | |||||||||
| LIQUID PORTFOLIO 22.6% (continued) | |||||||||||||
| Corporate Bonds 18.4% (continued) | |||||||||||||
| Utility 6.7% (continued) | |||||||||||||
| Southwestern Electric Power Co., 2.75%, 10/01/2026 | North America | $ | 2,360 | $ | 2,276 | ||||||||
| Virginia Electric and Power Co., 3.50%, 03/15/2027 | North America | 4,610 | 4,493 | ||||||||||
| Vistra Operations Co. LLC, 5.13%, 05/13/2025 | 10 | North America | 3,055 | 3,052 | |||||||||
| WEC Energy Group, Inc., 4.75%, 01/15/2028 | North America | 8,985 | 8,967 | ||||||||||
| Xcel Energy, Inc., 3.30%, 06/01/2025 | North America | 7,350 | 7,296 | ||||||||||
| Total Utility | 216,861 | 212,274 | |||||||||||
| Total Corporate Bonds (Cost $581,249) | 583,259 | ||||||||||||
Short-Term Investments - 4.2%
| SHARES | FAIR
VALUE | ||||||||||||
| Money Market Funds - 1.7% | |||||||||||||
| Fidelity Institutional Money Market Treasury Portfolio, Institutional Class, 4.35% | 11 | North America | 26,228 | 26,228 | |||||||||
| Invesco Government & Agency Portfolio, Institutional Class, 4.43% | 11 | North America | 26,228 | 26,228 | |||||||||
| Total Money Market Funds | 52,456 | ||||||||||||
| PRINCIPAL AMOUNT | VALUE | ||||||||||||
| Time Deposits - 2.5% | |||||||||||||
| Mizuho Time Deposit, 4.64%, 01/06/2025 | North America | 80,000 | 80,000 | ||||||||||
| Total Short-Term Investments (Cost $132,456) | 132,456 | ||||||||||||
| Total LIQUID PORTFOLIO 22.6% | 715,715 | ||||||||||||
| Total Investments (Cost $3,226,144) - 106.1% | 3,360,711 | ||||||||||||
| Liabilities in Excess of Other Assets - (6.1)% | (192,274 | ) | |||||||||||
| TOTAL NET ASSETS - 100.0% | $ | 3,168,437 | |||||||||||
The following notes should be read in conjunction with the accompanying Consolidated Schedule of Investments.
| 1 | Reflects the date at which the Predecessor Fund initially acquired the investment, where applicable. Certain investments held by the Predecessor Fund were purchased from affiliates. |
| 2 | Cost initially reflects the market value as of the date of Reorganization, where applicable, and is adjusted for subsequent purchases and sales activity. |
| 3 | Affiliated security (refer to Note 11, Investments in Affiliated Issuers, for further details). |
| 4 | Held through wholly-owned subsidiaries (refer to Note 2, Significant Accounting Policies, for further details). |
| 5 | These securities are characterized as Level 3 securities within the disclosure hierarchy. Level 3 security values are determined using significant unobservable inputs. As of December 31, 2024, the total value of all such securities was $2,644,996,000 or 83.5% of net assets. |
| 6 | Indirectly held through an affiliated unconsolidated special purpose vehicle. |
| 7 | As defined by the Investment Company Act of 1940, this investment is deemed to be a “controlled person” of the Fund because the Fund owns, either directly or indirectly, 25% or more of the portfolio company's outstanding voting securities. Refer to Note 12, Unconsolidated Significant Subsidiaries, for further details. |
| 8 | Investment in Federated Hermes Diversified Infrastructure Fund which is comprised of a diversified portfolio of seven U.K. and European transport, utility and renewable power businesses. |
See Notes to Consolidated Financial Statements.
| 2024 Annual Report | 9 |
BROOKFIELD INFRASTRUCTURE INCOME FUND INC.
Consolidated Schedule of Investments (continued)
December 31, 2024
| 9 | The Fund’s investments in BII BID Aggregator A L .P. (“Aggregator A”) and BII BID Aggregator B L .P. (“Aggregator B”) as well as BII BID Preferred Aggregator L.P. ("Preferred Aggregator"), represent equity interests in entities that provide debt loans and preferred equity, respectively, to infrastructure borrowers/issuers, either by committing and funding these transactions entirely with their own capital, or alongside affiliates. Brookfield Infrastructure Debt Fund III, LP, an affiliate of the Fund, is also an investor in Aggregator A, Aggregator B and Preferred Aggregator (i.e. a co-investor). Aggregator A, Aggregator B and Preferred Aggregator do not charge management fees and redemption provisions are limited to the liquidity of their investments, which may be limited. The investments are made across multiple sectors, including data, transport, utilities and renewable power & transition. |
Aggregator A:
Aggregator A has made loan commitments of $346 million of which $220 million was funded as of December 31, 2024. The coupons for these loans are fixed and, as of December 31, 2024, range from 8% to 10%. Coupons may be paid-in-kind. The maturities range from April 2027 to March 2031.
Aggregator B:
Aggregator B has made loan commitments of $93 million, all of which were fully funded as of December 31, 2024. The coupons for these loans are comprised of fixed and variable rates and, as of December 31, 2024, range from 9% to 12% (on a swapped to fixed basis). Coupons may be paid-in-kind. The maturities range from August 2027 to April 2028.
Preferred Aggregator:
Preferred Aggregator has made preferred equity commitments of $66 million of which $45 million was funded as of December 31, 2024. The coupons for these instruments are fixed and, as of December 31, 2024, range from 9% to 10%. The maturities range from May 2030 to November 2030.
| 10 | Security exempt from registration under Rule 144A of the Securities Act of 1933. This security may be resold in transactions exempt from registration to qualified institutional buyers. As of December 31, 2024, the total value of such security was $82,817,000 or 2.6% of net assets. |
| 11 | The rate shown represents the seven-day yield as of December 31, 2024. |
Interest Rate Swap Contracts
At December 31, 2024, the Fund had the following interest rate swap contracts outstanding:
| Description | Payment Frequency | Counter-party | Maturity Date | Notional Amount (Local Currency) | Currency | Value | Upfront Payments (Receipts) | Unrealized Gain/(Loss) (USD) | ||||||||||||||||||
| US$ THOUSANDS | ||||||||||||||||||||||||||
| OTC Interest Swap Contracts | ||||||||||||||||||||||||||
| Receive 4.236%, Pay 3-month BBSY | Quarterly | Macquarie | 4/17/26 | 24,000 | AUD | $ | 60 | $ | — | $ | 60 | |||||||||||||||
| Receive 4.921%, Pay 1-day SONIA | Quarterly | Macquarie | 4/17/26 | 17,316 | GBP | 168 | — | 168 | ||||||||||||||||||
| Total Interest Rate Swap Contracts | $ | 228 | $ | — | $ | 228 | ||||||||||||||||||||
Foreign currency forward contracts
At December 31, 2024, the Fund had the following forward exchange contracts outstanding:
| Settlement Date | Currency to be received | Currency to be delivered | Counterparty | Unrealized
Gain/(Loss) (USD) | ||||||||||||||
| US$ THOUSANDS | ||||||||||||||||||
| 01/22/25 | 1,559 | USD | 2,319 | AUD | Goldman Sachs & Co. | $ | 123 | |||||||||||
| 01/22/25 | 427 | USD | 666 | AUD | Goldman Sachs & Co. | 15 | ||||||||||||
| 01/22/25 | 2,024 | USD | 1,553 | GBP | Goldman Sachs & Co. | 80 | ||||||||||||
| 02/28/25 | 28,977 | USD | 26,000 | EUR | Mizuho Financial Group | 1,980 | ||||||||||||
| 03/31/25 | 2,283 | USD | 1,800 | GBP | Macquarie Group | 31 | ||||||||||||
| 04/03/25 | 126,685 | USD | 173,525 | CAD | Macquarie Group | 5,577 | ||||||||||||
See Notes to Consolidated Financial Statements.
| 10 | Brookfield |
BROOKFIELD INFRASTRUCTURE INCOME FUND INC.
Consolidated Schedule of Investments (continued)
December 31, 2024
| Settlement Date | Currency to be received | Currency to be delivered | Counterparty | Unrealized
Gain/(Loss) (USD) | ||||||||||||||
| US$ THOUSANDS | ||||||||||||||||||
| 04/24/25 | 418 | USD | 651 | AUD | Goldman Sachs & Co. | $ | 15 | |||||||||||
| 06/06/25 | 2,855 | USD | 4,300 | AUD | Mizuho Financial Group | 189 | ||||||||||||
| 06/06/25 | 2,283 | USD | 2,000 | EUR | Mizuho Financial Group | 192 | ||||||||||||
| 06/06/25 | 56,593 | USD | 51,500 | EUR | Mizuho Financial Group | 2,810 | ||||||||||||
| 06/12/25 | 2,153 | USD | 1,710 | GBP | Mizuho Financial Group | 15 | ||||||||||||
| 07/22/25 | 423 | USD | 659 | AUD | Goldman Sachs & Co. | 14 | ||||||||||||
| 08/29/25 | 29,040 | USD | 26,000 | EUR | Mizuho Financial Group | 1,731 | ||||||||||||
| 09/15/25 | 1,493 | USD | 2,300 | AUD | Mizuho Financial Group | 66 | ||||||||||||
| 09/15/25 | 9,458 | USD | 12,800 | CAD | Mizuho Financial Group | 456 | ||||||||||||
| 09/15/25 | 2,653 | USD | 2,400 | EUR | Mizuho Financial Group | 130 | ||||||||||||
| 09/22/25 | 3,085 | USD | 13,808,000 | COP | Macquarie Group | 58 | ||||||||||||
| 10/22/25 | 427 | USD | 666 | AUD | Goldman Sachs & Co. | 14 | ||||||||||||
| 12/15/25 | 27,568 | USD | 127,034,000 | COP | Macquarie Group | 27 | ||||||||||||
| 12/15/25 | 5,074 | USD | 6,900 | CAD | Mizuho Financial Group | 203 | ||||||||||||
| 01/22/26 | 427 | USD | 666 | AUD | Goldman Sachs & Co. | 13 | ||||||||||||
| 02/02/26 | 3,812 | USD | 5,100 | CAD | Mizuho Financial Group | 202 | ||||||||||||
| 02/02/26 | 4,316 | USD | 3,400 | GBP | Mizuho Financial Group | 68 | ||||||||||||
| 02/27/26 | 31,006 | USD | 27,700 | EUR | Mizuho Financial Group | 1,566 | ||||||||||||
| 03/31/26 | 102,569 | USD | 137,405 | CAD | Mizuho Financial Group | 5,046 | ||||||||||||
| 03/31/26 | 3,112 | USD | 4,200 | CAD | Mizuho Financial Group | 132 | ||||||||||||
| 03/31/26 | 1,229 | USD | 1,100 | EUR | Mizuho Financial Group | 58 | ||||||||||||
| 04/17/26 | 394 | USD | 615 | AUD | Goldman Sachs & Co. | 12 | ||||||||||||
| 04/17/26 | 15,346 | USD | 24,000 | AUD | Goldman Sachs & Co. | 429 | ||||||||||||
| 04/30/26 | 6,921 | USD | 6,248 | EUR | Mizuho Financial Group | 259 | ||||||||||||
| 06/30/26 | 4,454 | USD | 6,700 | AUD | Mizuho Financial Group | 277 | ||||||||||||
| 06/30/26 | 10,553 | USD | 14,300 | CAD | Mizuho Financial Group | 372 | ||||||||||||
| 09/25/26 | 127,421 | USD | 170,000 | CAD | Macquarie Group | 5,834 | ||||||||||||
| 09/30/26 | 4,817 | USD | 4,300 | EUR | Mizuho Financial Group | 187 | ||||||||||||
| 12/08/26 | 16,200 | USD | 12,945 | GBP | Mizuho Financial Group | 42 | ||||||||||||
| 12/21/26 | 25,111 | USD | 37,690 | AUD | Mizuho Financial Group | 1,550 | ||||||||||||
| 06/07/27 | 5,799 | USD | 7,786 | CAD | Mizuho Financial Group | 175 | ||||||||||||
| 06/15/27 | 1,737 | USD | 2,600 | AUD | Mizuho Financial Group | 108 | ||||||||||||
| 06/15/27 | 1,689 | USD | 1,500 | EUR | Mizuho Financial Group | 50 | ||||||||||||
| 06/15/27 | 1,918 | USD | 1,500 | GBP | Mizuho Financial Group | 41 | ||||||||||||
| 06/30/27 | 15,470 | USD | 13,650 | EUR | Goldman Sachs & Co. | 538 | ||||||||||||
| 06/30/27 | 27,264 | USD | 21,050 | GBP | Goldman Sachs & Co. | 881 | ||||||||||||
| 06/30/27 | 602 | USD | 900 | AUD | Mizuho Financial Group | 38 | ||||||||||||
| 06/30/27 | 3,341 | USD | 4,500 | CAD | Mizuho Financial Group | 89 | ||||||||||||
| 06/30/27 | 15,475 | USD | 13,650 | EUR | Mizuho Financial Group | 543 | ||||||||||||
| 06/30/27 | 27,198 | USD | 21,050 | GBP | Mizuho Financial Group | 821 | ||||||||||||
| 09/27/27 | 51,043 | USD | 38,669 | GBP | Mizuho Financial Group | 2,445 | ||||||||||||
| 09/29/27 | 4,256 | USD | 5,800 | CAD | Goldman Sachs & Co. | 55 | ||||||||||||
| 09/30/27 | 1,801 | USD | 2,800 | AUD | Goldman Sachs & Co. | 51 | ||||||||||||
| 09/30/27 | 21,260 | USD | 18,700 | EUR | Goldman Sachs & Co. | 699 | ||||||||||||
| 09/30/27 | 26,533 | USD | 20,500 | GBP | Goldman Sachs & Co. | 824 | ||||||||||||
| 09/30/27 | 4,721 | USD | 3,753 | GBP | Macquarie Group | 29 | ||||||||||||
See Notes to Consolidated Financial Statements.
| 2024 Annual Report | 11 |
BROOKFIELD INFRASTRUCTURE INCOME FUND INC.
Consolidated Schedule of Investments (continued)
December 31, 2024
| Settlement Date | Currency to be received | Currency to be delivered | Counterparty | Unrealized
Gain/(Loss) (USD) | ||||||||||||||
| US$ THOUSANDS | ||||||||||||||||||
| 09/30/27 | 67,297 | USD | 98,756 | AUD | Mizuho Financial Group | $ | 5,165 | |||||||||||
| 09/30/27 | 21,273 | USD | 18,700 | EUR | Mizuho Financial Group | 710 | ||||||||||||
| 09/30/27 | 26,467 | USD | 20,500 | GBP | Mizuho Financial Group | 765 | ||||||||||||
| 12/15/27 | 27,132 | USD | 23,800 | EUR | Goldman Sachs & Co. | 852 | ||||||||||||
| 12/15/27 | 37,388 | USD | 28,900 | GBP | Goldman Sachs & Co. | 1,127 | ||||||||||||
| 12/15/27 | 1,409 | USD | 1,274 | EUR | Mizuho Financial Group | 8 | ||||||||||||
| 12/15/27 | 27,148 | USD | 23,800 | EUR | Mizuho Financial Group | 866 | ||||||||||||
| 12/15/27 | 37,291 | USD | 28,900 | GBP | Mizuho Financial Group | 1,041 | ||||||||||||
| 12/31/27 | 22,486 | USD | 20,221 | EUR | Goldman Sachs & Co. | 204 | ||||||||||||
| 12/31/27 | 21,216 | USD | 33,383 | AUD | Mizuho Financial Group | 358 | ||||||||||||
| 06/30/28 | 22,673 | USD | 20,221 | EUR | Goldman Sachs & Co. | 185 | ||||||||||||
| 06/30/28 | 21,201 | USD | 33,383 | AUD | Mizuho Financial Group | 331 | ||||||||||||
| 09/29/28 | 4,706 | USD | 3,753 | GBP | Macquarie Group | 7 | ||||||||||||
| 12/29/28 | 22,851 | USD | 20,221 | EUR | Goldman Sachs & Co. | 159 | ||||||||||||
| 12/29/28 | 21,170 | USD | 33,383 | AUD | Mizuho Financial Group | 294 | ||||||||||||
| 06/29/29 | 23,030 | USD | 20,221 | EUR | Goldman Sachs & Co. | 139 | ||||||||||||
| 06/29/29 | 21,119 | USD | 33,383 | AUD | Mizuho Financial Group | 257 | ||||||||||||
| 12/31/29 | 23,197 | USD | 20,221 | EUR | Goldman Sachs & Co. | 107 | ||||||||||||
| 12/31/29 | 21,062 | USD | 33,383 | AUD | Mizuho Financial Group | 217 | ||||||||||||
| Total unrealized gain | 49,952 | |||||||||||||||||
| 01/07/25 | 31,264,000 | COP | 7,289 | USD | Macquarie Group | (197 | ) | |||||||||||
| 01/07/25 | 381,104,000 | COP | 86,536 | USD | Macquarie Group | (78 | ) | |||||||||||
| 01/07/25 | 14,505,000 | COP | 3,531 | USD | Macquarie Group | (240 | ) | |||||||||||
| 01/07/25 | 43 | USD | 249,000 | COP | Macquarie Group | (13 | ) | |||||||||||
| 01/07/25 | 25,196 | USD | 144,524,000 | COP | Macquarie Group | (7,584 | ) | |||||||||||
| 01/07/25 | 24,655 | USD | 141,275,000 | COP | Macquarie Group | (7,388 | ) | |||||||||||
| 01/07/25 | 24,663 | USD | 140,825,000 | COP | Macquarie Group | (7,279 | ) | |||||||||||
| 01/22/25 | 621 | USD | 510 | GBP | Goldman Sachs & Co. | (17 | ) | |||||||||||
| 02/28/25 | 3,600 | EUR | 3,977 | USD | Mizuho Financial Group | (240 | ) | |||||||||||
| 02/28/25 | 6,100 | EUR | 6,483 | USD | Mizuho Financial Group | (151 | ) | |||||||||||
| 02/28/25 | 1,582 | EUR | 1,779 | USD | Mizuho Financial Group | (136 | ) | |||||||||||
| 04/24/25 | 607 | USD | 499 | GBP | Goldman Sachs & Co. | (17 | ) | |||||||||||
| 06/06/25 | 2,235 | USD | 11,326,000 | COP | Macquarie Group | (277 | ) | |||||||||||
| 06/06/25 | 38,500 | EUR | 44,086 | USD | Mizuho Financial Group | (3,847 | ) | |||||||||||
| 06/06/25 | 2,220 | USD | 1,800 | GBP | Mizuho Financial Group | (30 | ) | |||||||||||
| 06/12/25 | 180 | GBP | 229 | USD | Mizuho Financial Group | (4 | ) | |||||||||||
| 06/12/25 | 360 | GBP | 459 | USD | Mizuho Financial Group | (9 | ) | |||||||||||
| 06/12/25 | 1,170 | GBP | 1,532 | USD | Mizuho Financial Group | (68 | ) | |||||||||||
| 07/22/25 | 613 | USD | 505 | GBP | Goldman Sachs & Co. | (17 | ) | |||||||||||
| 09/15/25 | 1,364 | USD | 1,100 | GBP | Mizuho Financial Group | (10 | ) | |||||||||||
| 10/15/25 | 70,161 | GBP | 91,469 | USD | Goldman Sachs & Co. | (3,714 | ) | |||||||||||
| 10/15/25 | 70,161 | GBP | 91,340 | USD | Mizuho Financial Group | (3,589 | ) | |||||||||||
| 10/22/25 | 619 | USD | 510 | GBP | Goldman Sachs & Co. | (17 | ) | |||||||||||
| 01/22/26 | 619 | USD | 510 | GBP | Goldman Sachs & Co. | (17 | ) | |||||||||||
| 04/17/26 | 571 | USD | 471 | GBP | Goldman Sachs & Co. | (16 | ) | |||||||||||
See Notes to Consolidated Financial Statements.
| 12 | Brookfield |
BROOKFIELD INFRASTRUCTURE INCOME FUND INC.
Consolidated Schedule of Investments (continued)
December 31, 2024
| Settlement Date | Currency to be received | Currency to be delivered | Counterparty | Unrealized
Gain/(Loss) (USD) | ||||||||||||||
| US$ THOUSANDS | ||||||||||||||||||
| 04/17/26 | 20,956 | USD | 17,316 | GBP | Goldman Sachs & Co. | $ | (622 | ) | ||||||||||
| 06/30/26 | 26,792 | USD | 127,035,000 | COP | Macquarie Group | (62 | ) | |||||||||||
| 12/15/26 | 26,053 | USD | 127,035,000 | COP | Macquarie Group | (228 | ) | |||||||||||
| 12/15/27 | 2,693 | USD | 2,155 | GBP | Mizuho Financial Group | – | * | |||||||||||
| 09/28/29 | 4,695 | USD | 3,753 | GBP | Macquarie Group | (11 | ) | |||||||||||
| Total unrealized loss | (35,878 | ) | ||||||||||||||||
| Net unrealized gain | $ | 14,074 | ||||||||||||||||
| * | Amounts round to less than $1,000. |
Abbreviations
AUD — Australian Dollar
CAD — Canadian Dollar
COP — Colombian Peso
EUR — Euro
GBP — British Pound
USD — U.S. Dollar
BBSY — Bank Bill Swap Rate
SONIA — Sterling Overnight Indexed Average
See Notes to Consolidated Financial Statements.
| 2024 Annual Report | 13 |
BROOKFIELD INFRASTRUCTURE INCOME FUND INC.
Consolidated Statement of Assets and Liabilities
| US$ THOUSANDS (except per share amounts) | Note | As
of December 31, 2024 | |||||
| Assets: | |||||||
| Investments in unaffiliated securities, at fair value (cost: $1,222,632) | 3 | $ | 1,221,415 | ||||
| Investments in affiliated securities, at fair value (cost: $2,003,512) | 3 | 2,139,296 | |||||
| Total investments, at fair value (cost: $3,226,144) | 3,360,711 | ||||||
| Distributions and interest receivable | 10,581 | ||||||
| Foreign currency forward contracts | 2,3 | 49,952 | |||||
| Interest rate swap contracts | 2,3 | 228 | |||||
| Deferred financing costs | 9 | 5,623 | |||||
| Due from Adviser | 7 | 12,203 | |||||
| Other assets | 2,456 | ||||||
| Total assets | 3,441,754 | ||||||
| Liabilities: | |||||||
| Foreign currency forward contracts | 2,3 | 35,878 | |||||
| Management fees payable | 7 | 139 | |||||
| Incentive fees payable | 7 | 9,545 | |||||
| Organizational costs payable | 7,820 | ||||||
| Payable for investments purchased | 8 | 175,670 | |||||
| Distributions payable | 6 | 10,655 | |||||
| Due to custodian | 4,454 | ||||||
| Payable for repurchase of shares | 5 | 745 | |||||
| Accounts payable and other liabilities | 2,385 | ||||||
| Current taxes payable | 10 | 2,695 | |||||
| Deferred taxes payable | 10 | 23,331 | |||||
| Total liabilities | 273,317 | ||||||
| Commitments and contingencies | 7,13 | ||||||
| Net Assets | $ | 3,168,437 | |||||
| Composition of Net Assets: | |||||||
| Paid-in capital | $ | 3,054,643 | |||||
| Distributable earnings | 113,794 | ||||||
| Net Assets | $ | 3,168,437 | |||||
| Net Assets | |||||||
| — Net Assets | $ | 2,395,165 | |||||
| Shares outstanding | |||||||
| Net asset value per share | $ | 10.44 | |||||
| — Net Assets | $ | 771,412 | |||||
| Shares outstanding | |||||||
| Net asset value per share | $ | 10.41 | |||||
| Offering price per share based on a maximum sales charge of 3.50% | $ | 10.79 | |||||
| — Net Assets | $ | 1,860 | |||||
| Shares outstanding | |||||||
| Net asset value per share | $ | 10.31 | |||||
| Offering price per share based on a maximum sales charge of 2.00% | $ | 10.52 | |||||
See Notes to Consolidated Financial Statements.
| 14 | Brookfield |
BROOKFIELD INFRASTRUCTURE INCOME FUND INC.
Consolidated Statement of Operations
| US$ THOUSANDS | Note | For
the Year Ended December 31, 2024 | |||||
| Investment income: | |||||||
| Dividend and distribution income from affiliated investments (net of foreign withholding tax of $109) | 11 | $ | 115,587 | ||||
| Dividend and distribution income from unaffiliated investments | 18,722 | ||||||
| Interest and other income from unaffiliated investments | 34,510 | ||||||
| Less: Return of capital distributions from affiliated investments | 11 | (41,936 | ) | ||||
| Less: Return of capital distributions from unaffiliated investments | (2,558 | ) | |||||
| Total investment income | 124,325 | ||||||
| Expenses: | |||||||
| Management fees | 7 | 30,656 | |||||
| Incentive fees | 7 | 9,545 | |||||
| Distribution and shareholder servicing fees | 4 | 3,440 | |||||
| Other operating expenses | 2,024 | ||||||
| Legal fees | 1,320 | ||||||
| Audit and tax services | 980 | ||||||
| Transfer agent fees | 836 | ||||||
| Administration fees | 7 | 736 | |||||
| Directors' fees | 480 | ||||||
| Offering costs | 339 | ||||||
| Total operating expenses | 50,356 | ||||||
| Interest expense and other financing costs | 9 | 3,619 | |||||
| Total operating expenses and financing costs | 53,975 | ||||||
| Expenses recouped by the Adviser | 7 | 3,771 | |||||
| Total expenses | 57,746 | ||||||
| Net investment income (before taxes) | 66,579 | ||||||
| Current tax expense | 10 | 3,218 | |||||
| Net investment income | 63,361 | ||||||
| Net realized gain (loss) on: | |||||||
| Investments in unaffiliated investments | 3,501 | ||||||
| Foreign currency transactions | 1,054 | ||||||
| Foreign currency forward contracts | 2,3 | (20,497 | ) | ||||
| Net realized loss | (15,942 | ) | |||||
| Net change in unrealized gain (loss) on: | |||||||
| Investments in affiliated investments | 3,11 | 79,745 | |||||
| Investments in unaffiliated investments | 3 | (3,010 | ) | ||||
| Foreign currency forward contracts | 2,3 | 72,835 | |||||
| Interest rate swap contracts | 2,3 | (401 | ) | ||||
| Deferred taxes recouped by the Adviser | 7 | (2,391 | ) | ||||
| Change in deferred taxes on unrealized gain | 10 | (13,293 | ) | ||||
| Foreign currency translations | 7,447 | ||||||
| Net change in unrealized gain | 140,932 | ||||||
| Net realized and unrealized gain | 124,990 | ||||||
| Net increase in net assets resulting from operations | $ | 188,351 | |||||
See Notes to Consolidated Financial Statements.
| 2024 Annual Report | 15 |
BROOKFIELD INFRASTRUCTURE INCOME FUND INC.
Consolidated Statements of Changes in Net Assets
| US$ THOUSANDS | For the Year Ended December 31, 2024 | For the Period November 1, 20231 through December 31, 2023 | |||||||||
| Increase in Net Assets Resulting from Operations: | Note | ||||||||||
| Net investment income | $ | 63,361 | $ | 6,184 | |||||||
| Net realized (loss) gain | (15,942 | ) | 129 | ||||||||
| Net change in unrealized gain | 140,932 | 16,536 | |||||||||
| Net increase in net assets resulting from operations | 188,351 | 22,849 | |||||||||
| Distributions to shareholders: | 6 | ||||||||||
| From distributable earnings | |||||||||||
| Class I shares | (85,814 | ) | (9,360 | ) | |||||||
| Class S shares | (13,533 | ) | (11 | ) | |||||||
| Class D shares | (53 | ) | — | ||||||||
| From return of capital | |||||||||||
| Class I shares | (1,171 | ) | (2,807 | ) | |||||||
| Class S shares | (185 | ) | (10 | ) | |||||||
| Class D shares | (1 | ) | — | ||||||||
| Total distributions paid | (100,757 | ) | (12,188 | ) | |||||||
| Capital share transactions: | 4 | ||||||||||
| Subscriptions | 1,735,640 | 35,481 | |||||||||
| Reinvestment of distributions | 43,027 | 1,976 | |||||||||
| Repurchases | 5 | (294,580 | ) | — | |||||||
| Shares issued due to Reorganization | — | 1,548,638 | |||||||||
| Net increase in capital share transactions | 1,484,087 | 1,586,095 | |||||||||
| Total increase in net assets | 1,571,681 | 1,596,756 | |||||||||
| Net Assets: | |||||||||||
| Beginning of Year | 1,596,756 | — | |||||||||
| End of Year | $ | 3,168,437 | $ | 1,596,756 | |||||||
| 1 | Commencement of operations |
See Notes to Consolidated Financial Statements.
| 16 | Brookfield |
BROOKFIELD INFRASTRUCTURE INCOME FUND INC.
Consolidated Statement of Cash Flows
| US$ THOUSANDS | For
the Year Ended December 31, 2024 | |||
| Operating activities : | ||||
| Net increase in net assets resulting from operations | $ | 188,351 | ||
| Adjustments to reconcile net increase in net assets resulting from operations to net cash used in operating activities: | ||||
| Purchases of long-term portfolio investments | (1,591,840 | ) | ||
| Proceeds from disposition of long-term portfolio investments | 431,630 | |||
| Net purchases and sales of short-term portfolio investments | (81,967 | ) | ||
| Net accretion of discount on investments and other adjustments to cost | (8,930 | ) | ||
| Return of capital distributions from portfolio investments | 44,494 | |||
| Increase in distributions and interest receivable | (3,168 | ) | ||
| Increase in deferred financing costs | (4,805 | ) | ||
| Decrease in deferred offering costs | 339 | |||
| Decrease in due from adviser | 5,040 | |||
| Increase in other assets | (446 | ) | ||
| Decrease in interest payable | (1,693 | ) | ||
| Decrease in management fees payable | (1,765 | ) | ||
| Increase in incentive fees payable | 5,725 | |||
| Decrease in organizational costs payable | (3,505 | ) | ||
| Increase in payable for investments purchased | 175,670 | |||
| Decrease in due to custodian | (454 | ) | ||
| Increase in accounts payable and other liabilities | 42 | |||
| Increase in current taxes payable | 1,499 | |||
| Increase in deferred taxes payable | 13,293 | |||
| Net change in unrealized gain on investments | (76,735 | ) | ||
| Net change in unrealized gain on foreign currency forward contracts | (72,835 | ) | ||
| Net change in unrealized loss on interest rate swap contracts | 401 | |||
| Cash flows used in operating activities | (981,659 | ) | ||
| Financing activities : | ||||
| Repayment of loan payable | (149,000 | ) | ||
| Proceeds from credit facility | 4,000 | |||
| Repayment of credit facility | (101,902 | ) | ||
| Repayment of reverse repurchase agreements | (84,537 | ) | ||
| Cash provided from subscriptions | 1,659,945 | |||
| Payments on repurchase of shares | (293,835 | ) | ||
| Distributions paid to shareholders, net of reinvestments | (53,012 | ) | ||
| Cash flows from financing activities | 981,659 | |||
| Effect of exchange rate changes on cash | — | |||
| Net increase to cash | — | |||
| Cash, beginning of period | — | |||
| Cash, end of Year | $ | — | ||
Supplemental Disclosure of Cash Flow Information:
Interest payments on the loan, credit facility and reverse repurchase agreements for the period ended December 31, 2024 totaled $3,243,000.
Non-cash financing activities consist of distributions reinvested through our Dividend Reinvestment Plan of $43,027,000 for the period ended December 31, 2024.
See Notes to Consolidated Financial Statements.
| 2024 Annual Report | 17 |
BROOKFIELD INFRASTRUCTURE INCOME FUND INC.
Consolidated Financial Highlights
| Class I | For the Year Ended December 31, 2024 | For the Period November 1, 20231 through December 31, 2023 |
||||||
| Per Share Operating Performance: | ||||||||
| Net asset value, beginning of period | $ | $ | ||||||
| Income from Investment Operations: | ||||||||
| Net investment income2 | 0.26 | 0.04 | ||||||
| Net realized and unrealized gain2 | 0.55 | 0.11 | ||||||
| Total from investment operations2 | 0.81 | 0.15 | ||||||
| Distributions to Shareholders: | ||||||||
| From distributable earnings | (0.43 | ) | (0.06 | ) | ||||
| From return of capital | (0.01 | ) | (0.02 | ) | ||||
| Total distributions to shareholders3 | ( |
) | ( |
) | ||||
| Net asset value, end of period | $ | $ | ||||||
| Total Investment Return4 | 8.18 | % | 1.48 | %5 | ||||
| Ratios and Supplemental Data: | ||||||||
| Net assets, end of period (in thousands) | $ | 2,395,165 | $ | 1,589,722 | ||||
| Ratio of Expenses to Average Net Assets: | ||||||||
| Management fee expense | 1.25 | % | 1.25 | %6 | ||||
| Incentive fee expense | 0.38 | % | 0.41 | %6 | ||||
| Operating expenses | 0.25 | % | 0.26 | %6 | ||||
Total expenses before interest, current tax and organizational and offering expenses | 1.88 | % | 1.92 | %6 | ||||
| Organizational and offering expenses | 0.01 | % | 0.72 | %5 | ||||
| Interest expense | 0.16 | % | 0.16 | %5 | ||||
| Current tax expense | 0.10 | % | 0.06 | %5 | ||||
Gross expenses, excluding recoupment / reimbursement, and including interest, current tax and organizational and offering expenses | 2.15 | % | 2.86 | % | ||||
| Expenses recouped (reimbursed) by the Adviser | 0.17 | % | (0.68 | )%5 | ||||
| Net expenses, including recoupment / reimbursement, interest, current tax and organizational and offering expenses | 2.32 | % | 2.18 | % | ||||
| Ratio of Net Investment Income to Average Net Assets: | ||||||||
| Net investment income | 2.52 | % | 3.67 | %6 | ||||
| Net investment income, excluding the effect of recoupment / reimbursement, interest expense and current tax expense | 2.94 | % | 3.21 | %6 | ||||
| Portfolio turnover rate7 | 17.78 | % | 0.03 | %5 | ||||
| 1 | |
| 2 | Per share amounts presented are based on average shares outstanding throughout the period indicated. |
| 3 | |
| 4 | Total investment return based on net asset value (“NAV”) is the combination of changes in NAV, reinvested dividend income at NAV and reinvested capital gains distributions at NAV, if any. |
| 5 | Not annualized for periods less than one year. |
| 6 | Annualized for periods less than one year. |
| 7 | Refer to Note 8, Purchases and Sales of Investments, for further details. |
See Notes to Consolidated Financial Statements
| 18 | Brookfield |
BROOKFIELD INFRASTRUCTURE INCOME FUND INC.
Consolidated Financial Highlights (continued)
| Class S | For the Year Ended December 31, 2024 | For
the Period December 31, 2023 |
||||||
| Per Share Operating Performance: | ||||||||
| Net asset value, beginning of period | $ | $ | ||||||
| Income from Investment Operations: | ||||||||
| Net investment income2 | 0.30 | 0.05 | ||||||
| Net realized and unrealized gain2 | 0.42 | 0.02 | ||||||
| Total from investment operations2 | 0.72 | 0.07 | ||||||
| Distributions to Shareholders: | ||||||||
| From distributable earnings | (0.35 | ) | (0.02 | ) | ||||
| From return of capital | (0.00 | ) | (0.01 | ) | ||||
| Total distributions to shareholders3 | ( | ) | ( |
) | ||||
| Net asset value, end of period | $ | $ | ||||||
| Total Investment Return4 | 7.28 | % | 0.70 | %5 | ||||
| Ratios and Supplemental Data: | ||||||||
| Net assets, end of period (in thousands) | $ | 771,412 | $ | 7,034 | ||||
| Ratio of Expenses to Average Net Assets: | ||||||||
| Management fee expense | 1.25 | % | 1.25 | %6 | ||||
| Incentive fee expense | 0.44 | % | 0.41 | %6 | ||||
| Operating expenses | 0.29 | % | 0.26 | %6 | ||||
| Distribution and shareholder servicing fees | 0.85 | % | 0.85 | %6 | ||||
Total expenses before interest, current tax and organizational and offering expenses | 2.83 | % | 2.77 | %6 | ||||
| Organizational and offering expenses | 0.01 | % | 0.72 | %5 | ||||
| Interest expense | 0.11 | % | 0.16 | %5 | ||||
| Current tax expense | 0.29 | % | 0.06 | %5 | ||||
Gross expenses, excluding recoupment / reimbursement, and including interest, current tax and organizational and offering expenses | 3.24 | % | 3.71 | % | ||||
| Expenses recouped (reimbursed) by the Adviser | 0.09 | % | (0.68 | )%5 | ||||
| Net expenses, including recoupment / reimbursement, interest, current tax and organizational and offering expenses | 3.33 | % | 3.03 | % | ||||
| Ratio of Net Investment Income to Average Net Assets: | ||||||||
| Net investment income | 2.93 | % | 2.82 | %6 | ||||
| Net investment income, excluding the effect of recoupment / reimbursement, interest expense and current tax expense | 3.41 | % | 2.36 | %6 | ||||
| Portfolio turnover rate7 | 17.78 | % | 0.03 | %5 | ||||
| 1 | |
| 2 | Per share amounts presented are based on average shares outstanding throughout the period indicated. |
| 3 | |
| 4 | Total investment return based on net asset value (“NAV”) is the combination of changes in NAV, reinvested dividend income at NAV and reinvested capital gains distributions at NAV, if any. |
| 5 | Not annualized for periods less than one year. |
| 6 | Annualized for periods less than one year. |
| 7 | Refer to Note 8, Purchases and Sales of Investments, for further details. |
See Notes to Consolidated Financial Statements
2024 Annual Report |
19 |
BROOKFIELD INFRASTRUCTURE INCOME FUND INC.
Consolidated Financial Highlights (continued)
|
For the Period March 1, 20241 through December 31, 2024 | ||||
| Class D | ||||
| Per Share Operating Performance: | ||||
| Net asset value, beginning of period | $ | |||
| Income from Investment Operations: | ||||
| Net investment income2 | 0.34 | |||
| Net realized and unrealized gain2 | 0.31 | |||
| Total from investment operations2 | 0.65 | |||
| Distributions to Shareholders: | ||||
| From distributable earnings | (0.34 | ) | ||
| From return of capital | (0.00 | ) | ||
| Total distributions to shareholders3 | ( | ) | ||
| Net asset value, end of period | $ | |||
| Total Investment Return4,5 | 6.58 | % | ||
| Ratios and Supplemental Data: | ||||
| Net assets, end of period (in thousands) | $ | 1,860 | ||
| Ratio of Expenses to Average Net Assets: | ||||
| Management fee expense6 | 1.25 | % | ||
| Incentive fee expense6 | 0.44 | % | ||
| Operating expenses6 | 0.28 | % | ||
| Distribution and shareholder servicing fees6 | 0.25 | % | ||
| Total expenses before interest, current tax and organizational and offering expenses6 | 2.22 | % | ||
| Organizational and offering expenses5 | 0.01 | % | ||
| Interest expense6 | 0.10 | % | ||
| Current tax expense6 | 0.28 | % | ||
| Gross expenses, excluding recoupment / reimbursement, and including interest, current tax and organizational and offering expenses | 2.61 | % | ||
| Expenses recouped (reimbursed) by the Adviser | 0.09 | % | ||
| Net expenses, including recoupment / reimbursement, interest, current tax and organizational and offering expenses | 2.70 | % | ||
| Ratio of Net Investment Income to Average Net Assets: | ||||
| Net investment income6 | 4.00 | % | ||
| Net investment income, excluding the effect of recoupment /reimbursement, interest expense and current tax expense6 | 4.46 | % | ||
| Portfolio turnover rate5,7 | 17.78 | % | ||
| 1 | |
| 2 | Per share amounts presented are based on average shares outstanding throughout the period indicated. |
| 3 | |
| 4 | Total investment return based on net asset value (“NAV”) is the combination of changes in NAV, reinvested dividend income at NAV and reinvested capital gains distributions at NAV, if any. |
| 5 | Not annualized for periods less than one year. |
| 6 | Annualized for periods less than one year. |
| 7 | Refer to Note 8, Purchases and Sales of Investments, for further details. |
See Notes to Consolidated Financial Statements
| 20 | Brookfield |
BROOKFIELD INFRASTRUCTURE INCOME FUND INC.
Consolidated Financial Highlights (continued)
The following table sets forth information regarding the Fund’s outstanding senior securities as of December 31, 2024.
| Fiscal or Period End | Total Amount Outstanding Exclusive of Treasury Securities | Asset Coverage per Unit1 | Involuntary Liquidating Preference Per Unit | Average Market Value per Unit (Exclude Bank Loans) | Type of Senior Security2 | |||||||
| December 31, 2024 | $ | $ | N/A | N/A | Loan Payable, Credit Facility, Reverse Repurchase Agreement | |||||||
| December 31, 2023 | N/A | N/A | Loan Payable, Credit Facility, Reverse Repurchase Agreement | |||||||||
| 1 | |
| 2 | “Senior security" means any bond, debenture, note, or similar obligation or instrument constituting a security and evidencing indebtedness, and any stock of a class having priority over any other class as to distribution of assets or payment of dividends. |
See Notes to Consolidated Financial Statements
2024 Annual Report |
21 |
BROOKFIELD INFRASTRUCTURE INCOME FUND INC.
Notes to Consolidated Financial Statements
December 31, 2024
| 1. | ORGANIZATION & INVESTMENT OBJECTIVES |
Brookfield Infrastructure Income Fund Inc. (the “Fund”) is a Maryland corporation registered under the Investment Company Act of 1940, as amended (the “1940 Act” or the “Investment Company Act”), as a non-diversified, closed-end management investment company. The Fund continuously offers its shares of common stock, and seeks to offer periodic liquidity to investors. The Fund's Class I Shares, Class S Shares and Class D Shares commenced operations on November 1, 2023, December 1, 2023 and March 1, 2024, respectively.
The Fund currently offers shares of four classes of common stock on a continuous basis: Class I Common Shares (“Class I Shares”), Class D Common Shares (“Class D Shares”), Class S Common Shares (“Class S Shares”), and Class T Common Shares (“Class T Shares” and, together with the Class I Shares, the Class D Shares, and the Class S Shares, the “Shares”). The Fund was granted exemptive relief (the “Multi-Class Exemptive Relief”) by the U.S. Securities and Exchange Commission (the “SEC”) that permits the Fund to issue multiple classes of shares and to impose asset-based distribution fees and early-withdrawal fees. In addition to the Class I Shares, Class D Shares, Class S Shares, and Class T Shares, the Fund may offer additional classes of shares in the future.
Brookfield Asset Management Private Institutional Capital Adviser (Canada), L.P. (the “Adviser”) serves as the investment adviser to the Fund pursuant to the terms of an investment advisory agreement with the Fund (the “Advisory Agreement”). The Adviser is an indirect wholly-owned subsidiary of Brookfield Asset Management Ltd. (NYSE: BAM; TSX: BAMA) ("Brookfield Asset Management" or "BAM"). Brookfield Public Securities Group LLC (the "Administrator," "PSG," or the "Sub-Adviser," together with the Adviser, the "Advisers"), an indirect-wholly-owned subsidiary of BAM, is registered as an investment adviser under the Investment Advisers Act of 1940, as amended, and serves as Administrator to the Fund. Brookfield Corporation (NYSE: BN; TSX: BN), holds a 73% interest in BAM. Brookfield Asset Management is a leading global alternative asset manager.
In addition, as described more fully below in Note 7, pursuant to an investment sub-advisory agreement (the "Sub-Advisory Agreement") between the Adviser and PSG, PSG is responsible for the implementation of the Fund's investment strategy with respect to its investments in public securities, in accordance with the Fund's investment objectives and strategies.
The Fund’s investment objective is to maximize total returns through growth of capital and current income. There can be no assurance that the Fund will achieve its investment objective.
BII launched on November 1, 2023, as a regulated investment company, structured as a "tender offer fund." At the time of launch, a predecessor fund based in Luxembourg, Brookfield Infrastructure Income Fund SCSp (the "Predecessor Fund"), was reorganized into the Fund (the "Reorganization") and as a result, the Fund adopted all of the assets and liabilities of the Predecessor Fund, including its portfolio of private infrastructure investments. The Fund maintains an investment objective and investment strategies, policies, guidelines and restrictions that are, in all material respects, equivalent to those of the Predecessor Fund. Further, the Reorganization did not result in (1) a material change in the Predecessor Fund’s investment portfolio due to investment restrictions; or (2) a change in accounting policies. Additionally, the Advisers and portfolio managers did not change as a result of the Reorganization. The net asset value of the Fund’s shares as of close of business on October 31, 2023, after the Reorganization, was $10.00 for Class I Shares and the Fund received in-kind capital contributions of net assets valued at $1,548,638,000 in exchange for 154,864,000 Class I Shares.
| 2. | SUMMARY OF SIGNIFICANT ACCOUNTING POLICIES |
The preparation of financial statements in conformity with accounting principles generally accepted in the United States of America (“GAAP”) requires management to make estimates and assumptions that affect the reported amounts of assets and liabilities and disclosure of contingent assets and liabilities at the date of the financial statements and the reported amounts of increases and decreases in net assets from operations during the reporting period. Actual results could differ from those estimates. The Fund is an investment company within the scope of Financial Accounting Standards Board (“FASB”) Accounting Standards Update (“ASU”) 2013-08 and follows accounting and reporting guidance under FASB Accounting Standards Codification (“ASC”) Topic 946 Financial Services-Investment Companies.
| 22 | Brookfield |
BROOKFIELD INFRASTRUCTURE INCOME FUND INC.
Notes to Consolidated Financial Statements (continued)
December 31, 2024
2. SUMMARY OF SIGNIFICANT ACCOUNTING POLICIES (continued)
Reporting entity and principles of consolidation
The entities listed below are wholly-owned subsidiaries (each, a "Subsidiary," or together "Subsidiaries") of the Fund. The financial results of these Subsidiaries are included in the consolidated financial statements and financial highlights of the Fund. All investments held by the Subsidiaries are disclosed in the Consolidated Schedule of Investments. The accompanying consolidated financial statements include the accounts of the Subsidiaries. All intercompany accounts and transactions have been eliminated on consolidation.
Subsidiaries
Enercare BII ULC, an Alberta corporation formed on September 23, 2022.
IPL BII ULC, an Alberta corporation formed on September 23, 2022.
Ontario Wind BII ULC, an Alberta corporation formed on September 23, 2022.
Intermediate Holdings US LLC, formed as a limited liability company under the Delaware Limited Liability Company Act on September 30, 2022.
BII Foundry Holdings LLC, formed as a limited liability company under the Delaware Limited Liability Company Act on December 22, 2022.
BII Smoky Holdings LLC, formed as a limited liability company under the Delaware Limited Liability Company Act on February 16, 2023.
BII Finco (Cayman) 2 LP formed as an Exempted Limited Partnership registered in the Cayman Islands on October 10, 2023.
BII Finco GP LLC, formed in Delaware on October 10, 2023 and is the sole general partner of BII Finco (Cayman) 2 LP.
BII Preferred US Holdings LLC, formed as a limited liability company under the Delaware Limited Liability Company Act on May 16, 2024.
BII RIC Europe Holdings (UK) Limited, formed as a limited liability company under the United Kingdom Companies Act 2006 as a private company on July 31, 2024.
BII Launch Holdings LLC, formed as a limited liability company under the Delaware Limited Liability Company Act on November 8, 2024.
Cash
Cash represents funds held in bank accounts with reputable international financial institutions. To the extent that such deposits exceed federally insured limits, the excess over such limits will be uninsured.
Valuation of investments
The Board of Directors (the "Board") has designated the Adviser as the valuation designee pursuant to Rule 2a-5 under the 1940 Act to perform fair value determinations relating to any or all Fund investments. The Board oversees the Adviser in its role as the valuation designee in accordance with the requirements of Rule 2a-5 under the 1940 Act.
The Fund values its private investments on at least a monthly basis. The Fund carries its private investments at their estimated fair value as determined by the Adviser. A number of valuation methodologies are considered in arriving at the fair value of unquoted investments, including internal or external valuation models, which may include discounted cash flow analysis. The most appropriate methodology to determine fair value is chosen on an investment by investment basis. Any control, size, liquidity or other discounts or premiums on the investment are considered by the Adviser in their determination of fair value. During the initial period after an investment has been made, cost may represent the most reasonable estimate of fair value. Intra-quarter, month-end values will reflect the latest quarterly valuation, as adjusted based on the total return that the investment is expected to generate, the impact of foreign exchange rates, and any adjustments the Adviser deems appropriate.
2024 Annual Report |
23 |
BROOKFIELD INFRASTRUCTURE INCOME FUND INC.
Notes to Consolidated Financial Statements (continued)
December 31, 2024
2. SUMMARY OF SIGNIFICANT ACCOUNTING POLICIES (continued)
Investments in equity securities listed or traded on any securities exchange or traded in the over-the-counter market are valued at the last trade price as of the close of business on the valuation date. If the relevant exchange closes early, then the equity security will be valued at the last traded price before the relevant exchange close. Prices of foreign equities that are principally traded on certain foreign markets will generally be adjusted daily pursuant to a fair value pricing service approved by the Board in order to reflect an adjustment for the factors occurring after the close of certain foreign markets but before the NYSE close. When fair value pricing is employed, the value of the portfolio securities used to calculate the Fund’s net asset value (“NAV”) may differ from quoted or official closing prices. Investments in open-end registered investment companies, if any, are valued at the NAV as reported by those investment companies.
Debt securities, including U.S. government securities, listed corporate bonds, other fixed income and asset-backed securities, and unlisted securities and private placement securities, are generally valued at the bid prices furnished by an independent pricing service or, if not valued by an independent pricing service, using bid prices obtained from active and reliable market makers in any such security or a broker-dealer. Valuations from broker-dealers or pricing services consider appropriate factors such as market activity, market activity of comparable securities, yield, estimated default rates, timing of payments, underlying collateral, coupon rate, maturity date, and other factors. Short-term debt securities with remaining maturities of sixty days or less are valued at amortized cost of discount or premium to maturity, unless such valuation, in the judgment of the Adviser, does not represent fair value.
Over-the-counter financial derivative instruments, such as forward currency contracts, options contracts, or swap agreements, derive their values from underlying asset prices, indices, reference rates, other inputs or a combination of these factors. These instruments are normally valued on the basis of evaluations provided by independent pricing services or broker dealer quotations. Depending on the instrument and the terms of the transaction, the value of the derivative instruments can be estimated by a pricing service provider using a series of techniques, such as simulation pricing models. The pricing models use issuer details and other inputs that are observed from actively quoted markets such as indices, spreads, interest rates, curves, dividends and exchange rates. Derivatives that use similar valuation techniques and inputs as described above are normally categorized as Level 2 of the fair value hierarchy.
The fair value of financial instruments that are traded in active markets at each reporting date is determined by reference to quoted market prices or dealer price quotation, without any deduction for transaction costs. For financial instruments not traded in an active market, the fair value is determined using appropriate valuation techniques. Such techniques may include using recent arm’s length market transactions, reference to the current fair value or another instrument that is substantially the same, a discounted cash flow analysis, or other valuation models.
Securities for which market prices are not readily available, cannot be determined using the sources described above, or the Adviser determines that the quotation or price for a portfolio security provided by a broker-dealer or an independent pricing service is inaccurate will be valued at a fair value determined by the Adviser following the procedures adopted by the Adviser under the supervision of the Board.
The Adviser’s valuation policy establishes parameters for the sources, methodologies, and inputs the Adviser uses in determining fair value. Non-publicly traded debt and equity securities and other securities or instruments for which reliable market quotations are not available are valued by the Adviser using valuation methodologies applied on a consistent basis. These securities may initially be valued at the acquisition price as the best indicator of fair value. The Adviser reviews the significant unobservable inputs, valuations of comparable investments and other similar transactions for investments valued at acquisition price to determine whether another valuation methodology should be utilized. Subsequent valuations will depend on facts and circumstances known as of the valuation date and the application of valuation methodologies further described below. The fair value may also be based on a pending transaction expected to close after the valuation date. These valuation methodologies involve a significant degree of management judgment. Accordingly, valuations do not necessarily represent the amounts which may eventually be realized from sales or other dispositions of investments in the future. Fair values may differ from the values that would have been used had a ready market for the investment existed, and the differences could be material to the consolidated financial statements.
| 24 | Brookfield |
BROOKFIELD INFRASTRUCTURE INCOME FUND INC.
Notes to Consolidated Financial Statements (continued)
December 31, 2024
2. SUMMARY OF SIGNIFICANT ACCOUNTING POLICIES (continued)
The fair valuation methodology may include or consider the following guidelines, as appropriate: (1) evaluation of all relevant factors, including but not limited to, pricing history, current market level, supply and demand of the respective security; (2) comparison to the values and current pricing of securities that have comparable characteristics; (3) knowledge of historical market information with respect to the security; and (4) other factors relevant to the security which would include, but not be limited to, duration, yield, fundamental analytical data, the Treasury yield curve, and credit quality. The fair value may be difficult to determine and thus judgment plays a greater role in the valuation process. Imprecision in estimating fair value can also impact the amount of unrealized gain or loss recorded for a particular portfolio security and differences in the assumptions used could result in a different determination of fair value, and those differences could be material. For those securities valued by fair valuations, the Adviser reviews and affirms the reasonableness of the valuations based on such methodologies on a regular basis after considering all relevant information that is reasonably available. There can be no assurance that the Fund could purchase or sell a portfolio security at the price used to calculate the Fund’s NAV.
Foreign Currency Transactions
Securities and other assets and liabilities denominated in foreign currencies are translated into U.S. dollar amounts at the date of valuation. Purchases and sales of securities and income and expense items denominated in foreign currencies are translated into U.S. dollar amounts on the respective dates of such transactions. The Fund does not isolate the portion of gains or losses resulting from changes in foreign exchange rates on securities from the fluctuations arising from changes in market prices.
Reported net realized foreign exchange gains or losses arise from sales of securities, currency gains or losses realized between the trade and settlement dates on securities transactions and the difference between the amounts of dividends, interest and foreign withholding taxes recorded on the Fund’s books and the U.S. dollar equivalent of the amounts actually received or paid.
Investment Transactions and Investment Income
Investments are recorded on trade date. Realized gains and losses from securities transactions are calculated on the identified cost basis. Discounts and premiums on securities are accreted and amortized on a daily basis using the effective yield to maturity and yield to next methods, respectively, and might be adjusted based on management’s assessment of the collectability of such interest. Dividend income is recorded on the ex-dividend date. Income from distributions is limited to the amount of earnings and profits, generated by each portfolio company. Distributions from these portfolio companies in excess of earnings and profits are recorded as a return of capital. Interest income is recorded on the accrual basis, if applicable.
Expenses
Expenses directly attributable to the Fund are charged directly to the Fund, while expenses that are attributable to the Fund and other investment companies advised by the Adviser or its affiliates are allocated among the respective investment companies, including the Fund, based either upon relative average net assets, evenly, or a combination of average net assets and evenly.
2024 Annual Report |
25 |
BROOKFIELD INFRASTRUCTURE INCOME FUND INC.
Notes to Consolidated Financial Statements (continued)
December 31, 2024
2. SUMMARY OF SIGNIFICANT ACCOUNTING POLICIES (continued)
Income Taxes
The Fund is a regulated investment company that benefits from flow-through tax treatment as it expects to distribute substantially all of its taxable income to its shareholders. However, income taxes are recognized for the amount of taxes payable by the Fund’s corporate subsidiaries and for the impact of deferred tax assets and liabilities related to such subsidiaries.
Current income taxes: Current income tax assets and liabilities are measured at the amount expected to be paid to tax authorities, net of recoveries based on the tax rates and laws enacted at the reporting date.
Deferred income taxes: Deferred income tax liabilities are provided for using the liability method on temporary differences between the tax bases used in the computation of taxable income and carrying amounts of assets and liabilities in the consolidated financial statements. Deferred income tax assets are recognized for all deductible temporary differences, carry forward of unused tax credits and unused tax losses, to the extent that it is probable that deductions, tax credits and tax losses can be utilized. The carrying amount of deferred income tax assets are reviewed at each reporting date and reduced to the extent it is no longer probable that the income tax asset will be recovered.
Deferred income tax assets and liabilities are measured at the tax rates that are expected to apply in the period in which the liability is settled or the asset realized, based on tax rates and tax laws that have been enacted by the end of the reporting period. The measurement of deferred income tax liabilities and assets reflect the tax consequences that would follow from the manner in which the Fund expects, at the end of the reporting period, to recover or settle the carrying amount of its assets and liabilities.
Deferred income tax assets and liabilities are offset when there is a legally enforceable right to set off current tax assets against current tax liabilities and when they relate to income taxes levied by the same taxation authority within a single taxable entity or the Fund intends to settle its current tax assets and liabilities on a net basis in the case where there exist different taxable entities in the same taxation authority and when there is a legally enforceable right to set off current tax assets against current tax liabilities.
Organizational Expenses and Offering Costs
Organizational costs are expensed as incurred and consist of costs to establish the Fund and enable it legally to do business. Offering costs from the initial launch of the Fund were deferred and amortized over the first twelve months after the commencement of operations in accordance with FASB ASC 946-20-25-5 and ASC 946-20-35-5, respectively. Offering costs consist primarily of registration fees and legal fees for the preparation of the Fund’s initial Registration Statement on Form N-2. Organizational costs were reimbursed by the Adviser, subject to potential recoupment as described in Note 7.
Operating Segments
The Fund operates as a single operating segment. The Fund’s income, expenses, assets, and performance are regularly monitored and assessed as a whole by the President of the Fund, who is responsible for the oversight functions of the Fund, using the information presented in the financial statements and financial highlights.
New Accounting Pronouncements
In June 2022, FASB issued ASU No. 2022-03, Fair Value Measurement (Topic 820): Fair Value Measurement of Equity Securities Subject to Contractual Sale Restrictions. The amendments in this update clarify the guidance in Topic 820 when measuring the fair value of an equity security subject to contractual sale restrictions and introduce new disclosure requirements related to such equity securities. The amendments are effective for fiscal years beginning after December 15, 2023, with early adoption permitted. The Fund's financial statements are not materially impacted by this update.
| 26 | Brookfield |
BROOKFIELD INFRASTRUCTURE INCOME FUND INC.
Notes to Consolidated Financial Statements (continued)
December 31, 2024
2. SUMMARY OF SIGNIFICANT ACCOUNTING POLICIES (continued)
In December 2023, the FASB issued ASU 2023-09, Income Taxes (Topic 740) Improvements to Income Tax Disclosures. ASU 2023-09 requires disclosure of disaggregated income taxes paid in both U.S. and foreign jurisdictions, prescribes standard categories for the components of the effective tax rate reconciliation and modifies other income tax-related disclosures. ASU 2023-09 is effective for the fiscal year ending December 31, 2025. Early adoption is permitted and the amendments in this update should be applied on a prospective basis, though retrospective adoption is permitted. The Fund is currently evaluating the impact of this guidance on its financial statements.
Derivative Financial Instruments
The Fund may purchase and sell derivative instruments such as swaps, including credit default and total return swaps, and other over-the-counter derivative instruments or participations. The Fund may invest in, or enter into, derivatives for a variety of reasons, including to hedge certain market risks, to provide a substitute for purchasing or selling particular securities or to increase potential income gain.
Forward Currency Contracts: A forward currency contract (“forward contract”) is an agreement between two parties to buy or sell a currency at an agreed upon price for settlement at a future date. During the period the forward contract is in existence, changes in the value of the forward contract will fluctuate with changes in the currency exchange rates. The forward contract is marked to market daily and these changes are recorded as an unrealized gain or loss. Gain or loss on the purchase or sale of a forward contract is realized on the settlement date.
The Fund enters into forward contracts to hedge against fluctuations in the value of foreign currencies caused by changes in the prevailing currency exchange rates. The use of forward contracts involves the risk that the counterparties may be unable to meet the terms of their contracts and may be negatively impacted from unanticipated movements in the value of a foreign currency relative to the U.S. dollar.
The average U.S. dollar value of forward currency contracts to be delivered or received during the year ended December 31, 2024 was $1,111,053,000.
Interest Rate Swaps: An interest rate swap is an agreement between the Fund and a counterparty to exchange cash flows based on the difference between two interest rates, applied to a notional amount. These agreements may be privately negotiated in the over-the-counter market (OTC interest rate swaps) or may be executed on a registered exchange (centrally cleared interest rate swaps). Over the term of the contract, contractually required payments to be paid and to be received are accrued daily and recorded as unrealized gain or loss until the payments are made, at which time they are realized.
The Fund enters into interest rate swap contracts primarily to manage interest rate risk.
For the year ended December 31, 2024, the average month end notional amount of swap contracts was $40,016,000.
The following table sets forth the fair value of the Fund’s derivative instruments:
| Derivatives | Consolidated Statement of Assets and Liabilities Location | Value as of December 31, 2024 | ||||
| US$ THOUSANDS | ||||||
| Assets | ||||||
| Foreign currency contracts | Foreign currency forward contracts | $ | 49,952 | |||
| Interest rate contracts | Interest rate swap contracts | $ | 228 | |||
2024 Annual Report |
27 |
BROOKFIELD INFRASTRUCTURE INCOME FUND INC.
Notes to Consolidated Financial Statements (continued)
December 31, 2024
2. SUMMARY OF SIGNIFICANT ACCOUNTING POLICIES (continued)
| Derivatives | Consolidated Statement of Assets and Liabilities Location | Value as of December 31, 2024 | ||||
| Liabilities | ||||||
| Foreign currency contracts | Foreign currency forward contracts | $ | (35,878 | ) | ||
The following table sets forth the effect of derivative instruments on the Consolidated Statement of Operations for the year ended December 31, 2024:
| Derivatives | Consolidated Statement of Operations Location | Net Realized Loss | Net Change in Unrealized Gain (Loss) | |||||||
| US$ THOUSANDS | ||||||||||
| Foreign currency contracts | Foreign currency forward contracts | $ | (20,497 | ) | $ | 72,835 | ||||
| Interest rate contracts | Interest rate swap contracts | — | (401 | ) | ||||||
| $ | (20,497 | ) | $ | 72,434 | ||||||
The Fund has elected to not offset derivative assets and liabilities or financial assets, including cash, that may be received or paid as part of collateral arrangements, even when an enforceable master netting agreement is in place that provides the Fund, in the event of counterparty default, the right to liquidate collateral and the right to offset a counterparty’s rights and obligations.
| Gross Amounts | Amounts Offset in the Statement Assets and Liabilities | Amounts Presented in the Statement of Assets and Liabilities | Non-Cash Collateral (Pledged) Received1 | Collateral Pledged (Received)1 | Net Amount | |||||||||||||||||||
| US$ THOUSANDS | ||||||||||||||||||||||||
| Assets: | ||||||||||||||||||||||||
Forward currency contracts | $ | 49,952 | $ | — | $ | 49,952 | $ | — | $ | — | $ | 49,952 | ||||||||||||
| Swap contracts | $ | 228 | $ | — | $ | 228 | $ | — | $ | — | $ | 228 | ||||||||||||
| Liabilities: | ||||||||||||||||||||||||
Forward currency contracts | $ | (35,878 | ) | $ | — | $ | (35,878 | ) | $ | — | $ | — | $ | (35,878 | ) | |||||||||
| 1 | Excess of collateral pledged to the individual counterparty is not shown for financial statement purposes. |
| 28 | Brookfield |
BROOKFIELD INFRASTRUCTURE INCOME FUND INC.
Notes to Consolidated Financial Statements (continued)
December 31, 2024
3. FAIR VALUE MEASUREMENTS
A three-tier hierarchy has been established to maximize the use of observable market data and minimize the use of unobservable inputs and to establish classification of fair value measurements for disclosure purposes.
Observable inputs are inputs that reflect the assumptions market participants would use in pricing the asset or liability developed based on market data obtained from sources independent of the reporting entity. Unobservable inputs are inputs that reflect the reporting entity’s own assumptions about the assumptions market participants would use in pricing the asset or liability developed based on the best information available in the circumstances.
The three-tier hierarchy of inputs is summarized in the three broad levels listed below:
Level 1 — quoted prices in active markets for identical assets or liabilities
Level 2 — quoted prices in markets that are not active or other significant observable inputs (including, but not limited to: quoted prices for similar assets or liabilities, quoted prices based on recently executed transactions, interest rates, credit risk, etc.)
Level 3 — significant unobservable inputs (including the Fund’s own assumptions in determining the fair value of assets or liabilities)
The following table summarizes the Fund’s investments valuation inputs categorized in the disclosure hierarchy as of December 31, 2024:
| FAIR VALUE MEASUREMENTS | ||||||||||||||||
| LEVEL 1 | LEVEL 2 | LEVEL 3 | TOTAL | |||||||||||||
| US$ THOUSANDS | ||||||||||||||||
| Investments accounted for at fair value: | ||||||||||||||||
| Private investments | $ | — | $ | — | $ | 2,644,996 | $ | 2,644,996 | ||||||||
| Corporate bonds | — | 583,259 | — | 583,259 | ||||||||||||
| Short-term Investments | 52,456 | 80,000 | — | 132,456 | ||||||||||||
| Total Investments at Fair Value | $ | 52,456 | $ | 663,259 | $ | 2,644,996 | $ | 3,360,711 | ||||||||
| Other Financial Instruments (Assets) | ||||||||||||||||
| Foreign currency forward contracts | $ | — | $ | 49,952 | $ | — | $ | 49,952 | ||||||||
| Interest rate swaps | — | 228 | — | 228 | ||||||||||||
| Total Other Financial Instruments (Assets) | $ | — | $ | 50,180 | $ | — | $ | 50,180 | ||||||||
| Other Financial Instruments (Liabilities) | ||||||||||||||||
| Foreign currency forward contracts | $ | — | $ | 35,878 | $ | — | $ | 35,878 | ||||||||
| Total Other Financial Instruments (Liabilities) | $ | — | $ | 35,878 | $ | — | $ | 35,878 | ||||||||
2024 Annual Report |
29 |
BROOKFIELD INFRASTRUCTURE INCOME FUND INC.
Notes to Consolidated Financial Statements (continued)
December 31, 2024
3. FAIR VALUE MEASUREMENTS (continued)
The table below shows the significant unobservable valuation inputs that were used by the Adviser to fair value the Level 3 investments as of December 31, 2024.
| Quantitative Information about Level 3 Fair Value Measurements | |||||||
Value as of December 31, 2024 |
Valuation Approach | Valuation Technique | Unobservable Input | Amount or Range/ (Weighted Average) |
Impact to Valuation from an Increase in Input(1) | ||
| US$ THOUSANDS | |||||||
| Private equity Investments | $ | 2,281,116 | Income Approach |
Discounted cash flow model |
Discount Rate |
8% to 20% (12%) |
Decrease |
Terminal Value Multiple |
4x to 26x (14x) |
Increase | |||||
| Private debt Investments | $ | 363,880 | Income Approach |
Discounted cash flow model |
Discount Rate |
8% to 12% (9%) |
Decrease |
| (1) | The impact represents the expected directional change in the fair value of Level 3 investments that would result from an increase in the corresponding input. A decrease to the unobservable input would have the opposite effect. Significant changes in these inputs could result in significantly higher or lower fair value measurements. |
The following is a reconciliation of the assets in which significant unobservable inputs (Level 3) were used in determining fair value:
| Private Equity | Private Debt | Total | ||||||||||
| US$ THOUSANDS | ||||||||||||
| Balance as of December 31, 2023 | $ | 1,521,539 | $ | 207,450 | $ | 1,728,989 | ||||||
| Purchases of investments | 718,451 | 165,356 | 883,807 | |||||||||
| Return of capital | (33,901 | ) | (10,593 | ) | (44,494 | ) | ||||||
| Sales proceeds | — | — | — | |||||||||
| Accrued discounts (premiums) | — | — | — | |||||||||
| Realized gain (loss) | — | — | — | |||||||||
| Net change in unrealized gain | 75,027 | 1,667 | 76,694 | |||||||||
| Balance as of December 31, 2024 | $ | 2,281,116 | $ | 363,880 | $ | 2,644,996 | ||||||
| Change in unrealized gain for Level 3 assets still held at the reporting date | $ | 75,027 | $ | 1,667 | $ | 76,694 | ||||||
4. CAPITAL SHARES
The Fund currently offers its Shares on a continuous basis and was granted Multi-Class Exemptive Relief by the SEC that permits the Fund to issue multiple classes of shares and to impose asset-based distribution fees and early-withdrawal fees. In addition to the Class I Shares, Class D Shares, Class S Shares, and Class T Shares, the Fund may offer additional classes of shares in the future.
| 30 | Brookfield |
BROOKFIELD INFRASTRUCTURE INCOME FUND INC.
Notes to Consolidated Financial Statements (continued)
December 31, 2024
4. CAPITAL SHARES (continued)
The Shares are continuously offered each month at an offering price equal to NAV per share (plus an applicable front-end sales load, where relevant), which is calculated: (i) as of the close of business on the last business day of each month; (ii) on each date that Shares are to be repurchased in connection with the Fund's offer to purchase Shares; and (iii) at such other times as the Board shall determine. The differences among the Shares relate to front-end sales loads and ongoing distribution and shareholder servicing fees. No front-end sales load or distribution and shareholder servicing fees are paid with respect to Class I Shares. The Class D Shares and the Class S Shares are each subject to a front-end sales load of up to 2.00% and 3.50%, respectively. Investors purchasing Class T Shares may be charged a sales load of up to 3.00% and a maximum dealer fee of 0.50% of the investment amount, for a total front-end sales load of up to 3.50%. Holders of the Shares have equal rights and privileges with each other, except with respect to front-end sales loads and certain ongoing distribution and shareholder servicing fees.
For the year ended December 31, 2024, distribution and shareholder servicing fees totaled $3,437,000 for Class S Shares. Distribution and shareholder servicing fees for Class D Shares were $3,000 for the period from March 1, 2024 (inception date) to December 31, 2024.
At December 31, 2024, 0.81% of the shares of the Fund were owned by Brookfield and its affiliates.
Share transactions in the Fund’s shares were as follows:
Year Ended December 31, 2024 | Period Ended December 31, 2023 | |||||||||||||||
| Shares | Amount | Shares | Amount | |||||||||||||
| US$ THOUSANDS | ||||||||||||||||
| Class I Shares: Inception date November 1, 2023 | ||||||||||||||||
| Shares issued in Reorganization (Note 1) | $ | — | $ | 1,548,638 | ||||||||||||
| Subscriptions | 96,920 | 991,546 | 2,846 | 28,472 | ||||||||||||
| Reinvestment of distributions | 3,404 | 34,981 | 197 | 1,976 | ||||||||||||
| Repurchases | (28,744 | ) | (294,190 | ) | — | — | ||||||||||
| Net increase | $ | 732,337 | $ | 1,579,086 | ||||||||||||
Class S Shares: Inception date December 1, 2023 | ||||||||||||||||
| Subscriptions | 72,643 | 742,119 | 701 | 7,009 | ||||||||||||
| Reinvestment of distributions | 778 | 8,004 | — | — | ||||||||||||
| Repurchases | (18 | ) | (184 | ) | — | — | ||||||||||
| Net increase | $ | 749,939 | $ | 7,009 | ||||||||||||
Class D Shares: Inception date March 1, 2024 | ||||||||||||||||
| Subscriptions | 196 | 1,975 | — | — | ||||||||||||
| Reinvestment of distributions | 4 | 42 | — | — | ||||||||||||
| Repurchases | (20 | ) | (206 | ) | — | — | ||||||||||
| Net increase | $ | 1,811 | — | $ | — | |||||||||||
5. REPURCHASES
The Fund intends, but is not obligated, to conduct quarterly tender offers of its outstanding Shares at the applicable NAV per share as of the applicable valuation date. Repurchases will be made at such times and on such terms as may be determined by the Board of Directors, in its sole discretion. However, no assurance can be given that repurchases will occur or that any Shares properly tendered will be repurchased by the Fund. Any repurchase of Shares from a stockholder that were held for less than one year (on a first-in, first-out basis) will be subject to an “Early Repurchase Fee” equal to 2% of the NAV (measured as of the repurchase date) of any Shares repurchased by the Fund. If an Early Repurchase Fee is charged to a stockholder, the amount of such fee will be retained by the Fund. Following the commencement of an offer to repurchase Shares, the Fund may suspend, postpone or terminate such offer in certain circumstances upon the determination of a majority of the Board, including a majority of the independent directors, that such suspension, postponement or termination is advisable for the Fund and its stockholders, including, without limitation, circumstances as a result of which it is not reasonably practicable for the Fund to dispose of its investments or to determine its net asset value, and other unusual circumstances. In the event of termination, however, the Fund may terminate an offer only upon the occurrence of conditions as specified at the outset of the offer that are objectively verifiable and outside of the control of the Fund or its agents or affiliates. Stockholders may withdraw their written tenders after the expiration of 40 business days from the commencement of the offer if the Board provides consent and the tender has not yet been accepted by the Fund for payment. Once the tender has been accepted for payment, the Fund will repurchase the Shares and remit the repurchase price to stockholders, less any applicable Early Repurchase Fee, within 5 business days after the applicable expiration date in all instances.
2024 Annual Report |
31 |
BROOKFIELD INFRASTRUCTURE INCOME FUND INC.
Notes to Consolidated Financial Statements (continued)
December 31, 2024
5. REPURCHASES (continued)
During the year ended December 31, 2024, the Fund completed four quarterly tender offers which commenced on February 23, 2024, May 29, 2024, August 23, 2024 and December 2, 2024. The results of the tender offers were as follows:
| Commencement Date | February 23, 2024 | |
| Repurchase Request Deadline | March 22, 2024 | |
| Repurchase Pricing Date | March 28, 2024 | |
| Dollar Amount Repurchased | $ | 55,935,000 |
| Shares Repurchased | 5,500,000 | |
| Commencement Date | May 29, 2024 | |
| Repurchase Request Deadline | June 27, 2024 | |
| Repurchase Pricing Date | June 28, 2024 | |
| Dollar Amount Repurchased | $ | 237,793,000 |
| Shares Repurchased | 23,199,000 | |
| Commencement Date | August 23, 2024 | |
| Repurchase Request Deadline | September 24, 2024 | |
| Repurchase Pricing Date | September 30, 2024 | |
| Dollar Amount Repurchased | $ | 106,000 |
| Shares Repurchased | 10,000 | |
| Commencement Date | December 2, 2024 | |
| Repurchase Request Deadline | December 31, 2024 | |
| Repurchase Pricing Date | December 31, 2024 | |
| Dollar Amount Repurchased | $ | 746,000 |
| Shares Repurchased | 73,000 | |
Brookfield and its affiliates participated in each tender offer and tendered a total of 28,688,000 shares for total proceeds of $293,616,000.
6. DISTRIBUTIONS
The Fund intends to distribute substantially all of its net investment income to common stockholders in the form of distributions. Under normal market conditions, the Fund intends to declare and pay distributions monthly to common stockholders of record. In addition, the Fund intends to distribute any net capital gains earned from the sale of portfolio securities to common stockholders no less frequently than annually, although net short-term capital gains may be paid more frequently. However, the Fund cannot guarantee that it will make distributions and the amount of distributions that the Fund may pay, if any, is uncertain.
| 32 | Brookfield |
BROOKFIELD INFRASTRUCTURE INCOME FUND INC.
Notes to Consolidated Financial Statements (continued)
December 31, 2024
6. DISTRIBUTIONS (continued)
The Fund intends to pay common stockholders annually all, or at least 90%, of its investment company taxable income. Various factors will affect the level of the Fund’s investment company taxable income, such as its asset mix. Distributions may be paid to the holders of the Fund’s Shares if, as and when authorized by the Board of Directors and declared by the Fund out of assets legally available therefor. To permit the Fund to pay monthly distributions, it may from time to time distribute less than the entire amount of income earned in a particular period, with the undistributed amount being available to supplement future distributions. As a result, the distributions paid by the Fund for any particular monthly period may be more or less than the amount of income actually earned during that period. Because the Fund’s income will fluctuate and the Fund’s distribution policy may be changed by the Board of Directors at any time, there can be no assurance that the Fund will pay distributions or dividends. Distributions are subject to re-characterization for federal income tax purposes after the end of the fiscal year.
A notice disclosing the source(s) of a distribution is provided after a payment is made from any source other than net investment income. This notice is available on the Adviser’s website at https://www.brookfieldoaktree.com/fund/brookfield- infrastructure-income-fund-inc. Any such notice is provided only for informational purposes in order to comply with the requirements of Section 19(a) of the 1940 Act and not for tax reporting purposes. The tax composition of the Fund’s distributions for each calendar year is reported on IRS Form 1099-DIV.
7. INVESTMENT ADVISORY & ADMINISTRATIVE AGREEMENTS
The Fund and the Adviser have entered into the Advisory Agreement pursuant to which the Adviser is entitled to receive a base management fee and an incentive fee.
The base management fee (the “Management Fee”) is accrued monthly and payable quarterly in arrears at the annual rate of 1.25% of the value of the Fund’s net assets before any management and incentive fees, which is calculated as of the close of business on the last business day of each month.
The incentive fee (the “Incentive Fee”) is accrued monthly and payable annually in arrears at an amount equal to 12.5% of the Fund Income for the applicable year. The Fund looks through any total return swap contracts and counts the underlying reference assets as investments for purposes of calculating the Incentive Fee.
“Fund Income” means (1) distributions received by the Fund from the Fund’s private portfolio investments; plus (2) distributions received by the Fund of net investment income (or loss) from debt, preferred equity investments and traded securities; minus (3) the Fund’s expenses (excluding the Incentive Fee and distribution and servicing fees). The distributions received by the Fund from the Fund’s private portfolio investments, including the distributions received by the Fund of net investment income (or loss) from debt, preferred equity investments and traded securities, are treated as cash from operations (or income) received by the Fund without regard to the tax characteristics (e.g., income vs. return of capital) of the distributions received. The annual payment of the Incentive Fee will reflect all such distributions received by the Fund, except returns of invested capital that are not derived from the operations of the issuer based on a review by the Fund’s portfolio management team of the issuer’s financial statements and results from business operations.
Fund Income does not include any component of capital gains or capital appreciation. The Adviser is not entitled to any incentive fee based on the capital gains or capital appreciation of the Fund or its investments.
Pursuant to an Expense Limitation and Reimbursement Agreement (the “Expense Limitation and Reimbursement Agreement”), through April 30, 2026, the Adviser has contractually agreed to waive and/or reimburse expenses of the Fund so that certain of the Fund’s expenses (“Specified Expenses,” as defined below) will not exceed 0.70% of the Fund’s net assets (annualized). The Fund has agreed to repay these amounts, when and if requested by the Adviser, but only if and to the extent that Specified Expenses are less than 0.70% of net assets (annualized) (or, if a lower expense limit under the Expense Limitation and Reimbursement Agreement is then in effect, such lower limit) within three years after the date the Adviser waived or reimbursed such fees or expenses. This arrangement cannot be terminated prior to April 30, 2026 without the Board’s consent. “Specified Expenses” is defined to include all expenses incurred in the business of the Fund, including, among other things, organizational and offering costs, professional fees, and fees and expenses of the Administrator, Transfer Agent and Custodian, with the exception of (i) the Management Fee, (ii) the Incentive Fee, (iii) distribution and shareholder servicing fees, (iv) portfolio level expenses, (v) brokerage costs or other investment-related out-of-pocket expenses, including costs incurred with respect to unconsummated investments, (vi) dividend/ interest payments (including any dividend payments, interest expenses, commitment fees, or other expenses related to any leverage incurred by the Fund), (vii) taxes, and (viii) extraordinary expenses (such as litigation and other expenses not incurred in the ordinary course of the Fund’s business).
2024 Annual Report |
33 |
BROOKFIELD INFRASTRUCTURE INCOME FUND INC.
Notes to Consolidated Financial Statements (continued)
December 31, 2024
7. INVESTMENT ADVISORY & ADMINISTRATIVE AGREEMENTS (continued)
The amount of expenses reimbursed and available to be recouped before expiration on October 31, 2026 is $12,203,000. For the year ended December 31, 2024, the Adviser recouped previously waived eligible expenses of $3,771,000 and $2,391,000 related to organizational costs and income taxes, respectively.
The Adviser has entered into the Sub-Advisory Agreement with PSG (the "Sub-Adviser"), a Delaware limited liability company and a registered investment adviser under the Advisers Act. The Sub-Adviser is an indirect wholly-owned subsidiary of BAM. In addition to the Fund, the Sub-Adviser’s clients include financial institutions, public and private pension plans, insurance companies, endowments and foundations, sovereign wealth funds and high net worth investors. The Sub-Adviser specializes in global listed real assets strategies and its investment philosophy incorporates a value-based approach towards investment. PSG also serves as the Fund’s administrator (the “Administrator”) and accounting agent pursuant to an administration agreement. The Administrator provides, or oversees the performance of, administrative and compliance services, including, but not limited to, maintaining financial records, overseeing the calculation of NAV, compliance monitoring (including diligence and oversight of our other service providers), preparing reports to stockholders and reports filed with the SEC, preparing materials and coordinating meetings of the Board, managing the payment of expenses and the performance of administrative and professional services rendered by others and providing office space, equipment and office services. For its services under the administration agreement, PSG receives an annual fee from the Fund equal to 0.03% of the Fund's net asset value.
J.P. Morgan Chase Bank, N.A. (in such capacity, the “Sub-Administrator”) provides certain administrative and fund accounting services pursuant to a fund services agreement with the Fund (the “Fund Services Agreement”). Pursuant to the Fund Services Agreement, and subject to the supervision of the Administrator, the Sub-Administrator provides certain administrative services to the Fund that are not otherwise provided by the Administrator, which include, but are not limited to: assisting in securities valuation; performing portfolio accounting services; and assisting in the preparation of financial reports.
The Fund is responsible for any fees due to the Sub-Administrator.
Certain officers and/or directors of the Fund are officers and/or employees of the Administrator or the Adviser.
8. PURCHASES AND SALES OF INVESTMENTS
During the year ended December 31, 2024, purchases and sales of investments excluding short-term securities were $1,591,840,000 and $431,630,000, respectively. There were no purchases and sales of long-term U.S. Government securities. During the year, the portfolio turnover rate was 17.8% and comprised entirely of turnover within the Fund's corporate bond portfolio.
In October 2024, the Fund acquired an interest in a U.K. & European Diversified Infrastructure portfolio for total consideration of $303,632,000 of which $175,670,000 is payable in October 2025, one year from the initial investment date. This deferred consideration is denominated in GBP and was converted to U.S. dollars based on the spot rate as of December 31, 2024. This amount is reflected within "Payable for investments purchased" in the Consolidated Statement of Assets and Liabilities.
| 34 | Brookfield |
BROOKFIELD INFRASTRUCTURE INCOME FUND INC.
Notes to Consolidated Financial Statements (continued)
December 31, 2024
9. BORROWINGS
Credit facility: The Predecessor Fund established a line of credit on April 19, 2023. This facility was transferred to the Fund as part of the Reorganization that occurred on October 31, 2023 and was subsequently amended on November 21, 2024. The Fund pays interest in the amount of the Secured Overnight Financing Rate ("SOFR") plus an applicable margin on the amount borrowed and incurs commitment fees on the unused portion.
During the year ended December 31, 2024, the Fund borrowed an additional $4,000,000 and subsequently repaid the total outstanding amount on the facility of $101,902,000, including accrued interest of $789,000. The Fund utilized the credit facility for 13 days and had an average daily loan balance of $26,593,000 at a weighted average borrowing cost of 8.11%.
During the year, the Fund incurred commitment fees of $611,000 and amortized $1,121,000 in deferred financing costs, both of which are included in interest expense and other financing costs on the Consolidated Statement of Operations. As of December 31, 2024, the Fund had $5,623,000 in unamortized deferred financing costs reported on Consolidated Statement of Assets and Liabilities. The remaining portion is being amortized over the life of the agreement which matures on November 20, 2026.
In addition, as of December 31, 2024, $79,488,000 of the credit facility was committed for letters of credit in conjunction with our investments in Canadian Wind Portfolio (Ontario Wind), U.S. Hydro (Smoky Mountain), North American Residential Infrastructure (Enercare), U.S. Semiconductor Foundry (Intel Partnership) and U.K. Offshore Wind (Orsted).
Reverse Repurchase Agreements: In a reverse repurchase agreement, the Fund delivers a security to a financial institution, the counterparty, in exchange for cash with a simultaneous agreement to repurchase the same or substantially the same security at an agreed upon price and date. The Fund is entitled to receive principal and interest payments, if any, made on the security delivered to the counterparty during the term of the agreement. Cash received in exchange for securities delivered plus accrued interest payments to be made by the Fund to counterparties are reflected as a liability on the Consolidated Statement of Assets and Liabilities. Interest payments made by the Fund to counterparties are recorded as a component of interest expense on the Consolidated Statement of Operations. The Fund will segregate assets delivered as collateral under reverse repurchase agreements.
Reverse repurchase agreements involve the risk that the market value of the securities retained in lieu of sale by the Fund may decline below the price of the securities the Fund has sold but is obligated to repurchase. In the event the buyer of securities under a reverse repurchase agreement files for bankruptcy or becomes insolvent, such buyer or its trustee or receiver may receive an extension of time to determine whether to enforce the Fund’s obligation to repurchase the securities, and the Fund’s use of the proceeds of the reverse repurchase agreement may effectively be restricted pending such decision. Also, the Fund would bear the risk of loss to the extent that the proceeds of the reverse repurchase agreement are less than the value of the securities subject to such agreements.
During the year ended December 31, 2024, the Fund settled all outstanding reverse repurchase positions totaling $84,537,000. The Fund utilized reverse repurchase agreements for 77 days and had an average daily balance of positions outstanding of $62,481,000 at a weighted average interest rate of 6.39%. Interest expense amounted to $840,000.
Related party: On December 8, 2023, the Fund established a $300 million loan facility with BII BIG Holdings L.P., an indirect wholly-owned subsidiary of BAM. Each loan advanced under the facility incurs interest at a rate of 8% per annum and is repayable no later than two years following the date of advance. During the year ended December 31, 2024, the Fund converted $25,000,000 of the $174,000,000 brought forward balance to equity and repaid the residual balance in cash, including interest of $1,324,000. As of December 31, 2024, the Fund did not have a balance outstanding on the facility.
| 2024 Annual Report | 35 |
BROOKFIELD INFRASTRUCTURE INCOME FUND INC.
Notes to Consolidated Financial Statements (continued)
December 31, 2024
10. FEDERAL INCOME TAX INFORMATION
The Fund intends to continue to meet the requirements of the Internal Revenue Code of 1986, as amended, applicable to regulated investment companies and to distribute substantially all of its investment company taxable income and net capital gain, if any, for the taxable year to its shareholders. Therefore, no associated federal income or excise tax provision is required. The Fund may incur an excise tax to the extent it has not distributed all of its taxable income on a calendar year basis, however, no such tax has been incurred for the year ended December 31, 2024. Income taxes recognized relate to the amount of taxes payable by the Fund’s corporate subsidiaries and the deferred tax assets and liabilities of such subsidiaries.
GAAP provides guidance for how uncertain tax positions should be recognized, measured, presented and disclosed in the financial statements. An evaluation of tax positions taken in the course of preparing the Fund’s tax returns to determine whether the tax positions are “more-likely-than-not” of being sustained by the taxing authority is required. Tax benefits of positions not deemed to meet the more-likely-than-not threshold would be booked as a tax expense in the current year and recognized as: a liability for unrecognized tax benefits; a reduction of an income tax refund receivable; a reduction of a deferred tax asset; an increase in a deferred tax liability; or a combination thereof.
The Fund has reviewed all taxable years that are open for examination (i.e., not barred by the applicable statute of limitations) by taxing authorities of all major jurisdictions, including the Internal Revenue Service. No examination of the Fund’s tax returns is currently in progress.
Income and capital gain distributions are determined in accordance with federal income tax regulations, which may differ from GAAP.
The Fund’s income tax provision consists of the following for the fiscal year ended December 31, 2024.
| US$ THOUSANDS | Year Ended December 31, 2024 | |||
| Current tax expense: | ||||
| Federal | $ | 670 | ||
| State | 92 | |||
| Foreign | 2,456 | |||
| Total current tax expense | $ | 3,218 | ||
| Deferred tax expense | ||||
| Federal | $ | 7,433 | ||
| State | 1,475 | |||
| Foreign | 4,385 | |||
| Total deferred tax expense | $ | 13,293 | ||
| Total estimated provisions for income taxes | $ | 16,511 | ||
The effective tax rate for the Fund and its consolidated subsidiaries for the year ended December 31, 2024 was 8.94%.
The tax character of the distributions paid for the periods shown below were as follows:
| US$ THOUSANDS | Year Ended December 31, 2024 | Period Ended December 31, 2023 | ||||||
| Ordinary income | $ | 88,745 | $ | 9,371 | ||||
| Return of capital | 1,357 | 2,817 | ||||||
| Total | $ | 90,102 | $ | 12,188 | ||||
| 36 | Brookfield |
BROOKFIELD INFRASTRUCTURE INCOME FUND INC.
Notes to Consolidated Financial Statements (continued)
December 31, 2024
10. FEDERAL INCOME TAX INFORMATION (continued)
At December 31, 2024, the Fund’s most recently completed tax year-end, the components of distributable earnings on a tax basis were as follows:
| US$ THOUSANDS | ||||
| Undistributed ordinary income | $ | — | ||
| Undistributed long-term capital gains | $ | — | ||
| Capital loss carryforwards | $ | — | ||
| Net unrealized appreciation (depreciation) | $ | 128,475 | ||
| Other timing difference | $ | (14,681 | ) | |
Federal Income Tax Basis: The federal income tax basis of the Fund’s investments at December 31, 2024 was as follows:
| Cost of investments | Gross Unrealized gain | Gross Unrealized loss | Net Unrealized gain | |||||||||||
| US$ THOUSANDS | ||||||||||||||
| $ | 3,223,285 | $ | 177,709 | $ | (40,967 | ) | $ | 136,742 | ||||||
The Fund had no capital loss carryforwards as of December 31, 2024.
Capital Account Reclassifications: Because federal income tax regulations differ in certain respects from GAAP, income and capital gain distributions, if any, determined in accordance with tax regulations may differ in amount, timing, and character from net investment income and realized gains recognized for financial reporting purposes. These differences are primarily due to differing treatments for Section 988 currency, partnership income/expense and nondeductible expenses. Permanent book and tax differences, if any, will result in reclassifications among the components of the Fund's net assets. These reclassifications have no effect on net assets or NAV per share. Any undistributed net income and realized gain remaining at fiscal year end is distributed in the following year.
At December 31, 2024, the Fund’s most recently completed tax year-end, the Fund’s components of net assets were increased or (decreased) by the amounts shown in the table below:
| Paid-in capital | Distributable earnings |
| $1,318 | $(1,318) |
| 2024 Annual Report | 37 |
BROOKFIELD INFRASTRUCTURE INCOME FUND INC.
Notes to Consolidated Financial Statements (continued)
December 31, 2024
11. INVESTMENTS IN AFFILIATED ISSUERS
The table below reflects transactions during the year with entities that are affiliates as of December 31, 2024.
| Opening Value | Purchases, net of returns of capital | Sales | Unrealized Gain (Loss)1 | End Value | Dividend and Distributions Income2 | |||||||||||||||||||
| US$ THOUSANDS | ||||||||||||||||||||||||
| Australian Utility (AusNet Services) | $ | 99,067 | $ | — | $ | — | $ | (9 | ) | $ | 99,058 | $ | 100 | |||||||||||
| Canadian Midstream (Inter Pipeline) | 173,858 | (587 | ) | — | 1,722 | 174,993 | — | |||||||||||||||||
| Canadian Wind Portfolio (Ontario Wind) | 113,599 | — | — | (2,960 | ) | 110,639 | 1,896 | |||||||||||||||||
| Colombian Renewable Power (Isagen) | 100,977 | — | — | (2,393 | ) | 98,584 | 4,413 | |||||||||||||||||
| European Telecom Towers (GD Towers) | 95,644 | 1,275 | — | 1,461 | 98,380 | 2,644 | ||||||||||||||||||
| Global Container Network (Triton International) | 93,811 | — | — | 9,794 | 103,605 | 12,654 | ||||||||||||||||||
| Global Renewable Power (Neoen) | — | 212,512 | — | (3,053 | ) | 209,459 | — | |||||||||||||||||
| North American Residential Infrastructure (Enercare) | 124,458 | 6,533 | — | 5,312 | 136,303 | 349 | ||||||||||||||||||
| North American Residential Infrastructure (Homeserve) | 96,484 | (4,508 | ) | — | 8,620 | 100,596 | 1,855 | |||||||||||||||||
| Nuclear Services (Westinghouse) | 117,836 | (235 | ) | — | 31,219 | 148,820 | — | |||||||||||||||||
| Terraform Renewable Power (TERP) | 197,610 | (23,800 | ) | — | (11,329 | ) | 162,481 | 12,336 | ||||||||||||||||
| U.K. Offshore Wind (Orsted) | — | 16,420 | — | (73 | ) | 16,347 | — | |||||||||||||||||
| U.K. Utility (SGN) | 53,945 | — | — | 4,069 | 58,014 | 53 | ||||||||||||||||||
| U.K. Wind & Solar (OnPath) | 18,680 | (2,066 | ) | — | 1,786 | 18,400 | 1,626 | |||||||||||||||||
| U.S. Hydro (Smoky Mountain) | 141,351 | — | — | 30,298 | 171,649 | 10,774 | ||||||||||||||||||
| U.S. Semiconductor Foundry (Intel Partnership) | — | — | — | — | — | — | ||||||||||||||||||
| U.S. Utility (FirstEnergy Transmission) | 56,974 | — | — | 3,614 | 60,588 | 328 | ||||||||||||||||||
| U.S. Wireless Infrastructure (SVP) | — | 7,500 | — | — | 7,500 | — | ||||||||||||||||||
| BII BID Aggregator A L.P. | 114,729 | 115,031 | — | 2,647 | 232,407 | 14,768 | ||||||||||||||||||
| BII BID Aggregator B L.P. | 92,721 | (5,342 | ) | — | (1,903 | ) | 85,476 | 9,717 | ||||||||||||||||
| BII BID Preferred Aggregator L.P. | — | 45,074 | — | 923 | 45,997 | 247 | ||||||||||||||||||
| $ | 1,691,744 | $ | 367,807 | $ | — | $ | 79,745 | $ | 2,139,296 | $ | 73,760 | |||||||||||||
| 1 | Includes foreign currency translation gains & losses. Offsetting mark-to-market gains & losses from the Fund's foreign currency hedging positions are disclosed separately under 'Foreign currency forward contracts' on the Consolidated Statement of Operations. |
| 2 | Dividend and distributions income is shown gross of foreign withholding taxes. |
12. UNCONSOLIDATED SIGNIFICANT SUBSIDIARIES
In accordance with Rules 3-09 and 4-08(g) of Regulation S-X (“Rule 3-09” and “Rule 4-08(g),” respectively), the Fund must determine which of its unconsolidated controlled portfolio companies (as defined by Regulation S-X) are considered “significant subsidiaries,” if any. In evaluating these investments, Rule 1-02(w)(2) of Regulation S-X stipulates two tests to be utilized to determine if any of our controlled investments are considered significant subsidiaries for financial reporting purposes: the investment test and the income test. Rule 3-09 requires separate audited financial statements of an unconsolidated majority owned subsidiary in an annual report if any of the tests exceed the thresholds noted in Rule 1-02(w)(2) whereas Rule 4-08(g) only requires summarized financial information in an annual/semi-annual report if the thresholds are exceeded.
The Fund’s investment in U.S. Hydro (Smoky Mountain) as of December 31, 2024 exceeded the threshold in at least one of the Rule 4-08(g) tests. Included below is the summarized financial information for U.S. Hydro (Smoky Mountain).
| US$ THOUSANDS | 31-Dec-24 | 31-Dec-23 | 31-Dec-22 | |||||||||
| Total assets | $ | 565,364 | $ | 519,453 | $ | 542,034 | ||||||
| Total liabilities | 457,047 | 199,947 | 222,517 | |||||||||
| Equity | 108,317 | 319,506 | 319,517 | |||||||||
| Total revenue | 101,070 | 93,173 | 111,198 | |||||||||
| Net income | 46,355 | 45,356 | 34,124 | |||||||||
| 38 | Brookfield |
BROOKFIELD INFRASTRUCTURE INCOME FUND INC.
Notes to Consolidated Financial Statements (continued)
December 31, 2024
13. INDEMNIFICATIONS, COMMITMENTS AND CONTINGENCIES
Under the Fund’s organizational documents, its officers and directors are indemnified against certain liabilities arising out of the performance of their duties to the Fund. In addition, in the normal course of business, the Fund enters into contracts with its vendors and others that provide for indemnification. The Fund’s maximum exposure under these arrangements is unknown, since this would involve the resolution of certain claims, as well as future claims that may be made, against the Fund. Thus, an estimate of the financial impact, if any, of these arrangements cannot be made at this time. However, based on experience, the Fund expects the risk of loss due to these warranties and indemnities to be unlikely.
14. SUBSEQUENT EVENTS
GAAP requires recognition in the financial statements of the effects of all subsequent events that provide additional evidence about conditions that existed at the date of the Statement of Assets and Liabilities. For non-recognized subsequent events that must be disclosed to keep the financial statements from being misleading, the Fund is required to disclose the nature of the event as well as an estimate of its financial effect, or a statement that such an estimate cannot be made.
Management has evaluated subsequent events in the preparation of the Fund’s financial statements and has determined that there are no additional events that require recognition or disclosure in the financial statements.
| 2024 Annual Report | 39 |
BROOKFIELD INFRASTRUCTURE INCOME FUND INC.
Report of Independent Registered Public Accounting Firm
To the shareholders and the Board of Directors of Brookfield Infrastructure Income Fund Inc.
Opinion on the Financial Statements and Financial Highlights
We have audited the accompanying consolidated statement of assets and liabilities of Brookfield Infrastructure Income Fund Inc. and subsidiaries (the "Fund"), including the consolidated schedule of investments, as of December 31, 2024, the related consolidated statements of operations and cash flows for the year then ended, the consolidated statement of changes in net assets and the consolidated financial highlights for the year then ended and for the period from November 1, 2023 (commencement of operations) through December 31, 2023, and the related notes to the consolidated financial statements (collectively referred to as the “financial statements”). In our opinion, the financial statements and financial highlights present fairly, in all material respects, the financial position of the Fund as of December 31, 2024, and the results of its operations and its cash flows for the year then ended, and the changes in its net assets and the financial highlights for the year then ended and for the period from November 1, 2023 (commencement of operations) through December 31, 2023 in conformity with accounting principles generally accepted in the United States of America.
Basis for Opinion
These financial statements and financial highlights are the responsibility of the Fund's management. Our responsibility is to express an opinion on the Fund's financial statements and financial highlights based on our audits. We are a public accounting firm registered with the Public Company Accounting Oversight Board (United States) (PCAOB) and are required to be independent with respect to the Fund in accordance with the U.S. federal securities laws and the applicable rules and regulations of the Securities and Exchange Commission and the PCAOB.
We conducted our audits in accordance with the standards of the PCAOB. Those standards require that we plan and perform the audit to obtain reasonable assurance about whether the financial statements and financial highlights are free of material misstatement, whether due to error or fraud. The Fund is not required to have, nor were we engaged to perform, an audit of its internal control over financial reporting. As part of our audits, we are required to obtain an understanding of internal control over financial reporting but not for the purpose of expressing an opinion on the effectiveness of the Fund’s internal control over financial reporting. Accordingly, we express no such opinion.
Our audits included performing procedures to assess the risks of material misstatement of the financial statements and financial highlights, whether due to error or fraud, and performing procedures that respond to those risks. Such procedures included examining, on a test basis, evidence regarding the amounts and disclosures in the financial statements and financial highlights. Our audits also included evaluating the accounting principles used and significant estimates made by management, as well as evaluating the overall presentation of the financial statements and financial highlights. Our procedures included confirmation of securities owned as of December 31, 2024, by correspondence with the custodian, counterparties, agent banks, and brokers; when replies were not received from agent banks and brokers, we performed other auditing procedures. We believe that our audits provide a reasonable basis for our opinion.
Deloitte & Touche LLP
Chicago, Illinois
February 28, 2025
We have served as the auditor of one or more Brookfield Public Securities Group LLC’s investment companies since 2011.
| 40 | Brookfield |
BROOKFIELD INFRASTRUCTURE INCOME FUND INC.
Tax Information (Unaudited)
The Fund is required by subchapter M of the Internal Revenue Code of 1986, as amended, to advise you within 60 days of the Fund’s fiscal year end (December 31, 2024) as to the federal tax status of distributions received by shareholders during such fiscal year. Accordingly, we are advising you that 1.51% of the distributions paid from net investment income for the Fund was reclassified as return of capital and is reflected as such in the Fund’s Statements of Changes in Net Assets and Financial Highlights.
For the year ended December 31, 2024, certain dividends paid by the Fund may be subject to a maximum tax rate of 23.80%, as provided for by the Tax Cuts and Jobs Act of 2017. The percentage of dividends declared from ordinary income designated as qualified dividend income was 25.95%.
For corporate shareholders, the percent of ordinary income distributions qualifying for the corporate dividends received deduction for the fiscal year ended December 31, 2024 was 14.82%.
The percentage of taxable ordinary income distributions that are designated as short-term capital gain distributions under Internal Revenue Section 871(k)(2)(C) was 0.00%.
| 2024 Annual Report | 41 |
BROOKFIELD INFRASTRUCTURE INCOME FUND INC.
Information Concerning Directors and Officers (Unaudited)
The following tables provide information concerning the directors and officers of the Fund.
Independent Directors of the Fund
Name,
Address and |
Position(s)
Held with Fund |
Principal
Occupation(s) During Past 5 Years and |
Number
of Portfolios |
Independent Directors:(4) |
|||
Edward
A. Kuczmarski
Born: 1949 |
Director and Independent Chair of the Board, Member of the Audit Committee, Member of the Governance Committee
Served since 2023 |
Retired.
Director/Trustee of several investment companies advised by PSG (2011-Present).
|
10
|
Stuart
A. McFarland
Born: 1947 |
Director, Member of the Audit Committee, Member of the Governance Committee
Served since 2023
|
Managing Partner of Federal City Capital Advisors (1997-2021).
Director/Trustee of several investment companies advised by PSG (2006 – Present); Director of Drive Shack Inc. (formerly, New Castle Investment Corp.) (2000 – 2020); Director of New America High Income Fund (2013 – Present); Director of New Senior Investment Group, Inc. (2014 – 2021); Director of Steward Partners (2017 – 2020); Chair of the Board of Raven SR (2022 – Present). |
10
|
Heather
S. Goldman
Born: 1967 |
Director, Member of the Audit Committee, Chair of the Governance Committee
Served since 2023 |
CFO of My Flex Inc. an EQBR company (2022 – 2023); Executive in Residence, Global Digital Finance (2024 - Present).
Director/Trustee of several investment companies advised by PSG (2013-Present).
|
10
|
William
H. Wright II
Born: 1960 |
Director, Chair of the Audit Committee, Member of the Governance Committee
Served since 2023
|
Retired.
Director/Trustee of several investment companies advised by PSG (2020-Present); Director of Alcentra Capital Corporation (1940 Act BDC) (2018-2019); Advisory Director of Virtus Global Dividend & Income Fund, Virtus Global Multi-Sector Income Fund, Virtus Total Return Fund and Duf & Phelps Select Energy MLP Fund (2013-2019); Director of the Carlyle Group, TCG BDC I, Inc., TCG BDC II, Inc. and Carlyle Secured Lending III (2021-Present). |
10
|
| 42 | Brookfield |
BROOKFIELD INFRASTRUCTURE INCOME FUND INC.
Information Concerning Directors and Officers (Unaudited) (continued)
Name,
Address and |
Position(s)
Held with Fund |
Principal
Occupation(s) During Past 5 Years and |
Number
of Portfolios |
Betty
A.Whelchel
Born: 1956 |
Director, Member of the Audit Committee, Member of the Governance Committee
Since January 1, 2024 |
Retired.
Director/Trustee of several investment companies advised by the Adviser (2024-Present). |
10 |
Susan
Schauffert-Tam
Born: 1968 |
Director, Member of the Audit Committee, Member of the Governance Committee
Since November 20, 2024 |
Managing Director, BMO Capital Markets (2007 - 2024) Director/Trustee of several investment companies advised by PSG (2024-Present). |
10 |
| Interested Director: | |||
Brian
F. Hurley
Born: 1977 |
Director
Since March 29, 2024 |
President of several investment companies advised by PSG (2014– Present); General Counsel of the Administrator (2017–Present); General Counsel of Brookfield Oaktree Wealth Solutions (2021–Present); Managing Partner of Brookfield Asset Management Inc. (2016– Present).
Director/Trustee of several investment companies advised by PSG (2024-Present). |
10 |
| 2024 Annual Report | 43 |
BROOKFIELD INFRASTRUCTURE INCOME FUND INC.
Information Concerning Directors and Officers (Unaudited) (continued)
Officers of the Fund
Name,
Address and |
Position(s)
Held with Fund and Term |
Principal
Occupation(s) During Past 5 Years |
Chloe
Berry
Born: 1984 |
President Served since 2023 |
Managing Director of the Adviser (2022 – Present); Senior Vice President of the Adviser (2017 – 2022).
|
Casey
P. Tushaus
Born: 1982 |
Treasurer Served since 2023 |
Treasurer of several investment companies advised by PSG (2021 – Present); Assistant Treasurer of several investment companies advised by PSG (2016 – 2021); Director of PSG (2021 – Present); Vice President of PSG (2014– 2021).
|
Brian
F. Hurley
Born: 1977 |
Secretary Served Since 2023 |
Secretary of several investment companies advised by the PSG (2014-Present); General Counsel of PSG (2017-Present); Managing Director (2014-Present) of the PSG; Managing Partner of Brookfield (2016-Present); Director of Brookfield Soundvest Capital Management (2015-2018).
|
Craig
A. Ruckman
Born: 1977 |
Assistant
Secretary Served Since 2023 |
Secretary of several investment companies advised by PSG (November 2022 – Present); Managing Director of PSG (October 2022 – Present); Director of Allianz Global Investors U.S. Holdings LLC (2016 – 2022); Assistant Secretary of 63 funds in the Allianz Global Investors Fund Complex (2017 – 2020); and Chief Legal Officer of Allianz Global Investors Distributors LLC (2019 – 2022). |
Adam
R. Sachs
Born: 1984 |
Chief
Compliance Officer Served Since 2023 |
CCO of several investment companies advised by PSG (2017 – Present); Director of PSG (2017– Present); CCO of Brookfield Public Securities Group (Canada) LLC (2017 – Present).
|
Mohamed
S. Rasul
Born: 1981 |
Assistant
Treasurer Served Since 2023 |
Assistant Treasurer of several investment companies advised by PSG (2016 – Present); Vice President of PSG (2019 – Present); Assistant Vice President of PSG (2014 – 2019).
|
| 44 | Brookfield |
BROOKFIELD INFRASTRUCTURE INCOME FUND INC.
Information Concerning Directors and Officers (Unaudited) (continued)
| 1 | The term of office of the Independent Directors is indefinite. |
| 2 | As of the date of this report, the Brookfield fund complex (the "Fund Complex") is comprised of the Fund, Brookfield Investment Funds (five series of underlying portfolios), Brookfield Real Assets Income Fund Inc., Oaktree Asset-Backed Income Fund Inc., Oaktree Asset-Backed Income Private Fund Inc. and Oaktree Diversified Income Fund Inc. |
| 3 | This column includes only directorships of companies required to report to the SEC under the 1934 Act (i.e., public companies) or other investment companies registered under the 1940 Act. |
| 4 | Directors who are not considered to be “interested persons” of the Fund as defined in the 1940 Act are considered to be “Independent Directors.” |
The Fund’s Statement of Additional Information includes additional information about the directors, and is available, without charge, upon request by calling 1-855-777-8001.
| 2024 Annual Report | 45 |
BROOKFIELD INFRASTRUCTURE INCOME FUND INC.
Dividend Reinvestment Plan (Unaudited)
The Fund has adopted a Dividend Reinvestment Plan (the “DRIP,” or the “Plan”) that provides that, unless stockholders elect to receive their distributions in cash, they will be automatically reinvested by SS&C GIDS, Inc. (in such capacity, the “Plan Administrator”), in additional Shares. If stockholders elect to receive distributions in cash, they will receive them paid by check mailed directly to them by the Plan Administrator.
The Fund may pay distributions from sources that may not be available in the future and that are unrelated to the Fund’s performance, such as from offering proceeds and/or borrowings.
Shares received under the Plan will be issued to stockholders at their NAV on the ex-dividend date; there is no sales or other charge for reinvestment. Stockholders are free to withdraw from the Plan and elect to receive cash at any time by giving written notice to the Plan Administrator or by contacting the broker or dealer, who will inform the Fund.
The Plan Administrator provides written confirmation of all transactions in the shareholder accounts in the Plan, including information stockholders may need for tax records. Any proxy stockholders receive will include all Shares received under the Plan.
Automatically reinvested dividends and distributions are taxed in the same manner as cash dividends and distributions.
The Fund and the Plan Administrator reserve the right to amend or terminate the Plan. There is no direct service charge to participants in the Plan; however, the Fund reserves the right to amend the Plan to include a service charge payable by the participants. If the Plan is amended to include such service charges, the Plan Administrator will include a notification to registered stockholders with the Plan Administrator.
Additional information about the Plan may be obtained from the Plan Administrator.
| 46 | Brookfield |
BROOKFIELD INFRASTRUCTURE INCOME FUND INC.
Joint Notice of Privacy Policy (Unaudited)
Brookfield Asset Management Private Institutional Capital Adviser (Canada), L.P., on its own behalf and on behalf of the funds managed by PSG and its affiliates, recognizes and appreciates the importance of respecting the privacy of our clients and shareholders. Our relationships are based on integrity and trust and we maintain high standards to safeguard your non-public personal information (“Personal Information”) at all times. This privacy policy (“Policy”) describes the types of Personal Information we collect about you, the steps we take to safeguard that information and the circumstances in which it may be disclosed.
If you hold shares of the Fund through a financial intermediary, such as a broker, investment adviser, bank or trust company, the privacy policy of your financial intermediary will also govern how your Personal Information will be shared with other parties.
WHAT INFORMATION DO WE COLLECT?
We collect the following Personal Information about you:
| ● | Information we receive from you in applications or other forms, correspondence or conversations, including but not limited to name, address, phone number, social security number, assets, income and date of birth. |
| ● | Information about transactions with us, our affiliates, or others, including but not limited to account number, balance and payment history, parties to transactions, cost basis information, and other financial information. |
| ● | Information we may receive from our due diligence, such as your creditworthiness and your credit history. |
WHAT IS OUR PRIVACY POLICY?
We may share your Personal Information with our affiliates in order to provide products or services to you or to support our business needs. We will not disclose your Personal Information to nonaffiliated third parties unless 1) we have received proper consent from you; 2) we are legally permitted to do so; or 3) we reasonably believe, in good faith, that we are legally required to do so. For example, we may disclose your Personal Information with the following in order to assist us with various aspects of conducting our business, to comply with laws or industry regulations, and/or to effect any transaction on your behalf;
| ● | Unaffiliated service providers (e.g.transfer agents, securities broker-dealers, administrators, investment advisers or other firms that assist us in maintaining and supporting financial products and services provided to you); |
| ● | Government agencies, other regulatory bodies and law enforcement officials (e.g. for reporting suspicious transactions); |
| ● | Other organizations, with your consent or as directed by you; and |
| ● | Other organizations, as permitted or required by law (e.g. for fraud protection) |
When we share your Personal Information, the information is made available for limited purposes and under controlled circumstances designed to protect your privacy. We require third parties to comply with our standards for security and confidentiality.
HOW DO WE PROTECT CLIENT INFORMATION?
We restrict access to your Personal Information to those persons who require such information to assist us with providing products or services to you. It is our practice to maintain and monitor physical, electronic, and procedural safeguards that comply with federal standards to guard client nonpublic personal information. We regularly train our employees on privacy and information security and on their obligations to protect client information.
CONTACT INFORMATION
For questions concerning our Privacy Policy, please contact our client services representative at 1-855-777-8001.
| 2024 Annual Report | 47 |
CORPORATE INFORMATION
Investment
Adviser
Administrator Brookfield
Public Securities Group LLC
Please
direct your inquiries to:
Transfer Agent Shareholder inquiries relating to distributions, address changes and shareholder account information should be directed to the Fund’s transfer agent:
SS&C
Global Investor & Distribution Solutions, Inc
|
Fund Accounting Agent and Custodian
J.P.
Morgan Chase Bank, N.A.
Sub-Adviser
Brookfield
Public Securities Group LLC
Independent Registered Public Accounting Firm
Deloitte
& Touche LLP
Legal Counsel
Paul
Hastings LLP
Distributor
Quasar
Distributors, LLC |
Directors of the Fund
|
Edward
A. Kuczmarski
|
Chair
of Board of Directors |
| Officers of the Fund | |
|
Chloe
Berry |
President |
The Fund files its complete schedule of portfolio holdings with the SEC for the first and third quarters of each fiscal year on Form N-PORT. The Fund’s Forms N-PORT are available on the SEC’s website at www.sec.gov.
You may obtain a description of the Fund’s proxy voting policies and procedures, information regarding how the Fund voted proxies relating to portfolio securities during the most recent 12-month period ended December 31, without charge, upon request by calling 1-855-777-8001, or go to the SEC’s website at www.sec.gov.

| (b) | Not applicable. |
Item 2. Code of Ethics.
The registrant has adopted a code of ethics that applies to the registrant’s principal executive officer and principal financial officer. The registrant has not made any substantive amendments to its code of ethics during the period covered by this report. The registrant has not granted any waivers from any provisions of the code of ethics during the period covered by this report.
The registrant undertakes to provide to any person without charge, upon request, a copy of its code of ethics by contacting Investor Relations at (855) 777-8001 or by writing to Secretary, Brookfield Infrastructure Income Fund Inc., Brookfield Place, 225 Liberty Street, 35th Floor, New York, NY 10281-1048.
Item 3. Audit Committee Financial Expert.
The registrant’s Board of Directors has determined that there is at least one audit committee financial expert serving on its audit committee. Stuart A. McFarland, Edward A. Kuczmarski, William H. Wright II and Heather S. Goldman each qualify as “audit committee financial experts” and are considered to be “independent” as each term is defined in Item 3 of Form N-CSR.
Item 4. Principal Accountant Fees and Services.
Audit Fees and Audit Related Fees
The registrant has engaged its principal accountant, Deloitte & Touche LLP (“Deloitte”) to perform audit services, audit-related services, and other services during the past two fiscal years. “Audit services” refer to performing an audit of the registrant’s annual financial statements or services that are normally provided by the accountant in connection with statutory and regulatory filings or engagements for those fiscal years. “Audit-related services” refer to the assurance and related services by the principal accountant that are reasonably related to the performance of the audit.
Tax Fees
There were no fees paid by the registrant to the principal accountant for the performance of tax services during the fiscal year ended December 31, 2024 or the fiscal year ended December 31, 2023. “Tax services” refer to professional services rendered by the principal accountant for tax compliance, tax advice, and tax planning.
The following table details the aggregate fees billed or expected to be billed for each of the last two fiscal years for audit fees, audit-related fees, tax fees and other fees by the principal accountant.
| FYE 12/31/2024 | FYE 12/31/2023 | |
| (a) Audit Fees | $311,000 | $205,000 |
| (b) Audit-Related Fees | $0 | $0 |
| (c) Tax Fees | $0 | $0 |
| (d) All Other Fees | $0 | $0 |
(e)(1) The audit committee has adopted pre-approval policies and procedures that require the audit committee to pre-approve all audit and non-audit services of the registrant, including services provided to any entity affiliated with the registrant.
(e)(2) The percentage of fees billed by Deloitte applicable to non-audit services pursuant to waiver of pre-approval requirement were as follows:
| FYE 12/31/2024 | FYE 12/31/2023 | |
| Audit-Related Fees | 0% | 0% |
| Tax Fees | 0% | 0% |
| All Other Fees | 0% | 0% |
(f) All of the principal accountant’s hours spent on auditing the registrant’s financial statements were attributed to work performed by full-time permanent employees of the principal accountant.
(g) The aggregate fees billed by Deloitte for the fiscal years ended December 31, 2024 and December 31, 2023 for non-audit services rendered to the registrant and the registrant’s investment adviser and administrator were $0 and $161,600. For the fiscal years ended December 31, 2024 and December 31, 2023, these amounts reflect the amount disclosed above in (b), (c) and (d), plus $161,600, in fees billed to the registrant’s investment adviser for non-audit services that did not relate directly to the operations and financial reporting of the registrant.
(h) The audit committee of the Board of Directors has considered whether the provision of non-audit services that were rendered to the registrant’s investment adviser and administrator is compatible with maintaining the principal accountant’s independence and has concluded that the provision of such non-audit services by the accountant has not compromised the accountant’s independence.
(i) Not applicable.
(j) Not applicable.
Item 5. Audit Committee of Listed Registrants.
(a) The registrant is an issuer as defined in Rule 10A-3 under the Securities Exchange Act of 1934, (the “Act”) and has a separately-designated standing audit committee established in accordance with Section 3(a)(58)(A) of the Act. The independent members of the committee are as follows: Stuart A. McFarland, Edward A. Kuczmarski, Heather S. Goldman, William H. Wright II, Betty Whelchel and Susan Schauffert-Tam.
(b) Not applicable.
Item 6. Investments.
| (a) | Schedule of Investments is included as part of the report to shareholders filed under Item 1(a) of this Form. |
| (b) | Not Applicable. |
Item 7. Financial Statements and Financial Highlights for Open-End Investment Companies.
Not applicable to closed-end investment companies.
Item 8. Changes in and Disagreements with Accountants for Open-End Investment Companies.
Not applicable to closed-end investment companies.
Item 9. Proxy Disclosure for Open-End Investment Companies.
Not applicable to closed-end investment companies.
Item 10. Remuneration Paid to Directors, Officers, and Others of Open-End Investment Companies.
Not applicable to closed-end investment companies.
Item 11. Statement Regarding Basis for Approval of Investment Advisory Contract.
Not Applicable.
Item 12. Disclosure of Proxy Voting Policies and Procedures for Closed-End Management Investment Companies.
The information below provides a description of the policies and procedures that the Fund uses to determine how to vote proxies relating to portfolio securities, including the procedures that the Fund uses when a vote presents a conflict of interest.
Proxy Voting Responsibility. The Adviser has adopted policies and procedures for the voting of proxies relating to portfolio securities for the client accounts over which it has been delegated and/or granted proxy voting authority, including the Fund (the “Policies”). The Policies, which have been adopted by the Board of Directors on behalf of the Fund, enable the Fund to vote proxies in a manner consistent with the best interests of the Fund’s stockholders. A committee has been established (the “Proxy Voting Committee”) to administer the voting of all proxies in accordance with the Policies. The Proxy Voting Committee meets regularly with representatives of the Legal, Compliance, Operations and Investment teams. The Proxy Voting Committee has engaged the services of a third-party proxy voting agent to act as agent to vote proxies, and oversees such third-party proxy voting agent’s compliance with the Policies, including any deviations by the proxy voting agent from the third-party proxy voting guidelines (the “Guidelines”). Under the Policies, the Adviser has adopted the Guidelines as the basis for how proxy proposals are evaluated and voted upon. The Fund is generally a passive investor in holding portfolio securities, seeking to maximize stockholder value, but not necessarily to exercise control over the issuers of portfolio securities, or otherwise advance a particular agenda. In addition, in accordance with local law or business practices, many foreign companies prevent the sales of Shares that have been voted for a certain period beginning prior to the stockholder meeting and ending on the day following the meeting. The costs of voting proxies with respect to Shares of foreign companies include the potentially serious portfolio management consequences of reduced flexibility to sell the Shares at the most advantageous time for the Fund. As a result, such proxies generally will not be voted in the absence of an unusual, significant vote of compelling economic importance. In determining whether to vote proxies under these circumstances, the Adviser, in consultation with the Proxy Voting Committee, considers whether the costs of voting proxies with respect to such Shares of foreign companies generally outweigh any benefits that may be achieved by voting such proxies.
Case-By-Case Voting Matters. Under the Guidelines, certain voting matters are determined on a case-by-case basis. In these circumstances, and in proposals not specifically addressed by the Policies, the Proxy Voting Committee generally will rely on the guidance or a recommendation from the third-party proxy voting agent, or other sources. The Proxy Voting Committee may propose to deviate from the Guidelines or guidance or recommendations from the third-party proxy voting agent. In these instances, the Proxy Voting Committee will recommend the vote that will maximize value for, and is in the best interests of, the Fund’s stockholders.
Conflicts of Interest. Members of the Proxy Voting Committee will seek to resolve any conflicts of interest presented by a proxy vote. In practice, application of the Guidelines will in most instances adequately address any possible conflicts of interest, as votes generally are affected according to the guidance or recommendations of the third-party proxy voting agent. However, if a situation arises where a vote presents a conflict between the interests of the Fund’s stockholders and the interests of the Adviser, and the conflict is known to the Proxy Voting Committee, the Committee may retain an independent fiduciary for advice on how to vote the proposal or the Committee may direct the Adviser to abstain from voting because voting on the proposal is impracticable and/or is outweighed by the cost of voting.
Proxy Voting Records. The Proxy Voting Committee will be responsible for documenting its basis for (a) any determination to vote a particular proxy in a manner contrary to the Guidelines, (b) any determination to vote a particular proxy in a non-uniform manner, and (c) any other material determination made by the Proxy Voting Committee, as well as for ensuring the maintenance of records of each proxy vote, as required by applicable law. The third-party proxy voting agent will maintain records of voting decisions for each vote cast on behalf of the Fund. The proxy voting record for the most recent twelve-month period ended June 30 is available: (i) without charge, upon request, by calling toll-free at 1-855-777-8001; and (ii) on the SEC’s website at http://www.sec.gov.
Board Reporting. The Fund’s Chief Compliance Officer will provide a summary report of proxy voting matters at each quarterly meeting of the Board of Directors, which describes any Proxy Voting Committee meeting(s) held during the prior quarter.
Proxy Voting Guidelines. Guidelines are available upon request.
Item 13. Portfolio Managers of Closed-End Management Investment Companies.
Investment Team – Portfolio Managers
Adviser
A team of investment professionals at the Adviser are jointly and primarily responsible for the day-to-day management and operations of the Fund. The portfolio managers who comprise this team, and their professional backgrounds, are set forth below:
Sam Pollock, Portfolio Manager
Mr. Pollock is Chief Executive Officer of Brookfield’s Infrastructure business and Brookfield Infrastructure Partners. In this role, he is responsible for investments, operations and the expansion of the Infrastructure business. Since joining Brookfield in 1994, Mr. Pollock has held a number of senior positions across the organization, including leading Brookfield’s corporate investment group and its private equity business. Mr. Pollock holds a Bachelor of Commerce degree from Queen’s University and is a Chartered Professional Accountant.
Chloe Berry, Portfolio Manager
Ms. Berry is a Managing Partner in Brookfield’s Infrastructure Group. In this role, Ms. Berry is the Head of Brookfield Infrastructure Income and is also responsible for the global capital markets and treasury function. She has held a number of roles within Brookfield, including recently leading the finance and operations of Brookfield’s private infrastructure funds. Prior to joining Brookfield, Ms. Berry worked in corporate finance and M&A at large multinational corporations and a global investment bank. Ms. Berry holds a Bachelor of Science degree from McGill University.
Sam Garetano, Portfolio Manager
Mr. Garetano is a Senior Vice President in Brookfield’s Infrastructure Group. In this role, Mr. Garetano is responsible for the portfolio management of Brookfield Infrastructure Income and is also involved in strategic initiatives for Brookfield’s infrastructure platform. Prior to joining Brookfield, Mr. Garetano held similar roles at Waud Capital Partners, Adams Street Partners and BlackRock, where he was responsible for delivering alternative investment solutions to clients globally. Mr. Garetano holds a Bachelor of Science degree from Syracuse University.
Caroline Rouse, Portfolio Manager
Ms. Rouse is a Senior Vice President in Brookfield’s Infrastructure Group. In this role, Ms. Rouse is responsible for portfolio management initiatives for the Brookfield Infrastructure Income including asset allocation and portfolio construction. Ms. Rouse is also responsible for origination and execution of infrastructure investments for the broader platform. Prior to joining Brookfield, Ms. Rouse was a Vice President in the Project, Infrastructure, and Principal Finance group at Goldman Sachs and held various roles in infrastructure finance and debt capital markets at J.P. Morgan. Ms. Rouse graduated summa cum laude with a BA from Yale University and holds an MPhil with distinction from the University of Cambridge.
Hrishikesh Balaji, Portfolio Manager
Mr. Balaji is a Vice President in Brookfield’s Infrastructure Group. In this role, Mr. Balaji is responsible for portfolio management initiatives for the Brookfield Infrastructure Income including asset allocation and portfolio construction. Prior to this role, Mr. Balaji was responsible for investor relations, capital raising, co-investments, and other strategic initiatives for Brookfield’s private infrastructure funds. Prior to Brookfield, Mr. Balaji worked in the assurance practice at Ernst & Young LLP. Mr. Balaji holds a Bachelor of Arts degree from the Ivey Business School at Western University, is a Chartered Professional Accountant and a CFA Charterholder.
Sub-Adviser
A team of investment professionals at the Sub-Adviser are jointly and primarily responsible for the day-to-day management of the Public Securities Portfolio, subject to overall supervision of the Adviser. The portfolio managers who comprise this team, and their professional backgrounds, are set forth below:
Christopher Janus, Portfolio Manager
Mr. Janus has 17 years of industry experience, is a Managing Director and Co-Head of on Brookfield’s Corporate Credit team. He is responsible for portfolio manager duties that span all real asset sectors, the largest of which is infrastructure. Previously, he was a Director on Brookfield’s Structured Products team focused on CMBS, CRE CLOs (Commercial Real Estate Collateralized Loan Obligations) and direct lending. Prior to joining the firm in 2009, Chris began his career at SunTrust Robinson Humphrey within the Real Estate Investment Banking group. Chris earned a Bachelor of Science degree in Mechanical Engineering from Miami University.
Daniel Parker, CFA, Portfolio Manager
Mr. Parker has over 20 years of industry experience and is a Portfolio Manager and Managing Director on the Public Securities Group’s Global Credit team. In addition, Mr. Parker supports the Global Infrastructure Equities team with a focus on utilities. Prior to joining the firm in 2006, Mr. Parker spent four years at Standard & Poor’s where he covered the utilities and natural resources sectors. He started his career in international trade finance as a credit analyst at Canada’s Export Credit Agency, EDC. Mr. Parker holds the Chartered Financial Analyst® designation and is a member of the CFA Society Chicago, Inc. He earned an Honours Bachelor of Commerce degree from Lakehead University.
Management of Other Accounts
The portfolio managers primarily responsible for the day-to-day management of the Fund also manage other registered investment companies, other pooled investment vehicles and other accounts, as indicated below. The following table identifies, as of December 31, 2024: (i) the other registered investment companies, pooled investment vehicles and other accounts managed by an investment committee (or equivalent body) on which the corresponding portfolio manager serves and (ii) the AUM of such companies, vehicles and accounts, and (iii) the number and total AUM of such companies, vehicles and accounts with respect to which the advisory fee is based on:
Adviser
| Portfolio Manager | Beneficial Ownership of Equity Securities in the Fund | Number of Registered Investment Companies Managed and Total Assets for such Accounts* | Other Pooled Investment Companies and Total Assets for such Accounts* | Number of Other Accounts Managed and Total Assets for such Accounts* | ||||||||||||||||||||||||
| # of shares | # of accounts | AUM | # of accounts | AUM | # of accounts | AUM | ||||||||||||||||||||||
| Sam Pollock | - | - | $ | - | 12 | $ | 79,536.2 | ** | - | $ | - | |||||||||||||||||
| Chloe Berry | - | - | $ | - | - | $ | - | - | $ | - | ||||||||||||||||||
| Sam Garetano | - | - | $ | - | - | $ | - | - | $ | - | ||||||||||||||||||
| Caroline Rouse | - | - | $ | - | 6 | $ | 72,887.2 | *** | - | $ | - | |||||||||||||||||
| Hrishikesh Balaji | - | - | $ | - | - | $ | - | - | $ | - | ||||||||||||||||||
| * | Assets in Millions | |
| ** | Of the Other Pooled Investment Companies, 12 accounts, totalling $79,536.2 million in assets pays an advisory fee that is based on the performance of the accounts. | |
| *** | Of the Other Pooled Investment Companies, 6 accounts, totalling $72,887.2 million in assets pays an advisory fee that is based on the performance of the accounts. |
Sub-Adviser
| Portfolio Manager | Beneficial Ownership of Equity Securities in the Fund | Number of Registered Investment Companies Managed and Total Assets for such Accounts* | Other Pooled Investment Companies and Total Assets for such Accounts* | Number of Other Accounts Managed and Total Assets for such Accounts* | ||||||||||||||||||||||||
| # of shares | # of accounts | AUM | # of accounts | AUM | # of accounts | AUM | ||||||||||||||||||||||
| Christopher Janus | - | 1 | $ | 1,067.2 | - | $ | - | 14 | $ | 17,831.2 | ||||||||||||||||||
| Daniel Parker, CFA | - | 3 | $ | 608.0 | 4 | $ | 125.9 | 25 | $ | 26,025.5 | ||||||||||||||||||
| * | Assets in millions |
Share Ownership
The following table indicates the dollar range of securities of the Registrant owned by the Registrant’s portfolio managers as of December 31, 2024.
Adviser
| Dollar Range of Securities Owned | |
| Sam Pollock | None |
| Chloe Berry | None |
| Sam Garetano | None |
| Caroline Rouse | None |
| Hrishikesh Balaji | None |
Sub-Adviser
| Dollar Range of Securities Owned | |
| Christopher Janus | None |
| Daniel Parker, CFA | None |
Potential Conflicts of Interest
Brookfield is a global alternative asset manager with significant assets under management and a long history of owning, managing and operating assets, businesses and investment vehicles across various sectors (and underlying industries), geographies and strategies. As noted in this SAI, a key element of the Fund’s strategy is to leverage Brookfield’s experience and expertise and its broad reach, relationships and position in the market for investment opportunities and deal flow, financial resources, access to capital markets and operating needs. Brookfield believes this is in the Fund’s and its Portfolio Investments’ best interests. However, being part of this broader platform, as well as activities of and other considerations relating to Brookfield and Brookfield Accounts, give rise to actual or potential conflicts of interest which may not be resolved in favor of the Fund’s or its Portfolio Investments’ interests.
Brookfield’s activities include, among others: investment and asset management; sponsoring, offering and managing private and public investment vehicles that invest in the global fixed income, currency, commodity, equities, secondaries, private and other markets; developing, constructing, owning, managing, operating and servicing real estate and related companies and assets, renewable power and related companies, assets and facilities, infrastructure and related companies and assets, and other businesses and assets including data centers, transportation facilities, electric utilities, industrial and manufacturing facilities, energy companies, metals and mining companies, timberlands and agrilands, natural gas pipelines and storage systems and other assets; providing capital and financing solutions, as well as financial advisory, business development and other financial services; and other activities (collectively, “Brookfield Activities”). While it is expected that the Fund will benefit from Brookfield’s expertise, market positioning and connectivity that arise from Brookfield Activities, in the ordinary course of its business, Brookfield’s interests or the interests of the clients or others receiving services through Brookfield Activities (including other Brookfield Accounts) may conflict with the interests of the Fund, notwithstanding Brookfield’s direct or indirect participation in the Fund or the Fund’s Portfolio Investments. While Brookfield expects that its expertise as a global real asset operator will directly impact the Adviser’s and the Fund’s ability to identify, access and assess investment opportunities, and that the Fund’s Portfolio Investments will benefit from the greater Brookfield ecosystem, there can be no assurance of any such successful collaboration or synergies. A lack of successful collaboration or synergies, whether as a result of concerns related to conflicts or otherwise, may impact Brookfield’s ability to successfully implement its strategies or achieve its investment objectives.
Portfolio Manager Compensation
Each Portfolio Manager is compensated based on the scale and complexity of his portfolio responsibilities, the total return performance of funds and accounts managed by the Portfolio Manager on an absolute basis and when compared to appropriate peer groups of similar size and strategy, as well as the management skills displayed in managing their portfolio teams and the teamwork displayed in working with other members of their firm. Since each Portfolio Manager is responsible for multiple funds and accounts, investment performance is evaluated on an aggregate basis almost equally weighted among performance, management and teamwork. Base compensation for each Portfolio Manager varies in line with their seniority and position. The compensation of a Portfolio Manager with other job responsibilities (such as acting as an executive officer of their firm or supervising various departments) includes consideration of the scope of such responsibilities and the Portfolio Manager’s performance in meeting them. The Investment Adviser seeks to compensate each Portfolio Manager commensurate with their responsibilities and performance, and that is competitive with other firms within the investment management industry. Salaries, bonuses and stock based compensation also are influenced by the operating performance of their respective firms and their parent companies. While the salaries of each Portfolio Manager is comparatively fixed, cash bonuses and stock based compensation may fluctuate significantly from year to year. Bonuses are determined on a discretionary basis by the senior executives of their respective firm and measured by individual and team-oriented performance guidelines. The amount of the Long Term Incentive Plan (LTIP) is approved annually and there is a rolling vesting schedule to aid in retention of key people. A key component of this program is achievement of client objectives in order to properly align interests with our clients. Further, the incentive compensation of all investment personnel who work on each strategy is directly tied to the relative performance of the strategy and its clients.
The compensation structure of each Portfolio Manager and other investment professionals has four primary components:
| ● | A base salary; |
| ● | An annual cash bonus; |
| ● | If applicable, long-term compensation consisting of restricted stock units or stock options of the Adviser’s ultimate parent company, Brookfield Asset Management; and |
| ● | If applicable, long-term compensation consisting of restricted stock units in private funds managed by the investment professional. |
Each Portfolio Manager also receives certain retirement, insurance and other benefits that are broadly available to all employees. Compensation of each Portfolio Manager is reviewed on an annual basis by senior management.
Item 14. Purchases of Equity Securities by Closed-End Management Investment Company and Affiliated Purchasers.
No purchases were made during the reporting period by or on behalf of the registrant or any “affiliated purchaser,” as defined in Rule 10b-18(a)(3) under the Exchange Act (17 CFR 240.10b-18(a)(3)), of shares or other units of any class of the registrant’s equity securities that is registered by the registrant pursuant to Section 12 of the Exchange Act (15 U.S.C. 781).
Item 15. Submission of Matters to a Vote of Security Holders.
There have been no material changes to the procedures by which shareholders may recommend nominees to the registrant’s Board of Directors.
Item 16. Controls and Procedures.
| (a) | The Registrant’s Principal Executive Officer and Principal Financial Officer have reviewed the Registrant’s disclosure controls and procedures (as defined in Rule 30a-3(c) under the Investment Company Act of 1940 (the “Act”)) as of a date within 90 days of the filing of this report, as required by Rule 30a-3(b) under the Act and Rules 13a-15(b) or 15d-15(b) under the Securities Exchange Act of 1934. Based on their review, such officers have concluded that the disclosure controls and procedures are effective in ensuring that information required to be disclosed in this report is appropriately recorded, processed, summarized and reported and made known to them by others within the Registrant and by the Registrant’s service provider. |
| (b) | There were no changes in the Registrant’s internal control over financial reporting (as defined in Rule 30a-3(d) under the Act) that occurred during the period covered by this report that have materially affected, or are reasonably likely to materially affect, the Registrant’s internal control over financial reporting. |
Item 17. Disclosure of Securities Lending Activities for Closed-End Management Investment Companies
The registrant did not engage in securities lending activities during the fiscal period reported on this Form N-CSR.
Item 18. Recovery of Erroneously Awarded Compensation.
(a) Not Applicable.
(b) Not Applicable.
Item 19. Exhibits.
| (a) | (1) Any code of ethics or amendment thereto, that is the subject of the disclosure required by Item 2, to the extent that the registrant intends to satisfy Item 2 requirements through filing an exhibit. Not applicable. |
(2) Any policy required by the listing standards adopted pursuant to Rule 10D-1 under the Exchange Act (17 CFR 240.10D-1) by the registered national securities exchange or registered national securities association upon which the registrant’s securities are listed. Not applicable.
(4) Any written solicitation to purchase securities under Rule 23c-1 under the Investment Company Act of 1940 (17 CFR 270.23c-1) sent or given during the period covered by the report by or on behalf of the registrant to 10 or more persons. Not applicable.
(5) Change in the registrant’s independent public accountant. Provide the information called for by Item 4 of Form 8-K under the Exchange Act (17 CFR 249.308). Unless otherwise specified by Item 4, or related to and necessary for a complete understanding of information not previously disclosed, the information should relate to events occurring during the reporting period. There was no change in the registrant’s independent public accountant for the period covered by this report.
| (b) | Certifications pursuant to Section 906 of the Sarbanes-Oxley Act of 2002. Filed herewith. |
SIGNATURES
Pursuant to the requirements of the Securities Exchange Act of 1934 and the Investment Company Act of 1940, the registrant has duly caused this report to be signed on its behalf by the undersigned, thereunto duly authorized.
| (Registrant) | Brookfield Infrastructure Income Fund Inc. | |
| By (Signature and Title)* | /s/ Chloe Berry | |
| Chloe Berry, Principal Executive Officer | ||
| Date | March 7, 2025 |
Pursuant to the requirements of the Securities Exchange Act of 1934 and the Investment Company Act of 1940, this report has been signed below by the following persons on behalf of the registrant and in the capacities and on the dates indicated.
| By (Signature and Title)* | /s/ Chloe Berry | |
| Chloe Berry, Principal Executive Officer | ||
| Date | March 7, 2025 | |
| By (Signature and Title)* | /s/ Casey P. Tushaus | |
| Casey P. Tushaus, Principal Financial Officer | ||
| Date | March 7, 2025 |
| * | Print the name and title of each signing officer under his or her signature. |