.2
MANAGEMENT’S DISCUSSION & ANALYSIS For the three and six month periods ended June 30, 2026 Greenfire Resources Ltd.

MANAGEMENT’S DISCUSSION AND ANALYSIS
This Management’s Discussion and Analysis (“MD&A”) of the financial condition and results of operations of Greenfire Resources Ltd. (“Greenfire” or the “Company”) is dated August 5, 2026, which is the date this MD&A was approved by the Board of Directors of the Company (the “Board of Directors”), and should be read in conjunction with the Company’s unaudited condensed interim consolidated financial statements (“financial statements”) and notes thereto for the three and six months ended June 30, 2026 and 2025, and the audited consolidated financial statements for the years ended December 31, 2025 and 2024 (“annual financial statements”) and the related MD&A. The financial statements, including the comparative figures, were prepared in accordance with IAS 34 “Interim Financial Reporting” as issued by the International Accounting Standards Board.
Additional information about Greenfire has been filed with Canadian securities regulatory authorities and the United States Securities and Exchange Commission (the “SEC”) and is available on SEDAR+ at www.sedarplus.ca, including Greenfire’s Annual Information Form, dated March 12, 2026 (the “2025 AIF”), which is also filed with the SEC under cover of Form 40-F. Information contained in or otherwise accessible through our website, even if referred to in this MD&A, does not constitute part of this MD&A and is not incorporated by reference into this MD&A.
This MD&A contains forward-looking information based on the Company’s current expectations and projections. For information on the material factors and assumptions underlying such forward-looking information, refer to the “Forward-Looking Statements” section of this MD&A. Refer to the “Abbreviations” section of this MD&A for information regarding abbreviations used in this MD&A.
This MD&A contains non-GAAP financial measures and non-GAAP financial ratios (the “Non-GAAP Measures”). Non-GAAP measures include adjusted EBITDA, operating netback, operating netback, excluding realized gain (loss) on risk management contracts, effective royalty rate, adjusted funds flow, adjusted free cash flow (deficit), available funding, and net surplus (debt). When non-GAAP measures are expressed on a per barrel basis, they are non-GAAP ratios. This MD&A also contains supplementary financial measures and ratios derived from IFRS Accounting Standards. Supplementary financial measures include gross profit (loss), capital expenditures, and depletion. For additional information regarding these non-GAAP and supplementary financial measures refer to the “Non-GAAP and Other Financial Measures” section of this MD&A.
All financial information included in this MD&A is presented in Canadian dollars (“CAD”), unless otherwise noted. Certain dollar amounts have been rounded to the nearest million dollars or thousand dollars, as noted, and tables may not add due to rounding. Unless indicated otherwise, production volumes and per unit statistics are presented throughout this MD&A on a “gross” basis as determined in accordance with National Instrument 51-101 – Standards for Disclosure for Oil and Gas Activities, which is the Company’s gross working interest basis before deduction of royalties and without including any royalty interests of the Company. Dollar per barrel ($/bbl) figures presented throughout this MD&A are based upon sold bitumen barrels unless otherwise noted. The Company monitors and reviews financial information on a per barrel basis for comparability to prior period results and to analyze the Company’s competitiveness relative to its peer group.
DESCRIPTION OF BUSINESS
Greenfire is an oil sands producer focused on the development of its long-life and low-decline thermal oil assets in the Athabasca region of Alberta, Canada, with its registered offices in Calgary, Alberta. Greenfire plans to leverage its large resource base and significant infrastructure in place to drive meaningful, capital-efficient production growth. As part of the Company’s commitment to operational excellence, safe and reliable operations remain a top priority for Greenfire.
Greenfire’s common shares are listed on the Toronto Stock Exchange and the New York Stock Exchange under the symbol “GFR”. At June 30, 2026, approximately 72.0% of the Company’s common shares were owned by certain limited partnerships comprising Waterous Energy Fund and its affiliates (collectively, “WEF”).
GREENFIRE’S ASSETS AND STRATEGY
Greenfire’s principal assets are the Hangingstone Facilities and the Great Divide Asset. The Hangingstone Facilities consist of two Steam-Assisted Gravity Drainage (“SAGD”) oil production facilities: the Expansion Asset (“HE”) and the Demo Asset. Located approximately 50 kilometers south of Fort McMurray, Alberta, these facilities are operated by Greenfire, with the Company holding a 75% working interest in the Expansion Asset and a 100% working interest in the Demo Asset. The Great Divide Asset consists of two SAGD oil production facilities, Pod One and Algar, in which the Company holds 100% working interests. The Great Divide Asset is located approximately 70 kilometers south of Fort McMurray, Alberta.
The Company’s strategic objective is to manage and enhance its asset portfolio to maximize long-term net asset value per share for Greenfire shareholders. This goal is expected to be achieved by investing in proven, industry-standard SAGD optimization techniques at the Hangingstone Facilities, which are designed to increase production levels to leverage existing facility spare capacities, while maintaining disciplined control over its operating cost structures.
Greenfire Resources Ltd. | 2026 Q2 Management’s Discussion and Analysis | 2 |
RECENT DEVELOPMENTS
Acquisition of Connacher Oil and Gas Limited
On August 5, 2026, Greenfire completed the previously announced acquisition of Connacher Oil and Gas Limited (“Connacher”) for total cash consideration of $1.297 billion, inclusive of closing adjustments related to the assumption of Connacher’s net working capital surplus (the “Acquisition”). The purchase price for the Acquisition was financed with: (i) a draw on a $1.0 billion reserves-based loan (upsized from $275.0 million) (the “Senior Credit Facility”); and (ii) a $575.0 million bridge facility (the “Bridge Facility”), which is expected to be repaid with proceeds from an anticipated rights offering of Greenfire common shares. Waterous Energy Fund, which currently holds approximately 72% of the Company’s common shares, has committed to providing a standby commitment of at least $575.0 million for the rights offering. The final prospectus for the rights offering will include all material terms related to the rights offering.
Increased Revolving Credit Facility
On August 5, 2026, in connection with the Acquisition, Greenfire closed the upsize of its Senior Credit Facility from $275.0 million to $1.0 billion. The Senior Credit Facility matures on August 5, 2028.
Rights Offering
The Company filed a preliminary short form prospectus related to a rights offering of subscription receipts on July 27, 2026, and also filed a corresponding registration statement on Form F-10 with the U.S. Securities and Exchange Commission (the “SEC”). As a result of Greenfire closing the Acquisition, the Company intends to file an amended and restated preliminary short form prospectus, and a corresponding amendment to the registration statement on Form F-10, relating to a rights offering of common shares rather than subscription receipts. The Company will use the proceeds from the rights offering to repay the Bridge Facility.
Drilling and Development Update
HE Pad 7 (14 Well Pairs): Pad 7 continues to progress on schedule, with drilling completed in the second quarter of 2026. First steam injection is anticipated in the third quarter of 2026, with first oil expected in the fourth quarter of 2026.
HE Pad 5SE (3 Well Pairs): Drilling commenced in third quarter of 2026 on Pad 5SE, which will consist of three new well pairs drilled from the existing Pad 5 surface location to optimize capital efficiency. First oil is anticipated in the second quarter of 2027.
HE Pad 8 (9 Well Pairs): Drilling is expected to commence in the third quarter of 2026, with first oil targeted for the third quarter of 2027.
Demo Asset: Base production has been maintained through ongoing production optimization. Greenfire is currently evaluating 4D seismic data to identify additional potential future drilling locations.
Great Divide Asset: In the near-term, Greenfire’s priorities will be safe operations, sustainable production, integration of the workforces, and the implementation of Greenfire’s action plan to achieve $30.0 million of annual synergies by December 31, 2026. Capital spending for the remainder of 2026 will be focused on the development of infill wells at Pod One and Algar, as well as some minor facility debottlenecking projects.
FINANCIAL & OPERATING HIGHLIGHTS
| Three months ended June 30, | Six months ended June 30, | |||||||||||||||
| ($ thousands, unless otherwise noted) | 2026 | 2025 | 2026 | 2025 | ||||||||||||
| Bitumen production (bbls/d) | 13,607 | 15,748 | 14,159 | 16,617 | ||||||||||||
| Oil sales | 179,408 | 144,542 | 326,721 | 328,179 | ||||||||||||
| Oil sales ($/bbl) | 103.63 | 72.53 | 89.44 | 77.59 | ||||||||||||
| Gross profit (loss)(1) | 73,021 | 55,829 | (7,639 | ) | 90,221 | |||||||||||
| Operating netback(2) | 29,233 | 49,905 | 60,670 | 99,509 | ||||||||||||
| Operating netback ($/bbl)(2) | 23.46 | 35.06 | 23.45 | 33.28 | ||||||||||||
| Net income (loss) and comprehensive income (loss) | 53,462 | 48,730 | (19,540 | ) | 64,893 | |||||||||||
| Adjusted EBITDA(2) | 22,755 | 44,273 | 48,337 | 85,589 | ||||||||||||
| Cash provided by operating activities | 35,573 | 17,732 | 36,936 | 52,405 | ||||||||||||
| Adjusted funds flow(2) | 21,913 | 33,843 | 46,452 | 65,287 | ||||||||||||
| Cash used in investing activities | (55,048 | ) | (17,951 | ) | (99,163 | ) | (45,765 | ) | ||||||||
| Capital expenditures(1) | 56,662 | 10,840 | 106,255 | 37,139 | ||||||||||||
| (1) | Supplementary financial measures. Refer to the “Supplementary Financial Measures” section of this MD&A. |
| (2) | Non-GAAP measures or ratios without a standardized meaning under IFRS Accounting Standards. Refer to the “Non-GAAP and Other Financial Measures” section in this MD&A. |
Greenfire Resources Ltd. | 2026 Q2 Management’s Discussion and Analysis | 3 |
Liquidity and Financial Position
| June 30, | December 31, | |||||||
| ($ thousands) | 2026 | 2025 | ||||||
| Cash | 2,962 | 41,974 | ||||||
| Working capital surplus (deficit) | (4,962 | ) | 53,358 | |||||
| Face value of debt(1) | (26,500 | ) | - | |||||
| Undrawn Senior Credit Facility capacity | 248,500 | 275,000 | ||||||
| Net surplus (debt)(2) | (13,509 | ) | 49,746 | |||||
| Available funding(2) | 261,491 | 324,746 | ||||||
| (1) | Amounts represent undiscounted principal only and exclude interest and transaction costs. |
| (2) | Non-GAAP measures or ratios without a standardized meaning under IFRS Accounting Standards. Refer to the “Non-GAAP and Other Financial Measures” section in this MD&A. |
GUIDANCE
| Revised 2026 Guidance | Previous(1) | |||
| Annual production average | 21,500 – 23,500 (bbls/d) | 13,500 – 15,500 (bbls/d) | ||
| Capital expenditures | $250.0 million | $210.0 million |
| (1) | As announced on May 6, 2026, and disclosed in Greenfire’s MD&A for the three months ended March 31, 2026, and 2025. |
In connection with closing of the Acquisition, the Company’s Board of Directors approved an increase in the 2026 capital budget from $210.0 million to $250.0 million. The Company’s current production inclusive of the Acquisition, is approximately 34,000 barrels per day. Greenfire expects full-year 2026 production to average between 21,500 – 23,500 barrels per day.
PRODUCTION AND COMMODITY PRICING
Bitumen Production and Sales
| Three months ended June 30, | Six months ended June 30, | |||||||||||||||
| (Average barrels per day) | 2026 | 2025 | 2026 | 2025 | ||||||||||||
| Bitumen production(1) | 13,607 | 15,748 | 14,159 | 16,617 | ||||||||||||
| Bitumen sales – Undiluted | 1,461 | 1,485 | 1,285 | 1,449 | ||||||||||||
| Bitumen sales – Blended with diluent | 12,233 | 14,159 | 13,016 | 15,070 | ||||||||||||
| Bitumen sales(1) | 13,694 | 15,644 | 14,301 | 16,519 | ||||||||||||
| Purchased diluent - Blended into sales volumes | 5,331 | 6,255 | 5,882 | 6,848 | ||||||||||||
| Sales volumes | 19,025 | 21,899 | 20,183 | 23,367 | ||||||||||||
| (1) | Bitumen sales differ from bitumen production due to inventory fluctuations. |
Greenfire Resources Ltd. | 2026 Q2 Management’s Discussion and Analysis | 4 |
Greenfire’s oil sales include both bitumen blended with diluent, which is transported by pipeline, and a smaller portion of undiluted bitumen, which is trucked to a sales point.
Bitumen production decreased 14% (or 2,141 bbl/d) and 15% (or 2,458 bbl/d) for the three and six months ended June 30, 2026, respectively, when compared to the same periods in 2025. The decrease was primarily attributable to natural production declines and a scheduled nine-day production outage associated with the maintenance turnaround at the Expansion Asset during the second quarter of 2026.
Commodity Prices
| Three months ended June 30, | Six months ended June 30, | |||||||||||||||||
| Benchmark | Unit | 2026 | 2025 | 2026 | 2025 | |||||||||||||
| WTI(1) | US$/bbl | 92.79 | 63.74 | 82.36 | 67.58 | |||||||||||||
| WCS differential to WTI | US$/bbl | (14.66 | ) | (10.27 | ) | (14.41 | ) | (11.47 | ) | |||||||||
| WCS Hardisty | US$/bbl | 78.13 | 53.47 | 67.95 | 56.11 | |||||||||||||
| Edmonton Condensate (C5+) | US$/bbl | 95.61 | 63.68 | 83.61 | 66.89 | |||||||||||||
| WTI(2) | C$/bbl | 128.38 | 88.22 | 113.46 | 95.25 | |||||||||||||
| WCS differential to WTI | C$/bbl | (20.28 | ) | (14.21 | ) | (19.85 | ) | (16.17 | ) | |||||||||
| WCS Hardisty(2) | C$/bbl | 108.10 | 74.00 | 93.61 | 79.08 | |||||||||||||
| WCS differential to Edm Condensate (C5+) | C$/bbl | (24.19 | ) | (14.13 | ) | (21.57 | ) | (15.19 | ) | |||||||||
| Edm Condensate (C5+)(2) | C$/bbl | 132.29 | 88.13 | 115.18 | 94.27 | |||||||||||||
| AECO 5A (C$/GJ) | C$/GJ | 1.55 | 1.60 | 1.72 | 1.83 | |||||||||||||
| Alberta power pool (C$/MWh) | C$/MWh | 29.32 | 40.48 | 30.58 | 40.39 | |||||||||||||
| Average FX Rate (C$/US$)(3) | C$/US$ | 1.3836 | 1.3840 | 1.3776 | 1.4094 | |||||||||||||
| (1) | As per NYMEX oil futures contract. |
| (2) | Converted from above using the average exchange rate for the specific period. |
| (3) | Average exchange rates for the specified periods. |
WCS Hardisty
WCS is a blend of heavy crude oils that serves as the pricing benchmark for Canadian heavy oil at Hardisty, Alberta. Greenfire’s bitumen sales revenue is most directly correlated to WCS pricing. WCS is priced at a discount to WTI, with this difference referred to as the WCS differential. The WCS differential is subject to variability driven by factors such as production volumes, egress capacity, scheduled infrastructure maintenance, refinery demand, and other market conditions in Western Canada.
Condensate
Greenfire uses condensate, sourced from the Edmonton area, as a blending diluent to facilitate the transportation of its produced bitumen. The price of condensate has historically been correlated to the price of WTI.
AECO
Natural gas is used for steam generation and non-condensable gas (“NCG”) co-injection. NCG is used to manage reservoir pressure and improve bitumen recovery.
FINANCIAL RESULTS
Oil Sales
| Three months ended June 30, | Six months ended June 30, | |||||||||||||||
| ($ thousands, unless otherwise noted) | 2026 | 2025 | 2026 | 2025 | ||||||||||||
| Oil sales | 179,408 | 144,542 | 326,721 | 328,179 | ||||||||||||
| - ($/bbl)(1) | 103.63 | 72.53 | 89.44 | 77.59 | ||||||||||||
| (1) | Based on total sales volumes including blended diluent. |
Greenfire Resources Ltd. | 2026 Q2 Management’s Discussion and Analysis | 5 |
Oil sales increased 24% (or $34.9 million) for the three months ended June 30, 2026, to $179.4 million compared to $144.5 million in the same quarter of 2025. This increase reflects a 46% increase in Canadian-denominated WCS pricing partially offset by a 13% decrease in sales volumes.
Oil sales for the six months ended June 30, 2026, was consistent with the same period in 2025, as an 18% increase in Canadian-denominated WCS pricing substantially offset the impact of a 14% decrease in sales volumes.
Royalties
| Three months ended June 30, | Six months ended June 30, | |||||||||||||||
| ($ thousands, unless otherwise noted) | 2026 | 2025 | 2026 | 2025 | ||||||||||||
| Royalties | 7,941 | 3,932 | 12,224 | 10,756 | ||||||||||||
| - ($/bbl) | 6.37 | 2.76 | 4.72 | 3.60 | ||||||||||||
| Effective royalty rate(1) | 7.97 | % | 5.01 | % | 6.94 | % | 6.07 | % | ||||||||
| (1) | Non-GAAP measures or ratios without a standardized meaning under IFRS Accounting Standards. Refer to the “Non-GAAP and Other Financial Measures” section in this MD&A. |
Royalties consist of crown royalties on bitumen production paid to the Province of Alberta, based on government prescribed royalty rates. Royalty rates are based on, and adjust with, the one-month trailing Canadian dollar equivalent WTI benchmark price.
The effective royalty rate was 7.97% and 6.94% during the three and six months ended June 30, 2026, respectively, compared to 5.01% and 6.07% for the same respective periods in 2025. The higher effective royalty rate reflects higher Canadian-denominated WTI benchmark prices in 2026.
Realized and Unrealized Gain (Loss) on Risk Management Contracts
| Three months ended June 30, | Six months ended June 30, | |||||||||||||||
| ($ thousands) | 2026 | 2025 | 2026 | 2025 | ||||||||||||
| Realized gain (loss) | (39,867 | ) | 9,823 | (43,078 | ) | 8,722 | ||||||||||
| Unrealized gain (loss) | 63,137 | 25,839 | (28,285 | ) | 32,188 | |||||||||||
| Risk management contracts gains (losses) | 23,270 | 35,662 | (71,363 | ) | 40,910 | |||||||||||
Greenfire uses risk management contracts to protect its cash flows against volatility in commodity prices. Financial contracts settled in the period result in realized gains or losses based on the market price compared to the contract price and the notional volume outstanding. Realized losses occur when the average price of the hedged commodity settles above the contract price, while realized gains occur in the opposite scenario. Generally, realized gains and losses on risk management contracts resulting from fluctuations in energy prices are largely offset by an inverse gain or loss on physical sales or purchases. As the forward markets for commodities fluctuate, changes in the fair value of unsettled financial contracts are reported as unrealized gains or losses.
During the three and six months ended June 30, 2026, Greenfire recognized realized losses of $39.9 million and $43.1 million, respectively, compared to realized gains of $9.8 million and $8.7 million for the same periods of 2025. Realized gains occur when the average price of the hedged commodity settles below the contract price, while realized losses occur in the opposite scenario.
When remeasuring its risk management contracts to fair value at June 30, 2026, Greenfire recognized a non-cash unrealized gain of $63.1 million for the three months ended June 30, 2026, compared to a non-cash unrealized gain of $25.8 million for the same period in 2025. For the six months ended June 30, 2026, Greenfire recognized a non-cash unrealized loss of $28.3 million, compared to a non-cash unrealized gain of $32.2 million in the same period of 2025, reflecting changes in forward commodity prices over the respective reporting periods.
Diluent Expense
| Three months ended June 30, | Six months ended June 30, | |||||||||||||||
| ($ thousands, unless otherwise noted) | 2026 | 2025 | 2026 | 2025 | ||||||||||||
| Diluent expense | 69,635 | 56,290 | 129,868 | 130,284 | ||||||||||||
| - ($/bbl)(1) | 15.54 | 10.54 | 13.39 | 11.40 | ||||||||||||
| (1) | Represents the differential between the cost of purchased condensate and the sales value recovered on those same volumes when sold as diluted bitumen. Computed as oil sales minus diluent expense, divided by barrels of bitumen sold, with oil sales per barrel then subtracted. |
Greenfire Resources Ltd. | 2026 Q2 Management’s Discussion and Analysis | 6 |
To facilitate the transportation of bitumen, the Company uses condensate as a blending diluent. Greenfire’s diluent expense includes the cost of condensate and its associated transportation costs. Diluent expense per barrel represents the differential between the cost of purchased condensate and the sales value recovered on those same volumes when sold as diluted bitumen at the point of sale.
Diluent expense per barrel increased by 47% (or $5.00/bbl) to $15.54/bbl for the three months ended June 30, 2026, compared to $10.54/bbl in the same quarter of 2025. Diluent expense per bbl increased 17% (or $1.99/bbl) for the six months ended June 30, 2026, to $13.39/bbl compared to $11.40/bbl for the six months ended June 30, 2025.
Diluent expense per barrel is primarily influenced by the relationship between condensate and WCS benchmark prices, as diluent is purchased based on condensate pricing while the blended dilbit is priced on the WCS benchmark. During the three and six months ended June 30, 2026, the WCS-to-Edmonton Condensate (C5+) differential increased by 71% and 42%, respectively, compared to the same periods of 2025, contributing to higher diluent expense per barrel (see “Production and Commodity Pricing - Commodity Prices” section of this MD&A).
Transportation and Marketing Expense
| Three months ended June 30, | Six months ended June 30, | |||||||||||||||
| ($ thousands, unless otherwise noted) | 2026 | 2025 | 2026 | 2025 | ||||||||||||
| Marketing fees | 1,413 | 2,604 | 3,326 | 6,015 | ||||||||||||
| Oil transportation expense | 10,165 | 9,811 | 20,654 | 20,585 | ||||||||||||
| Transportation and marketing | 11,578 | 12,415 | 23,980 | 26,600 | ||||||||||||
| Marketing fees ($/bbl) | 1.13 | 1.83 | 1.28 | 2.02 | ||||||||||||
| Oil transportation expense ($/bbl) | 8.16 | 6.89 | 7.98 | 6.88 | ||||||||||||
| Transportation and marketing ($/bbl) | 9.29 | 8.72 | 9.26 | 8.90 | ||||||||||||
Transportation expenses include the costs to move bitumen between the Hangingstone assets and to the sales points. Marketing fees are incurred under contracts with a reputable international energy marketing company. A portion of Greenfire’s production is expected to remain subject to these marketing contracts through October 2028.
Marketing expenses per barrel were $1.13 and $1.28 during the three and six months ended June 30, 2026, respectively, compared to $1.83 and $2.02 for the corresponding periods in 2025. These decreases relate to the expiry of certain marketing fees in the third quarter of 2025.
Transportation expense per barrel was $8.16 and $7.98 during the three and six months ended June 30, 2026, respectively, compared to $6.89 and $6.88 for the corresponding periods in 2025. These increases were driven by lower sales volumes, which spread fixed transportation costs over fewer barrels.
Operating Expenses
| Three months ended June 30, | Six months ended June 30, | |||||||||||||||
| ($ thousands, unless otherwise noted) | 2026 | 2025 | 2026 | 2025 | ||||||||||||
| Operating expenses – energy(1) | 1,811 | 6,489 | 12,837 | 18,091 | ||||||||||||
| Operating expenses – non-energy(1) | 19,343 | 25,334 | 44,064 | 51,661 | ||||||||||||
| Operating expenses | 21,154 | 31,823 | 56,901 | 69,752 | ||||||||||||
| Operating expenses – energy ($/bbl)(1) | 1.45 | 4.56 | 4.96 | 6.05 | ||||||||||||
| Operating expenses – non-energy ($/bbl)(1) | 15.53 | 17.79 | 17.02 | 17.28 | ||||||||||||
| Operating expenses ($/bbl) | 16.98 | 22.35 | 21.98 | 23.33 | ||||||||||||
| (1) | Greenfire revised the classification of certain costs between energy and non-energy operating expenses based on their underlying nature. Comparative figures have been adjusted to conform to the current period presentation. This reclassification had no impact on total operating expenses. |
Greenfire Resources Ltd. | 2026 Q2 Management’s Discussion and Analysis | 7 |
Operating expenses include both energy operating expenses and non-energy operating expenses.
| ● | Energy operating expenses include the cost of natural gas for steam generation and NCG co-injection, electricity for facility operations, and carbon taxes. |
| ● | Non-energy operating expenses relate to production-related operating activities, including staff, contractors and associated travel and camp costs, chemicals, insurance, equipment rentals, maintenance and site administration, among other costs. |
For the three and six months ended June 30, 2026, operating expenses decreased by 34% (or $10.7 million) to $21.2 million and 18% (or $12.9 million) to $56.9 million, respectively, compared to the same periods in 2025.
For the three and six months ended June 30, 2026, energy operating expenses decreased by 72% (or $4.7 million) to $1.8 million and 29% (or $5.3 million) to $12.8 million, respectively, compared to the same periods in 2025. The decreases were primarily attributable to lower emissions compliance costs following a Q2 2026 update to the emissions intensity benchmarks applicable to the Company’s facilities, as well as lower benchmark prices for natural gas and electricity.
For the three and six months ended June 30, 2026, non-energy operating expenses decreased by 24% (or $6.0 million) to $19.3 million and 15% (or $7.6 million) to $44.1 million, respectively, compared to the same periods in 2025. The decrease was primarily attributable to lower staffing costs resulting from changes to the field staffing structure.
Depletion and Depreciation Expenses
| Three months ended June 30, | Six months ended June 30, | |||||||||||||||
| ($ thousands, unless otherwise noted) | 2026 | 2025 | 2026 | 2025 | ||||||||||||
| Depletion | 19,349 | 19,915 | 40,024 | 41,476 | ||||||||||||
| Depreciation | 222 | 53 | 283 | 109 | ||||||||||||
| Depletion and depreciation expense | 19,571 | 19,968 | 40,307 | 41,585 | ||||||||||||
| - ($/bbl) | 15.71 | 14.03 | 15.57 | 13.91 | ||||||||||||
For the three and six months ended June 30, 2026, depletion and depreciation expense decreased by 2% (or $0.4 million) and 3% (or $1.3 million), respectively, compared to the same periods in 2025. These declines reflect lower production volumes, partially offset by higher depletion costs per barrel driven by the estimated future development costs for Greenfire’s undeveloped reserves.
Operating Netback(1)
| Three months ended June 30, | Six months ended June 30, | |||||||||||||||
| ($ thousands, unless otherwise noted) | 2026 | 2025 | 2026 | 2025 | ||||||||||||
| Gross profit (loss)(2) | 73,021 | 55,829 | (7,639 | ) | 90,221 | |||||||||||
| Depletion | 19,349 | 19,915 | 40,024 | 41,476 | ||||||||||||
| Loss (gain) on risk management contracts | (23,270 | ) | (35,662 | ) | 71,363 | (40,910 | ) | |||||||||
| Operating netback, excluding realized loss on risk management contracts(1) | 69,100 | 40,082 | 103,748 | 90,787 | ||||||||||||
| Realized gain (loss) on risk management contracts | (39,867 | ) | 9,823 | (43,078 | ) | 8,722 | ||||||||||
| Operating netback(1) | 29,233 | 49,905 | 60,670 | 99,509 | ||||||||||||
| Operating netback, excluding realized loss on risk management contracts ($/bbl)(1) | 55.45 | 28.16 | 40.09 | 30.36 | ||||||||||||
| Operating netback ($/bbl)(1) | 23.46 | 35.06 | 23.45 | 33.28 | ||||||||||||
| (1) | Non-GAAP measures without a standardized meaning under IFRS Accounting Standards. Refer to the “Non-GAAP and Other Financial Measures” section in this MD&A. |
| (2) | Supplementary financial measure. Refer to the “Supplementary Financial Measures” section of this MD&A. |
Greenfire Resources Ltd. | 2026 Q2 Management’s Discussion and Analysis | 8 |
Operating netback per barrel decreased 33% (or $11.60/bbl) for the three months ended June 30, 2026, to $23.46/bbl compared to $35.06/bbl in the same quarter of 2025. Operating netback per barrel decreased 30% (or $9.83/bbl) for the six months ended June 30, 2026, to $23.45/bbl compared to $33.28/bbl in the corresponding period of 2025. These decreases were driven by realized losses on risk management contracts, higher diluent expense, and royalties on a per barrel basis, which more than offset higher oil sales per barrel.
Gross Profit (Loss)(1)
| Three months ended June 30, | Six months ended June 30, | |||||||||||||||
| ($ thousands, unless otherwise noted) | 2026 | 2025 | 2026 | 2025 | ||||||||||||
| Oil sales, net of royalties | 171,467 | 140,610 | 314,497 | 317,423 | ||||||||||||
| Gain (loss) on risk management contracts | 23,270 | 35,662 | (71,363 | ) | 40,910 | |||||||||||
| 194,737 | 176,272 | 243,134 | 358,333 | |||||||||||||
| Diluent expense | (69,635 | ) | (56,290 | ) | (129,868 | ) | (130,284 | ) | ||||||||
| Transportation and marketing | (11,578 | ) | (12,415 | ) | (23,980 | ) | (26,600 | ) | ||||||||
| Operating expenses | (21,154 | ) | (31,823 | ) | (56,901 | ) | (69,752 | ) | ||||||||
| Depletion | (19,349 | ) | (19,915 | ) | (40,024 | ) | (41,476 | ) | ||||||||
| Gross profit (loss)(1) | 73,021 | 55,829 | (7,639 | ) | 90,221 | |||||||||||
| Gross profit (loss) ($/bbl)(1) | 58.60 | 39.22 | (2.95 | ) | 30.17 | |||||||||||
| (1) | Supplementary financial measures. Refer to the “Supplementary Financial Measures” section of this MD&A. |
Gross profit increased by $17.2 million for the three months ended June 30, 2026, to $73.0 million, compared to $55.8 million in the same quarter of 2025. The increase was driven by higher oil sales and lower operating expenses, partially offset by lower gains on risk management contracts and increased diluent expense.
Gross profit decreased by $97.9 million for the six months ended June 30, 2026, resulting in a gross loss of $7.6 million, compared to a gross profit of $90.2 million in the same period of 2025. The decrease was driven by losses on risk management contracts partially offset by lower operating expenses.
General & Administrative Expenses (“G&A”)
| Three months ended June 30, | Six months ended June 30, | |||||||||||||||
| ($ thousands, unless otherwise noted) | 2026 | 2025 | 2026 | 2025 | ||||||||||||
| General and administrative expenses | 5,255 | 5,023 | 10,649 | 14,430 | ||||||||||||
| - ($/bbl) | 4.22 | 3.53 | 4.11 | 4.83 | ||||||||||||
G&A expenses include head office and corporate costs such as salaries and employee benefits, legal fees, audit and tax-related fees and other professional services and may also include expenses related to corporate strategic initiatives, if any, among other costs.
For the three months ended June 30, 2026, G&A expenses increased by 5% (or $0.2 million) to $5.3 million compared to $5.0 million for the same period of 2025. This increase was attributable to higher staffing costs.
For the six months ended June 30, 2026, G&A expenses decreased by 26% (or $3.8 million) to $10.6 million compared to $14.4 million for the same period of 2025. The decrease was primarily attributable to lower external professional services fees, including legal, audit, and reserves evaluation costs. The six months ended June 30, 2025, included a one-time expense of $1.9 million associated with challenging the Company’s adoption of a shareholder rights plan, in which WEF was successful. Refer to the “Related Party Transaction” section in this MD&A for further information.
Stock-Based Compensation
| Three months ended June 30, | Six months ended June 30, | |||||||||||||||
| ($ thousands, unless otherwise noted) | 2026 | 2025 | 2026 | 2025 | ||||||||||||
| Stock-based compensation | 80 | 398 | 148 | 1,650 | ||||||||||||
| - ($/bbl) | 0.06 | 0.28 | 0.06 | 0.55 | ||||||||||||
The stock-based compensation expense relates to share awards issued under the omnibus share incentive plan (the “Incentive Plan”) adopted in February 2024. The Company’s Board of Directors suspended further grants under the Incentive Plan as the Company’s incentive compensation plan will comprise solely of an annual cash bonus. The remaining awards will be expensed over their vesting periods.
Greenfire Resources Ltd. | 2026 Q2 Management’s Discussion and Analysis | 9 |
Financing and Interest Expenses
| Three months ended June 30, | Six months ended June 30, | |||||||||||||||
| ($ thousands) | 2026 | 2025 | 2026 | 2025 | ||||||||||||
| Interest expenses | 930 | 10,623 | 2,031 | 21,148 | ||||||||||||
| Financing expenses | 809 | 2,501 | 1,391 | 4,256 | ||||||||||||
| Financing and interest expenses | 1,739 | 13,124 | 3,422 | 25,404 | ||||||||||||
Interest expenses include cash-settled interest on the Senior Credit Facility, 2028 Notes, Letter of Credit Facility, and other related charges. Financing expenses include the non-cash amortization of debt issuance costs, redemption premiums on the 2028 Notes, accretion of lease liability and accretion of decommissioning liabilities.
Financing and interest expenses decreased by 87% (or $11.4 million) to $1.7 million for the three months ended June 30, 2026, compared to $13.1 million for the same period of 2025. During the six months ended June 30, 2026, financing and interest expenses decreased by 87% (or $22.0 million) to $3.4 million compared to $25.4 million for the same period of 2025. The decrease in both periods reflects the redemption of the 2028 Notes on December 19, 2025, eliminating the associated interest and financing costs.
Refer to the “Capital Resources and Liquidity” section in this MD&A for definitions and additional details of Greenfire’s debt, the Senior Credit Facility, and the Letter of Credit Facility.
Loss (Gain) on Revaluation of Warrants
Greenfire has approximately 7.5 million warrants outstanding. Each warrant is exercisable for 1.171 common shares at an exercise price of USD$9.82 per share. The outstanding warrants expire on September 19, 2028, and contain a cashless exercise feature, permitting settlement without the cash payment of the exercise price via the issuance of a net number of common shares. This cashless exercise feature results in the warrants being treated as a financial liability and requires remeasurement at each reporting date.
Upon remeasurement of the warrants to fair value, the Company recognized a gain of $3.3 million for the three months ended June 30, 2026, compared to a gain of $5.9 million in the same period of 2025. The current period’s gain was driven by a decrease in the Company’s closing share price at June 30, 2026, relative to March 31, 2026. For the six months ended June 30, 2026, the Company recognized a loss of $2.2 million compared to a gain of $13.8 million in the comparative period. The loss recognized in 2026 is attributable to the increase in the Company’s common share price at June 30, 2026, relative to December 31, 2025.
Taxes
For the three months ended June 30, 2026, Greenfire recognized a deferred income tax expense of $14.9 million, compared to a deferred income tax expense of $8.6 million in the same period of 2025. For the six months ended June 30, 2026, Greenfire recognized a deferred income tax recovery of $5.3 million, compared to a deferred tax expense of $11.8 million in the same period of 2025. Deferred tax expense or recovery typically varies inversely with income (loss) before income taxes.
Net Income (Loss) and Comprehensive Income (Loss) and Adjusted EBITDA(1)
| Three months ended June 30, | Six months ended June 30, | |||||||||||||||
| ($ thousands) | 2026 | 2025 | 2026 | 2025 | ||||||||||||
| Net income (loss) and comprehensive income (loss) | 53,462 | 48,730 | (19,540 | ) | 64,893 | |||||||||||
| Add (deduct): | ||||||||||||||||
| Income tax expense (recovery) | 14,930 | 8,639 | (5,254 | ) | 11,849 | |||||||||||
| Unrealized (gain) loss on risk management contracts | (63,137 | ) | (25,839 | ) | 28,285 | (32,188 | ) | |||||||||
| Stock-based compensation | 80 | 398 | 148 | 1,650 | ||||||||||||
| Financing and interest | 1,739 | 13,124 | 3,422 | 25,404 | ||||||||||||
| Depletion and depreciation | 19,571 | 19,968 | 40,307 | 41,585 | ||||||||||||
| Non-recurring transactions(2) | - | - | - | 1,853 | ||||||||||||
| Loss (gain) on revaluation of warrants | (3,315 | ) | (5,852 | ) | 2,172 | (13,848 | ) | |||||||||
| Foreign exchange gain | (276 | ) | (14,192 | ) | (332 | ) | (14,236 | ) | ||||||||
| Other income(3) | (299 | ) | (703 | ) | (871 | ) | (1,373 | ) | ||||||||
| Adjusted EBITDA(1) | 22,755 | 44,273 | 48,337 | 85,589 | ||||||||||||
| Adjusted EBITDA(1) ($/bbl) | 18.26 | 31.10 | 18.67 | 28.62 | ||||||||||||
| (1) | Non-GAAP measures or ratios without a standardized meaning under IFRS Accounting Standards. Refer to the “Non-GAAP and Other Financial Measures” section in this MD&A. |
| (2) | See “Financial Results – General & Administrative Expenses” and “Related Party Transaction” sections of this MD&A for further information. |
| (3) | Excludes the portion of other income generated by the Company’s oil and gas properties. |
Greenfire Resources Ltd. | 2026 Q2 Management’s Discussion and Analysis | 10 |
For the three months ended June 30, 2026, Greenfire generated a net income of $53.5 million compared to $48.7 million in the same quarter of 2025, an increase of $4.7 million. For the six months ended June 30, 2026, Greenfire incurred a net loss of $19.5 million compared to a net income of $64.9 million in the corresponding period of 2025, a decrease of $84.4 million. These changes represent the cumulative effect of the factors discussed throughout the “Financial Results” section of this MD&A.
Adjusted EBITDA decreased 49% (or $21.5 million) for the three months ended June 30, 2026, to $22.8 million compared to $44.3 million for the same quarter of 2025. Adjusted EBITDA decreased 44% (or $37.3 million) for the six months ended June 30, 2026, to $48.3 million compared to $85.6 million for the same quarter of 2025. The decreases were driven by higher realized losses on risk management contracts, which more than offset the positive impact of higher oil sales.
Net Income (Loss) per Share
| Three months ended June 30, | Six months ended June 30, | |||||||||||||||
| ($ per share, unless otherwise noted) | 2026 | 2025 | 2026 | 2025 | ||||||||||||
| Net income (loss) per share – basic and diluted | 0.43 | 0.69 | (0.16 | ) | 0.92 | |||||||||||
| Weighted average shares outstanding – basic (’000) | 125,428 | 70,119 | 125,420 | 70,538 | ||||||||||||
| Weighted average shares outstanding – diluted (’000) | 125,470 | 70,219 | 125,420 | 70,638 | ||||||||||||
For the three months ended June 30, 2026, basic and diluted net income per share was $0.43, compared to basic and diluted net income per share of $0.69 in the same period of 2025. For the six months ended June 30, 2026, basic and diluted net loss per share was $0.16, compared to basic and diluted net income per share of $0.92 in the same period of 2025. The increases in weighted shares outstanding primarily relates to the 2025 Rights Offering completed in December 2025. Refer to the “Capital Resources and Liquidity – 2025 Rights Offering” section of this MD&A for additional details.
RISK MANAGEMENT
The Company’s activities expose it to a variety of financial risks that arise as a result of its exploration, development, production and financing activities. These risks include market risk, credit risk, and liquidity risk. Market risk is the risk that changes in market conditions, such as commodity prices, foreign exchange rates and interest rates, will affect the Company’s cash flow, income, or the value of its financial instruments.
Commodity Price Risk
The Company is exposed to commodity price risk on its oil sales, diluent expense and energy operating costs due to fluctuations in market prices. The Company continues to execute a risk management program that is primarily designed to reduce the volatility of revenue and cash flow, generate sufficient cash flows to service any debt obligations and to fund the Company’s operations. The Company’s risk management assets and liabilities may consist of hedging instruments such as fixed price swaps and option structures, including costless collars on WTI, WCS differential, condensate differential, natural gas and electricity. The Company does not use financial derivatives for speculative purposes.
The Company’s risk management program does not involve margin accounts that require posting of margin, including in scenarios of increased volatility in underlying commodity prices. Financial risk management contracts are measured at fair value, with gains and losses on re-measurement included in the consolidated statements of comprehensive income (loss) in the period in which they arise.
Outstanding Financial Risk Management Contracts at June 30, 2026
| Instrument | Units | Volume (per day) | Swap Price | Put Price | Call Price | |||||||||||||||
| Q3 2026 | WTI Costless Collar | US$ / bbl | 7,500 | - | $ | 57.34 | $ | 66.26 | ||||||||||||
| Q3 2026 | WTI Fixed Price Swap | US$ / bbl | 3,500 | $ | 71.28 | - | - | |||||||||||||
| Q3 2026 | WCS Differential Swap | US$ / bbl | 14,000 | $ | (12.80 | ) | - | - | ||||||||||||
| Q3 2026 | AECO Swap | C$ / GJ | 24,848 | $ | 2.30 | - | - | |||||||||||||
| Q4 2026 | WTI Costless Collar | US$ / bbl | 7,473 | - | $ | 59.01 | $ | 72.21 | ||||||||||||
| Q4 2026 | WTI Fixed Price Swap | US$ / bbl | 674 | $ | 68.83 | - | - | |||||||||||||
| Q4 2026 | AECO Swap | C$ / GJ | 27,000 | $ | 2.30 | - | - | |||||||||||||
| Q1 – Q4 2027 | AECO Swap | C$ / GJ | 27,000 | $ | 2.93 | - | - | |||||||||||||
| Q1 – Q4 2028 | AECO Swap | C$ / GJ | 27,000 | $ | 2.93 | - | - | |||||||||||||
Subsequent to June 30, 2026, Greenfire entered into the following financial commodity risk management contracts:
| Instrument | Units | Volume (per day) | Put Price | Call Price | ||||||||||||
| Q1 2027 | WTI Costless Collar | US$ / bbl | 7,500 | $ | 67.50 | $ | 84.65 | |||||||||
Greenfire Resources Ltd. | 2026 Q2 Management’s Discussion and Analysis | 11 |
Foreign Exchange Risk
The Company’s exposure to foreign currency risk consists of any US Dollar denominated cash, accounts receivable, risk management contracts, accounts payable and accrued liabilities, and, to the extent that the Senior Credit Facility is drawn in US dollars, debt. As at June 30, 2026, Greenfire’s net foreign exchange risk exposure was a US$8.7 million liability, and a 10% change in the foreign exchange rate would result in a $1.2 million change in the foreign exchange gain or loss.
Interest Rate Risk
Interest rate risk is the risk that future cash flows will fluctuate as a result of changes in market interest rates. The Company is exposed to interest rate risk related to borrowings drawn under the Senior Credit Facility, as the interest charged on the credit facility fluctuates with floating interest rates. Any letters of credit issued are subject to fixed interest rates and are not exposed to changes in interest rates. A 1% change in the interest rate would result in a $0.1 million change in the interest expense for the six months ended June 30, 2026.
Credit Risk
Credit risk is the risk of financial loss to the Company if a customer or counterparty to a financial instrument fails to meet its contractual obligations and arises principally from the Company’s accounts receivable. The Company is primarily exposed to credit risk from receivables associated with its oil sales and joint interest partners.
The Company manages its credit risk exposure by transacting with high-quality creditworthy counterparties and monitoring credit worthiness and/or credit ratings on an ongoing basis. Trade receivables from oil sales are generally collected on the 25th day of the month following production. Joint interest receivables are typically collected within one to three months of the invoice being issued. All risk management contracts are held with large financial institutions. The Company has not previously experienced any material credit losses on the collection of accounts receivable.
Liquidity Risk
Liquidity risk is the risk that the Company will not be able to meet its financial obligations as they become due. The Company’s objective in managing liquidity risk is to maintain sufficient available reserves to meet its financial obligations at any point in time. The Company expects to achieve this objective through prudent capital spending, an active commodity risk management program and through strategies such as continuously monitoring forecast and actual cash flows from operating, financing and investing activities, and available credit facilities. Management believes that future cash flows generated from these sources will be adequate to settle Greenfire’s financial liabilities. Refer to “Commitments and Contractual Obligations” section of this MD&A for additional details.
CAPITAL RESOURCES AND LIQUIDITY
The Company’s capital management objective is to maintain financial flexibility and sufficient liquidity to execute on planned capital programs, while meeting short and long-term commitments. The Company strives to actively manage its capital structure in response to changes in economic conditions and the risk characteristics of the underlying oil sands assets. At June 30, 2026, the Company’s capital structure consists of working capital surplus (deficit), debt and shareholders’ equity. Management believes that its current capital resources and its ability to manage cash flow and working capital levels will allow the Company to meet its current and future obligations, and to fund the other needs of the business.
Senior Credit Facility
Greenfire has a reserve-based credit facility (the “Senior Credit Facility”), at June 30, 2026, it was comprised of a $30.0 million operating facility and a $245.0 million syndicated facility, providing total committed credit of $275.0 million. The Senior Credit Facility’s borrowing base is subject to a semi-annual review, occurring in May and November of each year, and is established based on the lenders’ evaluation of the Company’s bitumen reserves, incorporating their prevailing commodity price assumptions. As at June 30, 2026, $26.5 million was drawn on the Senior Credit Facility (December 31, 2025 - $nil). During the second quarter of 2026, the Company completed its semi-annual review of the Senior Credit Facility and the maturity date was extended from November 30, 2027, to May 31, 2028.
On August 5, 2026, in connection with the Acquisition, Greenfire closed the upsize of its Senior Credit Facility from $275.0 million to $1.0 billion and the maturity date was extended to August 5, 2028. The Senior Credit Facility is now comprised of a $50.0 million operating facility and a $950.0 million syndicated facility.
The Senior Credit Facility is available on a revolving basis, may be drawn in Canadian or U.S. dollars, and bears interest at floating rates based on applicable Canadian or U.S. benchmark rates(1), plus applicable margins. The applicable margin is determined on a quarterly basis by reference to the Company’s trailing twelve-month Debt to EBITDA Ratio(2). The undrawn portion of the Senior Credit Facility is subject to a standby fee.
| (1) | Benchmark rates available include the Canadian prime rate, U.S. base rate, Canadian overnight repo rate average, and the secured overnight financing rate. |
| (2) | As defined in the Senior Credit Facility Agreement. |
Greenfire Resources Ltd. | 2026 Q2 Management’s Discussion and Analysis | 12 |
The Senior Credit Facility is secured by a first-priority security interest over substantially all of the Company’s assets. The Senior Credit Facility contains customary restrictive covenants that limit the Company’s ability to, among other things, incur additional indebtedness, create or permit liens to exist, pay dividends, redeem stock, and sell assets. The Senior Credit Facility is not subject to any financial covenants.
Bridge Facility
On August 5, 2026, in connection with the Acquisition Greenfire entered into a non-extendible, non-revolving equity bridge credit facility (the “Bridge Facility”) in an aggregate principal amount of $575.0 million made available to Greenfire in connection with the Acquisition.
The Bridge Facility is generally consistent with the Senior Credit Facility; however, such facility: (i) contains a more limited set of representations, warranties, covenants and events of default than those contained in the Senior Credit Facility; (ii) includes a covenant requiring Greenfire to complete an equity financing resulting in net proceeds equal to at least the aggregate outstanding principal amount of the Bridge Facility no later than three months following the Acquisition (the “Initial Equity Transaction Deadline”), provided that, as referred to below, no “Event of Default” shall occur as a result of a failure to comply with such covenant until the expiry of a six-month cure period; (iii) includes provisions relating to the limited recourse guarantees and cash collateral provided by the WEF; (iv) includes additional events of default in respect of, among other things, (A) the failure by Greenfire to complete the required equity financing by the Initial Equity Transaction Deadline (following a six-month cure period), (B) the occurrence of an “Event of Default” under the Senior Credit Facility that results in the indebtedness thereunder becoming due and payable prior to its otherwise scheduled maturity, and (C) certain specified events of default relating to the cash collateral provided by WEF; and (v) provides for a revised event of default framework whereby only certain limited events of default will permit realization on cash collateral provided by WEF.
Letter of Credit Facility
Greenfire maintains a separate $75.0 million letter of credit facility with a financial institution that is supported by Export Development Canada’s Account Performance Security Guarantee program (the “EDC APSG Facility”). During the second quarter of 2026, the EDC APSG Facility capacity was increased from $55.0 million to $75.0 million. The EDC APSG Facility is available on a demand basis. As at June 30, 2026, the Company had $54.0 million (December 31, 2025 - $54.0 million) in letters of credit outstanding under the EDC APSG Facility. Letters of credit issued under the EDC APSG Facility do not reduce Greenfire’s borrowing capacity under the Senior Credit Facility. The Company and its subsidiary have indemnified Export Development Canada for any payments made to the financial institution; however, the obligations under such indemnity are unsecured.
2025 Rights Offering
On December 17, 2025, Greenfire completed a rights offering of its common shares to its shareholders (the “Rights Offering”). The Rights Offering resulted in the issuance of approximately 55.1 million common shares for gross proceeds of $298.7 million. WEF provided a standby commitment to backstop the Rights Offering by agreeing to acquire any common shares not subscribed for under the Rights Offering. The standby commitment was not utilized as the Rights Offering was oversubscribed. WEF did not receive any compensation in connection with the standby commitment.
Senior Secured Notes
On September 20, 2023, Greenfire issued US$300 million of senior secured notes (the “2028 Notes”). The 2028 Notes bore interest at a fixed rate of 12.00%, were to mature on October 1, 2028, and were secured by a second-priority lien on the Company’s assets. On December 19, 2025, the outstanding 2028 Notes were voluntarily redeemed at 106% of their principal amount. All accrued interest on the 2028 Notes was settled concurrently.
Net Surplus (Debt)(1)
| June 30, | December 31, | |||||||
| ($ thousands) | 2026 | 2025 | ||||||
| Face value of debt(2) | (26,500 | ) | - | |||||
| Accounts payable and accrued liabilities | (86,841 | ) | (88,432 | ) | ||||
| Cash | 2,962 | 41,974 | ||||||
| Accounts receivable | 69,616 | 66,186 | ||||||
| Inventories | 21,351 | 20,596 | ||||||
| Prepaid expenses and deposits | 5,903 | 9,422 | ||||||
| Net surplus (debt)(1) | (13,509 | ) | 49,746 | |||||
| (1) | Non-GAAP measure without a standardized meaning under IFRS Accounting Standards. Refer to the “Non-GAAP and Other Financial Measures” section in this MD&A. |
| (2) | Amounts represent undiscounted principal only and exclude interest and transaction costs. |
Greenfire Resources Ltd. | 2026 Q2 Management’s Discussion and Analysis | 13 |
The following chart reconciles the change in net surplus (debt) from December 31, 2025 to June 30, 2026.
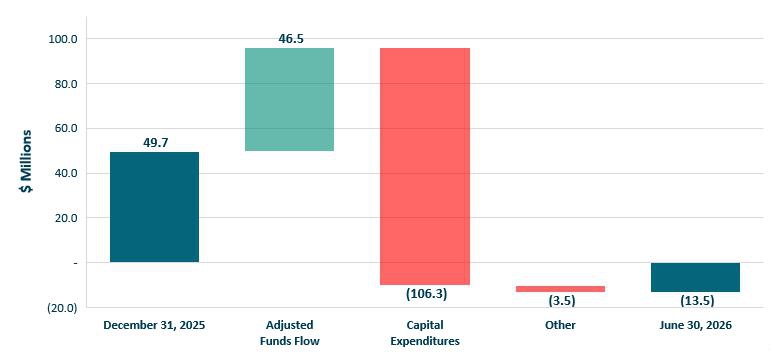
“Other” includes payment of lease liabilities, debt issuance costs, share issuance costs, and foreign exchange.
Available Funding(1)
| June 30, | December 31, | |||||||
| ($ thousands) | 2026 | 2025 | ||||||
| Current assets | 105,393 | 149,194 | ||||||
| Current liabilities | (110,355 | ) | (95,836 | ) | ||||
| Working capital surplus (deficit) | (4,962 | ) | 53,358 | |||||
| Current portion of risk management contracts | 10,269 | (11,016 | ) | |||||
| Current portion of lease liabilities and other | 2,381 | 3,276 | ||||||
| Warrant liability | 6,300 | 4,128 | ||||||
| Assets held for sale | (3,929 | ) | - | |||||
| Liabilities associated with assets held for sale | 2,932 | - | ||||||
| Undrawn capacity under the Senior Credit Facility(2) | 248,500 | 275,000 | ||||||
| Available funding(1) | 261,491 | 324,746 | ||||||
| (1) | Non-GAAP measure without a standardized meaning under IFRS Accounting Standards. Refer to the “Non-GAAP and Other Financial Measures” section in this MD&A. |
| (2) | As at June 30, 2026 the Company had a $275.0 million borrowing base (December 31, 2025 - $275.0 million) under the Senior Credit Facility, of which $26.5 million was drawn at June 30, 2026 (December 31, 2025 - $nil). On August 5, 2026, the borrowing base under the Senior Credit Facility was upsized to $1.0 billion. |
As at June 30, 2026, working capital decreased to a deficit of $5.0 million from a surplus of $53.4 million at December 31, 2025, a change of $58.4 million. The decrease was primarily driven by the adjusted free cash flow deficit for the six months ended June 30, 2026.
Available funding decreased by $63.3 million to $261.5 million as at June 30, 2026, compared to $324.7 million as at December 31, 2025. This decrease primarily relates to the capital expenditures made in the first half of 2026.
Greenfire Resources Ltd. | 2026 Q2 Management’s Discussion and Analysis | 14 |
Share Capital
| August 5, | June 30, | December 31, | ||||||||||
| (thousands of shares, units, or warrants) | 2026 | 2026 | 2025 | |||||||||
| Common shares | 125,429 | 125,429 | 125,407 | |||||||||
| Warrants(1) | 7,527 | 7,527 | 7,527 | |||||||||
| Performance share units(2) | 152 | 192 | 249 | |||||||||
| Restricted share units | 35 | 42 | 84 | |||||||||
| (1) | Each warrant is exercisable for 1.171 common shares at a price of USD$9.82 per share. |
| (2) | The performance share units are exercisable for between 0.0 and 2.0 shares per unit, based on specified performance conditions. As at the dates presented, none of these conditions have been satisfied. |
The Company is authorized to issue an unlimited number of common shares without a nominal or par value. The Company’s Board of Directors has suspended further grants of performance share units and restricted share units under the Incentive Plan.
Cash Flow Summary
| Three months ended June 30, | Six months ended June 30, | |||||||||||||||
| ($ thousands) | 2026 | 2025 | 2026 | 2025 | ||||||||||||
| Cash provided (used) by: | ||||||||||||||||
| Operating activities | 35,573 | 17,732 | 36,936 | 52,405 | ||||||||||||
| Financing activities | 21,824 | (118 | ) | 23,079 | (2,055 | ) | ||||||||||
| Investing activities | (55,048 | ) | (17,951 | ) | (99,163 | ) | (45,765 | ) | ||||||||
| Exchange rate impact on cash | 69 | (1,921 | ) | 136 | (2,024 | ) | ||||||||||
| Change in cash | 2,418 | (2,258 | ) | (39,012 | ) | 2,561 | ||||||||||
Cash Provided by Operating Activities
Cash provided by operating activities in the second quarter of 2026 was $35.6 million, compared to $17.7 million for the same period of 2025. The change was primarily driven by non-cash working capital movements and lower cash interest paid, partially offset by lower Adjusted EBITDA.
For the six months ended June 30, 2026, cash provided by operating activities was $36.9 million compared to $52.4 million in the corresponding period of 2025. The decrease reflects a reduction in Adjusted EBITDA, partially offset by lower cash interest paid.
Based on current and forecasted production levels, operating expenses, capital expenditures, existing commodity price risk management contracts and current outlook for commodity prices, the Company expects cash provided by operating activities will be sufficient to cover its operational commitments and financial obligations over the next twelve months.
Cash Provided (Used) by Financing Activities
For the three months ended June 30, 2026, cash provided by financing activities was $21.8 million, compared to cash used in financing activities of $0.1 million in the same period of 2025. This change was primarily attributable to $22.4 million of draws on the Senior Credit Facility during the second quarter of 2026.
For the six months ended June 30, 2026, cash provided by financing activities was $23.1 million, compared to cash used in financing activities of $2.1 million in the same period of 2025. This change was primarily attributable to $26.5 million of draws on the Senior Credit Facility during 2026.
Greenfire Resources Ltd. | 2026 Q2 Management’s Discussion and Analysis | 15 |
Cash Used in Investing Activities
Cash used in investing activities for the second quarter of 2026 was $55.0 million, compared to $18.0 million in the same period of 2025. Cash used in investing activities for the first six months of 2026 was $99.2 million, compared to $45.8 million in the same period of 2025. The increase in both periods was primarily attributable to higher capital expenditures in 2026 as compared to 2025.
Capital Expenditures(1)
| Three months ended June 30, | Six months ended June 30, | |||||||||||||||
| ($ thousands) | 2026 | 2025 | 2026 | 2025 | ||||||||||||
| Property, plant and equipment expenditures | 56,662 | 10,840 | 106,255 | 37,139 | ||||||||||||
| (1) | Supplementary financial measure. Refer to the “Supplementary Financial Measures” section of this MD&A. |
Capital expenditures for the three months ended June 30, 2026 were $56.7 million, compared to $10.8 million for the same period in 2025. Capital expenditures for the six months ended June 30, 2026 were $106.3 million, compared to $37.1 million for the same period in 2025. The increases in the 2026 periods were primarily driven by the development of Pad 7 at the Expansion Asset. Pad 7 consists of fourteen well pairs and is expected to commence bitumen production in the fourth quarter of 2026. Pad 7 is Greenfire’s first SAGD well pad and will be the first new well pairs drilled at the Expansion Asset since 2017.
Adjusted Funds Flow(1) and Adjusted Free Cash Flow (Deficit)(1)
| Three months ended June 30, | Six months ended June 30, | |||||||||||||||
| ($ thousands) | 2026 | 2025 | 2026 | 2025 | ||||||||||||
| Cash provided by operating activities | 35,573 | 17,732 | 36,936 | 52,405 | ||||||||||||
| Non-recurring transactions(2) | - | - | - | 1,853 | ||||||||||||
| Changes in non-cash working capital | (13,660 | ) | 16,111 | 9,516 | 11,029 | |||||||||||
| Adjusted funds flow(1) | 21,913 | 33,843 | 46,452 | 65,287 | ||||||||||||
| Property, plant and equipment expenditures | (56,662 | ) | (10,840 | ) | (106,255 | ) | (37,139 | ) | ||||||||
| Adjusted free cash flow (deficit)(1) | (34,749 | ) | 23,003 | (59,803 | ) | 28,148 | ||||||||||
| (1) | Non-GAAP measures without a standardized meaning under IFRS Accounting Standards. Refer to the “Non-GAAP and Other Financial Measures” section in this MD&A. |
| (2) | See “Related Party Transaction” section in this MD&A for further information. |
Adjusted funds flow was $21.9 million, during the three months ended June 30, 2026, compared to $33.8 million during the same period in 2025. Adjusted funds flow was $46.5 million, during the six months ended June 30, 2026, compared to $65.3 million during the same period in 2025. The decrease in adjusted funds flow in both periods corresponds to the declines in Adjusted EBITDA discussed above, (see the “Financial Results – Net Income (Loss) and Comprehensive Income (Loss) and Adjusted EBITDA” section in this MD&A), partially offset by lower cash interest paid.
Greenfire’s adjusted free cash flow deficit was $34.7 million during the three months ended June 30, 2026, compared to adjusted free cash flow of $23.0 million during the same period in 2025. Adjusted free cash flow deficit was $59.8 million during the six months ended June 30, 2026, compared to adjusted free cash flow of $28.1 million during the same period in 2025. The decrease in both periods reflects increased capital expenditures and lower adjusted funds flow.
Greenfire Resources Ltd. | 2026 Q2 Management’s Discussion and Analysis | 16 |
SUMMARY OF QUARTERLY RESULTS
| 2026 | 2025 | 2024 | ||||||||||||||||||||||||||||||
| ($ thousands, unless otherwise noted) | Q2 | Q1 | Q4 | Q3 | Q2 | Q1 | Q4 | Q3 | ||||||||||||||||||||||||
| BUSINESS ENVIRONMENT(1) | ||||||||||||||||||||||||||||||||
| WTI (US$/bbl) | 92.79 | 71.93 | 59.14 | 64.93 | 63.74 | 71.42 | 70.27 | 75.09 | ||||||||||||||||||||||||
| WTI (C$/bbl) | 128.38 | 98.66 | 82.49 | 89.43 | 88.22 | 102.47 | 98.32 | 102.42 | ||||||||||||||||||||||||
| WCS (C$/bbl) | 108.10 | 79.24 | 66.87 | 75.12 | 74.00 | 84.29 | 80.75 | 83.94 | ||||||||||||||||||||||||
| AECO (C$/GJ) | 1.55 | 1.90 | 2.11 | 0.60 | 1.60 | 2.05 | 1.40 | 0.65 | ||||||||||||||||||||||||
| FX (USD:CAD)(2) | 1.384 | 1.372 | 1.395 | 1.377 | 1.384 | 1.435 | 1.399 | 1.364 | ||||||||||||||||||||||||
| OPERATING RESULTS | ||||||||||||||||||||||||||||||||
| Bitumen production (bbls/d) | 13,607 | 14,719 | 15,699 | 15,757 | 15,748 | 17,495 | 19,384 | 19,125 | ||||||||||||||||||||||||
| FINANCIAL RESULTS | ||||||||||||||||||||||||||||||||
| Oil sales | 179,408 | 147,313 | 133,987 | 141,137 | 144,542 | 183,637 | 208,895 | 193,643 | ||||||||||||||||||||||||
| Oil sales ($/bbl) | 103.63 | 76.65 | 65.20 | 73.24 | 72.53 | 82.10 | 79.00 | 83.01 | ||||||||||||||||||||||||
| Operating expenses | 21,154 | 35,747 | 27,322 | 31,936 | 31,823 | 37,929 | 40,864 | 40,655 | ||||||||||||||||||||||||
| Operating expenses ($/bbl) | 16.98 | 26.63 | 18.84 | 22.52 | 22.35 | 24.21 | 21.83 | 23.90 | ||||||||||||||||||||||||
| Gross profit (loss)(3) | 73,021 | (80,660 | ) | 27,144 | 14,526 | 55,829 | 34,392 | 26,471 | 76,772 | |||||||||||||||||||||||
| Operating netback(4) | 29,233 | 31,437 | 51,146 | 53,328 | 49,905 | 49,604 | 65,183 | 57,833 | ||||||||||||||||||||||||
| Operating netback ($/bbl)(4) | 23.46 | 23.42 | 35.26 | 37.60 | 35.06 | 31.67 | 34.81 | 34.00 | ||||||||||||||||||||||||
| Adjusted EBITDA(4) | 22,755 | 25,582 | 46,908 | 48,286 | 44,273 | 41,316 | 62,472 | 53,388 | ||||||||||||||||||||||||
| Net income (loss) and comprehensive income (loss) | 53,462 | (73,002 | ) | (8,638 | ) | (8,751 | ) | 48,730 | 16,163 | 78,562 | 58,916 | |||||||||||||||||||||
| Per share - basic | 0.43 | (0.58 | ) | (0.11 | ) | (0.12 | ) | 0.69 | 0.23 | 1.13 | 0.85 | |||||||||||||||||||||
| Per share - diluted | 0.43 | (0.58 | ) | (0.11 | ) | (0.12 | ) | 0.69 | 0.23 | 1.09 | 0.82 | |||||||||||||||||||||
| Cash provided by operating activities | 35,573 | 1,363 | 35,292 | 48,764 | 17,732 | 34,673 | 60,195 | (17,875 | ) | |||||||||||||||||||||||
| Adjusted funds flow(4) | 21,913 | 24,539 | 40,162 | 38,051 | 33,843 | 31,444 | 52,950 | 44,104 | ||||||||||||||||||||||||
| Capital expenditures(3) | 56,662 | 49,593 | 56,731 | 17,896 | 10,840 | 26,299 | 13,161 | 21,175 | ||||||||||||||||||||||||
| Adjusted free cash flow (deficit)(4) | (34,749 | ) | (25,054 | ) | (16,569 | ) | 20,155 | 23,003 | 5,145 | 39,789 | 22,929 | |||||||||||||||||||||
| FINANCIAL POSITION | ||||||||||||||||||||||||||||||||
| Cash and cash equivalents | 2,962 | 544 | 41,974 | 114,656 | 69,980 | 72,238 | 67,419 | 37,709 | ||||||||||||||||||||||||
| Total assets | 1,312,016 | 1,298,318 | 1,285,444 | 1,303,797 | 1,285,472 | 1,270,152 | 1,257,471 | 1,163,759 | ||||||||||||||||||||||||
| Total non-current financial liabilities | 54,800 | 36,108 | 22,751 | 332,528 | 331,914 | 338,990 | 100,181 | 244,727 | ||||||||||||||||||||||||
| Total debt | 24,636 | 2,361 | - | 321,869 | 314,705 | 329,627 | 328,930 | 308,561 | ||||||||||||||||||||||||
| Shareholders’ equity | 1,146,861 | 1,093,568 | 1,166,857 | 879,436 | 886,993 | 838,126 | 821,431 | 742,384 | ||||||||||||||||||||||||
| (1) | These benchmark prices are not the Company’s realized sales price. |
| (2) | Quarterly average exchange rates as per the Bank of Canada. |
| (3) | Supplementary financial measures. Refer to the “Supplementary Financial Measures” section of this MD&A. |
| (4) | Non-GAAP measures without a standardized meaning under IFRS Accounting Standards. Refer to the “Non-GAAP and Other Financial Measures” section in this MD&A. |
RELATED PARTY TRANSACTION
In the first quarter of 2025, Greenfire agreed to reimburse WEF for approximately $1.9 million of legal fees associated with its adoption of a shareholder rights plan and related hearings before the Alberta Securities Commission, in which WEF was successful. The reimbursement was reviewed and approved by the independent members of the Company’s Board of Directors.
RISK FACTORS
The Company’s business is subject to numerous risks and uncertainties, any of which may adversely affect the Company’s business and its financial results and results of its operations. Certain of these risks and uncertainties are described throughout this MD&A. For additional information refer to the “Risk Factors” section in our 2025 AIF, which is also filed with the SEC under cover of Form 40-F, is available online at www.sedarplus.ca, www.sec.gov and on our website at www.greenfireres.com.
Greenfire Resources Ltd. | 2026 Q2 Management’s Discussion and Analysis | 17 |
NON-GAAP AND OTHER FINANCIAL MEASURES
Certain financial measures in this MD&A are non-GAAP financial measures or ratios. These measures do not have a standardized meaning under IFRS Accounting Standards and therefore may not be comparable to similar measures provided by other companies. These non-GAAP measures should not be considered in isolation or as an alternative for measures of performance prepared in accordance with IFRS Accounting Standards. This MD&A also contains supplementary financial measures and ratios. Supplementary financial measures are derived from IFRS Accounting Standards. Non-GAAP and supplementary financial measures are not intended to represent or replace measures prepared in accordance with IFRS Accounting Standards.
Non-GAAP financial measures and ratios include: adjusted EBITDA, operating netback, operating netback, excluding realized gain (loss) on risk management contracts, adjusted funds flow, adjusted free cash flow (deficit), effective royalty rate, available funding, net surplus (debt) and per barrel figures associated with non-GAAP financial measures.
Supplementary financial measures and ratios include: gross profit (loss), capital expenditures, and depletion.
While these measures are commonly used in the oil and natural gas industry, the Company’s determination of these measures may not be comparable with calculations of similar measures presented by other reporting issuers. We believe that the inclusion of these specified financial measures provides useful information to financial statement users when evaluating the financial results of Greenfire.
Non-GAAP Financial Measures & Ratios
Adjusted EBITDA (including per barrel ($/bbl))
Adjusted EBITDA is used to measure Greenfire’s profitability from its underlying asset base on a continuing basis. When adjusted EBITDA is expressed on a per barrel basis it is a non-GAAP ratio.
Adjusted EBITDA is calculated as net income (loss) and comprehensive income (loss) before interest and financing costs, income taxes, depletion, depreciation and amortization, transaction costs, refinancing costs and is adjusted for certain non-cash items, or other items that are considered non-recurring in nature or outside of normal business operations. Adjusted EBITDA ($/bbl) is calculated by dividing adjusted EBITDA by the Company’s total bitumen sales volume in a specified period.
Net income (loss) and comprehensive income (loss) is the most directly comparable GAAP measure for adjusted EBITDA. For a reconciliation of net income (loss) and comprehensive income (loss) to adjusted EBITDA, see the “Financial Results – Net Income (loss) and comprehensive income (loss) and Adjusted EBITDA” section in this MD&A.
Operating Netback (including per barrel ($/bbl)) and Operating Netback, excluding realized gain (loss) on risk management contracts (including per barrel ($/bbl))
Operating netback and operating netback, excluding realized gain (loss) on risk management contracts are financial measures widely used in the oil and gas industry as measures of a company’s efficiency and ability to generate cash flow for debt repayments, capital expenditures or other uses. When Operating netback is expressed on a per barrel basis it is a non-GAAP ratio.
Operating netback, excluding realized gain (loss) on risk management contracts is comprised of gross profit (loss), plus loss on risk management contracts, less gain on risk management contracts and plus depletion expense on the Company’s operating assets. Operating netback, excluding realized gain (loss) on risk management contracts per barrel ($/bbl) is calculated by dividing operating netback, excluding realized gain (loss) on risk management contracts by the Company’s bitumen sales volume in a specified period. Operating netback is further adjusted for realized gain (loss) risk management contracts, as appropriate. Operating netback per barrel ($/bbl) is calculated by dividing operating netback by the Company’s bitumen sales volume in a specified period.
Gross profit (loss) is the most directly comparable GAAP measure to operating netback and operating netback, excluding realized (gain) loss on risk management contracts. See the “Financial Results – Operating Netback” section in this MD&A for a reconciliation of gross profit (loss) to operating netback and operating netback, excluding realized gain (loss) on risk management contracts.
Adjusted Funds Flow
Management uses the adjusted funds flow measure to evaluate the Company’s ability to fund its capital programs and meet its ongoing financial obligations using cash flow internally generated from ongoing operating related activities.
Greenfire Resources Ltd. | 2026 Q2 Management’s Discussion and Analysis | 18 |
Adjusted funds flow is computed as cash provided by operating activities, excluding the impact of changes in non-cash working capital, less transaction costs and transactions considered non-recurring in nature or outside of normal business operations.
Cash provided by operating activities is the most directly comparable GAAP measure for adjusted funds flow, which is a non-GAAP measure. For a reconciliation of cash provided by operating activities to adjusted funds flow, see the “Capital Resources and Liquidity – Adjusted Funds Flow and Adjusted Free Cash Flow (Deficit)” section in this MD&A.
Adjusted Free Cash Flow (Deficit)
Management uses adjusted free cash flow (deficit) as an indicator of the efficiency and liquidity of its business, measuring its funds after capital investment that are available to manage debt levels and return capital to shareholders.
Adjusted free cash flow (deficit) is computed as cash provided by operating activities, excluding the impact of changes in non-cash working capital, less transaction costs, transactions considered non-recurring in nature or outside of normal business operations, property, plant and equipment expenditures and acquisitions.
Cash provided by operating activities is the most directly comparable GAAP measure for adjusted free cash flow (deficit), which is a non-GAAP measure. For a reconciliation of cash provided by operating activities to adjusted free cash flow (deficit), see the “Capital Resources and Liquidity – Adjusted Funds Flow and Adjusted Free Cash Flow (Deficit)” section in this MD&A.
Effective Royalty Rate
Management uses effective royalty rate, a non-GAAP ratio, to compare between pre and post-payout crown royalties by calculating a royalty rate on a consistent basis.
Royalties consist of crown royalties on bitumen production paid to the Province of Alberta, based on government prescribed royalty rates. The pre-payout royalty rates are calculated using the Canadian dollar equivalent one-month trailing WTI benchmark price. Post-payout royalty rates are calculated using the estimated annual average Canadian dollar equivalent WTI benchmark price. These rates are applied to gross revenue (pre-payout) or the greater of gross or net revenue (post-payout). “Payout” is reached when net revenue is greater than costs for the cumulative project. Pre-payout, the gross revenue royalty—bitumen realization net of transportation and storage costs—starts at 1%, rising with the Canadian dollar WTI price to a maximum of 9%. Post-payout, the royalty is applied to the higher of the gross revenue royalty or the net revenue royalty (net of operating, diluent, transportation, and capital costs).
The actual royalty rate applied will differ from the effective royalty rate. The effective royalty rate is calculated as royalty expense divided by oil sales after diluent and oil transportation expenses.
| Three months ended June 30, | Six months ended June 30, | |||||||||||||||
| ($ thousands, unless otherwise noted) | 2026 | 2025 | 2026 | 2025 | ||||||||||||
| Oil sales | 179,408 | 144,542 | 326,721 | 328,179 | ||||||||||||
| Diluent expense | (69,635 | ) | (56,290 | ) | (129,868 | ) | (130,284 | ) | ||||||||
| Oil transportation expense | (10,165 | ) | (9,811 | ) | (20,654 | ) | (20,585 | ) | ||||||||
| Oil sales after diluent and transportation expense | 99,608 | 78,441 | 176,199 | 177,310 | ||||||||||||
| Royalties | 7,941 | 3,932 | 12,224 | 10,756 | ||||||||||||
| Effective royalty rate | 7.97 | % | 5.01 | % | 6.94 | % | 6.07 | % | ||||||||
Net Surplus (Debt)
Management uses net surplus (debt) to monitor and evaluate the Company’s financial strength, and financing requirements.
Net surplus (debt) is computed as the face value of Greenfire’s debt adjusted for accounts payable and accrued liabilities, cash, accounts receivable, inventories, and prepaid expenses and deposits.
Debt is the most directly comparable GAAP measure to net surplus (debt). For a reconciliation of debt to net surplus (debt), see the “Capital Resources and Liquidity – Net Surplus (Debt)” section in this MD&A.
Available Funding
Management uses available funding to assess liquidity, financial flexibility and the Company’s ability to fund capital expenditures, and other obligations as they come due.
Greenfire Resources Ltd. | 2026 Q2 Management’s Discussion and Analysis | 19 |
Available funding is calculated as working capital surplus (deficit), adjusted to exclude the current portion of risk management contracts, current portion of lease liabilities and other, current portion of decommissioning obligations, warrant liabilities, assets held for sale, liabilities associated with assets held for sale, and the current portion of debt, and including the undrawn capacity available under the Company’s Senior Credit Facility.
Net working capital surplus (deficit) is the GAAP measure that is the most directly comparable measure to available funding. For a reconciliation of net working capital surplus (deficit) to available funding, see the “Capital Resources and Liquidity – Available Funding” section in this MD&A.
Supplementary Financial Measures
Gross Profit (Loss)
Gross profit (loss) is a supplementary financial measure prepared on a consistent basis with IFRS Accounting Standards. Greenfire uses gross profit (loss) to assess its core operating performance before considering other expenses such as general and administrative costs, financing costs, and income taxes. Gross profit (loss) is calculated as oil sales, net of royalties, plus gains on risk management contracts, less losses on risk management contracts, diluent expense, operating expense, depletion expense on the Company’s operating assets, transportation expenses and marketing expenses.
Management believes that gross profit (loss) provides investors, analysts, and other stakeholders with useful insight into the Company’s ability to generate profitability from its core operations before non-operating expenses. When gross profit (loss) is expressed on a per barrel basis it is a supplementary financial ratio. See the “Financial Results – Gross Profit (Loss)” section in this MD&A for a reconciliation of gross profit (loss).
Capital Expenditures
Capital expenditures is a supplementary financial measure prepared on a consistent basis with IFRS Accounting Standards. Greenfire uses capital expenditures to monitor the cash flows it invests into property, plant and equipment. Capital expenditures is derived from the statement of cash flows and includes property, plant and equipment expenditures and acquisitions.
Management believes that capital expenditures provides investors, analysts and other stakeholders with a useful insight into the Company’s investments into property, plant and equipment.
Depletion
The term “depletion” or “depletion expense” is the portion of depletion and depreciation expense reflecting the cost of development and extraction of its bitumen reserves. The term “Depreciation expense” is the portion of depletion and depreciation expense for assets not directly associated with the development and extraction of the Company’s bitumen reserves. When depletion expense is expressed on a per barrel basis it is a supplementary financial ratio.
Management uses these metrics to analyze those costs directly associated with capital cost of different property, plant and equipment types. A quantitative reconciliation of depletion expense and depreciation expense to the most directly comparable GAAP financial measure, Depletion and depreciation expense, is contained under the heading “Financial Results – Depletion and Depreciation Expenses” of this MD&A.
COMMITMENTS AND CONTRACTUAL OBLIGATIONS
The Company enters into commitments and contractual obligations in the normal course of operations. The following table is a summary of management’s estimate of the contractual maturities of obligations as at June 30, 2026:
| ($ thousands) | 1 Year | 2-3 Years | 4-5 Years | Thereafter | Total | |||||||||||||||
| Accounts payable and accrued liabilities | 86,841 | - | - | - | 86,841 | |||||||||||||||
| Risk management contracts | 11,901 | 7,000 | - | - | 18,901 | |||||||||||||||
| Lease liabilities and other(1) | 2,573 | 3,378 | 1,039 | 1,332 | 8,322 | |||||||||||||||
| Debt(2) | - | 26,500 | - | - | 26,500 | |||||||||||||||
| Financial liabilities | 101,315 | 36,878 | 1,039 | 1,332 | 140,564 | |||||||||||||||
| Transportation commitments | 37,183 | 74,881 | 73,426 | 200,511 | 386,001 | |||||||||||||||
| Other | 2,428 | - | - | - | 2,428 | |||||||||||||||
| Total future payments | 140,926 | 111,759 | 74,465 | 201,843 | 528,993 | |||||||||||||||
| (1) | Amounts represent expected undiscounted cash payments. |
| (2) | Amounts represent undiscounted principal only and exclude interest and transaction costs. |
Greenfire Resources Ltd. | 2026 Q2 Management’s Discussion and Analysis | 20 |
Management believes its current capital resources, combined with its ability to manage cash flow and working capital requirements, will enable the Company to meet its current and future obligations, and fund other business needs. In the short term, the Company anticipates meeting its cash requirements through a combination of cash on hand, operating cash flows, and accessing its available credit facilities.
OFF-BALANCE SHEET ARRANGEMENTS
Greenfire does not maintain off-balance sheet transactions, arrangements, obligations or other relationships with unconsolidated entities or others that are reasonably likely to have a material current or future effect on the Company’s financial condition, revenues or expenses, results of operations, liquidity, capital expenditures or capital resources and which are not disclosed in the financial statements.
APPLICATION OF CRITICAL ACCOUNTING ESTIMATES
Certain accounting policies require that management make appropriate decisions with respect to the formulation of estimates and assumptions that affect the reported amounts of assets, liabilities, revenues and expenses. Management reviews its estimates on a regular basis. The emergence of new information and changed circumstances may result in actual results or changes to estimates that differ materially from current estimates. The Company’s use of estimates and judgements in preparing the annual financial statements is discussed in Note 2 of the annual financial statements.
DISCLOSURE CONTROLS AND INTERNAL CONTROLS OVER FINANCIAL REPORTING
Disclosure Controls and Procedures (“DC&P”)
The Company’s President and Vice President, Finance (“VP Finance”) have established and maintained DC&P and evaluated the effectiveness of the design and operation of these controls to provide reasonable assurance that: (i) material information relating to the Company is made known to the Company’s President and VP Finance by others, particularly during the period in which the annual and interim filings are being prepared; and (ii) information required to be disclosed by the Company in the annual filings, interim filings or other reports filed or submitted under securities legislation is recorded, processed, summarized and reported within the time period specified in securities legislation. Based on that evaluation the President and the VP Finance have concluded and certified the Company’s DC&P are effective as of June 30, 2026.
Internal Control over Financial Reporting (“ICFR”)
Management is responsible for establishing and maintaining adequate internal control over the Company’s financial reporting. Internal control over the Company’s financial reporting is a process designed by, or designed under the supervision of, the Company’s President and VP Finance, and effected by the Company’s board of directors, management and other personnel, to provide reasonable assurance regarding the reliability of financial reporting and the preparation of annual financial statements and interim financial statements for external purposes in accordance with IFRS Accounting Standards.
The Company’s President and VP Finance have assessed the effectiveness of the Company’s ICFR as defined in Rule 13a-15(f) and 15(d)-15(f) of the US Securities Exchange Act of 1934 and as defined in Canada by National Instrument 52-109, Certification of Disclosure in Issuers’ Annual and Interim Filings. This assessment was based on the framework in Internal Control – Integrated Framework (2013) issued by the Committee of Sponsoring Organizations of the Treadway Commission. The President and VP Finance have concluded and certified that the Company’s ICFR was effective as of June 30, 2026.
There have been no changes in the Company’s internal control over financial reporting that occurred during the period ended June 30, 2026, that has materially affected, or is reasonably likely to materially affect, the Company’s internal control over financial reporting.
It should be noted that a control system, no matter how well conceived, can provide only reasonable, but not absolute assurance that the objectives of the control system will be met, and it should not be expected that the disclosure and internal controls and procedures will prevent all errors or fraud.
Greenfire Resources Ltd. | 2026 Q2 Management’s Discussion and Analysis | 21 |
FORWARD-LOOKING STATEMENTS
This MD&A contains forward-looking statements or forward-looking information within the meaning of the applicable United States federal securities laws and applicable Canadian securities laws (forward-looking information being collectively hereinafter referred to as “forward-looking statements”). Such forward-looking statements are based on expectations, estimates and projections as at the date of this MD&A. Any statements that involve discussions with respect to predictions, expectations, beliefs, plans, projections, objectives, assumptions or future events or performance (often but not always using phrases such as “expects”, “is expected”, “anticipates”, “plans”, “budget”, “scheduled”, “forecasts”, “estimates”, “believes” or “intends”, or variations of such words and phrases (including negative and grammatical variations), or stating that certain actions, events or results “may”, “could”, “would”, “should”, “might” or “will” be taken, occur or be achieved) are not statements of historical fact and may be forward-looking statements and are intended to identify forward-looking statements. These forward-looking statements include, but are not limited to, statements and information concerning: the intentions, strategy, plans and future actions of the Company; that Greenfire plans to leverage its large resource base and significant infrastructure in place to drive meaningful, capital-efficient production growth; Greenfire’s strategic objective to manage and enhance its asset portfolio to maximize long-term net asset value per share for Greenfire shareholders, including by investing in proven, industry-standard SAGD optimization techniques at the Hangingstone Facilities; the anticipated benefits from the Acquisition and the integration of Connacher’s business and operations with those of the Company; the anticipated completion, timing, size and terms of the rights offering of common shares, including the filing of an amended and restated prospectus in respect thereof; the intended use of proceeds of the rights offering to repay the Bridge Facility; the standby commitment in connection with the rights offering; expected timing for first steam injection, and first oil production from Pad 7; expected timing for completion of drilling, and first oil production from Pad 5SE; expected timing for drilling and first oil production from Pad 8; anticipated results from the Company’s oilsands exploration well program and other operational activities in 2026, 2027 and beyond; the Company’s priorities in respect of the Great Divide Asset and the implementation of Greenfire’s action plan to achieve $30 million of annual synergies by December 31, 2026; the Company’s plans for capital spending at Pod One and Algar; capital expenditures and operational strategies for the Expansion Asset and the Demo Asset; the Company’s updated 2026 guidance, including the 2026 production guidance and increased 2026 capital budget and updates to the Company’s anticipated capital expenditures for 2026; expectations that cash provided by operating activities will be sufficient to cover the Company’s operational commitments and financial obligations; the term of certain marketing contracts; management’s belief that the Company’s current capital resources and its ability to manage cash flow and working capital levels will allow the Company to meet its current and future obligations, to make interest and principal payments, and to fund the other needs of the business; expectations related to the Company’s risk management program; and statements relating to the business and future activities of the Company after the date of this MD&A.
Management approved the capital expenditure and production guidance contained herein as of the date of this MD&A. The purpose of the capital expenditure and production guidance is to assist readers in understanding the Company’s expected and targeted financial position and performance, and this information may not be appropriate for other purposes.
Forward-looking statements are based on the beliefs of the Company’s management, as well as on assumptions, which management believes to be reasonable based on information available at the time such statements were made. In addition to other assumptions set out herein, the forward-looking statements contained herein are based on the following assumptions: the ability and timing to integrate Connacher’s business and operations and realize the anticipated strategic, operational and financial benefits and synergies from the Acquisition; the quality of the integrated resource/assets meeting expectations; Greenfire’s ability to compete with other companies; the anticipated future financial or operating performance of the Company; the expected results of operations, including expectations regarding development at Pad 8; expectations that current trends and impacts may continue; assumptions as to future drilling results; assumptions as to costs and commodity prices; the timing and amount of funding required to execute the Company’s business plans; assumptions about future capital expenditures; the effect on the Company of any changes to existing or new legislation or policy or government regulation; the length of time required to obtain permits, certifications and approvals; the availability of labor; estimated budgets; assumptions about future interest and currency exchange rates; assumptions underlying Greenfire’s available corporate tax pools and applicable royalty rates; requirements for additional capital; the timing and possible outcome of regulatory and permitting matters; Greenfire’s ability to obtain all applicable regulatory approvals in connection with the operation of its business; goals; strategies; future growth and the adequacy of financial resources. However, by their nature, forward-looking statements are based on assumptions and involve known and unknown risks, uncertainties and other factors which may cause the actual results, performance or achievements to be materially different from any future results, performance or achievements expressed or implied by the forward-looking statements.
Greenfire Resources Ltd. | 2026 Q2 Management’s Discussion and Analysis | 22 |
Forward-looking statements are subject to a variety of risks, uncertainties and other factors which could cause actual results, performance or achievements to differ from those expressed or implied by the forward-looking statements, including, without limitation: delay or inability to integrate Greenfire’s and Connacher’s respective businesses and operations and realize the anticipated strategic, operational and financial benefits and synergies from the Acquisition; the quality of the integrated resource/assets failing to meet expectations; a decline in oil prices or widening of differentials between various crude oil prices; lower than expected reservoir performance, including, but not limited to: lower oil production rates; the inability to recognize continued or increased efficiencies from the Company’s production enhancement program and processing plant enhancements; reduced access to or an increase in the cost of diluent; an increase in the cost of natural gas or electricity; the reliability and maintenance of Greenfire’s facilities; equipment failures that result in a failure to achieve expected benefits of capital expenditure programs or result in reduced production or increased costs; supply chain disruption and risks of increased costs relating to inflation; the uncertainty of reserve estimates and estimates and projects relating to production, costs and expenses; uncertainties resulting from potential delays or changes in plans with respect to exploration or development projects or capital expenditures; the safety and reliability of pipelines and trucking services that transport Greenfire’s products; the need to drill additional wells; the cost to transport bitumen, diluent and bitumen blend, and the cost to dispose of certain by-products; the availability and cost of insurance and the inability to insure against certain types of losses; severe weather or catastrophic events such as fires, droughts, lightning, earthquakes, extreme cold weather, storms or explosions; seasonal weather patterns and the corresponding effects of the spring thaw on Greenfire’s properties; operational and financial risks associated with wildfires in Alberta; the availability of pipeline capacity and other transportation and storage facilities for the Company’s bitumen blend; the cost of chemicals used in Greenfire’s operations, including, but not limited to, in connection with water and/or oil treatment facilities; the availability of and access to drilling equipment and key personnel; risks of cybersecurity threats including the possibility of potential breakdown, invasion, virus, cyber-attack, cyber-fraud, security breach, and destruction or interruption of the Company’s information technology systems; Canadian heavy and light oil export capacity constraints and the resulting impact on realized pricing; the impact of global wars and conflicts on global stability including the impacts of the Russia-Ukraine war and the conflicts in the Middle East, commodity prices and the world economy, changes in the political landscape and/or legal, tax, royalty and regulatory regimes in Canada, and elsewhere; changes in applicable tariff rates; the cost of compliance with applicable regulatory regimes, including, but not limited to, environmental regulation and Government of Alberta production curtailments, if any; the ability to attract or access capital as a result of changing investor priorities and trends, including as a result of climate change, environmental, social and governance initiatives, the adoption of decarbonization policies and the general negative sentiment towards the oil and gas industry; hedging risks; variations in foreign exchange and interest rates; failure to accurately estimate abandonment and reclamation costs; the potential for management estimates and assumptions to be inaccurate; risks associated with acquisitions; and general economic, market and business conditions in Canada, the United States and globally.
The lists of risk factors set out in this MD&A or in the Company’s other public disclosure documents are not exhaustive of the factors that may affect any forward-looking statements of the Company. Forward-looking statements are statements about the future and are inherently uncertain. Actual results could differ materially from those projected in the forward-looking statements as a result of the matters set out in this MD&A generally and certain economic and business factors, some of which may be beyond the control of the Company. In addition, the global financial and credit markets have experienced significant debt and equity market and commodity price volatility which could have a particularly significant, detrimental and unpredictable effect on forward-looking statements. The Company does not intend, and does not assume any obligation, to update any forward-looking statements, other than as required by applicable law. For all of these reasons, the Company’s security holders should not place undue reliance on forward-looking statements.
You should carefully consider all of the risks and uncertainties described in the “Risk Factors” section of the Company’s 2025 AIF, which is also filed with the SEC under cover of Form 40-F, is available online at www.sedarplus.ca, www.sec.gov and on our website at www.greenfireres.com.
Greenfire Resources Ltd. | 2026 Q2 Management’s Discussion and Analysis | 23 |
ABBREVIATIONS
The following provides a summary of common abbreviations used in this document:
| AECO | Alberta natural gas price reference location |
| AER | Alberta Energy Regulator |
| bbl | barrel |
| bbls/d | barrels per day |
| $ or C$ | Canadian dollars |
| C5+ | Pentane and heavier natural gas liquids, commonly referred to as condensate or diluent. |
| EDC | Export Development Canada |
| G&A | General and administrative |
| GJ | Gigajoule |
| HE | Hangingstone Expansion Asset |
| IFRS | IFRS® Accounting Standards as issued by the International Accounting Standards Board |
| MD&A | Management’s Discussion and Analysis |
| NCG | Non-condensable gas |
| SAGD | Steam-Assisted Gravity Drainage |
| U.S. | United States |
| US$ | United States dollars |
| WCS | Western Canadian Select |
| WTI | West Texas Intermediate |
INITIAL PRODUCTION RATES
References in this MD&A to initial production rates, other short-term production rates or initial performance measures relating to new wells are useful in confirming the presence of hydrocarbons; however, such rates are not determinative of the rates at which such wells will commence production and decline thereafter and are not indicative of long-term performance or of ultimate recovery. While encouraging, readers are cautioned not to place reliance on such rates in calculating the aggregate production for the Company. Accordingly, the Company cautions that short-term initial results should be considered to be preliminary.
ADDITIONAL INFORMATION
Additional information relating to the Company is available on https://www.greenfireres.com and can also be found on a website maintained by the SEC at www.sec.gov and on Greenfire’s SEDAR+ profile at www.sedarplus.ca.
Greenfire Resources Ltd. | 2026 Q2 Management’s Discussion and Analysis | 24 |