recovered grades mainly from Block 7 and 8 Cut 2b and Block 5, further negatively impacted output. Gold production was also
adversely affected by the processing of increased volumes of lower-grade stock pile material. Gold production at Obuasi
marginally decreased by 3,000 ounces, or one percent, from 224,000 ounces in 2023 to 221,000 ounces in 2024. Gold
production was marginally lower year-on-year mainly due to a three percent decrease in treated grade, development delays,
supply challenges with slag-based binder for paste fill, poor ground conditions, and stope sterilisation in Block 10, partially
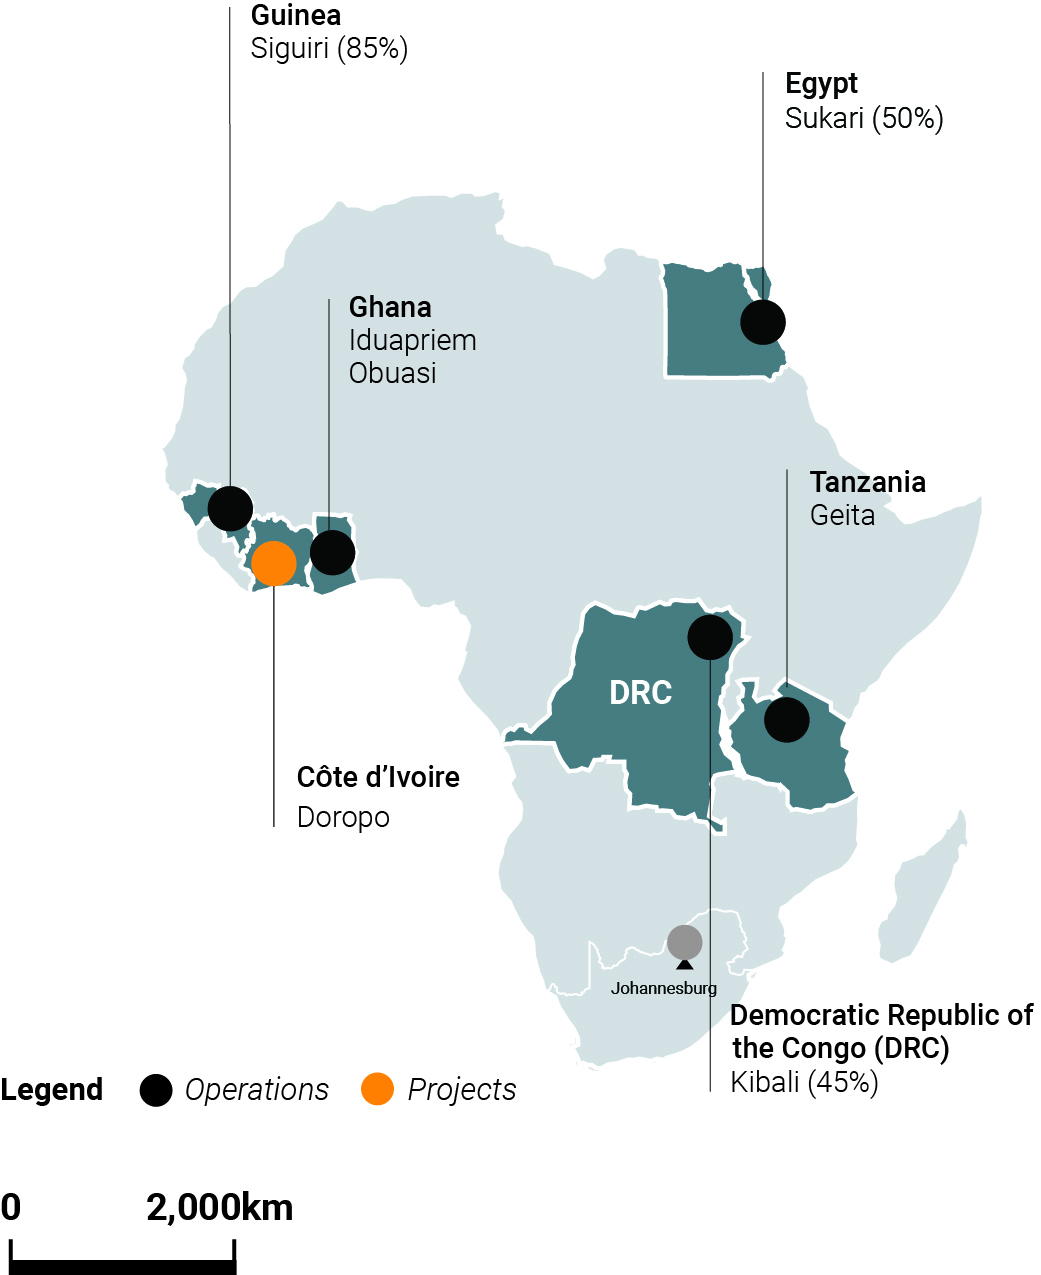
offset by a slight increase in tonnes treated. Gold production at Siguiri increased by 13,000 ounces, or five percent, from
260,000 ounces in 2023 to 273,000 ounces in 2024. Gold production increased year-on-year mainly due to improved
metallurgical recovery following the removal of Bidini carbonaceous material from the plant feed, partially offset by a reduction
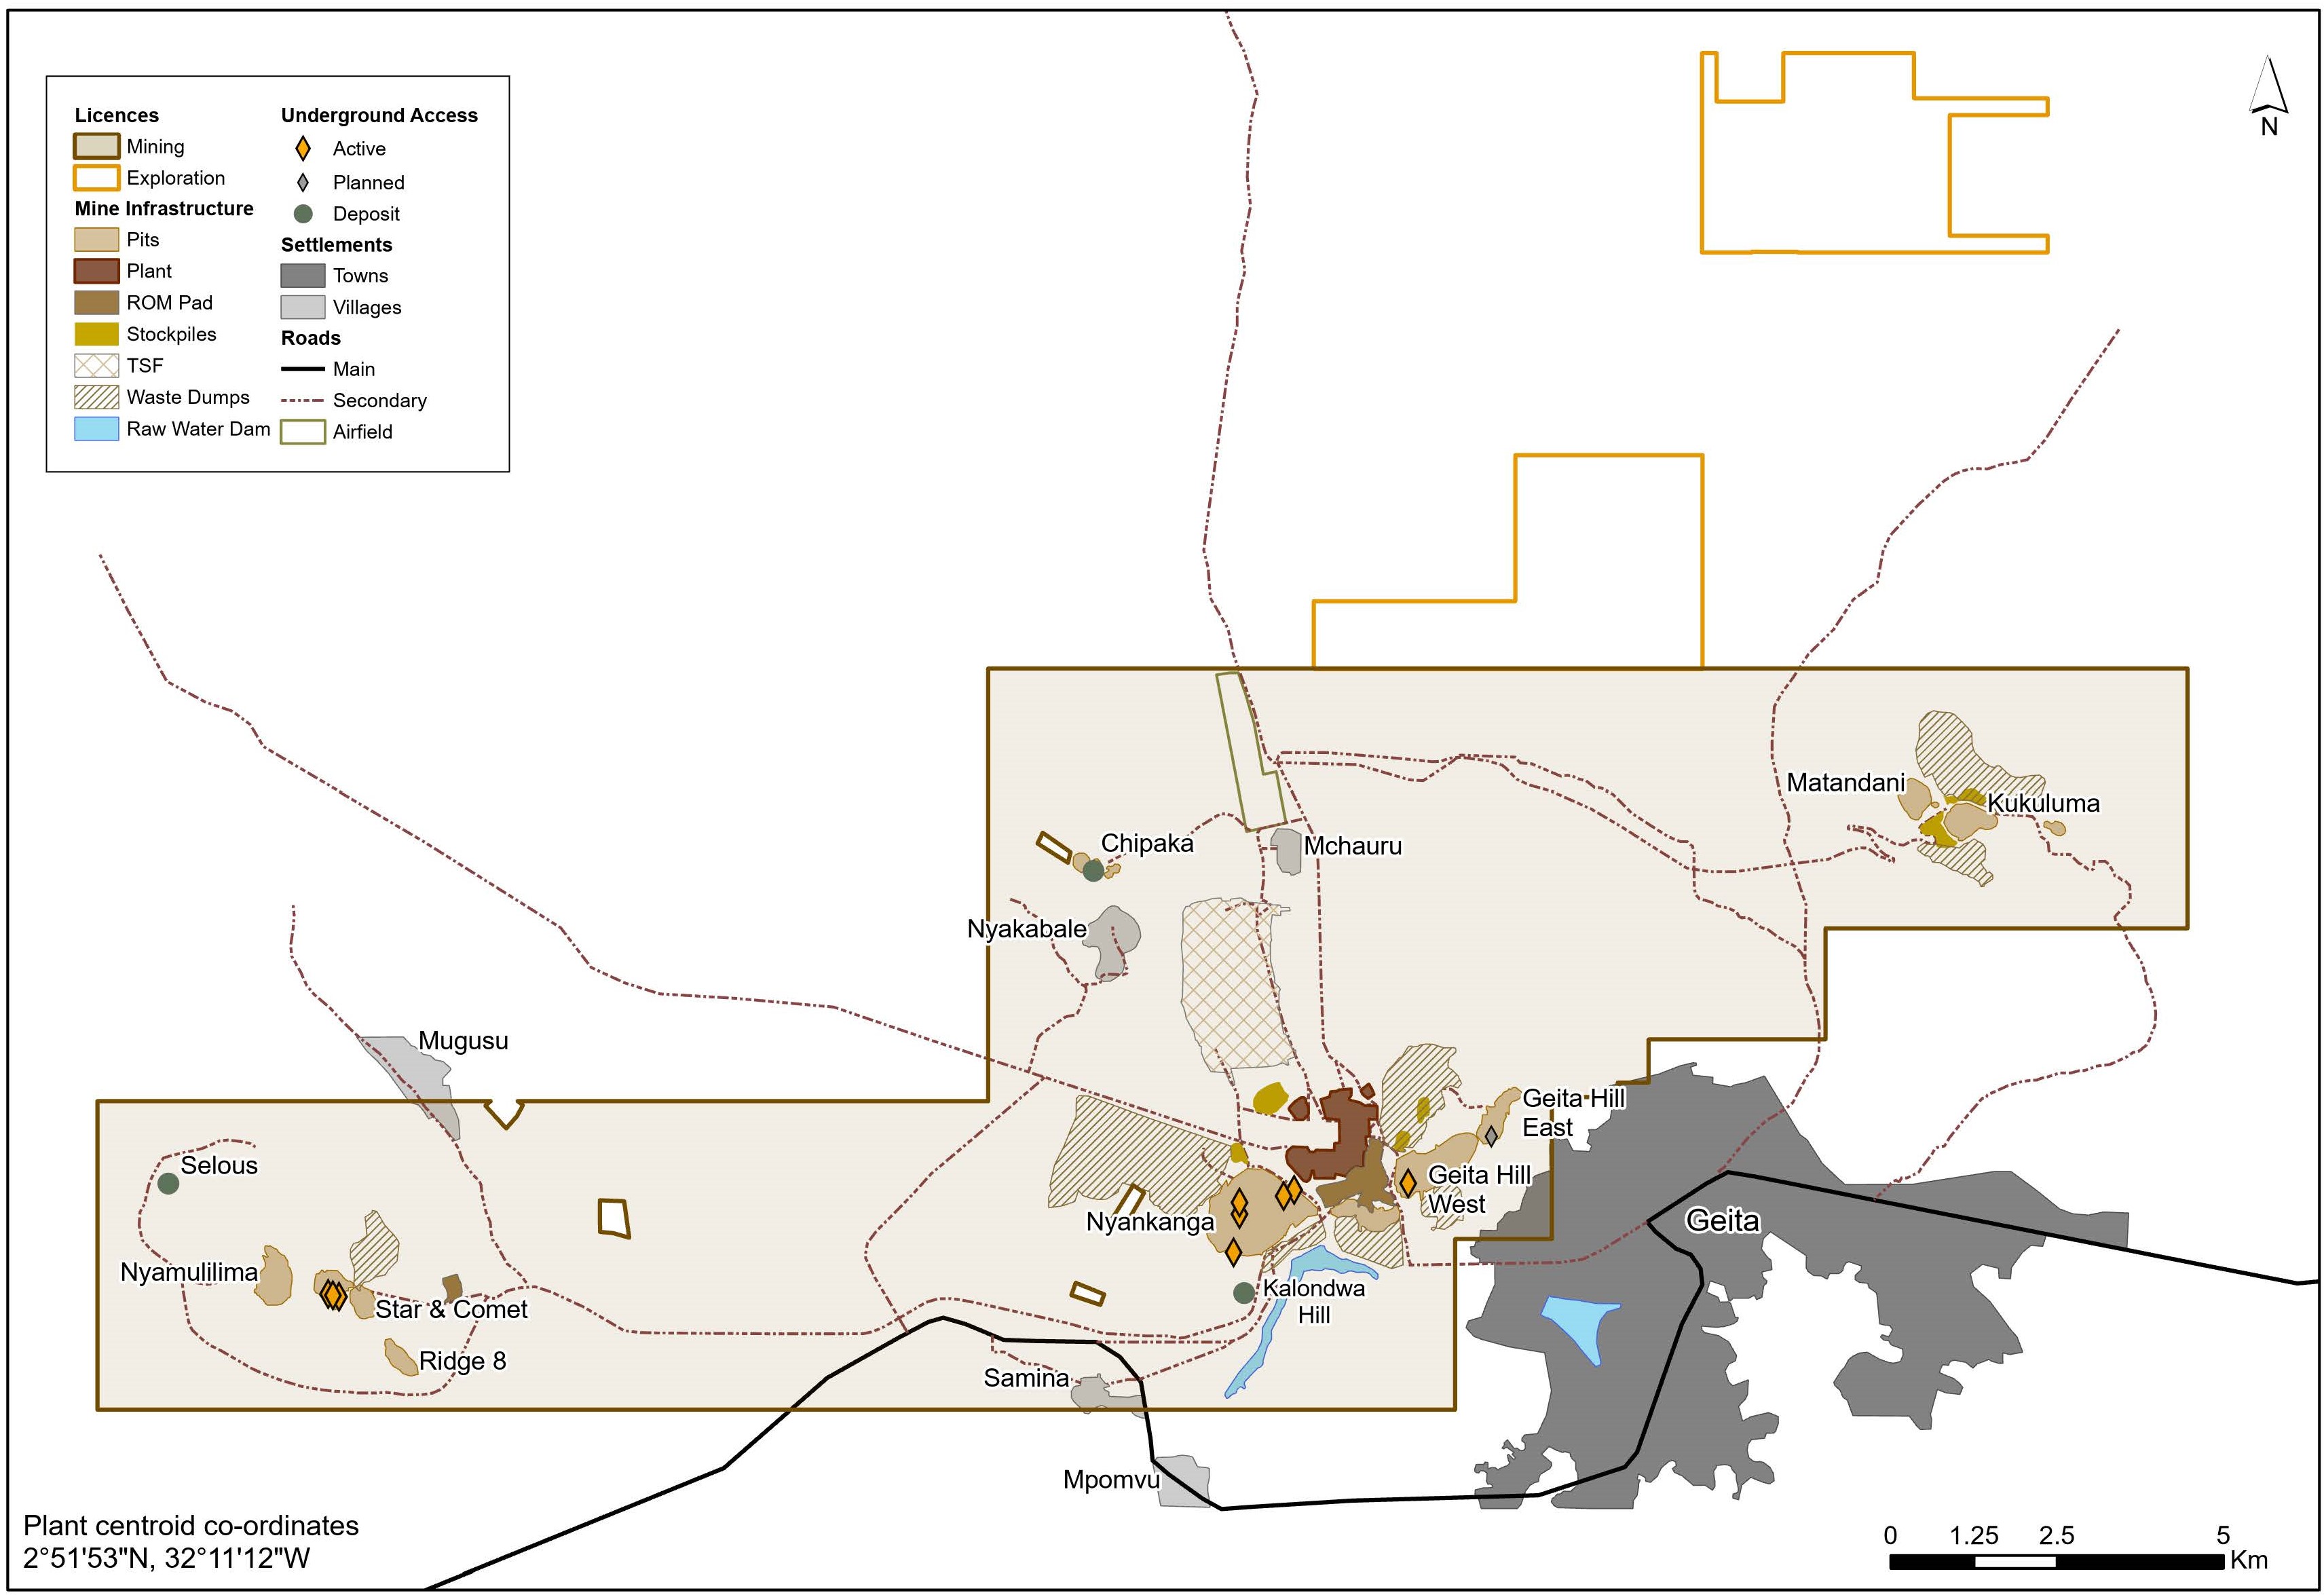
in head grade due to changes in the mining sequence. Gold production at Geita marginally decreased by 2,000 ounces, or
less than one percent, from 485,000 ounces in 2023 to 483,000 ounces in 2024, mainly due to minor mining and processing
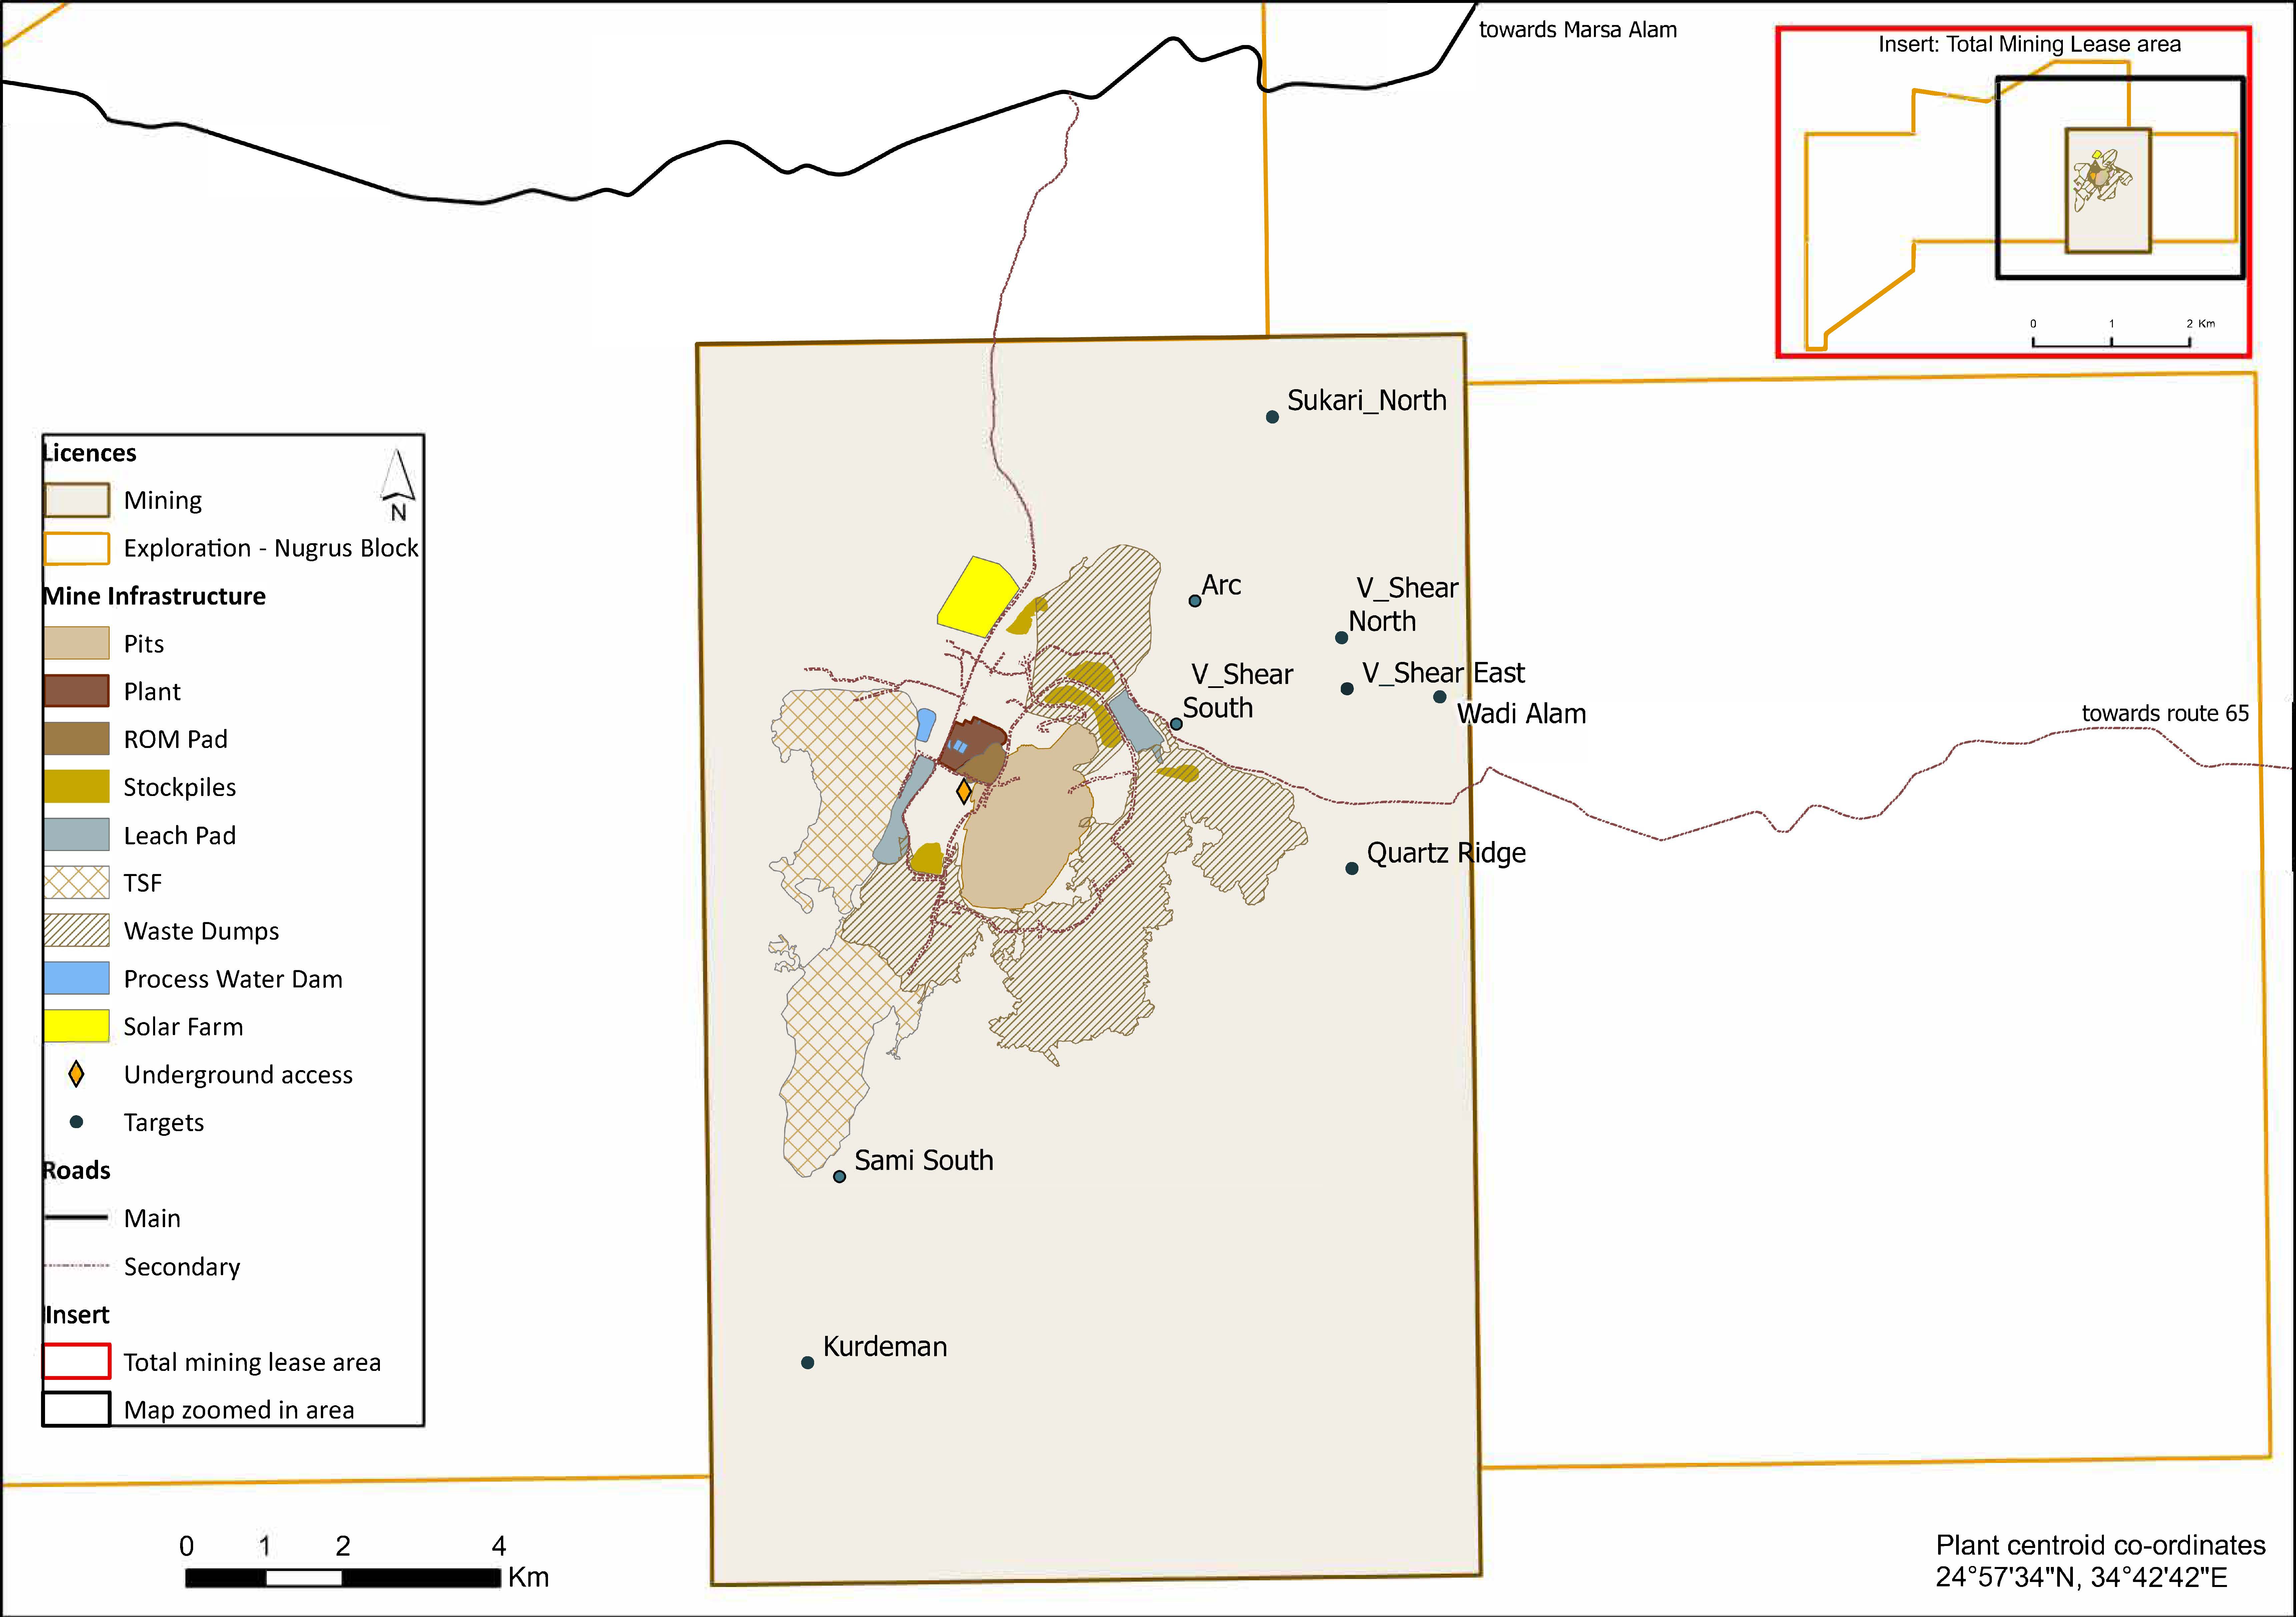
activity variances. Gold production at Sukari was 40,000 ounces in 2024 since its acquisition by the Company on 22 November
2024.
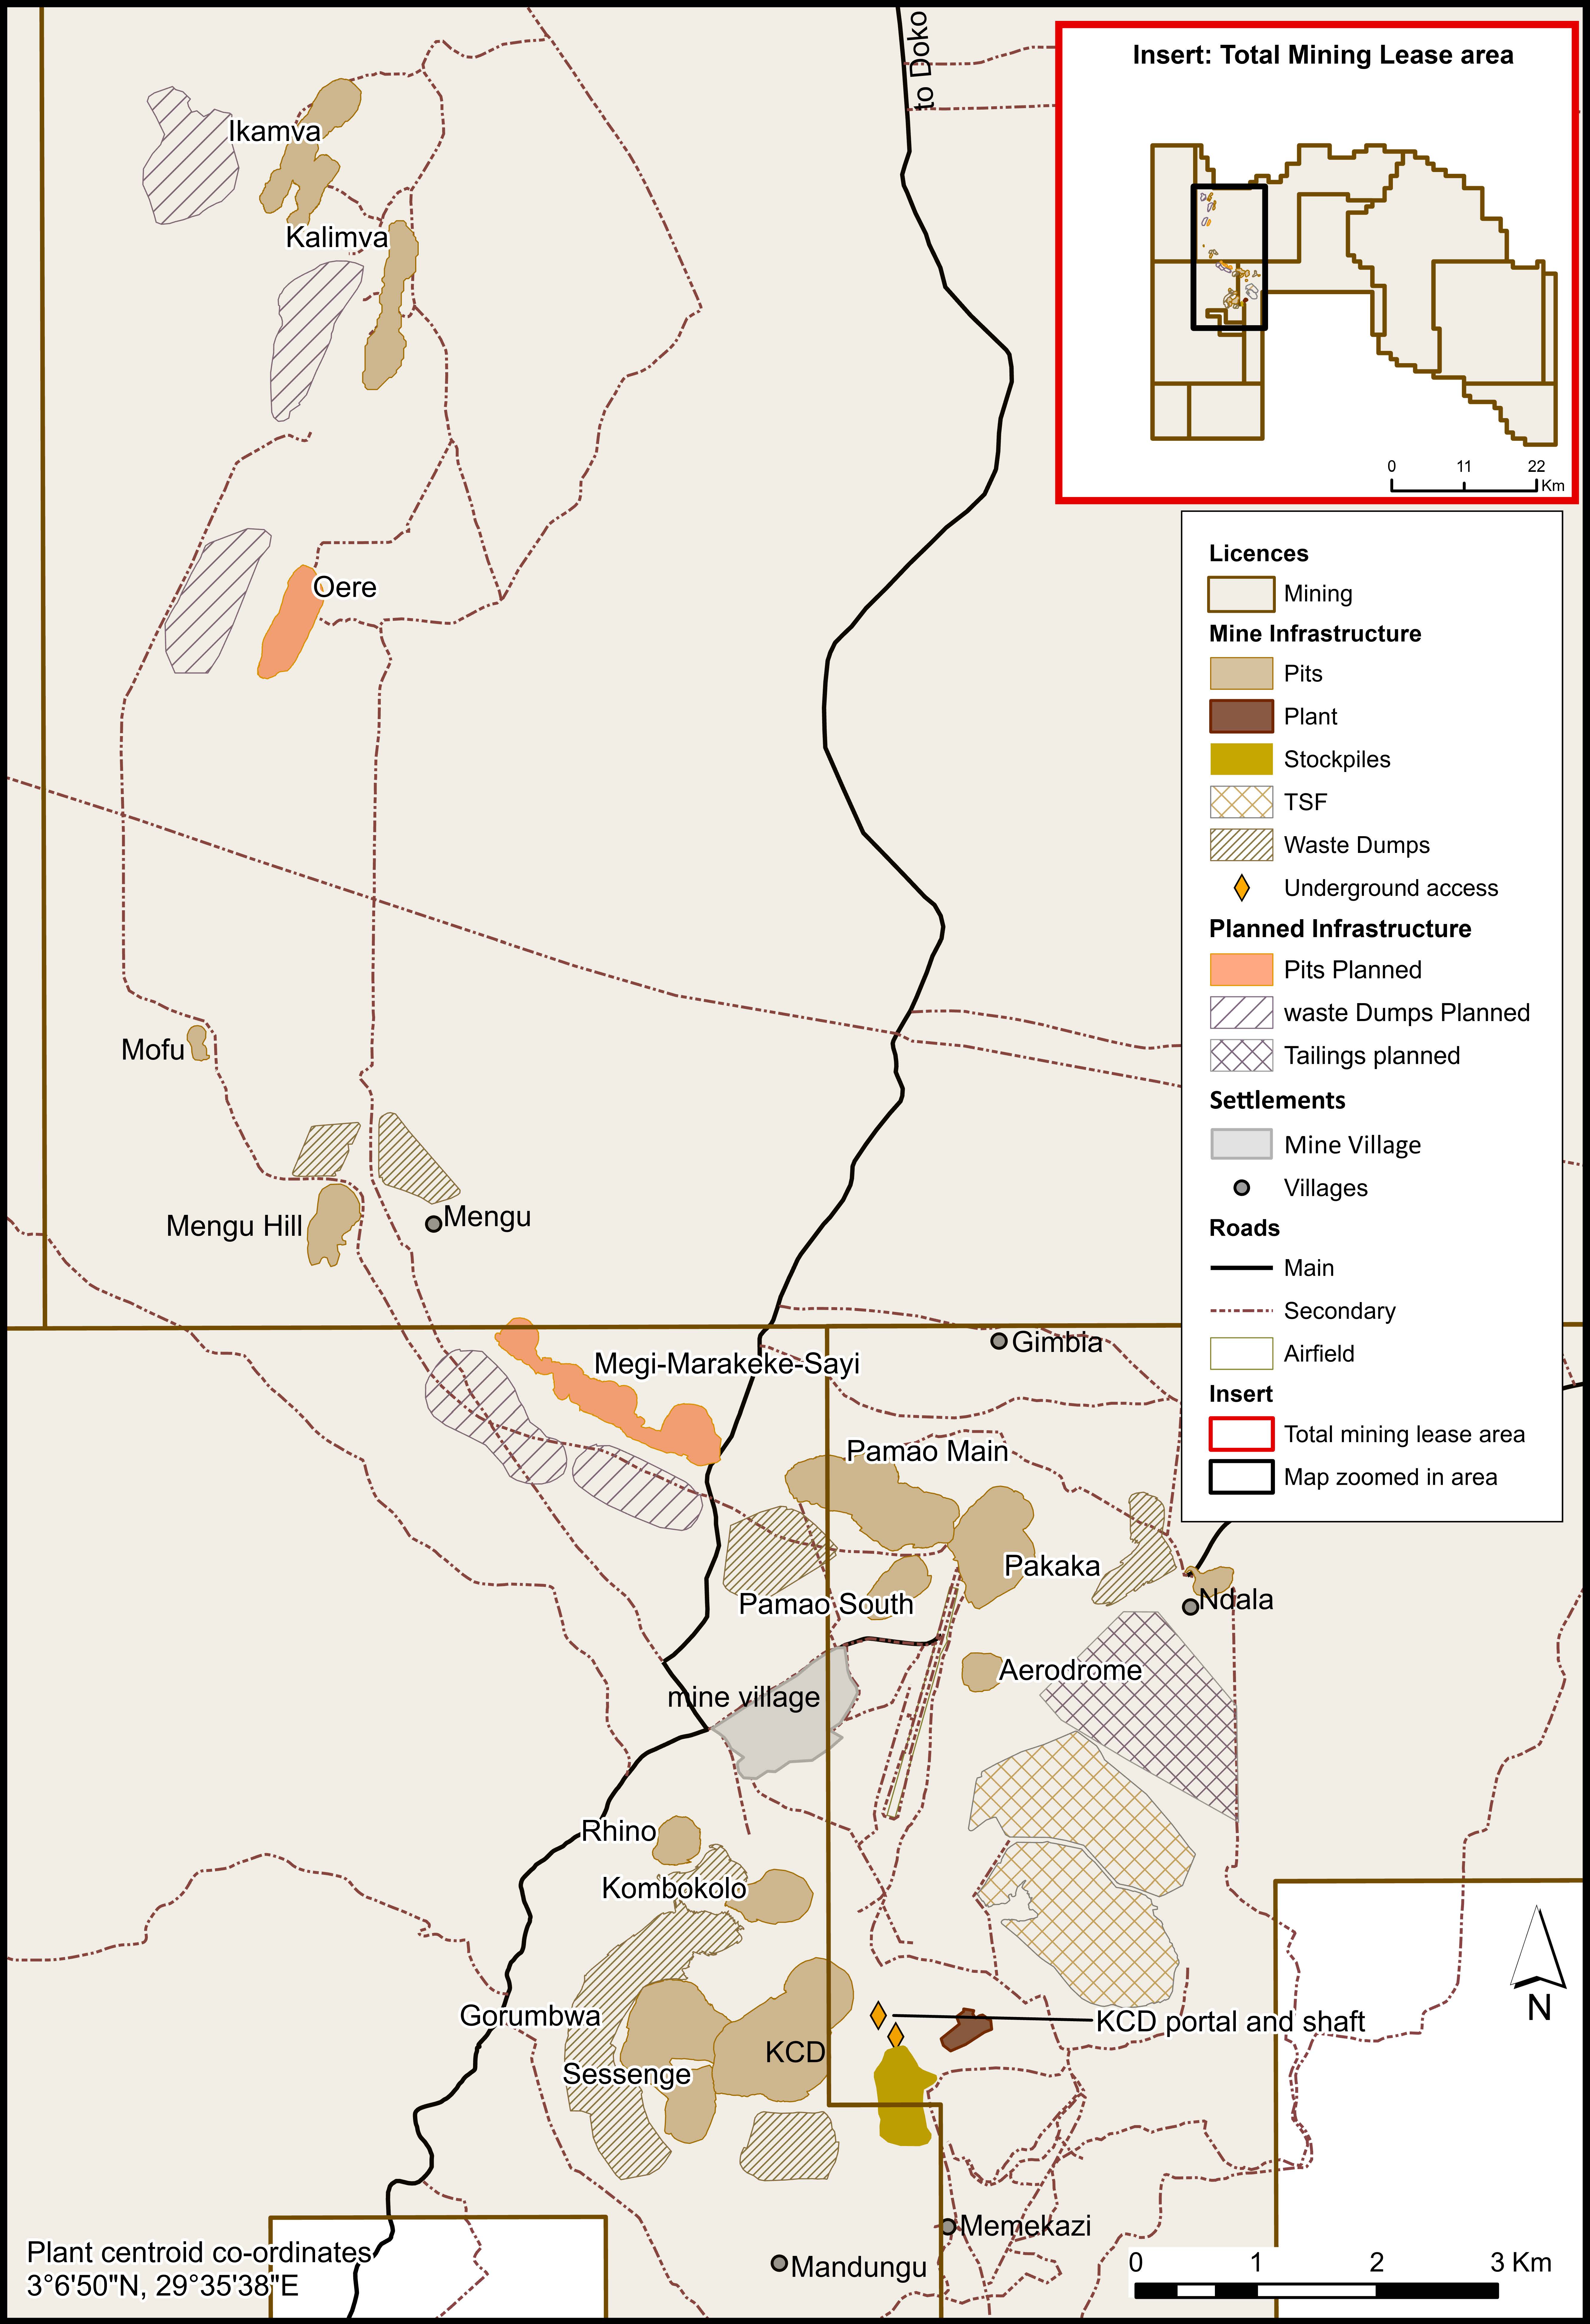
In the Africa region – non-managed joint ventures, gold production at Kibali (on an attributable basis) decreased by 34,000
ounces, or ten percent, from 343,000 ounces in 2023 to 309,000 ounces in 2024. Gold production was lower year-on-year
mainly due to lower recovered grades from open-pit areas mined, driven by operational challenges and high initial waste
stripping, partially offset by higher open-pit tonnes treated.
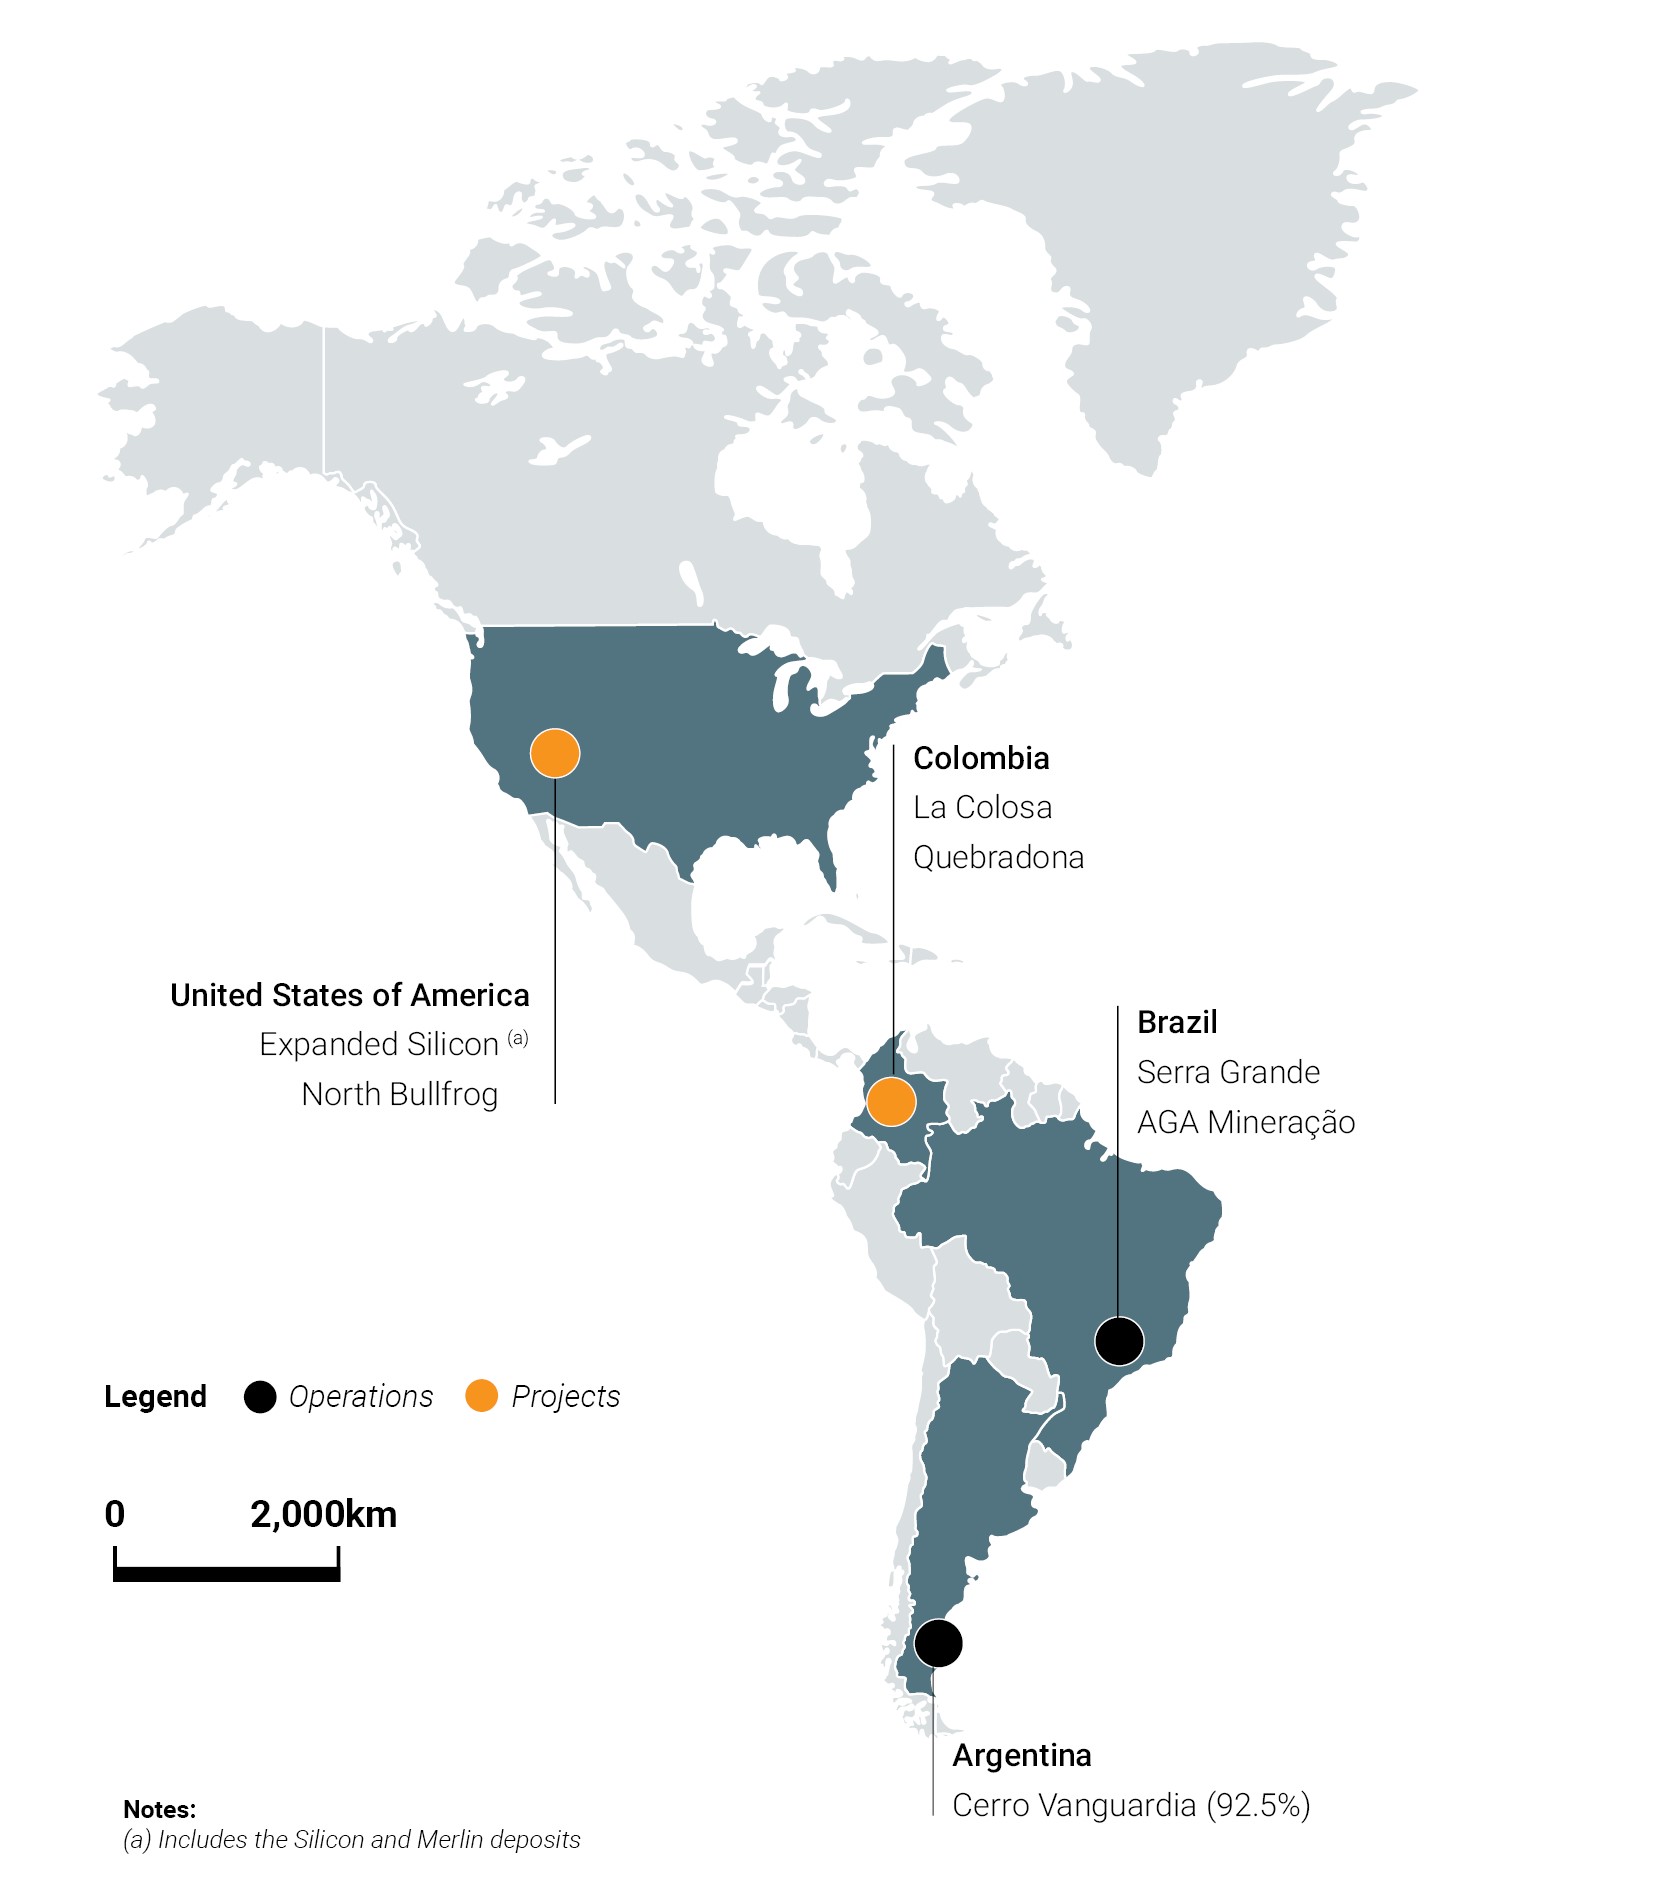
In the Americas region, gold production decreased by 18,000 ounces, or three percent, from 544,000 ounces (of which 42,000
ounces from CdS) in 2023 to 526,000 ounces in 2024 (of which nil ounces from CdS). This decrease was mainly due to lower
gold production from AGA Mineração and Serra Grande, partially offset by higher gold production from Cerro Vanguardia.
Excluding CdS, gold production in the Americas region increased by 24,000 ounces, or five percent, from 502,000 ounces in
2023 to 526,000 ounces in 2024. Gold production at AGA Mineração decreased by 23,000 ounces, or eight percent, from
294,000 ounces (of which 42,000 ounces from CdS) in 2023 to 271,000 ounces in 2024 (of which nil ounces from CdS).
Excluding CdS, gold production at AGA Mineração increased by 19,000 ounces, or eight percent, from 252,000 ounces in
2023 to 271,000 ounces in 2024. Gold production increased year-on-year mainly due to higher recovered grades at Cuiabá
despite a 12 percent reduction in ore-treated volumes. Improved mining performance and the implementation of Full Asset
Potential initiatives enhanced dilution control and recovery rates. Gold production at Cerro Vanguardia increased by 11,000
ounces, or seven percent, from 164,000 ounces in 2023 to 175,000 ounces in 2024. Gold production was higher year-on-year
mainly due to improved feed grades and better heap leach performance. Gold production at Serra Grande decreased by 6,000
ounces, or seven percent, from 86,000 ounces in 2023 to 80,000 ounces in 2024 mainly due to reduced tonnes processed,
partially offset by a slightly higher recovered grade.
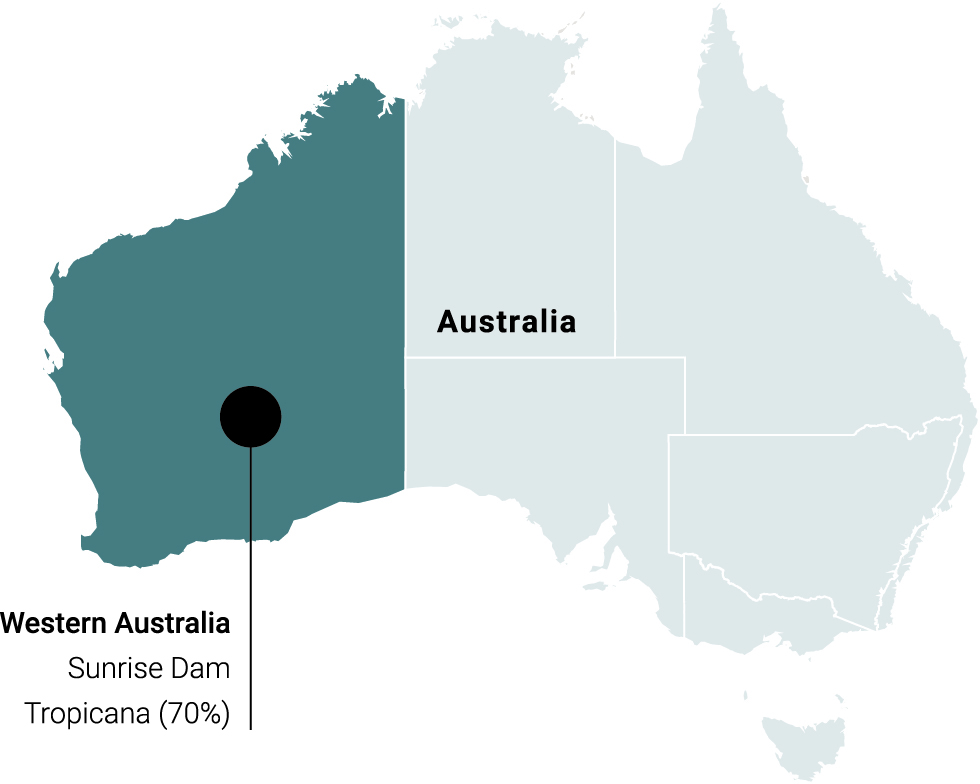
In the Australia region, gold production (on an attributable basis) marginally increased by 10,000 ounces, or two percent, from
562,000 ounces in 2023 to 572,000 ounces in 2024. This marginal increase was mainly due to higher gold production from
Sunrise Dam and Tropicana. The Australian assets continue their recovery from flooding which occurred towards the end of
the first quarter of 2024. Gold production at Sunrise Dam increased by 7,000 ounces, or three percent, from 252,000 ounces in
2023 to 259,000 ounces in 2024. Gold production was higher year-on-year mainly due to higher grades from the underground
mine and higher recoveries. Gold production at Tropicana (on an attributable basis) marginally increased by 3,000 ounces, or
one percent, from 310,000 ounces in 2023 to 313,000 ounces in 2024. Gold production was marginally higher year-on-year
mainly due to higher grades from the open pit and underground mines, partially offset by lower tonnes milled.
Comparison of gold production in 2023 with 2022
In 2023, gold production of managed operations was 2,343,000 ounces (of which 42,000 ounces from CdS), a decrease of
125,000 ounces, or five percent, compared with gold production of 2,468,000 ounces (of which 70,000 ounces from CdS) in
2022. Gold production was lower year-on-year mainly due to lower ore tonnes processed and lower recovered grades.
Excluding CdS, gold production of managed operations decreased by 97,000 ounces, or four percent, from 2,398,000 ounces
in 2022 to 2,301,000 ounces in 2023.
In 2023, gold production of non-managed joint ventures (on an attributable basis) was 343,000 ounces, a marginal increase of
6,000 ounces, or two percent, compared with gold production of 337,000 ounces in 2022. The Kibali mine in the DRC was the
only operating asset that was a non-managed joint venture in 2023 and 2022.
In the Africa region – managed operations, gold production decreased by 111,000 ounces, or eight percent, from 1,348,000
ounces in 2022 to 1,237,000 ounces in 2023. This decrease was mainly due to lower gold production from Siguiri, Geita and
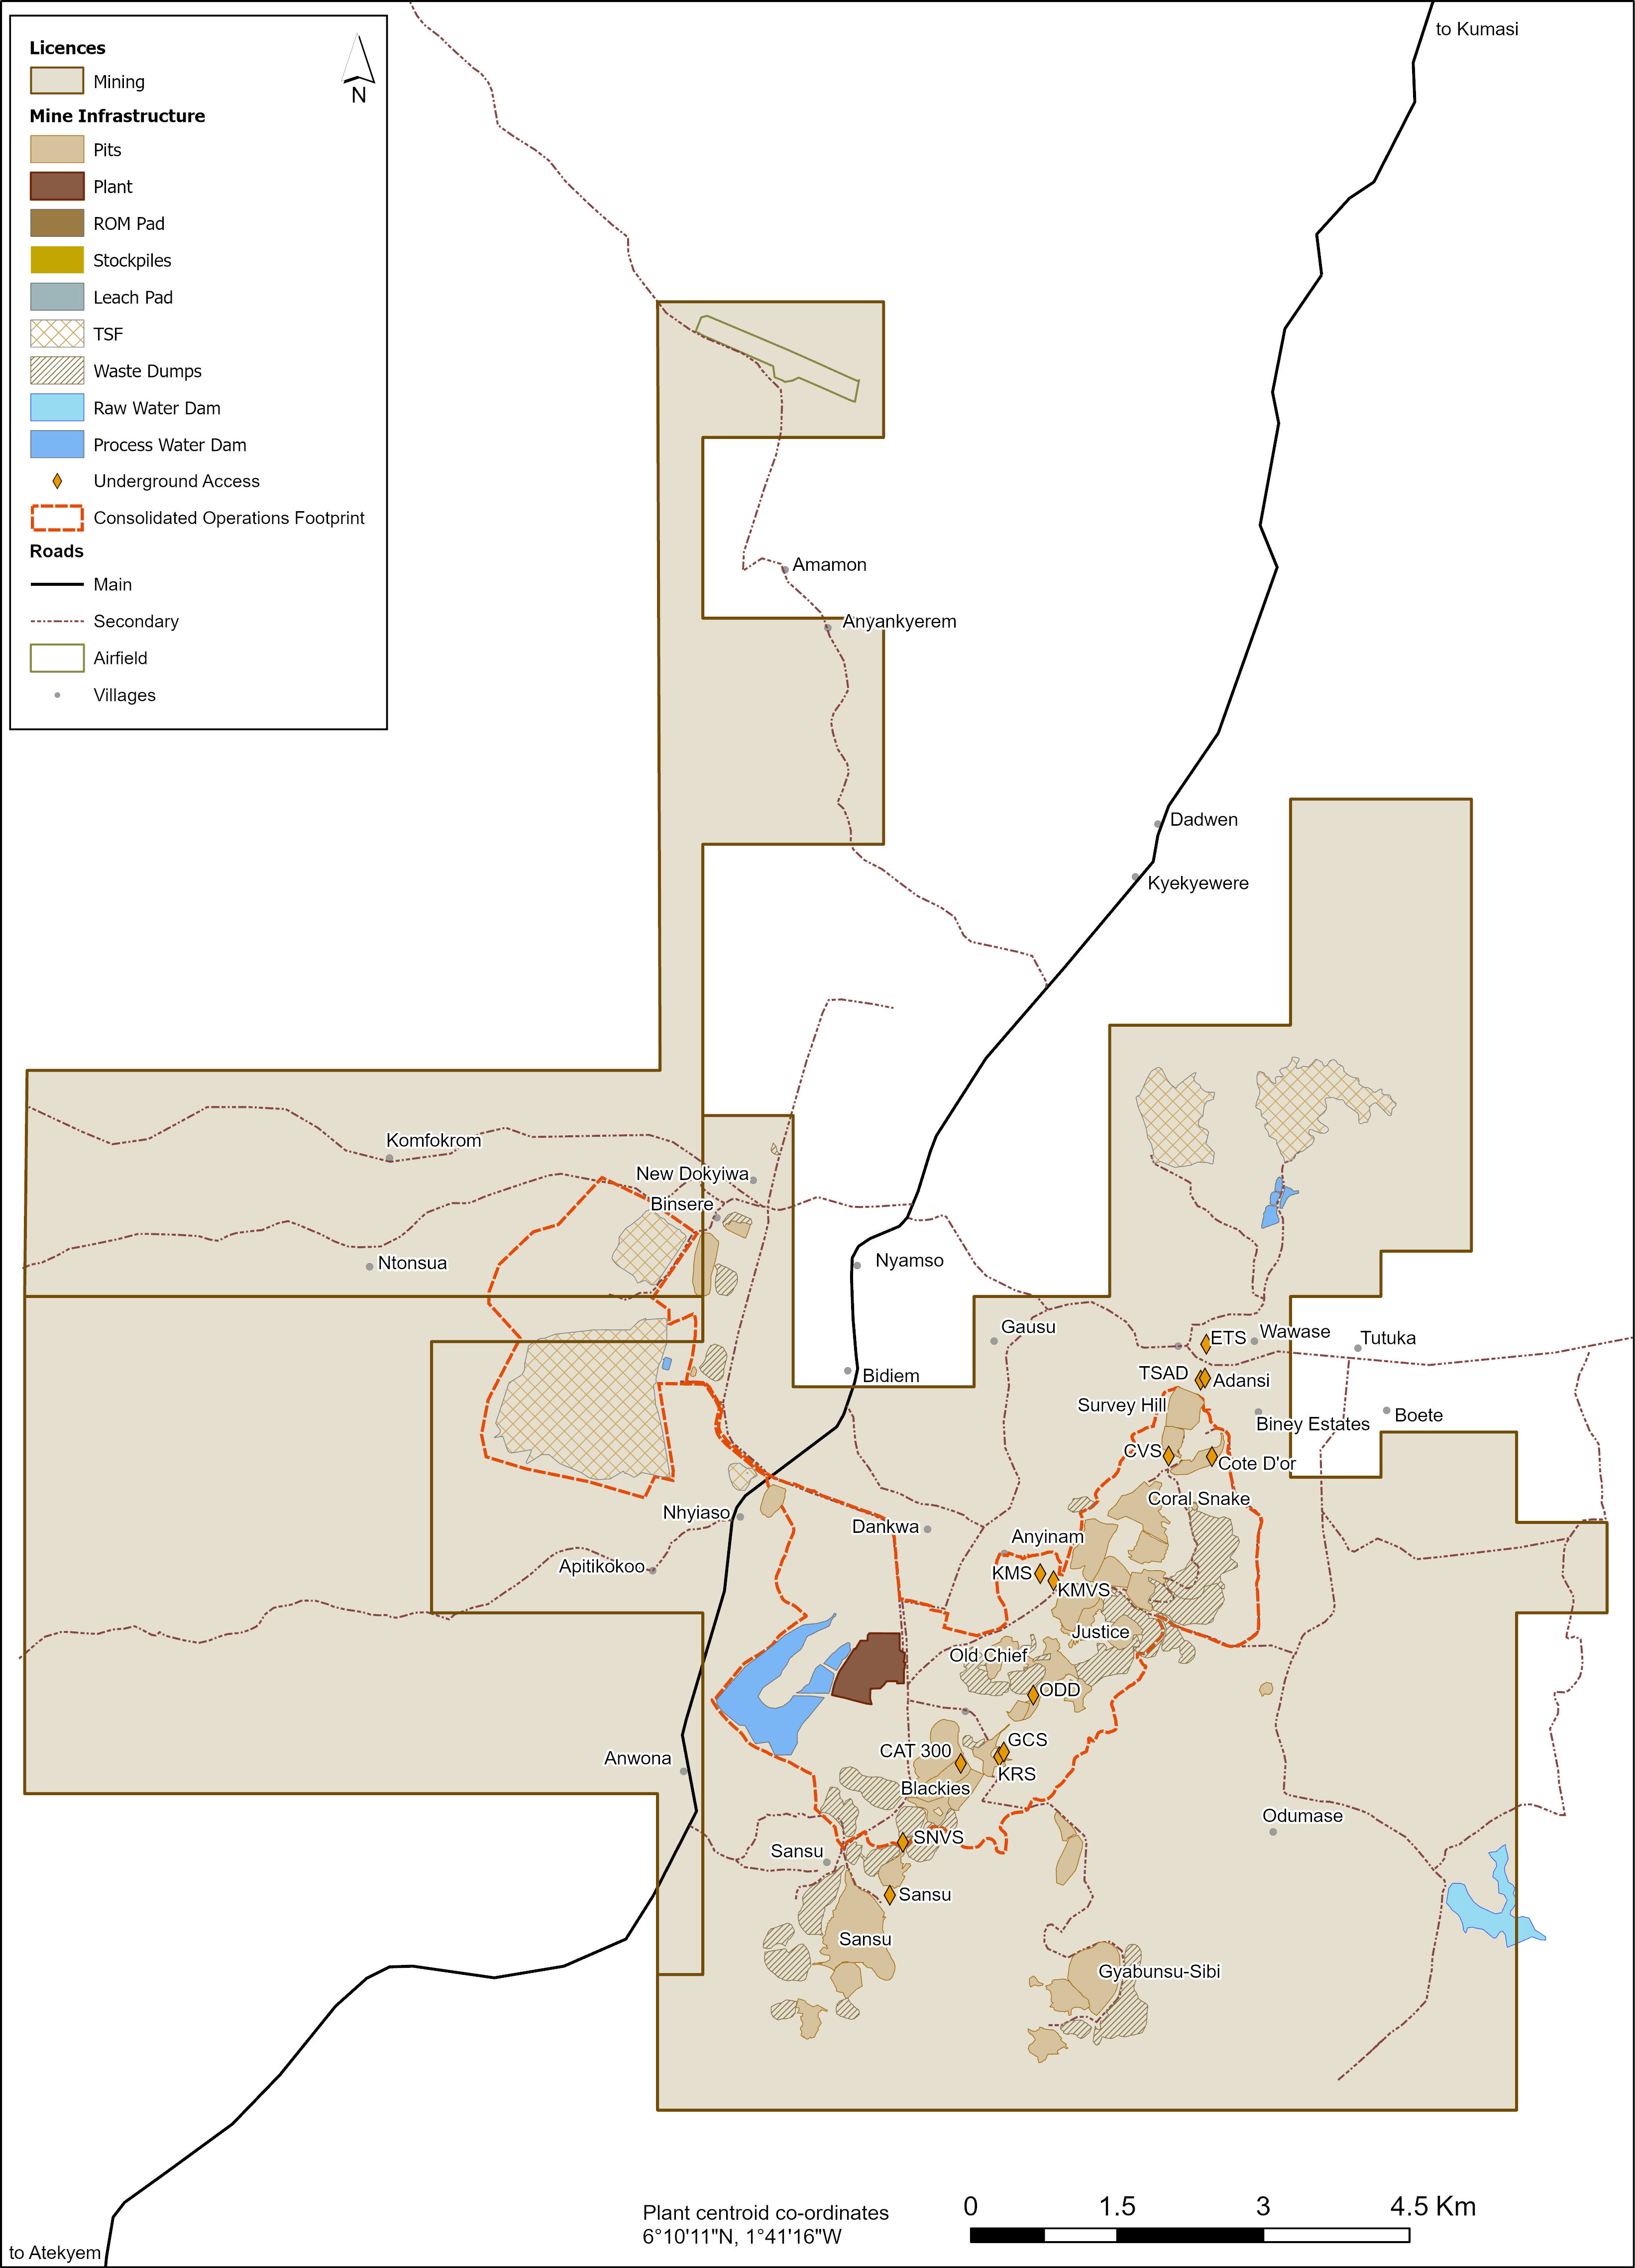
Obuasi, partially offset by higher gold production from Iduapriem. Gold production at Iduapriem increased by 20,000 ounces,
or eight percent, from 248,000 ounces in 2022 to 268,000 ounces in 2023. Gold production was higher year-on-year mainly
due to higher grades mined as the mine accessed higher grade ore tonnes from Teberebie Cut 2 compared to 2022, partially
offset by lower ore tonnes processed as the site commissioned the new TSF. Gold production at Obuasi decreased by 26,000
ounces, or ten percent, from 250,000 ounces in 2022 to 224,000 ounces in 2023. Gold production was lower year-on-year
mainly due to lower grades mined and poor ground conditions in some of the higher-grade stopes, partially offset by higher ore
tonnes processed. Obuasi was undertaking a trial of the underhand cut and fill mining method in high-grade areas. This is a
more selective mining method suited to challenging ground conditions often associated with higher grades. Gold production at