UNITED STATES
SECURITIES AND EXCHANGE COMMISSION
Washington, D.C. 20549
FORM 6-K
REPORT OF FOREIGN PRIVATE ISSUER
PURSUANT TO RULE 13a-16 OR 15d-16 UNDER
THE SECURITIES EXCHANGE ACT OF 1934
For the month of November 2025
Commission File Number: 001-41815
AngloGold Ashanti plc
(Translation of registrant’s name into English)
Third Floor, Hobhouse Court, Suffolk Street
London SW1Y 4HH
United Kingdom
6363 S. Fiddlers Green Circle, Suite 1000
Greenwood Village, CO 80111
United States of America
(Address of principal executive offices)
Indicate by check mark whether the registrant files or will file annual reports under cover of Form 20-F
or Form 40-F.
Form 20-F ☒ Form 40-F ☐
Enclosure: AngloGold Ashanti Earnings Release for the Three Months and Nine Months Ended
30 September 2025
Q3 2025 EARNINGS RELEASE | 2 |  | |||
AngloGold Ashanti posts strong Q3 2025 YoY: • Gold production +17% • Total cash costs* flat in real terms • Adjusted EBITDA* +109% to $1.6bn • Free cash flow* +141% to $920m • Adjusted net cash* of $450m • Q3 interim dividend of $460m, or 91cps • Total dividends declared for 9 months YTD of $927m, or 183.5cps |
London, Denver, Johannesburg, 11 November 2025 –
AngloGold Ashanti plc’s(2) (“AngloGold Ashanti”, “AGA”, the
“Company” or the “Group”) third quarter free cash flow* rose
141% year-on-year to a record $920m as continued cost
discipline helped capture the benefits of a higher gold price.
A quarterly dividend of $460m was declared, taking
dividends declared this year to $927m.
Annual guidance for 2025 was reaffirmed.
Group(1)(2)(3) gold production rose 17% in Q3 2025 compared
to Q3 2024. Strong contributions were made by Obuasi
(Ghana), Geita (Tanzania), Cuiabá (Brazil), Kibali (DRC) and
the addition of Sukari(2) (Egypt) to our portfolio. The average
gold price received per ounce*(6) increased to $3,490/oz in
Q3 2025, from $2,486/oz in Q3 2024.
“This is another record quarter for cash generation and
another healthy dividend declaration,” said CEO Alberto
Calderon. “Cash costs again stayed flat in real terms, which
means we can capture these stronger margins and show
capital discipline by passing the benefit on to shareholders.”
A 40% increase in the average gold price received per
ounce*(6) in Q3 2025 compared to Q3 2024 translated into a
94% rise in cash generated from operations, reflecting
strong price pass-through and cost discipline.
Balance sheet strengthened by earnings and cash
flow
Free cash flow*(5) rose to $920m in Q3 2025, from $381m in
Q3 2024. AngloGold Ashanti has continued to strengthen its
balance sheet, moving from an Adjusted net debt* position
into an Adjusted net cash* position of $450m at 30
September 2025. The Group ended Q3 2025 with liquidity of
$3.9bn, including $2.5bn in cash and cash equivalents.
Adjusted EBITDA* increased 109% year-on-year to $1.6bn
in Q3 2025, from $746m in Q3 2024. Headline earnings(4)
rose to $672m, or $1.32 per share, in Q3 2025, compared to
$236m, or $0.56 per share, in Q3 2024 — an increase of
185% and 136% year-on-year, respectively. Net cash flow
from operations rose 134% to $1.4bn in Q3 2025, from
$606m in Q3 2024, boosting free cash flow* for the quarter.
Dividend demonstrates confidence, strong cash
flow
An interim dividend of 91 US cents per share was declared
for Q3 2025, which includes the minimum quarterly dividend
of $63m or 12.5 US cents, with the balance reflecting the
decision to pay half of free cash flow* generated for the three
months ended 30 September 2025. While AngloGold
Ashanti’s dividend policy commits to this ‘true up’ payment to
50% of free cash flow* annually at year-end, the Board used
its discretion to make the payment at the quarter given the
strength of cash flows and its confidence in the outlook for
the balance of the year.
The Company maintained its strong safety performance, with
a Total Recordable Injury Frequency Rate (“TRIFR”) of 0.96
injuries per million hours worked in Q3 2025, well below
industry benchmarks.
Momentum continued at managed operations(1)
Gold production for the Group(1)(2)(3) increased by 17% year-
on-year to 768,000oz in Q3 2025, up from 657,000oz in Q3
2024. This growth reflects the contribution from Sukari and
improved performances at key assets, including Obuasi
(+30%), Kibali (+21%), Geita (+6%), and Cuiabá (+6%).
Managed operations(1) saw gold production up 16% year-on-
year to 682,000oz in Q3 2025, compared to 586,000oz in Q3
2024. The increase, driven by Sukari’s inclusion and the
continued ramp-up at Obuasi, was partially offset by lower
output from Australia and Siguiri. Non-managed joint
ventures(1), namely Kibali, recorded a year-on-year increase
in gold production to 86,000oz in Q3 2025 from 71,000oz in
Q3 2024 mainly due to higher grades mined.
Production improvements were led by Obuasi, with a
growing contribution from underhand drift-and-fill mining
(“UHDF”) and a 23% year-on-year increase in recovered
grade. Sukari posted another strong result, with the third
consecutive quarterly production increase. Gold production
at Cerro Vanguardia, Iduapriem and Serra Grande remained
largely unchanged year-on-year.
The focus on operational discipline and efficiencies was
evident once again, with total cash costs* flat in real terms,
year-on-year in Q3 2025. The inflation rate experienced
across the business in Q3 2025 was approximately 5%.
Total cash costs* for the Group(1)(2) increased by 5% year-on-
year to $1,225/oz in Q3 2025 from $1,172/oz in Q3 2024 as
the Full Asset Potential programme, operational excellence
and the addition of Sukari to the portfolio partly offset market
driven factors of inflation and higher gold price royalty
payments. All-in sustaining costs* (“AISC”) rose 6% to
$1,720/oz in Q3 2025, from $1,616/oz in Q3 2024.
For managed operations(1), total cash costs* rose 5% year-
on-year to $1,244/oz in Q3 2025 from $1,186/oz in Q3 2024,
while AISC* rose 6% to $1,766/oz in Q3 2025 from $1,665/
oz in Q3 2024. These increases were mainly driven by a
20% increase in sustaining capital expenditure* and
continued inflationary cost pressures of approximately 5%
Q3 2025 EARNINGS RELEASE | 3 | | |||
 | ||||||
2025 I GROUP PERFORMANCE | ||||||
CONTINUED
mainly driven by increases in labour and mining contractor
costs. More than half of this AISC increase came from a $56/
oz average jump in the overall Group royalty charge linked to
the higher gold price.
Total cash costs* for the managed operations(1) increased by
3% year-on-year to $1,233/oz in year-to-date (“YTD”) Sep
2025 from $1,195/oz in YTD Sep 2024, significantly below
the inflation rate of approximately 4% in YTD Sep 2025.
Total capital expenditure for the Group(1)(2) rose in line with
plan to $388m in Q3 2025, up 32% year-on-year from Q3
2024, with sustaining capital expenditure* increasing 24%
year-on-year to $281m. The increase in sustaining capital
expenditure* reflects the first-time inclusion of Sukari ($32m)
and ongoing investment to support asset integrity and long-
term operational resilience, in line with strategic priorities.
Reinvesting in the portfolio
As part of the strategy to further unlock shareholder value,
the Company is reinvesting in the growth of its Mineral
Reserve base and enhancing operational flexibility. Over the
next three years, targeted spending will be directed towards
exploration, Mineral Reserve Development, and the
conversion of Mineral Resource to Mineral Reserve at sites
with high geological potential.
At the tier one Geita Gold Mine in Tanzania, this investment
strategy is already underway, with additional capital
expenditure already approved this year, and ongoing
investment for the next three years is expected to increase
the Mineral Reserve by approximately 60% and to extend
life-of-mine to 10 years or more at current production rates of
about 500,000oz a year.
In addition, a conceptual study showing potential for a 1.0Mt
per annum mill expansion could underpin an increase in
production to about 600,000oz a year for at least a decade.
A detailed feasibility study into this project is now underway,
and is expected to be completed by 2027.
Augusta transaction complete
AngloGold Ashanti has further consolidated the Beatty
District in Nevada and, on 23 October 2025, concluded the
acquisition of Augusta Gold Corp., strengthening its position
in one of the most significant emerging gold districts in the
United States. This transaction enhances the Company’s
ability to develop the region under a unified regional plan.
Reaffirming guidance
Full-year 2025 guidance remains unchanged.
(1)The term “managed operations” refers to subsidiaries managed by
AngloGold Ashanti and included in its consolidated reporting, while the
term “non-managed joint ventures” (i.e., Kibali) refers to equity-accounted
joint ventures that are reported based on AngloGold Ashanti's share of
attributable earnings and are not managed by AngloGold Ashanti.
Managed operations are reported on a consolidated basis. Non-managed
joint ventures are reported on an attributable basis.
(2)On 22 November 2024, the acquisition of Centamin plc (“Centamin”) was
successfully completed. Centamin has been included from the effective
date of the acquisition.
(3)Includes gold concentrate from the Cuiabá mine sold to third parties.
(4)The financial measures “headline earnings (loss)” and “headline earnings
(loss) per share” are not calculated in accordance with IFRS® Accounting
Standards, but in accordance with the Headline Earnings Circular 1/2023,
issued by the South African Institute of Chartered Accountants (SAICA),
at the request of the Johannesburg Stock Exchange Limited (JSE). These
measures are required to be disclosed by the JSE Listings Requirements
and therefore do not constitute Non-GAAP financial measures for
purposes of the rules and regulations of the US Securities and Exchange
Commission (“SEC”) applicable to the use and disclosure of Non-GAAP
financial measures.
(5)To enhance comparability with industry peers, AngloGold Ashanti has
revised its definition of free cash flow*, which is a Non-GAAP financial
measure. Pursuant to its revised definition, free cash flow* is calculated
as operating cash flow less capital expenditure. Operating cash flow is
defined as net cash flow from operating activities, plus repayment of
loans advanced to joint ventures, less dividends paid to non-controlling
interests (i.e., dividends paid to non-controlling interests in Sukari (50%),
Siguiri (15%) and Cerro Vanguardia (7.5%)). Free cash flow* figures for
prior periods (including Q3 2024 and YTD Sep 2024) have been adjusted
to reflect this change in reporting.
(6)The average gold price received per ounce* for Q3 2024 and YTD Sep
2024 has been restated to be based on the gold revenue from primary
operating activities. Previously, the gold price received per ounce
calculation included revenue from normal operating activities as well as
hedging activities.
*Refer to “Non-GAAP disclosure” for definitions and reconciliations.
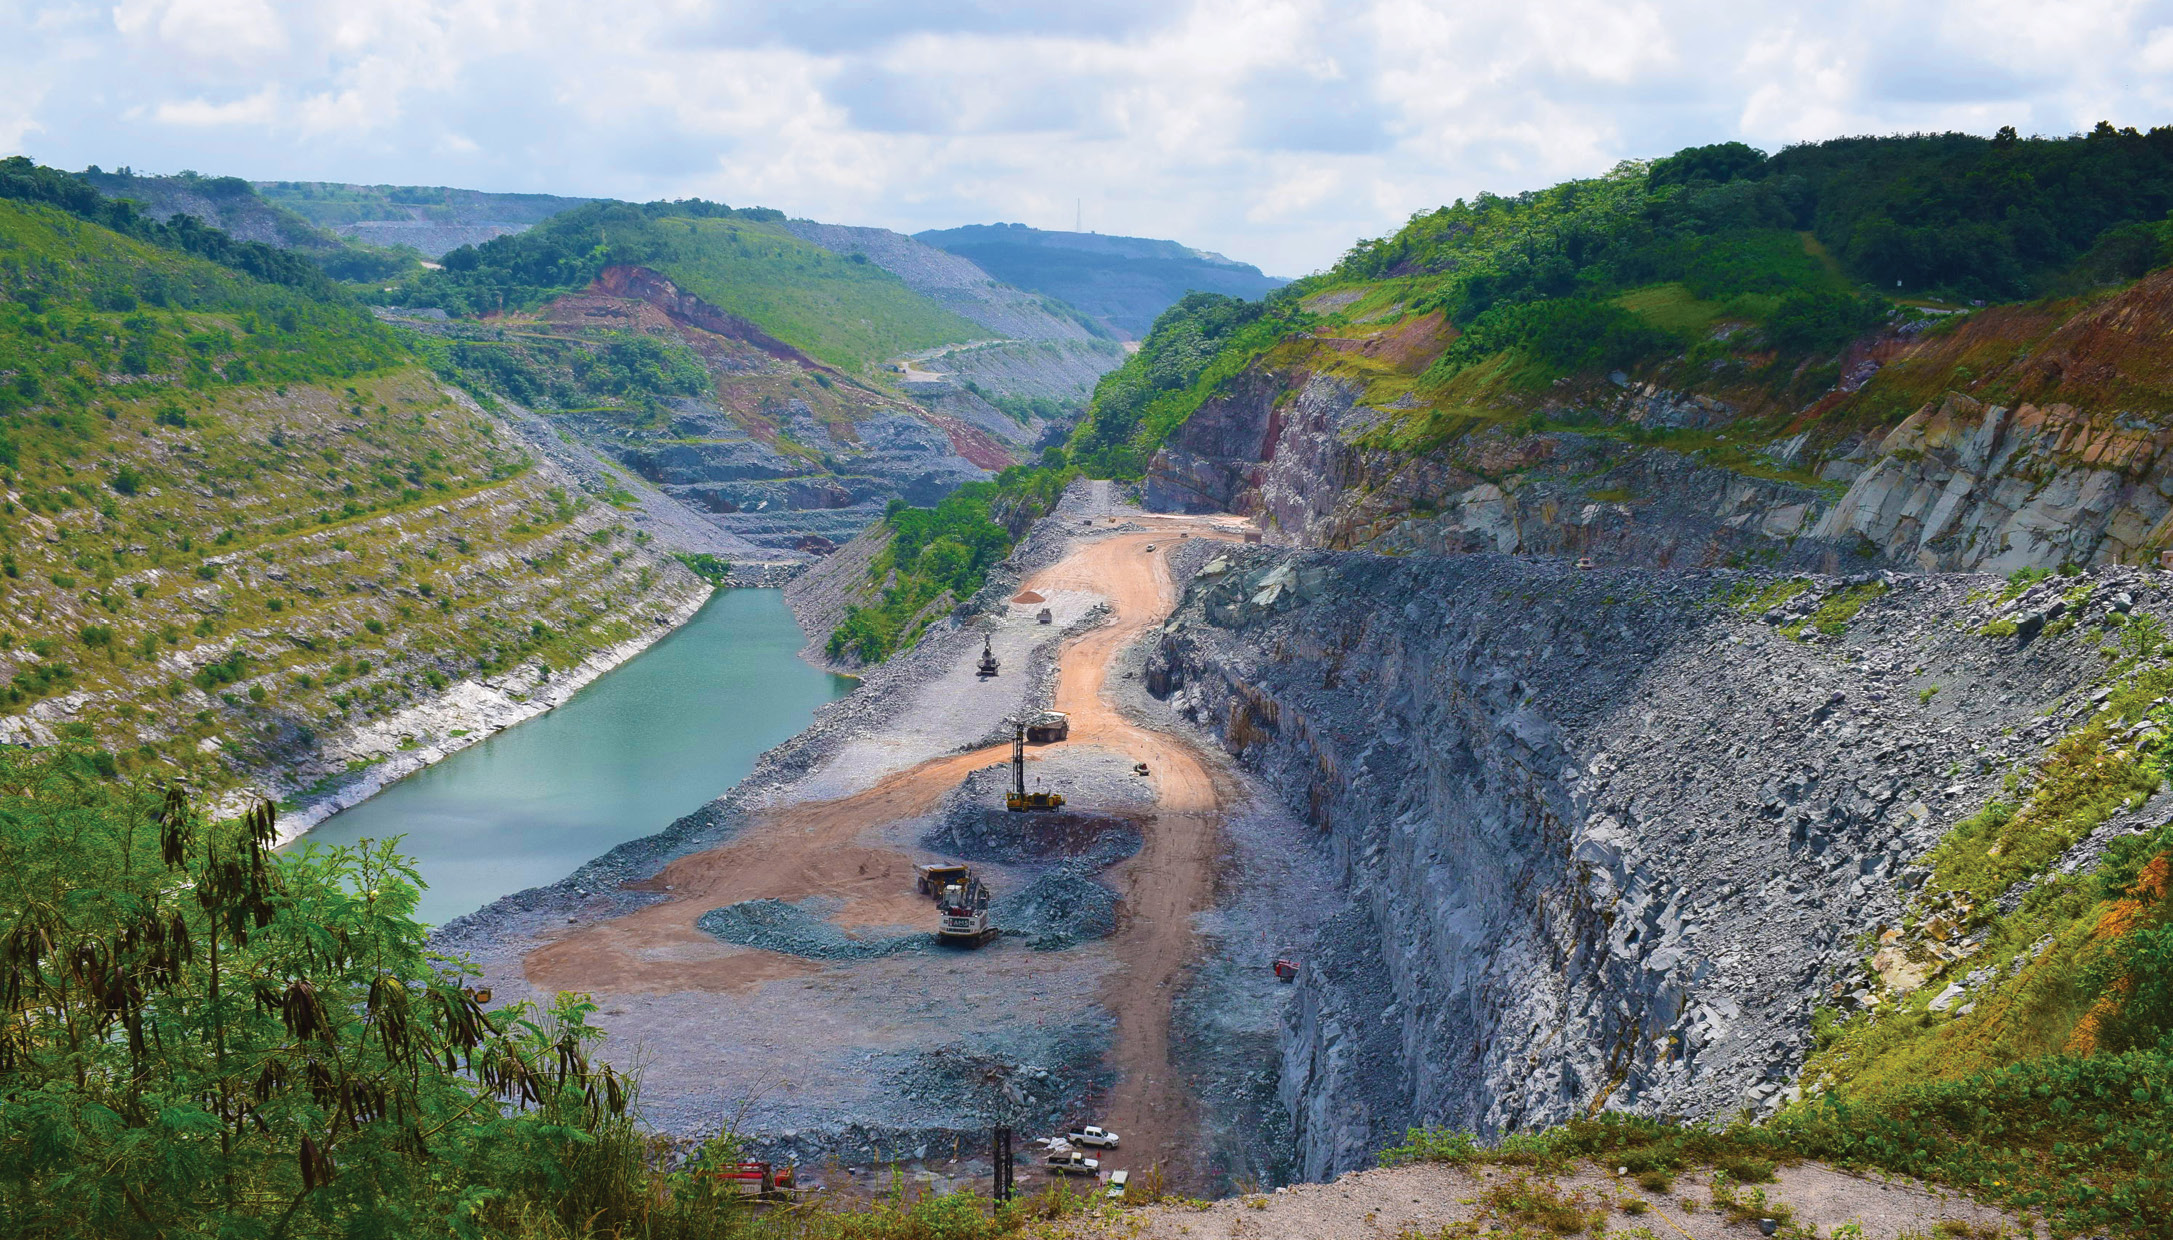
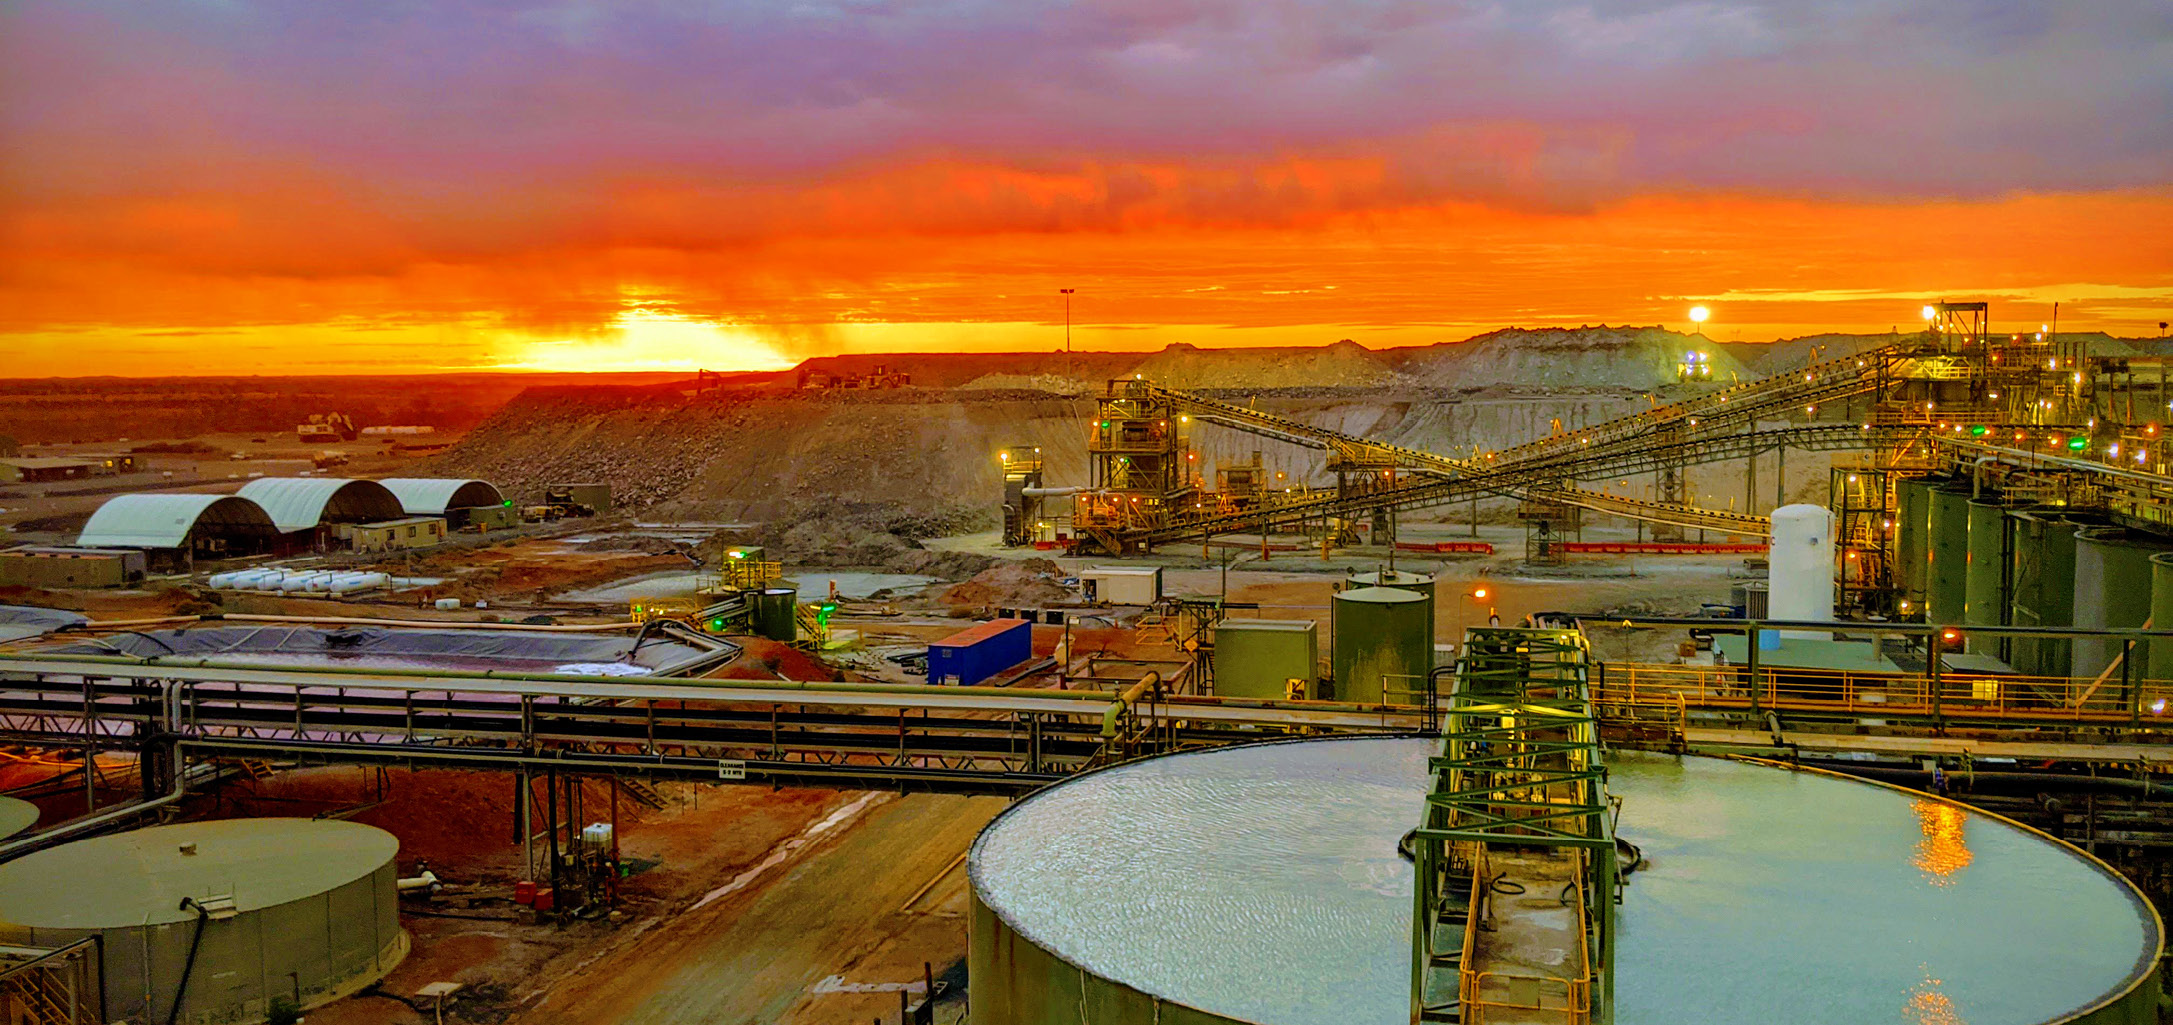
Cerro Vanguardia, Argentina
Q3 2025 EARNINGS RELEASE | 4 | | |||
| ||||||
2025 I GROUP PERFORMANCE | ||||||
CONTINUED
FINANCIAL RESULTS | Quarter | Quarter | Nine months | Nine months | ||
ended | ended | % | ended | ended | % | |
Sep | Sep | Variance | Sep | Sep | Variance | |
US Dollar million, except as otherwise noted | 2025 | 2024 | 2025 | 2024 | ||
Average gold price received*(1)(2)(6) ($/oz) | 3,490 | 2,486 | 40% | 3,222 | 2,298 | 40% |
Adjusted EBITDA* ($m) | 1,556 | 746 | 109% | 4,119 | 1,863 | 121% |
Headline earnings(4) ($m) | 672 | 236 | 185% | 1,759 | 549 | 220% |
Capital expenditure - Group(1)(2) ($m) | 388 | 295 | 32% | 1,105 | 846 | 31% |
Net cash flow from operating activities ($m) | 1,419 | 606 | 134% | 3,162 | 1,278 | 147% |
Free cash flow* ($m) | 920 | 381 | 141% | 1,858 | 653 | 185% |
Adjusted net debt (cash)* ($m) | (450) | 906 | (150)% | (450) | 906 | (150)% |
FINANCIAL HIGHLIGHTS •Adjusted EBITDA* rose by 109% year-on-year to $1,556m in Q3 2025, compared to $746m in Q3 2024, supported by increased production volumes, effective cost management, and a higher average gold price received per ounce* •Free cash flow* rose by 141% to $920m in Q3 2025, from $381m in Q3 2024 •Headline earnings(4) rose 185% year-on-year to $672m in Q3 2025, from $236m in Q3 2024; headline earnings(4) per share up 136% year-on-year to 132 US cents per share in Q3 2025, from 56 US cents per share in Q3 2024 •Total capital expenditure for the Group(1)(2), which included $59m at Sukari, increased 32% year-on-year to $388m in Q3 2025, from $295m in Q3 2024, including $281m in sustaining capital expenditure* and $107m in non-sustaining capital expenditure*, reflecting Sukari inclusion and reinvestment across the portfolio •Adjusted net debt* moved into a cash position of $450m at 30 September 2025 •Dividend of 91 US cents/share declared for Q3 2025 |
* Refer to “Non-GAAP disclosure” for definitions and reconciliations. | ||||
Q3 2025 EARNINGS RELEASE | 5 | | |||
| ||||||
2025 I GROUP PERFORMANCE | ||||||
CONTINUED
OPERATING RESULTS | Quarter | Quarter | Nine months | Nine months | ||
ended | ended | % | ended | ended | % | |
Sep | Sep | Variance | Sep | Sep | Variance | |
US Dollar million, except as otherwise noted | 2025 | 2024 | 2025 | 2024 | ||
Gold production - Group(1)(2)(3) (koz) | 768 | 657 | 17% | 2,292 | 1,911 | 20% |
Gold production - Managed operations(1)(2)(3)(koz) | 682 | 586 | 16% | 2,068 | 1,682 | 23% |
Total cash costs* - Group(1)(2) ($/oz) | 1,225 | 1,172 | 5% | 1,224 | 1,163 | 5% |
Total cash costs* - Managed operations(1)(2) ($/oz) | 1,244 | 1,186 | 5% | 1,233 | 1,195 | 3% |
AISC* - Group(1)(2) ($/oz) | 1,720 | 1,616 | 6% | 1,676 | 1,598 | 5% |
AISC* - Managed operations(1)(2) ($/oz) | 1,766 | 1,665 | 6% | 1,706 | 1,660 | 3% |
OPERATIONAL HIGHLIGHTS •TRIFR was 0.96 injuries per million hours worked in Q3 2025, well below industry benchmarks •Gold production for the Group(1)(2)(3) increased by 17% year-on-year in Q3 2025, reaching 768,000oz compared to 657,000oz in Q3 2024 •Strong year-on-year gold production growth in Q3 2025 at Obuasi (+30%), Kibali (+21%), Geita (+6%) and Cuiabá (+6%) •Sukari contributed 135,000oz for Q3 2025, firmly establishing its role as one of the top producers in the portfolio •Obuasi delivered a strong 69,000oz in Q3 2025, a 30% year-on-year increase, as grade improved and production ramped up steadily •Gold production from managed operations(1)(2)(3) rose 16% year-on-year to 682,000oz in Q3 2025, up from 586,000oz in Q3 2024, supported by consistent delivery from Sukari, Obuasi, Geita, Cuiabá, Cerro Vanguardia and Iduapriem •Australia’s production was lower year-on-year in Q3 2025, in line with internal expectations •Total cash costs per ounce* for the Group(1)(2) increased 5% to $1,225/oz in Q3 2025, from $1,172/oz in Q3 2024; AISC per ounce* for the Group(1)(2) rose 6% to $1,720/oz in Q3 2025, from $1,616/oz in Q3 2024 •Total cash costs per ounce* from managed operations(1)(2) increased 5% year-on-year to $1,244/oz in Q3 2025, from $1,186/oz in Q3 2024 •AISC per ounce* from managed operations(1)(2) rose 6% year-on-year to $1,766/oz in Q3 2025, from $1,665/oz in Q3 2024, reflecting sustaining capital expenditure* reinvestment, cost inflation, and higher gold royalty costs •AngloGold Ashanti reaffirmed its full-year 2025 guidance, with gold production, cost and capital spending expected to remain within the guided ranges |
* Refer to “Non-GAAP disclosure” for definitions and reconciliations. | ||||
Q3 2025 EARNINGS RELEASE | 6 | | |||
| ||||||
GROUP I FINANCIAL AND OPERATING KEY STATISTICS | ||||||
KEY STATISTICS | Quarter | Quarter | Nine months | Nine months | |
ended | ended | ended | ended | ||
Sep | Sep | Sep | Sep | ||
US Dollar million, except as otherwise noted | 2025 | 2024 | 2025 | 2024 | |
Operating review | |||||
Gold | |||||
Produced - Group(1)(2)(3) | - oz (000) | 768 | 657 | 2,292 | 1,911 |
Produced - Managed operations(1)(2)(3) | - oz (000) | 682 | 586 | 2,068 | 1,682 |
Produced - Non-managed joint ventures(1) | - oz (000) | 86 | 71 | 224 | 229 |
Sold - Group(1)(2)(3) | - oz (000) | 764 | 667 | 2,302 | 1,954 |
Sold - Managed operations(1)(2)(3) | - oz (000) | 680 | 590 | 2,083 | 1,724 |
Sold - Non-managed joint ventures(1) | - oz (000) | 84 | 77 | 219 | 230 |
Financial review | |||||
Gold income | - $m | 2,373 | 1,466 | 6,707 | 3,957 |
Cost of sales - Group(1)(2) | - $m | 1,348 | 1,025 | 3,933 | 2,961 |
Cost of sales - Managed operations(1)(2) | - $m | 1,225 | 921 | 3,597 | 2,683 |
Cost of sales - Non-managed joint ventures(1) | - $m | 123 | 104 | 336 | 278 |
Total operating costs | - $m | 894 | 720 | 2,669 | 2,096 |
Gross profit | - $m | 1,192 | 541 | 3,228 | 1,290 |
Average gold price received per ounce* - Group(1)(2)(6) | - $/oz | 3,490 | 2,486 | 3,222 | 2,298 |
Average gold price received per ounce* - Managed operations(1)(2)(6) | - $/oz | 3,488 | 2,484 | 3,220 | 2,296 |
Average gold price received per ounce* - Non-managed joint ventures(1)(6) | - $/oz | 3,502 | 2,502 | 3,240 | 2,313 |
All-in sustaining costs per ounce* - Group(1)(2) | - $/oz | 1,720 | 1,616 | 1,676 | 1,598 |
All-in sustaining costs per ounce* - Managed operations(1)(2) | - $/oz | 1,766 | 1,665 | 1,706 | 1,660 |
All-in sustaining costs per ounce* - Non-managed joint ventures(1) | - $/oz | 1,355 | 1,241 | 1,392 | 1,133 |
Total cash costs per ounce* - Group(1)(2) | - $/oz | 1,225 | 1,172 | 1,224 | 1,163 |
Total cash costs per ounce* - Managed operations(1)(2) | - $/oz | 1,244 | 1,186 | 1,233 | 1,195 |
Total cash costs per ounce* - Non-managed joint ventures(1) | - $/oz | 1,068 | 1,053 | 1,145 | 924 |
Profit before taxation | - $m | 1,057 | 394 | 2,832 | 974 |
Adjusted EBITDA* | - $m | 1,556 | 746 | 4,119 | 1,863 |
Total borrowings | - $m | 2,301 | 2,303 | 2,301 | 2,303 |
Adjusted net debt (cash)* | - $m | (450) | 906 | (450) | 906 |
Profit attributable to equity shareholders | - $m | 669 | 223 | 1,781 | 534 |
- US cents/share | 132 | 53 | 350 | 127 | |
Headline earnings(4) | - $m | 672 | 236 | 1,759 | 549 |
- US cents/share | 132 | 56 | 346 | 130 | |
Net cash inflow from operating activities | - $m | 1,419 | 606 | 3,162 | 1,278 |
Free cash flow*(5) | - $m | 920 | 381 | 1,858 | 653 |
Capital expenditure - Group(1)(2) | - $m | 388 | 295 | 1,105 | 846 |
Capital expenditure - Managed operations(1)(2) | - $m | 342 | 267 | 995 | 757 |
Capital expenditure - Non-managed joint ventures(1) | - $m | 46 | 28 | 110 | 89 |
(1) The term “managed operations” refers to subsidiaries managed by AngloGold Ashanti and included in its consolidated reporting, while the term “non-managed joint ventures” (i.e., Kibali) refers to equity-accounted joint ventures that are reported based on AngloGold Ashanti’s share of attributable earnings and are not managed by AngloGold Ashanti. Managed operations are reported on a consolidated basis. Non-managed joint ventures are reported on an attributable basis. | |||||
(2) On 22 November 2024, the acquisition of Centamin was successfully completed. Centamin has been included from the effective date of the acquisition. | |||||
(3) Includes gold concentrate from the Cuiabá mine sold to third parties. | |||||
(4) The financial measures “headline earnings (loss)” and “headline earnings (loss) per share” are not calculated in accordance with IFRS® Accounting Standards, but in accordance with the Headline Earnings Circular 1/2023, issued by the South African Institute of Chartered Accountants (SAICA), at the request of the Johannesburg Stock Exchange Limited (JSE). These measures are required to be disclosed by the JSE Listings Requirements and therefore do not constitute Non-GAAP financial measures for purposes of the rules and regulations of the US Securities and Exchange Commission (“SEC”) applicable to the use and disclosure of Non-GAAP financial measures. | |||||
(5) To enhance comparability with industry peers, AngloGold Ashanti has revised its definition of free cash flow*, which is a Non-GAAP financial measure. Pursuant to its revised definition, free cash flow* is calculated as operating cash flow less capital expenditure. Operating cash flow is defined as net cash flow from operating activities, plus repayment of loans advanced to joint ventures, less dividends paid to non-controlling interests (i.e., dividends paid to non-controlling interests in Sukari (50%), Siguiri (15%) and Cerro Vanguardia (7.5%)). Free cash flow* figures for prior periods (including Q3 2024 and YTD Sep 2024) have been adjusted to reflect this change in reporting. | |||||
(6) The average gold price received per ounce* for Q3 2024 and YTD Sep 2024 has been restated to be based on the gold revenue from primary operating activities. Previously, the gold price received per ounce calculation included revenue from normal operating activities as well as hedging activities. | |||||
* Refer to “Non-GAAP disclosure” for definitions and reconciliations. | |||||
$ represents US Dollar, unless otherwise stated. | |||||
Rounding of figures may result in computational discrepancies. | |||||
Q3 2025 EARNINGS RELEASE | 7 | | |||
| ||||||
GROUP I FINANCIAL AND OPERATING RESULTS | ||||||
QUARTERLY REVIEW
Gold production
Group gold production for Q3 2025 totalled 768,000oz, a
17% increase from 657,000oz in Q3 2024. This strong year-
on-year growth was the result of another full-quarter
contribution from Sukari, combined with solid performances
across a number of operations.
In Q3 2025, the Group delivered notable year-on-year gold
production increases at several operations, including Obuasi
(+16koz), Kibali (+15koz), Geita (+7koz) and Cuiabá
(+4koz). The Group experienced lower production at Siguiri
(-32koz), impacted by a 42 day plant stoppage during which
the mine continued normal operations (the plant has
resumed operations in the meantime and gold production at
Siguiri is still expected to grow significantly during Q4 2025);
at Sunrise Dam (-21koz), mainly due to lower underground
mined tonnes and grade from a revised mine plan, together
with lower stope and equipment availability; and at Tropicana
(-14koz), mainly due to a higher proportion of lower grade
stockpile ore processed. Gold production at Cerro
Vanguardia (+1koz), Iduapriem (+1koz), and Serra Grande
(-1koz) remained largely unchanged year-on-year.
Obuasi delivered a particularly strong performance in Q3
2025, with a growing contribution from UHDF, higher
underground grades, improved plant recovery from a new
flash cell, and no low-grade low-recovery surface material
treated in Q3 2025 compared to Q3 2024. Tonnes treated
also increased, overcoming the ventilation and equipment
constraints experienced in Q3 2024.
Kibali’s gold production increased by 21% in Q3 2025,
benefiting from improved plant feed grades compared to Q3
2024, partly offset by lower tonnes treated due to a mill
shutdown and loader shortages.
Group gold production for year-to-date (“YTD”) Sep 2025
totalled 2,292,000oz, a 20% increase from 1,911,000oz in
YTD Sep 2024. This strong year-on-year growth was driven
by the addition of Sukari into the portfolio, and sustained
production improvements across several key assets.
Costs
Total cash costs per ounce* for the Group increased by 5%
year-on-year to $1,225/oz in Q3 2025, compared to $1,172/
oz in Q3 2024. The increase was primarily driven by an
estimated 5% rise in inflation, reflecting consumer price
index (“CPI”) movements in the jurisdictions where the
Group operates, and higher royalty costs linked to the
stronger average gold price received per ounce* during Q3
2025. These impacts were partially offset by a favourable
foreign currency exchange environment against the US
dollar, which resulted in a 2% cost benefit.
Managed operations recorded a 5% year-on-year increase in
total cash costs per ounce*, rising from $1,186/oz in Q3
2024 to $1,244/oz in Q3 2025. In addition to the impacts of
inflation mainly due to increases in labour and mining
contractor costs, and higher gold royalties, the increase
reflects lower gold production at Siguiri, Sunrise Dam and
Tropicana, as well as higher operating costs at Obuasi.
These pressures were partially offset by the addition of
Sukari to the portfolio, and stronger production performances
at Obuasi, Geita and Cuiabá.
Total cash costs per ounce* at the Group’s non-managed
joint ventures marginally increased by 1% year-on-year to
$1,068/oz in Q3 2025, compared to $1,053/oz in Q3 2024.
The increase was primarily driven by higher royalties and
higher operating costs, partially offset by a stronger
production performance in Q3 2025.
All-in sustaining costs per ounce* (“AISC”) for the Group
increased by 6% year-on-year to $1,720/oz in Q3 2025,
compared to $1,616/oz in Q3 2024. At the managed
operations, AISC per ounce* increased by 6% to $1,766/oz
in Q3 2025, up from $1,665/oz in Q3 2024, reflecting higher
total cash costs per ounce* and increased sustaining capital
expenditure*. AISC per ounce* at the non-managed joint
ventures increased by 9% to $1,355/oz in Q3 2025, from
$1,241/oz in Q3 2024, primarily due to year-on-year increase
in sustaining capital expenditure* at Kibali.
Total cash costs per ounce* for the Group increased by 5%
year-on-year to $1,224/oz for YTD Sep 2025, compared to
$1,163/ oz in YTD Sep 2024. Consistent with the quarterly
trend, this increase was primarily driven by an estimated 4%
rise in inflation driven by higher labour and mining contractor
costs, and higher royalty costs associated with the stronger
average gold price received per ounce*. These impacts were
partially offset by a favourable cumulative foreign currency
exchange rate against the US dollar, which resulted in a 3%
cost benefit.
Managed operations reported a 3% year-on-year increase in
total cash costs per ounce*, increased from $1,195/oz in
YTD Sep 2024 to $1,233/oz in YTD Sep 2025. This increase
was primarily driven by inflationary pressures mainly due to
higher labour and mining contractor costs, and higher gold
royalty costs, including operational challenges at Iduapriem,
Sunrise Dam and Serra Grande. These impacts were
partially offset by the inclusion of Sukari into the portfolio and
strong operational performances at Geita and Obuasi.
Total cash costs per ounce* at non-managed joint ventures
increased by 24% year-on-year to $1,145/oz for YTD Sep
2025, up from $924/oz in YTD Sep 2024, primarily due to
higher royalties, higher labour and mining contractor costs
and higher open-pit volume-related operating costs.
AISC per ounce* for the Group increased by 5% year-on-
year to $1,676/oz in YTD Sep 2025, from $1,598/oz in YTD
Sep 2024. For managed operations, AISC per ounce*
increased by 3% to $1,706/oz for YTD Sep 2025, up from
$1,660/oz in YTD Sep 2024, reflecting the impact of higher
total cash costs per ounce*, partially offset by the positive
impact of Sukari’s inclusion in the portfolio. AISC per ounce*
at non-managed joint ventures increased by 23% to $1,392/
oz for YTD Sep 2025, compared to $1,133/oz for YTD Sep
2024, primarily due to a year-on-year increase in operating
costs.
Adjusted EBITDA*
Adjusted earnings before interest, tax, depreciation and
amortisation* (“Adjusted EBITDA*”) for Q3 2025 increased to
$1,556m, up from $746m in Q3 2024. This strong year-on-
year growth was underpinned by a favourable operating and
market environment, including a higher average gold price
received per ounce*, increased gold sales volumes, no
losses on non-hedge derivatives and other commodity
contracts, and higher equity earnings from associates and
non-managed joint ventures. These gains were partially
offset by higher total operating costs—driven by increased
royalty expenses, the first-time inclusion of Sukari, higher
costs related to legacy tailings storage facilities (“TSFs”) and
governmental fiscal claims, higher corporate costs, higher
legal fees and other provisions, and higher indirect taxes.
Q3 2025 EARNINGS RELEASE | 8 | | |||
| ||||||
REGIONS I FINANCIAL AND OPERATING RESULTS | ||||||
QUARTERLY REVIEW CONTINUED
Adjusted EBITDA* for YTD Sep 2025 increased to $4,119m,
compared to $1,863m in YTD Sep 2024. This strong year-
on-year growth was driven by a combination of favourable
operational and market conditions, including a higher
average gold price received per ounce*, increased gold
sales volumes, no losses on non-hedge derivatives and
other commodity contracts, favourable inventory
movements, lower legal fees, and higher equity earnings
from associates and non-managed joint ventures. These
positive factors were partially offset by higher total operating
costs, reflecting increased royalty expenses, the initial
inclusion of Sukari, higher costs associated with legacy
TSFs and governmental fiscal claims, higher corporate
costs, higher restructuring costs and other provisions, higher
costs relating to mining contractor rate adjustments, and
higher indirect taxes.
Earnings
Basic earnings (profit attributable to equity shareholders) for
Q3 2025 were $669m, or 132 US cents per share, compared
to $223m, or 53 US cents per share, in Q3 2024. The strong
year-on-year increase was largely driven by a higher
average gold price received per ounce*, increased gold
sales volumes, no losses on non-hedge derivatives and
other commodity contracts, higher finance income, lower
foreign exchange and fair value adjustments and higher
equity earnings from associates and non-managed joint
ventures. Q3 2025 also benefited from lower asset
derecognitions, lower care and maintenance costs and
higher profits on disposal of assets than Q3 2024.
These positive contributions were partially offset by higher
total operating costs, including increased royalty expenses
and costs associated with the initial inclusion of Sukari,
along with higher asset amortisation, elevated costs related
to legacy TSFs and governmental fiscal claims, higher
corporate and finance costs, higher legal fees and other
provisions, higher indirect taxes, an asset impairment in Q3
2025, and a higher tax charge.
Basic earnings (profit attributable to equity shareholders) for
YTD Sep 2025 were $1,781m, or 350 US cents per share,
compared to $534m, or 127 US cents per share, in YTD Sep
2024. This strong year-on-year growth was primarily driven
by a higher average gold price received per ounce*,
increased gold sales volumes, and no losses on non-hedge
derivatives and other commodity contracts. Additional
contributions came from favourable inventory movements,
lower legal fees, lower care and maintenance costs, higher
equity earnings from associates and non-managed joint
ventures, lower asset derecognitions and an impairment
reversal at Serra Grande which was not present in YTD Sep
2024.
These positive impacts were partially offset by higher total
operating costs, including increased royalty expenses and
the first-time inclusion of Sukari, alongside higher
amortisation of assets, elevated costs related to legacy TSFs
and governmental fiscal claims, higher costs relating to
mining contractor rate adjustments, higher corporate and
finance costs, higher foreign exchange and fair value
adjustments, higher indirect taxes, restructuring costs and
other provisions, lower finance income, and loss on disposal
of the Doropo and ABC projects in Côte d’Ivoire, and a
higher tax charge.
Headline earnings‡ for Q3 2025 were $672m, or 132 US
cents per share, compared to $236m, or 56 US cents per
share in Q3 2024. The increase in headline earnings‡
reflects the same key drivers that supported the rise in basic
earnings during Q3 2025. In addition, headline earnings‡
excludes impairment reversals/impairments, asset
derecognitions and losses (profits) on disposal of assets and
taxes thereon.
Headline earnings‡ for YTD Sep 2025 were $1,759m, or 346
US cents per share, compared to $549m, or 130 US cents
per share, for YTD Sep 2024. The increase in headline
earnings‡ reflects the same key drivers that supported the
rise in basic earnings during YTD Sep 2025.
‡The financial measures “headline earnings (loss)” and “headline
earnings (loss) per share” are not calculated in accordance with
IFRS® Accounting Standards, but in accordance with the
Headline Earnings Circular 1/2023, issued by the South African
Institute of Chartered Accountants (SAICA), at the request of the
Johannesburg Stock Exchange Limited (JSE). These measures
are required to be disclosed by the JSE Listings Requirements
and therefore do not constitute Non-GAAP financial measures
for purposes of the rules and regulations of the SEC applicable
to the use and disclosure of Non-GAAP financial measures.
Cash flow
Net cash inflow from operating activities reached $1,419m in
Q3 2025, representing a 134% year-on-year increase from
$606m in Q3 2024. This strong performance was
underpinned by a higher average gold price received per
ounce*, increased gold sales volumes from managed
operations, and higher dividends received from joint
ventures. These gains were partially offset by higher total
operating costs and increased tax payments.
After accounting for capital expenditure, loan repayments
from Kibali, and dividends paid to non-controlling
shareholders, the Company generated a free cash inflow* of
$920m in Q3 2025, compared to $381m in Q3 2024.
Net cash inflow from operating activities was $3,162m for
YTD Sep 2025, a 147% increase year-on-year from $1,278m
for YTD Sep 2024. This strong performance was primarily
driven by a higher average gold price received per ounce*,
increased gold sales volumes from managed operations,
and higher dividends received from joint ventures. These
benefits were partially offset by higher total operating costs
and increased tax payments.
After accounting for capital expenditure, loan repayments
from Kibali, dividends paid to non-controlling shareholders,
and landholder duties of $37m paid in May 2025 in respect
of the corporate restructuring, the Company generated a free
cash inflow* of $1,858m in YTD Sep 2025, compared to
$653m in YTD Sep 2024.
To enhance comparability with industry peers, AngloGold
Ashanti revised its definition of free cash flow*, which is a
Non-GAAP financial measure. Pursuant to its revised
definition, free cash flow* is calculated as operating cash
flow less capital expenditure. Operating cash flow is defined
as net cash flow from operating activities, plus repayment of
loans advanced to joint ventures, less dividends paid to non-
controlling interests (i.e., dividends paid to non-controlling
interests in Sukari (50%), Siguiri (15%) and Cerro
Vanguardia (7.5%)). Free cash flow* figures for prior periods
(including Q3 2024 and YTD Sep 2024) have been adjusted
to reflect this change in reporting.
The dividend policy targets a 50% payout of annual free
cash flow*, subject to maintaining an Adjusted net debt* to
Adjusted EBITDA* ratio of 1.0 times. The dividend policy
Q3 2025 EARNINGS RELEASE | 9 | | |||
| ||||||
REGIONS I FINANCIAL AND OPERATING RESULTS | ||||||
QUARTERLY REVIEW CONTINUED
also introduced a base dividend of $0.50 per share per
annum, payable in quarterly instalments of $0.125 per share.
The interim dividend for Q3 2025, is 91 US cents per share.
During Q3 2025, AngloGold Ashanti received $37m in
dividends from the Kibali joint venture, compared to $49m in
loan repayments and $8m in dividends in Q3 2024. The
Company’s attributable share of outstanding cash balances
awaiting repatriation from the Democratic Republic of the
Congo (“DRC”) was $119m at 30 September 2025, up from
$25m at 30 June 2025.
Free cash flow* during Q3 2025 was impacted by ongoing
movements in value-added tax (“VAT”) recoveries at Geita
and Kibali, as well as foreign exchange controls and export
duty-related restrictions at Cerro Vanguardia (“CVSA”):
•In Tanzania, the net overdue recoverable VAT input credit
balance (after discounting provisions) increased by $17m
during Q3 2025 to $186m at 30 September 2025, up
from $169m at 30 June 2025. This increase reflects
foreign exchange gains of $14m, new claims submitted
during the period of $22m, and a decrease in the
discounting provision of $12m, partially offset by the
application of $31m in verified VAT claims against
corporate tax liabilities. AngloGold Ashanti expects to
continue offsetting eligible VAT claims against corporate
taxes as part of its recovery strategy.
•In the DRC, the Company’s attributable share of the net
recoverable VAT balance (including fuel duties and after
discounting provisions) increased by $14m during
Q3 2025 to $90m at 30 September 2025, up from $76m
at 30 June 2025. This increase was driven by $7m in
new claims submitted and $12m in revaluation
adjustments, partially offset by $5m increase in the
discounting provision.
•In Argentina, CVSA’s cash balance decreased by $62m#
during Q3 2025 to $109m# at 30 September 2025 from
$171m# at 30 June 2025. The cash remains available for
CVSA’s operational and exploration requirements.
During Q2, 2025, CVSA approved its 2024 local financial
statements and declared dividends attributable to the
2024 financial year to AngloGold Ashanti’s offshore
($251m#) and onshore ($28m#) investment holding
companies. During Q3 2025, CVSA paid offshore
dividends of $140m to AngloGold Ashanti by utilising a
currency swap mechanism to secure the required US
dollars. CVSA expects to continue with monthly dividend
payments, subject to cash availability, in order to satisfy
the remaining amount of declared dividends.
#US dollar equivalent and at prevailing exchange rates.
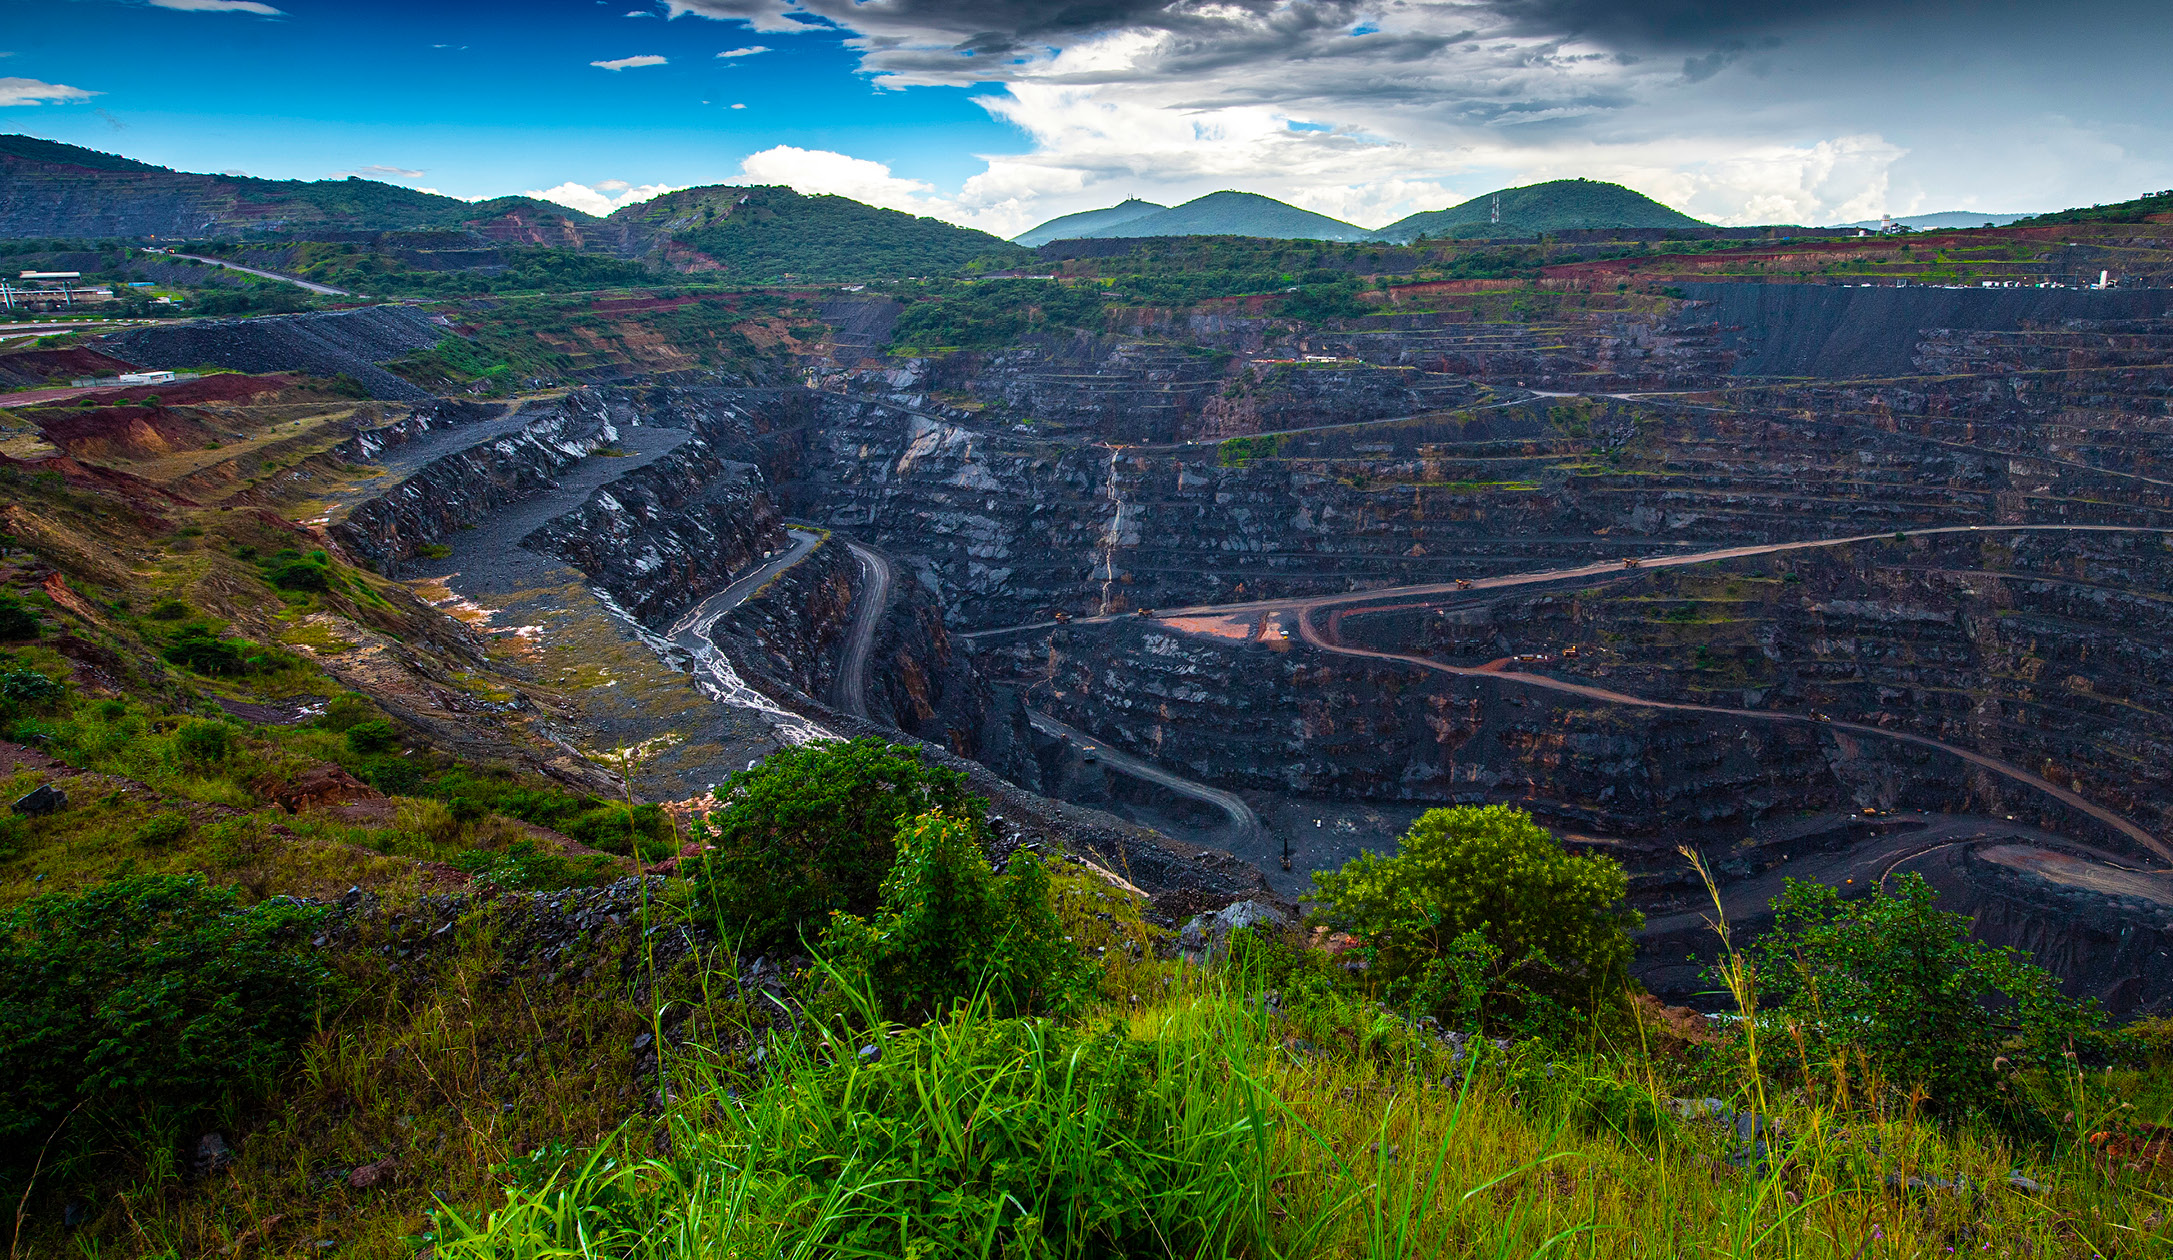
Geita, Tanzania
Q3 2025 EARNINGS RELEASE | 10 | | |||
| ||||||
GROUP I FINANCIAL AND OPERATING RESULTS | ||||||
QUARTERLY REVIEW CONTINUED
FREE CASH FLOW* | Quarter | Quarter | Nine months | Nine months |
ended | ended | ended | ended | |
Sep | Sep | Sep | Sep | |
US Dollar million, except as otherwise noted | 2025 | 2024 | 2025 | 2024 |
Net cash flow from operating activities (1) | 1,419 | 606 | 3,162 | 1,278 |
Repayment of loans advanced to joint ventures | — | 49 | 77 | 139 |
Dividends paid to non-controlling interests | (157) | (7) | (386) | (7) |
Operating cash flow | 1,262 | 648 | 2,853 | 1,410 |
Capital expenditure on tangible and intangible assets | (342) | (267) | (995) | (757) |
Free cash flow* | 920 | 381 | 1,858 | 653 |
(1) Includes landholder duties of $37m paid in May 2025.
* Refer to “Non-GAAP disclosure” for definitions and reconciliations.
Rounding of figures may result in computational discrepancies.
Balance sheet and liquidity
During Q3 2025, Adjusted net debt* moved into a cash
position, despite the payment of $562m in dividends during
Q3 2025. Adjusted net cash* at 30 September 2025 was
$450m, compared to Adjusted net debt* of $906m at 30
September 2024.
At 30 September 2025, the balance sheet remained robust,
supported by significant available liquidity. This included the
undrawn $1.4bn multi-currency revolving credit facility
(“RCF”). AngloGold Ashanti held approximately $2.5bn in
cash and cash equivalents (net of bank overdraft) at 30
September 2025, bringing Group liquidity to approximately
$3.9bn at 30 September 2025.
Capital expenditure
During Q3 2025, sustaining capital expenditure* of the
Group increased by 24% year-on-year to $281m, compared
to $227m in Q3 2024. Sustaining capital expenditure* at
managed operations rose by 20% year-on-year to $255m in
Q3 2025, up from $212m in Q3 2024. This increase was
primarily driven by the inclusion of Sukari’s sustaining capital
expenditure* of $32m in the portfolio and a $12m increase at
Sunrise Dam mainly due to the concentrated leach project.
At non-managed joint ventures, sustaining capital
expenditure* increased by 73% year-on-year to $26m in Q3
2025, from $15m in Q3 2024, mainly reflecting higher
expenditure on underground equipment and increased
Mineral Reserve development costs at Kibali, aligned with
increased underground development metres.
Non-sustaining capital expenditure* for the Group was
$107m in Q3 2025, a 57% increase year-on-year from $68m
in Q3 2024. At managed operations, non-sustaining capital
expenditure* rose by 58% year-on-year to $87m, from $55m
in Q3 2024, largely due to the addition of Sukari’s non-
sustaining capital expenditure* of $27m to the portfolio, a
$11m increase in the Havana growth capital expenditure at
Tropicana and investment in growth at Cuiabá to ramp up
production. This increase was partially offset by reduced
growth capital expenditure at Obuasi, following the
completion of Phase 3 of the Obuasi redevelopment project
in Q4 2024. Non-managed joint ventures recorded a 54%
year-on-year increase in non-sustaining capital expenditure*
to $20m in Q3 2025, from $13m in Q3 2024, mainly driven
by higher expenditure at Kibali on waste stripping for the
Pamao deposition project, as well as expenditure on
buttressing the TSF.
During YTD Sep 2025, sustaining capital expenditure* of the
Group increased by 22% year-on-year to $791m, compared
to $647m in YTD Sep 2024. Sustaining capital expenditure*
at managed operations rose by 24% year-on-year to $741m
in YTD Sep 2025, up from $598m in YTD Sep 2024. This
increase was primarily driven by the inclusion of Sukari’s
sustaining capital expenditure* of $101m in the portfolio, a
$38m increase at Geita reflecting the acquisition of a new
mining fleet and increased investment in Mineral Reserve
development, and a $20m increase at Sunrise Dam mainly
due to the concentrated leach project. This increase was
partially offset by lower expenditure at Siguiri following
elevated activity in Sep YTD 2024 related to waste mining,
TSF life extension and recovery work on a carbon-in-leach
(“CIL”) tank failure, and reduced expenditure at Iduapriem
mainly due to lower stripping costs. At non-managed joint
ventures, sustaining capital expenditure* at Kibali increased
marginally by 2% year-on-year to $50m in YTD Sep 2025,
from $49m in YTD Sep 2024.
Non-sustaining capital expenditure* for the Group was
$314m in YTD Sep 2025, a 58% increase year-on-year from
$199m in YTD Sep 2024. At managed operations, non-
sustaining capital expenditure* rose by 60% year-on-year to
$254m, from $159m in YTD Sep 2024, primarily driven by
the addition of Sukari’s non-sustaining capital expenditure*
of $83m to the portfolio, investment in growth at Cuiabá to
ramp up production and increased expenditure on the
Beposo TSF at Iduapriem. These increases were partially
offset by lower non-sustaining capital expenditure* at Obuasi
following the successful completion of Phase 3 of the Obuasi
redevelopment project in Q4 2024. Non-managed joint
ventures recorded a 50% year-on-year increase in non-
sustaining capital expenditure* to $60m in YTD Sep 2025,
from $40m in YTD Sep 2024. The increase was primarily
driven by higher investment at Kibali, including waste
stripping for the Pamao deposition project and continued
progress on buttressing the TSF.
* Refer to “Non-GAAP disclosure” for definitions and reconciliations.
Q3 2025 EARNINGS RELEASE | 11 | | |||
| ||||||
REGIONS I FINANCIAL AND OPERATING RESULTS | ||||||
QUARTER IN REVIEW
Regional view
Africa region
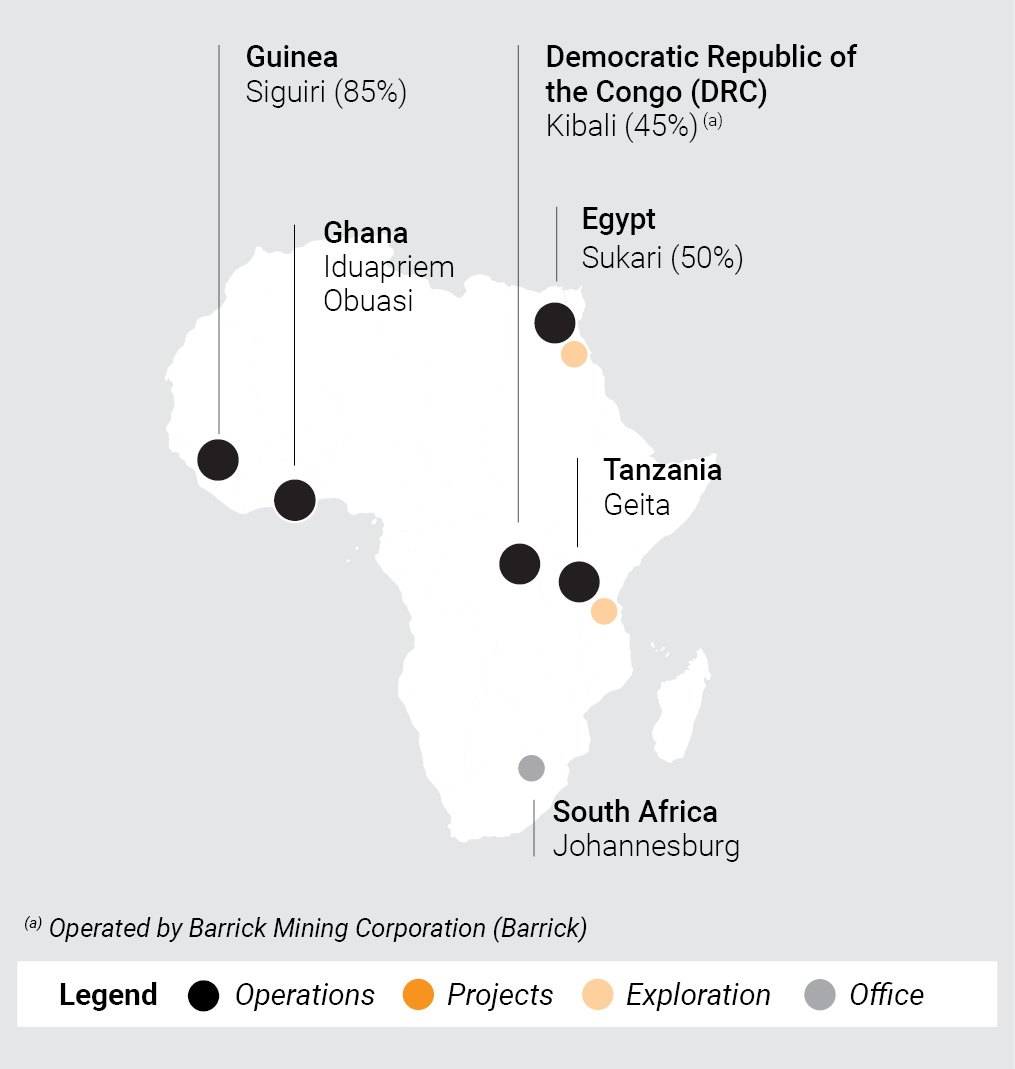
In the Africa region, managed operations (including Sukari)
produced 428,000oz at a total cash cost* of $1,154/oz in Q3
2025, compared to 301,000oz at a total cash cost* of
$1,179/oz in Q3 2024. In the Africa region, non-managed
joint ventures produced (on an attributable basis) 86,000oz
at a total cash cost* of $1,068/oz in Q3 2025, compared to
71,000oz at a total cash cost* of $1,053/oz in Q3 2024.
Managed operations (including Sukari) produced
1,307,000oz at a total cash cost* of $1,144/oz in YTD Sep
2025, compared to 894,000oz at a total cash cost* of
$1,206/oz in YTD Sep 2024.
In the Africa region, non-managed joint ventures produced
(on an attributable basis) 224,000oz at a total cash cost* of
$1,145/oz in YTD Sep 2025, compared to 229,000oz at a
total cash cost* of $924/oz in YTD Sep 2024.
In Ghana, at Iduapriem, gold production was 60,000oz at a
total cash cost* of $1,321/oz for Q3 2025, compared to
59,000oz at a total cash cost* of $1,191/oz during Q3 2024.
Gold production marginally increased by 2% year-on-year in
Q3 2025 compared to Q3 2024, due primarily to increased
tonnes treated, with reduced engineering downtime leading
to higher effective plant operating hours. The supply of
higher grade ore from Block 7/8 Cut 1 also contributed to
improved production. Total cash costs per ounce* increased
by 11% year-on-year in Q3 2025 compared to Q3 2024,
largely reflecting increases in production taxes, royalties
linked to a higher gold price, and an increase in
maintenance-related expenditures, partially offset by a lower
drawdown of metal inventories compared to Q3 2024.
Gold production was 149,000oz at a total cash cost* of
$1,480/oz for YTD Sep 2025, compared to 187,000oz at a
total cash cost* of $1,021/oz during YTD Sep 2024. Gold
production decreased by 20% year-on-year in YTD Sep
2025 compared to YTD Sep 2024, mainly due to an
unplanned seventeen-day plant shutdown in Q1 2025 to
investigate and repair a tear in the lining of the Beposo TSF,
as well as a reduction in overall grade resulting from the
depletion of the higher-grade Cut 2B pit in 2024 and
increased operational downtime due to power supply
interruptions. Total cash costs per ounce* increased by 45%
year-on-year in YTD Sep 2025 compared to YTD Sep 2024,
mainly driven by lower production - including an estimated
shortfall of approximately 12,000oz due to the plant
stoppage in Q1 2025 - and the processing of lower-grade
ore. Additionally, operating costs increased due to higher
expenditure on mining contractors, consultants and
maintenance costs.
Iduapriem, Ghana
Q3 2025 EARNINGS RELEASE | 12 | | |||
| ||||||
REGIONS I FINANCIAL AND OPERATING RESULTS | ||||||
QUARTER IN REVIEW CONTINUED
At Obuasi, gold production was 69,000oz at a total cash
cost* of $1,331/oz for Q3 2025, compared to 53,000oz at a
total cash cost* of $1,153/oz during Q3 2024. Gold
production increased by 30% year-on-year in Q3 2025
compared to Q3 2024, mainly due to a growing contribution
from UHDF delivering improved underground ore tonnes and
grades to the plant, with Q3 2024 impacted by ventilation
constraints and low equipment availability. Plant recoveries
improved by 2% year-on-year, supported by the installation
of a second flash cell and processing of higher-grade
material. Total cash costs per ounce* increased by 15%
year-on-year in Q3 2025 compared to Q3 2024, mainly due
to higher operating costs associated with year-on-year
increases in labour costs related to bonuses and once-off
payment to bargaining unit employees, increases in mining
contractor costs related to mining volume and updated rates,
and elevated consultant and maintenance expenditure.
Gold production was 194,000oz at a total cash cost* of
$1,306/oz for YTD Sep 2025, compared to 161,000oz at a
total cash cost* of $1,231/oz during YTD Sep 2024. Gold
production increased by 20% year-on-year in YTD Sep 2025
compared to YTD Sep 2024. This strong performance was
primarily due to UHDF delivering improved underground
mine health, and no Kokoteasua tailings processed during
YTD Sep 2025 — whereas surface sources accounted for
13% of the feed in YTD Sep 2024. Total underground tonnes
milled increased by 16% year-on-year to 976kt and the
average head grade improved significantly by 17%, rising to
7.09g/t in YTD Sep 2025 from 6.05g/t in YTD Sep 2024.
Total cash costs per ounce* increased by 6% year-on-year in
YTD Sep 2025 compared to YTD Sep 2024, mainly due to
higher labour costs associated with increases in labour
complement, once-off payment to bargaining unit
employees, bonuses linked to stronger production
performance, contractor costs associated with increased
tonnes mined and updated rates, along with elevated
consultant and maintenance costs.
In Guinea, at Siguiri, gold production was 39,000oz at a
total cash cost* of $2,331/oz for Q3 2025, compared to
71,000oz at a total cash cost* of $1,500/oz in Q3 2024. Gold
production decreased by 45% year-on-year in Q3 2025
compared to Q3 2024, mainly due to the suspension of
processing at the plant during Q3 2025 to address seepage
on a section of the south wall of the TSF following rainfall of
more than 110mm in a single day during the wet season.
Processing resumed at the plant at the end of Q3 2025,
while a project to buttress the perimeter of the TSF
continues to make good progress. Mining had continued
throughout the suspension and the Company expects to be
able to process the mined ore in the next few months. Gold
production is still expected to increase year-on-year by
approximately 8% during 2025 compared to 2024.
Total cash costs per ounce* increased by 55% year-on-year
in Q3 2025 compared to Q3 2024, mainly due to lower
production as a result of the plant stoppage, and volume-
related increases in mining costs, partially offset by a build-
up in metal inventories.
Gold production was 204,000oz at a total cash cost* of
$1,735/oz for YTD Sep 2025, compared to 199,000oz at a
total cash cost* of $1,687/oz in YTD Sep 2024. Gold
production increased by 3% in YTD Sep 2025 compared to
YTD Sep 2024, mainly due to a 7% improvement in
recovery, achieved by excluding deleterious Bidini ore from
the blend and optimising carbon management. This increase
was partly offset by a 5% decrease in tonnes treated, due to
the plant stoppage in Q3 2025 to address TSF concerns.
Total cash costs per ounce* increased by 3% year-on-year in
YTD Sep 2025 compared to YTD Sep 2024, largely
reflecting an increase in gold royalty expenses associated
with the higher gold price, partially offset by the higher
production base year-on-year, and a build-up of metal
inventories.
Obuasi, Ghana
Q3 2025 EARNINGS RELEASE | 13 | | |||
| ||||||
REGIONS I FINANCIAL AND OPERATING RESULTS | ||||||
QUARTER IN REVIEW CONTINUED
In Tanzania, at Geita, gold production was 125,000oz at a
total cash cost* of $1,010/oz for Q3 2025, compared to
118,000oz at a total cash cost* of $995/oz in Q3 2024. Gold
production increased by 6% year-on-year in Q3 2025
compared to Q3 2024, mainly due to a 10% higher
recovered grade resulting from improved mined grade from
Nyamulilima, partly offset by reduced underground mined
grade due to low availability of high grade stopes and a 4%
decline in ore tonnes treated resulting from a planned mill
shutdown. Total cash costs per ounce* marginally increased
by 2% year-on-year in Q3 2025 compared to Q3 2024,
mainly due to the year-on-year increase in production, and
metal inventory build-up. This benefit was partly offset by
higher gold refining and royalty charges associated with the
stronger gold price, along with increased backfilling,
maintenance and stores costs.
Gold production was 379,000oz at a total cash cost* of $993/
oz for YTD Sep 2025, compared to 347,000oz at a total cash
cost* of $1,020/oz in YTD Sep 2024. Gold production
increased by 9% year-on-year in YTD Sep 2025 compared
to YTD Sep 2024, mainly due to improved recovered grades,
supported by a 10% uplift in the mine call factor, partially
offset by a 6% decline in ore tonnes treated, due to lower
plant throughput rates and mill utilisation. Total cash costs
per ounce* decreased by 3% year-on-year in YTD Sep 2025
compared to YTD Sep 2024, mainly reflecting the benefit of
increased production volumes and a build-up of metal
inventories. This decrease was partly offset by higher direct
operating costs, including higher labour associated with
benefit adjustments and production bonuses, higher
contractor and consultant expenditure, higher stores costs,
and additional maintenance expenditure on the plant and
mining fleet.
In Egypt, at Sukari, a third consecutive quarterly production
increase was delivered, with gold production for Q3 2025 of
135,000oz (Q3 2024 132,000oz) at a total cash cost* of
$793/oz. Sukari was acquired by the Company on
22 November 2024. Float feed tonnes increased in Q3 2025
by 48kt, driven by higher plant throughput rates and
increased mill availability, partly offset by a decline in heap
leach production.
The mine performed in line with plan with gold production for
YTD Sep 2025 of 381,000oz (YTD Sep 2024 356,000oz) at
a total cash cost* of $765/oz. Gold production increased by
7% year-on-year in YTD Sep 2025 compared to YTD Sep
2024 mainly due to significantly higher mill grades, driven by
higher mined grades from both open pit and underground.
In the DRC, at Kibali, gold production (on an attributable
basis) was 86,000oz at a total cash cost* of $1,068/oz for Q3
2025, compared to 71,000oz at a total cash cost* of $1,053/
oz in Q3 2024. Gold production increased by 21% year-on-
year in Q3 2025 compared to Q3 2024, mainly due to a
greater proportion of higher grade ore fed from stockpiles.
Tonnes treated in Q3 2025 were 3% below Q3 2024 mainly
due to a shutdown overrun on Mill 1 and 2, as well as a
shortfall in underground tonnes due to loader availability
issues. Total cash costs per ounce* marginally increased by
1% year-on-year in Q3 2025 compared to Q3 2024, mainly
due to higher operating costs associated with volume-related
open-pit mining costs and higher gold royalties, partially
offset by higher gold production.
Gold production (on an attributable basis) was 224,000oz at
a total cash cost* of $1,145/oz for YTD Sep 2025, compared
to 229,000oz at a total cash cost* of $924/oz in YTD Sep
2024. Gold production marginally decreased by 2% year-on-
year in YTD Sep 2025 compared to YTD Sep 2024, mainly
due to operational challenges resulting in reduced
underground ore available for treatment. Total cash costs per
ounce* increased by 24% year-on-year in YTD Sep 2025
compared to YTD Sep 2024, mainly due to lower production
and higher operating costs from volume-related increases in
open-pit mining costs, and higher royalties driven by a
stronger gold price.
Geita, Tanzania
Q3 2025 EARNINGS RELEASE | 14 | | |||
| ||||||
REGIONS I FINANCIAL AND OPERATING RESULTS | ||||||
QUARTER IN REVIEW CONTINUED
Australia region
In the Australia region, gold production (on an attributable
basis) was 125,000oz at a total cash cost* of $1,638/oz in
Q3 2025, compared to 160,000oz at a total cash cost* of
$1,245/oz in Q3 2024. The region’s performance was
broadly in line with expectations.
Gold production (on an attributable basis) was 386,000oz at
a total cash cost* of $1,564/oz in YTD Sep 2025, compared
to 406,000oz at a total cash cost* of $1,335/oz in YTD Sep
2024.
At Sunrise Dam, gold production was 52,000oz at a total
cash cost* of $1,844/oz for Q3 2025, compared to 73,000oz
at a total cash cost* of $1,132/oz in Q3 2024. Gold
production decreased by 29% year-on-year in Q3 2025
compared to Q3 2024, mainly due to lower underground
tonnes mined and grade, which was impacted by lower
loader and stope availability, partially offset by improved
recoveries driven by increased circuit residence time and
reduced solution losses. Total cash costs per ounce*
increased by 63% year-on-year in Q3 2025 compared to Q3
2024, largely reflecting the impact of lower production, a
drawdown of metal inventories and volume-related increases
in open-pit mining costs.
Gold production was 174,000oz at a total cash cost* of
$1,646/oz for YTD Sep 2025, compared to 193,000oz at a
total cash cost* of $1,321/oz in YTD Sep 2024. Gold
production decreased by 10% year-on-year in YTD Sep
2025 compared to YTD Sep 2024, mainly due to reduced
underground mined tonnes and grade resulting from lower
loader and stope availability, partially offset by an
improvement in plant recoveries. Total cash costs per ounce*
increased by 25% year-on-year in YTD Sep 2025 compared
to YTD Sep 2024, mainly due to the lower production base,
gold-in-process inventory movements linked to timing of gold
pours, and additional crushing, reagents and maintenance
expenditure incurred at the plant.
At Tropicana, gold production (on an attributable basis) was
73,000oz at a total cash cost* of $1,364/oz in Q3 2025,
compared to 87,000oz at a total cash cost* of $1,243/oz in
Q3 2024. Gold production decreased by 16% year-on-year
in Q3 2025 compared to Q3 2024, mainly due to a greater
proportion of the lower-grade stockpile ore processed,
partially offset by higher open-pit grade. Total cash costs per
ounce* increased by 10% year-on-year in Q3 2025
compared to Q3 2024, mainly driven by the lower production
base, inflationary pressures driven primarily by increases in
mining contractor costs, and higher gold royalties.
Gold production (on an attributable basis) was 212,000oz at
a total cash cost* of $1,372/oz in YTD Sep 2025, compared
to 213,000oz at a total cash cost* of $1,230/oz in YTD Sep
2024. Gold production largely remained in line year-on-year
for YTD Sep 2025 compared to YTD Sep 2024, with lower
recovered grade, primarily driven by a greater proportion of
lower-grade stockpile ore processed, partially offset by an
increase in tonnes treated. Total cash costs per ounce*
increased by 12% year-on-year for YTD Sep 2025 compared
to YTD Sep 2024, primarily driven by volume-related
increases in underground costs, increase in maintenance
expenditure, elevated gold royalties, and a lower level of
open-pit capitalisation compared to YTD Sep 2024.
Sunrise Dam, Australia
Q3 2025 EARNINGS RELEASE | 15 | | |||
| ||||||
REGIONS I FINANCIAL AND OPERATING RESULTS | ||||||
QUARTER IN REVIEW CONTINUED
Americas region
In the Americas region, gold production was 129,000oz at
a total cash cost* of $1,192/oz in Q3 2025, compared to
125,000oz at a total cash cost* of $1,127/oz in Q3 2024.
Gold production was 375,000oz at a total cash cost* of
$1,201/oz in YTD Sep 2025, compared to 382,000oz at a
total cash cost* of $1,024/oz in YTD Sep 2024.
In Brazil, at Cuiabá (AGA Mineração), gold production was
71,000oz at a total cash cost* of $983/oz for Q3 2025,
compared to 67,000oz at a total cash cost* of $896/oz in Q3
2024. Following the successful restart of the Queiroz plant in
September 2024, gold production is now recorded upon
refining and pouring at the plant, rather than at the shipment
of gold concentrate. Gold production increased by 6% year-
on-year in Q3 2025 compared to Q3 2024, mainly due to
higher ore tonnes mined, partially offset by a decrease in
plant recoveries related to the shift to bar production. Total
cash costs per ounce* increased by 10% year-on-year for
Q3 2025 compared to Q3 2024, mainly due to the restart of
the Queiroz plant, which had previously been under care and
maintenance. This increase was partially offset by higher
gold production and increased by-product revenue.
Gold production was 196,000oz at a total cash cost* of $944/
oz for YTD Sep 2025, compared to 196,000oz at a total cash
cost* of $883/oz in YTD Sep 2024. Gold production
remained unchanged year-on-year in YTD Sep 2025
compared to YTD Sep 2024, with an improvement in ore
head grade and plant throughput offset by a 4% decline in
plant recoveries.
Total cash costs per ounce* increased by 7% year-on-year
for YTD Sep 2025 compared to YTD Sep 2024, mainly
reflecting higher operating costs associated with the
successful restart of the Queiroz plant. This increase was
partially mitigated by increased by-product revenue and a
weaker Brazilian real relative to the US dollar.
At Serra Grande, gold production was 15,000oz at a total
cash cost* of $2,253/oz for Q3 2025, compared to 16,000oz
at a total cash cost* of $1,801/oz in Q3 2024. Gold
production decreased by 6% year-on-year in Q3 2025
compared to Q3 2024, mainly due to lower tonnes treated as
a result of no open-pit mining in Q3 2025. Total cash costs
per ounce* increased by 25% year-on-year in Q3 2025
compared to Q3 2024, mainly driven by lower production
and higher operating costs. The team continues to focus on
enhancing operational efficiency to support improved cost
performance.
Gold production was 42,000oz at a total cash cost* of
$2,184/oz for YTD Sep 2025, compared to 57,000oz at a
total cash cost* of $1,439/oz in YTD Sep 2024. Gold
production decreased by 26% year-on-year in YTD Sep
2025 compared to YTD Sep 2024, mainly due to lower
recovered grades and reduced ore volumes treated,
impacted by a reduction in stope recovery resulting from
operational and geotechnical constraints. Total cash costs
per ounce* increased by 52% year-on-year for YTD Sep
2025 compared to YTD Sep 2024, largely reflecting the
impact of lower production. This increase was partially offset
by the weakening of the Brazilian real against the US dollar,
which helped mitigate some cost pressures.
The proposed sale of Serra Grande is expected to be
completed during Q4 2025.
In Argentina, at Cerro Vanguardia, gold production was
43,000oz at a total cash cost* of $1,139/oz during Q3 2025,
compared to 42,000oz at a total cash cost* of $1,224/oz in
Q3 2024. Gold production marginally increased by 2% year-
on-year in Q3 2025 compared to Q3 2024, mainly driven by
an increase in tonnes treated, with higher tonnes placed on
the heap leach pad, partially offset by a decrease in
recovered grade. Total cash costs per ounce* decreased by
7% year-on-year in Q3 2025 compared to Q3 2024, mainly
due to a year-on-year increase in by-product revenue driven
by higher volumes sold and a stronger silver price, partially
offset by higher gold royalties resulting from a higher gold
price.
Gold production was 137,000oz at a total cash cost* of
$1,253/oz during YTD Sep 2025, compared to 129,000oz at
a total cash cost* of $1,044/oz in YTD Sep 2024. Gold
production increased by 6% year-on-year in YTD Sep 2025
compared to YTD Sep 2024, mainly due to higher recovered
grades and an increase in ore tonnes treated, supporting
stronger operational performance. Total cash costs per
ounce* increased by 20% year-on-year in YTD Sep 2025
compared to YTD Sep 2024, primarily due to higher in-
country inflation and higher royalty costs associated with the
increased gold price. These increases were partially offset
by a weaker Argentinean peso against the US dollar, higher
by-product revenue and higher gold production, which
helped mitigate overall cost increases.
Q3 2025 EARNINGS RELEASE | 16 | | |||
| ||||||
REGIONS I FINANCIAL AND OPERATING RESULTS | ||||||
QUARTER IN REVIEW CONTINUED
Corporate update
Issued share capital
As at 10 November 2025, the total issued ordinary share
capital of the Company consisted of 504,887,435 ordinary
shares of $1.00 each. Each AngloGold Ashanti ordinary
share carries one voting right. The Company does not hold
any of its ordinary shares in treasury.
This figure may be used by AngloGold Ashanti shareholders
to determine whether they are required to notify their
interest, or a change to their interest, in the Company under
its Articles of Association or to comply with any other
applicable laws and regulations.
Proposed sale of the Serra Grande mine
On 2 June 2025, the Company announced that it had agreed
to sell Mineração Serra Grande S.A., which owns the
Company’s Serra Grande mine (“MSG”) in the state of
Goiás, Brazil, to Aura Minerals Inc. for the following
consideration:
•A cash consideration of $76m on closing subject to
certain working capital adjustments at the closing date;
and
•Deferred consideration payments equivalent to a 3% net
smelter returns participation over the current Mineral
Resource of MSG inclusive of the Mineral Reserve,
payable quarterly in cash.
The proposed sale, which is expected to close by the end of
2025, is subject to the fulfilment of certain customary closing
conditions.
Acquisition of Augusta Gold Corp.
On 23 October 2025, AngloGold Ashanti completed its
acquisition of Augusta Gold Corp. (“Augusta Gold”). The
transaction had previously been approved by the Augusta
Gold shareholders at a special meeting held on 20 October
2025. Following completion of the acquisition, the Augusta
Gold shares were delisted from the Toronto Stock Exchange
(TSX) and ceased to be quoted on the OTCQB.
Quebradona
On 20 June 2025, the Colombian Ministry of Environment
and Sustainable Development issued Resolution No. 855 of
2025, declaring a temporary renewable natural resources
reserve zone over multiple municipalities in the southwest of
the Department of Antioquia, including the area in which the
Quebradona project is located.
Resolution No. 855 restricts mining activities for three years
(extendable for a further two years) while authorities conduct
technical studies regarding the conservation value of the
area and subsequently determine whether to convert the
area to a permanent protected area or to withdraw the
temporary designation. No new environmental permits or
environmental licences may be issued as long as Resolution
No. 855 is in force.
On 17 October 2025, the Company submitted a conciliation
request which is a mandatory prerequisite for filing a lawsuit
seeking the annulment of Resolution No. 855 by the
administrative courts.
Change to Board of Directors
Effective 27 October 2025, Mr. Marcus Randolph joined
AngloGold Ashanti’s board of directors as an independent
non-executive director. Mr. Randolph serves as a member of
the Compensation and Human Resources Committee and
the Social, Ethics and Sustainability Committee.
Exploration update
For detailed disclosure on the exploration work done for the
three months ended 30 September 2025, see the
Exploration Update document on the Company’s website at
www.anglogoldashanti.com on both brownfield and
greenfield exploration programmes.

Serra Grande, Brazil
Q3 2025 EARNINGS RELEASE | 17 | | |||
| ||||||
GROUP I FINANCIAL RESULTS | ||||||
REVISION NOTE
Revision to selected line items in prior period consolidated statements of financial position
The Company’s management has identified prior period errors relating to the classification of deferred and current taxation assets
and liabilities in the Company’s consolidated statements of financial position as at 31 December 2023, as at 30 September 2024
and as at 31 December 2024. Selected line items for those consolidated statements of financial position have been revised to
correct those errors, as presented in the tables that follow. Management has determined that these errors are not material.
As at 31 December 2024 | |||
US Dollar million | Previously Reported | Adjustments Unaudited | Revised Unaudited |
ASSETS | |||
Non-current assets | |||
Deferred taxation | 12 | 73 | 85 |
Total assets | 13,157 | 73 | 13,230 |
EQUITY AND LIABILITIES | |||
Non-current liabilities | |||
Deferred taxation | 519 | (17) | 502 |
Current liabilities | |||
Taxation | 187 | 90 | 277 |
Total liabilities | 4,644 | 73 | 4,717 |
As at 30 September 2024 | |||
US Dollar million | Previously Reported | Adjustments Unaudited | Revised Unaudited |
ASSETS | |||
Non-current assets | |||
Deferred taxation | 14 | 59 | 73 |
Total assets | 8,801 | 59 | 8,860 |
EQUITY AND LIABILITIES | |||
Non-current liabilities | |||
Deferred taxation | 464 | (27) | 437 |
Current liabilities | |||
Taxation | 171 | 86 | 257 |
Total liabilities | 4,629 | 59 | 4,688 |
As at 31 December 2023 | |||
US Dollar million | Previously Reported | Adjustments Unaudited | Revised Unaudited |
ASSETS | |||
Non-current assets | |||
Deferred taxation | 50 | 82 | 132 |
Total assets | 8,175 | 82 | 8,257 |
EQUITY AND LIABILITIES | |||
Current liabilities | |||
Taxation | 64 | 82 | 146 |
Total liabilities | 4,435 | 82 | 4,517 |
The revised amounts shown herein are preliminary, unaudited and have not been reviewed by PricewaterhouseCoopers Inc.,
the Company’s independent registered public accounting firm, and may be subject to change as the Company and
PricewaterhouseCoopers Inc. complete their procedures.
Controls and procedures
Management is also in the process of evaluating the nature and magnitude of the deficiency or deficiencies in the Company’s
internal control over financial reporting (“ICFR”) that led to these errors. The evaluation and remedial steps with regard to the
relevant deficiency or deficiencies will be considered as part of management’s assessment of the effectiveness of ICFR as of
31 December 2025 as will be disclosed in the Company’s annual report on Form 20-F for the financial year ending
31 December 2025.
Q3 2025 EARNINGS RELEASE | 18 | | |||
| ||||||
GROUP I FINANCIAL RESULTS | ||||||
INCOME STATEMENT
GROUP INCOME STATEMENT | Quarter | Quarter | Nine months | Nine months |
ended | ended | ended | ended | |
Sep | Sep | Sep | Sep | |
2025 | 2024 | 2025 | 2024 | |
US Dollar millions, except as otherwise noted | Unaudited | Unaudited | Unaudited | Unaudited |
Revenue from product sales | 2,417 | 1,491 | 6,825 | 4,043 |
Cost of sales | (1,225) | (921) | (3,597) | (2,683) |
(Loss) gain on non-hedge derivatives and other commodity contracts | — | (29) | — | (70) |
Gross profit | 1,192 | 541 | 3,228 | 1,290 |
Corporate administration, marketing and related expenses | (32) | (20) | (93) | (86) |
Exploration and evaluation costs | (72) | (72) | (177) | (177) |
(Impairment) reversal of impairment, (derecognition of assets) and profit (loss) on disposal (1) | (3) | (13) | 22 | (14) |
Other expenses | (62) | (46) | (186) | (118) |
Finance income | 43 | 33 | 114 | 122 |
Foreign exchange and fair value adjustments | (12) | (21) | (57) | (46) |
Finance costs and unwinding of obligations | (81) | (42) | (166) | (126) |
Share of associates and joint ventures’ profit | 84 | 34 | 147 | 129 |
Profit before taxation | 1,057 | 394 | 2,832 | 974 |
Taxation | (242) | (160) | (669) | (419) |
Profit for the period | 815 | 234 | 2,163 | 555 |
Attributable to: | ||||
Equity shareholders | 669 | 223 | 1,781 | 534 |
Non-controlling interests | 146 | 11 | 382 | 21 |
815 | 234 | 2,163 | 555 | |
Basic earnings per ordinary share (US cents) (2) | 132 | 53 | 350 | 127 |
Diluted earnings per ordinary share (US cents) (3) | 131 | 53 | 350 | 127 |
(1) (Impairment) reversal of impairment, (derecognition of assets) and profit (loss) on disposal line item for the nine months ended 30 September 2025 includes a reversal of impairment for Mineração Serra Grande mine (MSG) of $74m (gross of taxation), partially offset by a loss on disposal of $47m relating to the sale of the Doropo and Archean-Birimian Contact (ABC) projects. | ||||
(2) Calculated on the basic weighted average number of ordinary shares. | ||||
(3) Calculated on the diluted weighted average number of ordinary shares. | ||||
Q3 2025 EARNINGS RELEASE | 19 | | |||
| ||||||
GROUP I FINANCIAL RESULTS | ||||||
STATEMENT OF FINANCIAL POSITION
GROUP STATEMENT OF FINANCIAL POSITION | As at | As at | As at | |
Sep | Sep | Dec | ||
2025 | 2024 | 2024 | ||
US Dollar millions, except as otherwise noted | Unaudited | Unaudited Revised | Unaudited Revised | |
ASSETS | ||||
Non-current assets | ||||
Tangible assets | 8,456 | 4,724 | 8,512 | |
Right of use assets | 156 | 143 | 123 | |
Intangible assets | 105 | 109 | 98 | |
Investments in associates and joint ventures | 664 | 689 | 530 | |
Other investments | 13 | 48 | 54 | |
Loan receivable | 141 | 289 | 203 | |
Inventories | 170 | 20 | 158 | |
Trade, other receivables and other assets (1) (2) | 304 | 189 | 213 | |
Contingent considerations (2) | 68 | 34 | 30 | |
Reimbursive right for post-retirement benefits | 58 | 62 | 49 | |
Deferred taxation | 115 | 73 | 85 | |
Cash restricted for use | 43 | 34 | 41 | |
10,293 | 6,414 | 10,096 | ||
Current assets | ||||
Loan receivable | 269 | 105 | 260 | |
Inventories | 1,058 | 832 | 1,055 | |
Trade, other receivables and other assets (2) (3) | 404 | 253 | 356 | |
Contingent considerations (2) | 12 | 5 | 18 | |
Taxation | 7 | — | — | |
Cash restricted for use | 24 | 19 | 20 | |
Cash and cash equivalents | 2,546 | 1,232 | 1,425 | |
Assets held for sale (4) | 223 | — | — | |
4,543 | 2,446 | 3,134 | ||
Total assets | 14,836 | 8,860 | 13,230 | |
EQUITY AND LIABILITIES | ||||
Share capital and premium | 552 | 438 | 526 | |
Accumulated losses and other reserves | 7,138 | 3,689 | 6,103 | |
Shareholders’ equity | 7,690 | 4,127 | 6,629 | |
Non-controlling interests | 1,864 | 45 | 1,884 | |
Total equity | 9,554 | 4,172 | 8,513 | |
Non-current liabilities | ||||
Borrowings | 2,025 | 1,939 | 1,901 | |
Lease liabilities | 126 | 84 | 65 | |
Environmental rehabilitation and other provisions (5) | 751 | 650 | 656 | |
Provision for pension and post-retirement benefits | 65 | 72 | 57 | |
Trade and other payables | 5 | 5 | 6 | |
Deferred taxation | 550 | 437 | 502 | |
3,522 | 3,187 | 3,187 | ||
Current liabilities | ||||
Borrowings | 96 | 200 | 83 | |
Lease liabilities | 54 | 80 | 76 | |
Environmental rehabilitation and other provisions (5) | 119 | 115 | 109 | |
Trade and other payables | 925 | 822 | 957 | |
Taxation | 453 | 257 | 277 | |
Bank overdraft | 14 | 7 | 28 | |
Liabilities held for sale (4) | 99 | 20 | — | |
1,760 | 1,501 | 1,530 | ||
Total liabilities | 5,282 | 4,688 | 4,717 | |
Total equity and liabilities | 14,836 | 8,860 | 13,230 | |
(1) The increase in non-current trade, other receivables and other assets from December 2024 is mainly as a result of the deferred consideration recognised for the sale
of the Doropo project of $103m.
(2) Contingent considerations, which were previously reported as part of trade, other receivables and other assets, are now reported separately on the statement of
financial position as these assets have a different measurement basis. Comparative periods have been reclassified. The increase in contingent considerations from
December 2024 is mainly as a result of contingent considerations recognised for the sale of the Doropo and ABC projects of $34m.
(3) The increase in current trade, other receivables and other assets from December 2024 is mainly as a result of an increase in trade receivables of $29m, other
prepayments of $23m, Kibali dividend declared of $18m in September 2025 and recoverable taxes of $50m, partly offset by the receipt of the Siguiri insurance claim
of $21m and the Kibali dividend of $55m declared in December 2024.
(4) The increase in assets and liabilities held for sale is as a result of MSG being classified as a disposal group held for sale, pending completion of the sale.
(5) The increase in environmental rehabilitation and other provisions in total from December 2024 is mainly as a result of an increase in the closure provisions at Brazil
due to the finalisation of the design review for the de-characterisation of the TSFs at AngloGold Ashanti Mineração ($73m), other change in estimates ($38m) and
unwinding of the provision ($25m), partly offset by MSG provisions transferred to liabilities held for sale ($34m).
Q3 2025 EARNINGS RELEASE | 20 | | |||
| ||||||
GROUP I FINANCIAL RESULTS | ||||||
STATEMENT OF CASH FLOWS
GROUP STATEMENT OF CASH FLOWS | Quarter | Quarter | Nine months | Nine months | |
ended | ended | ended | ended | ||
Sep | Sep | Sep | Sep | ||
2025 | 2024 | 2025 | 2024 | ||
US Dollar millions, except as otherwise noted | Unaudited | Unaudited | Unaudited | Unaudited | |
Cash flows from operating activities | |||||
Cash generated from operations | 1,457 | 615 | 3,507 | 1,350 | |
Dividends received from joint ventures | 37 | 8 | 55 | 44 | |
Taxation refund | 10 | 6 | 10 | 6 | |
Taxation paid | (85) | (23) | (410) | (122) | |
Net cash inflow from operating activities | 1,419 | 606 | 3,162 | 1,278 | |
Cash flows from investing activities | |||||
Capital expenditure on tangible and intangible assets | (342) | (267) | (995) | (757) | |
Proceeds from disposal of tangible assets | — | — | — | 1 | |
Proceeds from disposal of subsidiary | — | — | 25 | — | |
Deferred compensation received | — | — | 19 | 5 | |
Other investments and assets acquired | — | (11) | (3) | (29) | |
Proceeds on disposal of investment (1) | 70 | — | 70 | — | |
Loans advanced to associates and joint ventures | — | — | — | (1) | |
(Increase) decrease in cash restricted for use | (11) | (1) | (4) | 15 | |
Interest received | 23 | 21 | 68 | 81 | |
Repayment of loans advanced to joint ventures | — | 49 | 77 | 139 | |
Net cash outflow from investing activities | (260) | (209) | (743) | (546) | |
Cash flows from financing activities | |||||
Proceeds from borrowings | — | 155 | 285 | 475 | |
Repayment of borrowings | — | (151) | (180) | (571) | |
Repayment of lease liabilities | (23) | (25) | (69) | (68) | |
Finance costs – borrowings | (21) | (27) | (75) | (90) | |
Finance costs – leases | (4) | (3) | (12) | (8) | |
Other borrowing costs | — | (1) | — | (1) | |
Dividends paid | (562) | (99) | (1,201) | (179) | |
Net cash outflow from financing activities | (610) | (151) | (1,252) | (442) | |
Net increase in cash and cash equivalents | 549 | 246 | 1,167 | 290 | |
Translation | (11) | (4) | (20) | (20) | |
Reclassification to disposal group held for sale | 8 | — | (12) | — | |
Cash and cash equivalents at beginning of period (net of bank overdraft) | 1,986 | 983 | 1,397 | 955 | |
Cash and cash equivalents at end of period (net of bank overdraft) | 2,532 | 1,225 | 2,532 | 1,225 | |
(1) The proceeds relate to the disposal of the investment in G2 Goldfields Inc.
Q3 2025 EARNINGS RELEASE | 21 | | |||
| ||||||
GROUP I SEGMENTAL | ||||||
GOLD AND BY-PRODUCT INCOME
AngloGold Ashanti’s operating segments are being reported based on the financial information regularly provided to the Chief
Executive Officer and the Executive Committee, collectively identified as the Chief Operating Decision Maker (CODM). Individual
members of the Executive Committee are responsible for geographic regions of the business. Under the Group’s operating model,
the financial results and the composition of the operating segments are reported to the CODM per geographical region and the
Projects segment which comprises all the major non-sustaining capital projects with the potential to be developed into operating
entities. In addition to the geographical reportable segments structure, the Group has voluntarily disaggregated and disclosed the
financial information on a line-by-line basis for each mining operation to facilitate comparability of mine performance.
GOLD INCOME | Quarter | Quarter | Nine months | Nine months | |
ended | ended | ended | ended | ||
Sep | Sep | Sep | Sep | ||
2025 | 2024 | 2025 | 2024 | ||
US Dollar millions, except as otherwise noted | Unaudited | Unaudited | Unaudited | Unaudited | |
AFRICA | 1,779 | 943 | 4,969 | 2,642 | |
Kibali - Attributable 45% | 294 | 193 | 711 | 533 | |
Iduapriem | 202 | 149 | 480 | 438 | |
Obuasi | 238 | 123 | 614 | 372 | |
Siguiri | 151 | 181 | 662 | 472 | |
Geita | 418 | 297 | 1,246 | 827 | |
Sukari | 476 | — | 1,256 | — | |
AUSTRALIA | 429 | 392 | 1,226 | 953 | |
Sunrise Dam | 176 | 178 | 542 | 450 | |
Tropicana - Attributable 70% | 253 | 214 | 684 | 503 | |
AMERICAS | 459 | 324 | 1,223 | 895 | |
Cerro Vanguardia | 169 | 116 | 464 | 323 | |
AngloGold Ashanti Mineração (1) | 236 | 166 | 623 | 439 | |
Serra Grande | 54 | 42 | 136 | 133 | |
2,667 | 1,659 | 7,418 | 4,490 | ||
Equity-accounted joint venture included above | (294) | (193) | (711) | (533) | |
2,373 | 1,466 | 6,707 | 3,957 | ||
(1) Includes income from sale of gold concentrate. | |||||
BY-PRODUCT REVENUE | |||||
US Dollar millions, except as otherwise noted | Unaudited | Unaudited | Unaudited | Unaudited | |
AFRICA | 3 | 1 | 8 | 4 | |
Kibali - Attributable 45% | 1 | — | 2 | 1 | |
Obuasi | — | — | 1 | — | |
Siguiri | — | — | — | 1 | |
Geita | 1 | 1 | 3 | 2 | |
Sukari | 1 | — | 2 | — | |
AUSTRALIA | 1 | 1 | 4 | 3 | |
Sunrise Dam | — | — | 1 | 1 | |
Tropicana - Attributable 70% | 1 | 1 | 3 | 2 | |
AMERICAS | 41 | 23 | 108 | 80 | |
Cerro Vanguardia | 36 | 23 | 94 | 80 | |
AngloGold Ashanti Mineração | 5 | — | 14 | — | |
45 | 25 | 120 | 87 | ||
Equity-accounted joint venture included above | (1) | — | (2) | (1) | |
44 | 25 | 118 | 86 | ||
Q3 2025 EARNINGS RELEASE | 22 | | |||
| ||||||
GROUP I SEGMENTAL | ||||||
COST OF SALES AND GROSS PROFIT
COST OF SALES | Quarter | Quarter | Nine months | Nine months | |
ended | ended | ended | ended | ||
Sep | Sep | Sep | Sep | ||
2025 | 2024 | 2025 | 2024 | ||
US Dollar millions, except as otherwise noted | Unaudited | Unaudited | Unaudited | Unaudited | |
AFRICA | 841 | 553 | 2,477 | 1,645 | |
Kibali - Attributable 45% | 123 | 104 | 336 | 278 | |
Iduapriem | 115 | 93 | 316 | 260 | |
Obuasi | 118 | 78 | 320 | 259 | |
Siguiri | 118 | 124 | 418 | 384 | |
Geita | 170 | 154 | 520 | 464 | |
Sukari | 198 | — | 568 | — | |
Administration and other | (1) | — | (1) | — | |
AUSTRALIA | 249 | 249 | 724 | 687 | |
Sunrise Dam | 110 | 101 | 326 | 317 | |
Tropicana - Attributable 70% | 128 | 139 | 369 | 344 | |
Administration and other | 11 | 9 | 29 | 26 | |
AMERICAS | 261 | 222 | 728 | 627 | |
Cerro Vanguardia | 121 | 94 | 347 | 269 | |
AngloGold Ashanti Mineração | 100 | 90 | 271 | 254 | |
Serra Grande | 40 | 38 | 108 | 103 | |
Administration and other | — | — | 2 | 1 | |
CORPORATE AND OTHER | (3) | 1 | 4 | 2 | |
1,348 | 1,025 | 3,933 | 2,961 | ||
Equity-accounted joint venture included above | (123) | (104) | (336) | (278) | |
1,225 | 921 | 3,597 | 2,683 | ||
GROSS PROFIT (1) | |||||
US Dollar millions, except as otherwise noted | Unaudited | Unaudited | Unaudited | Unaudited | |
AFRICA | 940 | 391 | 2,499 | 1,002 | |
Kibali - Attributable 45% | 172 | 89 | 377 | 256 | |
Iduapriem | 87 | 56 | 163 | 179 | |
Obuasi | 120 | 45 | 295 | 114 | |
Siguiri | 33 | 57 | 244 | 88 | |
Geita | 249 | 144 | 729 | 365 | |
Sukari | 278 | — | 690 | — | |
Administration and other | 1 | — | 1 | — | |
AUSTRALIA | 182 | 145 | 507 | 269 | |
Sunrise Dam | 67 | 78 | 218 | 135 | |
Tropicana - Attributable 70% | 126 | 76 | 318 | 161 | |
Administration and other | (11) | (9) | (29) | (27) | |
AMERICAS | 239 | 125 | 603 | 347 | |
Cerro Vanguardia | 83 | 45 | 211 | 133 | |
AngloGold Ashanti Mineração | 141 | 77 | 366 | 185 | |
Serra Grande | 15 | 4 | 28 | 30 | |
Administration and other | — | (1) | (2) | (1) | |
CORPORATE AND OTHER | 3 | (31) | (4) | (72) | |
1,364 | 630 | 3,605 | 1,546 | ||
Equity-accounted joint venture included above | (172) | (89) | (377) | (256) | |
1,192 | 541 | 3,228 | 1,290 | ||
(1) The Group’s segmental profit measure is gross profit, which excludes the results of associates and joint ventures. For the reconciliation of gross profit to profit before taxation, refer to the Group income statement. | |||||
Q3 2025 EARNINGS RELEASE | 23 | | |||
| ||||||
GROUP I SEGMENTAL | ||||||
AMORTISATION AND CAPITAL EXPENDITURE
AMORTISATION | Quarter | Quarter | Nine months | Nine months | |
ended | ended | ended | ended | ||
Sep | Sep | Sep | Sep | ||
2025 | 2024 | 2025 | 2024 | ||
US Dollar millions, except as otherwise noted | Unaudited | Unaudited | Unaudited | Unaudited | |
AFRICA | 235 | 109 | 663 | 312 | |
Kibali - Attributable 45% | 32 | 23 | 79 | 67 | |
Iduapriem | 29 | 19 | 85 | 60 | |
Obuasi | 24 | 20 | 66 | 53 | |
Siguiri | 13 | 12 | 46 | 37 | |
Geita | 48 | 35 | 129 | 95 | |
Sukari | 89 | — | 258 | — | |
AUSTRALIA | 46 | 49 | 122 | 132 | |
Sunrise Dam | 16 | 19 | 45 | 58 | |
Tropicana - Attributable 70% | 29 | 30 | 76 | 73 | |
Administration and other | 1 | — | 1 | 1 | |
AMERICAS | 57 | 48 | 156 | 133 | |
Cerro Vanguardia | 23 | 15 | 60 | 40 | |
AngloGold Ashanti Mineração | 26 | 28 | 74 | 78 | |
Serra Grande | 8 | 5 | 22 | 15 | |
CORPORATE AND OTHER | 1 | 1 | 3 | 3 | |
339 | 207 | 944 | 580 | ||
Equity-accounted joint venture included above | (32) | (23) | (79) | (67) | |
307 | 184 | 865 | 513 | ||
CAPITAL EXPENDITURE | |||||
US Dollar millions, except as otherwise noted | Unaudited | Unaudited | Unaudited | Unaudited | |
AFRICA | 271 | 212 | 781 | 567 | |
Kibali - Attributable 45% | 46 | 28 | 110 | 89 | |
Iduapriem | 38 | 49 | 110 | 119 | |
Obuasi | 57 | 60 | 145 | 149 | |
Siguiri | 20 | 30 | 52 | 73 | |
Geita | 51 | 45 | 180 | 137 | |
Sukari | 59 | — | 184 | — | |
AUSTRALIA | 49 | 27 | 124 | 112 | |
Sunrise Dam | 28 | 16 | 58 | 38 | |
Tropicana - Attributable 70% | 21 | 11 | 66 | 74 | |
AMERICAS | 60 | 52 | 165 | 143 | |
Cerro Vanguardia | 12 | 19 | 43 | 48 | |
AngloGold Ashanti Mineração | 35 | 23 | 89 | 68 | |
Serra Grande | 13 | 10 | 33 | 27 | |
PROJECTS | 7 | 4 | 34 | 23 | |
Colombian projects | 2 | 2 | 12 | 5 | |
North American projects | 5 | 2 | 22 | 18 | |
CORPORATE AND OTHER | 1 | — | 1 | 1 | |
388 | 295 | 1,105 | 846 | ||
Equity-accounted joint venture included above | (46) | (28) | (110) | (89) | |
342 | 267 | 995 | 757 | ||
Q3 2025 EARNINGS RELEASE | 24 | | |||
| ||||||
GROUP I SEGMENTAL | ||||||
TOTAL ASSETS
TOTAL ASSETS | As at | As at | As at | |
Sep | Sep | Dec | ||
2025 | 2024 | 2024 | ||
US Dollar millions, except as otherwise noted | Unaudited | Unaudited Revised | Unaudited Revised | |
AFRICA | 9,451 | 4,773 | 9,081 | |
Kibali - Attributable 45% | 1,008 | 1,025 | 950 | |
Iduapriem | 706 | 604 | 579 | |
Obuasi | 1,584 | 1,429 | 1,481 | |
Siguiri | 609 | 558 | 591 | |
Geita | 1,415 | 1,151 | 1,231 | |
Sukari | 4,119 | — | 4,243 | |
Administration and other | 10 | 6 | 6 | |
AUSTRALIA | 997 | 946 | 845 | |
AMERICAS | 1,834 | 1,514 | 1,534 | |
Cerro Vanguardia | 564 | 641 | 626 | |
AngloGold Ashanti Mineração | 1,029 | 723 | 729 | |
Serra Grande | 223 | 131 | 161 | |
Administration and other | 18 | 19 | 18 | |
PROJECTS | 929 | 859 | 991 | |
Colombian projects | 222 | 199 | 207 | |
North American projects | 707 | 660 | 784 | |
CORPORATE AND OTHER | 1,625 | 768 | 780 | |
14,836 | 8,860 | 13,230 | ||
By order of the Board | ||||
J TILK Chairman | A CALDERON Chief Executive Officer | G DORAN Chief Financial Officer | ||
10 November 2025 | ||||
Q3 2025 EARNINGS RELEASE | 25 | | |||
| ||||||
2025 I DIVIDENDS | ||||||
AngloGold Ashanti plc today announces an interim dividend for the three months ended 30 September 2025 of 91 US cents per
share. In respect of the interim dividend, the timelines, including dates for currency conversions, set out below will apply.
To holders of ordinary shares on the New York Stock Exchange (NYSE)
2025 | ||
Ex-dividend on NYSE | Friday, 28 November | |
Record date | Friday, 28 November | |
Payment date | Friday, 12 December | |
To holders of ordinary shares on the South African Register
Additional information for South African resident shareholders of AngloGold Ashanti:
Shareholders registered on the South African section of the register are advised that the distribution of 91 US cents per ordinary
share will be converted to South African rands at the applicable exchange rate.
In compliance with the requirements of Strate and the Johannesburg Stock Exchange (JSE) Listings Requirements, the salient
dates for payment of the dividend are as follows:
2025 | ||
Declaration date | Tuesday, 11 November | |
Currency conversion rate for South African rands announcement date | Friday, 21 November | |
Last date to trade ordinary shares cum dividend | Tuesday, 25 November | |
Ordinary shares trade ex-dividend | Wednesday, 26 November | |
Record date | Friday, 28 November | |
Payment date | Friday, 12 December | |
Dividends in respect of dematerialised shareholdings will be credited to shareholders’ accounts with the relevant CSDP (as defined
below) or broker.
To comply with further requirements of Strate, share certificates may not be dematerialised or rematerialised between Wednesday,
26 November 2025 and Friday, 28 November 2025, both days inclusive. No transfers between South African, NYSE and Ghanaian
share registers will be permitted between Friday, 21 November 2025 and Friday, 28 November 2025, both days inclusive.
Details of the exchange rates applicable to the dividend and a summary of the tax considerations applicable to South African
shareholders is expected to be published on Friday, 21 November 2025.
To Beneficial Owners on the Ghana sub-register holding shares through the nominee arrangement with the
Central Securities Depositary (GH) LTD
2025 | |||
Currency conversion date | Friday, 21 November | ||
Last date to trade and to register shares cum dividend | Tuesday, 25 November | ||
Shares trade ex-dividend | Wednesday, 26 November | ||
Record date | Friday, 28 November | ||
Approximate payment date of dividend | Friday, 12 December | ||
To Beneficial Owners holding Ghanaian Depositary Shares (GhDSs) and acting by National Trust Holding
Company Ltd as depository agent 100 GhDSs represent one ordinary share
2025 | |||
Currency conversion date | Friday, 21 November | ||
Last date to trade and to register GhDSs cum dividend | Tuesday, 25 November | ||
GhDSs trade ex-dividend | Wednesday, 26 November | ||
Record date | Friday, 28 November | ||
Approximate payment date of dividend | Friday, 12 December | ||
Beneficial owners on the Ghana sub-register holding shares and beneficial owners holding GhDSs are advised that the distribution
of 91 US cents per ordinary share will be converted to Ghanaian cedis at the applicable exchange rate. Assuming an exchange
rate of US$1/¢10.20, the gross dividend payable per share, is equivalent to ca. ¢9.282 Ghanaian cedis. However, the actual rate of
payment will depend on the exchange rate on the date for currency conversion.
Entitlement to interim dividends
A “Shareholder of Record” is a person appearing on the register of members of the Company in respect of ordinary shares at the
close of business on the relevant record date. A “Beneficial Owner” is a person who holds ordinary shares of the Company through
a bank, broker, central securities depository participant (“CSDP”), Shareholder of Record or other agent (sometimes referred to as
holding shares “in street name”).
Q3 2025 EARNINGS RELEASE | 26 | | |||
| ||||||
NON-GAAP DISCLOSURE I RESULTS | ||||||
Non-GAAP disclosure
From time to time AngloGold Ashanti may publicly disclose certain “Non-GAAP” financial measures in the course of its financial
presentations, earnings releases, earnings conference calls and otherwise.
In this document, AngloGold Ashanti presents the financial items “total cash costs”, “total cash costs per ounce”, “all-in sustaining
costs”, “all-in sustaining costs per ounce”, “average gold price received per ounce”, “sustaining capital expenditure” and “non-
sustaining capital expenditure”, which have been determined using industry guidelines and practices and are not measures under
IFRS. In addition, AngloGold Ashanti also presents the financial items “Adjusted EBITDA”, “Adjusted net debt (cash)” and “free
cash flow” which are not measures under IFRS either. An investor should not consider these items in isolation or as alternatives to
cost of sales, gold income, capital expenditure, profit (loss) before taxation, total borrowings, cash flows from operating activities or
any other measure of financial performance presented in accordance with IFRS or as an indicator of the Group’s performance. The
Group uses certain Non-GAAP performance measures and ratios in managing the business and may provide users of this financial
information with additional meaningful comparisons between current results and results in prior operating periods. Non-GAAP
financial measures should be viewed in addition to, and not as an alternative to, the reported operating results or any other
measure of performance prepared in accordance with IFRS. In addition, the presentation of these measures may not be
comparable to similarly titled measures that other companies use.
The term “managed operations” refers to subsidiaries managed by AngloGold Ashanti and included in its consolidated reporting,
while the term “non-managed joint ventures” refers to equity-accounted joint ventures that are reported based on AngloGold
Ashanti’s share of attributable earnings and are not managed by AngloGold Ashanti. Managed operations are reported on a
consolidated basis. Non-managed joint ventures are reported on an attributable basis.
All-in sustaining costs
During 2018, the World Gold Council (“WGC”), an industry body, published a revised Guidance Note on the “all-in sustaining costs”
metric, which gold mining companies can use to supplement their overall Non-GAAP disclosure. The WGC worked closely with its
members (including AngloGold Ashanti) to develop these Non-GAAP measures which are intended to provide further transparency
into the full cost associated with producing gold. It is expected that this metric, which AngloGold Ashanti provides herein, will be
helpful to investors, governments, local communities and other stakeholders in understanding the economics of gold mining.
“All-in sustaining costs” is a Non-GAAP measure which is an extension of the existing “total cash costs” metric and incorporates all
costs related to sustaining production and in particular, recognises sustaining capital expenditures associated with developing and
maintaining gold mines. In addition, this metric includes the cost associated with Corporate Office structures that support these
operations, the community and environmental rehabilitation costs attendant with responsible mining and any exploration and
evaluation cost associated with sustaining current operations. “All-in sustaining costs per ounce - managed operations” ($/oz) is
calculated by dividing the consolidated US dollar value of this cost metric by the consolidated ounces of gold sold. “All-in sustaining
costs per ounce - non-managed joint ventures” ($/oz) is calculated by dividing the attributable US dollar value of this cost metric by
the attributable ounces of gold sold.
Total cash costs
“Total cash costs” is calculated in accordance with the guidelines of the Gold Institute industry standard and industry practice and is
a Non-GAAP measure. The Gold Institute, which has been incorporated into the National Mining Association, is a non-profit
international association of miners, refiners, bullion suppliers and manufacturers of gold products, which developed a uniform
format for reporting total cash costs on a per ounce basis. The guidance was first adopted in 1996 and revised in November 1999.
“Total cash costs” is a Non-GAAP measure and, as calculated and reported by AngloGold Ashanti, include costs for all mining,
processing, onsite administration costs, royalties and production taxes, as well as contributions from by-products, but exclude
amortisation of tangible, intangible and right of use assets, rehabilitation costs and other non-cash costs, retrenchment costs,
corporate administration, marketing and related costs, capital costs and exploration costs. “Total cash costs per ounce - managed
operations” ($/oz) is calculated by dividing the consolidated US dollar value of this cost metric by the consolidated ounces of gold
produced. “Total cash costs per ounce - non-managed joint ventures” ($/oz) is calculated by dividing the attributable US dollar
value of this cost metric by the attributable ounces of gold produced.
Average gold price received per ounce
“Average gold price received per ounce” is a Non-GAAP measure which gives an indication of revenue earned per ounce of gold
sold and serves as a benchmark of performance against the market spot gold price. “Average gold price received per ounce -
managed operations” is calculated by dividing the consolidated US dollar value of this revenue metric by the consolidated ounces
of gold sold. “Average gold price received per ounce - non-managed joint ventures” is calculated by dividing the attributable US
dollar value of this revenue metric by the attributable ounces of gold sold.
The “average gold price received per ounce” for the three months and nine months ended 30 September 2024 has been restated
to be based on the gold revenue from primary operating activities. Previously, the gold price received per ounce calculation
included revenue from normal operating activities as well as hedging activities.
Sustaining capital expenditure
“Sustaining capital (expenditure)” is a Non-GAAP measure comprising capital expenditure incurred to sustain and maintain existing
assets at their current productive capacity in order to achieve constant planned levels of productive output and capital expenditure
to extend useful lives of existing production assets. This includes replacement of vehicles, plant and machinery, Mineral Reserve
development, deferred stripping and capital expenditure related to financial benefit initiatives, safety, health and the environment.
Q3 2025 EARNINGS RELEASE | 27 | | |||
| ||||||
NON-GAAP DISCLOSURE I RESULTS | ||||||
CONTINUED
Non-sustaining capital expenditure
“Non-sustaining capital (expenditure)” is a Non-GAAP measure comprising capital expenditure incurred at new operations and
capital expenditure related to ‘major projects’ at existing operations where these projects will materially increase production.
While the Gold Institute provided definitions for the calculation of “total cash costs” and the WGC published a revised Guidance
Note on the “all-in sustaining costs” metric during 2018, the calculation of “total cash costs”, “total cash costs per ounce”, “all-in
sustaining costs” and “all-in sustaining costs per ounce” may vary significantly among gold mining companies, and by themselves
do not necessarily provide a basis for comparison with other gold mining companies. However, AngloGold Ashanti believes that
“total cash costs” and “all-in sustaining costs” in total by mine and per ounce by mine as well as “average gold price received per
ounce”, “sustaining capital expenditure” and “non-sustaining capital expenditure” are useful indicators to investors and
management as they provide:
•an indication of profitability, efficiency and cash flows;
•the trend in costs as the mining operations mature over time on a consistent basis; and
•an internal benchmark of performance to allow for comparison against other mines, both within the Group and at other gold
mining companies.
Management prepares its internal management reporting documentation, for use and decision making by the Chief Operating
Decision Maker (CODM), on a total basis.
The key metrics are based on the total ounces, gold income, “total cash costs”, “all-in sustaining costs”, “sustaining capital
expenditure” and “non-sustaining capital expenditure” from each operation and as a consequence includes AngloGold Ashanti’s
share of the “total cash costs”, “all-in sustaining costs”, “sustaining capital expenditure” and “non-sustaining capital expenditure” of
its non-managed joint ventures that are accounted for under the equity method. In a capital intensive industry, this basis allows
management to make operating and resource allocation decisions on a comparable basis between mining operations irrespective
of whether they are consolidated or accounted for under the equity method. This basis of calculating the metrics is consistent with
the WGC’s Guidance Note on the “all-in sustaining costs” metric.
Although AngloGold Ashanti has shareholder rights and board representation commensurate with its ownership interests in its
equity-accounted non-managed joint ventures and reviews the underlying operating results including “total cash costs”, “all-in
sustaining costs”, “sustaining capital expenditure” and “non-sustaining capital expenditure” with them at each reporting period, it
does not have direct control over their operations or resulting revenue and expenses, nor does it have a proportionate legal interest
in each financial statement line item. AngloGold Ashanti’s use of “total cash costs”, “all-in sustaining costs”, “sustaining capital
expenditure” and “non-sustaining capital expenditure” on a total basis, is not intended to imply that it has any such control or
proportionate legal interest, but rather to reflect the Non-GAAP measures on a basis consistent with its internal and external
segmental reporting.
Adjusted EBITDA
“Adjusted EBITDA” is a Non-GAAP measure and, as calculated and reported by AngloGold Ashanti, includes profit (loss) before
taxation, amortisation of tangible, intangible and right of use assets, retrenchment costs at the operations, finance income, other
gains (losses), care and maintenance costs, finance costs and unwinding of obligations, impairment and derecognition of assets,
impairment of investments, profit (loss) on disposal of assets and investments, gain (loss) on early settlement of hedge contracts,
fair value adjustments, repurchase premium and costs on settlement of issued bonds and the share of associates’ EBITDA. The
Adjusted EBITDA calculation is based on the formula included in AngloGold Ashanti’s Revolving Credit Facility Agreements for
compliance with the debt covenant formula.
“Adjusted EBITDA margin” is calculated as the percentage of Adjusted EBITDA divided by revenue from product sales.
Adjusted net debt (cash)
“Adjusted net debt (cash)” is a Non-GAAP measure and, as calculated and reported by AngloGold Ashanti, includes total
borrowings adjusted for the unamortised portion of borrowing costs and IFRS 16 lease adjustments; less cash restricted for use
and cash and cash equivalents (net of bank overdraft). The Adjusted net debt (cash) calculation is based on the formula included in
AngloGold Ashanti’s Revolving Credit Facility Agreements for compliance with the debt covenant formula.
Free cash flow
AngloGold Ashanti has revised its definition of “free cash flow” in order to align it with industry practice. “Free cash flow" is a Non-
GAAP measure and, as calculated and reported by AngloGold Ashanti, includes operating cash flow less capital expenditure.
Operating cash flow is defined as net cash flow from operating activities, plus repayment of loans advanced to joint ventures, less
dividends paid to non-controlling interests. “Free cash flow” for the three months and nine months ended 30 September 2024 has
been adjusted to reflect this change in reporting.
Reconciliations
All-in sustaining costs and total cash costs per ounce
A reconciliation of cost of sales as included in AngloGold Ashanti’s Earnings Release for the three months and nine months ended
30 September 2025 and 30 September 2024, to “all-in sustaining costs”, “all-in sustaining costs per ounce”, “total cash costs” and
“total cash costs per ounce” for each of the three-month and nine-month periods ended 30 September 2025 and 30 September
2024, is presented on a total (Group), total (managed operations/non-managed joint ventures) and segment basis in Note A below.
Q3 2025 EARNINGS RELEASE | 28 | | |||
| ||||||
NON-GAAP DISCLOSURE I RESULTS | ||||||
CONTINUED
In addition, the Company has provided detail of the consolidated ounces of gold produced and sold by mine for each of those
periods below.
Average gold price received per ounce
A reconciliation of gold income as included in AngloGold Ashanti’s Earnings Release for the three months and nine months ended
30 September 2025 and 30 September 2024, to “average gold price received per ounce” for each of the three-month and nine-
month periods ended 30 September 2025 and 30 September 2024, is presented on a total (Group) and total (managed operations/
non-managed joint ventures) basis in Note B below.
Sustaining capital expenditure and non-sustaining capital expenditure
A reconciliation of capital expenditure as included in AngloGold Ashanti’s Earnings Release for the three months and nine months
ended 30 September 2025 and 30 September 2024, to “sustaining capital expenditure” and “non-sustaining capital expenditure” for
each of the three-month and nine-month periods ended 30 September 2025 and 30 September 2024, is presented on a total
(Group), total (managed operations/non-managed joint ventures) and segment basis in Note C below.
Adjusted EBITDA
A reconciliation of profit (loss) before taxation as included in AngloGold Ashanti’s Earnings Release for the three months and nine
months ended 30 September 2025 and 30 September 2024, to “Adjusted EBITDA” for each of the three-month and nine-month
periods ended 30 September 2025 and 30 September 2024, is presented on a total (Group) basis in Note D below.
Adjusted net debt (cash)
A reconciliation of total borrowings as included in AngloGold Ashanti’s Earnings Release as at 30 September 2025, 30 September
2024 and 31 December 2024 to “Adjusted net debt (cash)” as at 30 September 2025, 30 September 2024 and 31 December 2024,
is presented on a total (Group) basis in Note E below.
Free cash flow
A reconciliation of net cash flow from operating activities as included in AngloGold Ashanti’s Earnings Release for the three months
and nine months ended 30 September 2025 and 30 September 2024, to “free cash flow” for each of the three-month and nine-
month periods ended 30 September 2025 and 30 September 2024, is presented on a total (Group) basis in Note F below.
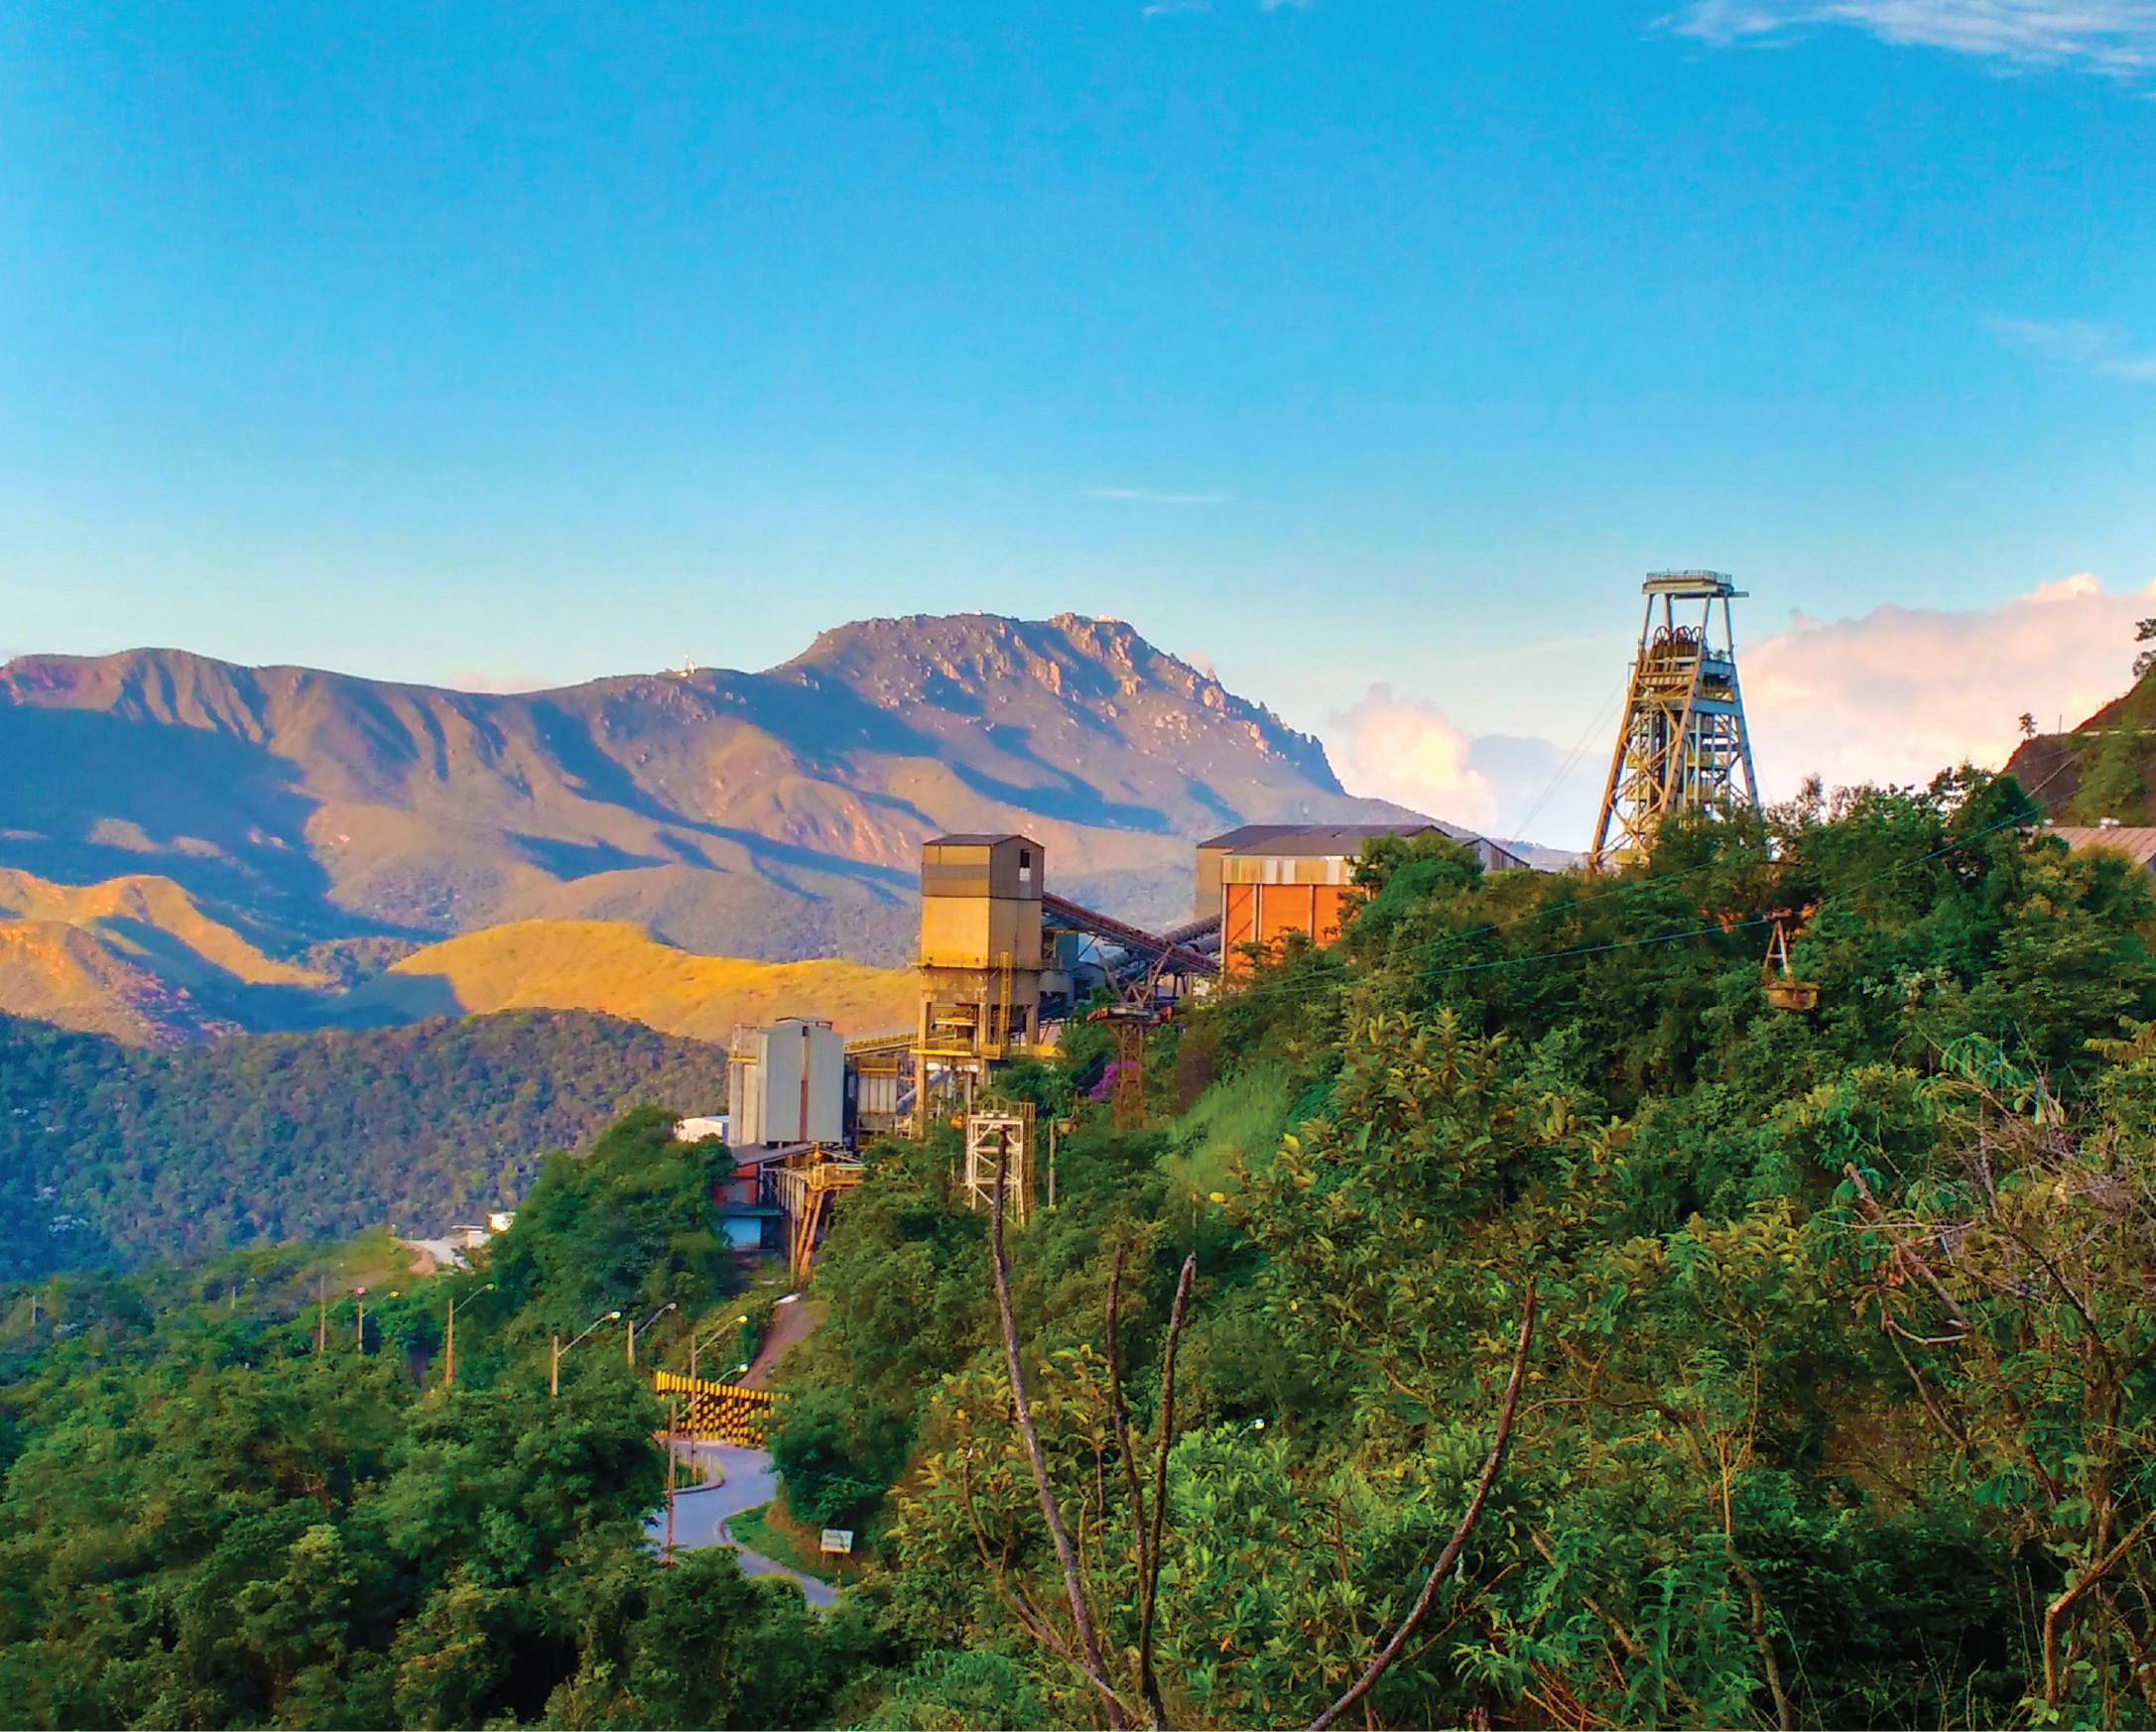
AGA Mineração, Cuiabá, Brazil
Q3 2025 EARNINGS RELEASE | 29 | | |||
| ||||||
NON-GAAP DISCLOSURE I NOTE A | ||||||
ALL-IN SUSTAINING COSTS | FOR THE QUARTER ENDED 30 SEPTEMBER 2025 | |||||||||||||
Corporate and other(3) | AFRICA | AUSTRALIA | ||||||||||||
Kibali | Non-managed joint ventures | Iduapriem | Obuasi | Siguiri | Geita | Sukari | Africa other | Managed operations | Sunrise Dam | Tropicana | Australia other | Australia | ||
in US Dollar million, except as otherwise noted | ||||||||||||||
Cost of sales per segmental information (2) | (3) | 123 | 123 | 115 | 118 | 118 | 170 | 198 | (1) | 718 | 110 | 128 | 11 | 249 |
By-product revenue | — | (1) | (1) | — | — | — | (1) | (1) | — | (2) | — | (1) | — | (1) |
Amortisation of tangible, intangible and right of use assets | (1) | (32) | (32) | (29) | (24) | (13) | (48) | (89) | — | (203) | (16) | (29) | (1) | (46) |
Adjusted for decommissioning and inventory amortisation | — | — | — | — | — | — | (1) | — | — | (1) | — | — | — | — |
Corporate administration, marketing and related expenses | 31 | — | — | — | — | — | — | — | — | — | — | — | — | — |
Lease payment sustaining | — | (2) | (2) | 1 | — | 1 | 6 | 1 | — | 9 | 4 | 6 | — | 10 |
Sustaining exploration and study costs | — | — | — | — | — | 3 | 3 | — | — | 6 | — | — | — | — |
Total sustaining capital expenditure | 1 | 26 | 26 | 23 | 49 | 18 | 46 | 32 | — | 168 | 28 | 8 | — | 36 |
All-in sustaining costs (5) | 28 | 114 | 114 | 110 | 144 | 126 | 175 | 141 | (1) | 695 | 125 | 113 | 10 | 248 |
Gold sold - oz (000) | — | 84 | 84 | 58 | 68 | 45 | 120 | 135 | — | 426 | 51 | 73 | — | 124 |
All-in sustaining costs per ounce - $/oz (1) | — | 1,355 | 1,355 | 1,902 | 2,109 | 2,804 | 1,464 | 1,041 | — | 1,631 | 2,439 | 1,558 | — | 2,007 |
(1) In addition to the operational performances of the mines, “all-in sustaining costs per ounce” and “total cash costs per ounce” are affected by fluctuations in the foreign currency exchange rate. AngloGold Ashanti reports “all-in sustaining costs per ounce” calculated to the nearest US dollar amount and gold sold in ounces. AngloGold Ashanti reports “total cash costs per ounce” calculated to the nearest US dollar amount and gold produced in ounces. “All-in sustaining costs per ounce” and “total cash costs per ounce” may not be calculated based on amounts presented in this table due to rounding. | ||||||||||||||
(2) Refer to Segmental reporting. | ||||||||||||||
(3) Corporate includes non-gold producing managed operations. | ||||||||||||||
(4) Total including equity-accounted non-managed joint ventures. | ||||||||||||||
(5) “Total cash costs” and “all-in sustaining costs” may not be calculated based on amounts presented in this table due to rounding. | ||||||||||||||
Rounding of figures may result in computational discrepancies. | ||||||||||||||
Q3 2025 EARNINGS RELEASE | 30 | | |||
| ||||||
NON-GAAP DISCLOSURE I NOTE A | ||||||
ALL-IN SUSTAINING COSTS | FOR THE QUARTER ENDED 30 SEPTEMBER 2025 | ||||||||||||
AMERICAS | Projects | GROUP | GROUP EXCL. SUKARI(6) | ||||||||||
Cerro Vanguardia | AngloGold Ashanti Mineração | Serra Grande | Americas other | Americas | Non- managed joint ventures | Managed operations | Group total (4) | Managed operations (Africa) | Managed operations | Group total (4) | |||
in US Dollar million, except as otherwise noted | |||||||||||||
Cost of sales per segmental information (2) | 121 | 100 | 40 | — | 261 | — | 123 | 1,225 | 1,348 | 520 | 1,027 | 1,150 | |
By-product revenue | (36) | (5) | — | — | (41) | — | (1) | (44) | (45) | (1) | (43) | (44) | |
Amortisation of tangible, intangible and right of use assets | (23) | (26) | (8) | — | (57) | — | (32) | (307) | (339) | (114) | (218) | (250) | |
Adjusted for decommissioning and inventory amortisation | 2 | — | 1 | — | 3 | — | — | 2 | 2 | (1) | 2 | 2 | |
Corporate administration, marketing and related expenses | — | — | — | — | — | 1 | — | 32 | 32 | — | 32 | 32 | |
Lease payment sustaining | — | 6 | 2 | — | 8 | — | (2) | 27 | 25 | 8 | 26 | 24 | |
Sustaining exploration and study costs | 3 | — | — | — | 3 | 1 | — | 10 | 10 | 6 | 10 | 10 | |
Total sustaining capital expenditure | 12 | 25 | 13 | — | 50 | — | 26 | 255 | 281 | 136 | 223 | 249 | |
All-in sustaining costs (5) | 80 | 99 | 47 | 1 | 227 | 2 | 114 | 1,200 | 1,314 | 554 | 1,059 | 1,173 | |
Gold sold - oz (000) | 47 | 68 | 15 | — | 130 | — | 84 | 680 | 764 | 291 | 545 | 629 | |
All-in sustaining costs per ounce - $/oz (1) | 1,691 | 1,459 | 3,105 | — | 1,740 | — | 1,355 | 1,766 | 1,720 | 1,907 | 1,946 | 1,867 | |
(1) In addition to the operational performances of the mines, “all-in sustaining costs per ounce” and “total cash costs per ounce” are affected by fluctuations in the foreign currency exchange rate. AngloGold Ashanti reports “all-in sustaining costs per ounce” calculated to the nearest US dollar amount and gold sold in ounces. AngloGold Ashanti reports “total cash costs per ounce” calculated to the nearest US dollar amount and gold produced in ounces. “All-in sustaining costs per ounce” and “total cash costs per ounce” may not be calculated based on amounts presented in this table due to rounding. | |||||||||||||
(2) Refer to Segmental reporting. | |||||||||||||
(3) Corporate includes non-gold producing managed operations. | |||||||||||||
(4) Total including equity-accounted non-managed joint ventures. | |||||||||||||
(5) “Total cash costs” and “all-in sustaining costs” may not be calculated based on amounts presented in this table due to rounding. | |||||||||||||
(6) Adjusted to exclude Sukari operation which was acquired on 22 November 2024 as part of the Centamin acquisition. | |||||||||||||
Rounding of figures may result in computational discrepancies. | |||||||||||||
Q3 2025 EARNINGS RELEASE | 31 | | |||
| ||||||
NON-GAAP DISCLOSURE I NOTE A | ||||||
TOTAL CASH COSTS | FOR THE QUARTER ENDED 30 SEPTEMBER 2025 | |||||||||||||
Corporate and other(3) | AFRICA | AUSTRALIA | ||||||||||||
Kibali | Non-managed joint ventures | Iduapriem | Obuasi | Siguiri | Geita | Sukari | Africa other | Managed operations | Sunrise Dam | Tropicana | Australia other | Australia | ||
in US Dollar million, except as otherwise noted | ||||||||||||||
Cost of sales per segmental information (2) | (3) | 123 | 123 | 115 | 118 | 118 | 170 | 198 | (1) | 718 | 110 | 128 | 11 | 249 |
- By-product revenue | — | (1) | (1) | — | — | — | (1) | (1) | — | (2) | — | (1) | — | (1) |
- Inventory change | — | 2 | 2 | 3 | 2 | (12) | 8 | — | — | 1 | 2 | 2 | — | 4 |
- Amortisation of tangible assets | (1) | (32) | (32) | (27) | (24) | (12) | (43) | (89) | — | (195) | (12) | (23) | (1) | (36) |
- Amortisation of right of use assets | — | — | — | (2) | — | (1) | (5) | — | — | (8) | (4) | (6) | — | (10) |
- Amortisation of intangible assets | — | — | — | — | — | — | — | — | — | — | — | — | — | — |
- Rehabilitation and other non-cash costs | — | — | — | (10) | (4) | (2) | (3) | (1) | — | (20) | — | — | — | — |
- Retrenchment costs | — | — | — | — | — | — | — | — | — | — | — | — | — | — |
Total cash costs (5) | (4) | 92 | 92 | 79 | 92 | 90 | 126 | 107 | (1) | 493 | 96 | 100 | 9 | 205 |
Gold produced - oz (000) | — | 86 | 86 | 60 | 69 | 39 | 125 | 135 | — | 428 | 52 | 73 | — | 125 |
Total cash costs per ounce - $/oz (1) | — | 1,068 | 1,068 | 1,321 | 1,331 | 2,331 | 1,010 | 793 | — | 1,154 | 1,844 | 1,364 | — | 1,638 |
(1) In addition to the operational performances of the mines, “all-in sustaining costs per ounce” and “total cash costs per ounce” are affected by fluctuations in the foreign currency exchange rate. AngloGold Ashanti reports “all-in sustaining costs per ounce” calculated to the nearest US dollar amount and gold sold in ounces. AngloGold Ashanti reports “total cash costs per ounce” calculated to the nearest US dollar amount and gold produced in ounces. “All-in sustaining costs per ounce” and “total cash costs per ounce” may not be calculated based on amounts presented in this table due to rounding. | ||||||||||||||
(2) Refer to Segmental reporting. | ||||||||||||||
(3) Corporate includes non-gold producing managed operations. | ||||||||||||||
(4) Total including equity-accounted non-managed joint ventures. | ||||||||||||||
(5) “Total cash costs” and “all-in sustaining costs” may not be calculated based on amounts presented in this table due to rounding. | ||||||||||||||
Rounding of figures may result in computational discrepancies. | ||||||||||||||
Q3 2025 EARNINGS RELEASE | 32 | | |||
| ||||||
NON-GAAP DISCLOSURE I NOTE A | ||||||
TOTAL CASH COSTS | FOR THE QUARTER ENDED 30 SEPTEMBER 2025 | ||||||||||||
AMERICAS | Projects | GROUP | GROUP EXCL. SUKARI(6) | ||||||||||
Cerro Vanguardia | AngloGold Ashanti Mineração | Serra Grande | Americas other | Americas | Non- managed joint ventures | Managed operations | Group total (4) | Managed operations (Africa) | Managed operations | Group total (4) | |||
in US Dollar million, except as otherwise noted | |||||||||||||
Cost of sales per segmental information (2) | 121 | 100 | 40 | — | 261 | — | 123 | 1,225 | 1,348 | 520 | 1,027 | 1,150 | |
- By-product revenue | (36) | (5) | — | — | (41) | — | (1) | (44) | (45) | (1) | (43) | (44) | |
- Inventory change | (5) | 1 | 1 | — | (3) | — | 2 | 2 | 4 | 1 | 2 | 4 | |
- Amortisation of tangible assets | (23) | (21) | (6) | — | (50) | — | (32) | (282) | (314) | (106) | (193) | (225) | |
- Amortisation of right of use assets | — | (5) | (2) | — | (7) | — | — | (25) | (25) | (8) | (25) | (25) | |
- Amortisation of intangible assets | — | — | — | — | — | — | — | — | — | — | — | — | |
- Rehabilitation and other non-cash costs | (8) | — | 2 | — | (6) | — | — | (26) | (26) | (19) | (25) | (25) | |
- Retrenchment costs | — | (1) | — | — | (1) | — | — | (1) | (1) | — | (1) | (1) | |
Total cash costs (5) | 49 | 70 | 35 | — | 154 | — | 92 | 848 | 940 | 386 | 741 | 833 | |
Gold produced - oz (000) | 43 | 71 | 15 | — | 129 | — | 86 | 682 | 768 | 293 | 547 | 633 | |
Total cash costs per ounce - $/oz (1) | 1,139 | 983 | 2,253 | — | 1,192 | — | 1,068 | 1,244 | 1,225 | 1,322 | 1,356 | 1,317 | |
(1) In addition to the operational performances of the mines, “all-in sustaining costs per ounce” and “total cash costs per ounce” are affected by fluctuations in the foreign currency exchange rate. AngloGold Ashanti reports “all-in sustaining costs per ounce” calculated to the nearest US dollar amount and gold sold in ounces. AngloGold Ashanti reports “total cash costs per ounce” calculated to the nearest US dollar amount and gold produced in ounces. “All-in sustaining costs per ounce” and “total cash costs per ounce” may not be calculated based on amounts presented in this table due to rounding. | |||||||||||||
(2) Refer to Segmental reporting. | |||||||||||||
(3) Corporate includes non-gold producing managed operations. | |||||||||||||
(4) Total including equity-accounted non-managed joint ventures. | |||||||||||||
(5) “Total cash costs” and “all-in sustaining costs” may not be calculated based on amounts presented in this table due to rounding. | |||||||||||||
(6) Adjusted to exclude Sukari operation which was acquired on 22 November 2024 as part of the Centamin acquisition. | |||||||||||||
Rounding of figures may result in computational discrepancies. | |||||||||||||
Q3 2025 EARNINGS RELEASE | 33 | | |||
| ||||||
NON-GAAP DISCLOSURE I NOTE A | ||||||
ALL-IN SUSTAINING COSTS | FOR THE QUARTER ENDED 30 SEPTEMBER 2024 | |||||||||||||
Corporate and other(3) | AFRICA | AUSTRALIA | ||||||||||||
Kibali | Non-managed joint ventures | Iduapriem | Obuasi | Siguiri | Geita | Sukari | Africa other | Managed operations | Sunrise Dam | Tropicana | Australia other | Australia | ||
in US Dollar million, except as otherwise noted | ||||||||||||||
Cost of sales per segmental information (2) | 1 | 104 | 104 | 93 | 78 | 124 | 154 | — | — | 449 | 101 | 139 | 9 | 249 |
By-product revenue | — | — | — | — | — | — | (1) | — | — | (1) | — | (1) | — | (1) |
Amortisation of tangible, intangible and right of use assets | (1) | (23) | (23) | (19) | (20) | (12) | (35) | — | — | (86) | (19) | (30) | — | (49) |
Adjusted for decommissioning and inventory amortisation | — | — | — | — | — | — | (1) | — | — | (1) | — | — | — | — |
Corporate administration, marketing and related expenses | 19 | — | — | — | — | — | — | — | — | — | — | — | — | — |
Lease payment sustaining | — | — | — | 3 | — | 1 | 6 | — | — | 10 | 4 | 3 | — | 7 |
Sustaining exploration and study costs | — | — | — | — | — | 2 | 4 | — | — | 6 | — | — | — | — |
Total sustaining capital expenditure | — | 15 | 15 | 27 | 43 | 24 | 41 | — | — | 135 | 16 | 9 | — | 25 |
All-in sustaining costs (5) | 20 | 96 | 96 | 103 | 101 | 139 | 169 | — | — | 512 | 102 | 119 | 9 | 230 |
Gold sold - oz (000) | — | 77 | 77 | 60 | 49 | 73 | 118 | — | — | 300 | 72 | 86 | — | 158 |
All-in sustaining costs per ounce - $/oz (1) | — | 1,241 | 1,241 | 1,719 | 2,063 | 1,916 | 1,428 | — | — | 1,707 | 1,411 | 1,389 | — | 1,455 |
(1) In addition to the operational performances of the mines, “all-in sustaining costs per ounce” and “total cash costs per ounce” are affected by fluctuations in the foreign currency exchange rate. AngloGold Ashanti reports “all-in sustaining costs per ounce” calculated to the nearest US dollar amount and gold sold in ounces. AngloGold Ashanti reports “total cash costs per ounce” calculated to the nearest US dollar amount and gold produced in ounces. “All-in sustaining costs per ounce” and “total cash costs per ounce” may not be calculated based on amounts presented in this table due to rounding. | ||||||||||||||
(2) Refer to Segmental reporting. | ||||||||||||||
(3) Corporate includes non-gold producing managed operations. | ||||||||||||||
(4) Total including equity-accounted non-managed joint ventures. | ||||||||||||||
(5) “Total cash costs” and “all-in sustaining costs” may not be calculated based on amounts presented in this table due to rounding. | ||||||||||||||
Rounding of figures may result in computational discrepancies. | ||||||||||||||
Q3 2025 EARNINGS RELEASE | 34 | | |||
| ||||||
NON-GAAP DISCLOSURE I NOTE A | ||||||
ALL-IN SUSTAINING COSTS | FOR THE QUARTER ENDED 30 SEPTEMBER 2024 | ||||||||
AMERICAS | Projects | GROUP | |||||||
Cerro Vanguardia | AngloGold Ashanti Mineração | Serra Grande | Americas other | Americas | Non- managed joint ventures | Managed operations | Group total (4) | ||
in US Dollar million, except as otherwise noted | |||||||||
Cost of sales per segmental information (2) | 94 | 90 | 38 | — | 222 | — | 104 | 921 | 1,025 |
By-product revenue | (23) | — | — | — | (23) | — | — | (25) | (25) |
Amortisation of tangible, intangible and right of use assets | (15) | (28) | (5) | — | (48) | — | (23) | (184) | (207) |
Adjusted for decommissioning and inventory amortisation | 3 | — | — | — | 3 | — | — | 2 | 2 |
Corporate administration, marketing and related expenses | — | — | — | — | — | 1 | — | 20 | 20 |
Lease payment sustaining | — | 7 | 3 | — | 10 | — | — | 27 | 27 |
Sustaining exploration and study costs | 2 | — | — | — | 2 | 1 | — | 9 | 9 |
Total sustaining capital expenditure | 19 | 23 | 10 | — | 52 | — | 15 | 212 | 227 |
All-in sustaining costs (5) | 80 | 92 | 46 | — | 218 | 2 | 96 | 982 | 1,078 |
Gold sold - oz (000) | 46 | 70 | 16 | — | 132 | — | 77 | 590 | 667 |
All-in sustaining costs per ounce - $/oz (1) | 1,744 | 1,315 | 2,773 | — | 1,653 | — | 1,241 | 1,665 | 1,616 |
(1) In addition to the operational performances of the mines, “all-in sustaining costs per ounce” and “total cash costs per ounce” are affected by fluctuations in the foreign currency exchange rate. AngloGold Ashanti reports “all-in sustaining costs per ounce” calculated to the nearest US dollar amount and gold sold in ounces. AngloGold Ashanti reports “total cash costs per ounce” calculated to the nearest US dollar amount and gold produced in ounces. “All-in sustaining costs per ounce” and “total cash costs per ounce” may not be calculated based on amounts presented in this table due to rounding. | |||||||||
(2) Refer to Segmental reporting. | |||||||||
(3) Corporate includes non-gold producing managed operations. | |||||||||
(4) Total including equity-accounted non-managed joint ventures. | |||||||||
(5) “Total cash costs” and “all-in sustaining costs” may not be calculated based on amounts presented in this table due to rounding. | |||||||||
Rounding of figures may result in computational discrepancies. | |||||||||
Q3 2025 EARNINGS RELEASE | 35 | | |||
| ||||||
NON-GAAP DISCLOSURE I NOTE A | ||||||
TOTAL CASH COSTS | FOR THE QUARTER ENDED 30 SEPTEMBER 2024 | |||||||||||||
Corporate and other(3) | AFRICA | AUSTRALIA | ||||||||||||
Kibali | Non-managed joint ventures | Iduapriem | Obuasi | Siguiri | Geita | Sukari | Africa other | Managed operations | Sunrise Dam | Tropicana | Australia other | Australia | ||
in US Dollar million, except as otherwise noted | ||||||||||||||
Cost of sales per segmental information (2) | 1 | 104 | 104 | 93 | 78 | 124 | 154 | — | — | 449 | 101 | 139 | 9 | 249 |
- By-product revenue | — | — | — | — | — | — | (1) | — | — | (1) | — | (1) | — | (1) |
- Inventory change | — | (4) | (4) | (2) | 6 | (3) | — | — | — | 1 | — | — | — | — |
- Amortisation of tangible assets | (1) | (23) | (23) | (18) | (20) | (11) | (29) | — | — | (78) | (15) | (28) | — | (43) |
- Amortisation of right of use assets | — | — | — | (1) | — | (1) | (6) | — | — | (8) | (4) | (2) | — | (6) |
- Amortisation of intangible assets | — | — | — | — | — | — | — | — | — | — | — | — | — | — |
- Rehabilitation and other non-cash costs | — | (1) | (1) | (2) | (3) | (2) | (1) | — | — | (8) | — | (1) | — | (1) |
- Retrenchment costs | — | — | — | — | — | — | — | — | — | — | — | — | — | — |
Total cash costs (5) | 1 | 75 | 75 | 70 | 61 | 106 | 117 | — | — | 354 | 82 | 108 | 8 | 198 |
Gold produced - oz (000) | — | 71 | 71 | 59 | 53 | 71 | 118 | — | — | 301 | 73 | 87 | — | 160 |
Total cash costs per ounce - $/oz (1) | — | 1,053 | 1,053 | 1,191 | 1,153 | 1,500 | 995 | — | — | 1,179 | 1,132 | 1,243 | — | 1,245 |
(1) In addition to the operational performances of the mines, “all-in sustaining costs per ounce” and “total cash costs per ounce” are affected by fluctuations in the foreign currency exchange rate. AngloGold Ashanti reports “all-in sustaining costs per ounce” calculated to the nearest US dollar amount and gold sold in ounces. AngloGold Ashanti reports “total cash costs per ounce” calculated to the nearest US dollar amount and gold produced in ounces. “All-in sustaining costs per ounce” and “total cash costs per ounce” may not be calculated based on amounts presented in this table due to rounding. | ||||||||||||||
(2) Refer to Segmental reporting. | ||||||||||||||
(3) Corporate includes non-gold producing managed operations. | ||||||||||||||
(4) Total including equity-accounted non-managed joint ventures. | ||||||||||||||
(5) “Total cash costs” and “all-in sustaining costs” may not be calculated based on amounts presented in this table due to rounding. | ||||||||||||||
Rounding of figures may result in computational discrepancies. | ||||||||||||||
Q3 2025 EARNINGS RELEASE | 36 | | |||
| ||||||
NON-GAAP DISCLOSURE I NOTE A | ||||||
TOTAL CASH COSTS | FOR THE QUARTER ENDED 30 SEPTEMBER 2024 | ||||||||
AMERICAS | Projects | GROUP | |||||||
Cerro Vanguardia | AngloGold Ashanti Mineração | Serra Grande | Americas other | Americas | Non- managed joint ventures | Managed operations | Group total (4) | ||
in US Dollar million, except as otherwise noted | |||||||||
Cost of sales per segmental information (2) | 94 | 90 | 38 | — | 222 | — | 104 | 921 | 1,025 |
- By-product revenue | (23) | — | — | — | (23) | — | — | (25) | (25) |
- Inventory change | 1 | — | (1) | — | — | — | (4) | 1 | (3) |
- Amortisation of tangible assets | (15) | (22) | (4) | — | (41) | — | (23) | (163) | (186) |
- Amortisation of right of use assets | — | (6) | (1) | — | (7) | — | — | (21) | (21) |
- Amortisation of intangible assets | — | — | — | — | — | — | — | — | — |
- Rehabilitation and other non-cash costs | (5) | (1) | (4) | — | (10) | — | (1) | (19) | (20) |
- Retrenchment costs | — | (1) | — | — | (1) | — | — | (1) | (1) |
Total cash costs (5) | 52 | 60 | 28 | 1 | 141 | — | 75 | 694 | 769 |
Gold produced - oz (000) | 42 | 67 | 16 | — | 125 | — | 71 | 586 | 657 |
Total cash costs per ounce - $/oz (1) | 1,224 | 896 | 1,801 | — | 1,127 | — | 1,053 | 1,186 | 1,172 |
(1) In addition to the operational performances of the mines, “all-in sustaining costs per ounce” and “total cash costs per ounce” are affected by fluctuations in the foreign currency exchange rate. AngloGold Ashanti reports “all-in sustaining costs per ounce” calculated to the nearest US dollar amount and gold sold in ounces. AngloGold Ashanti reports “total cash costs per ounce” calculated to the nearest US dollar amount and gold produced in ounces. “All-in sustaining costs per ounce” and “total cash costs per ounce” may not be calculated based on amounts presented in this table due to rounding. | |||||||||
(2) Refer to Segmental reporting. | |||||||||
(3) Corporate includes non-gold producing managed operations. | |||||||||
(4) Total including equity-accounted non-managed joint ventures. | |||||||||
(5) “Total cash costs” and “all-in sustaining costs” may not be calculated based on amounts presented in this table due to rounding. | |||||||||
Rounding of figures may result in computational discrepancies. | |||||||||
Q3 2025 EARNINGS RELEASE | 37 | | |||
| ||||||
NON-GAAP DISCLOSURE I NOTE A | ||||||
ALL-IN SUSTAINING COSTS | FOR THE NINE MONTHS ENDED 30 SEPTEMBER 2025 | |||||||||||||
Corporate and other (3) | AFRICA | AUSTRALIA | ||||||||||||
Kibali | Non-managed joint ventures | Iduapriem | Obuasi | Siguiri | Geita | Sukari | Africa other | Managed operations | Sunrise Dam | Tropicana | Australia other | Australia | ||
in US Dollar million, except as otherwise noted | ||||||||||||||
Cost of sales per segmental information (2) | 4 | 336 | 336 | 316 | 320 | 418 | 520 | 568 | (1) | 2,141 | 326 | 369 | 29 | 724 |
By-product revenue | — | (2) | (2) | — | (1) | — | (3) | (2) | — | (6) | (1) | (3) | — | (4) |
Amortisation of tangible, intangible and right of use assets | (3) | (79) | (79) | (85) | (66) | (46) | (129) | (258) | — | (584) | (45) | (76) | (1) | (122) |
Adjusted for decommissioning and inventory amortisation | — | — | — | — | — | — | (2) | — | — | (2) | 1 | — | — | 1 |
Corporate administration, marketing and related expenses | 91 | — | — | — | — | — | — | — | — | — | — | — | — | — |
Lease payment sustaining | 1 | (1) | (1) | 3 | — | 4 | 17 | 2 | — | 26 | 11 | 16 | 1 | 28 |
Sustaining exploration and study costs | — | — | — | 2 | — | 6 | 9 | — | — | 17 | 1 | — | — | 1 |
Total sustaining capital expenditure | 1 | 50 | 50 | 62 | 127 | 49 | 166 | 101 | — | 505 | 58 | 22 | — | 80 |
All-in sustaining costs (5) | 94 | 305 | 305 | 298 | 380 | 430 | 577 | 411 | — | 2,096 | 350 | 328 | 29 | 707 |
Gold sold - oz (000) | — | 219 | 219 | 148 | 190 | 210 | 385 | 389 | — | 1,322 | 170 | 214 | — | 384 |
All-in sustaining costs per ounce - $/oz (1) | — | 1,392 | 1,392 | 2,021 | 2,004 | 2,043 | 1,497 | 1,059 | — | 1,586 | 2,055 | 1,537 | — | 1,842 |
(1) In addition to the operational performances of the mines, “all-in sustaining costs per ounce” and “total cash costs per ounce” are affected by fluctuations in the foreign currency exchange rate. AngloGold Ashanti reports “all-in sustaining costs per ounce” calculated to the nearest US dollar amount and gold sold in ounces. AngloGold Ashanti reports “total cash costs per ounce” calculated to the nearest US dollar amount and gold produced in ounces. “All-in sustaining costs per ounce” and “total cash costs per ounce” may not be calculated based on amounts presented in this table due to rounding. | ||||||||||||||
(2) Refer to Segmental reporting. | ||||||||||||||
(3) Corporate includes non-gold producing managed operations. | ||||||||||||||
(4) Total including equity-accounted non-managed joint ventures. | ||||||||||||||
(5) “Total cash costs” and “all-in sustaining costs” may not be calculated based on amounts presented in this table due to rounding. | ||||||||||||||
Rounding of figures may result in computational discrepancies. | ||||||||||||||
Q3 2025 EARNINGS RELEASE | 38 | | |||
| ||||||
NON-GAAP DISCLOSURE I NOTE A | ||||||
ALL-IN SUSTAINING COSTS | FOR THE NINE MONTHS ENDED 30 SEPTEMBER 2025 | ||||||||||||
AMERICAS | Projects | GROUP | GROUP EXCL. SUKARI(6) | ||||||||||
Cerro Vanguardia | AngloGold Ashanti Mineração | Serra Grande | Americas other | Americas | Non- managed joint ventures | Managed operations | Group total (4) | Managed operations (Africa) | Managed operations | Group total (4) | |||
in US Dollar million, except as otherwise noted | |||||||||||||
Cost of sales per segmental information (2) | 347 | 271 | 108 | 2 | 728 | — | 336 | 3,597 | 3,933 | 1,573 | 3,029 | 3,365 | |
By-product revenue | (94) | (14) | — | — | (108) | — | (2) | (118) | (120) | (4) | (116) | (118) | |
Amortisation of tangible, intangible and right of use assets | (60) | (74) | (22) | — | (156) | — | (79) | (865) | (944) | (326) | (607) | (686) | |
Adjusted for decommissioning and inventory amortisation | 2 | — | 1 | — | 3 | — | — | 2 | 2 | (2) | 2 | 2 | |
Corporate administration, marketing and related expenses | — | — | — | — | — | 2 | — | 93 | 93 | — | 93 | 93 | |
Lease payment sustaining | — | 18 | 6 | — | 24 | 1 | (1) | 80 | 79 | 24 | 78 | 77 | |
Sustaining exploration and study costs | 4 | — | — | — | 4 | 1 | — | 23 | 23 | 17 | 23 | 23 | |
Total sustaining capital expenditure | 43 | 77 | 33 | — | 153 | 2 | 50 | 741 | 791 | 404 | 640 | 690 | |
All-in sustaining costs (5) | 243 | 278 | 126 | 2 | 649 | 6 | 305 | 3,552 | 3,857 | 1,685 | 3,141 | 3,446 | |
Gold sold - oz (000) | 143 | 193 | 41 | — | 377 | — | 219 | 2,083 | 2,302 | 933 | 1,694 | 1,913 | |
All-in sustaining costs per ounce - $/oz (1) | 1,695 | 1,438 | 3,051 | — | 1,719 | — | 1,392 | 1,706 | 1,676 | 1,806 | 1,854 | 1,801 | |
(1) In addition to the operational performances of the mines, “all-in sustaining costs per ounce” and “total cash costs per ounce” are affected by fluctuations in the foreign currency exchange rate. AngloGold Ashanti reports “all-in sustaining costs per ounce” calculated to the nearest US dollar amount and gold sold in ounces. AngloGold Ashanti reports “total cash costs per ounce” calculated to the nearest US dollar amount and gold produced in ounces. “All-in sustaining costs per ounce” and “total cash costs per ounce” may not be calculated based on amounts presented in this table due to rounding. | |||||||||||||
(2) Refer to Segmental reporting. | |||||||||||||
(3) Corporate includes non-gold producing managed operations. | |||||||||||||
(4) Total including equity-accounted non-managed joint ventures. | |||||||||||||
(5) “Total cash costs” and “all-in sustaining costs” may not be calculated based on amounts presented in this table due to rounding. | |||||||||||||
(6) Adjusted to exclude Sukari operation which was acquired on 22 November 2024 as part of the Centamin acquisition. | |||||||||||||
Rounding of figures may result in computational discrepancies. | |||||||||||||
Q3 2025 EARNINGS RELEASE | 39 | | |||
| ||||||
NON-GAAP DISCLOSURE I NOTE A | ||||||
TOTAL CASH COSTS | FOR THE NINE MONTHS ENDED 30 SEPTEMBER 2025 | |||||||||||||
Corporate and other (3) | AFRICA | AUSTRALIA | ||||||||||||
Kibali | Non- managed joint ventures | Iduapriem | Obuasi | Siguiri | Geita | Sukari | Africa other | Managed operations | Sunrise Dam | Tropicana | Australia other | Australia | ||
in US Dollar million, except as otherwise noted | ||||||||||||||
Cost of sales per segmental information (2) | 4 | 336 | 336 | 316 | 320 | 418 | 520 | 568 | (1) | 2,141 | 326 | 369 | 29 | 724 |
- By-product revenue | — | (2) | (2) | — | (1) | — | (3) | (2) | — | (6) | (1) | (3) | — | (4) |
- Inventory change | — | 6 | 6 | 3 | 7 | (13) | (5) | (13) | — | (21) | 6 | 1 | — | 7 |
- Amortisation of tangible assets | (2) | (78) | (78) | (81) | (66) | (42) | (112) | (257) | — | (558) | (35) | (59) | — | (94) |
- Amortisation of right of use assets | (1) | (1) | (1) | (4) | — | (4) | (17) | (1) | — | (26) | (10) | (17) | (1) | (28) |
- Amortisation of intangible assets | — | — | — | — | — | — | — | — | — | — | — | — | — | — |
- Rehabilitation and other non-cash costs | — | (5) | (5) | (14) | (8) | (4) | (7) | (2) | — | (35) | — | — | (1) | (1) |
- Retrenchment costs | — | — | — | — | — | — | — | — | — | — | — | — | — | — |
Total cash costs (5) | 1 | 256 | 256 | 221 | 253 | 354 | 376 | 292 | (1) | 1,495 | 286 | 291 | 27 | 604 |
Gold produced - oz (000) | — | 224 | 224 | 149 | 194 | 204 | 379 | 381 | — | 1,307 | 174 | 212 | — | 386 |
Total cash costs per ounce - $/oz (1) | — | 1,145 | 1,145 | 1,480 | 1,306 | 1,735 | 993 | 765 | — | 1,144 | 1,646 | 1,372 | — | 1,564 |
(1) In addition to the operational performances of the mines, “all-in sustaining costs per ounce” and “total cash costs per ounce” are affected by fluctuations in the foreign currency exchange rate. AngloGold Ashanti reports “all-in sustaining costs per ounce” calculated to the nearest US dollar amount and gold sold in ounces. AngloGold Ashanti reports “total cash costs per ounce” calculated to the nearest US dollar amount and gold produced in ounces. “All-in sustaining costs per ounce” and “total cash costs per ounce” may not be calculated based on amounts presented in this table due to rounding. | ||||||||||||||
(2) Refer to Segmental reporting. | ||||||||||||||
(3) Corporate includes non-gold producing managed operations. | ||||||||||||||
(4) Total including equity-accounted non-managed joint ventures. | ||||||||||||||
(5) “Total cash costs” and “all-in sustaining costs” may not be calculated based on amounts presented in this table due to rounding. | ||||||||||||||
Rounding of figures may result in computational discrepancies. | ||||||||||||||
Q3 2025 EARNINGS RELEASE | 40 | | |||
| ||||||
NON-GAAP DISCLOSURE I NOTE A | ||||||
TOTAL CASH COSTS | FOR THE NINE MONTHS ENDED 30 SEPTEMBER 2025 | ||||||||||||
AMERICAS | Projects | GROUP | GROUP EXCL. SUKARI(6) | ||||||||||
Cerro Vanguardia | AngloGold Ashanti Mineração | Serra Grande | Americas other | Americas | Non- managed joint ventures | Managed operations | Group total (4) | Managed operations (Africa) | Managed operations | Group total (4) | |||
in US Dollar million, except as otherwise noted | |||||||||||||
Cost of sales per segmental information (2) | 347 | 271 | 108 | 2 | 728 | — | 336 | 3,597 | 3,933 | 1,573 | 3,029 | 3,365 | |
- By-product revenue | (94) | (14) | — | — | (108) | — | (2) | (118) | (120) | (4) | (116) | (118) | |
- Inventory change | (7) | 3 | 1 | — | (3) | — | 6 | (17) | (11) | (8) | (4) | 2 | |
- Amortisation of tangible assets | (60) | (60) | (18) | — | (138) | — | (78) | (792) | (870) | (301) | (535) | (613) | |
- Amortisation of right of use assets | — | (14) | (4) | — | (18) | — | (1) | (73) | (74) | (25) | (72) | (73) | |
- Amortisation of intangible assets | — | — | — | — | — | — | — | — | — | — | — | — | |
- Rehabilitation and other non-cash costs | (13) | — | 4 | — | (9) | — | (5) | (45) | (50) | (33) | (43) | (48) | |
- Retrenchment costs | (1) | (1) | — | — | (2) | — | — | (2) | (2) | — | (2) | (2) | |
Total cash costs (5) | 172 | 185 | 91 | 2 | 450 | — | 256 | 2,550 | 2,806 | 1,203 | 2,258 | 2,514 | |
Gold produced - oz (000) | 137 | 196 | 42 | — | 375 | — | 224 | 2,068 | 2,292 | 926 | 1,687 | 1,911 | |
Total cash costs per ounce - $/oz (1) | 1,253 | 944 | 2,184 | — | 1,201 | — | 1,145 | 1,233 | 1,224 | 1,300 | 1,339 | 1,316 | |
(1) In addition to the operational performances of the mines, “all-in sustaining costs per ounce” and “total cash costs per ounce” are affected by fluctuations in the foreign currency exchange rate. AngloGold Ashanti reports “all-in sustaining costs per ounce” calculated to the nearest US dollar amount and gold sold in ounces. AngloGold Ashanti reports “total cash costs per ounce” calculated to the nearest US dollar amount and gold produced in ounces. “All-in sustaining costs per ounce” and “total cash costs per ounce” may not be calculated based on amounts presented in this table due to rounding. | |||||||||||||
(2) Refer to Segmental reporting. | |||||||||||||
(3) Corporate includes non-gold producing managed operations. | |||||||||||||
(4) Total including equity-accounted non-managed joint ventures. | |||||||||||||
(5) “Total cash costs” and “all-in sustaining costs” may not be calculated based on amounts presented in this table due to rounding. | |||||||||||||
(6) Adjusted to exclude Sukari operation which was acquired on 22 November 2024 as part of the Centamin acquisition. | |||||||||||||
Rounding of figures may result in computational discrepancies. | |||||||||||||
Q3 2025 EARNINGS RELEASE | 41 | | |||
| ||||||
NON-GAAP DISCLOSURE I NOTE A | ||||||
ALL-IN SUSTAINING COSTS | FOR THE NINE MONTHS ENDED 30 SEPTEMBER 2024 | ||||||||||||
Corporate and other (3) | AFRICA | AUSTRALIA | |||||||||||
Kibali | Non-managed joint ventures | Iduapriem | Obuasi | Siguiri | Geita | Africa other | Managed operations | Sunrise Dam | Tropicana | Australia other | Australia | ||
in US Dollar million, except as otherwise noted | |||||||||||||
Cost of sales per segmental information (2) | 2 | 278 | 278 | 260 | 259 | 384 | 464 | — | 1,367 | 317 | 344 | 26 | 687 |
By-product revenue | — | (1) | (1) | — | — | (1) | (2) | — | (3) | (1) | (2) | — | (3) |
Amortisation of tangible, intangible and right of use assets | (3) | (67) | (67) | (60) | (53) | (37) | (95) | — | (245) | (58) | (73) | (1) | (132) |
Adjusted for decommissioning and inventory amortisation | — | — | — | — | (1) | — | (1) | — | (2) | — | — | — | — |
Corporate administration, marketing and related expenses | 84 | — | — | — | — | — | — | — | — | — | — | — | — |
Lease payment sustaining | 1 | 1 | 1 | 4 | — | 2 | 17 | — | 23 | 13 | 7 | 1 | 21 |
Sustaining exploration and study costs | — | — | — | — | 1 | 4 | 8 | — | 13 | 1 | — | — | 1 |
Total sustaining capital expenditure | 1 | 49 | 49 | 80 | 112 | 67 | 128 | — | 387 | 38 | 26 | — | 64 |
All-in sustaining costs (5) | 85 | 261 | 261 | 284 | 318 | 419 | 518 | — | 1,539 | 309 | 303 | 26 | 638 |
Gold sold - oz (000) | — | 230 | 230 | 191 | 163 | 203 | 358 | — | 915 | 194 | 217 | — | 411 |
All-in sustaining costs per ounce - $/oz (1) | — | 1,133 | 1,133 | 1,487 | 1,956 | 2,062 | 1,449 | — | 1,683 | 1,589 | 1,394 | — | 1,550 |
(1) In addition to the operational performances of the mines, “all-in sustaining costs per ounce” and “total cash costs per ounce” are affected by fluctuations in the foreign currency exchange rate. AngloGold Ashanti reports “all-in sustaining costs per ounce” calculated to the nearest US dollar amount and gold sold in ounces. AngloGold Ashanti reports “total cash costs per ounce” calculated to the nearest US dollar amount and gold produced in ounces. “All-in sustaining costs per ounce” and “total cash costs per ounce” may not be calculated based on amounts presented in this table due to rounding. | |||||||||||||
(2) Refer to Segmental reporting. | |||||||||||||
(3) Corporate includes non-gold producing managed operations. | |||||||||||||
(4) Total including equity-accounted non-managed joint ventures. | |||||||||||||
(5) “Total cash costs” and “all-in sustaining costs” may not be calculated based on amounts presented in this table due to rounding. | |||||||||||||
Rounding of figures may result in computational discrepancies. | |||||||||||||
Q3 2025 EARNINGS RELEASE | 42 | | |||
| ||||||
NON-GAAP DISCLOSURE I NOTE A | ||||||
ALL-IN SUSTAINING COSTS | FOR THE NINE MONTHS ENDED 30 SEPTEMBER 2024 | ||||||||
AMERICAS | Projects | GROUP | |||||||
Cerro Vanguardia | AngloGold Ashanti Mineração | Serra Grande | Americas other | Americas | Non- managed joint ventures | Managed operations | Group total (4) | ||
in US Dollar million, except as otherwise noted | |||||||||
Cost of sales per segmental information (2) | 269 | 254 | 103 | 1 | 627 | — | 278 | 2,683 | 2,961 |
By-product revenue | (80) | — | — | — | (80) | — | (1) | (86) | (87) |
Amortisation of tangible, intangible and right of use assets | (40) | (78) | (15) | — | (133) | — | (67) | (513) | (580) |
Adjusted for decommissioning and inventory amortisation | 3 | — | (1) | — | 2 | — | — | — | — |
Corporate administration, marketing and related expenses | — | — | — | — | — | 2 | — | 86 | 86 |
Lease payment sustaining | — | 21 | 7 | — | 28 | 1 | 1 | 74 | 75 |
Sustaining exploration and study costs | 5 | 1 | — | — | 6 | — | — | 20 | 20 |
Total sustaining capital expenditure | 48 | 68 | 27 | — | 143 | 3 | 49 | 598 | 647 |
All-in sustaining costs (5) | 205 | 266 | 122 | 1 | 594 | 6 | 261 | 2,862 | 3,123 |
Gold sold - oz (000) | 140 | 200 | 58 | — | 398 | — | 230 | 1,724 | 1,954 |
All-in sustaining costs per ounce - $/oz (1) | 1,460 | 1,330 | 2,113 | — | 1,493 | — | 1,133 | 1,660 | 1,598 |
(1) In addition to the operational performances of the mines, “all-in sustaining costs per ounce” and “total cash costs per ounce” are affected by fluctuations in the foreign currency exchange rate. AngloGold Ashanti reports “all-in sustaining costs per ounce” calculated to the nearest US dollar amount and gold sold in ounces. AngloGold Ashanti reports “total cash costs per ounce” calculated to the nearest US dollar amount and gold produced in ounces. “All-in sustaining costs per ounce” and “total cash costs per ounce” may not be calculated based on amounts presented in this table due to rounding. | |||||||||
(2) Refer to Segmental reporting. | |||||||||
(3) Corporate includes non-gold producing managed operations. | |||||||||
(4) Total including equity-accounted non-managed joint ventures. | |||||||||
(5) “Total cash costs” and “all-in sustaining costs” may not be calculated based on amounts presented in this table due to rounding. | |||||||||
Rounding of figures may result in computational discrepancies. | |||||||||
Q3 2025 EARNINGS RELEASE | 43 | | |||
| ||||||
NON-GAAP DISCLOSURE I NOTE A | ||||||
TOTAL CASH COSTS | FOR THE NINE MONTHS ENDED 30 SEPTEMBER 2024 | ||||||||||||
Corporate and other (3) | AFRICA | AUSTRALIA | |||||||||||
Kibali | Non- managed joint ventures | Iduapriem | Obuasi | Siguiri | Geita | Africa other | Managed operations | Sunrise Dam | Tropicana | Australia other | Australia | ||
in US Dollar million, except as otherwise noted | |||||||||||||
Cost of sales per segmental information (2) | 2 | 278 | 278 | 260 | 259 | 384 | 464 | — | 1,367 | 317 | 344 | 26 | 687 |
- By-product revenue | — | (1) | (1) | — | — | (1) | (2) | — | (3) | (1) | (2) | — | (3) |
- Inventory change | — | — | — | (5) | (1) | (7) | (10) | — | (23) | (3) | (6) | — | (9) |
- Amortisation of tangible assets | (2) | (66) | (66) | (58) | (53) | (35) | (74) | — | (220) | (46) | (68) | — | (114) |
- Amortisation of right of use assets | — | (1) | (1) | (2) | — | (2) | (21) | — | (25) | (12) | (5) | (1) | (18) |
- Amortisation of intangible assets | (1) | — | — | — | — | — | — | — | — | — | — | — | — |
- Rehabilitation and other non-cash costs | — | 1 | 1 | (4) | (7) | (4) | (3) | — | (18) | — | — | (1) | (1) |
- Retrenchment costs | — | — | — | — | — | — | — | — | — | — | — | — | — |
Total cash costs (5) | (1) | 212 | 212 | 191 | 198 | 335 | 354 | — | 1,078 | 255 | 262 | 25 | 542 |
Gold produced - oz (000) | — | 229 | 229 | 187 | 161 | 199 | 347 | — | 894 | 193 | 213 | — | 406 |
Total cash costs per ounce - $/oz (1) | — | 924 | 924 | 1,021 | 1,231 | 1,687 | 1,020 | — | 1,206 | 1,321 | 1,230 | — | 1,335 |
(1) In addition to the operational performances of the mines, “all-in sustaining costs per ounce” and “total cash costs per ounce” are affected by fluctuations in the foreign currency exchange rate. AngloGold Ashanti reports “all-in sustaining costs per ounce” calculated to the nearest US dollar amount and gold sold in ounces. AngloGold Ashanti reports “total cash costs per ounce” calculated to the nearest US dollar amount and gold produced in ounces. “All-in sustaining costs per ounce” and “total cash costs per ounce” may not be calculated based on amounts presented in this table due to rounding. | |||||||||||||
(2) Refer to Segmental reporting. | |||||||||||||
(3) Corporate includes non-gold producing managed operations. | |||||||||||||
(4) Total including equity-accounted non-managed joint ventures. | |||||||||||||
(5) “Total cash costs” and “all-in sustaining costs” may not be calculated based on amounts presented in this table due to rounding. | |||||||||||||
Rounding of figures may result in computational discrepancies. | |||||||||||||
Q3 2025 EARNINGS RELEASE | 44 | | |||
| ||||||
NON-GAAP DISCLOSURE I NOTE A | ||||||
TOTAL CASH COSTS | FOR THE NINE MONTHS ENDED 30 SEPTEMBER 2024 | ||||||||
AMERICAS | Projects | GROUP | |||||||
Cerro Vanguardia | AngloGold Ashanti Mineração | Serra Grande | Americas other | Americas | Non- managed joint ventures | Managed operations | Group total (4) | ||
in US Dollar million, except as otherwise noted | |||||||||
Cost of sales per segmental information (2) | 269 | 254 | 103 | 1 | 627 | — | 278 | 2,683 | 2,961 |
- By-product revenue | (80) | — | — | — | (80) | — | (1) | (86) | (87) |
- Inventory change | (7) | (1) | (1) | — | (9) | — | — | (41) | (41) |
- Amortisation of tangible assets | (40) | (61) | (12) | — | (113) | — | (66) | (449) | (515) |
- Amortisation of right of use assets | — | (17) | (3) | — | (20) | — | (1) | (63) | (64) |
- Amortisation of intangible assets | — | — | — | — | — | — | — | (1) | (1) |
- Rehabilitation and other non-cash costs | (7) | (1) | (4) | — | (12) | — | 1 | (31) | (30) |
- Retrenchment costs | (1) | (1) | — | — | (2) | — | — | (2) | (2) |
Total cash costs (5) | 134 | 173 | 83 | 1 | 391 | — | 212 | 2,010 | 2,222 |
Gold produced - oz (000) | 129 | 196 | 57 | — | 382 | — | 229 | 1,682 | 1,911 |
Total cash costs per ounce - $/oz (1) | 1,044 | 883 | 1,439 | — | 1,024 | — | 924 | 1,195 | 1,163 |
(1) In addition to the operational performances of the mines, “all-in sustaining costs per ounce” and “total cash costs per ounce” are affected by fluctuations in the foreign currency exchange rate. AngloGold Ashanti reports “all-in sustaining costs per ounce” calculated to the nearest US dollar amount and gold sold in ounces. AngloGold Ashanti reports “total cash costs per ounce” calculated to the nearest US dollar amount and gold produced in ounces. “All-in sustaining costs per ounce” and “total cash costs per ounce” may not be calculated based on amounts presented in this table due to rounding. | |||||||||
(2) Refer to Segmental reporting. | |||||||||
(3) Corporate includes non-gold producing managed operations. | |||||||||
(4) Total including equity-accounted non-managed joint ventures. | |||||||||
(5) “Total cash costs” and “all-in sustaining costs” may not be calculated based on amounts presented in this table due to rounding. | |||||||||
Rounding of figures may result in computational discrepancies. | |||||||||
Q3 2025 EARNINGS RELEASE | 45 | | |||
| ||||||
NON-GAAP DISCLOSURE I NOTE B | ||||||
QUARTER 3 AND NINE MONTHS I 2025 AND 2024
AVERAGE GOLD PRICE RECEIVED PER OUNCE | Quarter | Quarter | Nine months | Nine months | |||||||||
ended | ended | ended | ended | ||||||||||
Sep | Sep | Sep | Sep | ||||||||||
2025 | 2024 | 2025 | 2024 | ||||||||||
Unaudited | Unaudited | Unaudited | Unaudited | ||||||||||
US Dollar million, except as otherwise noted | Managed operations | Non- managed joint ventures | Group (Equity) | Managed operations | Non- managed joint ventures | Group (Equity) | Managed operations | Non- managed joint ventures | Group (Equity) | Managed operations | Non- managed joint ventures | Group (Equity) | |
Gold income per income statement | 2,373 | 294 | 2,373 | 1,466 | 193 | 1,466 | 6,707 | 711 | 6,707 | 3,957 | 533 | 3,957 | |
Associates and joint ventures’ share of gold income | 294 | 193 | 711 | 533 | |||||||||
Gold income | 2,373 | 294 | 2,667 | 1,466 | 193 | 1,659 | 6,707 | 711 | 7,418 | 3,957 | 533 | 4,490 | |
Gold sold - oz (000) | 680 | 84 | 764 | 590 | 77 | 667 | 2,083 | 219 | 2,302 | 1,724 | 230 | 1,954 | |
Average gold price received per ounce - $/oz (1) | 3,488 | 3,502 | 3,490 | 2,484 | 2,502 | 2,486 | 3,220 | 3,240 | 3,222 | 2,296 | 2,313 | 2,298 | |
(1) The “average gold price received per ounce” for the three months and nine months ended 30 September 2024 has been restated to be based on the gold revenue from primary operating activities. Previously, the gold price received per ounce calculation included revenue from normal operating activities as well as hedging activities. | |||||||||||||
Rounding of figures may result in computational discrepancies. | |||||||||||||
Q3 2025 EARNINGS RELEASE | 46 | | |||
| ||||||
NON-GAAP DISCLOSURE I NOTE C | ||||||
QUARTER 3 2025 AND 2024
CAPITAL EXPENDITURE | FOR THE QUARTER ENDED 30 SEPTEMBER 2025 | |||||||||||||
Corporate and other | AFRICA | AUSTRALIA | ||||||||||||
Kibali | Non-managed joint ventures | Iduapriem | Obuasi | Siguiri | Geita | Sukari | Africa other | Managed operations | Sunrise Dam | Tropicana | Australia other | Australia | ||
in US Dollar million, except as otherwise noted | ||||||||||||||
Sustaining capital expenditure | 1 | 26 | 26 | 23 | 49 | 18 | 46 | 32 | — | 168 | 28 | 8 | — | 36 |
Non-sustaining capital expenditure | — | 20 | 20 | 15 | 8 | 2 | 5 | 27 | — | 57 | — | 13 | — | 13 |
Capital expenditure | 1 | 46 | 46 | 38 | 57 | 20 | 51 | 59 | — | 225 | 28 | 21 | — | 49 |
CAPITAL EXPENDITURE | AMERICAS | Projects | GROUP | GROUP EXCL. SUKARI(2) | |||||||||
Cerro Vanguardia | AngloGold Ashanti Mineração | Serra Grande | Americas other | Americas | Non- managed joint ventures | Managed operations | Group total (1) | Managed operations (Africa) | Managed operations | Group total (1) | |||
in US Dollar million, except as otherwise noted | |||||||||||||
Sustaining capital expenditure | 12 | 25 | 13 | — | 50 | — | 26 | 255 | 281 | 136 | 223 | 249 | |
Non-sustaining capital expenditure | — | 10 | — | — | 10 | 7 | 20 | 87 | 107 | 30 | 60 | 80 | |
Capital expenditure | 12 | 35 | 13 | — | 60 | 7 | 46 | 342 | 388 | 166 | 283 | 329 | |
CAPITAL EXPENDITURE | FOR THE QUARTER ENDED 30 SEPTEMBER 2024 | ||||||||||||
Corporate and other | AFRICA | AUSTRALIA | |||||||||||
Kibali | Non-managed joint ventures | Iduapriem | Obuasi | Siguiri | Geita | Africa other | Managed operations | Sunrise Dam | Tropicana | Australia other | Australia | ||
in US Dollar million, except as otherwise noted | |||||||||||||
Sustaining capital expenditure | — | 15 | 15 | 27 | 43 | 24 | 41 | — | 135 | 16 | 9 | — | 25 |
Non-sustaining capital expenditure | — | 13 | 13 | 22 | 17 | 6 | 4 | — | 49 | — | 2 | — | 2 |
Capital expenditure | — | 28 | 28 | 49 | 60 | 30 | 45 | — | 184 | 16 | 11 | — | 27 |
CAPITAL EXPENDITURE | AMERICAS | Projects | GROUP | ||||||
Cerro Vanguardia | AngloGold Ashanti Mineração | Serra Grande | Americas other | Americas | Non- managed joint ventures | Managed operations | Group total (1) | ||
in US Dollar million, except as otherwise noted | |||||||||
Sustaining capital expenditure | 19 | 23 | 10 | — | 52 | — | 15 | 212 | 227 |
Non-sustaining capital expenditure | — | — | — | — | — | 4 | 13 | 55 | 68 |
Capital expenditure | 19 | 23 | 10 | — | 52 | 4 | 28 | 267 | 295 |
(1) Total including equity-accounted non-managed joint ventures.
(2) Adjusted to exclude Sukari operation which was acquired on 22 November 2024 as part of the Centamin acquisition.
Rounding of figures may result in computational discrepancies.
Q3 2025 EARNINGS RELEASE | 47 | | |||
| ||||||
NON-GAAP DISCLOSURE I NOTE C | ||||||
NINE MONTHS 2025 AND 2024
CAPITAL EXPENDITURE | FOR THE NINE MONTHS ENDED 30 SEPTEMBER 2025 | |||||||||||||
Corporate and other | AFRICA | AUSTRALIA | ||||||||||||
Kibali | Non-managed joint ventures | Iduapriem | Obuasi | Siguiri | Geita | Sukari | Africa other | Managed operations | Sunrise Dam | Tropicana | Australia other | Australia | ||
in US Dollar million, except as otherwise noted | ||||||||||||||
Sustaining capital expenditure | 1 | 50 | 50 | 62 | 127 | 49 | 166 | 101 | — | 505 | 58 | 22 | — | 80 |
Non-sustaining capital expenditure | — | 60 | 60 | 48 | 18 | 3 | 14 | 83 | — | 166 | — | 44 | — | 44 |
Capital expenditure | 1 | 110 | 110 | 110 | 145 | 52 | 180 | 184 | — | 671 | 58 | 66 | — | 124 |
CAPITAL EXPENDITURE | AMERICAS | Projects | GROUP | GROUP EXCL. SUKARI(2) | |||||||||
Cerro Vanguardia | AngloGold Ashanti Mineração | Serra Grande | Americas other | Americas | Non- managed joint ventures | Managed operations | Group total (1) | Managed operations (Africa) | Managed operations | Group total (1) | |||
in US Dollar million, except as otherwise noted | |||||||||||||
Sustaining capital expenditure | 43 | 77 | 33 | — | 153 | 2 | 50 | 741 | 791 | 404 | 640 | 690 | |
Non-sustaining capital expenditure | — | 12 | — | — | 12 | 32 | 60 | 254 | 314 | 83 | 171 | 231 | |
Capital expenditure | 43 | 89 | 33 | — | 165 | 34 | 110 | 995 | 1,105 | 487 | 811 | 921 | |
CAPITAL EXPENDITURE | FOR THE NINE MONTHS ENDED 30 SEPTEMBER 2024 | ||||||||||||
Corporate and other | AFRICA | AUSTRALIA | |||||||||||
Kibali | Non-managed joint ventures | Iduapriem | Obuasi | Siguiri | Geita | Africa other | Managed operations | Sunrise Dam | Tropicana | Australia other | Australia | ||
in US Dollar million, except as otherwise noted | |||||||||||||
Sustaining capital expenditure | 1 | 49 | 49 | 80 | 112 | 67 | 128 | — | 387 | 38 | 26 | — | 64 |
Non-sustaining capital expenditure | — | 40 | 40 | 39 | 37 | 6 | 9 | — | 91 | — | 48 | — | 48 |
Capital expenditure | 1 | 89 | 89 | 119 | 149 | 73 | 137 | — | 478 | 38 | 74 | — | 112 |
CAPITAL EXPENDITURE | AMERICAS | Projects | GROUP | ||||||
Cerro Vanguardia | AngloGold Ashanti Mineração | Serra Grande | Americas other | Americas | Non- managed joint ventures | Managed operations | Group total (1) | ||
in US Dollar million, except as otherwise noted | |||||||||
Sustaining capital expenditure | 48 | 68 | 27 | — | 143 | 3 | 49 | 598 | 647 |
Non-sustaining capital expenditure | — | — | — | — | — | 20 | 40 | 159 | 199 |
Capital expenditure | 48 | 68 | 27 | — | 143 | 23 | 89 | 757 | 846 |
(1) Total including equity-accounted non-managed joint ventures.
(2) Adjusted to exclude Sukari operation which was acquired on 22 November 2024 as part of the Centamin acquisition.
Rounding of figures may result in computational discrepancies.
Q3 2025 EARNINGS RELEASE | 48 | | |||
| ||||||
NON-GAAP DISCLOSURE I NOTE D | ||||||
ADJUSTED EBITDA | Quarter | Quarter | Nine months | Nine months |
ended | ended | ended | ended | |
Sep | Sep | Sep | Sep | |
2025 | 2024 | 2025 | 2024 | |
US Dollar million, except as otherwise noted | Unaudited | Unaudited | Unaudited | Unaudited |
Adjusted EBITDA (1) | ||||
Profit before taxation | 1,057 | 394 | 2,832 | 974 |
Add back: | ||||
Finance costs and unwinding of obligations | 81 | 42 | 166 | 126 |
Finance income | (43) | (33) | (114) | (122) |
Amortisation of tangible, right of use and intangible assets | 307 | 184 | 865 | 513 |
Other amortisation | (2) | (2) | — | 1 |
Associates and joint ventures share of amortisation, interest, taxation and other | 123 | 77 | 292 | 198 |
EBITDA | 1,523 | 662 | 4,041 | 1,690 |
Adjustments: | ||||
Foreign exchange and fair value adjustments | 12 | 21 | 57 | 46 |
Unrealised non-hedge derivative loss | — | 5 | — | 22 |
Care and maintenance costs | 7 | 35 | 18 | 80 |
Retrenchment and related costs | 11 | 9 | 25 | 10 |
Impairment (reversal of impairment), derecognition of assets and (profit) loss on disposal | 3 | 13 | (22) | 14 |
Joint ventures share of costs | — | 1 | — | 1 |
Adjusted EBITDA | 1,556 | 746 | 4,119 | 1,863 |
(1) EBITDA (as adjusted) and prepared in terms of the formula set out in the Revolving Credit Agreements. | ||||
Rounding of figures may result in computational discrepancies. | ||||
Q3 2025 EARNINGS RELEASE | 49 | | |||
| ||||||
NON-GAAP DISCLOSURE I NOTE E | ||||||
ADJUSTED NET DEBT (CASH)(1) | As at | As at | As at | ||
Sep | Sep | Dec | |||
2025 | 2024 | 2024 | |||
US Dollar million, except as otherwise noted | Unaudited | Unaudited | Unaudited | ||
Borrowings - non-current portion | 2,025 | 1,939 | 1,901 | ||
Borrowings - current portion | 96 | 200 | 83 | ||
Lease liabilities - non-current portion | 126 | 84 | 65 | ||
Lease liabilities - current portion | 54 | 80 | 76 | ||
Total borrowings | 2,301 | 2,303 | 2,125 | ||
Less cash and cash equivalents, net of bank overdraft | (2,532) | (1,225) | (1,397) | ||
Net debt (cash) | (231) | 1,078 | 728 | ||
Adjustments: | |||||
IFRS16 lease adjustments | (169) | (146) | (126) | ||
Unamortised portion of borrowing costs | 17 | 27 | 26 | ||
Cash restricted for use | (67) | (53) | (61) | ||
Adjusted net debt (cash) | (450) | 906 | 567 | ||
Adjusted net debt (cash) to Adjusted EBITDA ratio | (0.09):1 | 0.37:1 | 0.21:1 | ||
Total borrowings to profit before taxation | 0.65:1 | 2.06:1 | 1.27:1 | ||
(1) Net debt (cash) (as adjusted) and prepared in terms of the formula set out in the Revolving Credit Agreements. | |||||
Rounding of figures may result in computational discrepancies. | |||||
Q3 2025 EARNINGS RELEASE | 50 | | |||
| ||||||
NON-GAAP DISCLOSURE I NOTE F | ||||||
FREE CASH FLOW | Quarter | Quarter | Nine months | Nine months | ||
ended | ended | ended | ended | |||
Sep | Sep | Sep | Sep | |||
2025 | 2024 | 2025 | 2024 | |||
US Dollar million, except as otherwise noted | Unaudited | Unaudited | Unaudited | Unaudited | ||
Net cash flow from operating activities (1)(2) | 1,419 | 606 | 3,162 | 1,278 | ||
Repayment of loans advanced to joint ventures | — | 49 | 77 | 139 | ||
Dividends paid to non-controlling interests | (157) | (7) | (386) | (7) | ||
Operating cash flow | 1,262 | 648 | 2,853 | 1,410 | ||
Capital expenditure on tangible and intangible assets | (342) | (267) | (995) | (757) | ||
Free cash flow | 920 | 381 | 1,858 | 653 | ||
(1) Includes landholder duties of $37m paid in May 2025. | ||||||
(2) Includes working capital movements as per table below. | ||||||
(Increase) decrease in inventories | (54) | (57) | (35) | (23) | ||
(Increase) decrease in trade receivables | 5 | (2) | (181) | (121) | ||
(Decrease) increase in trade payables | 155 | 88 | 14 | 13 | ||
Movement in working capital | 106 | 29 | (202) | (131) | ||
Rounding of figures may result in computational discrepancies. | ||||||
Q3 2025 EARNINGS RELEASE | 51 | | |||
| ||||||
OTHER INFORMATION I EXCHANGE RATES | ||||||
EXCHANGE RATES | Sep | Sep | Dec | |
2025 | 2024 | 2024 | ||
Unaudited | Unaudited | Unaudited | ||
ZAR/USD | ||||
Average for the year to date | 18.11 | 18.46 | 18.32 | |
Average for the quarter | 17.63 | 17.97 | 17.89 | |
Closing | 17.25 | 17.26 | 18.85 | |
AUD/USD | ||||
Average for the year to date | 1.56 | 1.51 | 1.52 | |
Average for the quarter | 1.53 | 1.49 | 1.53 | |
Closing | 1.51 | 1.45 | 1.62 | |
BRL/USD | ||||
Average for the year to date | 5.65 | 5.24 | 5.39 | |
Average for the quarter | 5.45 | 5.54 | 5.83 | |
Closing | 5.32 | 5.45 | 6.19 | |
ARS/USD | ||||
Average for the year to date | 1,182.19 | 888.30 | 916.78 | |
Average for the quarter | 1,330.75 | 942.19 | 1,000.92 | |
Closing | 1,366.58 | 970.92 | 1,032.50 | |
EGP/USD | ||||
Average for the year to date | 49.78 | 43.96 | 45.36 | |
Average for the quarter | 48.61 | 48.56 | 49.54 | |
Closing | 47.80 | 48.46 | 50.89 | |
Q3 2025 EARNINGS RELEASE | 52 | | |||
| ||||||
OPERATING RESULTS I OPERATIONS AT A GLANCE | ||||||
QUARTER 3 2025 AND 2024
OPERATIONS AT A GLANCE | FOR THE QUARTERS ENDED 30 SEPTEMBER 2025 AND 30 SEPTEMBER 2024 | |||||||||||||||
Gold production oz (000) | Open-pit treated 000 tonnes | Underground milled / treated 000 tonnes | Other milled / treated 000 tonnes | Open-pit recovered grade g/tonne | Underground recovered grade g/tonne | Other recovered grade g/tonne | Total recovered grade g/tonne | |||||||||
Sep-25 | Sep-24 | Sep-25 | Sep-24 | Sep-25 | Sep-24 | Sep-25 | Sep-24 | Sep-25 | Sep-24 | Sep-25 | Sep-24 | Sep-25 | Sep-24 | Sep-25 | Sep-24 | |
AFRICA Non-managed joint ventures | 86 | 71 | 578 | 581 | 357 | 384 | — | — | 1.86 | 0.91 | 4.46 | 4.41 | — | — | 2.85 | 2.30 |
Kibali - Attributable 45% (1) | 86 | 71 | 578 | 581 | 357 | 384 | — | — | 1.86 | 0.91 | 4.46 | 4.41 | — | — | 2.85 | 2.30 |
AFRICA Managed operations | 428 | 301 | 6,687 | 4,862 | 1,344 | 968 | — | 40 | 1.17 | 1.05 | 4.02 | 4.36 | — | 0.97 | 1.66 | 1.59 |
Iduapriem | 60 | 59 | 1,420 | 1,380 | — | — | — | — | 1.31 | 1.32 | — | — | — | — | 1.31 | 1.32 |
Obuasi | 69 | 53 | — | — | 340 | 279 | — | 40 | — | — | 6.31 | 5.75 | — | 0.97 | 6.31 | 5.15 |
Siguiri (3) | 39 | 71 | 1,686 | 2,754 | — | — | — | — | 0.72 | 0.80 | — | — | — | — | 0.72 | 0.80 |
Geita | 125 | 118 | 640 | 728 | 715 | 689 | — | — | 2.46 | 1.46 | 3.23 | 3.80 | — | — | 2.87 | 2.60 |
Sukari (3) | 135 | — | 2,941 | — | 289 | — | — | — | 1.07 | — | 3.27 | — | — | — | 1.31 | — |
AUSTRALIA | 125 | 160 | 1,717 | 1,714 | 911 | 921 | — | — | 1.03 | 1.33 | 2.33 | 2.89 | — | — | 1.48 | 1.88 |
Sunrise Dam | 52 | 73 | 425 | 425 | 561 | 552 | — | — | 1.03 | 1.48 | 2.10 | 2.95 | — | — | 1.64 | 2.31 |
Tropicana - Attributable 70% | 73 | 87 | 1,292 | 1,289 | 350 | 369 | — | — | 1.03 | 1.29 | 2.71 | 2.80 | — | — | 1.39 | 1.62 |
AMERICAS | 129 | 125 | 194 | 238 | 728 | 509 | 544 | 651 | 3.47 | 2.40 | 3.71 | 3.74 | 1.15 | 2.19 | 2.73 | 2.79 |
Cerro Vanguardia (3)(5) | 43 | 42 | 194 | 183 | 100 | 125 | 483 | 445 | 3.47 | 2.78 | 3.84 | 4.56 | 0.58 | 0.56 | 1.72 | 1.76 |
AngloGold Ashanti Mineração (2) | 71 | 67 | — | — | 362 | 165 | 61 | 206 | — | — | 5.09 | 5.48 | 5.65 | 5.73 | 5.17 | 5.62 |
Serra Grande | 15 | 16 | — | 55 | 266 | 219 | — | — | — | 1.16 | 1.80 | 1.95 | — | — | 1.80 | 1.79 |
Managed operations | 682 | 586 | 8,598 | 6,814 | 2,983 | 2,398 | 544 | 691 | 1.19 | 1.17 | 3.43 | 3.66 | 1.15 | 2.12 | 1.75 | 1.84 |
Non-managed joint ventures | 86 | 71 | 578 | 581 | 357 | 384 | — | — | 1.86 | 0.91 | 4.46 | 4.41 | — | — | 2.85 | 2.30 |
Group total including equity-accounted non- managed joint ventures | 768 | 657 | 9,176 | 7,395 | 3,340 | 2,782 | 544 | 691 | 1.23 | 1.15 | 3.54 | 3.77 | 1.15 | 2.12 | 1.83 | 1.88 |
Managed operations (excluding Sukari)(4) | 547 | 586 | 5,657 | 6,814 | 2,694 | 2,398 | 544 | 691 | 1.25 | 1.17 | 3.45 | 3.66 | 1.15 | 2.12 | 1.91 | 1.84 |
Non-managed joint ventures | 86 | 71 | 578 | 581 | 357 | 384 | — | — | 1.86 | 0.91 | 4.46 | 4.41 | — | — | 2.85 | 2.30 |
Group total including equity-accounted non- managed joint ventures (excluding Sukari)(4) | 633 | 657 | 6,235 | 7,395 | 3,051 | 2,782 | 544 | 691 | 1.31 | 1.15 | 3.56 | 3.77 | 1.15 | 2.12 | 2.00 | 1.88 |
(1) Equity-accounted joint venture. | ||||||||||||||||
(2) Includes gold concentrate from the Cuiabá mine sold to third parties. | ||||||||||||||||
(3) On a consolidated basis. Siguiri, Sukari and Cerro Vanguardia are owned 85%, 50% and 92.50% by AngloGold Ashanti, respectively. | ||||||||||||||||
(4) Adjusted to exclude Sukari operation which was acquired on 22 November 2024 as part of the Centamin acquisition. | ||||||||||||||||
(5) Cerro Vanguardia has adjusted the basis of allocation between open-pit, underground and other treated tonnes resulting in an adjustment of treated tonnes and related grades for Q3 2024. | ||||||||||||||||
Rounding of figures may result in computational discrepancies. | ||||||||||||||||
Q3 2025 EARNINGS RELEASE | 53 | | |||
| ||||||
FINANCIAL RESULTS I OPERATIONS AT A GLANCE | ||||||
QUARTER 3 2025 AND 2024
OPERATIONS AT A GLANCE | FOR THE QUARTERS ENDED 30 SEPTEMBER 2025 AND 30 SEPTEMBER 2024 | |||||||||||||
Cost of sales | Gross profit | Total cash costs per ounce* | All-in sustaining costs per ounce* | Sustaining MRD / Stripping capital | Other sustaining capital | Non-sustaining capital* | ||||||||
$m | $m | $/oz | $/oz | $m | $m | $m | ||||||||
Sep-25 | Sep-24 | Sep-25 | Sep-24 | Sep-25 | Sep-24 | Sep-25 | Sep-24 | Sep-25 | Sep-24 | Sep-25 | Sep-24 | Sep-25 | Sep-24 | |
AFRICA Non-managed joint ventures | 123 | 104 | 172 | 89 | 1,068 | 1,053 | 1,355 | 1,241 | 4 | 7 | 22 | 8 | 20 | 13 |
Kibali - Attributable 45% (1) | 123 | 104 | 172 | 89 | 1,068 | 1,053 | 1,355 | 1,241 | 4 | 7 | 22 | 8 | 20 | 13 |
AFRICA Managed operations | 718 | 449 | 768 | 302 | 1,154 | 1,179 | 1,631 | 1,707 | 89 | 82 | 79 | 53 | 57 | 49 |
Iduapriem | 115 | 93 | 87 | 56 | 1,321 | 1,191 | 1,902 | 1,719 | 18 | 20 | 5 | 7 | 15 | 22 |
Obuasi | 118 | 78 | 120 | 45 | 1,331 | 1,153 | 2,109 | 2,063 | 33 | 29 | 16 | 14 | 8 | 17 |
Siguiri (3) | 118 | 124 | 33 | 57 | 2,331 | 1,500 | 2,804 | 1,916 | 3 | 8 | 15 | 16 | 2 | 6 |
Geita | 170 | 154 | 249 | 144 | 1,010 | 995 | 1,464 | 1,428 | 22 | 25 | 24 | 16 | 5 | 4 |
Sukari (3) | 198 | — | 278 | — | 793 | — | 1,041 | — | 13 | — | 19 | — | 27 | — |
Administration and other | (1) | — | 1 | — | — | — | — | — | — | — | — | — | — | — |
AUSTRALIA | 249 | 249 | 182 | 145 | 1,638 | 1,245 | 2,007 | 1,455 | 14 | 14 | 22 | 11 | 13 | 2 |
Sunrise Dam | 110 | 101 | 67 | 78 | 1,844 | 1,132 | 2,439 | 1,411 | 12 | 10 | 16 | 6 | — | — |
Tropicana - Attributable 70% | 128 | 139 | 126 | 76 | 1,364 | 1,243 | 1,558 | 1,389 | 2 | 4 | 6 | 5 | 13 | 2 |
Administration and other | 11 | 9 | (11) | (9) | — | — | — | — | — | — | — | — | — | — |
AMERICAS | 261 | 222 | 239 | 125 | 1,192 | 1,127 | 1,740 | 1,653 | 33 | 33 | 17 | 19 | 10 | — |
Cerro Vanguardia (3) | 121 | 94 | 83 | 45 | 1,139 | 1,224 | 1,691 | 1,744 | 8 | 7 | 4 | 12 | — | — |
AngloGold Ashanti Mineração (2) | 100 | 90 | 141 | 77 | 983 | 896 | 1,459 | 1,315 | 15 | 19 | 10 | 4 | 10 | — |
Serra Grande | 40 | 38 | 15 | 4 | 2,253 | 1,801 | 3,105 | 2,773 | 10 | 7 | 3 | 3 | — | — |
Administration and other | — | — | — | (1) | — | — | — | — | — | — | — | — | — | — |
PROJECTS | — | — | — | — | — | — | — | — | — | — | — | — | 7 | 4 |
Colombian projects | — | — | — | — | — | — | — | — | — | — | — | — | 2 | 2 |
North American projects | — | — | — | — | — | — | — | — | — | — | — | — | 5 | 2 |
CORPORATE AND OTHER | (3) | 1 | 3 | (31) | — | — | — | — | — | — | 1 | — | — | — |
Managed operations | 1,225 | 921 | 1,192 | 541 | 1,244 | 1,186 | 1,766 | 1,665 | 136 | 129 | 119 | 83 | 87 | 55 |
Non-managed joint ventures | 123 | 104 | 172 | 89 | 1,068 | 1,053 | 1,355 | 1,241 | 4 | 7 | 22 | 8 | 20 | 13 |
Group total including equity-accounted non- managed joint ventures | 1,348 | 1,025 | 1,364 | 630 | 1,225 | 1,172 | 1,720 | 1,616 | 140 | 136 | 141 | 91 | 107 | 68 |
Managed operations (excluding Sukari)(4) | 1,027 | 921 | 914 | 541 | 1,356 | 1,186 | 1,946 | 1,665 | 123 | 129 | 100 | 83 | 60 | 55 |
Non-managed joint ventures | 123 | 104 | 172 | 89 | 1,068 | 1,053 | 1,355 | 1,241 | 4 | 7 | 22 | 8 | 20 | 13 |
Group total including equity-accounted non- managed joint ventures (excluding Sukari)(4) | 1,150 | 1,025 | 1,086 | 630 | 1,317 | 1,172 | 1,867 | 1,616 | 127 | 136 | 122 | 91 | 80 | 68 |
(1) Equity-accounted joint venture. | ||||||||||||||
(2) Includes gold concentrate from the Cuiabá mine sold to third parties. | ||||||||||||||
(3) On a consolidated basis. Siguiri, Sukari and Cerro Vanguardia are owned 85%, 50% and 92.50% by AngloGold Ashanti, respectively. | ||||||||||||||
(4) Adjusted to exclude Sukari operation which was acquired on 22 November 2024 as part of the Centamin acquisition. | ||||||||||||||
* Refer to “Non-GAAP disclosure” for definitions and reconciliations. | ||||||||||||||
Rounding of figures may result in computational discrepancies. | ||||||||||||||
Q3 2025 EARNINGS RELEASE | 54 | | |||
| ||||||
OPERATING RESULTS I OPERATIONS AT A GLANCE | ||||||
FOR THE NINE MONTHS ENDED SEPTEMBER 2025 AND 2024
OPERATIONS AT A GLANCE | FOR THE NINE MONTHS ENDED 30 SEPTEMBER 2025 AND 30 SEPTEMBER 2024 | |||||||||||||||
Gold production oz (000) | Open-pit treated 000 tonnes | Underground milled / treated 000 tonnes | Other milled / treated 000 tonnes | Open-pit recovered grade g/tonne | Underground recovered grade g/tonne | Other recovered grade g/tonne | Total recovered grade g/tonne | |||||||||
Sep-25 | Sep-24 | Sep-25 | Sep-24 | Sep-25 | Sep-24 | Sep-25 | Sep-24 | Sep-25 | Sep-24 | Sep-25 | Sep-24 | Sep-25 | Sep-24 | Sep-25 | Sep-24 | |
AFRICA Non-managed joint ventures | 224 | 229 | 1,798 | 1,652 | 1,015 | 1,204 | — | — | 1.29 | 0.94 | 4.58 | 4.63 | — | — | 2.48 | 2.50 |
Kibali - Attributable 45% (1) | 224 | 229 | 1,798 | 1,652 | 1,015 | 1,204 | — | — | 1.29 | 0.94 | 4.58 | 4.63 | — | — | 2.48 | 2.50 |
AFRICA Managed operations | 1,307 | 894 | 21,566 | 14,221 | 3,770 | 2,799 | 190 | 130 | 1.08 | 1.07 | 4.42 | 4.45 | 0.34 | 0.99 | 1.59 | 1.62 |
Iduapriem | 149 | 187 | 3,771 | 3,988 | — | — | — | — | 1.23 | 1.46 | — | — | — | — | 1.23 | 1.46 |
Obuasi | 194 | 161 | — | — | 976 | 843 | — | 130 | — | — | 6.17 | 5.77 | — | 0.99 | 6.17 | 5.14 |
Siguiri (3) | 204 | 199 | 7,792 | 8,166 | — | — | — | — | 0.81 | 0.76 | — | — | — | — | 0.81 | 0.76 |
Geita | 379 | 347 | 1,828 | 2,067 | 1,965 | 1,956 | — | — | 2.31 | 1.56 | 3.84 | 3.88 | — | — | 3.11 | 2.69 |
Sukari (3) | 381 | — | 8,175 | — | 829 | — | 190 | — | 1.00 | — | 3.73 | — | 0.34 | — | 1.29 | — |
AUSTRALIA | 386 | 406 | 4,910 | 4,824 | 2,786 | 2,732 | — | — | 1.07 | 1.08 | 2.42 | 2.70 | — | — | 1.56 | 1.67 |
Sunrise Dam | 174 | 193 | 1,089 | 1,164 | 1,794 | 1,777 | — | — | 1.28 | 1.16 | 2.23 | 2.61 | — | — | 1.87 | 2.04 |
Tropicana - Attributable 70% | 212 | 213 | 3,821 | 3,660 | 992 | 955 | — | — | 1.01 | 1.06 | 2.76 | 2.87 | — | — | 1.37 | 1.43 |
AMERICAS | 375 | 382 | 543 | 580 | 2,139 | 1,446 | 1,510 | 2,109 | 2.93 | 2.44 | 4.13 | 4.04 | 0.82 | 2.20 | 2.78 | 2.88 |
Cerro Vanguardia (3)(5) | 137 | 129 | 541 | 523 | 395 | 390 | 1,449 | 1,424 | 2.93 | 2.58 | 4.49 | 4.74 | 0.62 | 0.57 | 1.78 | 1.71 |
AngloGold Ashanti Mineração (2) | 196 | 196 | — | — | 1,087 | 418 | 61 | 685 | — | — | 5.30 | 5.44 | 5.65 | 5.59 | 5.32 | 5.53 |
Serra Grande | 42 | 57 | 2 | 57 | 657 | 638 | — | — | 1.17 | 1.17 | 1.97 | 2.70 | — | — | 1.97 | 2.57 |
Managed operations | 2,068 | 1,682 | 27,019 | 19,625 | 8,695 | 6,977 | 1,700 | 2,239 | 1.12 | 1.11 | 3.71 | 3.68 | 0.77 | 2.13 | 1.72 | 1.81 |
Non-managed joint ventures | 224 | 229 | 1,798 | 1,652 | 1,015 | 1,204 | — | — | 1.29 | 0.94 | 4.58 | 4.63 | — | — | 2.48 | 2.50 |
Group total including equity-accounted non- managed joint ventures | 2,292 | 1,911 | 28,817 | 21,277 | 9,710 | 8,181 | 1,700 | 2,239 | 1.13 | 1.10 | 3.80 | 3.82 | 0.77 | 2.13 | 1.77 | 1.87 |
Managed operations (excluding Sukari)(4) | 1,687 | 1,682 | 18,844 | 19,625 | 7,866 | 6,977 | 1,510 | 2,239 | 1.17 | 1.11 | 3.71 | 3.68 | 0.82 | 2.13 | 1.86 | 1.81 |
Non-managed joint ventures | 224 | 229 | 1,798 | 1,652 | 1,015 | 1,204 | — | — | 1.29 | 0.94 | 4.58 | 4.63 | — | — | 2.48 | 2.50 |
Group total including equity-accounted non- managed joint ventures (excluding Sukari)(4) | 1,911 | 1,911 | 20,642 | 21,277 | 8,881 | 8,181 | 1,510 | 2,239 | 1.18 | 1.10 | 3.81 | 3.82 | 0.82 | 2.13 | 1.91 | 1.87 |
(1) Equity-accounted joint venture. | ||||||||||||||||
(2) Includes gold concentrate from the Cuiabá mine sold to third parties. | ||||||||||||||||
(3) On a consolidated basis. Siguiri, Sukari and Cerro Vanguardia are owned 85%, 50% and 92.50% by AngloGold Ashanti, respectively. | ||||||||||||||||
(4) Adjusted to exclude Sukari operation which was acquired on 22 November 2024 as part of the Centamin acquisition. | ||||||||||||||||
(5) Cerro Vanguardia has adjusted the basis of allocation between open-pit, underground and other treated tonnes resulting in an adjustment of treated tonnes and related grades for the nine months ended 30 September 2024. | ||||||||||||||||
Rounding of figures may result in computational discrepancies. | ||||||||||||||||
Q3 2025 EARNINGS RELEASE | 55 | | |||
| ||||||
FINANCIAL RESULTS I OPERATIONS AT A GLANCE | ||||||
FOR THE NINE MONTHS ENDED SEPTEMBER 2025 AND 2024
OPERATIONS AT A GLANCE | FOR THE NINE MONTHS ENDED 30 SEPTEMBER 2025 AND 30 SEPTEMBER 2024 | |||||||||||||
Cost of sales | Gross profit | Total cash costs per ounce* | All-in sustaining costs per ounce* | Sustaining MRD / Stripping capital | Other sustaining capital | Non-sustaining capital* | ||||||||
$m | $m | $/oz | $/oz | $m | $m | $m | ||||||||
Sep-25 | Sep-24 | Sep-25 | Sep-24 | Sep-25 | Sep-24 | Sep-25 | Sep-24 | Sep-25 | Sep-24 | Sep-25 | Sep-24 | Sep-25 | Sep-24 | |
AFRICA Non-managed joint ventures | 336 | 278 | 377 | 256 | 1,145 | 924 | 1,392 | 1,133 | 14 | 27 | 36 | 22 | 60 | 40 |
Kibali - Attributable 45% (1) | 336 | 278 | 377 | 256 | 1,145 | 924 | 1,392 | 1,133 | 14 | 27 | 36 | 22 | 60 | 40 |
AFRICA Managed operations | 2,141 | 1,367 | 2,122 | 746 | 1,144 | 1,206 | 1,586 | 1,683 | 281 | 261 | 224 | 126 | 166 | 91 |
Iduapriem | 316 | 260 | 163 | 179 | 1,480 | 1,021 | 2,021 | 1,487 | 52 | 68 | 10 | 12 | 48 | 39 |
Obuasi | 320 | 259 | 295 | 114 | 1,306 | 1,231 | 2,004 | 1,956 | 91 | 78 | 36 | 34 | 18 | 37 |
Siguiri (3) | 418 | 384 | 244 | 88 | 1,735 | 1,687 | 2,043 | 2,062 | 14 | 22 | 35 | 45 | 3 | 6 |
Geita | 520 | 464 | 729 | 365 | 993 | 1,020 | 1,497 | 1,449 | 90 | 93 | 76 | 35 | 14 | 9 |
Sukari (3) | 568 | — | 690 | — | 765 | — | 1,059 | — | 34 | — | 67 | — | 83 | — |
Administration and other | (1) | — | 1 | — | — | — | — | — | — | — | — | — | — | — |
AUSTRALIA | 724 | 687 | 507 | 269 | 1,564 | 1,335 | 1,842 | 1,550 | 31 | 34 | 49 | 30 | 44 | 48 |
Sunrise Dam | 326 | 317 | 218 | 135 | 1,646 | 1,321 | 2,055 | 1,589 | 22 | 22 | 36 | 16 | — | — |
Tropicana - Attributable 70% | 369 | 344 | 318 | 161 | 1,372 | 1,230 | 1,537 | 1,394 | 9 | 12 | 13 | 14 | 44 | 48 |
Administration and other | 29 | 26 | (29) | (27) | — | — | — | — | — | — | — | — | — | — |
AMERICAS | 728 | 627 | 603 | 347 | 1,201 | 1,024 | 1,719 | 1,493 | 106 | 105 | 47 | 38 | 12 | — |
Cerro Vanguardia (3) | 347 | 269 | 211 | 133 | 1,253 | 1,044 | 1,695 | 1,460 | 22 | 28 | 21 | 20 | — | — |
AngloGold Ashanti Mineração (2) | 271 | 254 | 366 | 185 | 944 | 883 | 1,438 | 1,330 | 58 | 56 | 19 | 12 | 12 | — |
Serra Grande | 108 | 103 | 28 | 30 | 2,184 | 1,439 | 3,051 | 2,113 | 26 | 21 | 7 | 6 | — | — |
Administration and other | 2 | 1 | (2) | (1) | — | — | — | — | — | — | — | — | — | — |
PROJECTS | — | — | — | — | — | — | — | — | — | — | 2 | 3 | 32 | 20 |
Colombian projects | — | — | — | — | — | — | — | — | — | — | — | — | 12 | 5 |
North American projects | — | — | — | — | — | — | — | — | — | — | 2 | 3 | 20 | 15 |
CORPORATE AND OTHER | 4 | 2 | (4) | (72) | — | — | — | — | — | — | 1 | 1 | — | — |
Managed operations | 3,597 | 2,683 | 3,228 | 1,290 | 1,233 | 1,195 | 1,706 | 1,660 | 418 | 400 | 323 | 198 | 254 | 159 |
Non-managed joint ventures | 336 | 278 | 377 | 256 | 1,145 | 924 | 1,392 | 1,133 | 14 | 27 | 36 | 22 | 60 | 40 |
Group total including equity-accounted non- managed joint ventures | 3,933 | 2,961 | 3,605 | 1,546 | 1,224 | 1,163 | 1,676 | 1,598 | 432 | 427 | 359 | 220 | 314 | 199 |
Managed operations (excluding Sukari)(4) | 3,029 | 2,683 | 2,538 | 1,290 | 1,339 | 1,195 | 1,854 | 1,660 | 384 | 400 | 256 | 198 | 171 | 159 |
Non-managed joint ventures | 336 | 278 | 377 | 256 | 1,145 | 924 | 1,392 | 1,133 | 14 | 27 | 36 | 22 | 60 | 40 |
Group total including equity-accounted non- managed joint ventures (excluding Sukari)(4) | 3,365 | 2,961 | 2,915 | 1,546 | 1,316 | 1,163 | 1,801 | 1,598 | 398 | 427 | 292 | 220 | 231 | 199 |
(1) Equity-accounted joint venture. | ||||||||||||||
(2) Includes gold concentrate from the Cuiabá mine sold to third parties. | ||||||||||||||
(3) On a consolidated basis. Siguiri, Sukari and Cerro Vanguardia are owned 85%, 50% and 92.50% by AngloGold Ashanti, respectively. | ||||||||||||||
(4) Adjusted to exclude Sukari operation which was acquired on 22 November 2024 as part of the Centamin acquisition. | ||||||||||||||
* Refer to “Non-GAAP disclosure” for definitions and reconciliations. | ||||||||||||||
Rounding of figures may result in computational discrepancies. | ||||||||||||||
Q3 2025 EARNINGS RELEASE | 56 | | |||
| ||||||
ADMINISTRATION AND CORPORATE I INFORMATION | ||||||
AngloGold Ashanti plc Incorporated in England & Wales Registration No. 14654651 LEI No. 2138005YDSA7A82RNU96 Share codes: ISIN: GB00BRXH2664 CUSIP: G0378L100 NYSE: AU JSE: ANG A2X: ANG GhSE (Shares): AGA GhSE (GhDS): AAD JSE Sponsor: The Standard Bank of South Africa Limited Auditors: PricewaterhouseCoopers Inc. PricewaterhouseCoopers LLP Offices Registered and Corporate Third Floor, Hobhouse Court Suffolk Street London SW1Y 4HH United Kingdom Telephone: +44 (0) 203 968 3320 Fax: +44 (0) 203 968 3325 Global headquarters 6363 S. Fiddlers Green Circle, Suite 1000 Greenwood Village, CO 80111 United States of America Telephone: +1 303 889 0700 Australia Level 10, AMP Building, 140 St George’s Terrace Perth, WA 6000 (PO Box Z5046, Perth WA 6831) Australia Telephone: +61 8 9425 4602 Fax: +61 8 9425 4662 South Africa 112 Oxford Road Houghton Estate, Johannesburg, 2198 (Private Bag X 20, Rosebank, 2196) South Africa Telephone: +27 11 637 6000 Fax: +27 11 637 6624 Ghana Gold House Patrice Lumumba Road (PO Box 2665) Accra AngloGold Ashanti posts information that may be important to investors on the main page of its website at www.anglogoldashanti.com and under the “Investors” tab on the main page. This information is updated periodically. AngloGold Ashanti intends to use its website as a means of disclosing material non-public information to the public in a broad, non-exclusionary manner and for complying with its disclosure obligations. Accordingly, investors should visit this website regularly to obtain important information about AngloGold Ashanti, in addition to following its press releases, documents it files with, or furnishes to, the United States Securities and Exchange Commission (SEC) and public conference calls and webcasts. No material on the AngloGold Ashanti website forms any part of, or is incorporated by reference into, this document. References herein to the AngloGold Ashanti website shall not be deemed to cause such incorporation. PUBLISHED BY ANGLOGOLD ASHANTI Ghana Telephone: +233 303 773400 Fax: +233 303 778155 | Directors Executive A Calderon (Chief Executive Officer) GA Doran (Chief Financial Officer) Non-Executive JE Tilk (Chairman) KOF Busia B Cleaver AM Ferguson AH Garner J Magie N Newton-King M Randolph DL Sands Company Secretary C Stead Company secretarial e-mail companysecretary@anglogoldashanti.com Investor Relations contacts Yatish Chowthee Telephone: +27 11 637 6273 Mobile: +27 78 364 2080 E-mail: yrchowthee@aga.gold Andrea Maxey Telephone: +61 08 9425 4603 Mobile: +61 400 072 199 E-mail: amaxey@aga.gold AngloGold Ashanti website www.anglogoldashanti.com AngloGold Ashanti posts information that may be important to investors on the main page of its website at www.anglogoldashanti.com and under the “Investors” tab on the main page. This information is updated periodically. AngloGold Ashanti intends to use its website as a means of disclosing material non-public information to the public in a broad, non-exclusionary manner and for complying with its disclosure obligations. Accordingly, investors should visit this website regularly to obtain important information about AngloGold Ashanti, in addition to following its press releases, documents it files with, or furnishes to, the United States Securities and Exchange Commission (SEC) and public conference calls and webcasts. No material on the AngloGold Ashanti website forms any part of, or is incorporated by reference into, this document. References herein to the AngloGold Ashanti website shall not be deemed to cause such incorporation. PUBLISHED BY ANGLOGOLD ASHANTI | Share Registrars United States Computershare Trust Company, N.A. 150 Royall Street Suite 101 Canton, MA 02021 United States of America Telephone US: 866-644-4127 Telephone non-US: +1-781-575-2000 Shareholder Online inquiries: https://www-us.computershare.com/Investor/ #Contact Website: www.computershare.com/investor South Africa Computershare Investor Services (Pty) Limited Rosebank Towers, 15 Biermann Avenue Rosebank, 2196 (PO Box 61051, Marshalltown 2107) South Africa Telephone: 0861 100 950 (in SA) Fax: +27 11 688 5218 E-mail: queries@computershare.co.za Website: www.computershare.com Ghana Central Securities Depository (GH) LTD 4th Floor, Cedi House PMB CT 465, Cantonments Accra, Ghana Telephone: +233 302 689313 Fax: +233 302 689315 Ghana depositary NTHC Limited 18 Gamel Abdul Nasser Avenue Ringway Estate Accra, Ghana Telephone: +233 302 235814/6 Fax: +233 302 229975 AngloGold Ashanti posts information that may be important to investors on the main page of its website at www.anglogoldashanti.com and under the “Investors” tab on the main page. This information is updated periodically. AngloGold Ashanti intends to use its website as a means of disclosing material non-public information to the public in a broad, non-exclusionary manner and for complying with its disclosure obligations. Accordingly, investors should visit this website regularly to obtain important information about AngloGold Ashanti, in addition to following its press releases, documents it files with, or furnishes to, the United States Securities and Exchange Commission (SEC) and public conference calls and webcasts. No material on the AngloGold Ashanti website forms any part of, or is incorporated by reference into, this document. References herein to the AngloGold Ashanti website shall not be deemed to cause such incorporation. PUBLISHED BY ANGLOGOLD ASHANTI |
AngloGold Ashanti posts information that may be important to investors on the main page of its website at
www.anglogoldashanti.com and under the “Investors” tab on the main page. This information is updated
periodically. AngloGold Ashanti intends to use its website as a means of disclosing material non-public
information to the public in a broad, non-exclusionary manner and for complying with its disclosure obligations.
Accordingly, investors should visit this website regularly to obtain important information about AngloGold
Ashanti, in addition to following its press releases, documents it files with, or furnishes to, the United States
Securities and Exchange Commission (SEC) and public conference calls and webcasts. No material on the
AngloGold Ashanti website forms any part of, or is incorporated by reference into, this document. References
herein to the AngloGold Ashanti website shall not be deemed to cause such incorporation.
PUBLISHED BY ANGLOGOLD ASHANTI
FORWARD-LOOKING I STATEMENTS
Certain statements contained in this document, other than statements of historical fact, including, without limitation, those concerning the economic outlook for the gold mining industry, expectations
regarding gold prices, production, total cash costs, all-in sustaining costs, cost savings and other operating results, return on equity, productivity improvements, growth prospects and outlook of
AngloGold Ashanti’s operations, individually or in the aggregate, including the achievement of project milestones, commencement and completion of commercial operations of certain of AngloGold
Ashanti’s exploration and production projects and the completion of acquisitions, dispositions or joint venture transactions, AngloGold Ashanti’s liquidity and capital resources and capital
expenditures and the outcome and consequences of any potential or pending litigation or regulatory proceedings or environmental, health and safety issues, are forward-looking statements
regarding AngloGold Ashanti’s financial reports, operations, economic performance and financial condition. These forward-looking statements or forecasts are not based on historical facts, but
rather reflect our current beliefs and expectations concerning future events and generally may be identified by the use of forward-looking words, phrases and expressions such as “believe”,
“expect”, “aim”, “anticipate”, “intend”, “foresee”, “forecast”, “predict”, “project”, “estimate”, “likely”, “may”, “might”, “could”, “should”, “would”, “seek”, “plan”, “scheduled”, “possible”, “continue”,
“potential”, “outlook”, “target” or other similar words, phrases, and expressions; provided that the absence thereof does not mean that a statement is not forward-looking. Similarly, statements that
describe our objectives, plans or goals are or may be forward-looking statements. These forward-looking statements or forecasts involve known and unknown risks, uncertainties and other factors
that may cause AngloGold Ashanti’s actual results, performance, actions or achievements to differ materially from the anticipated results, performance, actions or achievements expressed or implied
in these forward-looking statements. Although AngloGold Ashanti believes that the expectations reflected in such forward-looking statements and forecasts are reasonable, no assurance can be
given that such expectations will prove to have been correct. Accordingly, results, performance, actions or achievements could differ materially from those set out in the forward-looking statements
as a result of, among other factors, changes in economic, social, political and market conditions, including related to inflation or international conflicts, the success of business and operating
initiatives, changes in the regulatory environment and other government actions, including environmental approvals, fluctuations in gold prices and exchange rates, the outcome of pending or future
litigation proceedings, any supply chain disruptions, any public health crises, pandemics or epidemics, the failure to maintain effective internal control over financial reporting or effective disclosure
controls and procedures, the inability to remediate one or more material weaknesses, or the discovery of additional material weaknesses, in the Company’s internal control over financial reporting,
and other business and operational risks and challenges and other factors, including mining accidents. For a discussion of such risk factors, refer to AngloGold Ashanti’s annual report on Form 20-F
for the financial year ended 31 December 2024 filed with the United States Securities and Exchange Commission (SEC). These factors are not necessarily all of the important factors that could
cause AngloGold Ashanti’s actual results, performance, actions or achievements to differ materially from those expressed in any forward-looking statements. Other unknown or unpredictable factors
could also have material adverse effects on AngloGold Ashanti’s future results, performance, actions or achievements. Consequently, readers are cautioned not to place undue reliance on forward-
looking statements. AngloGold Ashanti undertakes no obligation to update publicly or release any revisions to these forward-looking statements to reflect events or circumstances after the date
hereof or to reflect the occurrence of unanticipated events, except to the extent required by applicable law. All subsequent written or oral forward-looking statements attributable to AngloGold
Ashanti or any person acting on its behalf are qualified by the cautionary statements herein.
Non-GAAP financial measures
This communication may contain certain “Non-GAAP” financial measures. AngloGold Ashanti utilises certain Non-GAAP performance measures and ratios in managing its business. Non-GAAP
financial measures should be viewed in addition to, and not as an alternative for, the reported operating results or cash flow from operations or any other measures of performance prepared in
accordance with IFRS. In addition, the presentation of these measures may not be comparable to similarly titled measures other companies may use.
SIGNATURES
Pursuant to the requirements of the Securities Exchange Act of 1934, the registrant has duly
caused this report to be signed on its behalf by the undersigned, thereunto duly authorised.
AngloGold Ashanti plc
Date: 12 November 2025
By:/s/ C STEAD
Name:C Stead
Title:Company Secretary