UNITED STATES
SECURITIES AND EXCHANGE COMMISSION
Washington, D.C. 20549
FORM 6-K
REPORT OF FOREIGN PRIVATE ISSUER
PURSUANT TO RULE 13a-16 OR 15d-16 UNDER
THE SECURITIES EXCHANGE ACT OF 1934
For the month of May 2026
Commission File Number: 001-41815
AngloGold Ashanti plc
(Translation of registrant’s name into English)
Third Floor, Hobhouse Court, Suffolk Street
London SW1Y 4HH
United Kingdom
6363 S. Fiddlers Green Circle, Suite 1000
Greenwood Village, CO 80111
United States of America
(Address of principal executive offices)
Indicate by check mark whether the registrant files or will file annual reports under cover of Form 20-F
or Form 40-F.
Form 20-F ☒ Form 40-F ☐
Enclosure: AngloGold Ashanti Earnings Release for the Three Months Ended 31 March 2026
 | 2 | Q1 2026 Earnings Release |

8 May 2026

AngloGold Ashanti delivers record free cash flow* of $1.2bn and EBITDA*(4) of $2.3bn • Gold production(1)(2) +1% • Net cash*(4) of $868m • Q1 2026 interim dividend of $585m, or 116 cps • Proposed $2.0bn share repurchase programme announced |
London, Denver, Johannesburg, 8 May 2026 – AngloGold
Ashanti plc (“AngloGold Ashanti”, “AGA”, the “Company” or the
“Group”) posted record free cash flow* of $1.2bn in Q1 2026,
almost triple the Q1 2025 amount, following steady performances
from most of its operating assets and the continued high gold
price. The Company remains on track to meet its 2026 annual
guidance.
An interim dividend for Q1 2026 was declared of $585m, or 116
US cents per share, a new record, compared to 12.5 US cents
per share declared in Q1 2025. On 7 May 2026, the Board of
Directors approved a proposed share repurchase programme for
AngloGold Ashanti’s ordinary shares of up to $2.0bn, subject to
shareholder approval.
"Our focus remains to control what we can control - managing
underlying costs and ensuring safe, predictable operating
results,” said CEO Alberto Calderon. “That has again enabled us
to deliver record free cash flow* and cash returns to our
shareholders, while moving our organic growth projects forward."
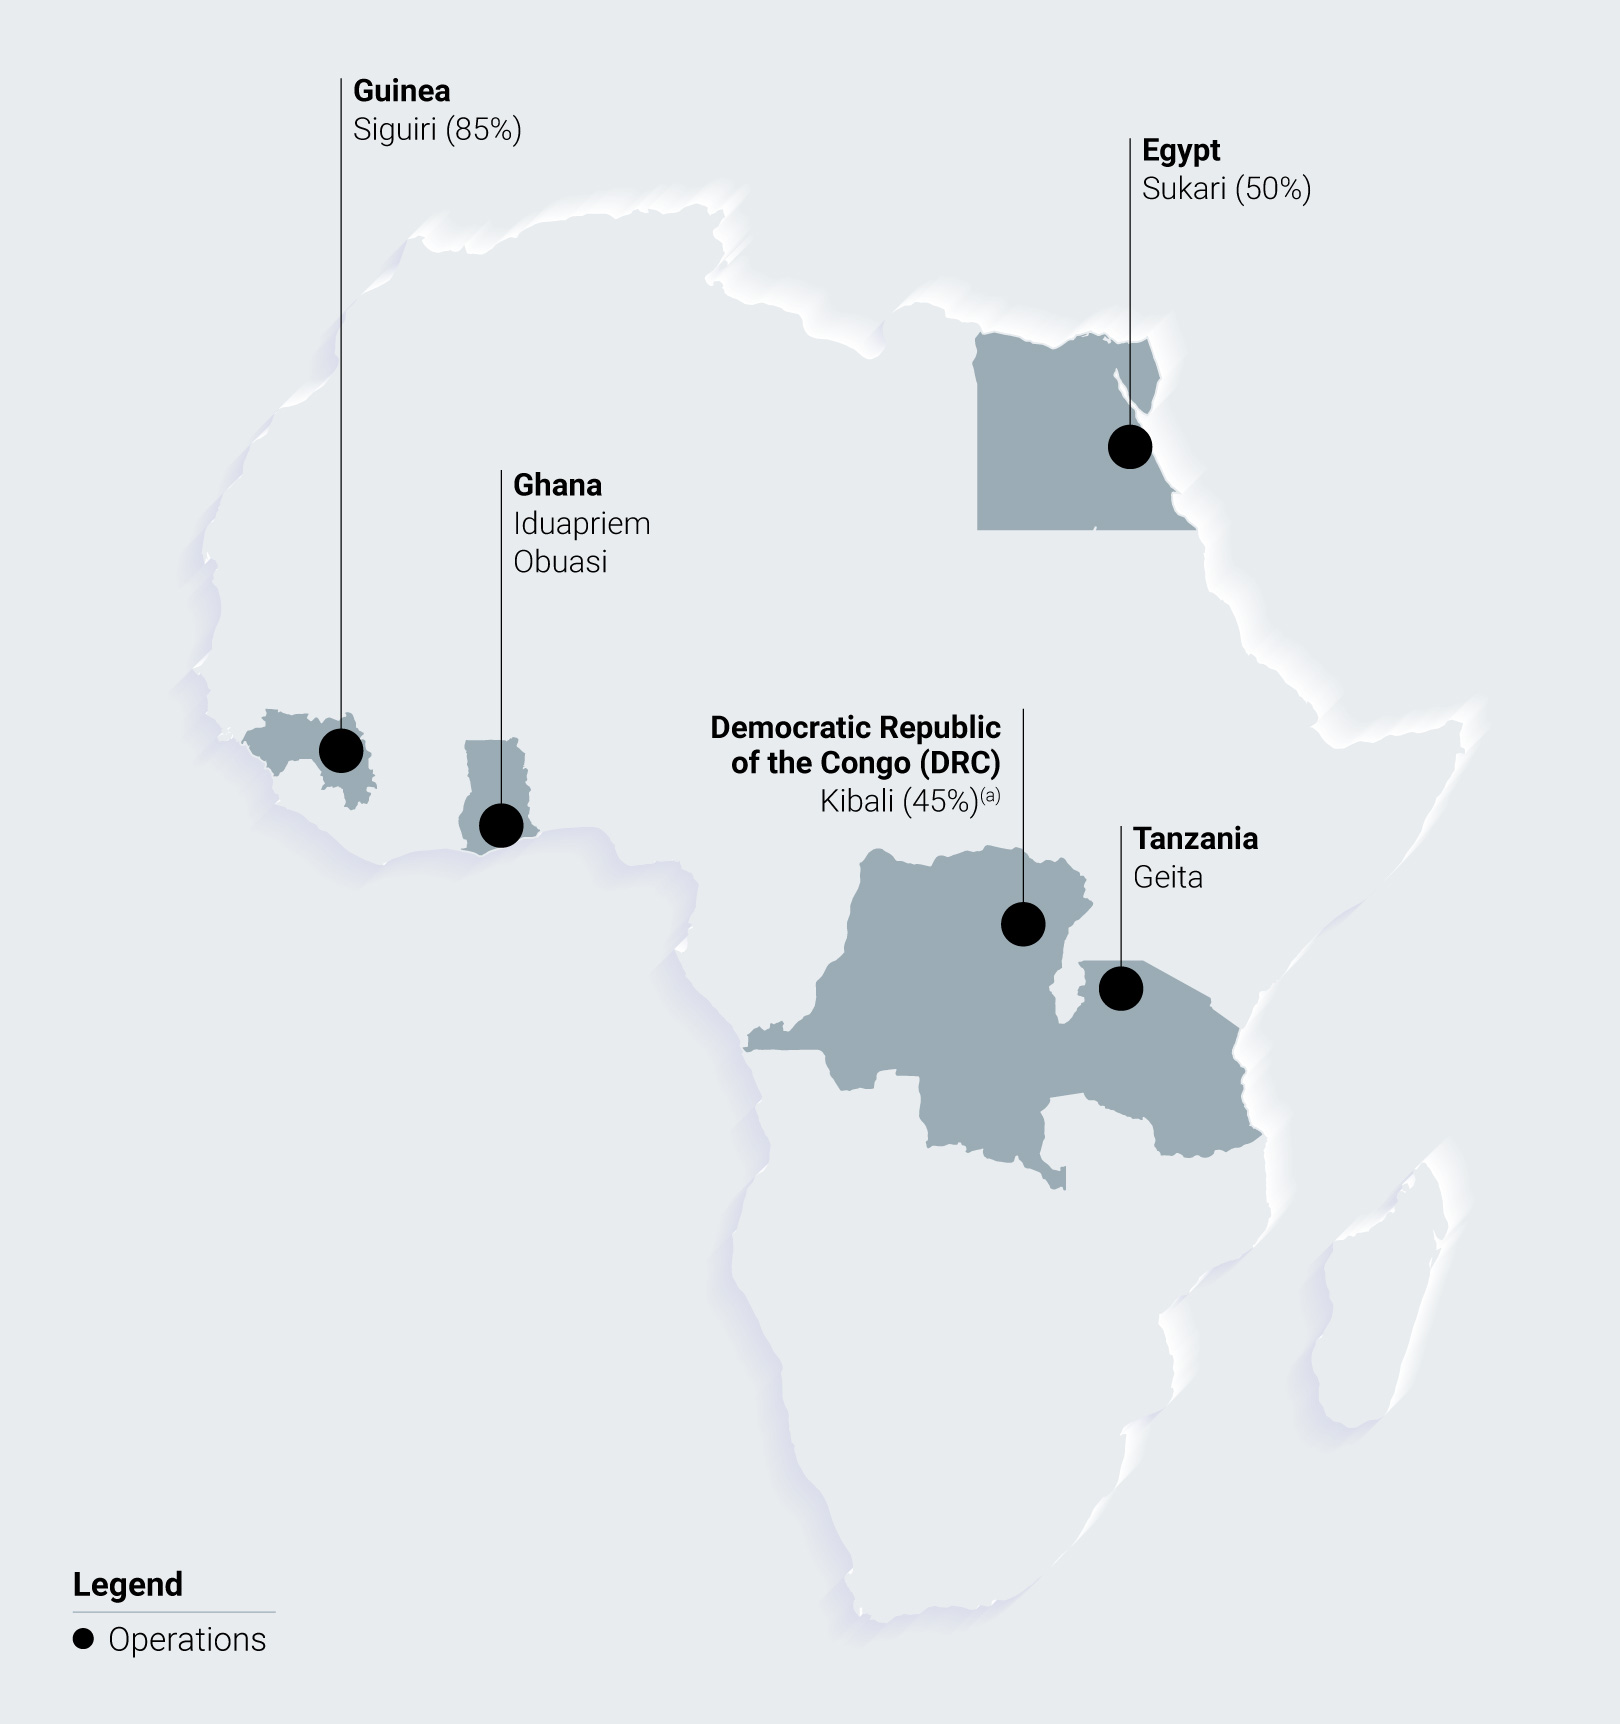
AngloGold Ashanti continues to focus on a series of key strategic
initiatives: delivery of predictable operating results; providing
competitive returns to shareholders; bringing a large, new
production centre into operation in southern Nevada; the steady
ramp-up of its Obuasi mine in Ghana; and realising a series of
organic growth projects at its mines in Tanzania, Guinea, Egypt
and Brazil.
Safety performance and workplace fatality
At Obuasi, following the end of Q1 2026 on 24 April 2026, a
contractor was fatally injured following a release of waste
material from an underground ore pass. A comprehensive
investigation into the incident is underway, with the express aim
of ensuring that similar incidents do not occur in the future. The
family and colleagues affected by this tragedy are receiving
ongoing support.
“We are heartbroken by the loss of our colleague and offer our
deepest sympathy to his family and loved ones," said CEO
Alberto Calderon. “Safety has always been our first and highest
priority and we will ensure we understand the root cause of this
incident and apply every lesson learned.”
During Q1 2026, safety remained at the core of continuous
improvement efforts. The Total Recordable Injury Frequency Rate
(“TRIFR”) at the Company’s managed operations(1) improved to
0.86 injuries per million hours worked in Q1 2026, compared to
0.97 injuries per million hours worked for 2025. While these injury
rates remained well below industry averages, the incident at
Obuasi underscored the importance of continued vigilance in the
face of workplace hazards.
Cash flow supports leading capital allocation
Free cash flow*, the strongest for a single quarter, represented a
190% increase year-on-year to $1.2bn in Q1 2026 from $403m in
Q1 2025. Net cash flow from operating activities was up 136%
year-on-year to $1.7bn in Q1 2026 (from $725m in Q1 2025). The
average gold price received per ounce*(1) in Q1 2026 was 69%
higher year-on-year compared to Q1 2025.
EBITDA*(4) increased 130% year-on-year to $2.3bn in Q1 2026
(from $1.0bn in Q1 2025), while headline earnings(3) rose 187%
to $1.3bn in Q1 2026, or 252 US cents per share (from $447m, or
88 US cents per share, in Q1 2025).
In line with the Company’s dividend policy, the base dividend of
$63m or 12.5 US cents per share was declared for Q1 2026. This
was topped up to 50% of free cash flow*, to arrive at the interim
dividend declaration of $585m, or 116 US cents per share.
The balance sheet continued to strengthen, swinging from $755m
of net debt*(4) in Q1 2025 to $868m of net cash*(4) at the end of
Q1 2026, all while making a series of record dividend payments
in the intervening quarters.
Capitalising on the robust balance sheet and strong liquidity
position, on 16 April 2026, the Company bought back
approximately $666m principal amount of its outstanding bonds,
further optimising its capital structure and improving its overall
flexibility through the cycle.
The strategic decision by the Board to approve a proposed $2bn
share repurchase programme is underpinned by stronger cash
generation capabilities and the prospective financial outlook for
the business. The proposed share repurchase programme is
intended to offer another vector for shareholder returns, and align
the Company’s capital return framework with its North American
peers. The proposed share repurchase programme reflects
AngloGold Ashanti’s disciplined approach to capital allocation,
utilising excess liquidity to reduce ordinary shares in issue
thereby increasing per-share value, earnings and cash flow for its
shareholders.
Underlying operational costs down $22/oz,
offsetting macro headwinds
External pressures from inflation, exchange rates and royalties
led to a year-on-year increase in total cash costs per ounce* for
the Group(1) to $1,391/oz in Q1 2026, from $1,223/oz in Q1 2025.
The Company’s continued focus on its Full Asset Potential
programme and rigorous cost discipline held total cash costs per
ounce* for managed operations(1) at $1,377/oz in Q1 2026. These
external pressures included a $117/oz rise in royalties due to
| 3 | Q1 2026 Earnings Release |
AngloGold Ashanti plc | |||
2026 | Quarter 1 |  |
Group Performance continued
record realised gold prices, alongside $43/oz in inflationary
impacts, specifically related to higher labour and mining
contractor costs, and a $30/oz impact from foreign exchange
movements.
Crucially, structural efficiencies delivered through the Full Asset
Potential programme reduced underlying, controllable costs by
$22/oz in Q1 2026 compared to Q1 2025. Targeted optimisation
of plant throughput (-$103/oz), improved open pit volume
efficiencies (-$15/oz), and by-product credits (-$64/oz)
successfully absorbed residual operating pressures.
This disciplined cost management ensured the higher gold price
was translated into expanded margins, with the total cash cost
margin* for the Group(1) increasing from 57% in Q1 2025 to 71%
in Q1 2026.
Momentum continued at managed operations(1)
Gold production for the Group(1)(2) remained stable, increasing to
724,000oz in Q1 2026, up from 720,000oz (or 710,000oz
excluding Serra Grande) in Q1 2025. The result was driven by a
solid performance from most managed operations(1)(2), partially
offset by lower gold production at Kibali. At managed
operations(1)(2), gold production rose 1% year-on-year to
666,000oz in Q1 2026, while total cash costs per ounce* and all-
in sustaining costs per ounce* (“AISC”) increased by 14% and
19% year-on-year in Q1 2026 to $1,377/oz and $1,980/oz,
respectively, compared to Q1 2025. Meanwhile non-managed
joint ventures experienced an 8% year-on-year reduction in gold
production to 58,000oz in Q1 2026.
Year-on-year gold production improvements totalling 9koz (or
19koz excluding Serra Grande) were achieved for managed
operations(1)(2) in Q1 2026, with higher gold production at Geita
(+12koz), Cuiabá (+9koz), Obuasi (+8koz), Iduapriem (+4koz),
Cerro Vanguardia (+3koz) and Tropicana (+2koz). These
increases were partly offset by lower gold production
contributions year-on-year in Q1 2026 from Sunrise Dam
(-10koz), Siguiri (-5koz) and Sukari (-4koz), reflecting variations
in mine sequencing and planned throughput compared to Q1
2025, alongside lower output from the remainder of the portfolio.
The Serra Grande operation in Brazil was sold on 1 December
2025.
Total cash costs per ounce* for the Group(1) increased by 14%
year-on-year to $1,391/oz in Q1 2026 from $1,223/oz in Q1 2025,
primarily reflecting higher royalty payments driven by the record
gold price and the impact from underlying inflation, mainly due to
increases in labour and mining contractor costs in the
jurisdictions in which the Company operates. AISC per ounce* for
the Group(1) rose by 19% year-on-year to $1,955/oz in Q1 2026
from $1,640/oz in Q1 2025, driven mainly by the mechanical
increase in gold price-linked royalties and a planned 29%
increase in sustaining capital expenditure*.
The increase in sustaining capital expenditure* reflects deliberate
and ongoing investment to advance the Full Asset Potential
programme, support asset integrity, and ensure long-term
operational resilience, in line with the Company’s strategic
priorities.
Total capital expenditure for the Group(1) was $467m in Q1 2026,
up 39% year-on-year from $336m in Q1 2025. This included
$305m in sustaining capital expenditure* and $162m in non-
sustaining capital expenditure*, the latter directed toward
targeted development initiatives across the portfolio, particularly
the advancement of the Nevada growth projects.
Supply chain update
In response to the ongoing crisis in the Middle East, the
Company has activated its global supply chain resilience
protocols to ensure operational continuity. Proactive mitigation
measures include, among other things, increasing fuel stocks and
inventory buffers of critical spares and consumables at key
African and Australian operations.
Arthur Gold Project technical report
published(5)(6)(7)
During Q1 2026, the Company published the Technical Report
Summary on the Pre-Feasibility Study for the Arthur Gold Project
in Nevada(5). The study declared an initial Probable Mineral
Reserve of 4.9Moz of gold (88Mt at 1.75g/t), establishing the
project as a cornerstone of the Company’s US growth
platform(5)(6).
“The exceptional economics detailed in the pre-feasibility study
firmly establish the Arthur Gold Project as the cornerstone of our
US growth platform,” said CEO Alberto Calderon. “Generating an
after-tax NPV of up to $3.46bn at a gold price of $3,500/oz with
an IRR up to 26%, this project pairs immediate scale with
outstanding financial returns. With a world-class oxide orebody,
minimal technical risk, and a disciplined capital approach, we
have a clear roadmap to driving immense long-term shareholder
value in a premier mining jurisdiction.”
The project demonstrates highly competitive economics and
exceptional leverage to the gold price. At a $2,715/oz gold price,
the project generates an estimated after-tax NPV (at a 5%
discount rate) of $1.73bn to $1.78bn with an IRR of 15% to 19%.
At a $3,500/oz gold price, the estimated after-tax NPV roughly
doubles to $3.41bn to $3.46bn, driving the IRR up to 22% to
26%.
The operation is modelled to deliver an average annual
production of approximately 500,000oz over an initial 9-year life
of mine at a competitive life-of-mine AISC* of $925/oz-
$975/ oz(5)(6)(7). Because the Merlin reserve is predominantly
oxide material (greater than 95%) amenable to conventional
processing, the project is expected to avoid the complexity and
technical risk of refractory processing. Feasibility-level
environmental, hydrological and community baseline studies are
already underway.
Outlook(7)(8)
Full year 2026 guidance for gold production, costs and capital
expenditure, which was issued in February 2026, remains
unchanged.
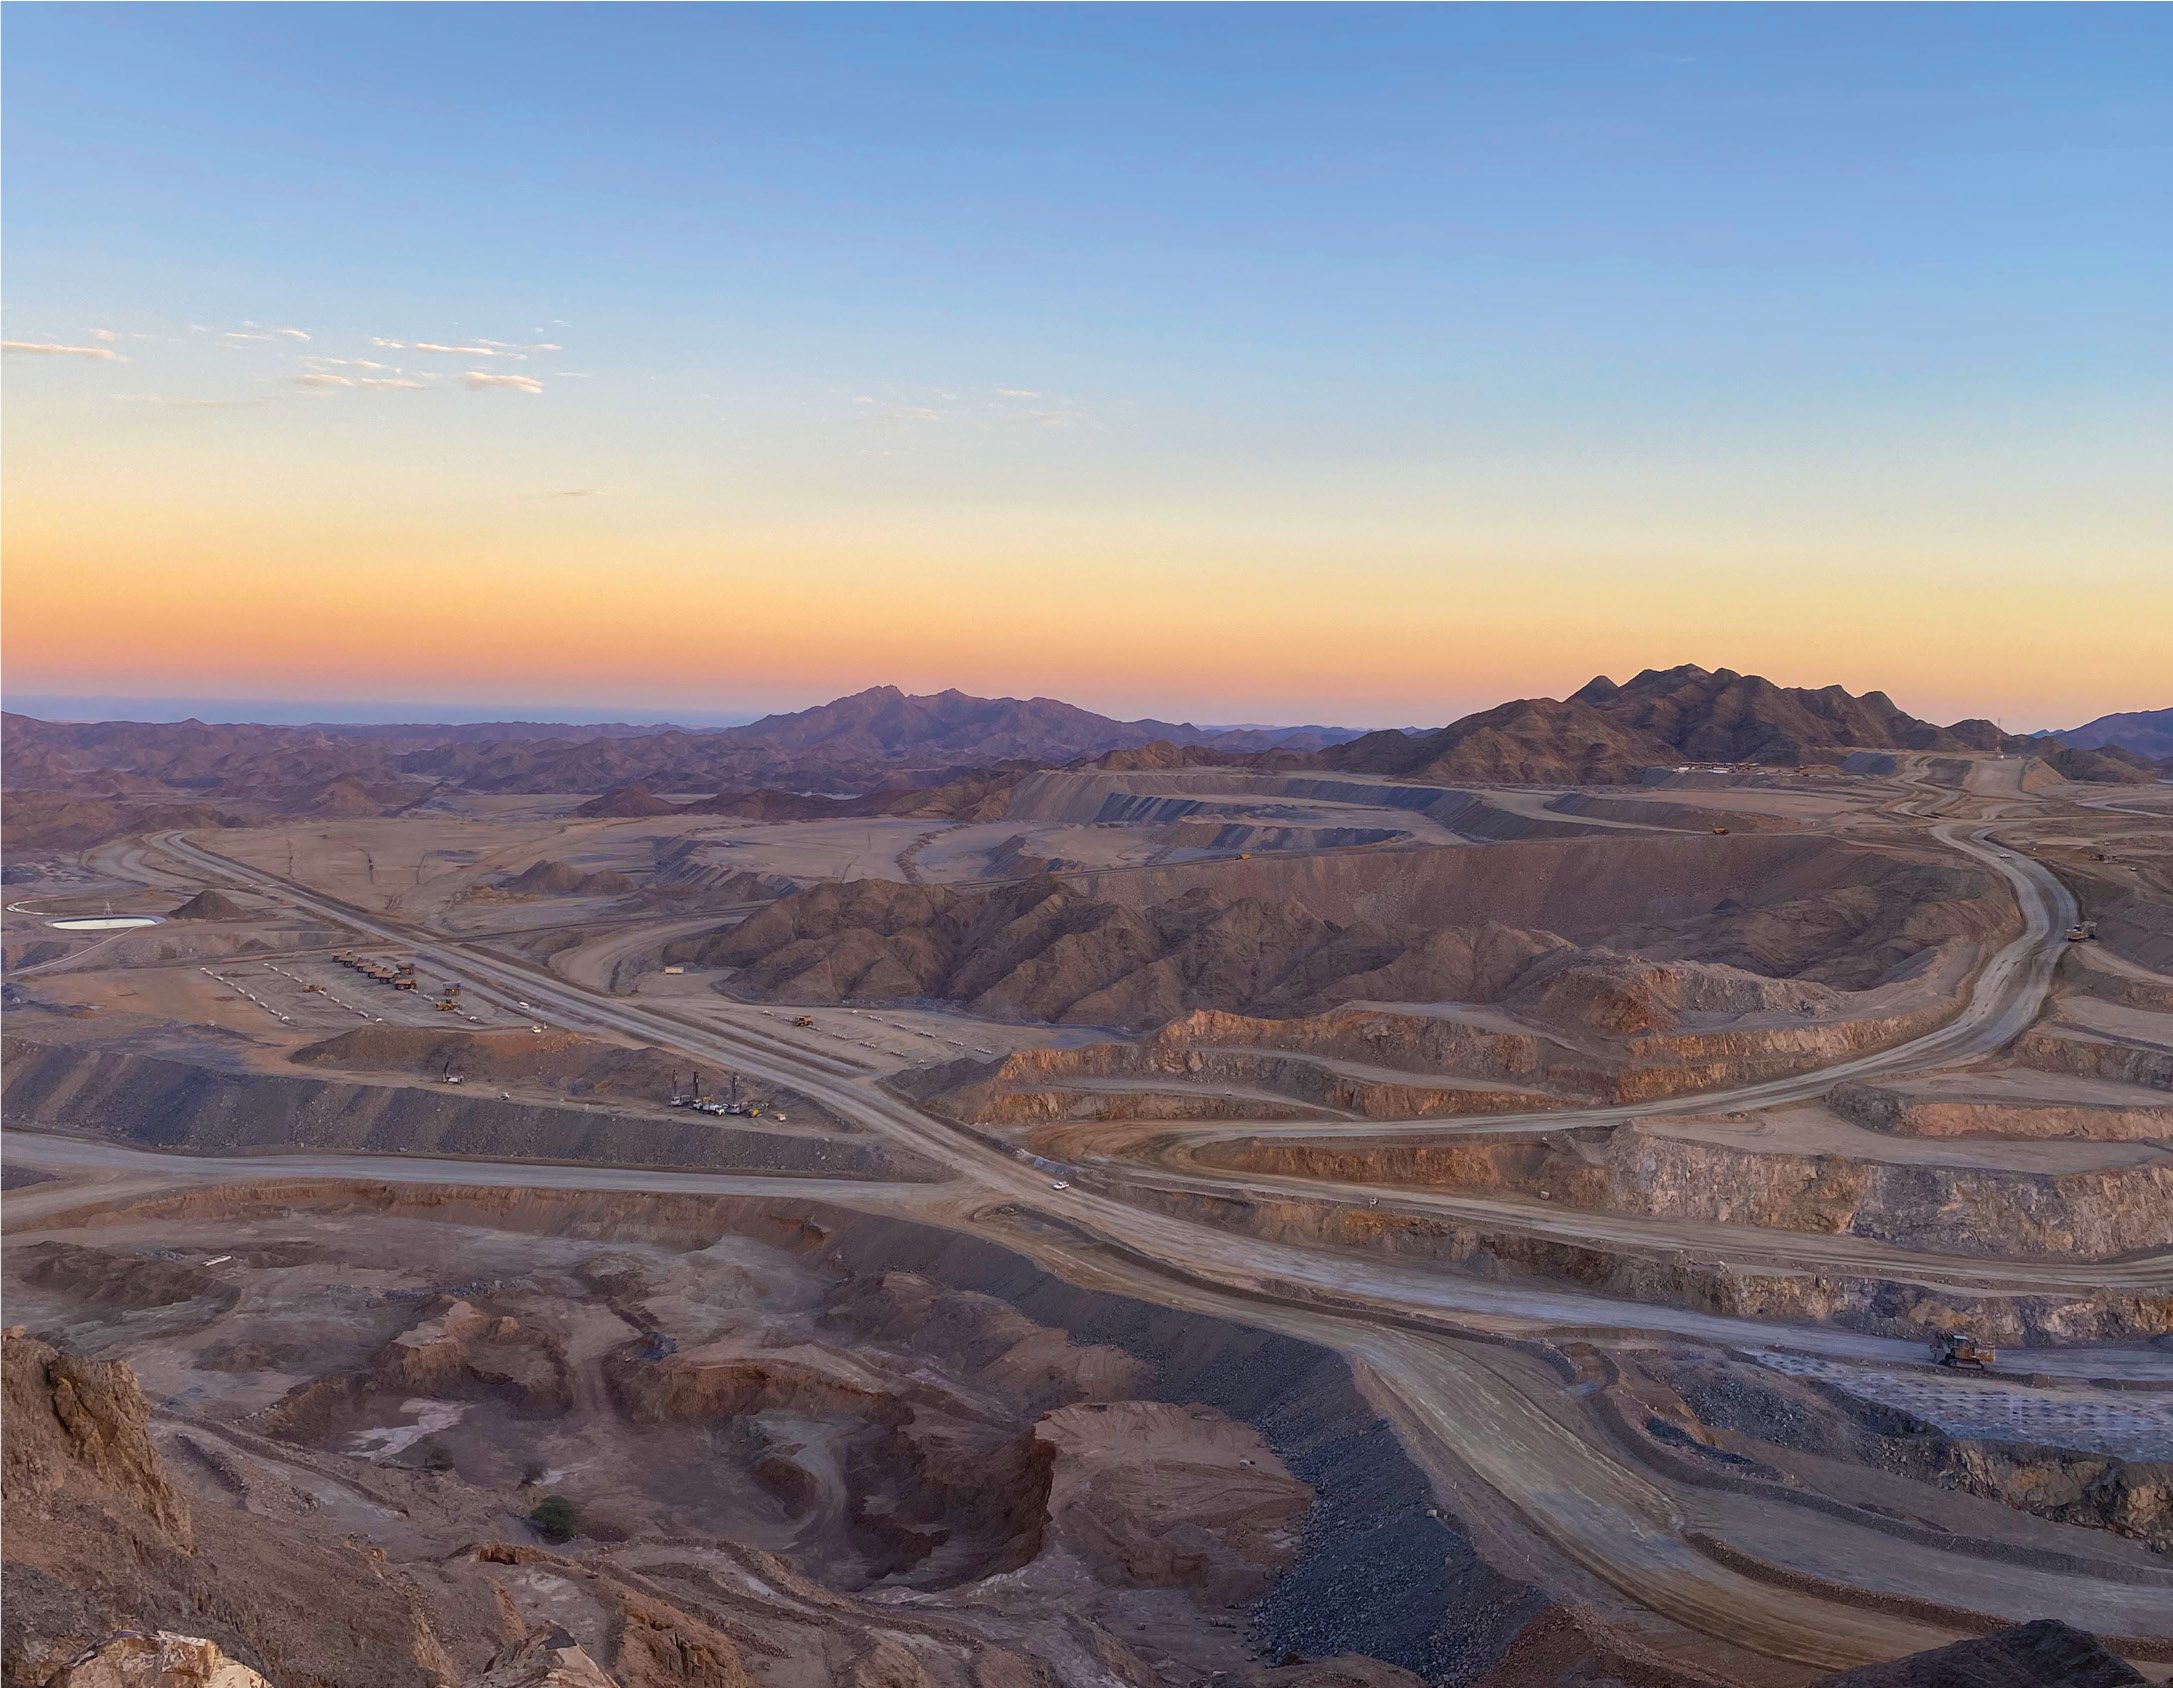
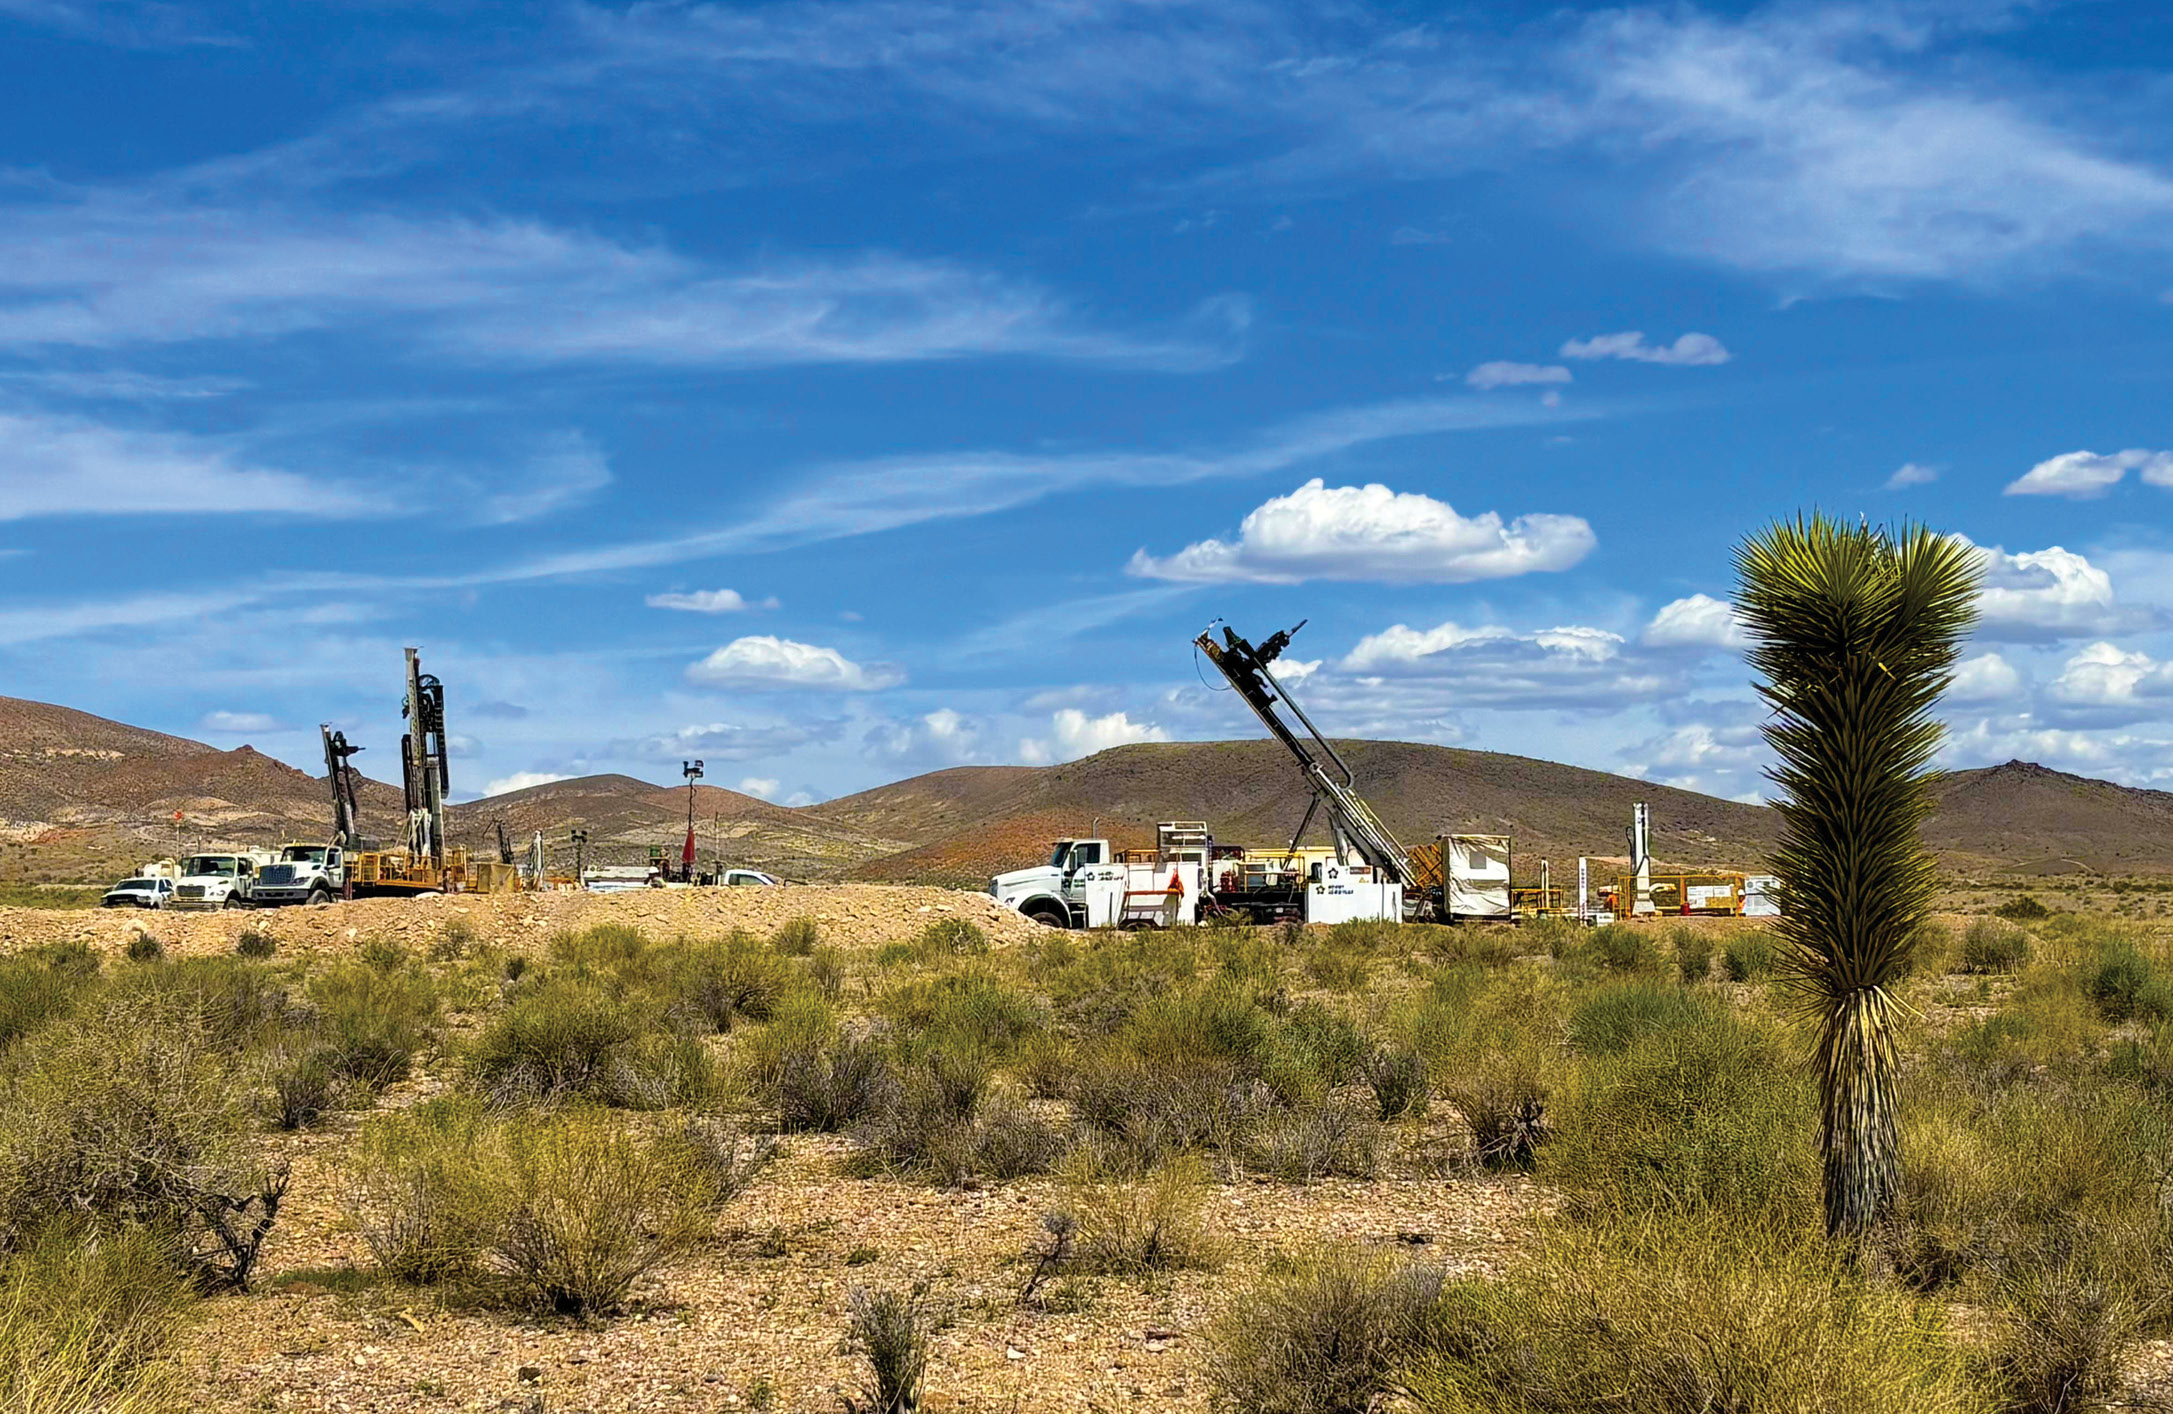
Nevada, United States of America
| 4 | Q1 2026 Earnings Release |
AngloGold Ashanti plc | |||
2026 | Quarter 1 | |
Group Performance continued
(1)The term “managed operations” refers to subsidiaries managed by
AngloGold Ashanti and included in its consolidated reporting, while the
term “non-managed joint ventures” (i.e., Kibali) refers to equity-accounted
joint ventures that are reported based on AngloGold Ashanti's share of
attributable earnings and are not managed by AngloGold Ashanti.
Managed operations are reported on a consolidated basis. Non-managed
joint ventures are reported on an attributable basis.
(2)Includes gold concentrate from the Cuiabá mine sold to third parties.
(3)The financial measures “headline earnings (loss)” and “headline earnings
(loss) per share” are not calculated in accordance with IFRS® Accounting
Standards, but in accordance with the Headline Earnings Circular 1/2023,
issued by the South African Institute of Chartered Accountants (SAICA), at
the request of the Johannesburg Stock Exchange Limited (JSE). These
measures are required to be disclosed by the JSE Listings Requirements
and therefore do not constitute Non-GAAP financial measures for
purposes of the rules and regulations of the US Securities and Exchange
Commission (“SEC”) applicable to the use and disclosure of Non-GAAP
financial measures.
(4)To enhance comparability with industry peers, AngloGold Ashanti will
present net debt (cash)* and EBITDA* as well as its net debt (cash)* to
EBITDA* ratio (leverage ratio), which are Non-GAAP financial measures,
and will not further adjust these metrics in its reporting. Comparative
periods will also reflect this change.
(5)The Technical Report Summary on the Pre-Feasibility Study for the Arthur
Gold Project is filed as an exhibit to the Company’s annual report on Form
20-F for the financial year ended 31 December 2025 as filed with the SEC
on 26 March 2026.
(6)The Arthur Gold Project Mineral Reserve estimate is presented as at
31 December 2025, unless otherwise stated, and economic estimates
presented are calculated based on the Mineral Reserve declared in the
Technical Report Summary on the Pre-Feasibility Study for the Arthur Gold
Project only, exclusive of Mineral Resource. For further information, see
the Company’s news release “AngloGold Ashanti Builds on Award-Winning
Discovery, Advancing Arthur Gold Project in Nevada with first-time 4.9Moz
Mineral Reserve and Robust PFS Economics,” dated 26 March 2026.
(7)The Company is not providing quantitative reconciliations to the most
directly comparable IFRS measures for its Non-GAAP forward-looking
information or financial guidance shown above in reliance on the exception
provided by Rule 100(a)(2) of Regulation G because the reconciliations
cannot be performed without unreasonable efforts as such IFRS measures
cannot be reliably estimated due to their dependence on future
uncertainties and adjusting items, including, among other factors, changes
in economic, social, political and market conditions, including related to
inflation or international conflicts, the success of business and operating
initiatives, changes in the regulatory environment and other government
actions, including environmental approvals, fluctuations in gold prices and
exchange rates, the outcome of pending or future litigation proceedings,
any supply chain disruptions, any public health crises, pandemics or
epidemics, and other business and operational risks and challenges and
other factors, including mining accidents, that the Company cannot
reasonably predict at this time but which may be material.
(8)Outlook economic assumptions for 2026 guidance are as follows: $0.68/
A$, BRL5.47/$, AP1,606/$, ZAR16.90/$, Brent $61/bbl and gold price
range of approximately $4,250/oz. Cost and capital forecast ranges for
2026 are expressed in “nominal” terms. “Nominal” cash flows are current
price term cash flows that have been inflated into future value, using an
appropriate “inflation” rate. Estimates assume neither operational or labour
interruptions or power disruptions, nor further changes to asset portfolio
and/or operating mines and have not been reviewed by AngloGold
Ashanti’s external auditors. Other unknown or unpredictable factors, or
factors outside the Company’s control, including inflationary pressures on
its cost base, could also have material adverse effects on AngloGold
Ashanti’s future results and no assurance can be given that any
expectations expressed by AngloGold Ashanti will prove to have been
correct. Measures taken at AngloGold Ashanti’s operations together with
AngloGold Ashanti’s business continuity plans aim to enable its operations
to deliver in line with its production targets. Actual results could differ from
guidance and any deviations may be significant. Please refer to the Risk
Factors section in AngloGold Ashanti’s annual report on Form 20-F for the
financial year ended 31 December 2025 filed with the SEC.
*Refer to “Non-GAAP disclosure” for definitions and reconciliations.
Sukari, Egypt
| 5 | Q1 2026 Earnings Release |
AngloGold Ashanti plc | |||
2026 | Quarter 1 | |
Group Performance continued
Financial results | Quarter | Quarter | |||
ended | ended | % | |||
Mar | Mar | Variance | |||
US Dollar millions, except as otherwise noted | 2026 | 2025 | |||
Average gold price received*(1) ($/oz) | 4,863 | 2,874 | 69% | ||
EBITDA*(4) ($m) | 2,291 | 996 | 130% | ||
Headline earnings(3) ($m) | 1,285 | 447 | 187% | ||
Capital expenditure - Group(1) ($m) | 467 | 336 | 39% | ||
Net cash flow from operating activities ($m) | 1,709 | 725 | 136% | ||
Free cash flow* ($m) | 1,169 | 403 | 190% | ||
Net debt (cash)*(4) ($m) | (868) | 755 | (215)% | ||
Financial highlights •EBITDA*(4) rose by 130% year-on-year to $2,291m for Q1 2026, compared to $996m for Q1 2025, mainly due to increased production volumes, and supported by the higher average gold price received per ounce* •Free cash flow* rose by 190% year-on-year to $1,169m in Q1 2026, from $403m in Q1 2025 •Headline earnings(3) rose 187% year-on-year to $1,285m in Q1 2026, from $447m in Q1 2025; headline earnings(3) per share up 186% year-on-year to 252 US cents per share in Q1 2026, from 88 US cents per share in Q1 2025 •Total capital expenditure for the Group(1) increased 39% year-on-year to $467m for Q1 2026, from $336m in Q1 2025, including $305m in sustaining capital expenditure* and $162m in non-sustaining capital expenditure*, reflecting strategic portfolio reinvestment •Net debt*(4) ended in a net cash(4) position of $868m at 31 March 2026 •Interim dividend of 116 US cents/share declared for Q1 2026 | ||
* Refer to “Non-GAAP disclosure” for definitions and reconciliations. | ||||
| 6 | Q1 2026 Earnings Release |
AngloGold Ashanti plc | |||
2026 | Quarter 1 | |
Group Performance continued
Operating results | Quarter | Quarter | |||
ended | ended | % | |||
Mar | Mar | Variance | |||
US Dollar millions, except as otherwise noted | 2026 | 2025 | |||
Gold production - Group(1)(2)(3) (koz) | 724 | 720 | 1% | ||
Gold production - Managed operations(1)(2)(3)(koz) | 666 | 657 | 1% | ||
Total cash costs* - Group(1) ($/oz) | 1,391 | 1,223 | 14% | ||
Total cash costs* - Managed operations(1) ($/oz) | 1,377 | 1,213 | 14% | ||
AISC* - Group(1) ($/oz) | 1,955 | 1,640 | 19% | ||
AISC* - Managed operations(1) ($/oz) | 1,980 | 1,657 | 19% | ||
Operational highlights •TRIFR at managed operations was 0.86 injuries per million hours worked in Q1 2026 •We are deeply saddened to report a fatal incident involving a contractor, which occurred at the Obuasi KMS operation on 24 April 2026 (subsequent to Q1 2026); a comprehensive investigation is currently underway and we extend our sincerest condolences to the family and colleagues affected by this tragedy •Gold production for the Group(1)(2) increased by 1% year-on-year in Q1 2026 to 724koz compared to 720koz in Q1 2025; excluding Serra Grande, there was a 2% year-on-year increase in Q1 2026 •Gold production from managed operations(1)(2) rose 1% year-on-year to 666koz in Q1 2026, up from 657koz in Q1 2025, supported by increases at Geita, Cuiabá, Obuasi, Iduapriem, Cerro Vanguardia and Tropicana; excluding Serra Grande, there was a 3% year-on-year increase in Q1 2026 •Obuasi delivered 62,000oz in Q1 2026, a significant 15% year-on-year increase, as underground mined tonnes improved, while Geita also grew production by 10% year-on-year •Sunrise Dam’s gold production dropped 16% year-on-year in Q1 2026, mainly due to lower underground tonnes resulting from equipment issues and lower grades •Total cash costs per ounce* for the Group(1) increased 14% year-on-year to $1,391/oz in Q1 2026, from $1,223/oz in Q1 2025; AISC per ounce* for the Group(1)(2) rose 19% year-on-year to $1,955/oz in Q1 2026, from $1,640/oz in Q1 2025 •Total cash costs per ounce* from managed operations(1) increased 14% year-on-year to $1,377/oz in Q1 2026, from $1,213/oz in Q1 2025 mainly due to market-driven factors, with higher gold royalty costs, increases in labour and mining contractor costs, as well as a stronger foreign currency exchange rate against the US Dollar •AISC per ounce* from managed operations(1) rose 19% year-on-year to $1,980/oz in Q1 2026, from $1,657/oz in Q1 2025, reflecting higher total cash costs per ounce* and higher sustaining capital expenditure* reinvestment | ||
* Refer to “Non-GAAP disclosure” for definitions and reconciliations. | ||||
| 7 | Q1 2026 Earnings Release |
AngloGold Ashanti plc | |||
2026 | Quarter 1 | |
Group Financial and Operating Key Statistics
Key statistics | Quarter | Quarter | |
ended | ended | ||
Mar | Mar | ||
US Dollar millions, except as otherwise noted | 2026 | 2025 | |
Operating review | |||
Gold | |||
Produced - Group(1)(2)(3) | - oz (000) | 724 | 720 |
Produced - Managed operations(1)(2)(3) | - oz (000) | 666 | 657 |
Produced - Non-managed joint ventures(1) | - oz (000) | 58 | 63 |
Sold - Group(1)(2)(3) | - oz (000) | 719 | 737 |
Sold - Managed operations(1)(2)(3) | - oz (000) | 650 | 670 |
Sold - Non-managed joint ventures(1) | - oz (000) | 69 | 67 |
Financial review | |||
Gold income | - $m | 3,154 | 1,927 |
Cost of sales - Group(1) | - $m | 1,416 | 1,230 |
Cost of sales - Managed operations(1) | - $m | 1,293 | 1,124 |
Cost of sales - Non-managed joint ventures(1) | - $m | 123 | 106 |
Total operating costs | - $m | 999 | 833 |
Gross profit | - $m | 1,943 | 839 |
Average gold price received per ounce* - Group(1) | - $/oz | 4,863 | 2,874 |
Average gold price received per ounce* - Managed operations(1) | - $/oz | 4,857 | 2,875 |
Average gold price received per ounce* - Non-managed joint ventures(1) | - $/oz | 4,918 | 2,865 |
All-in sustaining costs per ounce* - Group(1) | - $/oz | 1,955 | 1,640 |
All-in sustaining costs per ounce* - Managed operations(1) | - $/oz | 1,980 | 1,657 |
All-in sustaining costs per ounce* - Non-managed joint ventures(1) | - $/oz | 1,719 | 1,463 |
Total cash costs per ounce* - Group(1) | - $/oz | 1,391 | 1,223 |
Total cash costs per ounce* - Managed operations(1) | - $/oz | 1,377 | 1,213 |
Total cash costs per ounce* - Non-managed joint ventures(1) | - $/oz | 1,554 | 1,325 |
Profit for the period | - $m | 1,462 | 542 |
EBITDA*(5) | - $m | 2,291 | 996 |
Total borrowings | - $m | 2,257 | 2,213 |
Net debt (cash)*(5) | - $m | (868) | 755 |
Profit attributable to equity shareholders | - $m | 1,281 | 443 |
- US cents/share | 252 | 88 | |
Headline earnings(4) | - $m | 1,285 | 447 |
- US cents/share | 252 | 88 | |
Net cash inflow from operating activities | - $m | 1,709 | 725 |
Free cash flow* | - $m | 1,169 | 403 |
Capital expenditure - Group(1) | - $m | 467 | 336 |
Capital expenditure - Managed operations(1) | - $m | 428 | 303 |
Capital expenditure - Non-managed joint ventures(1) | - $m | 39 | 33 |
(1) The term “managed operations” refers to subsidiaries managed by AngloGold Ashanti and included in its consolidated reporting, while the term “non-managed joint ventures” (i.e., Kibali) refers to equity-accounted joint ventures that are reported based on AngloGold Ashanti’s share of attributable earnings and are not managed by AngloGold Ashanti. Managed operations are reported on a consolidated basis. Non-managed joint ventures are reported on an attributable basis. | |||
(2) Includes gold concentrate from the Cuiabá mine sold to third parties. | |||
(3) Includes Q1 2025 gold production and gold sold of 10,000oz for the Serra Grande operation, which was sold on 1 December 2025. | |||
(4) The financial measures “headline earnings (loss)” and “headline earnings (loss) per share” are not calculated in accordance with IFRS® Accounting Standards, but in accordance with the Headline Earnings Circular 1/2023, issued by the South African Institute of Chartered Accountants (SAICA), at the request of the Johannesburg Stock Exchange Limited (JSE). These measures are required to be disclosed by the JSE Listings Requirements and therefore do not constitute Non-GAAP financial measures for purposes of the rules and regulations of the US Securities and Exchange Commission (“SEC”) applicable to the use and disclosure of Non-GAAP financial measures. | |||
(5) To enhance comparability with industry peers, AngloGold Ashanti will present net debt (cash)* and EBITDA* as well as its net debt (cash)* to EBITDA* ratio (leverage ratio), which are Non-GAAP financial measures, and will not further adjust these metrics in its reporting. Comparative periods will also reflect this change. | |||
* Refer to “Non-GAAP disclosure” for definitions and reconciliations. | |||
$ represents US Dollar, unless otherwise stated. | |||
Rounding of figures may result in computational discrepancies. | |||
| 8 | Q1 2026 Earnings Release |
AngloGold Ashanti plc | |||
2026 | Quarter 1 | |
Group Financial and Operating Results
Quarterly Review
Gold production
Group gold production for Q1 2026 totalled 724,000oz, a 1%
increase year-on-year from 720,000oz in Q1 2025, with solid
year-on-year gold production increases at Geita (+12koz),
Cuiabá (+9koz), Obuasi (+8koz), Iduapriem (+4koz), Cerro
Vanguardia (+3koz) and Tropicana (+2koz). Excluding Serra
Grande, which was sold on 1 December 2025, there was a 2%
year-on-year increase in gold production for the Group in Q1
2026.
Geita delivered a strong Q1 2026, with gold production increasing
by 10% year-on-year in Q1 2026 compared to Q1 2025, with
higher open pit mined tonnes from Nyamulilima Cut 2 and higher
underground mined tonnes due to improved stope flexibility.
Tonnes treated increased by 20% year-on-year due to higher mill
throughput and availability, with Q1 2025 impacted by a planned
mill shutdown.
Gold production at Cuiabá increased by 16% year-on-year in Q1
2026 compared to Q1 2025, with total tonnes processed
including concentrate ore, increasing by 34%, partly offset by
lower mill head grade as a result of higher dilution from
underground ore.
Obuasi achieved substantive improvements during Q1 2026, with
gold production increasing by 15% year-on-year in Q1 2026
compared to Q1 2025, mainly driven by an increase in tonnes
treated from underground operations, with an improvement in
operating conditions and equipment availability.
The Group experienced lower gold production at Sunrise Dam
(-10koz), mainly due to lower underground tonnes and grades
resulting from lower loader availability from unplanned
mechanical maintenance, as well as an increase in low grade
stockpiles processed due to crusher challenges. There were
modest decreases at Siguiri (-5koz), Kibali (-5koz) and Sukari
(-4koz). Serra Grande, which produced 10koz in Q1 2025, was
sold on 1 December 2025.
Costs
Total cash costs per ounce* for the Group increased by 14%
year-on-year to $1,391/oz in Q1 2026, compared to $1,223/oz in
Q1 2025. The increase was primarily driven by higher royalty
costs linked to the stronger average gold price received per
ounce*, which resulted in an estimated 10% increase in total
cash costs per ounce*. In addition, costs increased as a result of
an estimated 4% rise in inflation mainly due to increases in labour
and mining contractor costs, reflecting consumer price index
(“CPI”) movements in the jurisdictions where the Group operates,
including a stronger foreign currency exchange rate against the
US Dollar which resulted in an estimated 2% increase in costs.
Managed operations recorded a 14% year-on-year increase in
total cash costs per ounce*, rising from $1,213/oz in Q1 2025 to
$1,377/oz in Q1 2026. The impact of the higher gold royalties and
inflation from higher labour and mining contractor costs were
partially offset by stronger year-on-year production performances
at Geita, Cuiabá, Obuasi, Iduapriem, Cerro Vanguardia and
Tropicana, as well as higher by-product revenue at Cerro
Vanguardia due to the higher silver price received in Q1 2026.
Total cash costs per ounce* at the Group’s non-managed joint
ventures increased by 17% year-on-year to $1,554/oz in Q1
2026, compared to $1,325/oz in Q1 2025. The increase was
primarily driven by lower year-on-year gold production and higher
gold price-linked royalties at Kibali.
All-in sustaining costs per ounce* (“AISC”) for the Group
increased by 19% year-on-year to $1,955/oz in Q1 2026,
compared to $1,640/oz in Q1 2025. At the managed operations,
AISC per ounce* increased by 19% year-on-year to $1,980/oz in
Q1 2026, up from $1,657/oz in Q1 2025, primarily due to higher
total cash costs per ounce* and higher year-on-year sustaining
capital expenditure*. AISC per ounce* at the non-managed joint
ventures increased by 17% year-on-year to $1,719/oz in Q1
2026, from $1,463/oz in Q1 2025, mainly due to a year-on-year
increase in total cash costs per ounce*.
EBITDA*
Earnings before interest, tax, depreciation and amortisation*
(“EBITDA*”) for Q1 2026 increased to $2,291m, up from $996m
in Q1 2025. This strong year-on-year growth was mainly
underpinned by a favourable operating and market environment,
including a higher average gold price received per ounce*, higher
equity earnings from associates and non-managed joint ventures
and favourable inventory movements. These gains were partially
offset by lower gold sales volumes, higher total operating costs
(mainly driven by increased royalty expenses and global inflation
primarily due to increases in labour and mining contractor costs),
higher corporate and exploration costs, and higher care and
maintenance costs.
Earnings
Basic earnings (profit attributable to equity shareholders) for Q1
2026 were $1,281m, or 252 US cents per share, compared to
$443m, or 88 US cents per share, in Q1 2025. The strong year-
on-year increase was largely driven by a higher average gold
price received per ounce*, higher equity earnings from associates
and non-managed joint ventures and favourable inventory
movements.
These positive contributions were partially offset by lower gold
sales volumes, higher total operating costs, including increased
royalty expenses, along with higher asset amortisation, higher
corporate and exploration costs, higher care and maintenance
costs, higher finance costs and unwinding of obligations, and a
higher tax charge.

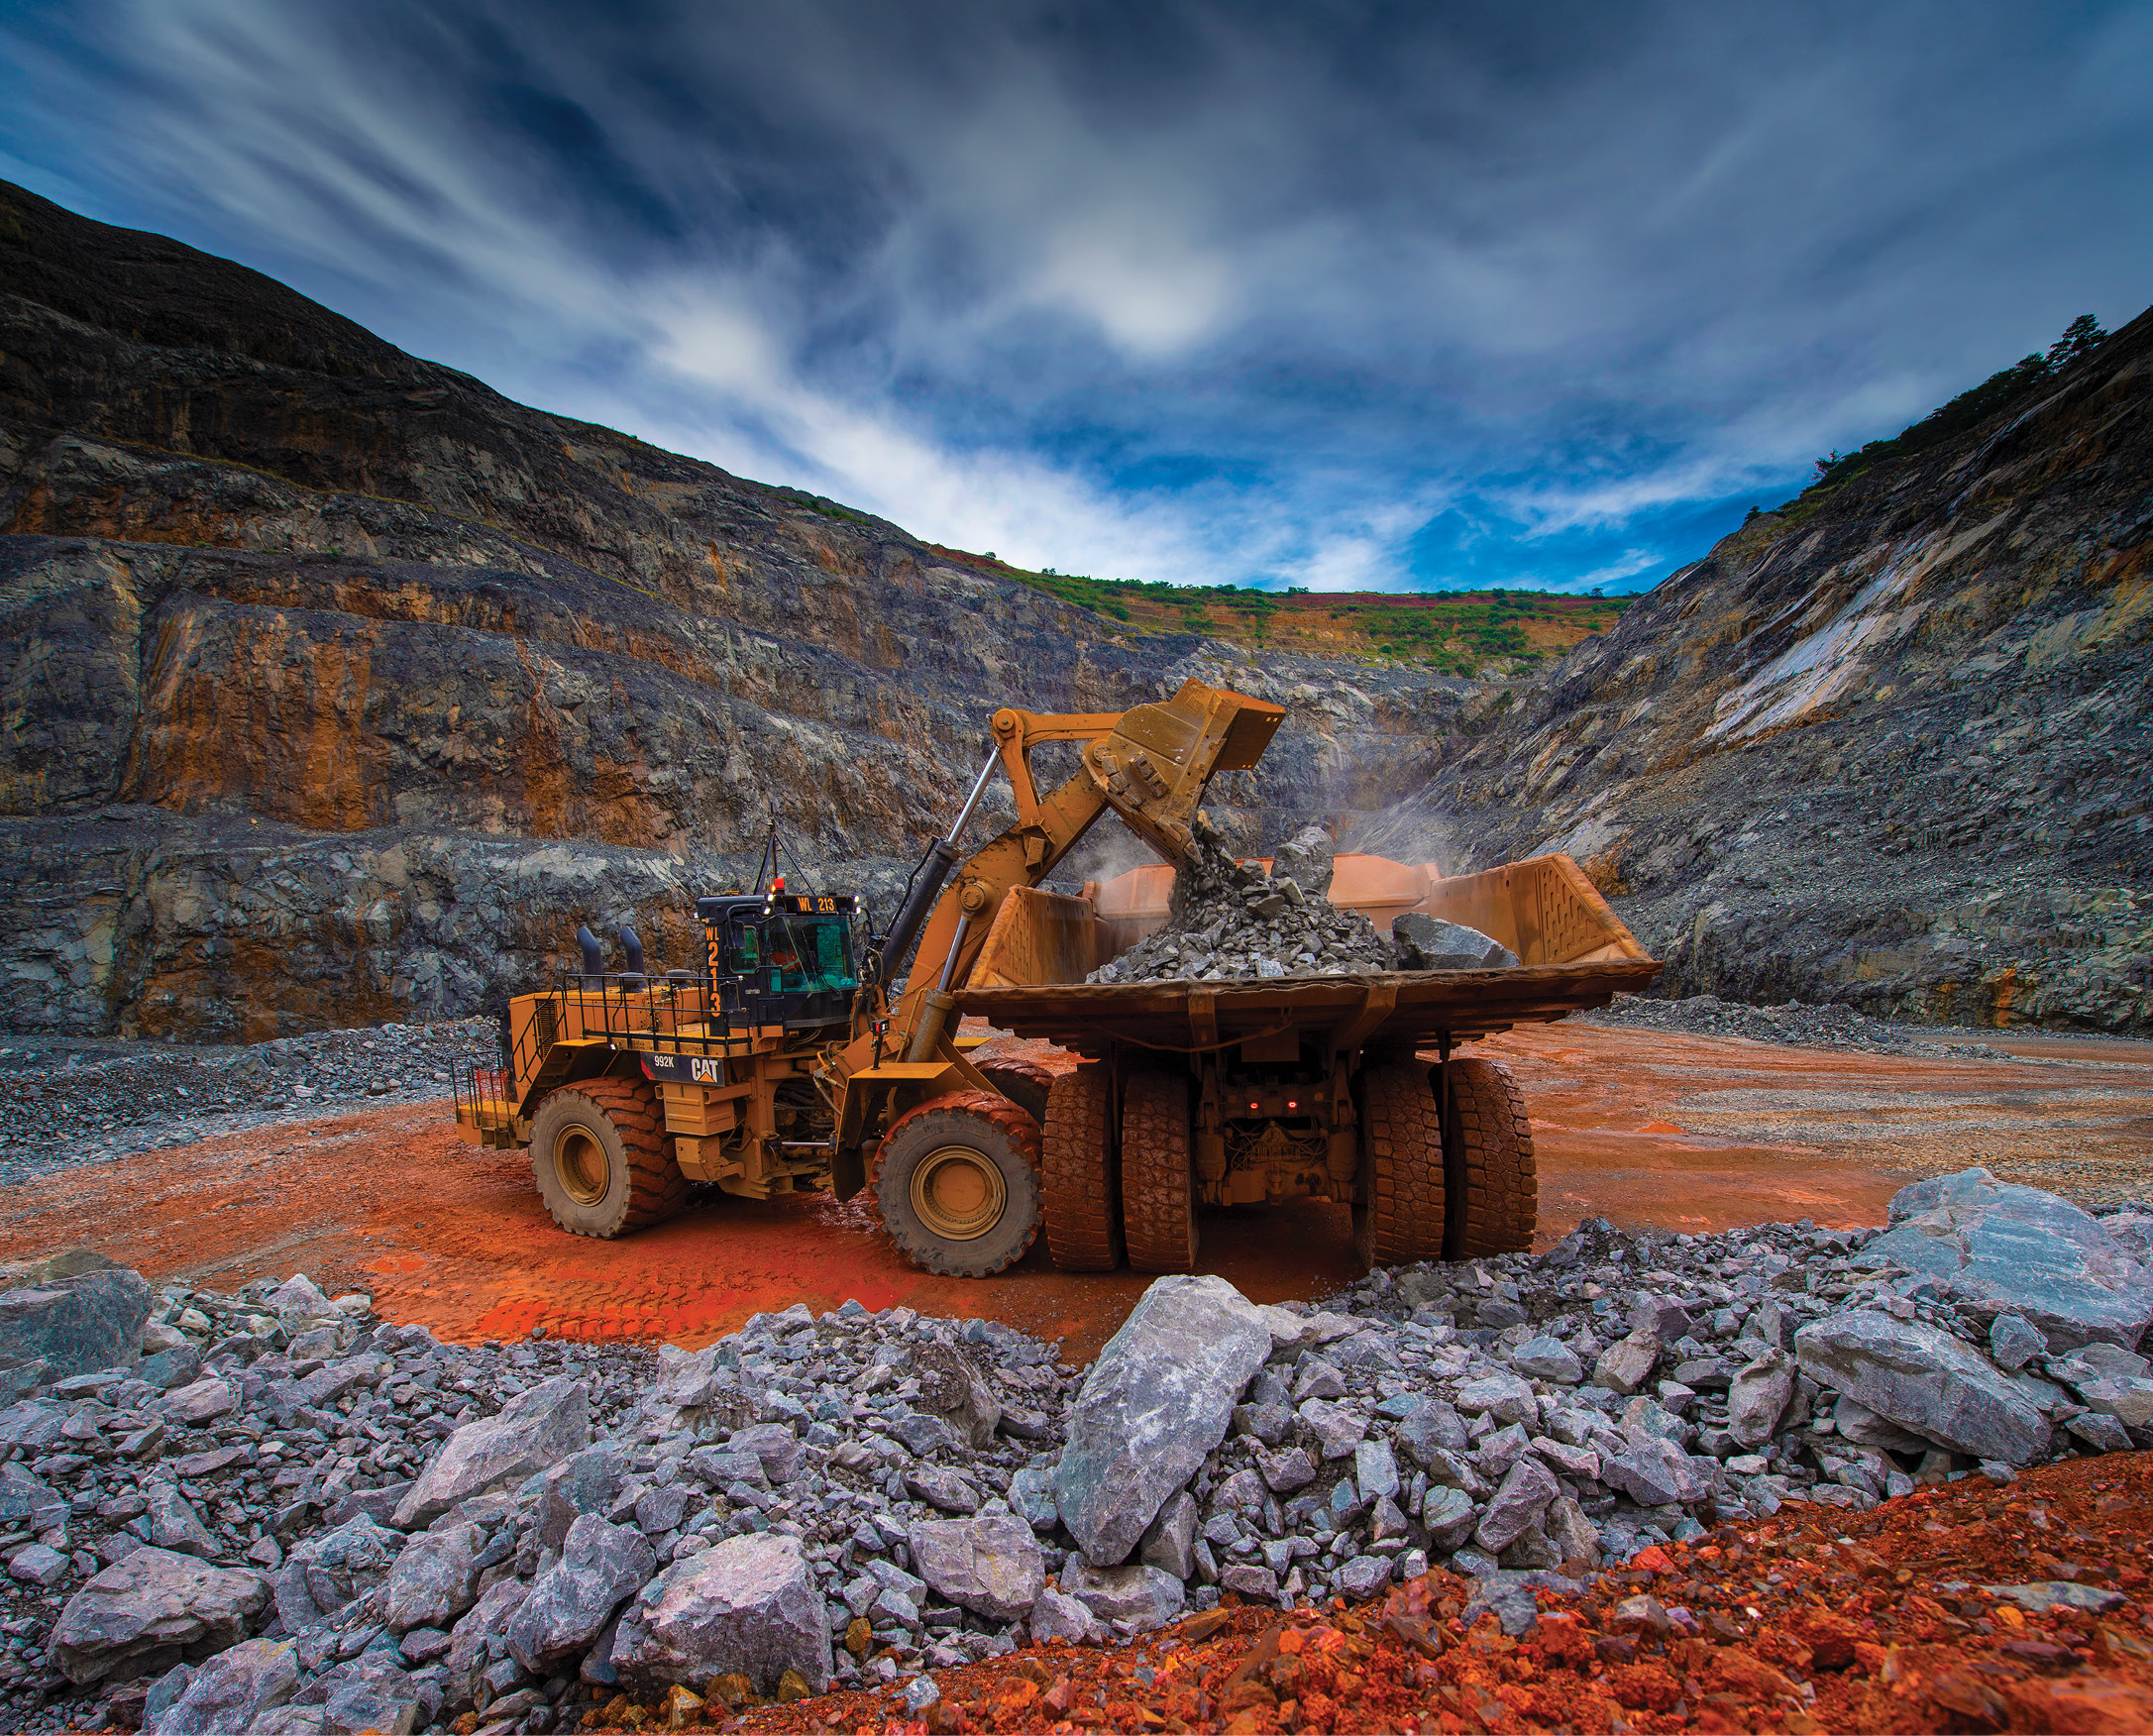
Iduapriem, Ghana
| 9 | Q1 2026 Earnings Release |
AngloGold Ashanti plc | |||
2026 | Quarter 1 | |
Group Financial and Operating Results continued
Quarterly Review
Headline earnings‡ for Q1 2026 were $1,285m, or 252 US cents
per share, compared to $447m, or 88 US cents per share, in Q1
2025. The increase in headline earnings‡ reflects the same key
drivers that supported the rise in basic earnings during Q1 2026.
In addition, headline earnings‡ excludes impairment reversals/
impairments, asset derecognitions and losses (profits) on
disposal of assets and taxes thereon.
‡The financial measures “headline earnings (loss)” and “headline earnings
(loss) per share” are not calculated in accordance with IFRS® Accounting
Standards, but in accordance with the Headline Earnings Circular 1/2023,
issued by the South African Institute of Chartered Accountants (SAICA), at
the request of the Johannesburg Stock Exchange Limited (JSE). These
measures are required to be disclosed by the JSE Listings Requirements
and therefore do not constitute Non-GAAP financial measures for
purposes of the rules and regulations of the SEC applicable to the use and
disclosure of Non-GAAP financial measures.
Cash flow
Net cash inflow from operating activities reached $1,709m in Q1
2026, representing a 136% year-on-year increase from $725m in
Q1 2025. This strong performance was underpinned by a higher
average gold price received per ounce* and higher dividends
received from joint ventures. These gains were partially offset by
higher total operating costs and increased tax payments.
After accounting for capital expenditure, loan repayments from
Kibali, and distributions to non-controlling shareholders, the
Company generated a free cash inflow* of $1,169m in Q1 2026,
compared to $403m in Q1 2025.
The dividend policy targets a 50% payout of annual free cash
flow*, subject to maintaining a net debt* to EBITDA* ratio of no
higher than 1.0 times. The interim dividend for Q1 2026, is 116
US cents per share.
During Q1 2026, AngloGold Ashanti received $61m in dividends
and $50m in loan repayments from the Kibali joint venture,
compared to $60m in loan repayments in Q1 2025. The
Company’s attributable share of outstanding cash balances
awaiting repatriation from the Democratic Republic of the Congo
(“DRC”) was $146m at 31 March 2026, up from $110m at
31 December 2025.
Free cash flow* during Q1 2026 was impacted by ongoing
movements in value-added tax (“VAT”) recoveries at Geita and
Kibali and foreign exchange controls at Cerro Vanguardia
(“CVSA”):
•In Tanzania, the net overdue recoverable VAT input credit
balance (after discounting provisions) decreased by $21m
during Q1 2026 to $150m at 31 March 2026, down from
$171m at 31 December 2025. This decrease reflects the
application of $31m in verified VAT claims against corporate
tax liabilities and foreign exchange gains of $13m, partially
offset by new claims submitted during the period of $21m,
and a decrease in the discounting provision of $2m.
AngloGold Ashanti expects to continue offsetting eligible
VAT claims against corporate taxes as part of its
recovery strategy.
•In the DRC, the Company’s attributable share of the net
recoverable VAT balance (including fuel duties and after
discounting provisions) remained similar to Q4 2025 totalling
$63m at 31 March 2026. During Q1 2026, $15m of new
claims were submitted, which were fully offset by $15m in
revaluation adjustments.
•In Argentina, CVSA’s cash balance increased by $174m#
during Q1 2026 to $271m# at 31 March 2026, up from $97m#
at 31 December 2025. The cash remains available for
CVSA’s operational and exploration requirements.
During Q4 2025, CVSA paid the remaining offshore dividends
related to the 2024 financial year to AngloGold Ashanti by
utilising a currency swap mechanism to secure the required
US dollars. Dividends related to the 2025 financial year are
expected to be paid to AngloGold Ashanti during Q2 2026,
once CVSA’s 2025 local financial statements will be finished
and the relevant dividend distribution will be approved.
#US dollar equivalent and at prevailing exchange rates.
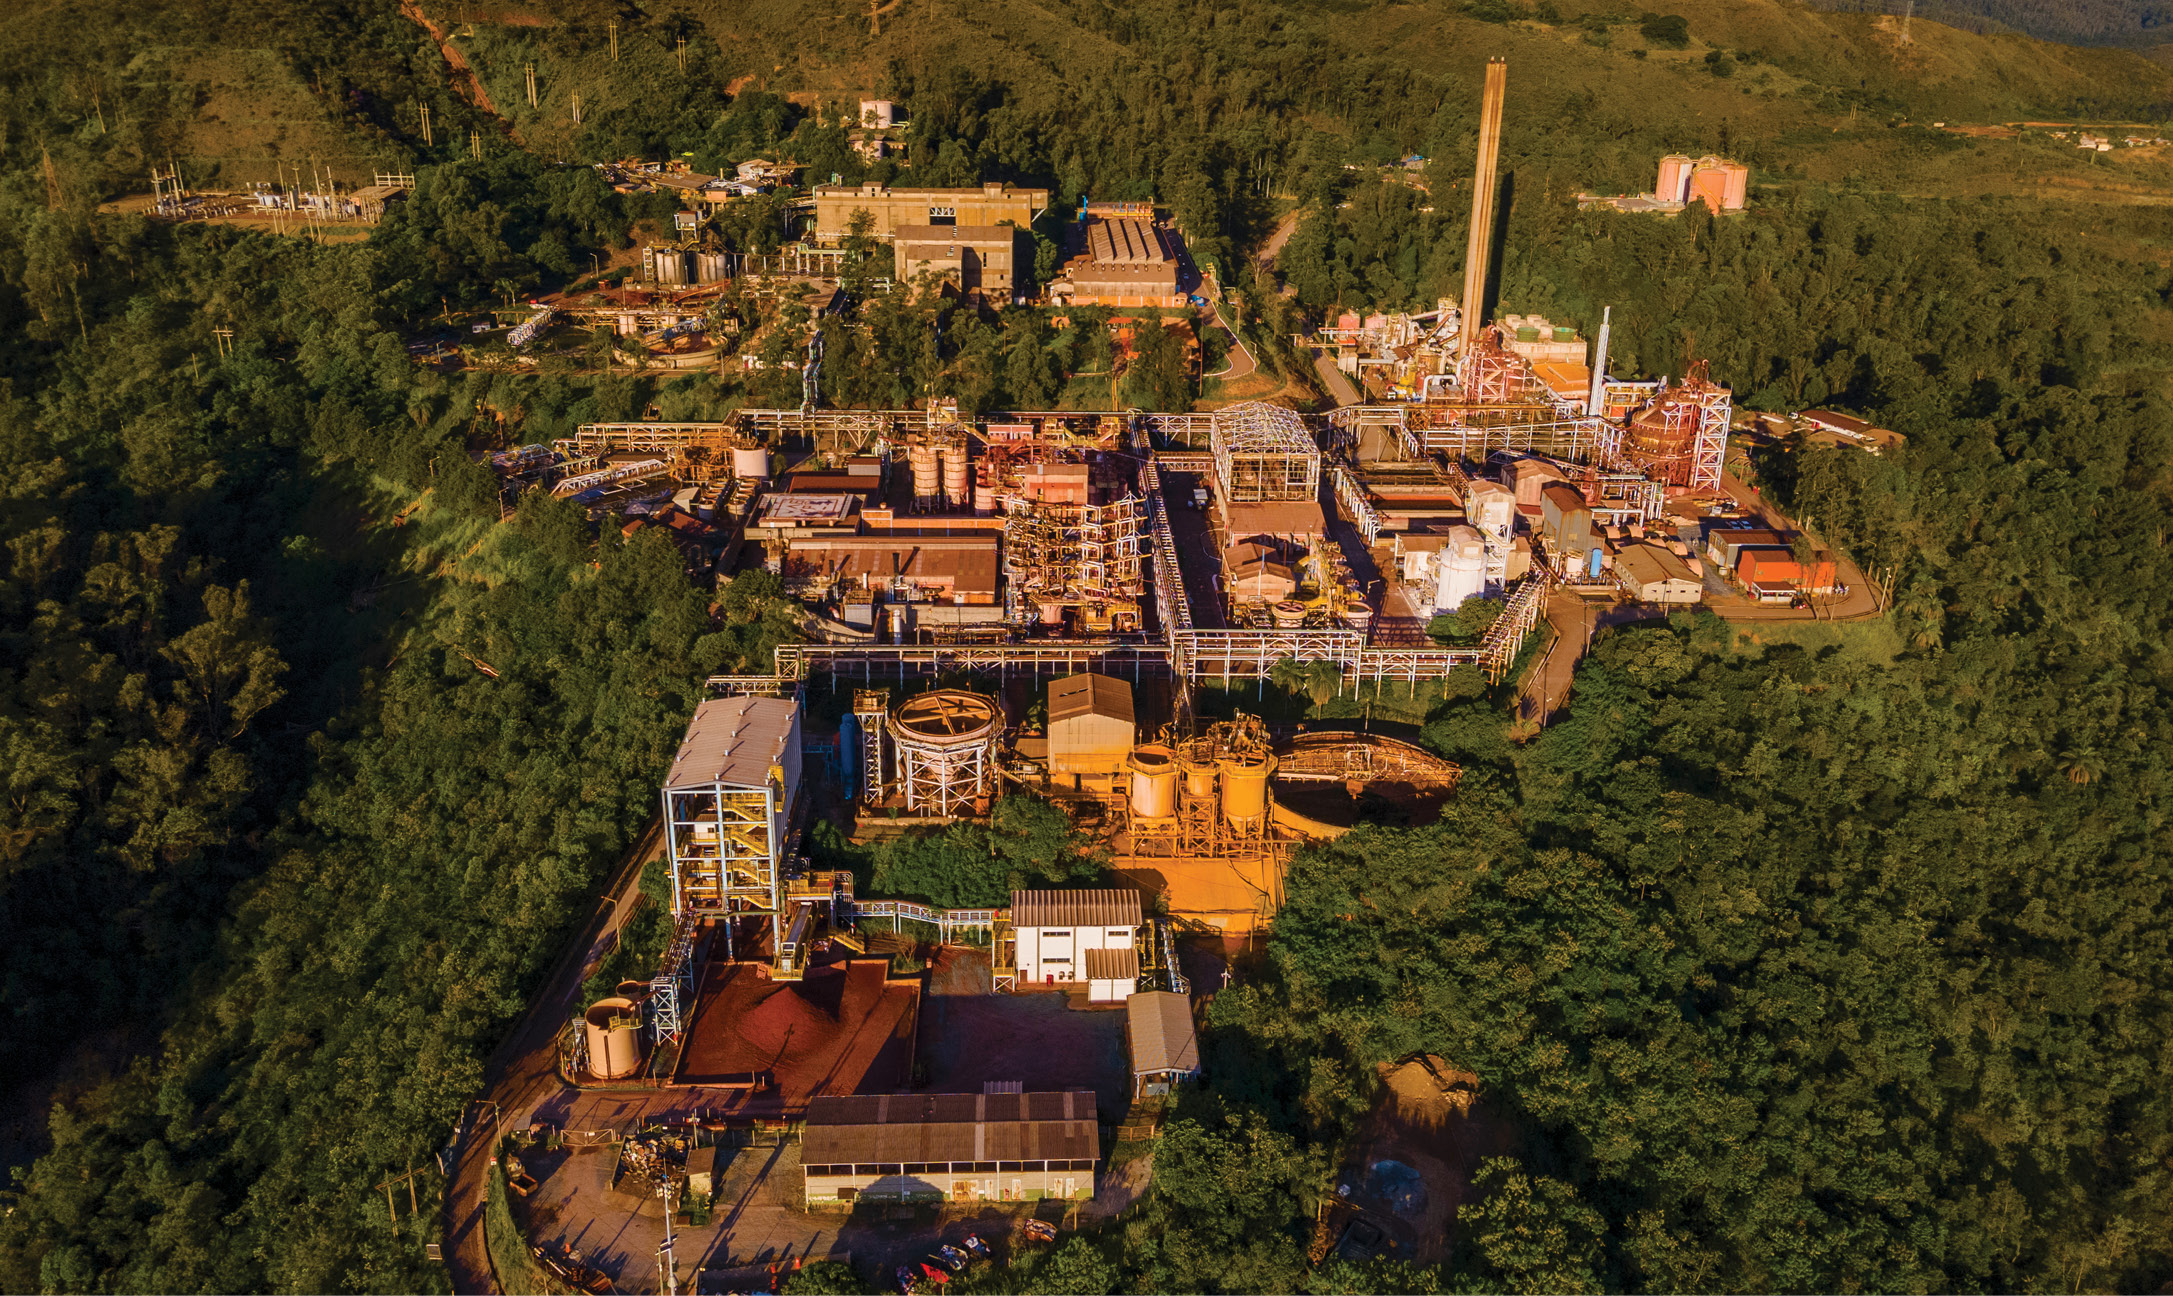
AGA Mineração, Brazil
| 10 | Q1 2026 Earnings Release |
AngloGold Ashanti plc | |||
2026 | Quarter 1 | |
Group Financial and Operating Results continued
Quarterly Review
Free cash flow* | Quarter | Quarter |
ended | ended | |
Mar | Mar | |
US Dollar millions, except as otherwise noted | 2026 | 2025 |
Net cash flow from operating activities | 1,709 | 725 |
Repayment of loans advanced to joint ventures | 50 | 60 |
Distributions to non-controlling interests | (162) | (79) |
Operating cash flow | 1,597 | 706 |
Capital expenditure on tangible and intangible assets | (428) | (303) |
Free cash flow* | 1,169 | 403 |
*Refer to “Non-GAAP disclosure” for definitions and reconciliations.
Rounding of figures may result in computational discrepancies.
Balance sheet and liquidity
During Q1 2026, net debt* ended in a cash position, despite the
payment of $1,026m in dividends during Q1 2026. Net cash* at
31 March 2026 was $868m, compared to net cash* of $624m at
31 December 2025.
At 31 March 2026, the balance sheet remained robust, supported
by significant available liquidity. This included the undrawn
$1.4bn multi-currency revolving credit facility (“RCF”), the
undrawn $65m Siguiri RCF and $5m undrawn on the Geita multi-
currency RCF. AngloGold Ashanti held approximately $3.1bn in
cash and cash equivalents at 31 March 2026, bringing Group
liquidity to approximately $4.6bn at 31 March 2026.
On 30 March 2026, AngloGold Ashanti Holdings plc (“AGAH”)
launched a capped cash tender offer for up to $650m aggregate
purchase price (excluding accrued interest) (“Aggregate Cap”) for
part of its 3.375% notes due 2028 (“2028 Notes”), 3.750% notes
due 2030 (“2030 Notes”) and 6.500% notes due 2040 (“2040
Notes”). The Aggregate Cap was met and in accordance with the
terms and conditions of the capped cash tender offer, on 16 April
2026, AGAH purchased $559m principal amount of the 2028
Notes, $107m principal amount of the 2030 Notes and none of
the 2040 Notes. The purchased notes were then cancelled on the
same day. The purpose of the tender offer was to utilise available
cash and reduce the overall principal amount of debt.
Capital expenditure
During Q1 2026, sustaining capital expenditure* of the Group
increased by 29% year-on-year to $305m, compared to $236m in
Q1 2025. Sustaining capital expenditure* at managed operations
rose by 30% year-on-year to $289m in Q1 2026, up from $223m
in Q1 2025. This increase was primarily driven by increased
Mineral Reserve development at Iduapriem and early acquisition
of additional mining fleet at Siguiri. At non-managed joint
ventures, sustaining capital expenditure* increased by 23% year-
on-year to $16m in Q1 2026, from $13m in Q1 2025, mainly
reflecting higher expenditure at Kibali on mining equipment and
rebuilds to enhance both underground and open pit fleet
availability.
Non-sustaining capital expenditure* for the Group was $162m in
Q1 2026, a 62% increase year-on-year from $100m in Q1 2025.
At managed operations, non-sustaining capital expenditure* rose
by 74% year-on-year to $139m, from $80m in Q1 2025, largely
due to tailings storage facility (“TSF”) expenditure at Siguiri, with
ongoing slope regulation to maintain stability of the TSF following
the seepage issues experienced in Q3 2025, and an increase in
Obuasi’s underground decline development meters. This
increase was partially offset by reduced growth capital
expenditure at Iduapriem as a result of the completion of Phase 2
of the Beposo TSF project in Q1 2025.
Non-managed joint ventures recorded a 15% year-on-year
increase in non-sustaining capital expenditure* to $23m in Q1
2026, from $20m in Q1 2025, mainly driven by higher
expenditure at Kibali on waste stripping for the Pamao deposition
project.
*Refer to “Non-GAAP disclosure” for definitions and reconciliations.
Cerro Vanguardia, Argentina
| 11 | Q1 2026 Earnings Release |
AngloGold Ashanti plc | |||
2026 | Quarter 1 | |
Regions Financial and Operating Results
Quarter in review
Regional view
Africa region
Notes
(a)Operated by Barrick Mining
Corporation (Barrick)
In the Africa region, managed operations produced 422,000oz
at a total cash cost* of $1,379/oz in Q1 2026, compared to
407,000oz at a total cash cost* of $1,144/oz in Q1 2025. Non-
managed joint ventures produced (on an attributable basis)
58,000oz at a total cash cost* of $1,554/oz in Q1 2026,
compared to 63,000oz at a total cash cost* of $1,325/oz in Q1
2025.
In Ghana, at Iduapriem, gold production was 44,000oz at a total
cash cost* of $1,736/oz for Q1 2026, compared to 40,000oz at a
total cash cost* of $1,493/oz during Q1 2025. Gold production
increased by 10% year-on-year in Q1 2026 compared to Q1 2025
largely due to a 39% increase in tonnes treated year-on-year
stemming from a seventeen-day plant shutdown in Q1 2025 to
investigate and repair a tear in the lining of the Beposo TSF. The
benefit of the increase in tonnes treated was partially offset by a
22% year-on-year decrease in recovered grade, mainly due to a
lower head grade compared to Q1 2025. Total cash costs per
ounce* increased by 16% year-on-year in Q1 2026 compared to
Q1 2025, mainly due to increases in royalties linked to the higher
gold price, as well as increased labour, reagents and mining
contractor costs, partially offset by the benefit of a higher
production base, a build-up of gold in process inventories and
decreased stores costs compared to Q1 2025.
At Obuasi, gold production was 62,000oz at a total cash cost* of
$1,492/oz for Q1 2026, compared to 54,000oz at a total cash
cost* of $1,284/oz during Q1 2025. Gold production increased by
15% year-on-year in Q1 2026 compared to Q1 2025. The strong
production performance was mainly as a result of improved
underground operational conditions and equipment availability,
partially offset by lower recovered grade year-on-year stemming
from lower plant recoveries.
Total cash costs per ounce* increased by 16% year-on-year in
Q1 2026 compared to Q1 2025, mainly due to higher operating
costs associated with increased royalties linked to the higher gold
price, higher labour and mining contractor costs, increases in
technical services due to updated rates, and higher reagents and
power expenditure related to increased operational activity,
partially offset by a higher production base and an increase in
metal inventories.
In Guinea, at Siguiri, gold production was 75,000oz at a total
cash cost* of $1,895/oz for Q1 2026, compared to 80,000oz at a
total cash cost* of $1,521/oz in Q1 2025. Gold production
decreased by 6% year-on-year in Q1 2026 compared to Q1
2025, mainly due to a 9% year-on-year decrease in tonnes
treated due to limited capacity for tailings deposition, partially
offset by a 5% year-on-year increase in recovered grade due to
improved head grade and plant recoveries in Q1 2026. Total cash
costs per ounce* increased by 25% year-on-year in Q1 2026
compared to Q1 2025, primarily driven by the impact of lower
production, a depletion of metal inventories, increased royalties
linked to the higher gold price and higher stores and technical
services costs related to dust suppression activities, partially
offset by decreased mining contractor costs.
In Tanzania, at Geita, gold production was 128,000oz at a total
cash cost* of $1,141/oz for Q1 2026, compared to 116,000oz at a
total cash cost* of $1,021/oz in Q1 2025. Gold production
increased by 10% year-on-year in Q1 2026 compared to Q1
2025, mainly due to a 20% increase in tonnes treated year-on-
year as a result of a ball mill shutdown in Q1 2025 resulting in
lower throughput rates in Q1 2025. The benefit of the higher
tonnes treated in Q1 2026 was partially offset by an 8% decline in
recovered grade year-on-year due to lower mined grades from
underground operations. Plant recoveries improved year-on-year
stemming from improved grinding and steady carbon-in-leach
(“CIL”) circuit operation. Total cash costs per ounce* increased by
12% year-on-year in Q1 2026 compared to Q1 2025, mainly due
to higher operating costs associated with increased royalties
linked to the higher gold price, increased security and insurance-
related costs and higher mining contractor and maintenance-
related costs, partially offset by the benefit of higher production,
increased by-product revenue and decreased stores and
lubricant material costs compared to Q1 2025.
In Egypt, at Sukari, gold production was 113,000oz at a total
cash cost* of $1,106/oz in Q1 2026, compared to 117,000oz at a
total cash cost* of $826/oz in Q1 2025. Gold production
decreased by 3% year-on-year in Q1 2026 compared to Q1
2025, mainly due to a 27% year-on-year decrease in recovered
grade driven by lower mined grades from underground
operations, partially offset by a 10% year-on-year increase in
tonnes treated at the process plant. Total cash costs per ounce*
increased by 34% year-on-year in Q1 2026 compared to Q1
2025, driven by the impact of lower production, a drawdown of
metal inventories, increased royalties linked to the higher gold
price, as well as increased labour, mining contractor and
maintenance-related costs.
In the DRC, at Kibali, gold production (on an attributable basis)
was 58,000oz at a total cash cost* of $1,554/oz for Q1 2026,
compared to 63,000oz at a total cash cost* of $1,325/oz in Q1
2025. Gold production decreased by 8% year-on-year in Q1 2026
compared to Q1 2025, largely due to a 28% year-on-year
decrease in the recovered grade stemming from lower mined
grades from open pit and underground operations and a lower
proportion of underground tonnes treated in Q1 2026 as a result
of equipment availability issues, partially offset by an increase in
open pit tonnes treated, driven by a stronger open pit mining
performance year-on-year. Total cash costs per ounce* increased
by 17% year-on-year in Q1 2026 compared to Q1 2025, mainly
driven by increased operating costs associated with higher open
pit mining and processing unit costs linked to production
inefficiencies, increased royalties linked to the higher gold price
and higher fuel prices, partially offset by increased metal
inventories and lower stores costs.
| 12 | Q1 2026 Earnings Release |
AngloGold Ashanti plc | |||
2026 | Quarter 1 | |
Regions Financial and Operating Results continued
Quarter in review
Australia region
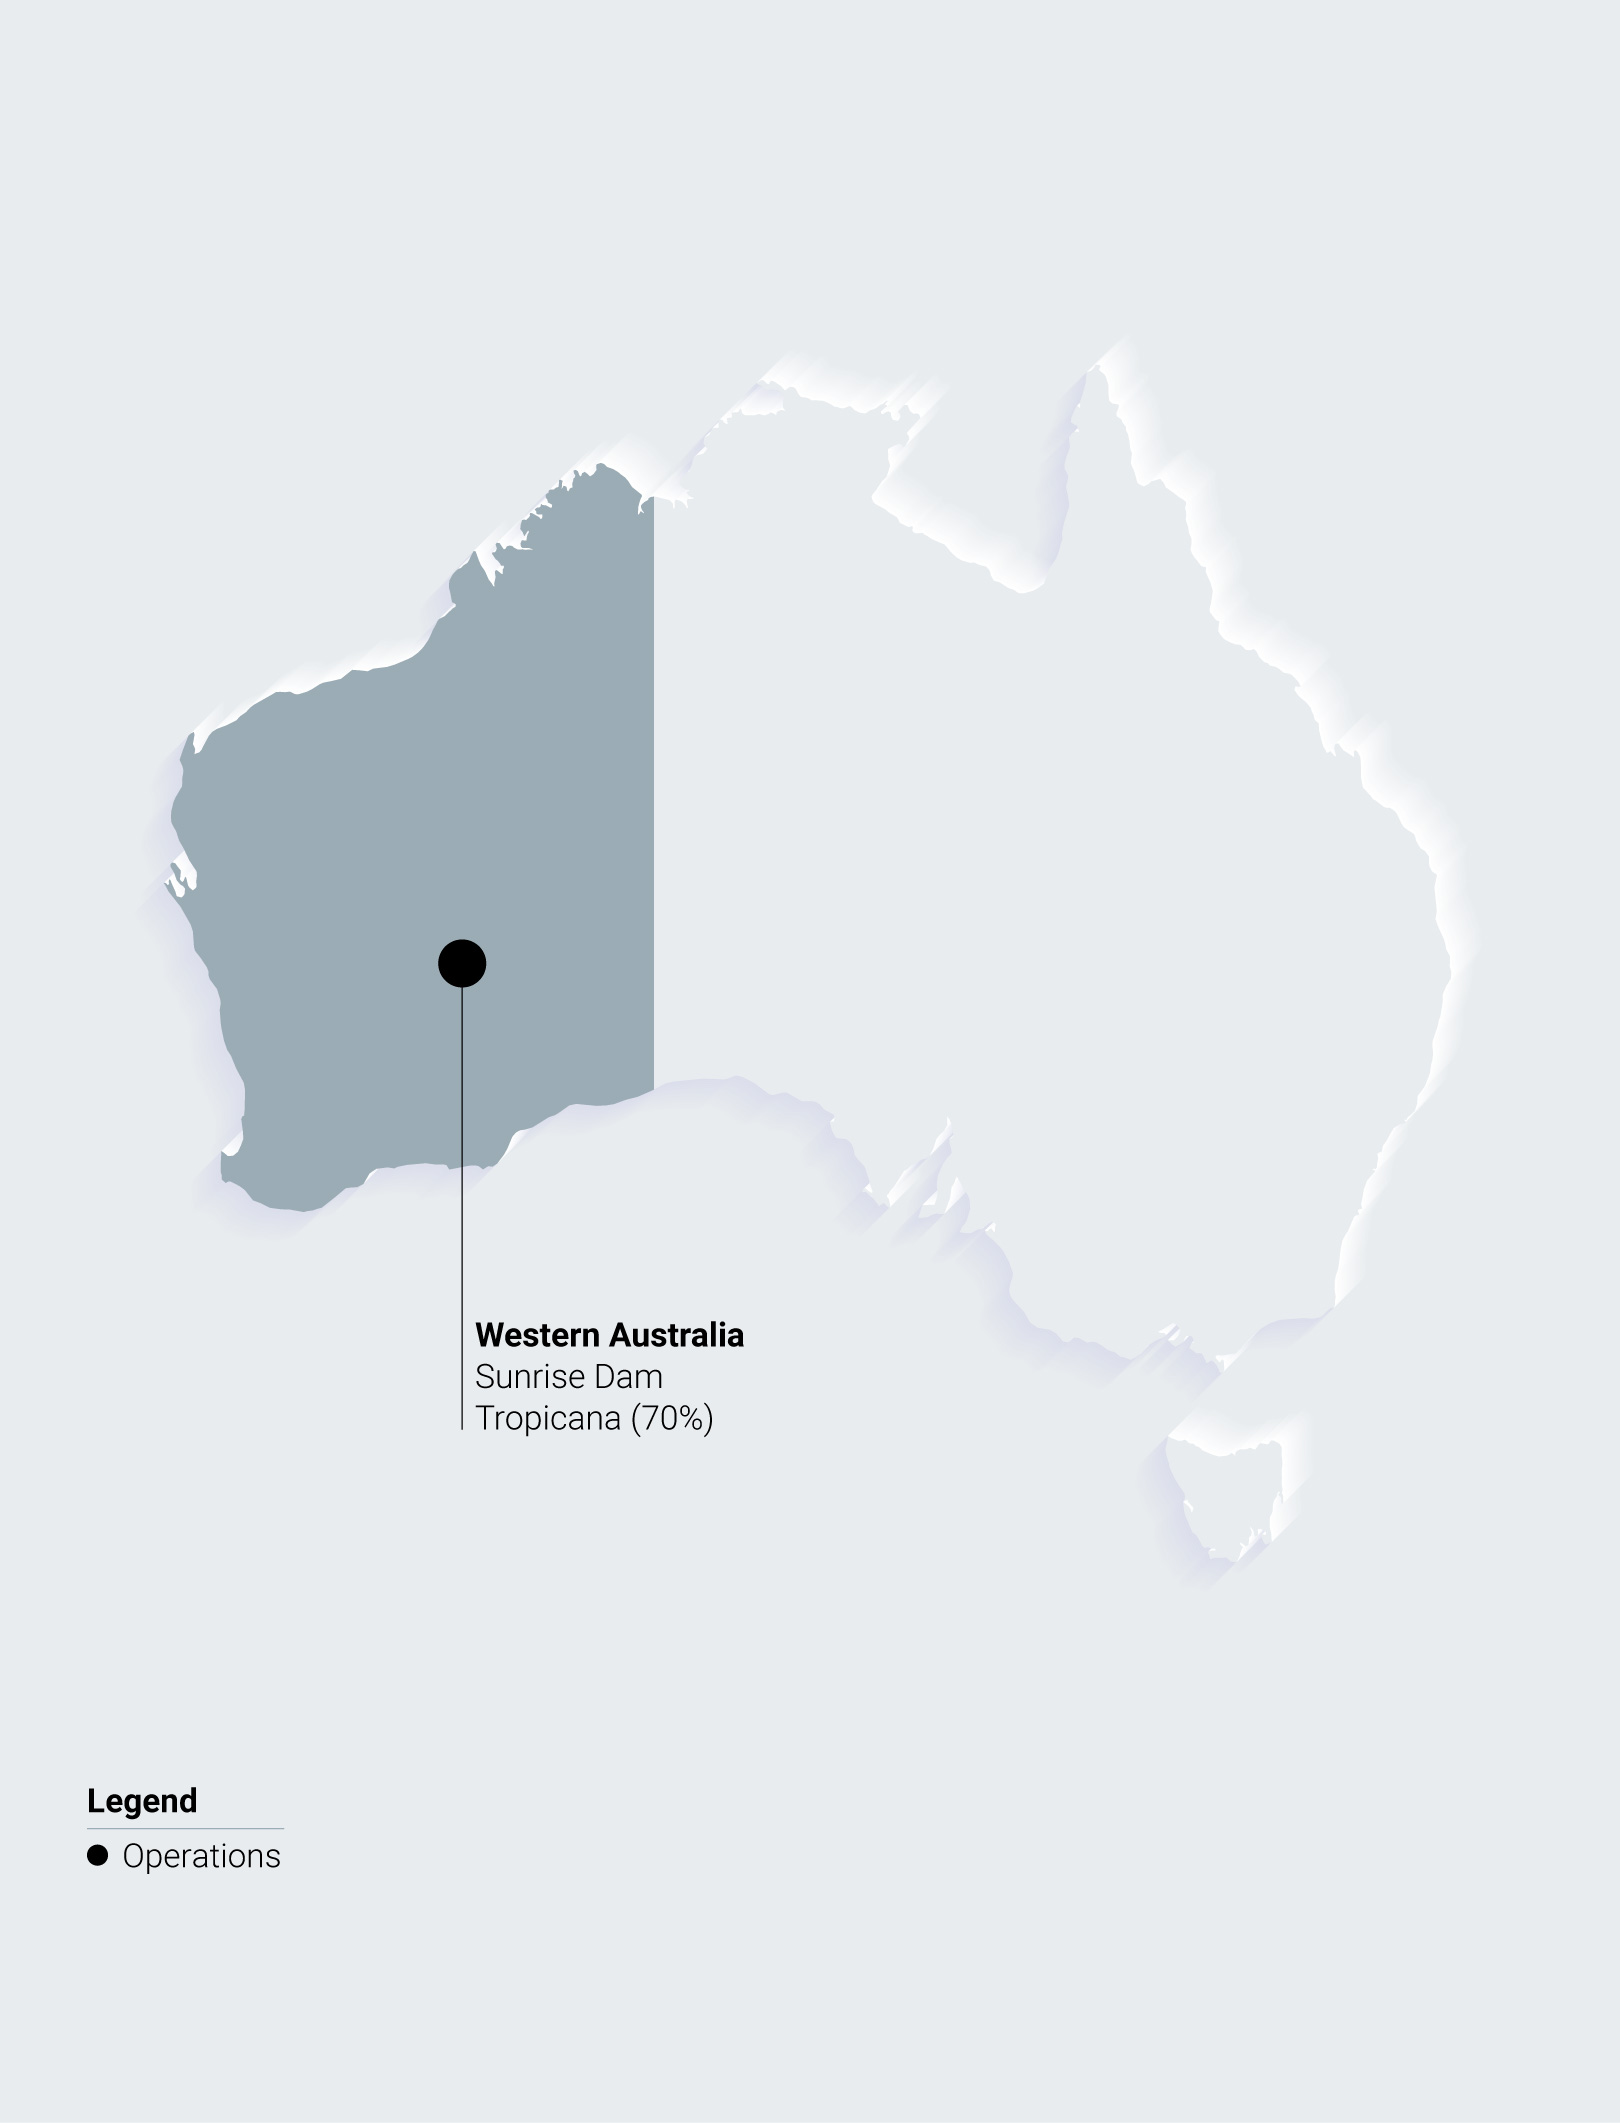
In the Australia region, gold production (on an attributable
basis) was 127,000oz at a total cash cost* of $1,798/oz in Q1
2026, compared to 135,000oz at a total cash cost* of $1,456/oz
in Q1 2025.
At Sunrise Dam, gold production was 51,000oz at a total cash
cost* of $2,087/oz for Q1 2026, compared to 61,000oz at a total
cash cost* of $1,479/oz in Q1 2025. Gold production decreased
by 16% year-on-year in Q1 2026 compared to Q1 2025, mainly
due to a 15% year-on-year decline in recovered grade as a result
of lower underground grade, stemming from lower loader and
stope availability, and an increase in low grade stockpiles
processed due to operational challenges with the crusher in Q1
2026. Total cash costs per ounce* increased by 41% year-on-
year in Q1 2026 compared to Q1 2025, mainly driven by the
impact of lower production, higher operating costs related to
increased royalties linked to the higher gold price, increased
repair and maintenance expenditure and higher reagents and
stores costs, partially offset by a build-up of metal inventories and
lower consultancy costs.
At Tropicana, gold production (on an attributable basis) was
76,000oz at a total cash cost* of $1,456/oz in Q1 2026,
compared to 74,000oz at a total cash cost* of $1,317/oz in Q1
2025. Gold production increased by 3% year-on-year in Q1 2026
compared to Q1 2025, primarily due to a marginal 2% year-on-
year increase in tonnes treated and a marginal 1% year-on-year
increase in recovered grade stemming from improved head
grade, partially offset by lower plant recoveries in Q1 2026. Total
cash costs per ounce* increased by 11% year-on-year in Q1
2026 compared to Q1 2025, mainly due to increased mining
contractor costs, increased royalties linked to the higher gold
price, as well as higher labour costs, partially offset by lower
volume-related open pit mining costs and a build-up of metal
inventories.
Tropicana, Australia
| 13 | Q1 2026 Earnings Release |
AngloGold Ashanti plc | |||
2026 | Quarter 1 | |
Regions Financial and Operating Results continued
Quarter in review
Americas region
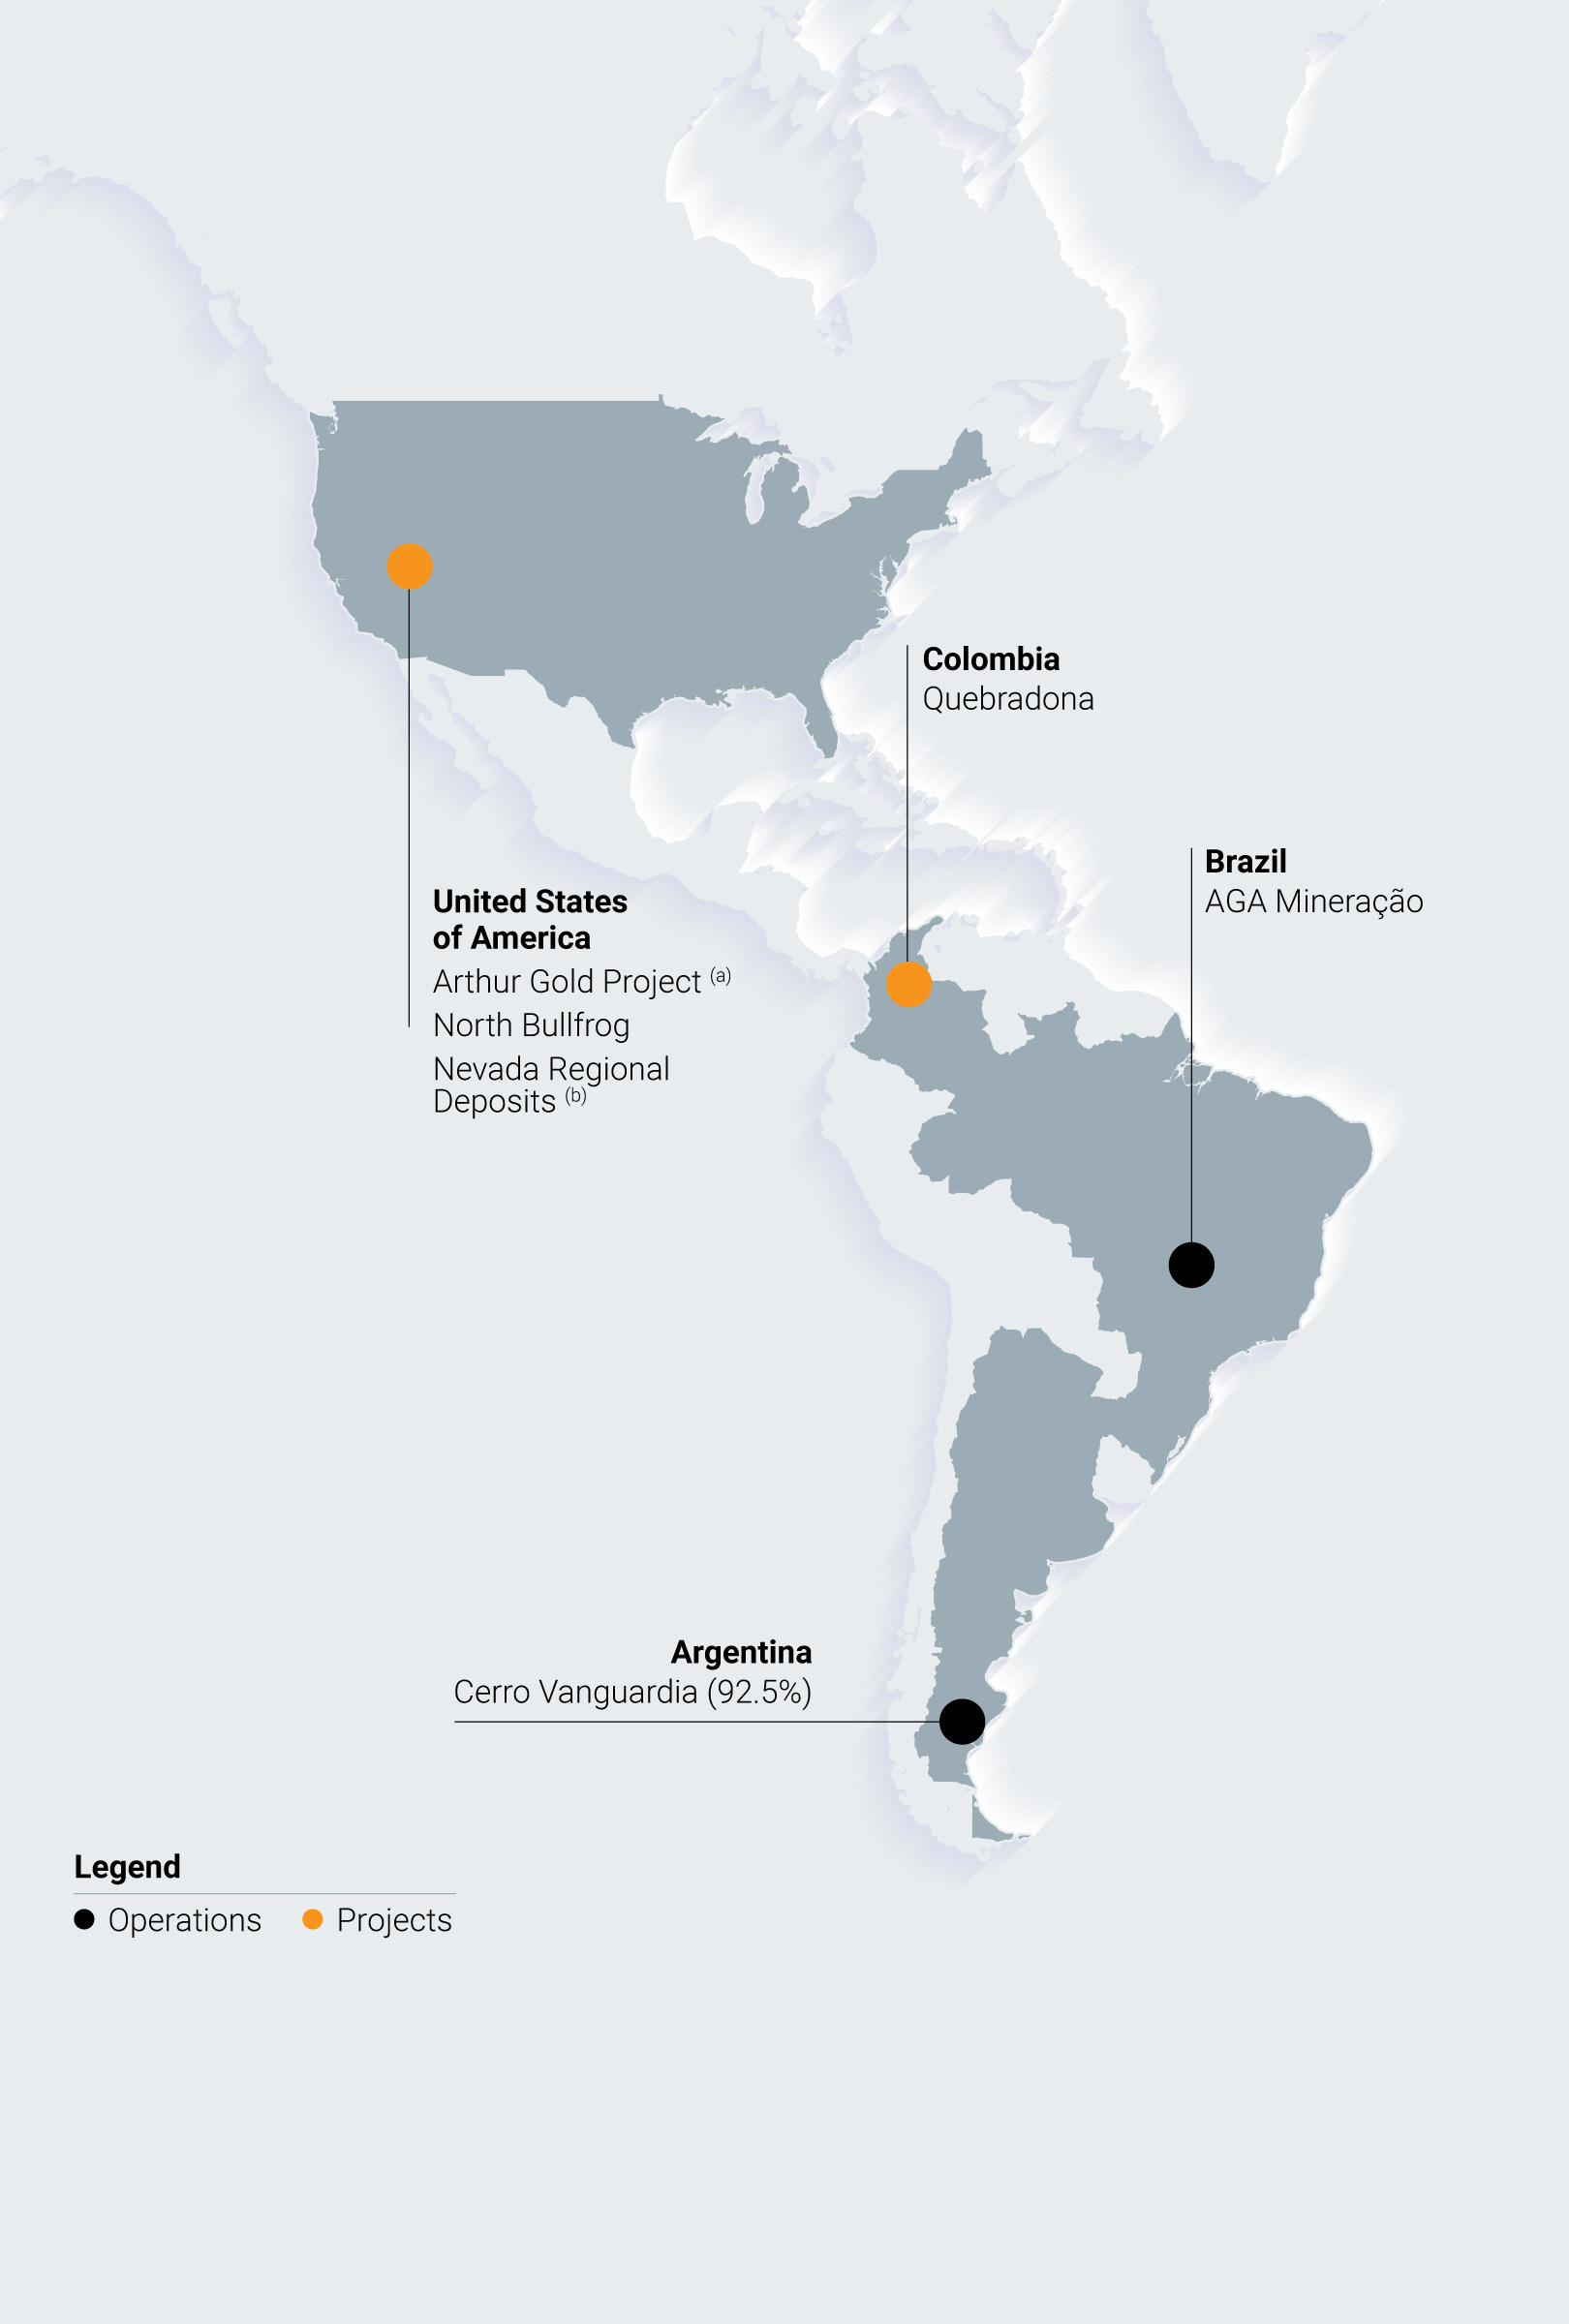
In the Americas region, gold production was 117,000oz at a
total cash cost* of $923/oz in Q1 2026, compared to 115,000oz at
a total cash cost* of $1,170/oz in Q1 2025 (including gold
production of 10,000oz for the Serra Grande operation, which was
sold on 1 December 2025).
In Brazil, at Cuiabá (AGA Mineração), gold production was
67,000oz at a total cash cost* of $1,159/oz for Q1 2026,
compared to 58,000oz at a total cash cost* of $897/oz in Q1
2025. Gold production is recorded upon refining and pouring at
the plant, together with the shipment of gold concentrate. Gold
production increased by 16% year-on-year in Q1 2026 compared
to Q1 2025, mainly driven by an increase in tonnes mined from
underground operations, partially offset by a 13% year-on-year
decrease in recovered grade due to lower mined grades in Q1
2026. Total cash costs per ounce* increased by 29% year-on-
year for Q1 2026 compared to Q1 2025, mainly due to increased
royalties linked to the higher gold price, increased labour and
mining contractor costs, higher stores and reagent costs related
to increased maintenance and rehabilitation activities, and a
depletion of metal inventories, partially offset by the benefit of a
higher production base.
In Argentina, at Cerro Vanguardia, gold production was
50,000oz at a total cash cost* of $602/oz during Q1 2026,
compared to 47,000oz at a total cash cost* of $1,201/oz in Q1
2025. Gold production increased by 6% year-on-year in Q1 2026
compared to Q1 2025, mainly due to a 24% year-on-year
increase in recovered grade stemming from higher mined grades
at open pit and underground operations, partially offset by a
decrease in tonnes placed on the heap leach in Q1 2026. Total
cash costs per ounce* significantly decreased by 50% year-on-
year in Q1 2026 compared to Q1 2025, mainly due to increased
by-product revenue due to a stronger silver price, the impact of
Notes
(a)Previously the Expanded Silicon project, and includes the Silicon and Merlin deposits
(b)Includes the deposits of Reward, Bullfrog, Mother Lode, Crown Block
(SNA, Secret Pass and Daisy), and the Sterling mine
higher gold production output and lower stores and reagents
costs, partially offset by increased royalties linked to the higher
gold and silver prices, a depletion of metal inventories and
increased labour costs.
Nevada, United States of America
| 14 | Q1 2026 Earnings Release |
AngloGold Ashanti plc | |||
2026 | Quarter 1 | |
Corporate Update
Quarter in review
Corporate update
Issued share capital
As at 7 May 2026, the total issued ordinary share capital of the
Company consisted of 505,609,800 ordinary shares of $1.00
each. Each AngloGold Ashanti ordinary share carries one voting
right. The Company does not hold any of its ordinary shares in
treasury.
This figure may be used by AngloGold Ashanti shareholders to
determine whether they are required to notify their interest, or a
change to their interest, in the Company under its Articles of
Association or to comply with any other applicable laws and
regulations.
Proposed share repurchase programme
On 7 May 2026, the Company’s Board of Directors (the “Board”)
approved a proposed share repurchase programme for
AngloGold Ashanti’s ordinary shares of up to $2.0bn. The
implementation of the proposed share repurchase programme is,
among other things, subject to receiving shareholder approval,
which the Company intends to seek by convening a general
meeting of the Company’s shareholders in due course, as well as
any applicable regulatory approvals.
The implementation of the proposed share repurchase
programme (including the timing, structure, manner, price and
number of AngloGold Ashanti ordinary shares repurchased) will
also depend on a number of factors, such as the Company’s
financial performance, availability of cash flows, business and
market conditions, and legal and regulatory requirements, and
will be subject to the Company’s discretion. The proposed share
repurchase programme does not obligate AngloGold Ashanti to
acquire any particular number of its ordinary shares, and the
proposed share repurchase programme may be suspended or
discontinued at any time without prior notice.
Sale of the La Colosa Project
On 13 April 2026, AngloGold Ashanti completed the sale of
AngloGold Ashanti Colombia S.A.S., which owns the La Colosa
project in the Department of Tolima in Colombia, to Mineros S.A.
for a cash consideration of approximately $10m and an additional
contingent consideration of up to $60m (linked to the total
tonnage of mineral ore authorised under an approved work plan
and environmental licence).
Change to Board Committee
Mr. Bruce Cleaver was appointed as a member of the
Nominations and Governance Committee with effect from 7 May
2026. He continues to serve as Chair of the Social, Ethics and
Sustainability Committee and as a member of the Audit and Risk
Committee.
Exploration update
For detailed disclosure on the exploration work done for the
three months ended 31 March 2026, see the Exploration
Update document on the Company’s website at
www.anglogoldashanti.com on both brownfield and greenfield
exploration programmes.
Geita, Tanzania
| 15 | Q1 2026 Earnings Release |
AngloGold Ashanti plc | |||
2026 | Quarter 1 | |
Group Financial Results
Income Statement
Group Income Statement | Quarter | Quarter |
ended | ended | |
Mar | Mar | |
2026 | 2025 | |
US Dollar millions, except as otherwise noted | Unaudited | Unaudited |
Revenue from product sales | 3,236 | 1,963 |
Cost of sales | (1,293) | (1,124) |
Gross profit | 1,943 | 839 |
Corporate administration, marketing and related expenses | (44) | (27) |
Exploration and evaluation costs | (60) | (51) |
(Impairment) reversal of impairment, (derecognition of assets) and profit (loss) on disposal | (4) | (1) |
Other expenses | (25) | (14) |
Finance income | 37 | 32 |
Foreign exchange and fair value adjustments | (35) | (39) |
Finance costs and unwinding of obligations | (90) | (41) |
Share of associates’ and joint ventures’ profit | 227 | 31 |
Profit before taxation | 1,949 | 729 |
Taxation | (487) | (187) |
Profit for the period | 1,462 | 542 |
Attributable to: | ||
Equity shareholders | 1,281 | 443 |
Non-controlling interests | 181 | 99 |
1,462 | 542 | |
Basic earnings per ordinary share (US cents) (1) | 252 | 88 |
Diluted earnings per ordinary share (US cents) (2) | 251 | 88 |
(1) Calculated on the basic weighted average number of ordinary shares. | ||
(2) Calculated on the diluted weighted average number of ordinary shares. |
| 16 | Q1 2026 Earnings Release |
AngloGold Ashanti plc | |||
2026 | Quarter 1 | |
Group Financial Results
Statement of Financial Position
Group Statement of Financial Position | As at | As at | As at | |
Mar | Mar | Dec | ||
2026 | 2025 | 2025 | ||
US Dollar millions, except as otherwise noted | Unaudited | Unaudited Revised (1) | Audited | |
ASSETS | ||||
Non-current assets | ||||
Tangible assets | 8,689 | 8,593 | 8,515 | |
Right of use assets | 174 | 180 | 187 | |
Intangible assets | 110 | 99 | 106 | |
Investments in associates and joint ventures | 890 | 562 | 726 | |
Other investments | 106 | 90 | 12 | |
Loan receivable | 210 | 142 | 200 | |
Inventories | 205 | 147 | 175 | |
Trade, other receivables and other assets (2) | 241 | 221 | 249 | |
Contingent consideration (2) | 68 | 30 | 60 | |
Reimbursive right for post-retirement benefits | 51 | 52 | 51 | |
Deferred taxation (1) | 125 | 89 | 106 | |
Cash restricted for use | 45 | 42 | 44 | |
10,914 | 10,247 | 10,431 | ||
Current assets | ||||
Loan receivable | 30 | 268 | 133 | |
Inventories | 1,054 | 1,063 | 1,076 | |
Trade, other receivables and other assets (2) | 467 | 374 | 426 | |
Contingent consideration (2) | 41 | 1 | 62 | |
Cash restricted for use | 24 | 22 | 23 | |
Cash and cash equivalents | 3,154 | 1,491 | 2,905 | |
Assets held for sale (3) | 21 | — | 22 | |
4,791 | 3,219 | 4,647 | ||
Total assets | 15,705 | 13,466 | 15,078 | |
EQUITY AND LIABILITIES | ||||
Share capital and premium | 568 | 537 | 554 | |
Accumulated profit (losses) and other reserves | 7,967 | 6,237 | 7,537 | |
Shareholders’ equity | 8,535 | 6,774 | 8,091 | |
Non-controlling interests | 1,843 | 1,903 | 1,825 | |
Total equity | 10,378 | 8,677 | 9,916 | |
Non-current liabilities | ||||
Borrowings | 2,020 | 1,926 | 2,025 | |
Lease liabilities | 154 | 129 | 155 | |
Environmental rehabilitation and other provisions | 694 | 678 | 687 | |
Provision for pension and post-retirement benefits | 61 | 60 | 61 | |
Trade and other payables | 14 | 7 | 14 | |
Deferred taxation (1) | 614 | 520 | 600 | |
3,557 | 3,320 | 3,542 | ||
Current liabilities | ||||
Borrowings | 30 | 88 | 19 | |
Lease liabilities | 53 | 70 | 59 | |
Environmental rehabilitation and other provisions | 142 | 113 | 131 | |
Trade and other payables | 966 | 822 | 1,001 | |
Taxation (1) | 540 | 343 | 377 | |
Bank overdraft | 29 | 33 | 23 | |
Liabilities held for sale (3) | 10 | — | 10 | |
1,770 | 1,469 | 1,620 | ||
Total liabilities | 5,327 | 4,789 | 5,162 | |
Total equity and liabilities | 15,705 | 13,466 | 15,078 | |
(1)The comparative period has been revised to correct immaterial prior period errors relating to the classification of deferred and current taxation assets and liabilities
as previously reported in the Company’s Q3 2025 and Q4 2025 financial results.
(2)Contingent consideration, which was previously reported as part of trade, other receivables and other assets, is now reported separately on the statement of
financial position as these assets have a different measurement basis. Current taxation asset, which was previously reported separately, is now reported as part of
trade, other receivables and other assets. Comparative periods have been reclassified.
(3)The assets and liabilities held for sale relate to the La Colosa project being classified as a disposal group held for sale.
| 17 | Q1 2026 Earnings Release |
AngloGold Ashanti plc | |||
2026 | Quarter 1 | |
Group Financial Results
Statement of Cash Flows
Group Statement of Cash Flows | Quarter | Quarter | |
ended | ended | ||
Mar | Mar | ||
2026 | 2025 | ||
US Dollar millions, except as otherwise noted | Unaudited | Unaudited | |
Cash flows from operating activities | |||
Cash generated from operations | 1,951 | 813 | |
Dividends received from joint ventures | 61 | — | |
Taxation paid | (303) | (88) | |
Net cash inflow from operating activities | 1,709 | 725 | |
Cash flows from investing activities | |||
Capital expenditure on tangible and intangible assets | (428) | (303) | |
Contingent consideration received | 19 | 19 | |
Other investments and assets acquired (1) | (67) | — | |
(Increase) decrease in cash restricted for use | (2) | (1) | |
Interest received | 24 | 19 | |
Repayment of loans advanced to joint ventures | 50 | 60 | |
Net cash outflow from investing activities | (404) | (206) | |
Cash flows from financing activities | |||
Proceeds from borrowings | — | 199 | |
Repayment of borrowings | — | (180) | |
Repayment of lease liabilities | (20) | (23) | |
Finance costs – borrowings | (18) | (22) | |
Finance costs – leases | (4) | (4) | |
Dividends paid | (1,026) | (427) | |
Net cash outflow from financing activities | (1,068) | (457) | |
Net increase in cash and cash equivalents | 237 | 62 | |
Translation | 6 | (1) | |
Cash and cash equivalents at beginning of period (net of bank overdraft) | 2,882 | 1,397 | |
Cash and cash equivalents at end of period (net of bank overdraft) | 3,125 | 1,458 | |
(1)This relates to the purchase of shares in Thesis Gold Inc. and Gold X2 Mining Inc.
| 18 | Q1 2026 Earnings Release |
AngloGold Ashanti plc | |||
2026 | Quarter 1 | |
Group Segmental
Gold and by-product income
AngloGold Ashanti’s operating segments are being reported based on the financial information regularly provided to the Chief Executive
Officer and the Executive Committee, collectively identified as the Chief Operating Decision Maker (CODM). Individual members of the
Executive Committee are responsible for geographic regions of the business. Under the Group’s operating model, the financial results and
the composition of the operating segments are reported to the CODM per geographical region and the Projects segment which comprises
all the major non-sustaining capital projects with the potential to be developed into operating entities. In addition to the geographical
reportable segments structure, the Group has voluntarily disaggregated and disclosed the financial information on a line-by-line basis for
each mining operation to facilitate comparability of mine performance.
Gold Income | Quarter | Quarter | |
ended | ended | ||
Mar | Mar | ||
2026 | 2025 | ||
US Dollar millions, except as otherwise noted | Unaudited | Unaudited | |
AFRICA | 2,321 | 1,389 | |
Kibali - Attributable 45% | 341 | 191 | |
Iduapriem | 217 | 114 | |
Obuasi | 283 | 171 | |
Siguiri | 377 | 221 | |
Geita | 604 | 362 | |
Sukari | 499 | 330 | |
AUSTRALIA | 623 | 388 | |
Sunrise Dam | 247 | 170 | |
Tropicana - Attributable 70% | 376 | 218 | |
AMERICAS | 551 | 341 | |
Cerro Vanguardia | 248 | 142 | |
AngloGold Ashanti Mineração (1) | 303 | 169 | |
Serra Grande | — | 30 | |
3,495 | 2,118 | ||
Equity-accounted joint venture included above | (341) | (191) | |
3,154 | 1,927 | ||
(1) Includes income from sale of gold concentrate. | |||
By-product Revenue | |||
US Dollar millions, except as otherwise noted | Unaudited | Unaudited | |
AFRICA | 6 | 2 | |
Kibali - Attributable 45% | 1 | — | |
Geita | 3 | 1 | |
Sukari | 2 | 1 | |
AUSTRALIA | 3 | 1 | |
Sunrise Dam | 1 | — | |
Tropicana - Attributable 70% | 2 | 1 | |
AMERICAS | 74 | 33 | |
Cerro Vanguardia | 69 | 30 | |
AngloGold Ashanti Mineração | 5 | 3 | |
83 | 36 | ||
Equity-accounted joint venture included above | (1) | — | |
82 | 36 | ||
| 19 | Q1 2026 Earnings Release |
AngloGold Ashanti plc | |||
2026 | Quarter 1 | |
Group Segmental
Cost of sales and gross profit
Cost of Sales | Quarter | Quarter | |
ended | ended | ||
Mar | Mar | ||
2026 | 2025 | ||
US Dollar millions, except as otherwise noted | Unaudited | Unaudited | |
AFRICA | 903 | 764 | |
Kibali - Attributable 45% | 123 | 106 | |
Iduapriem | 93 | 87 | |
Obuasi | 110 | 101 | |
Siguiri | 164 | 135 | |
Geita | 204 | 166 | |
Sukari | 209 | 169 | |
AUSTRALIA | 288 | 233 | |
Sunrise Dam | 126 | 102 | |
Tropicana - Attributable 70% | 151 | 122 | |
Administration and other | 11 | 9 | |
AMERICAS | 225 | 232 | |
Cerro Vanguardia | 121 | 111 | |
AngloGold Ashanti Mineração | 104 | 85 | |
Serra Grande | — | 36 | |
CORPORATE AND OTHER | — | 1 | |
1,416 | 1,230 | ||
Equity-accounted joint venture included above | (123) | (106) | |
1,293 | 1,124 | ||
Gross Profit (1) | |||
US Dollar millions, except as otherwise noted | Unaudited | Unaudited | |
AFRICA | 1,424 | 628 | |
Kibali - Attributable 45% | 219 | 86 | |
Iduapriem | 124 | 27 | |
Obuasi | 174 | 70 | |
Siguiri | 213 | 86 | |
Geita | 402 | 197 | |
Sukari | 292 | 162 | |
AUSTRALIA | 338 | 155 | |
Sunrise Dam | 122 | 68 | |
Tropicana - Attributable 70% | 227 | 97 | |
Administration and other | (11) | (10) | |
AMERICAS | 400 | 143 | |
Cerro Vanguardia | 196 | 62 | |
AngloGold Ashanti Mineração | 204 | 88 | |
Serra Grande | — | (6) | |
Administration and other | — | (1) | |
CORPORATE AND OTHER | — | (1) | |
2,162 | 925 | ||
Equity-accounted joint venture included above | (219) | (86) | |
1,943 | 839 | ||
(1) The Group’s segmental profit measure is gross profit, which excludes the results of associates and joint ventures. For the reconciliation of gross profit to profit for the period, refer to the Group income statement. | |||
| 20 | Q1 2026 Earnings Release |
AngloGold Ashanti plc | |||
2026 | Quarter 1 | |
Group Segmental
Amortisation and capital expenditure
Amortisation | Quarter | Quarter | |
ended | ended | ||
Mar | Mar | ||
2026 | 2025 | ||
US Dollar millions, except as otherwise noted | Unaudited | Unaudited | |
AFRICA | 213 | 188 | |
Kibali - Attributable 45% | 20 | 21 | |
Iduapriem | 12 | 27 | |
Obuasi | 22 | 20 | |
Siguiri | 12 | 15 | |
Geita | 55 | 38 | |
Sukari | 92 | 67 | |
AUSTRALIA | 56 | 38 | |
Sunrise Dam | 19 | 14 | |
Tropicana - Attributable 70% | 37 | 24 | |
AMERICAS | 41 | 49 | |
Cerro Vanguardia | 18 | 16 | |
AngloGold Ashanti Mineração | 23 | 22 | |
Serra Grande | — | 11 | |
CORPORATE AND OTHER | 1 | 1 | |
311 | 276 | ||
Equity-accounted joint venture included above | (20) | (21) | |
291 | 255 | ||
Capital Expenditure | |||
US Dollar millions, except as otherwise noted | Unaudited | Unaudited | |
AFRICA | 342 | 241 | |
Kibali - Attributable 45% | 39 | 33 | |
Iduapriem | 42 | 35 | |
Obuasi | 58 | 42 | |
Siguiri | 66 | 12 | |
Geita | 70 | 60 | |
Sukari | 67 | 59 | |
AUSTRALIA | 38 | 29 | |
Sunrise Dam | 20 | 13 | |
Tropicana - Attributable 70% | 18 | 16 | |
AMERICAS | 54 | 48 | |
Cerro Vanguardia | 21 | 15 | |
AngloGold Ashanti Mineração | 33 | 25 | |
Serra Grande | — | 8 | |
PROJECTS | 33 | 18 | |
Colombian projects | 1 | 10 | |
North American projects | 32 | 8 | |
467 | 336 | ||
Equity-accounted joint venture included above | (39) | (33) | |
428 | 303 | ||
| 21 | Q1 2026 Earnings Release |
AngloGold Ashanti plc | |||
2026 | Quarter 1 | |
Group Segmental
Total Assets
Total Assets | As at | As at | As at | |
Mar | Mar | Dec | ||
2026 | 2025 | 2025 | ||
US Dollar millions, except as otherwise noted | Unaudited | Unaudited Revised | Audited | |
AFRICA | 9,807 | 9,094 | 9,294 | |
Kibali - Attributable 45% | 1,041 | 922 | 981 | |
Iduapriem | 682 | 594 | 668 | |
Obuasi | 1,644 | 1,531 | 1,617 | |
Siguiri | 918 | 620 | 700 | |
Geita | 1,348 | 1,263 | 1,283 | |
Sukari | 4,164 | 4,158 | 4,034 | |
Administration and other | 10 | 6 | 11 | |
AUSTRALIA | 1,290 | 924 | 1,115 | |
AMERICAS | 1,846 | 1,594 | 1,712 | |
Cerro Vanguardia | 726 | 656 | 560 | |
AngloGold Ashanti Mineração | 948 | 775 | 1,080 | |
Serra Grande | — | 145 | — | |
Administration and other | 172 | 18 | 72 | |
PROJECTS | 1,031 | 923 | 975 | |
Colombian projects | 117 | 216 | 117 | |
North American projects | 914 | 707 | 858 | |
CORPORATE AND OTHER | 1,731 | 931 | 1,982 | |
15,705 | 13,466 | 15,078 | ||
By order of the Board | ||||
J TILK Chairman | A CALDERON Chief Executive Officer | G DORAN Chief Financial Officer | ||
7 May 2026 | ||||
| 22 | Q1 2026 Earnings Release |
AngloGold Ashanti plc | |||
2026 | Quarter 1 | |
Dividends
AngloGold Ashanti plc today announces an interim dividend for the three months ended 31 March 2026 of 116 US cents per share. In
respect of the interim dividend, the timelines, including dates for currency conversions, set out below will apply.
To holders of ordinary shares on the New York Stock Exchange (NYSE)
2026 | ||
Ex-dividend on NYSE | Friday, 29 May | |
Record date | Friday, 29 May | |
Payment date | Friday, 12 June | |
To holders of ordinary shares on the South African Register
Additional information for South African resident shareholders of AngloGold Ashanti:
Shareholders registered on the South African section of the register are advised that the distribution of 116 US cents per ordinary share will
be converted to South African rands at the applicable exchange rate.
In compliance with the requirements of Strate and the Johannesburg Stock Exchange (JSE) Listings Requirements, the salient dates for
payment of the dividend are as follows:
2026 | ||
Declaration date | Friday, 8 May | |
Currency conversion rate for South African rands announcement date | Friday, 22 May | |
Last date to trade ordinary shares cum dividend | Tuesday, 26 May | |
Ordinary shares trade ex-dividend | Wednesday, 27 May | |
Record date | Friday, 29 May | |
Payment date | Friday, 12 June | |
Dividends in respect of dematerialised shareholdings will be credited to shareholders’ accounts with the relevant CSDP (as defined below)
or broker.
To comply with further requirements of Strate, share certificates may not be dematerialised or rematerialised between Wednesday, 27 May
2026 and Friday, 29 May 2026, both days inclusive. No transfers between South African, NYSE and Ghanaian share registers will be
permitted between Friday, 22 May 2026 and Friday, 29 May 2026, both days inclusive.
Details of the exchange rates applicable to the dividend and a summary of the tax considerations applicable to South African shareholders
is expected to be published on Friday, 22 May 2026.
To Beneficial Owners on the Ghana sub-register holding shares through the nominee arrangement
with the Central Securities Depositary (GH) LTD
2026 | ||
Currency conversion date | Friday, 22 May | |
Last date to trade and to register shares cum dividend | Tuesday, 26 May | |
Shares trade ex-dividend | Wednesday, 27 May | |
Record date | Friday, 29 May | |
Approximate payment date of dividend | Friday, 12 June | |
To Beneficial Owners holding Ghanaian Depositary Shares (GhDSs) and acting by National Trust
Holding Company Ltd as depository agent 100 GhDSs represent one ordinary share
2026 | ||
Currency conversion date | Friday, 22 May | |
Last date to trade and to register GhDSs cum dividend | Tuesday, 26 May | |
GhDSs trade ex-dividend | Wednesday, 27 May | |
Record date | Friday, 29 May | |
Approximate payment date of dividend | Friday, 12 June | |
Beneficial owners on the Ghana sub-register holding shares and beneficial owners holding GhDSs are advised that the distribution of 116
US cents per ordinary share will be converted to Ghanaian cedis at the applicable exchange rate. Assuming an exchange rate of
US$1/ ¢11.2425, the gross dividend payable per share, is equivalent to ca. ¢13.0413 Ghanaian cedis. However, the actual rate of payment
will depend on the exchange rate on the date for currency conversion.
Entitlement to interim dividends
A “Shareholder of Record” is a person appearing on the register of members of the Company in respect of ordinary shares at the close of
business on the relevant record date. A “Beneficial Owner” is a person who holds ordinary shares of the Company through a bank, broker,
central securities depository participant (“CSDP”), Shareholder of Record or other agent (sometimes referred to as holding shares “in
street name”).
| 23 | Q1 2026 Earnings Release |
AngloGold Ashanti plc | |||
2026 | Quarter 1 | |
Non-GAAP Disclosure Results
Non-GAAP Disclosure
From time to time AngloGold Ashanti may publicly disclose certain “Non-GAAP” financial measures in the course of its financial
presentations, earnings releases, earnings conference calls and otherwise.
In this document, AngloGold Ashanti presents the financial items “total cash costs”, “total cash costs per ounce”, “all-in sustaining costs”,
“all-in sustaining costs per ounce”, “average gold price received per ounce”, “total cash cost margin”, “sustaining capital expenditure” and
“non-sustaining capital expenditure”, which have been determined using industry guidelines and practices and are not measures under
IFRS. In addition, AngloGold Ashanti also presents the financial items “EBITDA”, “net debt (cash)” and “free cash flow” which are not
measures under IFRS either. An investor should not consider these items in isolation or as alternatives to cost of sales, gold income,
capital expenditure, profit (loss) for the period, total borrowings, cash flows from operating activities or any other measure of financial
performance presented in accordance with IFRS or as an indicator of the Group’s performance. The Group uses certain Non-GAAP
performance measures and ratios in managing the business and may provide users of this financial information with additional meaningful
comparisons between current results and results in prior operating periods. Non-GAAP financial measures should be viewed in addition to,
and not as an alternative to, the reported operating results or any other measure of performance prepared in accordance with IFRS. In
addition, the presentation of these measures may not be comparable to similarly titled measures that other companies use.
The term “managed operations” refers to subsidiaries managed by AngloGold Ashanti and included in its consolidated reporting, while the
term “non-managed joint ventures” refers to equity-accounted joint ventures that are reported based on AngloGold Ashanti’s share of
attributable earnings and are not managed by AngloGold Ashanti. Managed operations are reported on a consolidated basis. Non-
managed joint ventures are reported on an attributable basis.
All-in sustaining costs
During 2018, the World Gold Council (“WGC”), an industry body, published a revised Guidance Note on the “all-in sustaining costs” metric,
which gold mining companies can use to supplement their overall Non-GAAP disclosure. The WGC worked closely with its members
(including AngloGold Ashanti) to develop these Non-GAAP measures which are intended to provide further transparency into the full cost
associated with producing gold. It is expected that this metric, which AngloGold Ashanti provides herein, will be helpful to investors,
governments, local communities and other stakeholders in understanding the economics of gold mining.
“All-in sustaining costs” is a Non-GAAP measure which is an extension of the existing “total cash costs” metric and incorporates all costs
related to sustaining production and in particular, recognises sustaining capital expenditures associated with developing and maintaining
gold mines. In addition, this metric includes the cost associated with Corporate Office structures that support these operations, the
community and environmental rehabilitation costs attendant with responsible mining and any exploration and evaluation cost associated
with sustaining current operations. “All-in sustaining costs per ounce - managed operations” ($/oz) is calculated by dividing the
consolidated US dollar value of this cost metric by the consolidated ounces of gold sold. “All-in sustaining costs per ounce - non-managed
joint ventures” ($/oz) is calculated by dividing the attributable US dollar value of this cost metric by the attributable ounces of gold sold.
Total cash costs
“Total cash costs” is calculated in accordance with the guidelines of the Gold Institute industry standard and industry practice and is a Non-
GAAP measure. The Gold Institute, which has been incorporated into the National Mining Association, is a non-profit international
association of miners, refiners, bullion suppliers and manufacturers of gold products, which developed a uniform format for reporting total
cash costs on a per ounce basis. The guidance was first adopted in 1996 and revised in November 1999.
“Total cash costs” is a Non-GAAP measure and, as calculated and reported by AngloGold Ashanti, include costs for all mining, processing,
onsite administration costs, royalties and production taxes, as well as contributions from by-products, but exclude amortisation of tangible,
intangible and right of use assets, rehabilitation costs and other non-cash costs, retrenchment costs, corporate administration, marketing
and related costs, capital costs and exploration costs. “Total cash costs per ounce - managed operations” ($/oz) is calculated by dividing
the consolidated US dollar value of this cost metric by the consolidated ounces of gold produced. “Total cash costs per ounce - non-
managed joint ventures” ($/oz) is calculated by dividing the attributable US dollar value of this cost metric by the attributable ounces of
gold produced.
Average gold price received per ounce
“Average gold price received per ounce” is a Non-GAAP measure which gives an indication of revenue earned per ounce of gold sold and
serves as a benchmark of performance against the market spot gold price. “Average gold price received per ounce - managed operations”
is calculated by dividing the consolidated US dollar value of this revenue metric by the consolidated ounces of gold sold. “Average gold
price received per ounce - non-managed joint ventures” is calculated by dividing the attributable US dollar value of this revenue metric by
the attributable ounces of gold sold.
Total cash cost margin
“Total cash cost margin” is a Non-GAAP measure which gives an indication of profitability after covering total cash costs, representing the
difference between the average realised price of gold per ounce and the total cash costs per ounce required to produce it, expressed on a
percentage basis. “Total cash cost margin” is calculated by AngloGold Ashanti as “average gold price received per ounce” minus “total
cash costs per ounce”, divided by “average gold price received per ounce”, expressed on a percentage basis.
Sustaining capital expenditure
“Sustaining capital expenditure” is a Non-GAAP measure comprising capital expenditure incurred to sustain and maintain existing assets at
their current productive capacity in order to achieve constant planned levels of productive output and capital expenditure to extend useful
lives of existing production assets. This includes replacement of vehicles, plant and machinery, Mineral Reserve development, deferred
stripping and capital expenditure related to financial benefit initiatives, safety, health and the environment.
Non-sustaining capital expenditure
“Non-sustaining capital expenditure” is a Non-GAAP measure comprising capital expenditure incurred at new operations and capital
expenditure related to ‘major projects’ at existing operations where these projects will materially increase production.
| 24 | Q1 2026 Earnings Release |
AngloGold Ashanti plc | |||
2026 | Quarter 1 | |
Non-GAAP Disclosure Results continued
While the Gold Institute provided definitions for the calculation of “total cash costs” and the WGC published a revised Guidance Note on
the “all-in sustaining costs” metric during 2018, the calculation of “total cash costs”, “total cash costs per ounce”, “all-in sustaining costs”
and “all-in sustaining costs per ounce” may vary significantly among gold mining companies, and by themselves do not necessarily provide
a basis for comparison with other gold mining companies.
However, AngloGold Ashanti believes that “total cash costs” and “all-in sustaining costs” in total by mine and per ounce by mine as well as
“average gold price received per ounce”, “sustaining capital expenditure” and “non-sustaining capital expenditure” are useful indicators to
investors and management as they provide:
•an indication of profitability, efficiency and cash flows;
•the trend in costs as the mining operations mature over time on a consistent basis; and
•an internal benchmark of performance to allow for comparison against other mines, both within the Group and at other gold mining
companies.
Management prepares its internal management reporting documentation, for use and decision making by the Chief Operating Decision
Maker (CODM), on a total basis.
The key metrics are based on the total ounces, gold income, “total cash costs”, “all-in sustaining costs”, “sustaining capital expenditure”
and “non-sustaining capital expenditure” from each operation and as a consequence includes AngloGold Ashanti’s share of the “total cash
costs”, “all-in sustaining costs”, “sustaining capital expenditure” and “non-sustaining capital expenditure” of its non-managed joint ventures
that are accounted for under the equity method. In a capital intensive industry, this basis allows management to make operating and
resource allocation decisions on a comparable basis between mining operations irrespective of whether they are consolidated or
accounted for under the equity method. This basis of calculating the metrics is consistent with the WGC’s Guidance Note on the “all-in
sustaining costs” metric.
Although AngloGold Ashanti has shareholder rights and board representation commensurate with its ownership interests in its equity-
accounted non-managed joint ventures and reviews the underlying operating results including “total cash costs”, “all-in sustaining costs”,
“sustaining capital expenditure” and “non-sustaining capital expenditure” with them at each reporting period, it does not have direct control
over their operations or resulting revenue and expenses, nor does it have a proportionate legal interest in each financial statement line
item. AngloGold Ashanti’s use of “total cash costs”, “all-in sustaining costs”, “sustaining capital expenditure” and “non-sustaining capital
expenditure” on a total basis, is not intended to imply that it has any such control or proportionate legal interest, but rather to reflect the
Non-GAAP measures on a basis consistent with its internal and external segmental reporting.
EBITDA
“EBITDA” is a Non-GAAP measure and, as calculated and reported by AngloGold Ashanti, includes profit (loss) for the period, adding back
finance costs and unwinding of obligations, taxation, amortisation of tangible, right of use and intangible assets, and other amortisation,
less finance income for the period.
To enhance comparability with industry peers, AngloGold Ashanti will present EBITDA, and will not further adjust this metric in its reporting.
Comparative periods will also reflect this change.
Net debt (cash)
“Net debt (cash)” is a Non-GAAP measure and, as calculated and reported by AngloGold Ashanti, includes total borrowings less cash and
cash equivalents (net of bank overdraft).
To enhance comparability with industry peers, AngloGold Ashanti will present net debt (cash), and will not further adjust this metric in its
reporting. Comparative periods will also reflect this change.
Free cash flow
“Free cash flow" is a Non-GAAP measure and, as calculated and reported by AngloGold Ashanti, includes operating cash flow less capital
expenditure. Operating cash flow is defined as net cash flow from operating activities, plus repayment of loans advanced to joint ventures,
less distributions to non-controlling interests.
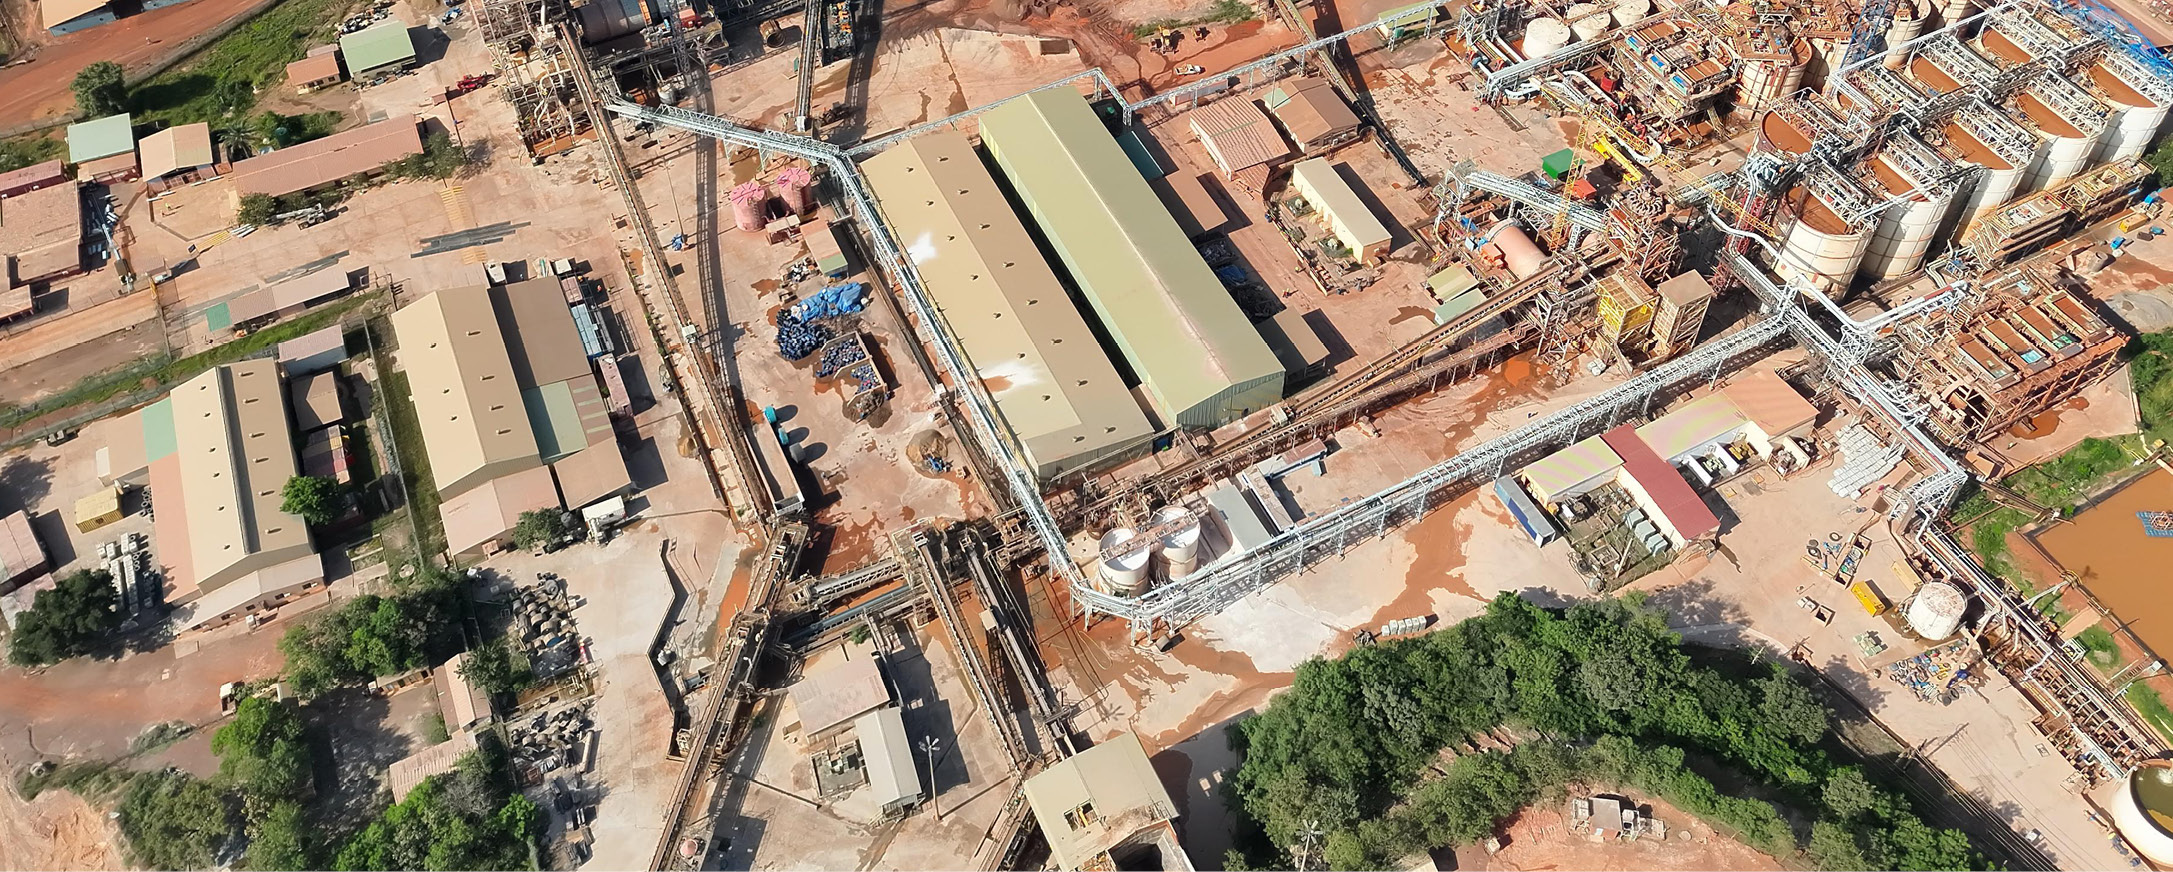
Siguiri, Guinea
| 25 | Q1 2026 Earnings Release |
AngloGold Ashanti plc | |||
2026 | Quarter 1 | |
Non-GAAP Disclosure Results continued
Reconciliations
All-in sustaining costs and total cash costs per ounce (including total cash cost margin)
A reconciliation of cost of sales as included in AngloGold Ashanti’s Earnings Release for the three months ended 31 March 2026 and
31 March 2025, to “all-in sustaining costs”, “all-in sustaining costs per ounce”, “total cash costs” and “total cash costs per ounce” for each
of the three-month periods ended 31 March 2026 and 31 March 2025, is presented on a total (Group), total (managed operations/non-
managed joint ventures) and segment basis in Note A below.
In addition, the Company has provided detail of the consolidated ounces of gold produced and sold by mine (for managed operations) and
the attributable ounces of gold produced and sold by mine (for non-managed joint ventures) for each of those periods below.
Average gold price received per ounce
A reconciliation of gold income as included in AngloGold Ashanti’s Earnings Release for the three months ended 31 March 2026 and
31 March 2025, to “average gold price received per ounce” for each of the three-month periods ended 31 March 2026 and 31 March 2025,
is presented on a total (Group) and total (managed operations/non-managed joint ventures) basis in Note B below.
Sustaining capital expenditure and non-sustaining capital expenditure
A reconciliation of capital expenditure as included in AngloGold Ashanti’s Earnings Release for the three months ended 31 March 2026
and 31 March 2025, to “sustaining capital expenditure” and “non-sustaining capital expenditure” for each of the three-month periods ended
31 March 2026 and 31 March 2025, is presented on a total (Group), total (managed operations/non-managed joint ventures) and segment
basis in Note C below.
EBITDA
A reconciliation of profit (loss) for the period as included in AngloGold Ashanti’s Earnings Release for the three months ended 31 March
2026 and 31 March 2025, to “EBITDA” for each of the three-month periods ended 31 March 2026 and 31 March 2025, is presented on a
total (Group) basis in Note D below.
Net debt (cash)
A reconciliation of total borrowings as included in AngloGold Ashanti’s Earnings Release as at 31 March 2026, 31 March 2025 and
31 December 2025 to “net debt (cash)” as at 31 March 2026, 31 March 2025 and 31 December 2025, is presented on a total (Group) basis
in Note E below.
Free cash flow
A reconciliation of net cash flow from operating activities as included in AngloGold Ashanti’s Earnings Release for the three months ended
31 March 2026 and 31 March 2025, to “free cash flow” for each of the three-month periods ended 31 March 2026 and 31 March 2025, is
presented on a total (Group) basis in Note F below.
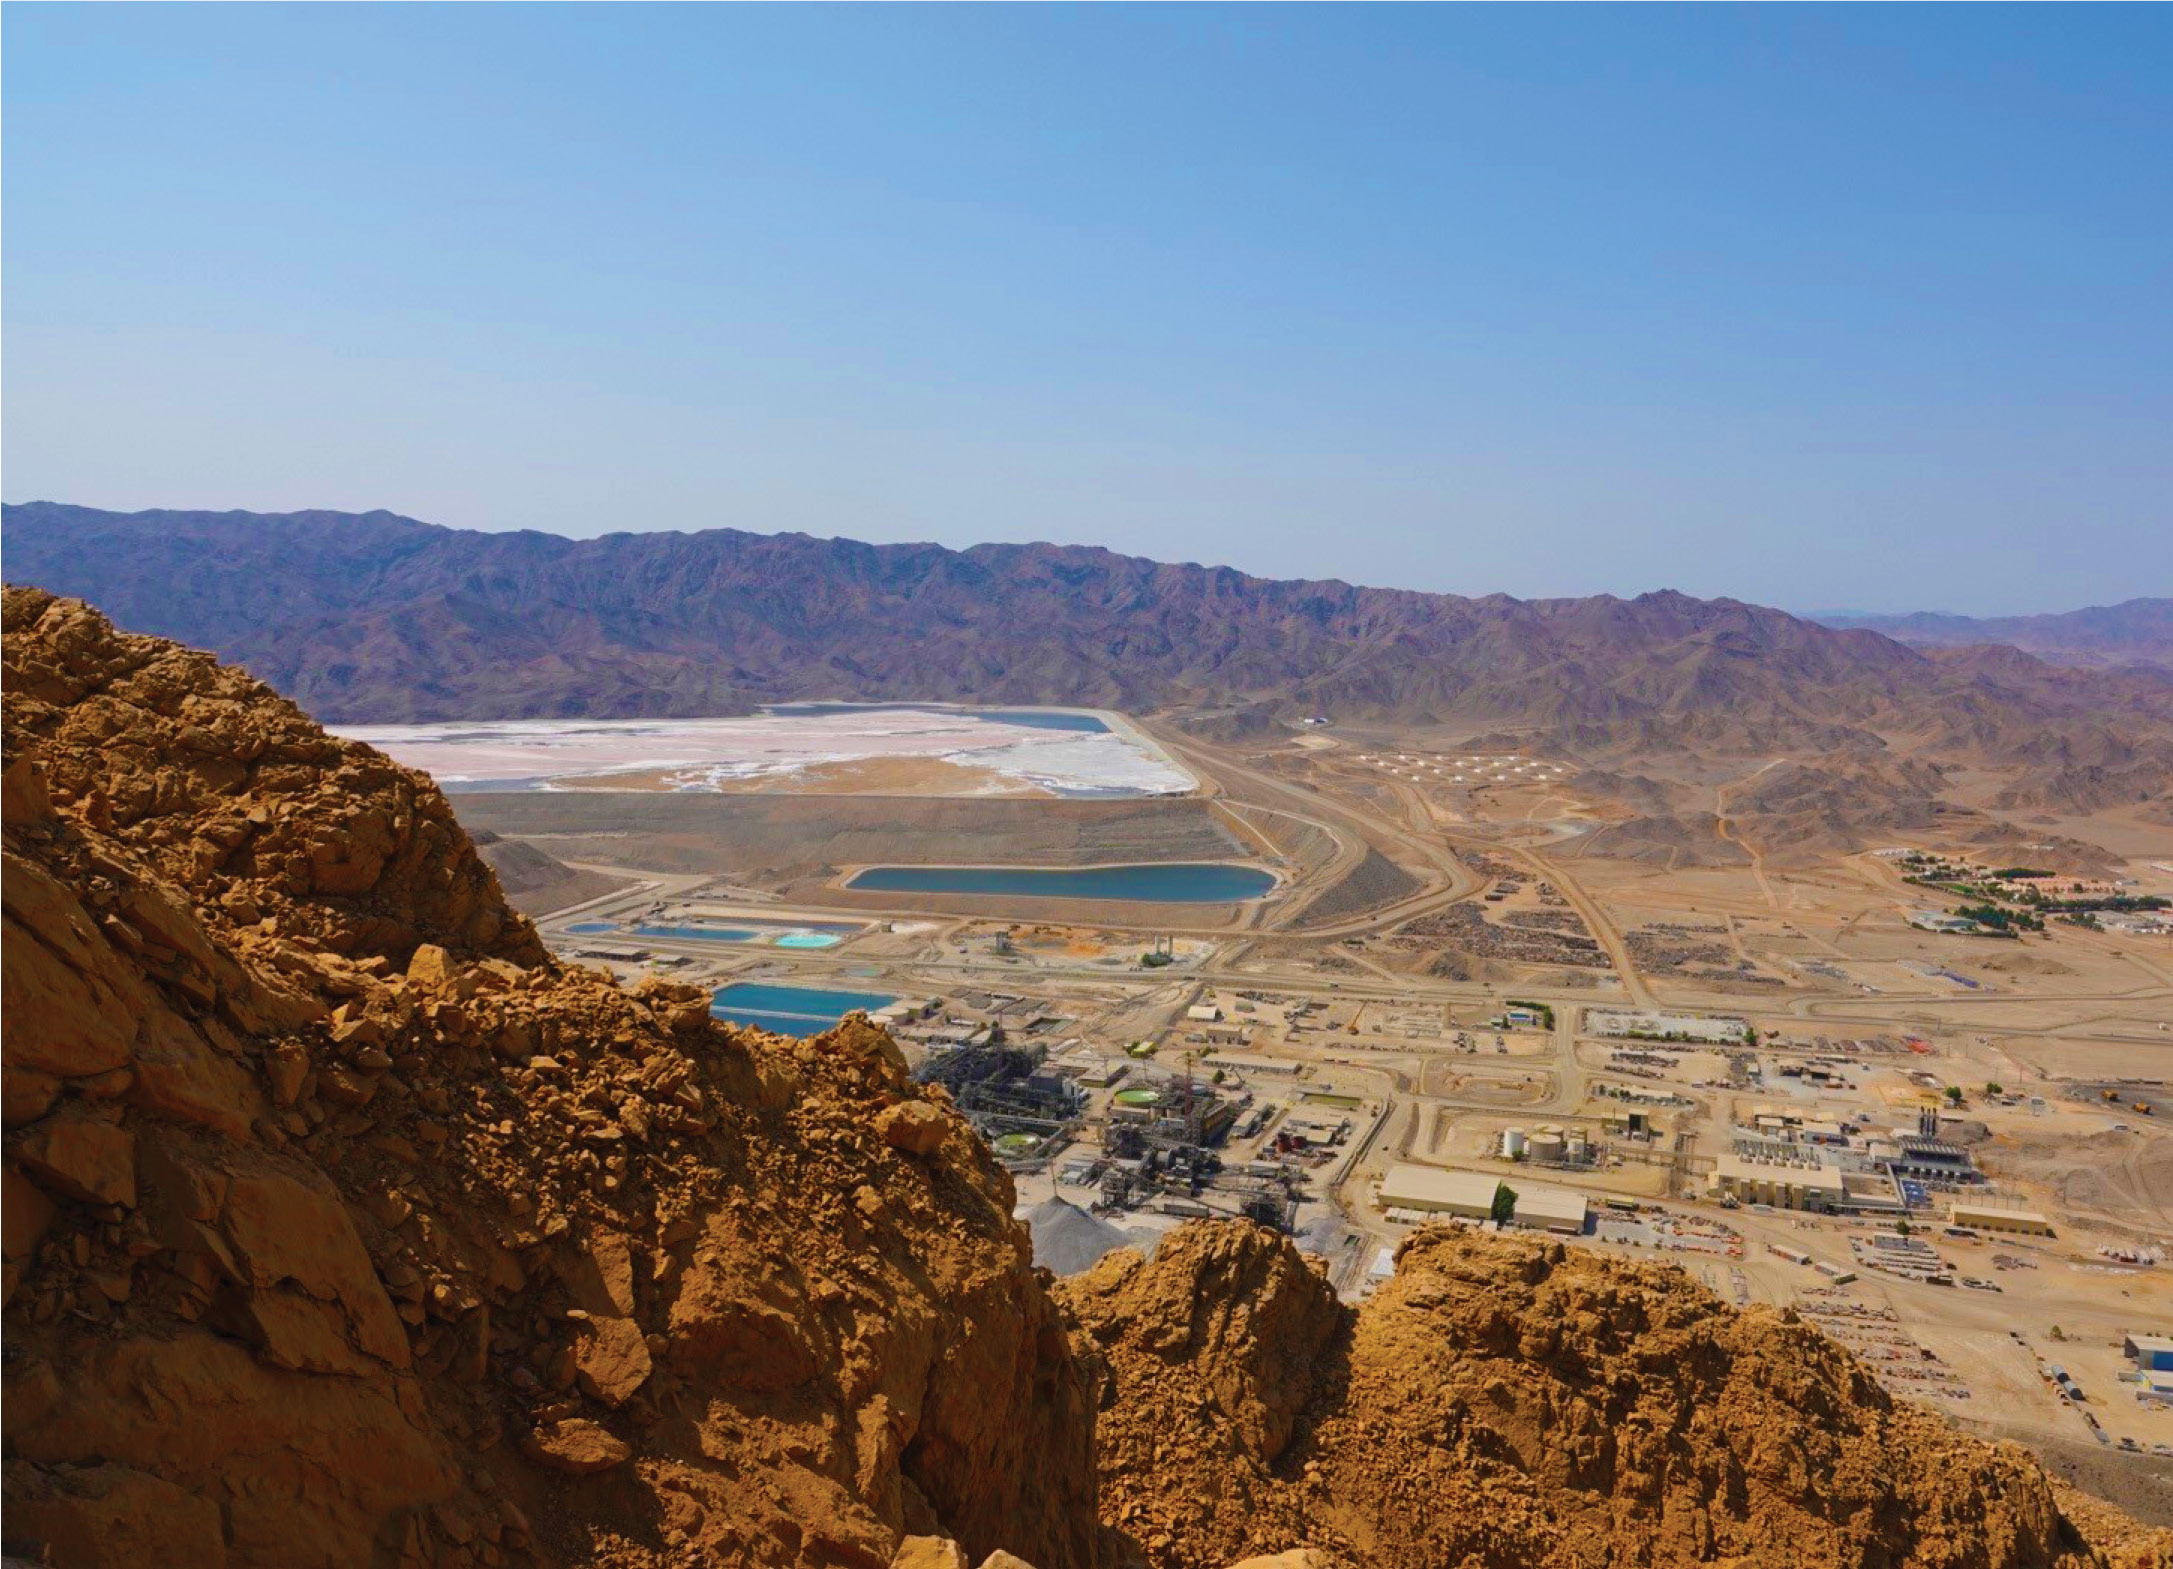
Sukari, Egypt
| 26 | Q1 2026 Earnings Release |
AngloGold Ashanti plc | |||
2026 | Quarter 1 | |
Non-GAAP Disclosure Note A
All-in sustaining costs | FOR THE QUARTER ENDED 31 MARCH 2026 | |||||||||||||
Corporate and other(3) | AFRICA | AUSTRALIA | ||||||||||||
Kibali - Attr. 45% | Non-managed joint ventures | Iduapriem | Obuasi | Siguiri | Geita | Sukari | Africa other | Managed operations | Sunrise Dam | Tropicana - Attr. 70% | Australia other | Australia | ||
in US Dollar millions, except as otherwise noted | ||||||||||||||
Cost of sales per segmental information (2) | — | 123 | 123 | 93 | 110 | 164 | 204 | 209 | — | 780 | 126 | 151 | 11 | 288 |
By-product revenue | — | (1) | (1) | — | — | — | (3) | (2) | — | (5) | (1) | (2) | — | (3) |
Amortisation of tangible, intangible and right of use assets | (1) | (20) | (20) | (12) | (22) | (12) | (55) | (92) | — | (193) | (19) | (37) | — | (56) |
Adjusted for decommissioning and inventory amortisation | — | — | — | — | — | — | — | — | — | — | — | — | — | — |
Corporate administration, marketing and related expenses | 44 | — | — | — | — | — | — | — | — | — | — | — | — | — |
Lease payment sustaining | — | 1 | 1 | 1 | — | 1 | 5 | 1 | — | 8 | 2 | 6 | 1 | 9 |
Sustaining exploration and study costs | — | — | — | — | — | 3 | 2 | — | — | 5 | 1 | — | — | 1 |
Total sustaining capital expenditure | — | 16 | 16 | 39 | 42 | 31 | 67 | 30 | — | 209 | 16 | 11 | — | 27 |
All-in sustaining costs (5) | 43 | 119 | 119 | 122 | 130 | 187 | 221 | 145 | — | 805 | 125 | 130 | 12 | 267 |
Gold sold - oz (000) | — | 69 | 69 | 45 | 59 | 78 | 123 | 102 | — | 407 | 51 | 78 | — | 129 |
All-in sustaining costs per ounce - $/oz (1) | — | 1,719 | 1,719 | 2,737 | 2,210 | 2,391 | 1,797 | 1,421 | — | 1,980 | 2,438 | 1,674 | — | 2,070 |
(1) In addition to the operational performances of the mines, “all-in sustaining costs per ounce” and “total cash costs per ounce” are affected by fluctuations in the foreign currency exchange rate. AngloGold Ashanti reports “all-in sustaining costs per ounce” calculated to the nearest US dollar amount and gold sold in ounces. AngloGold Ashanti reports “total cash costs per ounce” calculated to the nearest US dollar amount and gold produced in ounces. “All-in sustaining costs per ounce” and “total cash costs per ounce” may not be calculated based on amounts presented in this table due to rounding. | ||||||||||||||
(2) Refer to Segmental reporting. | ||||||||||||||
(3) Corporate includes non-gold producing managed operations. | ||||||||||||||
(4) Total including equity-accounted non-managed joint ventures. | ||||||||||||||
(5) “Total cash costs” and “all-in sustaining costs” may not be calculated based on amounts presented in this table due to rounding. | ||||||||||||||
Rounding of figures may result in computational discrepancies. | ||||||||||||||
| 27 | Q1 2026 Earnings Release |
AngloGold Ashanti plc | |||
2026 | Quarter 1 | |
Non-GAAP Disclosure Note A continued
All-in sustaining costs | FOR THE QUARTER ENDED 31 MARCH 2026 | |||||||
AMERICAS | Projects | GROUP | ||||||
Cerro Vanguardia | AngloGold Ashanti Mineração | Americas other | Americas | Non-managed joint ventures | Managed operations | Group total (4) | ||
in US Dollar millions, except as otherwise noted | ||||||||
Cost of sales per segmental information (2) | 121 | 104 | — | 225 | — | 123 | 1,293 | 1,416 |
By-product revenue | (69) | (5) | — | (74) | — | (1) | (82) | (83) |
Amortisation of tangible, intangible and right of use assets | (18) | (23) | — | (41) | — | (20) | (291) | (311) |
Adjusted for decommissioning and inventory amortisation | 2 | — | — | 2 | — | — | 2 | 2 |
Corporate administration, marketing and related expenses | — | — | — | — | — | — | 44 | 44 |
Lease payment sustaining | — | 6 | — | 6 | 1 | 1 | 24 | 25 |
Sustaining exploration and study costs | — | — | — | — | — | — | 6 | 6 |
Total sustaining capital expenditure | 21 | 31 | — | 52 | 1 | 16 | 289 | 305 |
All-in sustaining costs (5) | 56 | 113 | — | 169 | 2 | 119 | 1,286 | 1,405 |
Gold sold - oz (000) | 50 | 64 | — | 114 | — | 69 | 650 | 719 |
All-in sustaining costs per ounce - $/oz (1) | 1,117 | 1,768 | — | 1,481 | — | 1,719 | 1,980 | 1,955 |
(1) In addition to the operational performances of the mines, “all-in sustaining costs per ounce” and “total cash costs per ounce” are affected by fluctuations in the foreign currency exchange rate. AngloGold Ashanti reports “all-in sustaining costs per ounce” calculated to the nearest US dollar amount and gold sold in ounces. AngloGold Ashanti reports “total cash costs per ounce” calculated to the nearest US dollar amount and gold produced in ounces. “All-in sustaining costs per ounce” and “total cash costs per ounce” may not be calculated based on amounts presented in this table due to rounding. | ||||||||
(2) Refer to Segmental reporting. | ||||||||
(3) Corporate includes non-gold producing managed operations. | ||||||||
(4) Total including equity-accounted non-managed joint ventures. | ||||||||
(5) “Total cash costs” and “all-in sustaining costs” may not be calculated based on amounts presented in this table due to rounding. | ||||||||
Rounding of figures may result in computational discrepancies. | ||||||||
| 28 | Q1 2026 Earnings Release |
AngloGold Ashanti plc | |||
2026 | Quarter 1 | |
Non-GAAP Disclosure Note A continued
Total cash costs | FOR THE QUARTER ENDED 31 MARCH 2026 | |||||||||||||
Corporate and other(3) | AFRICA | AUSTRALIA | ||||||||||||
Kibali - Attr. 45% | Non-managed joint ventures | Iduapriem | Obuasi | Siguiri | Geita | Sukari | Africa other | Managed operations | Sunrise Dam | Tropicana - Attr. 70% | Australia other | Australia | ||
in US Dollar millions, except as otherwise noted | ||||||||||||||
Cost of sales per segmental information (2) | — | 123 | 123 | 93 | 110 | 164 | 204 | 209 | — | 780 | 126 | 151 | 11 | 288 |
- By-product revenue | — | (1) | (1) | — | — | — | (3) | (2) | — | (5) | (1) | (2) | — | (3) |
- Inventory change | — | (13) | (13) | (1) | 7 | (7) | — | 17 | — | 16 | (1) | (2) | — | (3) |
- Amortisation of tangible assets | — | (20) | (20) | (10) | (22) | (11) | (49) | (92) | — | (184) | (17) | (30) | — | (47) |
- Amortisation of right of use assets | (1) | — | — | (2) | — | (1) | (6) | — | — | (9) | (2) | (7) | — | (9) |
- Amortisation of intangible assets | — | — | — | — | — | — | — | — | — | — | — | — | — | — |
- Rehabilitation and other non-cash costs | — | 1 | 1 | (4) | (2) | (3) | (1) | (6) | — | (16) | — | — | — | — |
- Retrenchment costs | — | — | — | — | — | — | — | — | — | — | — | — | — | — |
Total cash costs (5) | (1) | 90 | 90 | 77 | 93 | 142 | 146 | 125 | — | 583 | 106 | 110 | 11 | 227 |
Gold produced - oz (000) | — | 58 | 58 | 44 | 62 | 75 | 128 | 113 | — | 422 | 51 | 76 | — | 127 |
Total cash costs per ounce - $/oz (1) | — | 1,554 | 1,554 | 1,736 | 1,492 | 1,895 | 1,141 | 1,106 | — | 1,379 | 2,087 | 1,456 | — | 1,798 |
(1) In addition to the operational performances of the mines, “all-in sustaining costs per ounce” and “total cash costs per ounce” are affected by fluctuations in the foreign currency exchange rate. AngloGold Ashanti reports “all-in sustaining costs per ounce” calculated to the nearest US dollar amount and gold sold in ounces. AngloGold Ashanti reports “total cash costs per ounce” calculated to the nearest US dollar amount and gold produced in ounces. “All-in sustaining costs per ounce” and “total cash costs per ounce” may not be calculated based on amounts presented in this table due to rounding. | ||||||||||||||
(2) Refer to Segmental reporting. | ||||||||||||||
(3) Corporate includes non-gold producing managed operations. | ||||||||||||||
(4) Total including equity-accounted non-managed joint ventures. | ||||||||||||||
(5) “Total cash costs” and “all-in sustaining costs” may not be calculated based on amounts presented in this table due to rounding. | ||||||||||||||
Rounding of figures may result in computational discrepancies. | ||||||||||||||
| 29 | Q1 2026 Earnings Release |
AngloGold Ashanti plc | |||
2026 | Quarter 1 | |
Non-GAAP Disclosure Note A continued
Total cash costs | FOR THE QUARTER ENDED 31 MARCH 2026 | |||||||
AMERICAS | Projects | GROUP | ||||||
Cerro Vanguardia | AngloGold Ashanti Mineração | Americas other | Americas | Non-managed joint ventures | Managed operations | Group total (4) | ||
in US Dollar millions, except as otherwise noted | ||||||||
Cost of sales per segmental information (2) | 121 | 104 | — | 225 | — | 123 | 1,293 | 1,416 |
- By-product revenue | (69) | (5) | — | (74) | — | (1) | (82) | (83) |
- Inventory change | (3) | 3 | — | — | — | (13) | 13 | — |
- Amortisation of tangible assets | (18) | (19) | — | (37) | — | (20) | (268) | (288) |
- Amortisation of right of use assets | — | (4) | — | (4) | — | — | (23) | (23) |
- Amortisation of intangible assets | — | — | — | — | — | — | — | — |
- Rehabilitation and other non-cash costs | (1) | — | — | (1) | — | 1 | (17) | (16) |
- Retrenchment costs | — | — | — | — | — | — | — | — |
Total cash costs (5) | 30 | 78 | — | 108 | — | 90 | 917 | 1,007 |
Gold produced - oz (000) | 50 | 67 | — | 117 | — | 58 | 666 | 724 |
Total cash costs per ounce - $/oz (1) | 602 | 1,159 | — | 923 | — | 1,554 | 1,377 | 1,391 |
Average gold price received per ounce - $/oz | 4,918 | 4,857 | 4,863 | |||||
Total cash cost margin - % | 68% | 72% | 71% | |||||
(1) In addition to the operational performances of the mines, “all-in sustaining costs per ounce” and “total cash costs per ounce” are affected by fluctuations in the foreign currency exchange rate. AngloGold Ashanti reports “all-in sustaining costs per ounce” calculated to the nearest US dollar amount and gold sold in ounces. AngloGold Ashanti reports “total cash costs per ounce” calculated to the nearest US dollar amount and gold produced in ounces. “All-in sustaining costs per ounce” and “total cash costs per ounce” may not be calculated based on amounts presented in this table due to rounding. | ||||||||
(2) Refer to Segmental reporting. | ||||||||
(3) Corporate includes non-gold producing managed operations. | ||||||||
(4) Total including equity-accounted non-managed joint ventures. | ||||||||
(5) “Total cash costs” and “all-in sustaining costs” may not be calculated based on amounts presented in this table due to rounding. | ||||||||
Rounding of figures may result in computational discrepancies. | ||||||||
| 30 | Q1 2026 Earnings Release |
AngloGold Ashanti plc | |||
2026 | Quarter 1 | |
Non-GAAP Disclosure Note A continued
All-in sustaining costs | FOR THE QUARTER ENDED 31 MARCH 2025 | |||||||||||||
Corporate and other(3) | AFRICA | AUSTRALIA | ||||||||||||
Kibali - Attr. 45% | Non-managed joint ventures | Iduapriem | Obuasi | Siguiri | Geita | Sukari | Africa other | Managed operations | Sunrise Dam | Tropicana - Attr. 70% | Australia other | Australia | ||
in US Dollar millions, except as otherwise noted | ||||||||||||||
Cost of sales per segmental information (2) | 1 | 106 | 106 | 87 | 101 | 135 | 166 | 169 | — | 658 | 102 | 122 | 9 | 233 |
By-product revenue | — | — | — | — | — | — | (1) | (1) | — | (2) | — | (1) | — | (1) |
Amortisation of tangible, intangible and right of use assets | (1) | (21) | (21) | (27) | (20) | (15) | (38) | (67) | — | (167) | (14) | (24) | — | (38) |
Adjusted for decommissioning and inventory amortisation | — | — | — | — | — | — | — | — | — | — | — | — | — | — |
Corporate administration, marketing and related expenses | 27 | — | — | — | — | — | — | — | — | — | — | — | — | — |
Lease payment sustaining | — | — | — | 1 | — | 1 | 6 | 1 | — | 9 | 4 | 4 | 1 | 9 |
Sustaining exploration and study costs | — | — | — | 1 | — | 1 | 2 | — | — | 4 | — | — | — | — |
Total sustaining capital expenditure | — | 13 | 13 | 19 | 37 | 12 | 55 | 32 | — | 155 | 13 | 6 | — | 19 |
All-in sustaining costs (5) | 27 | 98 | 98 | 81 | 118 | 134 | 189 | 134 | — | 656 | 105 | 108 | 10 | 223 |
Gold sold - oz (000) | — | 67 | 67 | 40 | 60 | 77 | 124 | 116 | — | 417 | 60 | 76 | — | 136 |
All-in sustaining costs per ounce - $/oz (1) | — | 1,463 | 1,463 | 2,053 | 1,973 | 1,733 | 1,521 | 1,153 | — | 1,573 | 1,768 | 1,409 | — | 1,636 |
(1) In addition to the operational performances of the mines, “all-in sustaining costs per ounce” and “total cash costs per ounce” are affected by fluctuations in the foreign currency exchange rate. AngloGold Ashanti reports “all-in sustaining costs per ounce” calculated to the nearest US dollar amount and gold sold in ounces. AngloGold Ashanti reports “total cash costs per ounce” calculated to the nearest US dollar amount and gold produced in ounces. “All-in sustaining costs per ounce” and “total cash costs per ounce” may not be calculated based on amounts presented in this table due to rounding. | ||||||||||||||
(2) Refer to Segmental reporting. | ||||||||||||||
(3) Corporate includes non-gold producing managed operations. | ||||||||||||||
(4) Total including equity-accounted non-managed joint ventures. | ||||||||||||||
(5) “Total cash costs” and “all-in sustaining costs” may not be calculated based on amounts presented in this table due to rounding. | ||||||||||||||
Rounding of figures may result in computational discrepancies. | ||||||||||||||
| 31 | Q1 2026 Earnings Release |
AngloGold Ashanti plc | |||
2026 | Quarter 1 | |
Non-GAAP Disclosure Note A continued
All-in sustaining costs | FOR THE QUARTER ENDED 31 MARCH 2025 | ||||||||
AMERICAS | Projects | GROUP | |||||||
Cerro Vanguardia | AngloGold Ashanti Mineração | Serra Grande(6) | Americas other | Americas | Non-managed joint ventures | Managed operations | Group total (4) | ||
in US Dollar millions, except as otherwise noted | |||||||||
Cost of sales per segmental information (2) | 111 | 85 | 36 | — | 232 | — | 106 | 1,124 | 1,230 |
By-product revenue | (30) | (3) | — | — | (33) | — | — | (36) | (36) |
Amortisation of tangible, intangible and right of use assets | (16) | (22) | (11) | — | (49) | — | (21) | (255) | (276) |
Adjusted for decommissioning and inventory amortisation | (2) | — | — | — | (2) | — | — | (2) | (2) |
Corporate administration, marketing and related expenses | — | — | — | — | — | — | — | 27 | 27 |
Lease payment sustaining | — | 6 | 2 | — | 8 | — | — | 26 | 26 |
Sustaining exploration and study costs | — | — | — | — | — | 1 | — | 5 | 5 |
Total sustaining capital expenditure | 15 | 25 | 8 | — | 48 | 1 | 13 | 223 | 236 |
All-in sustaining costs (5) | 77 | 90 | 35 | 1 | 203 | 2 | 98 | 1,111 | 1,209 |
Gold sold - oz (000) | 49 | 58 | 10 | — | 117 | — | 67 | 670 | 737 |
All-in sustaining costs per ounce - $/oz (1) | 1,577 | 1,544 | 3,403 | — | 1,731 | — | 1,463 | 1,657 | 1,640 |
(1) In addition to the operational performances of the mines, “all-in sustaining costs per ounce” and “total cash costs per ounce” are affected by fluctuations in the foreign currency exchange rate. AngloGold Ashanti reports “all-in sustaining costs per ounce” calculated to the nearest US dollar amount and gold sold in ounces. AngloGold Ashanti reports “total cash costs per ounce” calculated to the nearest US dollar amount and gold produced in ounces. “All-in sustaining costs per ounce” and “total cash costs per ounce” may not be calculated based on amounts presented in this table due to rounding. | |||||||||
(2) Refer to Segmental reporting. | |||||||||
(3) Corporate includes non-gold producing managed operations. | |||||||||
(4) Total including equity-accounted non-managed joint ventures. | |||||||||
(5) “Total cash costs” and “all-in sustaining costs” may not be calculated based on amounts presented in this table due to rounding. | |||||||||
(6) Serra Grande was sold on 1 December 2025. | |||||||||
Rounding of figures may result in computational discrepancies. | |||||||||
| 32 | Q1 2026 Earnings Release |
AngloGold Ashanti plc | |||
2026 | Quarter 1 | |
Non-GAAP Disclosure Note A continued
Total cash costs | FOR THE QUARTER ENDED 31 MARCH 2025 | |||||||||||||
Corporate and other(3) | AFRICA | AUSTRALIA | ||||||||||||
Kibali - Attr. 45% | Non-managed joint ventures | Iduapriem | Obuasi | Siguiri | Geita | Sukari | Africa other | Managed operations | Sunrise Dam | Tropicana - Attr. 70% | Australia other | Australia | ||
in US Dollar millions, except as otherwise noted | ||||||||||||||
Cost of sales per segmental information (2) | 1 | 106 | 106 | 87 | 101 | 135 | 166 | 169 | — | 658 | 102 | 122 | 9 | 233 |
- By-product revenue | — | — | — | — | — | — | (1) | (1) | — | (2) | — | (1) | — | (1) |
- Inventory change | — | (1) | (1) | 3 | (10) | 2 | (9) | (4) | — | (18) | 2 | — | — | 2 |
- Amortisation of tangible assets | (1) | (21) | (21) | (26) | (20) | (14) | (32) | (66) | — | (158) | (10) | (19) | — | (29) |
- Amortisation of right of use assets | — | — | — | (1) | — | (1) | (6) | (1) | — | (9) | (4) | (5) | — | (9) |
- Amortisation of intangible assets | — | — | — | — | — | — | — | — | — | — | — | — | — | — |
- Rehabilitation and other non-cash costs | — | 1 | 1 | (3) | (2) | (1) | — | — | — | (6) | — | — | — | — |
- Retrenchment costs | — | — | — | — | — | — | — | — | — | — | — | — | — | — |
Total cash costs (5) | — | 84 | 84 | 60 | 69 | 122 | 118 | 97 | — | 466 | 91 | 97 | 9 | 197 |
Gold produced - oz (000) | — | 63 | 63 | 40 | 54 | 80 | 116 | 117 | — | 407 | 61 | 74 | — | 135 |
Total cash costs per ounce - $/oz (1) | — | 1,325 | 1,325 | 1,493 | 1,284 | 1,521 | 1,021 | 826 | — | 1,144 | 1,479 | 1,317 | — | 1,456 |
(1) In addition to the operational performances of the mines, “all-in sustaining costs per ounce” and “total cash costs per ounce” are affected by fluctuations in the foreign currency exchange rate. AngloGold Ashanti reports “all-in sustaining costs per ounce” calculated to the nearest US dollar amount and gold sold in ounces. AngloGold Ashanti reports “total cash costs per ounce” calculated to the nearest US dollar amount and gold produced in ounces. “All-in sustaining costs per ounce” and “total cash costs per ounce” may not be calculated based on amounts presented in this table due to rounding. | ||||||||||||||
(2) Refer to Segmental reporting. | ||||||||||||||
(3) Corporate includes non-gold producing managed operations. | ||||||||||||||
(4) Total including equity-accounted non-managed joint ventures. | ||||||||||||||
(5) “Total cash costs” and “all-in sustaining costs” may not be calculated based on amounts presented in this table due to rounding. | ||||||||||||||
Rounding of figures may result in computational discrepancies. | ||||||||||||||
| 33 | Q1 2026 Earnings Release |
AngloGold Ashanti plc | |||
2026 | Quarter 1 | |
Non-GAAP Disclosure Note A continued
Total cash costs | FOR THE QUARTER ENDED 31 MARCH 2025 | ||||||||
AMERICAS | Projects | GROUP | |||||||
Cerro Vanguardia | AngloGold Ashanti Mineração | Serra Grande(6) | Americas other | Americas | Non-managed joint ventures | Managed operations | Group total (4) | ||
in US Dollar millions, except as otherwise noted | |||||||||
Cost of sales per segmental information (2) | 111 | 85 | 36 | — | 232 | — | 106 | 1,124 | 1,230 |
- By-product revenue | (30) | (3) | — | — | (33) | — | — | (36) | (36) |
- Inventory change | (5) | — | — | — | (5) | — | (1) | (21) | (22) |
- Amortisation of tangible assets | (16) | (17) | (10) | — | (43) | — | (21) | (231) | (252) |
- Amortisation of right of use assets | — | (5) | (1) | — | (6) | — | — | (24) | (24) |
- Amortisation of intangible assets | — | — | — | — | — | — | — | — | — |
- Rehabilitation and other non-cash costs | (3) | (7) | 1 | — | (9) | — | 1 | (15) | (14) |
- Retrenchment costs | (1) | — | — | — | (1) | — | — | (1) | (1) |
Total cash costs (5) | 56 | 52 | 25 | 1 | 134 | — | 84 | 797 | 881 |
Gold produced - oz (000) | 47 | 58 | 10 | — | 115 | — | 63 | 657 | 720 |
Total cash costs per ounce - $/oz (1) | 1,201 | 897 | 2,485 | — | 1,170 | — | 1,325 | 1,213 | 1,223 |
Average gold price received per ounce - $/oz | 2,865 | 2,875 | 2,874 | ||||||
Total cash cost margin - % | 54% | 58% | 57% | ||||||
(1) In addition to the operational performances of the mines, “all-in sustaining costs per ounce” and “total cash costs per ounce” are affected by fluctuations in the foreign currency exchange rate. AngloGold Ashanti reports “all-in sustaining costs per ounce” calculated to the nearest US dollar amount and gold sold in ounces. AngloGold Ashanti reports “total cash costs per ounce” calculated to the nearest US dollar amount and gold produced in ounces. “All-in sustaining costs per ounce” and “total cash costs per ounce” may not be calculated based on amounts presented in this table due to rounding. | |||||||||
(2) Refer to Segmental reporting. | |||||||||
(3) Corporate includes non-gold producing managed operations. | |||||||||
(4) Total including equity-accounted non-managed joint ventures. | |||||||||
(5) “Total cash costs” and “all-in sustaining costs” may not be calculated based on amounts presented in this table due to rounding. | |||||||||
(6) Serra Grande was sold on 1 December 2025. | |||||||||
Rounding of figures may result in computational discrepancies. | |||||||||
| 34 | Q1 2026 Earnings Release |
AngloGold Ashanti plc | |||
2026 | Quarter 1 | |
Non-GAAP Disclosure Note B
Quarter 1 | 2026 and 2025
Average gold price received per ounce | Quarter | Quarter | |||||
ended | ended | ||||||
Mar | Mar | ||||||
2026 | 2025 | ||||||
Unaudited | Unaudited | ||||||
US Dollar millions, except as otherwise noted | Managed operations | Non- managed joint ventures | Group (Equity) | Managed operations | Non- managed joint ventures | Group (Equity) | |
Gold income per income statement | 3,154 | 341 | 3,154 | 1,927 | 191 | 1,927 | |
Associates’ and joint ventures’ share of gold income | 341 | 191 | |||||
Gold income | 3,154 | 341 | 3,495 | 1,927 | 191 | 2,118 | |
Gold sold (oz 000) (1) | 650 | 69 | 719 | 670 | 67 | 737 | |
Average gold price received per ounce - $/oz | 4,857 | 4,918 | 4,863 | 2,875 | 2,865 | 2,874 | |
(1) Includes Q1 2025 gold sold of 10,000oz for the Serra Grande operation, which was sold on 1 December 2025. | |||||||
Rounding of figures may result in computational discrepancies. | |||||||
| 35 | Q1 2026 Earnings Release |
AngloGold Ashanti plc | |||
2026 | Quarter 1 | |
Non-GAAP Disclosure Note C
Quarter 1 | 2026 and 2025
Capital expenditure | FOR THE QUARTER ENDED 31 MARCH 2026 | |||||||||||||
Corporate and other | AFRICA | AUSTRALIA | ||||||||||||
Kibali - Attr. 45% | Non-managed joint ventures | Iduapriem | Obuasi | Siguiri | Geita | Sukari | Africa other | Managed operations | Sunrise Dam | Tropicana - Attr.70% | Australia other | Australia | ||
in US Dollar millions, except as otherwise noted | ||||||||||||||
Sustaining capital expenditure | — | 16 | 16 | 39 | 42 | 31 | 67 | 30 | — | 209 | 16 | 11 | — | 27 |
Non-sustaining capital expenditure | — | 23 | 23 | 3 | 16 | 35 | 3 | 37 | — | 94 | 4 | 7 | — | 11 |
Capital expenditure | — | 39 | 39 | 42 | 58 | 66 | 70 | 67 | — | 303 | 20 | 18 | — | 38 |
Capital expenditure | AMERICAS | Projects | GROUP | |||||
Cerro Vanguardia | AngloGold Ashanti Mineração | Americas other | Americas | Non-managed joint ventures | Managed operations | Group total (1) | ||
in US Dollar millions, except as otherwise noted | ||||||||
Sustaining capital expenditure | 21 | 31 | — | 52 | 1 | 16 | 289 | 305 |
Non-sustaining capital expenditure | — | 2 | — | 2 | 32 | 23 | 139 | 162 |
Capital expenditure | 21 | 33 | — | 54 | 33 | 39 | 428 | 467 |
Capital expenditure | FOR THE QUARTER ENDED 31 MARCH 2025 | |||||||||||||
Corporate and other | AFRICA | AUSTRALIA | ||||||||||||
Kibali - Attr. 45% | Non-managed joint ventures | Iduapriem | Obuasi | Siguiri | Geita | Sukari | Africa other | Managed operations | Sunrise Dam | Tropicana - Attr. 70% | Australia other | Australia | ||
in US Dollar millions, except as otherwise noted | ||||||||||||||
Sustaining capital expenditure | — | 13 | 13 | 19 | 37 | 12 | 55 | 32 | — | 155 | 13 | 6 | — | 19 |
Non-sustaining capital expenditure | — | 20 | 20 | 16 | 5 | — | 5 | 27 | — | 53 | — | 10 | — | 10 |
Capital expenditure | — | 33 | 33 | 35 | 42 | 12 | 60 | 59 | — | 208 | 13 | 16 | — | 29 |
Capital expenditure | AMERICAS | Projects | GROUP | ||||||
Cerro Vanguardia | AngloGold Ashanti Mineração | Serra Grande(2) | Americas other | Americas | Non-managed joint ventures | Managed operations | Group total (1) | ||
in US Dollar millions, except as otherwise noted | |||||||||
Sustaining capital expenditure | 15 | 25 | 8 | — | 48 | 1 | 13 | 223 | 236 |
Non-sustaining capital expenditure | — | — | — | — | — | 17 | 20 | 80 | 100 |
Capital expenditure | 15 | 25 | 8 | — | 48 | 18 | 33 | 303 | 336 |
(1)Total including equity-accounted non-managed joint ventures.
(2)Serra Grande was sold on 1 December 2025.
Rounding of figures may result in computational discrepancies.
| 36 | Q1 2026 Earnings Release |
AngloGold Ashanti plc | |||
2026 | Quarter 1 | |
Non-GAAP Disclosure Note D
EBITDA | Quarter | Quarter |
ended | ended | |
Mar | Mar | |
2026 | 2025 | |
US Dollar millions, except as otherwise noted | Unaudited | Unaudited |
EBITDA | ||
Profit for the period | 1,462 | 542 |
Add back: | ||
Finance costs and unwinding of obligations | 90 | 41 |
Finance income | (37) | (32) |
Taxation | 487 | 187 |
Amortisation of tangible, right of use and intangible assets | 291 | 255 |
Other amortisation | (2) | 3 |
EBITDA | 2,291 | 996 |
Rounding of figures may result in computational discrepancies. | ||
| 37 | Q1 2026 Earnings Release |
AngloGold Ashanti plc | |||
2026 | Quarter 1 | |
Non-GAAP Disclosure Note E
Net debt (cash) | As at | As at | As at | ||
Mar | Mar | Dec | |||
2026 | 2025 | 2025 | |||
US Dollar millions, except as otherwise noted | Unaudited | Unaudited | Unaudited | ||
Borrowings - non-current portion | 2,020 | 1,926 | 2,025 | ||
Borrowings - current portion | 30 | 88 | 19 | ||
Lease liabilities - non-current portion | 154 | 129 | 155 | ||
Lease liabilities - current portion | 53 | 70 | 59 | ||
Total borrowings | 2,257 | 2,213 | 2,258 | ||
Less cash and cash equivalents, net of bank overdraft | (3,125) | (1,458) | (2,882) | ||
Net debt (cash) | (868) | 755 | (624) | ||
Net debt (cash) to EBITDA ratio | (0.13) :1 | 0.22:1 | (0.11):1 | ||
Total borrowings to profit for the period | 0.55:1 | 1.44:1 | 0.71:1 | ||
Rounding of figures may result in computational discrepancies. | |||||
| 38 | Q1 2026 Earnings Release |
AngloGold Ashanti plc | |||
2026 | Quarter 1 | |
Non-GAAP Disclosure Note F
Free cash flow | Quarter | Quarter | ||
ended | ended | |||
Mar | Mar | |||
2026 | 2025 | |||
US Dollar millions, except as otherwise noted | Unaudited | Unaudited | ||
Net cash flow from operating activities (1) | 1,709 | 725 | ||
Repayment of loans advanced to joint ventures | 50 | 60 | ||
Distributions to non-controlling interests | (162) | (79) | ||
Operating cash flow | 1,597 | 706 | ||
Capital expenditure on tangible and intangible assets | (428) | (303) | ||
Free cash flow | 1,169 | 403 | ||
(1) Includes working capital movements as per table below. | ||||
(Increase) decrease in inventories | (8) | — | ||
(Increase) decrease in trade receivables | (72) | (42) | ||
(Decrease) increase in trade payables | (37) | (127) | ||
Movement in working capital | (117) | (169) | ||
Rounding of figures may result in computational discrepancies. | ||||
| 39 | Q1 2026 Earnings Release |
AngloGold Ashanti plc | |||
2026 | Quarter 1 | |
Other Information Exchange Rates
Exchange Rates | Mar | Mar | Dec | |
2026 | 2025 | 2025 | ||
Unaudited | Unaudited | Unaudited | ||
ZAR/USD | ||||
Average for the year to date | 16.34 | 18.47 | 17.86 | |
Average for the quarter | 16.34 | 18.47 | 17.10 | |
Closing | 16.93 | 18.30 | 16.56 | |
AUD/USD | ||||
Average for the year to date | 1.44 | 1.59 | 1.55 | |
Average for the quarter | 1.44 | 1.59 | 1.52 | |
Closing | 1.45 | 1.60 | 1.50 | |
BRL/USD | ||||
Average for the year to date | 5.26 | 5.85 | 5.59 | |
Average for the quarter | 5.26 | 5.85 | 5.39 | |
Closing | 5.22 | 5.74 | 5.50 | |
ARS/USD | ||||
Average for the year to date | 1,417.69 | 1,056.67 | 1,246.73 | |
Average for the quarter | 1,417.69 | 1,056.67 | 1,436.37 | |
Closing | 1,382.76 | 1,073.88 | 1,459.42 | |
EGP/USD | ||||
Average for the year to date | 48.82 | 50.47 | 49.19 | |
Average for the quarter | 48.82 | 50.47 | 47.45 | |
Closing | 54.48 | 50.52 | 47.65 | |
| 40 | Q1 2026 Earnings Release |
AngloGold Ashanti plc | |||
2026 | Quarter 1 | |
Operating Results Operations at a glance
Quarter 1 | 2026 and 2025
Operations at a glance | FOR THE QUARTERS ENDED 31 MARCH 2026 AND 31 MARCH 2025 | |||||||||||||||
Gold production oz (000) | Open pit treated 000 tonnes | Underground milled / treated 000 tonnes | Other milled / treated 000 tonnes | Open pit recovered grade g/tonne | Underground recovered grade g/tonne | Other recovered grade g/tonne | Total recovered grade g/tonne | |||||||||
Mar-26 | Mar-25 | Mar-26 | Mar-25 | Mar-26 | Mar-25 | Mar-26 | Mar-25 | Mar-26 | Mar-25 | Mar-26 | Mar-25 | Mar-26 | Mar-25 | Mar-26 | Mar-25 | |
AFRICA Non-managed joint ventures | 58 | 63 | 910 | 607 | 274 | 323 | — | — | 0.70 | 0.85 | 4.28 | 4.50 | — | — | 1.52 | 2.12 |
Kibali - Attr. 45% (1) | 58 | 63 | 910 | 607 | 274 | 323 | — | — | 0.70 | 0.85 | 4.28 | 4.50 | — | — | 1.52 | 2.12 |
AFRICA Managed operations | 422 | 407 | 7,324 | 6,901 | 1,422 | 1,159 | 699 | 111 | 1.02 | 1.00 | 3.87 | 4.68 | 0.31 | 0.39 | 1.39 | 1.55 |
Iduapriem | 44 | 40 | 1,393 | 999 | — | — | — | — | 0.98 | 1.26 | — | — | — | — | 0.98 | 1.26 |
Obuasi | 62 | 54 | — | — | 353 | 282 | — | — | — | — | 5.48 | 5.95 | — | — | 5.48 | 5.95 |
Siguiri (3) | 75 | 80 | 2,669 | 2,947 | — | — | — | — | 0.88 | 0.84 | — | — | — | — | 0.88 | 0.84 |
Geita | 128 | 116 | 595 | 521 | 756 | 605 | — | — | 2.25 | 1.88 | 3.50 | 4.34 | — | — | 2.95 | 3.20 |
Sukari (3) | 113 | 117 | 2,667 | 2,434 | 313 | 272 | 699 | 111 | 0.89 | 0.91 | 2.95 | 4.12 | 0.31 | 0.39 | 0.95 | 1.30 |
AUSTRALIA | 127 | 135 | 1,686 | 1,550 | 796 | 928 | — | — | 1.24 | 1.22 | 2.32 | 2.49 | — | — | 1.58 | 1.69 |
Sunrise Dam | 51 | 61 | 449 | 308 | 480 | 640 | — | — | 1.24 | 1.36 | 2.13 | 2.31 | — | — | 1.70 | 2.00 |
Tropicana - Attr. 70% | 76 | 74 | 1,237 | 1,242 | 316 | 288 | — | — | 1.24 | 1.18 | 2.61 | 2.88 | — | — | 1.52 | 1.50 |
AMERICAS | 117 | 115 | 179 | 186 | 459 | 627 | 525 | 520 | 2.91 | 2.49 | 4.88 | 4.47 | 1.68 | 0.58 | 3.13 | 2.68 |
Cerro Vanguardia (3) | 50 | 47 | 179 | 184 | 134 | 133 | 408 | 520 | 2.91 | 2.50 | 5.31 | 5.23 | 0.77 | 0.58 | 2.15 | 1.74 |
AngloGold Ashanti Mineração (2) | 67 | 58 | — | — | 325 | 331 | 117 | — | — | — | 4.70 | 5.43 | 4.84 | — | 4.74 | 5.43 |
Serra Grande (4) | — | 10 | — | 2 | — | 163 | — | — | — | 1.17 | — | 1.92 | — | — | — | 1.91 |
Managed operations | 666 | 657 | 9,189 | 8,637 | 2,677 | 2,714 | 1,224 | 631 | 1.09 | 1.07 | 3.58 | 3.88 | 0.90 | 0.55 | 1.58 | 1.71 |
Non-managed joint ventures | 58 | 63 | 910 | 607 | 274 | 323 | — | — | 0.70 | 0.85 | 4.28 | 4.50 | — | — | 1.52 | 2.12 |
Group total including equity-accounted non- managed joint ventures | 724 | 720 | 10,099 | 9,244 | 2,951 | 3,037 | 1,224 | 631 | 1.06 | 1.06 | 3.65 | 3.95 | 0.90 | 0.55 | 1.58 | 1.74 |
(1) Equity-accounted joint venture. | ||||||||||||||||
(2) Includes gold concentrate from the Cuiabá mine sold to third parties. | ||||||||||||||||
(3) On a consolidated basis. Siguiri, Sukari and Cerro Vanguardia are owned 85%, 50% and 92.50% by AngloGold Ashanti, respectively. | ||||||||||||||||
(4) Serra Grande was sold on 1 December 2025. | ||||||||||||||||
Rounding of figures may result in computational discrepancies. | ||||||||||||||||
| 41 | Q1 2026 Earnings Release |
AngloGold Ashanti plc | |||
2026 | Quarter 1 | |
Financial Results Operations at a glance
Quarter 1 | 2026 and 2025
Operations at a glance | FOR THE QUARTERS ENDED 31 MARCH 2026 AND 31 MARCH 2025 | |||||||||||||
Cost of sales | Gross profit | Total cash costs per ounce* | All-in sustaining costs per ounce* | Sustaining MRD / Stripping capital | Other sustaining capital | Non-sustaining capital* | ||||||||
$m | $m | $/oz | $/oz | $m | $m | $m | ||||||||
Mar-26 | Mar-25 | Mar-26 | Mar-25 | Mar-26 | Mar-25 | Mar-26 | Mar-25 | Mar-26 | Mar-25 | Mar-26 | Mar-25 | Mar-26 | Mar-25 | |
AFRICA Non-managed joint ventures | 123 | 106 | 219 | 86 | 1,554 | 1,325 | 1,719 | 1,463 | 6 | 6 | 10 | 7 | 23 | 20 |
Kibali - Attr. 45% (1) | 123 | 106 | 219 | 86 | 1,554 | 1,325 | 1,719 | 1,463 | 6 | 6 | 10 | 7 | 23 | 20 |
AFRICA Managed operations | 780 | 658 | 1,205 | 542 | 1,379 | 1,144 | 1,980 | 1,573 | 109 | 95 | 100 | 60 | 94 | 53 |
Iduapriem | 93 | 87 | 124 | 27 | 1,736 | 1,493 | 2,737 | 2,053 | 34 | 15 | 5 | 4 | 3 | 16 |
Obuasi | 110 | 101 | 174 | 70 | 1,492 | 1,284 | 2,210 | 1,973 | 26 | 28 | 16 | 9 | 16 | 5 |
Siguiri (3) | 164 | 135 | 213 | 86 | 1,895 | 1,521 | 2,391 | 1,733 | 11 | 7 | 20 | 5 | 35 | — |
Geita | 204 | 166 | 402 | 197 | 1,141 | 1,021 | 1,797 | 1,521 | 28 | 35 | 39 | 20 | 3 | 5 |
Sukari (3) | 209 | 169 | 292 | 162 | 1,106 | 826 | 1,421 | 1,153 | 10 | 10 | 20 | 22 | 37 | 27 |
Administration and other | — | — | — | — | — | — | — | — | — | — | — | — | — | — |
AUSTRALIA | 288 | 233 | 338 | 155 | 1,798 | 1,456 | 2,070 | 1,636 | 16 | 8 | 11 | 11 | 11 | 10 |
Sunrise Dam | 126 | 102 | 122 | 68 | 2,087 | 1,479 | 2,438 | 1,768 | 9 | 5 | 7 | 8 | 4 | — |
Tropicana - Attr. 70% | 151 | 122 | 227 | 97 | 1,456 | 1,317 | 1,674 | 1,409 | 7 | 3 | 4 | 3 | 7 | 10 |
Administration and other | 11 | 9 | (11) | (10) | — | — | — | — | — | — | — | — | — | — |
AMERICAS | 225 | 232 | 400 | 143 | 923 | 1,170 | 1,481 | 1,731 | 35 | 36 | 17 | 12 | 2 | — |
Cerro Vanguardia (3) | 121 | 111 | 196 | 62 | 602 | 1,201 | 1,117 | 1,577 | 14 | 7 | 7 | 8 | — | — |
AngloGold Ashanti Mineração (2) | 104 | 85 | 204 | 88 | 1,159 | 897 | 1,768 | 1,544 | 21 | 22 | 10 | 3 | 2 | — |
Serra Grande (4) | — | 36 | — | (6) | — | 2,485 | — | 3,403 | — | 7 | — | 1 | — | — |
Administration and other | — | — | — | (1) | — | — | — | — | — | — | — | — | — | — |
PROJECTS | — | — | — | — | — | — | — | — | — | — | 1 | 1 | 32 | 17 |
Colombian projects | — | — | — | — | — | — | — | — | — | — | — | — | 1 | 10 |
North American projects | — | — | — | — | — | — | — | — | — | — | 1 | 1 | 31 | 7 |
CORPORATE AND OTHER | — | 1 | — | (1) | — | — | — | — | — | — | — | — | — | — |
Managed operations | 1,293 | 1,124 | 1,943 | 839 | 1,377 | 1,213 | 1,980 | 1,657 | 160 | 139 | 129 | 84 | 139 | 80 |
Non-managed joint ventures | 123 | 106 | 219 | 86 | 1,554 | 1,325 | 1,719 | 1,463 | 6 | 6 | 10 | 7 | 23 | 20 |
Group total including equity-accounted non- managed joint ventures | 1,416 | 1,230 | 2,162 | 925 | 1,391 | 1,223 | 1,955 | 1,640 | 166 | 145 | 139 | 91 | 162 | 100 |
(1) Equity-accounted joint venture. | ||||||||||||||
(2) Includes gold concentrate from the Cuiabá mine sold to third parties. | ||||||||||||||
(3) On a consolidated basis. Siguiri, Sukari and Cerro Vanguardia are owned 85%, 50% and 92.50% by AngloGold Ashanti, respectively. | ||||||||||||||
(4) Serra Grande was sold on 1 December 2025. | ||||||||||||||
* Refer to “Non-GAAP disclosure” for definitions and reconciliations. | ||||||||||||||
Rounding of figures may result in computational discrepancies. | ||||||||||||||
| 42 | Q1 2026 Earnings Release |
AngloGold Ashanti plc | |||
2026 | Quarter 1 | |
Administration and Corporate Information
AngloGold Ashanti plc Incorporated in England & Wales Registration No. 14654651 LEI No. 2138005YDSA7A82RNU96 Share codes: ISIN: GB00BRXH2664 CUSIP: G0378L100 NYSE: AU JSE: ANG A2X: ANG GhSE (Shares): AGA GhSE (GhDS): AAD JSE Sponsor: The Standard Bank of South Africa Limited Auditors: PricewaterhouseCoopers Inc. PricewaterhouseCoopers LLP Offices Registered and Corporate Third Floor, Hobhouse Court Suffolk Street London SW1Y 4HH United Kingdom Telephone: +44 (0) 203 968 3320 Global headquarters 6363 S. Fiddlers Green Circle, Suite 1000 Greenwood Village, CO 80111 United States of America Telephone: +1 303 889 0700 Australia Level 10, AMP Building, 140 St George’s Terrace Perth, WA 6000 (PO Box Z5046, Perth WA 6831) Australia Telephone: +61 8 9425 4602 South Africa 112 Oxford Road Houghton Estate, Johannesburg, 2198 (Private Bag X 20, Rosebank, 2196) South Africa Telephone: +27 11 637 6000 Fax: +27 11 637 6624 Ghana Gold House Patrice Lumumba Road (PO Box 2665) Accra Ghana Telephone: +233 303 773400 Fax: +233 303 778155 | Directors Executive Alberto Calderon (Chief Executive Officer) Gillian Doran (Chief Financial Officer) Non-Executive Jochen Tilk (Chair) Kojo Busia Bruce Cleaver Alan Ferguson Albert Garner Jinhee Magie Nicky Newton-King Marcus Randolph Diana Sands Company Secretary Catherine Stead Company secretarial e-mail companysecretary@anglogoldashanti.com Investor Relations contacts Yatish Chowthee Telephone: +27 11 637 6273 Mobile: +27 78 364 2080 E-mail: yrchowthee@aga.gold Andrea Maxey Telephone: +61 08 9425 4603 Mobile: +61 400 072 199 E-mail: amaxey@aga.gold AngloGold Ashanti website www.anglogoldashanti.com | Share Registrars United States Computershare Trust Company, N.A. 150 Royall Street Suite 101 Canton, MA 02021 United States of America Telephone US: 866-644-4127 Telephone non-US: +1-781-575-2906 Shareholder Online inquiries: https://www-us.computershare.com/Investor/ #Contact Website: www.computershare.com/ AngloGoldAshanti South Africa Computershare Investor Services (Pty) Limited Rosebank Towers, 15 Biermann Avenue Rosebank, 2196 (PO Box 61051, Marshalltown 2107) South Africa Telephone: 0861 100 950 (in SA) Fax: +27 11 688 5218 E-mail: queries@computershare.co.za Website: www.computershare.com Ghana Central Securities Depository (GH) LTD 4th Floor, Cedi House PMB CT 465, Cantonments Accra, Ghana Telephone: +233 302 689313 Fax: +233 302 689315 Ghana depositary NTHC Limited 18 Gamel Abdul Nasser Avenue Ringway Estate Accra, Ghana Telephone: +233 302 235814/6 Fax: +233 302 229975 |

AngloGold Ashanti posts information that may be important to investors on the main page of its website at
www.anglogoldashanti.com and under the “Investors” tab on the main page. This information is updated
periodically. AngloGold Ashanti intends to use its website as a means of disclosing material non-public
information to the public in a broad, non-exclusionary manner and for complying with its disclosure obligations.
Accordingly, investors should visit this website regularly to obtain important information about AngloGold
Ashanti, in addition to following its press releases, documents it files with, or furnishes to, the United States
Securities and Exchange Commission (SEC) and public conference calls and webcasts. No material on the
AngloGold Ashanti website forms any part of, or is incorporated by reference into, this document. References
herein to the AngloGold Ashanti website shall not be deemed to cause such incorporation.
PUBLISHED BY ANGLOGOLD ASHANTI
Forward-looking statements
Certain statements contained in this document, other than statements of historical fact, including, without limitation, those concerning the economic outlook for the gold mining industry, expectations
regarding gold prices, production, mine life, total cash costs, all-in sustaining costs, cost savings and other operating results, return on equity, productivity improvements, growth prospects,
preliminary financial and production metrics for in-process projects, the ability to convert Mineral Resource into Mineral Reserve and replace Mineral Reserves net of depletion from production and
outlook of AngloGold Ashanti’s operations, individually or in the aggregate, including the achievement of project milestones, commencement and completion of commercial operations of certain of
AngloGold Ashanti’s exploration and production projects and the completion of acquisitions, dispositions or joint venture transactions, AngloGold Ashanti’s liquidity and capital resources and capital
expenditures and the outcome and consequences of any potential or pending litigation or regulatory proceedings or environmental, health and safety issues, are forward-looking statements
regarding AngloGold Ashanti’s financial reports, operations, economic performance and financial condition. These forward-looking statements or forecasts are not based on historical facts, but
rather reflect our current beliefs and expectations concerning future events and generally may be identified by the use of forward-looking words, phrases and expressions such as “believe”,
“expect”, “aim”, “anticipate”, “intend”, “foresee”, “forecast”, “predict”, “project”, “estimate”, “likely”, “may”, “might”, “could”, “should”, “would”, “seek”, “plan”, “scheduled”, “possible”, “continue”,
“potential”, “outlook”, “target” or other similar words, phrases, and expressions; provided that the absence thereof does not mean that a statement is not forward-looking. Similarly, statements that
describe our objectives, plans or goals are or may be forward-looking statements. These forward-looking statements or forecasts involve known and unknown risks, uncertainties and other factors
that may cause AngloGold Ashanti’s actual results, performance, actions or achievements to differ materially from the anticipated results, performance, actions or achievements expressed or implied
in these forward-looking statements. Although AngloGold Ashanti believes that the expectations reflected in such forward-looking statements and forecasts are reasonable, no assurance can be
given that such expectations will prove to have been correct. Accordingly, results, performance, actions or achievements could differ materially from those set out in the forward-looking statements
as a result of, among other factors, changes in economic, social, political and market conditions, including related to inflation or international conflicts, the success of business and operating
initiatives, changes in the regulatory environment and other government actions, including environmental approvals, fluctuations in gold prices and exchange rates, the outcome of pending or future
litigation proceedings, any supply chain disruptions, any public health crises, pandemics or epidemics, the failure to maintain effective internal control over financial reporting or effective disclosure
controls and procedures, the inability to remediate one or more material weaknesses, or the discovery of additional material weaknesses, in the Company’s internal control over financial reporting,
and other business and operational risks and challenges and other factors, including mining accidents. For a discussion of such risk factors, refer to AngloGold Ashanti’s annual report on Form 20-F
for the financial year ended 31 December 2025 filed with the United States Securities and Exchange Commission (SEC). These factors are not necessarily all of the important factors that could
cause AngloGold Ashanti’s actual results, performance, actions or achievements to differ materially from those expressed in any forward-looking statements. Other unknown or unpredictable factors
could also have material adverse effects on AngloGold Ashanti’s future results, performance, actions or achievements. Consequently, readers are cautioned not to place undue reliance on forward-
looking statements. AngloGold Ashanti undertakes no obligation to update publicly or release any revisions to these forward-looking statements to reflect events or circumstances after the date
hereof or to reflect the occurrence of unanticipated events, except to the extent required by applicable law. All subsequent written or oral forward-looking statements attributable to AngloGold
Ashanti or any person acting on its behalf are qualified by the cautionary statements herein.
Non-GAAP financial measures
This communication may contain certain “Non-GAAP” financial measures. AngloGold Ashanti utilises certain Non-GAAP performance measures and ratios in managing its business. Non-GAAP
financial measures should be viewed in addition to, and not as an alternative for, the reported operating results or cash flow from operations or any other measures of performance prepared in
accordance with IFRS. In addition, the presentation of these measures may not be comparable to similarly titled measures other companies may use.
SIGNATURES
Pursuant to the requirements of the Securities Exchange Act of 1934, the registrant has duly
caused this report to be signed on its behalf by the undersigned, thereunto duly authorised.
AngloGold Ashanti plc
Date: 08 May 2026
By:/s/ C STEAD
Name:C Stead
Title:Company Secretary