
1
Interim Financial Report 2026
For the period 1 January to 30 June 2026
Cadeler A/S. Incorporated in Denmark. Registration Number (CVR no.): 3118 0503
Kalvebod Brygge 43, DK-1560 Copenhagen V, Denmark


2
Contents


4
Statement from the CEO
The first half of 2026 demonstrated the strength of the business Cadeler
has built through disciplined investment and consistent execution.
Cadeler delivered a strong financial performance with revenue of
EUR 408 million and EBITDA of EUR 208 million, while continuing to
execute complex offshore wind projects across multiple markets. As
our customers place increasing emphasis on the resilience of their
supply chain, the first six months of the year demonstrated that
Cadeler's fleet strategy is delivering as intended, providing the
flexibility, reliability and operational capability required to support
the next phase of offshore wind development.
Demonstrating the strength of our fleet strategy
The first half of 2026 has been defined by execution.
During the period, Cadeler successfully mobilised and remobilised
vessels across multiple installation campaigns, providing customers
with alternative solutions where project requirements changed, and
helping to maintain project momentum. These operations
demonstrated the flexibility of our expanded fleet and the strength of
Cadeler’s organisation to adapt quickly to changing circumstances.
While 2025 was characterised by fleet expansion, 2026 has been
defined by project delivery. As our fleet, project portfolio and
organisation have continued to grow, Cadeler has remained focused
on disciplined execution while preserving the collaborative culture
that supports safe and reliable project delivery.
Proving our foundation installation capabilities
Cadeler’s full-scope foundation T&I capabilities are now being
demonstrated in active project execution. During the first half of the
year, we commenced foundation installation at Ørsted’s Hornsea 3
Offshore Wind Farm, our first full-scope foundation transport and
installation campaign. As the project progresses, it will serve as an
important demonstration of the capabilities and expertise we have
invested in over recent years, supporting our ambition to become a
leading provider of integrated foundation T&I solutions.
Strengthening our customer offering
Cadeler’s ambition is to be the leading offshore wind installation
partner, and every strategic investment we make is driven by
one objective: strengthening the value we create for our
customers.
The successful capital raise completed in March enabled the
subsequent order of two T-class newbuilds, representing the next
step in the expansion of our foundation installation capabilities.
Together with our A-class vessels, the T-class vessels will create one
of the industry's strongest and most capable foundation installation
offerings, enabling Cadeler to support increasingly demanding
offshore wind projects.
The T-class vessels have been engineered to be the largest and
most capable vessels ever introduced to the offshore wind
installation market. They will set a new benchmark for foundation
installation capability and will expand Cadeler’s ability to support
increasingly complex offshore wind projects.
Cadeler has also announced its intent to enter into scour protection.
Expanding into this scope will enable Cadeler to support customers
across a broader part of the offshore wind value chain, reducing
project scheduling and interface risks during foundation installation
campaigns.
In August, after the reporting period, Cadeler announced the
strategic acquisition of Menck, a leading global provider of specialist
equipment and engineering solutions for offshore foundation
installation. Combining Menck's specialist technology and decades
of engineering experience (including more than 50 million data
points on pile driving) with Cadeler’s industry-leading fleet of heavy-
lift wind installation vessels and deep industry relationships, Cadeler
will be well positioned to support customers across the installation
value chain.
Looking ahead
The offshore wind industry continues to evolve. While governments
across key markets continue to show strong ambitions for offshore
wind, the industry's focus is centred on dependable execution and
certainty of delivery. Developers are placing ever-greater emphasis
on resilient supply chains and experienced partners capable of
delivering projects safely, efficiently and on schedule. This reinforces
our confidence in Cadeler's long-term strategy and in the continued
demand for reliable offshore wind installation capacity.
We remain in close dialogue with customers across all major offshore
wind markets, supporting both current projects and future
developments. These conversations continue to confirm that the
market values what we offer. Supported by our growing fleet,
expanding capabilities and talented people, I am confident that Cadeler
is well positioned to support the next phase of growth in offshore wind.
Thank you
Finally, I would like to thank our customers, shareholders, partners
and suppliers for their continued trust and collaboration.
I would also like to thank all Cadelers for their professionalism and
commitment. The growth Cadeler has achieved in recent years has
only been possible because of the dedication shown every day
across our fleet and offices.
A special thank you goes to our seafarers. Over the past six years,
Cadeler has grown from around 150 to more than 850 seafarers, and
their professionalism, resilience, teamwork and dedication - often
while spending long periods away from home - remain fundamental
to our ability to deliver safely and reliably for our customers.
On behalf of the Executive Management and Board of Directors, I
thank you for your continued commitment to our customers, to one
another and to the continued success of Cadeler.
Mikkel Gleerup
CEO
5
Business review
6
Business review
Cadeler A/S ("Cadeler" or the "Company" and, together with its
subsidiaries, the "Cadeler Group" or the "Group") is the global leader
in offshore wind turbine transport and installation, operating the
world's largest fleet of jack-up wind installation vessels. For nearly
two decades, the Company has helped bring offshore wind to life,
turning large-scale offshore projects into operational reality at sea.
Cadeler continues to strengthen its position across the offshore wind
value chain. Alongside its market leading turbine transport and
installation, the Company is expanding its foundation transport and
installation capabilities while steadily growing its operations and
maintenance business, enabling it to support customers across a
broader range of offshore wind project scopes.
During the first half of 2026, Cadeler maintained a high level of
operational activity across Europe, North America, and the Asia-
Pacific region, successfully supporting customers on complex
offshore wind projects. The Company's expanded fleet demonstrated
its operational flexibility through the mobilisation and remobilisation
of vessels across multiple regions, enabling safe and efficient
execution while responding to changing customer requirements.
The period also marked continued progress in executing Cadeler’s
long-term growth strategy. In March 2026, Cadeler successfully
completed a private placement to partly finance its firm order
(subsequent to the reporting period) of two T-class newbuilds and
support its expansion into scour protection activities, further
strengthening its foundation installation capabilities and broadening
the range of services it is able to offer its customers.
Subsequent to the reporting period, Cadeler took delivery of Wind
Ace, the Company's eleventh wind installation vessel and second A-
class newbuild. The addition further expands Cadeler's fleet capacity
and operational flexibility, strengthening its ability to execute both
foundation and wind turbine installation projects. Following
mobilisation, Wind Ace is scheduled to commence work on
ScottishPower Renewables' East Anglia TWO project in the UK.
In addition, in August 2026, Cadeler acquired Menck, a leading global
provider of specialist equipment, technology and related services for
offshore foundation installation. The acquisition marks a step-change
in the development of Cadeler's offshore foundation transportation
and installation (T&I) capabilities and will strengthen Cadeler’s
operational resilience, unlocking value for Cadeler’s customers by
enabling more efficient use of mission-critical foundation installation
capabilities, reducing reliance on subcontracted services and
increasing agility in project planning and execution.
The developments during the first half of 2026 further strengthened
Cadeler's operational capabilities and long-term strategic position.
Supported by continued investment in its fleet and service offering,
the Company enters the second half of the year with increased
capacity and flexibility to support customers in delivering the next
generation of offshore wind projects.
7
Financial review

8
Key financial figures
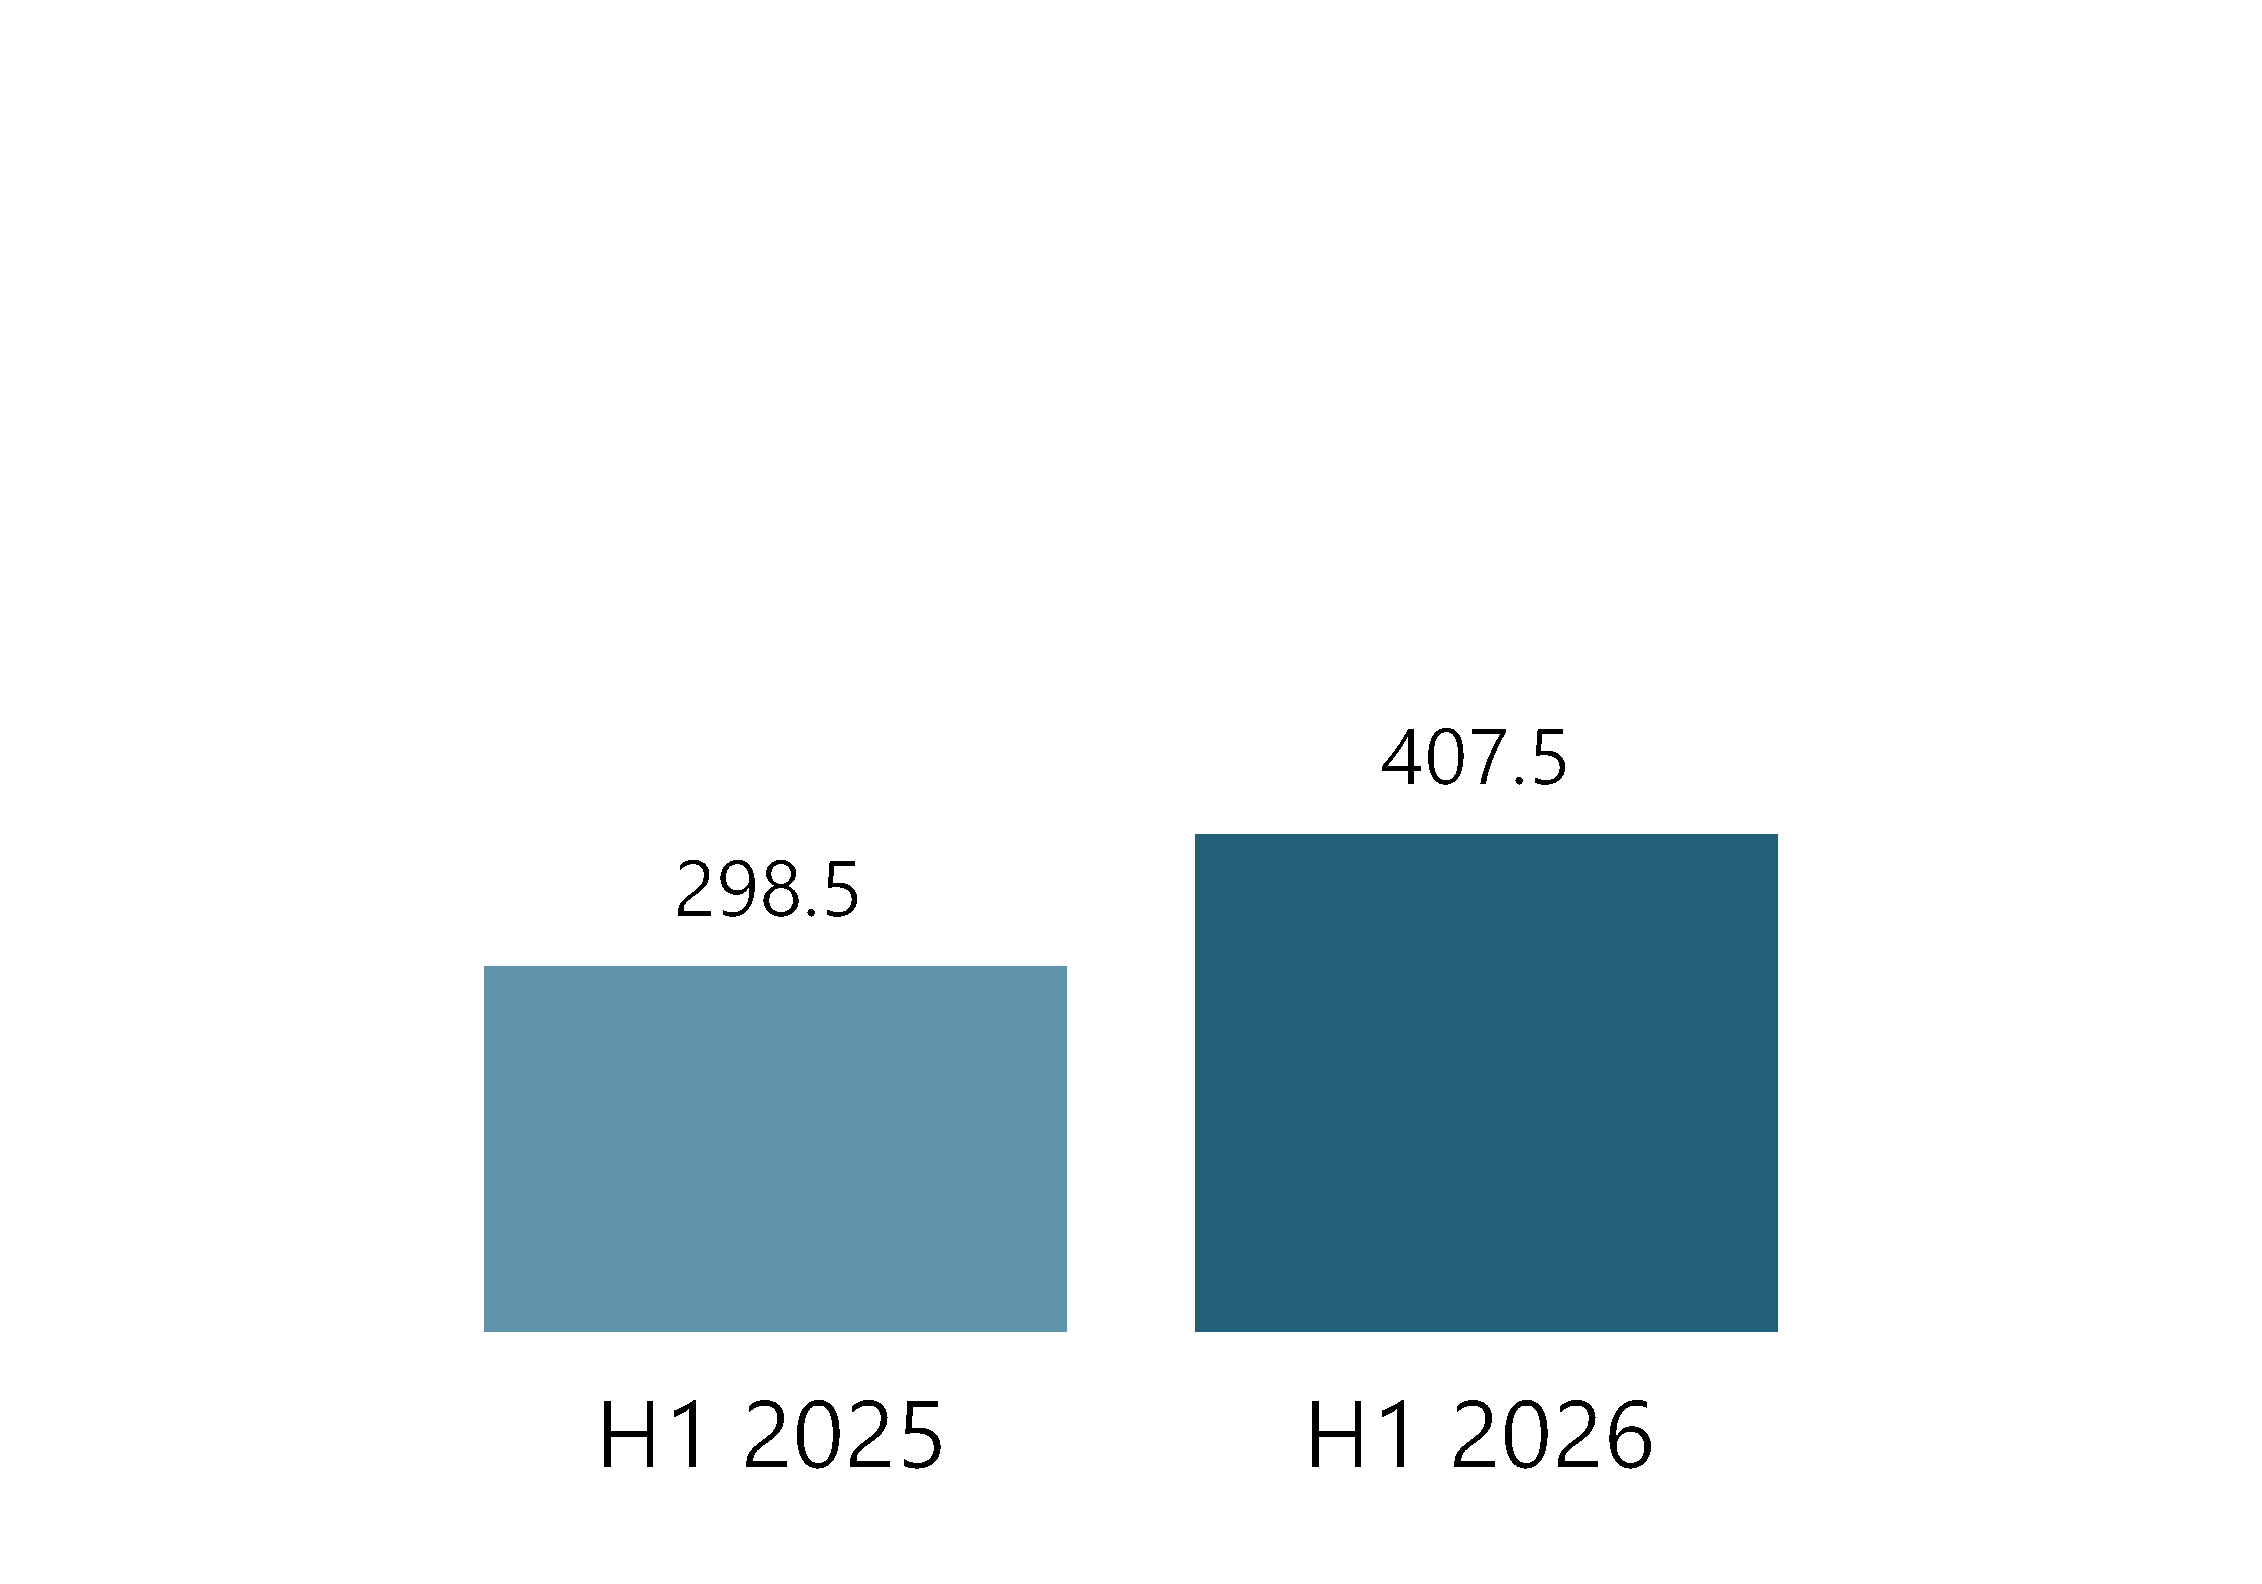
Revenue2
€407.5m
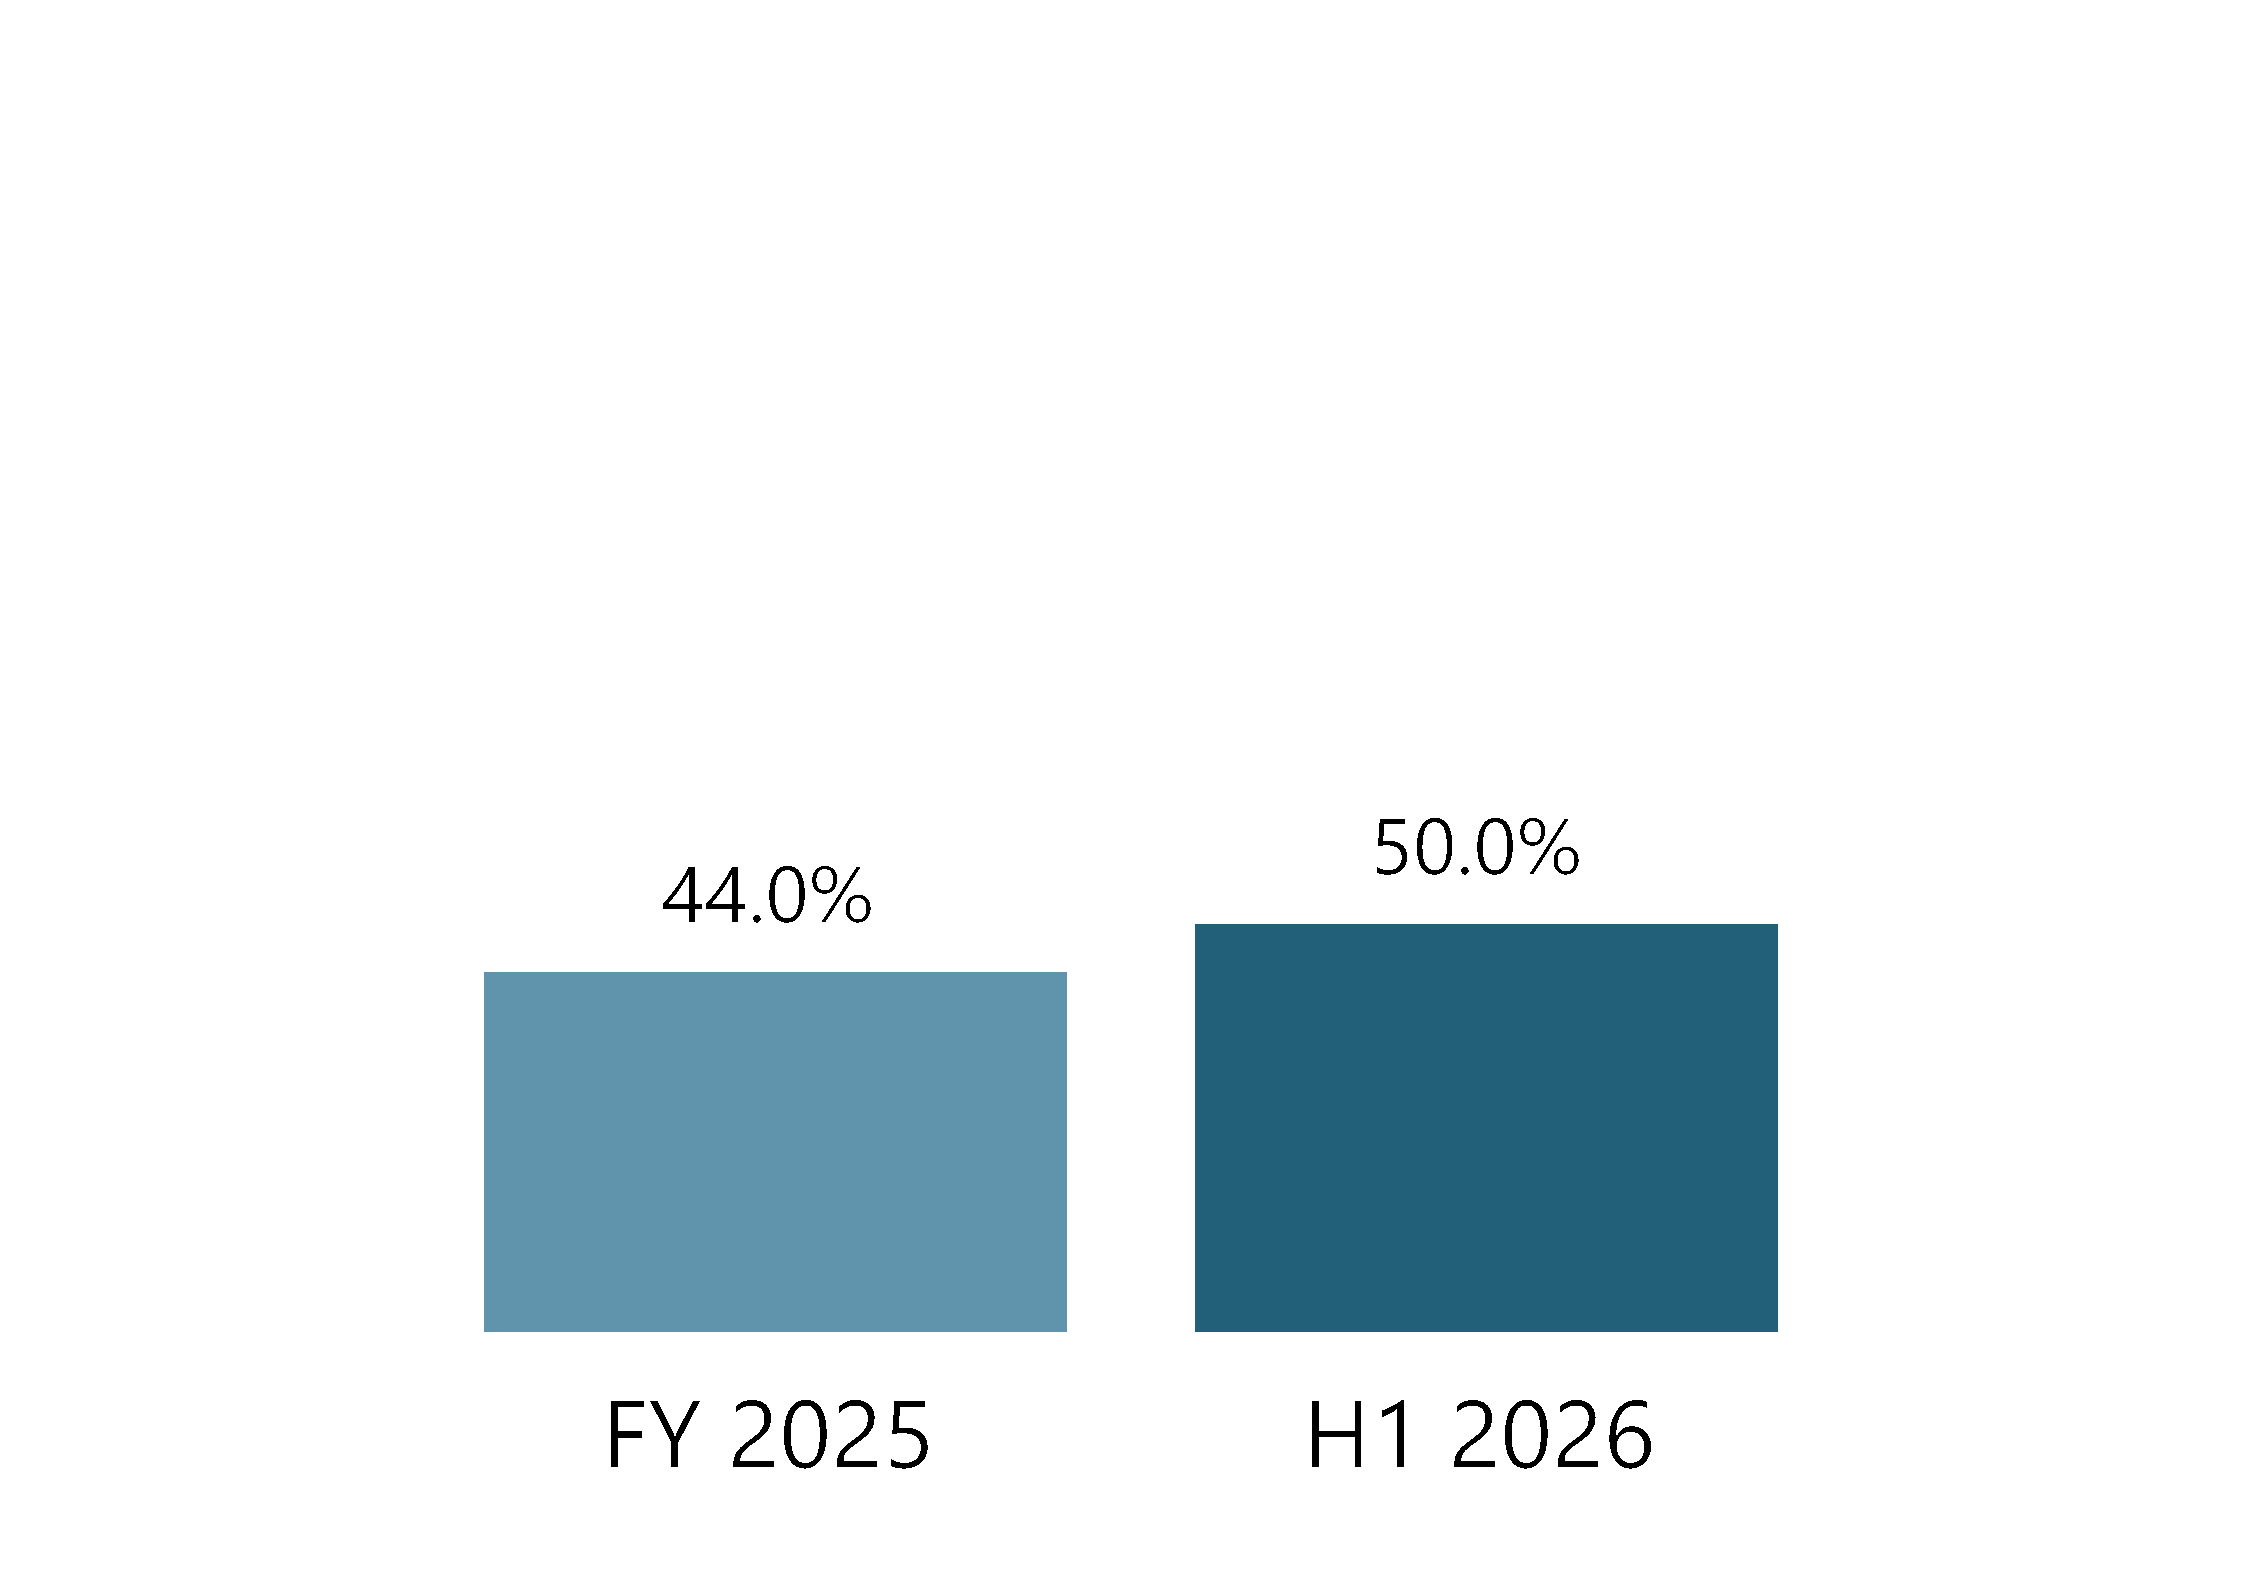
Equity ratio
50.0%
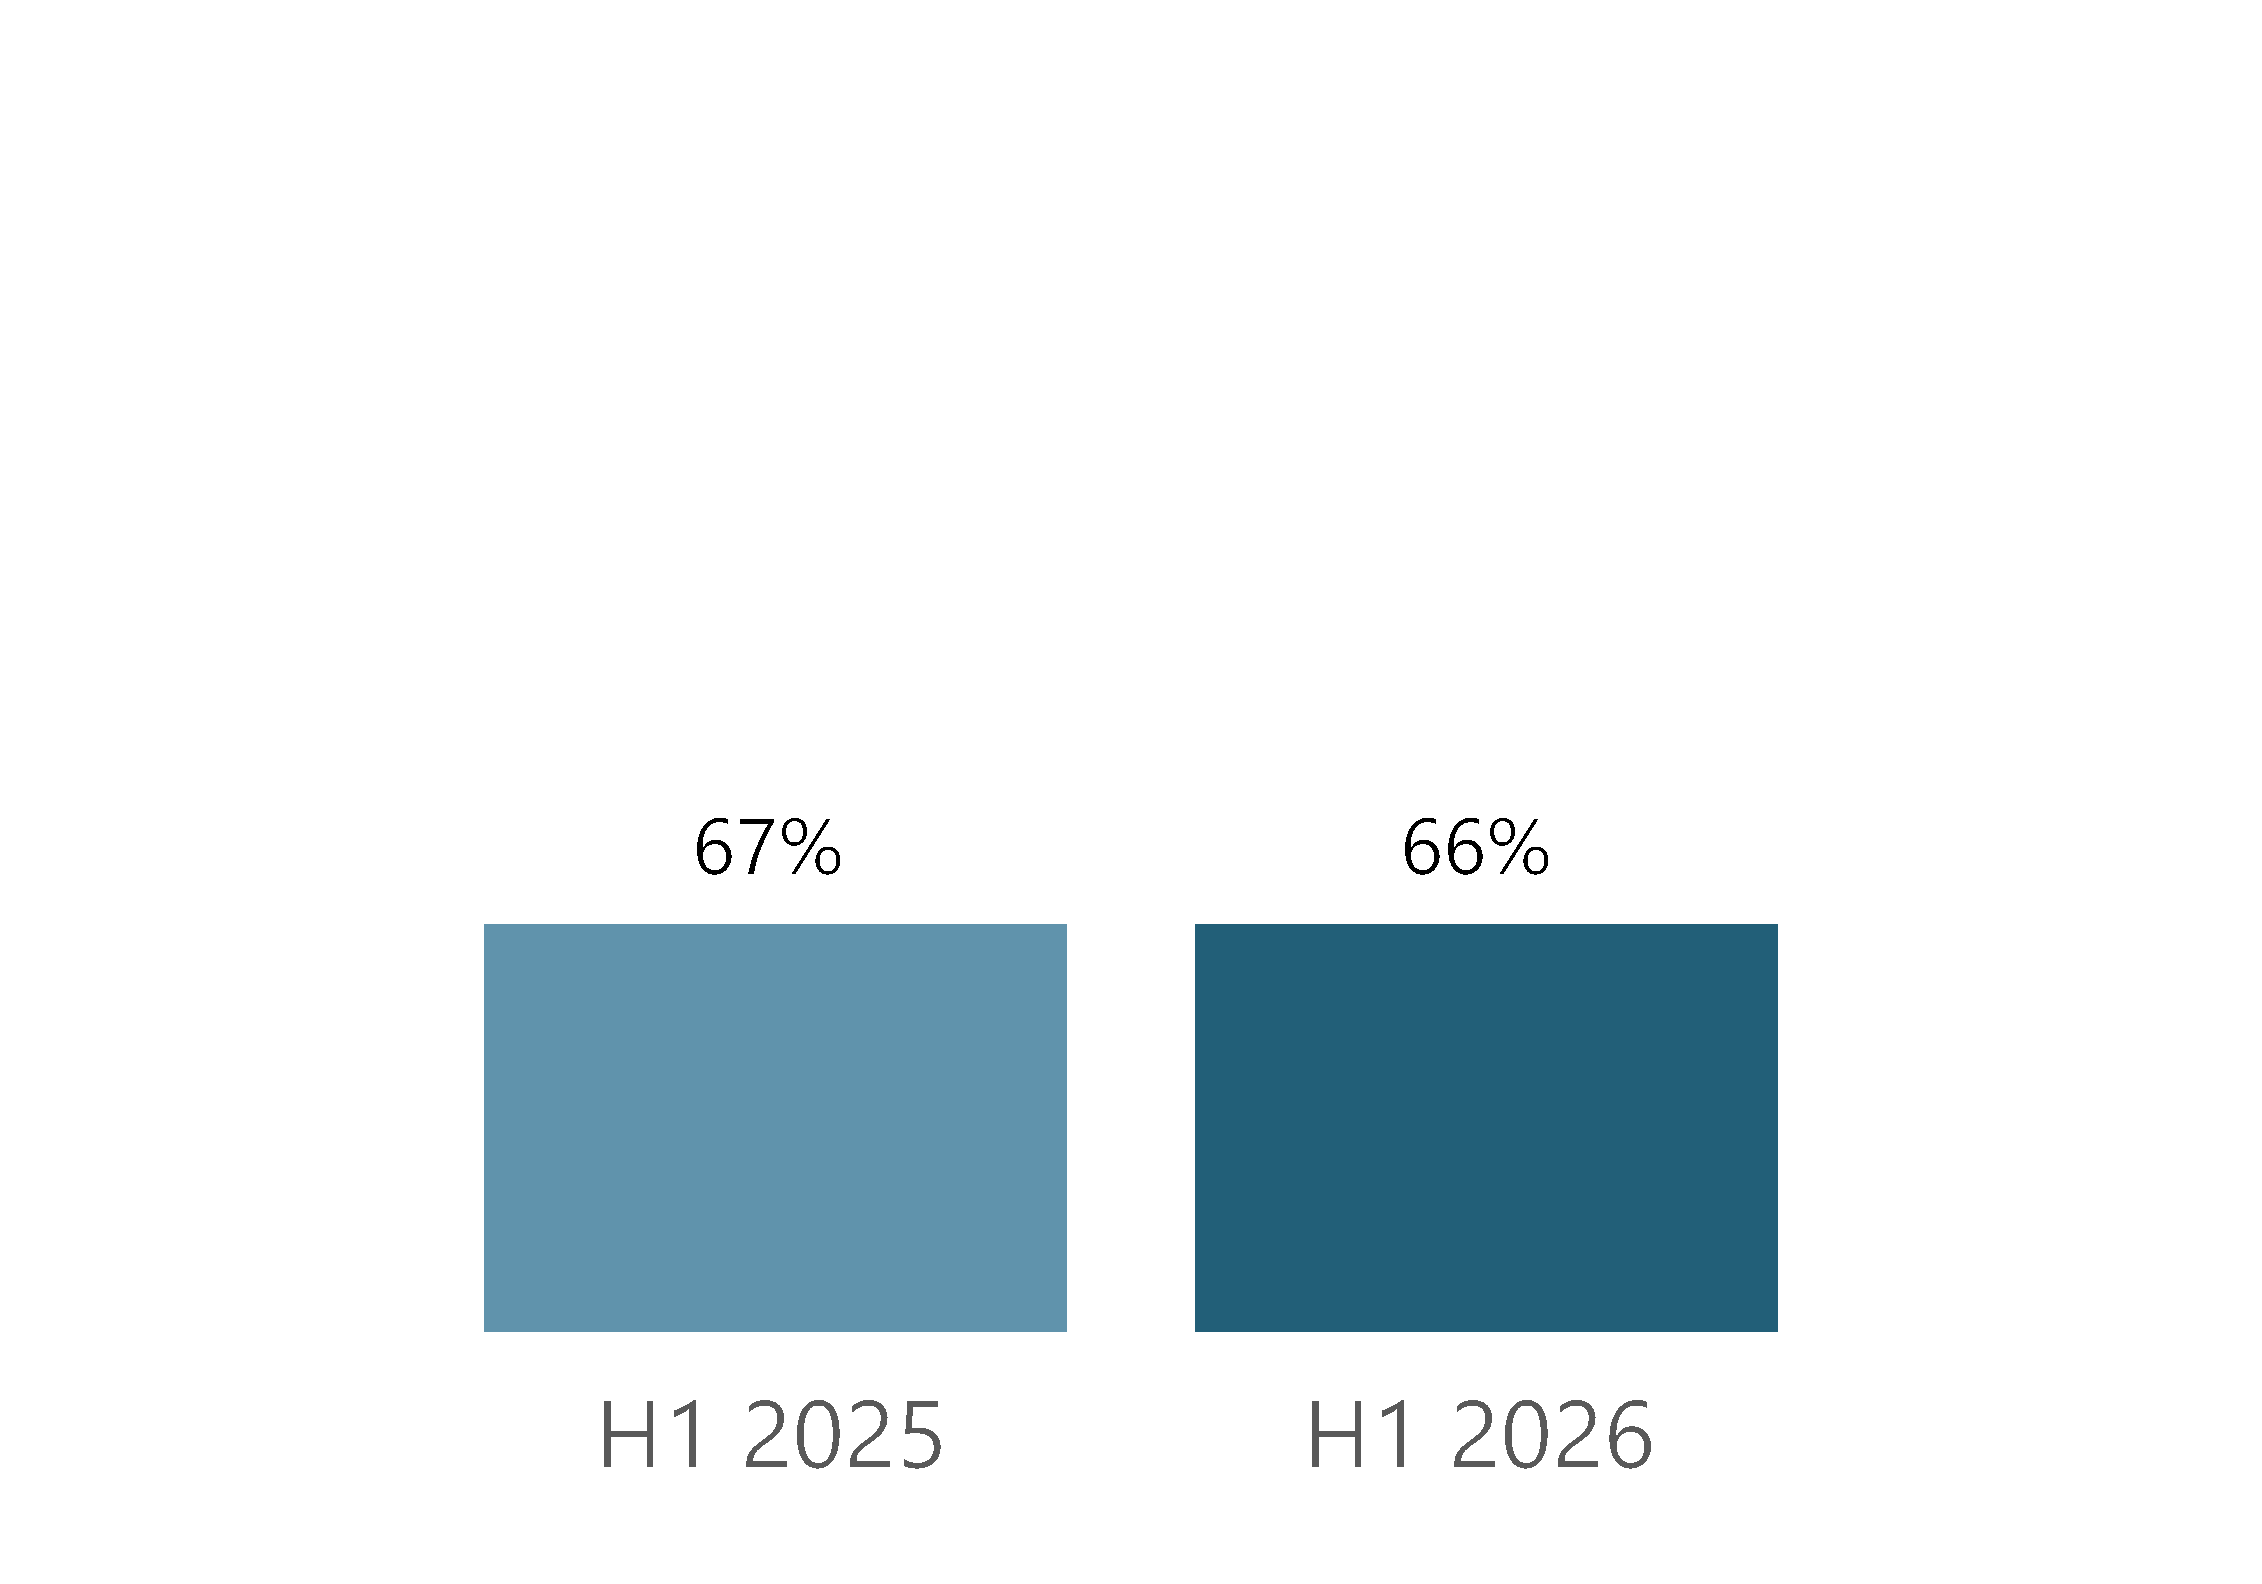
Utilisation
66%
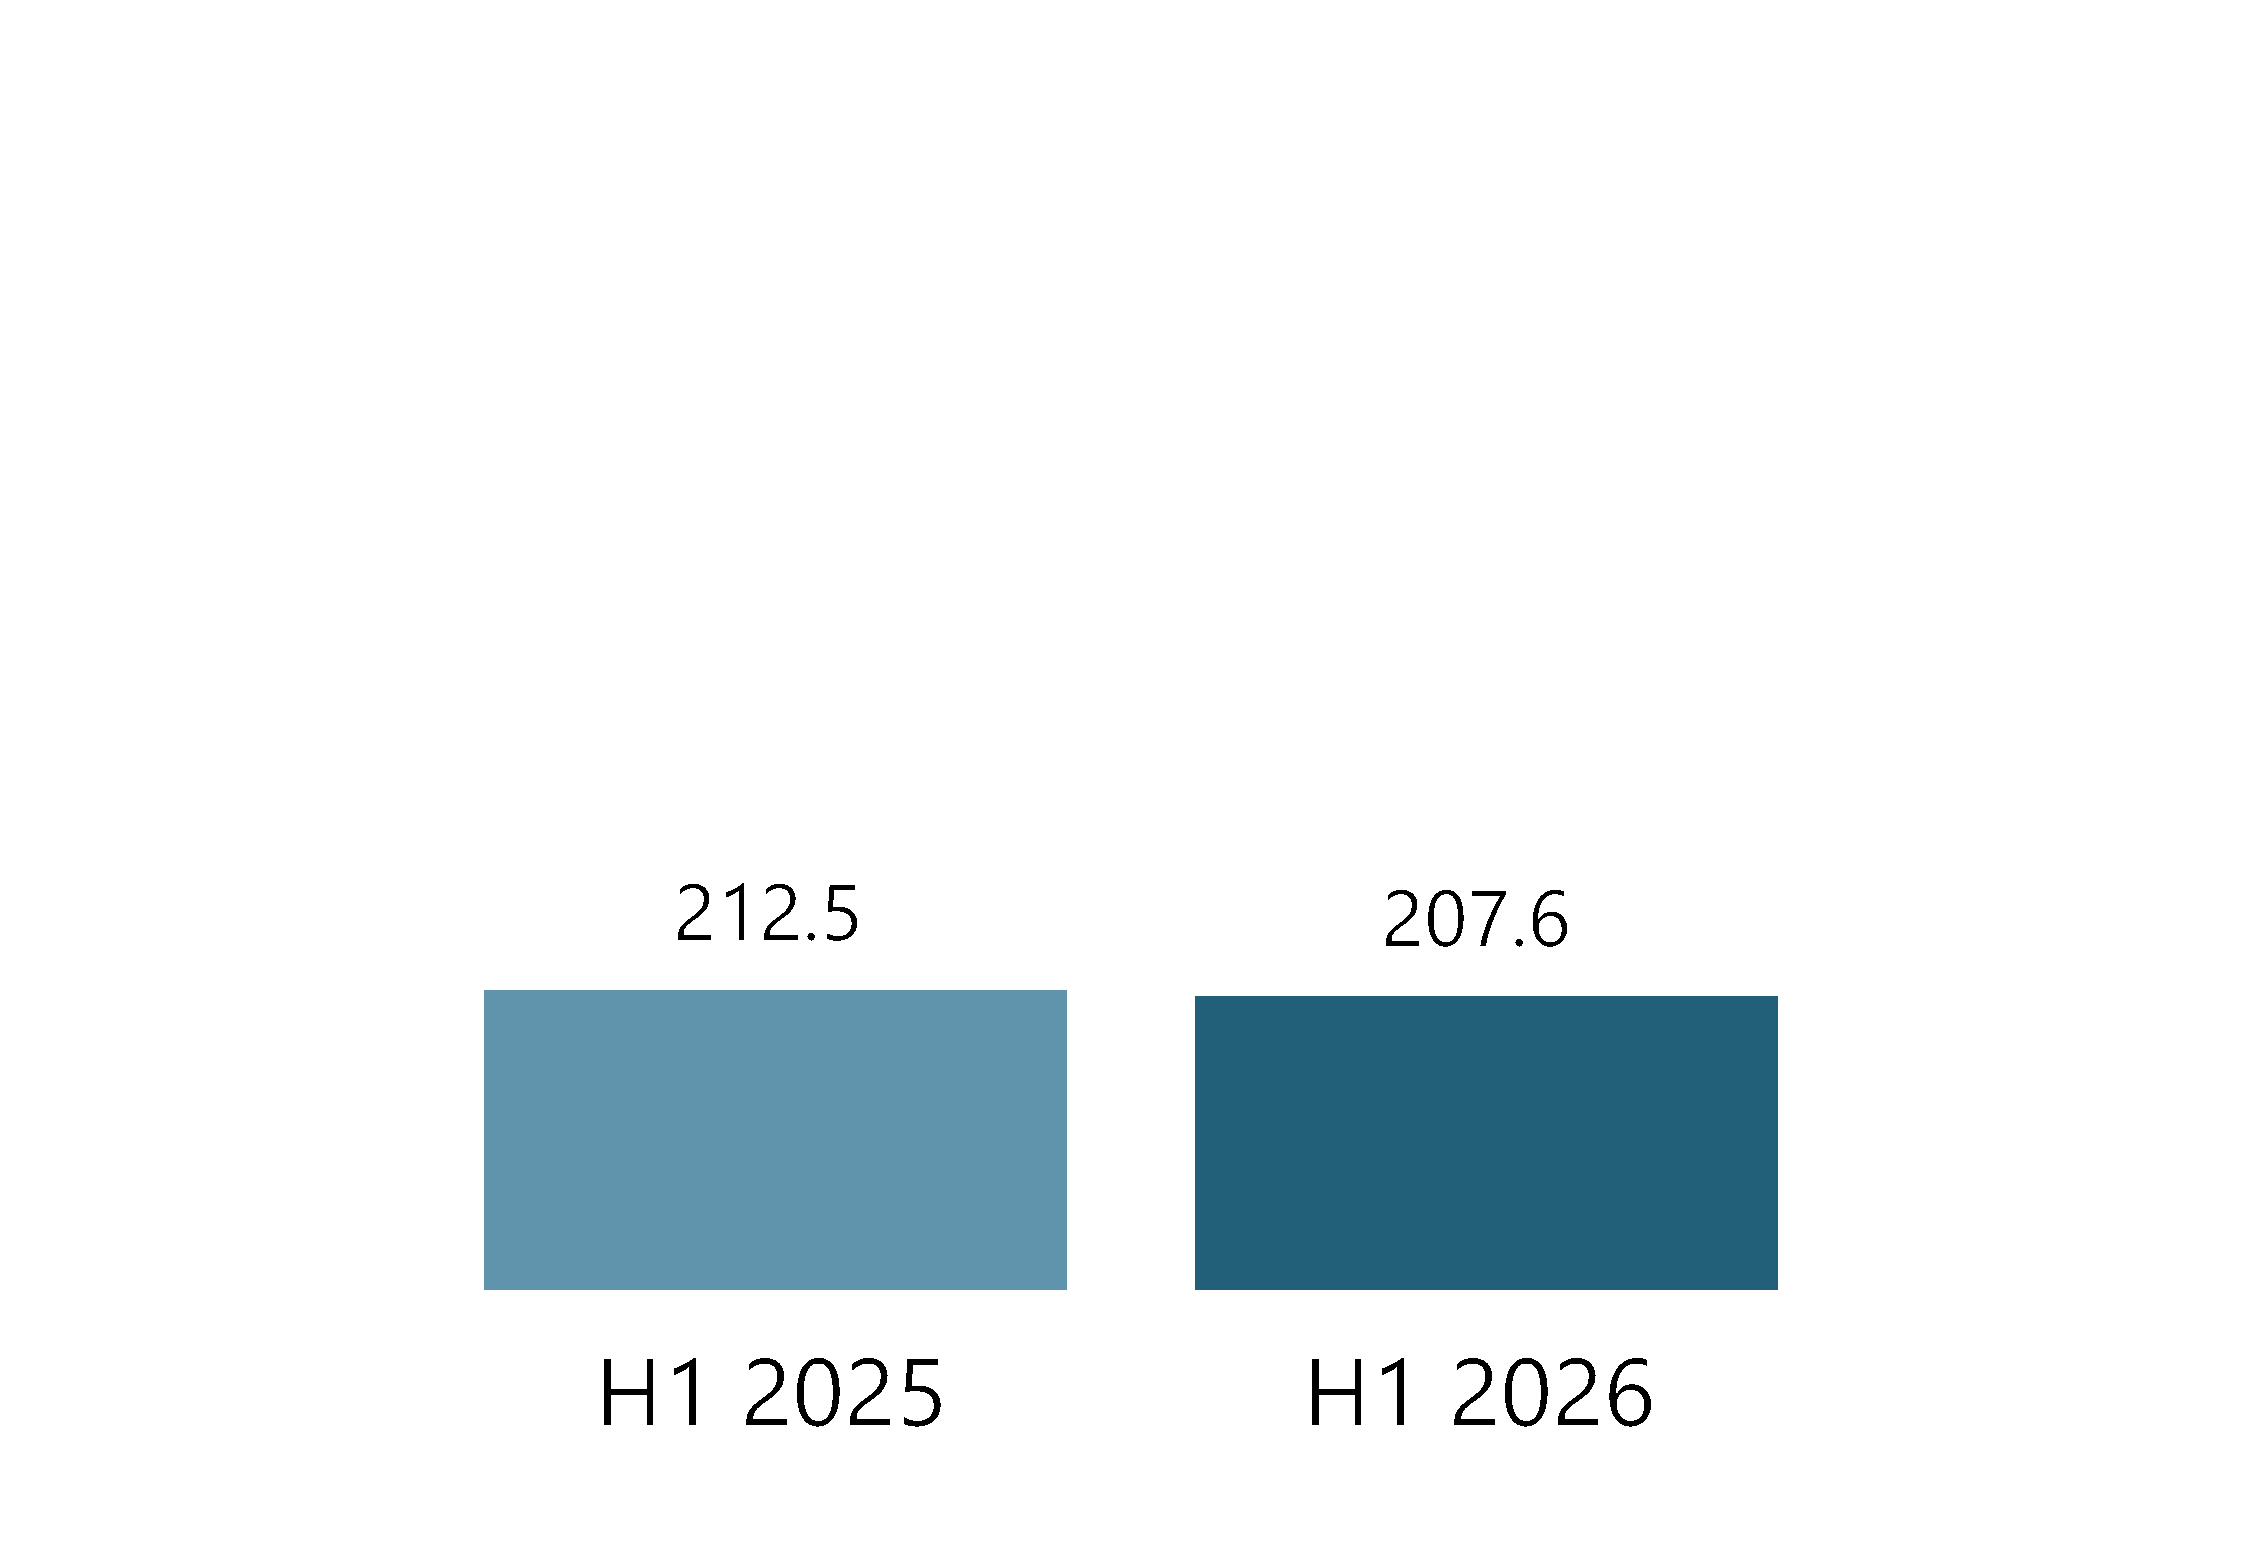
EBITDA2
Net profit2
Backlog1
€207.6m
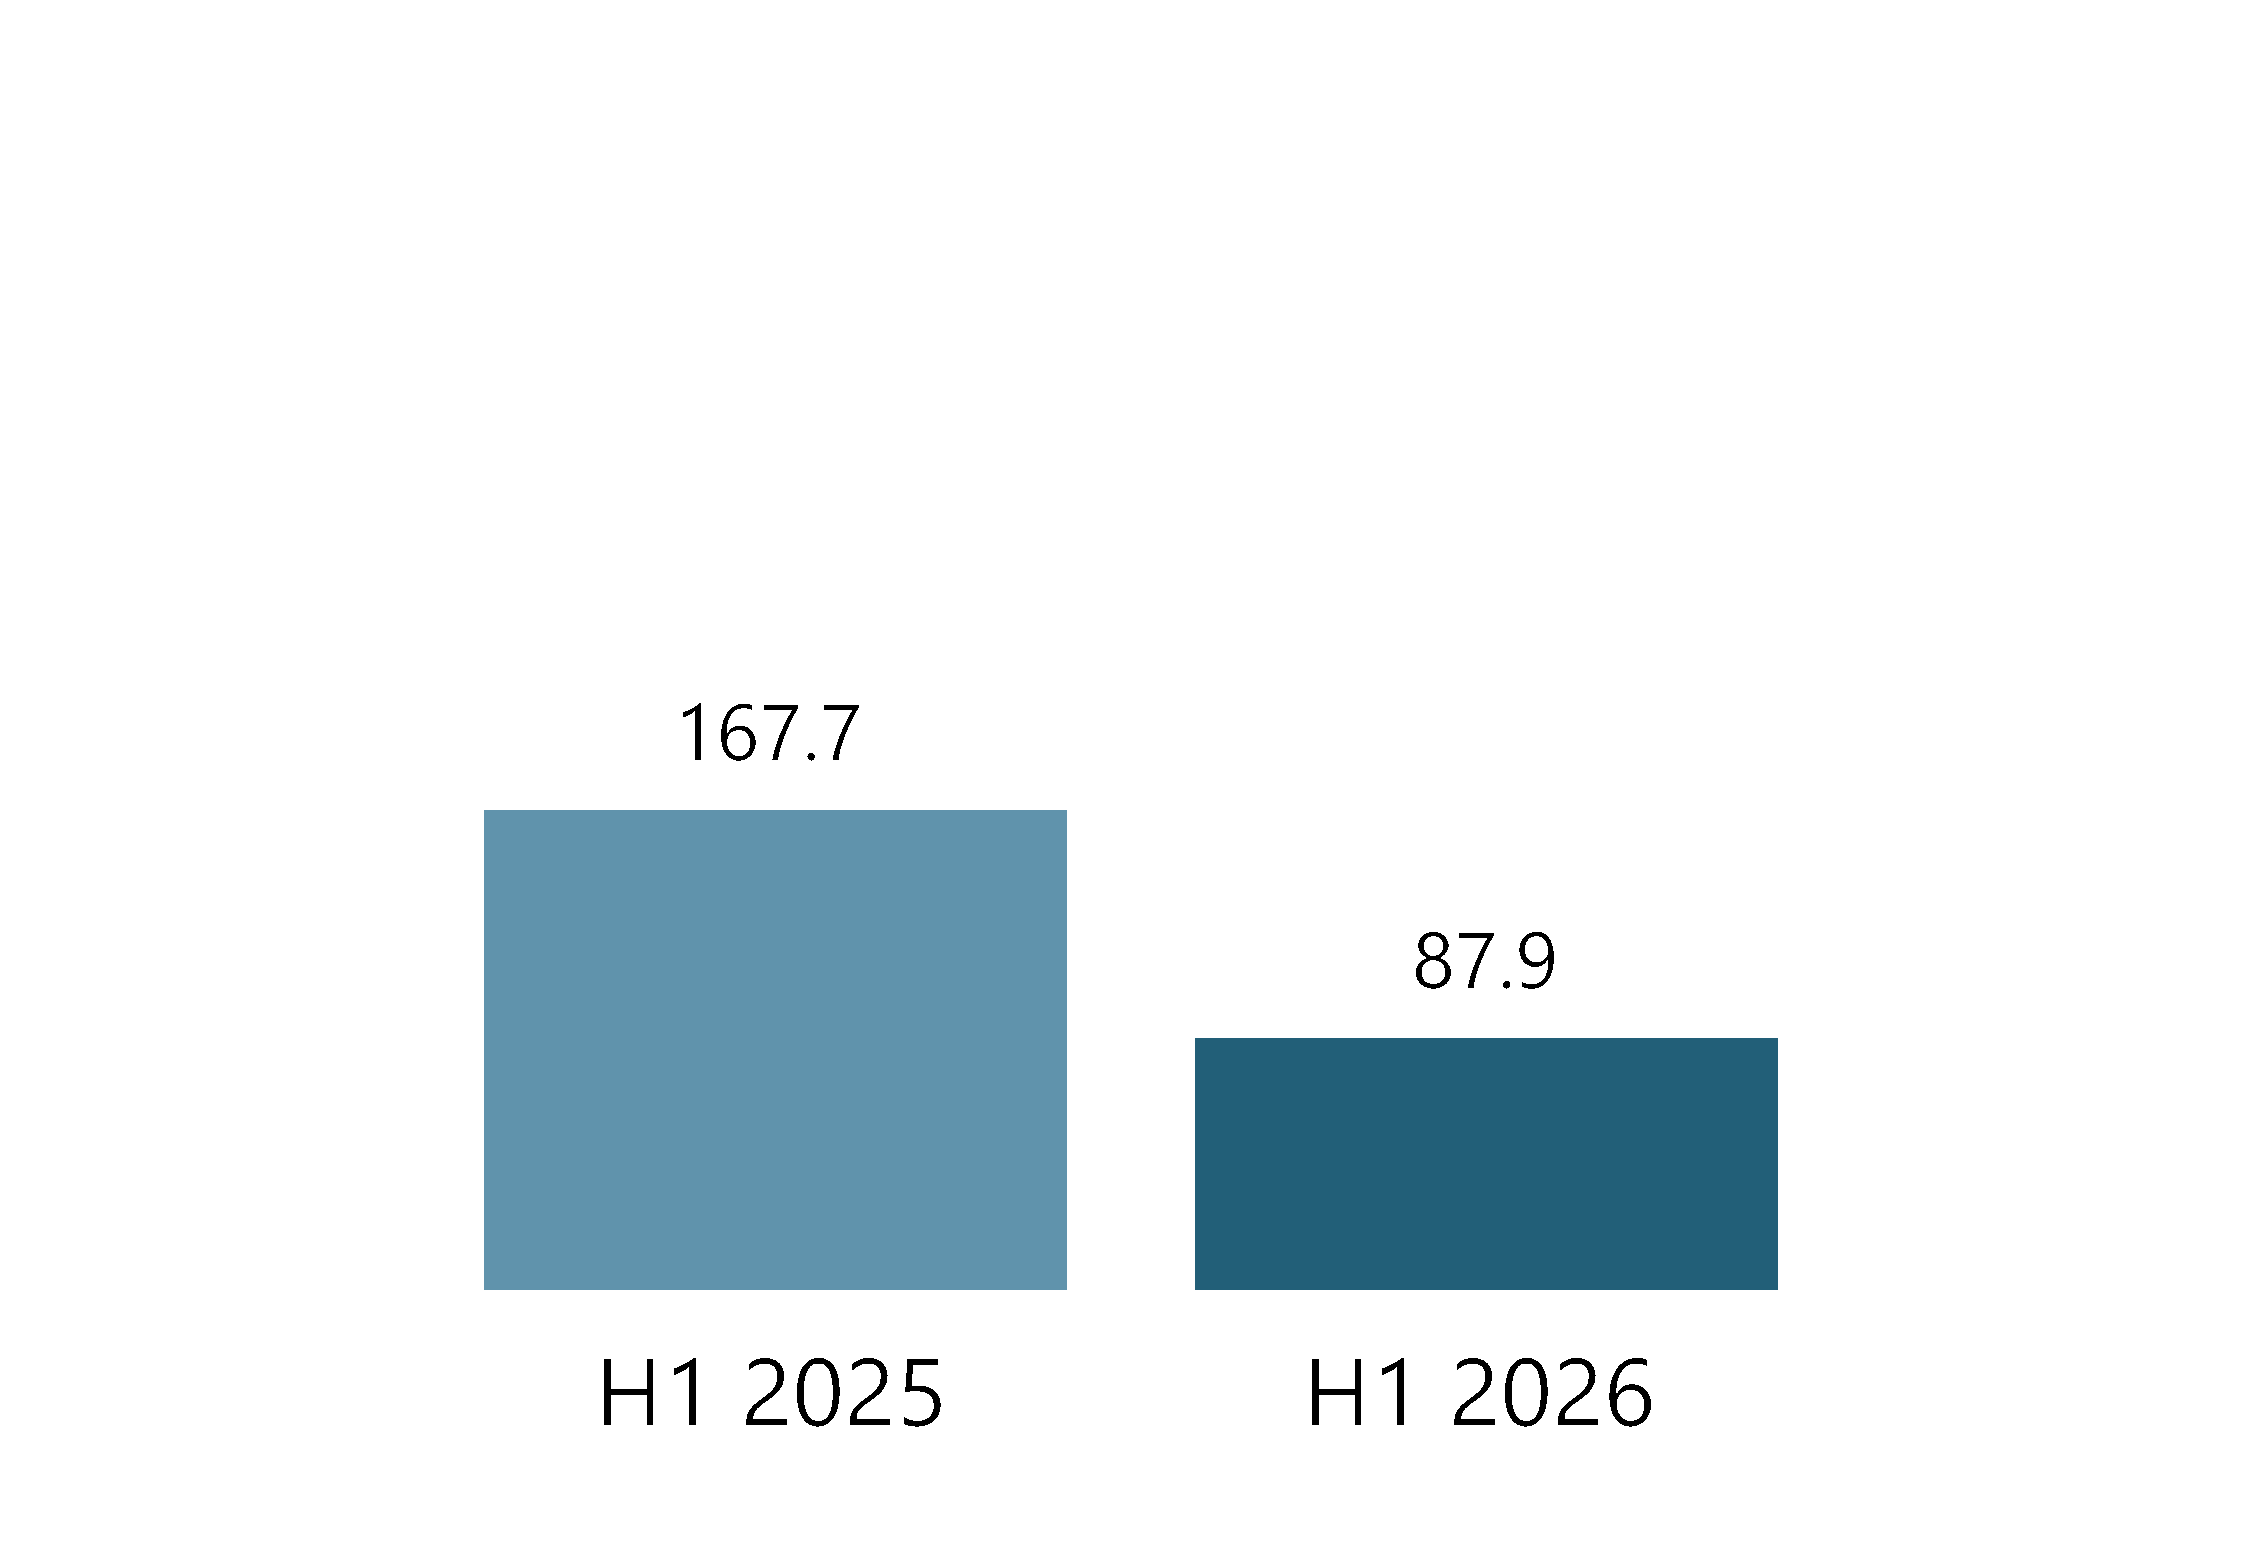
€87.9m
€2.5b
1.Contract Backlog including options as at 30 June 2026
2. Comparative period includes non-recurring revenue items (termination fees) of EUR 111 million.
9
Financial highlights
Key figures | ||
EUR'000 | H1 2026 | H1 2025 |
Revenue | 407,529 | 298,535 |
Cost of sales | (246,471) | (100,234) |
Gross profit | 161,058 | 198,301 |
Operating profit | 121,312 | 167,954 |
Net financials | (34,489) | 3,171 |
Profit for the period | 87,901 | 167,733 |
Cash flow provided by operating activities | 79,488 | 71,490 |
Cash flow used in investing activities | (133,537) | (680,081) |
Of which investment in property, plant and equipment | (132,498) | (672,217) |
Cash flow provided by/(used in) financing activities | 108,924 | 596,356 |
Net (decrease)/increase in cash and cash equivalents | 54,875 | (12,235) |
Share related key figures | ||
Earnings per share (EPS), EUR | 0.24 | 0.48 |
Diluted earnings per share (diluted EPS), EUR | 0.23 | 0.48 |
Operational metrics | ||
Contracted days (no. of days) | 1,198 | 770 |
Utilisation (%) | 66% | 67% |
Key figures | ||
EUR'000 | H1 2026 | FY 2025 |
Total assets | 3,544,094 | 3,416,676 |
Non-current assets | 3,094,118 | 3,026,719 |
Total liabilities | 1,770,497 | 1,913,000 |
Equity | 1,773,597 | 1,503,676 |
Cash and cash equivalents | 206,191 | 151,679 |
Financial ratios and operational metrics | ||
Return on assets (%) | 3.5% | 11.9% |
Return on equity (%) | 5.4% | 20.5% |
Equity ratio (%) | 50.0% | 44.0% |
Average number of employees | ||
Onshore | 359 | 307 |
Offshore | 767 | 586 |
10
Finance review
Profit for the period
For the first half of 2026, the Group’s result was a profit of EUR 88
million, representing a decrease of EUR 80 million compared to the
EUR 168 million profit earned in the comparative period in 2025. The
decrease in profit during the period was primarily attributable to
profit in H1 2025 benefiting from non-recurring revenue items
(termination fees) of EUR 111 million recognised in the prior-year
period without any associated costs. In addition, H1 2026 reflected
higher financial expenses, driven by a reduction in borrowing costs
capitalised following the delivery of vessels, compared with the
corresponding period.
Revenue
The Group’s revenue for the first six months of 2026 amounted to
EUR 408 million, reflecting an increase of EUR 109 million compared
to the EUR 299 million of revenue reported in H1 2025, driven
principally by the increased revenue from fleet expansion and
increased contracted days. Furthermore, H1 2025 included non-
recurring revenue item from termination of a Long-Term Agreement.
EBITDA
In H1 2026, the Group’s EBITDA amounted to EUR 208 million,
reflecting a decrease of EUR 5 million from EUR 213 million in H1
2025, as disclosed in the Alternative Performance Measures (APM)
section.
Costs
Amounting to EUR 246 million, the Group’s cost of sales for H1 2026
was EUR 146 million higher than the EUR 100 million reported for H1
2025, driven mainly by the addition of newly built vessels becoming
part of the Group’s fleet and operating in the market.
Administrative expenses in H1 2026 amounted to EUR 41 million, an
increase from the EUR 33 million in H1 2025. This was primarily driven
by the Group’s increasing headcount, reflecting the strategic hiring of
key personnel to strengthen support for ongoing operations and
major new projects.
Utilisation
The Group’s ten operating vessels achieved a combined 66%
utilisation rate for the first six months of 2026, compared to 67% in
the same period in 2025. The slight decrease was mainly attributable
to lower utilisation in Q1 2026, reflecting the addition of new vessels,
which typically experience lower utilisation during their initial period
of operation whilst in transit.
Cash flows
Net cash flow from operating activities amounted to EUR 79 million in
H1 2026, EUR 8 million higher than the EUR 71 million recorded in H1
2025, driven by a decrease in receivables in the period and offset by
decreased operating profit.
Net cash flow used in investing activities was EUR 134 million in H1
2026, representing a decrease of EUR 547 million compared to the
EUR 680 million reported in H1 2025. The decrease reflects higher
asset investments in the comparative period.
Net cash flow from financing activities in H1 2026 was EUR 109
million, a decrease of EUR 487 million compared to a net inflow of
EUR 596 million reported in H1 2025. The decrease was primarily
driven by lower net proceeds from borrowings compared to the
same period in 2025, partially offset by net proceeds of EUR 170
million from the issuance of share capital in Q1 2026.
11
Finance review
Continued from previous page
Capital structure and assets
Equity
On 30 June 2026, equity amounted to EUR 1,774 million, an increase of
EUR 270 million from the opening balance EUR 1,504 million. This
increase in equity was mainly as a result of profit for the period of EUR
88 million, and a net capital increase of EUR 170 million after
transaction costs.
The Company completed a successful private placement on 25 March
2026, resulting in the issuance of approximately 35 million shares at a
price of NOK 56 per share. Overall the Company raised
approximately EUR 175 million before transaction costs. The net
proceeds are to partly finance two Wind Foundation Installation
Vessel newbuilds (referred to as the “T-Class newbuilds') to be
delivered mid-2030 and mid-2031 and the potential acquisition of a
heavy-lift vessel for scour protection (rock installation) scopes.
Assets
As of 30 June 2026, the Company's total assets amounted to EUR
3,544 million, a 4% increase for the reporting period, driven
principally by an increase in property, plant and equipment of EUR 69
million of which the majority is driven by down payments for the A-
class foundation installation vessel. Additions to property, plant, and
equipment are described in Note 5.
Funding
At the end of the reporting period, EUR 188 million from the Green
Corporate Facility remains unutilised.
The Company had significant headroom to comply with its debt
covenants and on 30 June 2026, the Company had available liquidity
of EUR 394 million from cash at hand and available committed
facilities.
Related party transactions
Related party transactions over the reporting period are limited to
guarantee fees charged by BW Group Limited, training-related costs
and travel costs charged by BW Maritime, share lending fees charged
by BW Altor in connection with the private placement completed in
March 2026 and administrative expenses charged by Scorpio Services
Holding, see Note 9 for further details.
Impact on the external environment
There have been no significant changes to our sustainability strategy
since the publication of the 2025 Annual Report. Sustainability
remains a strategic objective for the Company and is key to its ability
to create long-term value for its shareholders. It represents an
opportunity for innovation, improved efficiency and a foundation for
growth. The Company strives to identify and reduce the impact that
its business has on the environment and the communities and is
committed to delivering leadership in matters of environment, health
and safety, employment, and corporate responsibility across its value
chain, as detailed in the 2025 Annual Report, which integrates the
sustainability statements.
12
Finance review
Continued from previous page
Order backlog
Cadeler’s order book for 2026 is substantially filled. As of 25 August 2026, notable contracts signed in 2026
include:
•In February, Nexra - Cadeler’s service platform - announced the signing of a firm contract for an
O&M campaign in Taiwan commencing March 2026, to run for 3-4 months. The value of the
contract to Cadeler exceeds EUR 20 million.
•In March, Nexra closed two additional firm contracts: a second 3-4 month O&M campaign for
Wind Maker in Taiwan, and a 2-3 month campaign for Wind Zaratan in Japan, both to be
completed in 2026.
In addition, in January 2026, Cadeler announced that it had signed a preferred supplier agreement (PSA)
with an undisclosed client for the transportation and installation of monopiles and transition pieces at a
large offshore wind farm in Europe. The campaign is expected to commence in H1 2028 and to be executed
using two of Cadeler’s vessels, including a newbuild A-class vessel. The PSA is subject to the client’s FID on
the project.
Vessel Reservation Agreements (VRAs) and Preferred Supplier Agreements (PSAs) are not included in the
contract backlog.
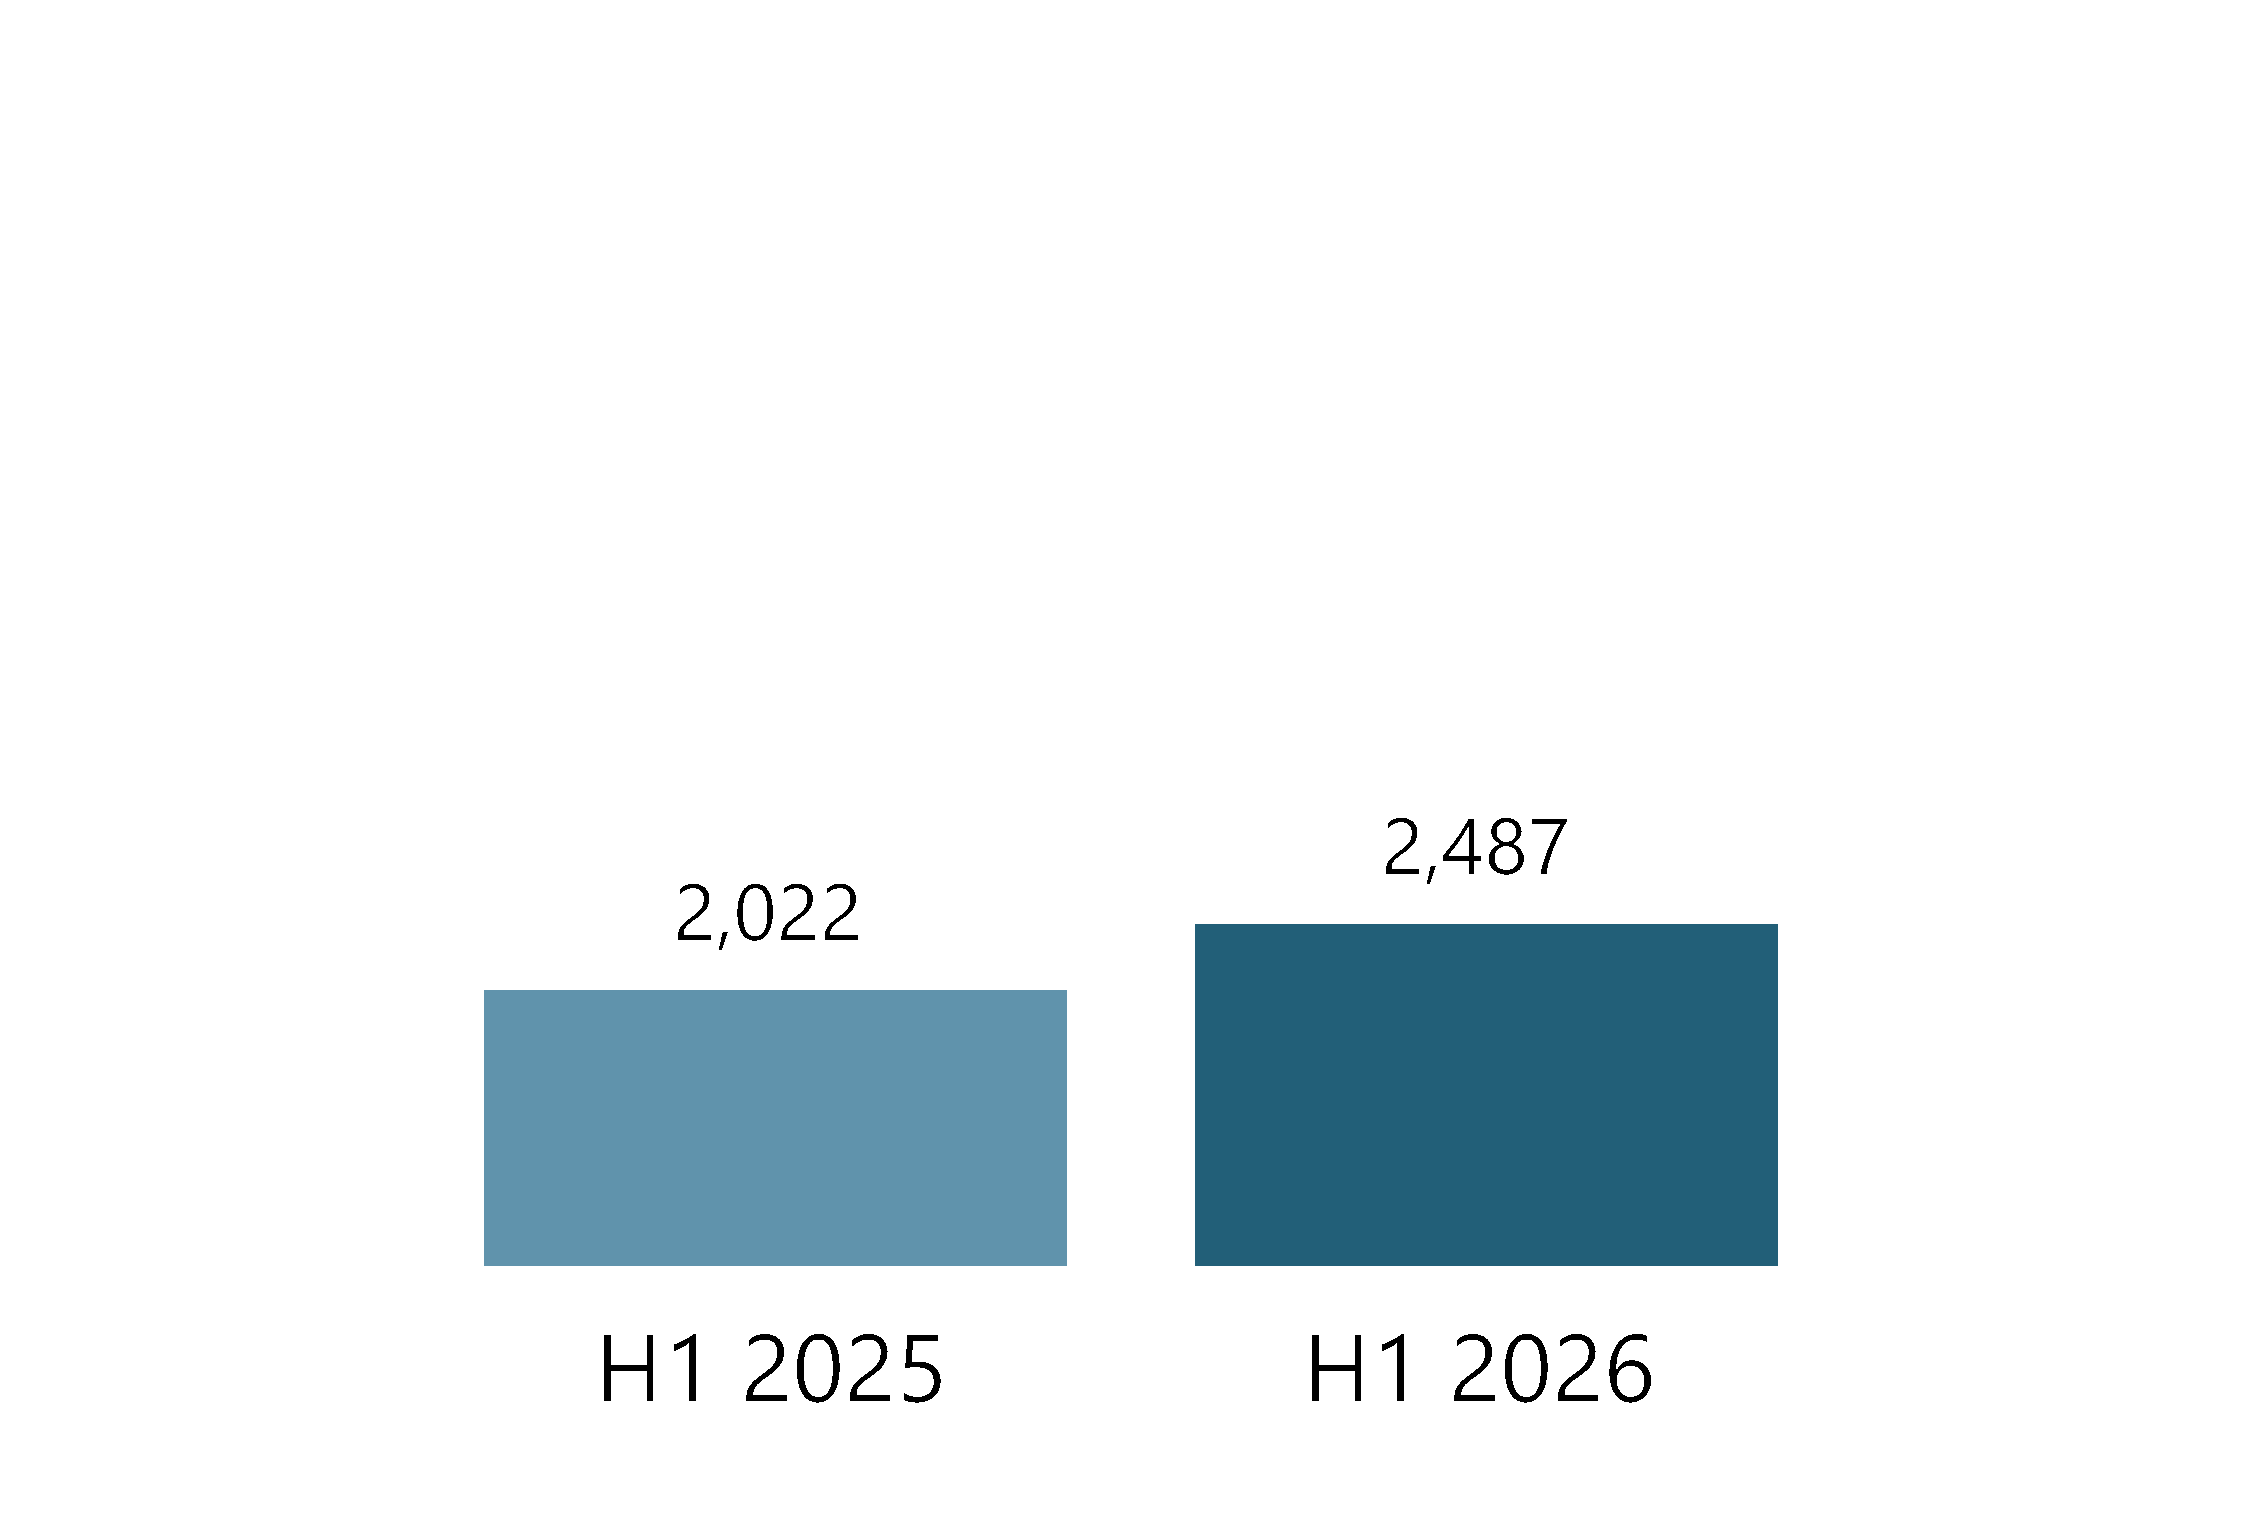
The Group’s order backlog as of the date of the release of this interim report amounted to EUR 2,487
million.
EUR million | Within 1 year | After 1 year | Total |
Contract backlog including options as of 30 June 2026 | 1,103 | 1,384 | 2,487 |
Additions in the period 1 July 2026 to 25 August 2026: | |||
Firm, excluding options | — | — | — |
Options considered as contingent considerations for revenue recognition purposes | — | — | — |
Options not considered as contingent considerations for revenue recognition purposes | — | — | — |
Contract backlog including options as of 25 August, unadjusted for services provided during the period 1 July - 25 August 2026¹ ² | 1,103 | 1,384 | 2,487 |
Refer to Note 3 for further information regarding the total contract backlog at 30 June 2026.
1As of the report release date, 77% of the contract backlog (an aggregate of EUR 1,919 million) relates to projects for which the relevant
counterparty has taken a positive final investment decision (FID), while an aggregate of EUR 568 million remains subject to
counterparty FID.
2 As Cadeler’s acquisition of Menck was completed after the reporting period and shortly before the authorisation of these interim
financial statements, the backlog figures presented as of the release date exclude backlog figures for Menck.
13
2026 Outlook
In the Annual Report 2025 published on 24 March 2026, Cadeler
provided guidance for the financial year ending 31 December 2026
that revenue was expected to be in the range between EUR 854 to
944 million while EBITDA was expected to be in the range EUR 420 to
510 million. As of 30 June 2026, the above revenue and EBITDA
guidance for the Cadeler Group (excluding Menck) is unchanged. The
acquisition of Menck is expected to impact the consolidated Cadeler
group’s revenue and EBITDA guidance for 2026. Cadeler is reviewing
the extent of that impact and will provide an update in due course.
After a series of negative headlines in 2025, driven in particular by
political headwinds in the United States, the offshore wind market is
experiencing renewed positive momentum. Markets are recalibrating,
with authorities adjusting auction timelines and frameworks to reflect
evolving market conditions, and long-term visibility has significantly
improved as an increasing number of governments adopt longer-
term CfD structures with supportive terms. In the UK, the AR8 auction
has been moved forward to July 2026, accompanied by an additional
GBP 200 million budget confirmed for the Clean Industry Bonus,
following the record-breaking AR7 round which awarded more than
8 GW of capacity. France is planning to award around 10 GW of
offshore wind capacity through the combined AO9 and AO10 tenders
to drive scale and enable faster deployment. This is further
underpinned by the commitments made at the North Sea Summit in
January 2026, where nine North Sea countries committed to
delivering 15 GW of offshore wind per year in the 2031–2040 period,
towards a goal of 300 GW installed by 2050.
The positive momentum extends beyond Europe. In June 2026, South
Korea concluded a record-breaking offshore wind auction, with
almost 3.7 GW of bids submitted for the 1.8 GW of capacity on offer,
while markets such as Taiwan are actively refining auction frameworks
to unlock stalled capacity and support long-term deployment targets.
These developments reflect the growing maturity of the Asia-Pacific
market, where Cadeler continues to expand its presence.
As the focus in the industry gradually shifts towards the market
post-2030, Cadeler expects strong growth towards the end of the
decade and beyond. The undersupply of capable installation vessels
is expected to increase further as the existing fleet ages and becomes
inefficient. Cadeler remains highly optimistic on the outlook for its
core segments — wind turbine and foundation installation and heavy
operations & maintenance — and has underpinned this conviction
with the order of two additional T-class vessels and a dedicated scour
protection vessel, further strengthening the largest and most capable
purpose-built fleet in the industry.
Cadeler’s guidance for 2026 is subject to risks and uncertainties,
many of which are beyond the Company’s control. Market-shaping
events such as economic turbulence, workforce shortages, supply
chain disruptions, strikes, embargoes, political instability, or adverse
weather conditions could impact operations. Vessel off-hire periods
due to accidents, technical issues, or contractual non-performance
may also affect project execution. Furthermore, delays, cancellations,
or changes to contract terms, crewing, or administrative costs could
materially influence earnings.

14
15
Interim condensed
consolidated
financial
statements

16
Interim condensed consolidated statement of profit or loss and
other comprehensive income
EUR'000 | Note | H1 2026 | H1 2025 |
Revenue | 3 | 407,529 | 298,535 |
Cost of sales | 3 | (246,471) | (100,234) |
Gross profit | 161,058 | 198,301 | |
Net other operating income and expenses | 935 | 2,854 | |
Administrative expenses | (40,681) | (33,201) | |
Operating profit | 121,312 | 167,954 | |
Financial income | 8,039 | 4,747 | |
Financial expenses | 8 | (42,528) | (1,576) |
Profit before income tax | 86,823 | 171,125 | |
Income tax credit/(expense) | 1,078 | (3,392) | |
Profit for the period | 87,901 | 167,733 | |
Profit for the period attributable to: | |||
Equity holders of the parent | 87,901 | 167,733 | |
Earnings per share | |||
Basic, profit/(loss) for the period attributable to ordinary equity holders of the parent (EUR per share) | 4 | 0.24 | 0.48 |
Diluted, profit/(loss) for the period attributable to ordinary equity holders of the parent (EUR per share) | 4 | 0.23 | 0.48 |
EUR'000 | Note | H1 2026 | H1 2025 |
Other comprehensive income/loss | |||
Items that may be reclassified to profit or loss | |||
Cash flow hedges - changes in fair value | 9 | 9,813 | (21,779) |
Cash flow hedges - items recycled | 9 | (82) | (2,772) |
Cash flow hedges - cost of hedging | 9 | 1,064 | (5,535) |
Other comprehensive (loss)/income after tax | 10,795 | (30,086) | |
Total comprehensive income/loss for the period, net of tax | 98,696 | 137,647 | |
Total comprehensive income/loss attributable to: | |||
Equity holders of the parent | 98,696 | 137,647 |
17
Interim condensed consolidated balance sheet
EUR'000 | Note | June 30 2026 | December 31 2025 |
Intangible assets | 19,345 | 19,432 | |
Property, plant and equipment | 5 | 3,006,015 | 2,937,060 |
Right-of-use assets | 11,760 | 12,598 | |
Leasehold deposits | 1,163 | 1,141 | |
Derivative assets | 8 | 3,025 | 2,419 |
Other non-current assets | 52,810 | 54,069 | |
Total non-current assets | 3,094,118 | 3,026,719 | |
Inventories | 4,163 | 3,540 | |
Trade and other receivables | 124,973 | 139,029 | |
Contract assets | 3 | 92,583 | 81,923 |
Prepayments | 17,932 | 13,523 | |
Current derivative assets | 8 | 4,134 | 263 |
Cash and cash equivalents | 206,191 | 151,679 | |
Total current assets | 449,976 | 389,957 | |
Total assets | 3,544,094 | 3,416,676 | |
EUR'000 | Note | June 30 2026 | December 31 2025 |
Share capital | 7 | 51,841 | 47,144 |
Share premium | 1,265,133 | 1,099,495 | |
Treasury shares | (3,515) | (2,999) | |
Reserves | 29,218 | 18,423 | |
Retained earnings | 430,920 | 341,613 | |
Total equity | 1,773,597 | 1,503,676 | |
Lease liabilities | 10,796 | 12,482 | |
Deferred tax liabilities | 12,569 | 13,256 | |
Deferred revenue | 3 | 5,035 | 30,901 |
Debt to credit institutions | 8 | 1,459,571 | 1,494,623 |
Derivative liabilities | 8 | 5,248 | 10,654 |
Total non-current liabilities | 1,493,219 | 1,561,916 | |
Trade and other payables | 69,414 | 98,208 | |
Payables to related parties | 9 | — | 272 |
Deferred revenue | 3 | 71,780 | 128,716 |
Current lease liabilities | 1,897 | 1,057 | |
Current income tax liabilities | 386 | 3,638 | |
Current debt to credit institutions | 8 | 133,358 | 116,131 |
Current derivative liabilities | 8 | 443 | 3,062 |
Total current liabilities | 277,278 | 351,084 | |
Total liabilities | 1,770,497 | 1,913,000 | |
Total equity and liabilities | 3,544,094 | 3,416,676 |
18
Interim condensed consolidated statement of changes in equity
Reserves | ||||||||
EUR'000 | Share capital | Share premium | Treasury shares | Hedging reserves | Cost of hedging reserves | Foreign currency translation reserve | Retained earnings | Total |
2026 | ||||||||
At 1 January 2026 | 47,144 | 1,099,495 | (2,999) | (8,381) | (577) | 27,381 | 341,613 | 1,503,676 |
Profit for the period | 87,901 | 87,901 | ||||||
Other comprehensive income for the period | 9,731 | 1,064 | 10,795 | |||||
Total comprehensive income for the period | — | — | — | 9,731 | 1,064 | — | 87,901 | 98,696 |
Capital increase March 2026 | 4,697 | 169,502 | 174,199 | |||||
Costs incurred in connection with March 2026 capital increase | (3,864) | (3,864) | ||||||
Treasury shares | (516) | (516) | ||||||
Share-based payments | 1,406 | 1,406 | ||||||
End of 30 June 2026 | 51,841 | 1,265,133 | (3,515) | 1,350 | 487 | 27,381 | 430,920 | 1,773,597 |
2025 | ||||||||
At 1 January 2025 | 47,144 | 1,099,495 | (1,283) | (3,332) | 5,131 | 27,381 | 59,358 | 1,233,894 |
Profit for the period | 167,733 | 167,733 | ||||||
Other comprehensive income for the period | (24,551) | (5,535) | (30,086) | |||||
Total comprehensive profit for the period | — | — | — | (24,551) | (5,535) | — | 167,733 | 137,647 |
Treasury shares | (1,716) | (1,716) | ||||||
Share-based payments | 1,102 | 1,102 | ||||||
End of 30 June 2025 | 47,144 | 1,099,495 | (2,999) | (27,883) | (404) | 27,381 | 228,193 | 1,370,927 |
19
Interim condensed consolidated statement of cash flows
EUR'000 | Note | H1 2026 | H1 2025 |
Cash flow from operating activities | |||
Profit/(loss) for the period | 87,901 | 167,733 | |
Adjustments of non-cash items | 6 | 114,405 | 49,961 |
Changes in working capital | 6 | (122,451) | (145,943) |
Income tax paid | (2,959) | (711) | |
Interest received | 2,592 | 450 | |
Net cash provided by operating activities | 79,488 | 71,490 | |
Cash flow from investing activities | |||
Additions to property, plant and equipment | 5 | (132,498) | (672,217) |
Movements in other non-current assets | 1,259 | (6,801) | |
Additions to intangible assets | (160) | (987) | |
Leasehold deposits | (22) | (76) | |
Settlement of derivative instrument | (2,116) | — | |
Net cash used in investing activities | (133,537) | (680,081) |
EUR'000 | Note | H1 2026 | H1 2025 |
Cash flow from financing activities | |||
Principal repayment of lease liabilities | (1,228) | (934) | |
Interest paid | (37,558) | (21,166) | |
Proceeds from borrowing net of bank fees | 77,988 | 644,057 | |
Proceeds from issue of share capital | 7 | 174,199 | — |
Transactional costs on issues of shares | 7 | (3,864) | — |
Repurchase of treasury shares | 7 | (516) | (1,716) |
Bank charges | (1,223) | (56) | |
Repayment of loan | (98,874) | (23,829) | |
Net cash provided by financing activities | 108,924 | 596,356 | |
Net (decrease)/increase in cash and cash equivalents | 54,875 | (12,235) | |
Cash and cash equivalents at beginning of the period | 151,679 | 51,155 | |
Effect of exchange rate on cash and cash equivalents | (363) | — | |
Cash and cash equivalents at end of the period | 206,191 | 38,920 |

20
Notes to the interim condensed consolidated
financial statements
Note 1 |
Note 2 |
Note 3 |
Note 4 |
Note 5 |
Note 6 |
Note 7 |
Note 8 |
Note 9 |
Note 10 |
Note 11 |
a
21
Notes to the interim
condensed
consolidated
financial
statements
22
Note 1
General information
Corporate information
Cadeler A/S (the “Company” or the “Group”) is incorporated and
domiciled in Denmark. The address of its registered office is Kalvebod
Brygge 43, DK-1560 Copenhagen, Denmark. The Company is listed
on the New York Stock Exchange (ticker: CDLR) and the Oslo Stock
Exchange (ticker: CADLR).
The Group is a global leader in offshore wind installation, operations,
and maintenance services headquartered in Copenhagen, Denmark.
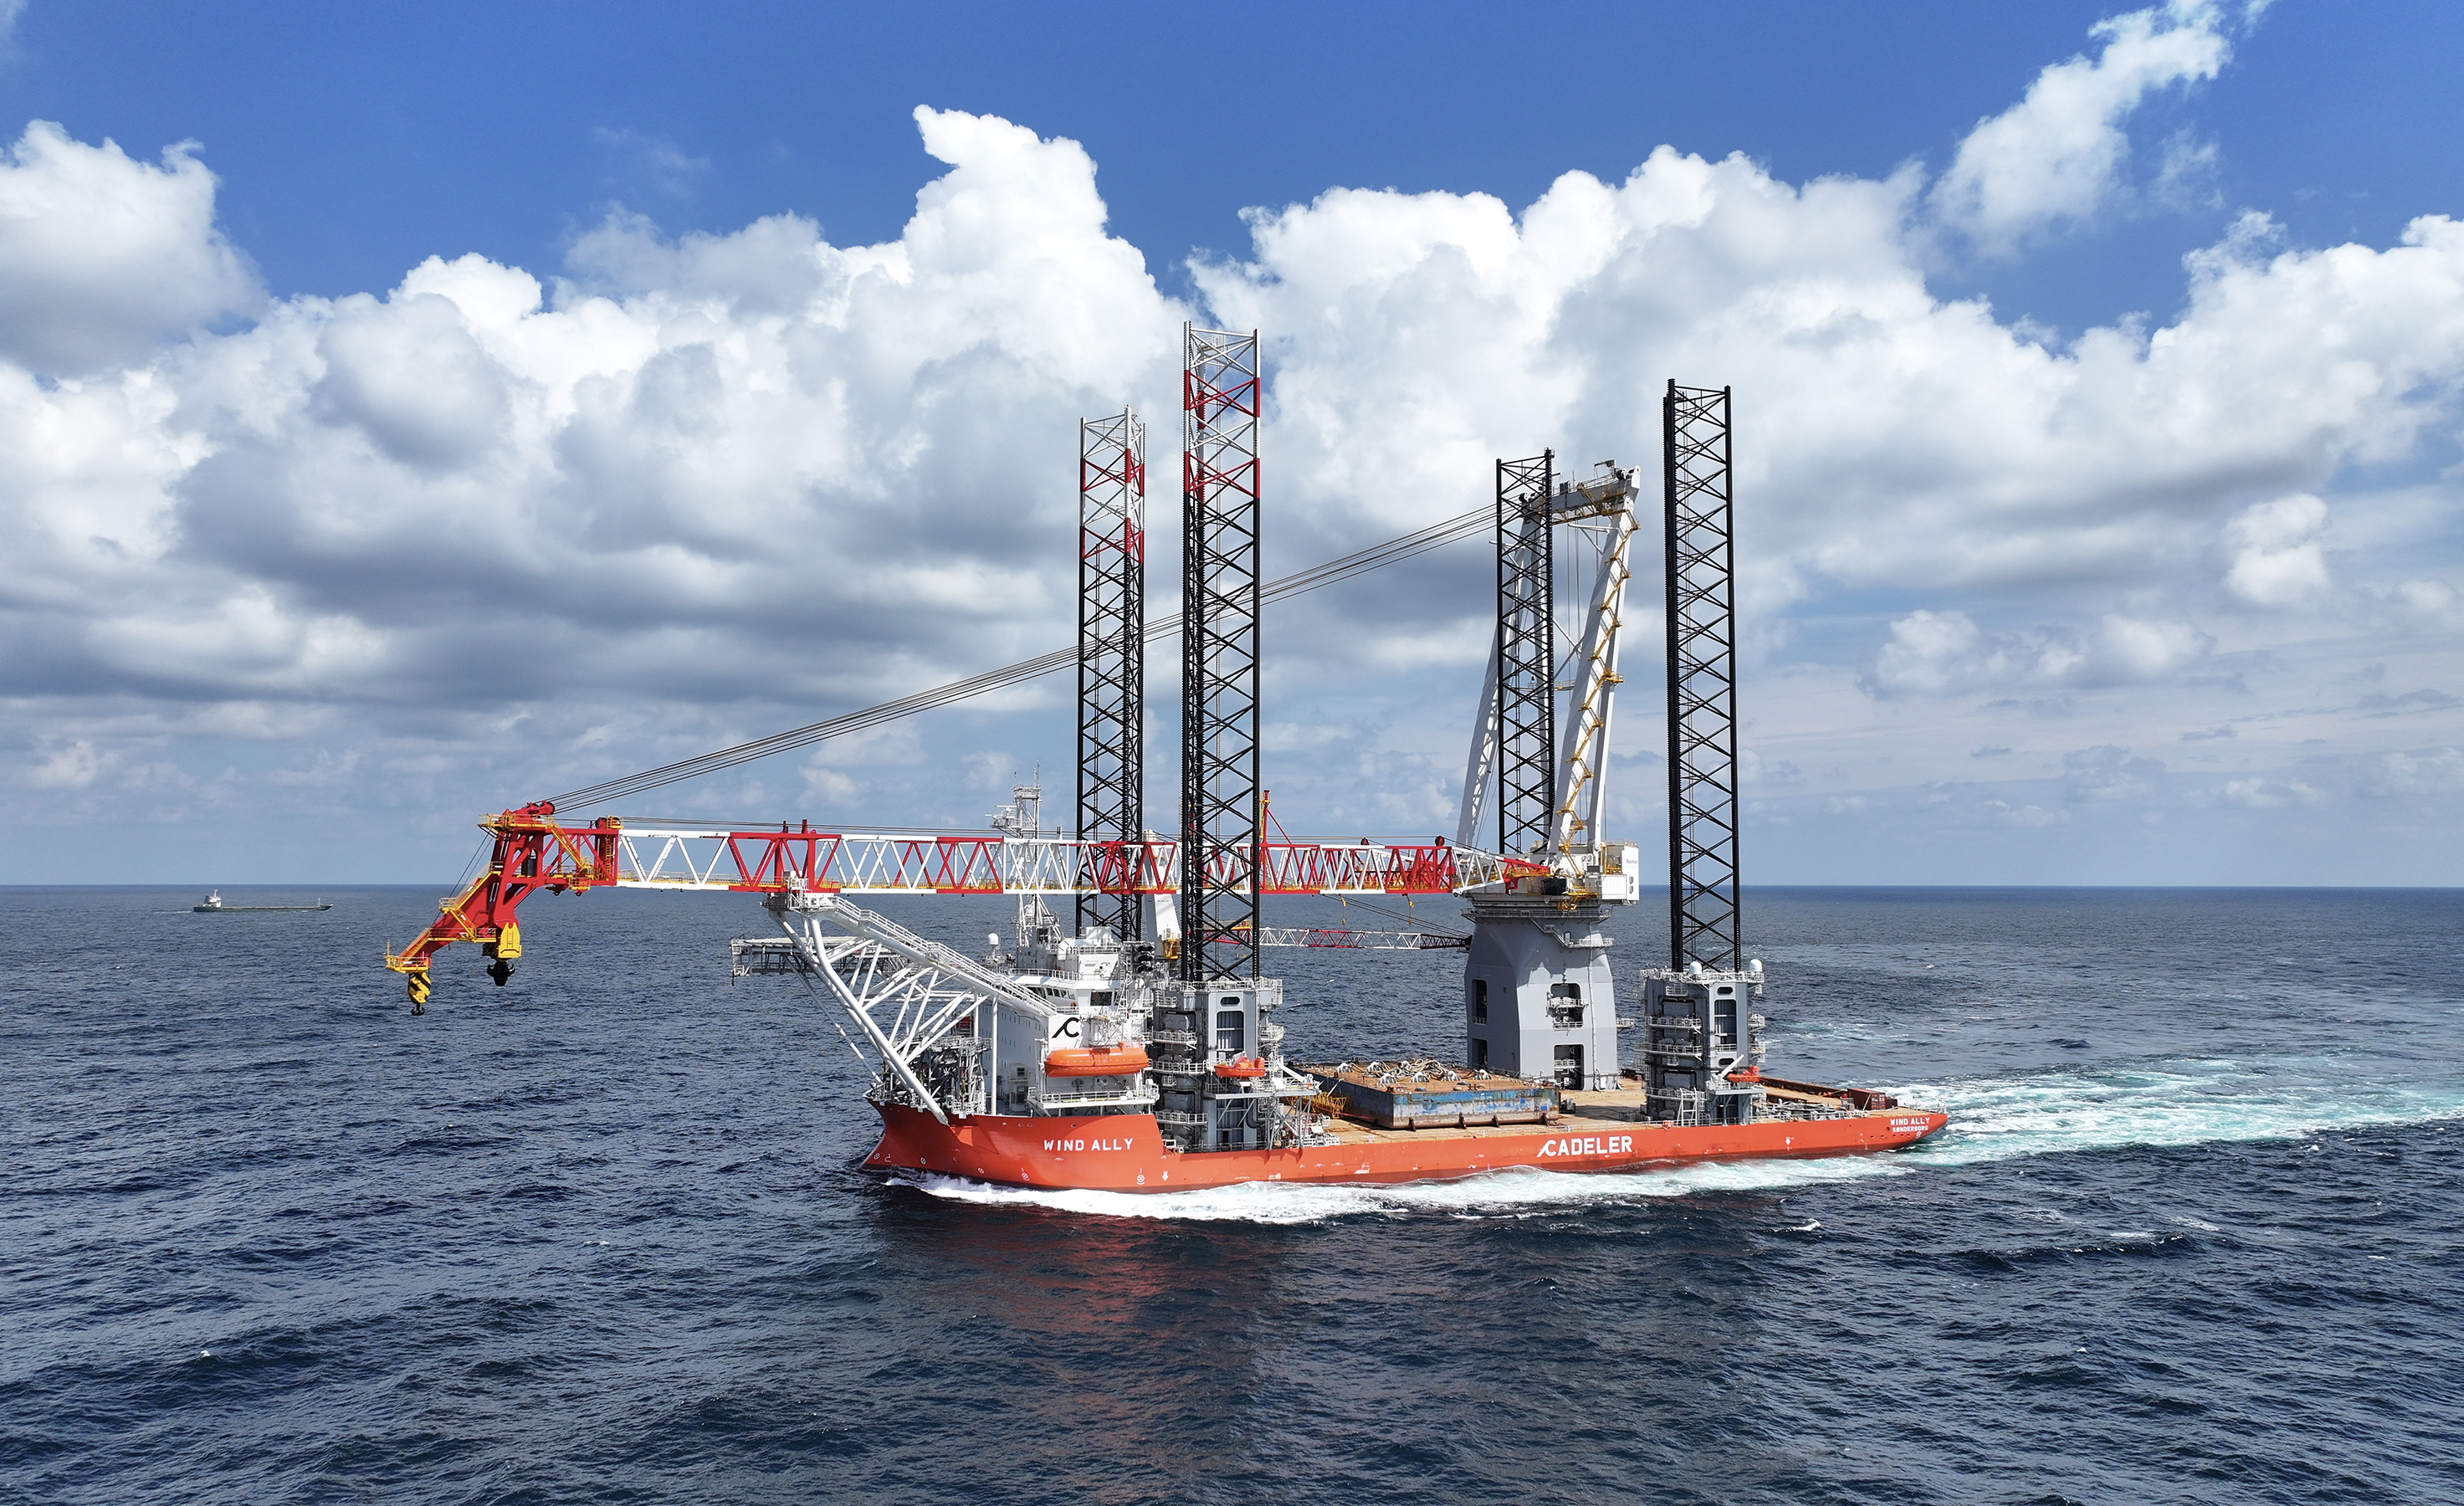
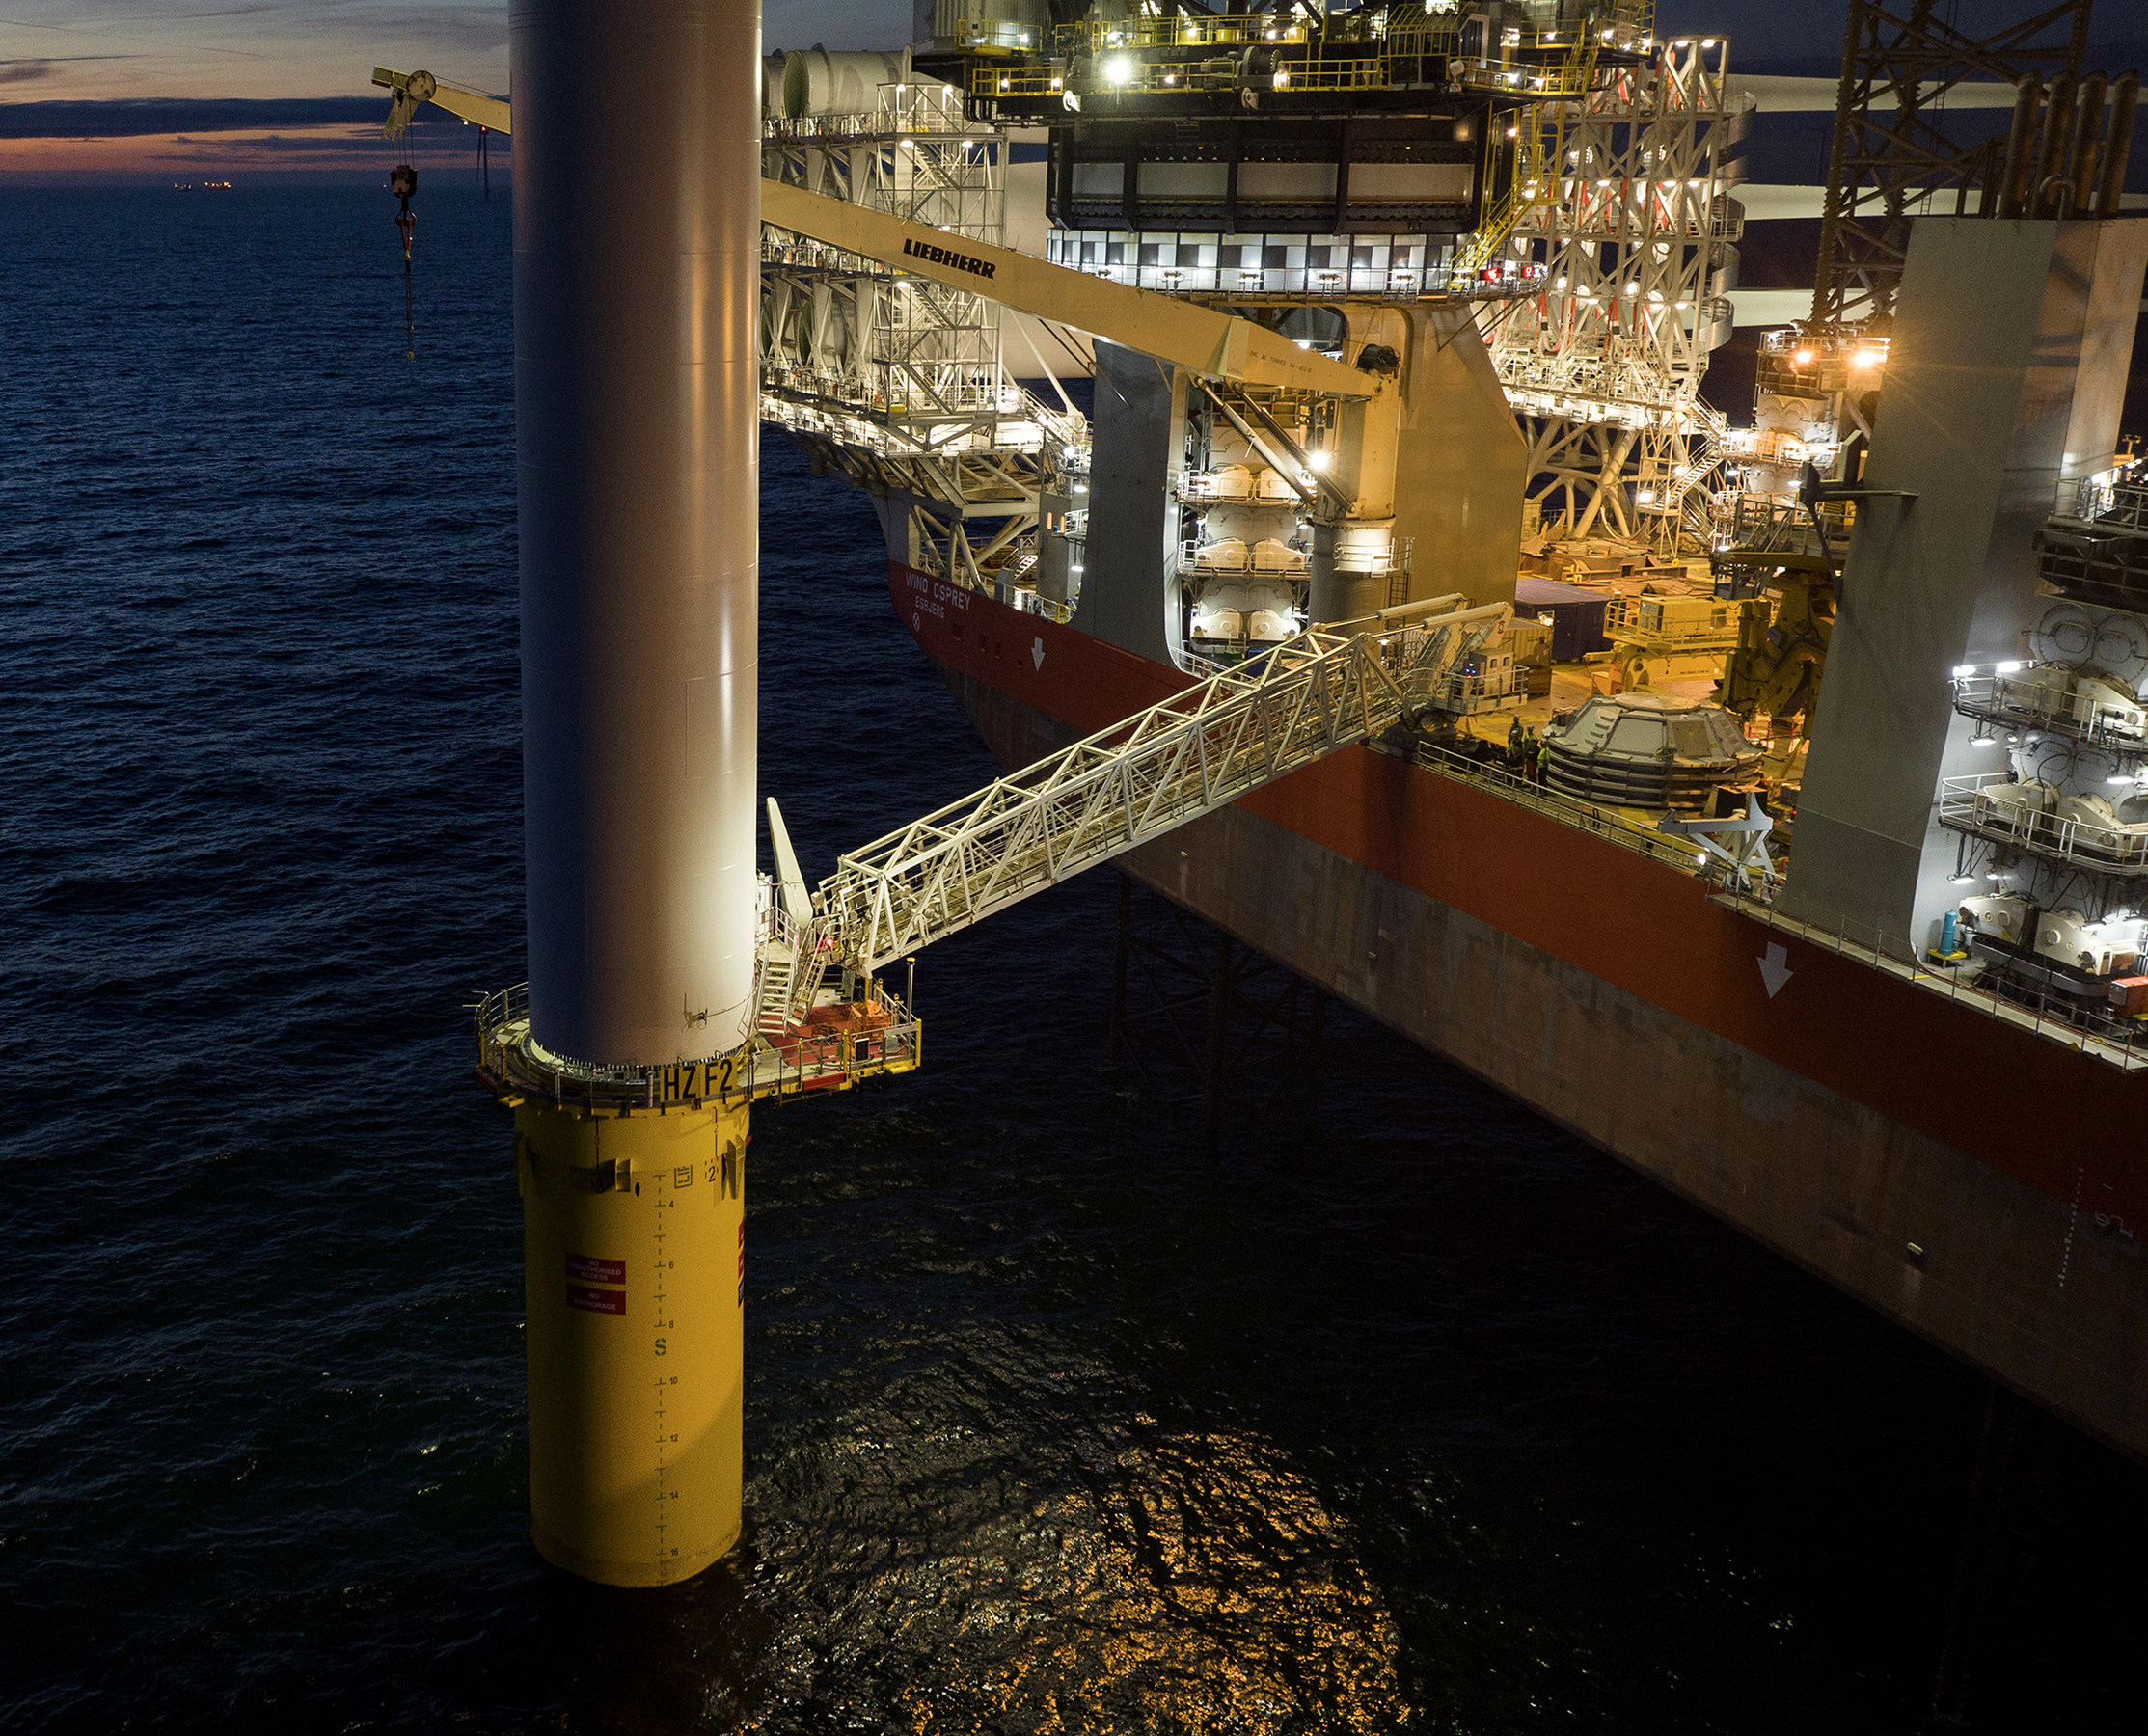
As at 30 June 2026, the Group owns ten offshore jack-up Wind
Turbine Installation Vessels (WTIVs): Wind Orca, Wind Osprey, Wind
Scylla, Wind Zaratan, Wind Peak, Wind Pace, Wind Maker, Wind
Keeper, Wind Ally and Wind Mover. Subsequent to the reporting
period, Cadeler took delivery of Wind Ace, the Company's eleventh
wind installation vessel and second A-class newbuild. In addition to
wind farm installation, these vessels can perform maintenance,
construction, decommissioning, and other tasks within the offshore
industry.
The interim condensed consolidated financial statements of the
Group are composed of the financial statements of Cadeler A/S and
its subsidiaries (which are all wholly owned by the Parent Company
Cadeler A/S). For more information on the subsidiaries of Cadeler A/S
please refer to Note 29 to the consolidated financial statements for
2025.
The interim condensed consolidated financial statements for the six
months ended 30 June 2026 are unaudited and not reviewed.
23
Note 2
Basis of presentation and other significant accounting policies
2.1. Basis for preparation
The interim condensed consolidated financial statements for the six
months ended 30 June 2026 have been prepared in accordance with
IAS 34 Interim Financial Reporting as issued by the International
Accounting Standards Board (IASB) and as endorsed by the EU, and
with the additional requirements in the Danish Financial Statements
Act applicable to interim reports of listed companies.
The interim condensed consolidated financial statements do not
include all the information and disclosures required in the annual
consolidated financial statements and should be read in conjunction
with the Group’s annual consolidated financial statements as of 31
December 2025.
The accounting policies, judgements and estimates are consistent
with those applied in the Annual Report for 2025. For a complete
description of accounting policies, see Note 2 to the consolidated
financial statements for 2025.
The interim condensed consolidated financial statements are
presented in euros and all values are rounded to the nearest
thousand, except when otherwise indicated.
Going concern assessment
The Company’s Board of Directors and Executive Directors have, at the
time of approving the interim condensed consolidated financial
statements, assessed that the Group has adequate resources to continue
as a going concern at least 12 months after the balance sheet date.
Thus, the Group continues to adopt the going concern basis of
accounting in preparing the interim condensed consolidated financial
statements.
2.2. Changes in accounting policies and disclosures
2.2.1. New accounting policies and disclosures
The Group has adopted standards and interpretations effective as of
1 January 2026, including the amendments to IFRS 9 Financial
Instruments and IFRS 7 Financial Instruments.
Adoption of new, amended standards and interpretations had no
material impact on the Group’s consolidated financial statements.
2.2.2. Standards issued but not yet effective
The IASB has issued several new and amended accounting standards
(IFRS) and interpretations (IFRS IC). The Group has assessed these
new and amended accounting standards and interpretations, and
does not anticipate any of them to have any material impact on
recognition or measurement in the consolidated financial statements.
IFRS 18 Presentation and Disclosure in Financial Statements, which
was issued in April 2024, becomes effective for reporting periods
beginning on or after 1 January 2027 and replaces IAS 1 Presentation
of Financial Statements, for more information see note 2.3.2 to the
consolidated financial statements as of 31 December 2025.
The Group is currently working to further identify and analyse the
implications on the consolidated financial statements. Our
interpretation of the application may evolve as additional guidance
will become available.
The Group expects to adopt the accounting standards and
interpretations as they become mandatory.
2.3. Material accounting judgements, estimates and
assumptions
The preparation of the Group’s interim condensed consolidated
financial statements requires management to make judgements,
estimates and assumptions that affect the reported amounts of
revenue, expenses, assets and liabilities, accompanying disclosures,
and the disclosure of contingent liabilities. Uncertainty about these
assumptions and estimates could result in outcomes that require a
material adjustment to the carrying amount of assets or liabilities
affected in future periods.
The following accounting judgements, estimates and assumptions,
which Management deems to be material to the preparation of the
interim condensed consolidated financial statements, are unchanged
from year-end 2025:
•Useful life of vessels
•Income tax
•Impairment of non-financial assets
•Identification of CGU for the purpose of goodwill
impairment
•Revenue recognition
•Macroeconomic factors and climate risks
Refer to Note 2.4 to the consolidated financial statements for 2025.
24
Note 3
Revenue
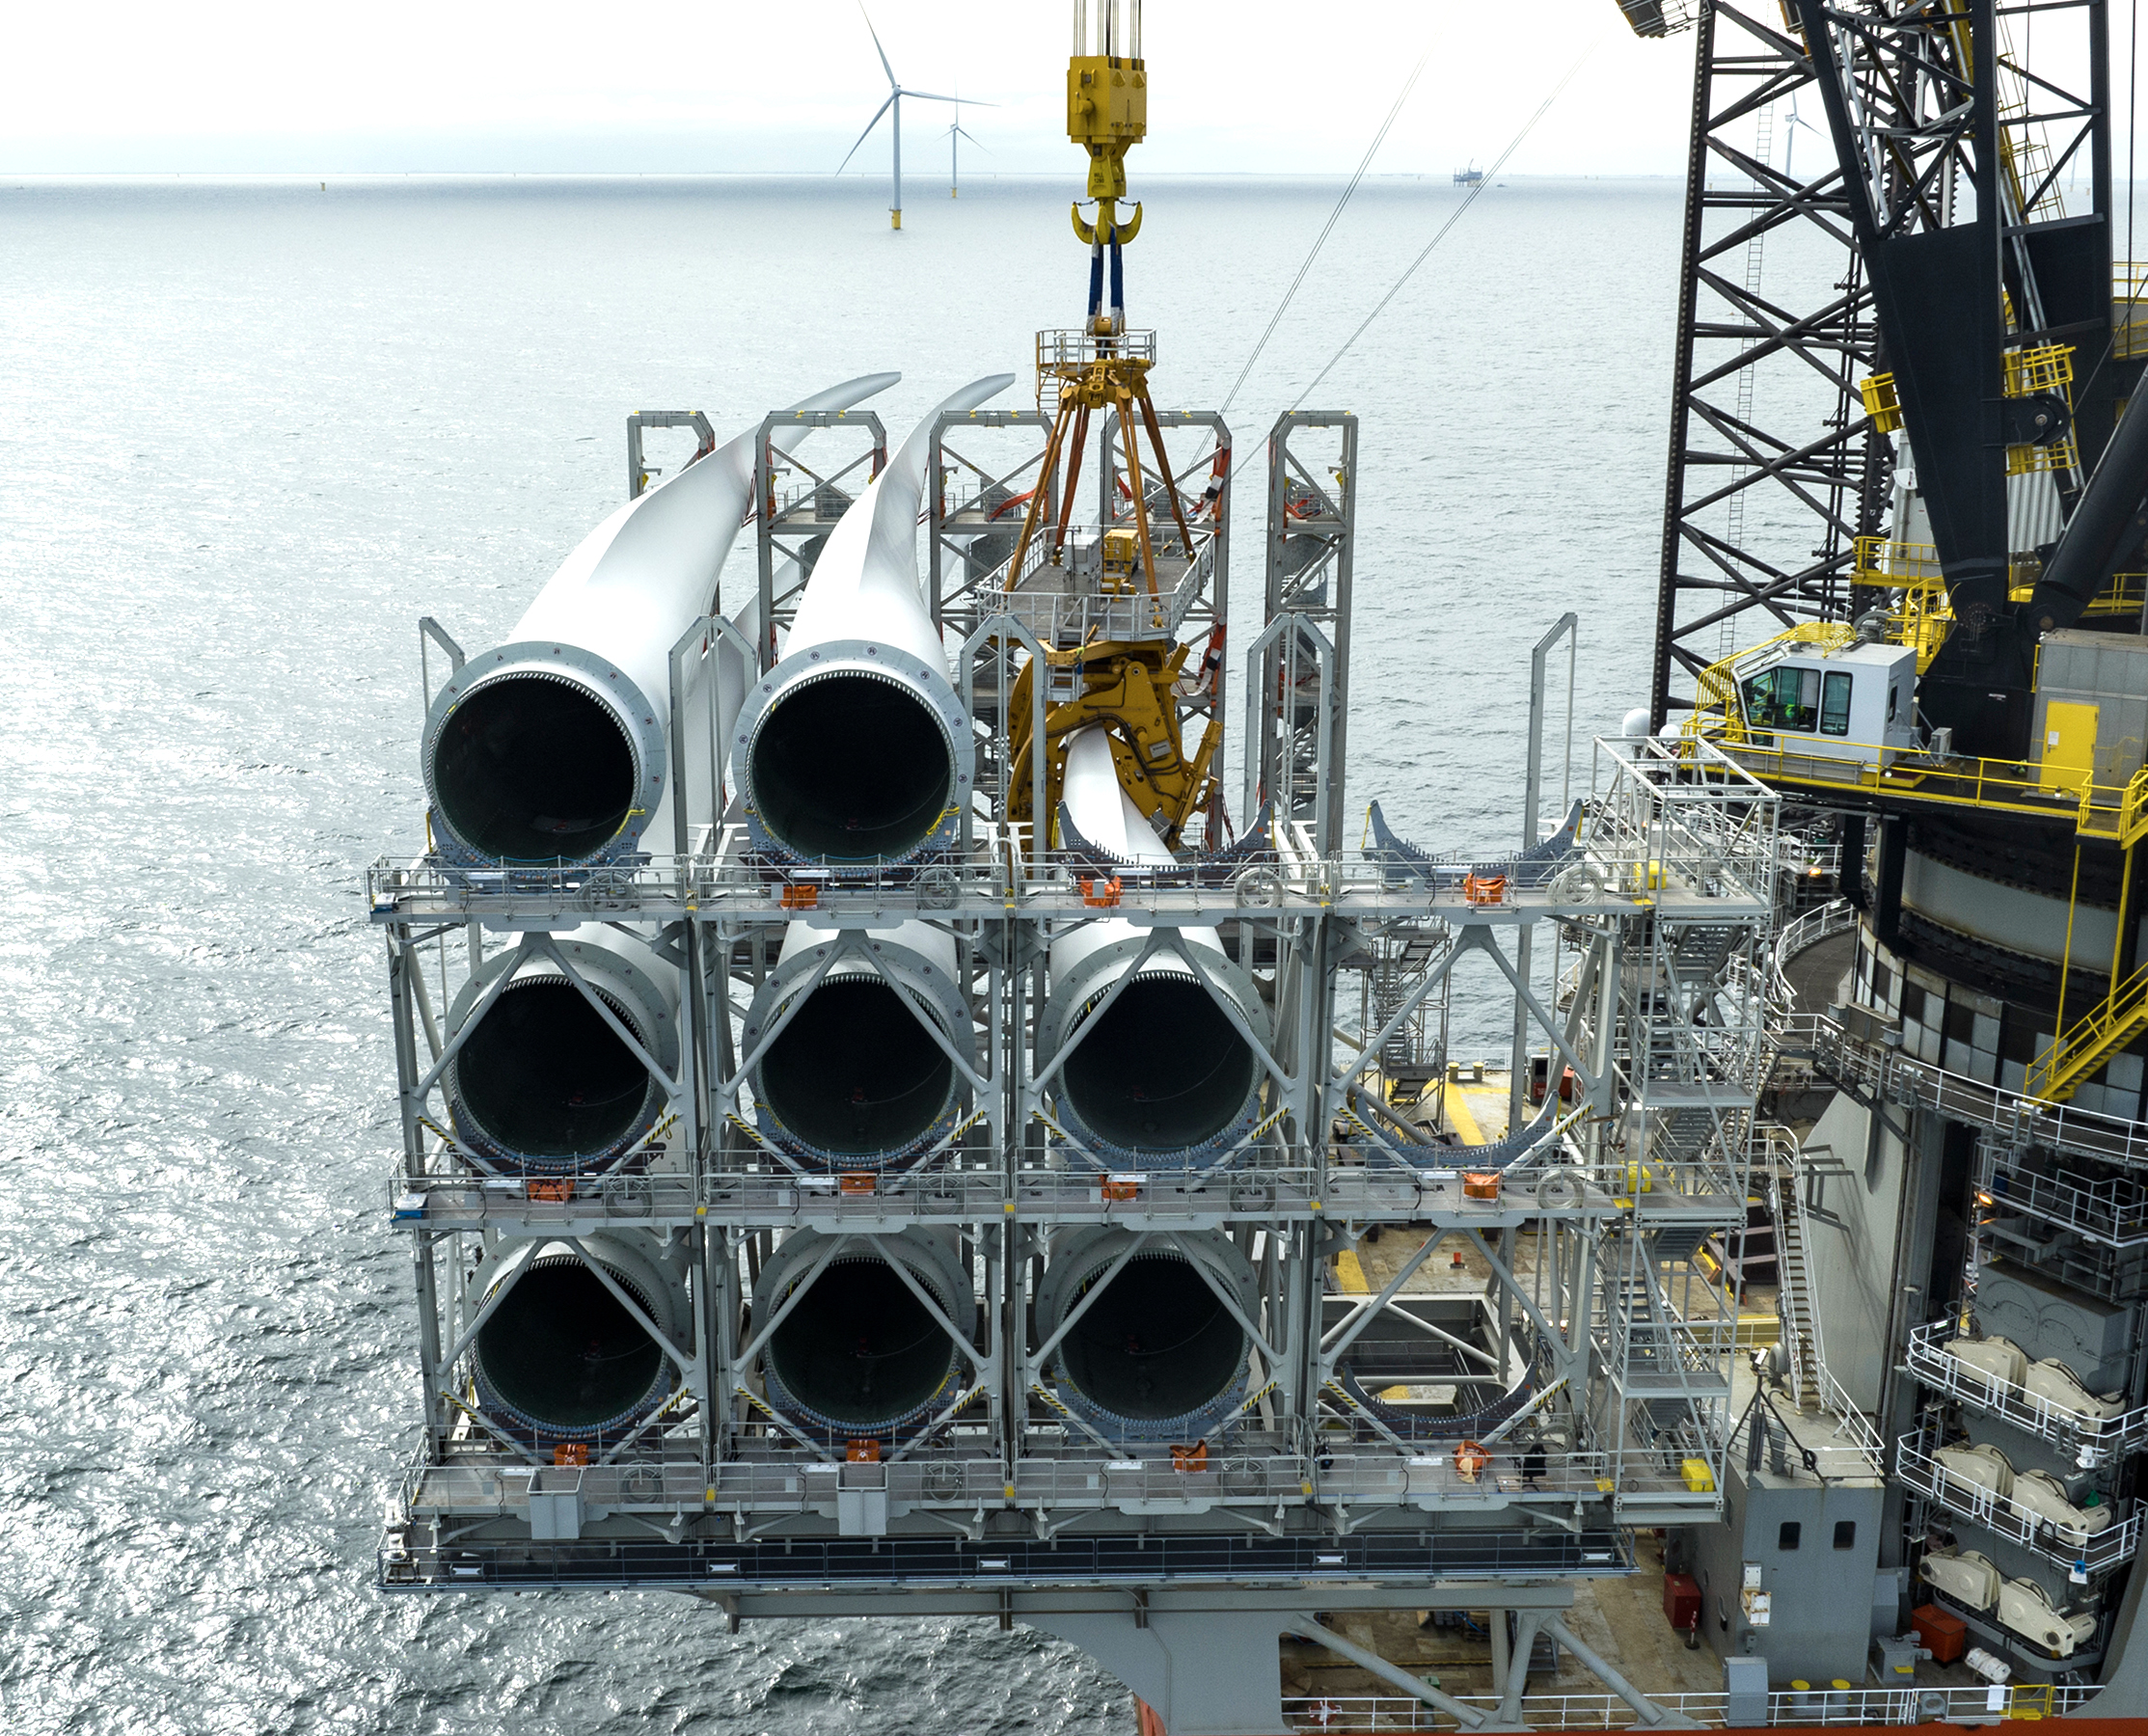
The Group is a leading supplier to the offshore wind industry,
specialising in T&I and O&M services rendered to customers in Europe,
Asia, and the United States. The Group owns and operates the world's
largest, most advanced, and most flexible fleet of wind turbine transport
and installation vessels. The Group’s revenue is dependent on project
contracts and vessel charters for the employment and utilisation of the
vessels. The customers are typically major project developers or energy
companies that operate globally, and the current order backlog spans a
number of years. Refer to separate information on major customers and
order backlog below. The Group operates ten vessels compared to
seven operating vessels at the same point in 2025. The increase in the
number of operating vessels in 2026 compared to 2025 is the main
driver for increased revenue.
The Group derives its revenue from fees charged to our customers for
the use of our vessels and related services. The Group’s contracts with
customers comprises the following main revenue-generating
activities:
Time-charter activities represents revenue earned from time charter
contracts and time charter related activities. Revenue from time
charter hire services are contracts with customers where the Group
utilises its vessels, equipment and crew to deliver a service to the
customer normally based on either a fixed day rate or milestone
deliverables. Contracts may also include other promises such as
mobilisation and demobilisation, provision of bunker services,
catering and accommodation.
Transportation and installation activities (T&I) represents contracts
with customers where the Group utilises its vessels, equipment and
crew to perform the transportation and installation of offshore wind
turbine foundations as well as heavy lifting operations,
decommissioning and planning and engineering.
Other revenue represents cost recharges and other personnel
services revenue, as well as early termination fees by customers.
25
Note 3
Revenue
Continued from previous page
Disaggregation of revenue from contracts with customers by activity
The following table provides information about disaggregated revenue.
EUR'000 | H1 2026 | H1 2025 |
Revenue disaggregation | ||
Time charter services and transportation and installation services | 403,789 | 178,163 |
Other revenue, including fees earned for early termination of contracts by customers | 3,740 | 120,372 |
Total revenue | 407,529 | 298,535 |
Other revenue, for the first six months of 2025 includes termination fees of EUR 111 million received under a
Long-Term Agreement (LTA).
For the period ended 30 June 2026, the lease component, included within time charter services and
transportation and installation services, amounts to EUR 142 million (H1 2025: EUR 85 million). The lease
component is calculated by applying the estimated bareboat charter day-rate to the on-hire days.
For the period ended 30 June 2026, Cost of sales amounted to EUR 246 million which was EUR 146 million
higher than the EUR 100 million reported for H1 2025, driven mainly by the addition of newly built vessels
becoming part of the Group’s fleet and operating in the market.
Operating segments and geographical information
Operating segments
The Group’s ten windfarm installation vessels (WFIVs) operate in a global market and are often redeployed
to different regions due to changing customers or contracts. Accordingly, the Group reports its operations
as a single reportable segment.
Geographical revenue split
The following table presents financial information by country and region based on the location of the
service provided. Individual countries are shown if they are above 10% of revenue.
EUR'000 | H1 2026 | H1 2025 |
Total revenue by country and region | ||
Denmark | — | 48 |
UK | 287,704 | 153,775 |
Germany | 9,467 | 42,340 |
Poland | 41,884 | 7,106 |
Europe | 339,055 | 203,269 |
United States | 62,900 | 47,938 |
Americas | 62,900 | 47,938 |
Taiwan | 5,574 | 47,328 |
Asia | 5,574 | 47,328 |
Total Revenue | 407,529 | 298,535 |
26
Note 3
Revenue
Continued from previous page
Major customers
For the period ended 30 June 2026, revenue from four customers each exceeded 10% of total revenue. The
revenue derived from these four customers was EUR 158 million, EUR 64 million, EUR 47 million, and
42 million respectively.
For the period ended 30 June 2025, revenue from four customers each exceeded 10% of total revenue. The
revenue derived from these four customers was EUR 121 million, EUR 41 million, EUR 40 million and EUR 33
million respectively.
27
Note 3
Revenue
Continued from previous page
Contract backlog
The Group's order backlog including options as of 30 June 2026
amounts to EUR 2.5 billion (H1 2025: EUR 2.0 billion). EUR 1,103 million
of the backlog pertains to contracts that management expects to
recognise within one year, if all options are exercised.
The following table presents the aggregate amount of the revenues
expected to be realised in the future from partially or fully unsatisfied
performance obligations as we perform under the contracts. We
disclose both the value of firm contracts and a contract backlog
including options (non-GAAP measure). The values include all new
contracts signed at the reporting date:
EUR million | Within 1 year | After 1 year | Total |
Contract Backlog | |||
Firm, excluding options | 979 | 1,138 | 2,117 |
Options considered as contingent considerations for revenue recognition purposes | 62 | 123 | 185 |
Options not considered as contingent considerations for revenue recognition purposes | 62 | 123 | 185 |
Total as of 30 June 2026 | 1,103 | 1,384 | 2,487 |
Firm, excluding options | 593 | 1,149 | 1,742 |
Options considered as contingent considerations for revenue recognition purposes | 53 | 87 | 140 |
Options not considered as contingent considerations for revenue recognition purposes | 53 | 87 | 140 |
Total as of 30 June 2025 | 699 | 1,323 | 2,022 |
Total contract backlog represents estimated transaction price for unfulfilled performance obligations, including both fixed and variable
consideration. Options that are considered for revenue recognition purposes and options not considered for revenue recognition purpose,
represent 50% each of the variable portion of the backlog. Contract backlog excludes vessel reservation agreements and preferred supplier
agreements. All contracts may be subject to future modifications, and off-hire days, that might impact the amount and/or timing of revenue
recognition.
1
28
Note 3
Revenue
Continued from previous page
Contract costs, assets and deferred revenue
Customers are typically invoiced monthly, when the vessels are on contract, with normal payment terms
between 30-60 days. Payment terms with customers are considered industry standard and do not include a
significant financing component. To the extent possible, we obtain payment guarantees to minimise the
credit risk during the contract term.
Sometimes revenue is recognised for work performed prior to issuance of invoice to customer and it will be
reported as a contract asset. For more information about contract assets at the reporting period, refer to
Note 16 to the consolidated financial statements for 2025. When the right to consideration is conditional
only on the passage of time, the balance does not meet the definition of a contract asset and is classified
as an unbilled receivable. This typically arises where the timing of the related billing cycle occurs in a period
after the performance obligation is satisfied.
Deferred revenue relates to consideration received from customers for unsatisfied performance obligations.
Revenue will be recognised when the related services are provided to the customers, which is almost
entirely within 12 months.
Incremental costs of obtaining a contract and certain costs to fulfil a contract to be recognised as a
contract asset if certain criteria are met. Any capitalised contract assets are amortised on a systematic basis
that is consistent with the transfer of the related goods or services to the customer.
Refer to Note 3 to the consolidated financial statements for 2025 for further information on the Group’s
accounting policies for revenue recognition.
EUR'000 | H1 2026 | H1 2025 |
Deferred revenue at 1 January | 159,617 | 47,337 |
Deferred during the period | 22,619 | 66,748 |
Recognised as revenue during the period | (105,421) | (25,764) |
Total deferred revenue at end of period | 76,815 | 88,321 |
Current | 71,780 | 79,984 |
Non-current | 5,035 | 8,337 |
29
Note 4
Earnings per share (EPS)
The following table reflects the income and share data used in the basic and diluted EPS calculations:
EUR'000 | H1 2026 | H1 2025 |
Profit attributable to ordinary equity holders of the parent for basic earnings | 87,901 | 167,733 |
Thousands | H1 2026 | H1 2025 |
Weighted average number of ordinary shares for basic EPS | 369,959 | 350,957 |
Effect of dilution from share-based payments programme | 5,700 | 1,404 |
Weighted average number of ordinary shares adjusted for the effect of dilution¹ | 375,659 | 352,361 |
Earnings per share | H1 2026 | H1 2025 |
Basic, profit/(loss) for the period attributable to ordinary equity holders of the parent (EUR per share) | 0.24 | 0.48 |
Diluted, profit/(loss) for the period attributable to ordinary equity holders of the parent (EUR per share) | 0.23 | 0.48 |
The weighted average number of ordinary shares considers the weighted average effect of treasury shares
during the period.
Refer to Note 11 to the consolidated financial statements for 2025 for further information on the Group’s
accounting policies for EPS.
There have been no other transactions involving ordinary shares or potential ordinary shares between the reporting date and the date
of authorisation of these financial statements.
1The weighted average number of shares considers the weighted average effect of share-based payments during the period.
30
Note 5
Property, plant and equipment
EUR'000 | Vessels | Dry dock | Other fixtures and fittings | Assets under construction | Total |
Cost 2026 | |||||
January 1, 2026 | 2,509,058 | 38,911 | 6,678 | 600,076 | 3,154,723 |
Additions | 4,824 | 4,660 | 1,399 | 142,990 | 153,873 |
Transfer from assets under construction | 383,614 | 6,563 | — | (390,177) | — |
Disposals | — | — | — | — | — |
Exchange differences | — | — | — | — | — |
30 June 2026 | 2,897,496 | 50,134 | 8,077 | 352,889 | 3,308,596 |
Accumulated depreciation and impairment | |||||
January 1, 2026 | 201,734 | 12,967 | 2,964 | — | 217,665 |
Depreciation charge | 79,343 | 4,587 | 986 | — | 84,916 |
Disposals | — | — | — | — | — |
Exchange differences | — | — | — | — | — |
30 June 2026 | 281,077 | 17,554 | 3,950 | — | 302,581 |
Net book value | 2,616,419 | 32,580 | 4,127 | 352,889 | 3,006,015 |
Additions during the first half of 2026 are driven by down payments of EUR 142 million for the A-class
foundation installation vessels (EUR 95 million), Wind Keeper installation vessel (EUR 25 million), Wind Mover
vessel upgrade (EUR 11 million) and O-class and P-class vessel upgrades (EUR 11 million) represented above
on assets under construction.
Additions during the first half of 2025 are driven by down payments of EUR 691 million for the third A-class
foundation installation vessels (EUR 102 million), the P-class vessels (EUR 201 million), the M-class and Wind
Keeper installation vessels (EUR 374 million) and O-class vessel upgrades (EUR 14 million).
31
Note 5
Property, plant and equipment
Continued from previous page
Transfer from assets under construction during the first half of 2026 were mainly related to Wind Keeper
(EUR 251.3 million), vessel upgrades on Wind Ally (EUR 99.1 million), vessel upgrades on Wind Mover (EUR
18.9 million), vessel upgrades on Wind Pace (EUR 11.4 million), vessel upgrades on Wind Osprey (EUR 2.8
million) and dry dock on Wind Keeper (EUR 6.6 million) while in the comparative period they related to
newbuilt Wind Pace (EUR 326 million), newbuilt Wind Maker (EUR 356 million), vessel up grades on Wind
Peak (EUR 18 million), vessel upgrades on O-class vessels (EUR 11 million) and dry dock on Wind Osprey
(EUR 4 million).
Borrowing costs for H1 2026 have been capitalised in the total amount of EUR 12.5 million (H1 2025: EUR 29
million). The capitalisation rate used to determine the amount of borrowing costs to be capitalised is the
weighted average interest rate applicable to the Company’s general borrowings during the reporting
period, being 2.5% (H1 2025: 3.6%).
Impairment of non-financial assets
Property, plant and equipment and right-of-use assets are tested for impairment whenever there is
objective evidence or an indication that these assets may be impaired. There were no present indicators of
impairment as at 30 June 2026. For further information, refer to Note 12 to the consolidated financial
statements for 2025.
Refer to Note 13 to the consolidated financial statements for 2025 for further information on the Group’s
accounting policies for property, plant and equipment.
32
Note 6
Statement of cash flows specifications
EUR'000 | Note | H1 2026 | H1 2025 |
Adjustments of non-cash items | |||
Depreciation and amortisation | 86,303 | 44,542 | |
Finance income | (2,813) | (450) | |
Interest expenses | 28,393 | 247 | |
Finance costs | 1,586 | 56 | |
Income tax expense | (1,078) | 3,807 | |
Fair value change of derivative instruments through profit or loss | 8 | 608 | (289) |
Items recycled | — | 946 | |
Share-based payment expenses | 1,406 | 1,102 | |
Total adjustments of non-cash items | 114,405 | 49,961 |
Changes in working capital | Note | H1 2026 | H1 2025 |
Inventories | (623) | (1,230) | |
Trade receivables, contract assets, prepayments and other receivables | (1,013) | (175,692) | |
Trade and other payables | (37,741) | (9,983) | |
Payables to related parties | (272) | (22) | |
Deferred revenue | (82,802) | 40,984 | |
Net change in working capital | (122,451) | (145,943) |
33
Note 7
Issued share capital
EUR'000 | No. of shares (in thousands) | Total |
1 January 2025 | 350,957 | 47,143 |
30 June 2025 | 350,957 | 47,143 |
Issued in March 2026 for capital increase | 35,097 | 4,698 |
30 June 2026 | 386,054 | 51,841 |
On 25 March 2026, the Company completed a successful private placement, resulting in the issuance of
35,097 thousand shares at a price of NOK 56 per share. The Company raised EUR 174,199 thousand before
transaction costs.
As of 30 June 2026, the Group had share capital amounting to DKK 386,054 thousand, equal to EUR 51,841
thousand, consisting of 386,054,000 shares of nominal DKK 1 each.
All shares have equal rights.
Treasury shares
As of 30 June 2026, the Company holds 169,267 treasury shares.
On 27 May 2026, the Company completed a share buy-back programme to fulfil share-based incentive
obligations resulting in the repurchase of 105,275 shares of a nominal price of DKK 1 each at an average
price of NOK 62.66 and corresponding to an aggregate amount of EUR 611 thousand, including commission.
34
Note 8
Financial risk management
Financial risk factors
The Group’s activities expose it to market risk, including currency risk and interest rate risk, as well as credit
risk and liquidity risk.
The financial risk management of the Group is performed by the Treasury department and overseen by the
Management of Cadeler, the Board of Directors, and the Audit Committee. The fair value of the Group's
financial assets and liabilities as of 30 June 2026 does not deviate materially from the carrying amounts as of
30 June 2026.
Financial risks and how the Group manages them, are addressed in Note 23 to the consolidated financial
statements in the Annual Report 2025. The risks in 2026 remain similar in nature.
Quantitative and qualitative disclosures about market risk
Currency risk
The functional currency of Cadeler A/S is EUR, while the largest currency exposure of the Group relates to
future instalments for newbuild vessels, denominated in USD, amounting to USD 478 million. Further details
regarding the instruments currently used to mitigate this currency risk are provided in Note 24 to the
consolidated financial statements in the Annual Report 2025. The Group evaluates the potential costs and
benefits of currency exposure management on an ongoing basis.
Interest rate risk
The Group’s exposure to the risk of changes in market interest rates relates to its interest-bearing debt
obligations with a floating interest rate. Further details regarding the hedging instruments used to mitigate
this risk can be found in Note 24 to the consolidated financial statements in the Annual Report 2025.
Liquidity risk
The Group manages liquidity risk by maintaining sufficient cash and access to funding through committed
credit facilities to enable it to meet its operational requirements and instalment payments for the contracted
newbuild vessels. Please refer to Note 10 for a detailed disclosure of the contract obligation for the
construction of the newbuild vessels.
Change in debts to credit institutions during the period:
EUR'000 | H1 2026 | H1 2025 |
Debt to credit institutions at 1 January | 1,610,754 | 571,017 |
Loans repayments | (98,874) | (23,829) |
Proceeds from borrowings | 80,000 | 661,167 |
New loan fees | (2,012) | (11,259) |
Non-cash movements | 3,062 | 1,289 |
Total debt to credit institutions at end of period | 1,592,929 | 1,198,385 |
35
Note 8
Financial risk management
Continued from previous page
Fair value measurement
The Group measures derivatives at fair value at each balance sheet
date. Fair value is the price that would be received to sell an asset or
paid to transfer a liability in an orderly transaction between market
participants at the balance sheet date.
There are no significant changes in the methods used in determining
the fair value of the derivative financial instruments. Please refer to
Note 24 to the consolidated financial statements for 2025 for a
detailed description of the Group’s derivative financial instruments
and related accounting policies.
As of 30 June 2026, the fair value of the derivative assets amounted
to EUR 7,159 thousand (H1 2025: EUR 2,682 thousand) and derivative
liabilities amounted to 5,691 thousand (H1 2025: EUR 13,716
thousand). The variation primarily reflects the execution of certain
financial instruments, together with changes in interest rate
expectations in 2026 compared to 2025. These expectations were
driven by more persistent inflation and continued economic
resilience, resulting in higher interest rates and a stronger USD.
The fair value hierarchy for the above derivative financial instruments
is Level 2.
EUR'000 | H1 2026 | H1 2025 |
Derivative assets measured at fair value | ||
Interest rate swaps | 3,025 | 2,171 |
FX forward contracts | 3,255 | 511 |
FX option collars | 879 | — |
Total derivative assets | 7,159 | 2,682 |
Derivative liabilities measured at fair value | ||
Interest rate swap | 5,248 | 10,499 |
Interest recycled through OCI | 443 | 525 |
Time value of FX option collars through OCI | — | 576 |
Derivatives ineffective hedges | — | 2,116 |
Total derivative liabilities | 5,691 | 13,716 |
36
Note 8
Financial risk management
Continued from previous page
As of 30 June 2026, the Group is in compliance with all financial covenants and expects to remain compliant during 2026. At the end of the reporting period, EUR 188 million from the Green Corporate Facility remains
unutilised.
The following table presents the repayment profile of the Group’s debt facilities:
EUR Million | Less than 1 year | Between 1 and 2 years | Between 2 and 3 years | Between 3 and 5 years | Above 5 years | Total |
Corporate financing | 27 | 75 | 251 | 137 | 13 | 502 |
Vessel financing | 105 | 105 | 105 | 263 | 545 | 1,124 |
Total borrowing | 132 | 180 | 356 | 400 | 557 | 1,626 |
Refer to Note 25 in the consolidated financial statements for 2025 for further information on the Group’s accounting policies for financial liabilities.
The difference between EUR 1,626 million and the carrying amount of EUR 1,593 million is mainly related to interest and fees. In addition, financial expenses for the first half of 2026 amounted to EUR 42.5 million, representing
an increase of EUR 41 million compared to the EUR 1.6 million in the comparative period in 2025. The increase in financial expenses during the period was driven by a reduction in borrowing costs capitalised during the period
which were expensed following the delivery of vessels, compared to the corresponding period, along with an increase in foreign currency losses arising from fluctuations in FX rates during the period.
37
Note 9
Related party transactions
The following significant transactions took place between the Company and related parties within the BW
Group and Scorpio Holdings at terms agreed between the parties:
EUR'000 | H1 2026 | H1 2025 |
Purchases of services from related parties | (1,338) | (3,510) |
BW Group Limited (including subsidiaries) | (1,335) | (3,270) |
Scorpio Holdings Limited (including subsidiaries) | (3) | (240) |
EUR'000 | H1 2026 | H1 2025 |
Payables to related parties at reported period | — | (382) |
BW Group Limited (including subsidiaries) | — | (306) |
Scorpio Holdings Limited (including subsidiaries) | — | (76) |
Related party transactions during the reporting period are primarily related to guarantee fees charged by
BW Group Limited, training-related costs and travel costs charged by BW Maritime, share lending fees
charged by BW Altor in connection with the private placement completed in March 2026 and administrative
expenses charged by Scorpio Services Holding.
As at 30 June 2026, EUR 4 million recognised within prepayments relates to legal and advisory costs
incurred by the Company on behalf of a special purpose vehicle incorporated by BW Altor Pte. Ltd. in
connection with the Cadeler Group’s proposed re-domiciliation to the United Kingdom, as first disclosed on
28 June 2024. It is anticipated that these costs will be reimbursed by the special purposes vehicle (which is
today a related party) immediately following the contemplated transaction, which the Company expects to
complete in 2026.
In addition, Cadeler has not entered into any significant transactions with members of the Cadeler Board of
Directors or Executive Management, other than remuneration and reimbursement of expenses. Cadeler has
not provided or granted any loans or guarantees to its directors or Executive Management.
38
Note 10
Commitments and pledges
As of 30 June 2026, the Group’s commitments relate to the future instalments for the new A-class vessels.
The table below shows total contract amount and the remaining commitments for the newbuild vessels:
Millions | A-Class | Total | ||||
Contract amount in EUR | 299 | 519 | ||||
Contract amount in USD | 794 | 1,839 | ||||
Total Contract amount converted to EUR | 993 | 2,166 | ||||
Millions | A-Class | Total | ||||
Commitment amount in EUR | 6 | 6 | ||||
Commitment amount in USD | 478 | 478 | ||||
Remaining commitment converted to EUR at 30 June 2026 | 425 | 425 | ||||
A-class vessels
On 9 May 2022 and 22 November 2022, the Company entered into contracts with COSCO to build a total of
two new A-class FIVs. In May 2024, the Company entered into an additional contract with COSCO to build
the third A-class FIV. On 29 September 2025, Wind Ally was delivered, with the final instalments paid upon
delivery.
The remaining amounts are due in 2026 and 2027 with expected deliveries in Q3 2026 and Q2 2027,
respectively.
39
Note 11
Events after reporting period
Wind Apex Facility signed
On 10 July 2026, Cadeler signed an EIFO-backed senior secured green term loan facility of up to EUR 247
million to finance in part the construction of its third A-class newbuild offshore wind installation vessel, Wind
Apex, with delivery expected in Q2 2027. The 12-year facility is supported by the Export and Investment
Fund of Denmark (EIFO) and has been designated as green financing under Cadeler's Green Finance
Framework.
Upsize of 2025 Holdco Facility
On 10 July 2026, Cadeler increased the capacity available to it under the 2025 Holdco Facility, with the
lender commitments thereunder increased by EUR 40 million, bringing the total capacity available under
that facility to EUR 180 million. As of 25 August 2026, all of the capacity available to Cadeler under the 2025
Holdco Facility had been drawn.
Delivery of Wind Ace
On 17 July 2026, Cadeler took delivery, within budget and on schedule, of Wind Ace, the Company's
eleventh wind installation vessel and second of three A-class newbuilds. Also in July, and in connection with
the delivery and payment of the final instalment under the contract for the construction of Wind Ace,
Cadeler drew down EUR 228 million under the A-Class Facility.
Order of T-Class vessels
On 10 August 2026, Cadeler entered into firm contracts with COSCO for the construction of two additional
newbuild FIVs, with the vessels scheduled for delivery in 2030 and 2031, respectively. The contract price for
the two T-class vessels is approximately EUR 805 million in aggregate.
Acquisition of Menck
On 11 August 2026, Cadeler acquired Menck, a leading global provider of specialist equipment, technology
and related services for offshore foundation installation, from Acteon. The acquisition was based on an
agreed enterprise valuation equivalent to EUR 501 million, with signing and closing completed
simultaneously following receipt of all mandatory regulatory approvals, and was financed through available
liquidity together with a EUR 380 million acquisition facility provided by DNB Bank ASA and Coöperatieve
Rabobank U.A. The acquisition facility is expected to be refinanced with long-term financing and cash flow
from operations. As the acquisition was completed after the reporting period and shortly before the
authorisation of these interim financial statements, the initial accounting for the business combination
(including a determination of the acquisition-date fair value of the net assets acquired) is incomplete. As a
result, it is not yet possible to provide a reliable estimate of the financial effect of the acquisition on the
Cadeler Group’s financial position. Cadeler expects to include the relevant IFRS 3 disclosures in its 2026
Annual Report.
40
Statement by
management
41
Statement by management
The Board of Directors and the Executive Board have today discussed
and approved the interim condensed consolidated financial
statements of Cadeler A/S for the period 1 January to 30 June 2026.
The interim condensed consolidated financial statements have been
prepared in accordance with IAS 34 Interim Financial Reporting as
issued by the International Accounting Standards Board (IASB) and as
adopted by the EU, along with additional Danish disclosure
requirements under the Danish Financial Statements Act for interim
reports of listed companies.
In our opinion, the interim condensed consolidated financial
statements give a true and fair view of the financial position of the
Group as of 30 June 2026 and of the results of their operations and
the consolidated cash flows for the six-month period ended 30 June
2026.
Further, in our opinion, the Management's review gives a fair review
of the development of the Group's activities and financial matters,
results for the period, consolidated cash flows and financial position
as well as a description of material risks and uncertainties that the
Group faces.
Copenhagen, 25 August 2026
Executive management
Mikkel Gleerup CEO | Peter Brogaard Hansen CFO |
Board of Directors
Andreas Sohmen-Pao
Emanuele Lauro
Ditlev Wedell-Wedellsborg
Andrea Abt
James B. Nish
Colette Cohen
Thomas Thune Andersen
42
Forward-looking
statements
43
Forward-looking statements
The Annual Report, as referred to in this document, and the Interim Financial Report contain certain
forward-looking statements relating to the business, financial performance and results of the Company and/
or the industry in which it operates. Forward-looking statements concern future circumstances, results and
other statements that are not historical facts, sometimes identified by the words “believes”, “expects”,
"predicts", "intends", "projects", "plans", "estimates", "aims", "foresees", "anticipates", "targets", and similar
expressions.
The forward-looking statements contained in the Annual Report and the Interim Financial Report- including
assumptions, opinions, views of the Company or citations from third-party sources are solely opinions and
forecasts which are subject to risks, uncertainties, and other factors that may cause actual events to differ
materially from any anticipated development. Such factors may, for example include a change in the price of
raw materials. None of the Company or any of its parent or subsidiary undertakings or any such person’s
officers or employees provides any assurance that the assumptions underlying such forward looking
statements are free from errors nor does any of them accept any responsibility for the future accuracy of the
opinions expressed in the Annual Report and the Interim Financial Report or the actual occurrence of the
forecasted developments.
The Company assumes no obligation, except as required by law, to update any forward looking statements
or to conform these forward-looking statements to its actual results. The Annual Report and the Interim
Financial Report contain information obtained from third parties. You are advised that such third-party
information has not been prepared specifically for inclusion in the Annual Report and the Interim Financial
Report and the Company has not undertaken any independent investigation to confirm the accuracy or
completeness of such information. Several other factors could cause the actual results, performance or
achievements of the Company to be materially different from any future results, performance or
achievements that may be expressed or implied by statements and information in the Annual Report and
the Interim Financial Report.
Should any risks or uncertainties materialise, or should underlying assumptions prove incorrect, actual
results may vary materially from those described in the Annual Report and the Interim Financial Report. No
representation or warranty (express or implied) is made as to, and no reliance should be placed on, any
information, including projections, estimates, targets and opinions, contained herein, and no liability
whatsoever is accepted as to any errors, omissions or misstatements contained herein.
Accordingly, neither the Company nor any of its subsidiaries or shareholders or any officers, directors, board
members or employees accept any liability whatsoever arising directly or indirectly from the use of the
Annual Report and the Interim Financial Report.
44
Alternative
performance
measures
45
Alternative performance measures
Non-IFRS Financial Measures
To supplement its financial information presented in accordance with IFRS, the Group uses certain non-IFRS
measures, including EBITDA, when measuring performance, including when measuring current period
results of operations against prior periods. Because of their non-standardised definition, these non-IFRS
measures (unlike IFRS measures) may not be comparable to the calculation of similar measures used by
other companies. These supplementary non-IFRS measures are presented solely to permit investors to more
fully understand how the Group Management assesses underlying performance.
These supplementary non-IFRS measures are not, and should not, be viewed as a substitute for IFRS
measures. Management believes the presentation of these non-IFRS measures provides investors with
greater transparency and supplementary data relating to the Group’s financial condition and results of
operations, and therefore a more complete understanding of factors affecting its business and operating
performance. In addition, Management believes the presentation of these non-IFRS measures is useful to
investors for period-to-period comparison of results as the items may reflect certain unique and/or non-
operating items such as asset sales, write-offs, contract termination costs or items outside of Management’s
control.
As a performance measure, the Company uses EBITDA: Earnings before interest, tax, depreciation,
amortisation and foreign exchange gains/losses.
EBITDA is calculated as shown below:
EUR'000 | Note | H1 2026 | H1 2025 |
Operating profit as reported in the statement of profit and loss | 121,312 | 167,954 | |
Right-of-use asset amortisation | 937 | 763 | |
Depreciation and amortisation | 85,366 | 43,799 | |
EBITDA | 207,615 | 212,516 |
46
Alternative performance measures
Continued from previous page
Financial ratios and operational metrics
Return on assets | Profit/loss from operating activities |
Average assets | |
Return on equity | Profit/loss for the period |
Average equity | |
Equity ratio | Equity, year-end |
Total equity and liabilities, period-end | |
Contracted days | Number of on hire days in the period |
(in total for all vessels) | |
Utilisation | Contracted days |
Days in the period (181*all vessels) |
Contract backlog (As of report release date) | The total value of all customer contracts, both firm and options, that are not yet recognised as revenue as of the reporting date, but includes all new contracts signed until the release date of the annual or interim report. Firm contracts are counted at full committed amounts. Contract backlog including options assumes 100% of counterparty options are exercised with 50% classified as subject to exercise of counterparty options contingent to consideration included in revenue recognition and the remaining 50% as non-contingent. Contract backlog excludes vessel reservation agreements. All contracts may be subject to future modifications, and off-hire days, that might impact the amount and/or timing of revenue recognition. |
Non-financial definitions
Vessel Reservation Agreements (VRAs) | A time-limited agreement with a third party to secure the availability of one or more of Cadeler’s vessels for a fixed period in the future, pending the negotiation of full contractual terms. Cadeler is generally entitled to receive a fee in the event that a VRA is cancelled or permitted to expire without full contractual terms having been entered into with the relevant counterpart. |
Final Investment Decision (FID) | Where a project remains subject to counterparty FID, the relevant counterpart has not yet publicly announced its final decision to commit to the development and operation of the project. |
Net financials | Net of finance income and finance costs |

47
Kalvebod Brygge 43
DK–1560 Copenhagen V
Denmark
+45 3246 3100
www.cadeler.com