| 1 February 4, 2026 Janney Investor Conference |

| 2 Forward Looking Statements Statements in this press release that are not historical facts are forward-looking statements within the meaning of Section 27A of the Securities Act of 1933, as amended, and Section 21E of the Securities Exchange Act of 1934, as amended, and are intended to be covered by the safe harbor provisions of the Private Securities Litigation Reform Act of 1995. We may also make forward-looking statements in other documents we file with the Securities and Exchange Commission (the “SEC”), in our annual reports to our stockholders, in press releases and other written materials, and in oral statements made by our officers, directors or employees. You can identify forward-looking statements by the use of the words “believe,” “expect,” “anticipate,” “intend,” “estimate,” “assume,” “outlook,” “will,” “should,” and other expressions that predict or indicate future events and trends and which do not relate to historical matters. Although the Company believes that these forward-looking statements are based on reasonable estimates and assumptions, they are not guarantees of future performance and are subject to known and unknown risks, uncertainties, and other factors. You should not place undue reliance on our forward-looking statements. You should exercise caution in interpreting and relying on forward-looking statements because they are subject to significant risks, uncertainties and other factors which are, in some cases, beyond the Company’s control. The Company’s actual results could differ materially from those projected in the forward-looking statements as a result of, among other factors, changes in general business and economic conditions on a national basis and in the local markets in which the Company operates, including changes which adversely affect borrowers’ ability to service and repay loans; changes in customer behavior due to political, business and economic conditions, including inflation and concerns about liquidity; turbulence in the capital and debt markets; reductions in net interest income resulting from interest rate volatility as well as changes in the balances and mix of loans and deposits; changes in interest rates and real estate values; changes in loan collectability and increases in defaults and charge-off rates; decreases in the value of securities and other assets, adequacy of credit loss reserves, or deposit levels necessitating increased borrowing to fund loans and investments; risks related to the Company’s acquisitions generally, including disruption to current plans and operations; difficulties in customer and employee retention; fees, expenses and charges related to these transactions being significantly higher than anticipated; unforeseen integration issues or impairment of other intangibles; and the Company’s inability to achieve expected revenues, cost savings, synergies, and other benefits at levels or within the timeframes originally anticipated; changing government regulation; competitive pressures from other financial institutions; changes in legislation or regulation and accounting principles, policies and guidelines; cybersecurity incidents, fraud, natural disasters, and future pandemics; the risk that the Company may not be successful in the implementation of its business strategy; the risk that intangibles recorded in the Company’s financial statements will become impaired; changes in assumptions used in making such forward-looking statements; and the other risks and uncertainties detailed in the Company’s Form 10-K and updated by our Quarterly Report on Form 10-Q and other filings submitted to the SEC. These statements speak only as of the date of this release and the Company does not undertake any obligation to update or revise any of these forward-looking statements to reflect events or circumstances occurring after the date of this communication or to reflect the occurrence of unanticipated events. 2 |
| 3 NB Bancorp, Inc. Overview |

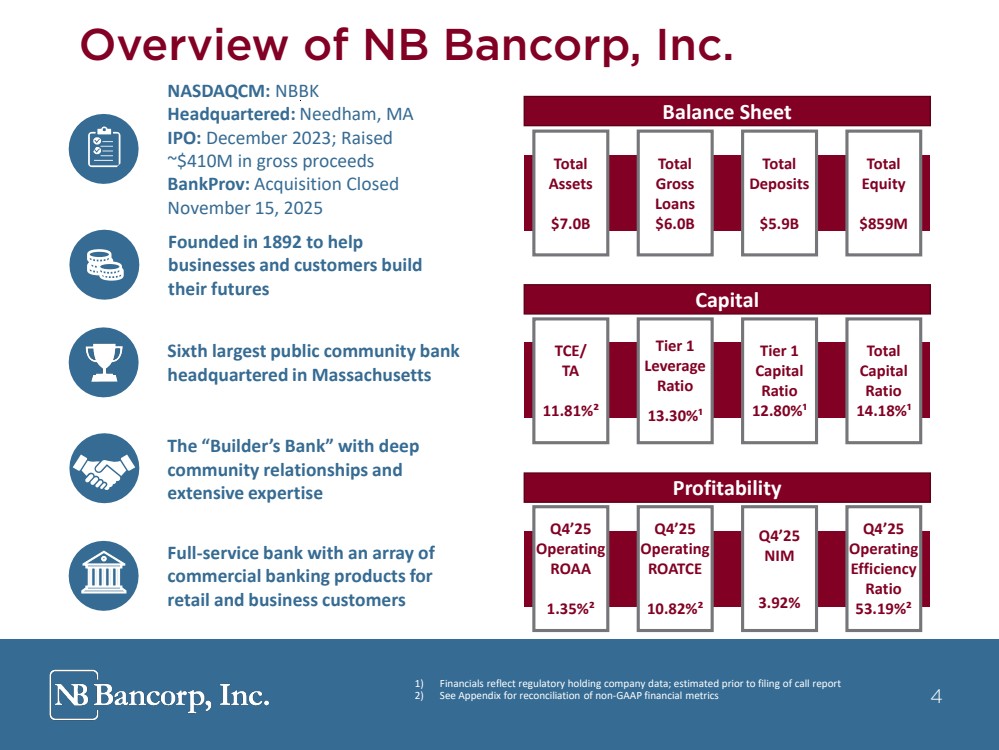
| 4 Overview of NB Bancorp, Inc. NASDAQCM: NBBK Headquartered: Needham, MA IPO: December 2023; Raised ~$410M in gross proceeds BankProv: Acquisition Closed November 15, 2025 Sixth largest public community bank headquartered in Massachusetts The “Builder’s Bank” with deep community relationships and extensive expertise Full-service bank with an array of commercial banking products for retail and business customers Founded in 1892 to help businesses and customers build their futures Total Assets $7.0B Total Gross Loans $6.0B Total Deposits $5.9B Total Equity $859M TCE/ TA 11.81%² Tier 1 Leverage Ratio 13.30%¹ Tier 1 Capital Ratio 12.80%¹ Total Capital Ratio 14.18%¹ Q4’25 Operating ROAA 1.35%² Q4’25 Operating ROATCE 10.82%² Q4’25 NIM 3.92% Q4’25 Operating Efficiency Ratio 53.19%² Balance Sheet Profitability Capital 1) Financials reflect regulatory holding company data; estimated prior to filing of call report 2) See Appendix for reconciliation of non-GAAP financial metrics 4 |
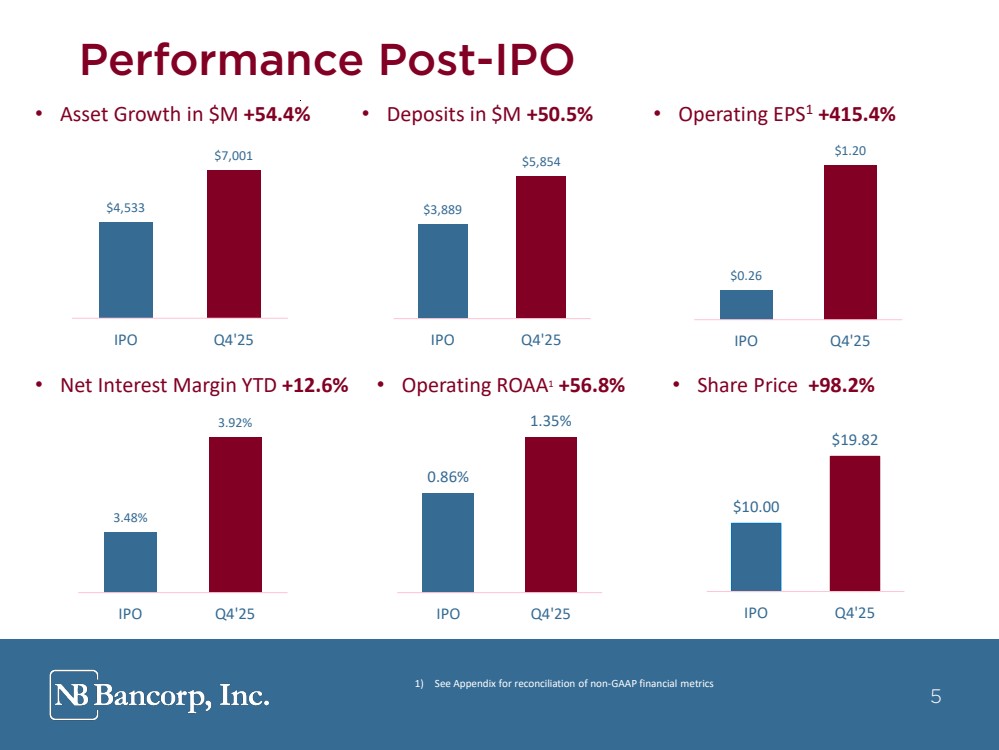
| 5 Performance Post-IPO 5 1) See Appendix for reconciliation of non-GAAP financial metrics • Asset Growth in $M +54.4% • Deposits in $M +50.5% • Operating EPS1 +415.4% • Net Interest Margin YTD +12.6% • Operating ROAA1 +56.8% • Share Price +98.2% $4,533 $7,001 IPO Q4'25 $3,889 $5,854 IPO Q4'25 $0.26 $1.20 IPO Q4'25 3.48% 3.92% IPO Q4'25 0.86% 1.35% IPO Q4'25 $10.00 $19.82 IPO Q4'25 |
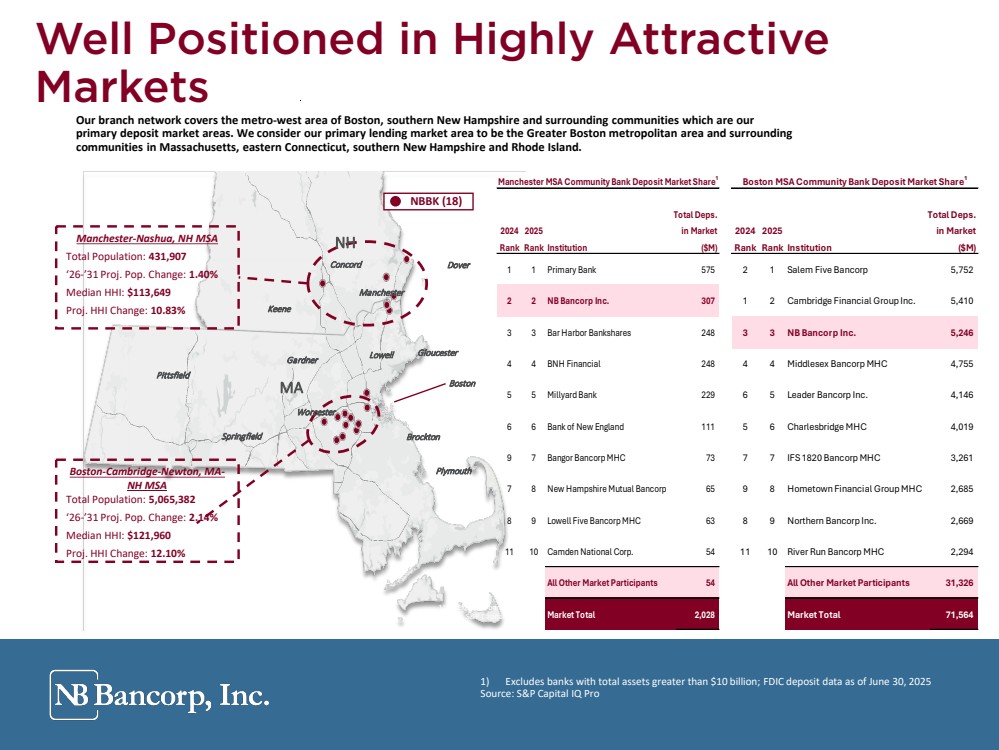
| 6 1) Excludes banks with total assets greater than $10 billion; FDIC deposit data as of June 30, 2025 Source: S&P Capital IQ Pro Well Positioned in Highly Attractive Markets Our branch network covers the metro-west area of Boston, southern New Hampshire and surrounding communities which are our primary deposit market areas. We consider our primary lending market area to be the Greater Boston metropolitan area and surrounding communities in Massachusetts, eastern Connecticut, southern New Hampshire and Rhode Island. 6 Boston-Cambridge-Newton, MA-NH MSA Total Population: 5,065,382 ‘26-’31 Proj. Pop. Change: 2.14% Median HHI: $121,960 Proj. HHI Change: 12.10% Manchester-Nashua, NH MSA Total Population: 431,907 ‘26-’31 Proj. Pop. Change: 1.40% Median HHI: $113,649 Proj. HHI Change: 10.83% MA NH Springfield Manchester Concord Boston Lowell Plymouth NBBK (18) Keene Gardner Brockton Pittsfield Worcester Gloucester Dover Boston MSA Community Bank Deposit Market Share¹ Total Deps. 2024 2025 in Market Rank Rank Institution ($M) 2 1 Salem Five Bancorp 5,752 1 2 Cambridge Financial Group Inc. 5,410 3 3 NB Bancorp Inc. 5,246 4 4 Middlesex Bancorp MHC 4,755 6 5 Leader Bancorp Inc. 4,146 5 6 Charlesbridge MHC 4,019 7 7 IFS 1820 Bancorp MHC 3,261 9 8 Hometown Financial Group MHC 2,685 8 9 Northern Bancorp Inc. 2,669 11 10 River Run Bancorp MHC 2,294 All Other Market Participants 31,326 Market Total 71,564 Manchester MSA Community Bank Deposit Market Share¹ Total Deps. 2024 2025 in Market Rank Rank Institution ($M) 1 1 Primary Bank 575 2 2 NB Bancorp Inc. 307 3 3 Bar Harbor Bankshares 248 4 4 BNH Financial 248 5 5 Millyard Bank 229 6 6 Bank of New England 111 9 7 Bangor Bancorp MHC 73 7 8 New Hampshire Mutual Bancorp 65 8 9 Lowell Five Bancorp MHC 63 11 10 Camden National Corp. 54 All Other Market Participants 54 Market Total 2,028 1) Excludes banks with total assets greater than $10 billion; FDIC deposit data as of June 30, 2025 Source: S&P Capital IQ Pro |
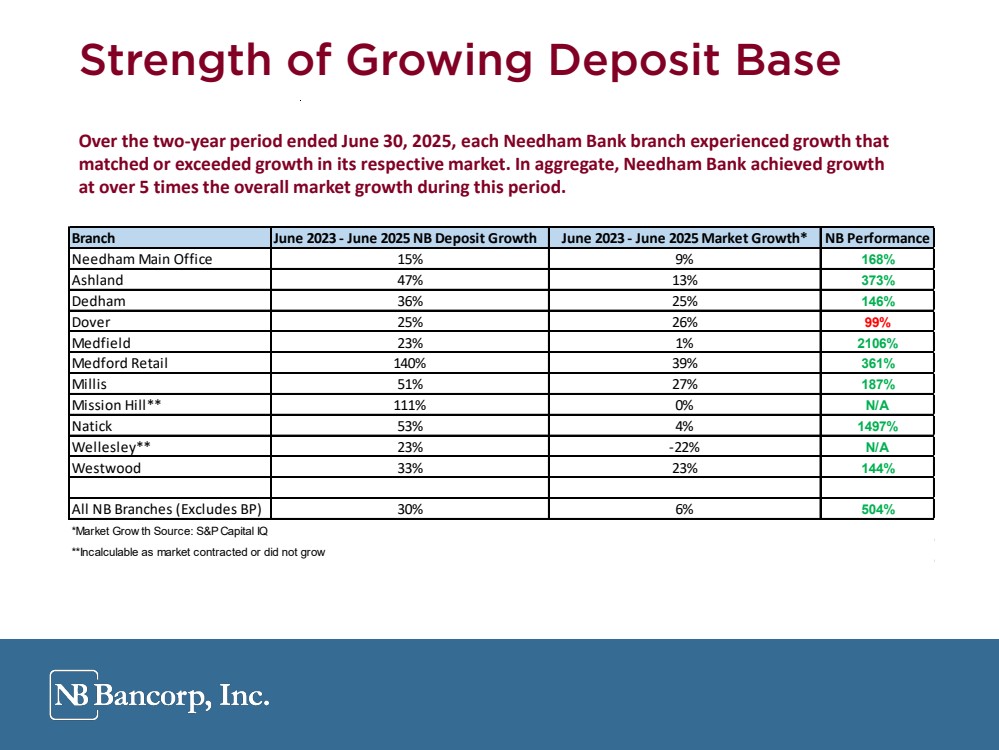
| 7 Strength of Growing Deposit Base Over the two-year period ended June 30, 2025, each Needham Bank branch experienced growth that matched or exceeded growth in its respective market. In aggregate, Needham Bank achieved growth at over 5 times the overall market growth during this period. Branch June 2023 - June 2025 NB Deposit Growth June 2023 - June 2025 Market Growth* NB Performance Needham Main Office 15% 9% 168% Ashland 47% 13% 373% Dedham 36% 25% 146% Dover 25% 26% 99% Medfield 23% 1% 2106% Medford Retail 140% 39% 361% Millis 51% 27% 187% Mission Hill** 111% 0% N/A Natick 53% 4% 1497% Wellesley** 23% -22% N/A Westwood 33% 23% 144% All NB Branches (Excludes BP) 30% 6% 504% *Market Grow th Source: S&P Capital IQ **Incalculable as market contracted or did not grow |
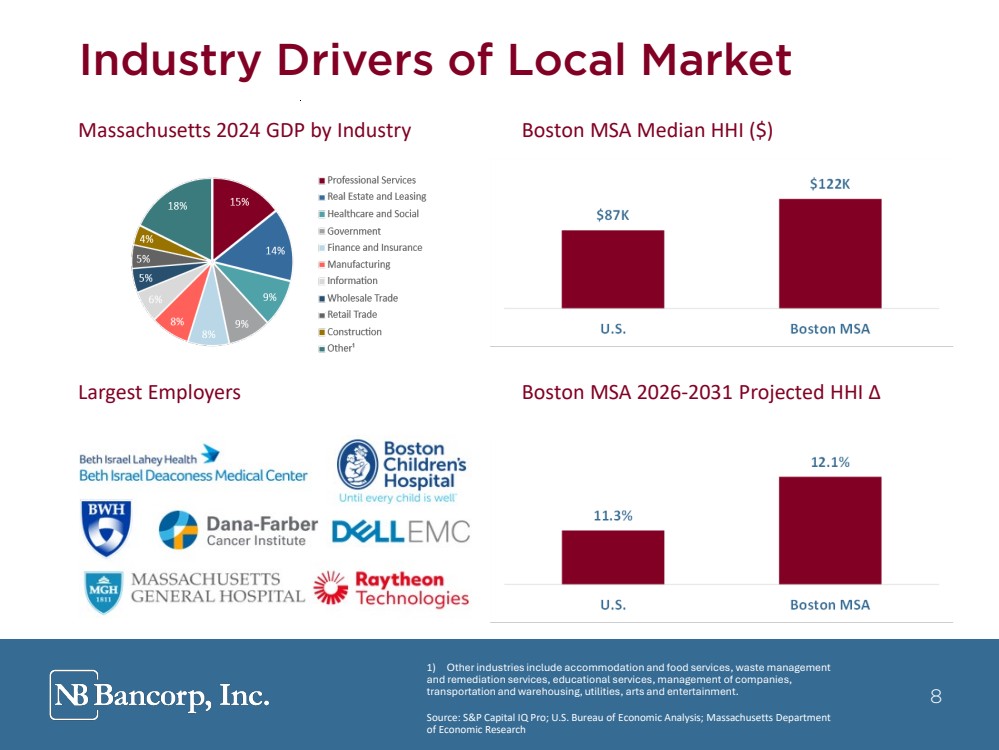
| 8 Largest Employers Boston MSA 2026-2031 Projected HHI Δ Massachusetts 2024 GDP by Industry Boston MSA Median HHI ($) Industry Drivers of Local Market 1) Other industries include accommodation and food services, waste management and remediation services, educational services, management of companies, transportation and warehousing, utilities, arts and entertainment. Source: S&P Capital IQ Pro; U.S. Bureau of Economic Analysis; Massachusetts Department of Economic Research 8 |
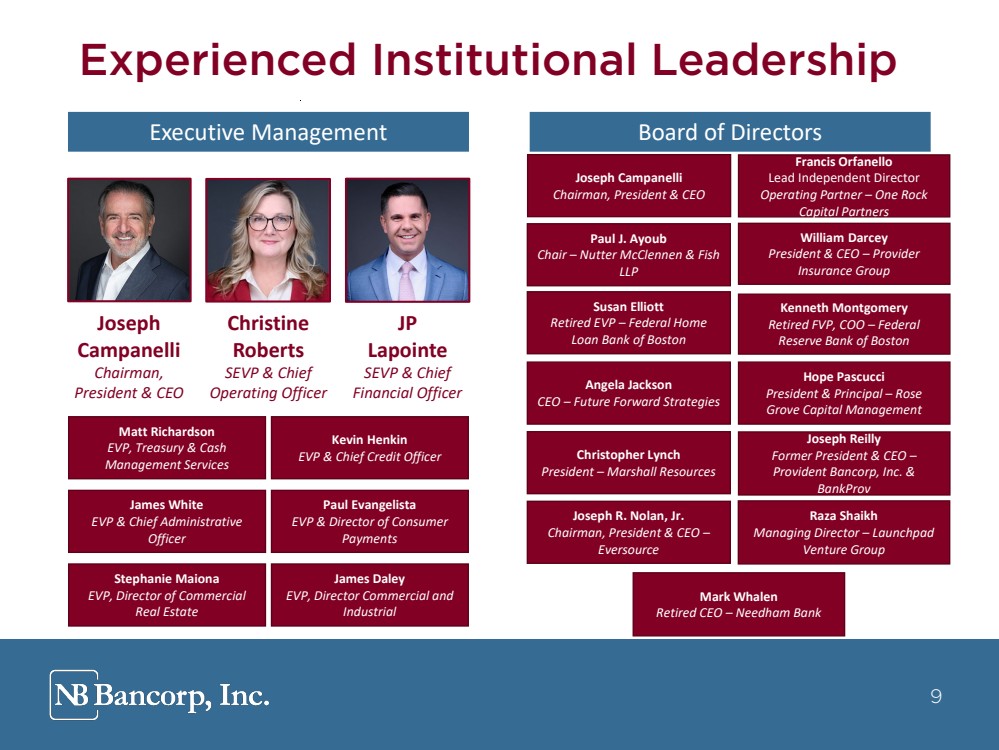
| 9 Experienced Institutional Leadership Joseph Campanelli Chairman, President & CEO William Darcey President & CEO – Provider Insurance Group Paul J. Ayoub Chair – Nutter McClennen & Fish LLP Susan Elliott Retired EVP – Federal Home Loan Bank of Boston Angela Jackson CEO – Future Forward Strategies Christopher Lynch President – Marshall Resources Joseph R. Nolan, Jr. Chairman, President & CEO – Eversource Francis Orfanello Lead Independent Director Operating Partner – One Rock Capital Partners Hope Pascucci President & Principal – Rose Grove Capital Management Raza Shaikh Managing Director – Launchpad Venture Group Mark Whalen Retired CEO – Needham Bank Joseph Campanelli Chairman, President & CEO Christine Roberts SEVP & Chief Operating Officer James White EVP & Chief Administrative Officer Paul Evangelista EVP & Director of Consumer Payments Kevin Henkin EVP & Chief Credit Officer Stephanie Maiona EVP, Director of Commercial Real Estate James Daley EVP, Director Commercial and Industrial Executive Management Board of Directors JP Lapointe SEVP & Chief Financial Officer 9 Kenneth Montgomery Retired FVP, COO – Federal Reserve Bank of Boston Matt Richardson EVP, Treasury & Cash Management Services Joseph Reilly Former President & CEO – Provident Bancorp, Inc. & BankProv |
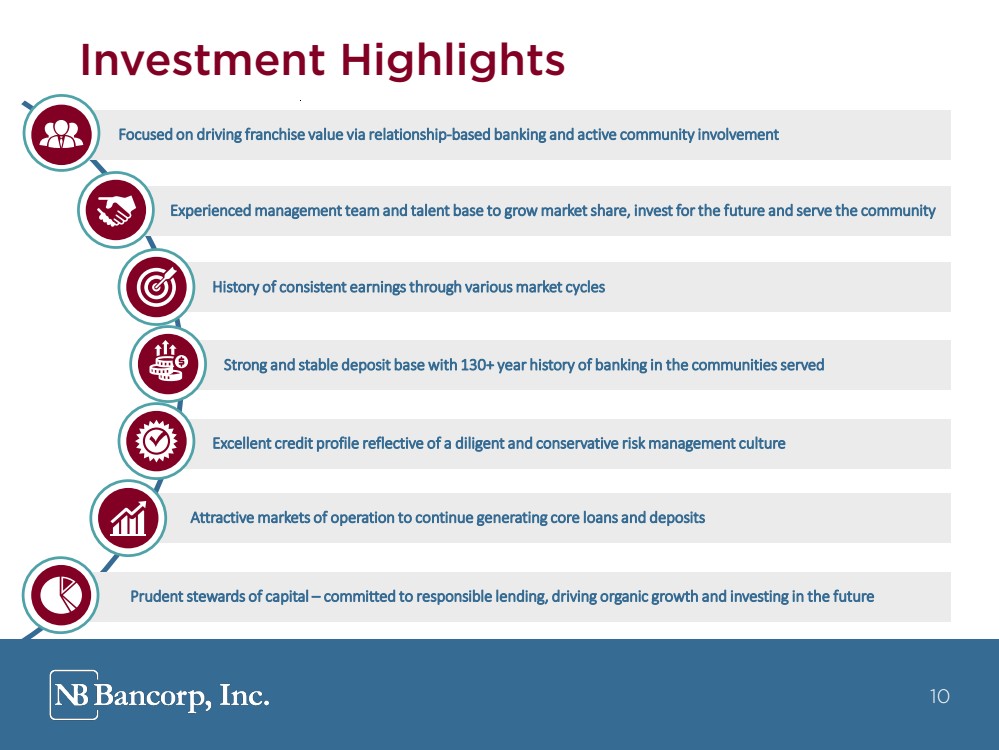
| 10 Investment Highlights Experienced management team and talent base to grow market share, invest for the future and serve the community Focused on driving franchise value via relationship-based banking and active community involvement History of consistent earnings through various market cycles Excellent credit profile reflective of a diligent and conservative risk management culture Prudent stewards of capital – committed to responsible lending, driving organic growth and investing in the future Strong and stable deposit base with 130+ year history of banking in the communities served Attractive markets of operation to continue generating core loans and deposits 10 |
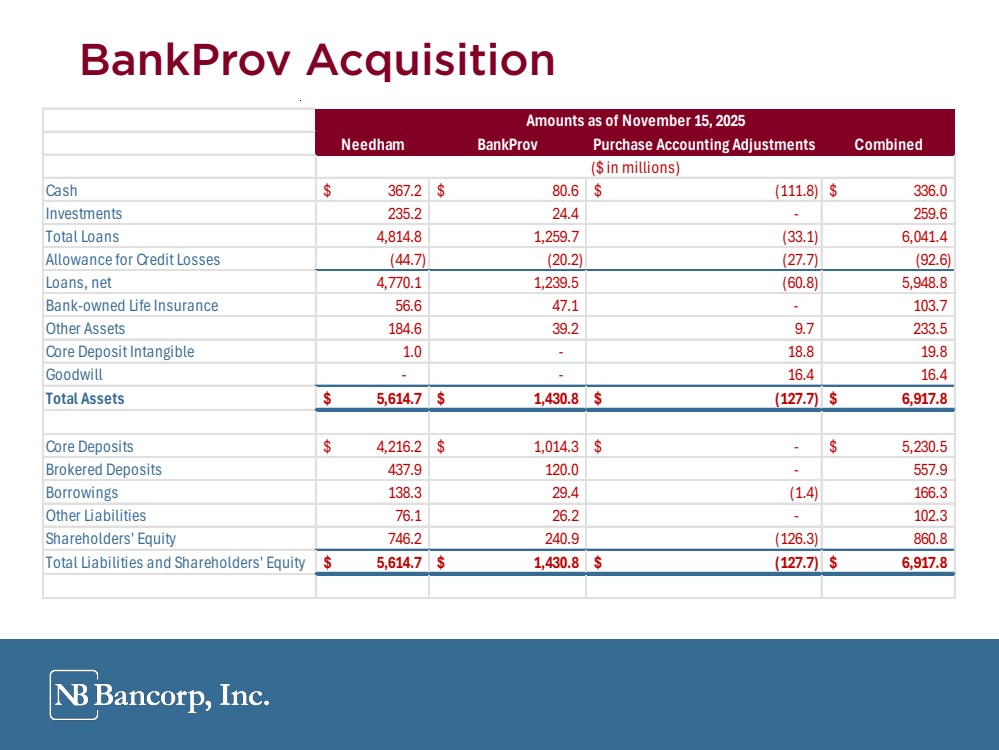
| 11 BankProv Acquisition Needham BankProv Purchase Accounting Adjustments Combined Cash $ 367.2 $ 80.6 $ (111.8) $ 336.0 Investments 235.2 24.4 - 259.6 Total Loans 4,814.8 1,259.7 (33.1) 6,041.4 Allowance for Credit Losses (44.7) (20.2) (27.7) (92.6) Loans, net 4,770.1 1,239.5 (60.8) 5,948.8 Bank-owned Life Insurance 56.6 47.1 - 103.7 Other Assets 184.6 39.2 9.7 233.5 Core Deposit Intangible 1.0 - 18.8 19.8 Goodwill - - 16.4 16.4 Total Assets $ 5,614.7 $ 1,430.8 $ (127.7) $ 6,917.8 Core Deposits $ 4,216.2 $ 1,014.3 $ - $ 5,230.5 Brokered Deposits 437.9 120.0 - 557.9 Borrowings 138.3 29.4 (1.4) 166.3 Other Liabilities 76.1 26.2 - 102.3 Shareholders' Equity 746.2 240.9 (126.3) 860.8 Total Liabilities and Shareholders' Equity $ 5,614.7 $ 1,430.8 $ (127.7) $ 6,917.8 Amounts as of November 15, 2025 ($ in millions) |
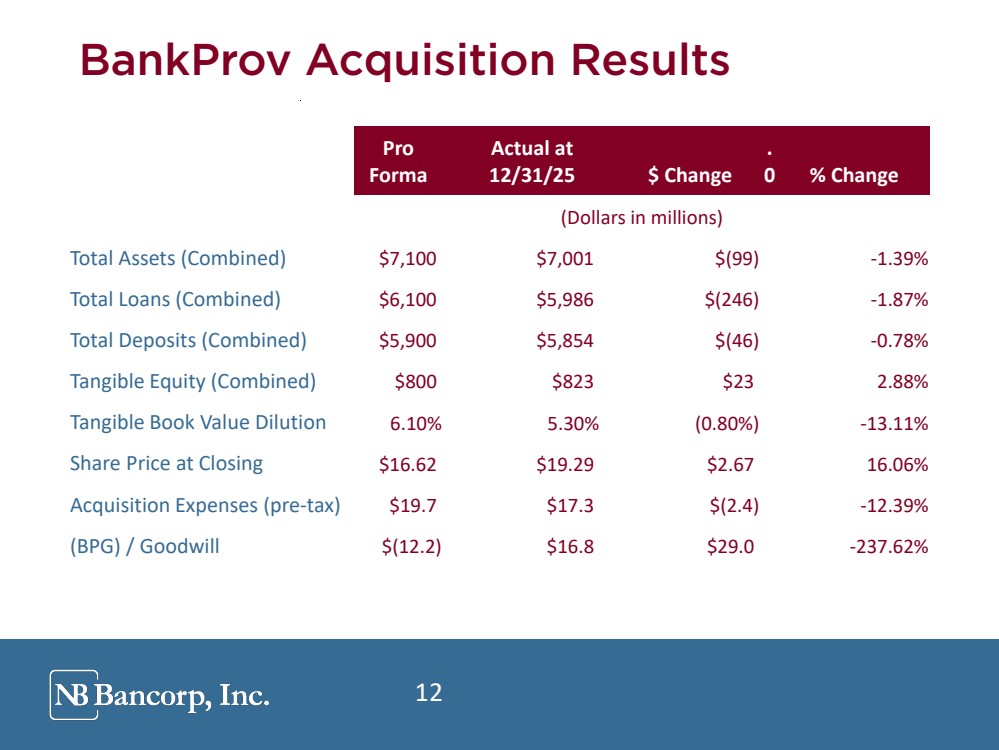
| 12 BankProv Acquisition Results 12 Pro Forma Actual at 12/31/25 $ Change . 0 % Change (Dollars in millions) Total Assets (Combined) $7,100 $7,001 $(99) -1.39% Total Loans (Combined) $6,100 $5,986 $(246) -1.87% Total Deposits (Combined) $5,900 $5,854 $(46) -0.78% Tangible Equity (Combined) $800 $823 $23 2.88% Tangible Book Value Dilution 6.10% 5.30% (0.80%) -13.11% Share Price at Closing $16.62 $19.29 $2.67 16.06% Acquisition Expenses (pre-tax) $19.7 $17.3 $(2.4) -12.39% (BPG) / Goodwill $(12.2) $16.8 $29.0 -237.62% |
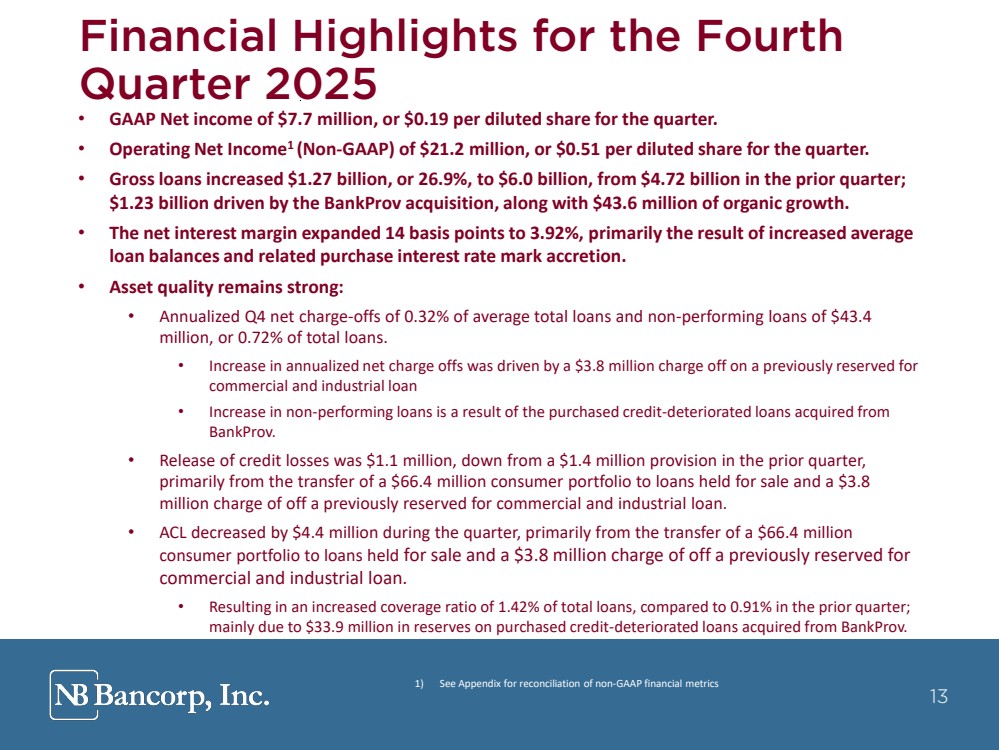
| 13 Financial Highlights for the Fourth Quarter 2025 • GAAP Net income of $7.7 million, or $0.19 per diluted share for the quarter. • Operating Net Income1 (Non-GAAP) of $21.2 million, or $0.51 per diluted share for the quarter. • Gross loans increased $1.27 billion, or 26.9%, to $6.0 billion, from $4.72 billion in the prior quarter; $1.23 billion driven by the BankProv acquisition, along with $43.6 million of organic growth. • The net interest margin expanded 14 basis points to 3.92%, primarily the result of increased average loan balances and related purchase interest rate mark accretion. • Asset quality remains strong: • Annualized Q4 net charge-offs of 0.32% of average total loans and non-performing loans of $43.4 million, or 0.72% of total loans. • Increase in annualized net charge offs was driven by a $3.8 million charge off on a previously reserved for commercial and industrial loan • Increase in non-performing loans is a result of the purchased credit-deteriorated loans acquired from BankProv. • Release of credit losses was $1.1 million, down from a $1.4 million provision in the prior quarter, primarily from the transfer of a $66.4 million consumer portfolio to loans held for sale and a $3.8 million charge of off a previously reserved for commercial and industrial loan. • ACL decreased by $4.4 million during the quarter, primarily from the transfer of a $66.4 million consumer portfolio to loans held for sale and a $3.8 million charge of off a previously reserved for commercial and industrial loan. • Resulting in an increased coverage ratio of 1.42% of total loans, compared to 0.91% in the prior quarter; mainly due to $33.9 million in reserves on purchased credit-deteriorated loans acquired from BankProv. 1) See Appendix for reconciliation of non-GAAP financial metrics 13 |
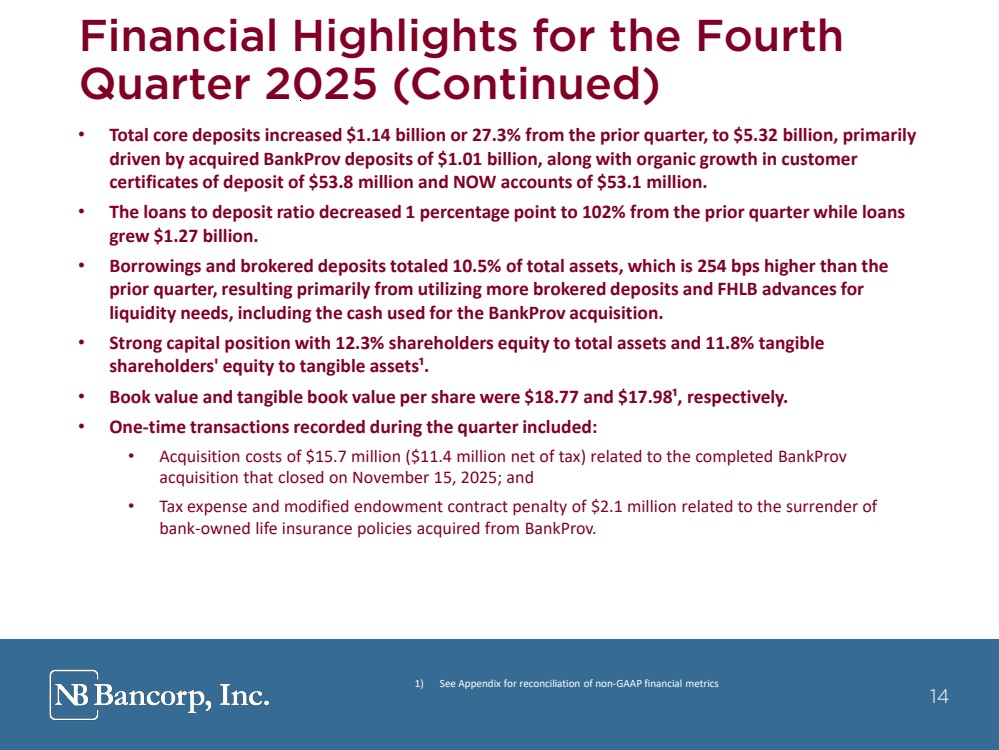
| 14 Financial Highlights for the Fourth Quarter 2025 (Continued) • Total core deposits increased $1.14 billion or 27.3% from the prior quarter, to $5.32 billion, primarily driven by acquired BankProv deposits of $1.01 billion, along with organic growth in customer certificates of deposit of $53.8 million and NOW accounts of $53.1 million. • The loans to deposit ratio decreased 1 percentage point to 102% from the prior quarter while loans grew $1.27 billion. • Borrowings and brokered deposits totaled 10.5% of total assets, which is 254 bps higher than the prior quarter, resulting primarily from utilizing more brokered deposits and FHLB advances for liquidity needs, including the cash used for the BankProv acquisition. • Strong capital position with 12.3% shareholders equity to total assets and 11.8% tangible shareholders' equity to tangible assets¹. • Book value and tangible book value per share were $18.77 and $17.98¹, respectively. • One-time transactions recorded during the quarter included: • Acquisition costs of $15.7 million ($11.4 million net of tax) related to the completed BankProv acquisition that closed on November 15, 2025; and • Tax expense and modified endowment contract penalty of $2.1 million related to the surrender of bank-owned life insurance policies acquired from BankProv. 1) See Appendix for reconciliation of non-GAAP financial metrics 14 |
| 15 Financial Overview |

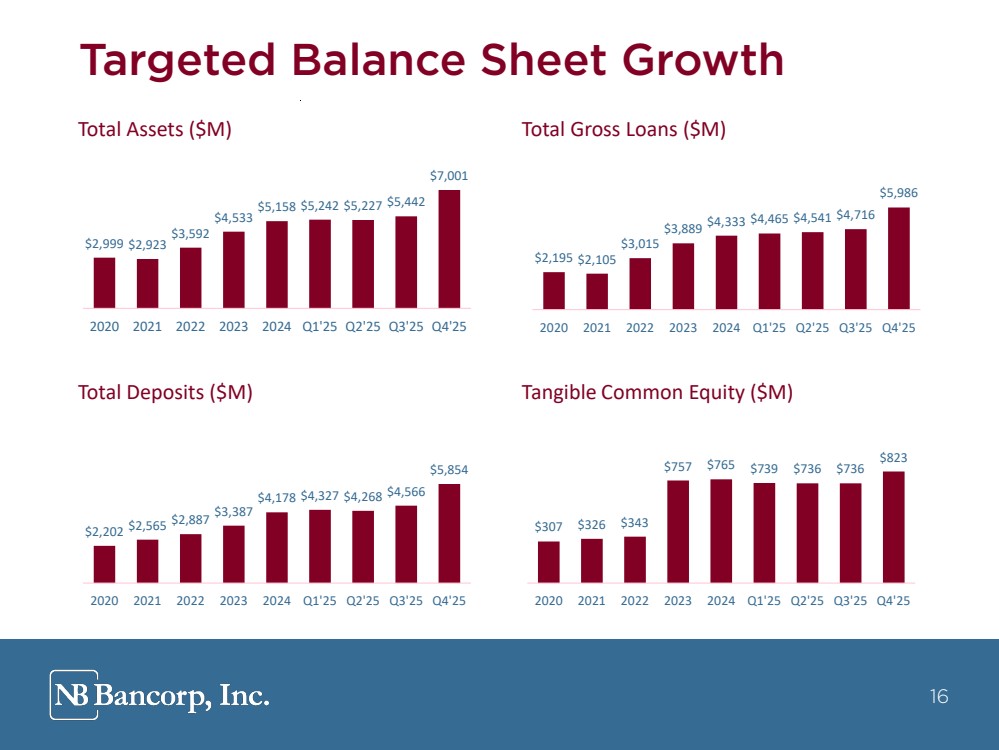
| 16 Total Deposits ($M) Tangible Common Equity ($M) Total Assets ($M) Total Gross Loans ($M) Targeted Balance Sheet Growth 16 $2,999 $2,923 $3,592 $4,533 $5,158 $5,242 $5,227 $5,442 $7,001 2020 2021 2022 2023 2024 Q1'25 Q2'25 Q3'25 Q4'25 $2,195 $2,105 $3,015 $3,889 $4,333 $4,465 $4,541 $4,716 $5,986 2020 2021 2022 2023 2024 Q1'25 Q2'25 Q3'25 Q4'25 $2,202 $2,565 $2,887 $3,387 $4,178 $4,327 $4,268 $4,566 $5,854 2020 2021 2022 2023 2024 Q1'25 Q2'25 Q3'25 Q4'25 $307 $326 $343 $757 $765 $739 $736 $736 $823 2020 2021 2022 2023 2024 Q1'25 Q2'25 Q3'25 Q4'25 |
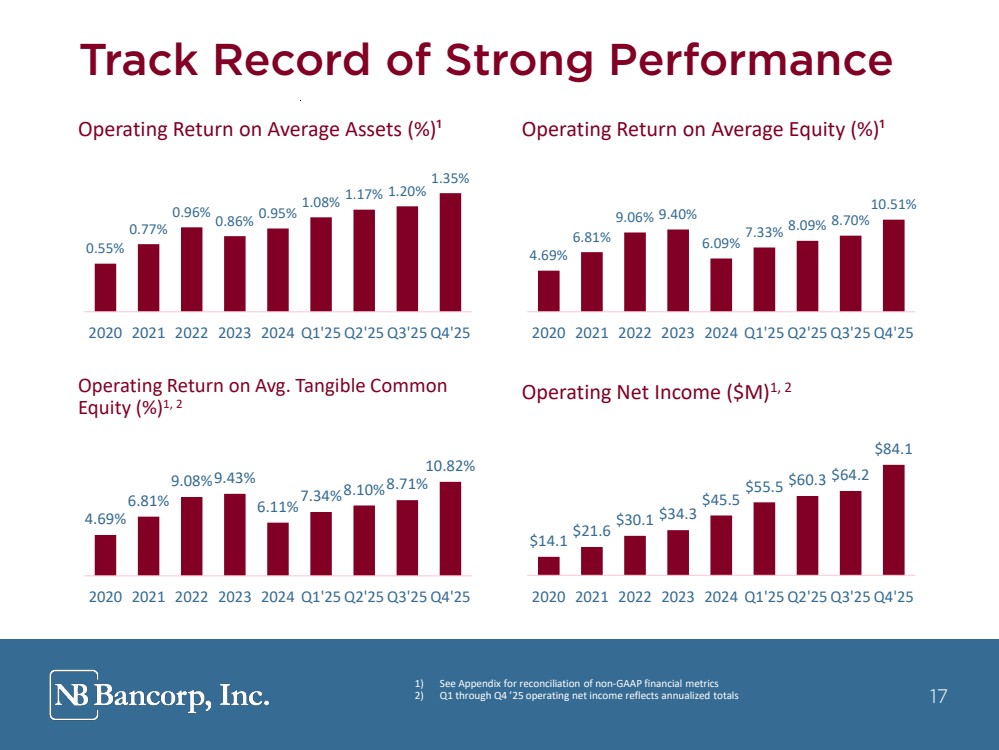
| 17 Operating Return on Avg. Tangible Common Equity (%)1, 2 Operating Net Income ($M)1, 2 Operating Return on Average Assets (%)¹ Operating Return on Average Equity (%)¹ Track Record of Strong Performance 1) See Appendix for reconciliation of non-GAAP financial metrics 2) Q1 through Q4 ’25 operating net income reflects annualized totals 17 0.55% 0.77% 0.96% 0.86% 0.95% 1.08% 1.17% 1.20% 1.35% 2020 2021 2022 2023 2024 Q1'25 Q2'25 Q3'25 Q4'25 4.69% 6.81% 9.06% 9.40% 6.09% 7.33% 8.09% 8.70% 10.51% 2020 2021 2022 2023 2024 Q1'25 Q2'25 Q3'25 Q4'25 4.69% 6.81% 9.08%9.43% 6.11%7.34%8.10%8.71% 10.82% 2020 2021 2022 2023 2024 Q1'25 Q2'25 Q3'25 Q4'25 $14.1 $21.6 $30.1 $34.3 $45.5 $55.5 $60.3 $64.2 $84.1 2020 2021 2022 2023 2024 Q1'25 Q2'25 Q3'25 Q4'25 |
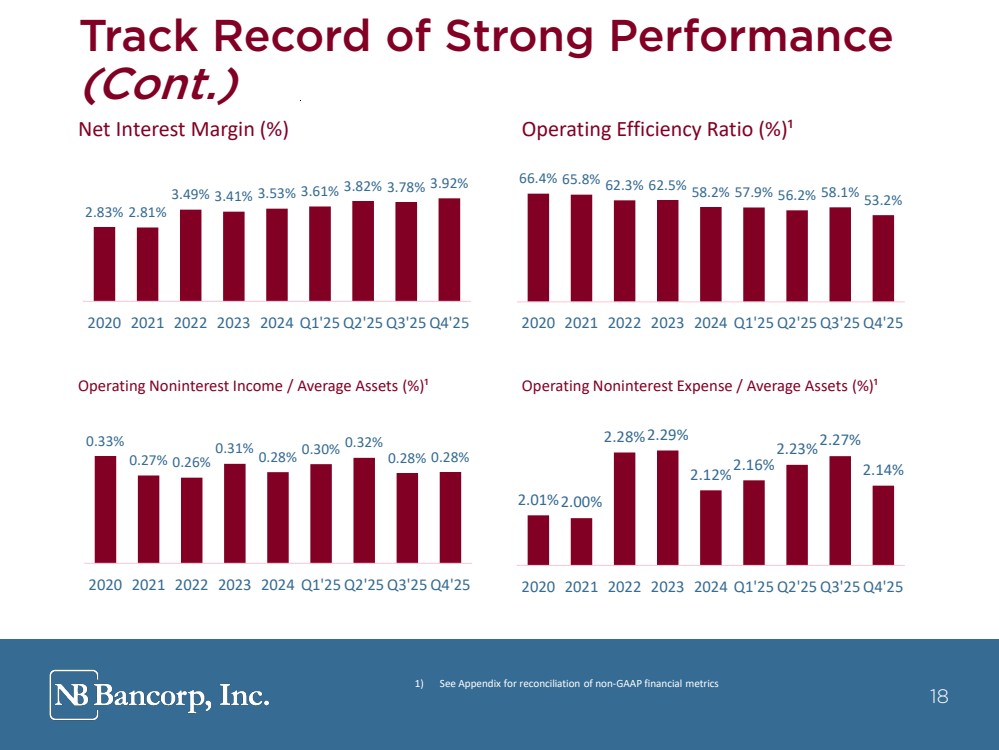
| 18 Operating Noninterest Income / Average Assets (%)¹ Operating Noninterest Expense / Average Assets (%)¹ Net Interest Margin (%) Operating Efficiency Ratio (%)¹ Track Record of Strong Performance (Cont.) 1) See Appendix for reconciliation of non-GAAP financial metrics 18 2.83% 2.81% 3.49% 3.41% 3.53% 3.61% 3.82% 3.78% 3.92% 2020 2021 2022 2023 2024 Q1'25 Q2'25 Q3'25 Q4'25 66.4% 65.8% 62.3% 62.5% 58.2% 57.9% 56.2% 58.1% 53.2% 2020 2021 2022 2023 2024 Q1'25 Q2'25 Q3'25 Q4'25 0.33% 0.27% 0.26% 0.31% 0.28% 0.30% 0.32% 0.28% 0.28% 2020 2021 2022 2023 2024 Q1'25 Q2'25 Q3'25 Q4'25 2.01%2.00% 2.28%2.29% 2.12%2.16% 2.23%2.27% 2.14% 2020 2021 2022 2023 2024 Q1'25 Q2'25 Q3'25 Q4'25 |
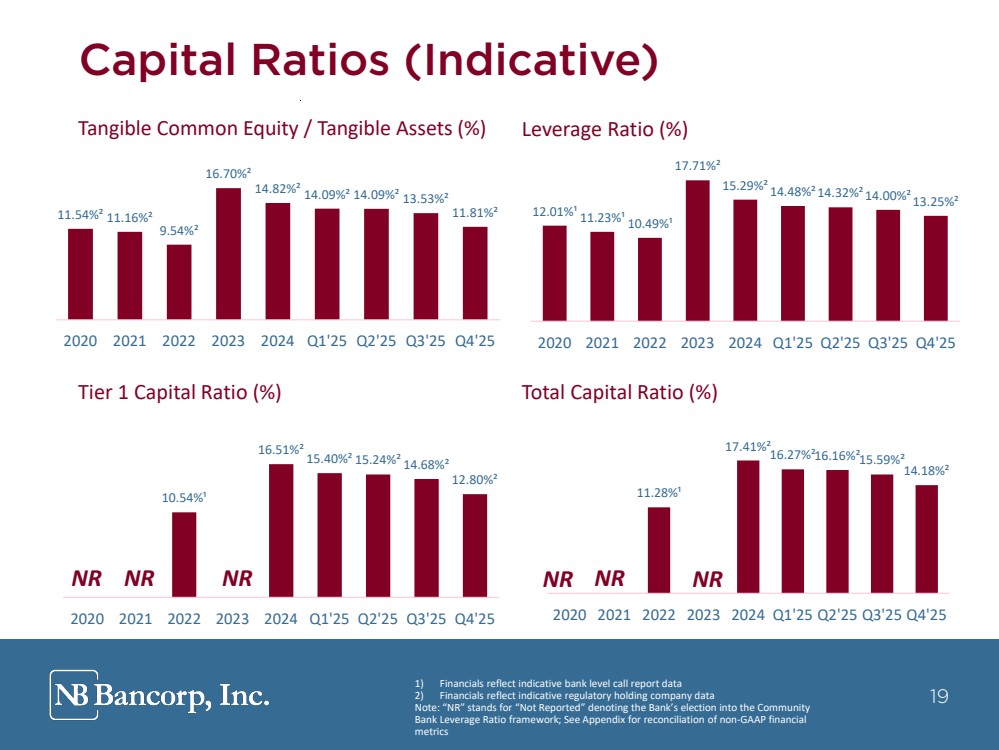
| 19 11.28%¹ 17.41%²16.27%²16.16%²15.59%² 14.18%² 2020 2021 2022 2023 2024 Q1'25 Q2'25 Q3'25 Q4'25 10.54%¹ 16.51%² 15.40%² 15.24%² 14.68%² 12.80%² 2020 2021 2022 2023 2024 Q1'25 Q2'25 Q3'25 Q4'25 Tier 1 Capital Ratio (%) Total Capital Ratio (%) Tangible Common Equity / Tangible Assets (%) Leverage Ratio (%) Capital Ratios (Indicative) 1) Financials reflect indicative bank level call report data 2) Financials reflect indicative regulatory holding company data Note: “NR” stands for “Not Reported” denoting the Bank’s election into the Community Bank Leverage Ratio framework; See Appendix for reconciliation of non-GAAP financial metrics NR NR NR NR NR NR 19 11.54%² 11.16%² 9.54%² 16.70%² 14.82%² 14.09%² 14.09%² 13.53%² 11.81%² 2020 2021 2022 2023 2024 Q1'25 Q2'25 Q3'25 Q4'25 12.01%¹ 11.23%¹ 10.49%¹ 17.71%² 15.29%²14.48%²14.32%²14.00%²13.25%² 2020 2021 2022 2023 2024 Q1'25 Q2'25 Q3'25 Q4'25 |
| 20 Loan Portfolio & Asset Quality |

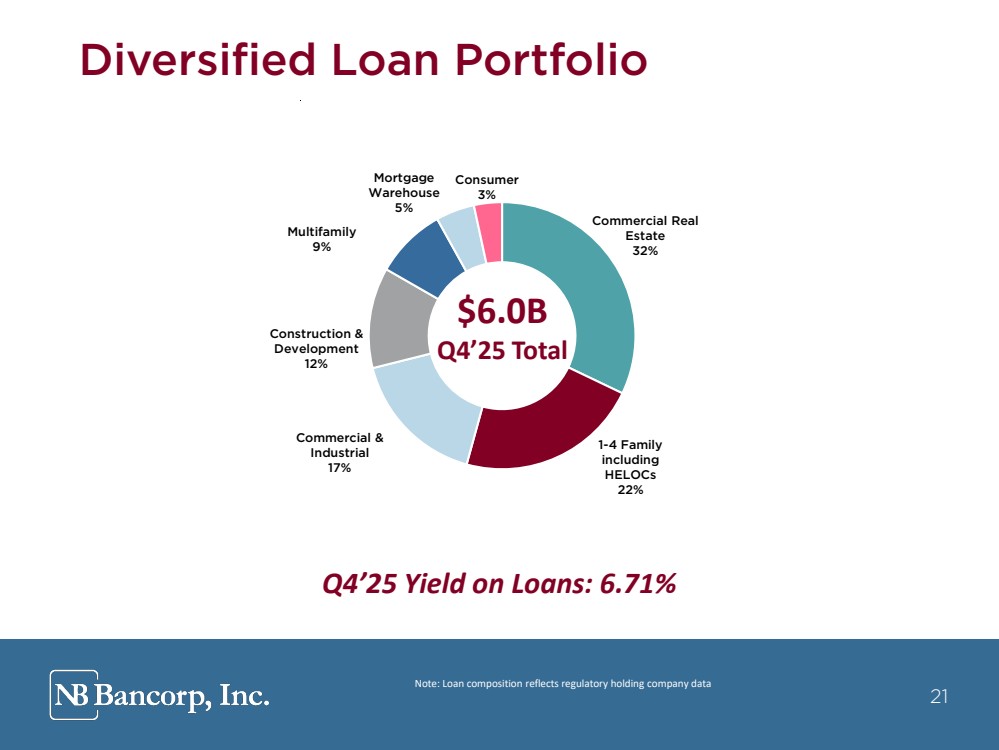
| 21 Note: Loan composition reflects regulatory holding company data Diversified Loan Portfolio Q4’25 Yield on Loans: 6.71% $6.0B Q4’25 Total 21 Commercial Real Estate 32% 1-4 Family including HELOCs 22% Commercial & Industrial 17% Construction & Development 12% Multifamily 9% Mortgage Warehouse 5% Consumer 3% |
| 22 Mortgage Warehouse Portfolio Overview • Our $285.9 million mortgage warehouse lending portfolio, acquired from BankProv, consists of facility lines to non-bank mortgage origination companies (“originators”). o It is a national platform with relationships across the United States that offers Master Repurchase Agreement facilities (“Facilities”) to independent originators, which allow them to fund the closing of residential mortgage loans. o Each Facility advance is fully collateralized, typically by a security interest in one- to four-family residential mortgage loans and is further enhanced by deposit balances. o The primary source of repayment of the facilities is the sale of the underlying mortgage loans to outside investors, which typically occurs within 15 days, except for construction-to-permanent loans, which generally take longer to sell due to the nature of the loan. These investors can include Federal National Mortgage Association/Federal Home Loan Mortgage Corporation and Government National Mortgage Association, as well as other large financial institutions. • The credit risk associated with this type of lending is the risk that the originators are unable to sell the loans, which is very low. The entire portfolio is current as of December 31, 2025. • We approve facilities to originators by conducting a thorough due diligence review of the originator and its ownership to assess their financial liquidity and regulatory risk profiles. We use a proprietary, risk-based scoring model to underwrite the companies, which correlates to our internal loan risk rating system and continually monitor originators’ performance through both internal and external financial management and quality reviews. 22 |
| 23 Enterprise Value (“EV”) Portfolio • Our C&I portfolio includes a $187.7 million EV portfolio, acquired from BankProv. The EV portfolio consists of loans and lines to entities collateralized by the cash flows and underlying enterprise value of the borrowing entity. • This portfolio has loans across the country and is geographically disperse. • The balance of this portfolio as of the date of the BankProv acquisition was $207.0 million. The portfolio has paid down $19.3 million in the short time since acquisition, with no charge-offs during this time. • The credit risk associated with this type of lending is the risk that the cash flows of the entity significantly decrease and do not provide for the ability to repay the remaining balance of the loan. • Management monitors this portfolio very closely and has been in close contact with predominantly all of the borrowing entities since acquisition. • Of the $39.9 million of purchase-credit deteriorated fair value marks recorded, $28.8 million was related to the EV portfolio. |
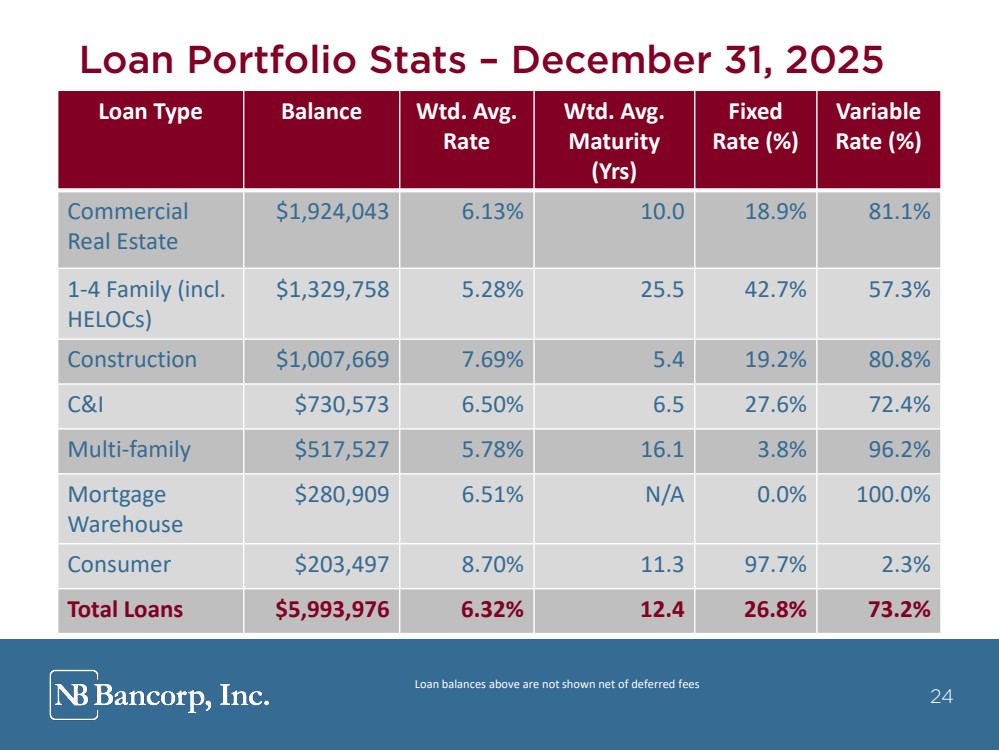
| 24 Loan balances above are not shown net of deferred fees Loan Portfolio Stats – December 31, 2025 Loan Type Balance Wtd. Avg. Rate Wtd. Avg. Maturity (Yrs) Fixed Rate (%) Variable Rate (%) Commercial Real Estate $1,924,043 6.13% 10.0 18.9% 81.1% 1-4 Family (incl. HELOCs) $1,329,758 5.28% 25.5 42.7% 57.3% Construction $1,007,669 7.69% 5.4 19.2% 80.8% C&I $730,573 6.50% 6.5 27.6% 72.4% Multi-family $517,527 5.78% 16.1 3.8% 96.2% Mortgage Warehouse $280,909 6.51% N/A 0.0% 100.0% Consumer $203,497 8.70% 11.3 97.7% 2.3% Total Loans $5,993,976 6.32% 12.4 26.8% 73.2% 24 |
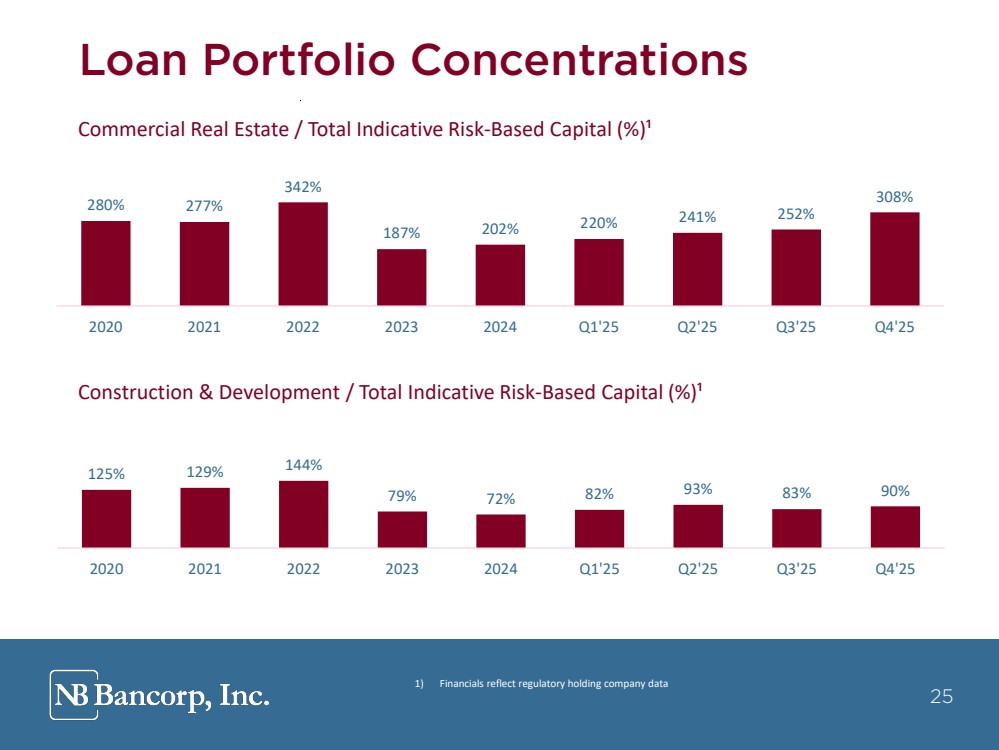
| 25 Construction & Development / Total Indicative Risk-Based Capital (%)¹ Commercial Real Estate / Total Indicative Risk-Based Capital (%)¹ Loan Portfolio Concentrations 1) Financials reflect regulatory holding company data 25 280% 277% 342% 187% 202% 220% 241% 252% 308% 2020 2021 2022 2023 2024 Q1'25 Q2'25 Q3'25 Q4'25 125% 129% 144% 79% 72% 82% 93% 83% 90% 2020 2021 2022 2023 2024 Q1'25 Q2'25 Q3'25 Q4'25 |
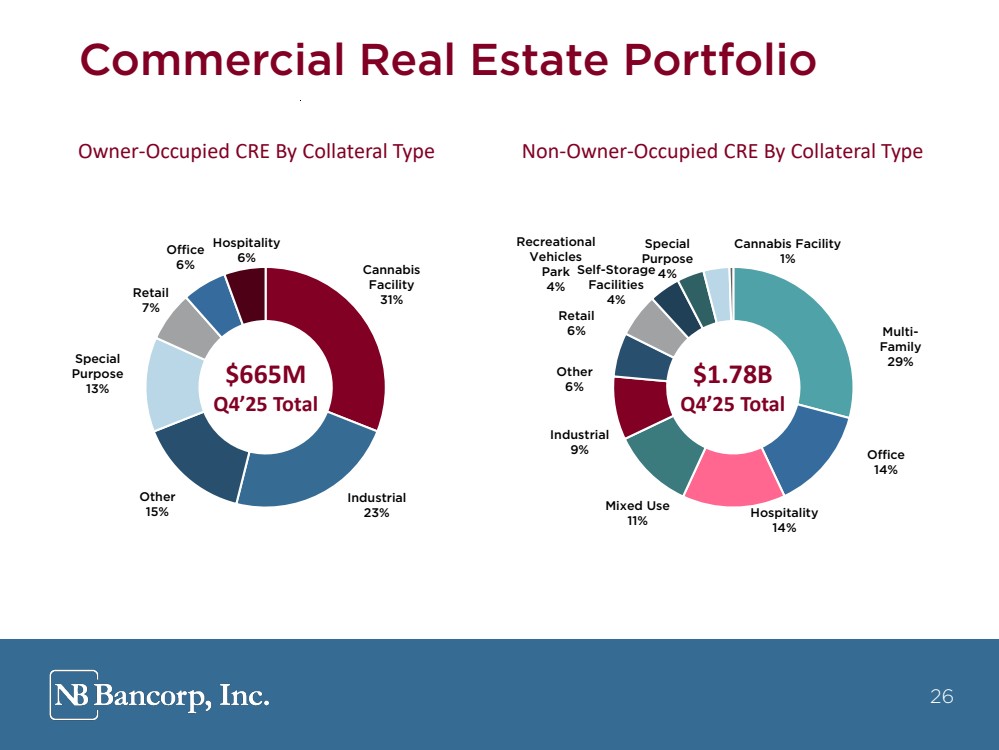
| 26 Owner-Occupied CRE By Collateral Type Non-Owner-Occupied CRE By Collateral Type Commercial Real Estate Portfolio $665M Q4’25 Total $1.78B Q4’25 Total 26 Cannabis Facility 31% Industrial 23% Other 15% Special Purpose 13% Retail 7% Office 6% Hospitality 6% Multi-Family 29% Office 14% Hospitality 14% Mixed Use 11% Industrial 9% Other 6% Retail 6% Recreational Vehicles Park 4% Self-Storage Facilities 4% Special Purpose 4% Cannabis Facility 1% |
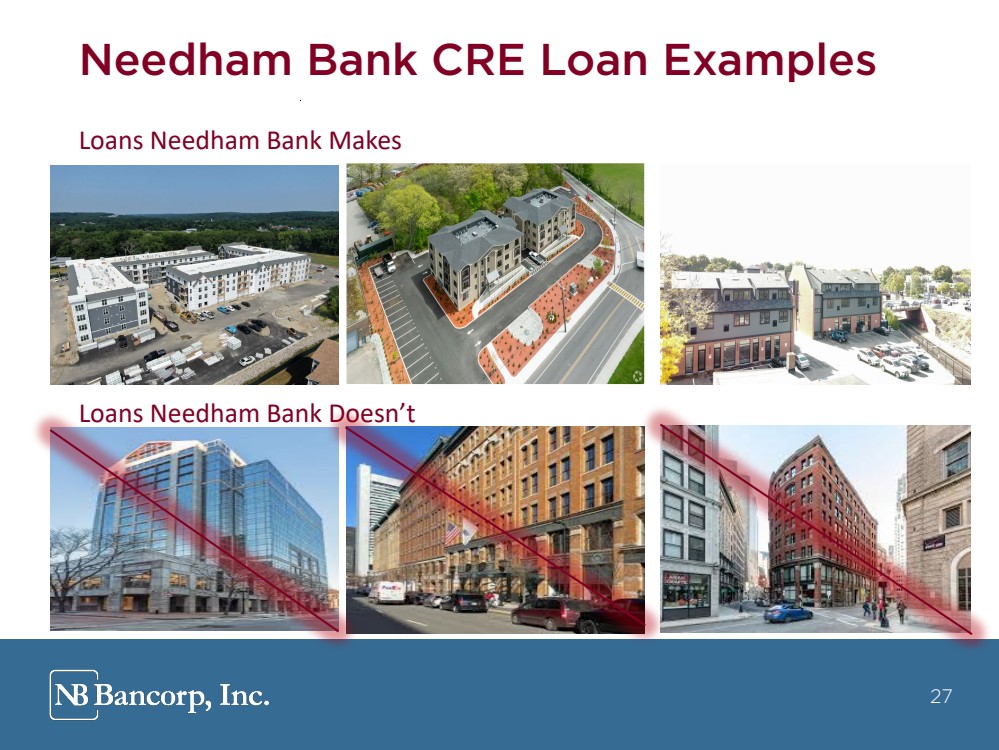
| 27 Loans Needham Bank Makes Loans Needham Bank Doesn’t Make Needham Bank CRE Loan Examples 27 |
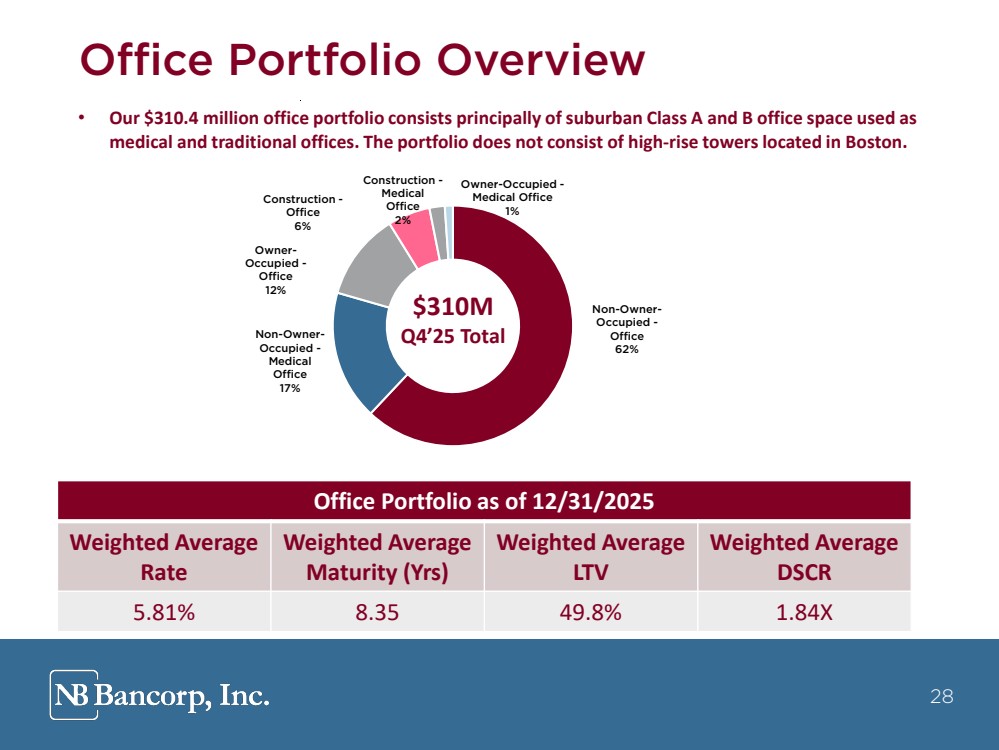
| 28 Office Portfolio Overview • Our $310.4 million office portfolio consists principally of suburban Class A and B office space used as medical and traditional offices. The portfolio does not consist of high-rise towers located in Boston. $310M Q4’25 Total 28 Office Portfolio as of 12/31/2025 Weighted Average Rate Weighted Average Maturity (Yrs) Weighted Average LTV Weighted Average DSCR 5.81% 8.35 49.8% 1.84X Non-Owner-Occupied - Office 62% Non-Owner-Occupied - Medical Office 17% Owner-Occupied - Office 12% Construction - Office 6% Construction - Medical Office 2% Owner-Occupied - Medical Office 1% |
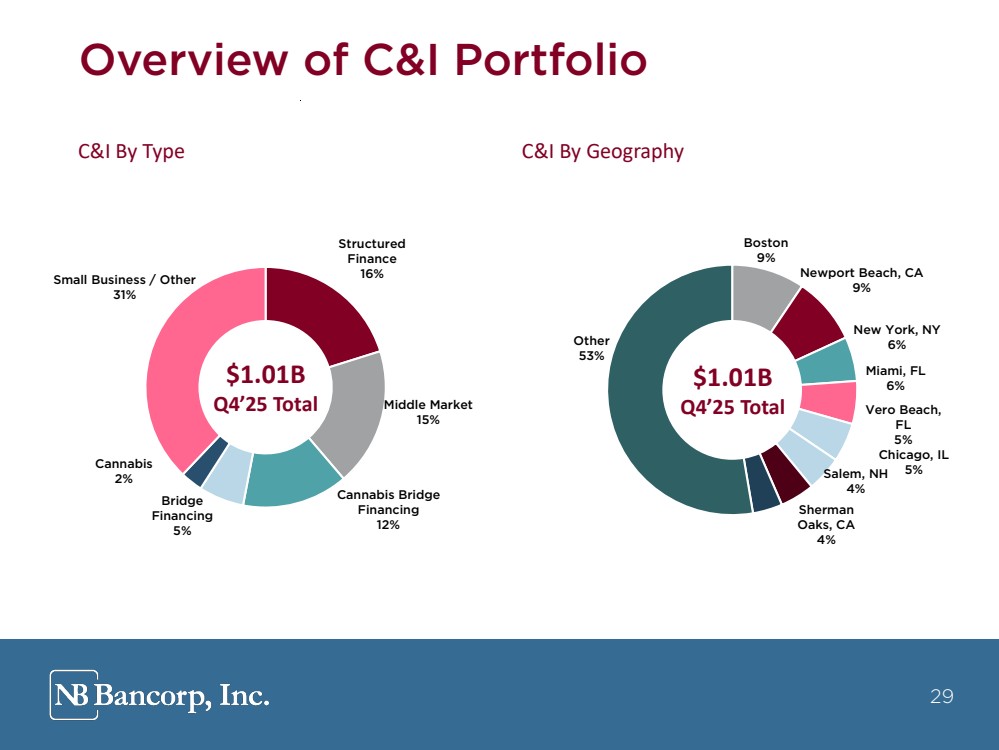
| 29 C&I By Type C&I By Geography Overview of C&I Portfolio $1.01B Q4’25 Total $1.01B Q4’25 Total 29 Structured Finance 16% Middle Market 15% Cannabis Bridge Financing 12% Bridge Financing 5% Cannabis 2% Small Business / Other 31% Boston 9% Newport Beach, CA 9% New York, NY 6% Miami, FL 6% Vero Beach, FL 5% Chicago, IL Salem, NH 5% 4% Sherman Oaks, CA 4% Other 53% |
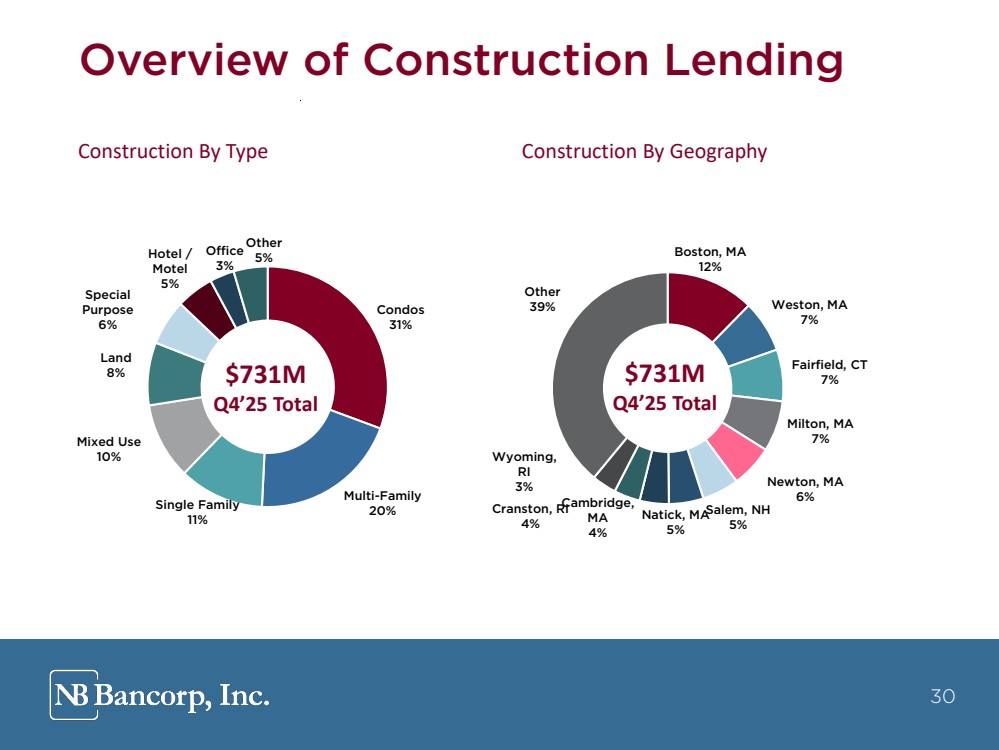
| 30 Construction By Type Construction By Geography Overview of Construction Lending $731M Q4’25 Total $731M Q4’25 Total 30 Boston, MA 12% Weston, MA 7% Fairfield, CT 7% Milton, MA 7% Newton, MA 6% Salem, NH 5% Natick, MA 5% Cambridge, MA 4% Cranston, RI 4% Wyoming, RI 3% Other Condos 39% 31% Multi-Family 20% Single Family 11% Mixed Use 10% Land 8% Special Purpose 6% Hotel / Motel 5% Office 3% Other 5% |
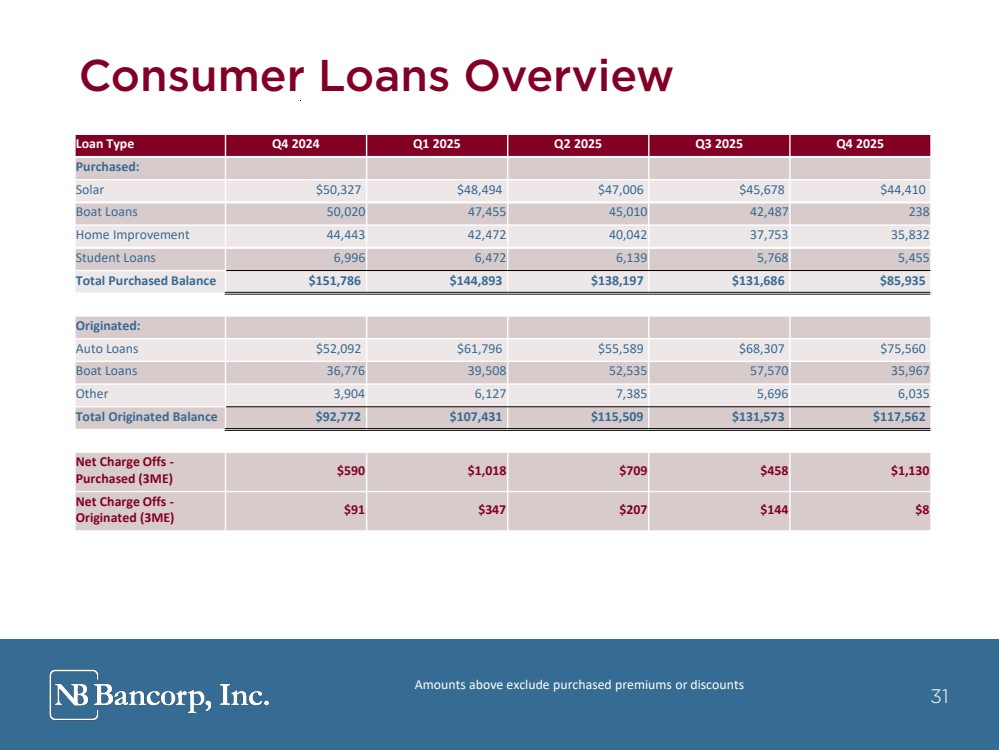
| 31 Consumer Loans Overview Amounts above exclude purchased premiums or discounts 31 Loan Type Q4 2024 Q1 2025 Q2 2025 Q3 2025 Q4 2025 Purchased: Solar $50,327 $48,494 $47,006 $45,678 $44,410 Boat Loans 50,020 47,455 45,010 42,487 238 Home Improvement 44,443 42,472 40,042 37,753 35,832 Student Loans 6,996 6,472 6,139 5,768 5,455 Total Purchased Balance $151,786 $144,893 $138,197 $131,686 $85,935 Originated: Auto Loans $52,092 $61,796 $55,589 $68,307 $75,560 Boat Loans 36,776 39,508 52,535 57,570 35,967 Other 3,904 6,127 7,385 5,696 6,035 Total Originated Balance $92,772 $107,431 $115,509 $131,573 $117,562 Net Charge Offs - Purchased (3ME) $590 $1,018 $709 $458 $1,130 Net Charge Offs - Originated (3ME) $91 $347 $207 $144 $8 |
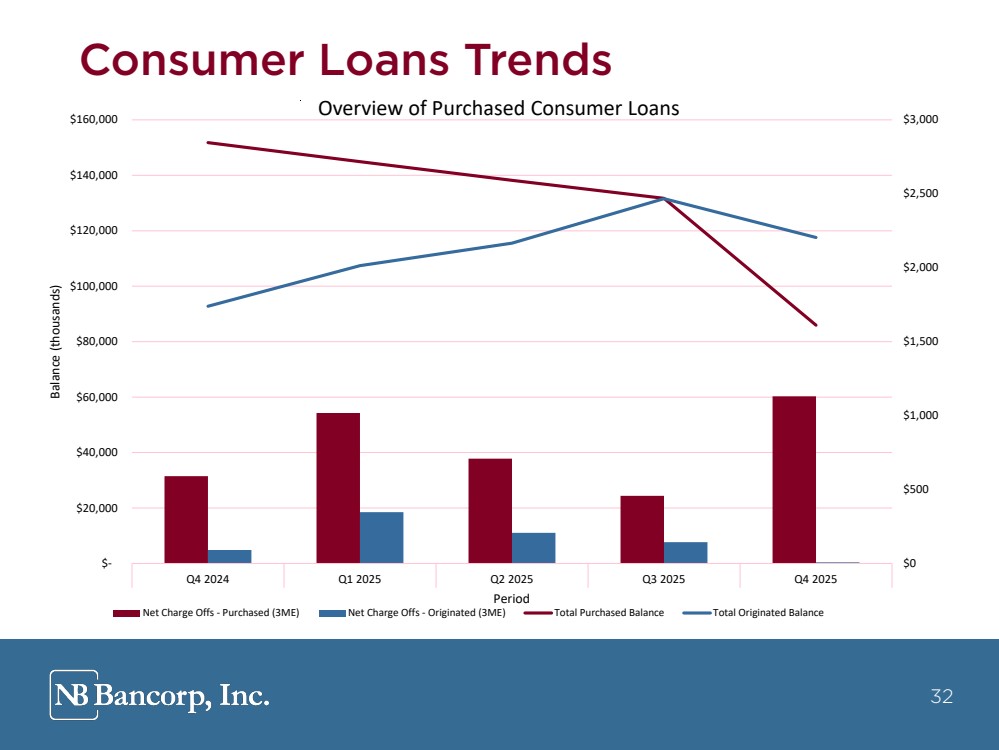
| 32 Consumer Loans Trends 32 $0 $500 $1,000 $1,500 $2,000 $2,500 $3,000 $- $20,000 $40,000 $60,000 $80,000 $100,000 $120,000 $140,000 $160,000 Q4 2024 Q1 2025 Q2 2025 Q3 2025 Q4 2025 Balance (thousands) Period Overview of Purchased Consumer Loans Net Charge Offs - Purchased (3ME) Net Charge Offs - Originated (3ME) Total Purchased Balance Total Originated Balance |
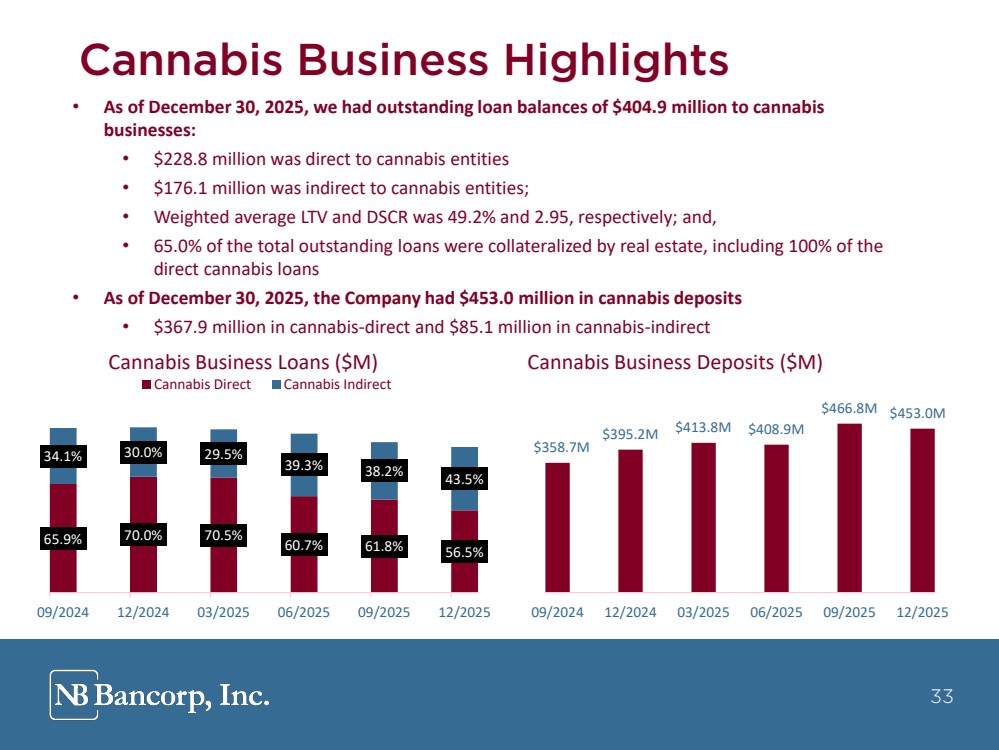
| 33 Cannabis Business Highlights • As of December 30, 2025, we had outstanding loan balances of $404.9 million to cannabis businesses: • $228.8 million was direct to cannabis entities • $176.1 million was indirect to cannabis entities; • Weighted average LTV and DSCR was 49.2% and 2.95, respectively; and, • 65.0% of the total outstanding loans were collateralized by real estate, including 100% of the direct cannabis loans • As of December 30, 2025, the Company had $453.0 million in cannabis deposits • $367.9 million in cannabis-direct and $85.1 million in cannabis-indirect Cannabis Business Loans ($M) Cannabis Business Deposits ($M) 33 $358.7M $395.2M $413.8M $408.9M $466.8M $453.0M 09/2024 12/2024 03/2025 06/2025 09/2025 12/2025 65.9% 70.0% 70.5% 60.7% 61.8% 56.5% 34.1% 30.0% 29.5% 39.3% 38.2% 43.5% 09/2024 12/2024 03/2025 06/2025 09/2025 12/2025 Cannabis Direct Cannabis Indirect |
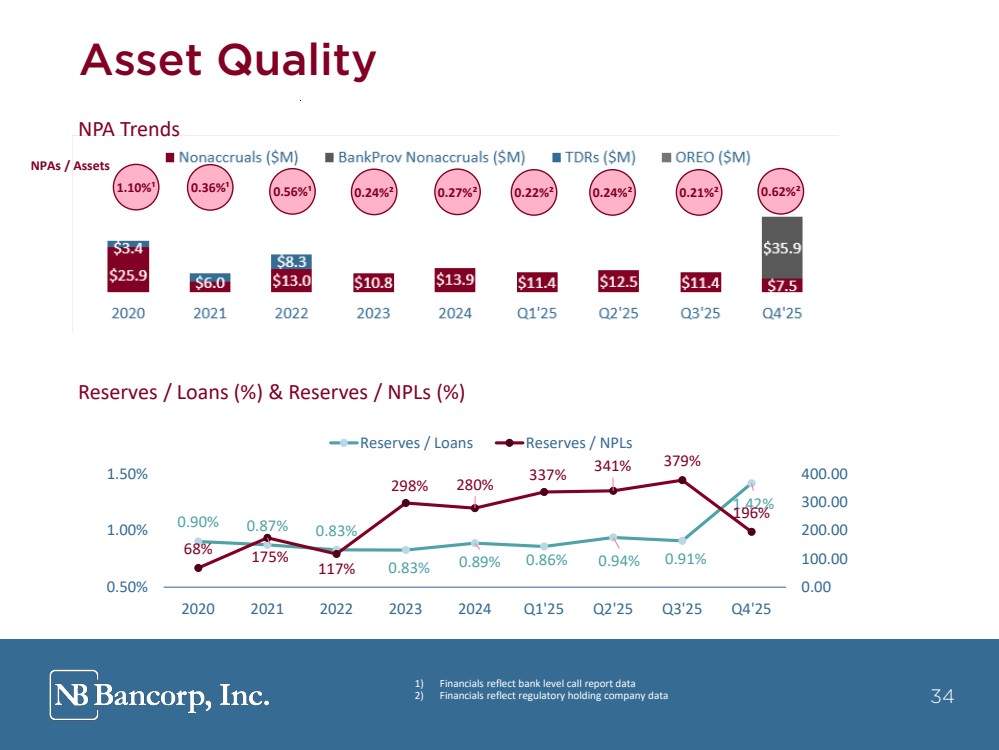
| 34 Reserves / Loans (%) & Reserves / NPLs (%) NPA Trends Asset Quality 1) Financials reflect bank level call report data 2) Financials reflect regulatory holding company data 1.10%¹ 0.56%¹ 0.24%² 0.36%¹ NPAs / Assets 34 0.27%² 0.22%² 0.24%² 0.21%² 0.62%² 0.90% 0.87% 0.83% 0.83% 0.89% 0.86% 0.94% 0.91% 1.42% 68% 175% 117% 298% 280% 337% 341% 379% 196% 0.00 100.00 200.00 300.00 400.00 0.50% 1.00% 1.50% 2020 2021 2022 2023 2024 Q1'25 Q2'25 Q3'25 Q4'25 Reserves / Loans Reserves / NPLs |
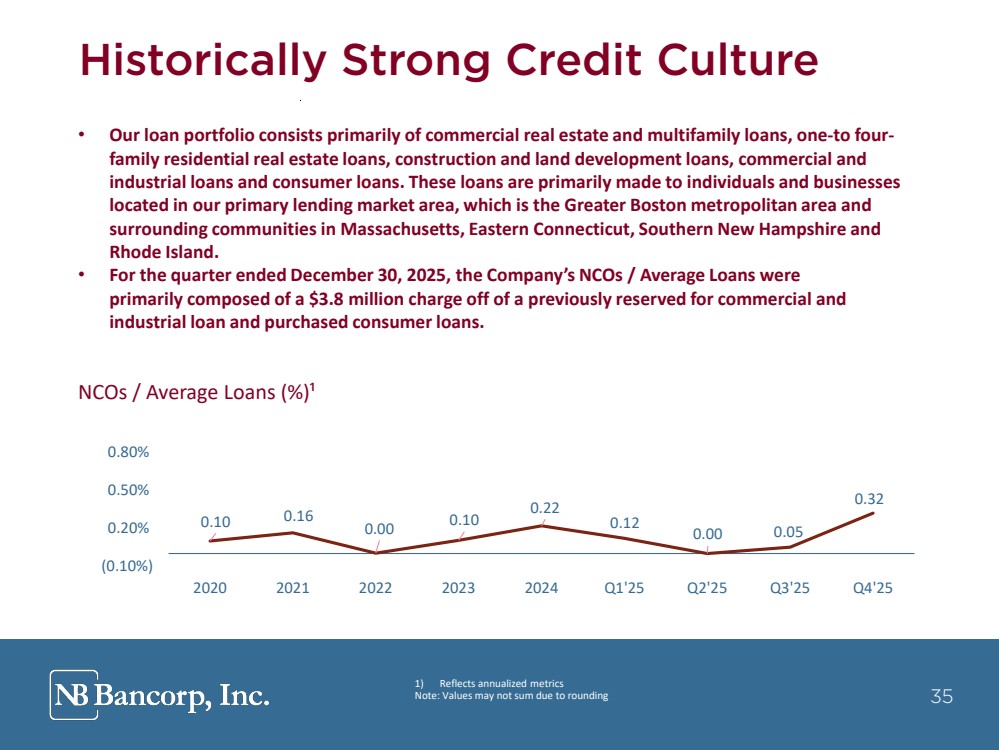
| 35 1) Reflects annualized metrics Note: Values may not sum due to rounding Historically Strong Credit Culture NCOs / Average Loans (%)¹ • Our loan portfolio consists primarily of commercial real estate and multifamily loans, one-to four-family residential real estate loans, construction and land development loans, commercial and industrial loans and consumer loans. These loans are primarily made to individuals and businesses located in our primary lending market area, which is the Greater Boston metropolitan area and surrounding communities in Massachusetts, Eastern Connecticut, Southern New Hampshire and Rhode Island. • For the quarter ended December 30, 2025, the Company’s NCOs / Average Loans were primarily composed of a $3.8 million charge off of a previously reserved for commercial and industrial loan and purchased consumer loans. 35 0.10 0.16 0.00 0.10 0.22 0.12 0.00 0.05 0.32 (0.10%) 0.20% 0.50% 0.80% 2020 2021 2022 2023 2024 Q1'25 Q2'25 Q3'25 Q4'25 |
| 36 Funding & Liquidity Management |
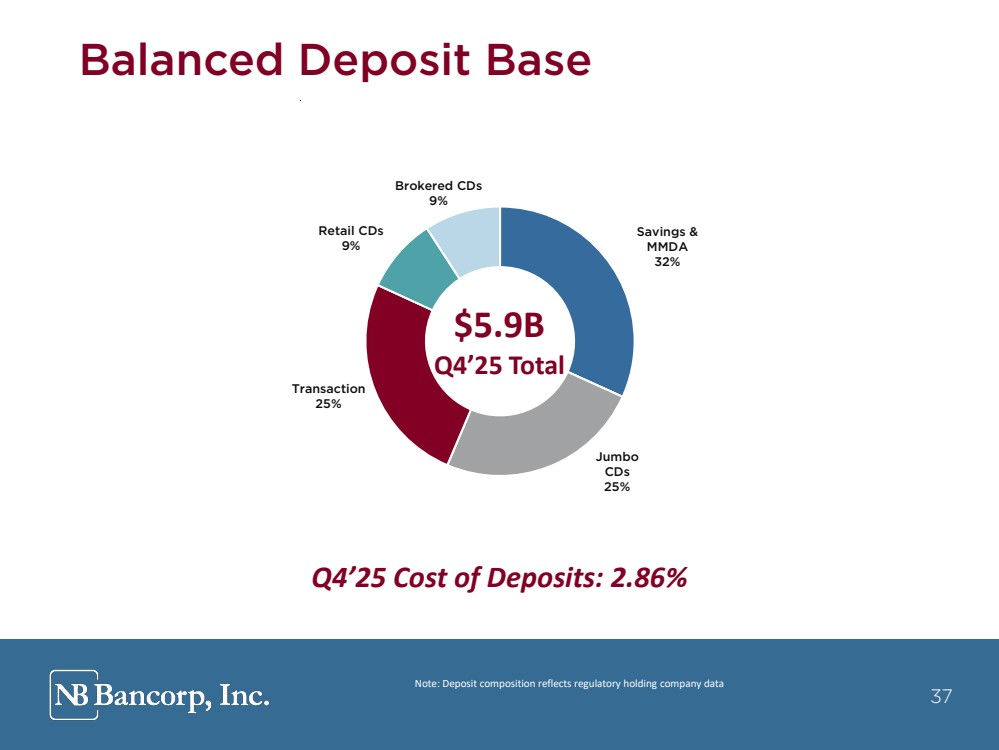
| 37 Note: Deposit composition reflects regulatory holding company data Balanced Deposit Base Q4’25 Cost of Deposits: 2.86% $5.9B Q4’25 Total 37 Savings & MMDA 32% Jumbo CDs 25% Transaction 25% Retail CDs 9% Brokered CDs 9% |
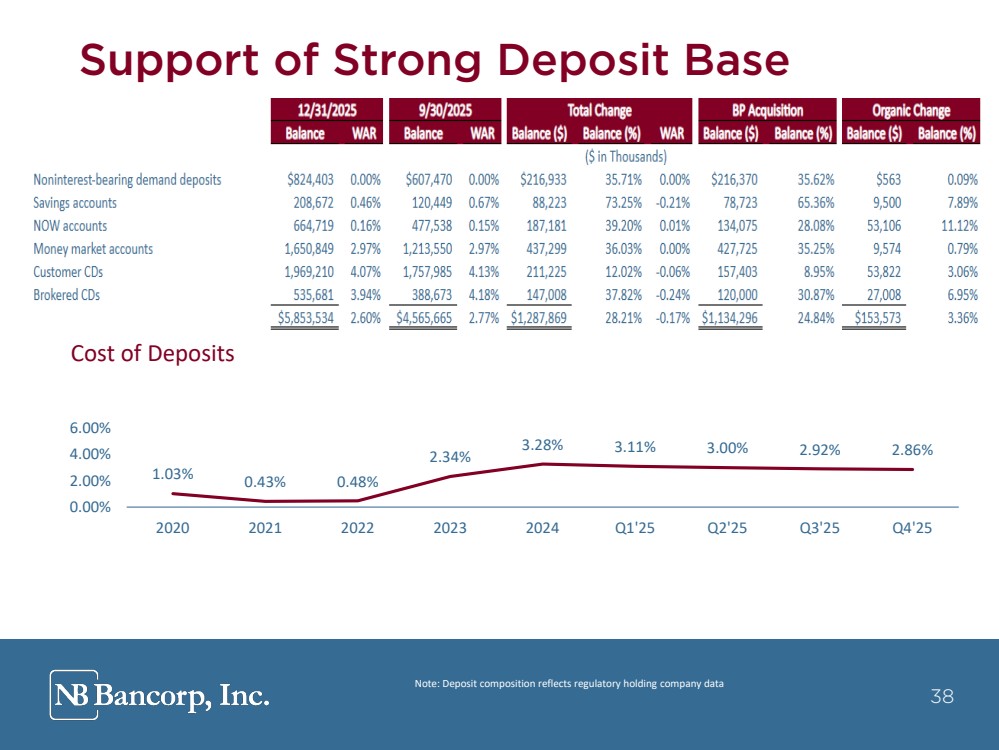
| 38 Note: Deposit composition reflects regulatory holding company data Support of Strong Deposit Base Cost of Deposits 38 1.03% 0.43% 0.48% 2.34% 3.28% 3.11% 3.00% 2.92% 2.86% 0.00% 2.00% 4.00% 6.00% 2020 2021 2022 2023 2024 Q1'25 Q2'25 Q3'25 Q4'25 |
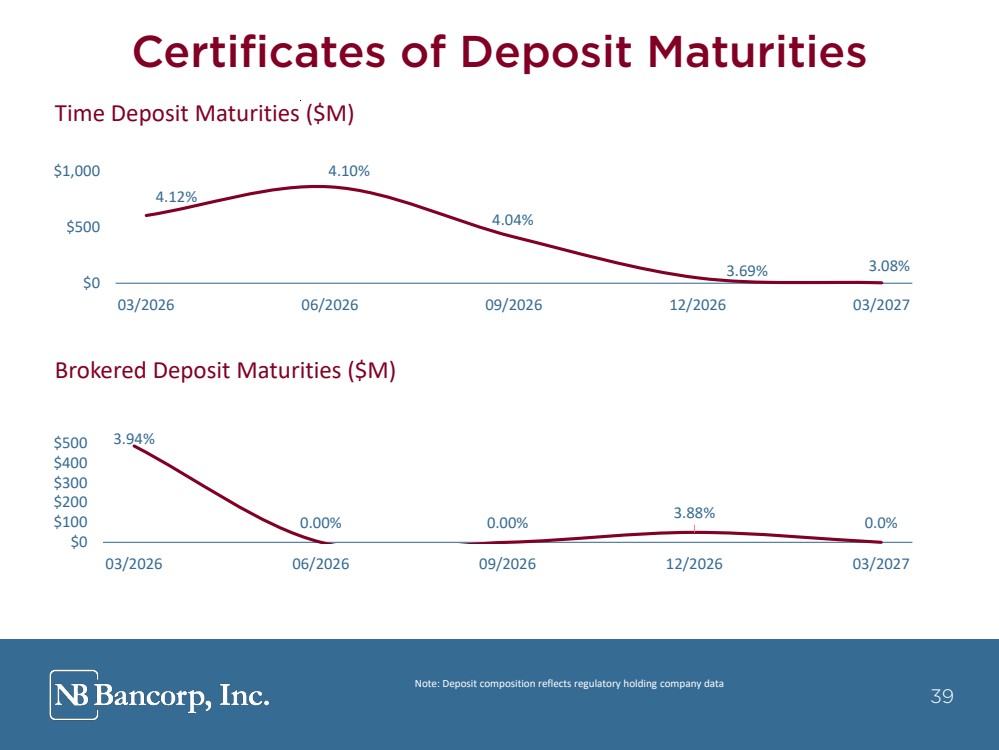
| 39 Note: Deposit composition reflects regulatory holding company data Certificates of Deposit Maturities 39 Time Deposit Maturities ($M) Brokered Deposit Maturities ($M) 4.12% 4.10% 4.04% 3.69% 3.08% $0 $500 $1,000 03/2026 06/2026 09/2026 12/2026 03/2027 3.94% 0.00% 0.00% 3.88% 0.0% $0 $100 $200 $300 $400 $500 03/2026 06/2026 09/2026 12/2026 03/2027 |
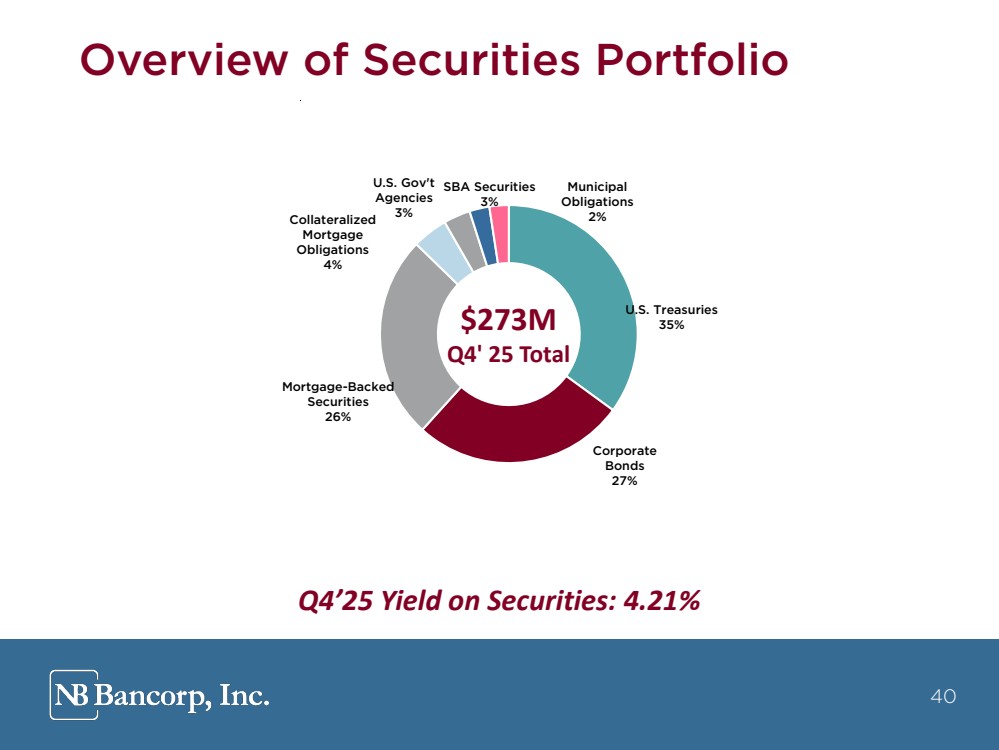
| 40 Overview of Securities Portfolio $273M Q4' 25 Total Q4’25 Yield on Securities: 4.21% 40 U.S. Treasuries 35% Corporate Bonds 27% Mortgage-Backed Securities 26% Collateralized Mortgage Obligations 4% U.S. Gov't Agencies 3% SBA Securities 3% Municipal Obligations 2% |
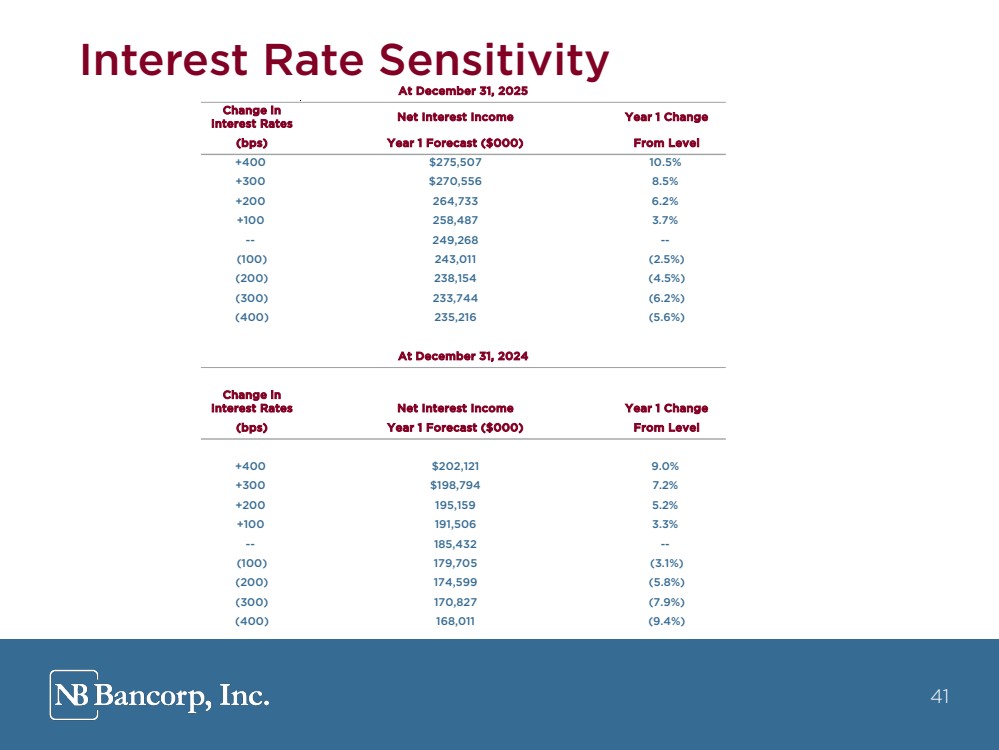
| 41 Interest Rate Sensitivity 41 At December 31, 2025 Change in Interest Rates Net Interest Income Year 1 Change (bps) Year 1 Forecast ($000) From Level +400 $275,507 10.5% +300 $270,556 8.5% +200 264,733 6.2% +100 258,487 3.7% -- 249,268 -- (100) 243,011 (2.5%) (200) 238,154 (4.5%) (300) 233,744 (6.2%) (400) 235,216 (5.6%) At December 31, 2024 Change in Interest Rates Net Interest Income Year 1 Change (bps) Year 1 Forecast ($000) From Level +400 $202,121 9.0% +300 $198,794 7.2% +200 195,159 5.2% +100 191,506 3.3% -- 185,432 -- (100) 179,705 (3.1%) (200) 174,599 (5.8%) (300) 170,827 (7.9%) (400) 168,011 (9.4%) |
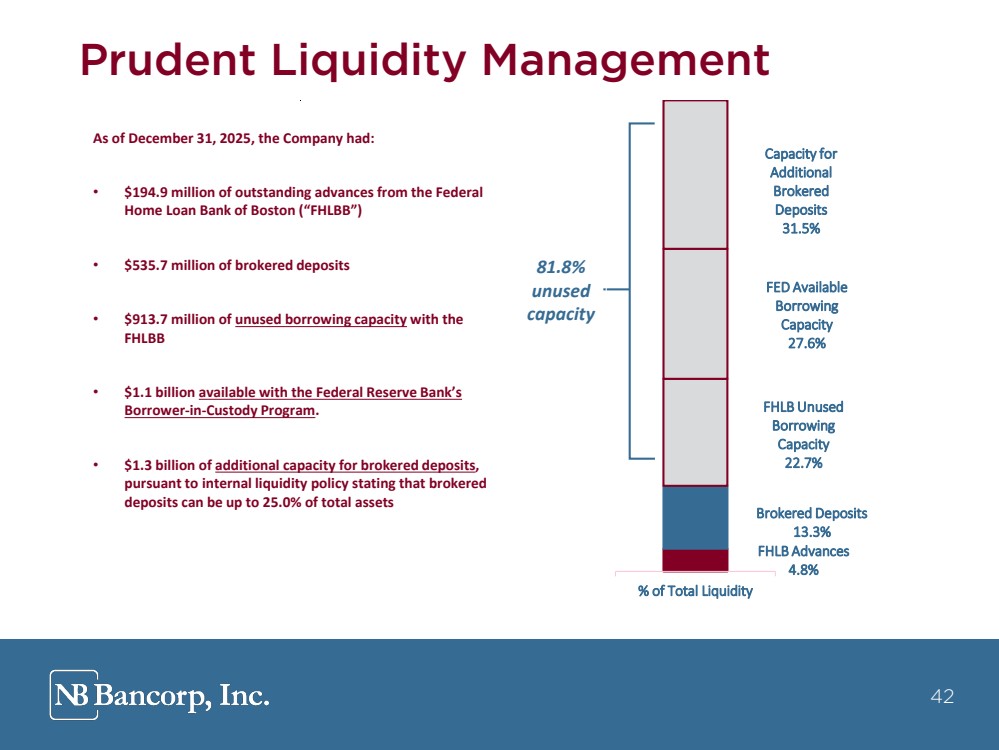
| 42 Prudent Liquidity Management As of December 31, 2025, the Company had: • $194.9 million of outstanding advances from the Federal Home Loan Bank of Boston (“FHLBB”) • $535.7 million of brokered deposits • $913.7 million of unused borrowing capacity with the FHLBB • $1.1 billion available with the Federal Reserve Bank’s Borrower-in-Custody Program. • $1.3 billion of additional capacity for brokered deposits, pursuant to internal liquidity policy stating that brokered deposits can be up to 25.0% of total assets 81.8% unused capacity 42 FHLB Advances 4.8% Brokered Deposits 13.3% FHLB Unused Borrowing Capacity 22.7% FED Available Borrowing Capacity 27.6% Capacity for Additional Brokered Deposits 31.5% % of Total Liquidity |
| 43 Appendix |

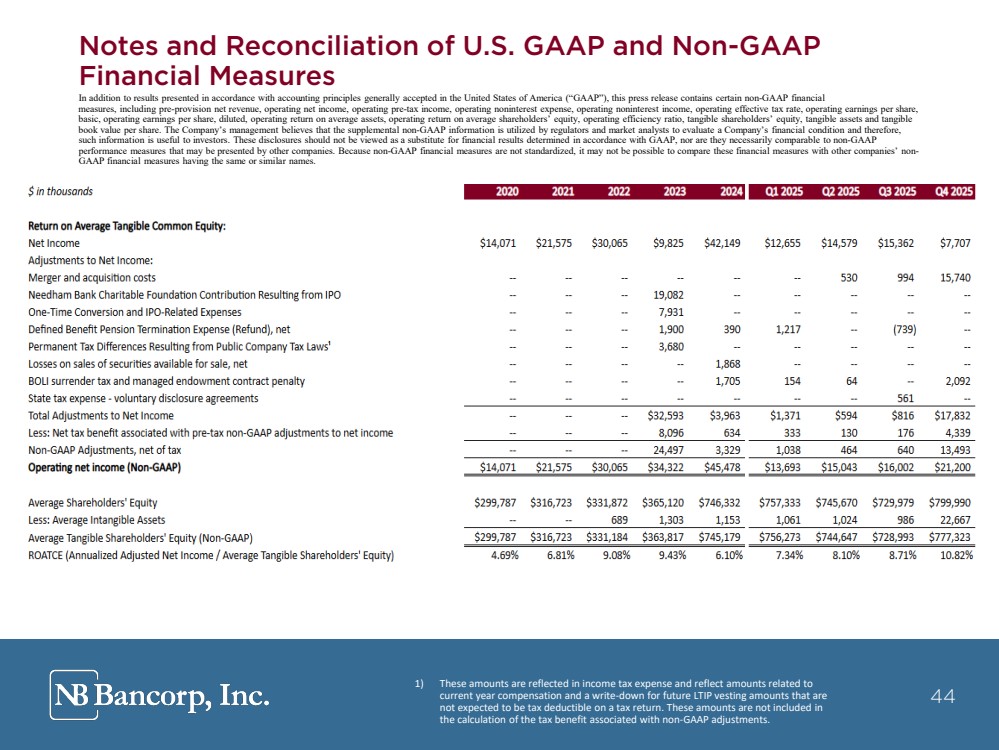
| 44 Notes and Reconciliation of U.S. GAAP and Non-GAAP Financial Measures In addition to results presented in accordance with accounting principles generally accepted in the United States of America (“GAAP”), this press release contains certain non-GAAP financial measures, including pre-provision net revenue, operating net income, operating pre-tax income, operating noninterest expense, operating noninterest income, operating effective tax rate, operating earnings per share, basic, operating earnings per share, diluted, operating return on average assets, operating return on average shareholders’ equity, operating efficiency ratio, tangible shareholders’ equity, tangible assets and tangible book value per share. The Company’s management believes that the supplemental non-GAAP information is utilized by regulators and market analysts to evaluate a Company’s financial condition and therefore, such information is useful to investors. These disclosures should not be viewed as a substitute for financial results determined in accordance with GAAP, nor are they necessarily comparable to non-GAAP performance measures that may be presented by other companies. Because non-GAAP financial measures are not standardized, it may not be possible to compare these financial measures with other companies’ non-GAAP financial measures having the same or similar names. 1) These amounts are reflected in income tax expense and reflect amounts related to current year compensation and a write-down for future LTIP vesting amounts that are not expected to be tax deductible on a tax return. These amounts are not included in the calculation of the tax benefit associated with non-GAAP adjustments. 44 |
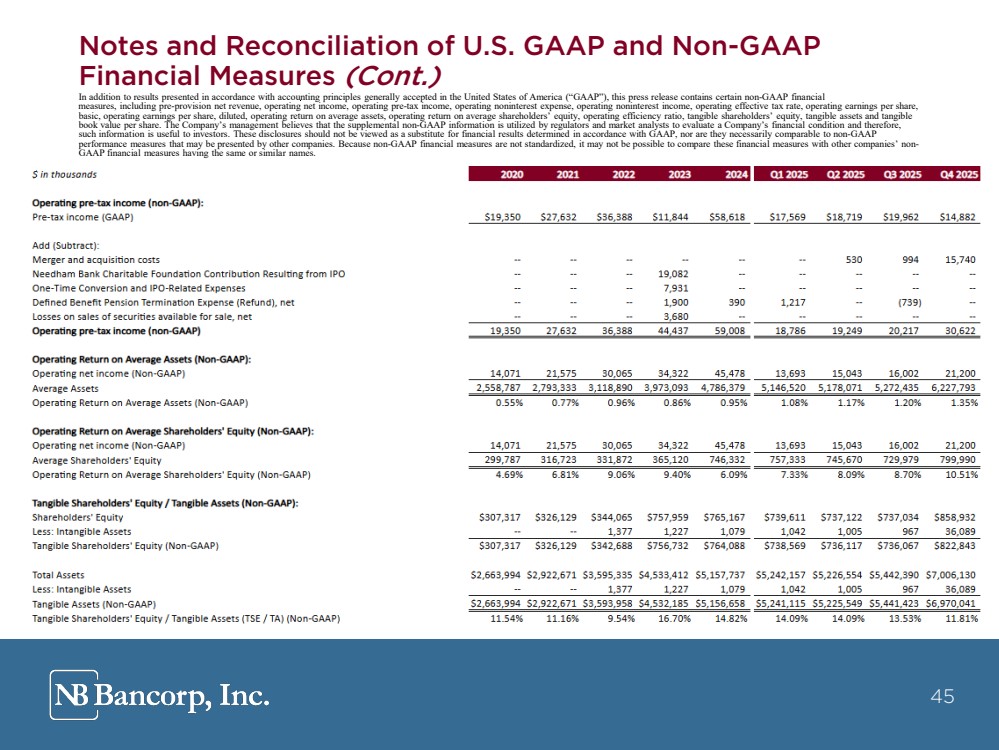
| 45 Notes and Reconciliation of U.S. GAAP and Non-GAAP Financial Measures (Cont.) In addition to results presented in accordance with accounting principles generally accepted in the United States of America (“GAAP”), this press release contains certain non-GAAP financial measures, including pre-provision net revenue, operating net income, operating pre-tax income, operating noninterest expense, operating noninterest income, operating effective tax rate, operating earnings per share, basic, operating earnings per share, diluted, operating return on average assets, operating return on average shareholders’ equity, operating efficiency ratio, tangible shareholders’ equity, tangible assets and tangible book value per share. The Company’s management believes that the supplemental non-GAAP information is utilized by regulators and market analysts to evaluate a Company’s financial condition and therefore, such information is useful to investors. These disclosures should not be viewed as a substitute for financial results determined in accordance with GAAP, nor are they necessarily comparable to non-GAAP performance measures that may be presented by other companies. Because non-GAAP financial measures are not standardized, it may not be possible to compare these financial measures with other companies’ non- GAAP financial measures having the same or similar names. 45 |
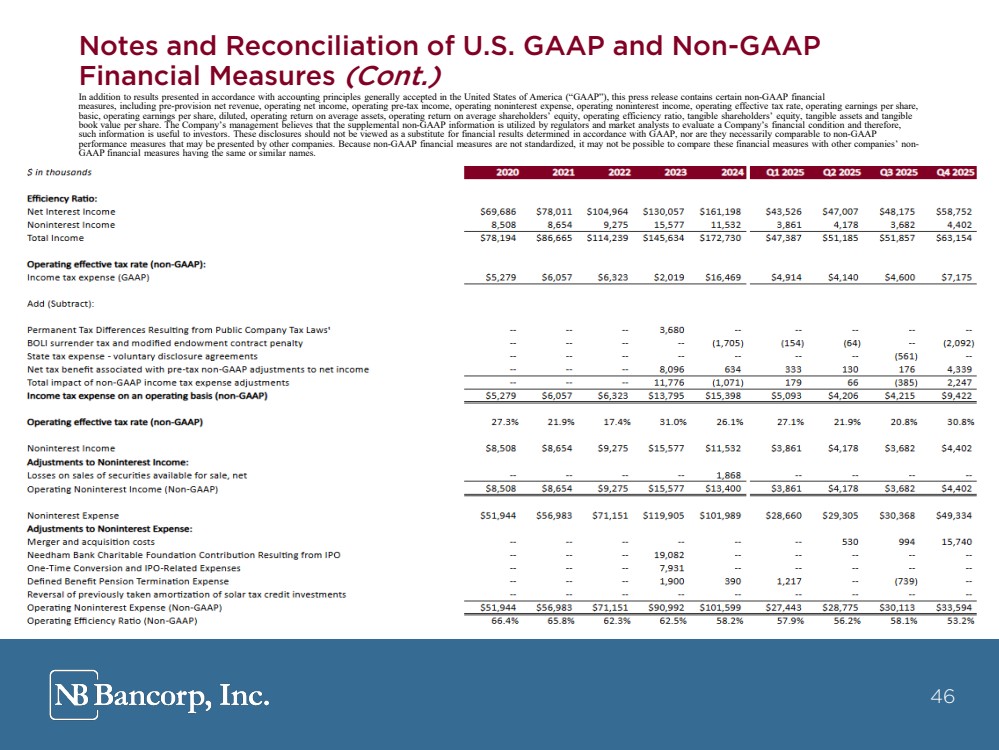
| 46 Notes and Reconciliation of U.S. GAAP and Non-GAAP Financial Measures (Cont.) In addition to results presented in accordance with accounting principles generally accepted in the United States of America (“GAAP”), this press release contains certain non-GAAP financial measures, including pre-provision net revenue, operating net income, operating pre-tax income, operating noninterest expense, operating noninterest income, operating effective tax rate, operating earnings per share, basic, operating earnings per share, diluted, operating return on average assets, operating return on average shareholders’ equity, operating efficiency ratio, tangible shareholders’ equity, tangible assets and tangible book value per share. The Company’s management believes that the supplemental non-GAAP information is utilized by regulators and market analysts to evaluate a Company’s financial condition and therefore, such information is useful to investors. These disclosures should not be viewed as a substitute for financial results determined in accordance with GAAP, nor are they necessarily comparable to non-GAAP performance measures that may be presented by other companies. Because non-GAAP financial measures are not standardized, it may not be possible to compare these financial measures with other companies’ non- GAAP financial measures having the same or similar names. 46 |
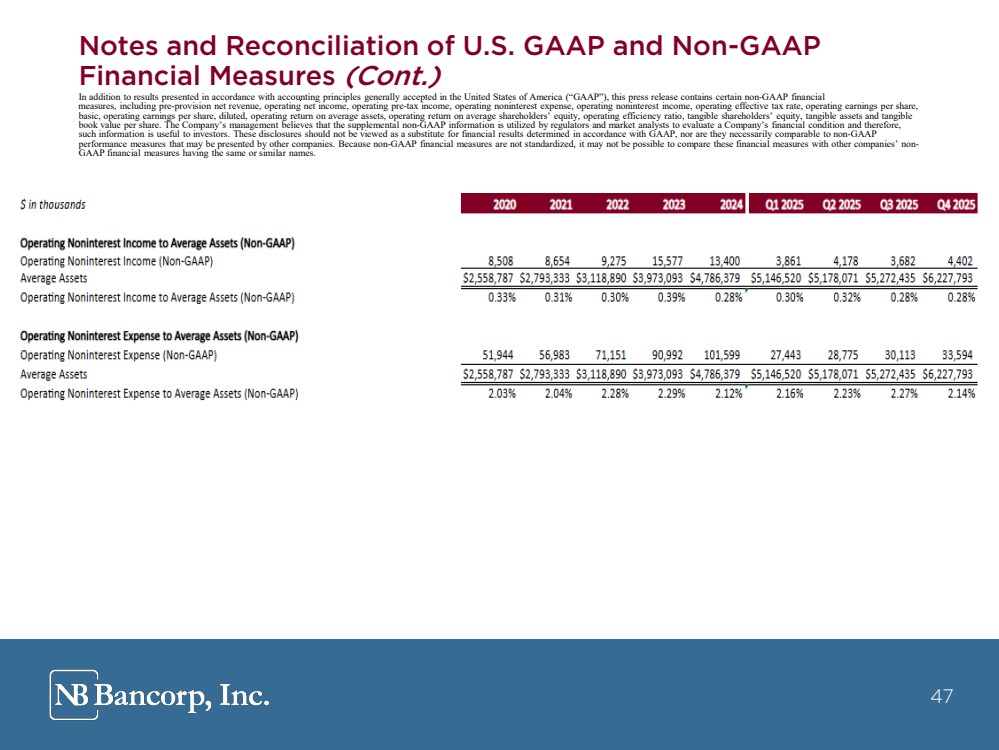
| 47 Notes and Reconciliation of U.S. GAAP and Non-GAAP Financial Measures (Cont.) In addition to results presented in accordance with accounting principles generally accepted in the United States of America (“GAAP”), this press release contains certain non-GAAP financial measures, including pre-provision net revenue, operating net income, operating pre-tax income, operating noninterest expense, operating noninterest income, operating effective tax rate, operating earnings per share, basic, operating earnings per share, diluted, operating return on average assets, operating return on average shareholders’ equity, operating efficiency ratio, tangible shareholders’ equity, tangible assets and tangible book value per share. The Company’s management believes that the supplemental non-GAAP information is utilized by regulators and market analysts to evaluate a Company’s financial condition and therefore, such information is useful to investors. These disclosures should not be viewed as a substitute for financial results determined in accordance with GAAP, nor are they necessarily comparable to non-GAAP performance measures that may be presented by other companies. Because non-GAAP financial measures are not standardized, it may not be possible to compare these financial measures with other companies’ non- GAAP financial measures having the same or similar names. 47 |
| 48 Executive Management Biographies Joseph Campanelli Chairman, President & CEO Christine Roberts SEVP & Chief Operating Officer JP Lapointe SEVP & Chief Financial Officer Mr. Campanelli has served as President and Chief Executive Officer of Needham Bank since joining the Bank in January 2017 and was elected Chairman in 2022. Mr. Campanelli has over 40 years of banking experience in a variety of senior and executive positions, including having served as the President and Chief Executive Officer of Sovereign Bancorp, Inc. and its subsidiary Sovereign Bank as well as Chairman, President and Chief Executive Officer of Flagstar Bancorp, Inc. and its subsidiary Flagstar Bank. Additionally, Mr. Campanelli has a long history of community involvement, currently serving on the board of the Massachusetts Business Roundtable, Boys and Girls Club of Boston and The One Hundred Club of Boston. Ms. Roberts is Senior Executive Vice President and Chief Operating Officer of Needham Bank, a position she has held since January 2025 when she joined Needham Bank. Prior to this, Ms. Roberts was Executive Vice President of Citizens Pay at Citizens Bank since April 2022. Ms. Roberts had been employed at Citizens Bank since August 2012, where she held positions of increasing responsibility across the institution. Mr. Lapointe is Senior Executive Vice President and Chief Financial Officer, a position he has held since February 2024. Prior to this, Mr. Lapointe was the Chief Financial Officer of Northeast Bank from November 2017 until February 2024. Prior to joining Northeast Bank, Mr. Lapointe served as a Senior Audit Manager at Wolf & Company, P.C. in its external and internal audit practices, with a focus on the financial services sector from 2004 to 2017. Mr. Lapointe is a certified public accountant registered in the Commonwealth of Massachusetts. Kevin Henkin EVP & Chief Credit Officer Mr. Henkin is Executive Vice President and Chief Credit Officer of Needham Bank, a position he has held since April 2018. In this role, Mr. Henkin has primary responsibility for managing all aspects of the credit risk management framework over the Bank’s lending operations. Mr. Henkin has over 30 years of banking experience, having served at other financial institutions as well as running a bank consulting firm for three years at which Mr. Henkin conducted external loan reviews, stress testing and due diligence for financial institutions. 48 |

| 49 Thank You |