2025 Third Quarter Earnings Call Presentation November 7, 2025 NYSE: FUN .2
Safe Harbor 2 Some of the statements contained in this presentation that are not historical in nature are forward-looking statements within the meaning of the federal securities laws, including Section 27A of the Securities Act of 1933, as amended, and Section 21E of the Securities Exchange Act of 1934, as amended, including statements as to our expectations, beliefs, goals and strategies regarding the future. Words such as “anticipate,” “believe,” “create,” “expect,” “future,” “guidance,” “intend,” “plan,” “potential,” “seek,” “synergies,” “target,” “objective,” “will,” “would,” similar expressions, and variations or negatives of these words identify forward-looking statements. However, the absence of these words does not mean that the statements are not forward-looking. Forward-looking statements by their nature address matters that are, to different degrees, uncertain. These forward-looking statements may involve current plans, estimates, expectations and ambitions that are subject to risks, uncertainties and assumptions that are difficult to predict, may be beyond our control and could cause actual results to differ materially from those described in such statements. Although we believe that the expectations reflected in such forward-looking statements are reasonable, we can give no assurance that such expectations will prove to be correct, or that our growth and operational strategies will achieve the target results. Important risks and uncertainties that may cause such a difference and could adversely affect attendance at our parks, our future financial performance, and/or our growth strategies, and could cause actual results to differ materially from our expectations or otherwise to fluctuate or decrease, include, but are not limited to: failure to realize the anticipated benefits of the merger, including difficulty in integrating the businesses of legacy Six Flags and legacy Cedar Fair; failure to realize the expected amount and timing of cost savings and operating synergies related to the merger; adverse weather conditions; general economic, political and market conditions; the impacts of pandemics or other public health crises, including the effects of government responses on people and economies; competition for consumer leisure time and spending or other changes in consumer behavior or sentiment for discretionary spending; unanticipated construction delays or increases in construction or supply costs; changes in capital investment plans and projects; anticipated tax treatment, unforeseen liabilities, future capital expenditures, revenues, expenses, earnings, synergies, economic performance, indebtedness, financial condition, losses, future prospects, business and management strategies for the management, expansion and growth of the combined company’s operations; legislative, regulatory and economic developments and changes in laws, regulations, and policies affecting the combined company; acts of terrorism or outbreak of war, hostilities, civil unrest, and other political or security disturbances; and other risks and uncertainties we discuss under the heading “Risk Factors” within our Annual Report on Form 10-K and in the other filings we make from time to time with the Securities and Exchange Commission. Readers are urged not to place undue reliance on these forward-looking statements, which speak only as of the date of this document and are based on information currently and reasonably known to us. We do not undertake any obligation to publicly update or revise any forward-looking statements to reflect future events, information or circumstances that arise after publication of this presentation.
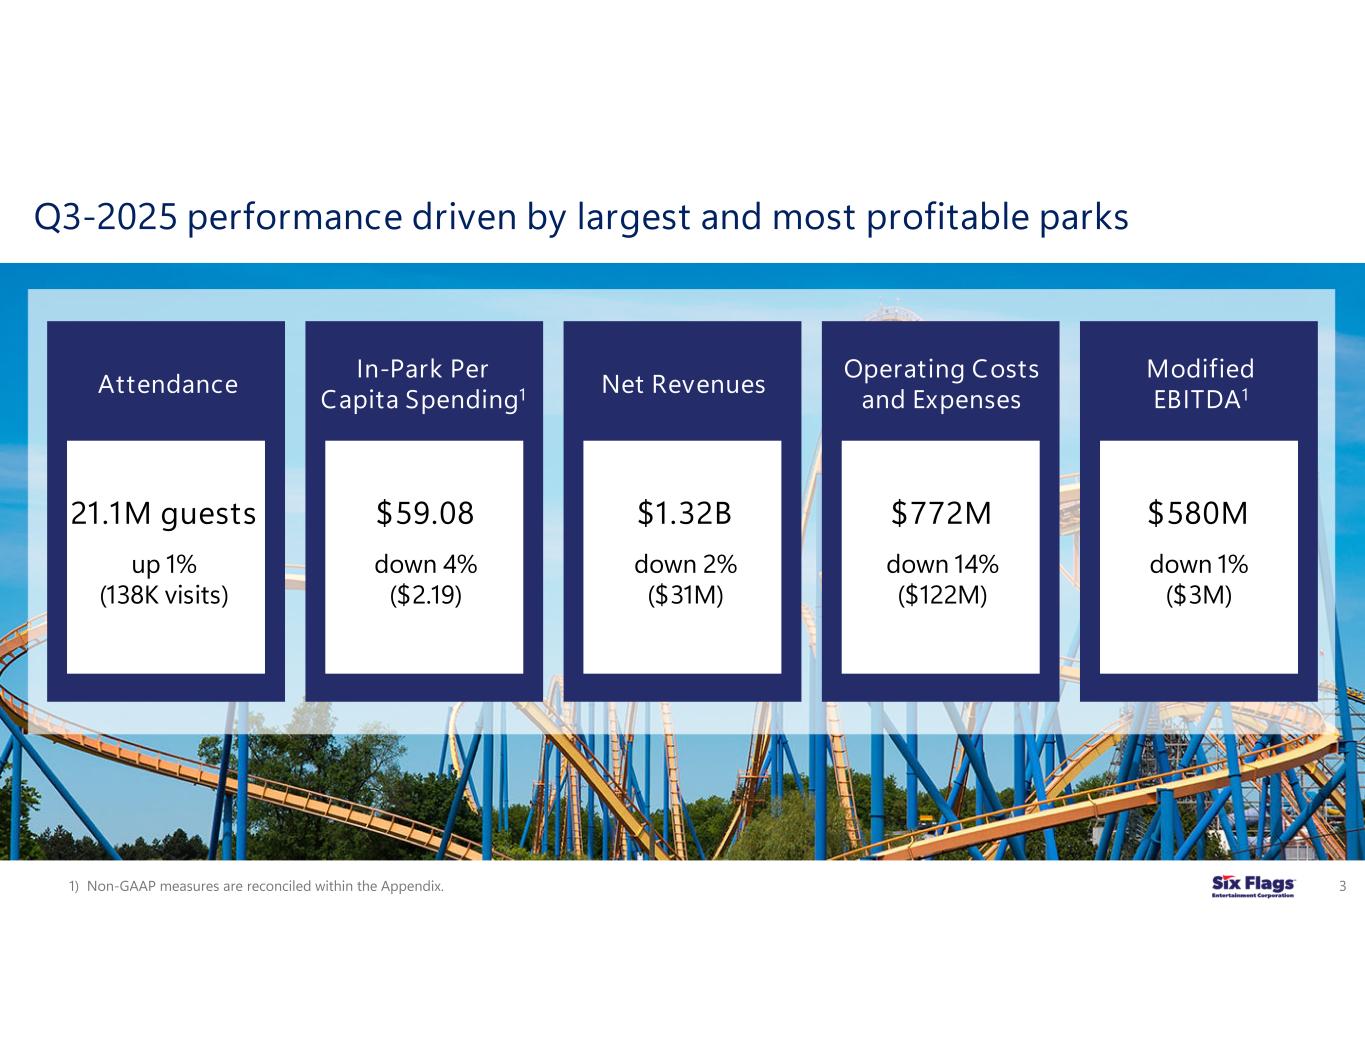
Q3-2025 performance driven by largest and most profitable parks 3 In-Park Per Capita Spending1 Net Revenues Operating Costs and Expenses Modified EBITDA1 Attendance $1.32B down 2% ($31M) 1) Non-GAAP measures are reconciled within the Appendix. $59.08 down 4% ($2.19) 21.1M guests up 1% (138K visits) $772M down 14% ($122M) $580M down 1% ($3M)
2025 Challenging But Laid Foundation for Future Growth Majority of park-level EBITDA (~70% of YTD) is healthy and growing despite severe Q2 weather impact To drive long-term EBITDA growth, aggressively invested in operating costs and capital expenditures while adjusting pricing and promotional strategies Investments drove improvement in long-lead performance indicators, underscoring turnaround opportunity at underperforming parks Measures undertaken to reset cost structure and address legacy underinvestment Magnitude of product initiatives outpaced consumers’ ability to comfortably absorb changes in a single season Strategy for 2026 focused on reassessing pricing and product structure, optimizing operating and capital expense needs, and prioritizing parks with the highest EBITDA potential 4
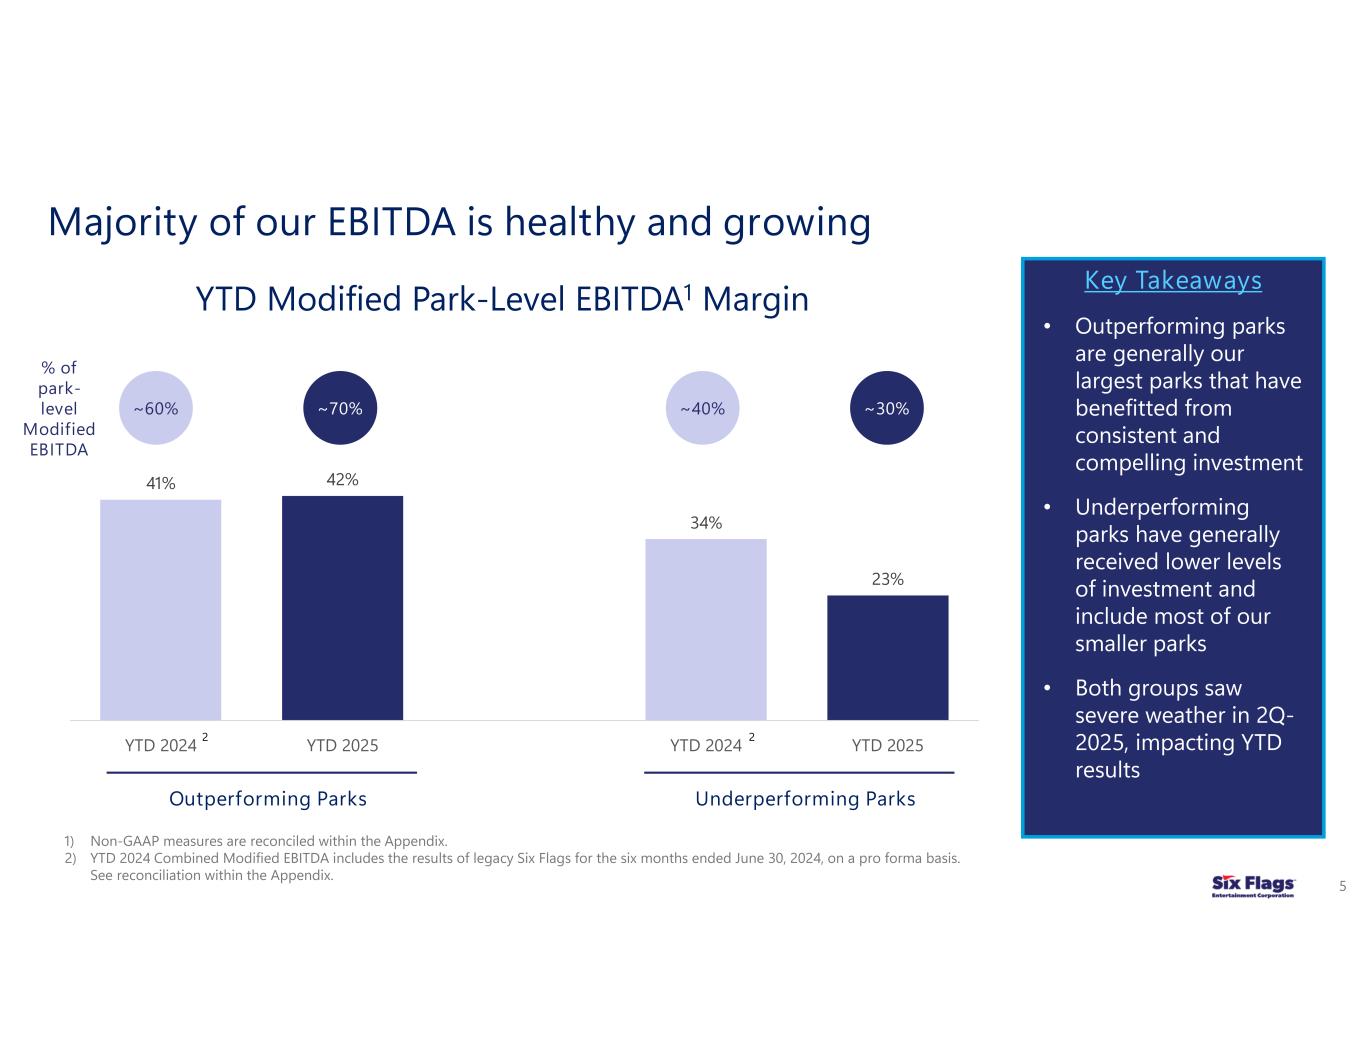
41% 42% 34% 23% YTD 2024 YTD 2025 YTD 2024 YTD 2025 Majority of our EBITDA is healthy and growing Underperforming Parks 5 YTD Modified Park-Level EBITDA1 Margin Key Takeaways • Outperforming parks are generally our largest parks that have benefitted from consistent and compelling investment • Underperforming parks have generally received lower levels of investment and include most of our smaller parks • Both groups saw severe weather in 2Q- 2025, impacting YTD results 1) Non-GAAP measures are reconciled within the Appendix. 2) YTD 2024 Combined Modified EBITDA includes the results of legacy Six Flags for the six months ended June 30, 2024, on a pro forma basis. See reconciliation within the Appendix. Outperforming Parks % of park- level Modified EBITDA ~60% ~70% ~40% ~30% 2 2
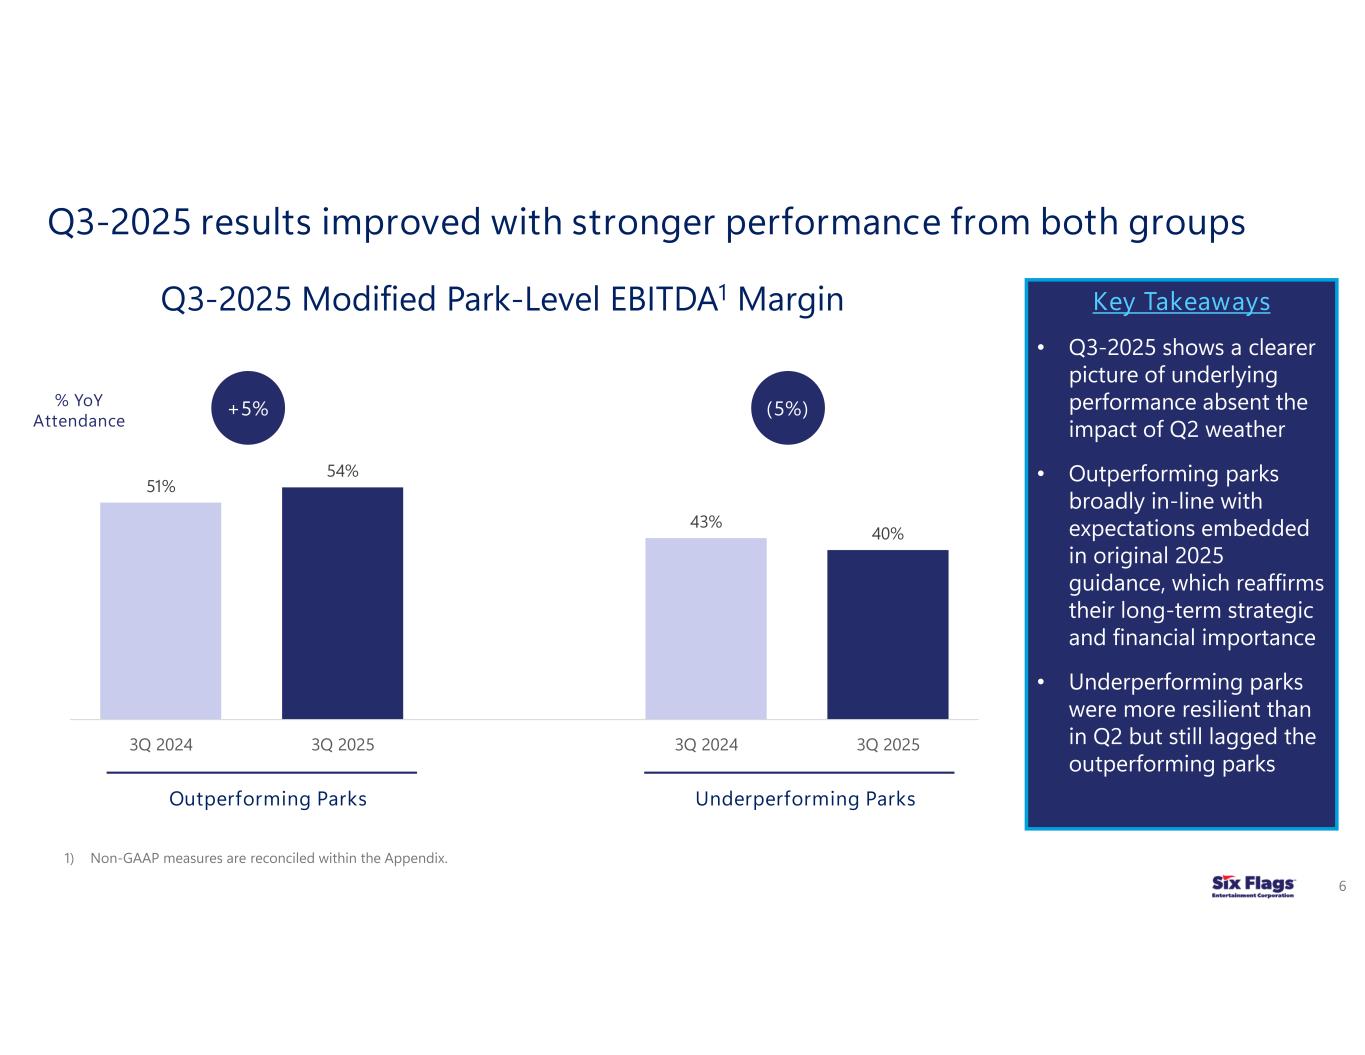
Q3-2025 results improved with stronger performance from both groups Underperforming Parks 6 Q3-2025 Modified Park-Level EBITDA1 Margin Key Takeaways • Q3-2025 shows a clearer picture of underlying performance absent the impact of Q2 weather • Outperforming parks broadly in-line with expectations embedded in original 2025 guidance, which reaffirms their long-term strategic and financial importance • Underperforming parks were more resilient than in Q2 but still lagged the outperforming parks 1) Non-GAAP measures are reconciled within the Appendix. Outperforming Parks % YoY Attendance +5% (5%) 51% 54% 43% 40% 3Q 2024 3Q 2025 3Q 2024 3Q 2025
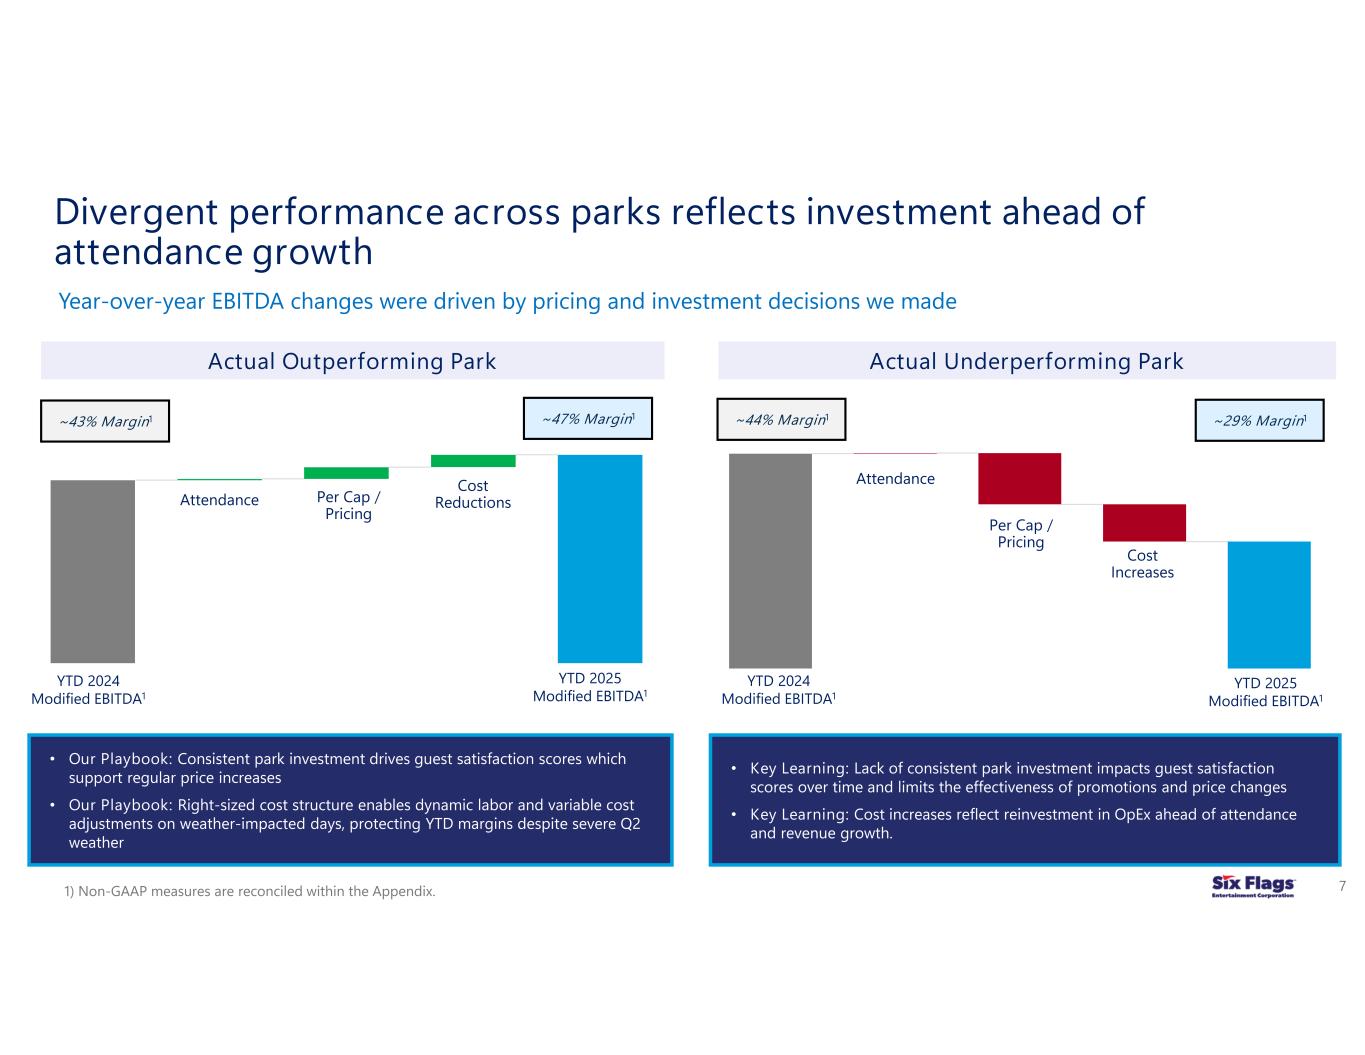
Divergent performance across parks reflects investment ahead of attendance growth Attendance Per Cap / Pricing Cost Reductions YTD 2024 Modified EBITDA1 YTD 2025 Modified EBITDA1 7 Actual Outperforming Park • Our Playbook: Consistent park investment drives guest satisfaction scores which support regular price increases • Our Playbook: Right-sized cost structure enables dynamic labor and variable cost adjustments on weather-impacted days, protecting YTD margins despite severe Q2 weather ~43% Margin1 ~47% Margin1 Attendance Per Cap / Pricing Cost Increases YTD 2024 Modified EBITDA1 YTD 2025 Modified EBITDA1 Actual Underperforming Park • Key Learning: Lack of consistent park investment impacts guest satisfaction scores over time and limits the effectiveness of promotions and price changes • Key Learning: Cost increases reflect reinvestment in OpEx ahead of attendance and revenue growth. ~44% Margin1 ~29% Margin1 Year-over-year EBITDA changes were driven by pricing and investment decisions we made 1) Non-GAAP measures are reconciled within the Appendix.
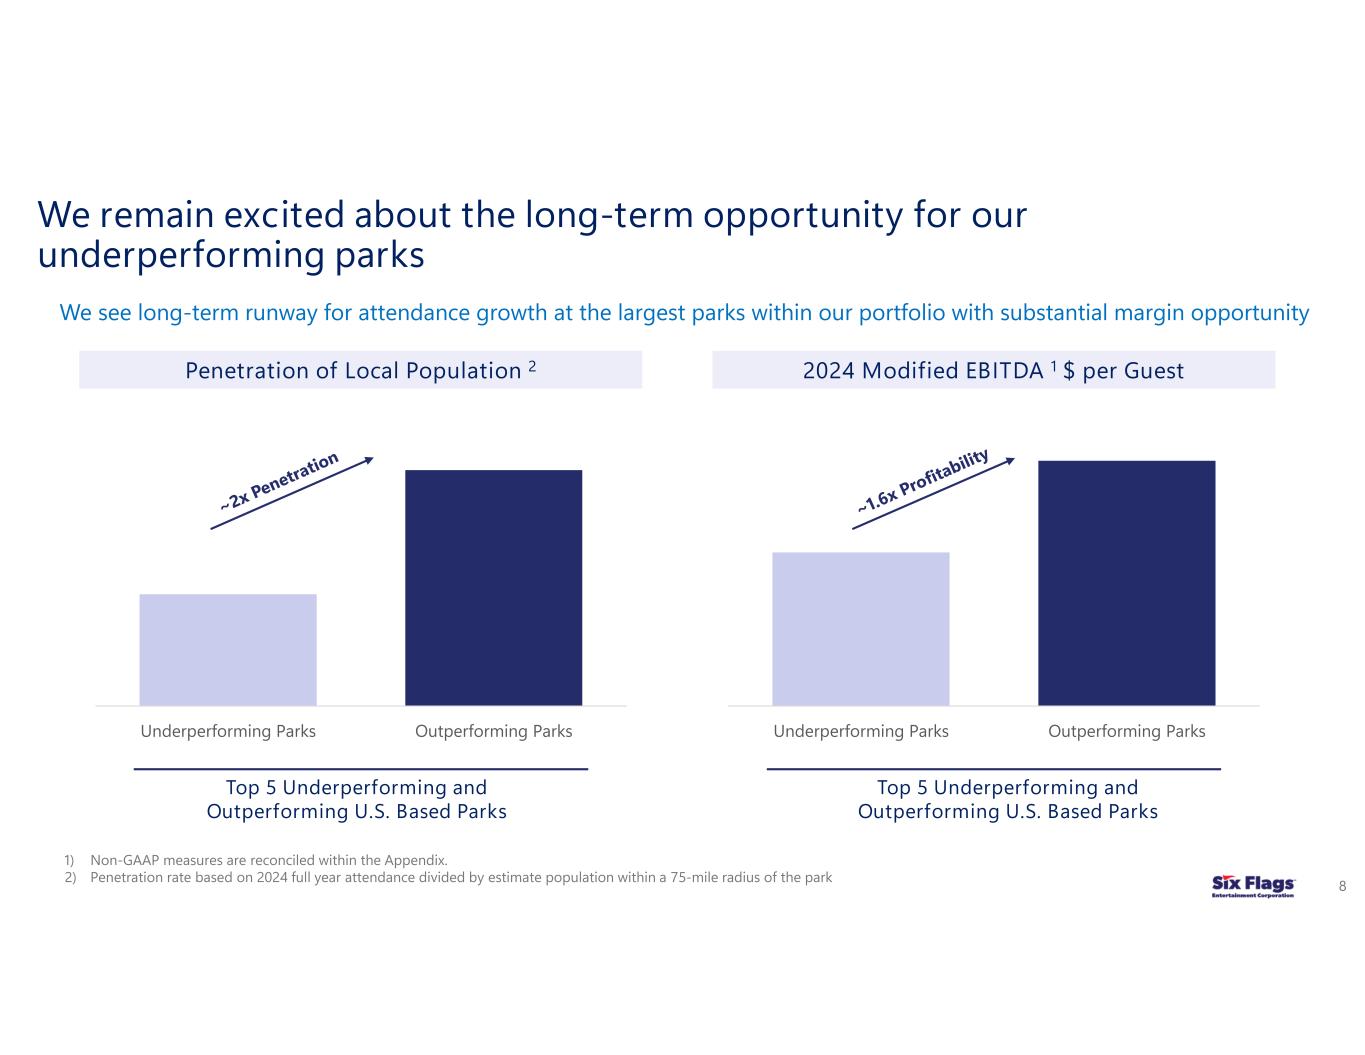
Underperforming Parks Outperforming Parks We remain excited about the long-term opportunity for our underperforming parks 8 Penetration of Local Population 2 We see long-term runway for attendance growth at the largest parks within our portfolio with substantial margin opportunity 2024 Modified EBITDA 1 $ per Guest Underperforming Parks Outperforming Parks Top 5 Underperforming and Outperforming U.S. Based Parks 1) Non-GAAP measures are reconciled within the Appendix. 2) Penetration rate based on 2024 full year attendance divided by estimate population within a 75-mile radius of the park Top 5 Underperforming and Outperforming U.S. Based Parks
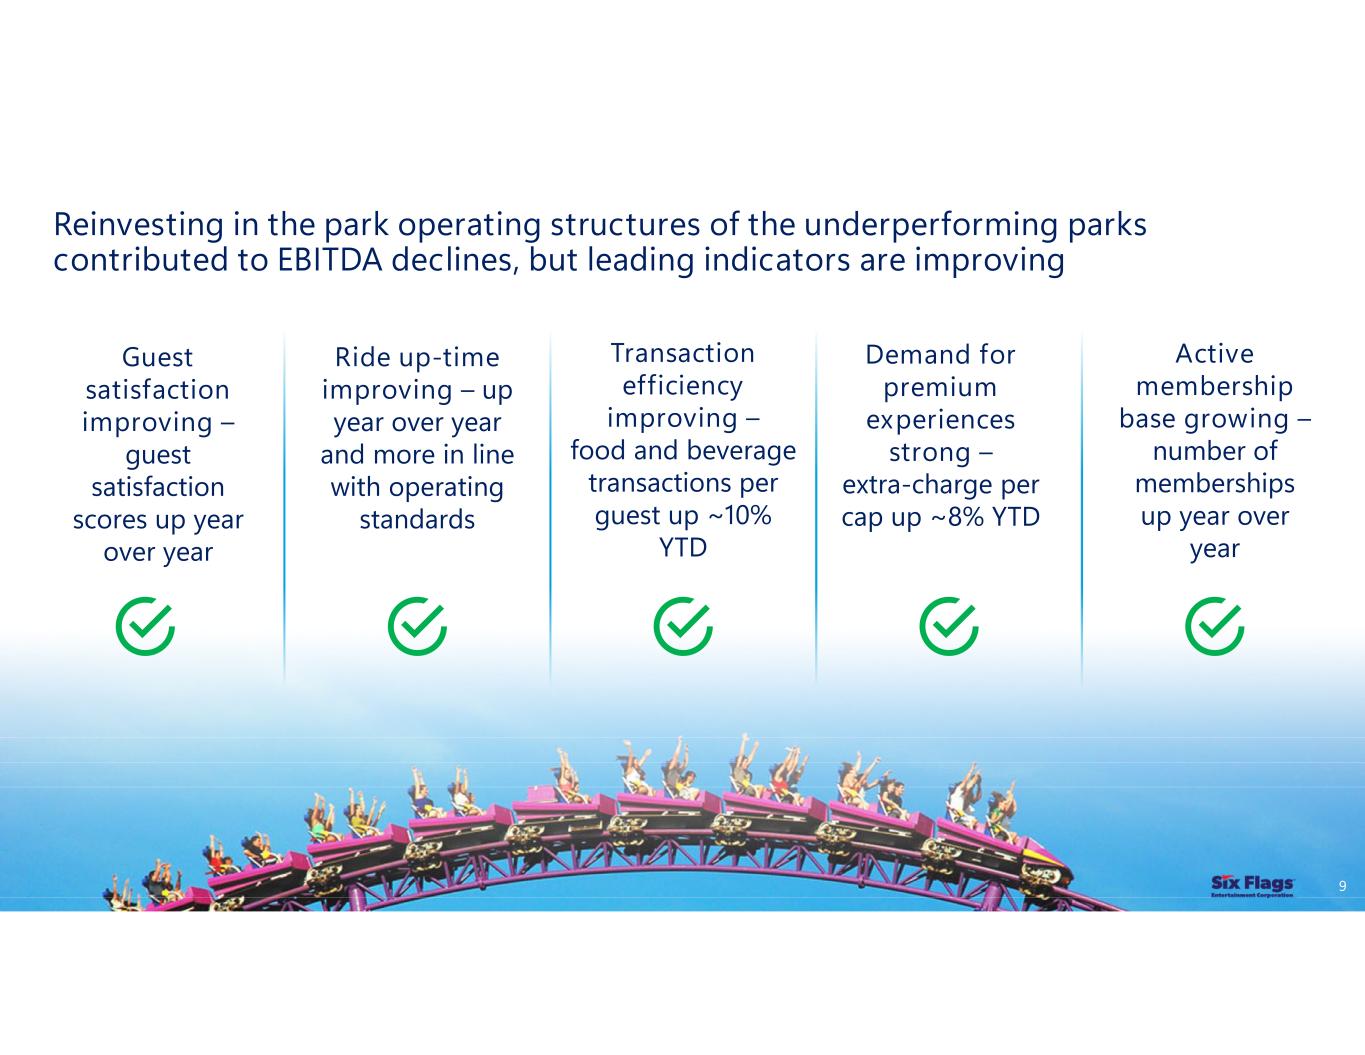
Reinvesting in the park operating structures of the underperforming parks contributed to EBITDA declines, but leading indicators are improving 9 Ride up-time improving – up year over year and more in line with operating standards Guest satisfaction improving – guest satisfaction scores up year over year Transaction efficiency improving – food and beverage transactions per guest up ~10% YTD Active membership base growing – number of memberships up year over year Demand for premium experiences strong – extra-charge per cap up ~8% YTD
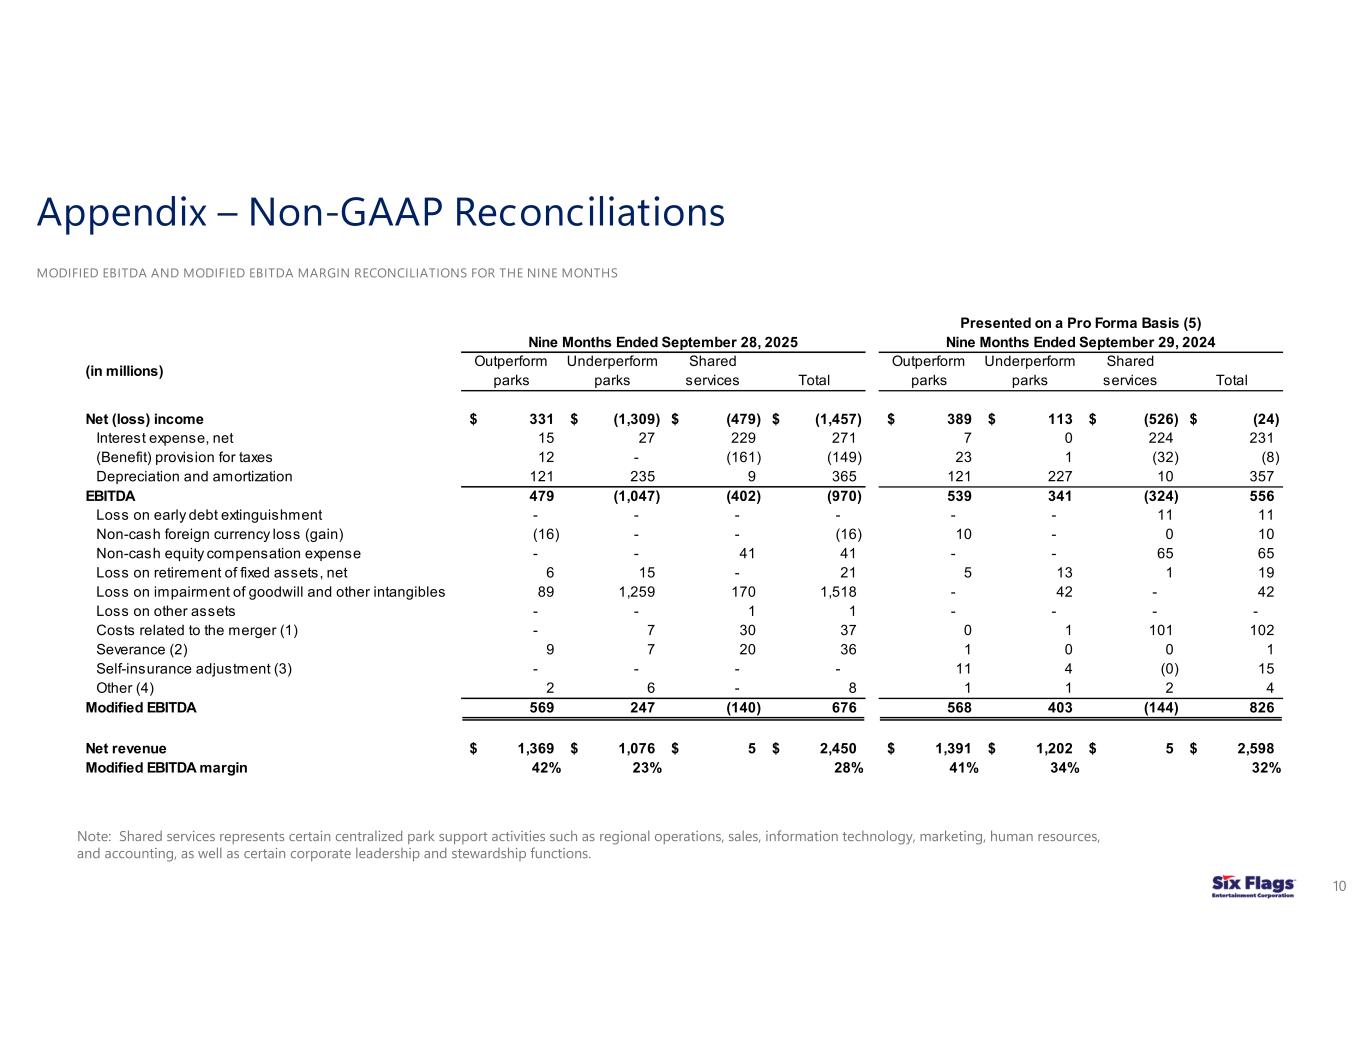
Appendix – Non-GAAP Reconciliations 10 MODIFIED EBITDA AND MODIFIED EBITDA MARGIN RECONCILIATIONS FOR THE NINE MONTHS (in millions) Outperform parks Underperform parks Shared services Total Outperform parks Underperform parks Shared services Total Net (loss) income 331$ (1,309)$ (479)$ (1,457)$ 389$ 113$ (526)$ (24)$ Interest expense, net 15 27 229 271 7 0 224 231 (Benefit) provision for taxes 12 - (161) (149) 23 1 (32) (8) Depreciation and amortization 121 235 9 365 121 227 10 357 EBITDA 479 (1,047) (402) (970) 539 341 (324) 556 Loss on early debt extinguishment - - - - - - 11 11 Non-cash foreign currency loss (gain) (16) - - (16) 10 - 0 10 Non-cash equity compensation expense - - 41 41 - - 65 65 Loss on retirement of fixed assets, net 6 15 - 21 5 13 1 19 Loss on impairment of goodwill and other intangibles 89 1,259 170 1,518 - 42 - 42 Loss on other assets - - 1 1 - - - - Costs related to the merger (1) - 7 30 37 0 1 101 102 Severance (2) 9 7 20 36 1 0 0 1 Self-insurance adjustment (3) - - - - 11 4 (0) 15 Other (4) 2 6 - 8 1 1 2 4 Modified EBITDA 569 247 (140) 676 568 403 (144) 826 Net revenue 1,369$ 1,076$ 5$ 2,450$ 1,391$ 1,202$ 5$ 2,598$ Modified EBITDA margin 42% 23% 28% 41% 34% 32% Nine Months Ended September 28, 2025 Nine Months Ended September 29, 2024 Presented on a Pro Forma Basis (5) Note: Shared services represents certain centralized park support activities such as regional operations, sales, information technology, marketing, human resources, and accounting, as well as certain corporate leadership and stewardship functions.
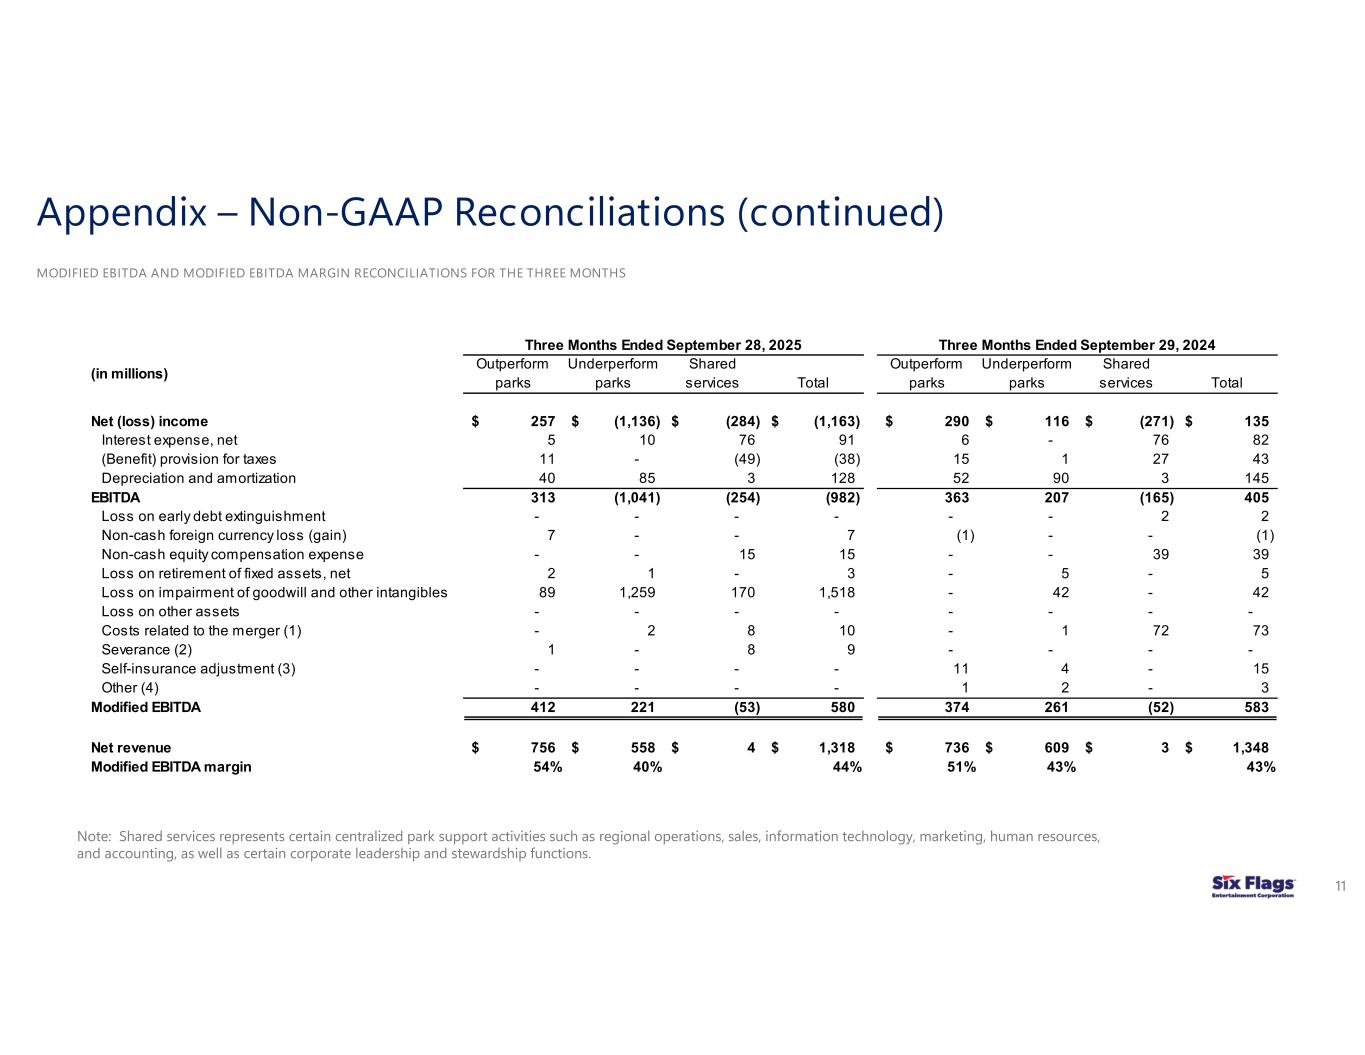
Appendix – Non-GAAP Reconciliations (continued) 11 MODIFIED EBITDA AND MODIFIED EBITDA MARGIN RECONCILIATIONS FOR THE THREE MONTHS (in millions) Outperform parks Underperform parks Shared services Total Outperform parks Underperform parks Shared services Total Net (loss) income 257$ (1,136)$ (284)$ (1,163)$ 290$ 116$ (271)$ 135$ Interest expense, net 5 10 76 91 6 - 76 82 (Benefit) provision for taxes 11 - (49) (38) 15 1 27 43 Depreciation and amortization 40 85 3 128 52 90 3 145 EBITDA 313 (1,041) (254) (982) 363 207 (165) 405 Loss on early debt extinguishment - - - - - - 2 2 Non-cash foreign currency loss (gain) 7 - - 7 (1) - - (1) Non-cash equity compensation expense - - 15 15 - - 39 39 Loss on retirement of fixed assets, net 2 1 - 3 - 5 - 5 Loss on impairment of goodwill and other intangibles 89 1,259 170 1,518 - 42 - 42 Loss on other assets - - - - - - - - Costs related to the merger (1) - 2 8 10 - 1 72 73 Severance (2) 1 - 8 9 - - - - Self-insurance adjustment (3) - - - - 11 4 - 15 Other (4) - - - - 1 2 - 3 Modified EBITDA 412 221 (53) 580 374 261 (52) 583 Net revenue 756$ 558$ 4$ 1,318$ 736$ 609$ 3$ 1,348$ Modified EBITDA margin 54% 40% 44% 51% 43% 43% Three Months Ended September 28, 2025 Three Months Ended September 29, 2024 Note: Shared services represents certain centralized park support activities such as regional operations, sales, information technology, marketing, human resources, and accounting, as well as certain corporate leadership and stewardship functions.
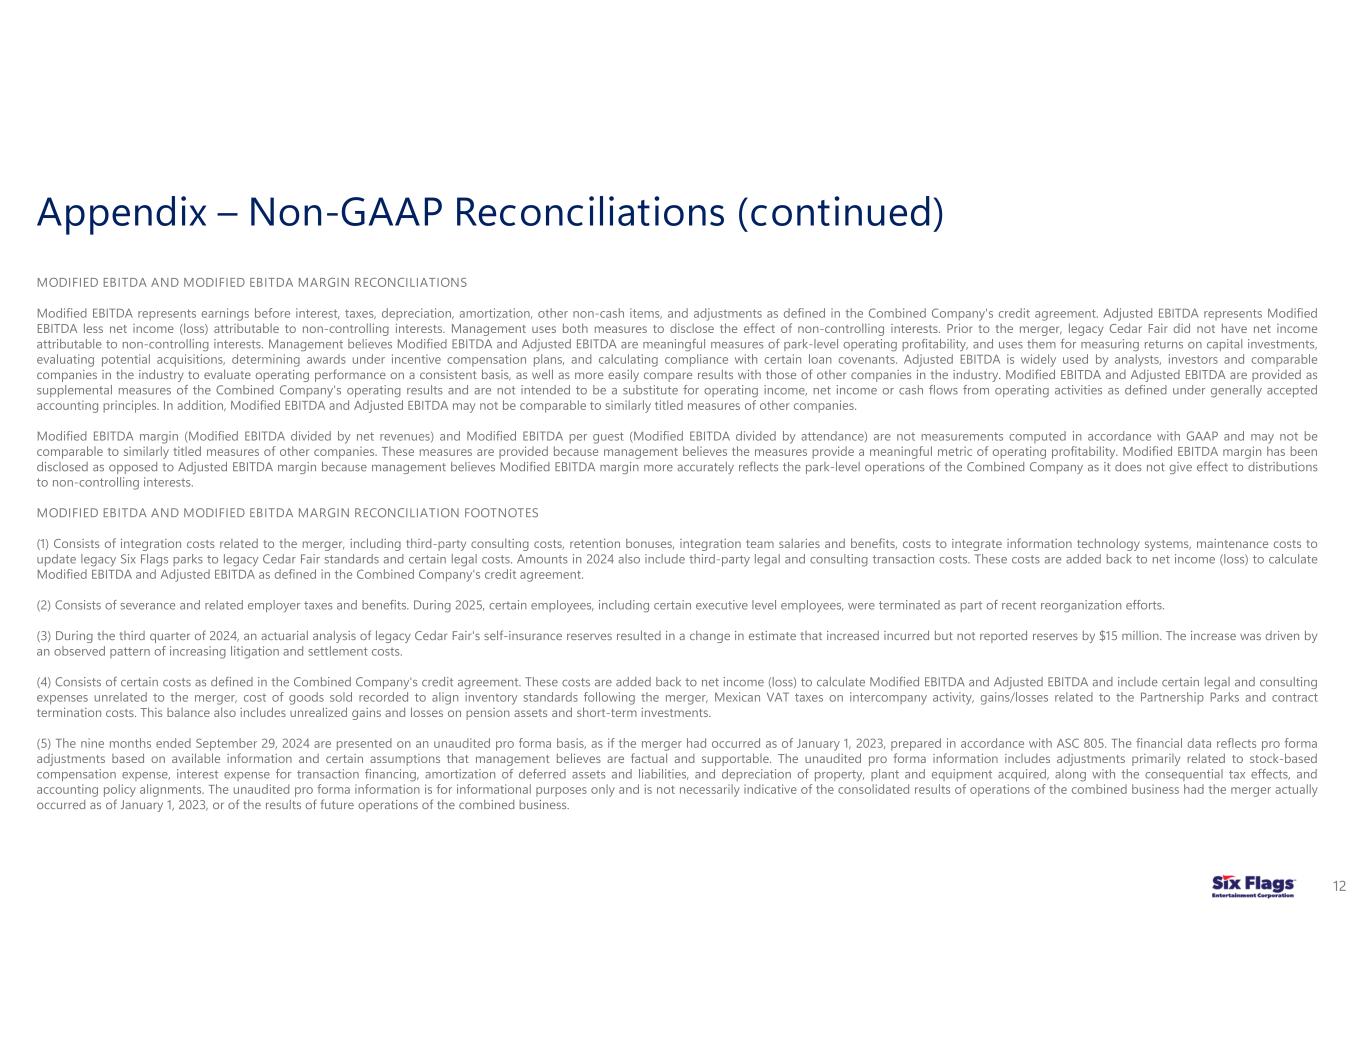
Appendix – Non-GAAP Reconciliations (continued) 12 MODIFIED EBITDA AND MODIFIED EBITDA MARGIN RECONCILIATIONS Modified EBITDA represents earnings before interest, taxes, depreciation, amortization, other non-cash items, and adjustments as defined in the Combined Company's credit agreement. Adjusted EBITDA represents Modified EBITDA less net income (loss) attributable to non-controlling interests. Management uses both measures to disclose the effect of non-controlling interests. Prior to the merger, legacy Cedar Fair did not have net income attributable to non-controlling interests. Management believes Modified EBITDA and Adjusted EBITDA are meaningful measures of park-level operating profitability, and uses them for measuring returns on capital investments, evaluating potential acquisitions, determining awards under incentive compensation plans, and calculating compliance with certain loan covenants. Adjusted EBITDA is widely used by analysts, investors and comparable companies in the industry to evaluate operating performance on a consistent basis, as well as more easily compare results with those of other companies in the industry. Modified EBITDA and Adjusted EBITDA are provided as supplemental measures of the Combined Company's operating results and are not intended to be a substitute for operating income, net income or cash flows from operating activities as defined under generally accepted accounting principles. In addition, Modified EBITDA and Adjusted EBITDA may not be comparable to similarly titled measures of other companies. Modified EBITDA margin (Modified EBITDA divided by net revenues) and Modified EBITDA per guest (Modified EBITDA divided by attendance) are not measurements computed in accordance with GAAP and may not be comparable to similarly titled measures of other companies. These measures are provided because management believes the measures provide a meaningful metric of operating profitability. Modified EBITDA margin has been disclosed as opposed to Adjusted EBITDA margin because management believes Modified EBITDA margin more accurately reflects the park-level operations of the Combined Company as it does not give effect to distributions to non-controlling interests. MODIFIED EBITDA AND MODIFIED EBITDA MARGIN RECONCILIATION FOOTNOTES (1) Consists of integration costs related to the merger, including third-party consulting costs, retention bonuses, integration team salaries and benefits, costs to integrate information technology systems, maintenance costs to update legacy Six Flags parks to legacy Cedar Fair standards and certain legal costs. Amounts in 2024 also include third-party legal and consulting transaction costs. These costs are added back to net income (loss) to calculate Modified EBITDA and Adjusted EBITDA as defined in the Combined Company's credit agreement. (2) Consists of severance and related employer taxes and benefits. During 2025, certain employees, including certain executive level employees, were terminated as part of recent reorganization efforts. (3) During the third quarter of 2024, an actuarial analysis of legacy Cedar Fair's self-insurance reserves resulted in a change in estimate that increased incurred but not reported reserves by $15 million. The increase was driven by an observed pattern of increasing litigation and settlement costs. (4) Consists of certain costs as defined in the Combined Company's credit agreement. These costs are added back to net income (loss) to calculate Modified EBITDA and Adjusted EBITDA and include certain legal and consulting expenses unrelated to the merger, cost of goods sold recorded to align inventory standards following the merger, Mexican VAT taxes on intercompany activity, gains/losses related to the Partnership Parks and contract termination costs. This balance also includes unrealized gains and losses on pension assets and short-term investments. (5) The nine months ended September 29, 2024 are presented on an unaudited pro forma basis, as if the merger had occurred as of January 1, 2023, prepared in accordance with ASC 805. The financial data reflects pro forma adjustments based on available information and certain assumptions that management believes are factual and supportable. The unaudited pro forma information includes adjustments primarily related to stock-based compensation expense, interest expense for transaction financing, amortization of deferred assets and liabilities, and depreciation of property, plant and equipment acquired, along with the consequential tax effects, and accounting policy alignments. The unaudited pro forma information is for informational purposes only and is not necessarily indicative of the consolidated results of operations of the combined business had the merger actually occurred as of January 1, 2023, or of the results of future operations of the combined business.
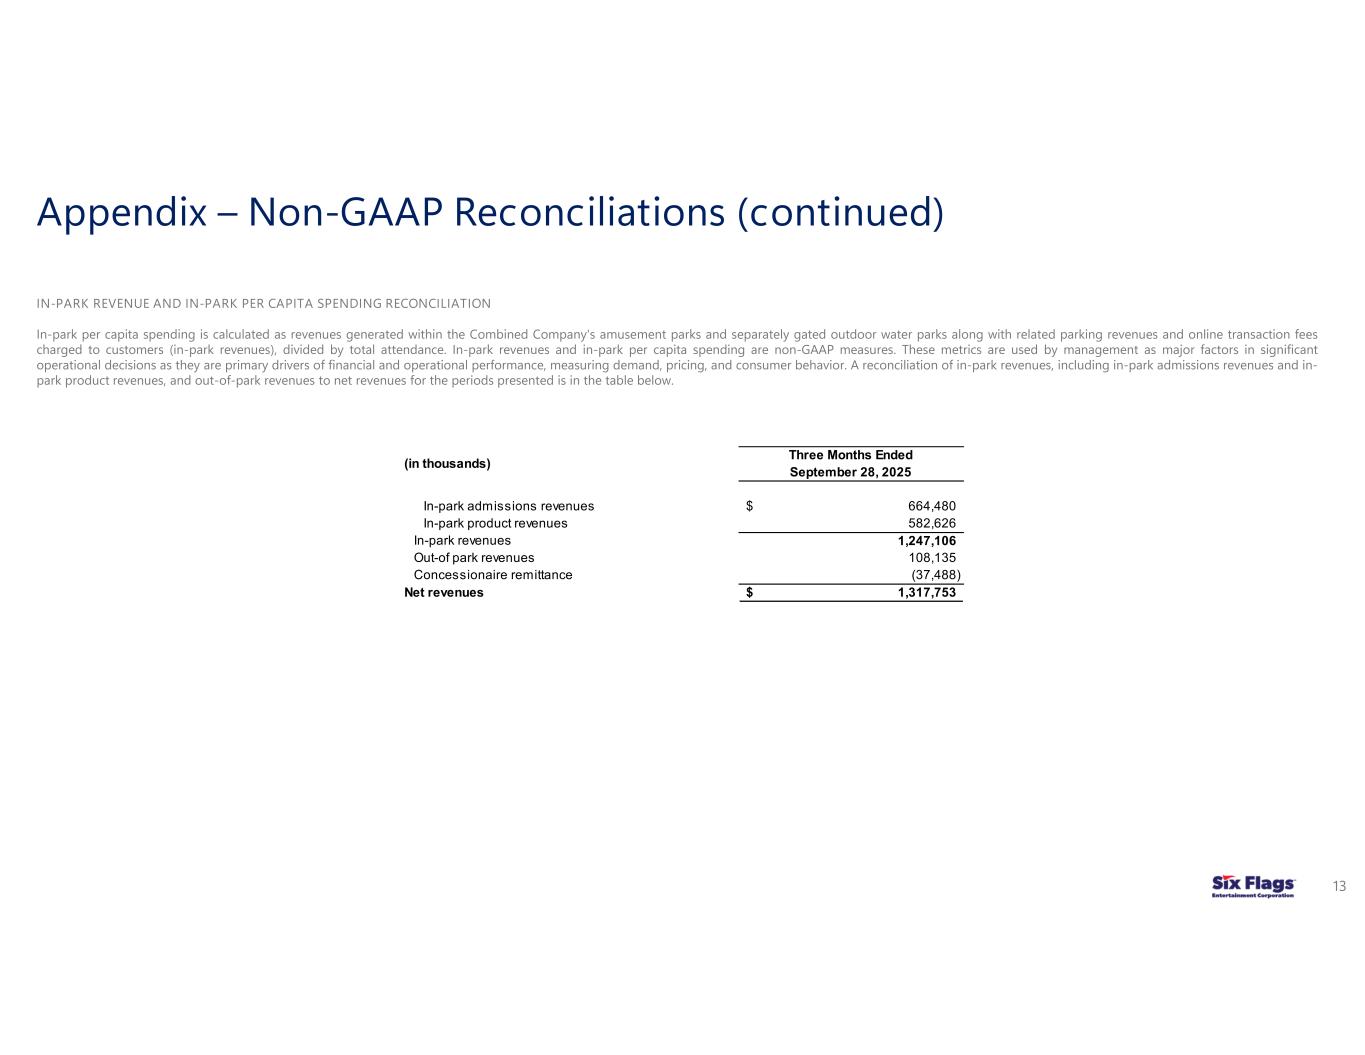
Appendix – Non-GAAP Reconciliations (continued) 13 IN-PARK REVENUE AND IN-PARK PER CAPITA SPENDING RECONCILIATION In-park per capita spending is calculated as revenues generated within the Combined Company's amusement parks and separately gated outdoor water parks along with related parking revenues and online transaction fees charged to customers (in-park revenues), divided by total attendance. In-park revenues and in-park per capita spending are non-GAAP measures. These metrics are used by management as major factors in significant operational decisions as they are primary drivers of financial and operational performance, measuring demand, pricing, and consumer behavior. A reconciliation of in-park revenues, including in-park admissions revenues and in- park product revenues, and out-of-park revenues to net revenues for the periods presented is in the table below. (in thousands) Three Months Ended September 28, 2025 In-park admissions revenues 664,480$ In-park product revenues 582,626 In-park revenues 1,247,106 Out-of park revenues 108,135 Concessionaire remittance (37,488) Net revenues 1,317,753$