| Paper | Packaging | Solutions 2025 Fourth Quarter and Full-Year Results February 11, 2026 |

| Paper | Packaging | Solutions Smurfit Westrock Q4 | 2025 Results | 2 Forward Looking Statements The presentation includes certain “forward-looking statements” (including within the meaning of Section 27A of the Securities Act of 1933, as amended, and Section 21E of the Securities Exchange Act of 1934, as amended) regarding, among other things, the plans, strategies, outcomes, outlooks, and prospects, both business and financial, of Smurfit Westrock, the expected benefits of the completed combination of Smurfit Kappa Group plc and WestRock Company (the “Combination”), including, but not limited to, synergies, as well as our scale, geographic reach and product portfolio, our medium-term plan, demand outlook, operating environment and the impact of announced closures and additional economic downtime and any other statements regarding the Company's future expectations, beliefs, plans, objectives, results of operations, financial condition and cash flows, or future events, outlook or performance. Statements that are not historical facts, including statements about the beliefs and expectations of the management of the Company, are forward-looking statements. Words such as “may”, “will”, “could”, “should”, “would”, “anticipate”, “intend”, “estimate”, “project”, “plan”, “believe”, “expect”, “target”, “prospects”, “potential”, “commit”, “forecasts”, “aims”, “considered”, “likely” and variations of these words and similar future or conditional expressions are intended to identify forward-looking statements but are not the exclusive means of identifying such statements. While the Company believes these expectations, assumptions, estimates and projections are reasonable, such forward-looking statements are only predictions and involve known and unknown risks and uncertainties, many of which are beyond the control of the Company. By their nature, forward-looking statements involve risk and uncertainty because they relate to events and depend upon future circumstances that may or may not occur. Actual results may differ materially from the current expectations of the Company depending upon a number of factors affecting its business, including risks associated with the integration and performance of the Company following the Combination. Important factors that could cause actual results to differ materially from plans, estimates or expectations include: our ability to deliver on our medium-term plan; changes in demand environment; our ability to deliver on our closure plan and associated efforts; our future cash payments associated with these initiatives; potential future cost savings associated with such initiatives; the amount of charges and the timing of such charges or actions described herein; potential future impairment charges; accuracy of assumptions associated with the charges; economic, competitive and market conditions generally, including macroeconomic uncertainty, customer inventory rebalancing, the impact of inflation and increases in energy, raw materials, shipping, labor and capital equipment costs; geo-economic fragmentation and protectionism such as tariffs, trade wars or similar governmental actions affecting the flows of goods, services or currency (including the implementation of tariffs by the US federal government and reciprocal tariffs and other protectionist or retaliatory measures governments in Europe, Asia, and other countries have taken or may take in response); the impact of prolonged or recurring U.S. federal government shutdowns and any resulting volatility in the capital markets or interruptions in the Company’s access to capital; the impact of public health crises, such as pandemics and epidemics and any related company or governmental policies and actions to protect the health and safety of individuals or governmental policies or actions to maintain the functioning of national or global economies and markets; reduced supply of raw materials, energy and transportation, including from supply chain disruptions and labor shortages; developments related to pricing cycles and volumes; intense competition; the ability of the Company to successfully recover from a disaster or other business continuity problem due to a hurricane, flood, earthquake, terrorist attack, war, pandemic, security breach, cyber-attack, power loss, telecommunications failure or other natural or man-made events, including the ability to function remotely during long-term disruptions; the Company's ability to respond to changing customer preferences and to protect intellectual property; the amount and timing of the Company's capital expenditures; risks related to international sales and operations; failures in the Company's quality control measures and systems resulting in faulty or contaminated products; cybersecurity risks, including threats to the confidentiality, integrity and availability of data in the Company's systems; works stoppages and other labor disputes; the Company’s ability to establish and maintain effective internal controls over financial reporting in accordance with the Sarbanes Oxley Act of 2002, as amended, and remediate any weaknesses in controls and processes; the Company's ability to retain or hire key personnel; risks related to sustainability matters, including climate change and scarce resources, as well as the Company's ability to comply with changing environmental laws and regulations; the Company's ability to successfully implement strategic transformation initiatives; results and impacts of acquisitions by the Company; the Company's significant levels of indebtedness; the impact of the Combination on the Company's credit ratings; the potential impairment of assets and goodwill; the availability of sufficient cash to distribute dividends to the Company's shareholders in line with current expectations; the scope, costs, timing and impact of any restructuring of operations and corporate and tax structure; evolving legal, regulatory and tax regimes; changes in economic, financial, political and regulatory conditions in Ireland, the United Kingdom, the United States and elsewhere, and other factors that contribute to uncertainty and volatility, natural and man-made disasters, civil unrest, geopolitical uncertainty, and conditions that may result from legislative, regulatory, trade and policy changes associated with the current or subsequent Irish, US or UK administrations; legal proceedings instituted against the Company; actions by third parties, including government agencies; the Company's ability to promptly and effectively integrate Smurfit Kappa's and WestRock's businesses; the Company's ability to achieve the synergies and value creation contemplated by the Combination; the Company's ability to meet expectations regarding the accounting and tax treatments of the Combination, including the risk that the Internal Revenue Service may assert that the Company should be treated as a US corporation or be subject to certain unfavorable US federal income tax rules under Section 7874 of the Internal Revenue Code of 1986, as amended, as a result of the Combination; other factors such as future market conditions, currency fluctuations, the behavior of other market participants, the actions of regulators and other factors such as changes in the political, social and regulatory framework in which the Company's group operates or in economic or technological trends or conditions, and other risk factors included in the Company's filings with the Securities and Exchange Commission, including the Company’s Annual Reports on Form 10-K for the fiscal years ended December 31, 2024 and 2025. Neither the Company nor any of its associates or directors, officers or advisers provides any representation, assurance or guarantee that the occurrence of the events expressed or implied in any such forward-looking statements will actually occur. You are cautioned not to place undue reliance on these forward-looking statements. Other than in accordance with its legal or regulatory obligations (including under the UK Listing Rules, the Disclosure Guidance and Transparency Rules, the UK Market Abuse Regulation and other applicable regulations), the Company is under no obligation, and the Company expressly disclaims any intention or obligation, to update or revise publicly any forward-looking statements, whether as a result of new information, future events or otherwise. |
| Paper | Packaging | Solutions Smurfit Westrock Q4 | 2025 Results | 3 Non-GAAP Financial Measures and Reconciliations Smurfit Westrock reports its financial results in accordance with accounting principles generally accepted in the United States ("GAAP"). However, management believes certain non-GAAP financial measures provide Smurfit Westrock’s Board of directors, investors, potential investors, securities analysts and others with additional meaningful financial information that should be considered when assessing its ongoing performance. Smurfit Westrock management also uses these non-GAAP financial measures in making financial, operating and planning decisions, and in evaluating company performance. Non-GAAP financial measures are not intended to be considered in isolation of or as a substitute for, or superior to, financial information prepared and presented in accordance with GAAP and should be viewed in addition to, and not as an alternative for, the GAAP results. The non-GAAP financial measures we present may differ from similarly captioned measures presented by other companies. Smurfit Westrock uses the non-GAAP financial measures “Adjusted EBITDA”, “Adjusted EBITDA Margin” and “Adjusted Free Cash Flow”. We discuss below details of the non-GAAP financial measures presented by us and provide reconciliations of these non-GAAP financial measures to the most directly comparable financial measures calculated in accordance with GAAP in the Appendix to this presentation. Definitions Smurfit Westrock uses the non-GAAP financial measures “Adjusted EBITDA” and “Adjusted EBITDA Margin” to evaluate its overall performance. The composition of Adjusted EBITDA is not addressed or prescribed by GAAP. Smurfit Westrock defines Adjusted EBITDA as net income before income tax expense, depreciation, depletion and amortization, interest expense, net, pension and other postretirement non-service income (expense), net, share based compensation expense, other expense, net, impairment and restructuring costs, transaction and integration-related expenses associated with the Combination, amortization of fair value step up on inventory and other specific items that management believes are not indicative of the ongoing operating results of the business. Management believes Adjusted EBITDA and Adjusted EBITDA Margin measures provide Smurfit Westrock’s management, Board of directors, investors, potential investors, securities analysts and others with useful information to evaluate Smurfit Westrock’s performance relative to other periods because it adjusts out non recurring items that management believes are not indicative of the ongoing results of the business. Adjusted EBITDA Margin is calculated as Adjusted EBITDA divided by Net Sales. Smurfit Westrock uses the non-GAAP financial measure “Adjusted Free Cash Flow”. Smurfit Westrock defines Adjusted Free Cash Flow as net cash provided by operating activities as adjusted for capital expenditures and to exclude certain costs not reflective of underlying ongoing operations. Management utilizes this measure in connection with managing Smurfit Westrock’s business and believes that Adjusted Free Cash Flow is useful to investors as a liquidity measure because it measures the amount of cash generated that is available, after reinvesting in the business, to maintain a strong balance sheet, pay dividends, repurchase stock, service debt and make investments for future growth. It should not be inferred that the entire free cash flow amount is available for discretionary expenditures. By adjusting for certain items that are not indicative of Smurfit Westrock’s underlying operational performance, Smurfit Westrock believes that Adjusted Free Cash Flow also enables investors to perform meaningful comparisons between past and present periods. |
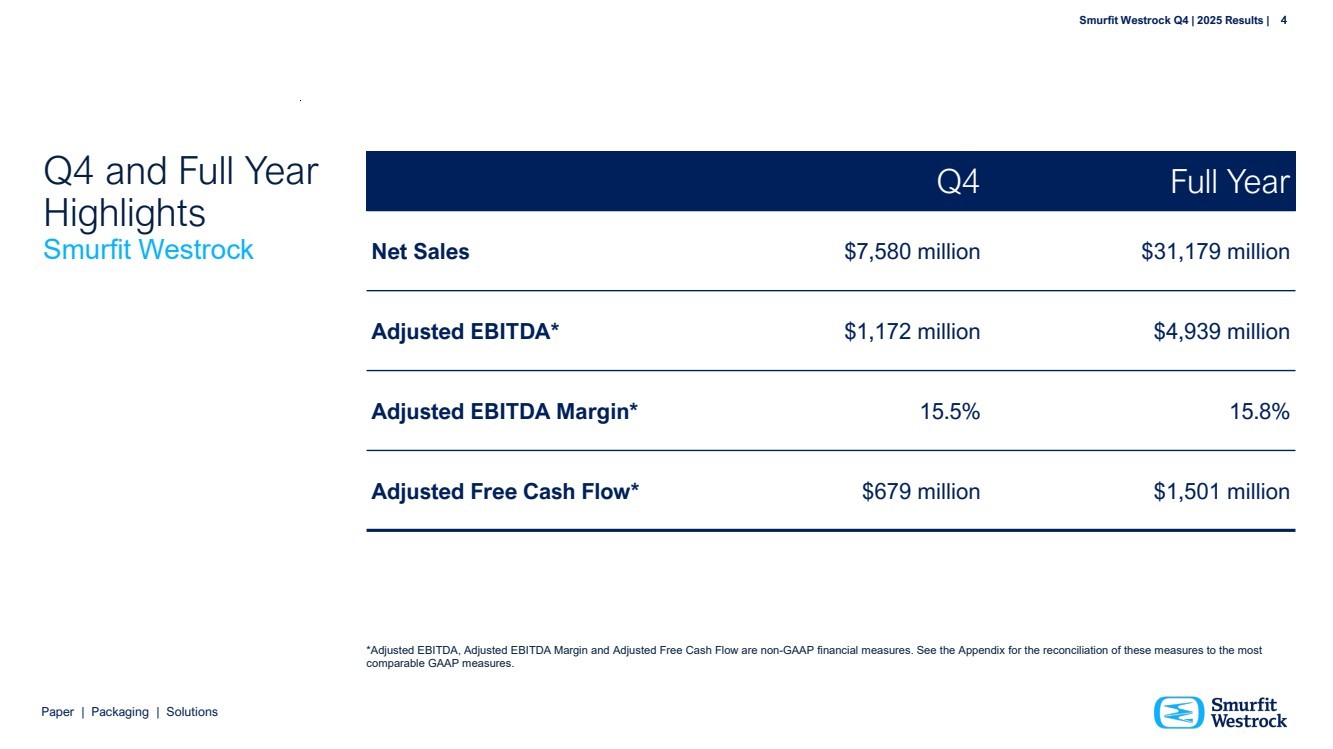
| Paper | Packaging | Solutions Smurfit Westrock Q4 | 2025 Results | 4 Q4 and Full Year Highlights Smurfit Westrock Q4 Full Year Net Sales $7,580 million $31,179 million Adjusted EBITDA* $1,172 million $4,939 million Adjusted EBITDA Margin* 15.5% 15.8% Adjusted Free Cash Flow* $679 million $1,501 million 4 *Adjusted EBITDA, Adjusted EBITDA Margin and Adjusted Free Cash Flow are non-GAAP financial measures. See the Appendix for the reconciliation of these measures to the most comparable GAAP measures. |
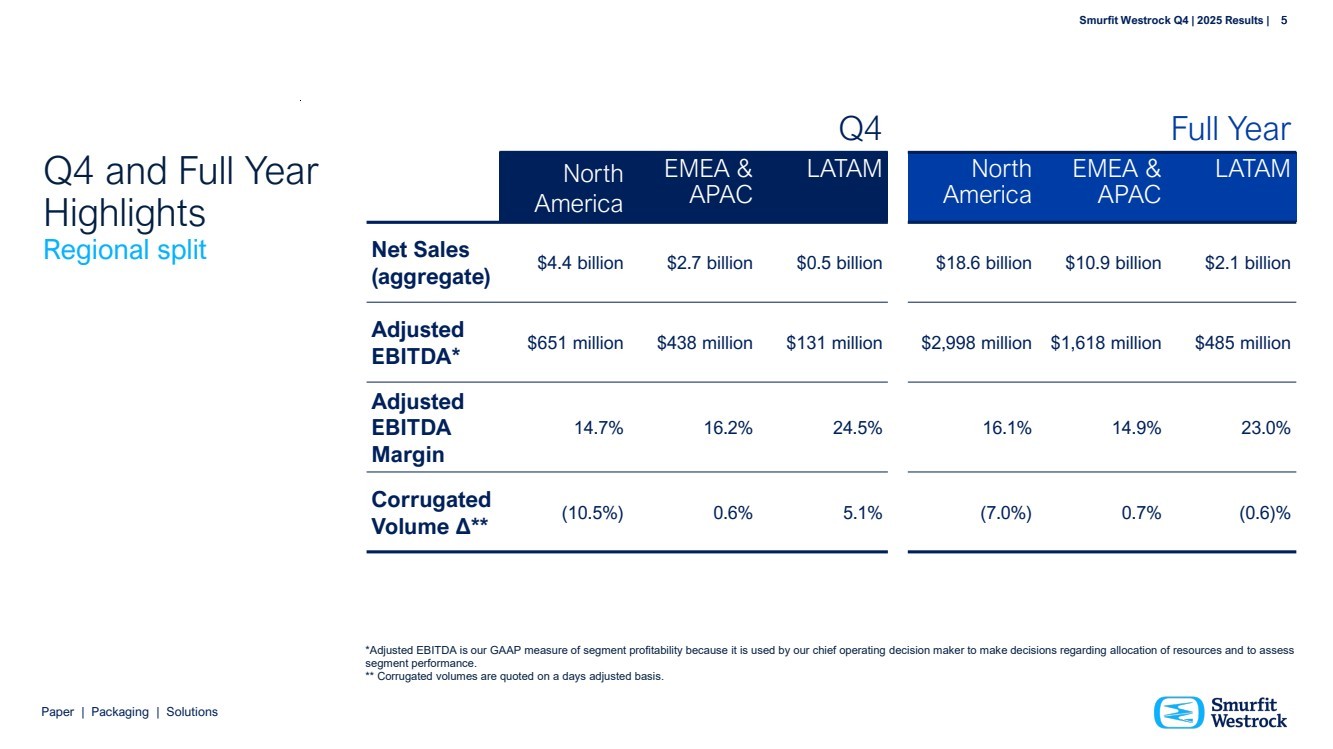
| Paper | Packaging | Solutions Smurfit Westrock Q4 | 2025 Results | 5 Q4 and Full Year Highlights Regional split Q4 Full Year North America EMEA & APAC LATAM North America EMEA & APAC LATAM Net Sales (aggregate) $4.4 billion $2.7 billion $0.5 billion $18.6 billion $10.9 billion $2.1 billion Adjusted EBITDA* $651 million $438 million $131 million $2,998 million $1,618 million $485 million Adjusted EBITDA Margin 14.7% 16.2% 24.5% 16.1% 14.9% 23.0% Corrugated Volume Δ** (10.5%) 0.6% 5.1% (7.0%) 0.7% (0.6)% *Adjusted EBITDA is our GAAP measure of segment profitability because it is used by our chief operating decision maker to make decisions regarding allocation of resources and to assess segment performance. ** Corrugated volumes are quoted on a days adjusted basis. 5 |
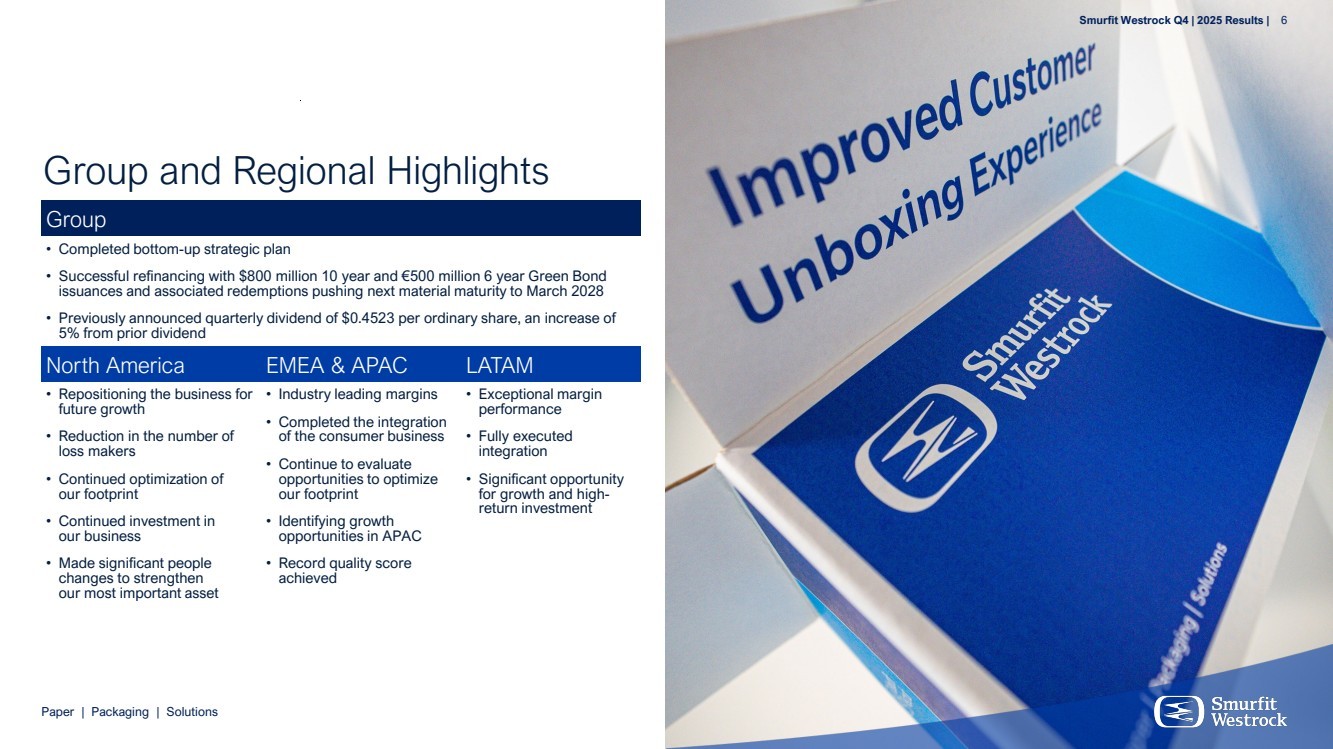
| Paper | Packaging | Solutions Smurfit Westrock Q4 | 2025 Results | 6 Group and Regional Highlights Group • Completed bottom-up strategic plan • Successful refinancing with $800 million 10 year and €500 million 6 year Green Bond issuances and associated redemptions pushing next material maturity to March 2028 • Previously announced quarterly dividend of $0.4523 per ordinary share, an increase of 5% from prior dividend North America EMEA & APAC LATAM • Repositioning the business for future growth • Reduction in the number of loss makers • Continued optimization of our footprint • Continued investment in our business • Made significant people changes to strengthen our most important asset • Industry leading margins • Completed the integration of the consumer business • Continue to evaluate opportunities to optimize our footprint • Identifying growth opportunities in APAC • Record quality score achieved • Exceptional margin performance • Fully executed integration • Significant opportunity for growth and high-return investment Smurfit Westrock Q4 | 2025 Results | 6 |
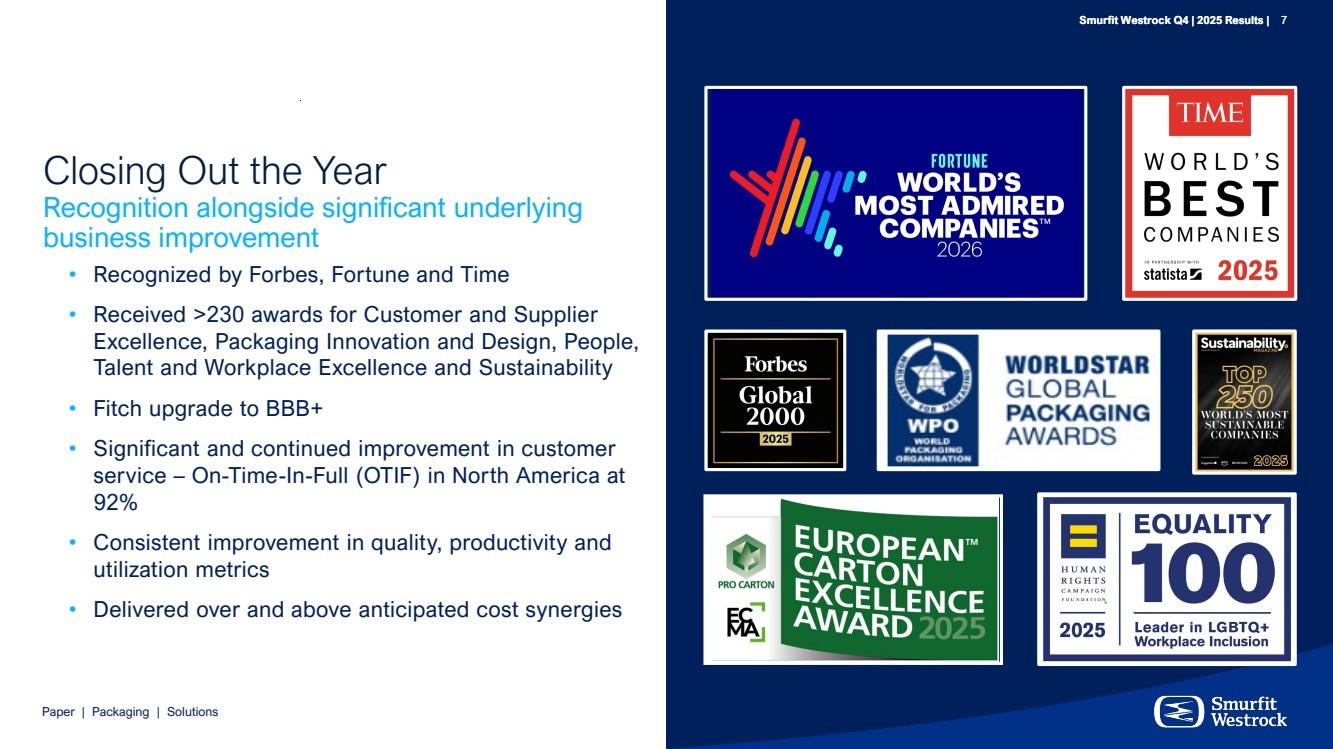
| Smurfit Westrock Q4 | 2025 Results | 7 Paper | Packaging | Solutions • Recognized by Forbes, Fortune and Time • Received >230 awards for Customer and Supplier Excellence, Packaging Innovation and Design, People, Talent and Workplace Excellence and Sustainability • Fitch upgrade to BBB+ • Significant and continued improvement in customer service – On-Time-In-Full (OTIF) in North America at 92% • Consistent improvement in quality, productivity and utilization metrics • Delivered over and above anticipated cost synergies Smurfit Westrock Q4 | 2025 Results | 7 Closing Out the Year Recognition alongside significant underlying business improvement |
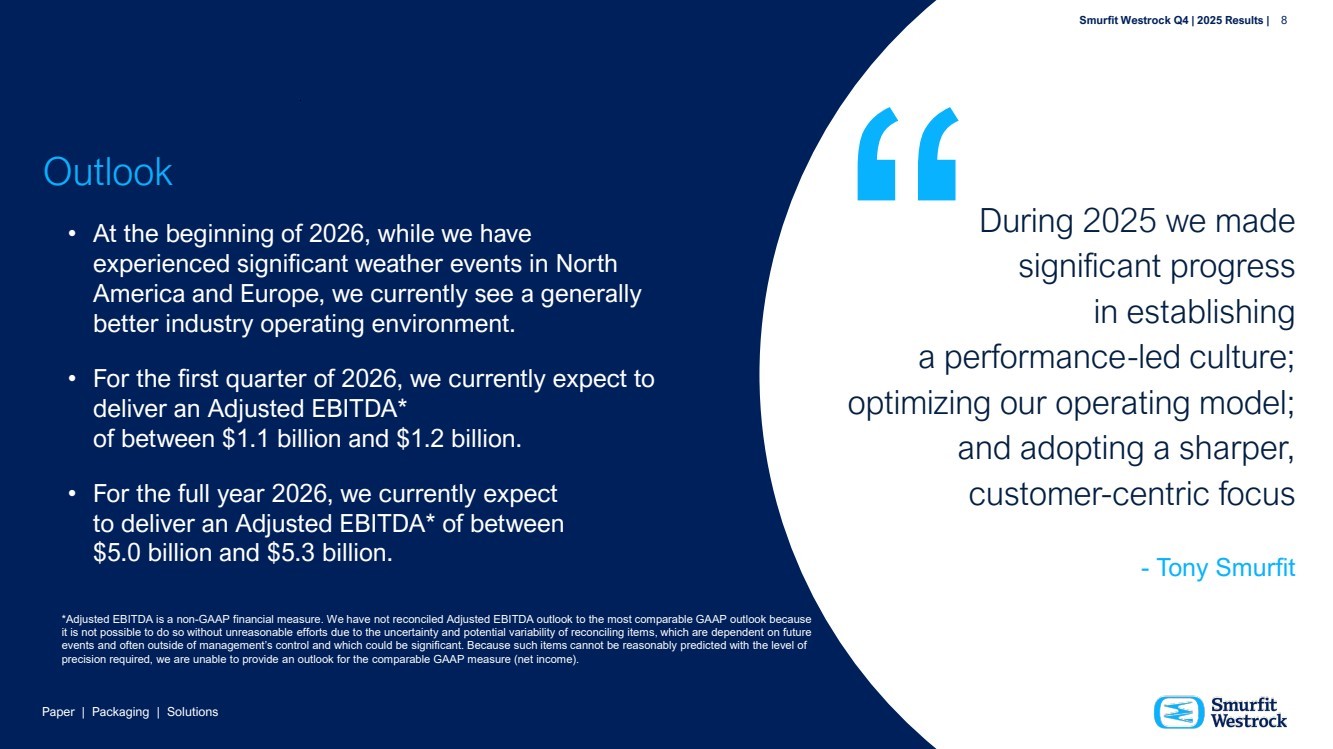
| Paper | Packaging | Solutions Smurfit Westrock Q4 | 2025 Results | 8 Outlook • At the beginning of 2026, while we have experienced significant weather events in North America and Europe, we currently see a generally better industry operating environment. • For the first quarter of 2026, we currently expect to deliver an Adjusted EBITDA* of between $1.1 billion and $1.2 billion. • For the full year 2026, we currently expect to deliver an Adjusted EBITDA* of between $5.0 billion and $5.3 billion. Smurfit Westrock Q4 | 2025 Results | 8 During 2025 we made significant progress in establishing a performance-led culture; optimizing our operating model; and adopting a sharper, customer-centric focus - Tony Smurfit *Adjusted EBITDA is a non-GAAP financial measure. We have not reconciled Adjusted EBITDA outlook to the most comparable GAAP outlook because it is not possible to do so without unreasonable efforts due to the uncertainty and potential variability of reconciling items, which are dependent on future events and often outside of management’s control and which could be significant. Because such items cannot be reasonably predicted with the level of precision required, we are unable to provide an outlook for the comparable GAAP measure (net income). |
| Paper | Packaging | Solutions Smurfit Westrock Q4 | 2025 Results | 9 Appendices |
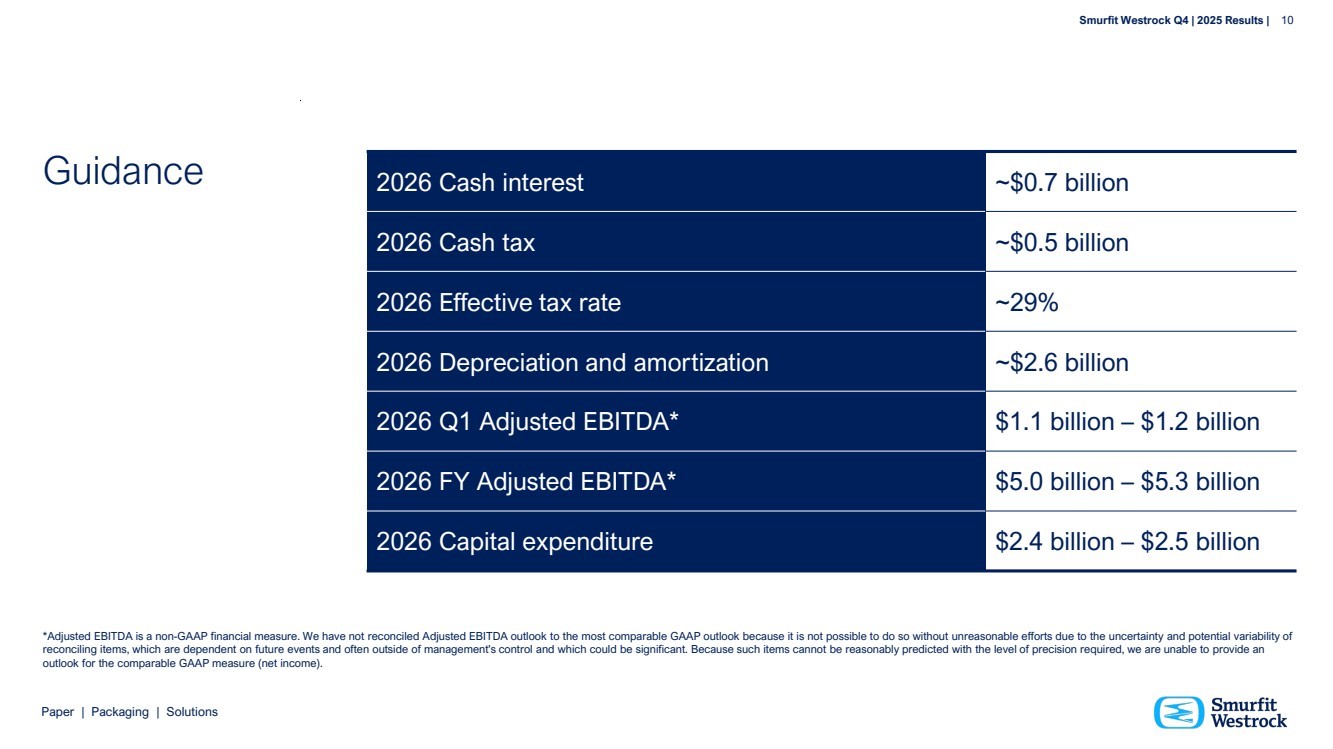
| Paper | Packaging | Solutions Smurfit Westrock Q4 | 2025 Results | 10 2026 Cash interest ~$0.7 billion 2026 Cash tax ~$0.5 billion 2026 Effective tax rate ~29% 2026 Depreciation and amortization ~$2.6 billion 2026 Q1 Adjusted EBITDA* $1.1 billion – $1.2 billion 2026 FY Adjusted EBITDA* $5.0 billion – $5.3 billion 2026 Capital expenditure $2.4 billion – $2.5 billion Guidance *Adjusted EBITDA is a non-GAAP financial measure. We have not reconciled Adjusted EBITDA outlook to the most comparable GAAP outlook because it is not possible to do so without unreasonable efforts due to the uncertainty and potential variability of reconciling items, which are dependent on future events and often outside of management's control and which could be significant. Because such items cannot be reasonably predicted with the level of precision required, we are unable to provide an outlook for the comparable GAAP measure (net income). |
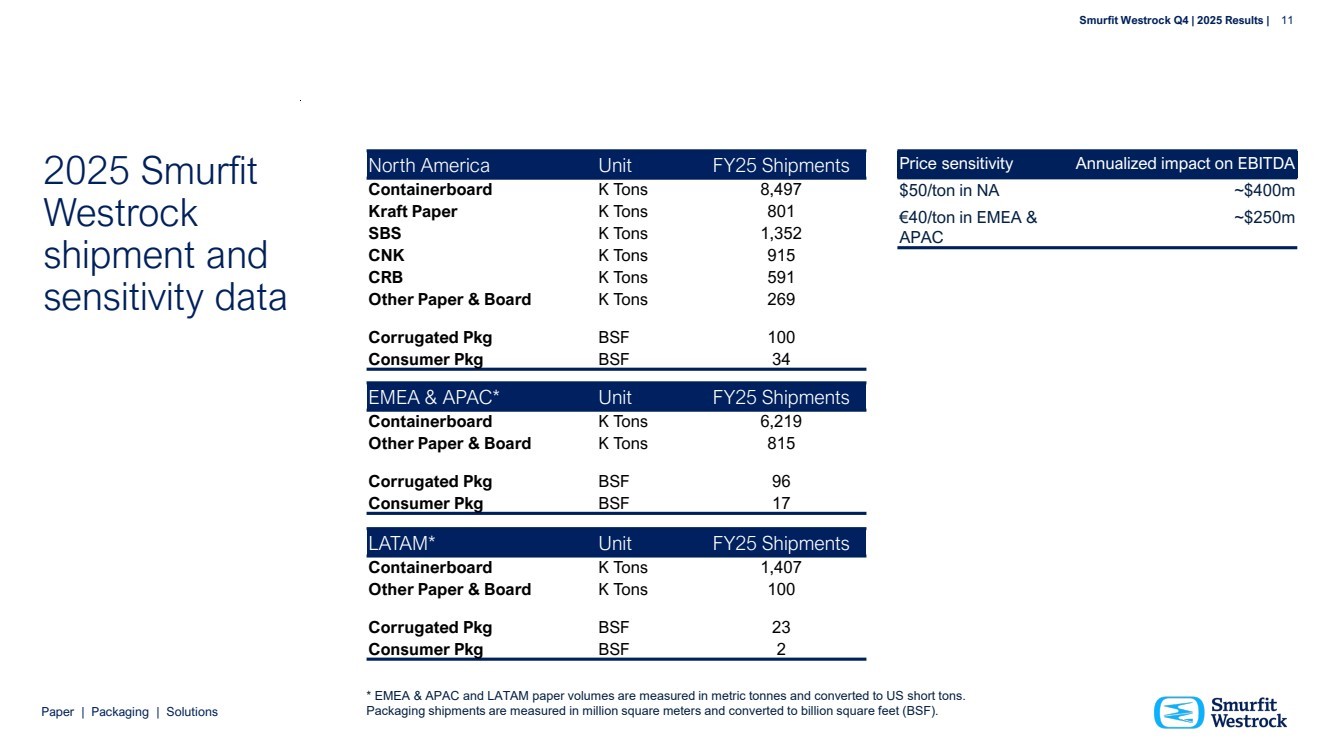
| Paper | Packaging | Solutions Smurfit Westrock Q4 | 2025 Results | 11 2025 Smurfit Westrock shipment and sensitivity data North America Unit FY25 Shipments Containerboard K Tons 8,497 Kraft Paper K Tons 801 SBS K Tons 1,352 CNK K Tons 915 CRB K Tons 591 Other Paper & Board K Tons 269 Corrugated Pkg BSF 100 Consumer Pkg BSF 34 EMEA & APAC* Unit FY25 Shipments Containerboard K Tons 6,219 Other Paper & Board K Tons 815 Corrugated Pkg BSF 96 Consumer Pkg BSF 17 LATAM* Unit FY25 Shipments Containerboard K Tons 1,407 Other Paper & Board K Tons 100 Corrugated Pkg BSF 23 Consumer Pkg BSF 2 Price sensitivity Annualized impact on EBITDA $50/ton in NA ~$400m €40/ton in EMEA & APAC ~$250m * EMEA & APAC and LATAM paper volumes are measured in metric tonnes and converted to US short tons. Packaging shipments are measured in million square meters and converted to billion square feet (BSF). |
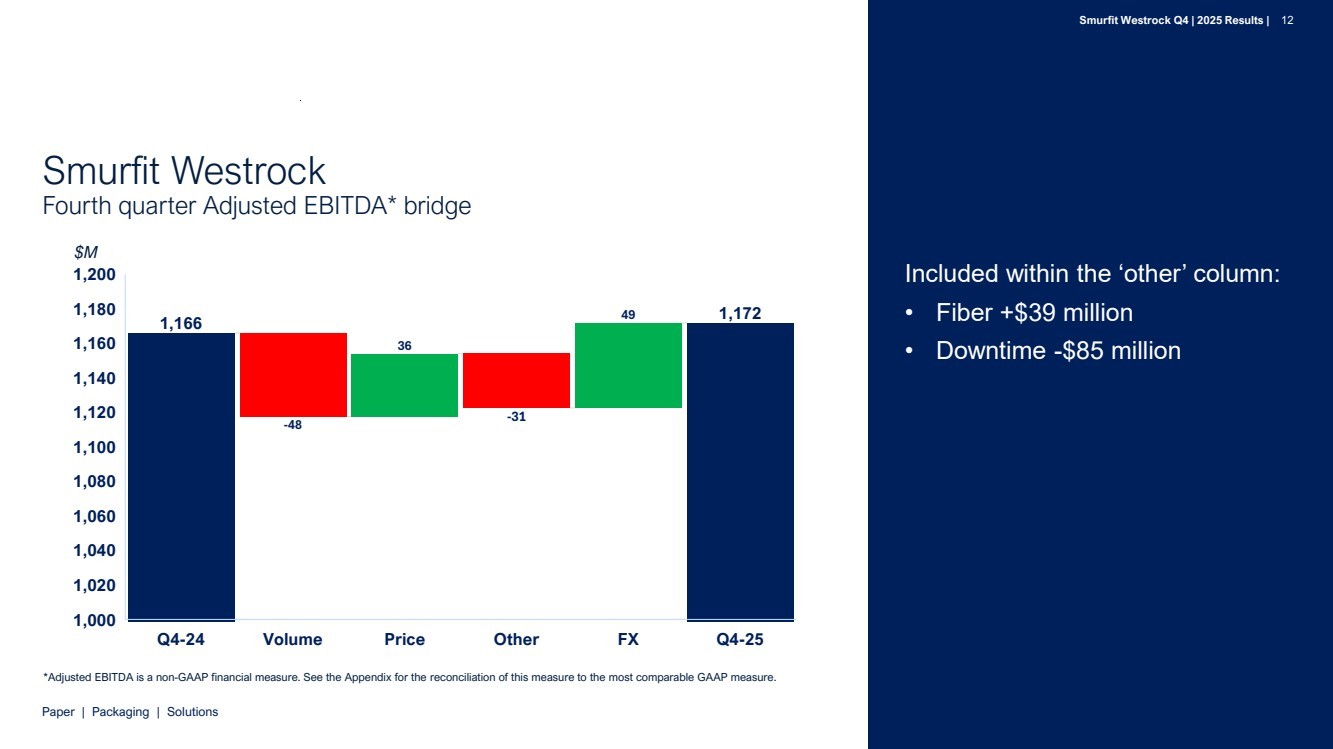
| Paper | Packaging | Solutions Smurfit Westrock Fourth quarter Adjusted EBITDA* bridge Included within the ‘other’ column: • Fiber +$39 million • Downtime -$85 million $M 1,166 -48 36 -31 49 1,172 Q4-24 Volume Price Other FX Q4-25 1,000 1,020 1,040 1,060 1,080 1,100 1,120 1,140 1,160 1,180 1,200 *Adjusted EBITDA is a non-GAAP financial measure. See the Appendix for the reconciliation of this measure to the most comparable GAAP measure. Smurfit Westrock Q4 | 2025 Results | 12 |
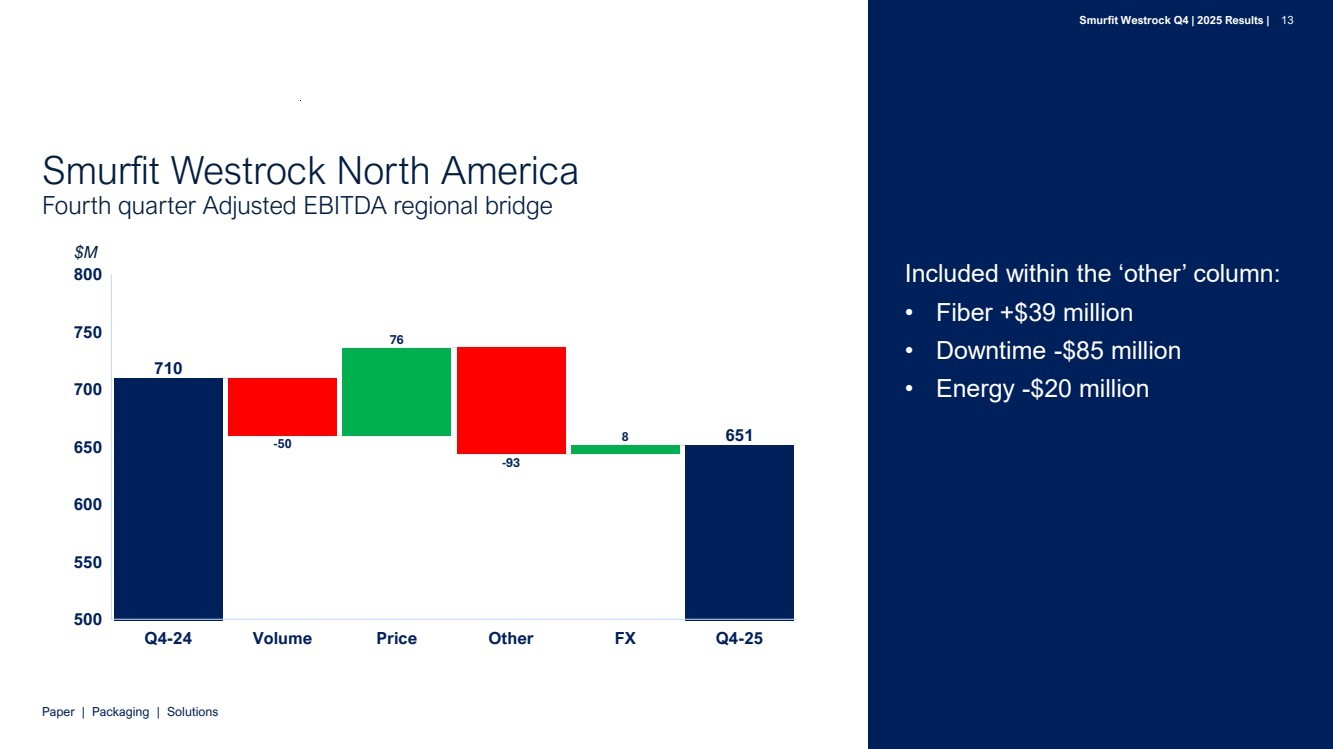
| Paper | Packaging | Solutions Smurfit Westrock North America Fourth quarter Adjusted EBITDA regional bridge Included within the ‘other’ column: • Fiber +$39 million • Downtime -$85 million • Energy -$20 million 710 651 -50 76 -93 8 Q4-24 Volume Price Other FX Q4-25 500 550 600 650 700 750 800 $M Smurfit Westrock Q4 | 2025 Results | 13 |
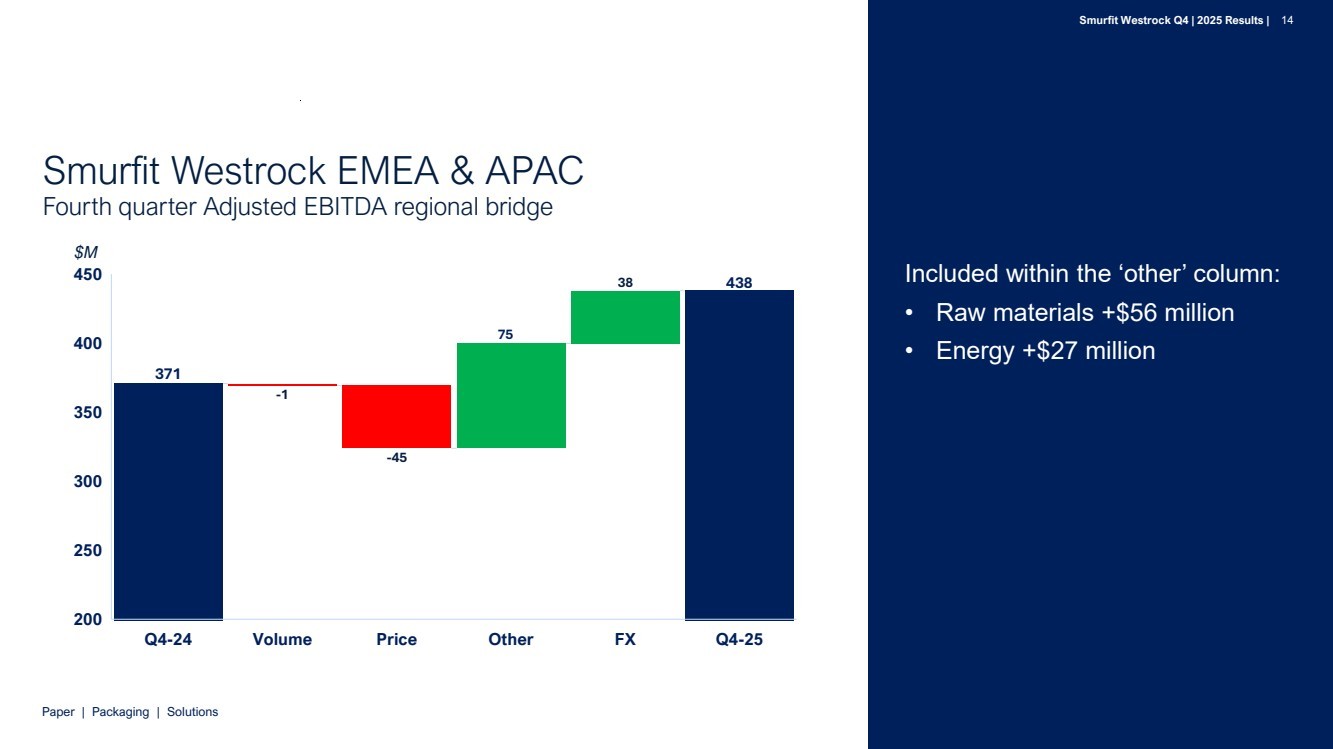
| Paper | Packaging | Solutions Smurfit Westrock EMEA & APAC Fourth quarter Adjusted EBITDA regional bridge Included within the ‘other’ column: • Raw materials +$56 million • Energy +$27 million 371 -1 -45 38 438 Q4-24 Volume Price Other FX Q4-25 200 250 300 350 400 450 75 $M Smurfit Westrock Q4 | 2025 Results | 14 |
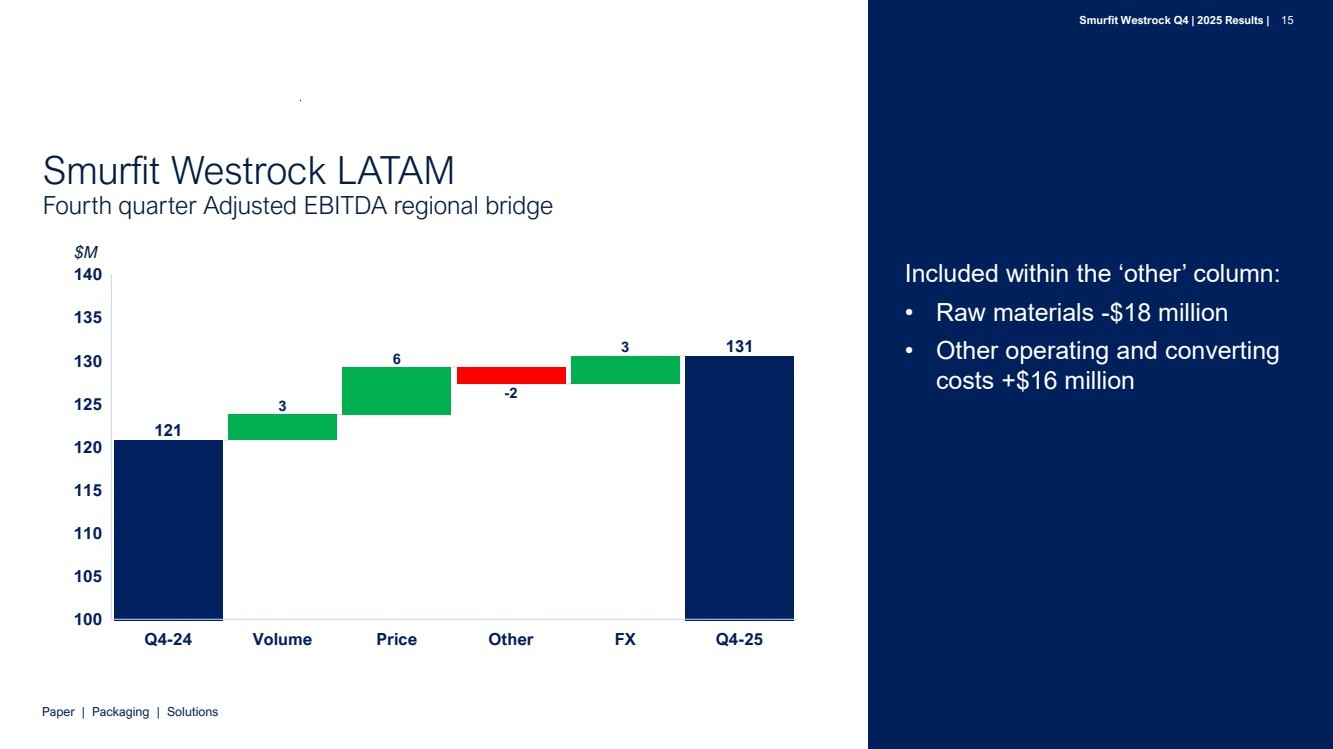
| Paper | Packaging | Solutions Smurfit Westrock LATAM Fourth quarter Adjusted EBITDA regional bridge Included within the ‘other’ column: • Raw materials -$18 million • Other operating and converting costs +$16 million 3 6 -2 3 121 131 Q4-24 Volume Price Other FX Q4-25 100 105 110 115 120 125 130 135 140 $M Smurfit Westrock Q4 | 2025 Results | 15 |
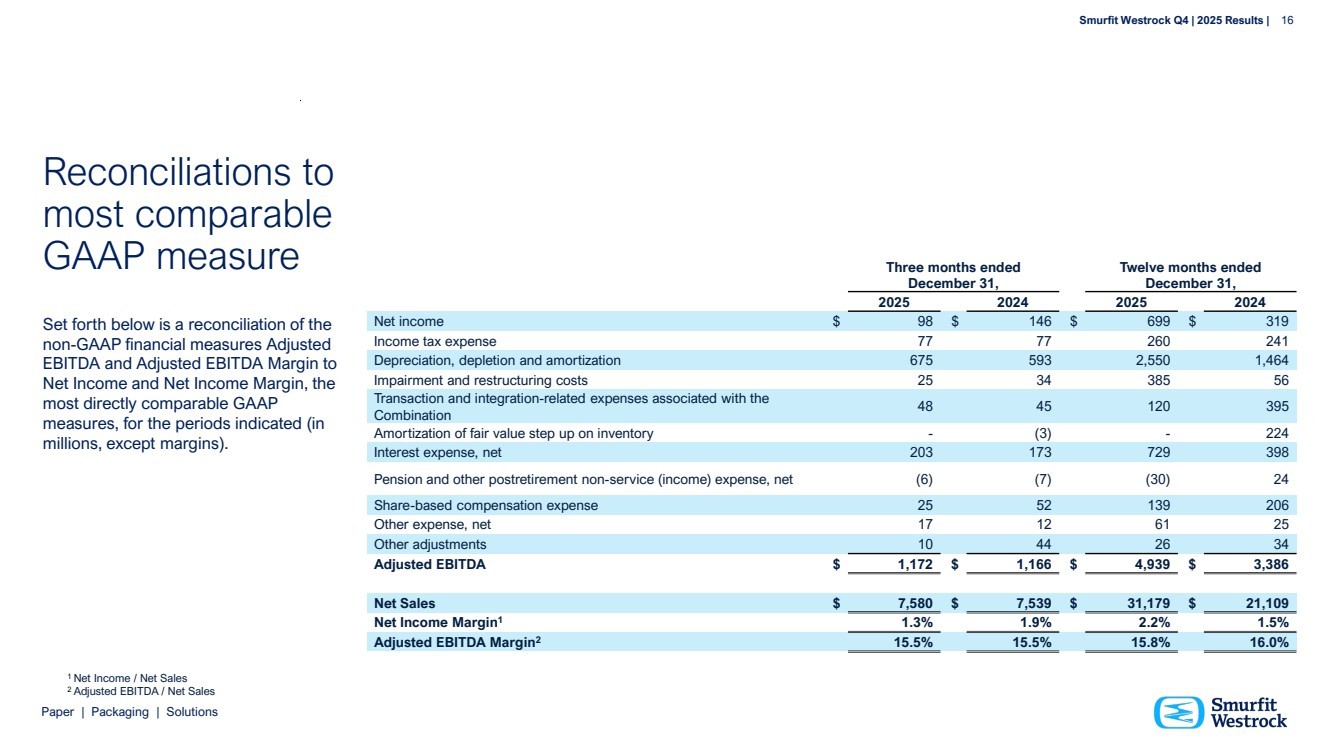
| Paper | Packaging | Solutions Smurfit Westrock Q4 | 2025 Results | 16 Reconciliations to most comparable GAAP measure Set forth below is a reconciliation of the non-GAAP financial measures Adjusted EBITDA and Adjusted EBITDA Margin to Net Income and Net Income Margin, the most directly comparable GAAP measures, for the periods indicated (in millions, except margins). Three months ended December 31, Twelve months ended December 31, 2025 2024 2025 2024 Net income $ 98 $ 146 $ 699 $ 319 Income tax expense 77 77 260 241 Depreciation, depletion and amortization 675 593 2,550 1,464 Impairment and restructuring costs 25 34 385 56 Transaction and integration-related expenses associated with the Combination 48 45 120 395 Amortization of fair value step up on inventory - (3) - 224 Interest expense, net 203 173 729 398 Pension and other postretirement non-service (income) expense, net (6) (7) (30) 24 Share-based compensation expense 25 52 139 206 Other expense, net 17 12 61 25 Other adjustments 10 44 26 34 Adjusted EBITDA $ 1,172 $ 1,166 $ 4,939 $ 3,386 Net Sales $ 7,580 $ 7,539 $ 31,179 $ 21,109 Net Income Margin1 1.3% 1.9% 2.2% 1.5% Adjusted EBITDA Margin2 15.5% 15.5% 15.8% 16.0% 1 Net Income / Net Sales 2 Adjusted EBITDA / Net Sales |
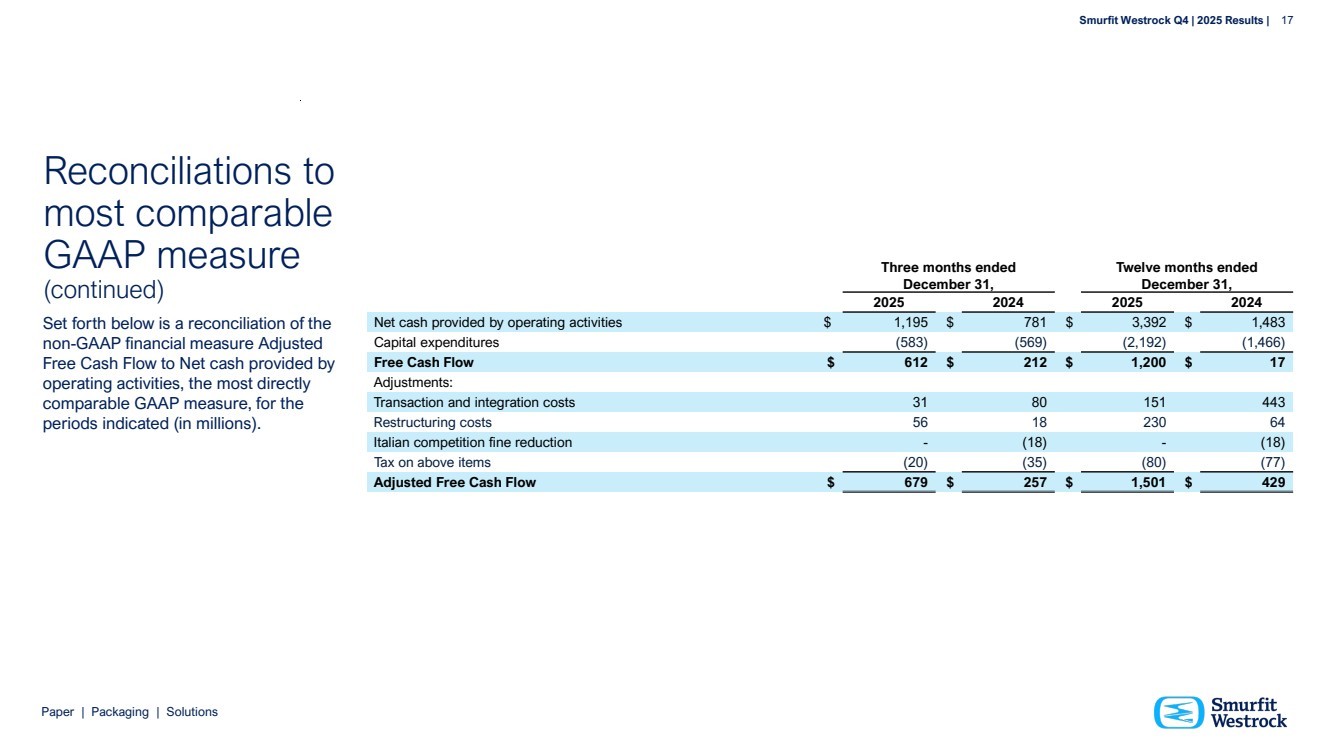
| Paper | Packaging | Solutions Smurfit Westrock Q4 | 2025 Results | 17 Reconciliations to most comparable GAAP measure (continued) Set forth below is a reconciliation of the non-GAAP financial measure Adjusted Free Cash Flow to Net cash provided by operating activities, the most directly comparable GAAP measure, for the periods indicated (in millions). Three months ended December 31, Twelve months ended December 31, 2025 2024 2025 2024 Net cash provided by operating activities $ 1,195 $ 781 $ 3,392 $ 1,483 Capital expenditures (583) (569) (2,192) (1,466) Free Cash Flow $ 612 $ 212 $ 1,200 $ 17 Adjustments: Transaction and integration costs 31 80 151 443 Restructuring costs 56 18 230 64 Italian competition fine reduction - (18) - (18) Tax on above items (20) (35) (80) (77) Adjusted Free Cash Flow $ 679 $ 257 $ 1,501 $ 429 |
| Paper | Packaging | Solutions Smurfit Westrock Q4 | 2025 Results | 18 |