| Paper | Packaging | Solutions February 2026 Medium-Term Plan |
| Paper | Packaging | Solutions Smurfit Westrock | Medium-Term Plan 2 © 2026 Smurfit Westrock. All Rights Reserved. Forward Looking Statements and Non-GAAP Financial Measures The presentation includes certain “forward-looking statements” (including within the meaning of Section 27A of the Securities Act of 1933, as amended, and Section 21E of the Securities Exchange Act of 1934, as amended) regarding, among other things, the plans, strategies, outcomes, outlooks, and prospects, both business and financial, of Smurfit Westrock, including, but not limited to the synergies and other expected benefits of the completed combination between Smurfit Kappa and WestRock as well as our scale, geographic reach, product portfolio, credit rating and level of debt and leverage ratio, demand outlook, market growth patterns, and mid-range plan, including with respect to our capital returns to shareholders (such as declaration of future dividends and/or share buybacks), planned investments and anticipated path to delivering shareholder value and any other statements regarding the Company's future expectations, beliefs, plans, objectives, capital allocation decisions, investment strategy and return on capital employed, results of operations, financial condition and cash flows, or future events, outlook, or performance. Statements that are not historical facts, including statements about the beliefs and expectations of the management of the Company, are forward-looking statements. Words such as “may”, “will”, “could”, “should”, “would”, “anticipate”, “intend”, “estimate”, “project”, “plan”, “believe”, “expect”, “target”, “prospects”, “potential”, “commit”, “forecasts”, “aims”, “considered”, “likely” and variations of these words and similar future or conditional expressions are intended to identify forward-looking statements but are not the exclusive means of identifying such statements. While the Company believes these expectations, assumptions, estimates and projections are reasonable, such forward-looking statements are only predictions and involve known and unknown risks and uncertainties, many of which are beyond the control of the Company. By their nature, forward-looking statements involve risk and uncertainty because they relate to events and depend upon future circumstances that may or may not occur. Actual results may differ materially from the current expectations of the Company depending upon a number of factors affecting its business, including risks associated with the integration and performance of the Company following the Combination. This presentation provides an overview of the Company’s goals, plans, and related initiatives. These goals, plans, and initiatives are aspirational or otherwise constitute forward-looking statements and actual performance may differ, possibly materially, and no guarantees are made that these goals will be met or that these plans and initiatives will be successfully executed. This presentation also includes numbers and percentages that are estimates or approximations and that may be based on various assumptions some but not all of which are provided herein. Some data and other information in this presentation are also based on management’s estimates and calculations, which are derived from its review and interpretation of internal company research, surveys and independent sources. In addition, industry data included herein is subject to significant business, economic and competitive uncertainties beyond the Company’s control. Important factors that could cause actual results to differ materially from plans, estimates or expectations include: our ability to deliver on our mid-range plan, including with respect to our capital returns to shareholders, planned investments and growth; changes in demand environment; our ability to deliver on our closure plan and associated efforts; our future cash payments associated with these initiatives; potential future cost savings associated with such initiatives; the amount of charges and the timing of such charges or actions described herein; potential future impairment charges; accuracy of assumptions associated with the charges; economic, competitive and market conditions generally, including macroeconomic uncertainty, customer inventory rebalancing, the impact of inflation and increases in energy, raw materials, shipping, labor and capital equipment costs, geo-economic fragmentation and protectionism such as tariffs, trade wars or similar governmental actions affecting the flows of goods, services or currency (including the implementation of tariffs by the US federal government and reciprocal tariffs and other protectionist or retaliatory measures governments in Europe, Asia, and other countries have taken or may take in response); the impact of prolonged or recurring U.S. federal government shutdowns and any resulting volatility in the capital markets or interruptions in the Company’s access to capital; the impact of public health crises, such as pandemics and epidemics and any related company or governmental policies and actions to protect the health and safety of individuals or governmental policies or actions to maintain the functioning of national or global economies and markets; reduced supply of raw materials, energy and transportation, including from supply chain disruptions and labor shortages; developments related to pricing cycles and volumes; intense competition; the ability of the Company to successfully recover from a disaster or other business continuity problem due to a hurricane, flood, earthquake, terrorist attack, war, pandemic, security breach, cyber-attack, power loss, telecommunications failure or other natural or man-made events, including the ability to function remotely during long-term disruptions; the Company's ability to respond to changing customer preferences and to protect intellectual property; the amount and timing of the Company's capital expenditures; risks related to international sales and operations; failures in the Company's quality control measures and systems resulting in faulty or contaminated products; cybersecurity risks, including threats to the confidentiality, integrity and availability of data in the Company's systems; works stoppages and other labor disputes; the Company’s ability to establish and maintain effective internal controls over financial reporting in accordance with the Sarbanes Oxley Act of 2002, as amended, and remediate any weaknesses in controls and processes; the Company's ability to retain or hire key personnel; risks related to sustainability matters, including climate change and scarce resources, as well as the Company's ability to comply with changing environmental laws and regulations; the Company's ability to successfully implement strategic transformation initiatives; results and impacts of acquisitions by the Company; the Company's significant levels of indebtedness; the impact of the Combination on the Company's credit ratings; the potential impairment of assets and goodwill; the availability of sufficient cash to distribute dividends to the Company's shareholders in line with current expectations; the scope, costs, timing and impact of any restructuring of operations and corporate and tax structure; evolving legal, regulatory and tax regimes; changes in economic, financial, political and regulatory conditions in Ireland, the United Kingdom, the United States and elsewhere, and other factors that contribute to uncertainty and volatility, natural and man-made disasters, civil unrest, geopolitical uncertainty, and conditions that may result from legislative, regulatory, trade and policy changes associated with the current or subsequent Irish, US or UK administrations; legal proceedings instituted against the Company; actions by third parties, including government agencies; the Company's ability to promptly and effectively integrate Smurfit Kappa's and WestRock's businesses; the Company's ability to achieve the synergies and value creation contemplated by the Combination; other factors such as future market conditions, currency fluctuations, the behavior of other market participants, the actions of regulators and other factors such as changes in the political, social and regulatory framework in which the Company's group operates or in economic or technological trends or conditions, and other risk factors included in the Company's filings with the Securities and Exchange Commission, including the Company’s Annual Report on Form 10-K for the fiscal years ended December 31, 2024 and 2025. Neither the Company nor any of its associates or directors, officers or advisers provides any representation, assurance or guarantee that the occurrence of the events expressed or implied in any such forward-looking statements will actually occur. You are cautioned not to place undue reliance on these forward-looking statements. Other than in accordance with its legal or regulatory obligations (including under the UK Listing Rules, the Disclosure Guidance and Transparency Rules, the UK Market Abuse Regulation and other applicable regulations), the Company is under no obligation, and the Company expressly disclaims any intention or obligation, to update or revise publicly any forward-looking statements, whether as a result of new information, future events or otherwise. |
| Paper | Packaging | Solutions Smurfit Westrock | Medium-Term Plan 3 © 2026 Smurfit Westrock. All Rights Reserved. Non-GAAP Financial Measures Smurfit Westrock reports its financial results in accordance with U.S. generally accepted accounting principles ("GAAP"). However, management believes certain non-GAAP financial measures provide Smurfit Westrock’s Board of directors, investors, potential investors, securities analysts and others with additional meaningful financial information that should be considered when assessing its ongoing performance. Smurfit Westrock management also uses these non-GAAP financial measures in making financial, operating and planning decisions, and in evaluating company performance. Non-GAAP financial measures are not intended to be considered in isolation of or as a substitute for, or superior to, financial information prepared and presented in accordance with GAAP and should be viewed in addition to, and not as an alternative for, the GAAP results. The non-GAAP financial measures we present may differ from similarly captioned measures presented by other companies. Smurfit Westrock uses the non-GAAP financial measures “Adjusted EBITDA”, “Adjusted EBITDA Margin”, “Adjusted EBITDA CAGR”, “Free Cash Flow”, “Discretionary Free Cash Flow”, “Discretionary Free Cash Flow CAGR” and “Net Leverage”. We discuss below details of the non-GAAP financial measures presented by us. We have not reconciled these forward-looking non-GAAP measures to the most comparable GAAP measures because it is not possible to do so without unreasonable efforts due to the uncertainty and potential variability of reconciling items, which are dependent on future events and often outside of management’s control and which could be significant. Because such items cannot be reasonably predicted with the level of precision required, we are unable to provide forward-looking comparable GAAP measures. Definitions Smurfit Westrock uses the non-GAAP financial measures “Adjusted EBITDA” and “Adjusted EBITDA Margin” to evaluate its overall performance. The composition of Adjusted EBITDA is not addressed or prescribed by GAAP. Smurfit Westrock defines Adjusted EBITDA as net income (loss) before income tax expense, depreciation, depletion and amortization, interest expense, net, pension and other postretirement non-service income (expense), net, share based compensation expense, other expense, net, impairment and restructuring costs, transaction and integration-related expenses associated with the Combination, amortization of fair value step up on inventory and other specific items that management believes are not indicative of the ongoing operating results of the business. Adjusted EBITDA CAGR (compound annual growth rate) measures the mean annual growth rate of the Company's Adjusted EBITDA over a specified time period. Management believes Adjusted EBITDA and Adjusted EBITDA Margin measures provide Smurfit Westrock’s management, board of directors, investors, potential investors, securities analysts and others with useful information to evaluate Smurfit Westrock’s performance relative to other periods because it adjusts out non recurring items that management believes are not indicative of the ongoing results of the business. Adjusted EBITDA Margin is calculated as Adjusted EBITDA divided by Net Sales. Smurfit Westrock defines the non-GAAP financial measure “Free Cash Flow” as net cash provided by operating activities as adjusted for capital expenditures. Management utilizes this measure in connection with managing Smurfit Westrock’s business and believes that Free Cash Flow is useful to investors as a liquidity measure because it measures the amount of cash generated after reinvesting in the business, and that is available for dividends, acquisitions and other uses. Smurfit Westrock also uses the non-GAAP financial measure “Discretionary Free Cash Flow.” Smurfit Westrock defines Discretionary Free Cash Flow as Free Cash Flow plus strategic capital expenditure. Discretionary Free Cash Flow CAGR (compound annual growth rate) measures the mean annual growth rate of the Company's Discretionary Free Cash Flow over a specified time period. Management utilizes this measure to assess cash flow before making strategic investment decisions. Smurfit Westrock uses the non-GAAP financial measure “Return on Capital Employed” (“ROCE”). Smurfit Westrock defines ROCE as the Company’s segment adjusted EBITDA adjusted further for (i) unallocated corporate costs, (ii) depreciation, depletion and amortization expense, (iii) share based-compensation expense, and (iv) other expense (income), net, excluding finance costs or income included within (iv), divided by the Company’s average capital employed, with capital employed for the applicable calendar year defined as the sum of the Company’s (a) total equity, (b) current portion of debt and (c) non-current debt due after one year, less (d) cash and cash equivalents. The average capital employed is defined as the sum of the capital employed during the applicable calendar year and the capital employed during the calendar year preceding such year divided by two. Smurfit Westrock uses the non-GAAP financial measure "Net Leverage". Smurfit Westrock defines Net Leverage as Net Financial Debt divided by Adjusted EBITDA (as defined above). Net Financial Debt is defined as Financial Liabilities (short- and long-term) minus Cash and cash equivalents. Inside Information This presentation contains Inside Information as defined under Article 7(1) of the Market Abuse Regulation (Eu) No 596/2014 as it forms part of UK Domestic Law by virtue of the European Union (Withdrawal) Act 2018 (As Amended). The person responsible for arranging the release of this presentation on behalf of Smurfit Westrock plc is Gillian Carson-Callan, Group SVP Finance & Company Secretary. The inside information contained herein was disclosed in full at the time noted in the Company's announcement entitled `Smurfit Westrock Medium-Term Investor Update' released on February 11, 2026. |
| Paper | Packaging | Solutions Smurfit Westrock | Medium-Term Plan 4 © 2026 Smurfit Westrock. All Rights Reserved. Presenters Today’s presenters Draft / Outline Tony Smurfit Note: Company to provide Laurent’s high-resolution picture Tony Smurfit Ken Bowles Laurent Sellier Saverio Mayer Alvaro Jose Henao CEO CFO CEO North America (including Mexico) CEO Europe, MEA and APAC CEO LATAM |
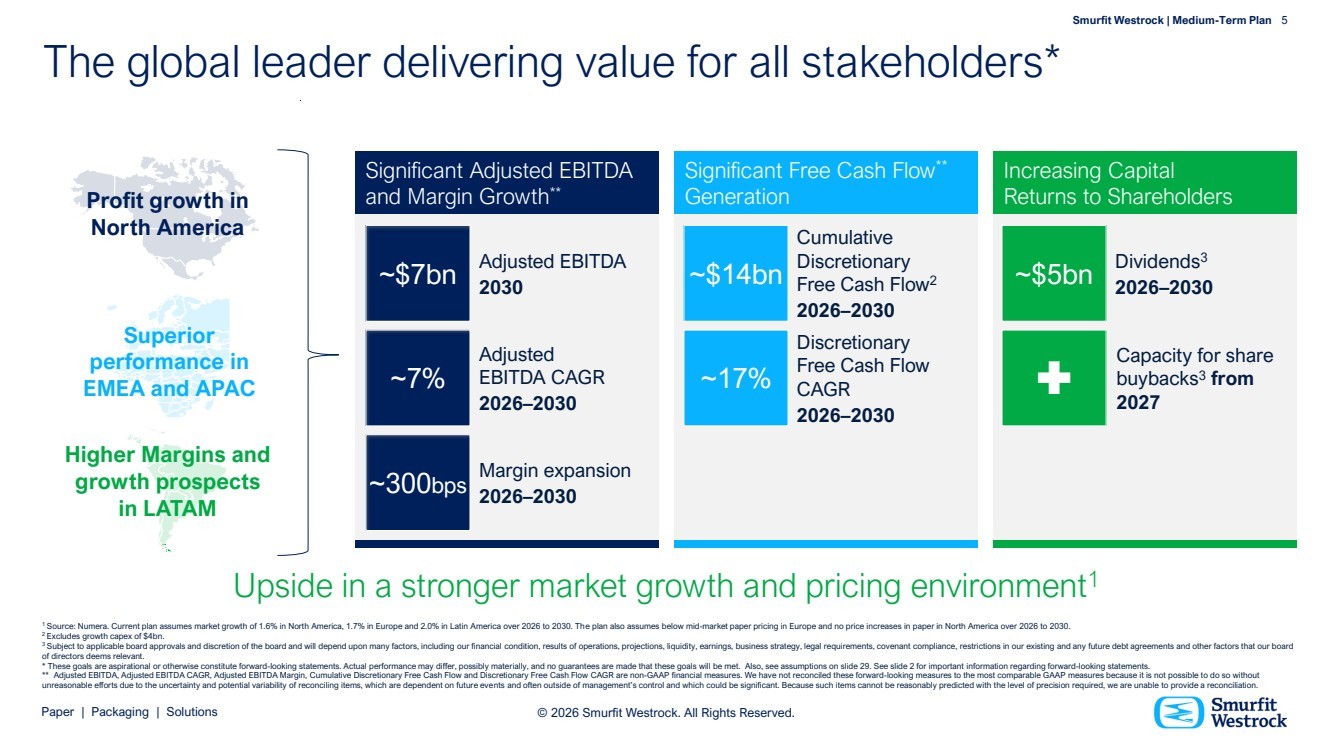
| Paper | Packaging | Solutions Smurfit Westrock | Medium-Term Plan 5 © 2026 Smurfit Westrock. All Rights Reserved. The global leader delivering value for all stakeholders* Significant Adjusted EBITDA and Margin Growth** Adjusted EBITDA 2030 ~$7bn Adjusted EBITDA CAGR 2026–2030 ~7% Margin expansion 2026–2030 ~300bps Significant Free Cash Flow** Generation Cumulative Discretionary Free Cash Flow2 2026–2030 ~$14bn Discretionary Free Cash Flow CAGR 2026–2030 ~17% Increasing Capital Returns to Shareholders Capacity for share buybacks3 from 2027 Dividends3 2026–2030 ~$5bn Upside in a stronger market growth and pricing environment1 Profit growth in North America Superior performance in EMEA and APAC Higher Margins and growth prospects in LATAM 1 Source: Numera. Current plan assumes market growth of 1.6% in North America, 1.7% in Europe and 2.0% in Latin America over 2026 to 2030. The plan also assumes below mid-market paper pricing in Europe and no price increases in paper in North America over 2026 to 2030. 2 Excludes growth capex of $4bn. 3 Subject to applicable board approvals and discretion of the board and will depend upon many factors, including our financial condition, results of operations, projections, liquidity, earnings, business strategy, legal requirements, covenant compliance, restrictions in our existing and any future debt agreements and other factors that our board of directors deems relevant. * These goals are aspirational or otherwise constitute forward-looking statements. Actual performance may differ, possibly materially, and no guarantees are made that these goals will be met. Also, see assumptions on slide 29. See slide 2 for important information regarding forward-looking statements. ** Adjusted EBITDA, Adjusted EBITDA CAGR, Adjusted EBITDA Margin, Cumulative Discretionary Free Cash Flow and Discretionary Free Cash Flow CAGR are non-GAAP financial measures. We have not reconciled these forward-looking measures to the most comparable GAAP measures because it is not possible to do so without unreasonable efforts due to the uncertainty and potential variability of reconciling items, which are dependent on future events and often outside of management’s control and which could be significant. Because such items cannot be reasonably predicted with the level of precision required, we are unable to provide a reconciliation. |
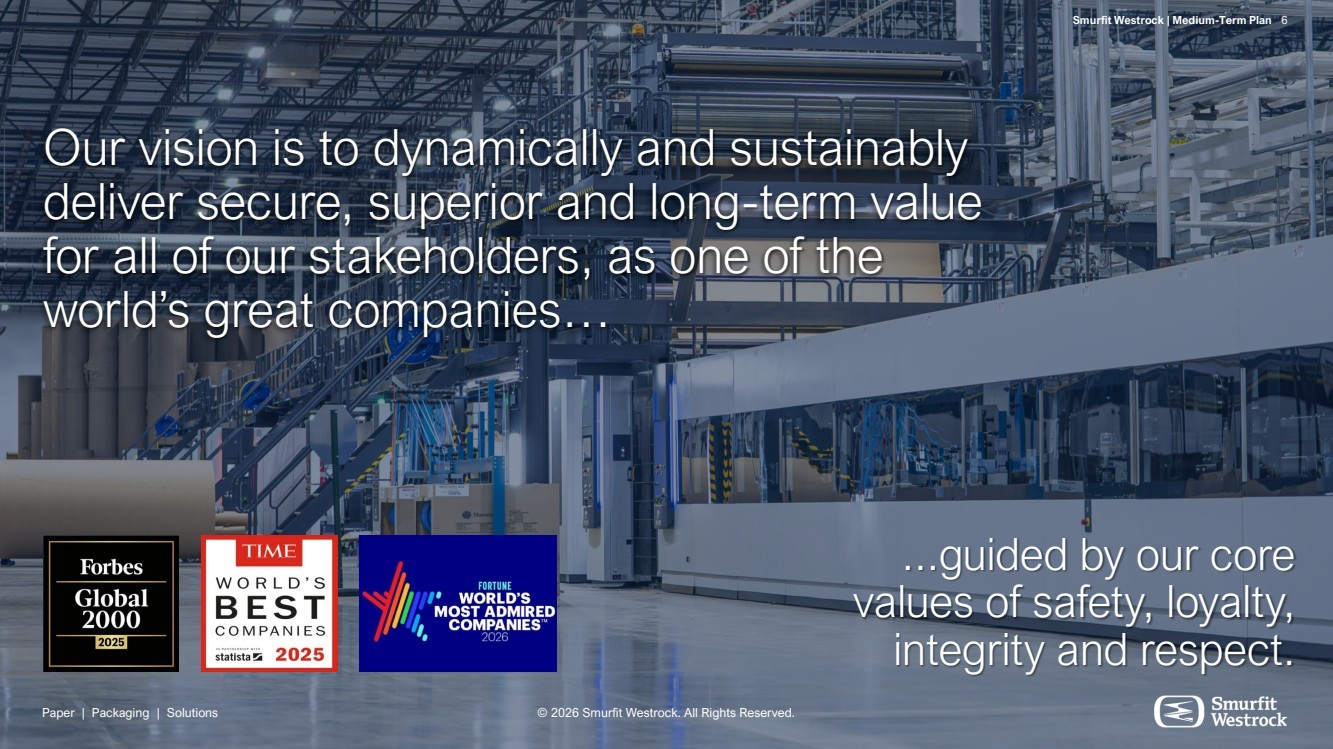
| Paper | Packaging | Solutions Smurfit Westrock | Medium-Term Plan 6 © 2026 Smurfit Westrock. All Rights Reserved. ...guided by our core values of safety, loyalty, integrity and respect. Our vision is to dynamically and sustainably deliver secure, superior and long-term value for all of our stakeholders, as one of the world’s great companies… Paper | Packaging | Solutions Smurfit Westrock | Medium-Term Plan 6 © 2026 Smurfit Westrock. All Rights Reserved. |
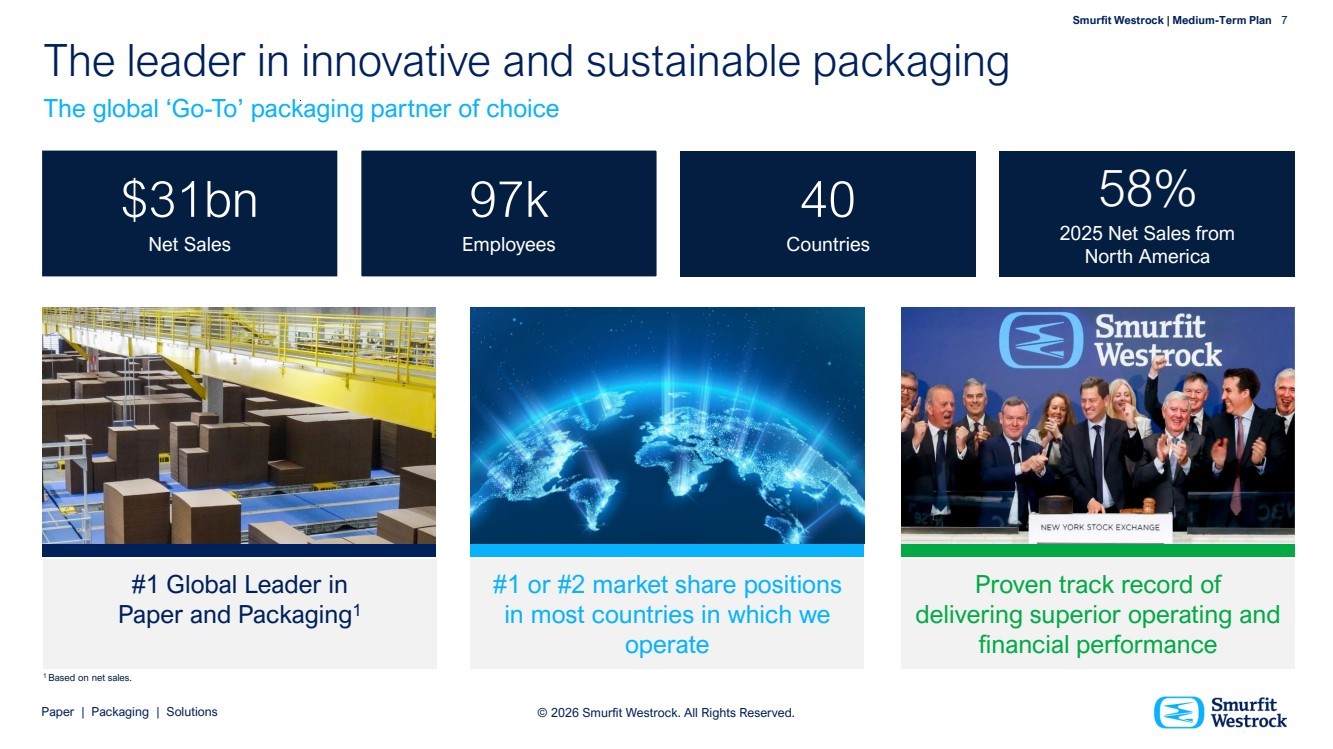
| Paper | Packaging | Solutions Smurfit Westrock | Medium-Term Plan 7 © 2026 Smurfit Westrock. All Rights Reserved. The leader in innovative and sustainable packaging The global ‘Go-To’ packaging partner of choice 97k Employees 40 Countries 58% 2025 Net Sales from North America $31bn Net Sales #1 or #2 market share positions in most countries in which we operate #1 Global Leader in Paper and Packaging1 Proven track record of delivering superior operating and financial performance 1 Based on net sales. |
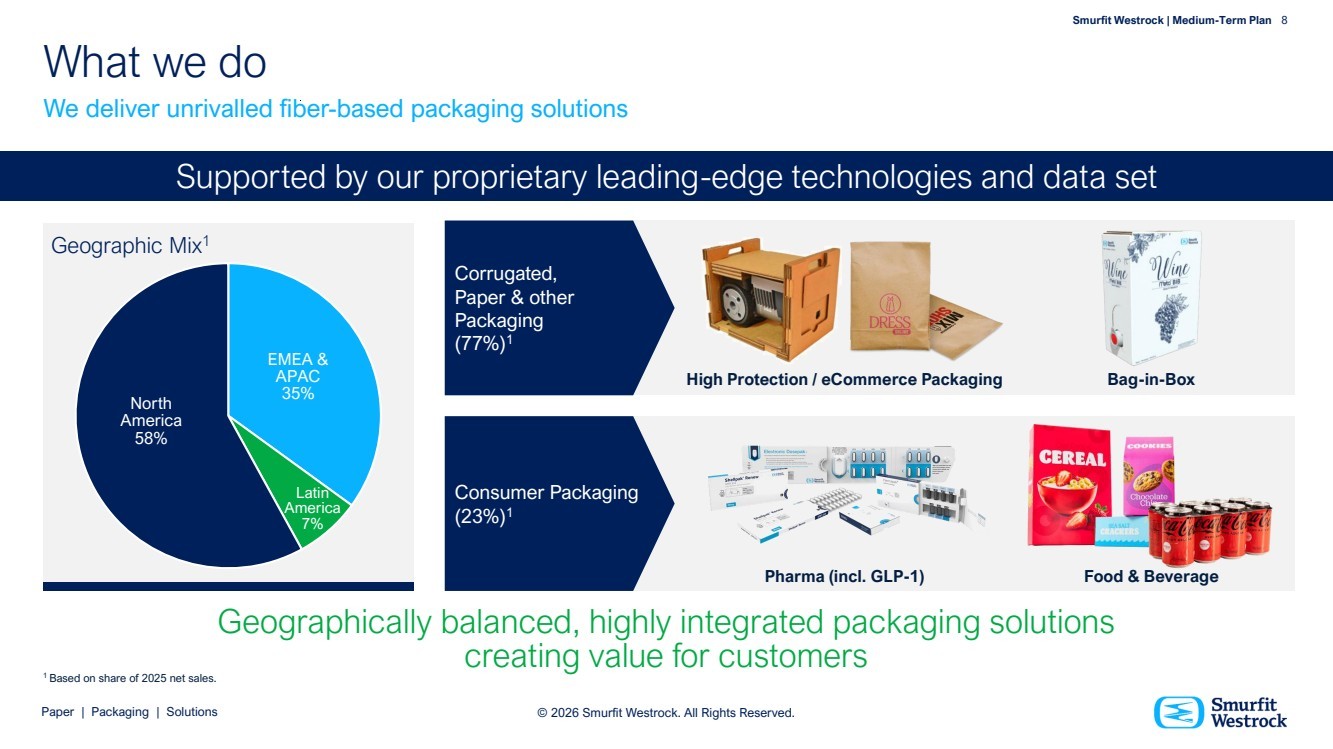
| Paper | Packaging | Solutions Smurfit Westrock | Medium-Term Plan 8 © 2026 Smurfit Westrock. All Rights Reserved. Geographic Mix1 What we do EMEA & APAC 35% Latin America 7% North America 58% Geographically balanced, highly integrated packaging solutions creating value for customers Corrugated, Paper & other Packaging (77%)1 Consumer Packaging (23%)1 1 Based on share of 2025 net sales. Pharma (incl. GLP-1) Food & Beverage High Protection / eCommerce Packaging Bag-in-Box Supported by our proprietary leading-edge technologies and data set We deliver unrivalled fiber-based packaging solutions |
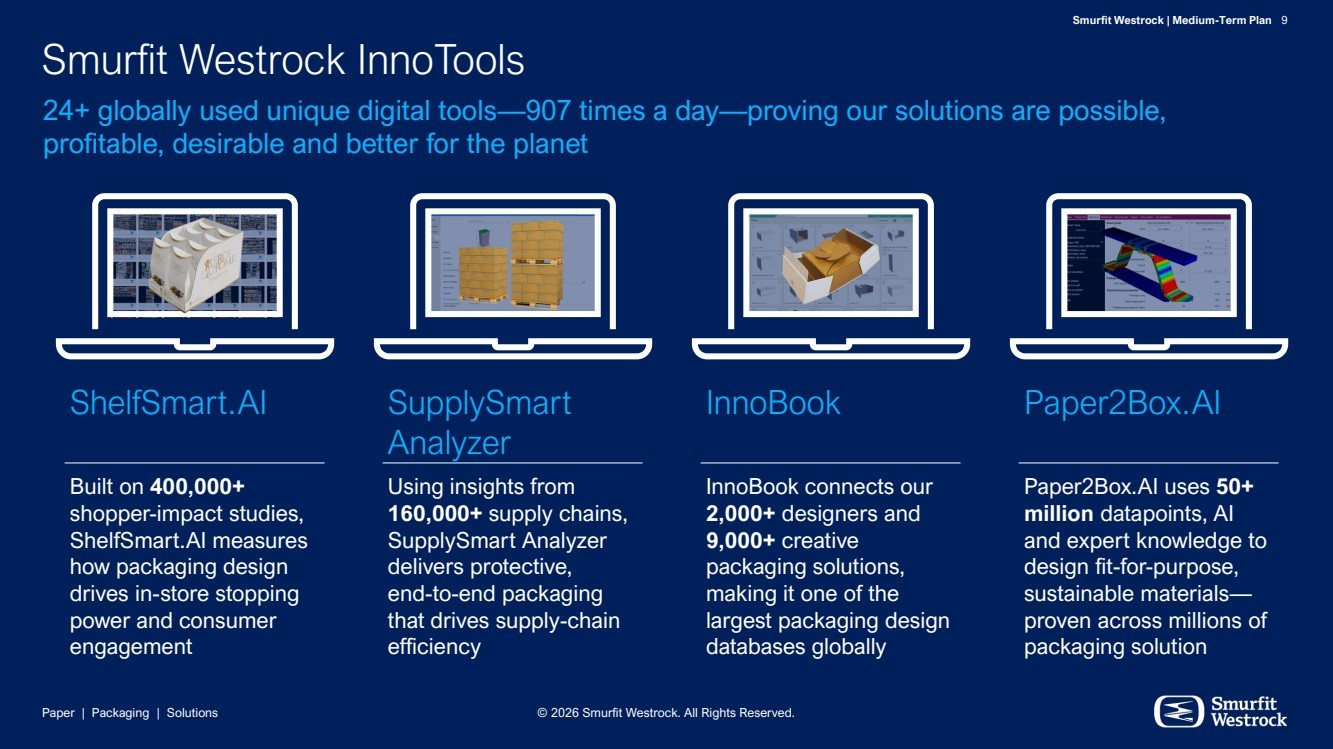
| Paper | Packaging | Solutions Smurfit Westrock | Medium-Term Plan 9 © 2026 Smurfit Westrock. All Rights Reserved. ShelfSmart.AI Built on 400,000+ shopper-impact studies, ShelfSmart.AI measures how packaging design drives in-store stopping power and consumer engagement InnoBook InnoBook connects our 2,000+ designers and 9,000+ creative packaging solutions, making it one of the largest packaging design databases globally Smurfit Westrock InnoTools 24+ globally used unique digital tools—907 times a day—proving our solutions are possible, profitable, desirable and better for the planet SupplySmart Analyzer Using insights from 160,000+ supply chains, SupplySmart Analyzer delivers protective, end-to-end packaging that drives supply-chain efficiency Paper2Box.AI Paper2Box.AI uses 50+ million datapoints, AI and expert knowledge to design fit-for-purpose, sustainable materials— proven across millions of packaging solution |
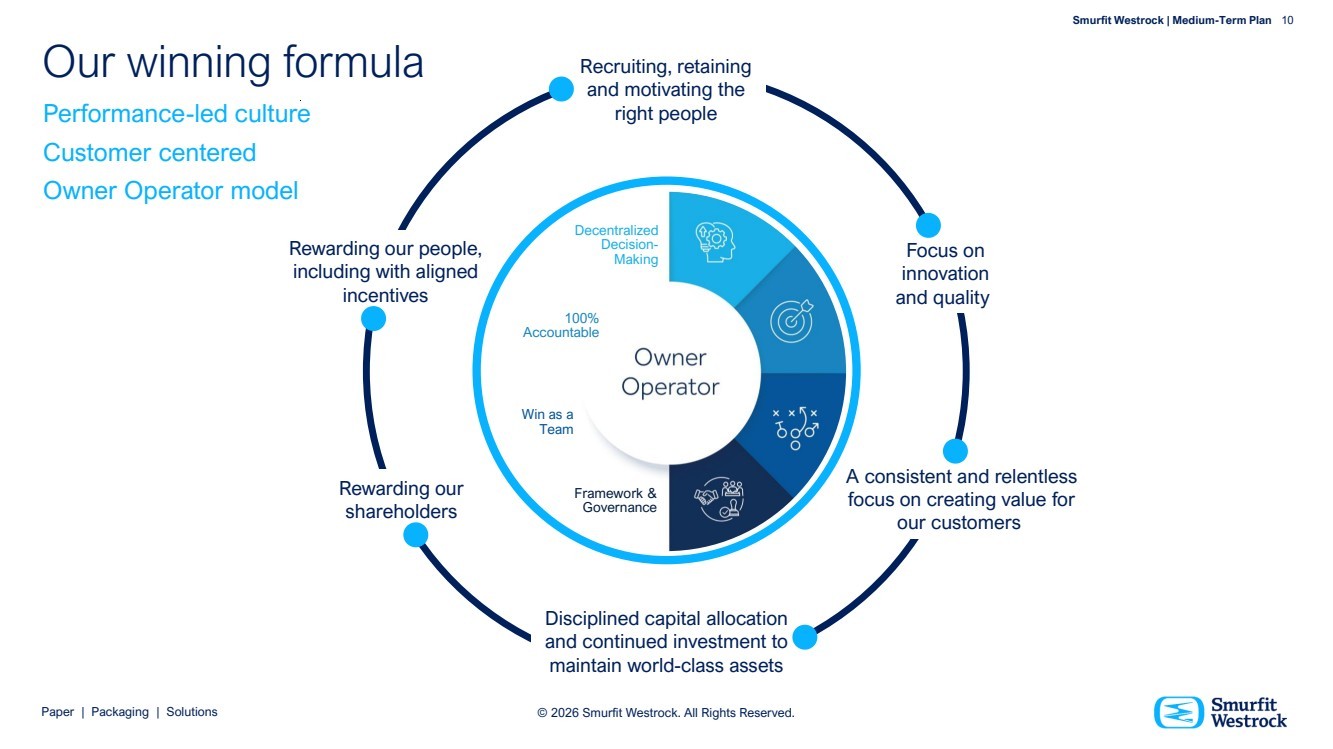
| Paper | Packaging | Solutions Smurfit Westrock | Medium-Term Plan 10 © 2026 Smurfit Westrock. All Rights Reserved. Our winning formula Recruiting, retaining and motivating the right people Disciplined capital allocation and continued investment to maintain world-class assets Focus on innovation and quality Rewarding our shareholders A consistent and relentless focus on creating value for our customers Rewarding our people, including with aligned incentives Performance-led culture Customer centered Owner Operator model Decentralized Decision-Making Win as a Team 100% Accountable Framework & Governance |
| Paper | Packaging | Solutions Smurfit Westrock | Medium-Term Plan 11 Paper | Packaging | Solutions © 2026 Smurfit Westrock. All Rights Reserved. North America Unlocking the full potential Smurfit Westrock | Medium-Term Plan 11 © 2026 Smurfit Westrock. All Rights Reserved. |
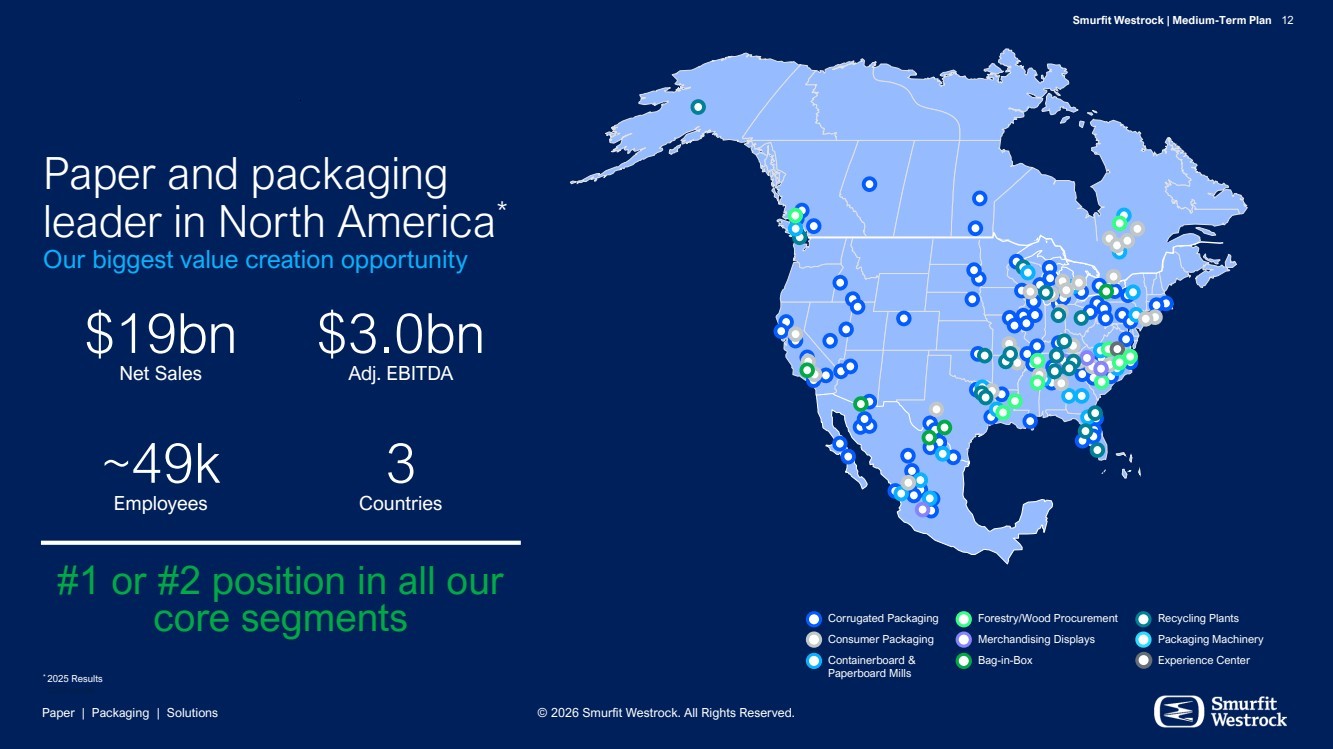
| Paper | Packaging | Solutions Smurfit Westrock | Medium-Term Plan 12 © 2026 Smurfit Westrock. All Rights Reserved. Corrugated Packaging Forestry/Wood Procurement Recycling Plants Consumer Packaging Merchandising Displays Packaging Machinery Containerboard & Paperboard Mills Bag-in-Box Experience Center Paper and packaging leader in North America* Our biggest value creation opportunity * 2025 results $19bn Net Sales $3.0bn Adj. EBITDA ~49k Employees 3 Countries #1 or #2 position in all our core segments * 2025 Results |
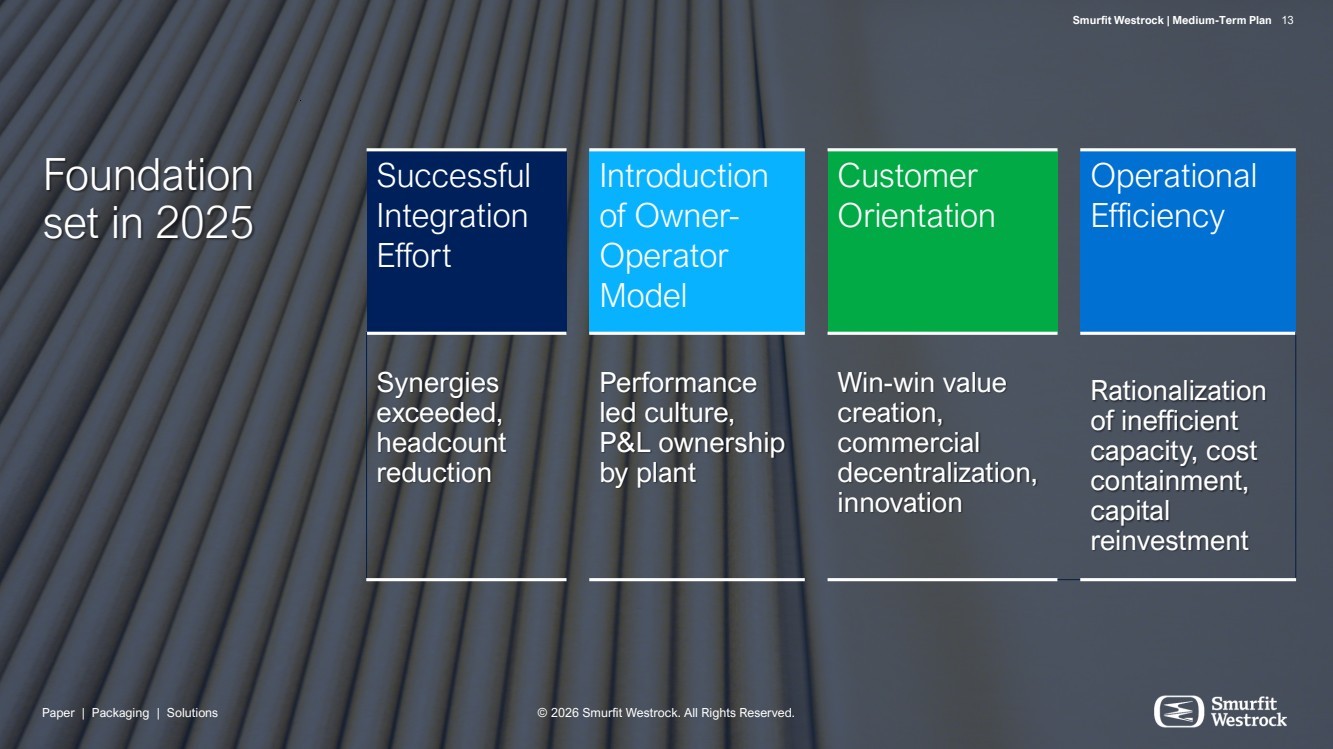
| Paper | Packaging | Solutions Smurfit Westrock | Medium-Term Plan 13 © 2026 Smurfit Westrock. All Rights Reserved. Foundation set in 2025 Successful Integration Effort Introduction of Owner-Operator Model Customer Orientation Operational Efficiency Synergies exceeded, headcount reduction Performance led culture, P&L ownership by plant Win-win value creation, commercial decentralization, innovation Rationalization of inefficient capacity, cost containment, capital reinvestment Paper | Packaging | Solutions © 2026 Smurfit Westrock. All Rights Reserved. Smurfit Westrock | Medium-Term Plan 13 |
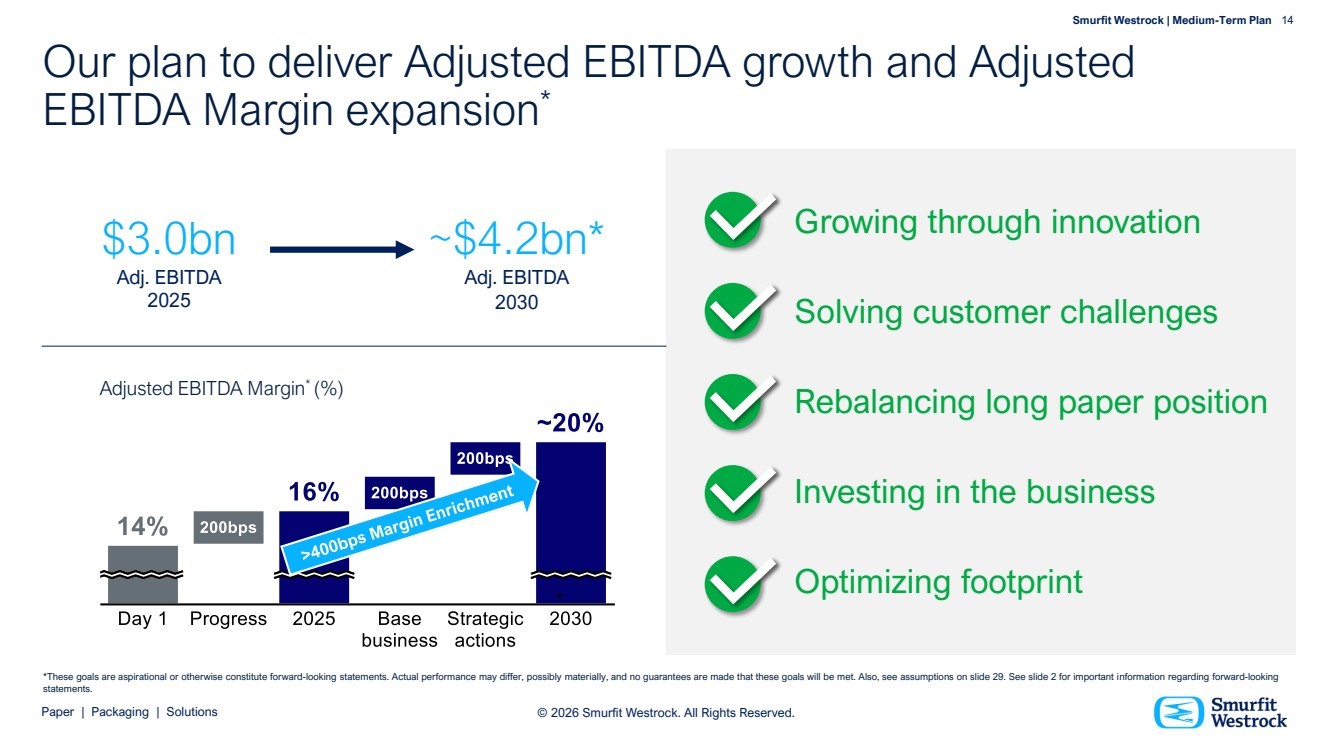
| Paper | Packaging | Solutions Smurfit Westrock | Medium-Term Plan 14 © 2026 Smurfit Westrock. All Rights Reserved. Growing through innovation Solving customer challenges Rebalancing long paper position Investing in the business Optimizing footprint Our plan to deliver Adjusted EBITDA growth and Adjusted EBITDA Margin expansion* Adjusted EBITDA Margin* (%) $3.0bn Adj. EBITDA 2025 ~$4.2bn* Adj. EBITDA 2030 *These goals are aspirational or otherwise constitute forward-looking statements. Actual performance may differ, possibly materially, and no guarantees are made that these goals will be met. Also, see assumptions on slide 29. See slide 2 for important information regarding forward-looking statements. Note: To discuss use of “base business” and “strategic actions” wording in the LHS bridge * |
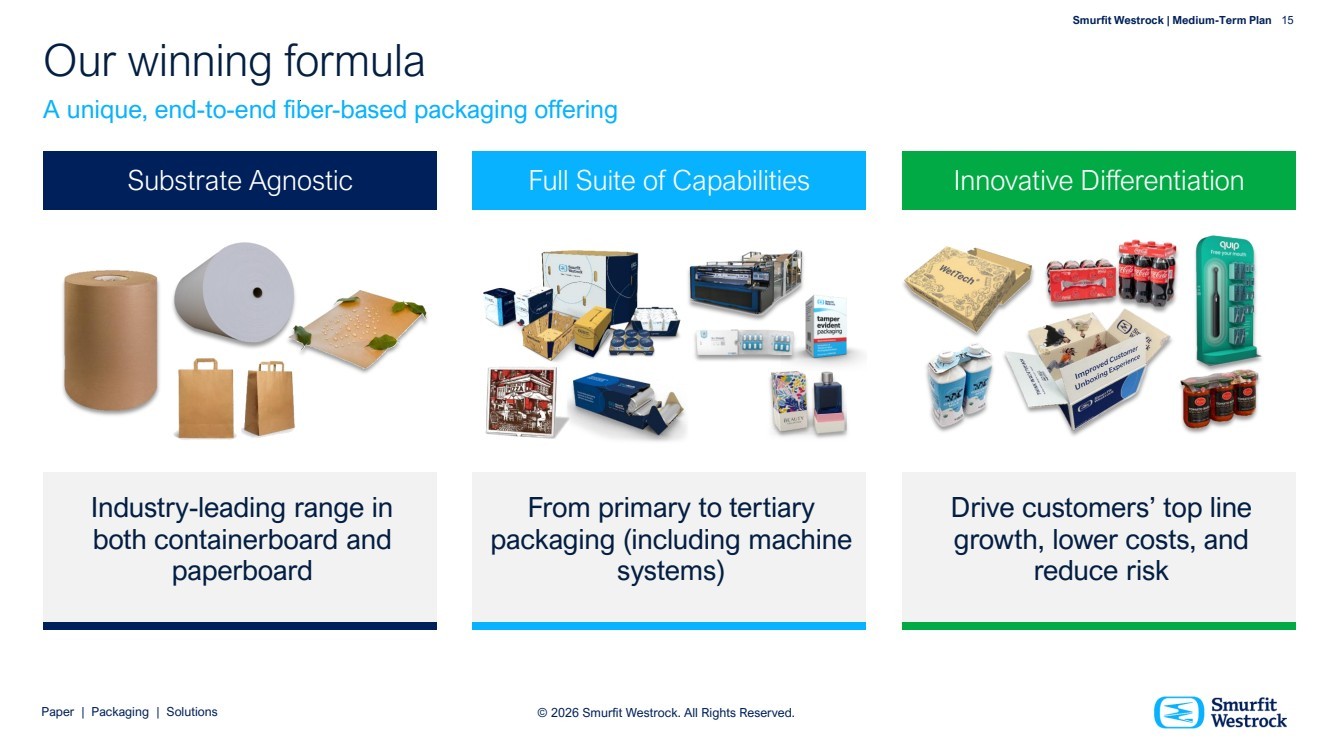
| Paper | Packaging | Solutions Smurfit Westrock | Medium-Term Plan 15 © 2026 Smurfit Westrock. All Rights Reserved. Industry-leading range in both containerboard and paperboard From primary to tertiary packaging (including machine systems) Drive customers’ top line growth, lower costs, and reduce risk Our winning formula A unique, end-to-end fiber-based packaging offering Substrate Agnostic Full Suite of Capabilities Innovative Differentiation |
| Paper | Packaging | Solutions Smurfit Westrock | Medium-Term Plan 16 Paper | Packaging | Solutions © 2026 Smurfit Westrock. All Rights Reserved. EMEA & APAC Track record of outperformance Smurfit Westrock | Medium-Term Plan 16 © 2026 Smurfit Westrock. All Rights Reserved. |
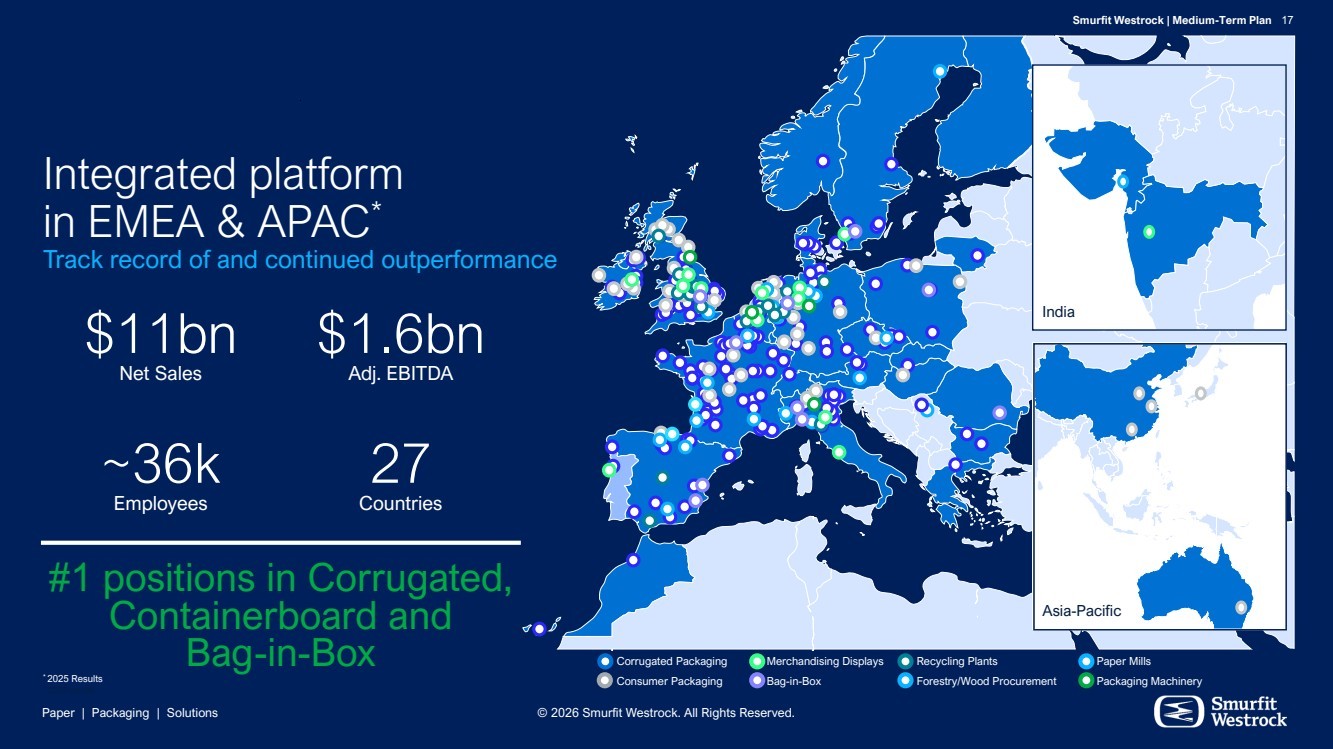
| Paper | Packaging | Solutions Smurfit Westrock | Medium-Term Plan 17 © 2026 Smurfit Westrock. All Rights Reserved. Integrated platform in EMEA & APAC* Track record of and continued outperformance * 2025 results $11bn Net Sales $1.6bn Adj. EBITDA ~36k Employees 27 Countries #1 positions in Corrugated, Containerboard and Bag-in-Box India Asia-Pacific Corrugated Packaging Merchandising Displays Recycling Plants Paper Mills Consumer Packaging Bag-in-Box Forestry/Wood Procurement Packaging Machinery * 2025 Results |
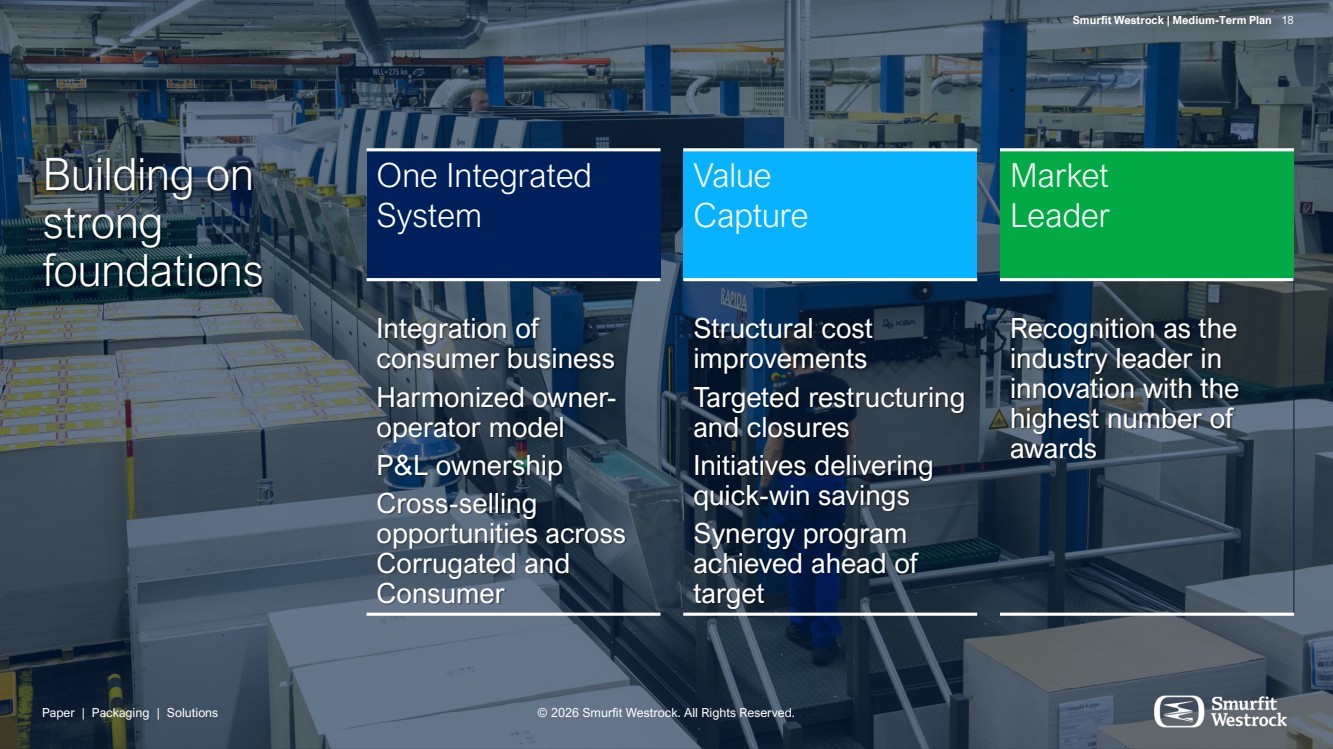
| Paper | Packaging | Solutions Smurfit Westrock | Medium-Term Plan 18 © 2026 Smurfit Westrock. All Rights Reserved. Building on strong foundations One Integrated System Value Capture Market Leader Integration of consumer business Harmonized owner-operator model P&L ownership Cross-selling opportunities across Corrugated and Consumer Structural cost improvements Targeted restructuring and closures Initiatives delivering quick-win savings Synergy program achieved ahead of target Recognition as the industry leader in innovation with the highest number of awards Paper | Packaging | Solutions © 2026 Smurfit Westrock. All Rights Reserved. Smurfit Westrock | Medium-Term Plan 18 |
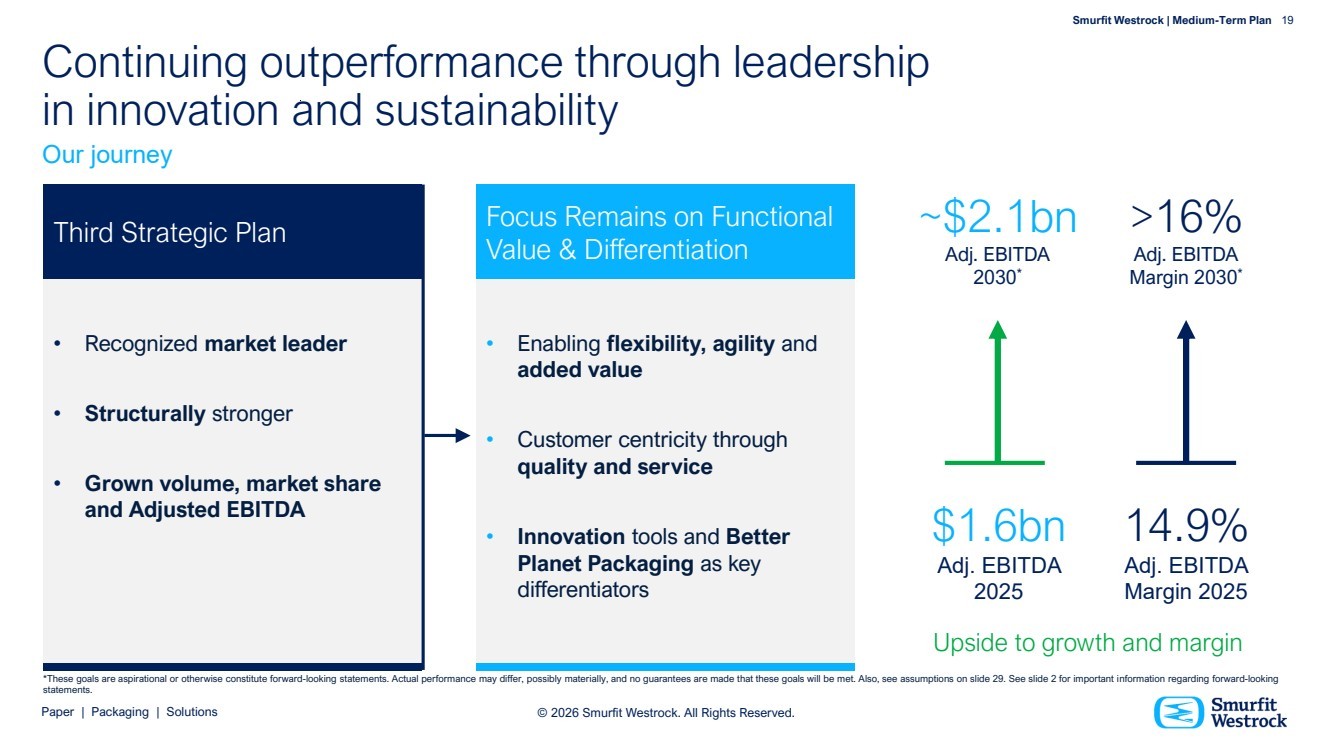
| Paper | Packaging | Solutions Smurfit Westrock | Medium-Term Plan 19 © 2026 Smurfit Westrock. All Rights Reserved. Continuing outperformance through leadership in innovation and sustainability • Recognized market leader • Structurally stronger • Grown volume, market share and Adjusted EBITDA • Enabling flexibility, agility and added value • Customer centricity through quality and service • Innovation tools and Better Planet Packaging as key differentiators Focus Remains on Functional Value & Differentiation Third Strategic Plan Our journey 14.9% Adj. EBITDA Margin 2025 >16% Adj. EBITDA Margin 2030* Upside to growth and margin $1.6bn Adj. EBITDA 2025 ~$2.1bn Adj. EBITDA 2030* *These goals are aspirational or otherwise constitute forward-looking statements. Actual performance may differ, possibly materially, and no guarantees are made that these goals will be met. Also, see assumptions on slide 29. See slide 2 for important information regarding forward-looking statements. |
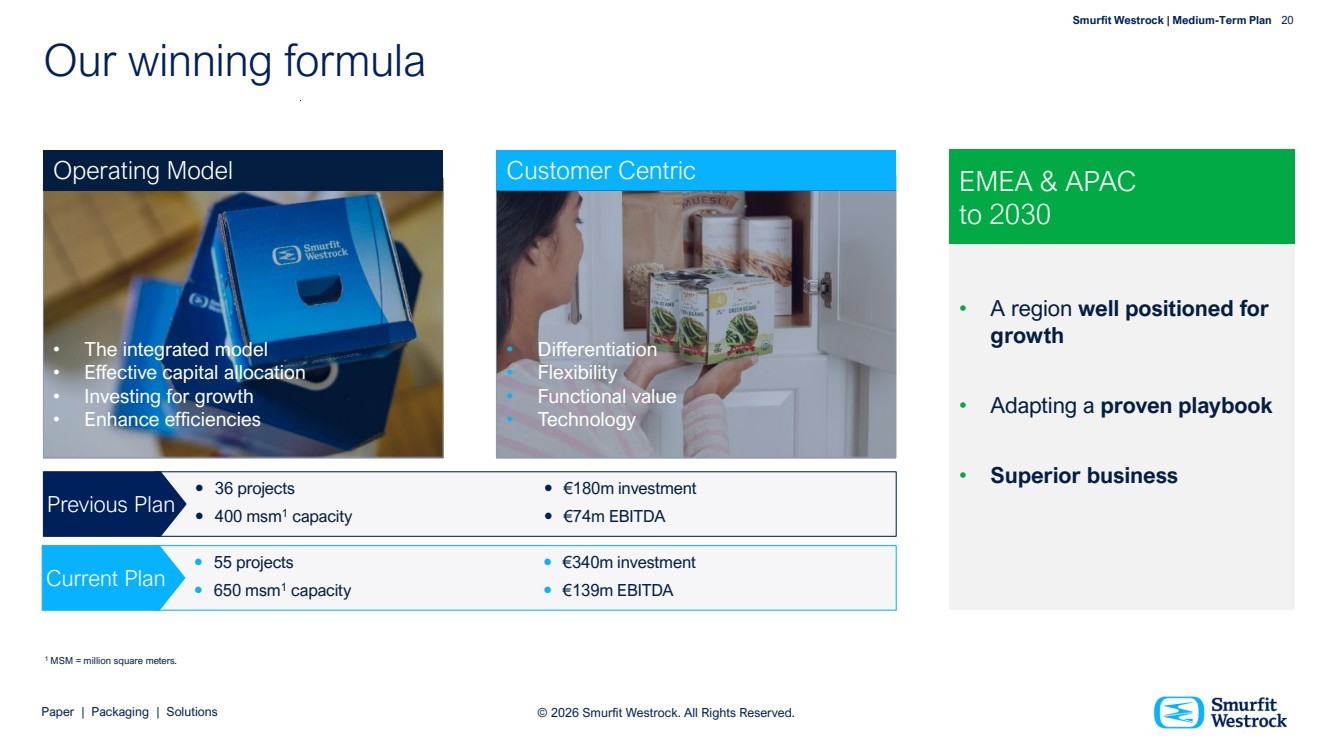
| Paper | Packaging | Solutions Smurfit Westrock | Medium-Term Plan 20 © 2026 Smurfit Westrock. All Rights Reserved. Operating Model Customer Centric • The integrated model • Effective capital allocation • Investing for growth • Enhance efficiencies • Differentiation • Flexibility • Functional value • Technology Our winning formula 55 projects 650 msm1 capacity €340m investment €139m EBITDA 36 projects 400 msm1 capacity €180m investment €74m EBITDA Previous Plan Current Plan 1 MSM = million square meters. • A region well positioned for growth • Adapting a proven playbook • Superior business EMEA & APAC to 2030 |
| Paper | Packaging | Solutions Smurfit Westrock | Medium-Term Plan 21 Paper | Packaging | Solutions © 2026 Smurfit Westrock. All Rights Reserved. Latin America Dynamic growth and superior margins © 2026 Smurfit Westrock. All Rights Reserved. Smurfit Westrock | Medium-Term Plan 21 |
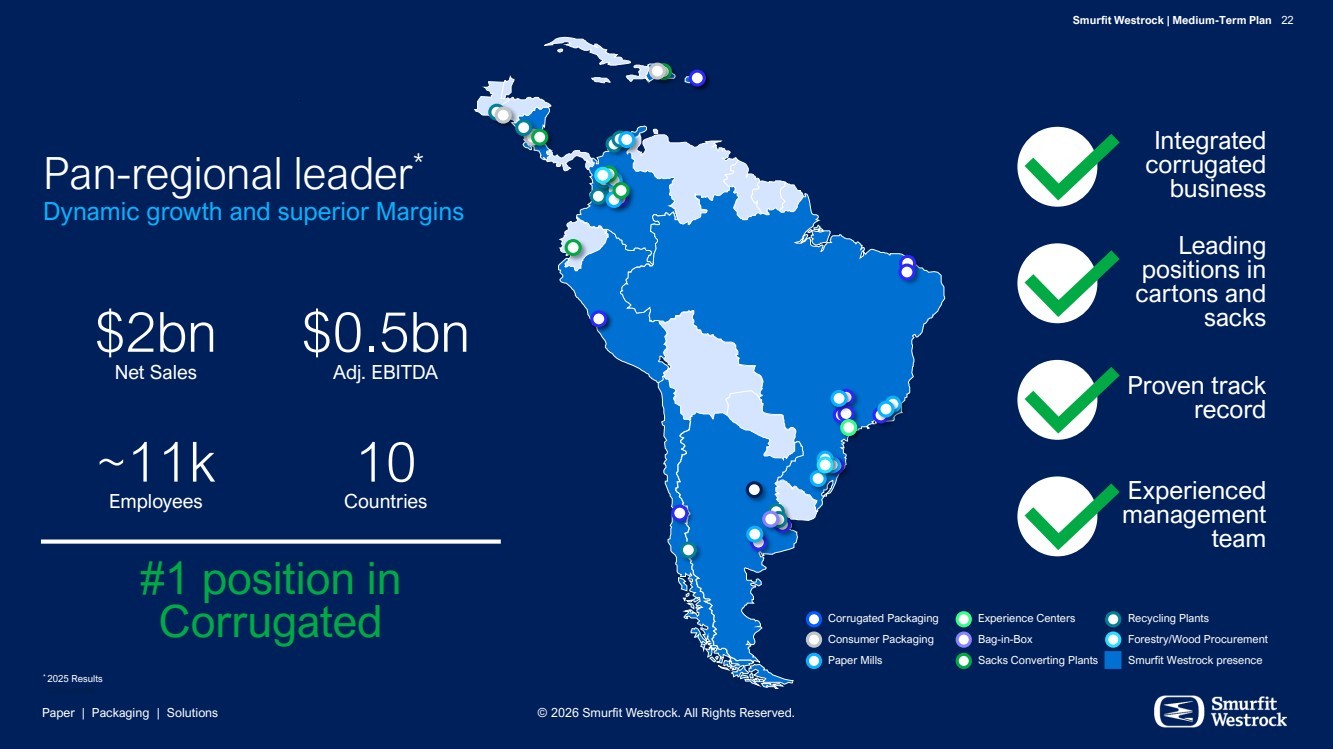
| Paper | Packaging | Solutions Smurfit Westrock | Medium-Term Plan 22 © 2026 Smurfit Westrock. All Rights Reserved. Pan-regional leader* Dynamic growth and superior Margins * 2025 results Corrugated Packaging Experience Centers Recycling Plants Consumer Packaging Bag-in-Box Forestry/Wood Procurement Paper Mills Sacks Converting Plants Smurfit Westrock presence $2bn Net Sales $0.5bn Adj. EBITDA ~11k Employees 10 Countries #1 position in Corrugated Leading positions in cartons and sacks Proven track record Experienced management team Integrated corrugated business * 2025 Results |
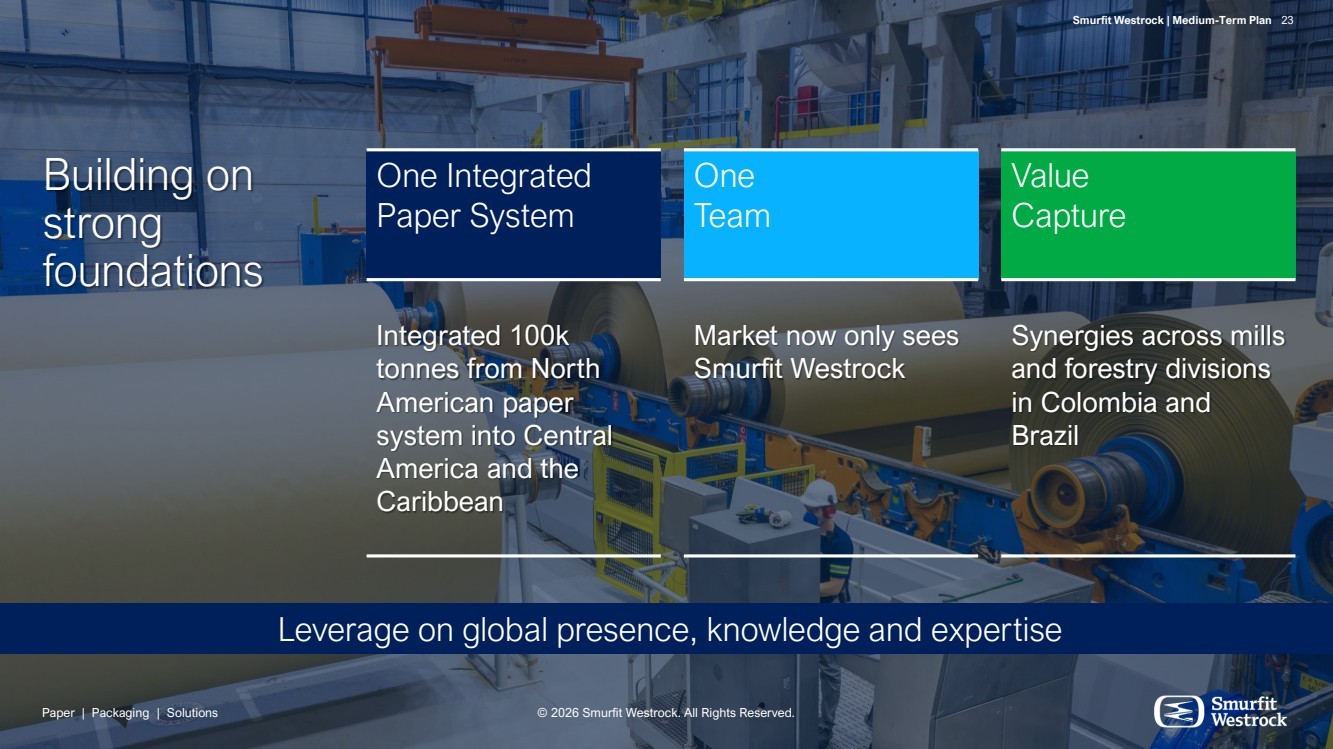
| Paper | Packaging | Solutions Smurfit Westrock | Medium-Term Plan 23 © 2026 Smurfit Westrock. All Rights Reserved. Building on strong foundations One Integrated Paper System One Team Value Capture Integrated 100k tonnes from North American paper system into Central America and the Caribbean Market now only sees Smurfit Westrock Synergies across mills and forestry divisions in Colombia and Brazil Paper | Packaging | Solutions © 2026 Smurfit Westrock. All Rights Reserved. Smurfit Westrock | Medium-Term Plan 23 Leverage on global presence, knowledge and expertise |
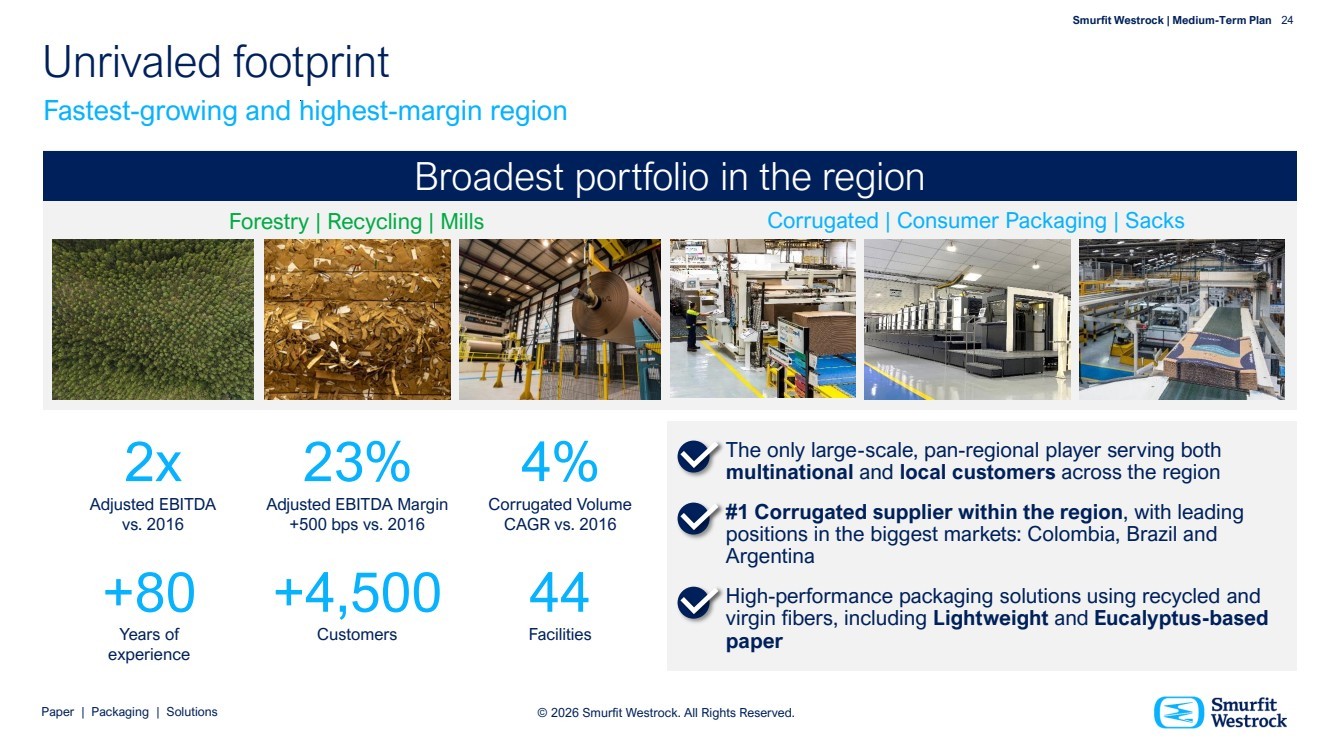
| Paper | Packaging | Solutions Smurfit Westrock | Medium-Term Plan 24 © 2026 Smurfit Westrock. All Rights Reserved. Broadest portfolio in the region Unrivaled footprint The only large-scale, pan-regional player serving both multinational and local customers across the region #1 Corrugated supplier within the region, with leading positions in the biggest markets: Colombia, Brazil and Argentina High-performance packaging solutions using recycled and virgin fibers, including Lightweight and Eucalyptus-based paper Forestry | Recycling | Mills Corrugated | Consumer Packaging | Sacks 2x Adjusted EBITDA vs. 2016 23% Adjusted EBITDA Margin +500 bps vs. 2016 4% Corrugated Volume CAGR vs. 2016 +80 Years of experience +4,500 Customers 44 Facilities Fastest-growing and highest-margin region |
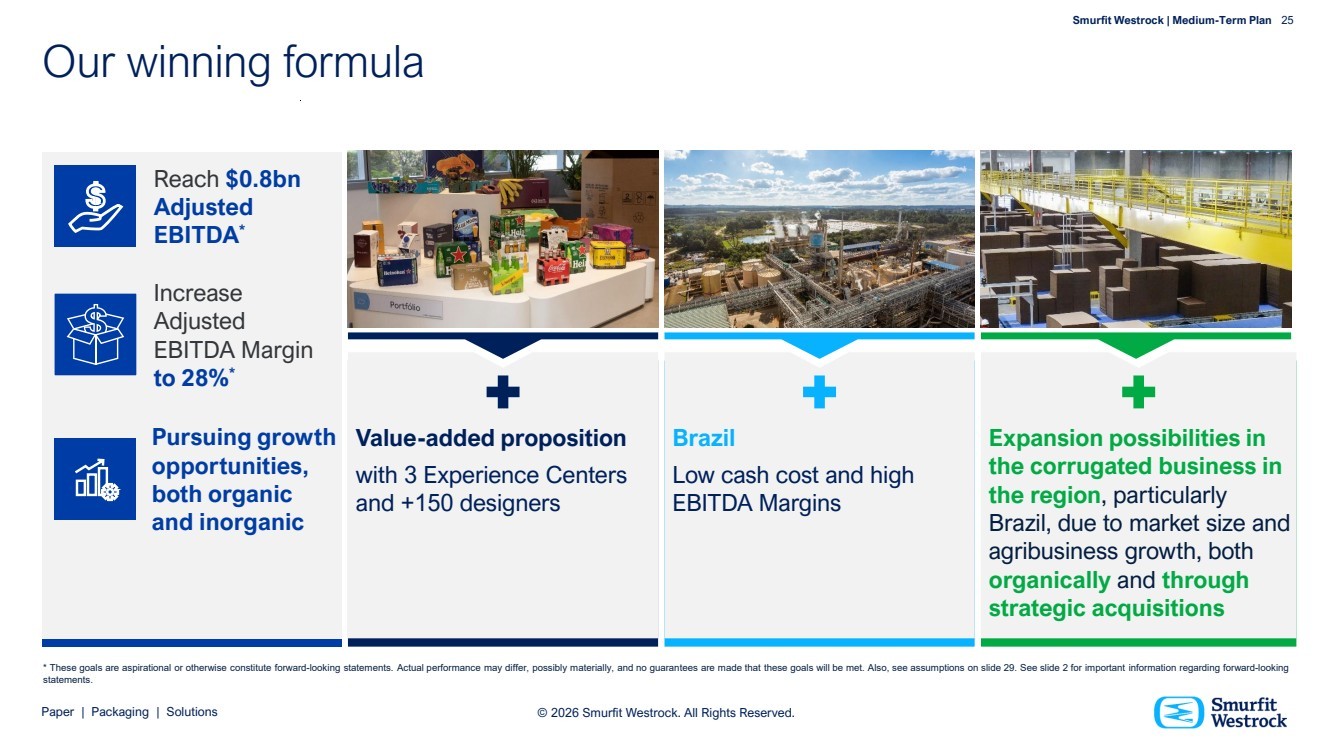
| Paper | Packaging | Solutions Smurfit Westrock | Medium-Term Plan 25 © 2026 Smurfit Westrock. All Rights Reserved. Our winning formula Value-added proposition with 3 Experience Centers and +150 designers Brazil Low cash cost and high EBITDA Margins Expansion possibilities in the corrugated business in the region, particularly Brazil, due to market size and agribusiness growth, both organically and through strategic acquisitions Reach $0.8bn Adjusted EBITDA* Pursuing growth opportunities, both organic and inorganic Increase Adjusted EBITDA Margin to 28%* * These goals are aspirational or otherwise constitute forward-looking statements. Actual performance may differ, possibly materially, and no guarantees are made that these goals will be met. Also, see assumptions on slide 29. See slide 2 for important information regarding forward-looking statements. |
| Paper | Packaging | Solutions © 2025 Smurfit Westrock. All Rights Reserved. Smurfit Westrock | Medium-Term Plan 26 Our accelerated path to delivering shareholder value Paper | Packaging | Solutions Smurfit Westrock | Medium-Term Plan 26 © 2026 Smurfit Westrock. All Rights Reserved. |
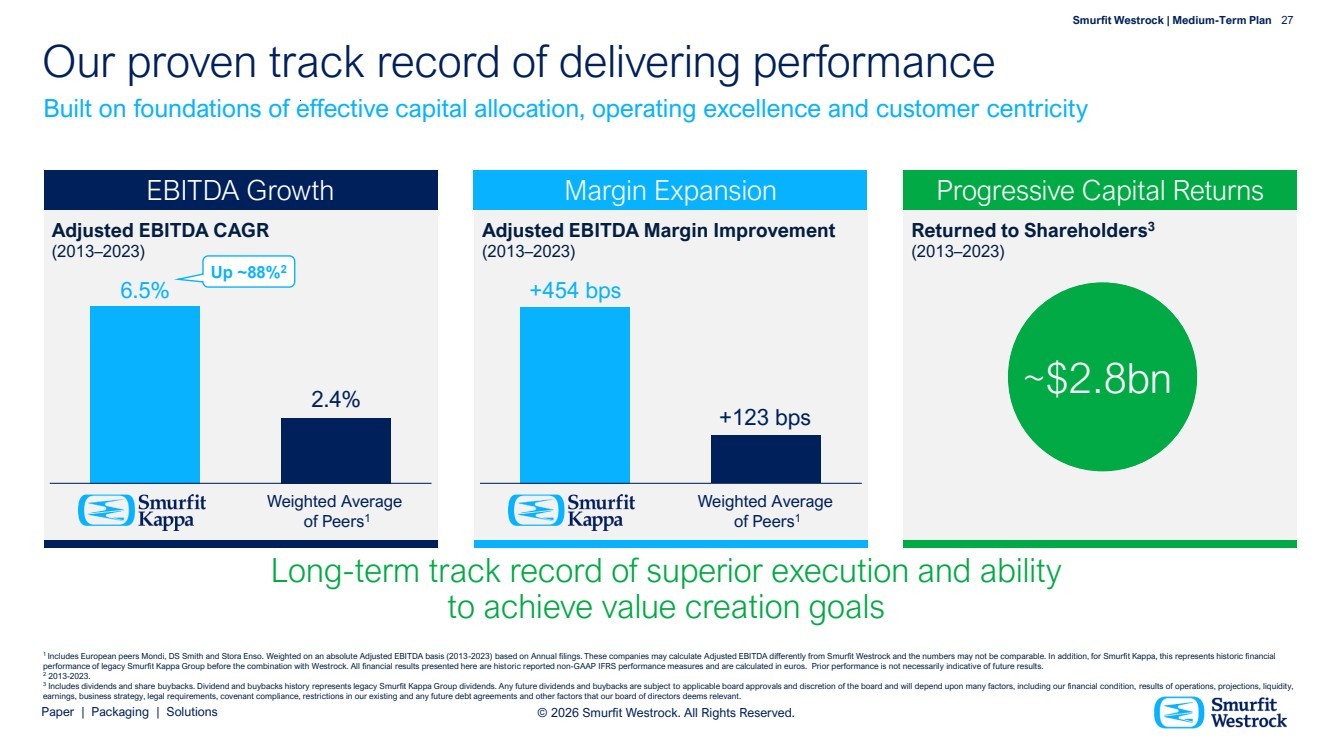
| Paper | Packaging | Solutions Smurfit Westrock | Medium-Term Plan 27 © 2026 Smurfit Westrock. All Rights Reserved. Our proven track record of delivering performance Built on foundations of effective capital allocation, operating excellence and customer centricity Adjusted EBITDA CAGR (2013–2023) Adjusted EBITDA Margin Improvement (2013–2023) EBITDA Growth Margin Expansion Returned to Shareholders3 (2013–2023) Progressive Capital Returns ~$2.8bn 6.5% 2.4% +454 bps +123 bps Weighted Average of Peers1 Up ~88%2 Weighted Average of Peers1 Long-term track record of superior execution and ability to achieve value creation goals 1 Includes European peers Mondi, DS Smith and Stora Enso. Weighted on an absolute Adjusted EBITDA basis (2013-2023) based on Annual filings. These companies may calculate Adjusted EBITDA differently from Smurfit Westrock and the numbers may not be comparable. In addition, for Smurfit Kappa, this represents historic financial performance of legacy Smurfit Kappa Group before the combination with Westrock. All financial results presented here are historic reported non-GAAP IFRS performance measures and are calculated in euros. Prior performance is not necessarily indicative of future results. 2 2013-2023. 3 Includes dividends and share buybacks. Dividend and buybacks history represents legacy Smurfit Kappa Group dividends. Any future dividends and buybacks are subject to applicable board approvals and discretion of the board and will depend upon many factors, including our financial condition, results of operations, projections, liquidity, earnings, business strategy, legal requirements, covenant compliance, restrictions in our existing and any future debt agreements and other factors that our board of directors deems relevant. |
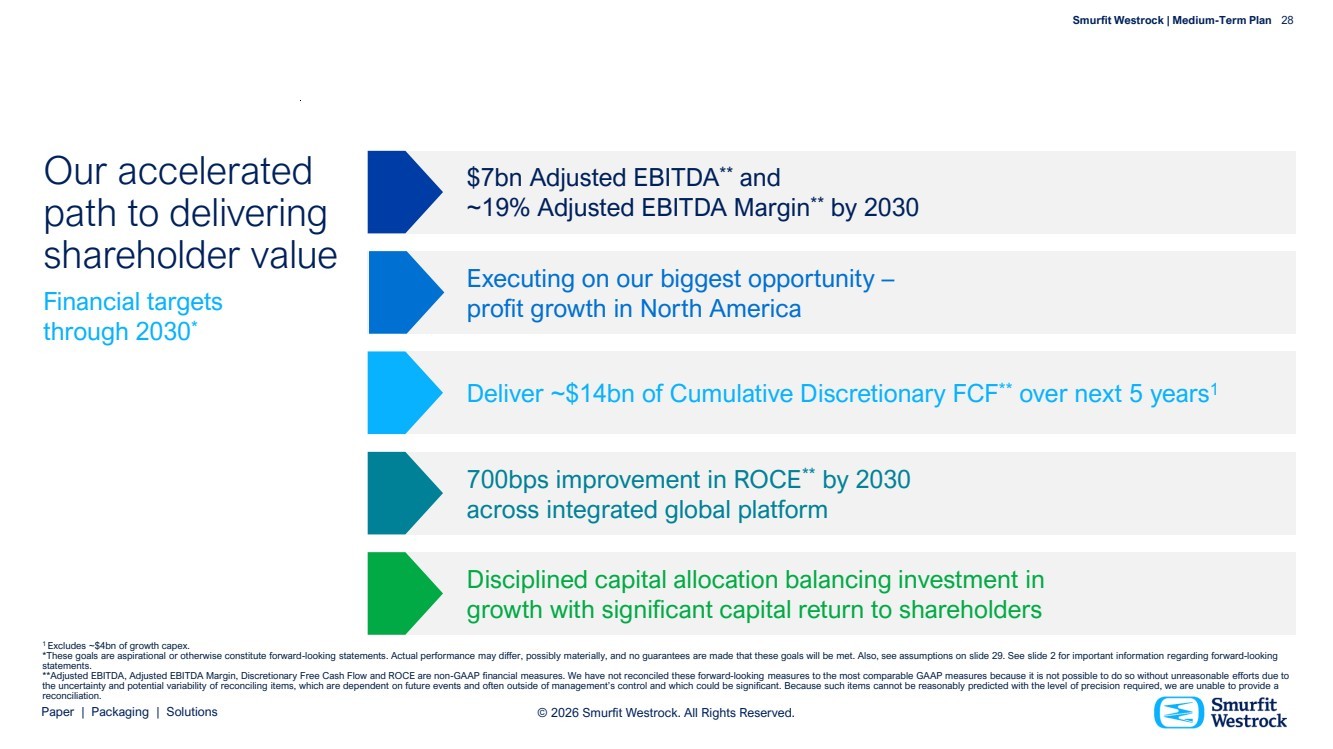
| Paper | Packaging | Solutions Smurfit Westrock | Medium-Term Plan 28 © 2026 Smurfit Westrock. All Rights Reserved. Our accelerated path to delivering shareholder value Financial targets through 2030* 700bps improvement in ROCE** by 2030 across integrated global platform Disciplined capital allocation balancing investment in growth with significant capital return to shareholders Deliver ~$14bn of Cumulative Discretionary FCF** over next 5 years1 $7bn Adjusted EBITDA** and ~19% Adjusted EBITDA Margin** by 2030 Executing on our biggest opportunity – profit growth in North America 1 Excludes ~$4bn of growth capex. *These goals are aspirational or otherwise constitute forward-looking statements. Actual performance may differ, possibly materially, and no guarantees are made that these goals will be met. Also, see assumptions on slide 29. See slide 2 for important information regarding forward-looking statements. **Adjusted EBITDA, Adjusted EBITDA Margin, Discretionary Free Cash Flow and ROCE are non-GAAP financial measures. We have not reconciled these forward-looking measures to the most comparable GAAP measures because it is not possible to do so without unreasonable efforts due to the uncertainty and potential variability of reconciling items, which are dependent on future events and often outside of management’s control and which could be significant. Because such items cannot be reasonably predicted with the level of precision required, we are unable to provide a reconciliation. |
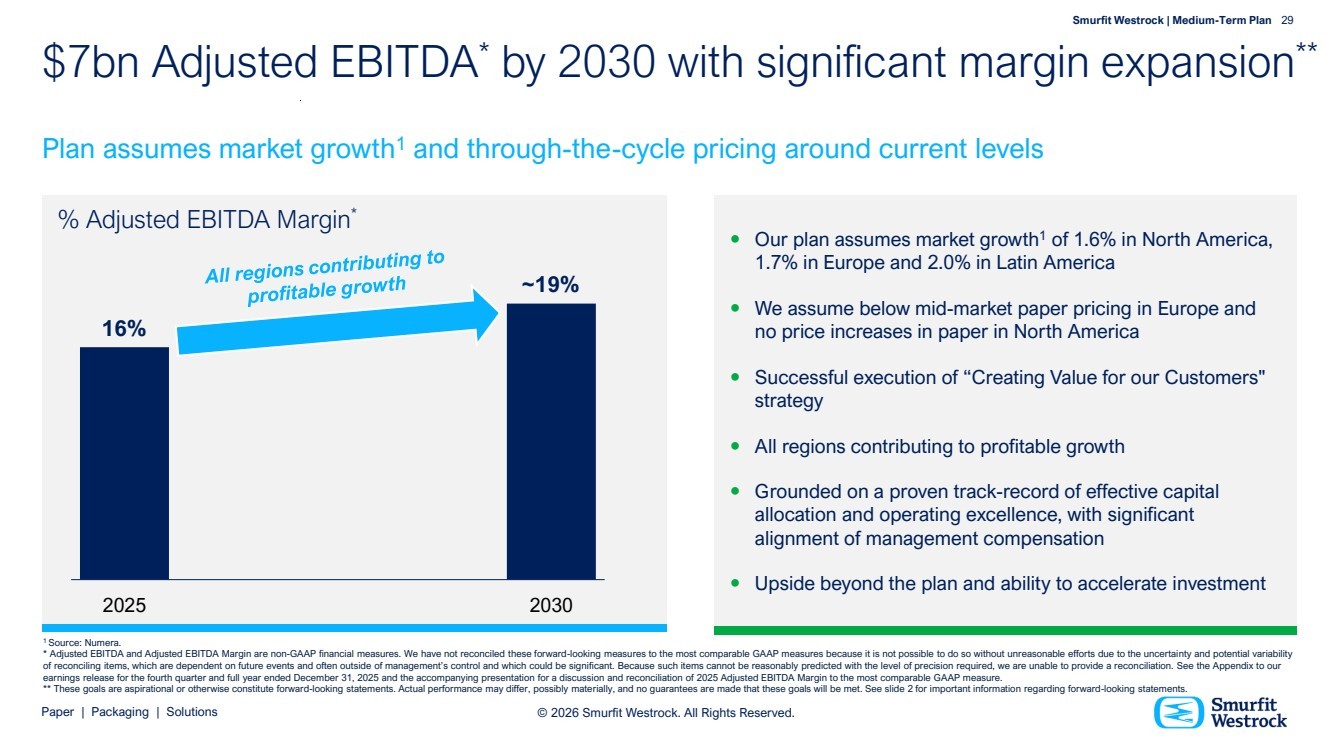
| Paper | Packaging | Solutions Smurfit Westrock | Medium-Term Plan 29 © 2026 Smurfit Westrock. All Rights Reserved. % Adjusted EBITDA Margin* $7bn Adjusted EBITDA* by 2030 with significant margin expansion** Plan assumes market growth1 and through-the-cycle pricing around current levels Our plan assumes market growth1 of 1.6% in North America, 1.7% in Europe and 2.0% in Latin America We assume below mid-market paper pricing in Europe and no price increases in paper in North America Successful execution of “Creating Value for our Customers" strategy All regions contributing to profitable growth Grounded on a proven track-record of effective capital allocation and operating excellence, with significant alignment of management compensation Upside beyond the plan and ability to accelerate investment 16% ~19% 2025 2030 1 Source: Numera. * Adjusted EBITDA and Adjusted EBITDA Margin are non-GAAP financial measures. We have not reconciled these forward-looking measures to the most comparable GAAP measures because it is not possible to do so without unreasonable efforts due to the uncertainty and potential variability of reconciling items, which are dependent on future events and often outside of management’s control and which could be significant. Because such items cannot be reasonably predicted with the level of precision required, we are unable to provide a reconciliation. See the Appendix to our earnings release for the fourth quarter and full year ended December 31, 2025 and the accompanying presentation for a discussion and reconciliation of 2025 Adjusted EBITDA Margin to the most comparable GAAP measure. ** These goals are aspirational or otherwise constitute forward-looking statements. Actual performance may differ, possibly materially, and no guarantees are made that these goals will be met. See slide 2 for important information regarding forward-looking statements. |
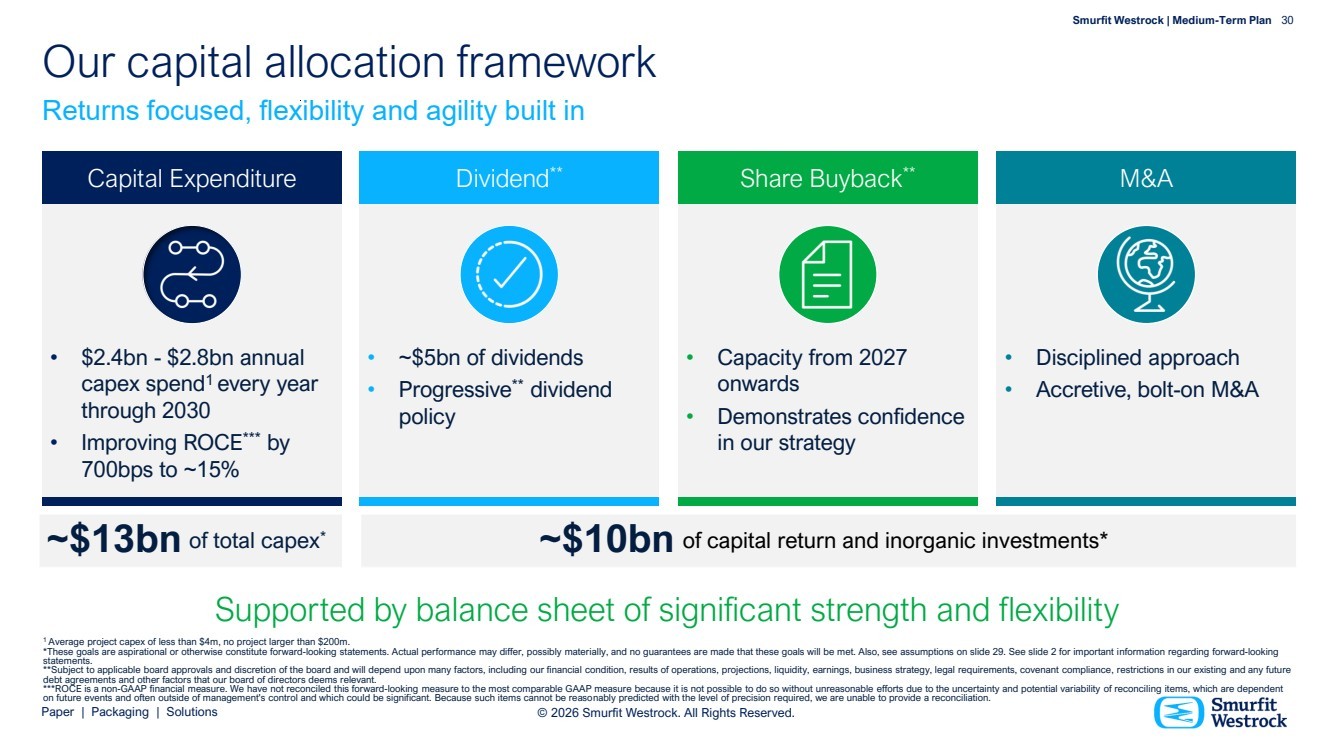
| Paper | Packaging | Solutions Smurfit Westrock | Medium-Term Plan 30 © 2026 Smurfit Westrock. All Rights Reserved. of total capex of capital return and inorganic investments* * Our capital allocation framework Returns focused, flexibility and agility built in • $2.4bn - $2.8bn annual capex spend1 every year through 2030 • Improving ROCE*** by 700bps to ~15% • ~$5bn of dividends • Progressive** dividend policy • Capacity from 2027 onwards • Demonstrates confidence in our strategy Dividend Capital Expenditure ** Share Buyback** • Disciplined approach • Accretive, bolt-on M&A M&A Supported by balance sheet of significant strength and flexibility ~$13bn ~$10bn 1 Average project capex of less than $4m, no project larger than $200m. *These goals are aspirational or otherwise constitute forward-looking statements. Actual performance may differ, possibly materially, and no guarantees are made that these goals will be met. Also, see assumptions on slide 29. See slide 2 for important information regarding forward-looking statements. **Subject to applicable board approvals and discretion of the board and will depend upon many factors, including our financial condition, results of operations, projections, liquidity, earnings, business strategy, legal requirements, covenant compliance, restrictions in our existing and any future debt agreements and other factors that our board of directors deems relevant. ***ROCE is a non-GAAP financial measure. We have not reconciled this forward-looking measure to the most comparable GAAP measure because it is not possible to do so without unreasonable efforts due to the uncertainty and potential variability of reconciling items, which are dependent on future events and often outside of management's control and which could be significant. Because such items cannot be reasonably predicted with the level of precision required, we are unable to provide a reconciliation. |
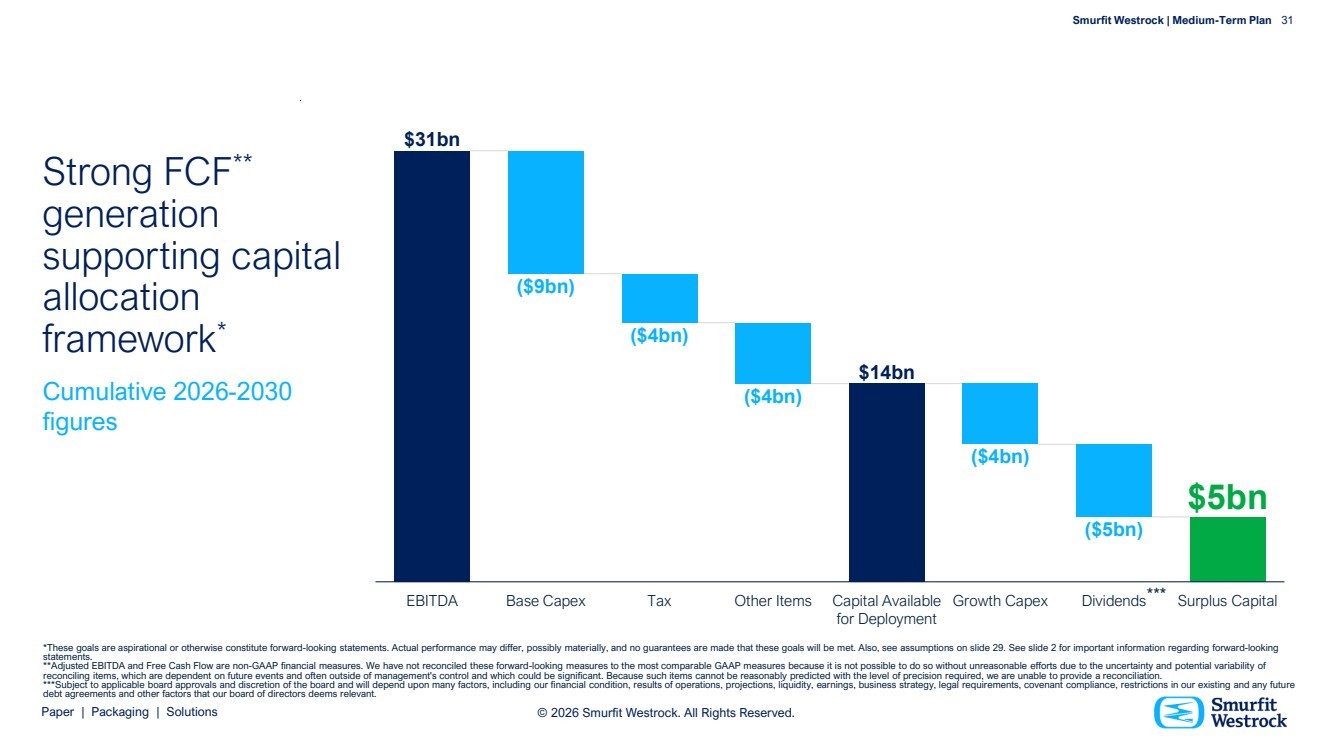
| Paper | Packaging | Solutions Smurfit Westrock | Medium-Term Plan 31 © 2026 Smurfit Westrock. All Rights Reserved. Strong FCF** generation supporting capital allocation framework* Cumulative 2026-2030 figures $31bn ($9bn) ($4bn) ($4bn) $14bn ($4bn) ($5bn) $5bn EBITDA Base Capex Tax Other Items Capital Available for Deployment Growth Capex Dividends Surplus Capital *These goals are aspirational or otherwise constitute forward-looking statements. Actual performance may differ, possibly materially, and no guarantees are made that these goals will be met. Also, see assumptions on slide 29. See slide 2 for important information regarding forward-looking statements. **Adjusted EBITDA and Free Cash Flow are non-GAAP financial measures. We have not reconciled these forward-looking measures to the most comparable GAAP measures because it is not possible to do so without unreasonable efforts due to the uncertainty and potential variability of reconciling items, which are dependent on future events and often outside of management's control and which could be significant. Because such items cannot be reasonably predicted with the level of precision required, we are unable to provide a reconciliation. ***Subject to applicable board approvals and discretion of the board and will depend upon many factors, including our financial condition, results of operations, projections, liquidity, earnings, business strategy, legal requirements, covenant compliance, restrictions in our existing and any future debt agreements and other factors that our board of directors deems relevant. *** |
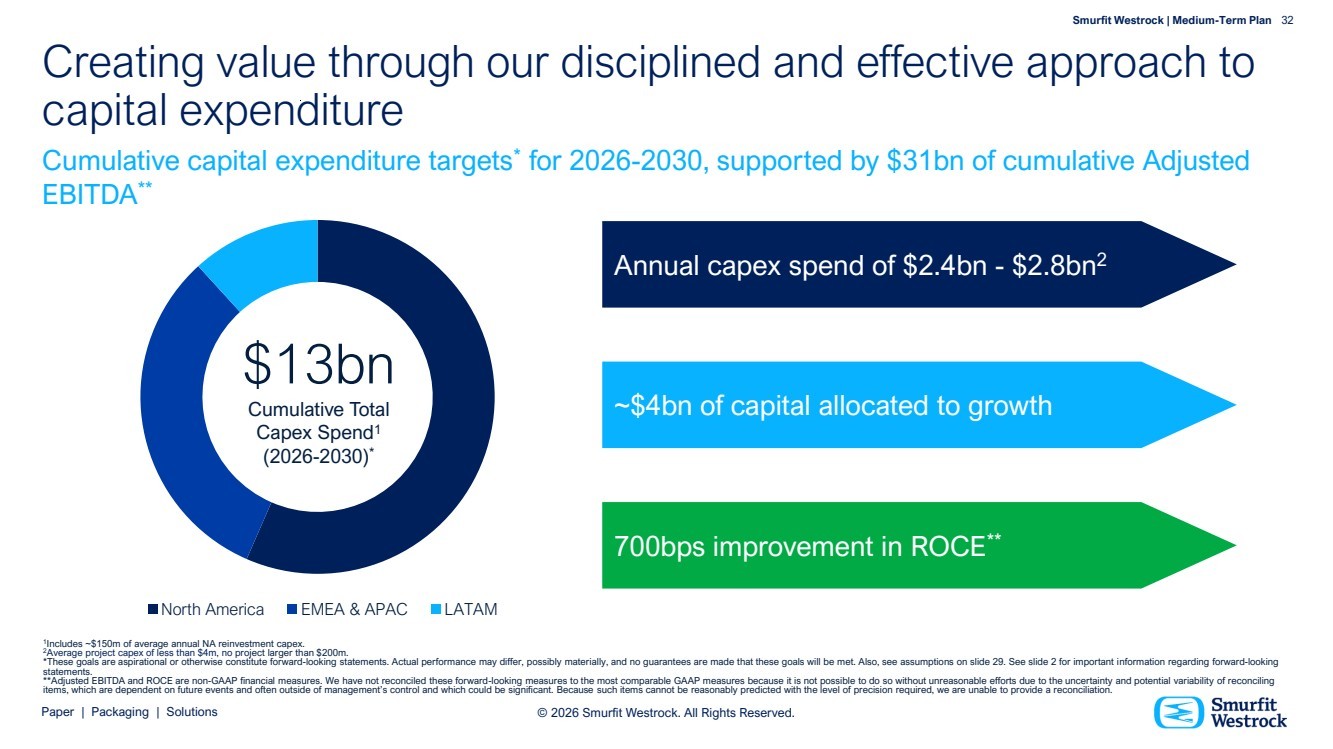
| Paper | Packaging | Solutions Smurfit Westrock | Medium-Term Plan 32 © 2026 Smurfit Westrock. All Rights Reserved. Annual capex spend of $2.4bn - $2.8bn2 ~$4bn of capital allocated to growth 700bps improvement in ROCE** Creating value through our disciplined and effective approach to capital expenditure Cumulative capital expenditure targets* for 2026-2030, supported by $31bn of cumulative Adjusted EBITDA** North America EMEA & APAC LATAM $13bn Cumulative Total Capex Spend1 (2026-2030)* 1 Includes ~$150m of average annual NA reinvestment capex. 2Average project capex of less than $4m, no project larger than $200m. *These goals are aspirational or otherwise constitute forward-looking statements. Actual performance may differ, possibly materially, and no guarantees are made that these goals will be met. Also, see assumptions on slide 29. See slide 2 for important information regarding forward-looking statements. **Adjusted EBITDA and ROCE are non-GAAP financial measures. We have not reconciled these forward-looking measures to the most comparable GAAP measures because it is not possible to do so without unreasonable efforts due to the uncertainty and potential variability of reconciling items, which are dependent on future events and often outside of management’s control and which could be significant. Because such items cannot be reasonably predicted with the level of precision required, we are unable to provide a reconciliation. |
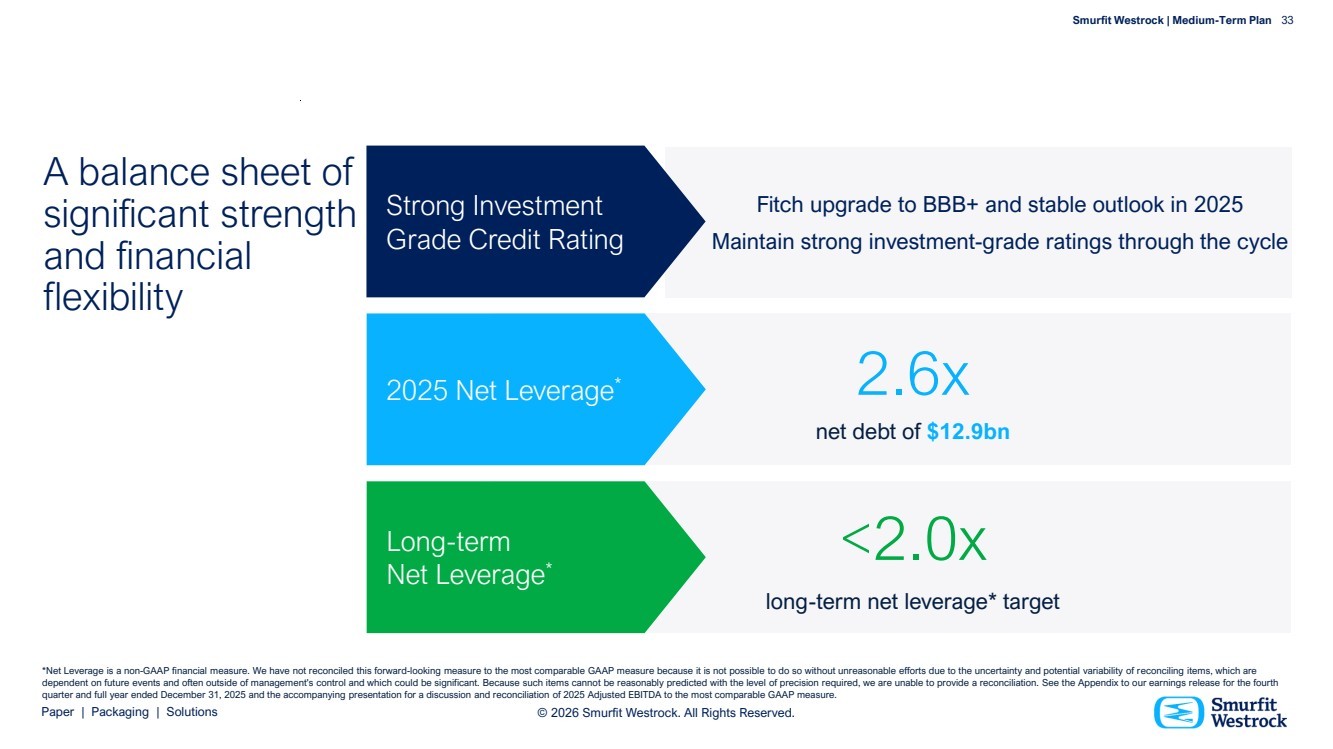
| Paper | Packaging | Solutions Smurfit Westrock | Medium-Term Plan 33 © 2026 Smurfit Westrock. All Rights Reserved. A balance sheet of significant strength and financial flexibility Fitch upgrade to BBB+ and stable outlook in 2025 Maintain strong investment-grade ratings through the cycle Strong Investment Grade Credit Rating 2.6x net debt of $12.9bn 2025 Net Leverage* <2.0x long-term net leverage* target Long-term Net Leverage* *Net Leverage is a non-GAAP financial measure. We have not reconciled this forward-looking measure to the most comparable GAAP measure because it is not possible to do so without unreasonable efforts due to the uncertainty and potential variability of reconciling items, which are dependent on future events and often outside of management's control and which could be significant. Because such items cannot be reasonably predicted with the level of precision required, we are unable to provide a reconciliation. See the Appendix to our earnings release for the fourth quarter and full year ended December 31, 2025 and the accompanying presentation for a discussion and reconciliation of 2025 Adjusted EBITDA to the most comparable GAAP measure. |
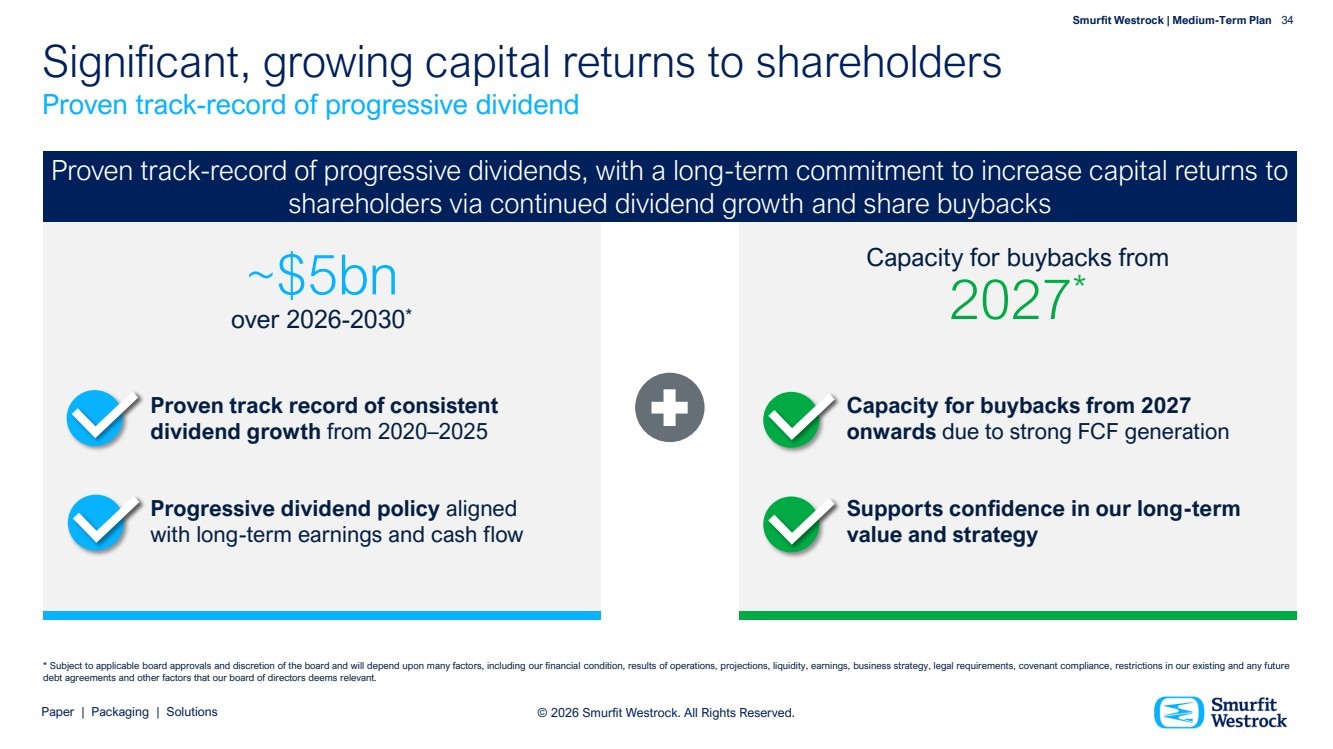
| Paper | Packaging | Solutions Smurfit Westrock | Medium-Term Plan 34 © 2026 Smurfit Westrock. All Rights Reserved. Significant, growing capital returns to shareholders Proven track-record of progressive dividend Proven track record of consistent dividend growth from 2020–2025 Progressive dividend policy aligned with long-term earnings and cash flow Capacity for buybacks from 2027 onwards due to strong FCF generation Supports confidence in our long-term value and strategy Proven track-record of progressive dividends, with a long-term commitment to increase capital returns to shareholders via continued dividend growth and share buybacks ~$5bn over 2026-2030* Capacity for buybacks from 2027* * Subject to applicable board approvals and discretion of the board and will depend upon many factors, including our financial condition, results of operations, projections, liquidity, earnings, business strategy, legal requirements, covenant compliance, restrictions in our existing and any future debt agreements and other factors that our board of directors deems relevant. |
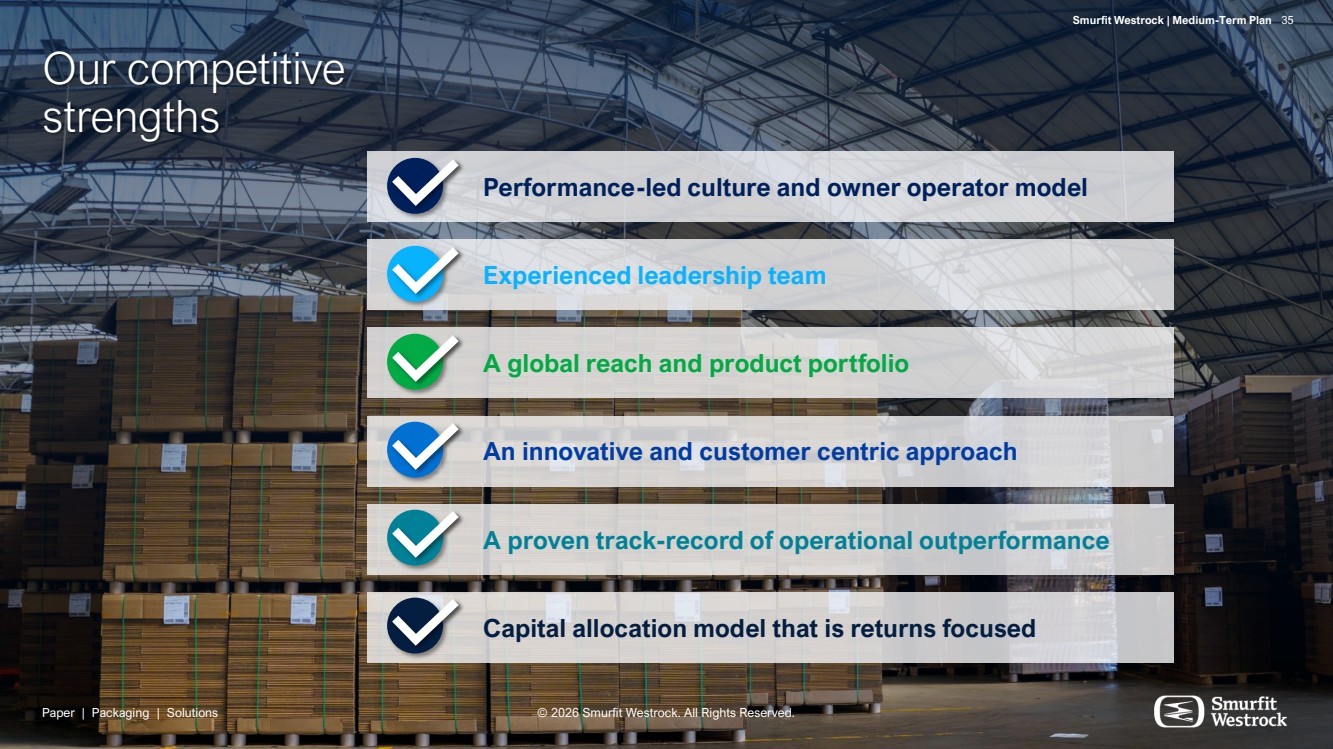
| Paper | Packaging | Solutions Smurfit Westrock | Medium-Term Plan 35 © 2026 Smurfit Westrock. All Rights Reserved. Our competitive strengths An innovative and customer centric approach A global reach and product portfolio A proven track-record of operational outperformance Experienced leadership team Performance-led culture and owner operator model Capital allocation model that is returns focused Paper | Packaging | Solutions © 2026 Smurfit Westrock. All Rights Reserved. Smurfit Westrock | Medium-Term Plan 35 |
| Paper | Packaging | Solutions Smurfit Westrock | Medium-Term Plan 36 © 2026 Smurfit Westrock. All Rights Reserved. In summary We are well positioned to deliver on this plan. Smurfit Westrock has: • 90 years of history • A proven operating model • A resilient business • An unrivalled product portfolio • A world class management team, aligned with shareholders • A proven track-record of successful transformational deals • Incremental opportunities identified beyond the plan Right team, right product, right time. Smurfit Westrock | Medium-Term Plan 36 Paper | Packaging | Solutions © 2026 Smurfit Westrock. All Rights Reserved. |
| Paper | Packaging | Solutions Smurfit Westrock | Medium-Term Plan 37 Thank you © 2026 Smurfit Westrock. All Rights Reserved. |

| Paper | Packaging | Solutions Smurfit Westrock | Medium-Term Plan 38 |