UNITED STATES
SECURITIES AND EXCHANGE COMMISSION
Washington, D.C. 20549
FORM
CERTIFIED SHAREHOLDER REPORT OF REGISTERED MANAGEMENT
INVESTMENT COMPANIES
Investment Company Act file number 811-23924
(Exact name of registrant as specified in charter)
128 S Tryon St., Suite 1600
Charlotte, NC 28202
(Address of principal executive offices) (Zip code)
Robert W. Long
Chief Executive Officer
StepStone Group Private Wealth LLC
128 S Tryon St., Suite 1600
Charlotte, NC 28202
(Name and address of agent for service)
Registrant’s telephone number, including area code: (704) 215-4300
Date of fiscal year end: December 31
Date of reporting period:
ITEM 1. REPORTS TO STOCKHOLDERS.
(a) The Report to Shareholders is attached herewith.
StepStone Private Credit Income Fund
Consolidated Financial Statements
For the Year Ended December 31, 2025
Annual Report
StepStone Private Credit Income Fund
Table of Contents
For the Year Ended December 31, 2025
1
StepStone Private Credit Income Fund
Management's Discussion of Fund Performance (unaudited)
December 31, 2025
Introduction
StepStone Private Credit Income Fund (“CRDEX” or the “Fund”) is a private credit, direct lending solution that seeks to generate current income and, to a lesser extent, long-term capital appreciation. The Fund launched in June 2024 and maintains a strategy of investing in private credit assets via direct loans, specialty credit, and investment funds. CRDEX offers access to top-tier private credit investments with exposure that varies across sectors, markets, investment partners and borrowers with a focus on managing risk and targeting attractive risk-adjusted returns.
Designed specifically for individual investors and small institutions, CRDEX’s investor-centric structure emphasizes convenience, efficiency and transparency. As an evergreen fund, CRDEX raises capital daily while providing liquidity through quarterly repurchase offers. There are no ongoing capital calls. Investors will receive dividend distributions, and tax reporting is provided via Form 1099.
Investment Activity, Performance1 and Benchmark
As of December 31, 2025, the Fund has invested in 2,820 positions with 1,800 borrowers and reached assets under management of $1.0 billion. We are pleased to report that CRDEX (Class I) generated a total return of 9.50% for the year ended December 31, 2025, outpacing the Morningstar LSTA US Leveraged Loan2 and Bloomberg US Aggregate Bond2 indexes, CRDEX’s primary benchmarks, which reported gains of 5.90% and 7.30%, respectively, during the same period.
The Fund deploys capital daily into direct lending and specialty credit strategies primarily through private investments in secured debt securities. Interest income totaled approximately $111.6 million for the year ended December 31, 2025, and was the primary driver of the Fund’s total return.
Contributions to the Fund’s performance were led by exposure to direct lending and specialty credit floating rate debt securities. There were no material detractors from the Fund’s performance over the period.
Liquidity and Share Repurchases
We believe CRDEX has ample liquidity to meet its obligations and is well-positioned to execute on investment opportunities in 2026. As of December 31, 2025, CRDEX has $175.2 million available to be drawn under its aggregate $512.5 million credit facilities.
During fiscal year 2025, CRDEX conducted its quarterly share repurchases, allowing for the repurchase of between 5% and 25% of outstanding shares. These repurchases, completed on a quarterly basis, represented 1.74% or less of shares outstanding in each quarter during the year ended December 31, 2025. Over this period, the Fund made four repurchase offers, resulting in 2,188,314 shares being repurchased for a total of $22,431,827.
Investment Approach
CRDEX seeks to offer investors access to a broadly diversified private credit strategy focused on senior secured direct lending, using a multi-lender approach, whereby the adviser utilizes a variety of investment partners to source investment opportunities for the Fund.
This commentary reflects the viewpoints of StepStone Group Private Wealth LLC as of December 31, 2025 and is not intended as a forecast or guarantee of future results.
| Average Annual Total Returns as of December 31, 20251 | ||||||||
| 1 Year | Since Inception3 | |||||||
| StepStone Private Credit Income Fund, Class I | 9.50 | % | 14.82 | % | ||||
| StepStone Private Credit Income Fund, Class D | 9.36 | % | 14.68 | % | ||||
| StepStone Private Credit Income Fund, Class S | 8.88 | % | 14.18 | % | ||||
| Morningstar LSTA US Leveraged Loan Index2 | 5.90 | % | 10.91 | % | ||||
| Bloomberg US Aggregate Bond Index2 | 7.30 | % | 10.46 | % | ||||
2
StepStone Private Credit Income Fund
Management's Discussion of Fund Performance (unaudited) (continued)
December 31, 2025
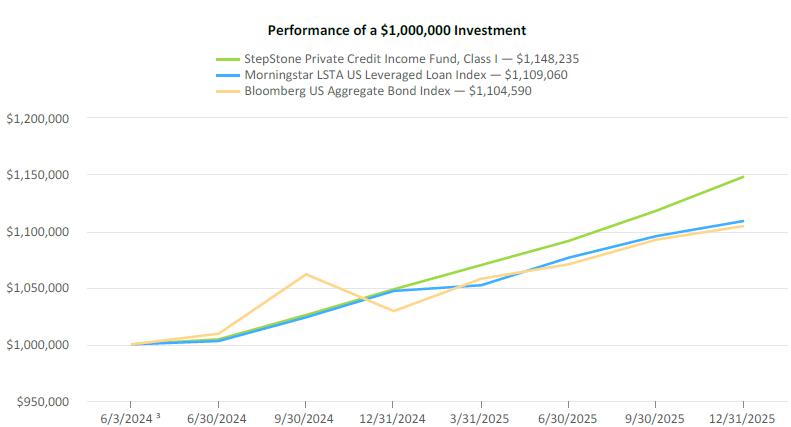
The chart above represents the hypothetical growth of a $1,000,000 investment in Class I shares. Returns for the Fund's other classes will vary from what is seen above due to differences in fee structures, specifically the distribution and shareholder servicing fees associated with brokers, dealers and certain registered investment advisers and other financial intermediaries.
The performance data quoted herein represents past performance, and the return and value of an investment in the Fund will fluctuate so that, when redeemed, it may be worth less than its original cost. Past performance does not predict future performance.
The Fund’s performance assumes the reinvestment of dividends. Index returns assume reinvestment of dividends and, unlike a portfolio’s returns, do not reflect any fees or expenses. If such fees and expenses were included in the index returns, the performance would have been lower. Please note that one cannot invest directly in an unmanaged index.
There are no assurances that the Fund will meet its stated objectives. The Fund’s holdings and allocations are subject to change because it is actively managed and should not be considered recommendations to buy individual securities.
Returns shown do not reflect the deduction of taxes that a shareholder would pay on Fund distributions or the redemption of Fund shares.
| 1 | Performance is cumulative and represents the percent change in NAV and assumes reinvestment of all distributions pursuant to the Fund’s distribution reinvestment plan. Total returns shown assume the maximum sales load is deducted from the initial investment. |
| 2 | The Morningstar LSTA US Leveraged Loan Index is a market-value weighted index designed to measure the performance of the US leveraged loan market. The Bloomberg US Aggregate Bond Index is a broad-based flagship benchmark that measures the investment grade, US dollar-denominated, fixed-rate taxable bond market. The index includes Treasuries, government-related and corporate securities, MBS (agency fixed-rate pass-throughs), ABS and CMBS (agency and non-agency). Both indices are CRDEX's primary benchmarks. The inception to date return shown is from June 3, 2024 to December 31, 2025 to match the inception of the Fund share classes. |
| 3 | The date of inception for all share classes is June 3, 2024. |
3
|
||
| Ernst & Young LLP | Tel: +1 212 773 3000 | |
| One Manhattan West | ey.com | |
| New York, NY 10001-8604 |

Report of Independent Registered Public Accounting Firm
To the Shareholders and the Board of Trustees of StepStone Private Credit Income Fund
Opinion on the Financial Statements
We have audited the accompanying consolidated statement of assets and liabilities of StepStone Private Credit Income Fund (the “Fund”), including the consolidated schedule of investments, as of December 31, 2025, the related consolidated statements of operations and cash flows for the year then ended, the consolidated statements of changes in net assets and the consolidated financial highlights for the year ended December 31, 2025 and for the period from June 3, 2024 (commencement of operations) through December 31, 2024, and the related notes (collectively referred to as the “financial statements”). In our opinion, the financial statements present fairly, in all material respects, the consolidated financial position of the Fund at December 31, 2025, the consolidated results of its operations and its cash flows for the year then ended, and the consolidated changes in its net assets and its consolidated financial highlights for the year ended December 31, 2025 and for the period from June 3, 2024 (commencement of operations) through December 31, 2025, in conformity with U.S. generally accepted accounting principles.
Basis for Opinion
These financial statements are the responsibility of the Fund’s management. Our responsibility is to express an opinion on the Fund’s financial statements based on our audits. We are a public accounting firm registered with the Public Company Accounting Oversight Board (United States) (“PCAOB”) and are required to be independent with respect to the Fund in accordance with the U.S. federal securities laws and the applicable rules and regulations of the Securities and Exchange Commission and the PCAOB.
We conducted our audits in accordance with the standards of the PCAOB. Those standards require that we plan and perform the audit to obtain reasonable assurance about whether the financial statements are free of material misstatement, whether due to error or fraud. The Fund is not required to have, nor were we engaged to perform, an audit of the Fund’s internal control over financial reporting. As part of our audits, we are required to obtain an understanding of internal control over financial reporting but not for the purpose of expressing an opinion on the effectiveness of the Fund’s internal control over financial reporting. Accordingly, we express no such opinion.
Our audits included performing procedures to assess the risks of material misstatement of the financial statements, whether due to error or fraud, and performing procedures that respond to those risks. Such procedures included examining, on a test basis, evidence regarding the amounts and disclosures in the financial statements. Our procedures included confirmation of securities owned as of December 31, 2025, by correspondence with the custodian, syndication agents and underlying investees; when replies were not received from the syndication agents and underlying investees, we performed other auditing procedures. Our audits also included evaluating the accounting principles used and significant estimates made by management, as well as evaluating the overall presentation of the financial statements. We believe that our audits provide a reasonable basis for our opinion.

We have served as the auditor of one or more of the StepStone Group LP investment companies since 2020.
New York, New York
February 27, 2026
A member firm of Ernst & Young Global Limited
4
StepStone Private Credit Income Fund
Consolidated Schedule of Investments
December 31, 2025
| Investments | Investment Type | Cash Interest Rate / PIK | Reference Rate | Spread | Maturity Date | Principal Amount | Cost25 | Fair Value | Footnotes | |||||||||||||||||||||
| Direct Lending - Non-Controlled/Non-Affiliated Investments - 118.7% of NAV | ||||||||||||||||||||||||||||||
| Senior Secured Loans - 89.8% of NAV | 1,2,3,4 | |||||||||||||||||||||||||||||
| Europe - 2.1% of NAV | ||||||||||||||||||||||||||||||
| Clarion Events Holdings Inc. | First Lien Term Loan | 8.76 | % | 3M SOFR | 5.00 | % | 11/12/2032 | $ | 3,811,387 | $ | 3,773,328 | $ | 3,772,971 | 5,6,19 | ||||||||||||||||
| Kee Safety LLC | First Lien Term Loan | 8.41 | % | 1M SOFR | 4.75 | % | 3/31/2032 | 5,651,038 | 5,594,809 | 5,587,596 | 5,6,19 | |||||||||||||||||||
| Quotient Science | First Lien Term Loan | 9.89 | % | 3M SOFR | 6.00 | % | 11/4/2029 | 1,072,727 | 1,070,050 | 1,071,994 | 5,6,19 | |||||||||||||||||||
| Quotient Science | First Lien Term Loan | 9.69 | % | 6M SOFR | 6.00 | % | 11/4/2029 | 2,927,273 | 2,919,966 | 2,925,272 | 5,6,19 | |||||||||||||||||||
| SERB Pharmaceuticals | First Lien Term Loan | 9.06 | % | 3M SOFR | 5.00 | % | 8/13/2032 | 7,771,383 | 7,674,624 | 7,675,511 | 5,6,19 | |||||||||||||||||||
| Total Direct Lending - Senior Secured Loans - Europe | $ | 21,032,777 | $ | 21,033,344 | ||||||||||||||||||||||||||
| North America - 87.4% of NAV | ||||||||||||||||||||||||||||||
| AAH Topco, LLC | Delayed Draw | 8.82 | % | 1M SOFR | 5.00 | % | 12/22/2027 | $ | 3,152,502 | $ | 887,189 | $ | 884,403 | 5,6,8,10 | ||||||||||||||||
| ABC Technologies Inc. | First Lien Term Loan | 12.17 | % | 1M SOFR | 8.25 | % | 8/22/2031 | 2,068,271 | 1,993,431 | 1,992,143 | 5,6,10,19 | |||||||||||||||||||
| Accordion Partners LLC | First Lien Term Loan | 8.96 | % | 3M SOFR | 5.25 | % | 11/17/2031 | 2,048,109 | 2,043,016 | 2,042,989 | 5,6,10,19 | |||||||||||||||||||
| ACP Avenu Buyer, LLC | Delayed Draw | 1.00 | % | 3M SOFR | 10/2/2029 | 248,846 | (1,053 | ) | (335 | ) | 5,6,7,8,11,26 | |||||||||||||||||||
| ACP Avenu Buyer, LLC | Revolver | 0.50 | % | 3M SOFR | 10/2/2029 | 87,096 | (736 | ) | (573 | ) | 5,6,7,8,11 | |||||||||||||||||||
| ACP Avenu Buyer, LLC | First Lien Term Loan | 8.99 | % | 3M SOFR | 5.00 | % | 10/2/2029 | 291,710 | 289,174 | 289,811 | 5,6,11,19 | |||||||||||||||||||
| ACP Avenu Buyer, LLC | First Lien Term Loan | 8.74 | % | 3M SOFR | 4.75 | % | 10/2/2029 | 371,906 | 368,427 | 368,815 | 5,6,11,19 | |||||||||||||||||||
| ACP Oak Buyer, Inc. | Delayed Draw | 8.78 | % | 6M SOFR | 5.00 | % | 5/16/2031 | 1,408,451 | 1,401,767 | 1,401,876 | 5,6,11 | |||||||||||||||||||
| ACP Oak Buyer, Inc. | Delayed Draw | 8.78 | % | 6M SOFR | 5.00 | % | 5/16/2031 | 1,408,451 | 1,120,068 | 1,120,186 | 5,6,8,11 | |||||||||||||||||||
| ACP Oak Buyer, Inc. | Revolver | 0.50 | % | 3M SOFR | 5/16/2031 | 1,267,606 | (5,767 | ) | (5,917 | ) | 5,6,7,8,11 | |||||||||||||||||||
| ACP Oak Buyer, Inc. | First Lien Term Loan | 9.17 | % | 3M SOFR | 5.00 | % | 5/16/2031 | 5,885,916 | 5,858,518 | 5,858,441 | 5,6,11,19 | |||||||||||||||||||
| ACR Group Borrower, LLC | First Lien Term Loan | 10.60 | % | 3M SOFR | 6.00 | % | 3/31/2028 | 304,108 | 304,587 | 303,930 | 5,6,11,20 | |||||||||||||||||||
| Advanced Medical Management, LLC | Revolver | 9.74 | % | 3M SOFR | 6.00 | % | 6/18/2028 | 789,586 | 360,854 | 360,644 | 5,6,8,11 | |||||||||||||||||||
| Advanced Medical Management, LLC | First Lien Term Loan | 9.99 | % | 3M SOFR | 6.00 | % | 6/18/2028 | 7,850,888 | 7,760,417 | 7,759,684 | 5,6,11,19 | |||||||||||||||||||
| Alkeme Intermediary Holdings, LLC | Delayed Draw | 8.67 | % | 3M SOFR | 5.00 | % | 5/28/2027 | 1,975,675 | 1,963,591 | 1,964,383 | 5,6,11,19 | |||||||||||||||||||
| Alkeme Intermediary Holdings, LLC | Delayed Draw | 8.68 | % | 3M SOFR | 5.00 | % | 5/28/2027 | 506,525 | 291,857 | 292,251 | 5,6,8,11 | |||||||||||||||||||
| Alkeme Intermediary Holdings, LLC | Revolver | 0.50 | % | 3M SOFR | 5/28/2027 | 30,404 | (104 | ) | (109 | ) | 5,6,7,8,11 | |||||||||||||||||||
| Alkeme Intermediary Holdings, LLC | Delayed Draw | 8.67 | % | 3M SOFR | 5.00 | % | 5/28/2027 | 1,457,030 | 1,447,010 | 1,452,953 | 5,6,11 | |||||||||||||||||||
The accompanying notes are an integral part of these consolidated financial statements
5
StepStone Private Credit Income Fund
Consolidated Schedule of Investments (continued)
December 31, 2025
| Investments | Investment Type | Cash Interest Rate / PIK | Reference Rate | Spread | Maturity Date | Principal Amount | Cost25 | Fair Value | Footnotes | |||||||||||||||||||||
| Direct Lending - Non-Controlled/Non-Affiliated Investments (continued) | ||||||||||||||||||||||||||||||
| Senior Secured Loans (continued) | ||||||||||||||||||||||||||||||
| North America (continued) | ||||||||||||||||||||||||||||||
| Allworth Financial Group, L.P. | Delayed Draw | 8.47 | % | 1M SOFR | 4.75 | % | 12/23/2027 | $ | 3,810,040 | $ | 2,217,012 | $ | 2,224,954 | 5,6,8,11 | ||||||||||||||||
| Allworth Financial Group, L.P. | Revolver | 0.50 | % | 3M SOFR | 12/23/2027 | 176,678 | (551 | ) | (1,060 | ) | 5,6,7,8,11 | |||||||||||||||||||
| Ambient Enterprises Holdco LLC | First Lien Term Loan | 8.92 | % | 3M SOFR | 5.25 | % | 6/28/2030 | 936,868 | 925,219 | 925,294 | 5,6,11,19 | |||||||||||||||||||
| Ambient Enterprises Holdco LLC | Delayed Draw | 8.92 | % | 3M SOFR | 5.25 | % | 6/28/2030 | 1,601,981 | 282,364 | 281,626 | 5,6,8,11 | |||||||||||||||||||
| Ambient Enterprises Holdco LLC | Delayed Draw | 0.75 | % | 6M SOFR | 6/28/2030 | 867,371 | (12,541 | ) | (13,659 | ) | 5,6,7,8,11,26 | |||||||||||||||||||
| Ambient Enterprises Holdco LLC | First Lien Term Loan | 9.09 | % | 3M SOFR | 5.25 | % | 6/28/2030 | 519,121 | 511,369 | 510,946 | 5,6,11,19 | |||||||||||||||||||
| Amercareroyal, LLC | First Lien Term Loan | 8.72 | % | 1M SOFR | 5.00 | % | 9/10/2030 | 2,576,385 | 2,550,974 | 2,556,680 | 5,6,11,19 | |||||||||||||||||||
| Amercareroyal, LLC | Delayed Draw | 1.00 | % | 3M SOFR | 9/10/2030 | 597,590 | — | — | 5,6,7,8,11,26 | |||||||||||||||||||||
| Amercareroyal, LLC | Delayed Draw | 8.72 | % | 1M SOFR | 5.00 | % | 9/10/2030 | 410,313 | 406,865 | 409,358 | 5,6,11,19 | |||||||||||||||||||
| Amercareroyal, LLC | Revolver | 8.72 | % | 1M SOFR | 5.00 | % | 9/10/2030 | 385,542 | 136,334 | 136,810 | 5,6,8,11 | |||||||||||||||||||
| American Family Care, LLC | Delayed Draw | 1.00 | % | 3M SOFR | 2/28/2029 | 1,505,018 | (6,860 | ) | (7,587 | ) | 5,6,7,8,11,26 | |||||||||||||||||||
| American Family Care, LLC | Revolver | 0.50 | % | 3M SOFR | 2/28/2029 | 451,631 | (2,057 | ) | (2,277 | ) | 5,6,7,8,11 | |||||||||||||||||||
| American Family Care, LLC | First Lien Term Loan | 8.75 | % | 3M SOFR | 4.75 | % | 2/28/2029 | 2,006,564 | 1,996,589 | 1,996,427 | 5,6,11,19 | |||||||||||||||||||
| AmeriLife Holdings LLC | First Lien Term Loan | 9.17 | % | 3M SOFR | 5.00 | % | 8/31/2029 | 5,309,113 | 5,282,864 | 5,294,340 | 5,6,10,19 | |||||||||||||||||||
| AmeriLife Holdings LLC | Delayed Draw | 1.00 | % | 3M SOFR | 8/31/2029 | 1,787,698 | (3,651 | ) | 4,469 | 5,6,7,8,10,26 | ||||||||||||||||||||
| AmeriLife Holdings LLC | Revolver | 8.79 | % | 3M SOFR | 5.00 | % | 8/31/2028 | 885,797 | 144,207 | 147,633 | 5,6,8,10 | |||||||||||||||||||
| Amplify Buyer, Inc. | First Lien Term Loan | 8.75 | % | 3M SOFR | 4.75 | % | 9/17/2032 | 4,000,000 | 3,980,549 | 3,975,020 | 5,6,10,19 | |||||||||||||||||||
| Any Hour LLC | First Lien Term Loan | 8.92 | % | 3M SOFR | 5.25 | % | 5/23/2030 | 2,336,710 | 2,309,021 | 2,293,499 | 5,6,9,19 | |||||||||||||||||||
| Any Hour LLC | Revolver | 8.96 | % | 3M SOFR | 5.25 | % | 5/23/2030 | 346,320 | 286,961 | 284,505 | 5,6,8,9 | |||||||||||||||||||
| Any Hour LLC | Delayed Draw | 8.92 | % | 3M SOFR | 5.25 | % | 5/23/2030 | 691,633 | 61,908 | 58,666 | 5,6,8,9 | |||||||||||||||||||
| Apex Service Partners, LLC | Delayed Draw | 8.78 | % | 3M SOFR | 5.00 | % | 10/24/2030 | 2,149,808 | 2,131,407 | 2,143,722 | 5,6,11,19 | |||||||||||||||||||
| Apex Service Partners, LLC | Revolver | 8.86 | % | 3M SOFR | 5.00 | % | 10/24/2029 | 96,927 | 24,666 | 24,656 | 5,6,8,11 | |||||||||||||||||||
| Apex Service Partners, LLC | Delayed Draw | 8.82 | % | 3M SOFR | 5.00 | % | 10/24/2030 | 289,679 | 287,231 | 287,384 | 5,6,11,19 | |||||||||||||||||||
| Apex Service Partners, LLC | First Lien Term Loan | 8.82 | % | 3M SOFR | 5.00 | % | 10/24/2030 | 1,217,087 | 1,206,802 | 1,207,448 | 5,6,11,19 | |||||||||||||||||||
| Apex Service Partners, LLC | First Lien Term Loan | 8.84 | % | 3M SOFR | 5.00 | % | 10/24/2030 | 1,570,013 | 1,555,661 | 1,555,781 | 5,6,11,19 | |||||||||||||||||||
The accompanying notes are an integral part of these consolidated financial statements
6
StepStone Private Credit Income Fund
Consolidated Schedule of Investments (continued)
December 31, 2025
| Investments | Investment Type | Cash Interest Rate / PIK | Reference Rate | Spread | Maturity Date | Principal Amount | Cost25 | Fair Value | Footnotes | |||||||||||||||||||||
| Direct Lending - Non-Controlled/Non-Affiliated Investments (continued) | ||||||||||||||||||||||||||||||
| Senior Secured Loans (continued) | ||||||||||||||||||||||||||||||
| North America (continued) | ||||||||||||||||||||||||||||||
| Apex Service Partners, LLC | Delayed Draw | 8.81 | % | 3M SOFR | 5.00 | % | 10/24/2030 | $ | 4,613,355 | $ | 3,133,974 | $ | 3,151,561 | 5,6,8,11 | ||||||||||||||||
| Aprio Advisory Group, LLC | Delayed Draw | 1.00 | % | 3M SOFR | 8/1/2031 | 286,557 | (2,856 | ) | (2,866 | ) | 5,6,7,8,11,26 | |||||||||||||||||||
| Aprio Advisory Group, LLC | Delayed Draw | 1.00 | % | 3M SOFR | 8/1/2031 | 3,688,525 | (36,759 | ) | (36,885 | ) | 5,6,7,8,11,26 | |||||||||||||||||||
| Aprio Advisory Group, LLC | Revolver | 0.50 | % | 3M SOFR | 8/1/2031 | 24,918 | (248 | ) | (249 | ) | 5,6,7,8,11 | |||||||||||||||||||
| Aptean, Inc. | Delayed Draw | 0.50 | % | 3M SOFR | 1/30/2031 | 2,460,152 | (5,254 | ) | (13,544 | ) | 5,6,7,8,10,26 | |||||||||||||||||||
| Aptean, Inc. | Revolver | 8.99 | % | 1M SOFR | 4.50 | % | 1/30/2031 | 285,408 | 96,632 | 95,565 | 5,6,8,10 | |||||||||||||||||||
| Aptean, Inc. | First Lien Term Loan | 8.57 | % | 3M SOFR | 4.75 | % | 1/30/2031 | 7,009,234 | 6,978,467 | 7,009,234 | 5,6,10 | |||||||||||||||||||
| Aptive Environmental, LLC | Delayed Draw | 1.00 | % | 3M SOFR | 10/15/2032 | 155,039 | (1,505 | ) | (1,474 | ) | 5,6,7,8,10,26 | |||||||||||||||||||
| Aptive Environmental, LLC | Revolver | 0.50 | % | 3M SOFR | 10/15/2032 | 310,078 | (3,008 | ) | (2,947 | ) | 5,6,7,8,10 | |||||||||||||||||||
| Aptive Environmental, LLC | First Lien Term Loan | 8.47 | % | 1M SOFR | 4.75 | % | 10/15/2032 | 3,534,884 | 3,499,625 | 3,501,288 | 5,6,10,19 | |||||||||||||||||||
| Archer Lewis, LLC | Delayed Draw | 9.92 | % | 3M SOFR | 5.75 | % | 8/28/2029 | 17,555 | 6,328 | 6,211 | 5,6,8,11 | |||||||||||||||||||
| Archer Lewis, LLC | Revolver | 9.63 | % | 3M SOFR | 5.75 | % | 8/28/2029 | 35,211 | 34,816 | 34,530 | 5,6,11 | |||||||||||||||||||
| Archer Lewis, LLC | First Lien Term Loan | 9.75 | % | 3M SOFR | 5.75 | % | 8/28/2029 | 1,234,241 | 1,218,931 | 1,210,289 | 5,6,11,19 | |||||||||||||||||||
| Archer Lewis, LLC | Delayed Draw | 9.75 | % | 3M SOFR | 5.75 | % | 8/28/2029 | 17,401 | 17,206 | 17,063 | 5,6,11,19 | |||||||||||||||||||
| Arcline Liberty Buyer LLC | Delayed Draw | — | % | 3M SOFR | 12/1/2032 | 774,194 | — | (7,794 | ) | 5,6,7,8,10,26 | ||||||||||||||||||||
| Arcline Liberty Buyer LLC | Revolver | 0.50 | % | 3M SOFR | 12/1/2032 | 516,129 | — | (5,196 | ) | 5,6,7,8,10 | ||||||||||||||||||||
| Arcline Liberty Buyer LLC | First Lien Term Loan | 8.62 | % | 1M SOFR | 4.75 | % | 12/1/2032 | 2,709,677 | 2,709,677 | 2,682,398 | 5,6,10,19 | |||||||||||||||||||
| Arctic Holdco, LLC | Delayed Draw | 9.16 | % | 3M SOFR | 5.25 | % | 1/31/2032 | 200,909 | 122,772 | 122,421 | 5,6,8,11 | |||||||||||||||||||
| Arctic Holdco, LLC | First Lien Term Loan | 6.25 | % | 3M SOFR | 5.25 | % | 1/31/2032 | 1,758,500 | 1,744,347 | 1,734,063 | 5,6,11,19 | |||||||||||||||||||
| Arctic Holdco, LLC | Revolver | 8.92 | % | 3M SOFR | 5.25 | % | 1/31/2031 | 134,565 | 23,071 | 22,352 | 5,6,8,11 | |||||||||||||||||||
| Argano LLC | First Lien Term Loan | 9.23 | % | 1M SOFR | 5.50 | % | 9/13/2029 | 5,108,615 | 5,049,010 | 5,030,286 | 5,6,11,19 | |||||||||||||||||||
| Argano LLC | First Lien Term Loan | 9.23 | % | 1M SOFR | 5.50 | % | 9/13/2029 | 690,435 | 681,793 | 679,849 | 5,6,11 | |||||||||||||||||||
| Argano LLC | Revolver | 0.50 | % | 3M SOFR | 9/13/2029 | 166,836 | (1,859 | ) | (2,558 | ) | 5,6,7,8,11 | |||||||||||||||||||
| Argano LLC | Delayed Draw | 9.22 | % | 1M SOFR | 5.50 | % | 9/13/2029 | 5,989,670 | 5,928,229 | 5,975,255 | 5,6,11 | |||||||||||||||||||
| ASP Global Holdings, LLC | First Lien Term Loan | 9.09 | % | 3M SOFR | 5.25 | % | 7/31/2029 | 2,054,213 | 2,038,429 | 2,029,524 | 5,6,11,19 | |||||||||||||||||||
The accompanying notes are an integral part of these consolidated financial statements
7
StepStone Private Credit Income Fund
Consolidated Schedule of Investments (continued)
December 31, 2025
| Investments | Investment Type | Cash Interest Rate / PIK | Reference Rate | Spread | Maturity Date | Principal Amount | Cost25 | Fair Value | Footnotes | |||||||||||||||||||||
| Direct Lending - Non-Controlled/Non-Affiliated Investments (continued) | ||||||||||||||||||||||||||||||
| Senior Secured Loans (continued) | ||||||||||||||||||||||||||||||
| North America (continued) | ||||||||||||||||||||||||||||||
| ASP Global Holdings, LLC | Revolver | 9.06 | % | 3M SOFR | 5.25 | % | 7/31/2029 | $ | 258,412 | $ | 213,429 | $ | 215,343 | 5,6,8,11 | ||||||||||||||||
| ASP Global Holdings, LLC | Delayed Draw | 9.56 | % | 3M SOFR | 5.25 | % | 7/31/2029 | 853,685 | 600,916 | 597,072 | 5,6,8,11 | |||||||||||||||||||
| Assembled Intelligence LLC | First Lien Term Loan | 8.92 | % | 3M SOFR | 5.25 | % | 5/3/2029 | 520,987 | 517,089 | 516,548 | 5,6,11,19 | |||||||||||||||||||
| Atlantic Pipe Services, LLC | Delayed Draw | 1.00 | % | 3M SOFR | 12/1/2031 | 991,736 | (12,227 | ) | (11,953 | ) | 5,6,7,8,11,26 | |||||||||||||||||||
| Atlantic Pipe Services, LLC | First Lien Term Loan | 8.20 | % | 6M SOFR | 4.50 | % | 12/1/2031 | 1,735,537 | 1,713,866 | 1,714,620 | 5,6,11,19 | |||||||||||||||||||
| Autism Learning Partners Holdings | First Lien Term Loan | 8.88 | % | 3M SOFR | 5.00 | % | 8/16/2027 | 1,805,257 | 1,797,650 | 1,789,533 | 5,6,11,20 | |||||||||||||||||||
| Aviation Technical Services, Inc. | First Lien Term Loan | 9.65 | % | 3M SOFR | 5.75 | % | 7/12/2029 | 1,316,667 | 1,309,059 | 1,306,764 | 5,6,11,19 | |||||||||||||||||||
| Aviation Technical Services, Inc. | Revolver | 0.50 | % | 3M SOFR | 7/12/2029 | 166,667 | (912 | ) | (1,253 | ) | 5,6,7,8,11 | |||||||||||||||||||
| Avita Care Solutions | Revolver | 0.50 | % | 3M SOFR | 8/6/2030 | 98,901 | (1,175 | ) | (1,265 | ) | 5,6,7,8,11 | |||||||||||||||||||
| Avita Care Solutions | First Lien Term Loan | 9.04 | % | 3M SOFR | 5.25 | % | 8/6/2030 | 1,098,346 | 1,085,242 | 1,084,541 | 5,6,11,19 | |||||||||||||||||||
| Axis Portable Air LLC | Delayed Draw | 0.50 | % | 3M SOFR | 12/31/2030 | 1,047,273 | (7,702 | ) | (8,567 | ) | 5,6,7,8,11,26 | |||||||||||||||||||
| Axis Portable Air LLC | First Lien Term Loan | 8.67 | % | 3M SOFR | 5.00 | % | 3/22/2028 | 523,636 | 519,703 | 519,603 | 5,6,11,19 | |||||||||||||||||||
| Axis Portable Air, LLC | Revolver | 0.50 | % | 3M SOFR | 3/22/2028 | 737,087 | (4,541 | ) | (2,705 | ) | 5,6,7,8,11 | |||||||||||||||||||
| Axis Portable Air, LLC | Delayed Draw | 8.67 | % | 3M SOFR | 5.00 | % | 3/22/2028 | 395,313 | 393,703 | 393,163 | 5,6,11 | |||||||||||||||||||
| Axis Portable Air, LLC | Delayed Draw | 8.67 | % | 3M SOFR | 5.00 | % | 3/22/2028 | 1,280,712 | 1,274,461 | 1,275,368 | 5,6,11,19 | |||||||||||||||||||
| Axxiom Elevator LLC | First Lien Term Loan | 8.35 | % | 6M SOFR | 4.75 | % | 10/19/2029 | 1,668,058 | 1,670,714 | 1,668,056 | 5,6,11,20 | |||||||||||||||||||
| Badge 21 Midco Holdings LLC | Delayed Draw | 1.00 | % | 3M SOFR | 6/30/2032 | 1,098,200 | (10,222 | ) | (10,865 | ) | 5,6,7,8,11,26 | |||||||||||||||||||
| Badge 21 Midco Holdings LLC | Revolver | 10.75 | % | 3M PRIME | 4.00 | % | 6/30/2032 | 694,752 | 45,647 | 45,233 | 5,6,8,11 | |||||||||||||||||||
| Badge 21 Midco Holdings LLC | First Lien Term Loan | 8.42 | % | 3M SOFR | 4.75 | % | 6/30/2032 | 5,959,047 | 5,903,229 | 5,900,091 | 5,6,11,19 | |||||||||||||||||||
| BBMA Buyer LLC | Delayed Draw | 9.75 | % | 3M SOFR | 5.75 | % | 1/2/2030 | 4,147,208 | 1,284,667 | 1,261,371 | 5,6,8,11 | |||||||||||||||||||
| BC Group Holdings, Inc. | Delayed Draw | 8.67 | % | 3M SOFR | 5.00 | % | 12/21/2026 | 4,961,270 | 3,624,305 | 3,626,062 | 5,6,8,10 | |||||||||||||||||||
| BCI Burke Holding Corp. | Delayed Draw | 1.00 | % | 3M SOFR | 12/14/2027 | 838,634 | (5,187 | ) | (6,203 | ) | 5,6,7,8,11,26 | |||||||||||||||||||
| BCI Burke Holding Corp. | First Lien Term Loan | 10.00 | % | 3M SOFR | 6.00 | % | 12/14/2027 | 2,815,325 | 2,787,550 | 2,794,443 | 5,6,11,19 | |||||||||||||||||||
| Beacon Oral Specialists Management LLC | Delayed Draw | 1.00 | % | 3M SOFR | 12/14/2026 | 1,010,633 | (1,436 | ) | (1,487 | ) | 5,6,7,8,11,26 | |||||||||||||||||||
| Berlin Rosen Acquisition, LLC | First Lien Term Loan | 9.47 | % | 3M SOFR | 5.50 | % | 1/14/2027 | 1,152,012 | 1,145,000 | 1,145,946 | 5,6,11,19 | |||||||||||||||||||
The accompanying notes are an integral part of these consolidated financial statements
8
StepStone Private Credit Income Fund
Consolidated Schedule of Investments (continued)
December 31, 2025
| Investments | Investment Type | Cash Interest Rate / PIK | Reference Rate | Spread | Maturity Date | Principal Amount | Cost25 | Fair Value | Footnotes | |||||||||||||||||||||
| Direct Lending - Non-Controlled/Non-Affiliated Investments (continued) | ||||||||||||||||||||||||||||||
| Senior Secured Loans (continued) | ||||||||||||||||||||||||||||||
| North America (continued) | ||||||||||||||||||||||||||||||
| Berlin Rosen Acquisition, LLC | Revolver | 9.47 | % | 1M SOFR | 5.50 | % | 1/14/2027 | $ | 576,465 | $ | 486,568 | $ | 486,967 | 5,6,8,11 | ||||||||||||||||
| Berlin Rosen Acquisition, LLC | First Lien Term Loan | 9.47 | % | 1M SOFR | 5.50 | % | 1/14/2027 | 2,223,085 | 2,209,800 | 2,211,379 | 5,6,11,19 | |||||||||||||||||||
| Big Top Holdings, LLC | Revolver | 0.50 | % | 3M SOFR | 3/1/2030 | 25,000 | (368 | ) | (419 | ) | 5,6,7,8,11 | |||||||||||||||||||
| Big Top Holdings, LLC | First Lien Term Loan | 8.95 | % | 3M SOFR | 5.25 | % | 3/1/2030 | 802,403 | 789,855 | 789,063 | 5,6,11,19 | |||||||||||||||||||
| Blue Matter Consulting LLC | First Lien Term Loan | 8.32 | % | 3M SOFR | 4.50 | % | 5/24/2027 | 4,900,189 | 4,878,990 | 4,877,669 | 5,6,11,20 | |||||||||||||||||||
| BridgePointe Technologies, LLC | Delayed Draw | 8.73 | % | 3M SOFR | 5.00 | % | 12/31/2027 | 5,081,973 | 4,984,107 | 4,994,794 | 5,6,8,11 | |||||||||||||||||||
| BridgePointe Technologies, LLC | Delayed Draw | 0.50 | % | 3M SOFR | 12/31/2027 | 5,081,973 | (45,922 | ) | (34,022 | ) | 5,6,7,8,11,26 | |||||||||||||||||||
| Brightmore Brands LLC | First Lien Term Loan | 13.64 | % | 3M SOFR | 9.35 | % | 9/10/2029 | 3,330,028 | 3,289,822 | 3,286,964 | 5,6,13,19 | |||||||||||||||||||
| Bristol Hospice, LLC | First Lien Term Loan | 8.67 | % | 3M SOFR | 5.00 | % | 8/26/2032 | 3,651,568 | 3,633,376 | 3,633,316 | 5,6,10,19 | |||||||||||||||||||
| Bristol Hospice, LLC | Revolver | 0.50 | % | 3M SOFR | 8/26/2032 | 348,432 | (1,657 | ) | (1,742 | ) | 5,6,7,8,10 | |||||||||||||||||||
| Campany Roofing Maintenance, LLC | Delayed Draw | 10.82 | % | 1M SOFR | 7.00 | % | 11/27/2028 | 1,553,883 | 1,536,351 | 1,438,285 | 5,6,13,19 | |||||||||||||||||||
| Cardiovascular Associates | Revolver | 0.50 | % | 3M SOFR | 5/22/2029 | 190,340 | (680 | ) | (447 | ) | 5,6,7,8,11 | |||||||||||||||||||
| Cardiovascular Associates | First Lien Term Loan | 8.99 | % | 1M SOFR | 5.25 | % | 5/22/2029 | 1,600,440 | 1,590,468 | 1,595,819 | 5,6,11,19 | |||||||||||||||||||
| Cardiovascular Associates | First Lien Term Loan | 9.14 | % | 1M SOFR | 5.25 | % | 5/22/2029 | 826,377 | 812,065 | 823,995 | 5,6,11 | |||||||||||||||||||
| Cardiovascular Associates | Delayed Draw | 8.98 | % | 1M SOFR | 5.25 | % | 5/22/2029 | 5,855,168 | 1,474,019 | 1,456,369 | 5,6,8,11 | |||||||||||||||||||
| Carnegie Dartlet, LLC | First Lien Term Loan | 9.42 | % | 1M SOFR | 5.50 | % | 2/7/2030 | 166,927 | 165,007 | 164,101 | 5,6,11,19 | |||||||||||||||||||
| Carnegie Dartlet, LLC | Delayed Draw | 9.46 | % | 1M SOFR | 5.50 | % | 2/7/2030 | 59,895 | 13,694 | 13,495 | 5,6,8,11 | |||||||||||||||||||
| Carnegie Dartlet, LLC | Revolver | 0.50 | % | 3M SOFR | 2/7/2030 | 20,000 | (161 | ) | (338 | ) | 5,6,7,8,11 | |||||||||||||||||||
| Case Works, LLC | Revolver | 9.50 | % | 3M SOFR | 5.11 | % | 10/1/2029 | 29,412 | 16,780 | 16,774 | 5,6,8,11 | |||||||||||||||||||
| Case Works, LLC | First Lien Term Loan | 9.25 | % | 3M SOFR | 5.25 | % | 10/1/2029 | 1,980,000 | 1,960,303 | 1,960,806 | 5,6,11,19 | |||||||||||||||||||
| Case Works, LLC | Delayed Draw | 9.19 | % | 3M SOFR | 5.25 | % | 10/1/2029 | 29,197 | 28,920 | 28,914 | 5,6,11,19 | |||||||||||||||||||
| Catalyst Acoustic Group, Inc. | Delayed Draw | 8.42 | % | 3M SOFR | 4.75 | % | 11/12/2030 | 2,213,722 | 1,108,798 | 1,105,380 | 5,6,8,11 | |||||||||||||||||||
| Catalyst Acoustic Group, Inc. | First Lien Term Loan | 9.17 | % | 3M SOFR | 5.00 | % | 11/12/2030 | 2,725,126 | 2,714,692 | 2,701,117 | 5,6,11,20 | |||||||||||||||||||
| CCMG Buyer LLC | First Lien Term Loan | 8.47 | % | 1M SOFR | 4.75 | % | 5/8/2030 | 1,883,884 | 1,869,708 | 1,863,418 | 5,6,11,20 | |||||||||||||||||||
| Centex Acquisition, LLC | Revolver | 9.25 | % | 1M SOFR | 5.30 | % | 5/9/2029 | 1,079,030 | 739,486 | 737,954 | 5,6,8,11 | |||||||||||||||||||
The accompanying notes are an integral part of these consolidated financial statements
9
StepStone Private Credit Income Fund
Consolidated Schedule of Investments (continued)
December 31, 2025
| Investments | Investment Type | Cash Interest Rate / PIK | Reference Rate | Spread | Maturity Date | Principal Amount | Cost25 | Fair Value | Footnotes | |||||||||||||||||||||
| Direct Lending - Non-Controlled/Non-Affiliated Investments (continued) | ||||||||||||||||||||||||||||||
| Senior Secured Loans (continued) | ||||||||||||||||||||||||||||||
| North America (continued) | ||||||||||||||||||||||||||||||
| Centex Acquisition, LLC | First Lien Term Loan | 9.48 | % | 1M SOFR | 5.25 | % | 5/9/2029 | $ | 2,906,365 | $ | 2,865,697 | $ | 2,861,656 | 5,6,11,19 | ||||||||||||||||
| Cerity Partners Equity Holding LLC | Delayed Draw | 9.12 | % | 3M SOFR | 5.25 | % | 7/28/2029 | 3,572,928 | 3,566,454 | 3,572,922 | 5,6,10 | |||||||||||||||||||
| Cerity Partners Equity Holding LLC | Revolver | 8.17 | % | 3M SOFR | 4.50 | % | 7/28/2031 | 410,256 | 101,841 | 102,563 | 5,6,8,10 | |||||||||||||||||||
| Cerity Partners Equity Holding LLC | Delayed Draw | 9.25 | % | 3M SOFR | 5.25 | % | 7/30/2029 | 1,232,394 | 77,416 | 75,065 | 5,6,8,10 | |||||||||||||||||||
| Cherry Bekaert Advisory LLC | Delayed Draw | 8.22 | % | 1M SOFR | 4.50 | % | 6/28/2030 | 251,324 | 134,862 | 134,843 | 5,6,8,10 | |||||||||||||||||||
| Cherry Bekaert Advisory LLC | First Lien Term Loan | 8.22 | % | 3M SOFR | 4.50 | % | 6/28/2030 | 251,324 | 250,697 | 250,703 | 5,6,10,19 | |||||||||||||||||||
| Cherry Bekaert Advisory LLC | First Lien Term Loan | 8.23 | % | 3M SOFR | 4.50 | % | 6/28/2030 | 2,240,886 | 2,235,287 | 2,235,284 | 5,6,10,19 | |||||||||||||||||||
| Choice Financial Group, LLC | Delayed Draw | 1.00 | % | 3M SOFR | 10/15/2027 | 4,000,000 | (37,173 | ) | (36,725 | ) | 5,6,7,8,11,26 | |||||||||||||||||||
| Chronicle Parent LLC | Delayed Draw | 8.88 | % | 3M SOFR | 5.00 | % | 4/15/2031 | 2,222,222 | 177,303 | 182,217 | 5,6,8,11 | |||||||||||||||||||
| Chronicle Parent LLC | Revolver | 0.50 | % | 3M SOFR | 4/15/2031 | 740,741 | (4,920 | ) | (3,694 | ) | 5,6,7,8,11 | |||||||||||||||||||
| Chronicle Parent LLC | First Lien Term Loan | 8.90 | % | 3M SOFR | 5.00 | % | 4/15/2031 | 7,001,852 | 6,954,096 | 6,966,845 | 5,6,11,19 | |||||||||||||||||||
| Clarest Health, LLC (FKA ProCare LTC Parent, LLC) | First Lien Term Loan | 9.28 | % |
3M SOFR | 5.50 | % |
12/20/2027 | 5,054,209 | 5,045,513 | 4,922,131 | 5,6,11,20 | |||||||||||||||||||
| Clinical Research (ITC) Buyer, Inc. | Delayed Draw | 9.56 | % | 3M SOFR | 5.25 | % | 5/17/2030 | 1,343,250 | 1,332,750 | 1,328,105 | 5,6,11 | |||||||||||||||||||
| CMG Holding Co, LLC | First Lien Term Loan | 8.57 | % | 3M SOFR | 4.75 | % | 11/26/2030 | 1,833,407 | 1,825,562 | 1,826,594 | 5,6,11,19 | |||||||||||||||||||
| CMG Holding Co, LLC | Delayed Draw | 8.57 | % | 3M SOFR | 4.75 | % | 11/26/2030 | 1,828,824 | 1,817,875 | 1,828,545 | 5,6,11 | |||||||||||||||||||
| CMG Holding Co, LLC | Revolver | 0.50 | % | 3M SOFR | 11/26/2030 | 275,011 | 343 | (42 | ) | 5,6,7,8,11 | ||||||||||||||||||||
| Combined Wellness Acquisition Co | Delayed Draw | 10.13 | % | 3M SOFR | 5.50 | % | 12/31/2026 | 4,958,438 | 4,733,242 | 4,729,323 | 5,6,8,11 | |||||||||||||||||||
| Compass Koons Gas LLC | First Lien Term Loan | 8.47 | % | 1M SOFR | 4.75 | % | 5/1/2030 | 2,702,436 | 2,706,738 | 2,701,367 | 5,6,10,20 | |||||||||||||||||||
| Computer Services, Inc. | Delayed Draw | 1.00 | % | 3M SOFR | 11/17/2031 | 29,196 | — | — | 5,6,7,8,11,26 | |||||||||||||||||||||
| Computer Services, Inc. | Delayed Draw | 0.50 | % | 3M SOFR | 11/17/2031 | 15,959 | (78 | ) | (64 | ) | 5,6,7,8,26 | |||||||||||||||||||
| Computer Services, Inc. | First Lien Term Loan | 8.17 | % | 3M SOFR | 4.50 | % | 11/17/2031 | 393,144 | 392,973 | 391,561 | 5,6,19 | |||||||||||||||||||
| Concert Golf Partners Holdco LLC | Delayed Draw | 0.50 | % | 3M SOFR | 3/31/2031 | — | (7,044 | ) | (8,492 | ) | 5,6,7,8,10,26 | |||||||||||||||||||
| Consolidated Equipment Group, LLC | First Lien Term Loan | 9.24 | % | 1M SOFR | 5.42 | % | 8/12/2027 | 1,643,372 | 1,639,113 | 1,636,242 | 5,6,14,20 | |||||||||||||||||||
| Cooper's Hawk Intermediate Holding, LLC | Delayed Draw | 9.32 | % | 3M SOFR | 5.50 | % | 7/29/2031 | 631,579 | 159,275 | 158,326 | 5,6,8,10 | |||||||||||||||||||
The accompanying notes are an integral part of these consolidated financial statements
10
StepStone Private Credit Income Fund
Consolidated Schedule of Investments (continued)
December 31, 2025
| Investments | Investment Type | Cash Interest Rate / PIK | Reference Rate | Spread | Maturity Date | Principal Amount | Cost25 | Fair Value | Footnotes | |||||||||||||||||||||
| Direct Lending - Non-Controlled/Non-Affiliated Investments (continued) | ||||||||||||||||||||||||||||||
| Senior Secured Loans (continued) | ||||||||||||||||||||||||||||||
| North America (continued) | ||||||||||||||||||||||||||||||
| Cooper's Hawk Intermediate Holding, LLC | Revolver | 9.23 | % | 1M SOFR | 5.50 | % | 7/29/2031 | $ | 294,737 | $ | 37,971 | $ | 37,394 | 5,6,8,10 | ||||||||||||||||
| Cooper's Hawk Intermediate Holding, LLC | First Lien Term Loan | 9.32 | % | 3M SOFR | 5.50 | % | 7/29/2031 | 3,073,684 | 3,029,984 | 3,024,555 | 5,6,10,19 | |||||||||||||||||||
| Cornerstone Advisors of Arizona, LLC | First Lien Term Loan | 8.42 | % | 3M SOFR | 4.75 | % | 5/13/2032 | 3,568,768 | 3,552,224 | 3,554,285 | 5,6,11,19 | |||||||||||||||||||
| Cornerstone Advisors of Arizona, LLC | Revolver | 0.38 | % | 3M SOFR | 5/13/2032 | 447,214 | (2,037 | ) | (1,815 | ) | 5,6,7,8,11 | |||||||||||||||||||
| Creative Multicare LLC | Delayed Draw | 9.39 | % | 6M SOFR | 5.50 | % | 3/27/2030 | 3,204,878 | 99,121 | 99,078 | 5,6,8,11 | |||||||||||||||||||
| CRH Healthcare Purchaser, Inc. | Delayed Draw | 1.00 | % | 3M SOFR | 9/17/2031 | 689,655 | (6,571 | ) | (7,072 | ) | 5,6,7,8,11,26 | |||||||||||||||||||
| CRH Healthcare Purchaser, Inc. | Revolver | 0.50 | % | 3M SOFR | 9/17/2031 | 275,862 | (2,626 | ) | (2,829 | ) | 5,6,7,8,11 | |||||||||||||||||||
| CRH Healthcare Purchaser, Inc. | First Lien Term Loan | 8.95 | % | 3M SOFR | 5.25 | % | 9/17/2031 | 3,026,897 | 2,996,797 | 2,995,782 | 5,6,11,19 | |||||||||||||||||||
| CSG Buyer, Inc. | Delayed Draw | 1.00 | % | 3M SOFR | 7/29/2029 | 473,684 | (853 | ) | (9,102 | ) | 5,6,7,8,11,26 | |||||||||||||||||||
| CSG Buyer, Inc. | Revolver | 0.50 | % | 3M SOFR | 7/29/2029 | 157,895 | (2,273 | ) | (4,574 | ) | 5,6,7,8,11 | |||||||||||||||||||
| CSG Buyer, Inc. | First Lien Term Loan | 10.09 | % | 3M SOFR | 6.25 | % | 7/29/2029 | 2,332,895 | 2,310,421 | 2,300,205 | 5,6,11,19 | |||||||||||||||||||
| CT Technologies Intermediate Holdings | Delayed Draw | 1.00 | % | 6M SOFR | 9/2/2031 | 156,693 | — | (398 | ) | 5,6,7,8,10,26 | ||||||||||||||||||||
| CT Technologies Intermediate Holdings | First Lien Term Loan | 8.47 | % | 1M SOFR | 4.75 | % | 9/2/2031 | 2,286,171 | 2,280,479 | 2,280,323 | 5,6,10,19 | |||||||||||||||||||
| CUB Financing Intermediate, LLC | Delayed Draw | 1.00 | % | 3M SOFR | 6/20/2030 | 4,000,000 | (39,864 | ) | (40,000 | ) | 5,6,7,8,9,26 | |||||||||||||||||||
| Curio Brands Intermediate, LLC | Delayed Draw | 0.50 | % | 3M SOFR | 4/2/2031 | 1,307,190 | (5,731 | ) | (6,620 | ) | 5,6,7,8,10,26 | |||||||||||||||||||
| Curio Brands Intermediate, LLC | Revolver | 0.50 | % | 3M SOFR | 4/2/2031 | 653,595 | (5,733 | ) | (6,608 | ) | 5,6,7,8,10 | |||||||||||||||||||
| Curio Brands Intermediate, LLC | First Lien Term Loan | 8.92 | % | 3M SOFR | 5.25 | % | 4/2/2031 | 7,999,020 | 7,938,538 | 7,918,150 | 5,6,10,19 | |||||||||||||||||||
| Cyber Advisors, Inc. | Delayed Draw | 9.08 | % | 1M SOFR | 5.25 | % | 7/18/2028 | 4,468,456 | 4,432,121 | 4,458,271 | 5,6,11 | |||||||||||||||||||
| Cyber Advisors, Inc. | First Lien Term Loan | 9.08 | % | 3M SOFR | 5.25 | % | 7/18/2028 | 2,523,343 | 2,498,307 | 2,501,030 | 5,6,11,19 | |||||||||||||||||||
| Danforth Global, Inc. | First Lien Term Loan | 9.32 | % | 3M SOFR | 5.50 | % | 12/9/2027 | 2,127,469 | 2,108,207 | 2,107,872 | 5,6,11,19 | |||||||||||||||||||
| Danforth Global, Inc. | Delayed Draw | 9.37 | % | 3M SOFR | 5.50 | % | 12/9/2027 | 178,332 | 176,632 | 177,928 | 5,6,11,19 | |||||||||||||||||||
| Danforth Global, Inc. | First Lien Term Loan | 9.32 | % | 3M SOFR | 5.50 | % | 12/9/2027 | 1,481,250 | 1,462,111 | 1,467,404 | 5,6,11,19 | |||||||||||||||||||
| Danforth Global, Inc. | Delayed Draw | 9.38 | % | 3M SOFR | 5.50 | % | 12/9/2027 | 2,984,112 | 2,946,189 | 2,974,714 | 5,6,11 | |||||||||||||||||||
| Danforth Global, Inc. | Revolver | 9.24 | % | 1M SOFR | 5.50 | % | 12/9/2027 | 747,898 | 28,811 | 29,316 | 5,6,8,11 | |||||||||||||||||||
| Danforth Global, Inc. | First Lien Term Loan | 9.39 | % | 3M SOFR | 5.50 | % | 12/9/2027 | 1,488,316 | 1,488,316 | 1,472,239 | 5,6,11,19 | |||||||||||||||||||
The accompanying notes are an integral part of these consolidated financial statements
11
StepStone Private Credit Income Fund
Consolidated Schedule of Investments (continued)
December 31, 2025
| Investments | Investment Type | Cash Interest Rate / PIK | Reference Rate | Spread | Maturity Date | Principal Amount | Cost25 | Fair Value | Footnotes | |||||||||||||||||||||
| Direct Lending - Non-Controlled/Non-Affiliated Investments (continued) | ||||||||||||||||||||||||||||||
| Senior Secured Loans (continued) | ||||||||||||||||||||||||||||||
| North America (continued) | ||||||||||||||||||||||||||||||
| Danforth Global, Inc. | Delayed Draw | 9.33 | % | 3M SOFR | 5.50 | % | 12/9/2027 | $ | 158,500 | $ | 157,042 | $ | 158,500 | 5,6,11,19 | ||||||||||||||||
| DCCM MergerSub, LLC | Delayed Draw | 0.75 | % | 3M SOFR | 6/24/2032 | 2,864,617 | (27,606 | ) | (19,295 | ) | 5,6,7,8,10,26 | |||||||||||||||||||
| DCCM MergerSub, LLC | Revolver | 0.50 | % | 3M SOFR | 6/24/2032 | 1,145,847 | (10,621 | ) | (7,718 | ) | 5,6,7,8,10 | |||||||||||||||||||
| DCCM MergerSub, LLC | First Lien Term Loan | 8.47 | % | 1M SOFR | 4.75 | % | 6/24/2032 | 5,843,103 | 5,785,009 | 5,803,747 | 5,6,10,19 | |||||||||||||||||||
| Dealer Services Network, LLC | First Lien Term Loan | 9.49 | % | 3M SOFR | 5.50 | % | 2/9/2027 | 2,891,435 | 2,877,242 | 2,878,248 | 5,6,11,19 | |||||||||||||||||||
| Dealer Services Network, LLC | First Lien Term Loan | 9.43 | % | 3M SOFR | 5.50 | % | 2/9/2027 | 310,112 | 307,019 | 307,622 | 5,6,11,19 | |||||||||||||||||||
| DecisionPoint Technologies Buyer, Inc. | First Lien Term Loan | 9.81 | % | 3M SOFR | 5.75 | % | 8/31/2029 | 685,216 | 677,190 | 681,348 | 5,6,11 | |||||||||||||||||||
| DecisionPoint Technologies Buyer, Inc. | Delayed Draw | 9.44 | % | 3M SOFR | 5.75 | % | 8/31/2029 | 1,550,327 | 1,532,202 | 1,541,576 | 5,6,11 | |||||||||||||||||||
| Denali Intermediate Holdings | First Lien Term Loan | 9.23 | % | 1M SOFR | 5.50 | % | 8/26/2032 | 6,573,797 | 6,510,471 | 6,522,174 | 5,6,19 | |||||||||||||||||||
| Denali Intermediate Holdings | Revolver | 0.50 | % | 3M SOFR | 8/26/2032 | 657,380 | (6,251 | ) | (5,162 | ) | 5,6,7,8,10 | |||||||||||||||||||
| Denali Topco, LLC | First Lien Term Loan | 8.59 | % | 3M SOFR | 4.75 | % | 8/26/2032 | 2,786,885 | 2,786,885 | 2,786,880 | 5,6,10 | |||||||||||||||||||
| Denali Topco, LLC | Delayed Draw | 0.75 | % | 3M SOFR | 8/26/2032 | 819,672 | — | (2 | ) | 5,6,7,8,10,26 | ||||||||||||||||||||
| Denali Topco, LLC | Revolver | 0.50 | % | 3M SOFR | 8/26/2032 | 393,443 | — | (1 | ) | 5,6,7,8,10 | ||||||||||||||||||||
| Dentive, LLC | First Lien Term Loan | 6.87 4.25 | %/ % | 3M SOFR | 7.25 | % | 12/22/2028 | 1,546,632 | 1,532,782 | 1,444,894 | 5,10,19,21 | |||||||||||||||||||
| Dentive, LLC | Delayed Draw | 6.87 4.25 | %/ % | 3M SOFR | 7.25 | % | 12/22/2028 | 768,351 | 761,474 | 717,809 | 5,6,10,19 | |||||||||||||||||||
| Dentive, LLC | Revolver | 6.87 4.25 | %/ % | 3M SOFR | 3.00 | % | 12/22/2028 | 122,273 | 3,412 | (10,294 | ) | 5,6,8,10 | ||||||||||||||||||
| DermCare Holdings, LLC | First Lien Term Loan | 10.02 | % | 1M SOFR | 6.00 | % | 4/21/2028 | 3,790,983 | 3,790,983 | 3,790,979 | 5,6,11,19 | |||||||||||||||||||
| DermCare Holdings, LLC | Delayed Draw | 10.02 | % | 1M SOFR | 6.00 | % | 4/21/2028 | 810,779 | 810,779 | 810,778 | 5,6,11,19 | |||||||||||||||||||
| DermCare Holdings, LLC | Delayed Draw | 10.02 | % | 1M SOFR | 6.00 | % | 4/21/2028 | 1,891,881 | 1,891,881 | 1,891,879 | 5,6,11,19 | |||||||||||||||||||
| DermCare Holdings, LLC | Revolver | 10.02 | % | 1M SOFR | 6.00 | % | 4/21/2028 | 420,875 | 420,875 | 420,875 | 5,6,11 | |||||||||||||||||||
| Designs for Health, Inc. | Revolver | 0.50 | % | 1M SOFR | 10/16/2030 | 842,105 | (8,105 | ) | (8,141 | ) | 5,6,7,8,10 | |||||||||||||||||||
| Designs for Health, Inc. | First Lien Term Loan | 6.00 | % | 3M SOFR | 6.00 | % | 10/16/2030 | 3,157,895 | 3,126,882 | 3,127,365 | 5,6,10,19 | |||||||||||||||||||
| Digicert, Inc. | Revolver | 0.50 | % | 3M SOFR | 7/10/2030 | 269,247 | (3,699 | ) | (4,019 | ) | 5,6,7,8,10 | |||||||||||||||||||
The accompanying notes are an integral part of these consolidated financial statements
12
StepStone Private Credit Income Fund
Consolidated Schedule of Investments (continued)
December 31, 2025
| Investments | Investment Type | Cash Interest Rate / PIK | Reference Rate | Spread | Maturity Date | Principal Amount | Cost25 | Fair Value | Footnotes | |||||||||||||||||||||
| Direct Lending - Non-Controlled/Non-Affiliated Investments (continued) | ||||||||||||||||||||||||||||||
| Senior Secured Loans (continued) | ||||||||||||||||||||||||||||||
| North America (continued) | ||||||||||||||||||||||||||||||
| Digicert, Inc. | First Lien Term Loan | 9.47 | % | 1M SOFR | 5.75 | % | 7/10/2030 | $ | 3,721,426 | $ | 3,665,832 | $ | 3,665,874 | 5,6,10,19 | ||||||||||||||||
| Discovery SL Management, LLC | Delayed Draw | 1.00 | % | 6M SOFR | 3/18/2030 | 267,412 | (1,963 | ) | (2,028 | ) | 5,6,7,8,11,26 | |||||||||||||||||||
| Discovery SL Management, LLC | Revolver | 0.50 | % | 3M SOFR | 3/18/2030 | 33,427 | (245 | ) | (250 | ) | 5,6,7,8,11 | |||||||||||||||||||
| Distinct Holdings, Inc. | First Lien Term Loan | 9.42 | % | 3M SOFR | 5.75 | % | 7/18/2029 | 1,805,256 | 1,778,311 | 1,762,235 | 5,6,11,20 | |||||||||||||||||||
| Diversis Tempo Holdco, LLC | First Lien Term Loan | 10.25 | % | 3M SOFR | 6.25 | % | 8/22/2031 | 3,846,493 | 3,799,657 | 3,801,972 | 5,6,10,19 | |||||||||||||||||||
| Diverzify Intermediate LLC | First Lien Term Loan | 9.89 | % | 3M SOFR | 5.75 | % | 5/11/2027 | 934,305 | 930,141 | 929,929 | 5,6,11,20 | |||||||||||||||||||
| Diverzify Intermediate LLC | First Lien Term Loan | 10.24 | % | 3M SOFR | 5.75 | % | 5/11/2027 | 732,436 | 729,171 | 728,981 | 5,6,11,20 | |||||||||||||||||||
| Duke's Root Control, Inc. | Revolver | 1.00 | % | 3M SOFR | 12/8/2028 | 276,448 | (1,768 | ) | (1,625 | ) | 5,6,7,8,11 | |||||||||||||||||||
| Duke's Root Control, Inc. | First Lien Term Loan | 9.85 | % | 3M SOFR | 5.50 | % | 12/10/2029 | 2,396,657 | 2,380,962 | 2,382,543 | 5,6,11,19 | |||||||||||||||||||
| Duke's Root Control, Inc. | First Lien Term Loan | 9.63 | % | 3M SOFR | 5.50 | % | 12/10/2029 | 831,798 | 826,326 | 826,907 | 5,6,11,19 | |||||||||||||||||||
| Durare Bidco, LLC | Delayed Draw | 0.50 | % | 3M SOFR | 8/9/2032 | 1,515,152 | (7,152 | ) | (6,945 | ) | 5,6,7,8,9,26 | |||||||||||||||||||
| Durare Bidco, LLC | Revolver | 0.50 | % | 3M SOFR | 8/9/2032 | 727,273 | (3,433 | ) | (3,333 | ) | 5,6,7,8,9 | |||||||||||||||||||
| Durare Bidco, LLC | First Lien Term Loan | 8.62 | % | 3M SOFR | 4.75 | % | 8/9/2032 | 5,757,576 | 5,728,922 | 5,731,187 | 5,6,9,19 | |||||||||||||||||||
| EdgeCo Buyer, Inc. | Delayed Draw | 8.39 | % | 1M SOFR | 4.50 | % | 6/1/2028 | 3,548,107 | 2,979,366 | 2,991,630 | 5,6,8,11 | |||||||||||||||||||
| EdgeCo Buyer, Inc. | Revolver | 0.50 | % | 3M SOFR | 6/1/2028 | 355,196 | — | (1 | ) | 5,6,7,8,11 | ||||||||||||||||||||
| EdgeCo Buyer, Inc. | First Lien Term Loan | 8.42 | % | 1M SOFR | 4.50 | % | 6/1/2028 | 1,209,682 | 1,209,682 | 1,209,681 | 5,6,11,19 | |||||||||||||||||||
| EdgeCo Buyer, Inc. | Delayed Draw | 8.17 | % | 3M SOFR | 4.50 | % | 6/1/2028 | 154,464 | 154,464 | 154,464 | 5,6,11,19 | |||||||||||||||||||
| Einstein Parent, Inc. | Revolver | 0.50 | % | 3M SOFR | 1/22/2031 | 544,674 | (9,218 | ) | (16,641 | ) | 5,6,7,8,10 | |||||||||||||||||||
| Einstein Parent, Inc. | First Lien Term Loan | 10.36 | % | 3M SOFR | 6.50 | % | 1/22/2031 | 5,265,185 | 5,172,059 | 5,104,321 | 5,6,10,19 | |||||||||||||||||||
| Elder Care Opco LLC | Delayed Draw | 0.75 | % | 3M SOFR | 7/31/2030 | 985,158 | (8,266 | ) | (8,558 | ) | 5,6,7,8,13,26 | |||||||||||||||||||
| Elder Care Opco LLC | Revolver | 0.50 | % | 3M SOFR | 7/31/2030 | 295,547 | (2,373 | ) | (2,567 | ) | 5,6,7,8,13 | |||||||||||||||||||
| Elder Care Opco LLC | First Lien Term Loan | 8.67 | % | 3M SOFR | 5.00 | % | 7/31/2030 | 1,581,179 | 1,568,282 | 1,567,443 | 5,6,13,19 | |||||||||||||||||||
| Eliassen Group, LLC | Delayed Draw | 9.42 | % | 3M SOFR | 5.75 | % | 4/14/2028 | 66,757 | 65,000 | 66,756 | 5,6,10 | |||||||||||||||||||
| Eliassen Group, LLC | First Lien Term Loan | 9.42 | % | 3M SOFR | 5.75 | % | 4/14/2028 | 927,451 | 900,044 | 903,238 | 5,6,10,19 | |||||||||||||||||||
| Empower Payments Investor, LLC | Delayed Draw | 1.00 | % | 3M SOFR | 3/12/2031 | 923,077 | (8,899 | ) | (8,756 | ) | 5,6,7,8,10,26 | |||||||||||||||||||
The accompanying notes are an integral part of these consolidated financial statements
13
StepStone Private Credit Income Fund
Consolidated Schedule of Investments (continued)
December 31, 2025
| Investments | Investment Type | Cash Interest Rate / PIK | Reference Rate | Spread | Maturity Date | Principal Amount | Cost25 | Fair Value | Footnotes | |||||||||||||||||||||
| Direct Lending - Non-Controlled/Non-Affiliated Investments (continued) | ||||||||||||||||||||||||||||||
| Senior Secured Loans (continued) | ||||||||||||||||||||||||||||||
| North America (continued) | ||||||||||||||||||||||||||||||
| Empower Payments Investor, LLC | First Lien Term Loan | 8.37 | % | 3M SOFR | 4.50 | % | 3/12/2031 | $ | 3,069,231 | $ | 3,038,689 | $ | 3,040,044 | 5,6,10,19 | ||||||||||||||||
| Ems Acquisition Corp. | First Lien Term Loan | 10.32 | % | 1M SOFR | 6.50 | % | 6/30/2027 | 955,340 | 956,861 | 955,340 | 5,6,11,20 | |||||||||||||||||||
| Engineering Resource Group Buyer, LLC | Delayed Draw | 1.00 | % | 3M SOFR | 10/27/2030 | 589,681 | (8,668 | ) | (8,647 | ) | 5,6,7,8,13,26 | |||||||||||||||||||
| Engineering Resource Group Buyer, LLC | Revolver | 0.50 | % | 3M SOFR | 10/27/2030 | 294,840 | (4,333 | ) | (4,324 | ) | 5,6,7,8,13 | |||||||||||||||||||
| Engineering Resource Group Buyer, LLC | First Lien Term Loan | 9.86 | % | 3M SOFR | 6.00 | % | 10/27/2030 | 884,521 | 871,266 | 871,777 | 5,6,13 | |||||||||||||||||||
| Epika Fleet Services, LLC | First Lien Term Loan | 8.69 | % | 3M SOFR | 5.00 | % | 4/17/2031 | 5,163,461 | 5,125,008 | 5,139,871 | 5,6,10,19 | |||||||||||||||||||
| Epika Fleet Services, LLC | Delayed Draw | 8.84 | % | 3M SOFR | 5.00 | % | 4/17/2031 | 1,366,799 | 1,349,791 | 1,360,525 | 5,6,10,19 | |||||||||||||||||||
| Epika Fleet Services, LLC | Delayed Draw | 8.69 | % | 3M SOFR | 5.00 | % | 4/17/2031 | 1,518,665 | 922,235 | 929,591 | 5,6,8,10 | |||||||||||||||||||
| Equinox Buyer, LLC | Revolver | 0.50 | % | 3M SOFR | 7/28/2031 | 305,444 | (2,896 | ) | (3,111 | ) | 5,6,7,8,11 | |||||||||||||||||||
| Equinox Buyer, LLC | First Lien Term Loan | 9.11 | % | 3M SOFR | 5.25 | % | 7/28/2031 | 2,268,085 | 2,245,480 | 2,244,981 | 5,6,11,19 | |||||||||||||||||||
| ES Ventures LLC | First Lien Term Loan | 8.74 | % | 1M SOFR | 4.75 | % | 12/13/2028 | 166,183 | 165,770 | 165,837 | 5,6,11,19 | |||||||||||||||||||
| ES Ventures LLC | First Lien Term Loan | 8.74 | % | 1M SOFR | 4.75 | % | 12/13/2028 | 145,478 | 145,128 | 145,176 | 5,6,11,19 | |||||||||||||||||||
| ESCP DTFS INC. | First Lien Term Loan | 9.17 | % | 3M SOFR | 5.50 | % | 9/28/2029 | 3,950,000 | 3,926,425 | 3,924,557 | 5,6,11,19 | |||||||||||||||||||
| EvAl Home Health Solutions Intermediate, L.L.C | First Lien Term Loan | 9.67 | % | 1M SOFR | 5.75 | % | 5/10/2030 | 498,188 | 492,203 | 465,215 | 5,6,11,19 | |||||||||||||||||||
| EvAl Home Health Solutions Intermediate, L.L.C | Revolver | 0.50 | % | 3M SOFR | 5/10/2030 | 20,000 | (228 | ) | (1,320 | ) | 5,6,7,8,11 | |||||||||||||||||||
| EVDR Purchaser, Inc. | First Lien Term Loan | 8.45 | % | 1M SOFR | 4.50 | % | 2/14/2031 | 875,092 | 870,727 | 871,012 | 5,6,10,19 | |||||||||||||||||||
| Everbridge Holdings, LLC | First Lien Term Loan | 8.98 | % | 3M SOFR | 5.00 | % | 7/2/2031 | 1,833,333 | 1,825,619 | 1,821,880 | 5,6,10,19 | |||||||||||||||||||
| Everbridge Holdings, LLC | Delayed Draw | 8.98 | % | 3M SOFR | 5.00 | % | 7/2/2031 | 461,148 | 178,731 | 177,966 | 5,6,8,10 | |||||||||||||||||||
| Everbridge Holdings, LLC | Revolver | 0.38 | % | 6M SOFR | 7/2/2031 | 185,185 | (731 | ) | (1,157 | ) | 5,6,7,8,10 | |||||||||||||||||||
| Everest Clinical Research Corporation | First Lien Term Loan | 9.70 | % | 3M SOFR | 5.25 | % | 11/6/2026 | 3,021,150 | 3,008,325 | 3,003,509 | 5,6,11,20 | |||||||||||||||||||
| Evergreen Services Group II | Delayed Draw | 9.05 | % | 1M SOFR | 5.25 | % | 6/15/2029 | 5,501,296 | 4,449,090 | 4,464,427 | 5,6,8,10 | |||||||||||||||||||
| Evergreen Services Group II | First Lien Term Loan | 8.93 | % | 3M SOFR | 5.25 | % | 6/15/2029 | 4,285,922 | 4,243,464 | 4,242,255 | 5,6,10,19 | |||||||||||||||||||
| Examinetics Holdings Inc | First Lien Term Loan | 8.42 | % | 1M SOFR | 4.50 | % | 8/11/2029 | 104,486 | 104,652 | 104,486 | 5,6,11,20 | |||||||||||||||||||
| First Legal Buyer, Inc. | First Lien Term Loan | 8.42 | % | 3M SOFR | 4.75 | % | 7/1/2031 | 1,672,284 | 1,661,737 | 1,666,484 | 5,6,11,19 | |||||||||||||||||||
The accompanying notes are an integral part of these consolidated financial statements
14
StepStone Private Credit Income Fund
Consolidated Schedule of Investments (continued)
December 31, 2025
| Investments | Investment Type | Cash Interest Rate / PIK | Reference Rate | Spread | Maturity Date | Principal Amount | Cost25 | Fair Value | Footnotes | |||||||||||||||||||||
| Direct Lending - Non-Controlled/Non-Affiliated Investments (continued) | ||||||||||||||||||||||||||||||
| Senior Secured Loans (continued) | ||||||||||||||||||||||||||||||
| North America (continued) | ||||||||||||||||||||||||||||||
| First Legal Buyer, Inc. | Delayed Draw | 8.42 | % | 3M SOFR | 4.75 | % | 7/1/2031 | $ | 617,553 | $ | 161,434 | $ | 163,838 | 5,6,8,11 | ||||||||||||||||
| First Legal Buyer, Inc. | Revolver | 8.50 | % | 1M SOFR | 4.75 | % | 7/1/2031 | 310,231 | 21,414 | 22,191 | 5,6,8,11 | |||||||||||||||||||
| Flatiron Crane Operating Company, LLC | First Lien Term Loan | 8.83 | % | 1M SOFR | 5.00 | % | 12/17/2027 | 1,641,781 | 1,641,063 | 1,637,644 | 5,6,11,20 | |||||||||||||||||||
| Force Electrical Buyerco, LLC | Delayed Draw | 8.26 | % | 3M SOFR | 4.50 | % | 10/21/2032 | 1,964,299 | 1,822 | 10,116 | 5,6,8,10 | |||||||||||||||||||
| Force Electrical Buyerco, LLC | Revolver | 10.25 | % | 3M PRIME | 3.50 | % | 10/21/2032 | 392,860 | 74,746 | 76,405 | 5,6,8,10 | |||||||||||||||||||
| Force Electrical Buyerco, LLC | First Lien Term Loan | 8.37 | % | 1M SOFR | 4.50 | % | 10/21/2032 | 1,152,389 | 1,140,891 | 1,146,031 | 5,6,10,19 | |||||||||||||||||||
| Fullsteam Operations LLC | Delayed Draw | 1.00 | % | 3M SOFR | 8/8/2031 | 474,002 | (4,588 | ) | (4,543 | ) | 5,6,7,8,10,26 | |||||||||||||||||||
| Fullsteam Operations LLC | Revolver | 0.50 | % | 3M SOFR | 8/8/2031 | 158,001 | (1,477 | ) | (1,514 | ) | 5,6,7,8,10 | |||||||||||||||||||
| Fullsteam Operations LLC | First Lien Term Loan | 9.11 | % | 3M SOFR | 5.25 | % | 8/8/2031 | 1,422,005 | 1,408,489 | 1,408,375 | 5,6,10,19 | |||||||||||||||||||
| Gastronome Acquisition, LLC | First Lien Term Loan | 8.82 | % | 3M SOFR | 5.00 | % | 6/18/2029 | 2,073,429 | 2,061,860 | 2,073,427 | 5,6,11,20 | |||||||||||||||||||
| Gator Plastic Intermediate Holdings, LLC | First Lien Term Loan | 10.98 | % | 1M SOFR | 7.25 | % | 10/14/2027 | 2,227,845 | 2,183,527 | 2,195,569 | 5,6,13,19 | |||||||||||||||||||
| Gator Plastic Intermediate Holdings, LLC | Revolver | 0.50 | % | 3M SOFR | 10/14/2027 | 400,662 | (5,901 | ) | (5,805 | ) | 5,6,7,8,13 | |||||||||||||||||||
| GC Waves Holdings, Inc | Delayed Draw | 8.22 | % | 1M SOFR | 4.50 | % | 10/4/2030 | 393,457 | 18,143 | 18,437 | 5,6,8,10 | |||||||||||||||||||
| GMF Parent, Inc. | Delayed Draw | 1.00 | % | 3M SOFR | 12/20/2032 | 500,000 | (4,975 | ) | (5,000 | ) | 5,6,7,8,10,26 | |||||||||||||||||||
| GMF Parent, Inc. | Delayed Draw | 1.00 | % | 3M SOFR | 12/20/2032 | 450,000 | (4,478 | ) | (4,500 | ) | 5,6,7,8,10,26 | |||||||||||||||||||
| GMF Parent, Inc. | Revolver | 0.50 | % | 3M SOFR | 12/20/2032 | 275,000 | (2,736 | ) | (2,750 | ) | 5,6,7,8,10 | |||||||||||||||||||
| GMF Parent, Inc. | First Lien Term Loan | 8.20 | % | 3M SOFR | 4.50 | % | 12/20/2032 | 1,775,000 | 1,757,258 | 1,757,250 | 5,6,10,19 | |||||||||||||||||||
| Gold Medal Holdings, Inc | First Lien Term Loan | 9.42 | % | 3M SOFR | 5.75 | % | 3/17/2027 | 1,594,648 | 1,594,648 | 1,594,648 | 5,6,11,19 | |||||||||||||||||||
| Gold Medal Holdings, Inc | Delayed Draw | 9.75 | % | 3M SOFR | 7.75 | % | 3/17/2027 | 380,241 | 131,510 | 131,510 | 5,6,8,11 | |||||||||||||||||||
| Golden State Dermatology Management, LLC | Delayed Draw | 9.52 | % | 1M SOFR | 5.50 | % | 9/28/2029 | 5,401,696 | 3,295,797 | 3,284,112 | 5,6,8,11 | |||||||||||||||||||
| Graymar Acquisition LLC | Delayed Draw | 8.22 | % | 1M SOFR | 4.50 | % | 9/13/2030 | 1,526,685 | 379,825 | 381,669 | 5,6,8,11 | |||||||||||||||||||
| Greenwood Operating Group, LLC | First Lien Term Loan | 9.22 | % | 1M SOFR | 5.50 | % | 5/7/2031 | 5,313,609 | 5,214,808 | 5,213,909 | 5,6,11,19 | |||||||||||||||||||
| Greenwood Operating Group, LLC | Revolver | 0.50 | % | 3M SOFR | 5/7/2031 | 1,068,062 | (19,091 | ) | (20,040 | ) | 5,6,7,8,11 | |||||||||||||||||||
| Gridhawk LLC | First Lien Term Loan | 9.45 | % | 3M SOFR | 5.25 | % | 5/7/2030 | 1,601,553 | 1,593,973 | 1,596,424 | 5,6,11,20 | |||||||||||||||||||
The accompanying notes are an integral part of these consolidated financial statements
15
StepStone Private Credit Income Fund
Consolidated Schedule of Investments (continued)
December 31, 2025
| Investments | Investment Type | Cash Interest Rate / PIK | Reference Rate | Spread | Maturity Date | Principal Amount | Cost25 | Fair Value | Footnotes | |||||||||||||||||||||
| Direct Lending - Non-Controlled/Non-Affiliated Investments (continued) | ||||||||||||||||||||||||||||||
| Senior Secured Loans (continued) | ||||||||||||||||||||||||||||||
| North America (continued) | ||||||||||||||||||||||||||||||
| GS Acquisitionco, Inc. | Delayed Draw | 0.50 | % | 3M SOFR | 5/25/2028 | $ | 350,698 | $ | (696 | ) | $ | (170 | ) | 5,6,7,8,10,26 | ||||||||||||||||
| Guava Buyer LLC | Delayed Draw | 9.36 | % | 1M SOFR | 5.50 | % | 8/12/2032 | 381,325 | 159,949 | 159,821 | 5,6,8,11 | |||||||||||||||||||
| Guava Buyer LLC | Revolver | 9.49 | % | 3M SOFR | 5.50 | % | 8/12/2030 | 382,166 | 125,370 | 124,985 | 5,6,8,11 | |||||||||||||||||||
| Guava Buyer LLC | First Lien Term Loan | 9.34 | % | 3M SOFR | 5.50 | % | 8/12/2032 | 3,227,580 | 3,163,441 | 3,164,085 | 5,6,11,19 | |||||||||||||||||||
| Halo Buyer, Inc. | First Lien Term Loan | 9.92 | % | 1M SOFR | 6.00 | % | 8/7/2029 | 6,403,940 | 6,290,426 | 6,265,181 | 5,6,11,19 | |||||||||||||||||||
| Halo Buyer, Inc. | Revolver | 11.02 | % | 3M PRIME | 5.40 | % | 8/7/2029 | 967,850 | 330,908 | 325,894 | 5,6,8,11 | |||||||||||||||||||
| Harris & Co. LLC | Delayed Draw | 8.93 | % | 1M SOFR | 5.00 | % | 8/9/2030 | 17,503 | 16,774 | 16,796 | 5,6,8,11 | |||||||||||||||||||
| Harris & Co. LLC | Revolver | 8.72 | % | 1M SOFR | 5.00 | % | 8/9/2030 | 226,637 | 43,599 | 43,165 | 5,6,8,11 | |||||||||||||||||||
| Harris & Co. LLC | First Lien Term Loan | 8.92 | % | 1M SOFR | 5.00 | % | 8/9/2030 | 1,651,404 | 1,635,021 | 1,635,605 | 5,6,11,19 | |||||||||||||||||||
| Harris & Co. LLC | Delayed Draw | 8.92 | % | 1M SOFR | 5.00 | % | 8/9/2030 | 17,404 | 17,244 | 17,237 | 5,6,11,19 | |||||||||||||||||||
| Harris & Co. LLC | Delayed Draw | 1.00 | % | 3M SOFR | 8/9/2030 | 2,074,281 | (15,007 | ) | (15,376 | ) | 5,6,7,8,11,26 | |||||||||||||||||||
| Heads Up Technologies, Inc. | Revolver | 0.50 | % | 3M SOFR | 7/23/2030 | 636,364 | (2,905 | ) | (3,306 | ) | 5,6,7,8,11 | |||||||||||||||||||
| Heads Up Technologies, Inc. | First Lien Term Loan | 9.57 | % | 3M SOFR | 5.25 | % | 7/23/2030 | 6,347,727 | 6,317,681 | 6,314,748 | 5,6,11,19 | |||||||||||||||||||
| Health Buyer LLC | Revolver | 8.48 | % | 1M SOFR | 4.75 | % | 4/29/2030 | 183,824 | 101,103 | 100,998 | 5,6,8,10 | |||||||||||||||||||
| Health Buyer LLC | First Lien Term Loan | 8.42 | % | 3M SOFR | 4.75 | % | 4/29/2030 | 1,254,668 | 1,249,667 | 1,247,399 | 5,6,10,19 | |||||||||||||||||||
| Health Management Associates, Inc. | First Lien Term Loan | 10.34 | % | 3M SOFR | 6.25 | % | 3/30/2029 | 525,227 | 520,447 | 518,635 | 5,6,11,20 | |||||||||||||||||||
| Hec Purchaser Corp. | First Lien Term Loan | 8.89 | % | 6M SOFR | 5.00 | % | 6/17/2029 | 3,681,857 | 3,643,775 | 3,631,378 | 5,6,11,19 | |||||||||||||||||||
| Hec Purchaser Corp. | Revolver | 0.50 | % | 3M SOFR | 6/17/2029 | 260,417 | (2,744 | ) | (3,599 | ) | 5,6,7,8,11 | |||||||||||||||||||
| Heritage Foodservice Investment, LLC | First Lien Term Loan | 9.50 | % | 3M SOFR | 5.50 | % | 8/1/2030 | 1,543,290 | 1,527,504 | 1,536,156 | 5,6,11,19 | |||||||||||||||||||
| Heritage Foodservice Investment, LLC | Revolver | 9.50 | % | 3M SOFR | 5.50 | % | 8/1/2030 | 200,871 | 31,536 | 32,530 | 5,6,8,11 | |||||||||||||||||||
| Heritage Foodservice Investment, LLC | Delayed Draw | 9.47 | % | 3M SOFR | 5.50 | % | 8/1/2030 | 1,606,384 | 123,452 | 131,991 | 5,6,8,11 | |||||||||||||||||||
| HES Intermediate Holdings II, LLC | First Lien Term Loan | 8.94 | % | 3M SOFR | 5.00 | % | 11/25/2026 | 104,683 | 104,297 | 104,185 | 5,6,11,20 | |||||||||||||||||||
| HHS Buyer Inc. | Revolver | 0.50 | % | 3M SOFR | 8/31/2028 | 1,081,315 | (11,548 | ) | (14,837 | ) | 5,6,7,8,11 | |||||||||||||||||||
| HHS Buyer Inc. | Delayed Draw | 9.60 | % | 3M SOFR | 5.50 | % | 8/31/2028 | 5,393,864 | 5,010,526 | 4,997,208 | 5,6,8,11 | |||||||||||||||||||
| HHS Buyer Inc. | First Lien Term Loan | 9.58 | % | 3M SOFR | 5.50 | % | 8/31/2028 | 860,727 | 851,307 | 848,917 | 5,6,11,19 | |||||||||||||||||||
The accompanying notes are an integral part of these consolidated financial statements
16
StepStone Private Credit Income Fund
Consolidated Schedule of Investments (continued)
December 31, 2025
| Investments | Investment Type | Cash Interest Rate / PIK | Reference Rate | Spread | Maturity Date | Principal Amount | Cost25 | Fair Value | Footnotes | |||||||||||||||||||||
| Direct Lending - Non-Controlled/Non-Affiliated Investments (continued) | ||||||||||||||||||||||||||||||
| Senior Secured Loans (continued) | ||||||||||||||||||||||||||||||
| North America (continued) | ||||||||||||||||||||||||||||||
| Hills Distribution, Inc. | First Lien Term Loan | 9.86 | % | 1M SOFR | 6.00 | % | 11/8/2029 | $ | 87,930 | $ | 87,491 | $ | 87,490 | 5,6,11,19 | ||||||||||||||||
| Hills Distribution, Inc. | Delayed Draw | 1.00 | % | 3M SOFR | 11/8/2029 | 212,733 | (1,044 | ) | (1,064 | ) | 5,6,7,8,11,26 | |||||||||||||||||||
| IDC Infusion Services, Inc. | First Lien Term Loan | 10.30 | % | 3M SOFR | 6.00 | % | 7/7/2028 | 2,078,691 | 2,065,965 | 2,057,488 | 5,6,11,20 | |||||||||||||||||||
| Ideal Components Acquisition, LLC | Delayed Draw | 1.00 | % | 6M SOFR | 6/30/2032 | 965,264 | (9,318 | ) | (9,474 | ) | 5,6,7,8,10,26 | |||||||||||||||||||
| Ideal Components Acquisition, LLC | Revolver | 8.72 | % | 1M SOFR | 5.00 | % | 6/30/2032 | 804,387 | 99,785 | 99,356 | 5,6,8,10 | |||||||||||||||||||
| Ideal Components Acquisition, LLC | First Lien Term Loan | 8.67 | % | 3M SOFR | 5.00 | % | 6/30/2032 | 5,242,190 | 5,193,086 | 5,190,735 | 5,6,10,19 | |||||||||||||||||||
| IEQ Capital, LLC | Delayed Draw | 8.33 | % | 6M SOFR | 4.50 | % | 12/22/2028 | 2,484,028 | 2,213,104 | 2,213,265 | 5,6,8,10,19 | |||||||||||||||||||
| IEQ Capital, LLC | First Lien Term Loan | 8.37 | % | 3M SOFR | 4.50 | % | 12/22/2028 | 1,462,969 | 1,462,969 | 1,462,965 | 5,6,10,19 | |||||||||||||||||||
| IF&P Holding Company, LLC | Delayed Draw | 1.00 | % | 3M SOFR | 10/3/2028 | 2,131,126 | (4,247 | ) | — | 5,6,7,8,11,26 | ||||||||||||||||||||
| Improving Acquisition, LLC | First Lien Term Loan | 10.74 | % | 3M SOFR | 6.50 | % | 7/26/2027 | 9,150,684 | 9,048,076 | 9,080,933 | 5,6,11,19 | |||||||||||||||||||
| Improving Acquisition, LLC | Revolver | 10.59 | % | 3M SOFR | 6.50 | % | 7/26/2027 | 584,271 | 52,168 | 53,719 | 5,6,8,11 | |||||||||||||||||||
| Inszone Mid, LLC | Delayed Draw | 1.00 | % | 3M SOFR | 11/30/2029 | 307,313 | (2,957 | ) | (2,913 | ) | 5,6,7,8,11,26 | |||||||||||||||||||
| Integrated Power Services Holdings, Inc. | First Lien Term Loan | 8.58 | % | 1M SOFR | 4.75 | % | 11/22/2028 | 3,949,749 | 3,930,262 | 3,939,977 | 5,6,11,19 | |||||||||||||||||||
| Integrity Marketing Acquisition, LLC | First Lien Term Loan | 8.82 | % | 3M SOFR | 5.00 | % | 8/25/2028 | 3,950,008 | 3,947,182 | 3,949,703 | 5,6,10,19 | |||||||||||||||||||
| Intermed Inc. | First Lien Term Loan | 9.34 | % | 3M SOFR | 5.50 | % | 4/3/2030 | 3,194,936 | 3,179,839 | 3,172,465 | 5,6,11,20 | |||||||||||||||||||
| ITS Buyer, Inc. | First Lien Term Loan | 9.83 | % | 1M SOFR | 6.00 | % | 6/14/2027 | 2,164,113 | 2,142,539 | 2,146,534 | 5,6,11 | |||||||||||||||||||
| ITS Buyer, Inc. | Revolver | 0.50 | % | 3M SOFR | 6/14/2027 | 395,546 | (2,364 | ) | — | 5,6,7,8,11 | ||||||||||||||||||||
| Ivy Technology Parent Intermediate III Holdings, LLC | First Lien Term Loan | 9.29 | % | 1M SOFR | 5.38 | % | 2/5/2031 | 3,508,801 | 3,460,565 | 3,465,847 | 5,6,11,19 | |||||||||||||||||||
| Ivy Technology Parent Intermediate III Holdings, LLC | Revolver | 9.09 | % | 1M SOFR | 5.38 | % | 2/5/2031 | 453,246 | 84,554 | 85,115 | 5,6,8,11 | |||||||||||||||||||
| JS Global, LLC | Revolver | 9.43 | % | 3M SOFR | 5.50 | % | 7/31/2030 | 490,196 | 65,623 | 64,777 | 5,6,8,11 | |||||||||||||||||||
| JS Global, LLC | First Lien Term Loan | 9.17 | % | 3M SOFR | 5.50 | % | 7/31/2030 | 1,268,137 | 1,247,374 | 1,245,494 | 5,6,11 | |||||||||||||||||||
| KabaFusion Parent LLC | First Lien Term Loan | 8.42 | % | 3M SOFR | 4.75 | % | 11/24/2031 | 2,828,654 | 2,814,681 | 2,823,626 | 5,6,10,19 | |||||||||||||||||||
| KabaFusion Parent LLC | Revolver | 0.50 | % | 6M SOFR | 11/24/2031 | 356,254 | (1,509 | ) | (633 | ) | 5,6,7,8,10 | |||||||||||||||||||
| KabaFusion Parent LLC | First Lien Term Loan | 9.30 | % | 3M SOFR | 5.00 | % | 11/24/2031 | 2,991,677 | 2,991,677 | 2,991,676 | 5,6,10,19 | |||||||||||||||||||
The accompanying notes are an integral part of these consolidated financial statements
17
StepStone Private Credit Income Fund
Consolidated Schedule of Investments (continued)
December 31, 2025
| Investments | Investment Type | Cash Interest Rate / PIK | Reference Rate | Spread | Maturity Date | Principal Amount | Cost25 | Fair Value | Footnotes | |||||||||||||||||||||
| Direct Lending - Non-Controlled/Non-Affiliated Investments (continued) | ||||||||||||||||||||||||||||||
| Senior Secured Loans (continued) | ||||||||||||||||||||||||||||||
| North America (continued) | ||||||||||||||||||||||||||||||
| KCM Environmental US Acquisition LLC | First Lien Term Loan | 8.67 | % | 3M SOFR | 5.00 | % | 6/17/2030 | $ | 2,073,429 | $ | 2,036,959 | $ | 2,022,222 | 5,6,11,20 | ||||||||||||||||
| Kelso Industries LLC | Delayed Draw | 9.57 | % | 3M SOFR | 5.75 | % | 12/30/2029 | 252,738 | 132,751 | 135,735 | 5,6,8,11 | |||||||||||||||||||
| Kelso Industries LLC | First Lien Term Loan | 9.71 | % | 1M SOFR | 5.75 | % | 12/30/2029 | 1,320,874 | 1,307,814 | 1,306,658 | 5,6,11 | |||||||||||||||||||
| Kelso Industries LLC | First Lien Term Loan | 9.71 | % | 1M SOFR | 5.75 | % | 12/30/2029 | 4,024,434 | 3,990,800 | 3,980,844 | 5,6,11,19 | |||||||||||||||||||
| Kept Companies, Inc. | Delayed Draw | 8.92 | % | 3M SOFR | 5.25 | % | 4/30/2029 | 1,306,111 | 886,736 | 884,025 | 5,6,8,11 | |||||||||||||||||||
| Kept Companies, Inc. | First Lien Term Loan | 8.92 | % | 3M SOFR | 5.25 | % | 4/30/2029 | 396,948 | 395,847 | 394,286 | 5,6,11,20 | |||||||||||||||||||
| Kite Bidco Inc. | First Lien Term Loan | 8.23 | % | 6M SOFR | 4.50 | % | 11/19/2031 | 2,645,028 | 2,609,976 | 2,601,611 | 5,6,19 | |||||||||||||||||||
| Kite Bidco Inc. | Delayed Draw | 1.00 | % | 3M SOFR | 11/19/2031 | 661,257 | (4,191 | ) | (5,806 | ) | 5,6,7,8,19,26 | |||||||||||||||||||
| KL Stockton Intermediate II, LLC | First Lien Term Loan | 0.0 13.0 | %/ % | Fixed | 13.00 | % | 5/23/2031 | 702,026 | 692,130 | 681,905 | 9,21,24 | |||||||||||||||||||
| Lakewood Acquisition Corp | First Lien Term Loan | 9.37 | % | 3M SOFR | 5.50 | % | 1/24/2030 | 5,491,700 | 5,403,442 | 5,397,286 | 5,6,11,19 | |||||||||||||||||||
| Lakewood Acquisition Corp | Revolver | 0.50 | % | 3M SOFR | 1/24/2030 | 1,509,054 | (23,199 | ) | (25,879 | ) | 5,6,7,8,11 | |||||||||||||||||||
| Lavie Group, Inc. | Delayed Draw | 8.87 | % | 6M SOFR | 5.00 | % | 10/10/2029 | 2,436,806 | 2,404,119 | 2,413,081 | 5,6,11 | |||||||||||||||||||
| LeadVenture Inc. | Delayed Draw | 9.25 | % | 3M SOFR | 5.25 | % | 6/23/2032 | 427,389 | 415,292 | 420,864 | 5,6,8,10 | |||||||||||||||||||
| LeadVenture Inc. | Revolver | 9.07 | % | 3M SOFR | 5.25 | % | 6/23/2032 | 649,183 | 125,329 | 126,574 | 5,6,8,10 | |||||||||||||||||||
| LeadVenture Inc. | First Lien Term Loan | 9.25 | % | 3M SOFR | 5.25 | % | 6/23/2032 | 6,799,378 | 6,751,858 | 6,765,122 | 5,6,10,19 | |||||||||||||||||||
| Legacy Farms LLC | First Lien Term Loan | 8.77 | % | 1M SOFR | 5.00 | % | 12/8/2029 | 201,013 | 201,296 | 201,013 | 5,6,11,20 | |||||||||||||||||||
| Legend Buyer, Inc. | Delayed Draw | 9.50 | % | 3M SOFR | 5.50 | % | 1/19/2029 | 545,060 | 545,502 | 543,446 | 5,6,11 | |||||||||||||||||||
| Legend Buyer, Inc. | First Lien Term Loan | 9.27 | % | 3M SOFR | 5.50 | % | 1/19/2029 | 489,941 | 490,331 | 488,609 | 5,6,11,20 | |||||||||||||||||||
| Lido Advisors, LLC | Revolver | 8.51 | % | 3M SOFR | 4.75 | % | 5/10/2032 | 109,549 | 53,781 | 53,775 | 5,6,8,11 | |||||||||||||||||||
| Lido Advisors, LLC | Delayed Draw | 8.42 | % | 3M SOFR | 4.75 | % | 5/10/2032 | 93,665 | 92,810 | 93,289 | 5,6,11,19 | |||||||||||||||||||
| Lido Advisors, LLC | Delayed Draw | 8.56 | % | 3M SOFR | 4.75 | % | 5/10/2032 | 625,995 | 366,240 | 368,392 | 5,6,8,11 | |||||||||||||||||||
| Life Science Intermediate, Holdings, LLC | Delayed Draw | 9.82 | % | 1M SOFR | 6.00 | % | 6/10/2027 | 2,483,054 | 1,270,167 | 1,271,553 | 5,6,8,11 | |||||||||||||||||||
| Life Science Intermediate, Holdings, LLC | Revolver | 9.83 | % | 3M SOFR | 6.00 | % | 6/10/2027 | 475,539 | 219,017 | 220,830 | 5,6,8,11 | |||||||||||||||||||
| Lighthouse Technologies Holding Corp | First Lien Term Loan | 8.72 | % | 1M SOFR | 5.00 | % | 12/31/2029 | 3,947,507 | 3,947,434 | 3,941,418 | 5,6,11,19 | |||||||||||||||||||
The accompanying notes are an integral part of these consolidated financial statements
18
StepStone Private Credit Income Fund
Consolidated Schedule of Investments (continued)
December 31, 2025
| Investments | Investment Type | Cash Interest Rate / PIK | Reference Rate | Spread | Maturity Date | Principal Amount | Cost25 | Fair Value | Footnotes | |||||||||||||||||||||
| Direct Lending - Non-Controlled/Non-Affiliated Investments (continued) | ||||||||||||||||||||||||||||||
| Senior Secured Loans (continued) | ||||||||||||||||||||||||||||||
| North America (continued) | ||||||||||||||||||||||||||||||
| Lindstrom, LLC | Revolver | 9.20 | % | 6M SOFR | 5.50 | % | 12/30/2032 | $ | 514,469 | $ | 180,840 | $ | 180,836 | 5,6,8,11 | ||||||||||||||||
| Lindstrom, LLC | First Lien Term Loan | 9.20 | % | 3M SOFR | 5.50 | % | 12/30/2032 | 3,485,531 | 3,433,276 | 3,433,248 | 5,6,11,19 | |||||||||||||||||||
| LJ Avalon Holdings, LLC | Delayed Draw | 8.29 | % | 3M SOFR | 4.50 | % | 2/1/2030 | 3,330,417 | 548,682 | 545,728 | 5,6,8,11 | |||||||||||||||||||
| LJ Avalon Holdings, LLC | Revolver | 0.50 | % | 3M SOFR | 2/1/2029 | 666,667 | (5,934 | ) | (6,944 | ) | 5,6,7,8,11 | |||||||||||||||||||
| Management Consulting & Research, LLC | First Lien Term Loan | 8.42 | % | 3M SOFR | 4.75 | % | 8/16/2027 | 1,252,786 | 1,252,786 | 1,252,785 | 5,6,11,19 | |||||||||||||||||||
| Management Consulting & Research, LLC | Revolver | 10.38 | % | 3M PRIME | 6.62 | % | 8/16/2027 | 1,379,780 | 511,030 | 511,029 | 5,6,8,11 | |||||||||||||||||||
| Management Consulting & Research, LLC | Delayed Draw | 8.52 | % | 3M SOFR | 4.75 | % | 8/16/2027 | 1,714,301 | 1,714,301 | 1,714,301 | 5,6,11,19 | |||||||||||||||||||
| Management Consulting & Research, LLC | Delayed Draw | 8.69 | % | 3M SOFR | 4.75 | % | 8/16/2027 | 815,617 | 648,375 | 648,449 | 5,6,8,11 | |||||||||||||||||||
| Management Consulting & Research, LLC | Delayed Draw | 8.87 | % | 6M SOFR | 4.75 | % | 5/9/2031 | 31,810 | 31,810 | 31,810 | 5,6,11,19 | |||||||||||||||||||
| MDC Interior Acquisition, Inc. | First Lien Term Loan | 9.00 | % | 3M SOFR | 5.00 | % | 4/26/2030 | 592,780 | 585,238 | 582,906 | 5,6,11,20 | |||||||||||||||||||
| Meca Solutions LLC | First Lien Term Loan | 9.40 | % | 3M SOFR | 5.25 | % | 5/22/2028 | 2,278,624 | 2,280,225 | 2,275,603 | 5,6,11,20 | |||||||||||||||||||
| Mechanair LLC | Delayed Draw | 1.00 | % | 3M SOFR | 12/31/2031 | 1,263,158 | (6,282 | ) | (12,632 | ) | 5,6,7,8,11,26 | |||||||||||||||||||
| Mechanair LLC | Revolver | 9.63 | % | 3M SOFR | 6.00 | % | 12/18/2031 | 421,053 | 101,205 | 101,195 | 5,6,8,11 | |||||||||||||||||||
| Mechanair LLC | First Lien Term Loan | 9.74 | % | 1M SOFR | 6.00 | % | 12/18/2031 | 2,315,789 | 2,304,215 | 2,304,211 | 5,6,11,19 | |||||||||||||||||||
| Med Learning Group, LLC | Delayed Draw | 1.00 | % | 3M SOFR | 12/30/2027 | 416,667 | (3,646 | ) | (3,180 | ) | 5,6,7,8,11,26 | |||||||||||||||||||
| Med Learning Group, LLC | First Lien Term Loan | 9.75 | % | 1M SOFR | 5.75 | % | 12/30/2027 | 3,574,375 | 3,540,894 | 3,541,112 | 5,6,11,19 | |||||||||||||||||||
| Medical Device Inc. | First Lien Term Loan | 8.96 | % | 3M SOFR | 5.25 | % | 7/11/2029 | 916,709 | 905,349 | 905,250 | 5,6,11 | |||||||||||||||||||
| Medical Device Inc. | First Lien Term Loan | 8.96 | % | 3M SOFR | 5.25 | % | 7/11/2029 | 495,868 | 489,723 | 489,669 | 5,6,11,19 | |||||||||||||||||||
| Medical Device Inc. | Revolver | 0.50 | % | 3M SOFR | 7/11/2029 | 470,859 | (5,819 | ) | (6,091 | ) | 5,6,7,8,11 | |||||||||||||||||||
| Medrina, LLC | Delayed Draw | 9.70 | % | 3M SOFR | 6.00 | % | 10/20/2029 | 1,473,684 | 239,872 | 238,645 | 5,6,8,11 | |||||||||||||||||||
| Medrina, LLC | First Lien Term Loan | 9.72 | % | 1M SOFR | 6.00 | % | 10/20/2029 | 2,526,316 | 2,488,485 | 2,487,902 | 5,6,11,19 | |||||||||||||||||||
| Minds Buyer, LLC | Revolver | 0.50 | % | 3M SOFR | 5/3/2029 | 156,250 | (870 | ) | (989 | ) | 5,6,7,8,11 | |||||||||||||||||||
| Minds Buyer, LLC | First Lien Term Loan | 8.67 | % | 3M SOFR | 5.00 | % | 5/3/2029 | 2,815,313 | 2,797,419 | 2,797,416 | 5,6,11,19 | |||||||||||||||||||
| MIV Buyer, LLC | First Lien Term Loan | 8.42 | % | 3M SOFR | 4.75 | % | 9/19/2031 | 4,000,000 | 3,960,372 | 3,960,026 | 5,6,10,20 | |||||||||||||||||||
| MKB Intermediate Holdings, LLC | First Lien Term Loan | 8.59 | % | 1M SOFR | 4.75 | % | 11/25/2030 | 3,990,000 | 3,950,566 | 3,948,767 | 5,6,11,20 | |||||||||||||||||||
The accompanying notes are an integral part of these consolidated financial statements
19
StepStone Private Credit Income Fund
Consolidated Schedule of Investments (continued)
December 31, 2025
| Investments | Investment Type | Cash Interest Rate / PIK | Reference Rate | Spread | Maturity Date | Principal Amount | Cost25 | Fair Value | Footnotes | |||||||||||||||||||||
| Direct Lending - Non-Controlled/Non-Affiliated Investments (continued) | ||||||||||||||||||||||||||||||
| Senior Secured Loans (continued) | ||||||||||||||||||||||||||||||
| North America (continued) | ||||||||||||||||||||||||||||||
| MKD Electric, LLC | First Lien Term Loan | 10.23 | % | 3M SOFR | 6.25 | % | 5/31/2029 | $ | 1,994,977 | $ | 1,965,281 | $ | 1,960,484 | 5,6,12,19 | ||||||||||||||||
| MKD Electric, LLC | Revolver | 10.12 | % | 1M SOFR | 6.25 | % | 5/31/2029 | 479,846 | 399,188 | 397,727 | 5,6,8,12 | |||||||||||||||||||
| MKD Electric, LLC | First Lien Term Loan | 10.23 | % | 3M SOFR | 6.25 | % | 5/31/2029 | 7,344,500 | 7,198,640 | 7,214,538 | 5,6,12,19 | |||||||||||||||||||
| MoboTrex, LLC | Delayed Draw | 8.78 | % | 6M SOFR | 5.00 | % | 6/6/2031 | 1,435,897 | 227,460 | 226,713 | 5,6,8,11 | |||||||||||||||||||
| MoboTrex, LLC | Revolver | 8.71 | % | 3M SOFR | 5.00 | % | 6/7/2030 | 410,256 | 51,726 | 51,491 | 5,6,8,11 | |||||||||||||||||||
| MoboTrex, LLC | First Lien Term Loan | 9.00 | % | 3M SOFR | 5.00 | % | 6/7/2030 | 2,153,846 | 2,138,129 | 2,136,992 | 5,6,11,19 | |||||||||||||||||||
| Model N, Inc. | First Lien Term Loan | 8.75 | % | 3M SOFR | 4.75 | % | 5/13/2031 | 1,880,343 | 1,864,569 | 1,861,055 | 5,6,10,19 | |||||||||||||||||||
| Model N, Inc. | Revolver | 0.38 | % | 3M SOFR | 6/27/2031 | 207,254 | (1,640 | ) | (2,126 | ) | 5,6,7,8,10 | |||||||||||||||||||
| Model N, Inc. | Delayed Draw | 1.00 | % | 3M SOFR | 6/27/2031 | 388,601 | (1,536 | ) | (1,994 | ) | 5,6,7,8,10,26 | |||||||||||||||||||
| Moonlight Parent, Inc. | Delayed Draw | — | % | 3M SOFR | 9/9/2032 | 754,717 | (7,215 | ) | (7,392 | ) | 5,6,7,8,10,26 | |||||||||||||||||||
| Moonlight Parent, Inc. | Revolver | 0.50 | % | 3M SOFR | 9/9/2032 | 452,830 | (4,332 | ) | (4,435 | ) | 5,6,7,8,10 | |||||||||||||||||||
| Moonlight Parent, Inc. | First Lien Term Loan | 8.57 | % | 3M SOFR | 4.75 | % | 9/9/2032 | 2,792,453 | 2,765,411 | 2,765,104 | 5,6,10,19 | |||||||||||||||||||
| MoreGroup Holdings, Inc. | First Lien Term Loan | 9.25 | % | 3M SOFR | 5.25 | % | 1/16/2030 | 1,473,750 | 1,457,014 | 1,452,252 | 5,6,11,19 | |||||||||||||||||||
| MPS Newco LLC | First Lien Term Loan | 9.45 | % | 3M SOFR | 5.26 | % | 12/28/2029 | 1,187,915 | 1,180,522 | 1,178,602 | 5,6,11,20 | |||||||||||||||||||
| MPULSE Mobile, Inc. | Delayed Draw | 1.00 | % | 3M SOFR | 8/26/2032 | 307,692 | (2,235 | ) | (1 | ) | 5,6,7,8,10,26 | |||||||||||||||||||
| MPULSE Mobile, Inc. | Revolver | 0.50 | % | 3M SOFR | 8/26/2032 | 461,538 | (3,297 | ) | (1 | ) | 5,6,7,8,10 | |||||||||||||||||||
| MPULSE Mobile, Inc. | First Lien Term Loan | 8.42 | % | 3M SOFR | 4.75 | % | 8/26/2032 | 3,230,769 | 3,206,635 | 3,206,558 | 5,6,10,19 | |||||||||||||||||||
| National EC Services, Inc. | Delayed Draw | 1.00 | % | 3M SOFR | 5/6/2031 | 1,710,058 | (17,010 | ) | (17,101 | ) | 5,6,7,8,10,26 | |||||||||||||||||||
| National EC Services, Inc. | Revolver | 0.50 | % | 3M SOFR | 5/6/2030 | 342,012 | (3,402 | ) | (3,420 | ) | 5,6,7,8,10 | |||||||||||||||||||
| Nautic Angels Acquisition LLC | Delayed Draw | 9.43 | % | 6M SOFR | 5.50 | % | 2/8/2030 | 1,815,250 | 571,579 | 569,034 | 5,6,8,11 | |||||||||||||||||||
| Nautic Angels Acquisition LLC | First Lien Term Loan | 9.22 | % | 1M SOFR | 5.50 | % | 2/8/2030 | 1,383,826 | 1,376,661 | 1,372,859 | 5,6,11,20 | |||||||||||||||||||
| New Charter Technologies, Inc. | Delayed Draw | 8.97 | % | 1M SOFR | 5.25 | % | 4/17/2030 | 4,230,321 | 417,343 | 421,127 | 5,6,8,10 | |||||||||||||||||||
| New Charter Technologies, Inc. | Revolver | 0.50 | % | 1M SOFR | 10/17/2028 | 282,092 | (103 | ) | (64 | ) | 5,6,7,8,10 | |||||||||||||||||||
| NMI Acquisitionco, Inc. | First Lien Term Loan | 8.32 | % | 1M SOFR | 4.50 | % | 9/6/2028 | 740,865 | 731,878 | 730,809 | 5,6,10,19 | |||||||||||||||||||
| NMI Acquisitionco, Inc. | Delayed Draw | 8.32 | % | 1M SOFR | 4.50 | % | 9/6/2028 | 380,883 | 376,263 | 375,713 | 5,6,10,19 | |||||||||||||||||||
The accompanying notes are an integral part of these consolidated financial statements
20
StepStone Private Credit Income Fund
Consolidated Schedule of Investments (continued)
December 31, 2025
| Investments | Investment Type | Cash Interest Rate / PIK | Reference Rate |
Spread | Maturity Date | Principal Amount | Cost25 | Fair Value | Footnotes | |||||||||||||||||||||
| Direct Lending - Non-Controlled/Non-Affiliated Investments (continued) | ||||||||||||||||||||||||||||||
| Senior Secured Loans (continued) | ||||||||||||||||||||||||||||||
| North America (continued) | ||||||||||||||||||||||||||||||
| NMI Acquisitionco, Inc. | Revolver | 0.50 | % | 3M SOFR | 9/6/2028 | $ | 110,767 | $ | (1,260 | ) | $ | (1,511 | ) | 5,6,7,8,10 | ||||||||||||||||
| North Haven Spartan US Holdco LLC | First Lien Term Loan | 9.82 | % | 3M SOFR | 5.75 | % | 6/5/2026 | 647,978 | 647,978 | 647,978 | 5,6,11,19 | |||||||||||||||||||
| Obra Capital, Inc. | First Lien Term Loan | 11.09 | % | 1M SOFR | 7.25 | % | 6/21/2029 | 2,475,000 | 2,437,536 | 2,431,549 | 5,6,11,19 | |||||||||||||||||||
| OMNIA Exterior Solutions LLC | Delayed Draw | 8.92 | % | 3M SOFR | 5.25 | % | 12/29/2029 | 4,309,375 | 4,316,235 | 4,305,795 | 5,6,11,20 | |||||||||||||||||||
| OPS Wildcat Merger Sub, Inc. | First Lien Term Loan | 8.77 | % | 3M SOFR | 5.00 | % | 9/3/2030 | 684,192 | 675,683 | 675,697 | 5,6,11,19 | |||||||||||||||||||
| OPS Wildcat Merger Sub, Inc. | Revolver | 0.50 | % | 3M SOFR | 9/3/2030 | 29,412 | (346 | ) | (365 | ) | 5,6,7,8,11 | |||||||||||||||||||
| Optimizely North America Inc. | First Lien Term Loan | 8.72 | % | 1M SOFR | 5.00 | % | 10/30/2031 | 3,620,640 | 3,588,939 | 3,582,916 | 5,6,10,19 | |||||||||||||||||||
| Optimizely North America Inc. | Revolver | 0.50 | % | 3M SOFR | 10/30/2031 | 352,000 | (2,942 | ) | (3,668 | ) | 5,6,7,8,10 | |||||||||||||||||||
| OrthoFeet, Inc. | First Lien Term Loan | 9.70 | % | 6M SOFR | 5.50 | % | 7/30/2030 | 1,805,256 | 1,783,845 | 1,778,096 | 5,6,11,20 | |||||||||||||||||||
| Orthopaedic (ITC) Management Services, LLC |
First Lien Term Loan | 10.60 | % |
3M SOFR | 6.50 | % |
7/31/2028 | 20 | 1,286 | 20 | 5,6,11,20 | |||||||||||||||||||
| OSR Opco LLC | First Lien Term Loan | 6.00 | % | 3M SOFR | 6.00 | % | 3/15/2029 | 2,992,500 | 2,947,741 | 2,951,250 | 5,6,11 | |||||||||||||||||||
| OSR Opco LLC | Revolver | 0.50 | % | 3M SOFR | 3/15/2029 | 1,000,000 | (13,677 | ) | (15,000 | ) | 5,6,7,8,11 | |||||||||||||||||||
| OSR Opco LLC | Revolver | 0.50 | % | 3M SOFR | 3/15/2029 | 338,235 | (348 | ) | (199 | ) | 5,6,7,8,13 | |||||||||||||||||||
| Owl Cyber Defense Solutions, LLC | First Lien Term Loan | 9.67 | % | 1M SOFR | 5.75 | % | 9/11/2029 | 3,300,800 | 3,267,729 | 3,276,834 | 5,6,11,19 | |||||||||||||||||||
| Owl Cyber Defense Solutions, LLC | Revolver | 9.48 | % | 1M SOFR | 5.75 | % | 9/11/2029 | 315,137 | 111,105 | 111,167 | 5,6,8,11 | |||||||||||||||||||
| Packaging Coordinators Midco, Inc. | Delayed Draw | — | % | 6M SOFR | 7/9/2032 | 357,462 | — | (2,487 | ) | 5,6,8,10,26 | ||||||||||||||||||||
| Packaging Coordinators Midco, Inc. | Delayed Draw | 8.59 | % | 6M SOFR | 4.75 | % | 7/9/2032 | 51,524 | 12,976 | 12,976 | 5,6,8,10 | |||||||||||||||||||
| Packaging Coordinators Midco, Inc. | First Lien Term Loan | 8.94 | % | 3M SOFR | 4.50 | % | 7/11/2032 | 1,867,294 | 1,863,095 | 1,844,877 | 5,6,10,19 | |||||||||||||||||||
| Packaging Coordinators Midco, Inc. | First Lien Term Loan | 8.94 | % | 3M SOFR | 4.50 | % | 7/11/2032 | 380,566 | 380,566 | 375,997 | 5,6,10 | |||||||||||||||||||
| Packaging Coordinators Midco, Inc. | Revolver | 0.50 | % | 6M SOFR | 7/9/2032 | 374,524 | (1,509 | ) | (703 | ) | 5,6,7,8,10 | |||||||||||||||||||
| Packaging Coordinators Midco, Inc. | Delayed Draw | — | % | 1M SOFR | 7/9/2032 | 487,420 | (4,725 | ) | (4,790 | ) | 5,6,7,8,10,26 | |||||||||||||||||||
| Packaging Coordinators Midco, Inc. | Delayed Draw | — | % | 1M SOFR | 7/9/2032 | 475,531 | (4,610 | ) | (1 | ) | 5,6,7,8,10,26 | |||||||||||||||||||
| PAG Holding Corp. | First Lien Term Loan | 8.42 | % | 3M SOFR | 4.75 | % | 12/21/2029 | 821,633 | 817,547 | 817,582 | 5,6,11,19 | |||||||||||||||||||
| PAG Holding Corp. | Revolver | 10.50 | % | 3M PRIME | 3.75 | % | 12/21/2029 | 392,426 | 88,710 | 94,182 | 5,6,8,11 | |||||||||||||||||||
The accompanying notes are an integral part of these consolidated financial statements
21
StepStone Private Credit Income Fund
Consolidated Schedule of Investments (continued)
December 31, 2025
| Investments | Investment Type | Cash Interest Rate / PIK | Reference Rate | Spread | Maturity Date | Principal Amount | Cost25 | Fair Value | Footnotes | |||||||||||||||||||||
| Direct Lending - Non-Controlled/Non-Affiliated Investments (continued) | ||||||||||||||||||||||||||||||
| Senior Secured Loans (continued) | ||||||||||||||||||||||||||||||
| North America (continued) | ||||||||||||||||||||||||||||||
| PAG Holding Corp. | First Lien Term Loan | 8.42 | % | 3M SOFR | 4.75 | % | 12/21/2029 | $ | 3,562,479 | $ | 3,531,586 | $ | 3,533,126 | 5,6,11,19 | ||||||||||||||||
| PAI Financing Merger Sub LLC | First Lien Term Loan | 8.17 | % | 3M SOFR | 4.50 | % | 2/13/2032 | 4,335,607 | 4,276,665 | 4,273,091 | 5,6,10,19 | |||||||||||||||||||
| PAI Financing Merger Sub LLC | Revolver | 8.17 | % | 3M SOFR | 4.50 | % | 2/13/2032 | 924,296 | 119,876 | 118,715 | 5,6,8,10 | |||||||||||||||||||
| Par Excellence Holdings, Inc. | First Lien Term Loan | 8.74 | % | 3M SOFR | 5.00 | % | 9/3/2030 | 6,201,882 | 6,109,675 | 6,110,375 | 5,6,11,19 | |||||||||||||||||||
| Patriot Foods Buyer, Inc. | Delayed Draw | 9.09 | % | 3M SOFR | 5.25 | % | 12/24/2029 | 2,739,726 | 907,868 | 910,959 | 5,6,8,11 | |||||||||||||||||||
| Pave America Holding, LLC | Delayed Draw | 8.64 | % | 3M SOFR | 4.75 | % | 8/27/2032 | 864,227 | 245,710 | 254,322 | 5,6,8,10 | |||||||||||||||||||
| Pave America Holding, LLC | Revolver | 8.42 | % | 3M SOFR | 4.75 | % | 8/27/2032 | 648,649 | 188,348 | 194,463 | 5,6,8,10 | |||||||||||||||||||
| Pave America Holding, LLC | First Lien Term Loan | 6.38 2.88 | %/ % | 3M SOFR | 5.25 | % | 8/27/2032 | 2,504,940 | 2,480,169 | 2,479,242 | 5,10,19,21 | |||||||||||||||||||
| PCS Midco, Inc. | First Lien Term Loan | 9.42 | % | 3M SOFR | 5.75 | % | 3/1/2030 | 601,767 | 594,189 | 593,881 | 5,6,11,19 | |||||||||||||||||||
| PCS Midco, Inc. | Delayed Draw | 9.42 | % | 3M SOFR | 5.75 | % | 3/1/2030 | 6,208 | 3,180 | 3,191 | 5,6,8,11 | |||||||||||||||||||
| PCS Midco, Inc. | Revolver | 0.50 | % | 3M SOFR | 3/1/2030 | 6,250 | (69 | ) | (82 | ) | 5,6,7,8,11 | |||||||||||||||||||
| Pediatric Home Respiratory Services, LLC | First Lien Term Loan | 9.10 | % | 6M SOFR | 5.50 | % | 12/23/2030 | 4,000,000 | 3,990,011 | 3,989,714 | 5,6,10,19 | |||||||||||||||||||
| PestCo, LLC | Delayed Draw | 8.58 | % | 3M SOFR | 4.75 | % | 8/6/2030 | 671,141 | 171,395 | 170,601 | 5,6,8,11 | |||||||||||||||||||
| PestCo, LLC | Revolver | 0.50 | % | 3M SOFR | 8/6/2030 | 268,456 | (1,236 | ) | (1,558 | ) | 5,6,7,8,11 | |||||||||||||||||||
| PestCo, LLC | First Lien Term Loan | 8.59 | % | 3M SOFR | 4.75 | % | 8/6/2030 | 3,052,752 | 3,037,559 | 3,035,032 | 5,6,11,19 | |||||||||||||||||||
| PGI Parent LLC | Revolver | 0.50 | % | 3M SOFR | 12/31/2031 | 359,909 | (3,599 | ) | (3,599 | ) | 5,6,7,8,11 | |||||||||||||||||||
| PGI Parent LLC | First Lien Term Loan | 8.67 | % | 3M SOFR | 5.00 | % | 12/31/2031 | 1,979,501 | 1,959,706 | 1,959,706 | 5,6,11,19 | |||||||||||||||||||
| Pharmalogic Holdings Corp | First Lien Term Loan | 8.72 | % | 1M SOFR | 5.00 | % | 6/21/2030 | 2,919,275 | 2,884,075 | 2,878,867 | 5,6,11,19 | |||||||||||||||||||
| Pharmalogic Holdings Corp | Delayed Draw | 8.84 | % | 3M SOFR | 5.00 | % | 6/21/2030 | 1,036,269 | 199,852 | 200,892 | 5,6,8,11 | |||||||||||||||||||
| PK Purchaser LLC | First Lien Term Loan | 9.14 | % | 3M SOFR | 5.00 | % | 9/19/2029 | 3,960,000 | 3,928,741 | 3,625,381 | 5,6,11,19 | |||||||||||||||||||
| Play Holdings, Inc. | Revolver | 9.17 | % | 1M SOFR | 5.25 | % | 10/29/2030 | 233,010 | 32,469 | 32,245 | 5,6,8,10 | |||||||||||||||||||
| Play Holdings, Inc. | First Lien Term Loan | 9.07 | % | 3M SOFR | 5.25 | % | 10/29/2031 | 3,766,990 | 3,710,591 | 3,708,755 | 5,6,10,19 | |||||||||||||||||||
| PMA Parent Holdings, LLC | First Lien Term Loan | 8.75 | % | 3M SOFR | 4.75 | % | 1/31/2031 | 2,324,309 | 2,303,250 | 2,292,176 | 5,6,10,19 | |||||||||||||||||||
The accompanying notes are an integral part of these consolidated financial statements
22
StepStone Private Credit Income Fund
Consolidated Schedule of Investments (continued)
December 31, 2025
| Investments | Investment Type | Cash Interest Rate / PIK | Reference Rate | Spread | Maturity Date | Principal Amount | Cost25 | Fair Value | Footnotes | |||||||||||||||||||||
| Direct Lending - Non-Controlled/Non-Affiliated Investments (continued) | ||||||||||||||||||||||||||||||
| Senior Secured Loans (continued) | ||||||||||||||||||||||||||||||
| North America (continued) | ||||||||||||||||||||||||||||||
| PMA Parent Holdings, LLC | Revolver | 0.50 | % | 3M SOFR | 1/31/2031 | $ | 104,500 | $ | (846 | ) | $ | (1,228 | ) | 5,6,7,8,10,19 | ||||||||||||||||
| PMA Parent Holdings, LLC | Revolver | 0.50 | % | 3M SOFR | 1/31/2031 | 97,114 | (916 | ) | (1,141 | ) | 5,6,7,8,10 | |||||||||||||||||||
| Point Quest Group, Inc. | Delayed Draw | 1.00 | % | 1M SOFR | 11/13/2031 | 487,805 | (2,386 | ) | (2,397 | ) | 5,6,7,8,10,26 | |||||||||||||||||||
| Point Quest Group, Inc. | Revolver | 0.50 | % | 6M SOFR | 11/13/2031 | 292,683 | (1,432 | ) | (1,438 | ) | 5,6,7,8,10 | |||||||||||||||||||
| Point Quest Group, Inc. | First Lien Term Loan | 8.59 | % | 3M SOFR | 4.75 | % | 11/13/2031 | 3,219,512 | 3,203,440 | 3,203,694 | 5,6,10,19 | |||||||||||||||||||
| PPW Aero Buyer, Inc. | Delayed Draw | 8.67 | % | 3M SOFR | 5.00 | % | 9/30/2031 | 402,964 | 397,888 | 399,725 | 5,6,11 | |||||||||||||||||||
| PPW Aero Buyer, Inc. | Delayed Draw | 8.67 | % | 3M SOFR | 5.00 | % | 9/30/2031 | 789,733 | 782,870 | 783,401 | 5,6,11,19 | |||||||||||||||||||
| PPW Aero Buyer, Inc. | Delayed Draw | 0.50 | % | 3M SOFR | 9/30/2031 | 44,980 | (261 | ) | (298 | ) | 5,6,7,8,11,26 | |||||||||||||||||||
| PPW Aero Buyer, Inc. | First Lien Term Loan | 8.67 | % | 3M SOFR | 5.00 | % | 9/30/2031 | 268,271 | 266,733 | 266,931 | 5,6,11,19 | |||||||||||||||||||
| Premise Health Holding Corp | Delayed Draw | 1.00 | % | 3M SOFR | 11/8/2032 | 74,465 | (729 | ) | (741 | ) | 5,6,7,8,10,26 | |||||||||||||||||||
| Premise Health Holding Corp | First Lien Term Loan | 8.17 | % | 3M SOFR | 4.50 | % | 11/8/2032 | 176,288 | 174,552 | 174,532 | 5,6,10,19 | |||||||||||||||||||
| Prestige PEO Holdings, LLC | Revolver | 9.41 | % | 3M SOFR | 5.50 | % | 1/14/2030 | 346,831 | 168,904 | 168,953 | 5,6,8,12 | |||||||||||||||||||
| Prestige PEO Holdings, LLC | First Lien Term Loan | 9.41 | % | 3M SOFR | 5.50 | % | 1/14/2030 | 3,614,349 | 3,564,904 | 3,567,848 | 5,6,12,19 | |||||||||||||||||||
| PRGX Global, Inc. | Delayed Draw | 1.00 | % | 3M SOFR | 12/20/2030 | 876,121 | (1,872 | ) | (1,296 | ) | 5,6,7,8,11,26 | |||||||||||||||||||
| PRGX Global, Inc. | First Lien Term Loan | 9.49 | % | 3M SOFR | 5.50 | % | 12/20/2030 | 7,227,999 | 7,192,220 | 7,198,961 | 5,6,11,19 | |||||||||||||||||||
| PrimeFlight Acquisition, LLC | First Lien Term Loan | 9.12 | % | 3M SOFR | 5.25 | % | 5/1/2029 | 697,183 | 693,728 | 694,469 | 5,6,11,19 | |||||||||||||||||||
| PrimeFlight Acquisition, LLC | First Lien Term Loan | 9.09 | % | 3M SOFR | 5.25 | % | 5/1/2029 | 465,575 | 460,940 | 461,081 | 5,6,11,19 | |||||||||||||||||||
| PTSH Intermediate Holdings, LLC | First Lien Term Loan | 9.65 | % | 3M SOFR | 5.50 | % | 12/17/2027 | 6,277,038 | 6,196,916 | 6,216,167 | 5,6,10,19 | |||||||||||||||||||
| Puma Buyer, LLC | First Lien Term Loan | 8.25 | % | 3M SOFR | 4.25 | % | 3/29/2032 | 8,568,056 | 8,509,193 | 8,568,056 | 5,6,9,19 | |||||||||||||||||||
| Puma Buyer, LLC | Revolver | 0.38 | % | 3M SOFR | 3/29/2032 | 1,388,889 | (9,287 | ) | — | 5,6,7,8,9 | ||||||||||||||||||||
| Puris, LLC | First Lien Term Loan | 9.73 | % | 3M SOFR | 5.75 | % | 6/30/2031 | 2,967,722 | 2,936,479 | 2,950,726 | 5,6,11,19 | |||||||||||||||||||
| Purple Cow Buyer, LLC | Delayed Draw | 8.90 | % | 3M SOFR | 5.00 | % | 11/5/2030 | 2,979,175 | 341,325 | 338,128 | 5,6,8,11 | |||||||||||||||||||
| Quantum Design International | Delayed Draw | 1.00 | % | 3M SOFR | 10/11/2030 | 2,439,024 | (18,484 | ) | (24,268 | ) | 5,6,7,8,11,26 | |||||||||||||||||||
| Quantum Design International | Delayed Draw | 1.00 | % | 3M SOFR | 10/11/2030 | 1,626,016 | (12,322 | ) | (16,179 | ) | 5,6,7,8,11,26 | |||||||||||||||||||
| Quantum Design International | First Lien Term Loan | 8.48 | % | 1M SOFR | 4.75 | % | 10/11/2030 | 900,735 | 902,930 | 891,739 | 5,6,11,20 | |||||||||||||||||||
The accompanying notes are an integral part of these consolidated financial statements
23
StepStone Private Credit Income Fund
Consolidated Schedule of Investments (continued)
December 31, 2025
| Investments | Investment Type | Cash Interest Rate / PIK | Reference Rate | Spread | Maturity Date | Principal Amount | Cost25 | Fair Value | Footnotes | |||||||||||||||||||||
| Direct Lending - Non-Controlled/Non-Affiliated Investments (continued) | ||||||||||||||||||||||||||||||
| Senior Secured Loans (continued) | ||||||||||||||||||||||||||||||
| North America (continued) | ||||||||||||||||||||||||||||||
| Quick Quack Car Wash Holdings, LLC | Delayed Draw | 8.47 | % | 1M SOFR | 4.75 | % | 6/10/2031 | $ | 6,700,000 | $ | 1,352,048 | $ | 1,352,467 | 5,6,8,10 | ||||||||||||||||
| Quick Quack Car Wash Holdings, LLC | Delayed Draw | 8.67 | % | 1M SOFR | 4.75 | % | 6/10/2031 | 3,291,251 | 3,268,198 | 3,265,278 | 5,6,10 | |||||||||||||||||||
| Railpros Parent, LLC | First Lien Term Loan | 8.38 | % | 3M SOFR | 4.50 | % | 5/24/2032 | 1,441,901 | 1,428,610 | 1,428,794 | 5,6,10,19 | |||||||||||||||||||
| Railpros Parent, LLC | Revolver | 0.38 | % | 3M SOFR | 5/24/2032 | 222,387 | (2,129 | ) | (2,022 | ) | 5,6,7,8,10 | |||||||||||||||||||
| Railpros Parent, LLC | Delayed Draw | 1.00 | % | 3M SOFR | 5/24/2032 | 444,774 | (4,062 | ) | (1,796 | ) | 5,6,7,8,10,26 | |||||||||||||||||||
| RBFD Buyer, LLC | First Lien Term Loan | 8.47 | % | 1M SOFR | 4.75 | % | 10/31/2030 | 786,106 | 777,466 | 776,622 | 5,6,11,19 | |||||||||||||||||||
| RBFD Buyer, LLC | Delayed Draw | 8.63 | % | 1M SOFR | 4.75 | % | 10/31/2030 | 324,008 | 133,461 | 133,808 | 5,6,8,11 | |||||||||||||||||||
| RBFD Buyer, LLC | Revolver | 0.50 | % | 3M SOFR | 10/31/2030 | 81,191 | (851 | ) | (979 | ) | 5,6,7,8,11 | |||||||||||||||||||
| RCP Nats Purchaser, LLC | Revolver | 0.50 | % | 3M SOFR | 3/19/2032 | 784,055 | (5,231 | ) | (9,560 | ) | 5,6,7,8,10 | |||||||||||||||||||
| RCP Nats Purchaser, LLC | Delayed Draw | 0.75 | % | 3M SOFR | 3/19/2032 | 1,120,079 | (1,247 | ) | (6,644 | ) | 5,6,7,8,10,26 | |||||||||||||||||||
| RCP Nats Purchaser, LLC | First Lien Term Loan | 8.69 | % | 3M SOFR | 5.00 | % | 3/19/2032 | 5,586,394 | 5,544,969 | 5,546,388 | 5,6,10,19 | |||||||||||||||||||
| Recipe Acquisition Corp. | First Lien Term Loan | 8.67 | % | 3M SOFR | 5.00 | % | 7/31/2031 | 2,553,203 | 2,542,244 | 2,552,859 | 5,6,11,19 | |||||||||||||||||||
| Recipe Acquisition Corp. | Delayed Draw | 8.67 | % | 3M SOFR | 5.00 | % | 7/31/2031 | 728,079 | 46,885 | 47,104 | 5,6,8,11 | |||||||||||||||||||
| Recipe Acquisition Corp. | Revolver | 8.67 | % | 3M SOFR | 5.00 | % | 7/31/2031 | 291,326 | 151,103 | 152,275 | 5,6,8,11 | |||||||||||||||||||
| Red Fox CD Acquisition Corporation | Delayed Draw | 9.99 | % | 3M SOFR | 6.00 | % | 3/4/2030 | 2,526,469 | 1,006,007 | 1,001,701 | 5,6,8,11 | |||||||||||||||||||
| Refocus Management Services, LLC | Delayed Draw | 9.50 | % | 3M SOFR | 5.50 | % | 2/14/2029 | 2,756,194 | 2,729,313 | 2,720,958 | 5,6,11 | |||||||||||||||||||
| Refocus Management Services, LLC | First Lien Term Loan | 9.27 | % | 3M SOFR | 5.50 | % | 2/14/2029 | 457,028 | 437,079 | 451,200 | 5,6,11,20 | |||||||||||||||||||
| REP TEC Intermediate Holdings, Inc. | Revolver | 0.50 | % | 3M SOFR | 5/30/2031 | 517,680 | (2,531 | ) | (2,649 | ) | 5,6,7,8,11 | |||||||||||||||||||
| REP TEC Intermediate Holdings, Inc. | First Lien Term Loan | 8.79 | % | 3M SOFR | 4.75 | % | 5/30/2031 | 3,473,614 | 3,456,322 | 3,455,798 | 5,6,11,19 | |||||||||||||||||||
| Resixperts Holdco, LLC | Delayed Draw | 8.87 | % | 3M SOFR | 5.00 | % | 5/2/2030 | 1,871,199 | 263,203 | 262,236 | 5,6,8,11 | |||||||||||||||||||
| Resixperts Holdco, LLC | Revolver | 0.50 | % | 3M SOFR | 5/2/2030 | 233,900 | (3,157 | ) | (3,280 | ) | 5,6,7,8,11 | |||||||||||||||||||
| Resixperts Holdco, LLC | First Lien Term Loan | 8.89 | % | 3M SOFR | 5.00 | % | 5/2/2030 | 496,492 | 489,647 | 489,529 | 5,6,11 | |||||||||||||||||||
| Resixperts Holdco, LLC | First Lien Term Loan | 8.89 | % | 3M SOFR | 5.00 | % | 5/2/2030 | 124,123 | 122,412 | 122,382 | 5,6,11,19 | |||||||||||||||||||
| Rev Up Brands, LLC | First Lien Term Loan | 9.40 | % | 1M SOFR | 5.00 | % | 2/28/2030 | 4,912,594 | 4,898,770 | 4,879,123 | 5,6,10,20 | |||||||||||||||||||
| Riverside Assessments LLC | First Lien Term Loan | 9.12 | % | 6M SOFR | 5.25 | % | 3/19/2031 | 2,702,436 | 2,706,738 | 2,697,317 | 5,6,10,20 | |||||||||||||||||||
The accompanying notes are an integral part of these consolidated financial statements
24
StepStone Private Credit Income Fund
Consolidated Schedule of Investments (continued)
December 31, 2025
| Investments | Investment Type | Cash Interest Rate / PIK | Reference Rate | Spread | Maturity Date | Principal Amount | Cost25 | Fair Value | Footnotes | |||||||||||||||||||||
| Direct Lending - Non-Controlled/Non-Affiliated Investments (continued) | ||||||||||||||||||||||||||||||
| Senior Secured Loans (continued) | ||||||||||||||||||||||||||||||
| North America (continued) | ||||||||||||||||||||||||||||||
| Rocket Bidco, Inc. | First Lien Term Loan | 8.60 | % | 3M SOFR | 4.75 | % | 11/1/2030 | $ | 3,712,500 | $ | 3,652,261 | $ | 3,618,036 | 5,6,11,19 | ||||||||||||||||
| Rocket Youth Brands HoldCo LLC | Delayed Draw | 1.00 | % | 3M SOFR | 6/20/2031 | 1,166,015 | (6,082 | ) | (18,438 | ) | 5,6,7,8,11,26 | |||||||||||||||||||
| Rocket Youth Brands HoldCo LLC | Revolver | 0.50 | % | 3M SOFR | 6/20/2031 | 174,902 | (798 | ) | (2,766 | ) | 5,6,7,8,11 | |||||||||||||||||||
| Rocket Youth Brands HoldCo LLC | First Lien Term Loan | 8.67 | % | 3M SOFR | 5.00 | % | 6/20/2031 | 1,166,015 | 1,160,576 | 1,147,577 | 5,6,11,19 | |||||||||||||||||||
| Rotolo Consultants, Inc. | Delayed Draw | 9.76 | % | 1M SOFR | 5.75 | % | 1/31/2031 | 266,091 | 265,301 | 264,349 | 5,6,11 | |||||||||||||||||||
| RPM Purchasers, Inc. | Delayed Draw | 10.28 | % | 1M SOFR | 6.25 | % | 9/11/2028 | 493,651 | 288,117 | 288,403 | 5,6,8,14 | |||||||||||||||||||
| RPMS LLC | Delayed Draw | 9.72 | % | 1M SOFR | 5.75 | % | 8/4/2027 | 1,469,363 | 1,452,873 | 1,453,191 | 5,6,11 | |||||||||||||||||||
| RRA Corporate, LLC | Delayed Draw | 9.07 | % | 3M SOFR | 5.14 | % | 8/15/2029 | 35,126 | 23,246 | 23,304 | 5,6,8,11 | |||||||||||||||||||
| RRA Corporate, LLC | Revolver | 9.22 | % | 3M SOFR | 5.30 | % | 8/15/2029 | 35,211 | 24,576 | 24,367 | 5,6,8,11 | |||||||||||||||||||
| RRA Corporate, LLC | First Lien Term Loan | 9.25 | % | 3M SOFR | 5.25 | % | 8/15/2029 | 1,651,541 | 1,630,127 | 1,621,753 | 5,6,11,19 | |||||||||||||||||||
| Rushmore Investment III LLC | First Lien Term Loan | 8.87 | % | 3M SOFR | 5.00 | % | 10/18/2030 | 3,936,172 | 3,904,136 | 3,917,412 | 5,6,11,19 | |||||||||||||||||||
| SAAB Purchaser, Inc. | Delayed Draw | 0.50 | % | 3M SOFR | 11/12/2031 | 1,846,154 | (8,820 | ) | (8,269 | ) | 5,6,7,8,10,26 | |||||||||||||||||||
| SAAB Purchaser, Inc. | Revolver | 0.38 | % | 3M SOFR | 11/12/2031 | 246,154 | (1,183 | ) | (1,103 | ) | 5,6,7,8,10 | |||||||||||||||||||
| SAAB Purchaser, Inc. | First Lien Term Loan | 8.75 | % | 3M SOFR | 4.75 | % | 11/12/2031 | 1,907,692 | 1,898,424 | 1,899,147 | 5,6,10,19 | |||||||||||||||||||
| Sabel Systems Technology Solutions, LLC | Revolver | 0.50 | % | 3M SOFR | 10/31/2030 | 79,422 | (847 | ) | (931 | ) | 5,6,7,8,11 | |||||||||||||||||||
| Sabel Systems Technology Solutions, LLC | First Lien Term Loan | 9.92 | % | 1M SOFR | 6.00 | % | 10/31/2030 | 1,046,001 | 1,034,301 | 1,033,706 | 5,6,11,19 | |||||||||||||||||||
| SageBrush Buyer, LLC | Revolver | 0.50 | % | 3M SOFR | 7/1/2030 | 258,621 | (2,948 | ) | (5,311 | ) | 5,6,7,8,11 | |||||||||||||||||||
| SageBrush Buyer, LLC | First Lien Term Loan | 8.72 | % | 1M SOFR | 5.00 | % | 7/1/2030 | 1,925,431 | 1,901,180 | 1,885,887 | 5,6,11,19 | |||||||||||||||||||
| Salisbury House, LLC | Delayed Draw | 1.00 | % | 3M SOFR | 8/18/2032 | 513,183 | (2,477 | ) | (2,861 | ) | 5,6,7,8,26 | |||||||||||||||||||
| Salisbury House, LLC | Revolver | 9.07 | % | 3M SOFR | 5.00 | % | 8/18/2032 | 342,122 | 90,718 | 90,466 | 5,6,8 | |||||||||||||||||||
| Salisbury House, LLC | First Lien Term Loan | 8.73 | % | 6M SOFR | 5.00 | % | 8/18/2032 | 2,552,232 | 2,539,507 | 2,538,005 | 5,6,19 | |||||||||||||||||||
| Salt Dental Collective, LLC | Delayed Draw | 10.57 | % | 1M SOFR | 6.75 | % | 2/15/2028 | 415,750 | 415,750 | 415,749 | 5,6,11,19 | |||||||||||||||||||
| Salt Dental Collective, LLC | Revolver | 10.57 | % | 1M SOFR | 6.75 | % | 2/15/2028 | 720,308 | 660,283 | 660,282 | 5,6,8,11 | |||||||||||||||||||
| Salt Dental Collective, LLC | First Lien Term Loan | 10.57 | % | 1M SOFR | 6.75 | % | 2/15/2028 | 27,697 | 27,697 | 27,697 | 5,6,11,19 | |||||||||||||||||||
| Salt Dental Collective, LLC | First Lien Term Loan | 10.81 | % | 1M SOFR | 6.75 | % | 2/15/2028 | 39,574 | 39,574 | 39,574 | 5,6,11,19 | |||||||||||||||||||
The accompanying notes are an integral part of these consolidated financial statements
25
StepStone Private Credit Income Fund
Consolidated Schedule of Investments (continued)
December 31, 2025
| Investments | Investment Type | Cash Interest Rate / PIK | Reference Rate | Spread | Maturity Date | Principal Amount | Cost25 | Fair Value | Footnotes | |||||||||||||||||||||
| Direct Lending - Non-Controlled/Non-Affiliated Investments (continued) | ||||||||||||||||||||||||||||||
| Senior Secured Loans (continued) | ||||||||||||||||||||||||||||||
| North America (continued) | ||||||||||||||||||||||||||||||
| Salt Dental Collective, LLC | First Lien Term Loan | 10.67 | % | 1M SOFR | 6.75 | % | 2/15/2028 | $ | 133,693 | $ | 133,693 | $ | 133,692 | 5,6,11,19 | ||||||||||||||||
| Salt Dental Collective, LLC | First Lien Term Loan | 10.81 | % | 1M SOFR | 6.75 | % | 2/15/2028 | 135,808 | 135,808 | 135,808 | 5,6,11,19 | |||||||||||||||||||
| Salt Dental Collective, LLC | First Lien Term Loan | 10.67 | % | 1M SOFR | 6.75 | % | 2/15/2028 | 209,368 | 209,368 | 209,368 | 5,6,11,19 | |||||||||||||||||||
| Salt Dental Collective, LLC | First Lien Term Loan | 10.81 | % | 1M SOFR | 6.75 | % | 2/15/2028 | 105,619 | 105,619 | 105,619 | 5,6,11,19 | |||||||||||||||||||
| Salt Dental Collective, LLC | First Lien Term Loan | 10.67 | % | 1M SOFR | 6.75 | % | 2/15/2028 | 2,384,453 | 2,384,453 | 2,384,451 | 5,6,11,19 | |||||||||||||||||||
| Salt Dental Collective, LLC | First Lien Term Loan | 10.57 | % | 1M SOFR | 6.75 | % | 2/15/2028 | 438,673 | 438,673 | 438,672 | 5,6,11,19 | |||||||||||||||||||
| Salt Dental Collective, LLC | First Lien Term Loan | 10.81 | % | 1M SOFR | 6.75 | % | 2/15/2028 | 962,376 | 962,376 | 962,376 | 5,6,11,19 | |||||||||||||||||||
| Salute Mission Critical, LLC | Delayed Draw | 9.18 | % | 1M SOFR | 5.22 | % | 11/30/2029 | 1,116,268 | 1,106,236 | 1,113,025 | 5,6,11,19 | |||||||||||||||||||
| Salute Mission Critical, LLC | First Lien Term Loan | 9.18 | % | 1M SOFR | 5.22 | % | 11/30/2029 | 93,345 | 92,521 | 92,582 | 5,6,11 | |||||||||||||||||||
| Salute Mission Critical, LLC | Delayed Draw | 1.00 | % | 3M SOFR | 11/30/2029 | 147,954 | (578 | ) | (464 | ) | 5,6,7,8,11,26 | |||||||||||||||||||
| Salute Mission Critical, LLC | First Lien Term Loan | 9.18 | % | 1M SOFR | 5.22 | % | 11/30/2029 | 2,623,323 | 2,597,493 | 2,595,530 | 5,6,11,19 | |||||||||||||||||||
| Sequon, LLC | First Lien Term Loan | 9.50 | % | 1M SOFR | 5.25 | % | 12/29/2028 | 3,990,000 | 3,951,862 | 3,953,326 | 5,6,11,20 | |||||||||||||||||||
| Shock Doctor Intermediate LLC | First Lien Term Loan | 9.17 | % | 3M SOFR | 5.50 | % | 11/20/2029 | 2,133,865 | 2,137,305 | 2,132,662 | 5,6,11,20 | |||||||||||||||||||
| Sigma Defense Systems LLC | First Lien Term Loan | 10.82 | % | 3M SOFR | 6.75 | % | 12/18/2027 | 785,075 | 773,993 | 774,422 | 5,6,11,19 | |||||||||||||||||||
| Sigma Defense Systems LLC | Revolver | 0.50 | % | 3M SOFR | 12/18/2027 | 25,000 | (826 | ) | (339 | ) | 5,6,7,8,11 | |||||||||||||||||||
| Sigma Defense Systems, Inc. | Delayed Draw | 1.00 | % | 1M SOFR | 12/18/2027 | 211,330 | (3,777 | ) | (3,951 | ) | 5,6,7,8,11,26 | |||||||||||||||||||
| SkyMark Refuelers, LLC | Delayed Draw | 8.20 | % | 3M SOFR | 4.50 | % | 12/16/2032 | 643,457 | 427,470 | 427,429 | 5,6,8,10 | |||||||||||||||||||
| SkyMark Refuelers, LLC | Delayed Draw | — | % | 3M SOFR | 12/16/2032 | 960,384 | (9,544 | ) | (9,604 | ) | 5,6,7,8,10,26 | |||||||||||||||||||
| SkyMark Refuelers, LLC | Revolver | 0.50 | % | 3M SOFR | 12/16/2032 | 480,192 | (4,772 | ) | (4,802 | ) | 5,6,7,8,10 | |||||||||||||||||||
| SkyMark Refuelers, LLC | First Lien Term Loan | 8.21 | % | 3M SOFR | 4.50 | % | 12/16/2032 | 1,915,966 | 1,896,895 | 1,896,807 | 5,6,10,19 | |||||||||||||||||||
| Socket Holding Corporation | First Lien Term Loan | 8.97 | % | 1M SOFR | 5.25 | % | 3/31/2031 | 987,406 | 972,697 | 975,787 | 5,6,10,19 | |||||||||||||||||||
| Socket Holding Corporation | Revolver | 0.50 | % | 3M SOFR | 3/31/2031 | 202,545 | (2,267 | ) | (1,868 | ) | 5,6,7,8,10 | |||||||||||||||||||
| Socket Holding Corporation | Delayed Draw | 8.97 | % | 1M SOFR | 5.25 | % | 3/31/2031 | 784,861 | 204,225 | 210,469 | 5,6,8,10 | |||||||||||||||||||
| Socket Holding Corporation | First Lien Term Loan | 8.97 | % | 1M SOFR | 5.25 | % | 3/31/2031 | 974,241 | 974,241 | 967,169 | 5,6,10,19 | |||||||||||||||||||
| Solairus Holdings, LLC | Delayed Draw | 0.50 | % | 3M SOFR | 11/13/2028 | 1,173,709 | (6,654 | ) | (16,883 | ) | 5,6,7,8,11,26 | |||||||||||||||||||
The accompanying notes are an integral part of these consolidated financial statements
26
StepStone Private Credit Income Fund
Consolidated Schedule of Investments (continued)
December 31, 2025
| Investments | Investment Type | Cash Interest Rate / PIK | Reference Rate | Spread | Maturity Date | Principal Amount | Cost25 | Fair Value | Footnotes | |||||||||||||||||||||
| Direct Lending - Non-Controlled/Non-Affiliated Investments (continued) | ||||||||||||||||||||||||||||||
| Senior Secured Loans (continued) | ||||||||||||||||||||||||||||||
| North America (continued) | ||||||||||||||||||||||||||||||
| Solairus Holdings, LLC | First Lien Term Loan | 9.67 | % | 3M SOFR | 6.00 | % | 11/13/2028 | $ | 3,203,492 | $ | 3,164,875 | $ | 3,157,412 | 5,6,11,19 | ||||||||||||||||
| Solairus Holdings, LLC | Revolver | 9.68 | % | 3M SOFR | 6.00 | % | 11/13/2028 | 528,169 | 127,774 | 126,206 | 5,6,8,11 | |||||||||||||||||||
| Solairus Holdings, LLC | Revolver | 0.50 | % | 3M SOFR | 7/22/2030 | 67,126 | 139 | 168 | 5,6,7,8,11 | |||||||||||||||||||||
| Solairus Holdings, LLC | Delayed Draw | 1.00 | % | 3M SOFR | 7/22/2030 | 268,502 | (558 | ) | (141 | ) | 5,6,7,8,11,26 | |||||||||||||||||||
| Sonny's Enterprises, LLC | Delayed Draw | 9.49 | % | 3M SOFR | 5.50 | % | 8/5/2028 | 149,850 | 11,054 | 10,677 | 5,6,8,11 | |||||||||||||||||||
| Soteria Flexibles Corp. | First Lien Term Loan | 9.17 | % | 3M SOFR | 5.50 | % | 8/15/2029 | 2,620,872 | 2,623,284 | 2,609,096 | 5,6,11,20 | |||||||||||||||||||
| SourceHOV Tax, LLC | First Lien Term Loan | 9.58 | % | 1M SOFR | 5.75 | % | 4/6/2028 | 4,873,768 | 4,704,731 | 4,827,490 | 5,6,11,20 | |||||||||||||||||||
| Spring Dental Intermediate, LLC | Delayed Draw | 10.03 | % | 3M SOFR | 6.00 | % | 12/23/2026 | 4,193,847 | 3,625,755 | 3,622,106 | 5,6,8,11 | |||||||||||||||||||
| Springline Advisory Intermediate, LLC | Delayed Draw | 9.04 | % | 1M SOFR | 5.25 | % | 1/12/2030 | 3,191,489 | (4,508 | ) | (3,549 | ) | 5,6,8,11 | |||||||||||||||||
| Springline Advisory Intermediate, LLC | Revolver | 0.50 | % | 3M SOFR | 1/12/2030 | 425,532 | (3,154 | ) | (3,026 | ) | 5,6,7,8,11 | |||||||||||||||||||
| Springline Advisory Intermediate, LLC | First Lien Term Loan | 9.04 | % | 1M SOFR | 5.25 | % | 1/12/2030 | 382,979 | 380,109 | 380,255 | 5,6,11,19 | |||||||||||||||||||
| Spruce Bidco I Inc. & Spruce Bidco II Inc. | First Lien Term Loan | 8.45 | % | 6M SOFR | 4.75 | % | 2/2/2032 | 7,892,352 | 7,781,314 | 7,766,522 | 5,6,10,19 | |||||||||||||||||||
| SRP Eagle Buyer, Inc. | Delayed Draw | 1.00 | % | 3M SOFR | 12/8/2031 | 1,290,323 | (12,787 | ) | (12,903 | ) | 5,6,7,8,13,26 | |||||||||||||||||||
| SRP Eagle Buyer, Inc. | Revolver | 0.50 | % | 3M SOFR | 12/8/2031 | 516,129 | (5,114 | ) | (5,161 | ) | 5,6,7,8,13 | |||||||||||||||||||
| SRP Eagle Buyer, Inc. | First Lien Term Loan | 8.74 | % | 3M SOFR | 5.00 | % | 12/8/2031 | 2,193,548 | 2,171,629 | 2,171,613 | 5,6,13,19 | |||||||||||||||||||
| Stonebridge Companies, LLC | First Lien Term Loan | 8.92 | % | 1M SOFR | 5.00 | % | 5/16/2031 | 3,577,919 | 3,544,955 | 3,543,867 | 5,6,11,19 | |||||||||||||||||||
| Stonebridge Companies, LLC | Revolver | 0.50 | % | 3M SOFR | 5/16/2030 | 681,508 | (5,973 | ) | (6,486 | ) | 5,6,7,8,11 | |||||||||||||||||||
| Stonebridge Companies, LLC | Delayed Draw | 1.00 | % | 3M SOFR | 5/16/2031 | 1,022,263 | (9,187 | ) | (9,729 | ) | 5,6,7,8,11,26 | |||||||||||||||||||
| Sunset Distributing, LLC | Delayed Draw | 9.75 | % | 3M SOFR | 5.75 | % | 5/30/2030 | 741,242 | 720,737 | 733,654 | 5,6,11 | |||||||||||||||||||
| Sunset Distributing, LLC | First Lien Term Loan | 9.75 | % | 3M SOFR | 5.75 | % | 5/30/2030 | 3,867,349 | 3,796,420 | 3,827,762 | 5,6,11,19 | |||||||||||||||||||
| SuperHero Fire Protection, LLC | Revolver | 9.34 | % | 3M SOFR | 5.50 | % | 12/31/2029 | 56,944 | 22,383 | 22,378 | 5,6,8,11 | |||||||||||||||||||
| SuperHero Fire Protection, LLC | First Lien Term Loan | 9.17 | % | 3M SOFR | 5.50 | % | 12/31/2029 | 578,033 | 571,558 | 571,151 | 5,6,11,19 | |||||||||||||||||||
| Surgical Center Solutions, LLC | First Lien Term Loan | 8.47 | % | 1M SOFR | 4.75 | % | 3/25/2031 | 2,051,660 | 2,024,551 | 2,029,338 | 5,6,11,19 | |||||||||||||||||||
| Surgical Center Solutions, LLC | Delayed Draw | 1.00 | % | 3M SOFR | 3/25/2031 | 621,890 | (3,552 | ) | (2,659 | ) | 5,6,7,8,11,26 | |||||||||||||||||||
| Surgical Center Solutions, LLC | Revolver | 8.47 | % | 1M SOFR | 4.75 | % | 3/25/2031 | 310,945 | 15,104 | 15,274 | 5,6,8,11 | |||||||||||||||||||
The accompanying notes are an integral part of these consolidated financial statements
27
StepStone Private Credit Income Fund
Consolidated Schedule of Investments (continued)
December 31, 2025
| Investments | Investment Type | Cash Interest Rate / PIK | Reference Rate | Spread | Maturity Date | Principal Amount | Cost25 | Fair Value | Footnotes | |||||||||||||||||||||
| Direct Lending - Non-Controlled/Non-Affiliated Investments (continued) | ||||||||||||||||||||||||||||||
| Senior Secured Loans (continued) | ||||||||||||||||||||||||||||||
| North America (continued) | ||||||||||||||||||||||||||||||
| SV Newco 2, Inc. | First Lien Term Loan | 8.42 | % | 3M SOFR | 4.75 | % | 6/2/2031 | $ | 477,133 | $ | 474,753 | $ | 474,906 | 5,6,10,19 | ||||||||||||||||
| SV Newco 2, Inc. | First Lien Term Loan | 8.42 | % | 3M SOFR | 4.75 | % | 6/2/2031 | 745,660 | 741,941 | 742,180 | 5,6,10,19 | |||||||||||||||||||
| SV Newco 2, Inc. | Delayed Draw | 9.08 | % | 3M SOFR | 4.56 | % | 6/2/2031 | 300,171 | 298,722 | 299,522 | 5,6,10,19 | |||||||||||||||||||
| SV Newco 2, Inc. | Delayed Draw | 8.42 | % | 3M SOFR | 4.75 | % | 6/2/2031 | 2,294,340 | 459,343 | 459,622 | 5,6,8,10 | |||||||||||||||||||
| SV Newco 2, Inc. | Revolver | 0.50 | % | 3M SOFR | 6/2/2031 | 180,733 | (865 | ) | (844 | ) | 5,6,7,8,10 | |||||||||||||||||||
| Synchronoss Technologies, Inc. | First Lien Term Loan | 10.87 | % | 3M SOFR | 7.00 | % | 4/24/2029 | 8,729,926 | 8,566,844 | 8,573,350 | 5,6,15,19 | |||||||||||||||||||
| Syndigo LLC | Revolver | 0.50 | % | 3M SOFR | 9/2/2032 | 473,934 | (4,518 | ) | (5,240 | ) | 5,6,7,8,10 | |||||||||||||||||||
| Syndigo LLC | First Lien Term Loan | 8.82 | % | 3M SOFR | 5.00 | % | 9/2/2032 | 3,526,066 | 3,490,933 | 3,487,084 | 5,6,10,19 | |||||||||||||||||||
| Syner-G Intermediate Holdings LLC | First Lien Term Loan | 8.92 | % | 3M SOFR | 5.25 | % | 9/17/2030 | 9,254,286 | 9,220,968 | 9,254,286 | 5,6,11,20 | |||||||||||||||||||
| Tau Midco, LLC | Delayed Draw | 8.69 | % | 3M SOFR | 4.75 | % | 2/2/2032 | 828,500 | 540,564 | 542,743 | 5,6,8,10 | |||||||||||||||||||
| Tau Midco, LLC | Revolver | 8.42 | % | 1M SOFR | 4.75 | % | 2/2/2032 | 310,688 | 46,998 | 46,617 | 5,6,8,10 | |||||||||||||||||||
| Tau Midco, LLC | First Lien Term Loan | 8.42 | % | 3M SOFR | 4.75 | % | 2/2/2032 | 2,381,939 | 2,360,447 | 2,358,227 | 5,6,10,19 | |||||||||||||||||||
| Tender Products, Inc. | First Lien Term Loan | 9.09 | % | 3M SOFR | 5.25 | % | 7/31/2030 | 3,368,421 | 3,320,516 | 3,317,767 | 5,6,11 | |||||||||||||||||||
| Tender Products, Inc. | Revolver | 0.50 | % | 3M SOFR | 7/31/2030 | 631,579 | (8,695 | ) | (9,498 | ) | 5,6,7,8,11 | |||||||||||||||||||
| Thames Technology Holdings, Inc. | First Lien Term Loan | 9.73 | % | 3M SOFR | 5.75 | % | 8/31/2029 | 1,742,401 | 1,722,373 | 1,698,682 | 5,6,11,19 | |||||||||||||||||||
| The Hardenbergh Group, Inc. | First Lien Term Loan | 10.60 | % | 3M SOFR | 6.50 | % | 8/7/2028 | 3,820,894 | 3,787,418 | 3,798,071 | 5,6,14,19 | |||||||||||||||||||
| The Hardenbergh Group, Inc. | First Lien Term Loan | 10.49 | % | 1M SOFR | 6.50 | % | 8/7/2028 | 159,506 | 157,919 | 157,977 | 5,6,14,19 | |||||||||||||||||||
| Theoria Management, LLC | Delayed Draw | 8.88 | % | 3M SOFR | 5.00 | % | 11/25/2030 | 1,180,430 | 136,119 | 135,158 | 5,6,8,11 | |||||||||||||||||||
| TL Atlas Merger Sub Corp | Revolver | 0.50 | % | 3M SOFR | 6/30/2031 | 1,000,000 | (9,186 | ) | (14,002 | ) | 5,6,7,8,11 | |||||||||||||||||||
| TL Atlas Merger Sub Corp | First Lien Term Loan | 8.67 | % | 3M SOFR | 5.00 | % | 6/30/2031 | 8,656,500 | 8,575,415 | 8,535,295 | 5,6,11,19 | |||||||||||||||||||
| TMSC OpCo, LLC | First Lien Term Loan | 9.98 | % | 1M SOFR | 6.25 | % | 5/1/2028 | 755,280 | 746,812 | 748,258 | 5,6,11,19 | |||||||||||||||||||
| ToxStrategies, LLC | Delayed Draw | 8.48 | % | 3M SOFR | 4.75 | % | 11/12/2031 | 491,106 | 322,552 | 322,821 | 5,6,8,10 | |||||||||||||||||||
| ToxStrategies, LLC | Revolver | 0.50 | % | 6M SOFR | 11/12/2031 | 229,183 | (1,120 | ) | (2,139 | ) | 5,6,7,8,10 | |||||||||||||||||||
| ToxStrategies, LLC | First Lien Term Loan | 8.59 | % | 3M SOFR | 4.75 | % | 11/12/2031 | 2,006,985 | 1,996,966 | 1,988,256 | 5,6,10,19 | |||||||||||||||||||
| TPC US Parent, LLC | First Lien Term Loan | 9.89 | % | 3M SOFR | 5.75 | % | 2/23/2026 | 245,000 | 244,643 | 244,696 | 5,6,11,19 | |||||||||||||||||||
| TRAK Purchaser, Inc. | First Lien Term Loan | 9.20 | % | 3M SOFR | 5.50 | % | 6/20/2031 | 1,363,636 | 1,343,189 | 1,350,000 | 5,6,11,19 | |||||||||||||||||||
The accompanying notes are an integral part of these consolidated financial statements
28
StepStone Private Credit Income Fund
Consolidated Schedule of Investments (continued)
December 31, 2025
| Investments | Investment Type | Cash Interest Rate / PIK | Reference Rate | Spread | Maturity Date | Principal Amount | Cost25 | Fair Value | Footnotes | |||||||||||||||||||||
| Direct Lending - Non-Controlled/Non-Affiliated Investments (continued) | ||||||||||||||||||||||||||||||
| Senior Secured Loans (continued) | ||||||||||||||||||||||||||||||
| North America (continued) | ||||||||||||||||||||||||||||||
| TRAK Purchaser, Inc. | First Lien Term Loan | 9.20 | % | 3M SOFR | 5.50 | % | 6/20/2031 | $ | 1,363,636 | $ | 1,343,189 | $ | 1,350,000 | 5,6,11 | ||||||||||||||||
| Traliant Operating LLC | First Lien Term Loan | 9.17 | % | 3M SOFR | 5.00 | % | 12/16/2030 | 2,677,709 | 2,681,972 | 2,677,276 | 5,6,10,20 | |||||||||||||||||||
| Transition Finance Strategies, LLC | First Lien Term Loan | 8.34 | % | 3M SOFR | 4.50 | % | 6/28/2029 | 2,702,436 | 2,683,241 | 2,672,611 | 5,6,11,20 | |||||||||||||||||||
| Tricor, LLC | Delayed Draw | 8.82 | % | 1M SOFR | 5.00 | % | 8/8/2031 | 157,659 | 156,154 | 155,502 | 5,6,11,19 | |||||||||||||||||||
| Tricor, LLC | Delayed Draw | 8.82 | % | 1M SOFR | 5.00 | % | 8/8/2031 | 192,782 | 191,035 | 190,145 | 5,6,11 | |||||||||||||||||||
| Tricor, LLC | Revolver | 0.50 | % | 3M SOFR | 8/8/2031 | 242,183 | (1,524 | ) | (1,396 | ) | 5,6,7,8,11 | |||||||||||||||||||
| Tricor, LLC | First Lien Term Loan | 8.82 | % | 1M SOFR | 5.00 | % | 8/8/2031 | 1,506,078 | 1,492,619 | 1,497,386 | 5,6,11,19 | |||||||||||||||||||
| Tricor, LLC | Delayed Draw | 1.00 | % | 3M SOFR | 8/8/2031 | 1,892,058 | (17,251 | ) | (10,919 | ) | 5,6,7,8,11,26 | |||||||||||||||||||
| Truck-Lite CO., LLC | Delayed Draw | 8.48 | % | 1M SOFR | 4.75 | % | 2/13/2032 | 969,052 | 374,142 | 379,380 | 5,6,8,10 | |||||||||||||||||||
| Truck-Lite CO., LLC | Delayed Draw | 1.00 | % | 3M SOFR | 2/13/2032 | 481,478 | (3,326 | ) | (2,115 | ) | 5,6,7,8,10,26 | |||||||||||||||||||
| Truck-Lite CO., LLC | First Lien Term Loan | 8.48 | % | 1M SOFR | 4.75 | % | 2/13/2032 | 100,352 | 99,355 | 99,653 | 5,6,10,19 | |||||||||||||||||||
| TVG- MGT Merger, LLC | Delayed Draw | 8.74 | % | 1M SOFR | 5.00 | % | 4/10/2029 | 2,401,052 | 487,565 | 492,993 | 5,6,8,11 | |||||||||||||||||||
| TVG- MGT Merger, LLC | Revolver | 10.75 | % | 3M PRIME | 4.00 | % | 4/10/2029 | 332,356 | 283,020 | 285,382 | 5,6,8,11 | |||||||||||||||||||
| TVG- MGT Merger, LLC | First Lien Term Loan | 8.75 | % | 1M SOFR | 5.00 | % | 4/10/2029 | 2,545,760 | 2,520,504 | 2,525,693 | 5,6,11,19 | |||||||||||||||||||
| Tvg Shelby Buyer, Inc. | Delayed Draw | 9.60 | % | 3M SOFR | 5.50 | % | 3/27/2028 | 832,540 | 309,079 | 311,485 | 5,6,8,11 | |||||||||||||||||||
| Tvg Shelby Buyer, Inc. | First Lien Term Loan | 9.17 | % | 3M SOFR | 5.50 | % | 3/27/2028 | 820,833 | 812,976 | 809,115 | 5,6,11,19 | |||||||||||||||||||
| Tvg Shelby Buyer, Inc. | Revolver | 0.50 | % | 3M SOFR | 3/27/2028 | 83,333 | (741 | ) | (774 | ) | 5,6,7,8,11 | |||||||||||||||||||
| U.S. Urology Parnters, LLC | Delayed Draw | 1.00 | % | 3M SOFR | 4/8/2032 | 4,000,000 | (48,444 | ) | (51,626 | ) | 5,6,7,8,10,26 | |||||||||||||||||||
| Upland Software, Inc. | First Lien Term Loan | 10.00 | % | 3M SOFR | 6.00 | % | 7/25/2031 | 7,420,000 | 7,297,825 | 7,291,758 | 5,6,13 | |||||||||||||||||||
| Upland Software, Inc. | First Lien Term Loan | 10.00 | % | 3M SOFR | 6.00 | % | 7/25/2031 | 3,180,000 | 3,127,639 | 3,125,039 | 5,6,13,19 | |||||||||||||||||||
| Upland Software, Inc. | Revolver | 0.50 | % | 3M SOFR | 7/25/2031 | 1,333,333 | (21,679 | ) | (22,900 | ) | 5,6,7,8,13 | |||||||||||||||||||
| USIC Holdings, Inc. | First Lien Term Loan | 9.32 | % | 3M SOFR | 5.50 | % | 9/10/2031 | 3,338,278 | 3,321,448 | 3,310,573 | 5,6,10,19 | |||||||||||||||||||
| USIC Holdings, Inc. | Revolver | 9.03 | % | 3M SOFR | 5.25 | % | 9/10/2031 | 429,163 | 199,030 | 197,560 | 5,6,8,10 | |||||||||||||||||||
| USIC Holdings, Inc. | Delayed Draw | 9.32 | % | 3M SOFR | 5.50 | % | 9/10/2031 | 198,047 | 113,170 | 112,539 | 5,6,8,10 | |||||||||||||||||||
| USN OpCo, LLC | Delayed Draw | 1.00 | % | 3M SOFR | 12/21/2026 | 3,333,333 | (9,608 | ) | (9,888 | ) | 5,6,7,8,11,26 | |||||||||||||||||||
| USN OpCo, LLC | First Lien Term Loan | 9.74 | % | 3M SOFR | 5.75 | % | 12/21/2026 | 1,569,608 | 1,563,212 | 1,564,940 | 5,6,11,20 | |||||||||||||||||||
The accompanying notes are an integral part of these consolidated financial statements
29
StepStone Private Credit Income Fund
Consolidated Schedule of Investments (continued)
December 31, 2025
| Investments | Investment Type | Cash Interest Rate / PIK | Reference Rate | Spread | Maturity Date | Principal Amount | Cost25 | Fair Value | Footnotes | |||||||||||||||||||||
| Direct Lending - Non-Controlled/Non-Affiliated Investments (continued) | ||||||||||||||||||||||||||||||
| Senior Secured Loans (continued) | ||||||||||||||||||||||||||||||
| North America (continued) | ||||||||||||||||||||||||||||||
| UVC Management LLC | Delayed Draw | 9.38 | % | 3M SOFR | 5.28 | % | 11/18/2028 | $ | 3,735,750 | $ | 3,712,626 | $ | 3,728,908 | 5,6,11 | ||||||||||||||||
| Vacation Rental Brands, LLC | First Lien Term Loan | 9.25 | % | 3M SOFR | 5.25 | % | 5/6/2032 | 4,573,144 | 4,527,738 | 4,537,454 | 5,6,11,19 | |||||||||||||||||||
| Vacation Rental Brands, LLC | First Lien Term Loan | 9.25 | % | 3M SOFR | 5.25 | % | 5/6/2032 | 1,207,033 | 1,195,417 | 1,197,613 | 5,6,11 | |||||||||||||||||||
| Vacation Rental Brands, LLC | Revolver | 0.50 | % | 3M SOFR | 5/6/2032 | 555,419 | (5,018 | ) | (4,335 | ) | 5,6,7,8,11 | |||||||||||||||||||
| Vacation Rental Brands, LLC | Delayed Draw | 1.00 | % | 3M SOFR | 5/6/2032 | 179,123 | (815 | ) | (492 | ) | 5,6,7,8,11,26 | |||||||||||||||||||
| Vascular Technology, Inc | First Lien Term Loan | 9.17 | % | 3M SOFR | 5.00 | % | 4/15/2031 | 4,359,187 | 4,328,326 | 4,299,781 | 5,6,11,20 | |||||||||||||||||||
| Vascular Technology, Inc | First Lien Term Loan | 8.99 | % | 3M SOFR | 5.00 | % | 11/15/2031 | 3,990,000 | 3,950,812 | 3,950,592 | 5,6,11,20 | |||||||||||||||||||
| Vatica Health, Inc. | Revolver | 0.50 | % | 3M SOFR | 10/29/2032 | 363,636 | (1,775 | ) | (1,855 | ) | 5,6,7,8,10 | |||||||||||||||||||
| Vatica Health, Inc. | First Lien Term Loan | 8.45 | % | 6M SOFR | 4.75 | % | 10/29/2032 | 3,636,364 | 3,618,219 | 3,617,810 | 5,6,10,19 | |||||||||||||||||||
| Vehlo Purchaser, LLC | Delayed Draw | 9.22 | % | 1M SOFR | 5.50 | % | 5/24/2028 | 4,278,851 | 4,255,085 | 4,260,258 | 5,6,10 | |||||||||||||||||||
| Vensure Employer Services, Inc. | First Lien Term Loan | 8.99 | % | 3M SOFR | 5.00 | % | 9/27/2031 | 3,085,520 | 3,066,321 | 3,052,373 | 5,6,9,19 | |||||||||||||||||||
| Vensure Employer Services, Inc. | First Lien Term Loan | 8.99 | % | 3M SOFR | 5.00 | % | 9/27/2031 | 760,350 | 757,145 | 752,182 | 5,6,9 | |||||||||||||||||||
| Vensure Employer Services, Inc. | Delayed Draw | 8.69 | % | 1M SOFR | 5.00 | % | 9/27/2031 | 119,115 | 56,204 | 55,876 | 5,6,8,9 | |||||||||||||||||||
| Vertex Service Partners, LLC | Delayed Draw | 8.92 | % | 3M SOFR | 5.25 | % | 11/8/2030 | 1,469,901 | 279,868 | 287,022 | 5,6,8,11 | |||||||||||||||||||
| Vertex Service Partners, LLC | First Lien Term Loan | 9.67 | % | 3M SOFR | 6.00 | % | 11/8/2030 | 1,710,696 | 1,713,391 | 1,710,128 | 5,6,10,20 | |||||||||||||||||||
| VISUSWR LLC | First Lien Term Loan | 9.81 | % | 6M SOFR | 6.00 | % | 11/8/2029 | 1,668,058 | 1,670,714 | 1,668,058 | 5,6,11,20 | |||||||||||||||||||
| VITAL PURCHASER, LLC | First Lien Term Loan | 9.17 | % | 3M SOFR | 5.50 | % | 8/7/2030 | 1,813,050 | 1,783,362 | 1,779,102 | 5,6,11,19 | |||||||||||||||||||
| VITAL PURCHASER, LLC | Revolver | 0.50 | % | 3M SOFR | 8/7/2030 | 164,000 | (1,896 | ) | (3,051 | ) | 5,6,7,8,11 | |||||||||||||||||||
| Vortex Companies, LLC | First Lien Term Loan | 8.72 | % | 1M SOFR | 5.00 | % | 5/7/2032 | 3,125,772 | 3,102,489 | 3,116,096 | 5,6,11,19 | |||||||||||||||||||
| Vortex Companies, LLC | Delayed Draw | 8.72 | % | 1M SOFR | 5.00 | % | 5/7/2032 | 1,888,917 | 279,027 | 286,503 | 5,6,8,11 | |||||||||||||||||||
| VRC Companies, LLC | First Lien Term Loan | 9.09 | % | 3M SOFR | 5.25 | % | 6/29/2027 | 3,918,058 | 3,918,058 | 3,918,058 | 5,6,11,19 | |||||||||||||||||||
| VTC Buyer Corp. | Revolver | 0.50 | % | 3M SOFR | 7/15/2031 | 802,907 | (5,566 | ) | (5,240 | ) | 5,6,7,8,11 | |||||||||||||||||||
| VTC Buyer Corp. | Delayed Draw | 9.01 | % | 3M SOFR | 5.25 | % | 7/15/2031 | 1,322,262 | 1,312,761 | 1,313,632 | 5,6,11 | |||||||||||||||||||
| VTC Buyer Corp. | Delayed Draw | 8.99 | % | 3M SOFR | 5.25 | % | 7/15/2031 | 925,954 | 345,187 | 345,819 | 5,6,8,11 | |||||||||||||||||||
| VTC Buyer Corp. | First Lien Term Loan | 9.15 | % | 3M SOFR | 5.25 | % | 7/15/2031 | 2,530,770 | 2,511,882 | 2,514,253 | 5,6,11,19 | |||||||||||||||||||
| Vybond Buyer LLC | Revolver | 0.50 | % | 6M SOFR | 2/3/2032 | 967,673 | (12,668 | ) | (15,016 | ) | 5,6,7,8,10 | |||||||||||||||||||
The accompanying notes are an integral part of these consolidated financial statements
30
StepStone Private Credit Income Fund
Consolidated Schedule of Investments (continued)
December 31, 2025
| Investments | Investment Type | Cash Interest Rate / PIK | Reference Rate | Spread | Maturity Date | Principal Amount | Cost25 | Fair Value | Footnotes | |||||||||||||||||||||
| Direct Lending - Non-Controlled/Non-Affiliated Investments (continued) | ||||||||||||||||||||||||||||||
| Senior Secured Loans (continued) | ||||||||||||||||||||||||||||||
| North America (continued) | ||||||||||||||||||||||||||||||
| Vybond Buyer LLC | Delayed Draw | 1.00 | % | 6M SOFR | 2/3/2032 | $ | 1,290,231 | $ | (8,460 | ) | $ | (10,338 | ) | 5,6,7,8,10,26 | ||||||||||||||||
| Vybond Buyer LLC | First Lien Term Loan | 8.42 | % | 3M SOFR | 4.75 | % | 2/3/2032 | 5,079,488 | 5,010,563 | 5,000,674 | 5,6,10,19 | |||||||||||||||||||
| W.A. Kendall and Company, LLC | Delayed Draw | 9.77 | % | 6M SOFR | 5.75 | % | 4/22/2030 | 6,515,919 | 6,479,914 | 6,469,178 | 5,6,11,20 | |||||||||||||||||||
| W.A. Kendall and Company, LLC | Revolver | 10.39 | % | 3M SOFR | 6.14 | % | 4/22/2030 | 253,033 | 139,957 | 139,600 | 5,6,8,11 | |||||||||||||||||||
| W.A. Kendall and Company, LLC | Delayed Draw | 10.34 | % | 6M SOFR | 5.75 | % | 4/22/2030 | 74,669 | 73,986 | 74,050 | 5,6,11 | |||||||||||||||||||
| W.A. Kendall and Company, LLC | Delayed Draw | 10.22 | % | 6M SOFR | 5.75 | % | 4/22/2030 | 1,841,929 | 338,235 | 339,490 | 5,6,8,11 | |||||||||||||||||||
| W.A. Kendall and Company, LLC | First Lien Term Loan | 10.38 | % | 6M SOFR | 5.75 | % | 4/22/2030 | 1,222,974 | 1,211,537 | 1,212,804 | 5,6,11,19 | |||||||||||||||||||
| Wasteology Group Transportation, LLC | First Lien Term Loan | 9.84 | % | 3M SOFR | 6.00 | % | 11/3/2032 | 1,081,134 | 1,070,340 | 1,071,172 | 5,6,10 | |||||||||||||||||||
| Wasteology Group Transportation, LLC | Delayed Draw | 1.00 | % | 3M SOFR | 11/3/2032 | 1,257,132 | (12,289 | ) | (11,583 | ) | 5,6,7,8,10,26 | |||||||||||||||||||
| Wasteology Group Transportation, LLC | Revolver | 0.38 | % | 3M SOFR | 11/3/2032 | 389,007 | (3,801 | ) | (3,584 | ) | 5,6,7,8,10 | |||||||||||||||||||
| WCHG Buyer | First Lien Term Loan | 8.47 | % | 1M SOFR | 4.75 | % | 4/10/2031 | 6,989,437 | 6,958,258 | 6,925,574 | 5,6,11,19 | |||||||||||||||||||
| Western Smokehouse Partners, LLC | First Lien Term Loan | 9.73 | % | 3M SOFR | 5.75 | % | 3/31/2029 | 7,228,646 | 7,144,221 | 7,170,604 | 5,6,11,19 | |||||||||||||||||||
| Western Smokehouse Partners, LLC | Revolver | 0.50 | % | 3M SOFR | 3/31/2028 | 309,122 | (3,773 | ) | (2,529 | ) | 5,6,7,8,11 | |||||||||||||||||||
| Western Smokehouse Partners, LLC | Delayed Draw | 9.80 | % | 1M SOFR | 5.75 | % | 3/31/2029 | 959,651 | 447,399 | 456,112 | 5,6,8,11 | |||||||||||||||||||
| Wges Buyer Inc. | Delayed Draw | 9.90 | % | 3M SOFR | 5.50 | % | 11/5/2027 | 5,956,588 | 3,135,056 | 2,902,696 | 5,6,8,11 | |||||||||||||||||||
| Wges Buyer Inc. | Delayed Draw | 9.54 | % | 3M SOFR | 5.50 | % | 11/5/2027 | 712,243 | 710,744 | 673,399 | 5,6,11,20 | |||||||||||||||||||
| Wharf Street Ratings Acquisition LLC | Delayed Draw | 1.00 | % | 3M SOFR | 9/16/2032 | 362,567 | (1,739 | ) | (1,860 | ) | 5,6,7,8,10,26 | |||||||||||||||||||
| Wharf Street Ratings Acquisition LLC | Revolver | 0.50 | % | 3M SOFR | 9/16/2032 | 374,332 | (1,794 | ) | (1,920 | ) | 5,6,7,8,10 | |||||||||||||||||||
| Wharf Street Ratings Acquisition LLC | First Lien Term Loan | 8.47 | % | 1M SOFR | 4.75 | % | 9/16/2032 | 3,263,102 | 3,247,272 | 3,246,363 | 5,6,10,19 | |||||||||||||||||||
| World Insurance Associates, LLC | First Lien Term Loan | 8.67 | % | 3M SOFR | 5.00 | % | 4/3/2030 | 9,925,000 | 9,925,000 | 9,924,979 | 5,6,11,19 | |||||||||||||||||||
| Worldwide Insurance Network, LLC | Delayed Draw | 9.77 | % | 3M SOFR | 5.81 | % | 5/28/2030 | 658,796 | 656,265 | 658,425 | 5,6,10 | |||||||||||||||||||
| Worldwide Insurance Network, LLC | First Lien Term Loan | 9.71 | % | 3M SOFR | 5.70 | % | 5/28/2030 | 822,699 | 816,177 | 820,789 | 5,6,10,19 | |||||||||||||||||||
| Worldwide Insurance Network, LLC | Delayed Draw | 9.41 | % | 1M SOFR | 5.68 | % | 5/28/2030 | 1,189,847 | 145,885 | 146,086 | 5,6,8,10 | |||||||||||||||||||
| WSRP Advisory, LLC | Delayed Draw | 8.85 | % | 1M SOFR | 5.00 | % | 2/28/2031 | 4,000,000 | 1,650,575 | 1,652,316 | 5,6,8,11 | |||||||||||||||||||
| Ya Ya Foods Corp | First Lien Term Loan | 8.52 | % | 3M SOFR | 4.75 | % | 8/26/2027 | 296,551 | 295,912 | 296,550 | 5,6,11,20 | |||||||||||||||||||
| Zone Climate Services Inc | First Lien Term Loan | 9.52 | % | 3M SOFR | 5.50 | % | 3/9/2028 | 4,885,787 | 4,893,567 | 4,883,714 | 5,6,11,20 | |||||||||||||||||||
The accompanying notes are an integral part of these consolidated financial statements
31
StepStone Private Credit Income Fund
Consolidated Schedule of Investments (continued)
December 31, 2025
| Investments | Investment Type | Cash Interest Rate / PIK | Reference Rate | Spread | Maturity Date | Principal Amount | Cost25 | Fair Value | Footnotes | |||||||||||||||||||||
| Direct Lending - Non-Controlled/Non-Affiliated Investments (continued) | ||||||||||||||||||||||||||||||
| Senior Secured Loans (continued) | ||||||||||||||||||||||||||||||
| Total Direct Lending - Senior Secured Loans - North America | $ | 893,899,598 | $ | 892,957,213 | ||||||||||||||||||||||||||
| Rest of World - 0.3% of NAV | 1,2,3,4,5,6 | |||||||||||||||||||||||||||||
| Kami Buyer, LLC | Delayed Draw | 1.00 | % | 3M SOFR | 8/17/2029 | $ | 1,818,182 | $ | (9,044 | ) | $ | (11,428 | ) | 7,8,11,26 | ||||||||||||||||
| Kami Buyer, LLC | First Lien Term Loan | 9.00 | % | 3M SOFR | 5.00 | % | 8/17/2029 | 3,104,734 | 3,096,724 | 3,085,075 | 11,20 | |||||||||||||||||||
| Total Direct Lending - Senior Secured Loans - Rest of World | $ | 3,087,680 | $ | 3,073,647 | ||||||||||||||||||||||||||
| Total Direct Lending - Senior Secured Loans | $ | 918,020,055 | $ | 917,064,204 | ||||||||||||||||||||||||||
| Investments | Investment Type | Cash Interest Rate / PIK | Reference Rate | Spread | Maturity Date | Principal Amount | Cost25 | Fair Value | Footnotes | |||||||||||||||||||||
| Direct Lending - Non-Controlled/Non-Affiliated Investments (continued) | ||||||||||||||||||||||||||||||
| Collateralized Loan Obligations and Warehouses - 27.5% of NAV | 1,2,3,6 | |||||||||||||||||||||||||||||
| North America - 27.5% of NAV | ||||||||||||||||||||||||||||||
| Audax Senior Debt CLO 12, LLC | Subordinated Notes | 4/22/2037 | $ | 2,250,000 | $ | 2,144,794 | $ | 2,144,794 | ||||||||||||||||||||||
| Barings Middle Market CLO Ltd. 2025-I | Subordinated Notes | 4/22/2038 | 35,843,500 | 35,905,804 | 35,905,804 | |||||||||||||||||||||||||
| Birch Grove CLO 10 Ltd. | Subordinated Notes | 1/22/2038 | 1,500,000 | 1,534,885 | 1,295,846 | |||||||||||||||||||||||||
| Birch Grove CLO 12 Ltd. | Subordinated Notes | 4/22/2038 | 1,500,000 | 1,537,185 | 1,463,712 | |||||||||||||||||||||||||
| Birch Grove CLO Ltd. | Subordinated Notes | 7/17/2037 | 1,391,250 | 969,285 | 857,384 | |||||||||||||||||||||||||
| Carlyle US CLO 2025-2, Ltd | Subordinated Notes | 7/25/2038 | 13,657,437 | 12,983,254 | 12,560,472 | |||||||||||||||||||||||||
| Churchill Middle Market CLO VI Ltd | Subordinated Notes | 4/25/2037 | 43,052,619 | 43,864,534 | 43,885,252 | |||||||||||||||||||||||||
| CIFC Funding 2024-V, Ltd | Subordinated Notes | 1/22/2038 | 2,286,600 | 2,013,767 | 1,873,876 | 19 | ||||||||||||||||||||||||
| CIFC Stone Warehouse III LTD | Warehouse | 16,579,500 | 16,579,500 | 16,579,500 | 8 | |||||||||||||||||||||||||
| Great Lakes CLO VIII Ltd | Subordinated Notes | 7/15/2037 | 95,650,000 | 95,021,827 | 94,872,219 | |||||||||||||||||||||||||
| Jefferies Credit Partners Direct Lending CLO 2025-1 Ltd. | Subordinated Notes | 10/15/2037 | 16,314,865 | 15,416,849 | 15,416,849 | |||||||||||||||||||||||||
| NXT Capital CLO 2024-1, LLC | Subordinated Notes | 1/15/2037 | 38,418,000 | 37,405,096 | 37,344,549 | |||||||||||||||||||||||||
| NXTC 2024-1A Class E Loan | Class E Note | 11.71 | % | 3M SOFR | 7.81 | % | 1/15/2037 | 17,100,000 | 16,955,680 | 17,063,372 | 5 | |||||||||||||||||||
| Total Direct Lending - Collateralized Loan Obligations and Warehouses - North America | $ | 282,332,460 | $ | 281,263,629 | ||||||||||||||||||||||||||
| Total Direct Lending - Collateralized Loan Obligations and Warehouses | $ | 282,332,460 | $ | 281,263,629 | ||||||||||||||||||||||||||
The accompanying notes are an integral part of these consolidated financial statements
32
StepStone Private Credit Income Fund
Consolidated Schedule of Investments (continued)
December 31, 2025
| Investments | Acquisition Date | Cost25 | Fair Value | Footnotes | ||||||||||
| Direct Lending - Non-Controlled/Non-Affiliated Investments (continued) | ||||||||||||||
| Investment Funds - 1.4% of NAV | 1,22 | |||||||||||||
| North America - 1.4% of NAV | ||||||||||||||
| 26N DL SIDECAR FUND I LP | 10/23/2025 | $ | — | $ | — | 27 | ||||||||
| Diameter Credit Company | 9/17/2025 | 6,000,000 | 5,989,755 | 8 | ||||||||||
| GC BSL CLO Fund, L.P. | 10/20/2025 | 2,505,000 | 2,540,060 | 8 | ||||||||||
| Trinitas Capital Management, LLC | 1/31/2025 | 6,000,000 | 5,881,587 | 6 | ||||||||||
| Total Direct Lending - Investment Funds - North America | $ | 14,505,000 | $ | 14,411,402 | ||||||||||
| Total Direct Lending - Investment Funds | $ | 14,505,000 | $ | 14,411,402 | ||||||||||
| Total Direct Lending | $ | 1,214,857,515 | $ | 1,212,739,235 |
| Investments | Acquisition Date | Cost25 | Fair Value | Footnotes | ||||||||||
| Specialty Credit - Non-Controlled/Non-Affiliated Investments - 7.1% of NAV | ||||||||||||||
| Investment Funds - 4.4% of NAV | 1,22 | |||||||||||||
| Europe - 1.1% of NAV | ||||||||||||||
| Kartesia Credit Opportunities III S.C.A., SICAV-SIF - Class C | 12/31/2025 | $ | 450,230 | $ | 704,106 | 8,23,28 | ||||||||
| Kartesia Credit Opportunities IV SCS - Class B | 12/31/2025 | 1,338,614 | 1,937,254 | 8,23,28 | ||||||||||
| Kartesia Credit Opportunities IV SCS - Class C | 12/31/2025 | 6,141,430 | 7,903,721 | 8,23,28 | ||||||||||
| Kartesia Credit Opportunities IV SCS - Class D | 12/31/2025 | 370,362 | 532,968 | 8,23,28 | ||||||||||
| Total Specialty Credit - Investment Funds - Europe | $ | 8,300,636 | $ | 11,078,049 | ||||||||||
| North America - 3.3% of NAV | ||||||||||||||
| Investments | Acquisition Date | Cost25 | Fair Value | Footnotes | ||||||||||
| Specialty Credit - Non-Controlled/Non-Affiliated Investments - 7.1% of NAV | ||||||||||||||
| Investment Funds - 4.4% of NAV | 1,22 | |||||||||||||
| North America - 3.3% of NAV | ||||||||||||||
| Blue Owl Opportunistic Lending Fund (Offshore) LP | 10/1/2025 | $ | 7,429,449 | $ | 8,806,710 | 6,8 | ||||||||
| Carlyle Santiago Aggregator, L.P. | 9/5/2024 | 2,916,359 | 3,127,504 | 6 | ||||||||||
| Castlelake Consumer Receivables Opportunity III, L.P. | 6/26/2024 | 3,716,334 | 4,885,944 | 8,23 | ||||||||||
| Castlelake Consumer Receivables Opportunity IV, L.P. | 11/22/2024 | 3,503,928 | 3,871,008 | 8,23 | ||||||||||
The accompanying notes are an integral part of these consolidated financial statements
33
StepStone Private Credit Income Fund
Consolidated Schedule of Investments (continued)
December 31, 2025
| Investments | Acquisition Date | Cost25 | Fair Value | Footnotes | ||||||||||
| Specialty Credit - Non-Controlled/Non-Affiliated Investments - 7.1% of NAV | ||||||||||||||
| Investment Funds - 4.4% of NAV | 1,22 | |||||||||||||
| North America - 3.3% of NAV | ||||||||||||||
| Castlelake Consumer Receivables Opportunity V, L.P. | 10/13/2025 | $ | 2,916,000 | $ | 2,866,857 | 8,23 | ||||||||
| Pimlico Partners, L.P. | 12/16/2025 | 2,000,000 | 2,000,000 | 23 | ||||||||||
| West Street Strategic Solutions Offshore Fund I, L.P. | 10/1/2025 | 7,336,628 | 8,121,709 | 8,23 | ||||||||||
| Total Specialty Credit - Investment Funds - North America | $ | 29,818,698 | $ | 33,679,732 | ||||||||||
| Total Specialty Credit - Investment Funds | $ | 38,119,334 | $ | 44,757,781 | ||||||||||
| Investments | Investment Type | Cash Interest Rate / PIK | Reference Rate | Spread | Maturity Date | Principal Amount | Cost25 | Fair Value | Footnotes | |||||||||||||||||||||
| Specialty Credit - Non-Controlled/Non-Affiliated Investments (continued) | ||||||||||||||||||||||||||||||
| Private Lending - 2.7% of NAV | 1,2,3,6 | |||||||||||||||||||||||||||||
| North America - 2.7% of NAV | ||||||||||||||||||||||||||||||
| AR3 LLC | First Lien Term Loan | 10.21 | % | 1M SOFR | 6.00 | % | 3/16/2027 | $ | 4,000,000 | $ | 4,037,107 | $ | 4,026,319 | 4,5,17 | ||||||||||||||||
| CLGF Holdco 2, LLC | First Lien Term Loan | 12.50 | % | Fixed | 12.50 | % | 4/23/2030 | 8,330,000 | 8,215,227 | 8,329,988 | 4,24 | |||||||||||||||||||
| Heights Financing I | Revolver | 13.60 | % | 1M SOFR | 10.00 | % | 10/31/2026 | 4,000,000 | 3,954,608 | 3,954,799 | 5,8 | |||||||||||||||||||
| Heights Financing II | Revolver | 12.48 | % | 1M SOFR | 9.50 | % | 10/31/2026 | 4,000,000 | 3,361,952 | 3,367,563 | 4,5,8,16 | |||||||||||||||||||
| Mission Lane Credit Card Master Trust JPM | Revolver | 12.48 | % | 1M SOFR | 12.48 | % | 4/1/2026 | 1,233,823 | 585,408 | 586,001 | 5,8 | |||||||||||||||||||
| Pipe Warehouse Trust II | Delayed Draw | 10.23 | % | 3M SOFR | 6.00 | % | 4/1/2027 | 4,000,000 | 1,271,920 | 1,211,278 | 4,5,8,16 | |||||||||||||||||||
| SPC Jamboree Lender LLC | Revolver | 13.50 | % | 1M SOFR | 9.00 | % | 9/30/2030 | 4,000,000 | 2,510,559 | 2,488,131 | 4,8,18,24 | |||||||||||||||||||
| Symmetry Holdco, LLC | First Lien Term Loan | 11.60 | % | 1M SOFR | 7.88 | % | 12/27/2029 | 3,962,784 | 3,903,655 | 3,903,493 | 4,5,8,18 | |||||||||||||||||||
| Total Specialty Credit - Private Lending - North America | $ | 27,840,436 | $ | 27,867,572 | ||||||||||||||||||||||||||
| Total Specialty Credit - Private Lending | $ | 27,840,436 | $ | 27,867,572 | ||||||||||||||||||||||||||
| Total Specialty Credit | $ | 65,959,770 | $ | 72,625,353 | ||||||||||||||||||||||||||
| Total Investments - 125.8% of NAV | $ | 1,280,817,285 | $ | 1,285,364,588 | ||||||||||||||||||||||||||
| Liabilities in excess of other assets - (25.8)% of NAV | $ | (264,163,469) | ||||||||||||||||||||||||||||
| Net Assets - 100.0% | $ | 1,021,201,119 | ||||||||||||||||||||||||||||
The accompanying notes are an integral part of these consolidated financial statements
34
StepStone Private Credit Income Fund
Consolidated Schedule of Investments (continued)
December 31, 2025
| 1 | Geographic region generally reflects the location of the investment manager for Investment Funds and Collateralized Loan Obligations or Warehouses and the company headquarters for other debt investments. |
| 2 | Fair value was determined using significant unobservable inputs. |
| 3 | Investment is generally subject to certain limitations on resale, and may be deemed to be “restricted securities” under the Securities Act of 1933, as amended. Investment is a Level 3 asset unless otherwise indicated. |
| 4 | Senior secured debt investment. |
| 5 | Investments bear interest at rates that may be determined by reference to Secured Overnight Financing Rate (“SOFR”) or an alternative base rate (commonly based on the Federal Fund Rate or the U.S. Prime Rate ("PRIME")), which generally reset periodically. For each such investment, the Fund has provided the reference rate used and the spread and the current contractual interest rate in effect at December 31, 2025. The interest rate disclosed is based on the reference rate as of the last reset date which may differ from the reference rate as of December 31, 2025. As of December 31, 2025, effective rates for 1 Month SOFR, 3 Month SOFR, 6 Month SOFR and PRIME are 3.787%, 4.011%, 4.200% and 6.750%, respectively. For companies with multiple interest rate contracts, the interest rate shown is a weighted average current interest rate in effect as of December 31, 2025. Certain investments are subject to a SOFR floor and have been provided. |
| 6 | Income producing investment that pays all interest in cash. |
| 7 | Unfunded commitment. Interest reflects the unfunded commitment fee rate. |
| 8 | Investment has an unfunded commitment balance. For private credit investments, unamortized capitalized fees (see Note 2) reduce cost basis and may result in a negative cost. A negative fair value may result from the unfunded commitment being valued below par. The private credit investment may be subject to an unfunded commitment fee. |
| 9 | Interest rate on funded balance is subject to a floor of 0.50%. |
| 10 | Interest rate on funded balance is subject to a floor of 0.75%. |
| 11 | Interest rate on funded balance is subject to a floor of 1.00%. |
| 12 | Interest rate on funded balance is subject to a floor of 1.25%. |
| 13 | Interest rate on funded balance is subject to a floor of 1.50%. |
| 14 | Interest rate on funded balance is subject to a floor of 2.00%. |
| 15 | Interest rate on funded balance is subject to a floor of 2.50%. |
| 16 | Interest rate on funded balance is subject to a floor of 3.00%. |
| 17 | Interest rate on funded balance is subject to a floor of 3.50%. |
| 18 | Interest rate on funded balance is subject to a floor of 4.50%. |
| 19 | Security is held by CRDEX LLC and designated as collateral for borrowings on the JPMorgan Chase Bank, N.A. credit facility. |
| 20 | Security is held by SSG Holdings LLC and designated as collateral for borrowings on the Bank of Montreal credit facility. |
| 21 | Investment does not pay cash interest. Principal includes accumulated payment in kind (“PIK”) interest, which is collected upon repayment. |
| 22 | Investment Funds typically do not permit redemptions or withdrawals, except at the discretion of their general partner, manager, or advisor. Final distribution dates are generally unknown unless specified. These funds are fair valued using net asset value as the practical expedient, unless otherwise noted, and are usually acquired through private placements with contractual resale restrictions that do not lapse. Each investment may have been purchased on different dates and for varying amounts. As of December 31, 2025, the total fair value of restricted investments was $59.2 million, representing 5.8% of net assets. The acquisition date of the first purchase is listed in the Consolidated Schedule of Investments. |
| 23 | Investment is non-income producing. |
| 24 | Interest rate is fixed. |
| 25 | For non-controlled, non-affiliated debt investments, cost represents amortized cost. |
| 26 | Position is an unfunded delayed draw term loan with no rate setting. |
| 27 | Investment has been committed to but has not been funded as of December 31, 2025. |
| 28 | This investment is denominated in EUR. Values are translated into U.S. dollars using the exchange rate in effect at the reporting date. |
The accompanying notes are an integral part of these consolidated financial statements
35
StepStone Private Credit Income Fund
Consolidated Schedule of Investments (continued)
December 31, 2025
| Summary of Investments by Strategy (as a percentage of total investments) | ||||
| Direct Lending | 94.3 | % | ||
| Specialty Credit | 5.7 | % | ||
| Total Investments | 100.0 | % | ||
Derivative Instruments
Forward Foreign Currency Exchange Contracts
| Currency to be | Settlement | Currency to be | Currency Amount to be | Currency Amount to be | Unrealized Appreciation | |||||||||||||
| Sold | Counterparty | Date | Purchased | Sold | Purchased | (Depreciation) | ||||||||||||
| Euro | State Street | January 30, 2026 | USD | 7,746,000 | $ | 9,136,934 | $ | 20,453 | ||||||||||
| Total Forward Foreign Currency Exchange Contracts | 7,746,000 | $ | 9,136,934 | $ | 20,453 | |||||||||||||
The accompanying notes are an integral part of these consolidated financial statements
36
StepStone Private Credit Income Fund
Consolidated Statement of Assets and Liabilities
December 31, 2025
| Assets | ||||
| Non-controlled/non-affiliated investments, at fair value (cost $1,280,817,285) | $ | 1,285,364,588 | ||
| Cash and restricted cash | 36,361,685 | |||
| Cash denominated in foreign currency (cost $809,682) | 796,826 | |||
| Receivable from unsettled transactions | 33,804,633 | |||
| Dividend and interest receivable | 6,025,433 | |||
| Receivable for Fund shares sold | 2,616,768 | |||
| Prepaid expenses | 65,214 | |||
| Unrealized appreciation on forward foreign currency exchange contracts | 20,453 | |||
| Total Assets | 1,365,055,600 | |||
| Liabilities | ||||
| Revolving credit facilities | 337,288,385 | |||
| Less deferred debt issuance costs | (3,100,925 | ) | ||
| Revolving credit facilities less deferred debt issuance costs | 334,187,460 | |||
| Revolving credit facilities interest and fees payable | 4,547,223 | |||
| Incentive fees payable | 3,217,334 | |||
| Management fees payable | 1,007,216 | |||
| Professional fees payable | 303,709 | |||
| Administration fees payable | 141,103 | |||
| Trustees' fees payable | 40,001 | |||
| Transfer agent fees payable | 28,628 | |||
| Due to Adviser | 24,848 | |||
| Other accrued expenses | 356,959 | |||
| Total Liabilities | 343,854,481 | |||
| Commitments and contingencies (see Note 10) | ||||
| Net Assets | $ | 1,021,201,119 | ||
| Components of Net Assets: | ||||
| Paid-in capital | $ | 1,023,474,287 | ||
| Total distributable earnings (accumulated loss) | (2,273,168 | ) | ||
| Net Assets | $ | 1,021,201,119 | ||
The accompanying notes are an integral part of these consolidated financial statements
37
StepStone Private Credit Income Fund
Consolidated Statement of Assets and Liabilities (continued)
December 31, 2025
| Class I | ||||
| Net Assets | $ | 1,021,142,971 | ||
| Outstanding shares (unlimited number of shares authorized) | ||||
| Net Asset Value Per Share | $ | |||
| Class D | ||||
| Net Assets | $ | 11,467 | ||
| Outstanding shares (unlimited number of shares authorized) | ||||
| Net Asset Value Per Share | $ | |||
| Class S: | ||||
| Net Assets | $ | 46,681 | ||
| Outstanding shares (unlimited number of shares authorized) | ||||
| Net Asset Value Per Share | $ | |||
The accompanying notes are an integral part of these consolidated financial statements
38
StepStone Private Credit Income Fund
Consolidated Statement of Operations
For the Year Ended December 31, 2025
| Investment Income | ||||
| Non-controlled/non-affiliated investments interest income | $ | 111,377,638 | ||
| Non-controlled/non-affiliated investments dividend income | 9,267,046 | |||
| Non-controlled/non-affiliated investments payment in-kind income | 245,766 | |||
| Total Investment Income | 120,890,450 | |||
| Expenses | ||||
| Revolving credit facilities interest and fees | 14,998,600 | |||
| Management fees | 10,284,434 | |||
| Incentive fees | 8,715,391 | |||
| Professional fees | 3,083,303 | |||
| Administration fees | 1,792,388 | |||
| Transfer agent fees | 248,951 | |||
| Trustees' fees | 160,001 | |||
| Income tax expense | 107,049 | |||
| Chief compliance officer fees | 60,000 | |||
| Distribution and shareholder servicing fees (Class S) | 298 | |||
| Shareholder servicing fees (Class D) | 14 | |||
| Other expenses | 1,158,899 | |||
| Total Expenses | 40,609,328 | |||
| Adviser expense recoupment (reimbursement) | 957,118 | |||
| Net Expenses | 41,566,446 | |||
| Net Investment Income (Loss) | 79,324,004 | |||
| Net Realized Gain (Loss) | ||||
| Net realized gain (loss) on non-controlled/non-affiliated investments | (1,525,136 | ) | ||
| Foreign currency transactions | (7,049 | ) | ||
| Total Net Realized Gain (Loss) | (1,532,185 | ) | ||
| Net Change in Unrealized Appreciation (Depreciation) | ||||
| Net change in unrealized appreciation (depreciation) on non-controlled/non-affiliated investments | 4,467,695 | |||
| Foreign currency translations | (18,709 | ) | ||
| Forward foreign currency exchange contracts | 20,453 | |||
| Total Net Change in Unrealized Appreciation (Depreciation) | 4,469,439 | |||
| Net Increase (Decrease) in Net Assets from Operations | $ | 82,261,258 | ||
The accompanying notes are an integral part of these consolidated financial statements
39
StepStone Private Credit Income Fund
Consolidated Statements of Changes in Net Assets
For the Year | For
the Period | |||||||
| Change in Net Assets Resulting from Operations: | ||||||||
| Net investment income (loss) | $ | 79,324,004 | $ | 5,417,652 | ||||
| Net realized gain (loss) | (1,532,185 | ) | 873 | |||||
| Net change in unrealized appreciation (depreciation) | 4,469,439 | 79,608 | ||||||
| Net Increase (Decrease) in Net Assets Resulting from Operations | 82,261,258 | 5,498,133 | ||||||
| Distributions from Distributable Earnings: | ||||||||
| Class I | (84,352,201 | ) | (5,700,402 | ) | ||||
| Class D | (1,018 | ) | (413 | ) | ||||
| Class S | (3,860 | ) | (413 | ) | ||||
| Class T1 | — | (892 | ) | |||||
| Total Distributions from Distributable Earnings: | (84,357,079 | ) | (5,702,120 | ) | ||||
| Change in Net Assets Resulting from Capital Share Transactions: | ||||||||
| Class I | ||||||||
| Proceeds from shares issued | 212,550,879 | 167,654,960 | ||||||
| Issuance of shares in connection with portfolio acquisition (Note 16) | 623,460,822 | — | ||||||
| Reinvestment of distributions | 40,980,591 | 1,279,044 | ||||||
| Repurchase of shares | (22,431,185 | ) | (52,357 | ) | ||||
| Exchange of shares | — | — | ||||||
| Total Class I Transactions | 854,561,107 | 168,881,647 | ||||||
| Class D | ||||||||
| Proceeds from shares issued | 600 | 10,000 | ||||||
| Reinvestment of distributions | 1,017 | 413 | ||||||
| Repurchase of shares | (642 | ) | — | |||||
| Exchange of shares | — | — | ||||||
| Total Class D Transactions | 975 | 10,413 | ||||||
| Class S | ||||||||
| Proceeds from shares issued | — | 10,000 | ||||||
| Reinvestment of distributions | 1,838 | 413 | ||||||
| Repurchase of shares | — | — | ||||||
| Exchange of shares | 34,435 | — | ||||||
| Total Class S Transactions | 36,273 | 10,413 | ||||||
| Class T1 | ||||||||
| Proceeds from shares issued | — | 34,125 | ||||||
| Reinvestment of distributions | — | 409 | ||||||
| Repurchase of shares | — | — | ||||||
| Exchange of shares | (34,435 | ) | — | |||||
| Total Class T Transactions | (34,435 | ) | 34,534 | |||||
| Change in Net Assets Resulting from Capital Share Transactions | 854,563,920 | 168,937,007 | ||||||
| Total Increase (Decrease) in Net Assets | 852,468,099 | 168,733,020 | ||||||
The accompanying notes are an integral part of these consolidated financial statements
40
StepStone Private Credit Income Fund
Consolidated Statements of Changes in Net Assets (continued)
For the Year | For
the Period Ended December 31, 2024* | |||||||
| Net Assets | ||||||||
| Beginning of period | 168,733,020 | — | ||||||
| End of period | $ | 1,021,201,119 | $ | 168,733,020 | ||||
| * | The Fund commenced operations on June 3, 2024. See Note 1 in the accompanying notes to consolidated financial statements. |
| 1 | On January 17, 2025, the Fund converted Class T shares into Class S shares and ceased offering Class T Shares. |
The accompanying notes are an integral part of these consolidated financial statements
41
StepStone Private Credit Income Fund
Consolidated Statement of Cash Flows
For the Year Ended December 31, 2025
| Cash Flows From Operating Activities | ||||
| Net increase (decrease) in net assets from operations | $ | 82,261,258 | ||
| Adjustments to reconcile net increase (decrease) in net assets resulting from operations to net cash provided by (used in) operating activities: | ||||
| Purchases of investments, net of payable for investments purchased | (869,480,734 | ) | ||
| Proceeds from sales and repayments of investments, net of receivable from unsettled transactions | 358,268,335 | |||
| Net accretion of original issue discount on investments | (2,156,902 | ) | ||
| Investments payment in-kind income | (245,766 | ) | ||
| Net realized (gain) loss | 1,525,136 | |||
| Net change in unrealized appreciation (depreciation) on investments | (4,467,695 | ) | ||
| Net change in unrealized appreciation (depreciation) on forward foreign currency exchange contracts | (20,453 | ) | ||
| Cash received from acquisition (Note 16) | 141,932,908 | |||
| Amortization of debt issuance costs | 677,468 | |||
| Amortization of offering costs | 201,962 | |||
| (Increase) Decrease in Assets | ||||
| Dividend and interest receivable | (5,092,452 | ) | ||
| Due from Adviser | 305,985 | |||
| Prepaid expenses | (52,052 | ) | ||
| Increase (Decrease) in Liabilities | ||||
| Professional fees payable | (103,698 | ) | ||
| Revolving credit facility interest and fees payable | 3,819,975 | |||
| Management fees payable | 844,164 | |||
| Incentive fees payable | 2,855,862 | |||
| Trustees’ fees payable | (34,848 | ) | ||
| Administration fees payable | 90,770 | |||
| Transfer agent fees payable | 13,400 | |||
| Due to Adviser | 24,848 | |||
| Other accrued expenses | 165,248 | |||
| Net Cash Provided by (Used in) Operating Activities | (288,667,281 | ) | ||
| Cash Flows from Financing Activities | ||||
| Proceeds from issuance of shares, net of receivable for Fund shares sold | 211,017,690 | |||
| Repurchase of shares | (22,431,827 | ) | ||
| Distributions paid in cash | (43,373,633 | ) | ||
| Proceeds from revolving credit facilities | 499,999,999 | |||
| Repayments of revolving credit facilities | (324,500,000 | ) | ||
| Debt issuance costs paid | (2,292,250 | ) | ||
| Net Cash Provided by (Used in) Financing Activities | 318,419,979 | |||
| Net Increase (Decrease) in Cash and Restricted cash | 29,752,698 | |||
The accompanying notes are an integral part of these consolidated financial statements
42
StepStone Private Credit Income Fund
Consolidated Statement of Cash Flows (continued)
For the Year Ended December 31, 2025
| Cash and Restricted cash | ||||
| Beginning of period | 7,405,813 | |||
| End of period | $ | 37,158,511 | ||
| Reconciliation to the Consolidated Statement of Assets and Liabilities | ||||
| Cash | 6,816,554 | |||
| Restricted cash | 29,545,131 | |||
| Cash denominated in foreign currency | 796,826 | |||
| Total Cash and Restricted cash | $ | 37,158,511 | ||
| Supplemental Information and Non-Cash Activities | ||||
| Cash paid during the period for interest expense and commitment fees | $ | 10,501,157 | ||
| Cash paid for state, local and excise taxes | $ | 64,345 | ||
| Reinvestment of distributions | $ | 40,983,446 | ||
| Value of shares issued in connection with portfolio acquisition (Note 16) | $ | 623,460,822 | ||
| Investments purchased in connection with portfolio acquisition (Note 16) | $ | 594,316,300 | ||
| Credit facility assumed in connection with portfolio acquisition (Note 16) | $ | 112,788,386 |
The accompanying notes are an integral part of these consolidated financial statements
43
StepStone Private Credit Income Fund
Consolidated Financial Highlights
Class I
Per share operating performance for a capital share outstanding throughout each period
| For the Year Ended December 31, 2025 | For the Period Ended December 31, 2024* | |||||||
| Senior Securities: | As of December 31, 2025 | As of December 31, | ||||||
| Total borrowings (in thousands) | $ | $ | ||||||
| Asset coverage per $ | 4,028 | 4,444 | ||||||
| * | |
| 1 | Per share data calculated using average shares method. |
| 2 | Includes balancing amounts necessary to reconcile the change in NAV per share for the period. |
| 3 | The net asset values and total returns have been calculated on net assets which include adjustments made in accordance with U.S. generally accepted accounting principles required at period end for financial reporting purposes. |
| 4 | Ratios do not reflect the Fund’s share of income and expenses originating from investments in underlying Investment Funds. |
| 5 | Net investment income (loss) and expense ratios have been annualized for periods of less than twelve months, except for organizational costs, which are one-time expenses, and incentive fees. As of December 31, 2025, the Fund is fully recouped and as such, adviser expense recoupment (reimbursement) is not annualized for the year ended December 31, 2025. If incentive fees were excluded, the net investment income (loss) ratio would have increased by 0.97% and 0.54% for the year ended December 31, 2025 and the period ended December 31, 2024, respectively. If incentive fees were excluded, the expense ratio would have decreased by 0.97% and 0.54% for the year ended December 31, 2025 and the period from the commencement of operations through December 31, 2024, respectively. |
| 6 | Total return reflects the change in the net asset value per share based on the effects of the performance of the Fund during the period and assumes distributions, if any, were reinvested in accordance with the Fund’s Dividend Reinvestment Plan (“DRIP”) (See Note 12). The total return for periods less than one year has not been annualized. |
| 7 | Total return would have been lower had certain expenses not been waived and assumed by the Adviser during periods of reimbursement. |
| 8 | Excluding cash equivalents, the portfolio turnover rate represents lesser of the Fund’s purchases, or sales and proceeds from repayments of investments for the period divided by the average monthly fair value of the Fund’s investments during the period and as required excludes investments acquired as part of the acquisition as described in Note 16. Result is not annualized. |
| 9 |
The accompanying notes are an integral part of these consolidated financial statements
44
StepStone Private Credit Income Fund
Consolidated Financial Highlights (continued)
Class D
Per share operating performance for a capital share outstanding throughout each period
| For
the Year Ended December 31, 2025 | For
the Period Ended December 31, 2024* | |||||||
| Per Share Operating Performance: | ||||||||
| Net Asset Value per share, beginning of period | $ | 10.07 | $ | 10.00 | ||||
| Activity from investment operations: | ||||||||
| Net investment income (loss)¹ | 0.88 | 0.48 | ||||||
| Net realized and unrealized gain (loss)² | 0.05 | — | ||||||
| Total from investment operations | 0.93 | 0.48 | ||||||
| Less distributions: | ||||||||
| From net investment income | (0.92 | ) | (0.41 | ) | ||||
| Total distributions | (0.92 | ) | (0.41 | ) | ||||
| Net Asset Value per share, end of period³ | $ | 10.08 | $ | 10.07 | ||||
| Net Assets, end of period (in thousands) | $ | 11 | $ | 10 | ||||
| Ratios to average net assets⁴ | ||||||||
| Net investment income (loss)⁵ | 8.60 | % | 8.79 | % | ||||
| Expenses before adviser expense recoupment (reimbursement)⁵ | 4.65 | % | 7.16 | % | ||||
| Expenses after adviser expense recoupment (reimbursement)⁵ | 4.76 | % | 5.70 | % | ||||
| Total return³ ⁶ ⁷ | 9.36 | % | 4.83 | % | ||||
| Portfolio turnover rate⁸ | 76.00 | % | 15.63 | % | ||||
| Senior Securities: | As of 2025 | As of December 31, | ||||||
| Total borrowings (in thousands) | $ | $ | ||||||
| Asset coverage per $ | 4,028 | 4,444 | ||||||
| * | The Fund commenced operations on June 3, 2024. See Note 1 in the accompanying notes to consolidated financial statements. |
| 1 | Per share data calculated using average shares method. |
| 2 | Includes balancing amounts necessary to reconcile the change in NAV per share for the period. |
| 3 | The net asset values and total returns have been calculated on net assets which include adjustments made in accordance with U.S. generally accepted accounting principles required at period end for financial reporting purposes. |
| 4 | Ratios do not reflect the Fund’s share of income and expenses originating from investments in underlying Investment Funds. |
| 5 | Net investment income (loss) and expense ratios have been annualized for periods of less than twelve months, except for organizational costs, which are one-time expenses, and incentive fees. As of December 31, 2025, the Fund is fully recouped and as such, adviser expense recoupment (reimbursement) is not annualized for the year ended December 31, 2025. If incentive fees were excluded, the net investment income (loss) ratio would have increased by 0.97% and 0.54% for the year ended December 31, 2025 and the period ended December 31, 2024, respectively. If incentive fees were excluded, the expense ratio would have decreased by 0.97% and 0.54% for the year ended December 31, 2025 and the period from the commencement of operations through December 31, 2024, respectively. |
| 6 | Total return reflects the change in the net asset value per share based on the effects of the performance of the Fund during the period and assumes distributions, if any, were reinvested in accordance with the Fund’s DRIP (See Note 12). The total return for periods less than 1 year has not been annualized. |
| 7 | Total return would have been lower had certain expenses not been waived and assumed by the Adviser during periods of reimbursement. |
| 8 | Excluding cash equivalents, the portfolio turnover rate represents lesser of the Fund’s purchases, or sales and proceeds from repayments of investments for the period divided by the average monthly fair value of the Fund’s investments during the period and as required excludes investments acquired as part of the acquisition as described in Note 16. Result is not annualized. |
| 9 | Calculated by subtracting the Fund’s total liabilities (not including borrowings) from the Fund’s total assets and dividing this by the total number of senior indebtedness units, where one unit equals $1,000 of senior indebtedness. |
The accompanying notes are an integral part of these consolidated financial statements
45
StepStone Private Credit Income Fund
Consolidated Financial Highlights (continued)
Class S
Per share operating performance for a capital share outstanding throughout each period
| For
the Year Ended December 31, 2025 | For
the Period Ended December 31, 2024* | |||||||
| Per Share Operating Performance: | ||||||||
| Net Asset Value per share, beginning of period | $ | 10.07 | $ | 10.00 | ||||
| Activity from investment operations: | ||||||||
| Net investment income (loss)¹ | 0.83 | 0.48 | ||||||
| Net realized and unrealized gain (loss)² | 0.04 | — | ||||||
| Total from investment operations | 0.87 | 0.48 | ||||||
| Less distributions: | ||||||||
| From net investment income | (0.86 | ) | (0.41 | ) | ||||
| Total distributions | (0.86 | ) | (0.41 | ) | ||||
| Net Asset Value per share, end of period³ | $ | 10.08 | $ | 10.07 | ||||
| Net Assets, end of period (in thousands) | $ | 47 | $ | 10 | ||||
| Ratios to average net assets⁴ | ||||||||
| Net investment income (loss)⁵ | 8.14 | % | 8.79 | % | ||||
| Expenses before adviser expense recoupment (reimbursement)⁵ | 5.23 | % | 7.16 | % | ||||
| Expenses after adviser expense recoupment (reimbursement)⁵ | 5.34 | % | 5.70 | % | ||||
| Total return³ ⁶ ⁷ | 8.88 | % | 4.83 | % | ||||
| Portfolio turnover rate⁸ | 76.00 | % | 15.63 | % | ||||
| Senior Securities: | As of December 31, | As of December 31, | ||||||
| Total borrowings (in thousands) | $ | $ | ||||||
| Asset coverage per $ | 4,028 | 4,444 | ||||||
| * | The Fund commenced operations on June 3, 2024. See Note 1 in the accompanying notes to consolidated financial statements. |
| 1 | Per share data calculated using average shares method. |
| 2 | Includes balancing amounts necessary to reconcile the change in NAV per share for the period. |
| 3 | The net asset values and total returns have been calculated on net assets which include adjustments made in accordance with U.S. generally accepted accounting principles required at period end for financial reporting purposes. |
| 4 | Ratios do not reflect the Fund’s share of income and expenses originating from investments in underlying Investment Funds. |
| 5 | Net investment income (loss) and expense ratios have been annualized for periods of less than twelve months, except for organizational costs, which are one-time expenses, and incentive fees. As of December 31, 2025, the Fund is fully recouped and as such, adviser expense recoupment (reimbursement) is not annualized for the year ended December 31, 2025. If incentive fees were excluded, the net investment income (loss) ratio would have increased by 1.00% and 0.54% for the year ended December 31, 2025 and the period ended December 31, 2024, respectively. If incentive fees were excluded, the expense ratio would have decreased by 1.00% and 0.54% for the year ended December 31, 2025 and the period from the commencement of operations through December 31, 2024, respectively. |
| 6 | Total return reflects the change in the net asset value per share based on the effects of the performance of the Fund during the period and assumes distributions, if any, were reinvested in accordance with the Fund’s DRIP (See Note 12). Total return for periods less than 1 year has not been annualized. Total return shown excludes the effect of applicable sales charges. |
| 7 | Total return would have been lower had certain expenses not been waived and assumed by the Adviser during periods of reimbursement. |
| 8 | Excluding cash equivalents, the portfolio turnover rate represents lesser of the Fund’s purchases, or sales and proceeds from repayments of investments for the period divided by the average monthly fair value of the Fund’s investments during the period and as required excludes investments acquired as part of the acquisition as described in Note 16. Result is not annualized. |
| 9 | Calculated by subtracting the Fund’s total liabilities (not including borrowings) from the Fund’s total assets and dividing this by the total number of senior indebtedness units, where one unit equals $1,000 of senior indebtedness. |
The accompanying notes are an integral part of these consolidated financial statements
46
StepStone Private Credit Income Fund
Notes to
Consolidated Financial Statements
December 31, 2025
1. Organization
StepStone Private Credit Income Fund (“Fund”) was organized as a Delaware statutory trust under the Delaware Statutory Trust Act on December 18, 2023 ("Inception") and is registered under the Investment Company Act of 1940, as amended, ("1940 Act") as a non-diversified, closed-end management investment company that is operated as an interval fund. The Fund commenced operations on June 3, 2024 ("Commencement of Operations").
The Fund offers an unlimited amount of number of shares in three separate classes of shares of beneficial interest designated as Class I Shares, Class D Shares and Class S Shares (collectively, “Shares”) to eligible investors (“Shareholders”).On January 17, 2025, the Fund converted all outstanding Class T shares into Class S shares and ceased offering Class T shares. The Shares are offered in a continuous registered public offering with subscriptions accepted daily at the then-current-daily net asset value (“NAV”) per share, adjusted for sales load, if applicable. The Fund conducts quarterly offers to repurchase between 5.00% and 25.00% of its outstanding Shares at NAV, pursuant to Rule 23c-3 under the 1940 Act, unless such offer is suspended or postponed in accordance with regulatory requirements. The offer to repurchase Shares is a fundamental policy that may not be changed without the vote of the holders of a majority of the Fund’s outstanding voting Shares as defined in the 1940 Act.
The Fund’s Board of Trustees (“Board”) provides broad oversight over the Fund’s investment program, management and operations and has the right to delegate management responsibilities. StepStone Private Wealth LLC serves as the Fund's investment adviser ("Adviser") and is a registered investment adviser under the Investment Advisers Act of 1940, as amended. The Adviser is a wholly owned subsidiary of StepStone Group LP. The Adviser oversees the management of the Fund’s day-to-day activities including structuring, governance, distribution, reporting and oversight. StepStone Group Private Debt LLC, an affiliate of StepStone Group LP, serves as the Fund’s investment sub-adviser (“Sub-Adviser”) and is responsible for the day-to-day management of the Fund’s assets. StepStone Group Europe Alternative Investments Limited (“SGEAIL”), an affiliate of StepStone Group LP, serves as the Fund’s investment sub-subadviser (“Sub-Subadviser”) and will provide ongoing research regarding the Fund’s investment portfolio. The Sub- Adviser and Sub-Subadviser are wholly owned subsidiaries of StepStone Group Private Debt AG (formerly, Swiss Capital Alternative Investments AG), which is a subsidiary of StepStone.
The Fund’s investment objectives are to seek to generate current income and, to a lesser extent, long-term capital appreciation. The Fund seeks to achieve its investment objectives by investing, under normal circumstances, at least 80% of its total assets (net assets plus borrowings for investment purposes) in private credit and income-related investments (“Private Credit Investments”). The Fund defines Private Credit Investments to consist primarily of direct lending and specialty credit strategies. The Fund intends to primarily use a multi-lender approach to achieve its investment objectives while utilizing a variety of non-bank or corporate lenders to source investment opportunities for the Fund. The Fund’s assets may be deployed in investment strategies deemed appropriate under prevailing economic and market conditions to seek to achieve the Fund’s investment objectives. The Fund may make non-U.S. investments, some of which may be denominated in currencies other than the U.S. dollar. In most cases, the currency fluctuations of investments will be hedged through the use of currency derivatives or other instruments.
Master-Feeder Structure
The Fund and CRDEX Equity Partners LLC (“Feeder Fund”) are part of a “master-feeder” structure as described in Note 16. The Feeder Fund invests substantially all of its assets in the Class I Shares of the Fund. As of December 31, 2025, the Feeder Fund owns 63.06% of the Fund’s net assets.
2. Summary of Significant Accounting Policies
The accompanying consolidated financial statements have been prepared in conformity with accounting principles generally accepted in the United States of America (“U.S. GAAP”) and are presented in U.S. dollars which is the functional currency of the Fund. The Fund is an investment company and therefore applies the accounting and reporting guidance issued by the Financial Accounting Standards Board (“FASB”) in Accounting Standards Codification (“ASC”) 946, Financial Services — Investment Companies. The following are significant accounting policies which are consistently followed in the preparation of the consolidated financial statements.
Basis of Consolidation
As provided under ASC Topic 946 and Regulation S-X, the Fund will generally not consolidate its investment in a company other than a wholly-owned or substantially wholly-owned investment company subsidiary whose design and purpose is to act as an extension of the Fund’s investment operations and facilitate the execution of the Fund’s investment strategy. Accordingly, the Fund has consolidated the results of the Fund’s direct wholly-owned subsidiaries including: Great Lakes SSG SPV Holdings LLC (“SSG Holdings SPV”), a Delaware limited liability company; CRDEX Cayman LLC, a limited liability company registered in the Cayman Islands; and CRDEX LLC and Great Lakes SSG SPV, which are bankruptcy remote special purpose vehicles organized as a Delaware limited liability companies (collectively, "Wholly-Owned Subsidiaries"). The effects of all intercompany transactions between the Fund and its Wholly-Owned Subsidiaries have been eliminated in consolidation.
47
StepStone Private Credit Income Fund
Notes to
Consolidated Financial Statements (continued)
December 31, 2025
Use of Estimates
The preparation of consolidated financial statements in conformity with U.S. GAAP requires management to make estimates and assumptions that affect the reported amounts of assets and liabilities and disclosures of contingent assets and liabilities at the date of the consolidated financial statements and the reported amounts of income and expenses during the reporting period. Changes in the economic environment, financial markets and any other factors or parameters used in determining these estimates could cause actual results to differ materially.
Net Asset Value Determination
The NAV of the Fund is determined as of the close of the regular trading session on the New York Stock Exchange (“NYSE”) (normally 4:00 p.m. Eastern Time) on each business day that the NYSE is open for trading, or as may be determined from time to time in accordance with policies approved by the Board (each, a “Determination Date”). In determining NAV, the Fund’s investments are valued as of the relevant Determination Date. The NAV of the Fund will equal, unless otherwise noted, the value of the total assets of the Fund, less all of its liabilities, including accrued fees and expenses allocated to Shares based on the relative net assets of each class to the total net assets of the Fund, each determined as of the relevant Determination Date.
Valuation of Investments
The Fund’s investments are valued as of each Determination Date at fair value consistent with the principles of ASC Topic 820, Fair Value Measurements (“ASC 820”). Pursuant to Rule 2a-5 under the 1940 Act, the Board has designated the Adviser as the valuation designee for the Fund to perform fair value determinations of the Fund’s investments. The Board has approved the Adviser’s valuation policy (“Valuation Policy”). The Adviser utilizes the resources and personnel of the Sub-Adviser, the Sub-sub adviser and the Fund’s sub-administrator (as defined herein) in carrying out its responsibilities. The Board has ultimate oversight responsibility for valuing all investments held by the Fund.
Investments for which market quotations are not readily available are valued at fair value as determined in good faith pursuant to Rule 2a-5 under the 1940 Act and ASC Topic 820. The Adviser’s Valuation Policy governs the Adviser’s selection and application of methodologies for determining and calculating the fair value of the Fund’s investments. Fair value calculations will involve significant professional judgment by the Adviser in the application of both observable and unobservable inputs.
For securities or Private Credit Investments that are quoted, traded or exchanged in an accessible, active market, the value of the asset is determined by multiplying the number of securities held by the quoted market price as of the measurement (or reporting) date. The Adviser does not apply any liquidity or restriction discount regardless of ownership structure or the ability to control the sale of the asset.
If a quoted market price is not available or not deemed to be indicative of fair value, the Adviser may elect to obtain broker quotes directly from a broker-dealer or passed through from a third-party pricing vendor. In the event that fair value is based upon a single sourced broker quote, these Private Credit Investments are categorized as Level 3 of the fair value hierarchy described in Note 4 of the Notes to the Consolidated Financial Statements. If the Fund were to use broker quotes, they would typically be received from established market participants. Although independently received, the Adviser does not have the transparency to view the underlying inputs which support the market quotation. Significant changes in the broker quote would have direct and proportional changes in the fair value of the security.
If the quotations obtained from brokers or pricing vendors are determined not to be reliable or are not readily available, the Fund may value such Private Credit Investments using a variety of valuation techniques. For direct lending investments, the Adviser generally uses a market interest rate yield analysis to determine fair value. To determine fair value using a yield analysis, the expected cash flows are projected based on the contractual terms of the debt security and discounted back to the measurement date based on a market yield. A market yield is determined based upon an assessment of current and expected market yields for similar Private Credit Investments and risk profiles. The Fund considers the current contractual interest rate, the expected life and other terms of the Private Credit Investment relative to risk of the company and the specific direct lending investment. For specialty credit investments, the Fund also considers payment ratios, conditional prepayment rates, charge-off rates, delinquency ratios and other measures of the specific specialty credit investment's performance.
In determining the estimated fair value of a performing Private Credit Investment for which there is no actively traded market, the estimate of fair value will consider such factors as the current market environment relative to that of the Private Credit Investment held, the tenor of maturity date of the Private Credit Investment, the operating performance of the issuer, the concern for maintaining any covenant levels embedded in the instrument, the ability of the issuer to call the security (and the associated redemption price), market interest rate spreads and the general overall credit quality of the security over the life of the Private Credit Investment.
48
StepStone Private Credit Income Fund
Notes to
Consolidated Financial Statements (continued)
December 31, 2025
Each direct Private Credit Investment is assigned an internal credit rating. The ratings are based on available fundamental information and are used in conjunction with market inputs to create an estimate of fair value. For Private Credit Investments with higher ratings, no additional steps are taken. Private Credit Investments with lower internal credit ratings are considered for additional or alternative procedures to determine a fair value, which will include, but are not limited to, a review of additional market inputs, performance and other relevant information on comparable assets.
Defaulted Private Credit Investments are valued using several methods including the following: discounting the expected cash flows of the Private Credit Investment, valuing the net assets of the company, reviewing comparable precedent transactions involving similar companies, and using a performance multiple or market-based approach.
For defaulted Private Credit Investments, discounted cash flow valuation uses an internal analysis based on the Adviser’s expectation of future income and expenses, capital structure, exit multiples of a security, and other unobservable inputs which may include contractual and factual loan factors, estimated future payments and credit rating.
Generally, an increase in market yields or discount rates or a decrease in EBITDA multiples may result in a decrease in the fair value of certain Private Credit Investments of the Fund. These Private Credit Investments are categorized as Level 3 of the fair value hierarchy.
Ordinarily, the fair value of the Fund’s investment in a private investment fund (“Investment Fund”) is based on the net asset value of the Investment Fund reported by its investment manager (“Investment Manager”). If the Adviser determines that the most recent net asset value reported by the Investment Manager does not represent fair value or if the Investment Manager fails to report a net asset value to the Fund, a fair value determination is made by the Adviser in accordance with the Valuation Policy. In making that determination, the Adviser will consider whether it is appropriate, in light of all relevant circumstances, to value such Investment Fund at the net asset value last reported by its Investment Manager, or whether to adjust such net asset value to reflect a premium or discount (adjusted net asset value). The net asset values or adjusted net asset values are net of management fees and incentive fees (carried interest) payable pursuant to the respective organizational documents of each Investment Fund. See further discussion regarding Investment Funds in Note 3.
Collateralized Loan Obligations (“CLO”) are not traded on a national securities exchange and instead are valued using a market yield approach. Under this approach, the Adviser estimates the fair value of CLO investments by applying a discounted cash flow methodology. Expected future cash flows are projected based on the terms of the CLO, the performance and characteristics of the underlying loan collateral, and assumptions regarding default rates, recovery rates, prepayment behavior, reinvestment spreads, reinvestment prices, and structural features of the CLO. These projected cash flows are then discounted using an assumed market yield (or required rate of return) that the Adviser believes a market participant would require for an investment with similar risk characteristics at the measurement date.
The assumed yield used in the valuation reflects factors including, but not limited to, prevailing market conditions, credit risk, liquidity considerations, structural subordination, and the expected volatility of cash flows. Because the valuation incorporates significant unobservable inputs, the fair value of the Fund’s CLO investments is classified as Level 3 within the fair value hierarchy.
The fair value of a Collateralized Loan Obligation Warehouse (“CLO Warehouse”), included as a direct lending investment in the Consolidated Schedule of Investments, if any, reflects the Fund’s pro rata interest in the residual economics of the structure. These investments are typically leveraged and are therefore sensitive to changes in the value and performance of the underlying assets. Valuation is influenced by factors including distributions, defaults, recoveries, prepayments, and the reinvestment environment. Interest is accrued daily based on an effective yield. Because the valuation incorporates significant unobservable inputs, the fair value of the Fund’s CLO Warehouse investments is classified as Level 3 within the fair value hierarchy.
Due to the inherent uncertainty of valuations, however, estimated fair values may differ from the values that would have been used had a readily available market for the investments existed and the differences could be material.
Revenue Recognition
Purchases of investment funds are recorded as of the first day of legal ownership and redemptions from investment funds are recorded as of the last day of legal ownership. All other investment transactions are recorded as of the trade date for financial reporting purposes. Realized gains and losses from investments sold are recorded on the identified cost basis. Dividend income, if any, is recorded on the ex-dividend date.
Distributions received from Investment Funds occur at irregular intervals and the exact timing of the distributions is not known. The classification and timing of distributions received in cash or in-kind, including return of capital, realized gains, interest income and dividend income, is based on information received from the Investment Manager of the Investment Fund.
49
StepStone Private Credit Income Fund
Notes to
Consolidated Financial Statements (continued)
December 31, 2025
Interest income is recognized on an accrual basis. Interest income on debt instruments is accrued and recognized for those issuers who are currently paying in full cash interest or expected to pay in full cash interest. For those issuers who are in default or are expected to default, cash interest is not accrued and is only recognized when received unless the cash received is applied to principal based upon management’s judgment. Loan origination fees, original issue discounts ("OID") and market discounts or premiums are capitalized as part of the underlying cost of the Private Credit Investments and accreted or amortized over the life of the Private Credit Investments as interest income using the effective interest method.
Direct Loans and Specialty Credit Loans are generally placed on non-accrual status when a payment default occurs or if management otherwise believes that the issuer of the loan will not be able to make contractual interest payments or principal payments. The Fund will cease recognizing interest income on that loan until all principal and interest is current through payment or until a restructuring occurs, such that the interest income is deemed to be collectible. However, the Fund remains contractually entitled to this interest. The Fund may make exceptions to this policy if the loan has sufficient collateral value and is in the process of collection. Accrued interest is written-off by reversing interest income in the period when it becomes probable that the interest will not be collected and the amount of uncollectible interest can be reasonably estimated. As of December 31, 2025, no loans have defaulted or were on non-accrual status.
The Fund may earn various fees during the life of the loans. Such fees include, but are not limited to, administration and amendment fees, some of which are paid to the Fund on an ongoing basis. These fees, if any, are recognized as earned as a component of interest income on the Consolidated Statement of Operations. For the year ended December 31, 2025 the Fund recorded $0.2 million of interest income related to amendment fees.
Upon prepayment of a loan or debt security, any prepayment premiums, unamortized upfront loan origination fees, unamortized syndication fees, unamortized commitment fees and unamortized discounts are recorded as interest income. The Fund had prepayments that resulted in $0.6 million in interest income for the year ended December 31, 2025.
The Fund may have Private Credit Investments that contain payment in-kind (“PIK”) provisions. PIK income, computed at the contractual rate specified in the Private Credit Investment agreement, is added to the principal balance of the Private Credit Investment and collected upon repayment of the outstanding principal, and is recorded as payment in-kind income on the Consolidated Statement of Operations. The Fund prospectively ceases recognition of PIK income and adjusts the associated principal balance if such amounts and balances are deemed to be doubtful of collection. For Private Credit Investments with PIK income, the Fund calculates income accruals based on the principal balance including any PIK.
When a PIK Private Credit Investment is placed on non-accrual status, the accrued, uncapitalized interest is reversed through interest income. To maintain the Fund’s status as a RIC, this non-cash source of income must be paid out to shareholders in the form of dividends, even though the Fund has not yet collected cash.
Interest income for CLO beneficial interests is recognized using the effective yield method, based on management’s estimate of expected cash flows over the life of the security in accordance with FASB ASC 325-40, Beneficial Interests in Securitized Financial Assets. Estimated yields for CLO positions are updated upon receipt of payments quarterly, as needed, or upon a transaction, such as an add-on purchase, refinancing or reset. When payments are received, any amount above or below the expected yield is treated as an adjustment to interest income or cost basis. The expected yield and investment cost may ultimately not be realized.
Foreign Currency Translation
The books and records of the Fund are maintained in U.S. dollars. The value of investments, assets and liabilities denominated in currencies other than U.S. dollars are translated into U.S. dollars based upon current foreign exchange rates on the Determination Date. Purchases and sales of foreign investments, income and expenses are converted into U.S. dollars based on currency exchange rates prevailing on the date of the relevant transaction. Net realized gain (loss) on foreign currency transactions and net change in unrealized appreciation (depreciation) on foreign currency translations represents foreign exchange: (1) gains and losses from the holding and sales of foreign currencies; (2) gains and losses between trade date and settlement date on investment securities transactions; and (3) gains and losses from the difference between amounts of interest and dividends recorded as receivable and the amounts actually received. The Fund does not separately isolate the impact of changes in exchange rates from other changes in the fair value of investments within the net realized gain (loss) and the change in unrealized appreciation (depreciation) of investments as presented on the Consolidated Statement of Operations.
Forward Foreign Currency Exchange Contracts
The Fund may utilize forward foreign currency exchange contracts (“Forward Contracts”) under which the Fund is obligated to exchange currencies with counterparties on specified future dates at specified rates, and is subject to valuation changes based on the translations of foreign exchange rates fluctuations. All contracts are “marked-to-market” daily and any resulting unrealized gains or losses are recorded as unrealized appreciation or depreciation on forward foreign currency exchange contracts. The Fund records realized gains or losses at the time the Forward Contract is settled. Counterparties to these forward contracts are major U.S. financial institutions. As of December 31, 2025, the Fund had one outstanding Forward Contract sold short, with total notional value of $9.2 million.
50
StepStone Private Credit Income Fund
Notes to
Consolidated Financial Statements (continued)
December 31, 2025
Fund Expenses
The Fund bears all expenses incurred in the course of its operations including, but not limited to, the following: all fees and expenses of the Fund Investments in which the Fund invests, including the underlying fees of the Fund Investments (“Acquired Fund Fees”), management fees, incentive fees, fees and expenses associated with a credit facility, legal fees, administrator fees, audit and tax preparation fees, custodial fees, transfer agency fees, registration expenses, expenses of the Board and other administrative expenses. Certain of these operating expenses are subject to an expense limitation agreement (“Expense Limitation and Reimbursement Agreement” as further discussed in Note 6). Expenses are recorded on an accrual basis and, other than class-specific expenses, are allocated pro-rata to Shares based upon prior day net assets at each Determination Date. Class-specific expenses are allocated only to their respective share class (see Note 8). Closing costs associated with the purchase of Investment Funds are included in the cost of the investment.
Debt Issuance Costs
Debt issuance costs consist of fees and expenses paid in connection with the closing of and amendments to the Fund’s revolving credit facilities. The aforementioned costs are amortized over the instrument’s term. Unamortized debt issuance costs are presented net against the outstanding revolving credit facilities balance on the Consolidated Statement of Assets and Liabilities.
Federal Income Taxes
For U.S. federal income tax purposes, the Fund has elected to be treated, and intends to qualify annually, as a Regulated Investment Company (“RIC”) under Subchapter M of the Internal Revenue Code of 1986, as amended, by distributing substantially all of its taxable net investment income and net realized capital gains to Shareholders each year and by meeting certain diversification and income requirements with respect to investments. If the Fund were to fail to meet the requirements to qualify as a RIC, and if the Fund were ineligible to or otherwise unable to cure such failure, the Fund would be subject to tax on its taxable income at corporate rates, whether or not distributed to Shareholders, and all distributions of earnings and profits would be taxable to Shareholders as ordinary income.
Additionally, the Fund is subject to a 4% federal excise tax on any undistributed income, including net capital gains, if it does not distribute at least 98% of its taxable income and 98.2% of its capital gains each year. The Fund endeavors to meet these distribution requirements to avoid such excise tax, and any excise tax liability, if incurred, will be reflected in the consolidated financial statements.
The Fund’s tax year is the 12-month period ending December 31. The Fund files tax returns as prescribed by the tax laws of the jurisdictions in which it operates. In the normal course of business, the Fund is subject to examination by federal, state, local and foreign jurisdictions, where applicable. As of December 31, 2025, only tax year 2024 is subject to examination by the major tax jurisdictions under the statute of limitations.
Distributions are determined in accordance with federal income tax regulations, which may differ from net investment income and net realized capital gains for financial statement purposes under U.S. GAAP. Differences may be permanent or temporary. Permanent differences, including book/tax differences relating to Shareholder distributions, are reclassified among capital accounts in the consolidated financial statements to reflect the applicable tax characterization. Temporary differences arise when certain items of income, expense, gain or loss are recognized in different periods for financial statement and tax purposes; these differences will reverse in the future. The tax basis components of distributable earnings differ from the amounts reflected in the Consolidated Statement of Assets and Liabilities and Consolidated Statement of Operations due to temporary book/tax differences. These amounts will be finalized before filing the Fund’s federal tax return.
In accounting for income taxes, the Fund follows the guidance in FASB ASC Codification 740, Income Taxes ("ASC 740"). ASC 740 prescribes the minimum recognition threshold a tax position must meet in connection with accounting for uncertainties in income tax positions taken or expected to be taken by an entity before being measured and recognized in the consolidated financial statements. Management evaluates the tax positions taken or expected to be taken in the course of preparing the Fund's tax returns to determine whether the tax positions will "more-likely-than-not" be sustained upon examination by the applicable tax authority. Tax positions deemed to meet the more-likely-than-not threshold that would result in a tax benefit or expense to the Fund would be recorded as a tax benefit or expense in the current year.
In preparing the consolidated financial statements, SSG Holdings SPV and CRDEX LLC are disregarded for federal income tax purposes. CRDEX Cayman LLC is required to recognize their estimate of income taxes for purposes of determining deferred tax assets or liabilities. CRDEX Cayman LLC is subject to U.S. federal income and withholding tax, state taxes, and branch profits tax on effectively connected income with a U.S. trade or business. The Fund recognizes deferred income taxes for temporary differences in the basis of assets and liabilities for financial and income tax purposes. Deferred tax assets are recognized for deductible temporary differences, tax credit carryforwards or net operating loss carryforwards and deferred tax liabilities are recognized for taxable temporary differences. To the extent the Wholly-Owned Subsidiaries have a deferred tax asset, consideration is given to whether a valuation allowance is required.
51
StepStone Private Credit Income Fund
Notes to
Consolidated Financial Statements (continued)
December 31, 2025
Organizational and Offering Costs
During the period from Inception through the Commencement of Operations, the Fund incurred organizational costs of $0.1 million. The organizational costs paid by the Adviser have been reimbursed by the Fund in accordance with the Expense Limitation and Reimbursement Agreement. Organizational costs consist primarily of costs to establish the Fund and enable it to legally conduct business. The Fund expenses organizational costs as incurred.
During the period from Inception through the Commencement of Operations, the Fund incurred offering costs of $0.5 million. Offering costs are treated as deferred charges and, upon Commencement of Operations, amortized over a 12-month period using the straight-line method. During the year ended December 31, 2025, the Fund amortized offering costs of $0.2 million which are included in the Consolidated Statement of Operations. Offering costs paid by the Adviser may be reimbursed by the Fund in accordance with the Expense Limitation and Reimbursement Agreement. Offering costs consist primarily of legal fees, filing fees and printing costs in connection with the preparation of the registration statement and related filings. The Fund will continue to incur offering costs due to its continuously offered status. Ongoing offering costs will be expensed as incurred.
Cash and Restricted Cash
Cash includes monies on deposit with UMB Bank, N.A. who serves as the Fund’s custodian (“Custodian”). Deposits, at times, may exceed the insurance limit guaranteed by the Federal Deposit Insurance Corporation. The Fund has not experienced any losses on deposits and does not believe it is exposed to significant credit risk on such deposits.
Cash deposits are insured by the Federal Deposit Insurance Corporation by up to $250,000. Restricted cash includes amounts that are collected and held in connection with assets securing certain of the Fund's financing transactions. Restricted cash is restricted for payment of interest expense and principal on the outstanding borrowings or for reinvestment into new assets.
Shareholder Distributions
Distributions to shareholders are recorded on the ex-dividend date. Dividend payments are approved by the Board and are generally determined based upon current year estimated earnings and consider the level of undistributed taxable income carried forward from the prior year, if any, for distribution in the current year.
Segment Reporting
An operating segment is defined in ASC Topic 280, Segment Reporting, as a component of a public entity that engages in business activities from which it may recognize revenues and incur expenses, has operating results that are regularly reviewed by the public entity’s Chief Operating Decision Maker (“CODM”) to make decisions about resources to be allocated to the segment and assess its performance, and has discrete financial information available. A management committee of the Fund’s Adviser acts as the Fund’s CODM. The Fund represents a single operating segment, as the CODM monitors the operating results of the Fund as a whole. The Fund’s long-term strategic asset allocation is pre-determined in accordance with the terms of a defined investment strategy which is executed by the Fund’s portfolio managers as described in Note 1. The financial information in the form of the Fund’s portfolio composition, total returns, expense ratios, changes in net assets resulting from operations, and subscriptions and redemptions activity is used by the CODM to assess the Fund’s performance versus comparative benchmarks and to make resource allocation decisions for the Fund’s single segment, and is consistent with that presented within the Fund’s consolidated financial statements. Segment assets are reflected on the accompanying Consolidated Statement of Assets and Liabilities as “total assets” and significant segment expenses are listed on the accompanying Consolidated Statement of Operations.
3. Investments
Direct Lending
The Fund's direct lending investment strategy primarily consists of secured debt (including first lien senior secured and second lien senior secured), but may also include unsecured debt (including senior unsecured and subordinated debt) and mezzanine loans, as well as broadly syndicated loans and club deals (generally investments made by a small group of investment firms). First lien senior secured debt has first claim to any underlying collateral of a loan, second lien senior secured debt is secured but subordinated in payment and/or lower in lien priority to first lien holders. Through this strategy, the Fund may also invest in investment funds, and privately offered structured products such as CLOs.
52
StepStone Private Credit Income Fund
Notes to
Consolidated Financial Statements (continued)
December 31, 2025
Specialty Credit
The Fund's specialty credit investment strategy primarily consists of privately originated lending (including corporate, real estate, infrastructure-related debt, trade and supply chain finance, marketplace lending (consumers, lending to lenders, etc.), insurance-linked strategies and instruments, royalties, aviation financing, shipping, regulatory capital financing and net asset value lending); and privately originated non-performing loans (including, for example, US residential mortgage loans and business loans in the EU). Through this strategy, the Fund may also invest in investment funds, and privately offered structured products such as CLOs.
Collateralized Loan Obligations
As part of the Fund's direct lending and specialty credit investment strategies, the Fund may invest in CLOs, which are structured by pooling certain private loans, other lender assets, and their associated collateral. A sponsoring organization establishes a special purpose vehicle to hold the assets/collateral and issue securities; interests in these pools are sold as individual securities. Payments of principal and interest are passed through to investors and are typically supported by credit enhancements, such as a letter of credit, surety bond, limited guaranty or senior/subordination structures. These payments are divided into multiple tranches of debt securities, offering distinct maturity and credit risk profiles. Some tranches receive regular principal and interest installments, while others receive only interest, with principal due at maturity or upon specified call dates. Each tranche may or may not have a defined interest rate. In instances where a tranche has an interest rate, the rate may be fixed or floating.
Collateralized Loan Obligation Warehouse
A CLO Warehouse is an entity organized for the purpose of holding syndicated bank loans, also known as leveraged loans, prior to the issuance of securities from that same vehicle. During the warehouse period, a CLO Warehouse will secure investments and build a portfolio of primarily leveraged loans and other debt obligations. The warehouse period terminates when the collateralized loan obligation vehicle issues various tranches of securities to the market. At this time, financing through the issuance of debt and equity securities is used to repay bank financing.
Investment Funds
Through the Fund's direct lending and specialty credit investment strategies, the Fund may invest in Investment Funds which are limited partnerships or limited liability companies that invest primarily in loans to private companies and are reported in the Consolidated Schedule of Investments. From time to time, the Fund may decide to purchase interests in an Investment Fund in the secondary markets.
4. Fair Value Measurements
U.S. GAAP, ASC 820, defines fair value as the value that the Fund would receive to sell an investment or pay to transfer a liability in an orderly transaction with an independent buyer in the principal market, or in the absence of a principal market, the most advantageous market for the asset or liability. ASC 820 establishes a three-level hierarchy for fair value measurements based upon the transparency of inputs to the valuation of an asset or liability. Inputs may be observable or unobservable and refer broadly to the assumptions that market participants would use in pricing the asset or liability. Observable inputs reflect the assumptions market participants would use in pricing the asset or liability based on market data obtained from sources independent of the Fund. Unobservable inputs reflect the Fund’s own assumptions about the assumptions that market participants would use in valuing the asset or liability developed based on the best information available in the circumstances. Each investment is assigned a level based upon the observation of the inputs which are significant to the overall valuation. The three-level hierarchy of inputs is summarized below:
Level 1: Quoted prices are available in active markets for identical investments as of the reporting date. The types of investments which would generally be included in Level 1 include listed equities, registered money market funds and short-term investment vehicles.
Level 2: Pricing inputs are other than quoted prices in active markets, which are either directly or indirectly observable as of the reporting date, and fair value is determined through the use of models or other valuation methodologies. The types of investments which would generally be included in Level 2 include corporate bonds and loans and less liquid and restricted equity securities.
Level 3: Pricing inputs are unobservable for the investment and include situations where there is little, if any, market activity for the investment. The inputs into the determination of fair value require significant management judgment and/or estimation. Those unobservable inputs, that are not corroborated by market data, generally reflect the reporting entity’s own assumptions about the assumptions market participants would use in determining the fair value of the investment. The types of investments which would generally be included in Level 3 are equity and/or debt securities issued by private entities.
53
StepStone Private Credit Income Fund
Notes to
Consolidated Financial Statements (continued)
December 31, 2025
In accordance with ASC 820, certain portfolio investments are excluded from the fair value hierarchy as they are valued using NAV as a practical expedient. These investments are fair valued using NAV or by adjusting the most recently available NAV for cash flows and public benchmark returns. As such, investments in securities with a fair value of $59.2 million are excluded from the fair value hierarchy as of December 31, 2025.
Changes in inputs or methodologies used for valuing investments may result in transfers in or out of levels within the fair value hierarchy. The inputs or methodologies used for valuing investments may not necessarily be indicative of the risk associated with investing in those investments. Transfers between levels of the fair value hierarchy are reported at the beginning of the reporting period in which they occur.
The following is a summary of the Fund's investments classified by fair value hierarchy as of December 31, 2025:
| Level 1 | Level 2 | Level 3 | Investments Valued at NAV | Total | ||||||||||||||||
| Direct Lending | ||||||||||||||||||||
| Senior Secured Loans | $ | — | $ | — | $ | 917,064,204 | $ | — | $ | 917,064,204 | ||||||||||
| Collateralized Loan Obligations and Warehouses | — | — | 281,263,629 | — | 281,263,629 | |||||||||||||||
| Investment Funds | — | — | — | 14,411,402 | 14,411,402 | |||||||||||||||
| Specialty Credit | ||||||||||||||||||||
| Investment Funds | — | — | — | 44,757,781 | 44,757,781 | |||||||||||||||
| Private Lending | — | — | 27,867,572 | — | 27,867,572 | |||||||||||||||
| Total Investments | $ | — | $ | — | $ | 1,226,195,405 | $ | 59,169,183 | $ | 1,285,364,588 | ||||||||||
| Other Financial Instruments | ||||||||||||||||||||
| Forward foreign currency exchange contracts | $ | — | $ | 20,453 | $ | — | $ | — | $ | 20,453 | ||||||||||
| Total | $ | — | $ | 20,453 | $ | — | $ | — | $ | 20,453 | ||||||||||
54
StepStone Private Credit Income Fund
Notes to
Consolidated Financial Statements (continued)
December 31, 2025
The following table presents a summary of changes in fair value of Level 3 assets by investment type during the year ended December 31, 2025:
| Senior Secured Loans | Collateralized Loan Obligations and Warehouses | Private Lending | Total | |||||||||||||
| Balance as of December 31, 2024 | $ | 166,366,651 | $ | 4,493,337 | $ | 31,901,909 | $ | 202,761,897 | ||||||||
| Transfers into Level 3 | — | — | — | — | ||||||||||||
| Purchases of investments | 392,652,865 | 400,096,342 | 23,218,831 | 815,968,038 | ||||||||||||
| Investments acquired in acquisition (Note 16) | 499,331,476 | — | — | 499,331,476 | ||||||||||||
| Proceeds from repayments of investments | (142,233,355 | ) | (121,671,231 | ) | (27,553,030 | ) | (291,457,616 | ) | ||||||||
| Net accretion of original issue discount on investments | 1,908,730 | (2,894 | ) | 251,066 | 2,156,902 | |||||||||||
| Non-controlled/non-affiliated investment payment in-kind income | 245,766 | — | — | 245,766 | ||||||||||||
| Net realized gain (loss) on non-controlled/non-affiliated investments | (136,923 | ) | (560,000 | ) | 90,542 | (606,381 | ) | |||||||||
| Net change in unrealized appreciation
(depreciation) on non-controlled/non-affiliated investments | (1,071,006 | ) | (1,091,925 | ) | (41,746 | ) | (2,204,677 | ) | ||||||||
| Transfers out of Level 3 | — | — | — | — | ||||||||||||
| Balance as of December 31, 2025 | $ | 917,064,204 | $ | 281,263,629 | $ | 27,867,572 | $ | 1,226,195,405 | ||||||||
| Net Change in Unrealized Appreciation (Depreciation) on Level 3 Investments Held at the End of the Reporting Period | $ | (1,014,973 | ) | $ | (1,068,831 | ) | $ | 14,040 | ||||||||
55
StepStone Private Credit Income Fund
Notes to
Consolidated Financial Statements (continued)
December 31, 2025
The following table presents additional quantitative information about valuation methodologies and inputs used for investments that are measured at fair value and categorized within Level 3 as of December 31, 2025.
| Strategy | Fair
Value as of 2025 | Valuation Technique(s) | Unobservable Input | Single
Input or Range of Inputs | Weighted Average of Input1 | Impact
to Valuation from an Increase in Input2 | ||||||||||||
| Senior Secured Loans | $ | 33,979,441 | Recent
Transactions | Transaction Price | $98.50 - $99.75 | $ | 99.03 | Increase | ||||||||||
| Senior Secured Loans | $ | 883,084,763 | Yield | Market
Yield Discount Spreads | 3.54% - 12.86 | % | 5.69 | % | Decrease | |||||||||
| Private Lending | $ | 27,867,572 | Yield | Market
Yield | 5.16% - 13.44 | % | 8.67 | % | Decrease | |||||||||
| Collateralized Loan Obligation Warehouses | $ | 16,579,500 | Yield | Market
Yield Discount Spread | 15.00 | % | 15.00 | % | Decrease | |||||||||
| Collateralized Loan Obligations | $ | 264,684,129 | Discounted Cash Flows | Annual
Default Rate | 2.00% - 3.00 | % | 2.92 | % | Decrease | |||||||||
| Annual
Prepayment Rate | 20.00 | % | 20.00 | % | Increase | |||||||||||||
| Reinvestment Spread | 3.20% - 5.40 | % | 5.00 | Increase | ||||||||||||||
| Reinvestment Price | 99.00 - 99.50 | 99.04 | Decrease | |||||||||||||||
| Recovery Rate | 65.00 | % | 65.00 | % | Increase | |||||||||||||
| Expected Yield | 7.85% - 25.00 | % | 17.00 | % | Decrease | |||||||||||||
| 1 | Weighted average is calculated by weighing the significant unobservable input by the relative fair value of each investment in the category. |
| 2 | This column represents the directional change in the fair value of the Level 3 investments that would result from an increase to the corresponding unobservable input. |
5. Derivative Instruments
U.S. GAAP requires enhanced disclosures about the Fund’s derivative and hedging activities, including how such activities are accounted for and their effects on the Fund’s financial position, performance and cash flows. The Fund invested in forward foreign currency exchange contracts for year ended December 31, 2025 in order to hedge overall portfolio currency risk. By entering into forward foreign exchange currency contracts, the Fund agrees to exchange different currencies at a specified exchange rate at an agreed-upon future date. The Fund may be susceptible to the risk of changes in the foreign exchange rate underlying the forward contract and of the counterparty’s potential inability to fulfill the terms of the contract.
56
StepStone Private Credit Income Fund
Notes to
Consolidated Financial Statements (continued)
December 31, 2025
The effects of these derivative instruments on the Fund’s financial position and financial performance as reflected in the Consolidated Statement of Assets and Liabilities and Consolidated Statement of Operations are presented in the tables below. Forward Contracts are not designated as hedging instruments. The fair values of derivative instruments as of December 31, 2025, and the realized and unrealized gain (loss) during the year ended December 31, 2025, are as follows:
Derivatives Not Designated as Hedging Instruments
| Asset Derivatives | Liability Derivatives | |||||||||
| Consolidated Statement of Asset and Liabilities Location | Derivatives Instruments | Value | Value | |||||||
| Net unrealized appreciation on forward foreign currency exchange contracts | Forward Contracts | $ | 20,453 | $ | — | |||||
Net Change in Unrealized Appreciation/Depreciation on Derivatives Recognized in Income
| Derivatives Instruments | Forward Contracts | Total | ||||||
| Net unrealized appreciation on forward foreign currency exchange contracts | $ | 20,453 | $ | — | ||||
The quarterly average volumes of derivative instruments as of December 31, 2025 are as follows:
| Derivatives Instruments | Notional Value | |||||
| Forward foreign currency exchange contracts | Short Forward Contract | $ | (1,827,387 | ) | ||
6. Related Party Transactions
Advisory Agreement
In consideration of its services to the Fund, the Adviser is entitled to a management fee (“Management Fee”) equal to 1.15% on an annualized basis of the Fund’s daily net assets. The Management Fee is accrued daily and payable monthly in arrears. The Adviser pays the Sub-Adviser 50% of the Management Fee on a monthly basis. For the year ended December 31, 2025, the Adviser earned $10.3 million in Management Fees of which $1.0 million was payable as of December 31, 2025.
In addition, the Fund pays the Adviser an income-based incentive fee (“Incentive Fee”). The Incentive Fee is accrued daily and payable quarterly in arrears based on the Fund’s pre-incentive fee net investment income (“Pre-Incentive Fee Net Investment Income”) for the most recently completed calendar quarter. The payment of the Incentive Fee is subject to a quarterly hurdle rate, expressed as a rate of return on the value of the Fund’s net assets at the end of the most recently completed calendar quarter, of 1.25% (5.00% annualized) (“Hurdle Rate”), subject to a “catch up” feature.
For this purpose, Pre-Incentive Fee Net Investment Income means interest income, dividend income and any other income (including any other fees, such as commitment, origination, structuring, diligence and consulting fees or other fees that the Fund (or its Wholly- Owned Subsidiaries) receives from portfolio companies) accrued during the calendar quarter, minus the Fund’s operating expenses for the quarter (including the Management Fee, expenses and fees paid to the Adviser under the Administration Agreement and any interest expense and dividends paid on any issued and outstanding preferred stock or credit agreements, but excluding the Incentive Fee and any shareholder servicing and/or distribution fees), net of any expense waivers or expense payments by the Adviser. Pre- Incentive Fee Net Investment Income includes, in the case of investments with a deferred interest feature (such as OID debt instruments with PIK interest and zero-coupon securities), accrued income that the Fund has not yet received in cash. Pre-Incentive Fee Net Investment Income does not include any realized capital gains, realized capital losses or unrealized appreciation or depreciation.
The calculation of the Incentive Fee for each quarter is as follows:
| • | No Incentive Fee will be payable to the Adviser in any calendar quarter in which the Fund’s Pre-Incentive Fee Net Investment Income does not exceed the Hurdle Rate; |
| • | 100% of the dollar amount of the Fund’s Pre-Incentive Fee Net Investment Income, if any, that exceeds the Hurdle Rate but is less than or equal to 1.3889% in any calendar quarter (5.5556% annualized) will be payable to the Adviser. This portion of the Fund’s Incentive Fee that exceeds the Hurdle Rate but is less than or equal to 1.3889% is referred to as the “catch up” and is intended to provide the Adviser with an Incentive Fee of 10% on all of the Fund’s Pre-Incentive Fee Net Investment Income when the Fund’s Pre-Incentive Fee Net Investment Income reaches 1.3889% (5.5556% annualized) on net assets in any calendar quarter; and |
57
StepStone Private Credit Income Fund
Notes to
Consolidated Financial Statements (continued)
December 31, 2025
| • | 10% of the dollar amount of the Fund’s Pre-Incentive Fee Net Investment Income, if any, that exceeds 1.3889% (5.5556% annualized) on net assets in any calendar quarter will be payable to the Adviser once the Hurdle Rate and catch-up have been achieved (10% of the Fund’s Pre-Incentive Fee Net Investment Income thereafter will be allocated to the Adviser). |
The Adviser pays the Sub-Adviser 60% of the Incentive Fee on a quarterly basis. For the year ended December 31, 2025, the Adviser earned $8.7 million in Incentive Fees of which $3.2 million was payable as of December 31, 2025.
Expense Limitation and Reimbursement Agreement
The Adviser entered into an Expense Limitation and Reimbursement Agreement with the Fund for a one-year term beginning with the Commencement of Operations and ending on the one-year anniversary thereof on June 2, 2025 (“Limitation Period”). On February 20, 2025, the Limitation Period was extended for a period of one year ending on April 30, 2026. The Adviser may extend the Limitation Period for a period of one year on an annual basis. The Expense Limitation and Reimbursement Agreement limits the amount of the Fund’s aggregate ordinary operating expenses, excluding certain specified expenses (“Specified Expenses”), borne by the Fund during the Limitation Period to an amount not to exceed 1.00% for Class I, D, and S shares, on an annualized basis, of the Fund’s prior day net assets (“Expense Cap”). Specified Expenses that are not covered by the Expense Limitation and Reimbursement Agreement include: (i) the Management Fee; (ii) Acquired Fund Fees; (iii) the Incentive Fee; (iv) transactional costs, including legal costs and brokerage commissions, and sourcing and servicing or related fees incurred by the Fund in connection with the servicing by non-affiliated third parties of, and other related administrative services associated with the acquisition and disposition of the Fund’s investments; (v) interest payments incurred on borrowing by the Fund or its subsidiaries; (vi) fees and expenses incurred in connection with a credit facility obtained by the Fund or any of its subsidiaries, including any expense for acquiring ratings related to the credit facilities; (vii) distribution and shareholder servicing fees, as applicable; (viii) taxes; and (ix) extraordinary expenses resulting from events and transactions that are distinguished by their unusual nature and by the infrequency of their occurrence including, without limitation, costs incurred in connection with any claim, litigation, arbitration, mediation, government investigation or similar proceeding, indemnification expenses, and expenses in connection with holding and/or soliciting proxies for all annual and other meetings of shareholders.
If the Fund’s aggregate ordinary operating expenses, exclusive of the Specified Expenses, in respect of any Class of Shares for any day exceeds the Expense Cap, the Adviser will waive its Management Fee, waive its Incentive Fee, directly pay and/or reimburse the Fund for expenses to the extent necessary to eliminate such excess. To the extent that the Adviser waives its Management Fee or Incentive Fee, reimburses expenses to the Fund or pays expenses directly on behalf of the Fund, it is permitted to recoup from the Fund any such amounts for a period not to exceed three years from the month in which such fees and expenses were waived, reimbursed, or paid, even if such recoupment occurs after the termination of the Limitation Period. However, the Adviser may only recoup the waived fees, reimbursed expenses or directly paid expenses in respect of the applicable Class of Shares if (i) the aggregate ordinary operating expenses plus waived fees, reimbursed expenses or directly paid expenses have fallen to a level below the Expense Cap and (ii) the recouped amount does not raise the level of aggregate ordinary operating expenses, plus waived fees, reimbursed expenses or directly paid expenses in respect of a Class of Shares in the month of recoupment to a level that exceeds any Expense Cap applicable at that time.
During the year ended December 31, 2025, the Adviser recouped $1.0 million under the Expense Limitation and Reimbursement agreement, as recorded on the Statement of Operations. The Consolidated Statement of Assets and Liabilities includes a Due to Adviser of $24,848 as of December 31, 2025 for the expenses paid by the Adviser on behalf of the Fund.
Administration Agreement
The Adviser serves as the Fund’s administrator (“Administrator”) pursuant to an administration agreement (“Administration Agreement”) under which the Administrator provides administrative, accounting and other services to the Fund. Pursuant to the Administration Agreement, the Fund pays the Administrator an administration fee (“Administration Fee”) in an amount up to 0.205% on an annualized basis of the Fund’s net assets. The Administration Fee is accrued daily based on the value of the prior day net assets of the Fund as of the close of business on each business day (including any assets in respect of Shares that will be repurchased by the Fund on such date), and is payable monthly in arrears. For the year ended December 31, 2025, the Administrator earned $1.8 million in Administration Fees of which $0.1 million was payable as of December 31, 2025.
7. Sub-Administrator and Other Agreements
From the proceeds of the Administration Fee, the Administrator pays UMB Fund Services, Inc. (“Sub-Administrator”) a sub-administration fee to perform certain administrative and accounting services for the Fund on behalf of the Administrator. The sub-administration fee, pursuant to a sub-administration agreement and a fund accounting agreement, is paid monthly by the Administrator and is based on the value of the net assets of the Fund as of the close of business on each business day, subject to an annual minimum.
58
StepStone Private Credit Income Fund
Notes to
Consolidated Financial Statements (continued)
December 31, 2025
7. Sub-Administrator and Other Agreements (continued)
UMB Bank, N.A. serves as the Fund’s Custodian pursuant to a custody agreement. As the Custodian, UMB Bank, N.A. holds the Fund’s U.S. assets. Foreign assets, if any, including foreign currency holdings, are held by a designated sub-custodian appointed by the Custodian in accordance with the terms of the custody agreement. For the year ended December 31, 2025, the Custodian earned $208,228 in custody fees, recorded in other expenses on the Consolidated Statement of Operations, of which $44,741 was payable as of December 31, 2025 and recorded in other accrued expenses on the Consolidated Statement of Assets and Liabilities.
The Sub-Administrator also serves as the Fund’s transfer agent (“Transfer Agent”) pursuant to a transfer agency agreement. The Transfer Agent, among other things, receives and processes purchase orders, effects issuance of Shares, prepares and transmits payments for distributions, receives and processes repurchase offers and maintains records of account. For the year ended December 31, 2025, the Transfer Agent earned $248,951 in transfer agent fees of which $28,628 was payable as of December 31, 2025.
SEI Investments Global Funds Services (“Loan Administrator”) provides certain outsourced loan administration services for the Fund. For the year ended December 31, 2025, the Loan Administrator earned $364,260 in loan administration fees, recorded in other expenses on the Consolidated Statement of Operations, of which $89,463 was payable and included in other accrued expenses on the Consolidated Statement of Assets and Liabilities as of December 31, 2025.
8. Distribution and Shareholder Servicing Plan
Distribution Services, LLC serves as the Fund’s distributor (“Distributor”) pursuant to a distribution agreement. The Distributor distributes the Shares of the Fund. The Distributor is authorized to enter into Sub-Distribution Agreements with brokers, dealers and certain Registered Investment Advisers ("RIA") and other financial intermediaries to effect the distribution of Shares of the Fund. To operate in a manner consistent with Rule 12b-1 under the 1940 Act, the Fund pays a distribution and shareholder servicing fee out of the net assets of Class S and Class T Shares at the annual rate of 0.85% of the aggregate NAV of Class S Shares and Class T Shares. On January 17, 2025, the Fund converted Class T shares into Class S shares and ceased offering Class T Shares. To operate in a manner consistent with Rule 12b-1 under the 1940 Act, the Fund pays a shareholder servicing fee out of the net assets of Class D Shares at the annual rate of 0.25% of the aggregate NAV of Class D Shares. Distribution and shareholder servicing fees are determined and accrued daily based on the net assets of the share class as of the close of business on each business day (including net assets in respect of Shares that will be repurchased by the Fund on such date). Class I Shares are not subject to a distribution and shareholder servicing fee. For the year ended December 31, 2025, distribution and shareholder servicing fees incurred are disclosed on the Consolidated Statement of Operations.
9. Revolving Credit Facilities
On June 3, 2024, the Fund, through CRDEX LLC as borrower, entered into a Loan and Security Agreement (“JPM Loan and Security Agreement”) with JPMorgan Chase Bank, National Association (“JPM”), as the administrative agent, UMB Bank, National Association, as the collateral agent, and the lenders party thereto from time to time, to provide CRDEX LLC with a revolving credit facility (“JPM Credit Facility”). Borrowings under the JPM Credit Facility are secured by all of the assets held by CRDEX LLC. The JPM Credit Facility carries a commitment of $250 million with an accordion provision, with increases up to $350 million, subject to satisfaction of certain conditions. As of December 31, 2025, the carrying value of the outstanding borrowings approximates fair value due to the variable interest rate and would be categorized in Level 3 of the fair value hierarchy.
Borrowings under the JPM Credit Facility generally bear interest at a rate per annum equal to 3-Month Term SOFR plus a margin of 2.26%, with no floor on a 3-Month Term SOFR (“Applicable Margin”). The JPM Credit Facility has a commitment fee (“Commitment Fee”) of 0.75% per annum on the average daily unused balance. In addition, the Fund is required to pay an undrawn fee, calculated as the Applicable Margin minus the Commitment Fee, multiplied by the shortfall between the Minimum Funding amount and the actual outstanding borrowings, if the aggregate principal amount of the outstanding borrowings is less than the required minimum funding amount (“Minimum Funding”). The Minimum Funding requirement, as a percentage of JPM Credit Facility commitments, increases over time, beginning with no Minimum Funding required during the period June 3, 2024 through August 31, 2024, a 20% Minimum Funding for the period September 1, 2024 through November 30, 2024, a 45% Minimum Funding for the period December 1, 2024 through February 2, 2025, an 18% Minimum Funding for the period February 3, 2025 through February 28, 2025, a 23% Minimum Funding for the period March 1, 2025 through April 30, 2025, a 35% Minimum Funding for the period May 1, 2025 through May 31, 2025, a 42% Minimum Funding for the period June 1, 2025 through July 31, 2025, a 57% Minimum Funding for the period August 1, 2025 through October 31, 2025, a 64.5% Minimum Funding for the period November 1, 2025 through January 31, 2026, and a 75% Minimum Funding for the period February 1, 2026 through June 3, 2027, with a final scheduled termination date of June 3, 2029 (as amended). Prior to February 3, 2025 the initial commitment was $100 million and the margin was 2.575%.
On October 8, 2025, the Fund amended the JPM Facility to increase the commitment from $250 million to $350 million and reduce the Applicable Margin to 2.10%.
As of December 31, 2025, the Fund had outstanding borrowings of $290.5 million under the JPM Credit Facility. For the year ended December 31, 2025, the Fund’s borrowings under the JPM Credit Facility bore interest at a weighted average interest rate of 6.35%. For the year ended December 31, 2025, the daily average amount of outstanding borrowings under the JPM Credit Facility was $153.1 million. In conjunction with the JPM Credit Facility, the Fund paid a closing fee of 1.0% which is being amortized in the Consolidated Statement of Operations over the term of the JPM Credit Facility. For the year ended December 31, 2025, expenses charged to the Fund related to the JPM Credit Facility were $11.3 million.
59
StepStone Private Credit Income Fund
Notes to Consolidated Financial Statements
(continued)
December 31, 2025
9. Revolving Credit Facilities (continued)
As a result of a transaction that was completed on January 2, 2025 as described in Note 16, the Fund acquired substantially all of the assets of CRDEX Equity Partners LLC (formerly, CPCF as defined in Note 16) in exchange for Class I Shares of the Fund, and the Fund became the sole member of SSG Holdings SPV, a wholly-owned and consolidated subsidiary organized as a Delaware limited liability company. SSG Holdings SPV is party to a loan and security agreement dated November 6, 2023, that was amended January 2, 2025, with the Bank of Montreal as administrative agent and collateral agent (the “SSG Holdings SPV Credit Facility”). The SSG Holdings SPV Credit Facility, will generally bear interest at a rate per annum equal to 3-Month Term SOFR plus a margin of 2.60%. The SSG Holdings SPV Credit Facility is secured by a first priority security interest in substantially all of the assets of SSG Holdings SPV and a pledge over 100% of the Funds equity interest in SSG Holdings SPV. The SSG Holdings SPV Credit Facility matures on June 21, 2031, unless sooner terminated in accordance with its terms.
On June 23, 2025, the Fund amended the SSG Holdings SPV Credit Facility to decrease the commitment from $445.9 million to $162.5 million and reduce the Applicable Margin to 2.30%. As of December 31, 2025, the carrying value of the outstanding borrowings approximates fair value due to the variable interest rate and would be categorized in Level 3 of the fair value hierarchy.
As of December 31, 2025, the Fund had outstanding borrowings of $46.8 million under the SSG Holdings SPV Credit Facility. For the year ended December 31, 2025, the Fund’s borrowings under the SSG Holdings SPV Credit Facility bore interest at a weighted average interest rate of 6.77%. For the year ended December 31, 2025, the daily average amount of outstanding borrowings under the SSG Holdings SPV Credit Facility was $52.6 million. In conjunction with the SSG Holdings SPV Credit Facility, CPCF paid a closing fee of 1.0% which was assumed as part of the acquisition described in Note 16, and which is being amortized in the Consolidated Statement of Operations over the term of the SSG Holdings SPV Credit Facility. For the year ended December 31, 2025, expenses charged to the Fund related to the SSG Holdings SPV Credit Facility were $3.7 million.
For the year ended December 31, 2025 the Fund had aggregate daily average outstanding borrowings of $205.7 million at a weighted average interest rate of 6.46%.
10. Commitments and Contingencies
ASC 460-10, Guarantees - Overall, requires entities to provide disclosure and, in certain circumstances, recognition of guarantees and indemnifications. In the normal course of business, the Fund enters into contracts that contain a variety of indemnification arrangements. The Fund’s exposure under these arrangements, if any, cannot be quantified. However, the Fund has not had claims or losses pursuant to these indemnification arrangements and expects the potential for a material loss to be remote.
The Fund may, from time to time, be party to various legal matters arising in the ordinary course of business, including claims and litigation proceedings. Although the ultimate outcome of the foregoing matters, if any, cannot be ascertained at this time, the Adviser believes, after consultation with counsel, that the resolution of such matters would not have a material adverse effect on the Fund’s consolidated financial statements.
Contingencies associated with the Expense Limitation and Reimbursement Agreement are discussed in Note 6.
As of December 31, 2025, the Fund has contractual unfunded commitments to provide additional funding of $40.0 million to Investments in Funds.
As of December 31, 2025, the Fund had the following unfunded commitments to investments in loans:
| Investments in loans | Unfunded Commitment | |||
| AAH Topco, LLC Delayed Draw | $ | 2,251,114 | ||
| ACP Avenu Buyer, LLC Delayed Draw | 248,846 | |||
| ACP Avenu Buyer, LLC Revolver | 87,096 | |||
| ACP Oak Buyer, Inc. Delayed Draw | 281,690 | |||
| ACP Oak Buyer, Inc. Revolver | 1,267,606 | |||
| Advanced Medical Management, LLC Revolver | 421,112 | |||
| Alkeme Intermediary Holdings, LLC Delayed Draw | 212,459 | |||
| Alkeme Intermediary Holdings, LLC Revolver | 30,404 | |||
| Allworth Financial Group, L.P. Delayed Draw | 1,585,085 | |||
| Allworth Financial Group, L.P. Revolver | 176,678 | |||
60
StepStone Private Credit Income Fund
Notes to Consolidated Financial Statements
(continued)
December 31, 2025
| Investments in loans (continued) | Unfunded Commitment | |||
| Ambient Enterprises Holdco LLC Delayed Draw | $ | 1,300,614 | ||
| Ambient Enterprises Holdco LLC Delayed Draw | 867,371 | |||
| Amercareroyal, LLC Delayed Draw | 597,590 | |||
| Amercareroyal, LLC Revolver | 245,783 | |||
| American Family Care, LLC Delayed Draw | 1,505,018 | |||
| American Family Care, LLC Revolver | 451,631 | |||
| AmeriLife Holdings LLC Delayed Draw | 1,787,698 | |||
| AmeriLife Holdings LLC Revolver | 738,164 | |||
| Any Hour LLC Delayed Draw | 625,455 | |||
| Any Hour LLC Revolver | 55,411 | |||
| Apex Service Partners, LLC Delayed Draw | 1,443,270 | |||
| Apex Service Partners, LLC Revolver | 71,503 | |||
| Aprio Advisory Group, LLC Delayed Draw | 286,557 | |||
| Aprio Advisory Group, LLC Delayed Draw | 3,688,525 | |||
| Aprio Advisory Group, LLC Revolver | 24,918 | |||
| Aptean, Inc. Delayed Draw | 2,460,152 | |||
| Aptean, Inc. Revolver | 187,554 | |||
| Aptive Environmental, LLC Delayed Draw | 155,039 | |||
| Aptive Environmental, LLC Revolver | 310,078 | |||
| Archer Lewis, LLC Delayed Draw | 11,004 | |||
| Arcline Liberty Buyer LLC Delayed Draw | 774,194 | |||
| Arcline Liberty Buyer LLC Revolver | 516,129 | |||
| Arctic Holdco, LLC Delayed Draw | 76,702 | |||
| Arctic Holdco, LLC Revolver | 110,344 | |||
| Argano LLC Revolver | 166,836 | |||
| ASP Global Holdings, LLC Delayed Draw | 246,353 | |||
| ASP Global Holdings, LLC Revolver | 43,069 | |||
| Atlantic Pipe Services, LLC Delayed Draw | 991,736 | |||
| Aviation Technical Services, Inc. Revolver | 166,667 | |||
| Avita Care Solutions Revolver | 98,901 | |||
| Axis Portable Air LLC Delayed Draw | 1,047,273 | |||
| Axis Portable Air, LLC Revolver | 737,087 | |||
| Badge 21 Midco Holdings LLC Delayed Draw | 1,098,200 | |||
| Badge 21 Midco Holdings LLC Revolver | 642,646 | |||
| BBMA Buyer LLC Delayed Draw | 2,864,583 | |||
| BC Group Holdings, Inc. Delayed Draw | 1,313,556 | |||
| BCI Burke Holding Corp. Delayed Draw | 838,634 | |||
| Beacon Oral Specialists Management LLC Delayed Draw | 1,010,633 | |||
| Berlin Rosen Acquisition, LLC Revolver | 86,470 | |||
| Big Top Holdings, LLC Revolver | 25,000 | |||
| BridgePointe Technologies, LLC Delayed Draw | 53,157 | |||
| BridgePointe Technologies, LLC Delayed Draw | 5,081,973 | |||
61
StepStone Private Credit Income Fund
Notes to Consolidated Financial Statements (continued)
December 31, 2025
| Investments in loans (continued) | Unfunded Commitment | |||
| Bristol Hospice, LLC Revolver | $ | 348,432 | ||
| Cardiovascular Associates Delayed Draw | 4,326,125 | |||
| Cardiovascular Associates Revolver | 190,340 | |||
| Carnegie Dartlet, LLC Delayed Draw | 46,000 | |||
| Carnegie Dartlet, LLC Revolver | 20,000 | |||
| Case Works, LLC Revolver | 12,353 | |||
| Catalyst Acoustic Group, Inc. Delayed Draw | 1,088,889 | |||
| Centex Acquisition, LLC Revolver | 324,520 | |||
| Cerity Partners Equity Holding LLC Delayed Draw | 1,145,170 | |||
| Cerity Partners Equity Holding LLC Revolver | 307,692 | |||
| Cherry Bekaert Advisory LLC Delayed Draw | 115,861 | |||
| Choice Financial Group, LLC Delayed Draw | 4,000,000 | |||
| Chronicle Parent LLC Delayed Draw | 2,040,000 | |||
| Chronicle Parent LLC Revolver | 740,741 | |||
| CMG Holding Co, LLC Revolver | 275,011 | |||
| Combined Wellness Acquisition Co Delayed Draw | 225,000 | |||
| Computer Services, Inc. Delayed Draw | 29,196 | |||
| Computer Services, Inc. Delayed Draw | 15,959 | |||
| Cooper's Hawk Intermediate Holding, LLC Revolver | 252,632 | |||
| Cornerstone Advisors of Arizona, LLC Revolver | 447,214 | |||
| Creative Multicare LLC Delayed Draw | 3,104,895 | |||
| CRH Healthcare Purchaser, Inc. Delayed Draw | 689,655 | |||
| CRH Healthcare Purchaser, Inc. Revolver | 275,862 | |||
| CSG Buyer, Inc. Delayed Draw | 473,684 | |||
| CSG Buyer, Inc. Revolver | 157,895 | |||
| CT Technologies Intermediate Holdings Delayed Draw | 156,693 | |||
| CUB Financing Intermediate, LLC Delayed Draw | 4,000,000 | |||
| Curio Brands Intermediate, LLC Delayed Draw | 1,307,190 | |||
| Curio Brands Intermediate, LLC Revolver | 653,595 | |||
| Danforth Global, Inc. Revolver | 710,503 | |||
| DCCM MergerSub, LLC Delayed Draw | 2,864,617 | |||
| DCCM MergerSub, LLC Revolver | 1,145,847 | |||
| Denali Intermediate Holdings Revolver | 657,380 | |||
| Denali Topco, LLC Delayed Draw | 819,672 | |||
| Denali Topco, LLC Revolver | 393,443 | |||
| Dentive, LLC Revolver | 117,808 | |||
| Designs for Health, Inc. Revolver | 842,105 | |||
| Digicert, Inc. Revolver | 269,247 | |||
| Discovery SL Management, LLC Delayed Draw | 267,412 | |||
| Discovery SL Management, LLC Revolver | 33,427 | |||
| Duke's Root Control, Inc. Revolver | 276,448 | |||
| Durare Bidco, LLC Delayed Draw | 1,515,152 | |||
62
StepStone Private Credit Income Fund
Notes to Consolidated Financial Statements (continued)
December 31, 2025
| Investments in loans (continued) | Unfunded Commitment | |||
| Durare Bidco, LLC Revolver | $ | 727,273 | ||
| EdgeCo Buyer, Inc. Delayed Draw | 556,474 | |||
| EdgeCo Buyer, Inc. Revolver | 355,196 | |||
| Einstein Parent, Inc. Revolver | 544,674 | |||
| Elder Care Opco LLC Delayed Draw | 985,158 | |||
| Elder Care Opco LLC Revolver | 295,547 | |||
| Empower Payments Investor, LLC Delayed Draw | 923,077 | |||
| Engineering Resource Group Buyer, LLC Delayed Draw | 589,681 | |||
| Engineering Resource Group Buyer, LLC Revolver | 294,840 | |||
| Epika Fleet Services, LLC Delayed Draw | 582,155 | |||
| Equinox Buyer, LLC Revolver | 305,444 | |||
| EvAl Home Health Solutions Intermediate, L.L.C. Revolver | 20,000 | |||
| Everbridge Holdings, LLC Delayed Draw | 281,481 | |||
| Everbridge Holdings, LLC Revolver | 185,185 | |||
| Evergreen Services Group II Delayed Draw | 1,008,581 | |||
| First Legal Buyer, Inc. Delayed Draw | 453,713 | |||
| First Legal Buyer, Inc. Revolver | 286,964 | |||
| Force Electrical Buyerco, LLC Delayed Draw | 1,943,347 | |||
| Force Electrical Buyerco, LLC Revolver | 314,288 | |||
| Fullsteam Operations LLC Delayed Draw | 474,002 | |||
| Fullsteam Operations LLC Revolver | 158,001 | |||
| Gator Plastic Intermediate Holdings, LLC Revolver | 400,662 | |||
| GC Waves Holdings, Inc Delayed Draw | 373,438 | |||
| GMF Parent, Inc. Delayed Draw | 500,000 | |||
| GMF Parent, Inc. Delayed Draw | 450,000 | |||
| GMF Parent, Inc. Revolver | 275,000 | |||
| Gold Medal Holdings, Inc Delayed Draw | 248,731 | |||
| Golden State Dermatology Management, LLC Delayed Draw | 2,107,143 | |||
| Graymar Acquisition LLC Delayed Draw | 1,145,013 | |||
| Greenwood Operating Group, LLC Revolver | 1,068,062 | |||
| GS Acquisitionco, Inc. Delayed Draw | 350,698 | |||
| Guava Buyer LLC Delayed Draw | 214,013 | |||
| Guava Buyer LLC Revolver | 249,682 | |||
| Halo Buyer, Inc. Revolver | 621,037 | |||
| Harris & Co. LLC Delayed Draw | 540 | |||
| Harris & Co. LLC Delayed Draw | 2,074,281 | |||
| Harris & Co. LLC Revolver | 181,310 | |||
| Heads Up Technologies, Inc. Revolver | 636,364 | |||
| Health Buyer LLC Revolver | 82,721 | |||
| Hec Purchaser Corp. Revolver | 260,417 | |||
| Heights Financing I Revolver | 45,201 | |||
| Heights Financing II Revolver | 632,437 | |||
63
StepStone Private Credit Income Fund
Notes to Consolidated Financial Statements (continued)
December 31, 2025
| Investments in loans (continued) | Unfunded Commitment | |||
| Heritage Foodservice Investment, LLC Delayed Draw | $ | 1,474,391 | ||
| Heritage Foodservice Investment, LLC Revolver | 167,392 | |||
| HHS Buyer Inc. Delayed Draw | 322,472 | |||
| HHS Buyer Inc. Revolver | 1,081,315 | |||
| Hills Distribution, Inc. Delayed Draw | 212,733 | |||
| Ideal Components Acquisition, LLC Delayed Draw | 965,264 | |||
| Ideal Components Acquisition, LLC Revolver | 697,135 | |||
| IEQ Capital, LLC Delayed Draw | 261,364 | |||
| IF&P Holding Company, LLC Delayed Draw | 2,131,126 | |||
| Improving Acquisition, LLC Revolver | 525,844 | |||
| Inszone Mid, LLC Delayed Draw | 307,313 | |||
| ITS Buyer, Inc. Revolver | 395,546 | |||
| Ivy Technology Parent Intermediate III Holdings, LLC Revolver | 362,597 | |||
| JS Global, LLC Revolver | 416,667 | |||
| KabaFusion Parent LLC Revolver | 356,254 | |||
| Kami Buyer, LLC Delayed Draw | 1,818,182 | |||
| Kelso Industries LLC Delayed Draw | 119,384 | |||
| Kept Companies, Inc. Delayed Draw | 413,329 | |||
| Lakewood Acquisition Corp Revolver | 1,509,054 | |||
| LeadVenture Inc. Revolver | 519,346 | |||
| Lido Advisors, LLC Delayed Draw | 255,093 | |||
| Lido Advisors, LLC Revolver | 54,774 | |||
| Life Science Intermediate, Holdings, LLC Delayed Draw | 1,192,875 | |||
| Life Science Intermediate, Holdings, LLC Revolver | 249,658 | |||
| Lindstrom, LLC Revolver | 325,916 | |||
| LJ Avalon Holdings, LLC Delayed Draw | 2,750,000 | |||
| LJ Avalon Holdings, LLC Revolver | 666,667 | |||
| Management Consulting & Research, LLC Delayed Draw | 160,456 | |||
| Management Consulting & Research, LLC Revolver | 868,751 | |||
| Mechanair LLC Delayed Draw | 1,263,158 | |||
| Mechanair LLC Revolver | 317,753 | |||
| Med Learning Group, LLC Delayed Draw | 416,667 | |||
| Medical Device Inc. Revolver | 470,859 | |||
| Medrina, LLC Delayed Draw | 1,212,632 | |||
| Minds Buyer, LLC Revolver | 156,250 | |||
| Mission Lane Credit Card Master Trust JPM Revolver | 647,822 | |||
| MKD Electric, LLC Revolver | 73,823 | |||
| MoboTrex, LLC Delayed Draw | 1,197,949 | |||
| MoboTrex, LLC Revolver | 355,556 | |||
| Model N, Inc. Delayed Draw | 388,601 | |||
| Model N, Inc. Revolver | 207,254 | |||
| Moonlight Parent, Inc. Delayed Draw | 754,717 | |||
64
StepStone Private Credit Income Fund
Notes to Consolidated Financial Statements (continued)
December 31, 2025
| Investments in loans (continued) | Unfunded Commitment | |||
| Moonlight Parent, Inc. Revolver | $ | 452,830 | ||
| MPULSE Mobile, Inc. Delayed Draw | 307,692 | |||
| MPULSE Mobile, Inc. Revolver | 461,538 | |||
| National EC Services, Inc. Delayed Draw | 1,710,058 | |||
| National EC Services, Inc. Revolver | 342,012 | |||
| Nautic Angels Acquisition LLC Delayed Draw | 1,231,818 | |||
| New Charter Technologies, Inc. Delayed Draw | 3,808,241 | |||
| New Charter Technologies, Inc. Revolver | 282,092 | |||
| NMI Acquisitionco, Inc. Revolver | 110,767 | |||
| OPS Wildcat Merger Sub, Inc. Revolver | 29,412 | |||
| Optimizely North America Inc. Revolver | 352,000 | |||
| OSR Opco LLC Revolver | 1,000,000 | |||
| OSR Opco LLC, Revolver | 338,235 | |||
| Owl Cyber Defense Solutions, LLC Revolver | 201,688 | |||
| Packaging Coordinators Midco, Inc. Delayed Draw | 357,462 | |||
| Packaging Coordinators Midco, Inc. Delayed Draw | 38,549 | |||
| Packaging Coordinators Midco, Inc. Delayed Draw | 487,420 | |||
| Packaging Coordinators Midco, Inc. Delayed Draw | 475,531 | |||
| Packaging Coordinators Midco, Inc. Revolver | 374,524 | |||
| PAG Holding Corp. Revolver | 298,244 | |||
| PAI Financing Merger Sub LLC Revolver | 792,254 | |||
| Patriot Foods Buyer, Inc. Delayed Draw | 1,828,767 | |||
| Pave America Holding, LLC Delayed Draw | 609,730 | |||
| Pave America Holding, LLC Revolver | 454,054 | |||
| PCS Midco, Inc. Delayed Draw | 2,935 | |||
| PCS Midco, Inc. Revolver | 6,250 | |||
| PestCo, LLC Delayed Draw | 496,644 | |||
| PestCo, LLC Revolver | 268,456 | |||
| PGI Parent LLC Revolver | 359,909 | |||
| Pharmalogic Holdings Corp Delayed Draw | 829,016 | |||
| Pipe Warehouse Trust II Delayed Draw | 2,739,487 | |||
| Play Holdings, Inc. Revolver | 197,162 | |||
| PMA Parent Holdings, LLC Revolver | 104,500 | |||
| PMA Parent Holdings, LLC Revolver | 97,114 | |||
| Point Quest Group, Inc. Delayed Draw | 487,805 | |||
| Point Quest Group, Inc. Revolver | 292,683 | |||
| PPW Aero Buyer, Inc. Delayed Draw | 44,980 | |||
| Premise Health Holding Corp Delayed Draw | 74,465 | |||
| Prestige PEO Holdings, LLC Revolver | 173,416 | |||
| PRGX Global, Inc. Delayed Draw | 876,121 | |||
| Puma Buyer, LLC Revolver | 1,388,889 | |||
| Purple Cow Buyer, LLC Delayed Draw | 2,604,255 | |||
65
StepStone Private Credit Income Fund
Notes to Consolidated Financial Statements (continued)
December 31, 2025
| Investments in loans (continued) | Unfunded Commitment | |||
| Quantum Design International Delayed Draw | $ | 2,439,024 | ||
| Quantum Design International Delayed Draw | 1,626,016 | |||
| Quick Quack Car Wash Holdings, LLC Delayed Draw | 5,300,000 | |||
| Railpros Parent, LLC Delayed Draw | 444,774 | |||
| Railpros Parent, LLC Revolver | 222,387 | |||
| RBFD Buyer, LLC Delayed Draw | 188,363 | |||
| RBFD Buyer, LLC Revolver | 81,191 | |||
| RCP Nats Purchaser, LLC Delayed Draw | 1,120,079 | |||
| RCP Nats Purchaser, LLC Revolver | 784,055 | |||
| Recipe Acquisition Corp. Delayed Draw | 680,976 | |||
| Recipe Acquisition Corp. Revolver | 139,013 | |||
| Red Fox CD Acquisition Corporation Delayed Draw | 1,475,921 | |||
| REP TEC Intermediate Holdings, Inc. Revolver | 517,680 | |||
| Resixperts Holdco, LLC Delayed Draw | 1,582,723 | |||
| Resixperts Holdco, LLC Revolver | 233,900 | |||
| Rocket Youth Brands HoldCo LLC Delayed Draw | 1,166,015 | |||
| Rocket Youth Brands HoldCo LLC Revolver | 174,902 | |||
| RPM Purchasers, Inc. Delayed Draw | 197,759 | |||
| RRA Corporate, LLC Delayed Draw | 11,541 | |||
| RRA Corporate, LLC Revolver | 10,211 | |||
| SAAB Purchaser, Inc. Delayed Draw | 1,846,154 | |||
| SAAB Purchaser, Inc. Revolver | 246,154 | |||
| Sabel Systems Technology Solutions, LLC Revolver | 79,422 | |||
| SageBrush Buyer, LLC Revolver | 258,621 | |||
| Salisbury House, LLC Delayed Draw | 513,183 | |||
| Salisbury House, LLC Revolver | 249,749 | |||
| Salt Dental Collective, LLC Revolver | 60,026 | |||
| Salute Mission Critical, LLC Delayed Draw | 147,954 | |||
| Sigma Defense Systems LLC Revolver | 25,000 | |||
| Sigma Defense Systems, Inc. Delayed Draw | 211,330 | |||
| SkyMark Refuelers, LLC Delayed Draw | 209,594 | |||
| SkyMark Refuelers, LLC Delayed Draw | 960,384 | |||
| SkyMark Refuelers, LLC Revolver | 480,192 | |||
| Socket Holding Corporation Delayed Draw | 572,189 | |||
| Socket Holding Corporation Revolver | 202,545 | |||
| Solairus Holdings, LLC Delayed Draw | 1,173,709 | |||
| Solairus Holdings, LLC Delayed Draw | 268,502 | |||
| Solairus Holdings, LLC Revolver | 394,366 | |||
| Solairus Holdings, LLC Revolver | 67,126 | |||
| Sonny's Enterprises, LLC Delayed Draw | 138,000 | |||
| SPC Jamboree Lender LLC Revolver | 1,489,441 | |||
| Spring Dental Intermediate, LLC Delayed Draw | 561,275 | |||
66
StepStone Private Credit Income Fund
Notes to Consolidated Financial Statements (continued)
December 31, 2025
| Investments in loans (continued) | Unfunded Commitment | |||
| Springline Advisory Intermediate, LLC Delayed Draw | $ | 3,172,340 | ||
| Springline Advisory Intermediate, LLC Revolver | 425,532 | |||
| SRP Eagle Buyer, Inc. Delayed Draw | 1,290,323 | |||
| SRP Eagle Buyer, Inc. Revolver | 516,129 | |||
| Stonebridge Companies, LLC Delayed Draw | 1,022,263 | |||
| Stonebridge Companies, LLC Revolver | 681,508 | |||
| SuperHero Fire Protection, LLC Revolver | 34,166 | |||
| Surgical Center Solutions, LLC Delayed Draw | 621,890 | |||
| Surgical Center Solutions, LLC Revolver | 292,289 | |||
| SV Newco 2, Inc. Delayed Draw | 1,824,000 | |||
| SV Newco 2, Inc. Revolver | 180,733 | |||
| Syndigo LLC Revolver | 473,934 | |||
| Tau Midco, LLC Delayed Draw | 281,690 | |||
| Tau Midco, LLC Revolver | 260,978 | |||
| Tender Products, Inc. Revolver | 631,579 | |||
| Theoria Management, LLC Delayed Draw | 1,033,327 | |||
| TL Atlas Merger Sub Corp Revolver | 1,000,000 | |||
| ToxStrategies, LLC Delayed Draw | 163,702 | |||
| ToxStrategies, LLC Revolver | 229,183 | |||
| Tricor, LLC Delayed Draw | 1,892,058 | |||
| Tricor, LLC Revolver | 242,183 | |||
| Truck-Lite CO, LLC Delayed Draw | 585,414 | |||
| Truck-Lite CO, LLC Delayed Draw | 481,478 | |||
| TVG- MGT Merger, LLC Delayed Draw | 1,901,326 | |||
| TVG- MGT Merger, LLC Revolver | 46,530 | |||
| Tvg Shelby Buyer, Inc. Delayed Draw | 518,304 | |||
| Tvg Shelby Buyer, Inc. Revolver | 83,333 | |||
| U.S. Urology Parnters, LLC Delayed Draw | 4,000,000 | |||
| Upland Software, Inc. Revolver | 1,333,333 | |||
| USIC Holdings, Inc. Delayed Draw | 84,762 | |||
| USIC Holdings, Inc. Revolver | 228,070 | |||
| USN OpCo, LLC Delayed Draw | 3,333,333 | |||
| Vacation Rental Brands, LLC Delayed Draw | 179,123 | |||
| Vacation Rental Brands, LLC Revolver | 555,419 | |||
| Vatica Health, Inc. Revolver | 363,636 | |||
| Vensure Employer Services, Inc. Delayed Draw | 62,506 | |||
| Vertex Service Partners, LLC Delayed Draw | 1,182,879 | |||
| VITAL PURCHASER, LLC Revolver | 164,000 | |||
| Vortex Companies, LLC Delayed Draw | 1,602,411 | |||
| VTC Buyer Corp. Delayed Draw | 574,091 | |||
| VTC Buyer Corp. Revolver | 802,907 | |||
| Vybond Buyer LLC Delayed Draw | 1,290,231 | |||
67
StepStone Private Credit Income Fund
Notes to Consolidated Financial Statements (continued)
December 31, 2025
| Investments in loans (continued) | Unfunded Commitment | |||
| Vybond Buyer LLC Revolver | $ | 967,673 | ||
| W.A. Kendall and Company, LLC Delayed Draw | 1,487,154 | |||
| W.A. Kendall and Company, LLC Revolver | 111,335 | |||
| Wasteology Group Transportation, LLC Delayed Draw | 1,257,132 | |||
| Wasteology Group Transportation, LLC Revolver | 389,007 | |||
| Western Smokehouse Partners, LLC Delayed Draw | 503,181 | |||
| Western Smokehouse Partners, LLC Revolver | 309,122 | |||
| Wges Buyer Inc. Delayed Draw | 2,805,000 | |||
| Wharf Street Ratings Acquisition LLC Delayed Draw | 362,567 | |||
| Wharf Street Ratings Acquisition LLC Revolver | 374,332 | |||
| Worldwide Insurance Network, LLC Delayed Draw | 1,032,780 | |||
| WSRP Advisory, LLC Delayed Draw | 2,320,000 | |||
| Total unfunded commitments | $ | 233,922,045 | ||
11. Capital Share Transactions
The Fund offers three separate classes of shares of beneficial interest designated as Class I Shares, Class D Shares and Class S Shares. Each class of Shares is subject to different fees and expenses. On January 17, 2025, the Fund converted Class T shares into Class S shares and ceased offering Class T Shares.
Subject to certain conditions, Shareholders may exchange shares from one class to another for an equivalent NAV amount of that share class.
68
StepStone Private Credit Income Fund
Notes to Consolidated Financial Statements (continued)
December 31, 2025
11. Capital Share Transactions (continued)
The following table summarizes the capital share transactions for the year ended December 31, 2025 and the period ended December 31, 2024:
| For the Year Ended December 31, 2025 | For the Period Ended December 31, 2024* | |||||||||||||||
| Shares | Dollar Amounts | Shares | Dollar Amounts | |||||||||||||
| Class I | ||||||||||||||||
| Proceeds from shares issued | 20,894,126 | $ | 212,550,879 | 16,622,652 | $ | 167,654,960 | ||||||||||
| Issuance of shares in connection with portfolio acquisition (Note 16) | 61,816,805 | 623,460,822 | — | — | ||||||||||||
| Reinvestment of distributions | 4,071,736 | 40,980,591 | 127,015 | 1,279,044 | ||||||||||||
| Repurchase of shares | (2,188,251 | ) | (22,431,185 | ) | (5,108 | ) | (52,357 | ) | ||||||||
| Exchange of shares | — | — | — | — | ||||||||||||
| Net increase (decrease) | 84,594,416 | $ | 854,561,107 | 16,744,559 | $ | 168,881,647 | ||||||||||
| Class D | ||||||||||||||||
| Proceeds from shares issued | 59 | $ | 600 | 1,000 | $ | 10,000 | ||||||||||
| Reinvestment of distributions | 101 | 1,017 | 41 | 413 | ||||||||||||
| Repurchase of shares | (63 | ) | (642 | ) | — | — | ||||||||||
| Exchange of shares | — | — | — | — | ||||||||||||
| Net increase (decrease) | 97 | $ | 975 | 1,041 | $ | 10,413 | ||||||||||
| Class S | ||||||||||||||||
| Proceeds from shares issued | — | $ | — | 1,000 | $ | 10,000 | ||||||||||
| Reinvestment of distributions | 182 | 1,838 | 41 | 413 | ||||||||||||
| Repurchase of shares | — | — | — | — | ||||||||||||
| Exchange of shares | 3,406 | 34,435 | — | — | ||||||||||||
| Net increase (decrease) | 3,588 | 36,273 | 1,041 | $ | 10,413 | |||||||||||
| Class T | ||||||||||||||||
| Proceeds from shares issued | — | $ | — | 3,365 | $ | 34,125 | ||||||||||
| Reinvestment of distributions | — | — | 41 | 409 | ||||||||||||
| Repurchase of shares | — | — | — | — | ||||||||||||
| Exchange of shares | (3,406 | ) | (34,435 | ) | — | — | ||||||||||
| Net increase (decrease) | (3,406 | ) | $ | (34,435 | ) | $ | 3,406 | $ | 34,534 | |||||||
| * | The Fund commenced operations on June 3, 2024. |
The Fund conducts quarterly offers to repurchase between 5.00% and 25.00% of its outstanding Shares at NAV, unless such offer is suspended or postponed in accordance with regulatory requirements (as discussed in Note 1). No Shareholder will have the right to require the Fund to repurchase such Shareholder’s Shares or any portion thereof. In the event that Shareholders, in the aggregate, submit for repurchase more than the number of Shares that the Fund will offer to repurchase, the Fund will repurchase the Shares on a pro rata basis, which may result in the Fund not honoring the full amount of a Share repurchase requested by a Shareholder. In connection with any given quarterly repurchase offer, the Fund currently intends to repurchase 5.00% of its outstanding Shares.
Rule 23c-3(b)(5) of the 1940 Act permits the Fund to repurchase up to an additional 2.00% of its outstanding Shares beyond the stated repurchase offer amount in the event that Shareholder repurchase requests exceed the offer. During the periods presented, repurchase requests were below the applicable offer amounts. Therefore, the Fund did not exercise the available option to repurchase additional Shares beyond the stated offer amount. As a result, all repurchase requests were fulfilled in full, and no pro rata reductions were necessary.
69
StepStone Private Credit Income Fund
Notes to Consolidated Financial Statements (continued)
December 31, 2025
11. Capital Share Transactions (continued)
The following table summarizes the Fund’s repurchase activity:
| Repurchase Request Deadline | Repurchase Offer Amount (Shares) | Shares Repurchased | ||||||
| September 16, 2024 | 514,837 | 18 | ||||||
| December 16, 2024 | 817,048 | 5,090 | ||||||
| March 14, 2025 | 3,898,769 | 244,398 | ||||||
| June 16, 2025 | 4,417,984 | 1,537,818 | ||||||
| September 15, 2025 | 4,674,625 | 149,848 | ||||||
| December 15, 2025 | 4,921,706 | 256,250 | ||||||
12. Dividend Reinvestment Plan
Pursuant to the dividend reinvestment plan ("DRIP") established by the Fund, each Shareholder whose Shares are registered in its own name will automatically be a participant under the DRIP and all income and/or capital gain dividend distributions will automatically be reinvested in additional Shares unless such Shareholder specifically elects to receive all income and/or capital gain dividends in cash. A Shareholder is free to change this election at any time. If, however, a Shareholder requests to change its election within 30 days prior to a distribution, the request will be effective only with respect to distributions after the 30-day period.
13. Investment Transactions
For the year ended December 31, 2025, purchases of investments, including the funding of existing commitments, excluding short-term investments, were $869.5 million. For the year ended December 31, 2025, total distributions, sales and repayments from investments, excluding short-term investments, were $392.1 million.
14. Tax Information
The Fund’s tax year ends on December 31. Accordingly, the tax-related disclosures herein are based on information as of December 31, 2025, the most recent tax year-end. There were no material tax-related changes during the period from January 1, 2025 through December 31, 2025. There were no material unrecognized tax benefits or unrecognized tax liabilities related to uncertain income tax positions for the tax years ended December 31, 2024. During the year ended December 31, 2025 and for the period from June 3, 2024 (commencement of operations) to December 31, 2024, the Fund did not incur any interest or penalties.
The Fund’s federal tax returns are subject to examination by the Internal Revenue Service for a period of three fiscal years after they are filed. Tax year 2024 is open to examination.
As of December 31, 2025, the Fund had temporary differences primarily due to timing of the amortization of organizational costs and undistributed tax basis.
U.S. GAAP requires that certain components of net assets be reclassified between financial and tax reporting. As of December 31, 2025, the Fund had permanent book to tax differences of $12,329 resulting primarily from a nondeductible excise tax. This permanent book to tax difference has been reclassified to paid-in capital and had no effect on the net assets or net asset value per share of the Fund.
For the tax year ended December 31, 2025, the Fund's tax components of distributable earnings (accumulated loss) on a tax basis were as follows:
| Undistributed ordinary income | $ | 12,079 | ||
| Accumulated capital and other losses | (911,753 | ) | ||
| Undistributed long-term capital gains | — | |||
| Net tax appreciation (depreciation) | $ | (750,537 | ) | |
| Other temporary differences | (622,957 | ) | ||
| Total distributable earnings (accumulated loss) | $ | (2,273,168 | ) |
70
StepStone Private Credit Income Fund
Notes to Consolidated Financial Statements (continued)
December 31, 2025
14. Tax Information (continued)
The tax character of Subchapter M distributions for the tax year ended December 31, 2025 was as follows:
| Ordinary Income | Long-Term Capital Gains | |||||||
| 2025 | $ | 84,357,079 | $ | — | ||||
| 2024 | $ | 5,702,120 | $ | — | ||||
For the tax year ended December 31, 2025, the federal tax cost of investments and unrealized appreciation (depreciation) were as follows:
| Gross unrealized appreciation | $ | 3,168,956 | ||
| Gross unrealized depreciation | (3,919,493 | ) | ||
| Net unrealized appreciation (depreciation) on investments | $ | (750,537 | ) | |
| Tax cost of investments | $ | 1,286,116,869 |
The difference between cost amounts for financial statement and federal income tax purposes is due primarily to timing differences in recognizing certain gains and losses on partnership and passive foreign investment company investments.
ASC 740 prescribes the minimum recognition threshold a tax position must meet in connection with accounting for uncertainties in income tax positions taken or expected to be taken by an entity before being measured and recognized in the consolidated financial statements. Management has concluded there were no uncertain tax positions as of the tax year ended December 31, 2025 for federal income tax purposes or in the Fund’s state and local tax jurisdictions. The Fund will recognize interest and penalties, if any, related to unrecognized tax benefits as tax expense in the Consolidated Statement of Operations. For the tax year ended December 31, 2025, the Fund did not incur any interest or penalties. The Fund did not have any unrecognized tax benefits as of the tax year ended December 31, 2025.
15. Risk Factors
An investment in the Fund involves material risks, including performance risk, liquidity risk, business and financial risk, risks associated with the use of leverage, valuation risk, tax risk and other risks that should be carefully considered prior to investing and investing should only be considered by persons financially able to maintain their investment and who can afford a loss of a substantial part or all of such investment.
16. Portfolio Acquisition
On January 2, 2025, the Fund had the initial closing on an agreement with Cresset Partners Private Credit Fund, LLC ("CPCF") to acquire substantially all of CPCF’s net assets (“Portfolio Acquisition”). The Portfolio Acquisition was effected pursuant to the Unit and Asset Purchase Agreement, dated as of November 23, 2024 (the “Purchase Agreement”), by and among the Fund, CPCF, and additional parties. The Purchase Agreement sets forth the terms and conditions of the transaction, including the mechanism by which substantially all of the net assets of CPCF were acquired by the Fund in exchange for Class I Shares of the Fund, and outlines the in-kind transfer of assets and assumption of certain liabilities. The Portfolio Acquisition is treated as a taxable event for U.S. federal income tax purposes. The agreement also describes the closing deliverables, purchase price allocation, post-closing adjustments, and other material terms governing the acquisition and related restructuring activities. Upon closing the Portfolio Acquisition, CPCF was renamed CRDEX Equity Partners LLC ("Feeder Fund").
71
StepStone Private Credit Income Fund
Notes to Consolidated Financial Statements (continued)
December 31, 2025
16. Portfolio Acquisition (continued)
The assets acquired in the transaction consisted of cash, a portfolio of investments in corporate loans, collateralized loan obligations and interests in investment vehicles that invest in debt securities. The liabilities assumed consist of the SSG Holdings SPV Credit Facility.
The transaction had an initial closing on January 2, 2025, at which point ownership of substantially all of the Feeder Fund's assets was transferred to the Fund. This initial transfer was subject to certain holdbacks and valuation adjustments, which were finalized on April 23, 2025.
Changes in ownership of the portfolio of investments were effectuated by each investment's respective form of assignment, such that all acquired investments are held in the name of the Fund. In addition, the Fund became the sole member of SSG Holdings SPV and, as a result, consolidates all SSG Holdings SPV’s assets and liabilities, including a portfolio of direct lending assets, CLO assets and the SSG Holdings SPV Credit Facility.
On January 2, 2025, March 31, 2025, and April 23, 2025, the Fund issued 56,931,963, 4,813,788, and 71,054 Shares, respectively, of additional Class I Shares to the Feeder Fund in connection with the Fund's acquisition of its net assets. On April 23, 2025, subsequent to the final closing of the Portfolio Acquisition, the Fund had gross assets of $1.0 billion, net assets of $860.6 million and 85,171,225 Shares outstanding.
The Portfolio Acquisition was accounted for as an asset acquisition under ASC 805-50, Business Combinations-Related Issues (“ASC 805”). Under asset acquisition accounting, the Fund allocated the total consideration paid—including the fair value of Class I Shares issued and transaction costs—to the individual assets acquired and liabilities assumed based on their relative fair values as of the acquisition date. In accordance with ASC 805-50-30-1, the acquired assets were recognized based on their cost to the Fund, which included transaction costs, and no goodwill was recorded. The fair value of the net assets acquired equaled the consideration paid, and no gain or loss was recognized. Cash received from the Portfolio Acquisition is presented net of transaction costs, other assets, and other liabilities in the Consolidated Statement of Cash Flows.
With substantially all CRDEX Equity Partners LLC assets invested in Shares of the Fund, it became a Feeder Fund following the Portfolio Acquisition. As of December 31, 2025, the Feeder Fund held 65.1% of the outstanding Shares of the Fund. The Shares held by the Feeder Fund are subject to contractual lock-ups that expire in various tranches beginning in March 31, 2026. As the lock-ups expire, the Shares held by the Feeder Fund are distributed to the investors in the Feeder Fund who become direct investors in the Fund.
On January 2, 2025, as a result of the Portfolio Acquisition, the Fund became the sole member of SSG Holdings SPV, a wholly-owned and consolidated subsidiary as described in Note 2. SSG Holdings SPV is party to a loan and security agreement dated as described in Note 9.
As of January 2, 2025, SSG Holdings SPV had $112.8 million outstanding on the $445.9 million commitment under the SSG Holdings SPV Credit Facility. The total commitment amount was later amended as described in Note 9.
72
StepStone Private Credit Income Fund
Notes to Consolidated Financial Statements (continued)
December 31, 2025
16. Portfolio Acquisition (continued)
The following table summarizes the allocation of the purchase price to the assets acquired and liabilities assumed as a result of the Portfolio Acquisition:
| Value of shares issued | $ | 623,460,822 | ||
| Transaction costs | 935,174 | |||
| Consideration paid | $ | 624,395,996 | ||
| Investments | $ | 594,316,300 | ||
| Cash, cash equivalents, and restricted cash | 145,563,672 | |||
| Other assets | 1,195,950 | |||
| Total assets acquired | 741,075,922 | |||
| SSG Holdings SPV Credit Facility | 112,788,386 | |||
| Other liabilities | 3,891,540 | |||
| Total liabilities acquired | 116,679,926 | |||
| Total net assets acquired | $ | 624,395,996 |
17. Subsequent Events
On February 9, 2026, the Fund commenced a repurchase offer with a valuation date of March 16, 2026.
The Fund has adopted financial reporting rules regarding subsequent events which require an entity to recognize in the financial statements the effects of all subsequent events that provide additional evidence about conditions that existed at the date of the balance sheet or may be of such a nature that disclosure will keep the financial statements from being misleading. The Adviser has evaluated the Fund’s related events and transactions that occurred through the date of issuance of the Fund’s financial statements. There were no other events or transactions that occurred during this period that materially impacted the amounts or disclosures in the Fund’s consolidated financial statements or the accompanying notes.
73
StepStone Private Credit Income Fund
Trustees and Officers (unaudited)
December 31, 2025
The identity of the Trustees and executive officers of the Fund and brief biographical information regarding each such person during the past five years is set forth below. The Fund’s Statement of Additional Information includes additional information about the membership of the Board and is available, without charge, upon request, by calling the Fund toll-free at (704) 215-4300.
| Independent Trustees | ||||||||||
| Name, Address and Birth Year1 |
Position(s) Held with Registrant |
Length of Time Served2 |
Principal Occupation(s) During Past Five Years |
Number of Portfolios Overseen in Fund Complex |
Other Trusteeships/ Directorships Held Outside the Fund Complex3 | |||||
| Terry Prather Birth Year: 1955 |
Trustee | Indefinite Length - Since May 2024 |
Chief Operating Officer, LIFT Orlando (community development organization) (2016-2023) | 5 | None | |||||
| Tracy Schmidt Birth Year: 1957 |
Trustee | Indefinite Length - Since Inception |
Founder, Morning Star Advisory, LLC (consulting and advisory services) (Since 2018) | 5 | None | |||||
| Ron Sturzenegger Birth Year: 1960 |
Trustee | Indefinite Length - Since Inception |
None | 5 | Director of Elme Communities (real estate investment trust)(since 2025) Director, KBS Real Estate Investment Trust II, Inc. (since 2019) and KBS Real Estate Investment Trust III, Inc. (Since 2019) | |||||
| Interested Trustees | ||||||||||
| Name, Address and
Birth Year1 |
Position(s) Held with Registrant |
Length of Time Served2 |
Principal Occupation(s) During Past Five Years |
Number of Portfolios Overseen in Fund Complex |
Other Trusteeships/ Directorships Held Outside the Fund Complex3 |
|||||
| Tom Sittema Birth Year: 1958 |
Chairperson of the Board of Trustees | Indefinite Length - Since Inception |
Executive Chairman, StepStone Group Private Wealth LLC (Since 2020) Managing Director, RiverBridge Capital (Since 2018) | 5 | None | |||||
| Bob Long Birth Year: 1962 |
Trustee | Indefinite Length - Since Inception |
CEO, StepStone Group Private Wealth LLC (Since 2019) | 5 | None | |||||
74
StepStone Private Credit Income Fund
Trustees and Officers (unaudited) (continued)
December 31, 2025
| Executive Officers | ||||||
| Name, Address and Birth Year1 |
Position(s) Held with Registrant |
Length of Time Served2 |
Principal Occupation(s) During Past Five Years | |||
| Bob Long Birth Year: 1962 |
President and Principal Executive Officer | Indefinite Length – Since Inception |
See above | |||
| Kimberly Zeitvogel Birth Year: 1971 |
Treasurer and Principal Financial Officer | Indefinite Length – Since Inception |
Partner, StepStone Group Private Wealth LLC (Since 2020); Vice President of Finance, Millennium Advisors, LLC (2018 – 2020) | |||
| Tim Smith Birth Year: 1968 |
Vice President | Indefinite Length – Since Inception |
CFO and COO, StepStone Group Private Wealth LLC (Since 2019); President, Carolon Capital (Since 2013) | |||
| Dean Caruvana Birth Year: 1988 |
Secretary and Chief Compliance Officer | Indefinite Length – Since Inception |
General Counsel, StepStone Group Private Wealth LLC (Since 2023); Principal, Blue Owl Capital (2022-2023); Vice President, BlackRock (2018-2022) | |||
| 2 | Each Trustee or Officer serves an indefinite term, until his or her successor is elected. |
| 3 | This includes any directorships at public companies and registered investment companies held by the Trustee over the past five years. |
75
StepStone Private Credit Income Fund
Other Information (unaudited)
December 31, 2025
Proxy Voting Record
Information regarding how the Fund voted proxies for portfolio securities, if applicable, during the most recent 12-month period ended June 30, is also available, without charge and upon request by calling the Fund at (877) 772-7724 or by accessing the Fund’s Form N-PX on the SEC’s website at sec.gov.
Proxy Voting Policies and Procedures
A description of the Fund’s proxy voting policies and procedures related to portfolio securities is available without charge, upon request, by calling the Fund at (704) 215-4300 or on the U.S. Securities and Exchange Commission’s (“SEC”) website at sec.gov.
Interval Fund Policy
The Fund has adopted a fundamental policy, which may be changed only by the affirmative vote of a "majority of the outstanding voting securities" of the Fund (as defined in the 1940 Act), that it will make quarterly repurchase offers pursuant to Rule 23c-3 under the 1940 Act, as such rule may be amended from time to time, for between 5% and 25% of the Fund's shares outstanding at NAV, unless suspended or postponed in accordance with regulatory requirements, and each repurchase pricing shall occur no later than the 14th day after the repurchase request deadline, or the next business day if the 14th day is not a business day.
Availability of Quarterly Portfolio Schedules
The Fund files its complete schedule of portfolio holdings with the SEC for the first and third quarters of each fiscal year on Form N-PORT. The Fund’s Form N-PORT is available on the SEC website at sec.gov, or without charge and upon request by calling the Fund at (704) 215-4300.
76
StepStone Private Credit Income Fund
Privacy Notice (unaudited)
December 31, 2025
STEPSTONE GROUP PRIVATE WEALTH LLC PRIVACY POLICY
Data privacy is a primary concern for each of StepStone Group LP (“SSG”), StepStone Group Private Wealth LLC (“SPW”), StepStone Group Real Assets LP (“SIRA”), StepStone Group Real Estate LP (“SRE”), StepStone Group Private Debt LLC (“SPD”), and StepStone Group Private Debt AG (“SPD AG”) together with their affiliates and related entities (collectively, “StepStone”). This data privacy notice (the “Notice”) details StepStone’s practices for collecting, using, and disclosing the personal information of clients and others, to both affiliates of SSG, SPW, SIRA, SRE, SPD, and SPD AG as applicable, and nonaffiliated third parties. Recipients of this Notice include, among others, current clients and investors, prospective clients, visitors to our websites, former clients, employees of managers with whom StepStone has conducted business, customers, as defined by Regulation S-P, and employees of StepStone or any of StepStone’s affiliates (each a “Notice Recipient”). For purposes of this Notice, an affiliate is an entity that (i) controls SSG, SPW, SIRA, SRE, SPD, or SPD AG, (ii) is controlled by SSG, SPW, SIRA, SRE, SPD, or SPD AG, or (iii) is under common control with SSG, SPW, SIRA, SRE, SPD, or SPD AG. Nonaffiliated third parties are parties who are not affiliates of any of SSG, SPW, SIRA, SRE, SPD, or SPD AG.
Confidentiality of Personal Information
StepStone maintains reasonable physical, electronic and procedural safeguards to guard a Notice Recipient’s personal information. StepStone endeavors to procure that third parties that handle information agree to abide by confidentiality obligations, and use personal information only in accordance with the purpose for which it is shared. In addition, StepStone employees are trained to handle a Notice Recipient’s information properly in order to maintain its security, and only employees who reasonably need to know personal information about a Notice Recipient to provide services to such Notice Recipient are designed to have access to such information.
Categories of Personal information that StepStone Collects
StepStone collects personal information about Notice Recipients from the following sources: (i) information it receives from Notice Recipients on applications or other forms, including contact forms and application forms; (ii) information about Notice Recipients’ transactions with StepStone, its affiliates, or others; and (iii) information collected automatically from website visitors.
StepStone is a data controller within the meaning the General Data Protection Regulation (“GDPR”), the Swiss Federal Act on Data Protection (“FADP”) and other applicable data protection legislation in force in the European Economic Area (“EEA”), and a business within the meaning of the California Consumer Privacy Act of 2018 (“CCPA”) and undertakes to hold any personal information provided in accordance with EEA data protection legislation, the CCPA, the Australian Privacy Act 1988, or any other applicable privacy law.
Use of Your Personal Information
Personal information will be used by StepStone for the following purposes:
| ● | to respond to and communicate with you; |
| ● | to provide the services you request and manage our relationship with you; |
| ● | to manage and administer holdings in StepStone managed or advised funds, separately managed accounts, advisory engagements and any related business relationships (and, in each case, the investments made pursuant thereto) on an ongoing basis in accordance with the terms agreed between a Notice Recipient and SSG, SPW, SIRA, SRE, SPD, or SPD AG, as applicable; |
| ● | to provide user and technical support; |
| ● | to carry out statistical analysis and market research; and |
| ● | to comply with legal and regulatory obligations applicable to the Notice Recipient, StepStone or its managed or advised funds, separately managed accounts, advisory engagements or any related business relationship with the Notice Recipient from time to time, including applicable anti-money laundering and counter terrorist financing legislation, investor qualification legislation and tax legislation. |
To understand our practices regarding information that is collected automatically from visitors to our website, please review our Cookie Consent Policy.
We only use personal information in connection with StepStone’s legitimate business interests and accordingly Notice Recipients’ specific consent is not required.
77
StepStone Private Credit Income Fund
Privacy Notice (unaudited) (continued)
December
31, 2025
Job Applicants
If you apply for a job with us, we will collect additional information in connection with your application. This may include:
| ● | Name and contact information; |
| ● | Username and password; |
| ● | Work authorization status; |
| ● | Resume, CV, cover letter, work experience, and education information; |
| ● | Skills; |
| ● | Professional and work-related licenses, permits, and certifications held; |
| ● | Reference-related information; and |
| ● | Any other information that is publicly available or that you elect to provide to us. |
Such information may be collected from you directly, from your references, from your prior employers, or from your places of education. We will only use this information to evaluate your candidacy, including by processing your application, assessing your qualifications, corresponding with you, and complying with legal obligations.
Disclosure of Personal information to Affiliates
StepStone generally may share all of a Notice Recipient’s personal information with StepStone’s affiliates, provided that such affiliates will be obligated to keep such personal information confidential to the same extent as StepStone. StepStone shares information with its affiliates in order to serve its Notice Recipients better, including for business continuity purposes. If a Notice Recipient prefers that StepStone not disclose personal information about such Notice Recipient to its affiliates, such Notice Recipient may opt out of those general disclosures; that is, such Notice Recipient may direct StepStone not to make such disclosures (other than disclosures permitted or required by applicable law or otherwise permitted by StepStone’s privacy policy). However, notwithstanding any such opt-out, StepStone will be permitted to disclose personal information to its affiliates to the extent necessary or appropriate for such affiliates to perform services for the benefit of the Notice Recipient.
Disclosure of Personal information to Non-Affiliates
StepStone does not sell, share, or market a Notice Recipient’s personal information to nonaffiliated third parties. StepStone’s intent is to respect the Notice Recipients’ expectations that their personal information will be kept confidential. However, in order to serve the Notice Recipients better, StepStone will disclose personal information to nonaffiliated third parties (including service providers to StepStone) to the extent necessary or appropriate for such third parties to perform services for the benefit of the Notice Recipient. In addition, StepStone only shares personal information with unaffiliated third parties if StepStone believes that such personal information will be kept confidential by such third parties after such disclosure, and that the third parties will use the personal information only for the purposes identified by contract between StepStone and the nonaffiliated third party.
StepStone may also disclose information:
| ● | In connection with any merger, sale of stock or assets, financing, acquisition, divestiture, or dissolution of all or a portion of our business; and |
| ● | If we believe that disclosure is reasonably necessary to: (a) comply with any applicable law, regulation, legal process or governmental request; (b) enforce or comply with our Terms of Use or other applicable agreements or policies, (c) protect our rights or property, or the security or integrity of our services, or (d) protect us, users of our services or the public from harm or potentially prohibited or illegal activities. |
Except as required by applicable law and described in this privacy notice, StepStone will not share any other personal information about a Notice Recipient with its affiliates or nonaffiliated third parties.
Personal information of Former Investors and Prospective Clients
This Notice and StepStone’s policy regarding treatment of personal information of Notice Recipients also apply to former clients, business prospects, potential clients and current and former employees.
Disclosure of Personal information outside the EEA (excluding Switzerland)
Personal information may be transferred to countries which may not have the same or equivalent data protection laws as that required under EEA data protection legislation. Any such transfer will be made in compliance with applicable data protection legislation, and appropriate measures are in place to facilitate this, such as entering into Model Contractual Clauses (as published by the European Commission). For more information on the means of transfer of data or a copy of the relevant safeguards, please contact us at privacy@stepstonegroup.com.
78
StepStone Private Credit Income Fund
Privacy Notice (unaudited) (continued)
December 31, 2025
Pursuant to EEA data protection legislation, investors have the right to object to processing of personal information and a number of other rights which may be exercised in certain circumstances, i.e.:
| ● | the right of access to personal information held; |
| ● | the right to amend and rectify any inaccuracies in personal information held; |
| ● | the right to erase personal information held; |
| ● | the right to data portability of personal information held; and |
| ● | the right to request restriction of the processing of personal information. |
These rights will be exercisable, subject to limitations as provided for in EEA data protection legislation. Any Notice Recipient may make a request to StepStone to exercise these rights by contacting us at privacy@stepstonegroup.com.
Rights for California Residents
The California Consumer Privacy Act of 2018, California Civil Code Sections 1798.100 et seq. (CCPA) additionally affords data protection rights to persons who are California residents. California residents, please see our California Consumer Privacy Act Disclosures here.
Rights for Swiss and Australian Residents
Personal information may be transmitted to StepStone’s affiliates and non-affiliates outside of Switzerland or Australia (as described in the sections on disclosure above). The countries in which personal information may be transmitted are the following: Australia; Brazil; Canada; Chile; China; Germany; Ireland; Italy; Japan; Kingdom of Saudi Arabia; Korea; Luxembourg; Malaysia; Mexico; Netherlands; Singapore; Spain; Switzerland; the United States; United Arab Emirates; and the United Kingdom. Any such transfers will be made in compliance with applicable data protection legislation, and appropriate measures are in place to facilitate this, such as entering into a data transfer agreement or Model Contractual Clauses (as published by the European Commission and for Switzerland with the Swiss Addendum).
Pursuant to Australian privacy legislation, a Notice Recipient has the right of access to personal information held and the right to amend and rectify any inaccuracies in personal information held.
These rights will be exercisable, subject to limitations as provided for in Australian privacy legislation. Any Notice Recipient may make a request to StepStone to exercise these rights by contacting us at privacy@stepstonegroup.com.
Retention of Personal Information
Please note that personal information may be retained by StepStone for the duration of a Notice Recipient’s investment or engagement with StepStone, and afterwards in accordance with StepStone’s legal and regulatory obligations and policies.
Links to Other Sites
Our websites may contain links to other sites. Please be aware that we are not responsible for the content or privacy practices of such other sites. We encourage our users to be aware when they leave our site and to read the privacy statements of any other linked sites that collect personal information.
Contact Us
For queries, requests, complaints or comments in respect of this Notice, or the way in which StepStone uses personal information, or if you need to access the policy in an alternative format due to a disability, please contact us at privacy@stepstonegroup.com, fill out our Contact Us form available on our website, or call +1-888-995-0350. StepStone will verify your identity using at least two data points and try to respond to you as soon as possible. You may also authorize an agent to submit a request on your behalf, so long as you provide the authorized agent written permission to request on your behalf, and your authorized agent is able to verify their identity with us.
Note that Notice Recipients have the right to lodge a complaint with the appropriate regulator.
Changes to Privacy Policy
StepStone may modify its privacy policy at any time. If we make any changes to this Privacy Policy, we will provide notice of such changes, as appropriate (e.g., on our website or by an email notification to the address you have provided).
79
Investment Adviser and Administrator
StepStone Group Private Wealth LLC
128 S Tryon St., Suite 1600
Charlotte, North Carolina 28202
www.stepstonepw.com
Investment
Sub-Adviser
StepStone Group Private Debt LLC
277 Park Avenue 44th Floor
New York, New York 10172
Investment Sub-Subadviser
StepStone
Group Europe
Alternative Investments Limited
Third Floor, One Haddington
Buildings
Haddington Road, Floor 3
Dublin 4, D04 X4C9, Ireland
Custodian
UMB Bank, N.A.
928 Grand Boulevard, 5th Floor
Kansas
City, Missouri 64106
Sub-Administrator, Transfer
Agent and Sub-Accountant
UMB Fund Services, Inc.
235 W.
Galena Street
Milwaukee, Wisconsin 53212-3949
Phone: (414) 299-2200
Distributor
Distribution
Services, LLC
3 Canal Plaza, Suite 100
Portland, Maine 04101
Independent Registered Public
Accounting Firm
Ernst & Young LLP
One Manhattan
West
New York, New York 10001
80
(b) Not applicable.
ITEM 2. CODE OF ETHICS.
(a) StepStone Private Credit Income Fund (the “Fund” or the “Registrant”), as of the end of the period covered by this report, has adopted a code of ethics that applies to the Registrant’s principal executive officer, principal financial officer, principal accounting officer or controller, or persons performing similar functions, regardless of whether these individuals are employed by the Registrant or a third party.
(b) Not applicable.
(c) There have been no amendments, during the period covered by this report, to a provision of the code of ethics that applies to the Registrant’s principal executive officer, principal financial officer, principal accounting officer or controller, or persons performing similar functions, regardless of whether these individuals are employed by the Registrant or a third party, and that relates to any element of the code of ethics description.
(d) The Registrant has not granted any waivers, during the period covered by this report, including an implicit waiver, from a provision of the code of ethics that applies to the Registrant’s principal executive officer, principal financial officer, principal accounting officer or controller, or persons performing similar functions, regardless of whether these individuals are employed by the Registrant or a third party, that relates to one or more of the items set forth in paragraph (b) of this item’s instructions.
(e) Not applicable.
(f) The Registrant’s code of ethics is attached as Exhibit (a)(1) to this Form N-CSR.
ITEM 3. AUDIT COMMITTEE FINANCIAL EXPERT.
(a)(1) The Registrant’s board of trustees has determined that the Registrant has at least one audit committee financial expert serving on the audit committee.
(a)(2) The audit committee financial expert is Mr. Tracy Schmidt who is independent as defined in Form N-CSR Item 3 (a)(2).
ITEM 4. PRINCIPAL ACCOUNTANT FEES AND SERVICES.
Audit Fees
(a) The aggregate fees billed for the year ended December 31, 2025 and the period ended December 31, 2024 (the Registrant’s first period of operations) for professional services rendered by the principal accountant for the audit of the Registrant’s annual financial statements or services that are normally provided by the accountant in connection with statutory and regulatory filings or engagements for each year or period are $355,000 and $187,500, respectively.
Audit-Related Fees
(b) The aggregate fees billed for the year ended December 31, 2025 and the period ended December 31, 2024 (the Registrant’s first period of operations) for assurance and related services by the principal accountant that are reasonably related to the performance of the audit of the Registrant’s financial statements and are not reported under paragraph (a) of this Item are $23,675 and $13,675, respectively. Audit-related fees principally include fees associated with reviewing and providing comments on semi-annual reports and issuing consents.
Tax Fees
(c) The aggregate fees billed for the year ended December 31, 2025 and the period ended December 31, 2024 (the Registrant’s first period of operations) for professional services rendered by the principal accountant for tax compliance, tax advice and tax planning are $54,000 and $75,560, respectively. Tax-related fees principally include fees associated with the preparation of taxable income calculations and federal income tax forms.
All Other Fees
(d) The aggregate fees billed for the year ended December 31, 2025 and the period ended December 31, 2024 (the Registrant’s first period of operations) for products and services provided by the principal accountant other than the services reported in paragraphs (a) through (c) of this Item are $0 and $0, respectively.
(e)(1) During its regularly scheduled periodic meetings, the Registrant’s audit committee will pre-approve all audit, audit-related, tax and other services to be provided by the principal accountants of the Registrant.
The audit committee may, from time to time, delegate to one or more of its members who are “independent trustees” (as defined in Section 2(a)(19) of the Investment Company Act of 1940 (the “1940 Act”)) pre-approval authority for any subsequent new engagements that arise between regularly scheduled meeting dates provided that any fees that are pre-approved are presented to the audit committee at its next regularly scheduled meeting.
Under applicable laws, pre-approval of non-audit services may be waived provided that: (i) the aggregate amount of all such services provided constitutes no more than five percent of the total amount of fees paid by the Registrant to its principal accountant during the fiscal year in which services are provided; (ii) such services were not recognized by the Registrant at the time of engagement as non-audit services; and (iii) such services are promptly brought to the attention of the audit committee of the Registrant, approved prior to the completion of the audit, and approved based upon a determination that the service is eligible for waiver.
(e)(2) The percentage of services described in each of paragraphs (b) through (d) of this Item that were approved by the audit committee pursuant to paragraph (c)(7)(i)(C) of Rule 2-01 of Regulation S-X are as follows:
(b) Not applicable.
(c) 0%
(d) Not applicable.
(f) Not applicable.
(g) The aggregate non-audit fees billed by the Registrant’s accountant for services rendered to the Registrant, and rendered to the Registrant’s investment adviser (not including any sub-adviser whose role is primarily portfolio management and is subcontracted with or overseen by another investment adviser), and any entity controlling, controlled by, or under common control with the adviser that provides ongoing services to the Registrant for the year ended December 31, 2025 and the period ended December 31, 2024 (the Registrant’s first period of operations) were $2.9 million and $1.5 million, respectively.
(h) The Registrant’s audit committee of the board of trustees has considered whether the provision of non-audit services that were rendered to the Registrant’s investment adviser (not including any sub-adviser whose role is primarily portfolio management and is subcontracted with or overseen by another investment adviser), and any entity controlling, controlled by, or under common control with the investment adviser that provides ongoing services to the Registrant that were not pre-approved pursuant to paragraph (c)(7)(ii) of Rule 2-01 of Regulation S-X is compatible with maintaining the principal accountant’s independence. No such services were rendered.
(i) Not applicable.
(j) Not applicable.
ITEM 5. AUDIT COMMITTEE OF LISTED REGISTRANTS.
Not applicable.
ITEM 6. INVESTMENTS.
(a) Schedule of Investments in securities of unaffiliated issuers as of the close of the reporting period is included as part of the Report to Shareholders filed under Item 1(a) of this Form.
(b) Not applicable.
ITEM 7. FINANCIAL STATEMENTS AND FINANCIAL HIGHLIGHTS FOR OPEN-END MANAGEMENT INVESTMENT COMPANIES.
Not applicable.
ITEM 8. CHANGES IN AND DISAGREEMENTS WITH ACCOUNTANTS FOR OPEN-END MANAGEMENT INVESTMENT COMPANIES.
Not applicable.
ITEM 9. PROXY DISCLOSURES FOR OPEN-END MANAGEMENT INVESTMENT COMPANIES.
Not applicable.
ITEM 10. REMUNERATION PAID TO DIRECTORS, OFFICERS, AND OTHERS OF OPEN-END MANAGEMENT INVESTMENT COMPANIES.
Not applicable.
ITEM 11. STATEMENT REGARDING BASIS FOR APPROVAL OF INVESTMENT ADVISORY CONTRACT.
Not applicable.
ITEM 12. DISCLOSURE OF PROXY VOTING POLICIES AND PROCEDURES FOR CLOSED-END MANAGEMENT INVESTMENT COMPANIES.
The Fund’s investment adviser, StepStone Group Private Wealth LLC (the “Adviser”), has delegated proxy voting responsibility to StepStone Group Private Debt LLC (the “Sub-Adviser”). The Sub-Adviser’s exercise of this delegated proxy voting authority on behalf of the Fund is subject to the oversight of the Adviser.
The policies and procedures used by the Sub-Adviser to determine how to vote proxies relating to portfolio securities is set forth below:
PROXY VOTING POLICY
Pursuant to Rule 206(4)-6 and Rule 204-2 under the Investment Advisers Act of 1940 (the “Advisers Act”), it is a fraudulent, deceptive, or manipulative act, practice or course of business, within the meaning of Section 206(4) of the Advisers Act, for an investment adviser to exercise voting authority with respect to client securities, unless (A) the adviser has adopted and implemented written policies and procedures that are reasonably designed to ensure that the adviser votes proxies in the best interests of its clients, (B) the adviser describes its proxy voting procedures to its clients and provides copies on request, and (C) the adviser discloses to clients how they may obtain information on how the adviser voted their proxies.
Voting Proxies
The Sub-Adviser is responsible for voting proxies on behalf of the Fund. The Sub-Adviser must vote proxies in a way that is consistent with the Sub-Adviser’s fiduciary duty to the Fund, and any investment policy of the Fund and maintain records of proxies voted, together with a brief explanation why votes were cast in a particular way.
The Sub-Adviser, as a matter of policy and as a fiduciary to the Fund, has responsibility for voting proxies for portfolio securities consistent with the best economic interest of the Fund. The Sub-Adviser’s policy and practice includes the responsibility to monitor corporate actions, receive and vote client proxies and disclose any potential conflicts of interest as well as make information available to clients about the voting of proxies for their portfolio securities and maintaining relevant and required records.
The Sub-Adviser has adopted the following procedures to implement the Sub-Adviser’s policy in regard to the Fund.
Voting Procedures
All investment professionals will forward any proxy materials received on behalf of the Fund to the Sub-Adviser’s Chief Compliance Officer, as applicable.
The Sub-Adviser’s Chief Compliance Officer, as applicable, will verify the Fund holds the security to which the proxy relates.
Absent material conflicts, the investment professionals responsible for the investment to which the proxy materials relate, in consultation with Sub-Adviser’s Chief Compliance Officer will determine how the Sub-Adviser should vote the proxy in accordance with applicable voting guidelines, complete the proxy, and vote the proxy in a timely and appropriate manner.
Voting Guidelines
The Sub-Adviser will vote proxies in the best interests of the Fund. The Sub-Adviser’s policy is to vote all proxies from a specific issuer the same way for each client absent qualifying restrictions from a client or as documented in the file by the Sub-Adviser’s Chief Compliance Officer, as applicable. Clients of the Sub-Adviser, outside of the Fund, are permitted to place reasonable restrictions on the Sub-Adviser’s voting authority in the same manner that they may place such restrictions on the actual selection of account securities.
The Sub-Adviser will generally vote in favor of routine corporate housekeeping proposals such as to change capitalization (e.g., increase the authorized number of common or preferred shares of stock (to the extent there are not disproportionate voting rights per preferred share)), the election of directors, setting the time and place of the annual meeting, change of fiscal year, change of name, and selection of auditors absent conflicts of interest raised by an auditor’s non-audit services.
In the case of non-routine matters, voting decisions will generally be made in support of management, unless it is believed that such recommendation is not in the best interests of the Fund. On a case by case basis, the Sub-Adviser will decide non-routine matters, taking into account the opinion of management and the effect on management, and the effect on shareholder value and the issuer’s business practices. These matters include, but are not limited to, change of domicile, change in preemptive rights or cumulative voting rights, compensation plans, investment restrictions for social policy goals, precatory proposals, classification of the board of directors, poison pill proposals or amendments, recapitalizations, and super-majority voting.
The Sub-Adviser will abstain from voting if it is determined to be in the best interests of the Fund. In making such a determination, various factors will be considered, including, but not limited to, the costs associated with exercising the proxy (e.g., travel or translation costs) and any legal restrictions on trading resulting from the exercise of the proxy. In consultation with the Sub-Adviser’s Chief Compliance Officer, as applicable, the Sub-Adviser may also consider any special regulatory implications applicable to the client or the Sub-Adviser resulting from the exercise of the proxy.
Conflicts of Interest
The Sub-Adviser will identify any conflicts that exist between the interests of the Sub-Adviser and the client by reviewing the relationship of the Sub-Adviser with the issuer of each security to determine if the Sub-Adviser or any of its employees has any financial, business or personal relationship with the issuer.
If a material conflict of interest exists, the Sub-Adviser’s Chief Compliance Officer, as applicable, will determine whether it is appropriate to disclose the conflict to the affected clients, to give the clients an opportunity to vote the proxies themselves, or to address the voting issue through other objective means such as voting in a manner consistent with a predetermined voting policy or receiving an independent third party voting recommendation.
The Sub-Adviser will maintain a record of the resolution of any conflict of interest.
Recordkeeping
The Sub-Adviser’s Chief Compliance Officer, as applicable, shall retain the following proxy records in accordance with the SEC’s five-year retention requirement.
| ● | These policies and procedures and any amendments. |
| ● | Each proxy statement that the Sub-Adviser receives. |
| ● | A record of each vote that the Sub-Adviser casts. |
| ● | Any document the Sub-Adviser created that was material to making a decision how to vote proxies, or that memorializes that decision including periodic reports to the Sub-Adviser’s Chief Compliance Officer or proxy committee, if applicable. |
| ● | A copy of each written request from the Board for information on how the Sub-Adviser voted the Fund’s proxies, and a copy of any written response. |
Private Markets Investments
Investments in private assets are often subject to contractual agreements among the investors in the fund or company. If the Sub-Adviser has the authority to vote with respect to the interests, it will exercise its rights in accord with its contractual obligations and, if its vote is not constrained by contract, the Sub-Adviser will determine how to vote based on the principles described above. Records relating to the vote will be kept for the five-year retention period.
ITEM 13. PORTFOLIO MANAGERS OF CLOSED-END MANAGEMENT INVESTMENT COMPANIES.
(a)(1) Fund Management
The following provides biographical information about the individuals who are primarily responsible for the day-to-day management of the Registrant’s portfolio (each a “Portfolio Manager”) as of the date of this filing:
Gary Gipkhin
Gary Gipkhin is a director and member of the private debt investment team at StepStone Group. Prior to joining StepStone Group, Mr. Gipkhin worked in investment banking at SunTrust Robinson Humphrey, where he originated and executed a variety of M&A, debt and equity transactions for clients in the industrials space. Mr. Gipkhin received his BS in finance and accounting from the Kelley School of Business at Indiana University.
Ariel Goldblatt
Ariel Goldblatt is a partner and member of the private debt team at StepStone Group. Prior to joining StepStone Group in April 2019, Ms. Goldblatt was a director of business development at CNBC, Inc., where she led business development and M&A activity. Prior to that, Ms. Goldblatt was a senior analyst at Eachwin Capital, L.P. an institutionally oriented investment management firm, from February 2013 to February 2017. Before that she worked in private equity, private credit and investment banking at Apax Partners LLP, Crescent Capital Group L.P. and Merrill Lynch & Co. Ms. Goldblatt received her MBA from The Wharton School, University of Pennsylvania and her BS in finance from the Schreyer Honors College, Pennsylvania State University.
(a)(2) Other Accounts Managed by Portfolio Manager(s) or Management Team Member and Potential Conflicts of Interest
Other Accounts Managed by the Portfolio Managers
(As of December 31, 2025)
|
Number of Other Accounts Managed and Total (in billions) |
Number of Other Accounts and Total Value of Assets (in billions) | |||||
| Name | Registered investment companies |
Other pooled investment vehicles |
Other accounts |
Registered investment companies |
Other pooled investment vehicles |
Other accounts |
| Gary Gipkhin |
One account, $0.2B |
Zero accounts |
One account, $1.2B |
Zero accounts | Zero accounts | Zero accounts |
| Ariel Goldblatt |
One account, $0.2B |
Zero accounts |
Two accounts, $1.2B |
Zero accounts | Zero accounts | One account, $1.9B |
Conflicts of Interest
A potential conflict of interest may arise as a result of a Portfolio Manager’s provision of advisory services to other investment companies, pooled investment vehicles, and/or other accounts (including institutional clients, pension plans and certain high-net-worth individuals) (“Other Accounts”). The Sub-Adviser may receive fees from Other Accounts that are higher than the fee it receives from the Fund, or it may receive a performance-based fee on certain accounts. In those instances, the Portfolio Managers may have an incentive to favor the higher and/or performance-based fee accounts over the Fund.
The Sub-Adviser has implemented procedures that are designed to ensure that investment opportunities are allocated in a manner that: (i) treats all of its clients fairly and equitably over time; (ii) prevents conflicts regarding allocation of investment opportunities among its clients; and (iii) complies with applicable regulatory requirements. For example, the Sub-Adviser uses an allocation methodology designed to allocate all investments ratably based on a defined allocation procedure. Notwithstanding the foregoing, an aggregated investment may be allocated on a different basis under certain circumstances depending on factors which include, but are not limited to, available cash, liquidity requirements, risk parameters and legal and/or regulatory requirements.
The Sub-Adviser and its investment personnel, including a Portfolio Manager, may hold investments in Other Accounts. This may create an incentive for the Sub-Adviser and its investment personnel to take investment actions based on those investment interests which might diverge, in some cases, from the interests of other clients or favor or disfavor certain funds over other funds. Any potential conflict that arises from these circumstances is mitigated by several factors, including: (i) the fact that the Sub-Adviser’s investment process is designed to achieve long-term capital appreciation as opposed to short-term profits and (ii) the fact that the allocation process is controlled by finance and compliance personnel for the Sub-Adviser.
(a)(3) Compensation Structure of Portfolio Managers
The Sub-Adviser’s philosophy on compensation is to provide senior professionals incentives that are tied to both short-term and long-term performance of the Sub-Adviser. All investment professionals are salaried. Further, all investment professionals are eligible for a short-term incentive bonus each year that is discretionary and based upon the professional’s performance, as well as the performance of the business.
As of December 31, 2025, compensation for the Portfolio Managers includes, a salary, a discretionary bonus and certain retirement benefits from the Sub-Adviser. Additionally, each Portfolio Manager has an equity interest in the Sub-Adviser and indirectly benefits from the success of the Fund based on his or her ownership interest.
(a)(4) Disclosure of Securities Ownership
The Fund is required to show the dollar amount range of each of Mr. Gipkhin’s and Ms. Goldblatt’s “beneficial ownership” of shares of the Fund as of the end of the most recently completed fiscal year. Dollar amount ranges to be disclosed are established by the SEC. “Beneficial ownership” is determined in accordance with Rule 16a-1(a)(2) under the Securities Exchange Act of 1934, as amended (the “Exchange Act”). As of December 31, 2025, Mr. Gipkhin and Ms. Goldblatt did not beneficially own shares of the Fund.
(b) Not applicable.
ITEM 14. PURCHASES OF EQUITY SECURITIES BY CLOSED-END MANAGEMENT INVESTMENT COMPANY AND AFFILIATED PURCHASERS.
No purchases were made during the reporting period by or on behalf of the Fund or any “affiliated purchaser,” as defined in Rule 10b-18(a)(3) under the Exchange Act (17 CFR 240.10b-18(a)(3)), of shares or other units of any class of the Fund’s equity securities that is registered by the Registrant pursuant to Section 12 of the Exchange Act (15 U.S.C. 781).
ITEM 15. SUBMISSION OF MATTERS TO A VOTE OF SECURITY HOLDERS.
There have been no material changes to the procedures by which the shareholders may recommend nominees to the Registrant’s board of trustees during the period covered by this report.
ITEM 16. CONTROLS AND PROCEDURES.
(a) The Registrant’s principal executive and principal financial officers, or persons performing similar functions, have concluded that the Registrant’s disclosure controls and procedures (as defined in Rule 30a-3(c) under the 1940 Act (17 CFR 270.30a-3(c))) are effective, as of a date within 90 days of the filing date of the report that includes the disclosure required by this paragraph, based on their evaluation of these controls and procedures required by Rule 30a-3(b) under the 1940 Act (17 CFR 270.30a-3(b)) and Rules 13a-15(b) or 15d-15(b) under the Exchange Act, as amended (17 CFR 240.13a-15(b) or 240.15d-15(b)).
(b) There were no changes in the Registrant’s internal control over financial reporting (as defined in Rule 30a-3(d) under the 1940 Act (17 CFR 270.30a-3(d)) that occurred during the period covered by this report that has materially affected, or is reasonably likely to materially affect, the Registrant’s internal control over financial reporting.
ITEM 17. DISCLOSURE OF THE SECURITIES LENDING ACTIVITIES FOR CLOSED-END MANAGEMENT COMPANIES.
(a) Not applicable.
(b) Not applicable.
ITEM 18. RECOVERY OF ERRONEOUSLY AWARDED COMPENSATION.
(a) Not applicable.
(b) Not applicable.
ITEM 19. EXHIBITS.
(a)(3) Not applicable.
(a)(4) Not applicable.
SIGNATURES
Pursuant to the requirements of the Securities Exchange Act of 1934 and the Investment Company Act of 1940, the Registrant has duly caused this report to be signed on its behalf by the undersigned, thereunto duly authorized.
| (Registrant) | StepStone Private Credit Income Fund | |
| By (Signature and Title)* | /s/ Robert W. Long | |
| Robert W. Long, President | ||
| (Principal Executive Officer) | ||
| Date | March 6, 2026 |
Pursuant to the requirements of the Securities Exchange Act of 1934 and the Investment Company Act of 1940, this report has been signed below by the following persons on behalf of the Registrant and in the capacities and on the dates indicated.
| By (Signature and Title)* | /s/ Robert W. Long | |
| Robert W. Long, President | ||
| (Principal Executive Officer) | ||
| Date | March 6, 2026 | |
| By (Signature and Title)* | /s/ Kimberly S. Zeitvogel | |
| Kimberly S. Zeitvogel, Treasurer | ||
| (Principal Financial Officer) | ||
| Date | March 6, 2026 |
| * | Print the name and title of each signing officer under his or her signature. |