Accents 1 2 3 4 5 6 Hyperlink Followed Hyperlink INNIO Green (Darker for text ) INNIO Red INNIO Yellow INNIO Cyan Text Background 31 31 39 230 231 234 36 219 130 0 49 166 77 130 255 110 38 154 201 153 230 132 132 158 140 87 255 81 2 255 27 164 98 211 32 8 255 241 92 0 181 213 October 27, 2026 Third Quarter 2026 Results
Q3 2026 Results – Today’s Agenda 2 Business & Market Update Financial Discussion 01 02
© 2026 INNIO. All rights reserved 3 Disclaimer Forward - Looking Statements This presentation includes forward - looking statements within the meaning of the safe harbor provisions of the Private Securities Litigation Reform Act of 1995 . All statements other than statements of historical fact contained in this presentation, including statements regarding our future results of operations and financial position, industry dynamics, business strategy and plans, our objectives for future operations, our engines' long - term performance, industry expectations for gas prices, the expected growth and future performance of our Services segment, our capacity expansion, scale and future production capacity, and our expectations for our future revenue, leverage, demand, equipment margin, backlog, Adjusted EBITDA and Adjusted EBITDA Margin, are forward - looking statements . In some cases, you can identify forward - looking statements by terms such as “may,” “will,” “should,” “aim,” “expect,” “plan,” “anticipate,” “could,” “intend,” “target,” “project,” “contemplate,” “believe,” “estimate,” “predict,” “potential” or “continue” or the negative of these words or other similar terms or expressions that are intended to identify forward - looking statements . These forward - looking statements involve known and unknown risks, uncertainties, changes in circumstances that are difficult to predict and other important factors that may cause our actual results, performance or achievements to be materially different from any future results, performance or achievements expressed or implied by the forward - looking statement including, but not limited to: changes in macroeconomic and market conditions and market volatility, including risk of recession, inflation, supply chain constraints or disruptions, interest rates, the value of securities and other financial assets, oil, natural gas and other commodity prices and exchange rates, and the impact of such changes and volatility on our business operations, financial results and financial position ; global economic trends, competition and geopolitical risks, including impacts from the ongoing geopolitical conflicts (such as the Iran conflict, Russia - Ukraine conflict, ongoing tensions between the United States and China and China and Taiwan), demand or supply shocks from events such as a major terrorist attack, natural disasters or actual or threatened public health pandemics or other emergencies, or an escalation of sanctions, tariffs or other trade tensions, and related impacts on our supply chains and strategies ; our ability to successfully execute our business and growth strategy ; our future financial performance, including our expectations regarding the performance of our Services segment, our revenue, operating expenses and ability to remain profitable ; economic and industry trends, projected growth, or trend analysis, particularly as it relates to AI ; our ability to develop and introduce new technologies to meet market demand and evolving customer needs, which depends on many factors, including the ability to obtain any required permits, licenses, and registrations ; our ability to attract and retain highly qualified personnel ; our expectations concerning relationships with our channel partners and distribution network ; our ability to manage and predict our backlog ; actual or perceived quality issues or safety failures related to our complex and specialized products, solutions and services ; significant disruptions in our supply chain, including the high cost or unavailability of raw materials, components, and products essential to our business, and significant disruptions to our manufacturing and production facilities and distribution networks ; our ability to obtain, maintain, protect, and effectively enforce our intellectual property rights ; our capital allocation plans, including the timing and amount of dividends ; shifts in market and other dynamics related to electrification, decarbonization or sustainability ; the amount and timing of our cash flows and earnings, which may be impacted by macroeconomic, customer, supplier, competitive, contractual and other dynamics and conditions ; actions by our joint venture arrangements and similar collaborations with third parties for certain projects that result in additional costs and obligations ; any reductions or modifications to, or the elimination of, governmental incentives or policies that support renewable energy and energy transition innovation and technology ; our ability to stay in compliance with laws and regulations that currently apply or may become applicable to our business both in the United States and internationally and changes in law, regulation or policy that may affect our businesses ; our ability to maintain the security and availability of our platform and protect against data breaches and other security incidents ; our ability and challenges to our operations as a public company, including the increased expenses associated with being a public company, or achieve some or all of the benefits we expect to achieve ; the risk of significant volatility in our share price ; our ability to retain tax residency in Germany ; our ability to remediate the material weaknesses we identified in our internal control over financial reporting or prevent material weaknesses in the future ; and other statements regarding our future operations, financial condition, and prospects and business strategies . In light of these risks, uncertainties and assumptions, the forward - looking events and circumstances discussed in this presentation may not occur and actual results could differ materially and adversely from those anticipated or implied in the forward - looking statements . We caution you therefore against relying on these forward - looking statements, and we qualify all of our forward - looking statements by these cautionary statements . For additional information on other potential risks and uncertainties that could cause actual results to differ from expected results, please refer to our filings with the Securities and Exchange Commission . The forward - looking statements included in this presentation are made only as of the date hereof . The Company undertakes no obligation to update any forward - looking statements for any reason after the date of this presentation to conform these statements to actual results or to changes in our expectations, except as may be required by law . Financial Information and Non - GAAP Measures We report under accounting principles generally accepted in the United States (“U .S . GAAP”) . We maintain our financial books and records and publish our consolidated financial statements in U.S . dollars, which is our reporting currency . This presentation also contains certain supplemental financial measures that are not calculated under U.S . GAAP, including but not limited to Adjusted EBITDA, Adjusted EBITDA Margin , Adjusted SG&A, Adjusted Net Income, Diluted Adjusted EPS, Adjusted EBITDA - Capex, Free Cashflow, Free Cashflow Conversion and Cash Conversion . These non - GAAP financial measures are in addition to, and not as a substitute for or superior to, measures of financial performance prepared in accordance with GAAP . There are a number of limitations related to the use of these non - GAAP financial measures versus their nearest GAAP equivalents . For example, other companies may calculate non - GAAP financial measures differently or may use other measures to evaluate their performance, all of which could reduce the usefulness of our non - GAAP financial measures as tools for comparison . Furthermore, the non - GAAP financial measures presented herein may not be presented in our future SEC filings . See the Appendix to this presentation for the definition and reconciliation of each such non - GAAP financial measure to its most directly comparable GAAP measure . Certain columns and rows in this presentation may not add due to the use of rounded numbers .
Accents 1 2 3 4 5 6 Hyperlink Followed Hyperlink INNIO Green (Darker for text ) INNIO Red INNIO Yellow INNIO Cyan Text Background 31 31 39 230 231 234 36 219 130 0 49 166 77 130 255 110 38 154 201 153 230 132 132 158 140 87 255 81 2 255 27 164 98 211 32 8 255 241 92 0 181 213 4 01 Business & Market Update
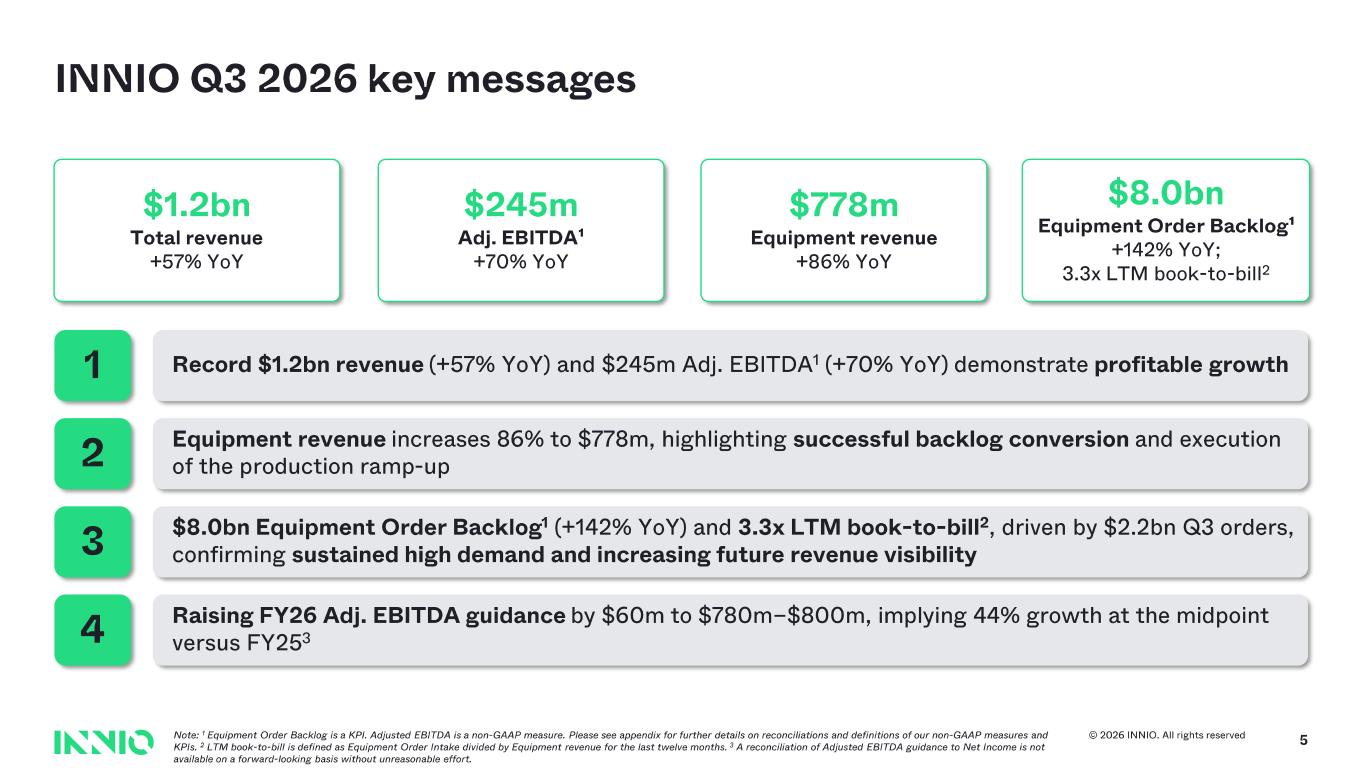
© 2026 INNIO. All rights reserved 5 INNIO Q3 2026 key messages 1 Record $1.2bn revenue (+57% YoY) and $245m Adj. EBITDA 1 (+70% YoY) demonstrate profitable growth $8.0bn Equipment Order Backlog 1 (+142% YoY) and 3.3x LTM book - to - bill 2, driven by $2.2bn Q3 orders, confirming sustained high demand and increasing future revenue visibility Equipment revenue increases 86% to $778m, highlighting successful backlog conversion and execution of the production ramp - up2 3 4 Raising FY26 Adj. EBITDA guidance by $60m to $780m – $800m, implying 44% growth at the midpoint versus FY25 3 Note: 1 Equipment Order Backlog is a KPI. Adjusted EBITDA is a non - GAAP measure. Please see appendix for further details on reconciliati ons and definitions of our non - GAAP measures and KPIs. 2 LTM book - to- bill is defined as Equipment Order Intake divided by Equipment revenue for the last twelve months. 3 A reconciliation of Adjusted EBITDA guidance to Net Income is not available on a forward - looking basis without unreasonable effort. $8.0bn Equipment Order Backlog¹ +142% YoY; 3.3x LTM book - to-bill 2 $778m Equipment revenue +86% YoY $1.2bn Total revenue +57% YoY $245m Adj. EBITDA¹ +70% YoY
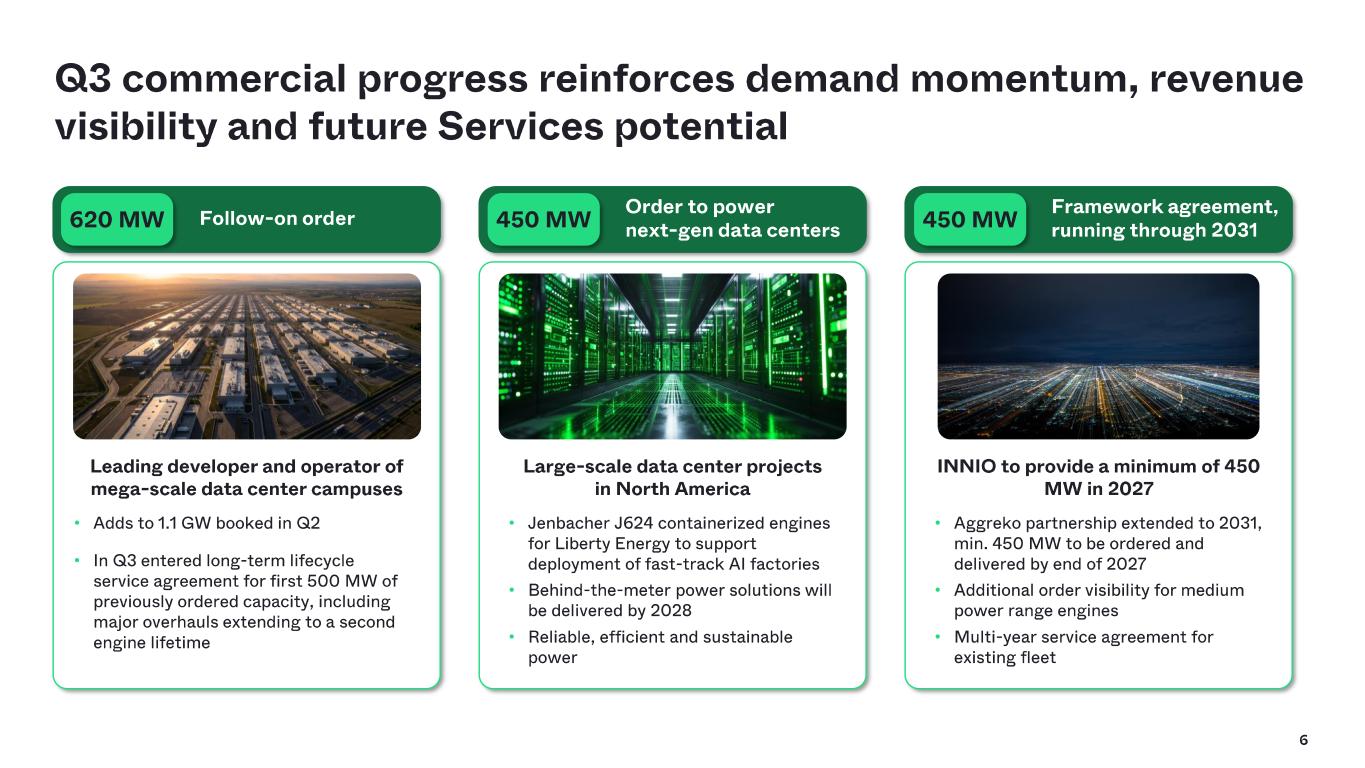
6 Q3 commercial progress reinforces demand momentum, revenue visibility and future Services potential Follow - on Order Leading developer and operator of mega - scale data center campuses • Adds to 1.1 GW booked in Q2 • In Q3 entered long - term lifecycle service agreement for first 500 MW of previously ordered capacity, including major overhauls extending to a second engine lifetime - on order620 MW INNIO to provide a minimum of 450 MW in 2027 • Aggreko partnership extended to 2031, min. 450 MW to be ordered and delivered by end of 2027 • Additional order visibility for medium power range engines • Multi - year service agreement for existing fleet Framework agreement, running through 2031 Large - scale data center projects in North America • Jenbacher J624 containerized engines for Liberty Energy to support deployment of fast - track AI factories • Behind - the - meter power solutions will be delivered by 2028 • Reliable, efficient and sustainable power Order to power next - gen data centers 450 MW 450 MW
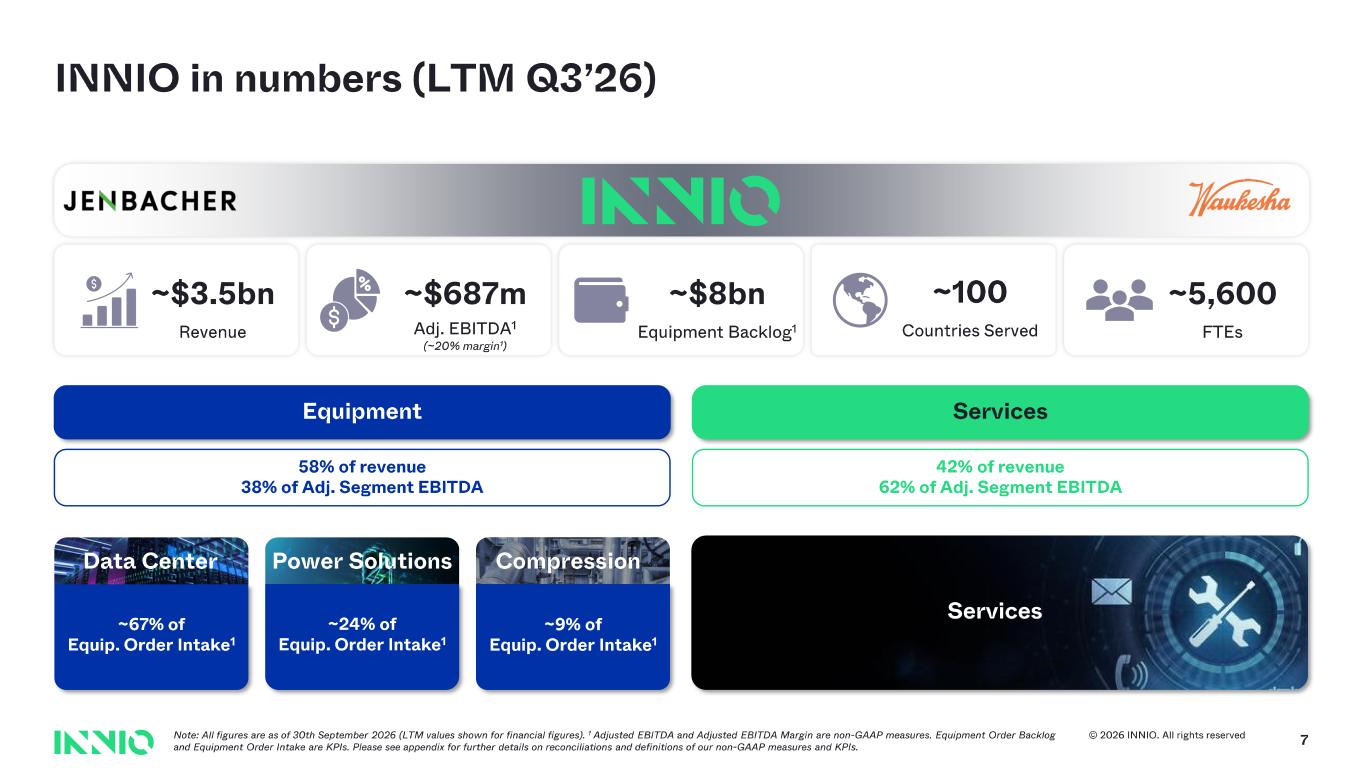
© 2026 INNIO. All rights reserved 7 INNIO in numbers (LTM Q3’26) Note: All figures are as of 30th September 2026 (LTM values shown for financial figures). 1 Adjusted EBITDA and Adjusted EBITDA Margin are non - GAAP measures. Equipment Order Backlog and Equipment Order Intake are KPIs. Please see appendix for further details on reconciliations and definitions of our non - GAAP measures and KPIs. ~$3.5bn Revenue ~$68 7m Adj. EBITDA 1 (~20% margin 1) ~$8bn Equipment Backlog 1 ~100 Countries Served ~ 5,600 FTEs ~67% of Equip. Order Intake 1 Data Center ~2 4 % of Equip. Order Intake 1 ~9% of Equip. Order Intake 1 Power Solutions Compression Services Equipment Services 58% of revenue 38% of Adj. Segment EBITDA 42% of revenue 62% of Adj. Segment EBITDA
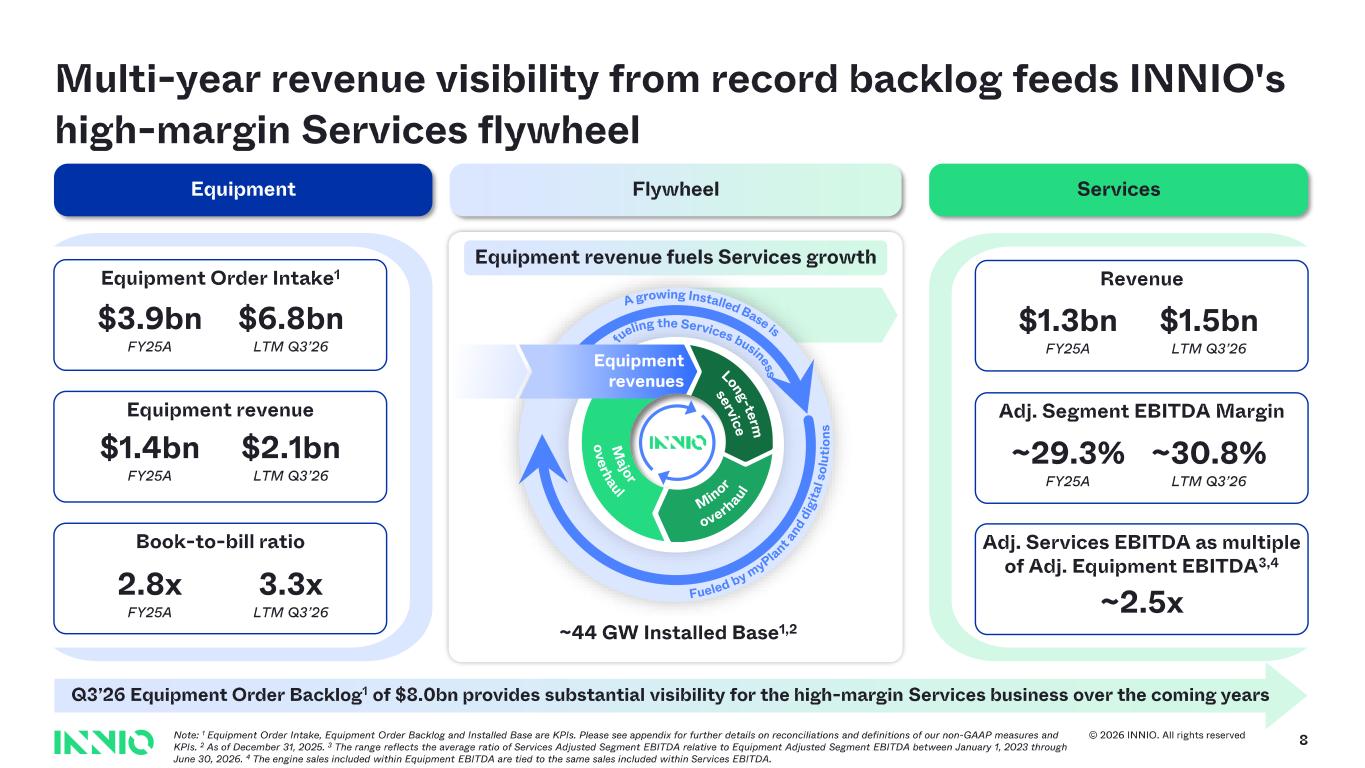
© 2026 INNIO. All rights reserved 8 Multi - year revenue visibility from record backlog feeds INNIO's high - margin Services flywheel A growing Installed Base is fu eling the Services business Fueled by myPla nt an d d ig it a l s o lu ti o n s Equipment revenues Long -te rm servic e M in or overh au l M a jo r o v e rh aul Equipment revenue fuels Services growth Equipment ServicesFlywheel Revenue Adj. Segment EBITDA Margin Equipment Order Intake 1 Equipment revenue Book - to - bill ratio Adj. Services EBITDA as multiple of Adj. Equipment EBITDA 3,4 ~44 GW Installed Base 1,2 $6.8bn LTM Q3’26 $ 3.9 bn FY25A $ 2.1bn LTM Q3’26 $ 1.4bn FY25A 3.3x LTM Q3’26 2.8x FY25A $1.5bn LTM Q3’26 $ 1.3bn FY25A ~30.8% LTM Q3’26 ~29.3% FY25A ~2.5x Note: 1 Equipment Order Intake, Equipment Order Backlog and Installed Base are KPIs. Please see appendix for further details on recon ci liations and definitions of our non - GAAP measures and KPIs. 2 As of December 31, 2025. 3 The range reflects the average ratio of Services Adjusted Segment EBITDA relative to Equipment Adjusted Segment EBITDA betwee n January 1, 2023 through June 30, 2026. 4 The engine sales included within Equipment EBITDA are tied to the same sales included within Services EBITDA. Q3’26 Equipment Order Backlog 1 of $8.0bn provides substantial visibility for the high - margin Services business over the coming years
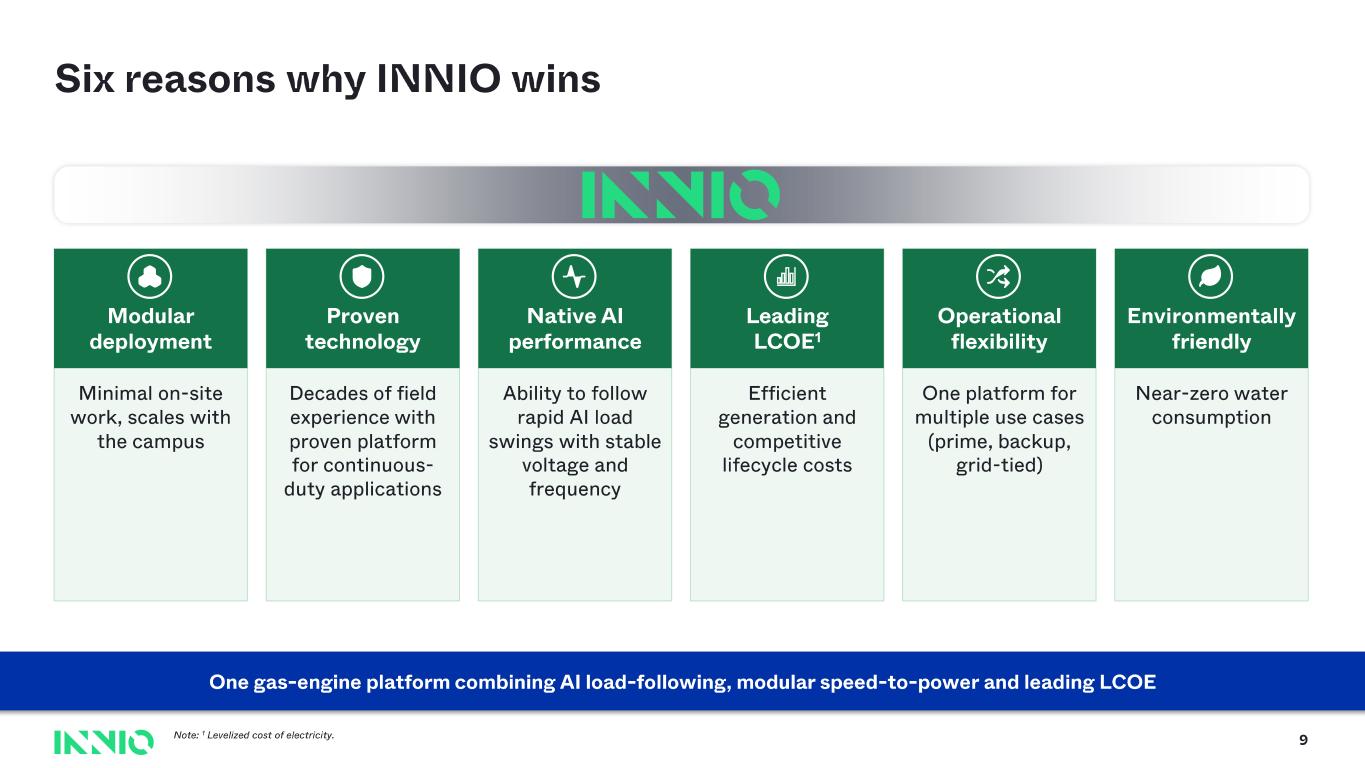
Six reasons why INNIO wins 9 Modular deployment Minimal on - site work, scales with the campus Proven technology Decades of field experience with proven platform for continuous - duty applications Native AI performance Ability to follow rapid AI load swings with stable voltage and frequency Leading LCOE 1 Efficient generation and competitive lifecycle costs Operational flexibility One platform for multiple use cases (prime, backup, grid - tied) Environmentally friendly Near - zero water consumption One gas - engine platform combining AI load - following, modular speed - to - power and leading LCOE Note: 1 Levelized cost of electricity.
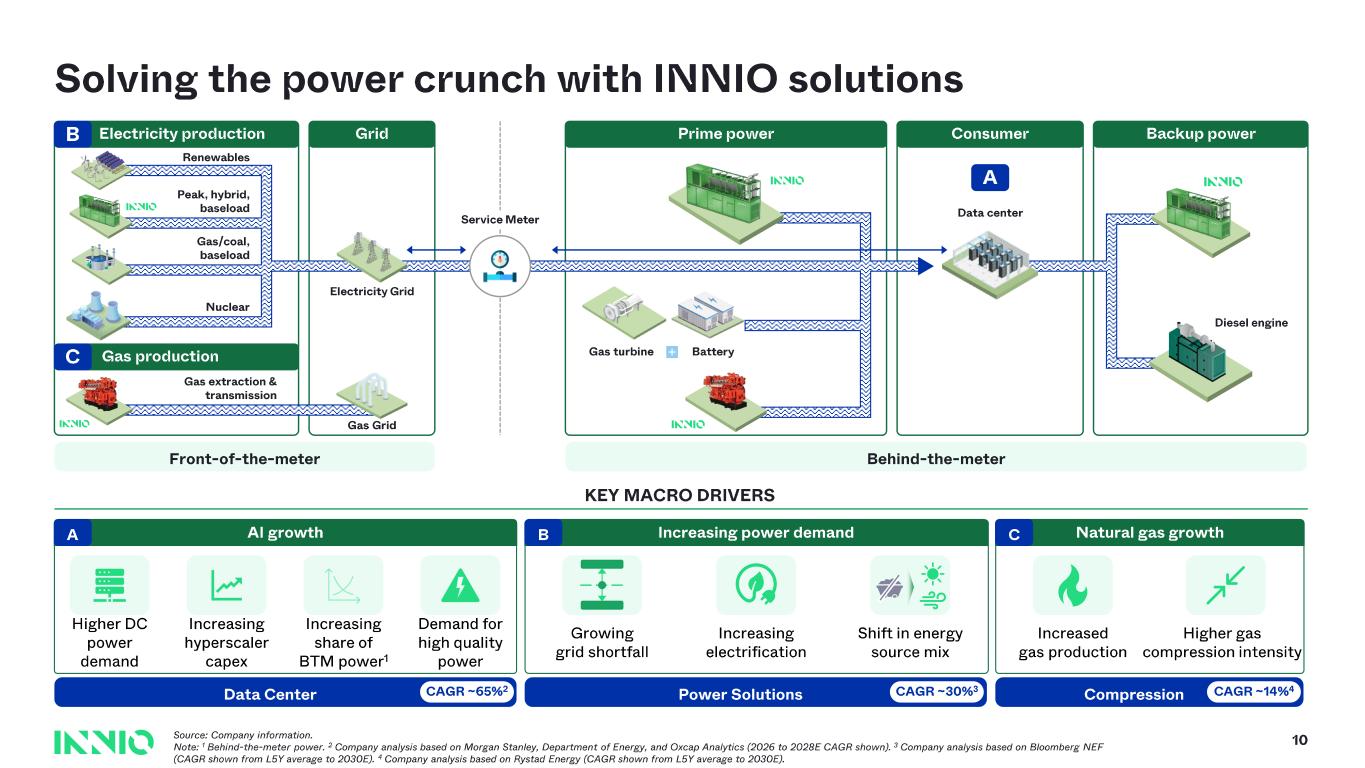
Electricity production Grid Prime power Consumer Backup power Gas productionC B Gas turbine Service Meter Electricity Grid Renewables Gas/coal, baseload Nuclear Peak, hybrid, baseload Gas extraction & transmission Gas Grid Diesel engine A Data center Solving the power crunch with INNIO solutions KEY MACRO DRIVERS Increasing power demand Growing grid shortfall Increasing electrification Shift in energy source mix B Natural gas growth Increased gas production Higher gas compression intensity CAI growthA Increasing hyperscaler capex Higher DC power demand Increasing share of BTM power 1 Demand for high quality power Battery Behind - the - meterFront - of - the - meter 10 Power Solutions CompressionData Center CAGR ~65% 2 CAGR ~30% 3 CAGR ~14% 4 Source: Company information. Note: 1 Behind - the - meter power. 2 Company analysis based on Morgan Stanley, Department of Energy, and Oxcap Analytics (2026 to 2028E CAGR shown). 3 Company analysis based on Bloomberg NEF (CAGR shown from L5Y average to 2030E). 4 Company analysis based on Rystad Energy (CAGR shown from L5Y average to 2030E).
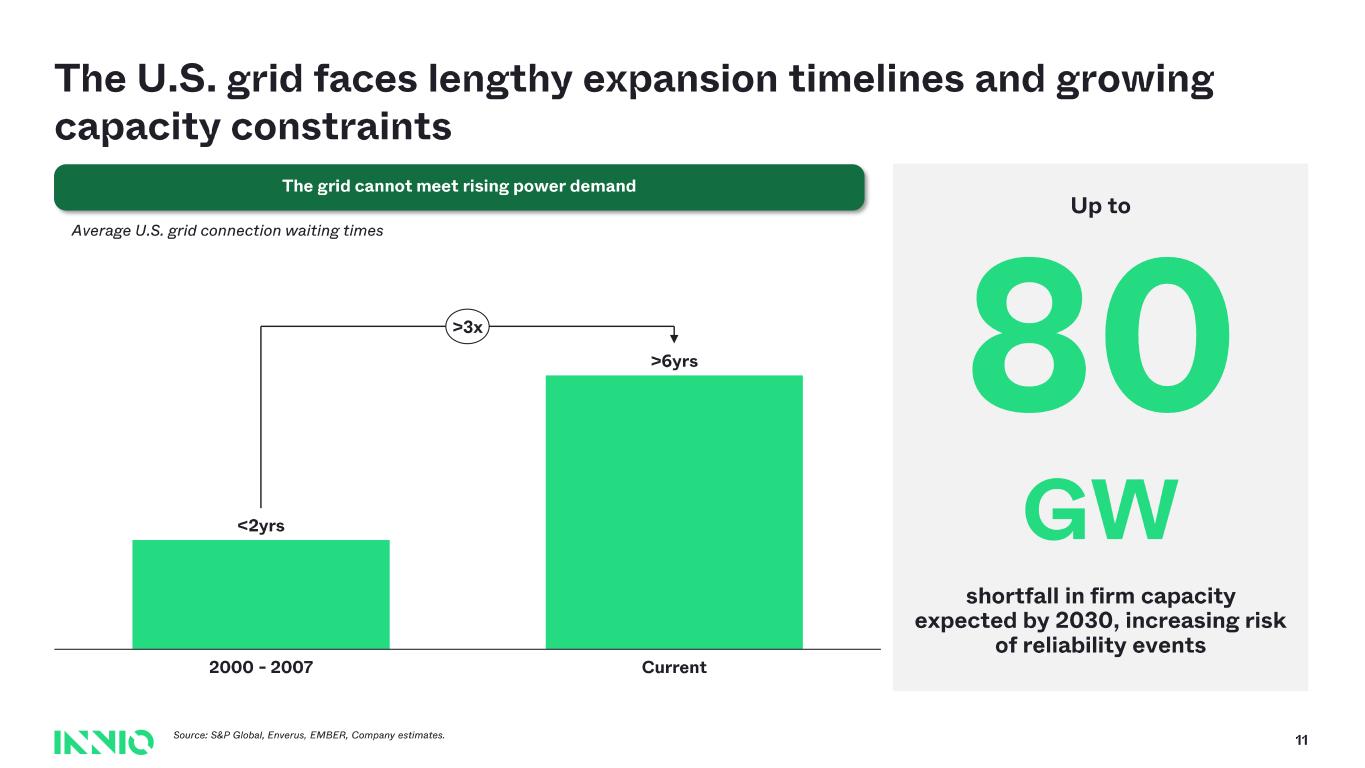
The U.S. grid faces lengthy expansion timelines and growing capacity constraints The grid cannot meet rising power demand Up to 80 GW shortfall in firm capacity expected by 2030, increasing risk of reliability events Average U.S. grid connection waiting times 2000 - 2007 Current < 2yrs >6yrs >3x Source: S&P Global, Enverus, EMBER, Company estimates. 11
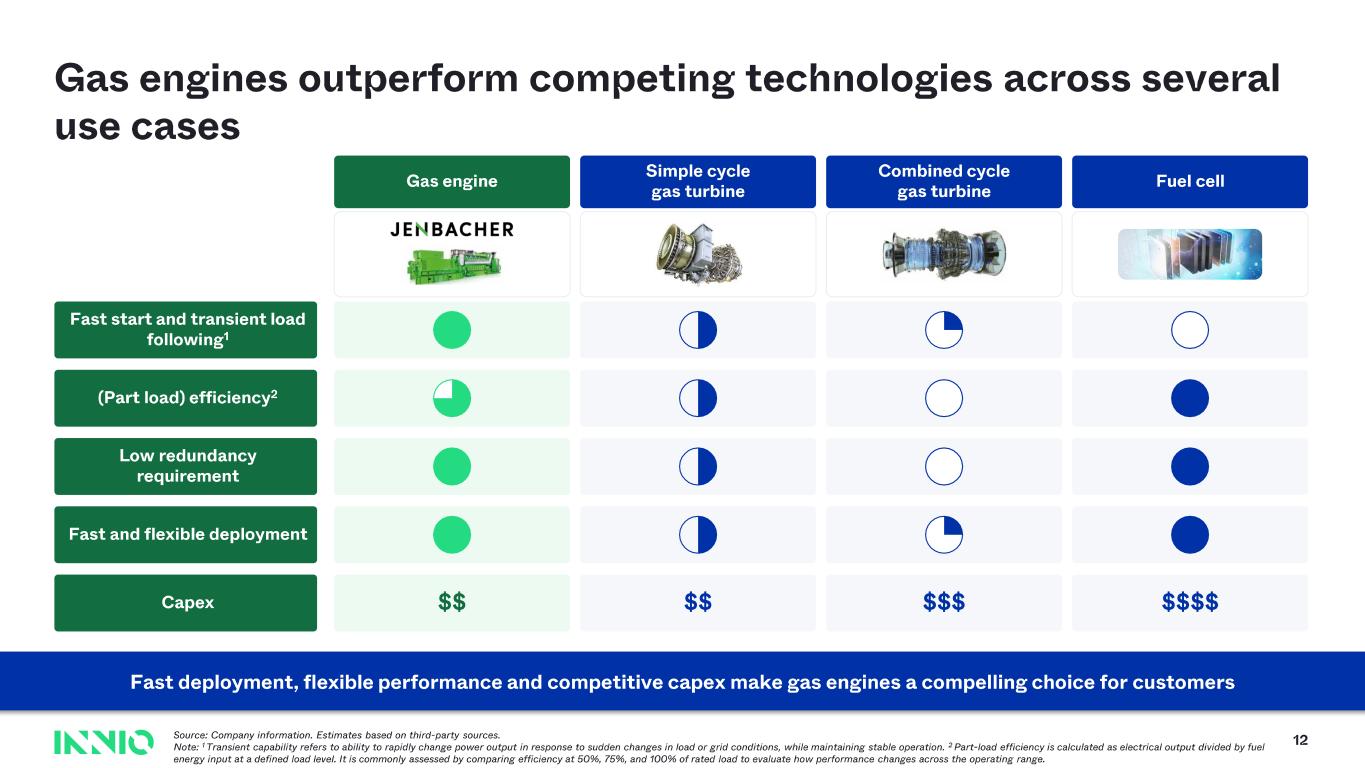
Gas engines outperform competing technologies across several use cases Gas engine Simple cycle gas turbine Combined cycle gas turbine Fuel cell Fast start and transient load following 1 (Part load) efficiency 2 Fast and flexible deployment $$$$$$$$$$$Capex 12 Low redundancy requirement Fast deployment, flexible performance and competitive capex make gas engines a compelling choice for customers Source: Company information. Estimates based on third - party sources. Note: 1 Transient capability refers to ability to rapidly change power output in response to sudden changes in load or grid condition s, while maintaining stable operation. 2 Part - load efficiency is calculated as electrical output divided by fuel energy input at a defined load level. It is commonly assessed by comparing efficiency at 50%, 75%, and 100% of rated load to eva luate how performance changes across the operating range.
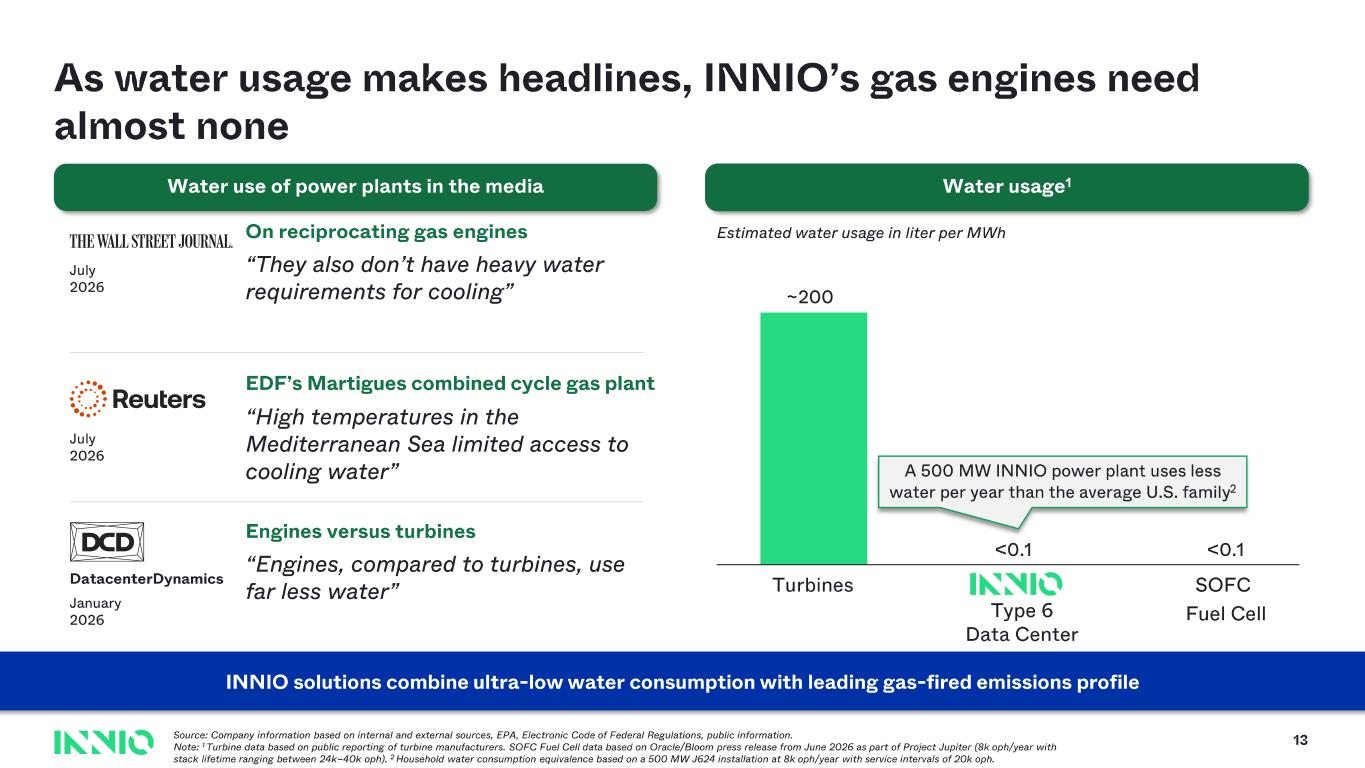
As water usage makes headlines, INNIO’s gas engines need almost none 13Source: Company information based on internal and external sources, EPA, Electronic Code of Federal Regulations, public infor mat ion. Note: 1 Turbine data based on public reporting of turbine manufacturers . SOFC Fuel Cell data based on Oracle/Bloom press release from June 2026 as part of Project Jupiter (8k oph /year with stack lifetime ranging between 24k – 40k oph ). 2 Household water consumption equivalence based on a 500 MW J624 installation at 8k oph /year with service intervals of 20k oph . Turbines SOFC Fuel Cell <0.1 ~200 <0.1 Water usage 1 Estimated water usage in liter per MWh INNIO solutions combine ultra - low water consumption with leading gas - fired emissions profile Type 6 Data Center Water use of power plants in the media A 500 MW INNIO power plant uses less water per year than the average U.S. family 2 July 2026 On reciprocating gas engines “They also don’t have heavy water requirements for cooling” July 2026 EDF’s Martigues combined cycle gas plant “H igh temperatures in the Mediterranean Sea limited access to cooling water” Data c enterDynamics January 2026 Engines versus turbines “E ngines, compared to turbines, use far less water”
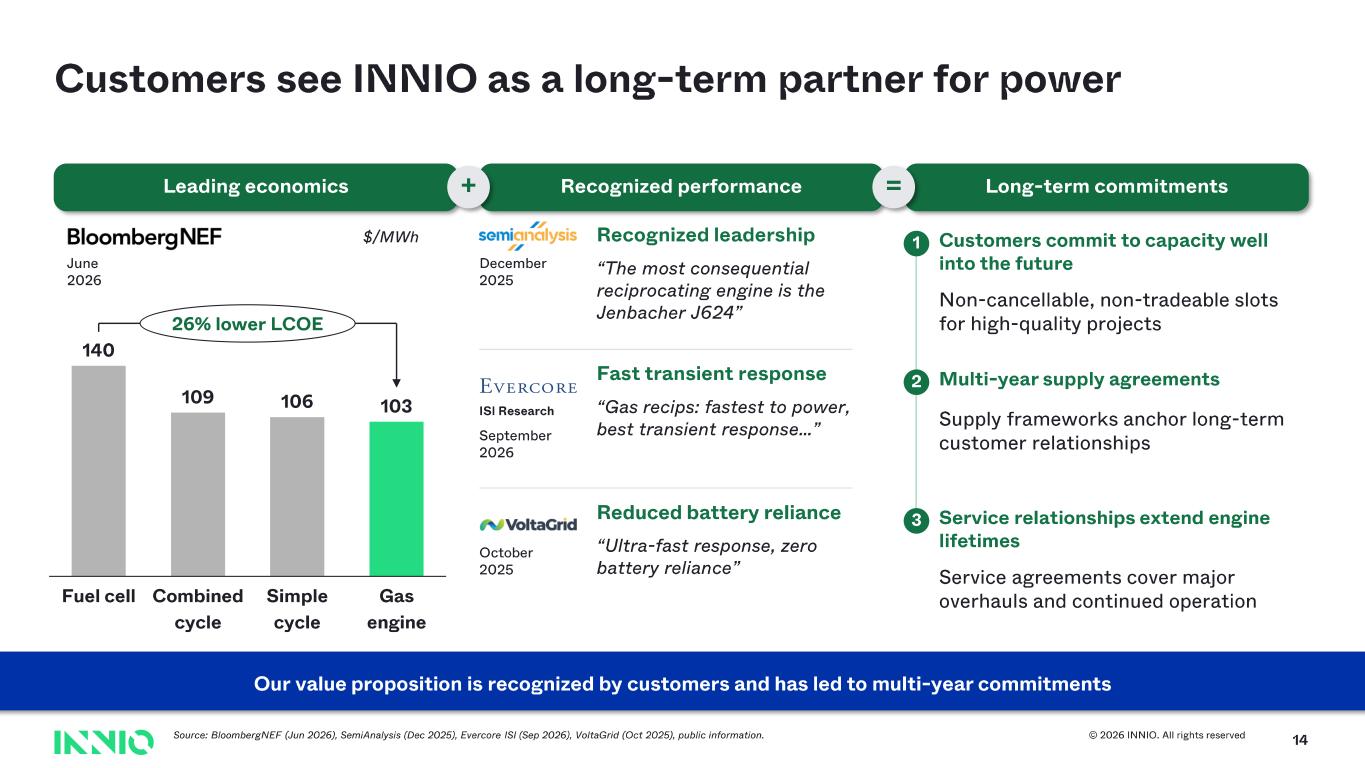
© 2026 INNIO. All rights reserved Customers see INNIO as a long - term partner for power Our value proposition is recognized by customers and has led to multi - year commitments 14 Leading economics Recognized performance Long - term commitments 1 Customers commit to capacity well into the future Non - cancellable, non - tradeable slots for high - quality projects 2 Multi - year supply agreements Supply frameworks anchor long - term customer relationships 3 Service relationships extend engine lifetimes Service agreements cover major overhauls and continued operation December 2025 Recognized leadership “The most consequential reciprocating engine is the Jenbacher J624” ISI Research September 2026 Fast transient response “Gas recips : fastest to power, best transient response…” October 2025 Reduced battery reliance “Ultra - fast response, zero battery reliance” Source: BloombergNEF (Jun 2026), SemiAnalysis (Dec 2025), Evercore ISI (Sep 2026), VoltaGrid (Oct 2025), public information. + = 140 109 106 103 Fuel cell Combined cycle Simple cycle Gas engine 26% lower LCOE $/MWh June 202 6
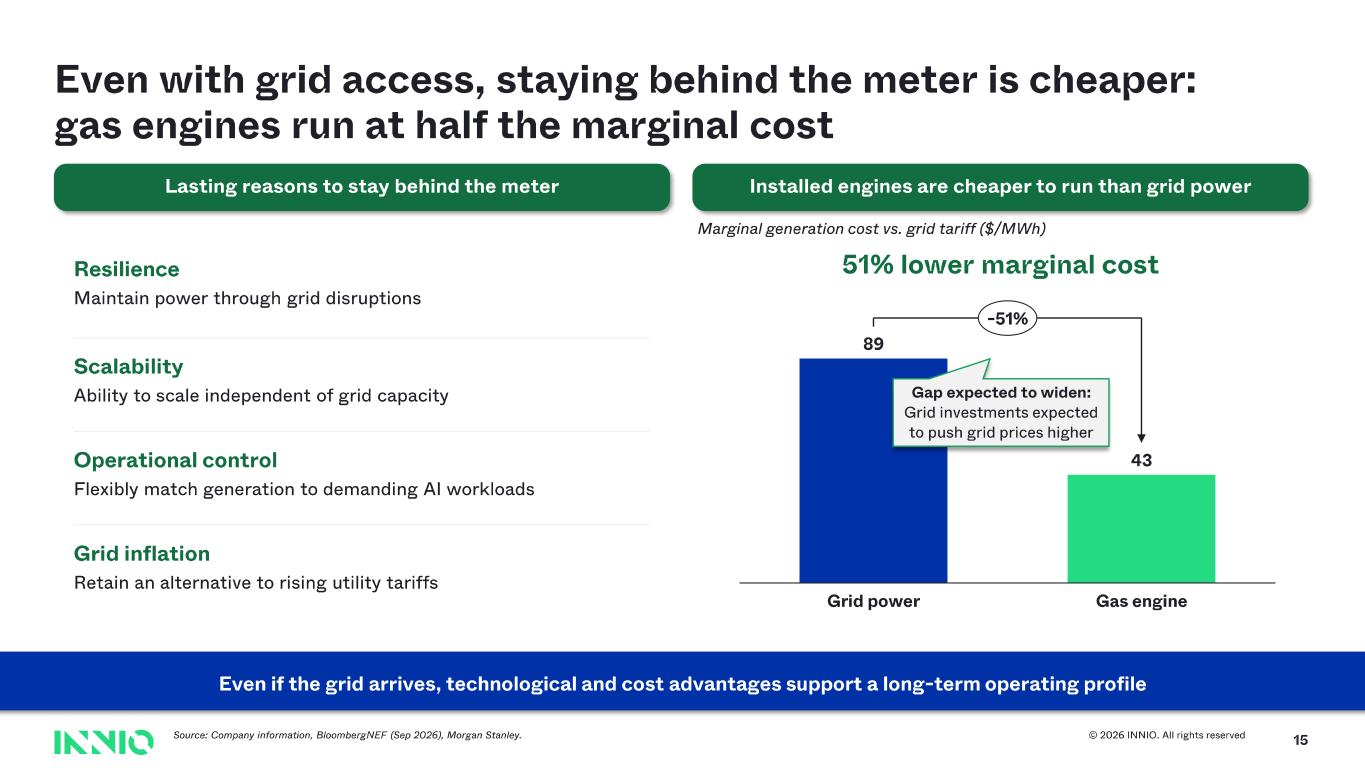
© 2026 INNIO. All rights reserved 15 Even with grid access, staying behind the meter is cheaper: gas engines run at half the marginal cost Lasting reasons to stay behind the meter Installed engines are cheaper to run than grid power Even if the grid arrives, technological and cost advantages support a long - term operating profile Source: Company information, BloombergNEF (Sep 2026), Morgan Stanley. Resilience Maintain power through grid disruptions Scalability Ability to scale independent of grid capacity Operational control Flexibly match generation to demanding AI workloads Grid inflation Retain an alternative to rising utility tariffs Marginal generation cost vs. grid tariff ($/MWh) 89 43 Grid power Gas engine - 51% 51% lower marginal cost Gap expected to widen: Grid investments expected to push grid prices higher
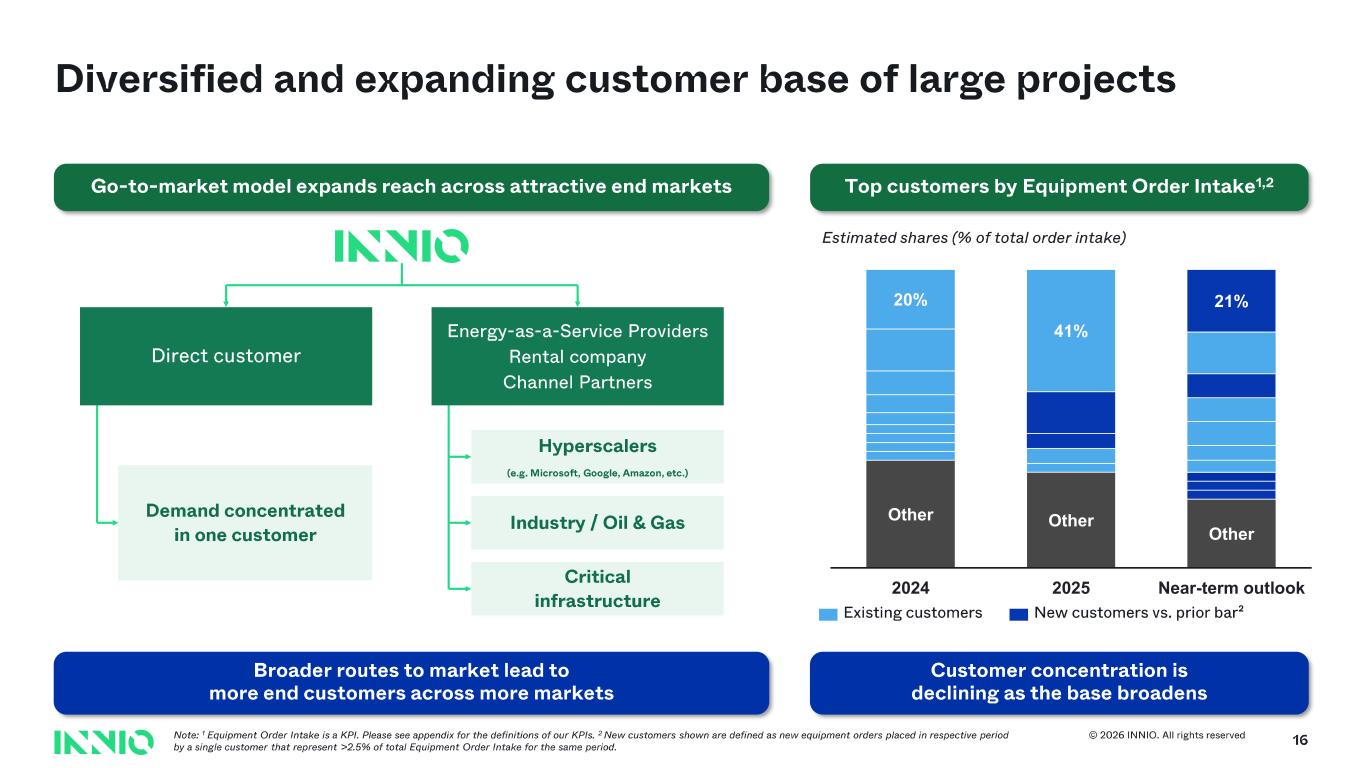
© 2026 INNIO. All rights reserved Diversified and expanding customer base of large projects Direct customer Energy - as - a- Service Providers Rental company Channel Partners Demand concentrated in one customer Industry / Oil & Gas Critical infrastructure Top customers by Equipment Order Intake 1,2Go - to - market model expands reach across attractive end markets Hyperscalers (e.g. Microsoft, Google, Amazon, etc.) Other Other Other 20% 41% 21% 2024 2025 Near-term outlook Estimated shares (% of total order intake) Existing customers New customers vs. prior bar² Note: 1 Equipment Order Intake is a KPI. Please see appendix for the definitions of our KPIs. 2 New customers shown are defined as new equipment orders placed in respective period by a single customer that represent >2.5% of total Equipment Order Intake for the same period. Broader routes to market lead to more end customers across more markets Customer concentration is declining as the base broadens 16
Accents 1 2 3 4 5 6 Hyperlink Followed Hyperlink INNIO Green (Darker for text ) INNIO Red INNIO Yellow INNIO Cyan Text Background 31 31 39 230 231 234 36 219 130 0 49 166 77 130 255 110 38 154 201 153 230 132 132 158 140 87 255 81 2 255 27 164 98 211 32 8 255 241 92 0 181 213 17 02 Financial Discussion
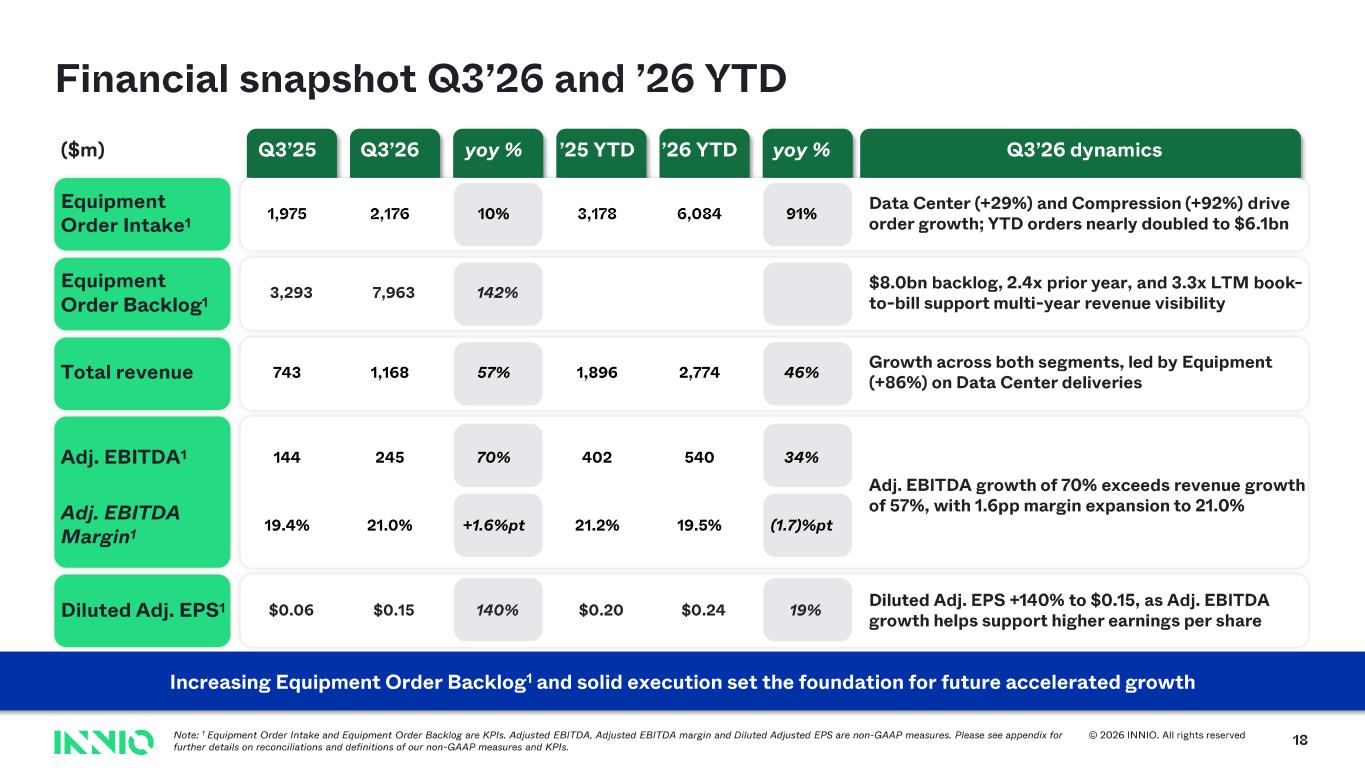
© 2026 INNIO. All rights reserved 18 Financial snapshot Q3’26 and ’26 YTD Increasing Equipment Order Backlog 1 and solid execution set the foundation for future accelerated growth Note: 1 Equipment Order Intake and Equipment Order Backlog are KPIs. Adjusted EBITDA, Adjusted EBITDA margin and Diluted Adjusted EPS are non - GAAP measures. Please see appendix for further details on reconciliations and definitions of our non - GAAP measures and KPIs. ($m) Q3’25 Q3’26 yoy % ’25 YTD ’26 YTD yoy % Q3’26 dynamics Equipment Order Intake 1 1,975 2,176 10% 3,178 6,084 91% Data Center (+29%) and Compression (+92%) drive order growth; YTD orders nearly doubled to $6.1bn Equipment Order Backlog 1 3,293 7,963 142% $8.0bn backlog, 2.4x prior year, and 3.3x LTM book - to - bill support multi - year revenue visibility Total revenue 743 1,168 57% 1,896 2,774 46% Growth across both segments, led by Equipment (+86%) on Data Center deliveries Adj. EBITDA 1 144 245 70% 402 540 34% Adj. EBITDA growth of 70% exceeds revenue growth of 57%, with 1.6pp margin expansion to 21.0%Adj. EBITDA Margin 1 19.4% 21.0% +1.6%pt 21.2% 19.5% (1.7)%pt Diluted Adj. EPS 1 $0.06 $0.15 140 % $0.20 $ 0.2 4 19 % Diluted Adj. EPS + 140 % to $0.15, as Adj. EBITDA growth helps support higher earnings per share
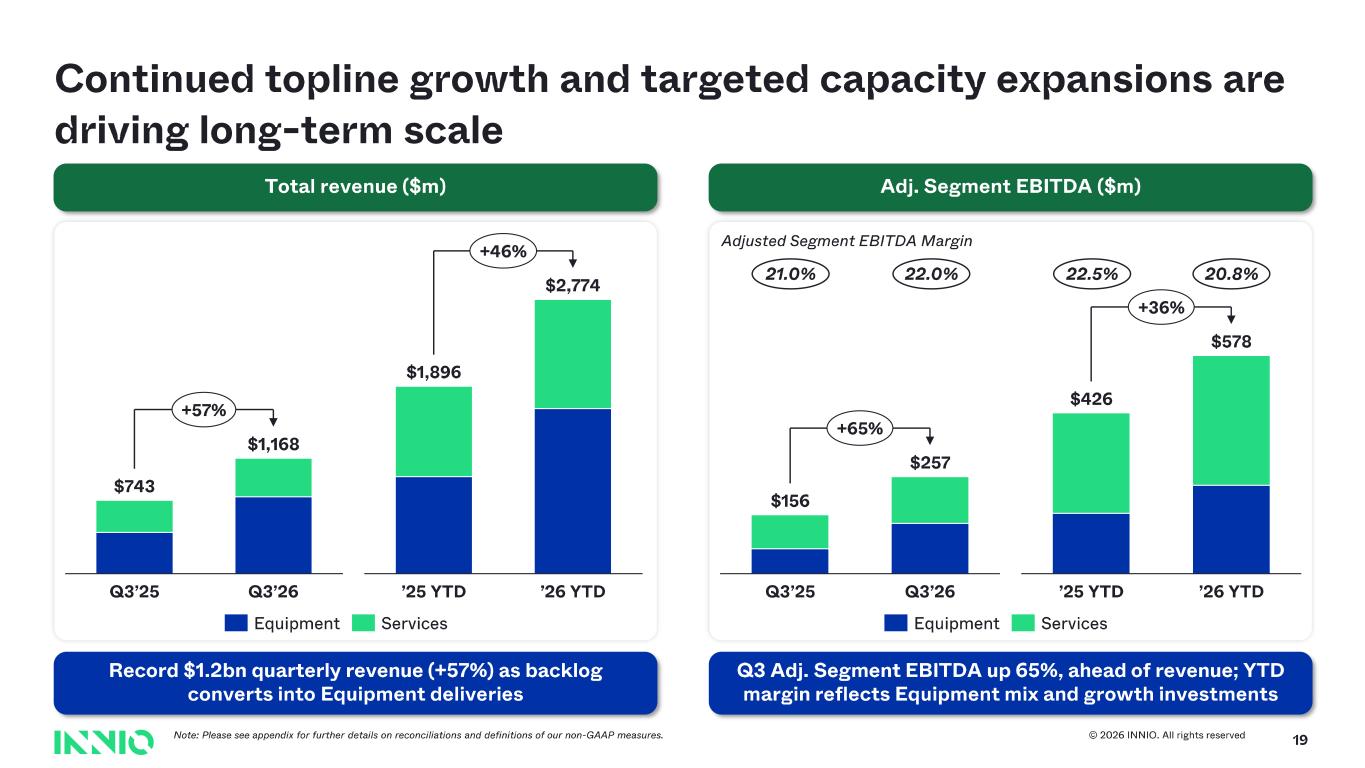
© 2026 INNIO. All rights reserved Adj. Segment EBITDA ($m)Total revenue ($m) 19 Continued topline growth and targeted capacity expansions are driving long - term scale Q3 Adj. Segment EBITDA up 65%, ahead of revenue; YTD margin reflects Equipment mix and growth investments Record $1.2bn quarterly revenue (+57%) as backlog converts into Equipment deliveries Q3’25 Q3’26 $743 $1,168 +57% 22.0% Adjusted Segment EBITDA Margin 21.0% 20.8%22.5% Q3’25 Q3’26 $156 $257 +65% Note: P lease see appendix for further details on reconciliations and definitions of our non - GAAP measures. ’25 YTD ’26 YTD $1,896 $2,774 +46% ’25 YTD ’26 YTD $426 $578 +36% Equipment ServicesEquipment Services
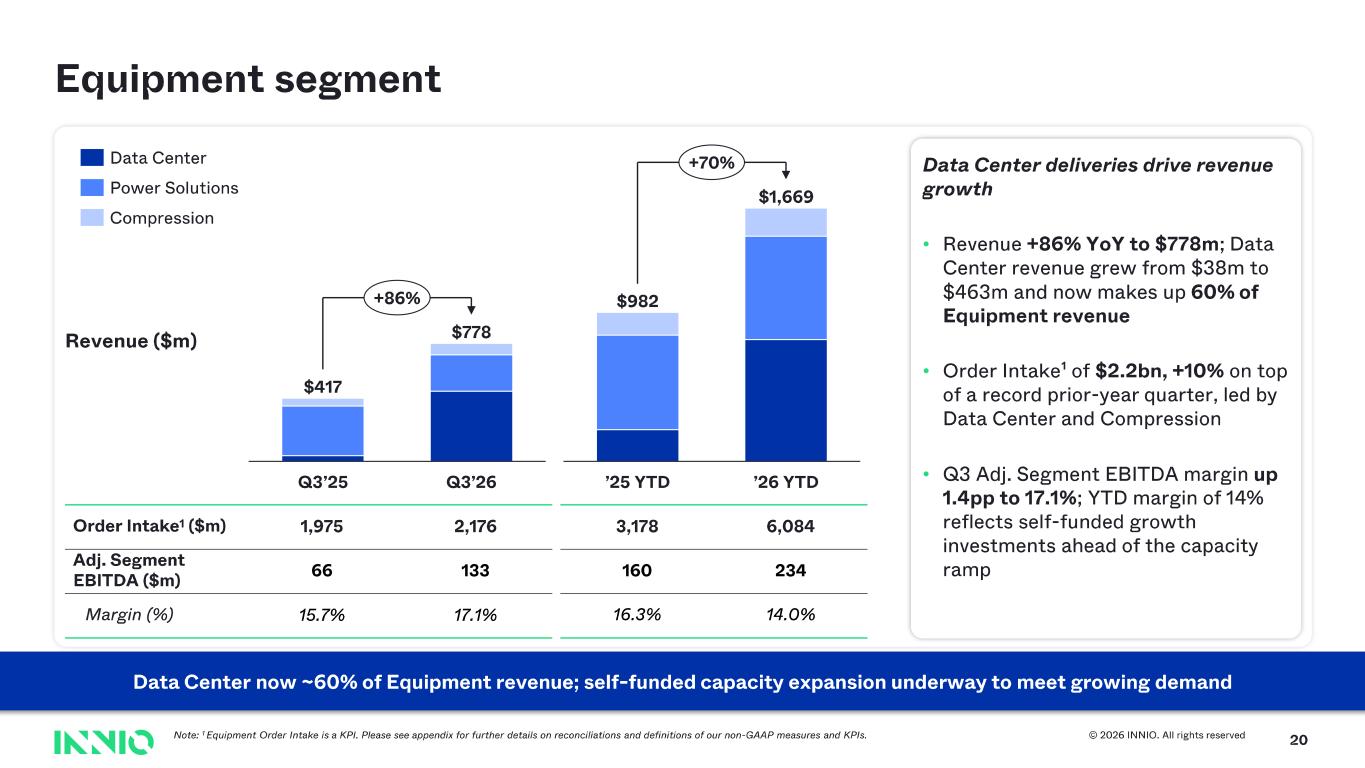
© 2026 INNIO. All rights reserved 20 Equipment segment Data Center deliveries drive revenue growth • Revenue +86% YoY to $778m ; Data Center revenue grew from $38m to $463m and now makes up 60% of Equipment revenue • Order Intake¹ of $2.2bn, +10% on top of a record prior - year quarter, led by Data Center and Compression • Q3 Adj. Segment EBITDA margin up 1.4pp to 17.1% ; YTD margin of 14% reflects self - funded growth investments ahead of the capacity ramp Order Intake 1 ($m) 1,975 2,176 3,178 6,084 Adj. Segment EBITDA ($m) 66 133 160 234 Margin (%) 15.7% 17.1% 16.3% 14.0% Note: 1 Equipment Order Intake is a KPI. Please see appendix for further details on reconciliations and definitions of our non - GAAP measures and KPIs. Data Center now ~60% of Equipment revenue; self - funded capacity expansion underway to meet growing demand Q3’25 Q3’26 $417 $778 +86% Revenue ($m) ’25 YTD ’26 YTD $982 $1,669 +70%Data Center Power Solutions Compression
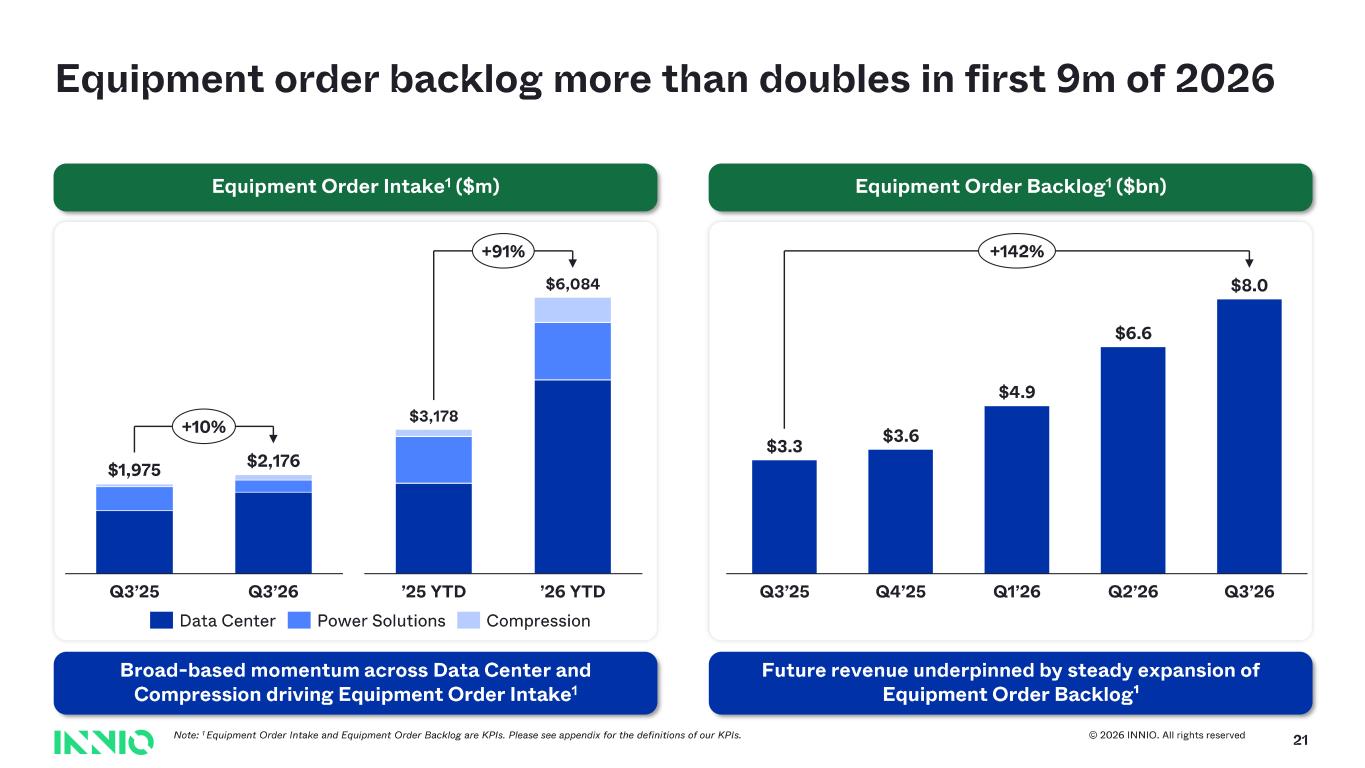
© 2026 INNIO. All rights reserved Equipment Order Backlog 1 ($bn) 21 Equipment order backlog more than doubles in first 9m of 2026 Equipment Order Intake 1 ($m) Future revenue underpinned by steady expansion of Equipment Order Backlog¹ Broad - based momentum across Data Center and Compression driving Equipment Order Intake 1 Q3’25 Q4’25 Q1’26 Q2’26 Q3’26 $3.3 $3.6 $4.9 $6.6 $8.0 +142% No te : 1 Equipment Order Intake and Equipment Order Backlog are KPIs. Please see appendix for the definitions of our KPIs. Q3’25 Q3’26 $1,975 $2,176 +10% ’25 YTD ’26 YTD $3,178 $6,084 +91% Data Center Power Solutions Compression
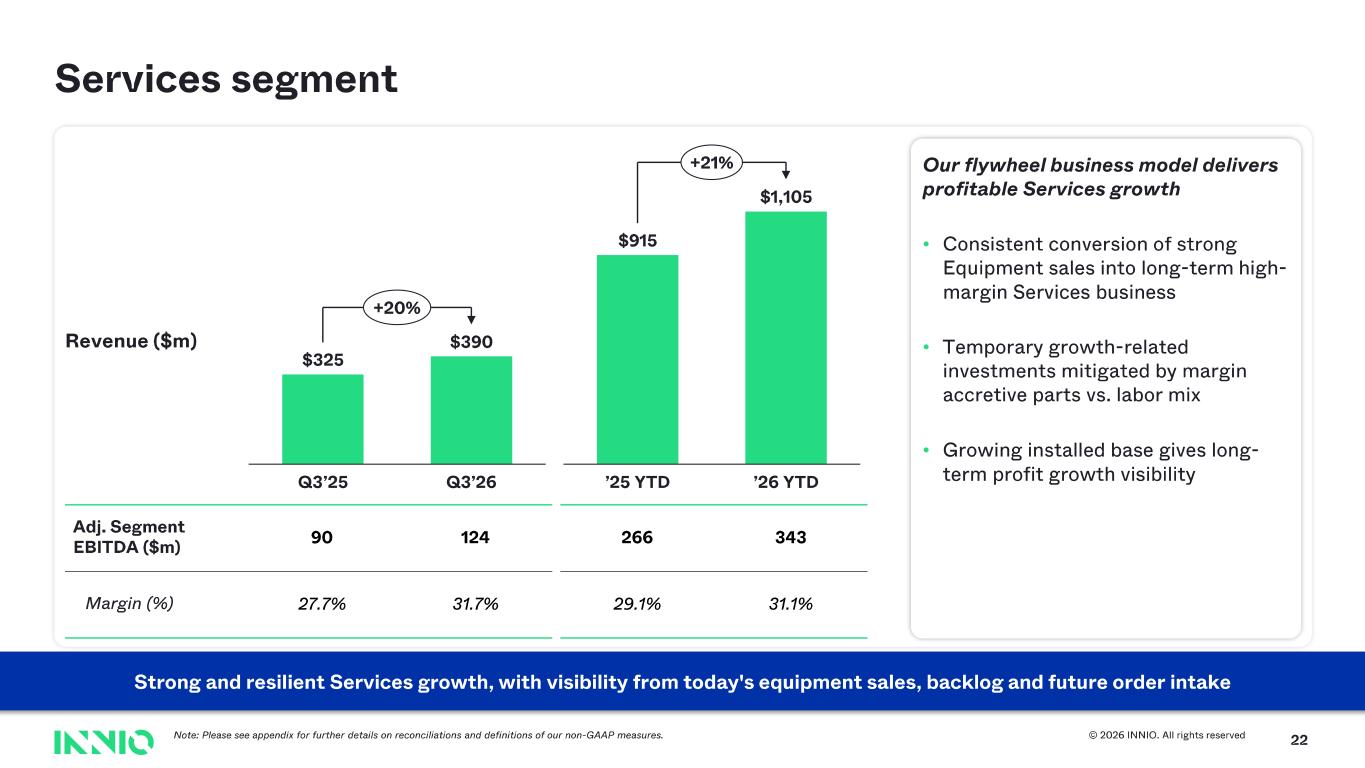
© 2026 INNIO. All rights reserved 22 Services segment Our flywheel business model delivers profitable Services growth • Consistent conversion of strong Equipment sales into long - term high - margin Services business • Temporary growth - related investments mitigated by margin accretive parts vs. labor mix • Growing installed base gives long - term profit growth visibility $325 $390 Q3’25 Q3’26 +20% Adj. Segment EBITDA ($m) 90 124 266 343 Margin (%) 27.7% 31.7% 29.1% 31.1% Revenue ($m) $915 ’25 YTD ’26 YTD $1,105 +21% Note: Please see appendix for further details on reconciliations and definitions of our non - GAAP measures. Strong and resilient Services growth, with visibility from today's equipment sales, backlog and future order intake
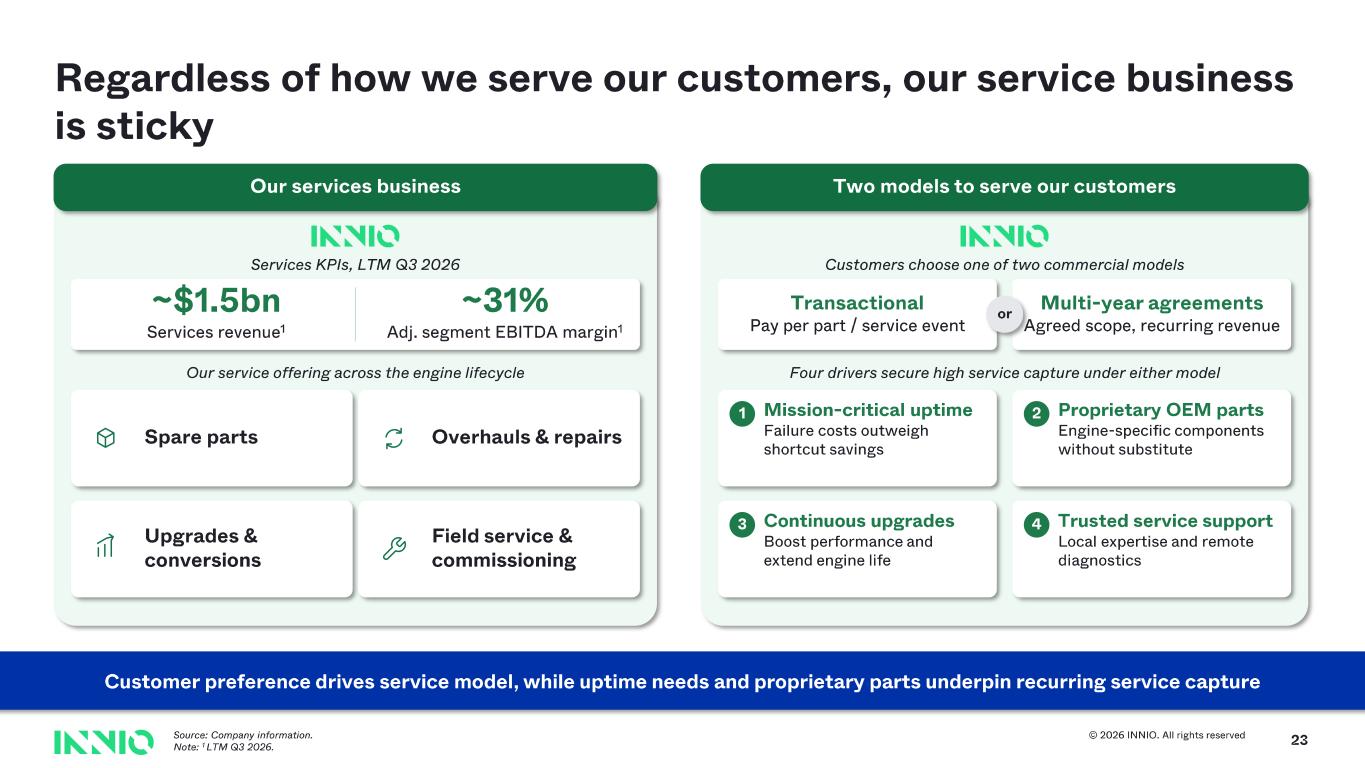
© 2026 INNIO. All rights reserved Our services business Two models to serve our customers ~$1.5bn Services revenue 1 ~31% Adj. segment EBITDA margin 1 Spare parts Overhauls & repairs Upgrades & conversions Field service & commissioning Transactional Pay per part / service event Multi - year agreements Agreed scope, recurring revenue Customer preference drives service model, while uptime needs and proprietary parts underpin recurring service capture Mission - critical uptime Failure costs outweigh shortcut savings Proprietary OEM parts Engine - specific components without substitute Continuous upgrades Boost performance and extend engine life Trusted service support Local expertise and remote diagnostics Regardless of how we serve our customers, our service business is sticky 23 1 2 3 4 Source: Company information. Note: 1 LTM Q3 2026. Services KPIs, LTM Q3 2026 Customers choose one of two commercial models or Our service offering across the engine lifecycle Four drivers secure high service capture under either model
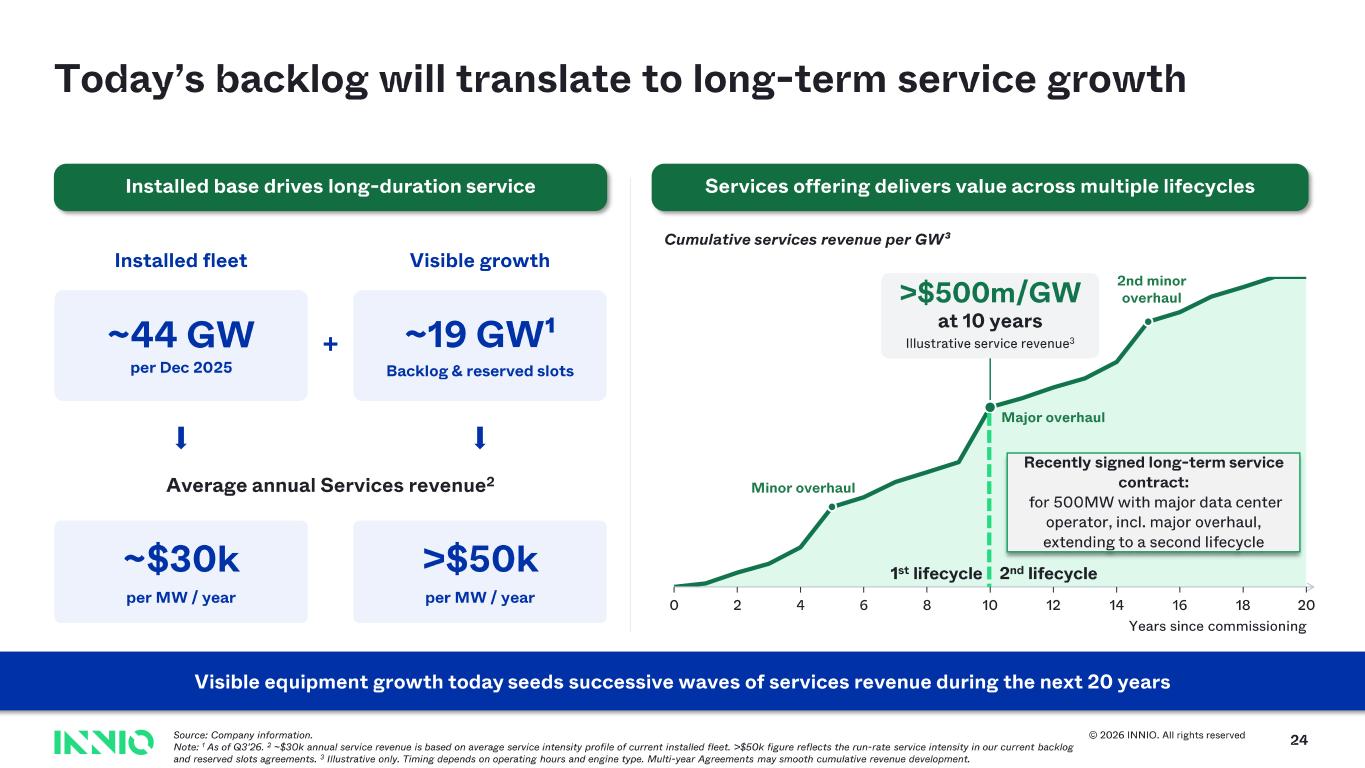
© 2026 INNIO. All rights reserved Installed base drives long - duration service Services offering delivers value across multiple lifecycles Installed fleet ~44 GW per Dec 2025 Visible growth ~19 GW¹ Backlog & reserved slots + Cumulative services revenue per GW³ >$500m/GW at 10 years Illustrative service revenue 3 Major overhaul Minor overhaul 2nd minor overhaul 0 2 4 6 8 10 12 14 16 18 20 Years since commissioning Visible equipment growth today seeds successive waves of services revenue during the next 20 years 24 1st lifecycle 2 nd lifecycle Recently signed long - term service contract: for 500MW with major data center operator, incl. major overhaul, extending to a second lifecycle Average annual Services revenue 2 ~$30k per MW / year >$50k per MW / year Today’s backlog will translate to long - term service growth Source: Company information. Note: 1 As of Q3’26. 2 ~$30k annual service revenue is based on average service intensity profile of current installed fleet. >$50k figure reflects th e run - rate service intensity in our current backlog and reserved slots agreements. 3 Illustrative only. Timing depends on operating hours and engine type. Multi - year Agreements may smooth cumulative revenue devel opment.
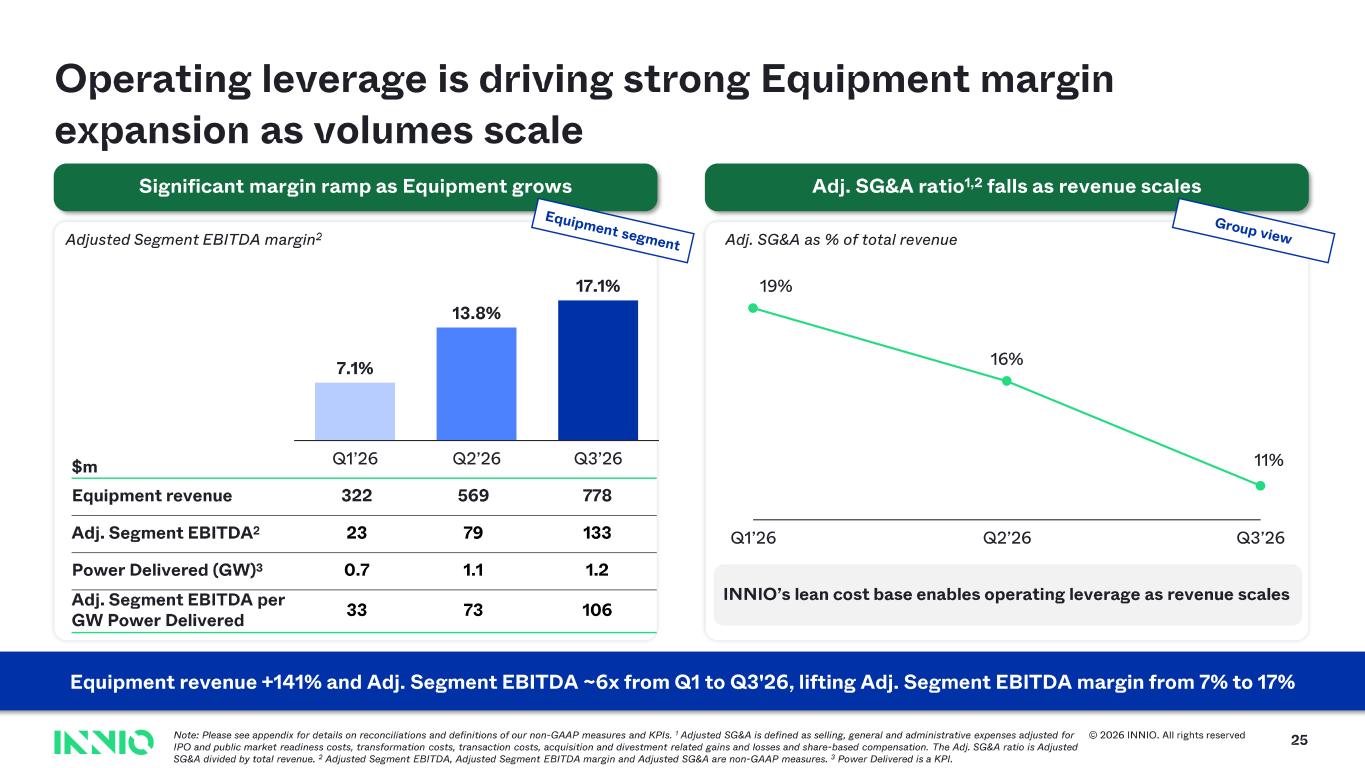
© 2026 INNIO. All rights reserved 25 Operating leverage is driving strong Equipment margin expansion as volumes scale Adj. SG&A ratio 1,2 falls as revenue scalesSignificant margin ramp as Equipment grows Adjusted Segment EBITDA margin 2 Adj. SG&A as % of total revenue Q1’26 Q2’26 Q3’26 7.1% 13.8% 17.1% Equipment revenue 322 569 778 Adj. Segment EBITDA 2 23 79 133 Power Delivered (GW) 3 0.7 1.1 1.2 Adj. Segment EBITDA per GW Power Delivered 33 73 106 Equipment revenue +141% and Adj. Segment EBITDA ~6x from Q1 to Q3'26, lifting Adj. Segment EBITDA margin from 7% to 17% INNIO’s lean cost base enables operating leverage as revenue scales $m 19% Q1’26 16% Q2’26 11% Q3’26 Note: Please see appendix for details on reconciliations and definitions of our non - GAAP measures and KPIs. 1 Adjusted SG&A is defined as selling, general and administrative expenses adjusted for IPO and public market readiness costs, transformation costs, transaction costs, acquisition and divestment related gains and los ses and share - based compensation. The Adj. SG&A ratio is Adjusted SG&A divided by total revenue. 2 Adjusted Segment EBITDA, Adjusted Segment EBITDA margin and Adjusted SG&A are non - GAAP measures. 3 Power Delivered is a KPI.
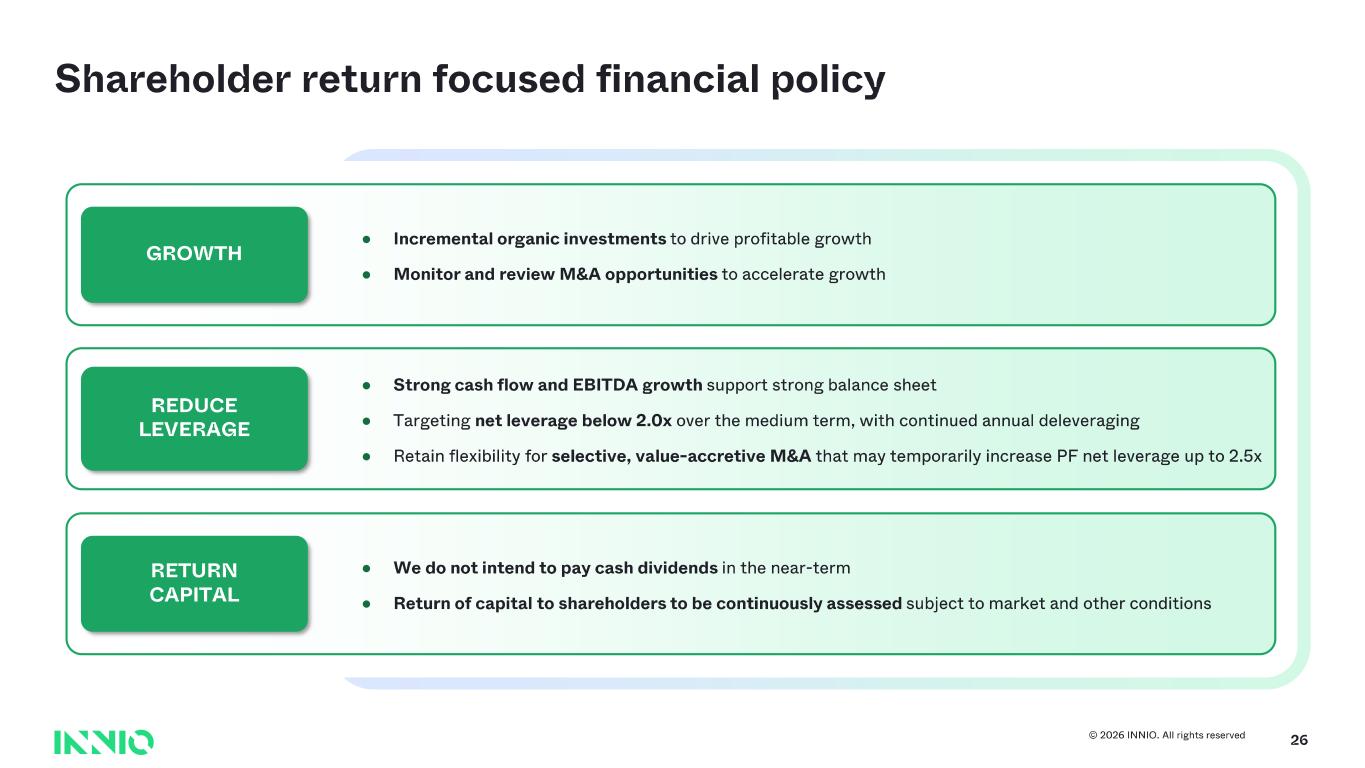
© 2026 INNIO. All rights reserved 26 Shareholder return focused financial policy ● We do not intend to pay cash dividends in the near - term ● Return of capital to shareholders to be continuously assessed subject to market and other conditions RETURN CAPITAL ● Strong cash flow and EBITDA growth support strong balance sheet ● Targeting net leverage below 2.0x over the medium term, with continued annual deleveraging ● Retain flexibility for selective, value - accretive M&A that may temporarily increase PF net leverage up to 2.5x REDUCE LEVERAGE ● Incremental organic investments to drive profitable growth ● Monitor and review M&A opportunities to accelerate growth GROWTH
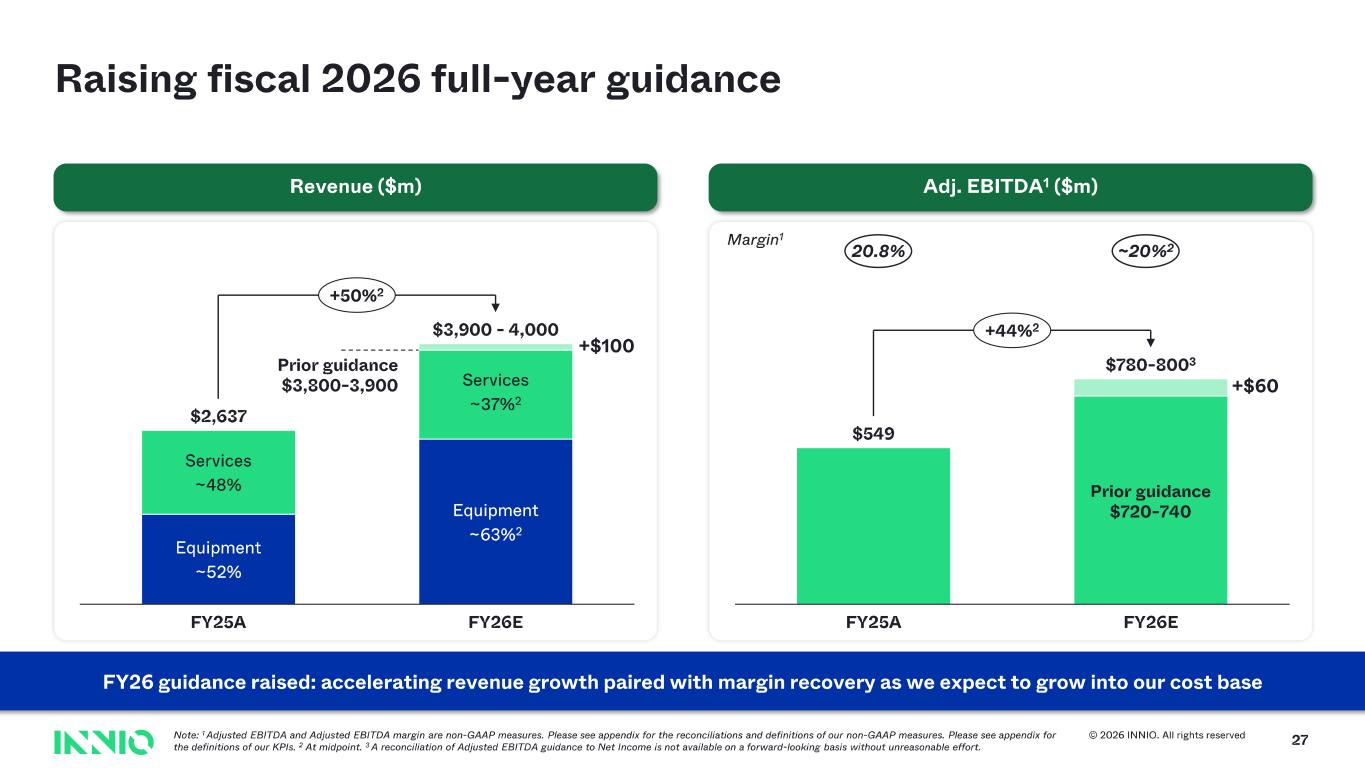
© 2026 INNIO. All rights reserved 27 Raising fiscal 2026 full - year guidance Revenue ($m) Equipment ~52% Services ~48% FY25 A Equipment ~63% 2 Services ~37% 2 FY26 E $ 2,637 $3,900 - 4,000 +50% 2 Adj. EBITDA 1 ($m) FY25 A FY26 E $549 $780 - 800 3 +44% 2 FY26 guidance raised: accelerating revenue growth paired with margin recovery as we expect to grow into our cost base Note: 1 Adjusted EBITDA and Adjusted EBITDA margin are non - GAAP measures. Please see appendix for the reconciliations and definitions of our non - GAAP measures. Please see appendix for the definitions of our KPIs. 2 At midpoint. 3 A reconciliation of Adjusted EBITDA guidance to Net Income is not available on a forward - looking basis without unreasonable effo rt. Margin 1 20.8% ~20% 2 Prior guidance $720 - 740 +$60 Prior guidance $3,800 - 3,900 +$100

Accents 1 2 3 4 5 6 Hyperlink Followed Hyperlink INNIO Green (Darker for text ) INNIO Red INNIO Yellow INNIO Cyan Text Background 31 31 39 230 231 234 36 219 130 0 49 166 77 130 255 110 38 154 201 153 230 132 132 158 140 87 255 81 2 255 27 164 98 211 32 8 255 241 92 0 181 213 28 Q&A
Accents 1 2 3 4 5 6 Hyperlink Followed Hyperlink INNIO Green (Darker for text ) INNIO Red INNIO Yellow INNIO Cyan Text Background 31 31 39 230 231 234 36 219 130 0 49 166 77 130 255 110 38 154 201 153 230 132 132 158 140 87 255 81 2 255 27 164 98 211 32 8 255 241 92 0 181 213 Appendix 29
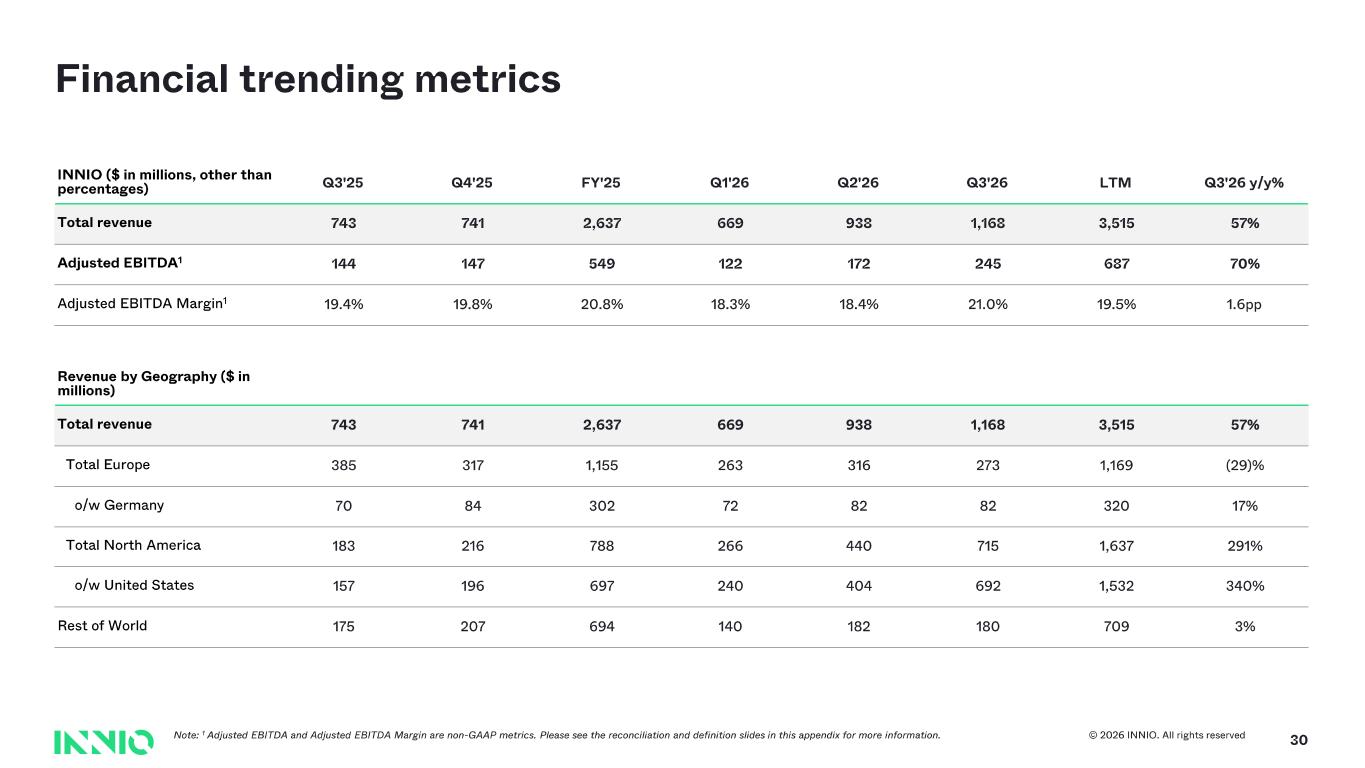
© 2026 INNIO. All rights reserved 30 Financial trending metrics Note: 1 Adjusted EBITDA and Adjusted EBITDA Margin are non - GAAP metrics. Please see the reconciliation and definition slides in this ap pendix for more information. INNIO ($ in millions, other than percentages) Q3'25 Q4'25 FY'25 Q1'26 Q2'26 Q3'26 LTM Q3'26 y/y% Total revenue 743 741 2,637 669 938 1,168 3,515 57% Adjusted EBITDA 1 144 147 549 122 172 245 687 70% Adjusted EBITDA Margin 1 19.4% 19.8% 20.8% 18.3% 18.4% 21.0% 19.5% 1.6pp Revenue by Geography ($ in millions) Total revenue 743 741 2,637 669 938 1,168 3,515 57% Total Europe 385 317 1,155 263 316 273 1,169 (29)% o/w Germany 70 84 302 72 82 82 320 17% Total North America 183 216 788 266 440 715 1,637 291% o/w United States 157 196 697 240 404 692 1,532 340% Rest of World 175 207 694 140 182 180 709 3%
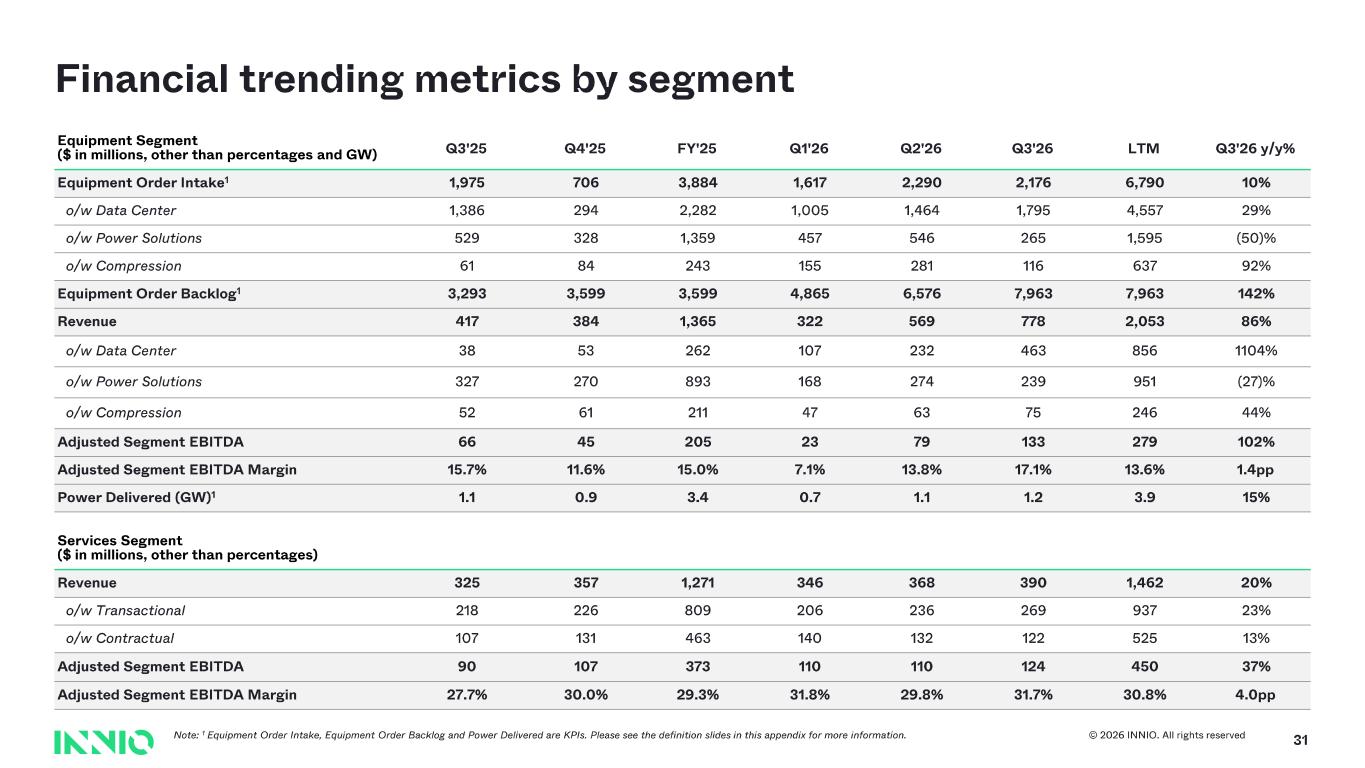
© 2026 INNIO. All rights reserved 31 Financial trending metrics by segment Note: 1 Equipment Order Intake, Equipment Order Backlog and Power Delivered are KPIs. Please see the definition slides in this append ix for more information. Equipment Segment ($ in millions, other than percentages and GW) Q3'25 Q4'25 FY'25 Q1'26 Q2'26 Q3'26 LTM Q3'26 y/y% Equipment Order Intake 1 1,975 706 3,884 1,617 2,290 2,176 6,790 10% o/w Data Center 1,386 294 2,282 1,005 1,464 1,795 4,557 29% o/w Power Solutions 529 328 1,359 457 546 265 1,595 (50)% o/w Compression 61 84 243 155 281 116 637 92% Equipment Order Backlog 1 3,293 3,599 3,599 4,865 6,576 7,963 7,963 142% Revenue 417 384 1,365 322 569 778 2,053 86% o/w Data Center 38 53 262 107 232 463 856 1104% o/w Power Solutions 327 270 893 168 274 239 951 (27)% o/w Compression 52 61 211 47 63 75 246 44% Adjusted Segment EBITDA 66 45 205 23 79 133 279 102% Adjusted Segment EBITDA Margin 15.7% 11.6% 15.0% 7.1% 13.8% 17.1% 13.6% 1.4pp Power Delivered (GW) 1 1.1 0.9 3.4 0.7 1.1 1.2 3.9 15% Services Segment ($ in millions, other than percentages) Revenue 325 357 1,271 346 368 390 1,462 20% o/w Transactional 218 226 809 206 236 269 937 23% o/w Contractual 107 131 463 140 132 122 525 13% Adjusted Segment EBITDA 90 107 373 110 110 124 450 37% Adjusted Segment EBITDA Margin 27.7% 30.0% 29.3% 31.8% 29.8% 31.7% 30.8% 4.0pp
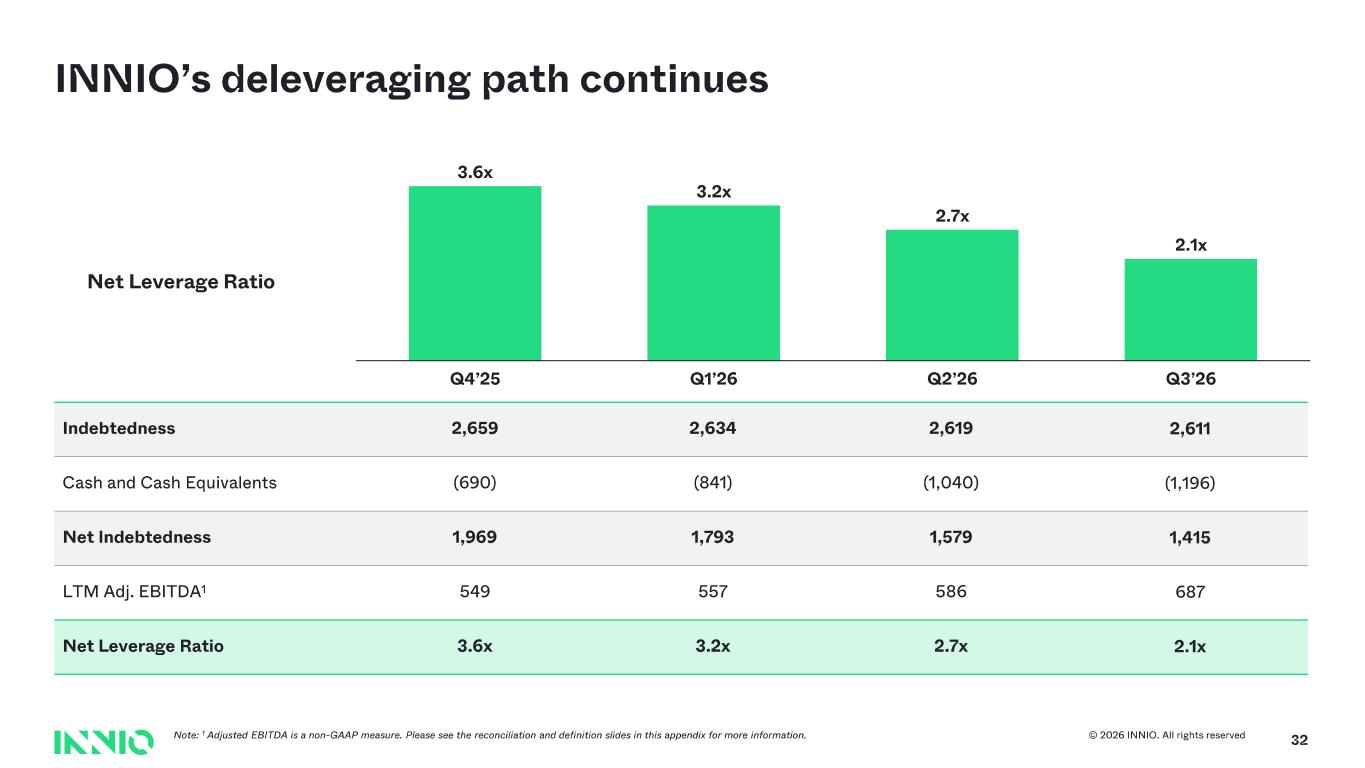
© 2026 INNIO. All rights reserved 32 INNIO’s deleveraging path continues Note: 1 Adjusted EBITDA is a non - GAAP measure. Please see the reconciliation and definition slides in this appendix for more informatio n. Indebtedness 2,659 2,634 2,619 2,611 Cash and Cash Equivalents (690) (841) (1,040) (1,196) Net Indebtedness 1,969 1,793 1,579 1,415 LTM Adj. EBITDA 1 549 557 586 687 Net Leverage Ratio 3.6x 3.2x 2.7x 2.1x Net Leverage Ratio Q4’25 Q1’26 Q2’26 Q3’26 3.6x 3.2x 2.7x 2.1x
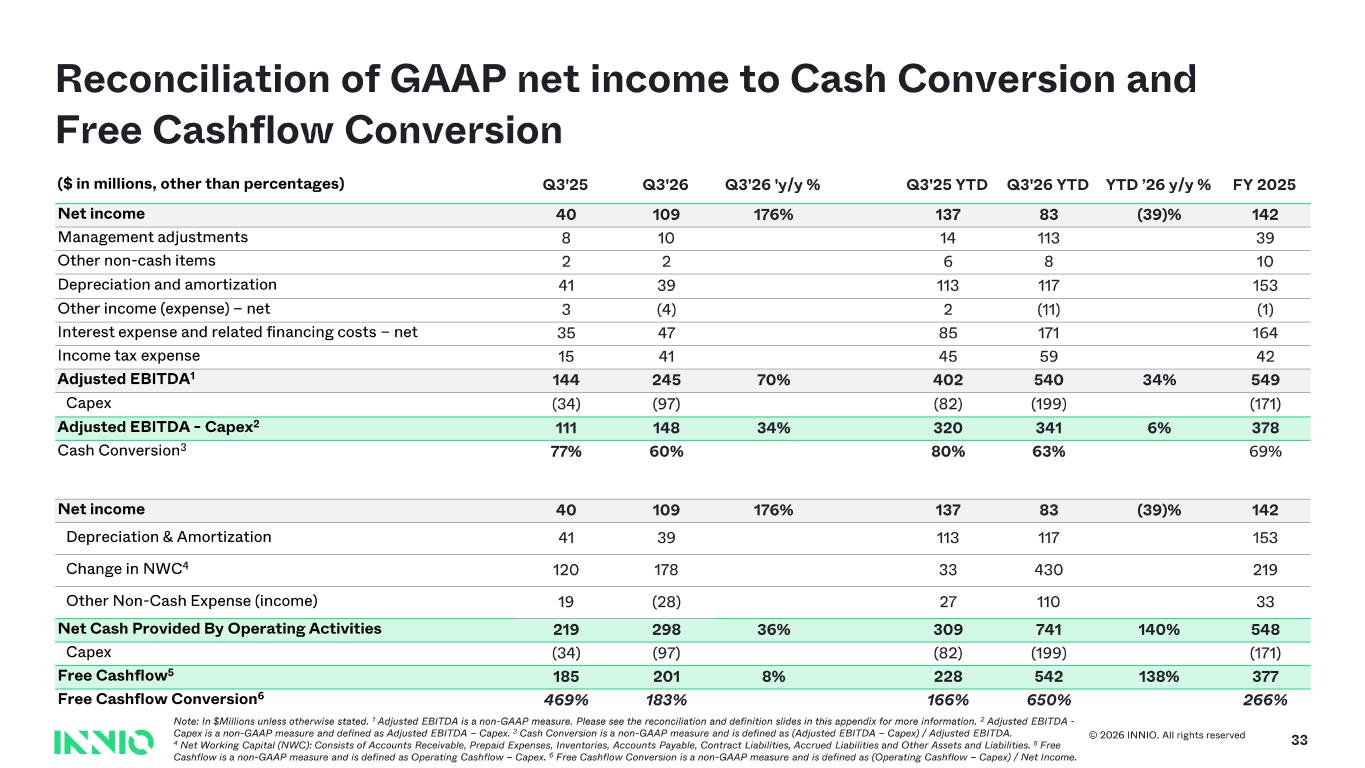
© 2026 INNIO. All rights reserved 33 Reconciliation of GAAP net income to Cash Conversion and Free Cashflow Conversion Note: In $Millions unless otherwise stated. 1 Adjusted EBITDA is a non - GAAP measure. Please see the reconciliation and definition slides in this appendix for more informatio n. 2 Adjusted EBITDA - Capex is a non - GAAP measure and defined as Adjusted EBITDA – Capex. 3 Cash Conversion is a non - GAAP measure and is defined as (Adjusted EBITDA – Capex) / Adjusted EBITDA. 4 Net Working Capital (NWC): Consists of Accounts Receivable, Prepaid Expenses, Inventories, Accounts Payable, Contract Liabili ties, Accrued Liabilities and Other Assets and Liabilities. 5 Free Cashflow is a non - GAAP measure and is defined as Operating Cashflow – Capex. 6 Free Cashflow Conversion is a non - GAAP measure and is defined as (Operating Cashflow – Capex) / Net Income. ($ in millions, other than percentages) Q3'25 Q3'26 Q3'26 'y/y % Q3'25 YTD Q3'26 YTD YTD ’26 y/y % FY 2025 Net income 40 109 176% 137 83 (39)% 142 Management adjustments 8 10 14 113 39 Other non - cash items 2 2 6 8 10 Depreciation and amortization 41 39 113 117 153 Other income (expense) – net 3 (4) 2 (11) (1) Interest expense and related financing costs – net 35 47 85 171 164 Income tax expense 15 41 45 59 42 Adjusted EBITDA 1 144 245 70% 402 540 34% 549 Capex (34) (97) (82) (199) (171) Adjusted EBITDA - Capex 2 111 148 34% 320 341 6% 378 Cash Conversion 3 77% 60% 80% 63% 69% Net income 40 109 176% 137 83 (39)% 142 Depreciation & Amortization 41 39 113 117 153 Change in NWC 4 120 178 33 430 219 Other Non - Cash Expense (income) 19 (28) 27 110 33 Net Cash Provided By Operating Activities 219 298 36% 309 741 140% 548 Capex (34) (97) (82) (199) (171) Free Cashflow 5 185 201 8% 228 542 138% 377 Free Cashflow Conversion 6 469% 183% 166% 650% 266%
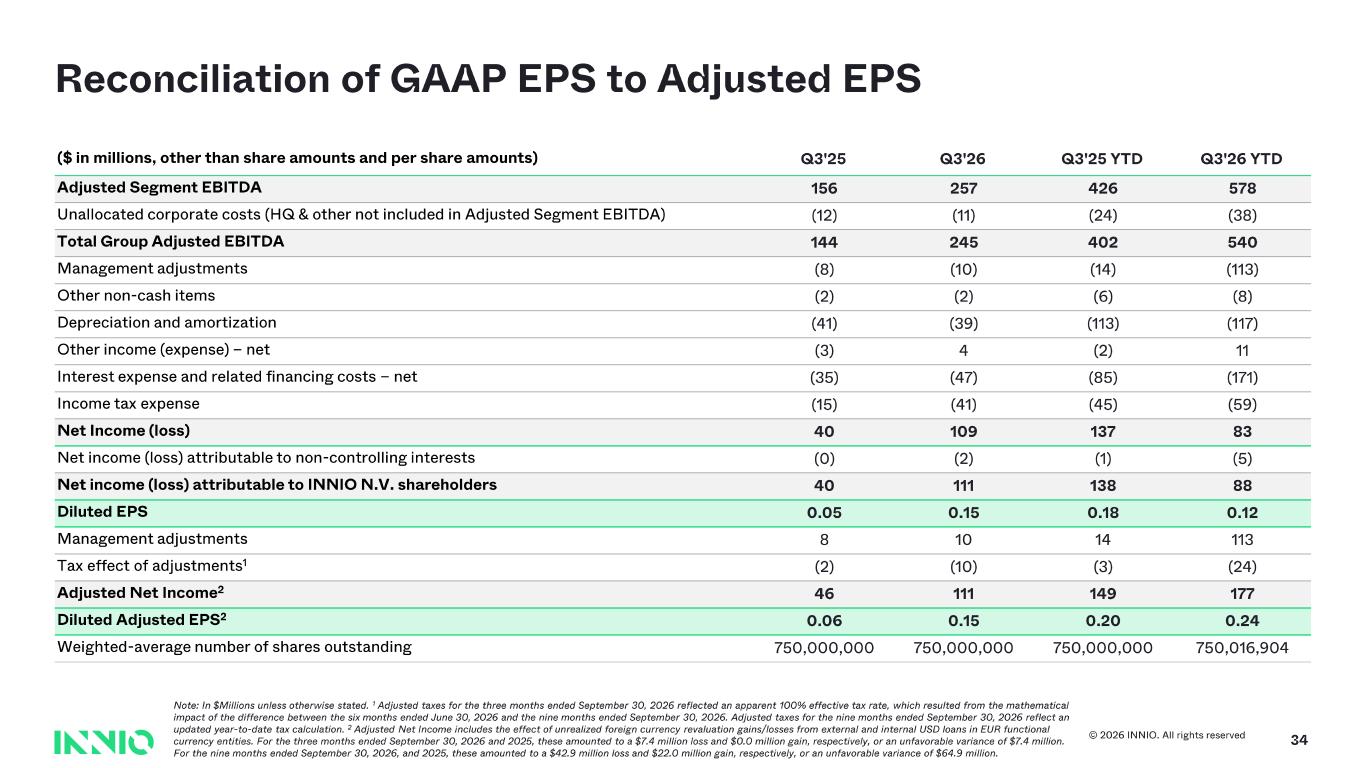
© 2026 INNIO. All rights reserved 34 Reconciliation of GAAP EPS to Adjusted EPS Note: In $Millions unless otherwise stated. 1 Adjusted taxes for the three months ended September 30, 2026 reflected an apparent 100% effective tax rate, which resulted fr om the mathematical impact of the difference between the six months ended June 30, 2026 and the nine months ended September 30, 2026. Adjusted ta xes for the nine months ended September 30, 2026 reflect an updated year - to- date tax calculation. 2 Adjusted Net Income includes the effect of unrealized foreign currency revaluation gains/losses from external and internal US D loans in EUR functional currency entities. For the three months ended September 30, 2026 and 2025, these amounted to a $7.4 million loss and $0.0 mil lion gain, respectively, or an unfavorable variance of $7.4 million. For the nine months ended September 30, 2026, and 2025, these amounted to a $42.9 million loss and $22.0 million gain, respec tiv ely, or an unfavorable variance of $64.9 million. ($ in millions, other than share amounts and per share amounts) Q3'25 Q3'26 Q3'25 YTD Q3'26 YTD Adjusted Segment EBITDA 156 25 7 426 578 Unallocated corporate costs (HQ & other not included in Adjusted Segment EBITDA) (12) (11) (24) (38) Total Group Adjusted EBITDA 144 245 402 540 Management adjustments (8) (10) (14) (113) Other non - cash items (2) (2) (6) (8) Depreciation and amortization (41) (39) (113) (117) Other income (expense) – net (3) 4 (2) 11 Interest expense and related financing costs – net (35) (47) (85) (171) Income tax expense (15) (41) (45) (59) Net Income (loss) 40 109 137 83 Net income (loss) attributable to non - controlling interests (0) (2) (1) (5) Net income (loss) attributable to INNIO N.V. shareholders 40 111 138 88 Diluted EPS 0.05 0.15 0.18 0.12 Management adjustments 8 10 14 113 Tax effect of adjustments 1 (2) (10) (3) (24) Adjusted Net Income 2 46 111 149 177 Diluted Adjusted EPS 2 0.06 0.15 0.20 0.2 4 Weighted - average number of shares outstanding 750,000,000 750,000,000 750,000,000 750,01 6,904
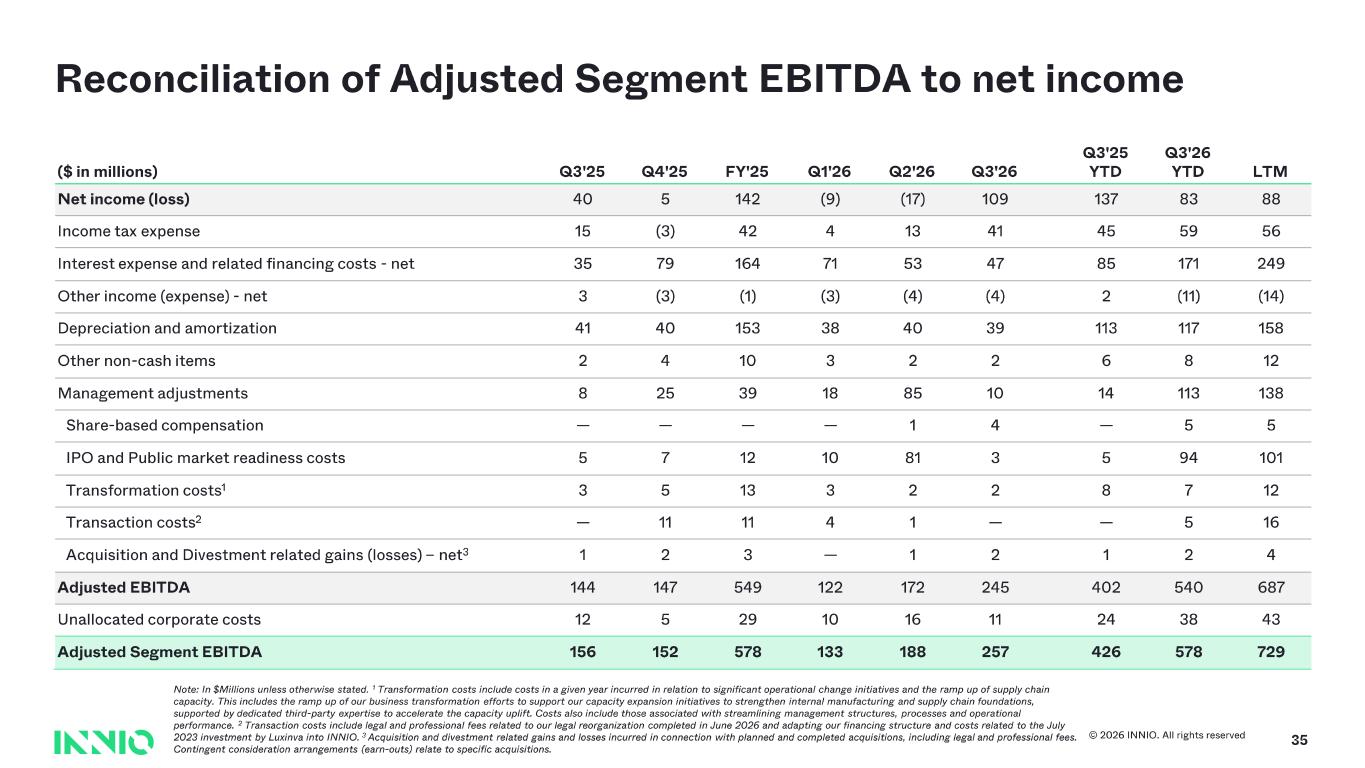
© 2026 INNIO. All rights reserved 35 Reconciliation of Adjusted Segment EBITDA to net income Note: In $Millions unless otherwise stated. 1 Transformation costs include costs in a given year incurred in relation to significant operational change initiatives and the ramp up of supply chain capacity. This includes the ramp up of our business transformation efforts to support our capacity expansion initiatives to s tre ngthen internal manufacturing and supply chain foundations, supported by dedicated third - party expertise to accelerate the capacity uplift. Costs also include those associated with streaml ining management structures, processes and operational performance. 2 Transaction costs include legal and professional fees related to our legal reorganization completed in June 2026 and adapting our financing structure and costs related to the July 2023 investment by Luxinva into INNIO. 3 Acquisition and divestment related gains and losses incurred in connection with planned and completed acquisitions, including legal and professional fees. Contingent consideration arrangements (earn - outs) relate to specific acquisitions. ($ in millions) Q3'25 Q4'25 FY'25 Q1'26 Q2'26 Q3'26 Q3'25 YTD Q3'26 YTD LTM Net income (loss) 40 5 142 (9) (17) 109 137 83 88 Income tax expense 15 (3) 42 4 13 41 45 59 56 Interest expense and related financing costs - net 35 79 164 71 53 47 85 171 249 Other income (expense) - net 3 (3) (1) (3) (4) (4) 2 (11) (14) Depreciation and amortization 41 40 153 38 40 39 113 117 158 Other non - cash items 2 4 10 3 2 2 6 8 12 Management adjustments 8 25 39 18 85 10 14 113 138 Share - based compensation — — — — 1 4 — 5 5 IPO and Public market readiness costs 5 7 12 10 81 3 5 94 101 Transformation costs 1 3 5 13 3 2 2 8 7 12 Transaction costs 2 — 11 11 4 1 — — 5 16 Acquisition and Divestment related gains (losses) – net 3 1 2 3 — 1 2 1 2 4 Adjusted EBITDA 144 147 549 122 172 245 402 540 687 Unallocated corporate costs 12 5 29 10 16 11 24 38 43 Adjusted Segment EBITDA 156 152 578 133 188 25 7 426 578 729
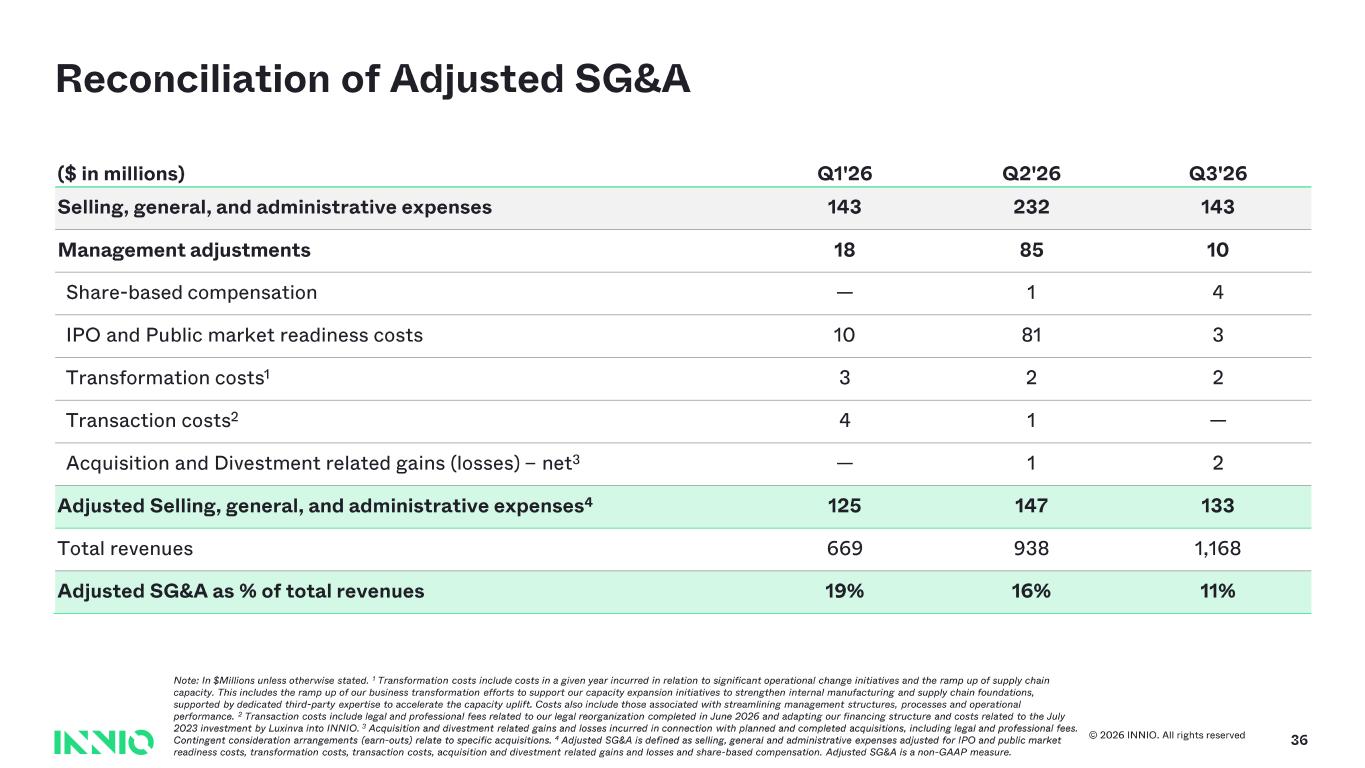
© 2026 INNIO. All rights reserved 36 Reconciliation of Adjusted SG&A Note: In $Millions unless otherwise stated. 1 Transformation costs include costs in a given year incurred in relation to significant operational change initiatives and the ramp up of supply chain capacity. This includes the ramp up of our business transformation efforts to support our capacity expansion initiatives to s tre ngthen internal manufacturing and supply chain foundations, supported by dedicated third - party expertise to accelerate the capacity uplift. Costs also include those associated with streaml ining management structures, processes and operational performance. 2 Transaction costs include legal and professional fees related to our legal reorganization completed in June 2026 and adapting our financing structure and costs related to the July 2023 investment by Luxinva into INNIO. 3 Acquisition and divestment related gains and losses incurred in connection with planned and completed acquisitions, including legal and professional fees. Contingent consideration arrangements (earn - outs) relate to specific acquisitions. 4 Adjusted SG&A is defined as selling, general and administrative expenses adjusted for IPO and public market readiness costs, transformation costs, transaction costs, acquisition and divestment related gains and losses and share - based co mpensation. Adjusted SG&A is a non - GAAP measure. ($ in millions) Q1'26 Q2'26 Q3'26 Selling, general, and administrative expenses 143 232 143 Management adjustments 18 85 10 Share - based compensation — 1 4 IPO and Public market readiness costs 10 81 3 Transformation costs 1 3 2 2 Transaction costs 2 4 1 — Acquisition and Divestment related gains (losses) – net 3 — 1 2 Adjusted Selling, general, and administrative expenses 4 125 147 133 Total revenues 669 938 1,168 Adjusted SG&A as % of total revenues 19% 16% 11%
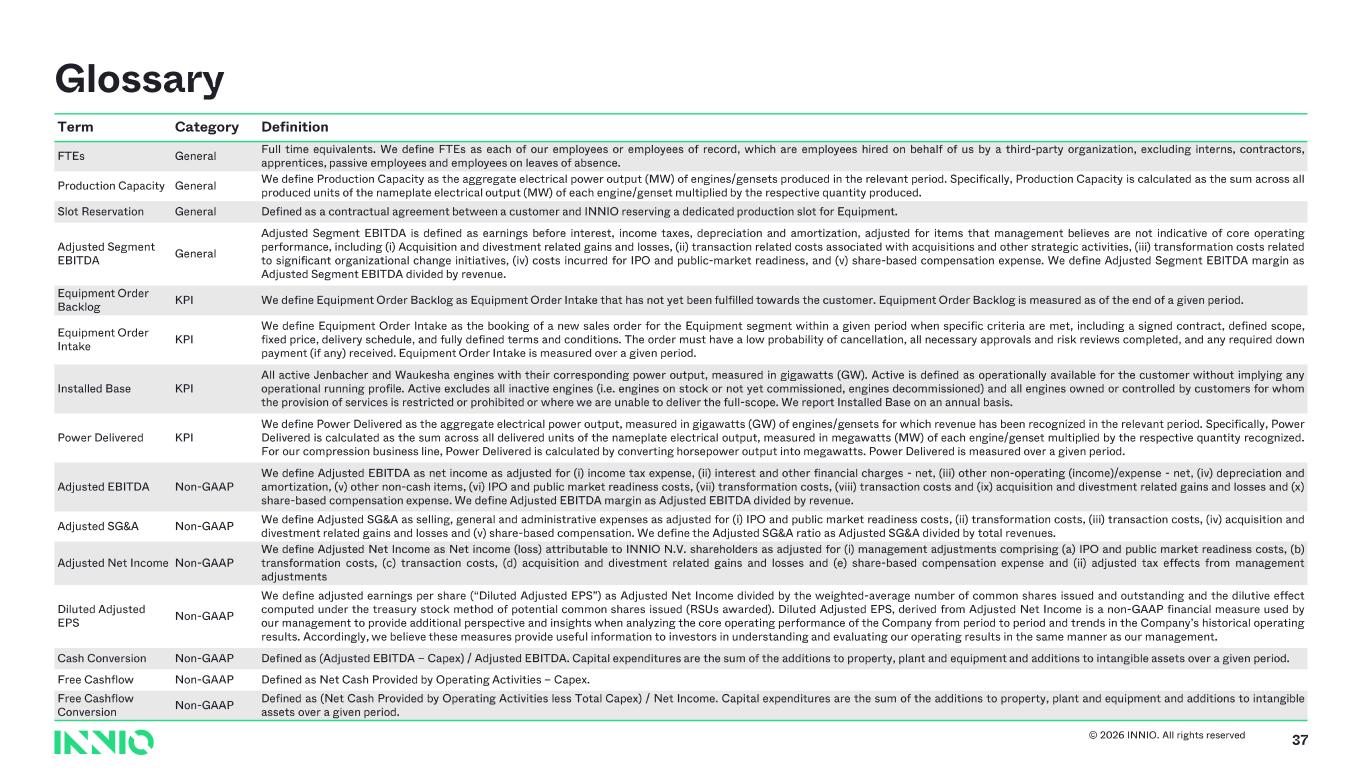
© 2026 INNIO. All rights reserved 37 Glossary Term Category Definition FTEs General Full time equivalents . We define FTEs as each of our employees or employees of record, which are employees hired on behalf of us by a third -party organization, excluding interns, contractors, apprentices, passive employees and employees on leaves of absence . Production Capacity General We define Production Capacity as the aggregate electrical power output (MW) of engines/gensets produced in the relevant period . Specifically, Production Capacity is calculated as the sum across all produced units of the nameplate electrical output (MW) of each engine/genset multiplied by the respective quantity produced . Slot Reservation General Defined as a contractual agreement between a customer and INNIO reserving a dedicated production slot for Equipment . Adjusted Segment EBITDA General Adjusted Segment EBITDA is defined as earnings before interest, income taxes, depreciation and amortization, adjusted for items that management believes are not indicative of core operating performance, including (i) Acquisition and divestment related gains and losses, (ii) transaction related costs associated with acquisitions and other strategic activities, (iii) transformation costs related to significant organizational change initiatives, (iv) costs incurred for IPO and public -market readiness, and (v) share -based compensation expense . We define Adjusted Segment EBITDA margin as Adjusted Segment EBITDA divided by revenue . Equipment Order Backlog KPI We define Equipment Order Backlog as Equipment Order Intake that has not yet been fulfilled towards the customer . Equipment Order Backlog is measured as of the end of a given period . Equipment Order Intake KPI We define Equipment Order Intake as the booking of a new sales order for the Equipment segment within a given period when specific criteria are met, including a signed contract, defined scope, fixed price, delivery schedule, and fully defined terms and conditions . The order must have a low probability of cancellation, all necessary approvals and risk reviews completed, and any required down payment (if any) received . Equipment Order Intake is measured over a given period . Installed Base KPI All active Jenbacher and Waukesha engines with their corresponding power output, measured in gigawatts (GW) . Active is defined as operationally available for the customer without implying any operational running profile . Active excludes all inactive engines (i.e. engines on stock or not yet commissioned, engines decommissioned) and all engines owned or controlled by customers for whom the provision of services is restricted or prohibited or where we are unable to deliver the full - scope . We report Installed Base on an annual basis . Power Delivered KPI We define Power Delivered as the aggregate electrical power output , measured in gigawatts (GW) of engines/gensets for which revenue has been recognized in the relevant period . Specifically, Power Delivered is calculated as the sum across all delivered units of the nameplate electrical output, measured in megawatts (MW) of each engine/genset multiplied by the respective quantity recognized . For our compression business line, Power Delivered is calculated by converting horsepower output into megawatts . Power Delivered is measured over a given period . Adjusted EBITDA Non -GAAP We define Adjusted EBITDA as net income as adjusted for (i) income tax expense, (ii) interest and other financial charges - net, (iii) other non -operating (income)/expense - net, (iv) depreciation and amortization, (v) other non -cash items, (vi) IPO and public market readiness costs, (vii) transformation costs, (viii) transaction costs and (ix) acquisition and divestment related gains and losses and (x) share -based compensation expense . We define Adjusted EBITDA margin as Adjusted EBITDA divided by revenue . Adjusted SG&A Non -GAAP We define Adjusted SG&A as selling, general and administrative expenses as adjusted for (i) IPO and public market readiness costs, (ii) transformation costs, (iii) transaction costs, (iv) acquisition and divestment related gains and losses and (v) share -based compensation . We define the Adjusted SG&A ratio as Adjusted SG&A divided by total revenues . Adjusted Net Income Non -GAAP We define Adjusted Net Income as Net income (loss) attributable to INNIO N .V. shareholders as adjusted for (i) management adjustments comprising (a) IPO and public market readiness costs, (b) transformation costs, (c) transaction costs, (d) acquisition and divestment related gains and losses and (e) share -based compensation expense and (ii) adjusted tax effects from management adjustments Diluted Adjusted EPS Non -GAAP We define adjusted earnings per share (“Diluted Adjusted EPS”) as Adjusted Net Income divided by the weighted -average number of common shares issued and outstanding and the dilutive effect computed under the treasury stock method of potential common shares issued (RSUs awarded) . Diluted Adjusted EPS, derived from Adjusted Net Income is a non -GAAP financial measure used by our management to provide additional perspective and insights when analyzing the core operating performance of the Company from period to period and trends in the Company’s historical operating results . Accordingly, we believe these measures provide useful information to investors in understanding and evaluating our operating results in the same manner as our management . Cash Conversion Non -GAAP Defined as (Adjusted EBITDA – Capex) / Adjusted EBITDA . Capital expenditures are the sum of the additions to property, plant and equipment and additions to intangible assets over a given period . Free Cashflow Non -GAAP Defined as Net Cash Provided by Operating Activities – Capex . Free Cashflow Conversion Non -GAAP Defined as (Net Cash Provided by Operating Activities less Total Capex) / Net Income . Capital expenditures are the sum of the additions to property, plant and equipment and additions to intangible assets over a given period .

Accents 1 2 3 4 5 6 Hyperlink Followed Hyperlink INNIO Green (Darker for text ) INNIO Red INNIO Yellow INNIO Cyan Text Background 31 31 39 230 231 234 36 219 130 0 49 166 77 130 255 110 38 154 201 153 230 132 132 158 140 87 255 81 2 255 27 164 98 211 32 8 255 241 92 0 181 213 38