REGISTRATION STATEMENT PURSUANT TO SECTION 12(b) OR (g) OF THE SECURITIES EXCHANGE ACT OF 1934
OR
☒
ANNUAL REPORT PURSUANT TO SECTION 13 OR 15(d) OF THE SECURITIES EXCHANGE ACT OF 1934
FOR THE FISCAL YEAR ENDED DECEMBER 31, 2018
OR
☐
TRANSITION REPORT PURSUANT TO SECTION 13 OR 15(d) OF THE SECURITIES EXCHANGE ACT OF 1934
OR
☐
SHELL COMPANY REPORT PURSUANT TO SECTION 13 OR 15(d) OF THE SECURITIES EXCHANGE ACT OF 1934
Date of event requiring this shell company report
For the transition period from
to
Commission file number 001-04546
UNILEVER PLC
(Exact name of Registrant as specified in its charter)
ENGLAND
(Jurisdiction of incorporation or organization)
100 Victoria Embankment, London, England
(Address of principal
executive offices)
R Sotamaa, Chief Legal Officer and Group Secretary
Tel: +44(0)2078225252, Fax: +44(0)2078225464
100 Victoria Embankment, London EC4Y 0DY, UK
(Name, telephone number, facsimile number and
address of Company Contact)
Securities registered or to be registered pursuant to Section 12(b) of the Act:
Title of each class
Name of each exchange on which
registered
American Shares (evidenced by Depositary Receipts) each representing one ordinary share of the nominal amount of 3 1/9p each
New York Stock Exchange
4.8% Notes due 2019
2.2% Notes due 2019
2.1% Notes due 2020
1.8% Notes due 2020
4.25% Notes due 2021
2.75% Notes due 2021
1.375% Notes due 2021
3.0% Notes due 2022
2.2% Notes due 2022
3.125% Notes due 2023
3.25% Notes due 2024
2.6% Notes due 2024
3.375% Notes due 2025
3.1% Notes due 2025
2.0% Notes due 2026
2.9% Notes due 2027
3.5% Notes due 2028
5.9% Notes due 2032
New York Stock Exchange
New York Stock
Exchange
New York Stock Exchange
New York Stock
Exchange
New York Stock Exchange
New York Stock
Exchange
New York Stock Exchange
New York Stock
Exchange
New York Stock Exchange
New York Stock
Exchange
New York Stock Exchange
New York Stock
Exchange
New York Stock Exchange
New York Stock
Exchange
New York Stock Exchange
New York Stock
Exchange
New York Stock Exchange
New York Stock
Exchange
Securities registered or to be registered pursuant to Section 12(g) of the Act: None
Securities for which there is a reporting obligation pursuant to Section 15(d) of the Act: None
Indicate the number of outstanding shares of each of the issuer’s classes of capital or common stock as of the close of the period covered by the annual
report.
The total number of outstanding shares of the issuer’s capital stock at the close of the period covered by the annual report was:
1,187,191,284 ordinary shares
Indicate by check mark if the registrant is a well-known seasoned issuer, as defined in Rule 405 of the
Securities Act:
Yes ☒ No ☐
If this report is an annual or transition report, indicate by check mark if the registrant
is not required to file reports pursuant to Section 13 or 15(d) of the Securities Exchange Act of 1934:
Yes ☐ No ☒
Indicate by check mark whether the registrant: (1) has filed all reports required to be filed by Section 13 or 15(d) of the Securities Exchange Act of 1934 during the preceding 12 months (or for such
shorter period that the registrant was required to file such reports), and (2) has been subject to such filing requirements for the past 90 days.
Yes ☒ No ☐
Indicate by check mark whether the registrant has submitted electronically every Interactive Data File required to be submitted pursuant to Rule 405 of Regulation S-T (§232.405 of this chapter) during the preceding 12 months (or for such shorter period that the registrant was required to submit such files).
Yes ☒ No ☐
Indicate by check mark whether the registrant is a large accelerated filer, an accelerated
filer, or a non-accelerated filer. See definition of “accelerated filer,” “large accelerated filer,” and “emerging growth company” in
Rule 12b-2 of the Exchange Act.
Large Accelerated filer ☒ Accelerated
filer ☐ Non-accelerated
filer ☐ Emerging Growth Company ☐
If an emerging growth company that prepares its financial statements in accordance with U.S. GAAP, indicate by check mark if the registrant has elected not to use
the extended transition period for complying with any new or revised financial accounting standards* provided pursuant to Section 13(a) of the Exchange Act. ☐
*The term ‘‘new or revised financial accounting standard’’ refers to any update issued by the Financial Accounting Standards Board to its
Accounting Standards Codification after April 5, 2012.
Indicate by check mark which basis of accounting the registrant has used to prepare the
financial statements included in this filing:
U.S. GAAP ☐
International Financial Reporting Standards as issued by the International Accounting Standards Board ☒
Other ☐
If ‘Other’ has been checked in response to the previous question, indicate by check mark which financial statement item
the registrant has elected to follow. Item 17 ☐ Item 18 ☐
If this is an annual report, indicate by check mark whether the registrant is a shell company (as defined in
Rule 12b-2 of the Exchange Act):
This document may contain forward-looking statements, including ‘forward-looking statements’ within the meaning of the United States Private Securities Litigation Reform Act of 1995. Words such as
‘will’, ‘aim’, ‘expects’, ‘anticipates’, ‘intends’, ‘looks’, ‘believes’, ‘vision’, or the negative of these terms and other similar expressions of future performance or
results, and their negatives, are intended to identify such forward-looking statements. These forward-looking statements are based upon current expectations and assumptions regarding anticipated developments and other factors affecting the Unilever
Group (the ‘Group’). They are not historical facts, nor are they guarantees of future performance.
Because these forward-looking statements
involve risks and uncertainties, there are important factors that could cause actual results to differ materially from those expressed or implied by these forward-looking statements. Among other risks and uncertainties, the material or principal
factors which could cause actual results to differ materially are: Unilever’s global brands not meeting consumer preferences; Unilever’s ability to innovate and remain competitive; Unilever’s investment choices in its portfolio
management; inability to find sustainable solutions to support long-term growth including to plastic packaging; the effect of climate change on Unilever’s business; significant changes or deterioration in customer relationships; the recruitment
and retention of talented employees; disruptions in our supply chain and distribution; increases or volatility in the cost of raw materials and commodities; the production of safe and high quality products; secure and reliable IT infrastructure;
execution of acquisitions, divestitures and business transformation projects; economic, social and political risks and natural disasters; financial risks; failure to meet high and ethical standards; and managing regulatory, tax and legal matters.
These forward-looking statements speak only as of the date of this document. Except as required by any applicable law or regulation, the Group
expressly disclaims any obligation or undertaking to release publicly any updates or revisions to any forward-looking statements contained herein to reflect any change in the Group’s expectations with regard thereto or any change in events,
conditions or circumstances on which any such statement is based.
Further details of potential risks and uncertainties affecting the Group are
described in the Group’s filings with the London Stock Exchange, Euronext Amsterdam and the US Securities and Exchange Commission, including in the Unilever Annual Report and Accounts 2018.
This document is made up of the Strategic Report, the Governance Report, the Financial Statements and Notes, and Additional Information for US Listing Purposes.
The Unilever Group consists of Unilever N.V. (NV) and Unilever PLC (PLC) together with the companies they control. The terms “Unilever”, the “Group”,
“we”, “our” and “us” refer to the Unilever Group.
Our Strategic Report, pages 1 to 35, contains information about us, how we create
value and how we run our business. It includes our strategy, business model, market outlook and key performance indicators, as well as our approach to sustainability and risk. The Strategic Report is only part of the Annual Report and Accounts 2018.
The Strategic Report has been approved by the Boards and signed on their behalf by Ritva Sotamaa – Group Secretary.
Our Governance Report, pages 36 to 65
contains detailed corporate governance information, our Committee reports and how we remunerate our Directors.
Our Financial Statements and Notes are on pages 66 to
127.
Pages 1 to 147 constitute the Unilever Annual Report and Accounts 2018 for UK and Dutch purposes, which we may also refer to as ‘this Annual Report and
Accounts’ throughout this document.
The Directors’ Report of PLC on pages 36 to 49, 66 (Statement of Directors’ responsibilities), 97 (Dividends on
ordinary capital), 110 to 115 (Treasury Risk Management), 133 and 137 (Post balance sheet event) and 145 (branch disclosure) has been approved by the PLC Board and signed on its behalf by Ritva Sotamaa – Group Secretary.
The Strategic Report, together with the Governance Report, constitutes the report of the Directors within the meaning of Article 2:391 of the Dutch Civil Code and has
been approved by the NV Board and signed on its behalf by Ritva Sotamaa – Group Secretary.
Pages 148 to 167 are included as Additional Information for US
Listing Purposes.
ONLINE
You can find more information about Unilever online at
www.unilever.com
For further information on the Unilever Sustainable Living Plan (USLP) visit
www.unilever.com/sustainable-living
The Annual Report on Form 20-F 2018 along with other relevant documents can be downloaded at
OUR BRANDS ARE AVAILABLE IN OVER 190 COUNTRIES. THIS GIVES US A UNIQUE OPPORTUNITY TO POSITIVELY IMPACT THE LIVES OF PEOPLE ALL OVER THE WORLD.
Every day, 2.5 billion people use our products to feel good, look good and get more out of life. Our range of around 400 household brands includes Lipton, Knorr,
Dove, Rexona, Hellmann’s and Omo. We are one of the largest fast moving consumer goods (FMCG) companies globally. In 2018 we had 12 brands with turnover of over a billion euros or more. The strength of our global brands is reflected in
Kantar’s Brand Footprint report published in May 2018. It found that 13 of the world’s top 50 FMCG brands – based on market penetration and consumer interactions – are owned by Unilever with these brands chosen 36 billion
times each year. This is significantly more than any other FMCG company in the study.
Our portfolio also includes iconic local brands designed to meet the specific
needs of consumers in their home market such as Brooke Bond in India and Brilhante in Brazil. We are increasingly seeing our local brands and innovations being rolled out to more markets such as Lakme and Breyers Delights. Our geographic reach gives
us an unparalleled global presence, including a unique position in emerging markets which generate 58% of our turnover.
From the beginning of 2018, Unilever began
operating across three new Divisions created as part of our efforts to accelerate shareholder value creation. The largest by turnover is Beauty & Personal Care followed by Foods & Refreshment then Home Care. Details of each can be
found on pages 11 to 12. The sale of our spreads business was also completed in mid-2018. These changes create a strong platform to accelerate our strategy of long-term, sustainable shareholder value creation.
Our strategy is explained in detail on page 10.
Our business activities span a complex global value chain which is described on page 9. At the heart of our business
is a workforce of 155,000 people (as at 31 December 2018) who are driven by our purpose and empowered to excel in our fast-changing markets. The combination of global scale and local agility has become yet more effective through the continued
implementation of our Connected 4 Growth (C4G) change programme to meet consumer trends which are detailed on page 8. Our employees are supported by leadership teams with representatives from over 70 countries. Of our business leaders, 80% are local
to their markets reflecting the deep local expertise at the heart of our business. This rises to more than 90% when we include managers who support those teams.
In
this volatile and uncertain world, protecting Unilever through the fostering of business integrity is a non-negotiable for all employees. Our Code of Business Principles (the Code), and the 24 policies that
support it (Code Policies), set out the behaviour standards required from all our people. The Code Policies cover a number of areas, including anti-bribery and corruption, respect, dignity and fair treatment of people and personal data and privacy.
Together, the Code and Code Policies help us put our values of Integrity, Respect, Responsibility and Pioneering into practice. See page 16 for more on our Code and Code Policies.
During the year the Boards withdrew proposals to simplify Unilever’s dual-headed legal structure after extensive engagement with shareholders. We remain firmly
committed to our 2020 financial programme and are confident of meeting its key targets and objectives as our faster, simpler organisation delivers more efficiency, lower costs and significant operational and financial benefits.
This Annual Report and Accounts provides further detail on our performance during the year and how our business model is delivering strong returns for shareholders and a
more sustainable way of doing business for the benefit of all our stakeholders. Find out more about our performance on pages 6 and 7.
OUR
PURPOSE
UNILEVER’S PURPOSE IS TO MAKE SUSTAINABLE LIVING COMMONPLACE. WE BELIEVE THIS IS THE BEST WAY TO DELIVER LONG-TERM SUSTAINABLE GROWTH.
We believe long-term sustainable growth is best delivered through brands that offer great performance and have a genuine purpose. Washing shirts whiter or making hair
healthier and shinier is still vitally important, but product performance by itself is no longer enough. Consumers are looking for more.
At Unilever, we encourage
our brand managers to take a stance and make a positive difference to society. Purpose defines a brand in people’s minds and is best delivered through action. It’s only through action that consumers will see purpose as more than marketing.
Our company purpose ‘To make sustainable living commonplace’ is unequivocal. We want to help create a world where everyone can live well within the natural
limits of the planet. We put sustainable living at the heart of everything we do, including our brands and products, our standards of behaviour and our partnerships which drive transformational change across our value chain.
Purpose takes many forms amongst our brands. Some, like Lifebuoy, take on life-threatening diseases associated with poor hygiene with programmes to change handwashing
behaviour. Domestos’ purpose is to improve sanitation for millions of people who do not have access to a toilet. Our brands can also be a catalyst to promote positive cultural norms. Brooke Bond’s purpose ‘Common ground is only a cup
away’ is highly relevant in an increasingly divided world and can be applied well locally. In India, it addresses religious tensions. In the Gulf, divorce. In Canada, same-sex relationships.
Some of our brands take an activist stance, mobilising citizens to change policy or create social movements. For example, Ben & Jerry’s builds movements
around issues such as climate change and the refugee crisis. Seventh Generation – with its plant-based products – campaigns for renewable energy. Deodorant brand Rexona’s purpose is to help reverse physical inactivity, a big issue for
societies facing increasingly sedentary lifestyles. Rexona believes ‘the more you move, the more you live’ supported by Motion Sense technology which works through movement. Radiant believes everyone deserves an opportunity to shine. It
goes beyond bright clothes and helping consumers ‘dress to progress’, enhancing skills through its Career Academies. Each market focuses on the skills that matter locally. In Brazil that’s entrepreneurial and business skills. In
India, English language skills.
All of Unilever’s brands are on a journey to becoming purposeful. Sustainable Living brands are those that are furthest ahead.
In 2017, 26 of our brands qualified as Sustainable Living brands including our B-Corp certified brands such as Ben & Jerry’s, Seventh Generation and Pukka Herbs, which means that they meet high
standards of social and environmental performance, transparency and legal accountability. Our Sustainable Living brands grew 46% faster than the rest of the business and delivered more than 70% of Unilever’s growth, driven by consumer demand
for brands with purpose at their core.
However volatile and uncertain the world is, Unilever’s purpose – supported by the Unilever Sustainable Living Plan
(USLP) and brands with purpose – will remain steadfast because managing for the benefit of multiple stakeholders is the best way for us to grow.
We are now
looking beyond the current USLP as many of our targets end in 2020. We carried out an extensive listening exercise on the future of sustainable business. We spoke to approximately 300 stakeholders, including more than 130 external experts, and heard
from over 40,000 employees through a ‘Have Your Say’ survey. They gave us their views on the priorities that they would like Unilever to focus on. The results will be used to co-create
Unilever’s future agenda.
I am pleased to report that 2018 was another year of consistent top and bottom line performance for Unilever. Solid revenue growth was combined with
good profitability and cash flow delivery. This despite a challenging year for the global economy, with subdued growth and high levels of volatility undermining consumer confidence in many parts of the world.
Unilever is also operating in a sector that is experiencing widespread change and disruption. Although challenging, these changes offer significant opportunities to
companies able to move with speed and agility and who can tailor their offering to changing consumer preferences. To that end, the Boards are very confident that Unilever’s strategy and the measures it has taken to strengthen its organisation,
sharpen its portfolio and digitise its operations make it well placed to capture new and emerging growth opportunities.
The Boards also believe that the Unilever
Sustainable Living Plan continues to set Unilever apart as a business highly attuned to the growing desire among consumers for companies and brands that serve a wider societal and environmental need.
In 2018 we also completed successfully the complex disposal of the spreads business. Our Share Buy-back programme delivered on its
intention to buy back shares with an aggregate market value of €6 billion, in line with Unilever’s objective to return the after-tax proceeds of
the spreads disposal to shareholders.
SIMPLIFICATION
Following a thorough
review and widespread consultation, the Boards put forward proposals in 2018 to simplify Unilever’s dual-headed structure under a new single holding company.
In
developing the proposal – including a recommendation to incorporate in the Netherlands while maintaining listings in the Netherlands, the UK and the US – the Boards were motivated by the opportunity to unlock value by simplifying Unilever
and giving it added flexibility to compete effectively over the longer-term.
We recognised however that the proposal did not receive support from a significant group
of shareholders and therefore considered it appropriate to withdraw. The Boards still believe that simplifying Unilever’s dual-headed structure would, over time, provide opportunities to further accelerate value creation and would serve
Unilever’s best long-term interests.
Since withdrawing the proposal, I have met with a significant number of PLC and NV shareholders to discuss further ideas
and possible next steps. It is clear from all these meetings that there is widespread support for the principles and strategic rationale behind Simplification. In these meetings, I also took the opportunity to reaffirm our commitment to further
strengthen our corporate governance. Accordingly, in February 2019, we followed through on our commitment to cancel the NV Preference Shares, in itself a major step towards simplifying the company’s share capital.
BOARD COMPOSITION AND SUCCESSION
The 2018 AGMs marked the retirement of Ann
Fudge as a Non-Executive Director and Vice-Chairman of the Boards. On behalf of the Boards, I would like to thank Ann for her outstanding and valued contribution to Unilever.
I was also delighted that you elected Andrea Jung as a Non-Executive Director at the same AGMs. Andrea brings highly relevant
experience and expertise to Unilever and is a very welcome addition to the Boards.
CEO SUCCESSION
A key focus for the Boards last year was to manage the CEO succession, with Paul Polman stepping down as CEO after 10 years with the Group.
After a rigorous and wide-ranging selection process, the Boards were unanimous in its decision to appoint Alan Jope to the role. Alan became CEO on 1 January 2019
and is being proposed as an Executive Director at the 2019 AGMs.
Alan has led Unilever’s largest Division, Beauty & Personal Care, for the last four years and he has been a
member of the Group’s Leadership Executive since 2011. His previous roles include running Unilever’s business in North Asia. Alan has deep understanding and wide experience of Unilever’s business and markets. He is a strong, dynamic
and values-driven leader with an impressive track record of delivering consistent high-quality performance across both developed and emerging markets. The Boards warmly welcome Alan to the role and look forward to working closely with him in the
years ahead.
Unilever has been transformed under the leadership of Paul Polman. He has overseen ten years of consistent top and bottom line growth and very
competitive returns to shareholders. He leaves with the company’s geographic footprint and brand portfolio stronger and well positioned for future growth.
Paul’s pioneering commitment to sustainable and equitable growth have marked him – and the company – out as leaders in the field. Thanks to his visionary
leadership and tireless efforts, Unilever is not only one of the most admired and respected companies in the world today, but also one of the most desired employers.
Paul retired as CEO and as a Board member on 31 December 2018. He will support the transition process in the first half of 2019 and will leave the Group in early
July. We thank him for his remarkable contribution to the company and wish him every success in the future.
REMUNERATION
During 2018 we also continued to consult with shareholders on our Remuneration Policy, particularly for the Executive Directors. At the 2017 AGMs you provided your strong
support to the implementation of a reward framework that encourages and enhances a strong performance culture by enabling Unilever managers to have an even stronger personal commitment to Unilever share ownership.
At the 2018 AGMs, we asked shareholders to approve a new Remuneration Policy that would align the pay of our Executive Directors fully with the Reward Framework we
introduced following the 2017 AGMs. Whilst shareholders approved the new Remuneration Policy, we recognised that a significant minority of NV and PLC shareholders voted against the proposal. On pages 50 and 51 of the 2018 Directors’
Remuneration Report, we describe in detail the principal concerns and how we responded to them and other changes to the implementation of the Remuneration Policy.
EVALUATION
Following the external Board evaluation in 2017, we used a
simplified internal evaluation this year. While we concluded that the Boards continued to operate in an effective manner overall, the Boards decided that it will maintain a particular focus on portfolio and channel strategies and digitisation. Each
Board Committee also performed its own self-evaluation, agreeing areas where it could enhance its effectiveness further. These are described within each Committee Report.
LOOKING AHEAD
Even though trading conditions are likely to remain challenging
in 2019, the Boards remain confident both in the outlook and in the strategy for the Group, reflected by an 8% increase in the dividend for the 2018 financial year.
Over the year, Board members have visited Unilever operations in several parts of the world, including China and the United States. We have seen first-hand the depth of talent that exists within the company, as well as the commitment of Unilever people to go on improving the lives of consumers and the societies in which the company operates. On behalf of the
Boards, I want to thank all of the 155,000 employees of Unilever for their remarkable efforts.
Equally we have been pleased to engage with many of the company’s
other stakeholders, without whom Unilever could not be successful. That includes our shareholders, who I also want to thank for their continued support of the company.
Previous experience: Bayer AG (CEO); Thermo Fisher Scientific Inc. (CEO).
Current external appointments: Novalis LifeSciences LLC (Founder and Chairman); Quanterix Corporation (Director); Georgetown University (member Board of
Directors); Foundation for the National Institutes of Health (Director).
YOUNGME MOON
ALAN JOPE
GRAEME PITKETHLY
NILS SMEDEGAARD
Vice-Chairman/Senior
CEO
CFO
ANDERSEN
Independent Director
Previous experience: Harvard Business School (Chairman and Senior Associate Dean for the MBA Program); Massachusetts Institute of Technology
(Professor); Avid Technology (NED).
Current external appointments: Sweetgreen Inc (Board Member); Jand Inc (Board Member); Harvard Business School
(Professor).
Nationality British Age 54, Male. Appointed CEO: January 2019. Appointed Director: Alan Jope will be proposed for election as an Executive
Director at the 2019 AGMs.
Previous experience: Beauty and Personal Care Division (President); Unilever Russia, Africa and Middle East (President); Unilever
North Asia (President); SCC and Dressings (Global Category Leader); Home and Personal Care North America (President).
Nationality British Age 52, Male. Appointed CFO: October 2015. Appointed Director: April 2016. Attended 6/6 planned Board Meetings and 4/4
ad hoc Board Meetings.
Previous experience: Unilever UK and Ireland (EVP and General Manager); Finance Global Markets (EVP); Group Treasurer; Head of
M&A; FLAG Telecom (VP Corporate Development); PwC.
Current external appointments: Financial Stability Board Task Force on Climate Related Financial
Disclosure (Vice Chair).
Previous experience: A.P. Moller – Maersk A/S (Group CEO); Carlsberg A/S and Carlsberg Breweries A/S (CEO); European Round Table of
Industrialists (Vice-Chairman); Unifeeder S/A (Chairman).
Current external appointments: AKZO Nobel N.V. (Chairman); BP Plc (NED); Dansk Supermarked
A/S (Chairman); Faerch Plast (Chairman).
LAURA CHA
VITTORIO COLAO
JUDITH HARTMANN
ANDREA JUNG
Previous experience: Securities and Futures Commission, Hong Kong (Deputy Chairman); China Securities Regulatory Commission (Vice Chairman);
China Telecom Corporation Limited (NED); 12th National People’s Congress of China (Hong Kong Delegate).
Current external appointments: HSBC
Holdings plc (NED); Hong Kong Exchanges and Clearing Ltd (Non-Executive Chairman); Foundation Asset Management Sweden AB (Senior international adviser); Executive Council of the Hong Kong Special
Administrative Region (Non-official member).
Previous experience: Vodafone Group plc (CEO); RCS MediaGroup SpA (CEO); McKinsey & Company (Partner); Finmeccanica Group Services SpA
(renamed to Leonardo SpA) (NED); RAS Insurance SpA (merged with Allianz AG) (NED).
Current external appointments: Bocconi University (NED and Executive
Committee member); Oxford Martin School (Advisor).
Previous experience: General Electric (various roles); Bertelsmann SE & Co. KGaA (CFO); RTL Group SA (NED); Penguin Random House LLC
(NED).
Current external appointments: ENGIE Group (CFO and EVP North America and UK/Ireland); Suez (NED).
Previous experience: Avon Products Inc (CEO); General Electric (Board Member); Daimler AG (Board Member).
Currentexternal appointments: Grameen America Inc (President and CEO); Apple Inc (NED); Wayfair Inc (NED).
MARY MA
STRIVE MASIYIWA
JOHN RISHTON
FEIKE SIJBESMA
Previous experience: TPG Capital, LP (Partner); TPG China Partners (Co-Chairman).
Current external appointments: Lenovo Group Ltd. (NED); Boyu Capital Consultancy Co. Ltd (Managing Partner); MXZ Investment Limited (Director); Securities and
Futures Commission, Hong Kong (NED).
Previous experience: Africa Against Ebola Solidarity Trust (Co-Founder and Chairman); Grow Africa (Co-Chairman); Nutrition International (formerly known as Micronutrient Initiative) (Chairman).
Current external
appointments: Econet Group (Founder and Group Executive Chairman); Econet Wireless Zimbabwe Ltd (Director); The Alliance for a Green Revolution in Africa (AGRA)
Not-for-Profit Corporation (Chairman); Rockefeller Foundation (Trustee).
Previous experience: Rolls-Royce Holdings plc (CEO); Koninklijke Ahold NV (merged to Koninklijke Ahold Delhaize NV) (CEO, President and CFO); ICA
(now ICA Gruppen AB) (NED).
Current external appointments: Informa plc (NED); Serco Group plc (NED); Associated British Ports Holdings Ltd.
(NED).
Previous experience: Supervisory Board of DSM Nederland B.V. (Chairman); Utrecht University (Supervisory Director); Stichting Dutch Cancer
Institute/ Antoni van Leeuwenhoek Hospital NKI/AVL) (Supervisory Director).
Current external appointments: Koninklijke DSM NV (CEO and Chairman of the
Managing Board); De Nederlandsche Bank NV (Member of the Supervisory Board); Carbon Pricing Leadership Coalition (High Level Assembly Co-Chairman), Climate Leader for the World Bank Group.
NON-EXECUTIVE DIRECTORS
MARIJN
NILS
LAURA
VITTORIO
JUDITH
ANDREA
MARY
STRIVE
YOUNGME
JOHN
FEIKE
DEKKERS
ANDERSEN
CHA
COLAO
HARTMANN
JUNG
MA
MASIYIWA
MOON
RISHTON
SIJBESMA
Age
61
60
69
57
49
59
66
58
54
61
59
Gender
Male
Male
Female
Male
Female
Female
Female
Male
Female
Male
Male
Nationality
Dutch / American
Danish
Chinese
Italian
Austrian
American / Canadian
Chinese
Zimbabwean
American
British
Dutch
Appointment date
April
2016
April
2015
May
2013
July
2015
April
2015
May
2018
May
2013
April
2016
April
2016
May
2013
November
2014
Committee membership*
CC, NCGC
(Chairman)
AC
NCGC
CC
(Chairman)
AC
CC
CC
CRC
(Chairman)
CRC
AC
(Chairman)
CRC, NCGC
Leadership of complex global entities
✓
✓
✓
✓
✓
✓
✓
✓
Broad Board experience
✓
✓
✓
✓
✓
✓
✓
✓
✓
✓
Geo-political exposure
✓
✓
✓
✓
✓
✓
✓
✓
✓
✓
Financial expertise
✓
✓
✓
✓
✓
✓
✓
✓
✓
FMCG/consumer insights
✓
✓
✓
✓
✓
✓
✓
✓
✓
✓
Emerging markets experience
✓
✓
✓
✓
✓
✓
✓
✓
✓
✓
Digital insights
✓
✓
Marketing and sales expertise
✓
✓
✓
✓
✓
✓
Science, technology and innovation expertise
✓
✓
✓
✓
✓
CSR experience
✓
✓
✓
✓
✓
HR and remuneration in international firms
✓
✓
✓
✓
✓
✓
✓
✓
Attendance at planned Board Meetings
6/6
6/6
6/6
6/6
6/6
3/3
6/6
6/6
6/6
6/6
6/6
Attendance at ad hoc Board Meetings
4/4
2/4
2/4
4/4
3/4
3/3
4/4
3/4
4/4
3/4
4/4
Tenure as at 2018 AGMs
2
3
5
3
3
0
5
2
2
5
4
*
AC refers to the Audit Committee; CC refers to the Compensation Committee; CRC refers to the Corporate Responsibility
Committee; and NCGC refers to the Nominating and Corporate Governance Committee.
Widespread
economic and geopolitical uncertainty meant that the global business environment remained challenging in 2018. Currency depreciation in a number of key markets fuelled inflationary pressures and dampened consumer demand, while input costs rose
steadily on the back of escalating commodity prices.
A SOLID PERFORMANCE
Against this backdrop, Unilever delivered a solid performance. Underlying sales grew by 3.1%, excluding the recently-divested spreads business (2.9% including spreads).
Growth was profitable, bringing our underlying operating margin to 18.4%, up 90 basis points, which also drove a healthy free cash flow of €5 billion for the year.
Importantly, the overall shape and quality of the performance was encouraging. We achieved a good balance of price and volume growth. Growth was broad-based, across each
of our three global Divisions – Beauty & Personal Care, Home Care and Foods & Refreshment. Our continuing margin progression was underpinned by well-embedded savings and efficiency programmes, and an improving mix from
underlying sales growth in Beauty & Personal Care.
Inspired by the Unilever Sustainable Living Plan, we also saw our brands with the most distinct and
well-articulated social and environmental purpose grow significantly faster than our other brands.
The performance last year demonstrates I believe that our strategy
is working. By empowering our three global Divisions, we are allowing for more strategic allocation of resource and for greater differentiation in meeting changing consumer needs. Beauty & Personal Care, for example, made good progress in
moving to more premium positions and expanding in the high growth segments. Home Care built on its already strong emerging market footprint with a strategy of market development and benefit-led innovation for
emerging needs. Whilst Foods & Refreshment was combined into a single division bringing more scale and focus to allow faster transformation of our portfolio.
The results in 2018 re-affirm the enduring strength of Unilever’s brands and the growing resilience of our organisational
model, as well as underlining Unilever’s ability to deliver consistent top and bottom line performance even in very challenging conditions. Nevertheless, we are determined to step up the proportion of our business that is winning market share
as part of moving our sales growth more consistently into the middle of our multi-year 3-5% targeted range.
A YEAR OF
PROGRESS
As well as delivering a solid set of results, we also made good progress in 2018 in strengthening the overall business to be ready for future
opportunities:
•
By empowering those closest to the marketplace, and by linking our global brand teams across the world, our Connected for Growth (C4G) organisational model is helping to increase speed and agility, as well as giving
rise to a greater entrepreneurial spirit inside the company. As an illustration of this, time to market with new innovations to meet local trends is now 40%-50% faster compared to 2016. We also launched 19 new
brands, including Love Home and Planet, a range of plant-based, home-cleaning products and a follow-up to our successful launch of the natural and sustainable hair and skincare product range, Love Beauty and
Planet.
•
In line with our strategy, we continued to move the portfolio in the direction of the faster-growing segments of the market, especially those that speak to consumers’ growing desire for more natural products and
purpose-driven brands. The vast majority of businesses we have acquired over recent years are now growing by double digits on a yearly basis and we were delighted at the end of last year to announce the acquisition of GlaxoSmithKline’s Health
Food Drinks portfolio, including its iconic Horlicks brand in India and the rest of Asia, further increasing our presence in the highly attractive health-food category. We also completed successfully the complex disposal of the spreads business,
returning the after-tax proceeds to shareholders.
•
The way people shop and access brands is changing rapidly and we made good progress in 2018 in positioning ourselves effectively in
new and faster-growing channels. Our e-commerce sales were up by 47%, ahead of global e-commerce market growth and
putting us well on the road to building a scale e-commerce business. We also accelerated the growth of our business with Discounters, in the Health and Beauty channel and in the
out-of-home eating market.
•
The digital transformation of the company also continues apace. We are working successfully with leading global technology companies to build world-class technology and data analytics infrastructure. Through the
sophisticated and responsible leveraging of our data insights, we are close to reaching our goal of being able to connect directly with a billion of our consumers. In our operations, we have already automated over 700 processes – saving time
and reducing cost – and our in-house training programmes are increasingly focussed on the digital up-skilling of our own people.
•
Our attractiveness as an employer of choice grew still further in 2018. Unilever is now the number one FMCG graduate employer of choice in almost 50 countries. That is a remarkable achievement, and testament to
Unilever’s values and commitment to be a force for good in the world.
Strengthened by these measures, we are good in shape for the future. We
ended 2018 with 58% of our turnover in the emerging markets and enjoying number 1 or 2 positions in 85% of the key markets and categories in which we compete. Our Beauty & Personal Care business – where some of the biggest growth
opportunities exist – now represents 40% of our turnover. All of this makes us well placed to capture the many opportunities that exist across our markets.
LOOKING AHEAD
Building on these strong foundations, I have already made clear
that my first priority as CEO will be to accelerate quality growth. For us, that means an investment-led approach based on delivering our 4G growth model – consistent growth, competitive growth,
profitable growth and responsible growth, with an equal focus on each.
In particular, I want to leave no doubt that I intend to build further on Unilever’s century-old commitment to responsible business. ‘Making Sustainable Living Commonplace’ will remain our purpose as a company and we will use this to keep Unilever at the forefront of ensuring business is a
force for good. More and more of our brands will become explicit about the positive social and environmental impact they have. This is entirely aligned to the instincts of our people and to the expectations of our consumers. It is not about putting
purpose ahead of profits, it is purpose that drives profits.
Despite the progress we have made in recent years, I am also clear that – in a world where the
speed of change is relentless – we need to quicken the pace of everything we do still further. I want to make speed and skills for a digital age a hallmark of Unilever under my leadership.
If we can do all this then I am confident we can achieve our strategic aims and deliver many years of solid cash flow, further underlying operating margin improvement and
good quality growth.
AND FINALLY…
I want to thank my colleagues
throughout the whole company for their hard work in delivering these results. Unilever is fortunate to have such talented and dedicated people and I am deeply aware of my responsibilities to them – and to our many other stakeholders – in
being asked to lead this wonderful company.
I especially want to thank my predecessor, Paul Polman. Unilever has been transformed under his inspiring leadership. He
has worked tirelessly to make the company stronger and the world a better place. It has been a privilege to serve with him and an honour now to succeed him.
I also
want to thank the Unilever Board of Directors for their confidence and invaluable guidance as I take on the role. And, finally, to our shareholders, thank you for your ongoing support and belief in the company, which we will always work hard to
retain.
Appointed to ULE
January 2013 (will retire in April 2019)
Joined Unilever 1986
Previous Unilever posts include: Unilever Research & Development (SVP); Unilever Canada Inc. (Chairman); Foods America (SVP Marketing Operations);
Global Dressings (VP R&D); Margarine and Spreads (Director of Product Development).
Current external appointments:
Ingleby Farms and Forests (NED).
Nationality Dutch Age 52, Male
Appointed to ULE
January 2016
Joined Unilever 1990
Previous Unilever posts
include:
Unilever East Africa and Emerging Markets (EVP); Chief Procurement Officer; Supply Chain, Spreads, Dressings and Olive Oil Europe (VP); Ice Cream Brazil
(Managing Director); Ice Cream Brazil (VP); Corporate Strategy Group; Birds Eye Wall’s, Unilever UK (Operations Manager).
Current external
appointments: PostNL (Supervisory Board member).
Nationality Dutch Age 49, Female Appointed to ULE January 2018
Joined Unilever 2018
Previous posts include:
Royal Ahold Delhaize (CEIO & EC);
Royal Ahold (CCO); P&G (VP &
GM).
Current external appointments:
Bayer AG (Supervisory Board member),
Leading Executives Advancing Diversity (LEAD) (advisory board member).
Nationality Dutch Age 50, Male
Appointed to ULE
November 2011
Joined Unilever 1993
Previous Unilever posts include:
President, North America and Global Head of Customer Development; Brazil (EVP); Unilever Foods South Africa (CEO); Unilever Bestfoods Asia (SVP and Board member).
Current external appointments: Enactus (Chairman).
LEENA NAIR
Chief Human Resources Officer
NITIN PARANJPE
President, Foods and Refreshment
RITVA SOTAMAA
Chief Legal Officer and Group Secretary
AMANDA SOURRY
President, North America & Global Head of
Customer Development
Nationality Indian Age 49, Female
Appointed to ULE
March 2016
Joined Unilever 1992
Previous Unilever posts include:
HR Leadership and Organisational Development and Global Head of Diversity (SVP); Hindustan Unilever Limited (Executive Director HR); Hindustan Lever (various roles).
Nationality Indian Age 55, Male
Appointed to ULE
October 2013
Joined Unilever 1987
Previous Unilever posts include:
President Home Care; EVP South Asia and Hindustan Unilever Limited (CEO); Home and Personal Care, India (Executive Director); Home Care (VP); Fabric Wash (Category Head); Laundry and Household Cleaning, Asia (Regional Brand Director).
Nationality Finnish Age 55, Female
Appointed to ULE
February 2013
Joined Unilever 2013
Previous posts include: Siemens AG –
Siemens Healthcare (GC); General Electric Company – GE Healthcare (various positions including GE Healthcare Systems (GC)); Instrumentarium Corporation (GC).
Current external appointments:
Fiskars Corporation (NED).
Nationality British Age 55, Female
Appointed to ULE
October 2015
Joined Unilever 1985
Previous Unilever posts
include: President Foods; Global Hair (EVP); Unilever UK and Ireland (EVP and Chairman); Global Spreads and Dressings (EVP); Unilever US Foods (SVP).
Current external appointments: PVH Corporation. (NED).
KEITH WEED
Chief Marketing & Communications Officer
Nationality British Age 57, Male
Appointed to ULE
April 2010 (will retire in May 2019).
Joined Unilever 1983
Previous
Unilever posts include:
Global Home Care and Hygiene (EVP); Lever Fabergé (Chairman); Hair and Oral Care (SVP).
Current external appointments:
Business in the Community (Board member); Effie
(Board member); Historical Advertising Trust (President); Advertising Association (President); Grange Park Opera (Trustee).
Underlying sales
growth averaged 3.3% over five years
2.9%
^
3.1%
^
3.7%
UNDERLYING VOLUME GROWTH*
Underlying volume
growth averaged 1.3% over five years
1.9%
0.8%
0.9%
OPERATING MARGIN
Operating margin
averaged 17.3% over five years
24.6%
16.5%
14.8%
UNDERLYING OPERATING MARGIN*
Underlying
operating margin has steadily increased over five years from 15.5% to 18.4%
18.4%
17.5%
16.4%
FREE CASH FLOW*
Unilever has
generated free cash flow of €23.0 billion over five years
€5.0 billion
€5.4 billion
€4.8 billion
DIVISIONS
BEAUTY & PERSONAL CARE
Turnover
€20.6 billion
€20.7 billion
€20.2 billion
Turnover
growth
(0.3%
)
2.6%
0.5%
Underlying
sales growth
3.1%
^
2.9%
^
4.2%
Operating
margin
20.0%
19.8%
18.4%
Underlying
operating margin
21.9%
21.1%
20.0%
FOODS & REFRESHMENT
Turnover
€20.2 billion
€22.4 billion
€22.5 billion
Turnover
growth
(9.9%
)
(0.4%
)
(2.2%
)
Underlying
sales growth
2.0%
^
2.7%
^
2.7%
Operating
margin
35.8%
16.1%
14.0%
Underlying
operating margin
17.5%
16.7%
15.6%
HOME CARE
Turnover
€10.1 billion
€10.6 billion
€10.0 billion
Turnover
growth
(4.2%
)
5.6%
(1.5%
)
Underlying
sales growth
4.2%
^
4.4%
^
4.9%
Operating
margin
11.5%
10.8%
9.5%
Underlying
operating margin
13.0%
12.2%
10.9%
*
Key Financial Indicators.
^
Wherever referenced in this document, 2018 underlying sales growth does not include price growth in Venezuela for the
whole of 2018 and in Argentina from July 2018. 2017 underlying sales growth does not include Q4 price growth in Venezuela. See pages 23 and 24 on non-GAAP measures for more details.
◇
The Group has revised its operating segments to align with the new structure under which the business is managed.
Beginning 2018, operating segment information is provided based on three product areas: Beauty & Personal Care, Foods & Refreshment and Home Care.
Underlying sales growth, underlying volume growth, underlying operating margin and free cash flow are non-GAAP measures. For
further information about these measures, and the reasons why we believe they are important for an understanding of the performance of the business, please refer to our commentary on non-GAAP measures on
page 23.
BIG GOAL: By 2020 we will help more than a billion people take action to improve
their health and well-being. See page 13.
HEALTH & HYGIENE
Target: By 2020 we will help more than a billion people to improve their health
and hygiene. This will help reduce the incidence of life-threatening diseases like diarrhoea.
1 billion
653 million
601 million
538 million
f
NUTRITION
Target: By 2020 we will double (ie up to 60%) the proportion of our portfolio
that meets the highest nutritional standards, based on globally recognised dietary guidelines. This will help hundreds of millions of people to achieve a healthier diet.
60%
48%
39%
¥
35%
REDUCING ENVIRONMENTAL IMPACT
BIG GOAL: By 2030 our goal is to halve the environmental footprint of the making
and use of our products as we grow our business. See pages 13 to 14.
GREENHOUSE
GASES
Target: Halve the greenhouse gas impact of our products across the lifecycle
(from the sourcing of the raw materials to the greenhouse gas emissions linked to people using our products) by 2030 (greenhouse gas impact per consumer use).+
(50%
)
6%
q
9%
¥
8%
Target: By 2020 CO2
emissions from energy from our factories will be at or below 2008 levels despite significantly higher volumes (reduction in CO2 from energy per tonne of production since 2008).**
£145.92
70.46
†
76.77
¥
83.52
f
WATER
Target: Halve the water associated with the consumer use of our products by 2020
(water impact per consumer use).
(50%
)
(2%
)q
(2%
)¥
(7%
)
Target: By 2020 water abstraction by our global factory network will be at or
below 2008 levels despite significantly higher volumes (reduction in water abstraction per tonne of production since 2008).**
£2.97
1.67
†
1.80
¥
1.85
f
WASTE
Target: Halve the waste associated with the disposal of our products by 2020
(waste impact per consumer use).
(50%
)
(31%
)†q
(29%
)
(28%
)f
Target: By 2020 total waste sent for disposal will be at or below 2008 levels
despite significantly higher volumes (reduction in total waste per tonne of production since 2008).**
£7.91
0.20
†
0.18
¥
0.35
f
SUSTAINABLE
SOURCING
Target: By 2020 we will source 100% of our agricultural raw materials sustainably
(% of tonnes purchased).
100%
56%
56%
51%
ENHANCING LIVELIHOODS
BIG GOAL: By 2020 we will enhance the livelihoods of millions of people as we grow
our business. See page 14.
FAIRNESS IN THE
WORKPLACE
Target: By 2020 we will advance human rights across our operations and extended
supply chain, by:
• Sourcing 100% of procurement spend from suppliers meeting the mandatory requirements of the Responsible
Sourcing Policy (% of spend of suppliers meeting the Policy).
100%
61%
‡†
55%
‡¥
–
• Reducing workplace injuries and accidents (Total Recordable Frequency Rate of workplace accidents per
million hours worked)**.
0.69
†
0.89
¥
1.01
f
OPPORTUNITIES
FOR WOMEN
Target: By 2020 we will empower 5 million women, by:
• Promoting safety for women in communities where we operate.
• Enhancing access to training and skills (number of women).
5 million
1.85 million
†
1.26 million
¥
0.92 million
• Expanding opportunities in our value chain (number of women).
• Building a gender-balanced organisation with a focus on management (% of managers that are
women)**.
50%
49%
†
47%
¥
46%
INCLUSIVE
BUSINESS
Target: By 2020 we will have a positive impact on the lives of 5.5 million
people by:
• Enabling small-scale retailers to access initiatives aiming to improve their income (number of
small-scale retailers).
5 million
1.73 million
1.60 million
1.53 million
• Enabling smallholder farmers to access initiatives aiming to improve their agricultural
practices.
0.5 million
0.75 million
0.72 million
¥
0.65 million
Baseline 2010 unless otherwise stated
**
Key Non-Financial Indicators.
†
PricewaterhouseCoopers assured in 2018. For details and 2018 basis of preparation see www.unilever.com/investor-relations/annual-report-and-accounts/
¥
PricewaterhouseCoopers assured in 2017. For details and 2017 basis of preparation see www.unilever.com/sustainable-living/our-approach-to-reporting/reports-and-publications-archive
f
PricewaterhouseCoopers assured in 2016. For details and 2016 basis of preparation see www.unilever.com/sustainable-living/our-approach-to-reporting/reports-and-publications-archive
‡
During 2017 and 2018 we amended how we assessed compliance with the Responsible Sourcing Policy, hence year-on-year data is not comparable.
Around 490,000 women have accessed initiatives under both the Inclusive Business and the Opportunities for Women pillars
in 2018.
( )
In the table above, brackets around numbers indicate a negative trend which, for environmental metrics, represents a
reduction in impact.
+
Target approved by the Science Based Targets Initiative.
q
The spreads business was sold in mid-2018 and is excluded from the performance
measure (including the baseline) to ensure alignment with the existing business structure.
UNILEVER
OPERATES IN THE FAST-MOVING CONSUMER GOODS (FMCG) INDUSTRY, ONE OF THE WORLD’S LARGEST, MOST COMPETITIVE AND DYNAMIC.
MARKET OVERVIEW
The top 25 global FMCG players generate sales of over €700 billion in markets characterised by their dynamic
nature. A global, digital economy is fuelling rapid change characterised by fragmentation throughout the value chain. This requires fast, innovative, profitable global and local responses in areas such as supply chain, customer development,
marketing and brand innovation.
In response, Unilever has reorganised into three Divisions: Beauty
& Personal Care, Foods & Refreshment and Home Care. Each has implemented our C4G change programme which was introduced in 2016 to create a simpler
organisation capable of innovating more quickly to evolve our brand portfolios and meet changing trends more effectively – harnessing our global scale and local expertise. Acquisitions of new brands have further supplemented our core
portfolios.
The use and threat of tariffs for political leverage continues to drive uncertainty in our markets. Currency volatility in Argentina, Turkey and Pakistan
as well as major political disruption in markets such as Brazil, continues to demand rapid local responses from our brands.
Our business is shaped by systemic macro
forces. We periodically review these to ensure our strategy remains relevant. We believe there are four distinct but overlapping macro trends that will shape the world over the next ten years.
DIGITAL AND TECHNOLOGY REVOLUTION
Business is evolving at a faster pace than
ever. Traditional understanding and engagement with consumers is being redefined. Digital technology is transforming relationships with consumers – from connectivity and the Internet of Things, to robotics, artificial intelligence and augmented
reality. All are linked by more targeted and data-driven marketing.
Fragmentation remains a principal driver of change, impacting consumer journeys, route-to-market channels and media, and brand spend. Consumers are taking different paths to purchase, often combining offline and online channels where influencers are a
growing force. Younger consumers continue to prioritise meaning over materialism and are demanding more authenticity, transparency and natural ingredients. The talkability of brands is vital in a fragmented digital media landscape, favouring those
with a strong point of view, or purpose, relevant to consumers. The growth of the global workforce and middle class consumers, especially in emerging markets, has resulted in long-term shifts favouring greater convenience and time-saving attributes.
Channels to reach consumers are equally fragmented. There is less reliance on ‘big box’ retailers with e-commerce
growing 13% globally, driven by direct-to-consumer models and platforms such as Amazon and Alibaba. The market is also polarising between specialist channels and
discounters and convenience stores, creating both risks and opportunities for FMCG companies.
The proliferation of digital and social media channels has resulted in
media fragmentation, with digital advertising now about 40% of the market. However, improving standards and tackling fraud to protect the integrity of digital marketing are major challenges.
POLARISED WORLD
Slow and uneven economic growth, rising inequality, political
polarisation and the rise of nationalism within countries is impacting consumer confidence. At the same time, consumers continue to have low confidence in government, business, media and NGOs, according to the Edelman Trust Barometer. However,
according to the same study, three out of four people agree a company can take action to both increase profits while improving economic and social conditions in the community it operates in.
ENVIRONMENT UNDER PRESSURE
According to a 2018 Intergovernmental Panel on Climate Change report, the world is on course for warming of 1.5 degrees Celsius by as early as 2030. Drought, floods,
extreme heat and poverty for hundreds of millions are threatened if no action is taken to curb emissions. The cost of inaction will be profound, estimated to be about $44 trillion in lost GDP. But the rewards for positive action are substantial and
thanks to the Paris Agreement, nearly 200 countries are pursuing carbon reforms. This is helping to open about $23 trillion in opportunities for climate-smart investments in 21 emerging markets alone by 2030.
Climate change also threatens our food system which must produce 50% more food to feed over 9 billion people by 2050. However, changing weather patterns and growing
seasons threaten suitable cultivation areas around the world. Business can spur positive change and achieving food security could create 80 million jobs and business opportunities worth $2.3 trillion annually by 2030. Linked to climate change
is water scarcity, a threat to 3.2 billion people. If current usage continues the world will have only 60% of its required water by 2030. See pages 30 and 33 to 35 for more on climate change risks.
Other environmental concerns are growing in significance, such as plastic packaging. The Ellen MacArthur Foundation found that 95% of the value of plastic packaging is
lost to the economy after one short use, equivalent of $80-120 billion lost to the global economy each year. See pages 14 to 15 and 30 for more on plastic packaging risks and opportunities.
PEOPLE LIVING DIFFERENTLY
Concerns about the planet and society are matched by
concerns about our own health and what we eat. Growing urbanisation is shaping new health priorities while the cost of care is also rising, placing health services under increased pressure. Obesity kills more people than hunger, while many
populations struggle to find sufficient nourishment in their diets. Sugar is seen as a major threat which has resulted in a number of countries choosing to implement a tax on it. For food companies, this presents a mix of challenges and
opportunities. Meanwhile, public awareness around mental health issues continues to grow, particularly with digital connectivity.
Consumers are now living in
communities that are becoming more diverse with fragmented identities. Younger generations, especially Millennials and Generation Z, continue to have a powerful influence on cultural norms – on issues such as diversity and discrimination.
Meanwhile, older generations are exerting a strong economic influence. The number of people aged 80 or over is expected to triple by 2050.
Migration is having a
profound effect on national identity. One in 30 people are international migrants living abroad, a 40% rise since 2000. People are encouraged to move, in part, by the rise of global megacities with more than ten million inhabitants. The number of
these will rise from 31 to 41 by 2030. Such urbanisation is expected to create an additional 500 million one-person households between 2016 and 2030. Climate change looks set to increase migration even
further as populations are displaced due to rising sea levels and changing climates.
The #MeToo movement has encapsulated a major shift in women’s rights. The
global gender gap in primary school completion and enrolment in secondary school has closed, however barriers and opportunities remain, particularly on equal pay. According to the World Bank, gender equality would enrich the global economy by an
estimated $160 trillion if women were earning as much as men in the workplace. Men themselves face changing roles. Time spent with children has almost quadrupled for men since 1965 and in some countries the burden of care is changing in response to
improved paternity leave entitlements and shared parental leave. Changing demographics and societal expectations present significant risks and opportunities for FMCG companies.
Find out more about how we are responding to the trends outlined in this section in delivering value for our stakeholders (pages 11 to 18).
UNILEVER HAS A
PROVEN BUSINESS MODEL THAT SUPPORTS LONG-TERM, SUSTAINABLE VALUE CREATION.
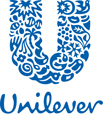
Our business activities span a complex, global and cyclical value chain. The start of our
value chain is consumer insight. We track changing consumer sentiment through our 27 People Data Centres around the world. Through close collaboration between marketing and R&D, we use our insights to inform product development, leveraging our €900 million annual R&D spend. Our research aims to bring together the best thinking and ideas from wherever they exist – within Unilever and beyond, including universities and specialist
companies.
We work with tens of thousands of suppliers and spend around €34 billion on goods and services.
Our supply chain sources the materials and ingredients that make up our products. Our global manufacturing operations across more than 300 factories in 69 countries turn these raw materials into products with a total volume of nearly 19 million
tonnes.
Our products are then distributed via a network of around 400 globally coordinated distribution centres to 26 million retail stores, from large
supermarkets, hypermarkets, wholesalers and cash and carry, to small convenience stores, as well as other fast-growing channels such as e-commerce, out-of-home and direct-to-consumer.
We are
the second largest advertiser in the world, based on media spend. We create an increasing amount of tailored content ourselves to market our brands, using digital channels.
Underpinning our value chain is a set of defining strengths which set us apart from our competitors: our portfolio of global,
purpose-led brands and local jewels; a geographic presence in more than 190 countries with 58% of our turnover in emerging markets; deep distribution capability through ever more complex channels; and a talent
pool of local leaders – over 80% of our business leaders are local to their markets.
Our strategy (see page 10) and our Divisional strategies (see pages 11 to
12) harness these strengths to deliver competitive top and
bottom-line growth, and capital efficiency which in turn drives underlying operating margin, free
cash flow and return on invested capital – and ultimately attractive returns for shareholders.
To respond further to the increasing pace of change and
accelerate value creation, we have embedded our C4G programme across all Divisions so we are a faster, simpler organisation. We are also rapidly embracing new digital technologies such as the Internet of Things, AI and robotics to get even closer to
our value chain partners and consumers.
Our strategy and business model continue to deliver solid growth. From 2014 to 2018 we have delivered average underlying
sales growth of 3.3% a year while underlying operating margin increased by an average 70 basis points per year to 18.4%. Longer term, Unilever has grown dividends by an average of 8% per year over the last 38 years, with no reductions.
We are on track to meet a number of targets to accelerate shareholder value since 2017. These include underlying sales growth ahead of our markets, which we expect to
translate into underlying sales growth of 3-5% each year up to 2020, projected cumulative savings of €6 billion by 2019 and an expansion of underlying
operating margin from 18.4% in 2018 to 20% by 2020. Return on Invested Capital is expected to be sustained in the high teens and dividends will continue to rise, reflecting confidence in the outlook for profit growth and cash generation.
Sustainable value creation also means creating value for the many stakeholders Unilever relies on. The Unilever Sustainable Living Plan (USLP) is at the heart of our
multi-stakeholder business model and vision to grow our business, whilst decoupling our environmental footprint from our growth and increasing our positive social impact – in turn contributing to the United Nations Sustainable Development Goals
(see page 15). The USLP helps us to deliver more growth through our brands with purpose, less risk by future proofing our supply chain, lower costs through eco-efficiency practices and more trust from the
stakeholders who we rely on.
GROWING THE CORE, EVOLVING THE PORTFOLIO AND DEVELOPING
CHANNELS ARE AT THE HEART OF OUR STRATEGY.
Our strategy helps us deliver top and bottom line growth in a fast-changing world. It is underpinned by C4G which aims to
create a faster, simpler organisation.
WINNING WITH BRANDS AND INNOVATION
Rapid innovation is critical to respond effectively to the fragmentation we are experiencing in consumer segments, routes to market and media channels. Innovation varies
by Division based on market requirements and brand strategies but we split projects into three separate groups. Firstly, we have global roll-outs, such as the Sunsilk Natural Recharge launched in 5 markets in 2018. Secondly, we have local
innovations marketed through global brands, such as our partnership with Kinder (owned by Ferrero) which was launched in several European countries following success in France. Finally, we have local brands with local innovation, such as Vim bars
with mint extract launched in India.
Our faster response to consumer trends is due to different
ways of working to meet the needs of local consumers and customers, and quick decision-making. Global marketing networks called Brand Communities work hand in hand with more than 230 Country Category Business Teams (CCBTs) that operate as
multifunctional entrepreneurial units. This allows for more experimentation, responsiveness and scaling up of innovation across markets. We are already seeing an improvement in time to market across our portfolio as a result of a range of
initiatives to speed up the innovation process. For example, time to market with new innovations to meet local trends is now 40-50% faster compared to 2016.
Our portfolios are evolving to meet consumer demand for brands that take a stand on issues they
care about. Unilever’s purpose and our Sustainable Living brands are key to driving purchase preference. Consumer trust in brands is also driven by their experiences of marketing. In 2018 we took a key role in the industry ensuring digital
responsibility covering content, platforms and measurement while also campaigning to improve influencer marketing and combat fraud in the digital ecosystem.
Related principal risks (pages 29 to 32): Brand preference, Economic and political instability, Portfolio management, Safe and high-quality products, Sustainability,
Climate change, Plastic packaging
WINNING THROUGH CONTINUOUS IMPROVEMENT
C4G
plays a significant role in driving growth, but is also responsible for margin expansion for profitable growth. Through sharper financial discipline governing overhead spending, and our zero-based budgeting
(ZBB) approach, we are reducing costs and uncovering innovative ways of working.
We are
applying the 5S ‘smart’ programme across the Group which cuts costs and examines the business case for improvements more broadly driving savings through smart buying, smart sourcing and a smart product portfolio, as well as leveraging our
supplier Partner to Win programme. 5S also drives revenue and margin through smart mix and smart pricing delivered through our Net Revenue Management programme. 5S is delivering over
€1 billion of savings per year, with the aim to reinvest two-thirds of these savings.
Brand and Marketing Investment is focused on maximising return on spend. We are increasing spend in
the areas driving growth, such as digital media and in-store, whilst reducing production and promotional spend. In 2018 we generated savings in BMI of over
€500 million. We are creating more content in-house while making existing assets go further. Our 16 U-Studios
in 13 countries create brand content faster and more efficiently than external agencies. Improvements to measurement and verification of digital audiences ensure we maximise value in digital advertising alongside improvements in the measurement of
influencer follower data.
Related principal risks (pages 29 and 31): Brand preference,
Supply chain
WINNING IN THE MARKETPLACE
Every day, 2.5 billion people use our products. We evolve our portfolio to reach consumers in all income brackets from our prestige range in Beauty &
Personal Care, built from carefully selected acquisitions, to the roll-out of affordable products, such as Domex Toilet Cleaning Powder in India, for low income consumers. We reach wide into new geographies,
with brands expanding into new pockets of growth such as launching Ben & Jerry’s Moo-phoria low calorie ice cream in the US and Premium Cif sprays in 15 European markets in 2018.
Data is key and our ambition is to build one billion one-to-one consumer relationships through our People Data Centres which connect us with consumers in a responsible way through real-time analytics. Our 27 People Data Centres identify trends from social
listening alongside engaging with consumers on ideas for new launches. Our contact with consumers is governed by our Code Policy on Personal Data & Privacy which sets out the steps we take to protect personal data.
Alongside innovation, customer development is key to growth, ensuring products are available when
and where consumers want them, in the format they prefer, at the right price. E-commerce remains a crucial channel. Online is now around 5% of Unilever turnover. In China
e-commerce accounts for over 20% of turnover. We are building our business through online channels such as Amazon, Taobao in China, online grocery websites, and direct-to-consumer models deployed by Dollar Shave Club, T2 and our prestige brands.
Related principal risks (pages 29, 30 and 32): Customer relationships, Economic and political instability, Portfolio management, Sustainability, Climate
change
WINNING WITH PEOPLE
With unprecedented change happening externally, we are taking action in a number of areas to ensure we are more agile, digitally focused and networked. Our C4G programme
is empowering our people with an owner’s mindset and gives them the licence to take greater responsibility. Through C4G we are already seeing higher levels of empowerment, collaboration, experimentation and increased speed in
decision-making.
To develop the capabilities, skills and leadership which support new ways of
working, we are investing in continuous, ‘always-on’ learning programmes. We are particularly focused on digital capabilities. To develop purpose-led and
future-fit leaders, in 2018 we launched new Standards of Leadership. Developed in collaboration with thought leaders and groups of young and senior leaders, the new Standards recognise the need for leaders to embrace both the inner and outer aspects
of leadership. The ‘outer game’ is what leaders need to do to succeed; the ‘inner game’ is about their inner purpose which guides their behaviours and actions.
Attracting and retaining talent is vital to support our growth ambitions. Purpose and our Unilever
Sustainable Living Plan (USLP) remain key talent attractors with 75% of employees in our 2018 UniVoice survey believing their role contributes to the USLP and 70% believing they can fulfil their purpose at work. To reinforce this link and give more
people a stake in the business we are developing our approach to reward by including more long-term share-based incentives for business performance and progress on our USLP targets.
Related principal risks (pages 29, 31 and 32): Talent, Business transformation,
Sustainability
Our three Divisions meet the
constantly changing needs of consumers by harnessing our global scale and local expertise. Innovation is the fuel, creating great products that consumers love, from nutritionally balanced foods and refreshments, to affordable soaps that combat
disease, luxurious shampoos and everyday household care products. Whatever the brand, wherever it is bought, we’re working to ensure that it plays a part in helping fulfil our purpose as a business – making sustainable living commonplace.
BEAUTY & PERSONAL CARE
BEAUTY & PERSONAL CARE (BPC)
GENERATED TURNOVER OF €20.6 BILLION, ACCOUNTING FOR 40% OF UNILEVER’S TURNOVER AND 33% OF OPERATING PROFIT IN 2018.
The Division is our largest and includes five global brands with turnover of €1 billion or above, namely Axe,
Dove, Lux, Rexona and Sunsilk, as well as other household names such as TRESemmé, Signal, Lifebuoy and Vaseline. BPC has leading global positions in hair care, skin cleansing and deodorants, and strong local positions in skin care and oral
care. The prestige business leads in premiumising our portfolio with turnover of €490 million from brands including Dermalogica and Hourglass.
BPC’s strategic ambition is to become the most valuable and admired BPC company, led by its purpose ‘Beauty that cares for people, society and our planet’.
Its priorities are to continue to grow its core brands, build a future-fit portfolio, lead in high-growth spaces and adopt a new model of marketing. The priorities reflect and respond to key trends shaping the
Division. 2018 saw increasing fragmentation across route to market, retail channels and media, alongside growing data, analytic and automation capabilities. Together these trends are creating a more dynamic, complex and sophisticated landscape with
greater segmentation, differentiation and personalisation.
BPC’s core brands are introducing new innovations and formats quickly and at scale, such as the new
shower mousses from Axe, Dove and Radox as well as a growing range of products which respond to the trend for natural and wellbeing products. During 2018 we launched Vaseline Clinical Care and Dove Derma Series in the fast-growing therapeutics
segment and Dove Facial Cleansing Series infused with 100% plant-derived botanical oils in Japan. Hair care has created and launched multiple naturals products, creating a business with over
€300 million in turnover in 2018.
Succeeding in the hyper-fragmented world demands greater consumer
responsiveness and we are proud to have launched nine new brands over the past two years: ApotheCARE Essentials, Hijab Fresh, K-Bright, K-JU, Korea Glow, Love Beauty and
Planet, Pure Derm, Purifi and Skinsei. Love Beauty and Planet has expanded from North America into four markets in Europe and is now active across several categories including skin cleansing, deodorants, skin care and hair care.
Our acquisitions play a key role in building the future-fit portfolio. In the last four years, BPC has acquired 13 companies including wellbeing focused Equilibra in
2018. AHC (Carver Korea), acquired in 2017, showed strong e-commerce performance and in 2018, we rolled it out to Taiwan, Hong Kong, Singapore, Malaysia and Russia. Schmidt’s Naturals, also acquired in
2017, has extended beyond deodorants into more categories. The acquisition of Quala S.A completed in February 2018. Within two months of acquisition, its Savile and Ego extensions had brought to market multiple new products in five categories.
Strong progress has been made building a highly attractive prestige portfolio which is on track to becoming a €1 billion business. Our most recent acquisition in prestige, Hourglass, is
growing fast, expanding into new geographies and with a commitment to become entirely vegan by 2020.
Future growth will depend on accelerating the adoption of a new
model of marketing focused on brands with purpose, generating great content, delivered via digital channels using advanced data and analytics. The model is creating many new consumer touchpoints. For instance, Axe collaborated with DJ Martin Garrix
to launch his Burn Out video with over 40 million YouTube views to date, celebrating the brand’s message of individuality. In Latin America, Sunsilk partnered with an online influencer to co-create
products for curly hair.
Our purpose-led brands are well positioned to meet growing concerns about the fragility of the
planet and consumer preference for more
sustainable products. In October we joined calls from consumers, NGOs and politicians for a worldwide ban on animal testing of cosmetics and Dove, the Division’s
biggest brand, achieved PETA accreditation as ‘cruelty free’. The PETA cruelty-free logo will start appearing on many packs in 2019 and more brands are set to follow. We are also developing new packaging solutions with less plastic, better
plastic and no plastic. REN launched a sea kelp and magnesium body wash in a bottle made from 100% recycled plastic, with 20% from recovered ocean plastic. Simple launched biodegradable face wipes made from renewable plant fibres and sustainable
wood pulp. More packaging innovations will be launched in 2019.
Overall, underlying sales growth was 3.1%, driven by skin care and skin cleansing, but partly offset
by slower growth in deodorants and oral care due to market and competitive pressures. Profitability progressed with underlying operating margin improving 80 basis points to 21.9%. Geographically, a number of countries grew above the market including
US, Canada and the UK while emerging markets such as Pakistan and Bangladesh also had high growth. Brazil underperformed as did Japan and parts of Western Europe, where markets were flat to declining. In our channels,
e-commerce remains a key driver of growth alongside the Health & Beauty channel where we would like to see faster growth following a slow year, especially in North America.
Looking ahead, we will continue to build our future-fit portfolio while adopting the new model of marketing, to deliver strong growth, making an accretive contribution to
Unilever’s top and bottom line.
FOODS & REFRESHMENT
FOODS & REFRESHMENT (F&R) GENERATED TURNOVER OF €20.2 BILLION, ACCOUNTING FOR 40% OF UNILEVER’S
TURNOVER AND 58% OF OPERATING PROFIT IN 2018.
The Division launched in January 2018 after the previous Foods and Refreshment Categories merged. The integration and
relocation of the global teams to Rotterdam is complete. The disposal of the spreads business was also completed in July. F&R now includes the foods, ice cream and beverages categories, as well as Unilever Food Solutions, our dedicated
foodservice business. F&R is home to five global brands with turnover of €1 billion or above, namely Knorr, Hellmann’s, Magnum, Lipton and Heart brand (eg Wall’s) as well as
other famous global brands including Brooke Bond and Ben & Jerry’s. It also includes local jewels such as Bango and Robertson’s plus recent B Corp acquisitions such as Pukka Herbs, Sir Kensington’s and Mãe Terra.
F&R’s ambition is to accelerate growth while improving underlying operating margin. F&R’s purpose ‘Taste good, Feel good, Force for good’ underpins our strategic priorities which are to: transform the portfolio; organise
for agility and lower costs; and transform capabilities.
Our efforts to transform the F&R portfolio are driven by consumer insights. For example, we are seeing
stronger preference for healthier products with more natural and organic ingredients. F&R has launched a number of products addressing this trend, including Magnum and Hellmann’s vegan variants in Europe, meat-free Knorr launches in the
Nordics and Ben & Jerry’s non-dairy alternatives. Knorr also expanded its organic and 100% natural ranges in Europe. In our beverages category, we continue to grow our ‘good for me tea’
ranges. Lipton’s range, which includes variants such as detox and stress-less, continued its global roll-out with strong performance. Recently acquired brands such as Pukka Herbs are being rolled out at
pace. However, given continuous acceleration of the external landscape, we have to step up portfolio transformation further and increase the speed of our response to trends.
Our market-focused organisation and agility supports our portfolio transformation and delivered several new brands in 2018 such as RED RED (UK), Culture Republick (US),
and Jawara (Indonesia). We announced an agreement to acquire Horlicks and other consumer healthcare nutrition products in India and other Asian markets from GlaxoSmithKline (GSK), and also acquired the Vegetarian Butcher (Netherlands) and three ice
cream brands – Adityaa (India), Betty (Romania) and Denny (Bulgaria). After success in the US, Breyers Delights was launched in Europe. In addition, we introduced innovative licensed ice cream brands including Kinder in Europe and Cornetto Oreo
in India.
DELIVERING LONG-TERM VALUE FOR OUR STAKEHOLDERS CONTINUED
Consumers’ shopping habits continue to change. We launched the IceCreamNow platform in partnership with restaurant
delivery services, building a new home-delivery channel. We have also launched a global front-of-house programme to showcase our teas and condiments in restaurants,
hotels and bars, and to capitalise on the growth of eating out and out-of-home consumption. These represent significant business opportunities.
The second F&R strategic priority is to organise for agility and lower costs. In 2018, our 5S and ZBB programmes stepped up fuelling our gross margin and marketing
support. We will continue our savings programme to reduce structural costs, while providing funding for portfolio transformation and margin expansion. Our speed to market has improved by almost a third, reflecting how C4G is helping to unlock speed
and agility. We are also piloting new ways of working across our teams.
Our final strategic priority is to transform our capabilities with a focus on R&D, lean
innovation and precision marketing. The creation of our state-of-the art global Foods Innovation Centre in Wageningen (Netherlands) will further strengthen our
innovation capability. It is scheduled to open in 2019. We are also enhancing our capabilities in digital-driven marketing through extra resourcing across key markets, upskilling our current teams and hiring digital savvy marketeers.
These strategic priorities are underpinned by the development of more purpose-led brands. Knorr, Hellmann’s, Lipton, Brooke
Bond and Ben & Jerry’s continued to grow, each fuelled by a unique purpose which is resonating with consumers. Brooke Bond for example continued its work tackling cultural taboos through its campaigns, addressing same-sex relationships in Canada and divorce in the Gulf markets. Meanwhile, Hellmann’s launched a major focus on food waste with an activation in Brazil to inspire people to use Hellmann’s to transform
leftovers into tasty meals. Action on plastic packaging is another priority for F&R. We have partnered with Ioniqa and Indorama Ventures to pioneer a technology which converts PET waste into virgin grade material for use in food packaging. In
the UK, PG tips started to introduce 100% biodegradable plant-based pyramid bags. More innovations and new technologies are in the pipeline.
During 2018 F&R
turnover declined 9.9% to €20.2 billion, due to the sale of spreads and currency devaluation. Underlying sales growth was 2.0% while our underlying operating margin improved by 80 basis
points to reach 17.5%. Europe returned good results in ice cream, underpinned by good weather and innovations such as Magnum pints and Kinder ice cream. However, developed markets overall remain difficult and are seeing slower volume growth due to
increasing segmentation of consumer preferences, especially in foods, where our efforts on portfolio transformation were not enough to offset the headwinds. Traditional channels in Europe such as supermarkets and hypermarkets continue to discount,
creating deflationary pressure. Latin America had a challenging year due to tough economic conditions, a truckers’ strike in Brazil and currency headwinds in Argentina which affected growth in these two markets. Excluding Latin America,
emerging markets generally delivered a strong performance. Several key markets including India, China and Turkey saw double-digit growth reflecting the strong potential in emerging markets.
F&R will continue to drive growth and margin by focusing on its strategic priorities. Our portfolio transformation, step-up in
capabilities and shift in culture are of paramount importance to meet these objectives.
HOME CARE
HOME CARE GENERATED TURNOVER OF €10.1 BILLION, ACCOUNTING FOR 20% OF UNILEVER’S TURNOVER AND
9% OF OPERATING PROFIT IN 2018.
Home Care is home to two global brands with turnover
of €1 billion or above, namely Dirt is Good (eg Omo and Persil) and Surf. Other leading brands include Comfort, Domestos, Sunlight, Cif, Seventh Generation as well as our air and water
purification brands Blueair, Pureit and Truliva/Qinyuan. 79.5% of our turnover is in developing and emerging countries. Home Care’s ambition is to deliver sustained underlying sales growth and step up underlying operating margin.
The rapid change of consumer habits, media, competitors and channels, as well as heightened environmental stress, has redefined Home Care’s
growth opportunities. The Division responded to these changes by creating four consumer-centric categories: Fabric
solutions which focuses on ready to wear clothes (eg Omo, Surf, Radiant); Fabric sensations which focuses on fabrics, fashion and lifestyle (eg Comfort, Snuggle); Home & hygiene (eg Sunlight, Sun) which focuses on delivering care for a
cleaner world; and life essentials which unites our air and water purification brands (eg Pureit, Truliva, Blueair). Home Care’s purpose ‘Making your home a better world. Making our world a better home’ underpins the Division’s
strategic priorities: strengthening further the foundation of the business; making Home Care fit for the future; and investing in capabilities.
Home Care
strengthened the foundations of the business by delivering superior products and benefits. We launched Cif Specialist sprays across 15 countries in Europe whilst continuing to roll-out our toilet blocks to 11
more markets. We expanded our product portfolio into high potential geographies, building on our most established brands such as Omo-branded floor cleaners in Brazil. Our Comfort Intense ultra-concentrated
fabric conditioners are now in 20 markets and continue to enjoy strong growth.
Our brands made progress in embracing purpose to connect more meaningfully with
consumers – in particular millennials. In India, Domex enrolled renowned movie stars in its ‘Pick up the brush’ campaign to help overcome the social stigma associated with cleaning toilets, a key barrier to improve sanitation. Seventh
Generation, acquired in 2016, stepped up its advocacy for Climate Justice together with the Sierra Club to move cities to commit to 100% renewable energy. Home Care’s biggest brand, Omo/Persil, joined forces with National Geographic, IKEA and
Lego to promote the developmental benefits of play in children.
The second pillar of our strategy is to future-proof our business to lead new trends. We intensified
our efforts and increased our footprint in the fast-growing natural segment through the launch of Omo naturals in New Zealand, France and Brazil among others, the roll-out of Seventh Generation in more markets
and the launch of Sunlight Naturals across South-East Asia and South Africa. Our brands such as Cif, Omo/Persil and Seventh Generation responded to growing concerns about plastic by including recycled plastic in their packaging. Home Care launched
Day2, a dry wash spray that revives clothes between washes – saving time and water. Our ultra-concentrated laundry gems, a new format launched in the UK in 2017, performed below expectations. In South Africa we reacted quickly to the drought in
Cape Town with Domestos Flush Less, a toilet spray that disinfects and eliminates odours without the need to flush. We increased our presence in e-commerce, crossing
€500 million of sales and continued to experiment with new business models such as peer-to-peer laundry
services.
The third strategic pillar is investing in our capabilities. This includes partnering to tap into the opportunities that data brings to make Home Care more
efficient and better able to seize growth opportunities. In China, our water purification brand, Truliva, partnered with Alibaba to develop an online leasing market for water purifiers. We also joined forces with Ms Paris, the Chinese dress rental
platform, that allows consumers to hire designer dresses and return without laundering. To support our R&D efforts, we have inaugurated the Materials Innovation Factory at the University of Liverpool, a world-class centre of excellence in
advanced material chemistry and an ecosystem that brings together innovation partners and leading academics to develop more sustainable and superior formula and packaging for our brands.
Home Care delivered underlying sales growth of 4.2% while our underlying operating margin improved by 80 basis points to reach 13.0%. Key drivers of growth were North and
South Asia with South East Asia, Middle-East, Turkey and the US also performing strongly. By contrast, our performance in Latin America was challenged by a trucker’s strike and extreme inflationary pressures. Our home & hygiene and
fabric sensations categories delivered strong, broad-based profitable growth whereas life essentials performed below expectations largely driven by a significant decline in category growth in air purification in China and intense competitive
pressures. Margin expansion in fabric solutions was hampered by inflationary headwinds and competitive pressures on pricing.
Home Care will continue to drive growth
and margin by shifting our portfolio and footprint towards the higher growth, more profitable market segments, formats, channels and geographies while continuing to address with agility changing consumer preferences.
OUR MULTI-STAKEHOLDER
MODEL AIMS TO REWARD OUR SHAREHOLDERS WHILE POSITIVELY IMPACTING SOCIETY.
Our impact on society starts with our 155,000 employees who received €5.3 billion in pay in 2018, and extends across our value chain including the millions of retailers and distributors who sell our products in more than 190 countries, generating income and
employment for many more. Our suppliers also benefit from the €34 billion we spent on goods and services in 2018. The taxes we pay are another important contribution to society. Total tax
borne by Unilever in 2018 was €3.7 billion, of which €2.3 billion was corporation tax. Unilever fully complies with the tax laws in
the countries where we operate. Where tax law is unclear, or has not kept pace with modern business practice, we interpret our obligations in a responsible way, guided by our Tax Principles.
UNILEVER SUSTAINABLE LIVING PLAN
Our impact on society is significant but we
want our impact to go beyond business as usual, delivering value for multiple stakeholders at the same time as growing our business. This idea is encapsulated in the Unilever Sustainable Living Plan (USLP) which represents a simple idea – that
business growth and sustainability are not mutually exclusive. By focusing on sustainable growth, we believe we will generate consistent and profitable long-term shareholder returns. The USLP has three big goals: improving the health and well-being
of more than one billion people by 2020; halving our environmental footprint by 2030; and enhancing livelihoods for millions by 2020. These goals are supported by over 50 time-bound stretching targets and a transformational change agenda which aims
to create change on a systemic scale. We are making good progress overall against our targets although some remain a challenge to achieve by the end of 2020. Our Sustainable Living Report includes extensive disclosure on progress against our USLP
targets including challenges we have faced, some of which are summarised in this section of the Annual Report & Accounts.
Our actions on sustainability are
creating value in numerous ways, generating more growth, lower costs, less risk and more trust in the business. Our Sustainable Living brands, which combine a powerful purpose with products contributing to the USLP, are a key driver of growth. In
2017, 26 of our top 40 brands were Sustainable Living brands including Ben & Jerry’s, Dove and Lifebuoy. Our Sustainable Living brands grew 46% faster than our other brands and accounted for 70% of total growth. Product innovations
which respond to water scarcity and climate change at the same time as helping consumers, continue to create growth opportunities for us. Recent sustainability innovations which deliver consumer benefits include our new Love Beauty and Planet range
in the US which uses fast-rinse technology in its conditioners thereby requiring less water. Domestos Flush Less, available in water-scarce South Africa, keeps toilets clean while saving nine litres of water per flush.
The USLP strengthens our business by helping us to save costs. Since our baseline year of 2008 we have saved over
€600 million on energy costs in our factories; and by using fewer materials and producing less waste we have avoided costs of approximately
€234 million.
Through the USLP, we are also responding directly to a number of macro forces (see page 8)
that are both risks and opportunities in our markets – such as a lack of access to water and sanitation, strains on the food system, climate, the environment, and rising inequality. We have identified the broad issue of sustainability, related
to the achievement of our goals in the USLP, as a principal risk (page 29) as well as a number of specific risks including climate change (page 30) and plastic packaging (page 30). Mitigating the physical impacts of climate change is critical
because we depend on raw materials sourced from countries that are particularly vulnerable to rising sea temperatures and changing weather patterns. See pages 33 to 35 for our response to the risks and opportunities from a low-carbon economy.
Trust is essential for any business, but it must be earned. The USLP is a key driver of trust among our
employees and potential recruits. We are the number one FMCG graduate employer of choice in around 50 countries where we recruit. We have been ranked first in the annual GlobeScan survey of sustainability leaders for eight years and also came
top of the Dow Jones Sustainability Index Personal Products sector in 2018.
IMPROVING HEALTH & WELL-BEING
Our activities impact the health and well-being of millions of people – through brand-led health and hygiene, and nutrition
interventions. Significant progress has been made against our first USLP goal of helping more than one billion people improve their health and well-being by 2020. By the end of 2018, we had reached 653 million people, making a significant
contribution to the Sustainable Development Goal on Clean Water and Sanitation (SDG6).
In order to increase the reach and social impact of some of our biggest
health & hygiene programmes we continue to explore the potential of using mass media and digital to drive behaviour change at greater scale, as well as scaling up partnerships to increase the reach of more conventional on-ground programmes. Dove, one of Unilever’s biggest brands which grew at 7.8% in 2018, has reached around 35 million young people since 2004 through its Self-Esteem Project. To expand its reach, Dove has
partnered with the Cartoon Network to create Steven Universe mini episodes which bring to life the proven themes from our on-ground programmes to boost self-esteem for young people. Our aim is that this will
reach 20 million young people over the next two years. This series is supported by a music video which has so far received over 1.8 million views on YouTube. As well as reaching more young people with body confidence messaging, this
activity is helping to raise overall awareness of Dove’s work to improve self-esteem which correlates with higher purchase intent.
Since 2010, Lifebuoy’s
programmes have reached 458 million people through schools, health clinics and community outreach. Lifebuoy has recently expanded its behaviour change programme on the importance of handwashing with soap using mobile technology. The new service
aims to reach out to women in media dark areas, providing free advice to mothers on their child’s health. Another recent Lifebuoy partnership with Gavi (the Vaccine Alliance) ties together the importance of handwashing with soap and
immunisation, using a variety of channels including home visits and mobile communications. While our programmes have focused on reaching children and mothers on-ground, we have long believed that TV
advertising can drive behaviour change. To test this, we ran a study in India to assess the effectiveness of specific Lifebuoy TV adverts. The study showed a significant increase in the frequency of handwashing with soap after people watched the
adverts. We are progressing with peer review publication of our study.
For more than a decade, we have been working to make our products even healthier by increasing
goodness and reducing nutrients of concern like sugar, salt and saturated fat. We aim to double the proportion of our portfolio that meets the highest nutritional standards, based on globally recognised dietary guidelines. So far 48% of our products
have reached this standard and we are on track to meet our 2020 commitment. We are also using the power of our brands to empower people to make responsible choices. In support of our Code Policy on Responsible Marketing, in 2018 95% of our Foods and
Refreshment portfolio had full nutrition labelling on pack that aligned with Unilever’s product labelling criteria (based on 96% of global sales from 1 April 2018 to 30 June 2018). We continued our efforts to improve the goodness in
our products and set out the ambition to provide 200 billion servings by 2022 containing at least one of the 5 key micronutrients: iron, iodine, zinc, vitamin A or D. We are developing plans to deliver against the ambition.
REDUCING ENVIRONMENTAL IMPACT
Our activities impact the environment,
principally through the use of water, energy and land as well as the production of waste and greenhouse gas emissions, largely as a result of consumer use. These impacts are reflected in the USLP environmental pillar and are supported by our
Environmental Policy which is available on our website. Our environmental big goal is by 2030 to halve the environmental footprint of the making and use of our products as we grow our business. This is a challenging target requiring action across
our value chain on waste, water and greenhouse gas emissions – in turn contributing to the Sustainable Development Goals.
As a consumer goods company, we are
acutely aware of the causes and consequences of the linear ‘take-make-dispose’ model of consumption. We are taking action across our value chain to reduce, reuse, recycle and recover post-consumer waste and move towards a more circular
model. Our manufacturing operations have seen a reduction in total waste disposed to landfill, or incineration without energy recovery, of around 97% per tonne of production since 2008.
DELIVERING LONG-TERM VALUE FOR OUR STAKEHOLDERS CONTINUED
Furthermore, we achieved zero non-hazardous waste to landfill across our global
factory network in 2015 and have maintained this every year since. We are more than half way towards meeting our 2020 commitment to reduce waste associated with the disposal of our products. This has reduced by about 31% since 2010 due to increases
in consumer recycling and changes in our portfolio.
In 2017, we made a further commitment on waste, ensuring that all our plastic packaging will be fully reusable,
recyclable or compostable by 2025. We are moving in the right direction to make all of our packaging recyclable but there is more work to do. Find out more on page 15. Seventh Generation is eliminating virgin petroleum plastic (new plastic made from
oil) and virgin fibre (virgin wood pulp) from its packs and has committed that all its packaging will be fully recyclable or compostable by 2020. In Brazil, Omo is launching its first plant-based detergent in a 100% recyclable pack containing
recycled plastic.
We have reduced the water used in manufacturing by 44% per tonne of production since 2008. Our biggest water impact occurs when consumers shower,
bathe and clean clothes with our products. In 2018, our water impact per consumer use reduced by around 2% compared to 2010. We recognise that we are a long way short of halving our water impact and we will not achieve this very challenging target
by the end of 2020. This is due in part to our portfolio being made up of more products that have a higher than average water footprint than in 2010 and the significant consumer behaviour change needed to reduce water consumption when our products
are used, where the vast majority of our water footprint resides. Going forward we want to broaden our water strategy by recognising the role of water in our consumers’ lives and its importance as a growth driver for our business. We are
developing and launching innovative products which deliver the benefits people need with less water, or even no water at all, as well as products that improve the quality of water.
As with water, our biggest greenhouse gas impact comes through consumer use. The greenhouse gas impact of our products across their lifecycle has increased by about 6%
since 2010. We are having more success in areas that are within our direct control such as manufacturing where we have cut CO2 from energy by 52% per tonne of production compared to 2008.
Similarly, we continue to make savings through the ongoing roll-out of freezer cabinets that use more climate-friendly natural (hydrocarbon) refrigerants. Our ability to meet our target partly depends on
changes in the energy markets worldwide, such as the rate of installation of renewable electricity in many countries. We have a role to play as an industry leader to help shape those markets. We are committed to implementing the recommendations of
the Taskforce on Climate-related Financial Disclosures (see pages 33 to 35). Two of our carbon reduction targets have been officially approved by the Science-Based Targets Initiative.
Our sustainable sourcing strategy focuses on a set of key agricultural crops, which are not only crucial to our brands, but also where we can drive measurable impact for
sustainable transformation of the industry. By the end of 2018, the total volume of our agricultural raw materials that were sustainably sourced was 56%. In line with our strategy, sustainably sourced volumes for our 12 key crops increased by over
4% including significant increases for palm oil and tea, whilst our sustainably sourced volumes for non-key crops reduced. As a result, our performance versus 2017 was flat. The sale of our spreads business during 2018 had a slight downward impact
on overall sustainable sourcing performance given the substantial volume of sustainable palm oil used by our spreads business.
A number of key activities moved our
sustainable sourcing agenda forward in 2018. We deepened our commitment to transparency with the publication of our palm oil mill list and the creation of a grievance tracker for our palm oil supply; and we, along with key NGOs including WWF,
initiated a new jurisdictional approach to palm oil in Malaysia. The additional programmes were also supported by digital solutions like leveraging satellite data for deforestation detection and risk assessments, mapping of smallholder parcels in
Indonesia, sending critical weather alerts to farmers’ mobiles in India, and using the Internet of Things to optimise tea production in Kenya. We are also piloting innovative approaches to achieving upstream traceability in several supply
chains.
ENHANCING LIVELIHOODS
Our activities have the potential to
positively impact the livelihoods of not only our employees, but the millions of people who are involved in our value chain – notably smallholder farmers and small-scale
retailers. By 2020, we aim to enhance the livelihoods of millions of people as we grow our business. In 2018, we made
steady progress across the three pillars of our Enhancing Livelihoods goal.
We believe that women’s empowerment is the single greatest enabler of development
and economic growth. We are building a gender-balanced organisation (page 16) while improving women’s safety in the communities in which we operate, and developing employment opportunities through the Shakti programme which has provided work
for around 113,000 women, equipping them to sell Unilever products in low income rural communities. Shakti continues to scale up in India, Sri Lanka, Pakistan and Nigeria and is now being rolled out to new countries, including Colombia. By 2018, we
had also enabled about 1,724,000 women to access initiatives aiming to develop their skills.
As well as directly creating wealth and jobs, our business supports
millions of people who source, make and sell our products – we call this inclusive business. By 2018, we had enabled 746,000 smallholder farmers and over 1.7 million small-scale retailers to access initiatives to improve agricultural
practices or increase incomes. The Philippines Kabisig programme, for example, has reached over 165,000 small retailers, training them in stock control, financial management, sales and customer service – increasing the earning potential of
small-scale retailers at the same time as growing turnover for Unilever.
Our Responsible Sourcing Policy (RSP) is at the heart of our ambition to source 100% of
procurement spend responsibly and through suppliers that meet our RSP requirements. In 2018, we focused on completing the onboarding of high risk suppliers into our compliance database and programme. Over 20,000 suppliers have now completed their
registration and are undergoing review processes allowing us to verify their compliance to the RSP and identify areas for remediation. In 2018, 61% of procurement spend was through suppliers who were assessed as meeting the mandatory requirements of
the RSP.
We continued to embed human rights with a focus on our eight salient issues (ie those at risk of the most severe negative impact through Unilever’s
activities or business relationships). We also began a process to review these through a series of global and regional consultations. This year, one of our primary areas of focus has been on the eradication of forced labour in our supply chain
through training, capacity building and driving a robust vetting process for temporary labour agencies. We launched and are rolling out our Land Rights Principles and Implementation Guidance. Human rights risks are included as part of our
sustainability and ethical principal risks (see pages 29 and 33). See our website and our latest Human Rights report for more on our activities and due diligence processes.
Safety is a critically important part of our USLP. Our Vision Zero strategy continues to aim for: Zero Fatalities; Zero Injuries; Zero Motor Vehicle Accidents; Zero
Process Incidents; and Zero Tolerance of Unsafe Behaviour and Practices. This is supported by our Code Policy on Occupational Health & Safety. Our Total Recordable Frequency Rate from 1 October 2017 to 30 September 2018 went from
0.89 accidents per 1 million hours worked in 2017 to 0.69, thanks to a continuous focus in high risk areas. See page 47 for more on safety.
DRIVING
TRANSFORMATIONAL CHANGE
Our USLP is a bold ambition to achieve change within our company. However, we are just one company among many and the problems our
society faces are urgent, large and complex. Our ‘transformational change’ agenda combines direct action on the SDGs with partnerships and external advocacy to create change on a systemic scale – while unlocking business opportunities
at the same time.
We are working on a number of areas where we believe we can make the biggest difference: climate change and forests; sustainable agriculture, land
use and food security; health and well-being including water, sanitation and hygiene; and improving livelihoods and creating more opportunities for women. Many of these issues relate directly to the SDGs. We are stepping up our engagement with
governments, NGOs and others in our industry on these issues. We are also developing a range of partnerships that will accelerate and scale new solutions.
UNLOCKING GROWTH OPPORTUNITIES
FROM THE SUSTAINABLE DEVELOPMENT GOALS
The Sustainable Development Goals (SDGs) are fundamental to future economic and business growth. The Business &
Sustainable Development Commission, co-founded by Unilever, concluded that successful delivery of the SDGs will create market opportunities of at least $12 trillion a year. By using our resources as a business
to address issues such as sanitation, hygiene, nutrition, gender equality and climate change – among other interconnected growth opportunities covered by the SDGs – we are delivering benefits for our business, shareholders and society.
Partnerships (SDG17) play a key role in unlocking these opportunities. Business, governments and civil society must work together, through innovative partnerships, with new types of funding and new business models. We are working with a range of
partners across many of the SDGs, often through our brands. Below we provide three examples where we have taken action in 2018. There are many more on our website.
SDG1 – NO POVERTY: EMPOWERING SMALL-SCALE RETAILERS FOR GROWTH
Our products are sold in more than 190 countries, generating income and employment for millions of retailers and distributors who bring our brands to consumers. Inclusive
distribution models such as Shakti and our retailer training programmes such as Kabisig in the Philippines help small-scale retailers to grow while strengthening our own sales and supply networks.
For any small retailer, selling out of a product line is a missed
opportunity. But for retailers who are stuck in cash economies without access to credit, especially in the developing world, running out of stock can be a routine event.
In 2017, we began a strategic partnership with Mastercard in Kenya.
Together, we’ve launched the Jaza Duka (‘fill up your store’) initiative, which uses a combination of innovative technology, targeted training and the strength of our relationships with our distribution network to free retailers from
the constraints of cash, helping them fulfil their potential.
By digitising the processes of buying supplies and selling goods,
small-scale retailers can build the credentials they need to access short-term working capital loans from Kenya Commercial Bank. This gives them better control of their inventory, so they can keep their shelves full and meet consumer demand. They
are also able to access training and essential financial tools to help them grow their sales and incomes. Our research found that stores that fully moved to the new platform grew their sales of Unilever products by up to 20%. These are still early
days. But if the partnership keeps succeeding, we believe it could help drive growth and improve incomes.
Our partnership with
Mastercard is just one of a number of exciting new innovative last-mile distribution projects which harness the power of digital and e-commerce to create positive social impact at the same time as helping
retailers grow.
SDG6 – CLEAN WATER
AND SANITATION: ADDRESSING BASIC NEEDS THROUGH OUR PRODUCTS
Nearly a billion people defecate in the open and around 2.3 billion people live without adequate sanitation. Addressing water, sanitation and hygiene needs is a
significant opportunity for Unilever. A number of our health and hygiene brands directly address these needs through products and innovative partnerships which drive growth and deliver positive impact at scale, including Lifebuoy, Domestos,
Vaseline, Signal and Pureit.
Domestos, which is one of our fastest growing brands, has committed to
help 25 million people gain improved access to a toilet by 2020 in countries such as India. By partnering with UNICEF, over 16 million people between 2012 and 2017 gained access to a toilet through behaviour-change interventions and
capacity-building initiatives. In 2018, Domestos went one step further and refocused its brand and marketing investment around its purpose. The new ‘Unstoppable’ campaign, now live in the UK and Poland, is showcasing how Domestos is
helping to fight germs while improving sanitation conditions for millions around the world.
Pureit, our water purification business, is another brand that is well
positioned to address clean water needs in South Asia. It has provided 106 billion litres of safe drinking water since 2005 through the sale of water purifiers. Pureit is looking at different models to serve communities with accessible and
affordable clean drinking water where it is most needed. One model is community water plants, which provide 20 litres of clean drinking water from a central point for just 8 to 10 rupees. In 2017, we began partnering with Water Health International
(WHI) who are global experts in community water systems. So far, we have set up four pilot plants in the city of Tumkur in India, managed by WHI.
These examples show
that everyday products can help prevent disease and improve people’s wellbeing, while helping us grow our business.
SDG12 – RESPONSIBLE
CONSUMPTION AND PRODUCTION: RETHINKING PLASTIC PACKAGING
Plastic has become an integral part of our lives. It protects products and makes them easy to dispense or reseal after use. But with that has emerged the enormous –
and growing – problem of plastic waste. It is littering our environment, polluting our seas and killing aquatic life. The challenge is that so little plastic packaging is currently recycled, recyclable or reusable. The result is a significant
economic loss for society and business. It is for these reasons that we have singled out plastic packaging as a principal risk for our business in 2018 (see page 30 for more).
In 2017, we were one of the first multinational companies to make a public
commitment to address plastic packaging waste. By 2025, all our plastic packaging will be reusable, recyclable or compostable and at least 25% of it will come from recycled plastic content. To help deliver these commitments we have an internal
framework: Less plastic. Better plastic. No plastic. ‘Less plastic’ is about cutting down how much we use in the first place. Since 2010 we’ve reduced the weight of our packaging by 18% through lightweighting and design improvements.
For example, several years ago we launched MuCell technology which uses gas-injection to create gas bubbles in the middle layer of a bottle wall. This cuts the amount of plastic by at least
15%.
‘Better plastics’ is about making our products recyclable and
eliminating problematic materials. Specifically, how we get recycled content in our packaging – a number of our brands are working to incorporate post-consumer recycled (PCR) plastic in their products including Love Beauty and Planet,
TRESemmé, Sunlight and Omo. Better plastics is also about how we work with governments and partners to build infrastructure so we can help keep plastic in the economy and out of the natural environment. Our Community Waste Banks and CreaSolv®Sachet recycling technology pilot plant in Indonesia are at the heart of these efforts. The plant is currently processing around three tonnes
of discarded sachets per day with an aim to scale up this process.
‘No plastics’ is about thinking differently – using
alternative materials such as aluminium, glass, paper and board where possible and removing plastic where it is not necessary, such as plastic stiffeners from soap bars. We’re also looking at reuse, encouraging shoppers to refill or reuse
through vending machines. It’s early days but we are committed to finding non-plastic packaging solutions.
We’re putting significant resource into tackling the issues associated with plastic packaging. It makes business sense to keep plastic in the economy and is
imperative for the planet.
DELIVERING LONG-TERM VALUE FOR OUR STAKEHOLDERS CONTINUED
OUR PEOPLE
UNILEVER EMPLOYEES ARE EMPOWERED TO
ACT LIKE BUSINESS OWNERS IN A PURPOSEFUL CULTURE.
The world of work is rapidly changing. Automation, flexible resourcing and new business models continue to impact
our business and workforce. The workforce expects more flexibility and is increasingly freelance. A job for life is no longer the norm. Once employed, people must regularly reinvent themselves with new skills. The digital transformation of work and
growth of automation is bringing both great benefits, but also great disruption. The composition of the workforce is changing too. By 2020, Millennials will make up around 35% of the global workforce. Just over half of Unilever’s own workforce
in 2018 were Millennials.
CREATING A FUTURE-FIT WORKFORCE
In response to the trends outlined above, we are taking action across our business, including simplifying processes and ways of working to free people from non-value adding tasks so they can focus on key priorities. 2018 saw the continued implementation of Connected 4 Growth (C4G), our organisational change programme, and the creation of three new Divisions to bring
further focus and simplicity. Our regular surveys show that 74% of our people now feel more empowered to make decisions. Our time to bring innovations to market is now 40-50% faster than in 2016.
With the advance of AI and robotics, it is more important than ever that we strike the right balance between the use of technology and more human-centred approaches. We
have invested in Una Hub, an AI-based platform, which automates responses to all general employee enquiries so People Experience Leads and HR Business Partners can focus on more complex queries, and provide face-to-face support where relevant.
Our research shows that a focus on purpose helps
attract talent and binds us together for growth. Through our People with Purpose programme, more than 30,000 employees have joined workshops to help them define their purpose, with 50,000 targeted by 2019. Our global Univoice survey results
reinforce the importance of these workshops – 92% of employees who believe they can live their purpose at Unilever, also say that their job inspires them to go the extra mile.
As the workplace changes it is important that we continue to prioritise mental wellbeing. In 2018, we officially recognised World Mental Health Day in October and
continue to invest in the mental wellbeing of our people, alongside their physical wellbeing. This builds on the roll-out of a mental wellbeing framework globally several years ago which guides us in tackling
the health risks across our business.
Another area of focus is on personalising training and capability building to develop the right leaders and teams who are fit
for the future. We are responding to demands for new skills through continuous learning. Since the launch of Degreed, our online learning platform in 2017, 76,000 people have access to 2.3 million pieces of learning content, with 55,000 pieces
being consumed on a monthly basis, including PowerUp, our digital upskilling programme. We are also accelerating impact through new agile ways of working. In the UK and US we are piloting more agile team structures to ensure we have the right
people, doing the right job at the right time, while breaking down silos.
RECRUITMENT AND RETENTION
Our attractiveness as an employer is improving amongst Millennial and Generation Z recruits. We are the number one FMCG graduate employer of choice in around 50 countries
and the most followed FMCG employer on LinkedIn with over 4 million followers as at the end of 2018.
In 2018 we introduced more ways to give our employees a
voice, through monthly pulse surveys and global and local surveys on a range of topics, reaching around 70,000 people. Our largest listening exercise is the annual engagement survey called UniVoice which covered a representative sample of almost
25,000 office-based employees in 2018. We maintained high levels of employee engagement – 90% of employees said they were proud to work for Unilever and our Engagement Index remained at 74%. The survey also reinforced the
importance of focusing on speed and responsiveness to
the market. We use survey results to help us take action in areas where there is room for improvement. For example, last year we implemented the new Standards of Leadership in response to feedback we received. Alongside our UniVoice survey, we use
Glassdoor to benchmark our employee experience. As at 31 December 2018, our rating of 3.9 out of 5 was above the site average of 3.2.
DIVERSITY AND INCLUSION
We want our culture to be inclusive, promoting gender
balance and respecting the contribution of all employees regardless of gender, age, race, disability or sexual orientation – as set out in our Code Policy on Respect, Dignity and Fair Treatment.
The USLP sets out clear targets for expanding opportunities and enhancing access to skills and training for women in our value chain. It also sets out our ambition to
build a gender-balanced workforce within Unilever, with 50% of women in management positions by 2020. By the end of 2018, 49% of total management were women (47% in 2017). Among the top 92 executives, 23% were women (22% in 2017). If you include
employees who are statutory directors of the corporate entities whose financial information is included in the Group’s 2018 consolidated accounts in this Annual Report and Accounts, the number increases to 474 (71%) males and 190 (29%) females.
38% (5 out of 13) of the Board were female (38% in 2017). Of our total workforce of 154,848, 101,383 (65%) were male and 53,465 (35%) were female at the end of 2018.
We run programmes across Unilever aimed at attracting, retaining and developing female talent. This includes developing candidates for potential future roles, aiming for
‘balanced slates’ so that we interview equal numbers of men and women for roles, and practical help such as a minimum 16 weeks paid maternity leave as a global standard – more than the regulatory requirement in over 50% of countries
where we operate. In 2018, we also committed to introduce by the end of 2019, three weeks of fully paid paternity leave as a benefit to all new fathers, adopting partners and parents in same-sex couples.
Unilever has a commitment to gender equality and fairness in the workplace based on equal pay for equal work and achieving greater gender balance. Pay and overall reward
is intended to be gender neutral, with any differences between employees in similar jobs reflecting performance and skill. Gender pay gaps develop where there is a representational imbalance between genders. When we look at our worldwide business as
a whole, in countries with more than 250 employees, the average female pay was 26% higher than male pay in 2018 (2017: 25%). This is largely due to the fact that 80% of our lower paying blue-collar roles are held by male employees. ‘Equal pay
for equal work’ is our primary ambition and is a crucial part of fair compensation. Our Framework for Fair Compensation reviews the average pay differences between genders at each work level and in each country. The most recent analysis
highlights that there is more work to do to continue improving our gender balance, and related gender pay gaps, at various levels and in various countries throughout the business.
BUSINESS INTEGRITY
Our principles and values apply to all our employees
through our Code and Code Policies. Our employees undertake mandatory annual training on these Policies via online training modules and an annual business integrity pledge. Our Business Integrity guidelines include clear processes for managing Code
breaches. For more information on Business Integrity see our website.
In 2018 1,206 whistleblowing incidents were opened (defined as Code Policy cases raised). We
closed 1,252 incidents across all areas of our Code and Code Policies, with 662 confirmed breaches. In 2018, we terminated the employment of 330 people. Business integrity risks are included as part of our ethical and legal and regulatory principal
risks (see page 30). The Code and Code Policies reflect our desire to fight corruption in all its forms. We are committed to eradicating any practices or behaviours though our zero-tolerance policy.
Our Responsible Sourcing Policy and Responsible Business Partner Policy help to give us visibility of our third parties to ensure their business principles are consistent
with our own.
WE WORK WITH MANY PARTNERS TO
SUPPORT THE SUSTAINABLE GROWTH OF OUR BUSINESS.
ENGAGING STAKEHOLDERS
We
have many interactions with our stakeholders on a daily basis. Our Code of Business Principles and Code Policies guide how we interact with suppliers, customers, governments, Non-Governmental Organisations
(NGOs) and trade associations in particular. Only authorised and appropriately trained employees or representatives can engage with these groups and we require that a record should be kept of all interactions and that all engagement must be
conducted: in a transparent manner with honesty, integrity and openness; in compliance with laws and in accordance with Unilever’s values. Our website contains further disclosure on how we engage with our stakeholders.
SUPPLIERS
Our supply chain is very diverse and highly dynamic as we respond to
changing consumer preferences, in line with our C4G programme. Our suppliers help us meet consumer needs by innovating, creating capacity and delivering quality materials and services for our products. We work with a large range of suppliers in over
160 countries – from multinational companies through to SMEs and smallholder farmers.
We screen suppliers in relation to their supply chain capabilities and the
level of associated environmental and social risk. Managing supplier risk is a key role of our Supply Chain function. All suppliers must complete our registration process to assess compliance with the mandatory requirements of our Responsible
Sourcing Policy which includes anti-bribery and corruption. We conduct audits and follow up issues identified where necessary.
Partner to Win is our approach to
building long-term relationships with selected key strategic supplier partners in order to achieve mutual growth. It focuses on five key areas: quality and service, innovation, value, sustainability and capacity and capability. Partner to Win helps
us strengthen supplier and customer collaboration and improves operational efficiency. In 2018, we had 175 Partner to Win suppliers, representing 35% of total procurement spend.
We came first in the annual Gartner Supply Chain Top 25 for the third year running, emphasising our leading practices in the area of supply chain management, in
particular on sustainability and digitalisation.
CUSTOMERS
In a
fragmented channel landscape, those companies that best serve their shoppers and customers with bespoke solutions will benefit most. Unilever serves consumers through ten different channels: hyper and supermarkets,
e-commerce, out of home, drug stores, small stores, discounters, Food Solutions, Unilever International, prestige channel and global retail.
We serve around 26 million retail stores globally of which we cover eight million directly and another 18 million indirectly through wholesale and
cash & carry.
In 2018 we focused on developing our e-commerce channels, digitising our value chain to respond to the
rapid fragmentation of traditional routes to market. We are actively driving B2C and B2B e-commerce in our top 30 markets. Our focus is to build a balanced e-commerce
business model, growing across e-retailers, bricks and mortar online sales and direct-to-consumer businesses. In 2018 we signed a
logistics partnership with JD.com, China’s largest retailer. JD will help to bring our most popular products to the most hard-to-reach communities in China,
securely and quickly.
Health & Beauty channels have been an area of focus for Beauty
& Personal Care. In Europe we have been increasing our presence and share with the discounter channel, which continues to see growth, contributing to top line growth
for Unilever while delivering incremental gross profit.
We are collaborating with hyper and supermarkets to
win with omni-channel shoppers and evolve new experiential concepts with these large-scale retailers to ensure Unilever brands enjoy the best positioning in store and online.
We continue to engage with small-scale retailers by professionalising their store operations through capability training. Our Rise Sales Academy is currently being
piloted in Nigeria and Sri Lanka to deliver store operations retail training for micro retailers across the world. In turn, this will help contribute to our USLP target to improve the incomes of 5 million small-scale retailers in our
distribution network.
GOVERNMENTS
We
co-operate and engage with governments, regulators and legislators, both directly and through trade associations, in the development of proposed legislation and regulation which may affect our business
interests. All employees involved in political engagement must comply with our Code of Business Principles and Code Policies. We do not support or fund political parties or candidates or any groups that promote party interests.
Our participation in policy discussions is varied, covering macro topics such as climate change, nutrition and plastic packaging. We engage with government stakeholders
directly or through membership of representative organisations, including trade associations.
TRADE ASSOCIATIONS
We are members of and support a number of trade associations and similar organisations which help us to advance our public policy interests. We keep a record of our trade
association memberships and membership fees, which is regularly updated. We also engage with peer companies, both individually and in coalitions, on issues of mutual interest. This includes working together to implement sustainable business
strategies and drive change.
These associations reflect our global scale and presence across several product categories. We list our global memberships in the
Engaging with stakeholders section on our website. We are registered in the Transparency Register of the European Union. Our US trade association memberships can be found on the FAQ section of the Unilever USA website.
NON-GOVERNMENTAL ORGANISATIONS
We are
building transformational partnerships in collaboration with NGOs who share our vision for a more sustainable future. These partnerships are instrumental in improving the quality of people’s lives, driving growth, achieving our USLP targets and
contributing to the Sustainable Development Goals.
In collaboration with NGOs, we build programmes on the ground to implement our brands’ purpose in addition to
advancing our efforts in areas such as sustainable sourcing and distribution – often in partnership with governments and other businesses. We drive scale through new business models, digital technologies and external financing.
Our leadership engages with stakeholders through platforms such as the World Economic Forum, UN Global Compact, the World Business Council for Sustainable Development and
the Consumer Goods Forum, championing a more inclusive model of capitalism and the pursuit of long-term value creation for the benefit of multiple stakeholders. Partnerships with NGOs are crucial to deliver the United Nations Sustainable Development
Goals (see page 15).
DELIVERING LONG-TERM VALUE FOR OUR STAKEHOLDERS CONTINUED
OUR SHAREHOLDERS
WE DELIVERED SOLID
PERFORMANCE IN 2018 AND REMAIN ON TRACK FOR OUR 2020 TARGETS.
We aim to build long-term relationships with our shareholders through positive engagement for the
benefit of all our stakeholders. We engage directly with our shareholders on a broad range of financial and environmental, social and governance (ESG) matters. During 2018 we engaged with shareholders on a number of topics including our Remuneration
Policy and on the simplification of Unilever. See page 39 and our website for more details. In addition to direct engagement we regularly engage indirectly via ESG ratings organisations such as MSCI, Sustainalytics and ISS, as well as
investor-focused sustainability rankings such CDP and the Dow Jones Sustainability Index.
PERFORMANCE IN 2018
Underlying sales growth for 2018 was 2.9% and underlying operating margin was 18.4%, a rise of 90 basis points. Turnover declined by 5.1% due to the sale of spreads and
currency devaluation; operating margin was 24.6% due to profit on the spreads disposals.
Emerging markets saw a good performance in underlying sales growth of 4.6%
including improved price growth in response to commodity inflation. Notable improvements were in India, which was strong across all categories, and China where strong volume growth was seen particularly in
e-commerce. Argentina was classified as hyper-inflationary and price growth was excluded from underlying figures from July; any volume growth or decline is included
within underlying figures. North America saw an improvement in underlying sales growth and there was acceleration in the US, helped by our acquisition programme in recent years, particularly in BPC. Europe remains challenged by a deflationary
environment generally. We delivered solid volume-driven growth across our business with good margin progression.
We generated
€5.0 billion of free cash flow and 18.8% return on capital. Underlying earnings per share was €2.36, a rise of 5.2%, and dividends were
increased 8%, reflecting Unilever’s confidence in future profit growth and cash generation. Diluted earnings per share was €3.48. Our share price has fallen 0.42% for PLC shareholders and
risen 0.98% for NV shareholders. For information on our non-GAAP measure, see pages 23 to 26.
PROGRESS AGAINST OUR 2020
FINANCIAL TARGETS
In April 2017, we set out financial targets for 2020 to further accelerate shareholder value. In 2018 we maintained a strong delivery of
savings with over €2 billion of savings from the supply chain, ZBB and change programmes. As a result, we are on track to meet our cumulative savings target of €6 billion by 2019 and a 2020 underlying operating margin target of 20%, compared to 16.4% in 2016.
We continue
to maintain our leverage by targeting a Net Debt to underlying EBITDA ratio of 2x, consistent with a credit rating of at least A/A2. During 2018, we returned €6 billion to shareholders
through our share buyback programme following the sale of spreads.
During the year the Boards decided to withdraw proposals to revise Unilever’s dual-headed
legal structure after extensive engagement with shareholders. We remain firmly committed to our 2020 improvement programme and are confident of meeting its key goals. To simplify our capital structure, we cancelled the NV preference shares in
February 2019 (see page 38).
BUSINESS TRANSFORMATION
Our brand portfolio continues to evolve to match our Divisions’ strategic priorities, resulting in the sale of assets that no longer fit our growth model or the
acquisition of assets that take us into new market segments and build new market positions. This active portfolio management means that in the past nine years we have sold €6.8 billion of
turnover, mainly in the lower growth foods businesses. During that same period, we have acquired approximately €5.3 billion of turnover. The spreads disposals in July allow Foods &
Refreshment to focus on growth.
Actively managing our brand portfolio through acquisitions and disposals remains an important strategic growth driver. In December we
announced an agreement to acquire the Health Food Drinks portfolio of GlaxoSmithKline (GSK) in India, Bangladesh and 20 other predominantly Asian markets. Further details of the transaction can be found on our website. The acquisition includes
iconic brands such as Horlicks and Boost, and a product portfolio supported by strong nutritional claims. The transaction is aligned with our strategy to increase our presence in health-food categories and in high-growth emerging markets. The
transaction is subject to customary regulatory and shareholder approvals, with expected completion around 12 months from the announcement.
In October we completed
the acquisition of a 75% stake in the Italian personal care business Equilibra which has a growing presence in the natural skin and hair care segments. We also completed the acquisition of Quala’s Beauty & Personal Care and Home Care
brands. We acquired a number of exciting new businesses including the Vegetarian Butcher (Netherlands) which expands our portfolio into plant-based foods, and three ice cream brands – Adityaa (India), Betty (Romania) and Denny (Bulgaria). With
the exception of brands launched in countries where they were not previously sold, acquisitions and disposals only contribute to underlying sales growth from 12 months after completion.
A key part of our 2020 programme is faster portfolio evolution in order to focus Unilever on more rapidly growing segments. This process continued at pace during 2018
with the focus on new brand launches and evolving our core brands. Our C4G organisation means we can respond to consumer trends more quickly. We have launched nearly 30 brands in the last two years. Local brands are also being launched more quickly
followed by rapid global roll-out, for instance Breyers Delights, Love Beauty and Planet and Lakme all responding to the trend for more natural and healthy products.
Evolving our core brands has also accelerated. Brands such as Dove, Lifebuoy and Sunsilk in Beauty & Personal Care all launched new variants responding to
consumer trends. In Home Care there were new launches of Domestos, Cif and Comfort while Foods & Refreshment extended the Knorr, Hellmann’s and Lipton brands with new on-trend variants (for more
information on brand launches see pages 11 to 12).
Realising the opportunities from digital technology to help deliver further growth and margin improvement is
another key part of our business transformation. We have launched a digital transformation programme across all aspects of our value chain. We have 30 platforms across Unilever which power our business using digital technologies. Our
Enterprise & Technology Solutions team is set up to deliver a technologically enabled Unilever for the future while ensuring that processes and activities are shared and scaled across the business. This will allow us to use technology as a
competitive advantage rather than a cost.
Digital technology changed our approach to marketing some time ago but the transformation of Unilever more broadly has
begun at pace. AI, machine learning and voice related technologies are being used to deliver personalised and immersive experiences to our consumer platforms such as Recipedia and Cleanipedia websites. We are also driving digital through our R&D
organisation, introducing new tools to increase the speed, efficiency and quality of our innovation processes.
In accordance with sections 414CA and 414CB of the Companies Act 2006 which outline new requirements for non-financial reporting,
the table below is intended to provide our stakeholders with the content they need to understand our development, performance, position and the impact of our activities with regards to specified non-financial
matters. Further information on these matters can be found in our online Sustainable Living Report, Human Rights Report as well as policy documents contained on our website.
Non-financial
matter and relevant sections
of Annual Report
Annual Report page reference
Environmental matters
Relevant sections of Annual Report & Accounts:
• Reducing environmental
impact
• Policy: Pages 13 and 33
to 35
• In focus: climate change
risks and opportunities
Turnover declined by 5.1% to €51.0 billion including an unfavourable currency impact of 6.7% (2017: 2.1% unfavourable currency impact) mainly due to weakening of currencies in key emerging markets such as Brazil, Argentina
and India. Underlying sales growth^ was 2.9% (2017: 3.1%), with a positive contribution from all divisions. Underlying volume growth was 1.9% (2017: 0.8%) and underlying price growth was 0.9% (2017: 2.3%). The net impact of acquisitions and
disposals was a reduction in turnover of 1.0% (2017: 0.9% increase) with the impact of recent acquisitions such as Carver Korea and Quala outweighed by the disposal of the spreads businesses. Emerging markets contributed 58% of total turnover (2017:
58%) with underlying sales growth of 4.6% (2017: 5.9%) coming from price growth of 1.7% and volume growth of 2.8%. Developed markets underlying sales growth was 0.5% coming from volume growth of 0.7% slightly offset by price decline of 0.2%.
Underlying operating margin improved by 0.9 percentage points to 18.4%. Gross margin improved by 0.5 percentage points driven by margin-accretive innovations and
continued strong delivery from our ‘5-S’ savings programmes. As a percentage of turnover, overheads and brand and marketing investment were down by 0.3 percentage points and 0.1 percentage points
respectively as a result of productivity gains from zero-based budgeting.
Operating profit was up 41.5% to €12.5 billion (2017: €8.9 billion) as a result of €3,176 million from non-underlying items. Non-underlying items within operating profit comprised a gain on spreads disposal of
€4,331 million, a credit from the early settlement of contingent consideration related to the Blueair acquisition of €277 million,
partially offset by restructuring costs of €914 million, acquisition and disposal related costs of €201 million and impairment and one-off items of €317 million.
Highlights for the year ended
31 December
2018
2017
% change
Turnover (€ million)
50,982
53,715
(5.1
)
Operating profit (€ million)
12,535
8,857
41.5
Underlying operating profit (€ million)*
9,359
9,400
(0.4
)
Profit before tax (€ million)
12,383
8,153
51.9
Net profit (€ million)
9,808
6,486
51.2
Diluted earnings per share (€)
3.48
2.15
62.0
Underlying earnings per share
(€)*
2.36
2.24
5.2
Net finance costs were €481 million in 2018 compared with €877 million in 2017, which included a one-off cost of €382 million for the buyback of the
Unilever NV preference shares. The cost of financing net borrowings was €57 million higher than 2017. The increase was primarily driven by an increase in net debt which was partially offset
by lower interest rates and a prior year one-off in Brazil relating to the interest element of an indirect tax amnesty programme. The average interest rate on net debt reduced to 2.2% from 2.7% in 2017. The
pensions financing charge was €25 million, down from €96 million in 2017 reflecting a lower pension deficit at the beginning of
2018.
A monetary gain of €122 million was recorded following adoption of IAS 29 ‘Financial Reporting
in Hyperinflationary Economies’ in Argentina (see note 1) from 1 July 2018.
The effective tax rate was 21.1% compared with 20.8% in the prior year. In both
years the rate was low relative to longer term norms, due to the significant impact on tax of the disposals of our spreads businesses in 2018 and US tax reform in 2017.
Net profit from joint ventures and associates was up 19% at €185 million, with the increase coming mainly from
a gain on disposal of the spreads business of the Portuguese joint venture. Other income from non-current investments was €22 million versus €18 million in the prior year.
Diluted earnings per share were up 62.0% at €3.48. The increase was mainly driven by the €4,331 million gain on disposal for the spreads businesses, improvement in operating margin and
the impact of the share buyback programmes.
The independent auditors’ reports issued by KPMG Accountants N.V. and KPMG LLP on the consolidated results of the Group, as set
out in the financial statements, were unqualified and contained no exceptions or emphasis of matter. For more details see pages 67 to 74.
The consolidated financial statements have been prepared in accordance with IFRS as adopted by the EU and IFRS as issued by the
International Accounting Standards Board. The critical accounting policies and those that are most significant in connection with our financial reporting are set out in note 1 on pages 79 to 82 and are consistent with those applied in 2017.
*
Certain measures used in our reporting are not defined under IFRS. For further information about these measures, please
refer to the commentary on non-GAAP measures on pages 23 to 26.
^
Wherever referenced in this report, underlying sales growth (USG) and underlying price growth (UPG) do not include price
growth in Venezuela for the whole of 2018 and in Argentina from July 2018. USG and UPG for 2017 do not include Q4 2017 price growth in Venezuela. See pages 23 and 24 on non-GAAP measures for further details.
The Group has revised its operating segments to align with the new structure under which the business is managed. Operating
segment information is now provided based on three product areas: Beauty & Personal Care, Foods & Refreshment and Home Care.
BEAUTY &
PERSONAL CARE
2018
2017
% change
Turnover (€ million)
20,624
20,697
(0.3
)
Operating profit (€ million)
4,130
4,103
0.7
Underlying operating profit (€ million)
4,508
4,375
3.0
Operating margin (%)
20.0
19.8
0.2
Underlying operating margin (%)
21.9
21.1
0.8
Underlying sales growth (%)
3.1
2.9
Underlying volume growth (%)
2.5
1.4
Underlying price growth (%)
0.6
1.5
KEY DEVELOPMENTS
•
Turnover declined by 0.3% including a negative currency impact of 7.0%. Acquisitions contributed 3.9% and underlying sales growth was 3.1%. Dove delivered another year of broad-based growth. Skin care grew strongly
helped by innovations such as the new Vaseline range with clinical strength moisturisation and other brands addressing the fast growing naturals trend including Love, Beauty & Planet. Growth in skin cleansing was helped by innovations such
as the relaunch of Lifebuoy with active silver, new premium formats including Dove exfoliating body polishes and our new cleansing brands such as Korea Glow. Deodorants delivered good volume growth helped by strong performance on Dove but pricing
was muted. The newly acquired Schmidt’s grew strongly. Sales in oral care were flat due to ongoing competitive pressures. Prestige performed well with double digit growth on Hourglass, Ren, Living Proof and Kate Sommerville as well as improved
momentum on Dermalogica and Murad. Dollar Shave Club grew double digits and continued to build scale in the US.
•
Underlying operating profit increased by €133 million. Underlying operating margin and underlying sales growth improvement added €302 million and €136 million respectively, offset by a €484 million adverse impact
from exchange rate movements. Acquisition related activities contributed €179 million. Underlying operating margin improvement reflects brand and marketing efficiencies from zero based
budgeting.
FOODS & REFRESHMENT
2018
2017
% change
Turnover (€ million)
20,227
22,444
(9.9
)
Operating profit (€ million)
7,245
3,616
100.4
Underlying operating profit (€ million)
3,534
3,737
(5.4
)
Operating margin (%)
35.8
16.1
19.7
Underlying operating margin (%)
17.5
16.7
0.8
Underlying sales growth (%)
2.0
2.7
Underlying volume growth (%)
1.3
(0.2
)
Underlying price growth (%)
0.7
3.0
KEY DEVELOPMENTS
•
Turnover declined by 9.9% including a negative currency impact of 5.6%. Acquisitions and disposals had an unfavourable impact of 6.4% reflecting the disposal of the spreads business. Underlying sales growth was 2.0%
coming from volume growth of 1.3% and price growth of 0.7%. Ice cream had another strong year helped by innovations on our premium brands which included a new Magnum praline variant and a non-dairy range of
Ben & Jerrys. The launch of Kinder® ice cream and good weather helped to drive strong ice cream growth in Europe. Sales in tea grew modestly: emerging markets growth was driven by
good performance on core brands like Brooke Bond in India whilst in developed markets challenges in black tea offset good growth from Pukka and the new organic Lipton
range. In savoury, Knorr was helped by good performance of cooking products in emerging markets and more organic and natural innovations such as a new ‘soup in glass’ range. In
dressings, campaigns centred around Hellmann’s purpose to fight food waste helped to increase brand equity, but sales were held back by promotional intensity particularly in the US. Our actions to transform the portfolio are working: strong
innovations including Knorr rice and pasta pots as well as our new brands Red Red, PrepCo and Mãe Terra helped us build scale in the fast growing snacking segment.
•
Underlying operating profit declined by €203 million including a €236 million adverse contribution
from exchange rate movements. Underlying operating margin improvement added €247 million and underlying sales growth contributed
€56 million. Acquisition and disposal related activities had an overall negative impact of €270 million mainly due to loss of
profit of the spreads business from the date of its disposal on 2 July 2018. Underlying operating margin improvement reflects strong gross margin improvement and lower overheads despite an adverse impact from the spreads disposal.
HOME CARE
2018
2017
% change
Turnover (€ million)
10,131
10,574
(4.2
)
Operating profit (€ million)
1,160
1,138
1.9
Underlying operating profit (€ million)
1,317
1,288
2.3
Operating margin (%)
11.5
10.8
0.7
Underlying operating margin (%)
13.0
12.2
0.8
Underlying sales growth (%)
4.2
4.4
Underlying volume growth (%)
2.3
2.1
Underlying price growth (%)
1.9
2.3
KEY DEVELOPMENTS
•
Turnover declined by 4.2% including an adverse currency impact of 8.3%. Underlying sales growth was 4.2%, coming from volume growth of 2.3% and price growth of 1.9%. Home and hygiene grew strongly led by Sunlight which
was helped by a new communication focussed on building functional awareness, as well as the continued success of Domestos toilet blocks. In fabric sensations, Comfort was helped by market development in India and China as well as the launch into
Germany. Fabric solutions grew strongly helped by our strategy to encourage consumers in emerging markets to uptrade to premium formulations like Surf Excel Matics in India, and innovations such as Omo eco active with recycled packaging, plant
extracts and naturally derived fragrances. Seventh Generation also grew well.
•
Underlying operating profit increased by €29 million, including a €144 million adverse contribution
from exchange rate movements. Underlying operating margin improvement contributed €113 million. Underlying sales growth and acquisition and disposal related activities added €55 million and €5 million respectively. Underlying operating margin improvement was mainly due to lower overheads and brand and
marketing efficiencies.
Cash flow from operating activities was €9.0 billion, a decline of
€0.5 billion compared to the prior year. Free cash flow was €5.0 billion, a reduction of
€0.4 billion on the prior year. The reductions reflected the impact of currency devaluation and higher working capital, including a
€0.4 billion increase arising from the disposal of spreads.
€ million 2018
€ million 2017
Operating profit
12,535
8,857
Depreciation, amortisation and impairment
1,747
1,538
Changes in working capital
(793
)
(68
)
Pensions and similar obligations less payments
(128
)
(904
)
Provisions less payments
55
200
Elimination of (profits)/losses on disposals
(4,299
)
(298
)
Non-cash charge for share-based compensation
196
284
Other adjustments
(266
)
(153
)
Cash flow from operating activities
9,047
9,456
Income tax paid
(2,294
)
(2,164
)
Net capital expenditure
(1,424
)
(1,621
)
Net interest and preference dividends paid
(367
)
(316
)
Free cash flow*
4,962
5,355
Net cash flow (used in)/from investing activities
4,644
(5,879
)
Net cash flow (used in)/from financing activities
(11,548
)
(1,433
)
*
Certain measures used in our reporting are not defined under IFRS. For further information about these measures, please
refer to the commentary on non-GAAP measures on pages 23 to 26.
Net inflow from investing activities was €4.6 billion, an increase of €10.5 billion compared to the prior year. The increase reflects proceeds of €7.2 billion from the disposal of spreads and higher spend on acquisitions during the prior year.
The net
outflow from financing activities was €11.5 billion, compared with €1.4 billion in the prior year. In 2018 there were repayments of
financial liabilities of €6.6 billion compared with €2.6 billion in 2017; and an outflow from changes in short-term borrowings of €4.0 billion, compared with an inflow of €2.7 billion in 2017. The cash outflow in respect of the repurchase of shares in 2018 was €6.0 billion, compared with €5.0 billion in the prior year.
BALANCE SHEET
At 31 December 2018,
Unilever’s combined market capitalisation was €121.8 billion compared with €127.9 billion at the end of 2017.
Goodwill and intangible assets increased by €1.1 billion mainly coming from the acquisition of Quala and
restatement of goodwill in relation to adoption of IAS 29 ‘Financial Reporting in Hyperinflationary Economies’ in Argentina (see note 1 and note 9). The increase was partially offset by impairment of Blueair. All material goodwill and
indefinite-life intangible assets have been tested for impairment with no charge recognised during the year other than for Blueair. Other non-current assets decreased by
€0.4 billion mainly due to a reduction in the value of pension assets.
€ million 2018
€ million 2017
Goodwill and intangible assets
29,493
28,401
Other non-current assets
14,482
14,901
Current assets
15,481
16,983
Total assets
59,456
60,285
Current liabilities
19,772
23,177
Non-current liabilities
27,392
22,721
Total liabilities
47,164
45,898
Shareholders’ equity
11,572
13,629
Non-controlling interest
720
758
Total equity
12,292
14,387
Total liabilities and equity
59,456
60,285
Current assets decreased from €17.0 billion to €15.5 billion mainly reflecting the reduction in assets held for disposals as a result of the completion of the spreads transactions on 2 July 2018. Current liabilities were €19.8 billion, a decrease of €3.4 billion compared to the prior year. The decrease was due to repayment of short-term liabilities which
were replaced by long term borrowings. Non-current liabilities were €27.4 billion, an increase of
€4.7 billion on the prior year. During the year the Group issued bonds worth over €6.0 billion and repaid notes of about €1.0 billion. See note 15C for analysis of bonds and other loans.
The table below shows the movement in net
pension liability during the year. The increase from €0.6 billion at the beginning of the year to €0.9 billion at the end of 2018
was primarily due to reduced pension assets, driven by adverse equity markets towards the end of 2018.
€ million 2018
1 January
(561
)
Current service cost
(220
)
Employee contributions
17
Actual return on plan assets (excluding interest)
(1,108
)
Net interest cost
(25
)
Actuarial gain
671
Employer contributions
383
Currency retranslation
26
Other movements(a)
(57
)
31 December
(874
)
(a)
Other movements relate to special termination benefits, past service costs including losses/(gains) on curtailment,
settlements and other immaterial movements. For more details see note 4B on pages 87 to 92.
FINANCE AND LIQUIDITY
Approximately €0.8 billion (or 26%) of the Group’s cash and cash equivalents are held in
the parent and central finance companies, for maximum flexibility. These companies provide loans to our subsidiaries that are also funded through retained earnings and third party borrowings. We maintain access to global debt markets through an
infrastructure of short and long-term debt programmes. We make use of plain vanilla derivatives, such as interest rate swaps and foreign exchange contracts, to help mitigate risks. More detail is provided in notes 16, 16A, 16B and 16C on pages 110
to 115.
The remaining €2.4 billion (74%) of the Group’s cash and cash equivalents are held in foreign
subsidiaries which repatriate distributable reserves on a regular basis. For most countries, this is done through dividends free of tax. This balance includes €154 million (2017: €206 million, 2016: €240 million) of cash that is held in a few countries where we face cross-border foreign exchange controls and/or other
legal restrictions that inhibit our ability to make these balances available in any means for general use by the wider business.The cash will generally be invested or held in the relevant country and, given the other capital resources
available to the Group, does not significantly affect the ability of the Group to meet its cash obligations.
We closely monitor all our exposures and counter-party
limits.
Unilever has committed credit facilities in place for general corporate purposes. The undrawn bilateral committed credit facilities in place on
31 December 2018 were $7,865 million.
For raw and packaging materials and finished goods.
Further details are set out in the following notes to the consolidated financial statements: note 10 on pages 100 and 101, note 15C on page 108 and 109, and note 20 on
pages 120 to 122. Unilever is satisfied that its financing arrangements are adequate to meet its working capital needs for the foreseeable future. In relation to the facilities available to the Group, borrowing requirements do not fluctuate
materially during the year and are not seasonal.
AUDIT FEES
Included
within operating profit is €21 million (2017: €20 million) paid to the external auditor, of which €16 million (2017: €14 million) related to statutory audit services.
NON-GAAP MEASURES
Certain discussions
and analyses set out in this Annual Report and Accounts (and the Additional Information for US Listing Purposes) include measures which are not defined by generally accepted accounting principles (GAAP) such as IFRS. We believe this information,
along with comparable GAAP measurements, is useful to investors because it provides a basis for measuring our operating performance, and our ability to retire debt and invest in new business opportunities. Our management uses these financial
measures, along with the most directly comparable GAAP financial measures, in evaluating our operating performance and value creation. Non-GAAP financial measures should not be considered in isolation from, or
as a substitute for, financial information presented in compliance with GAAP. Wherever appropriate and practical, we provide reconciliations to relevant GAAP measures.
EXPLANATION AND RECONCILIATION
OF
NON-GAAP MEASURES
Unilever uses ‘constant rate’ and ‘underlying’ measures primarily for internal
performance analysis and targeting purposes. We present certain items, percentages and movements, using constant exchange rates, which exclude the impact of fluctuations in foreign currency exchange rates. We calculate constant currency values by
translating both the current and the prior period local currency amounts using the prior period average exchange rates into euro, except for countries where the impact of consumer price inflation rates has escalated to extreme levels. In these
countries, the local currency amounts before the application of IAS 29 are translated into euros using the period closing exchange rate.
The table below shows exchange rate movements in our key markets.
Annual average rate in
2018
Annual average rate in
2017
Brazilian real (€1 = BRL)
4.282
3.573
Chinese yuan (€1 = CNY)
7.807
7.608
Indian rupee (€1 = INR)
80.730
73.258
Indonesia rupiah (€1 = IDR)
16831
15011
Philippine peso (€ 1 = PHP)
62.379
56.596
UK pound sterling (€1 = GBP)
0.884
0.876
US dollar
(€1 = US$)
1.185
1.123
In the following sections we set out our definitions of the following non-GAAP measures and
provide reconciliations to relevant GAAP measures:
•
underlying sales growth;
•
underlying volume growth;
•
underlying price growth;
•
non-underlying items;
•
underlying earnings per share;
•
underlying operating profit and underlying operating margin;
•
underlying effective tax rate;
•
constant underlying earnings per share;
•
free cash flow;
•
return on assets;
•
net debt; and
•
return on invested capital.
UNDERLYING SALES GROWTH
Underlying Sales Growth (USG) refers to the increase in turnover for the period, excluding any change in turnover resulting from acquisitions, disposals and changes in
currency. We believe this measure provides valuable additional information on the underlying sales performance of the business and is a key measure used internally. The impact of acquisitions and disposals is excluded from USG for a period of 12
calendar months from the applicable closing date. Turnover from acquired brands that are launched in countries where they were not previously sold is included in USG as such turnover is more attributable to our existing sales and distribution
network than the acquisition itself. Also excluded is the impact of price growth from countries where the impact of consumer price inflation (CPI) rates has escalated to extreme levels.
There are two countries where we have determined extreme levels of CPI exist. The first is Venezuela where in Q4 2017 inflation rates exceeded 1,000% and management
considered that the situation would persist for some time. Consequently, price growth in Venezuela has been excluded from USG since Q4 2017. The second is Argentina, which from Q3 2018 has been accounted for in accordance with IAS 29, and thus from
Q3 2018 Argentina price growth is excluded from USG. The adjustment made at Group level as a result of these two exclusions was a reduction in price growth of 32.4% for the year. This treatment for both countries will be kept under regular review.
Prior to Q3 2018 USG only excluded the impact of price changes in countries where consumer price inflation has escalated to extreme levels of 1,000% or more.
However, given the need to account for our Argentinian business in accordance with IAS 29, we have now also excluded price changes in countries that need to be accounted for in accordance with IAS 29. Prior to Q3 2018 there were no countries that
were accounted for under IAS 29, so no restatements are necessary.
The reconciliation of USG to changes in the GAAP measure turnover is as follows:
TOTAL GROUP
2018 vs 2017
2017 vs 2016
Turnover growth (%)(a)
(5.1
)
1.9
Effect of acquisitions (%)
2.0
1.3
Effect of disposals (%)
(3.0
)
(0.4
)
Effect of exchange rates (%)(b)
(6.7
)
(2.1
)
Underlying sales growth (%)(b)
2.9
3.1
BEAUTY & PERSONAL CARE
2018
vs 2017
2017
vs 2016
Turnover growth (%)(a)
(0.3
)
2.6
Effect of acquisitions (%)
3.9
1.8
Effect of disposals (%)
–
(0.1
)
Effect of exchange rates (%)(b)
(7.0
)
(1.9
)
Underlying sales growth (%)(b)
3.1
2.9
FOODS & REFRESHMENT
2018 vs 2017
2017 vs 2016
Turnover growth (%)(a)
(9.9
)
(0.4
)
Effect of acquisitions (%)
0.8
0.2
Effect of disposals (%)
(7.2
)
(0.8
)
Effect of exchange rates (%)(b)
(5.6
)
(2.4
)
Underlying sales growth (%)(b)
2.0
2.7
HOME CARE
2018 vs 2017
2017 vs 2016
Turnover growth (%)(a)
(4.2
)
5.6
Effect of acquisitions (%)
0.5
3.1
Effect of disposals (%)
(0.2
)
(0.2
)
Effect of exchange rates (%)(b)
(8.3
)
(1.7
)
Underlying sales growth (%)(b)
4.2
4.4
(a)
Turnover growth is made up of distinct individual growth components, namely underlying sales, currency impact,
acquisitions and disposals. Turnover growth is arrived at by multiplying these individual components on a compounded basis as there is a currency impact on each of the other components. Accordingly, turnover growth is more than just the sum of the
individual components.
(b)
For 2018 underlying price growth in Venezuela (from January 2018) and Argentina (from July 2018) has been excluded from
underlying sales growth and an equal and opposite adjustment made in effect of exchange rate. For 2017 only Q4 price growth in Venezuela has been excluded.
UNDERLYING VOLUME GROWTH
Underlying volume growth (UVG) is part of USG and
means, for the applicable period, the increase in turnover in such period calculated as the sum of (i) the increase in turnover attributable to the volume of products sold; and (ii) the increase in turnover attributable to the composition
of products sold during such period. UVG therefore excludes any impact on USG due to changes in prices.
UNDERLYING PRICE GROWTH
Underlying price growth (UPG) is part of USG and means, for the applicable period, the increase in turnover attributable to changes in prices during the period. UPG
therefore excludes the impact to USG due to (i) the volume of products sold; and (ii) the composition of products sold during the period. In determining changes in price we exclude the impact of price growth in Argentina and Venezuela as
explained in USG above.
The relationship between USG, UVG and UPG is set out below:
2018 vs 2017
2017 vs 2016
Underlying volume growth (%)
1.9
0.8
Underlying price growth
(%)(a)
0.9
2.3
Underlying sales growth (%)
2.9
3.1
(a)
For 2018 underlying price growth in Venezuela (from January 2018) and Argentina (from July 2018) has been excluded from
underlying price in the table above and an equal and opposite adjustment made in the effect of exchange rates. For 2017 only Q4 price growth in Venezuela has been excluded.
Refer to page 21 for the relationship between USG, UVG and UPG for each of the categories.
NON-UNDERLYING ITEMS
Several non-GAAP measures are adjusted to exclude items defined as non-underlying due to their nature and/or frequency of occurrence.
•
Non-underlying items within operating profit are: gains or losses on business disposals, acquisition and disposal related costs, restructuring costs, impairments and other
significant one-off items within operating profit
•
Non-underlying items not in operating profit but within net profit are: significant and unusual items in net finance cost, monetary gain/(loss) arising from
hyperinflationary economies, share of profit/(loss) of joint ventures and associates and taxation
•
Non-underlying items are both non-underlying items within operating profit and those
non-underlying items not in operating profit but within net profit
Refer to note 3 for details of non-underlying items.
UNDERLYING EARNINGS PER SHARE
Underlying earnings per share (underlying EPS) is calculated as underlying profit attributable to shareholders’ equity divided by the diluted combined average number
of share units. In calculating underlying profit attributable to shareholders’ equity, net profit attributable to shareholders’ equity is adjusted to eliminate the post-tax impact of non-underlying items. This measure reflects the underlying earnings for each share unit of the Group.
Refer to note 7 on page 96
for reconciliation of net profit attributable to shareholders’ equity to underlying profit attributable to shareholders’ equity.
UNDERLYING OPERATING PROFIT AND UNDERLYING OPERATING MARGIN
Underlying operating profit and underlying operating margin mean operating profit and operating margin before the impact of
non-underlying items within operating profit. Underlying operating profit represents our measure of segment profit or loss as it is the primary measure used for making decisions about allocating resources and
assessing performance of the segments.
The reconciliation of operating profit to underlying operating profit is as follows:
€ million 2018
€ million 2017
Operating profit
12,535
8,857
Non-underlying items within
operating profit (see note 3)
(3,176
)
543
Underlying operating profit
9,359
9,400
Turnover
50,982
53,715
Operating margin
24.6
%
16.5
%
Underlying operating margin
18.4
%
17.5
%
Further details of non-underlying items can be found in note 3 on page 85 of the consolidated
financial statements.
UNDERLYING EFFECTIVE TAX RATE
The underlying
effective tax rate is calculated by dividing taxation excluding the tax impact of non-underlying items by profit before tax excluding the impact of non-underlying items
and share of net profit/(loss) of joint ventures and associates. This measure reflects the underlying tax rate in relation to profit before tax excluding non-underlying items before tax and share of net
profit/(loss) of joint ventures and associates. Tax impact on non-underlying items within operating profit is the sum of the tax on each non-underlying item, based on
the applicable country tax rates and tax treatment. This is shown in the following table:
€ million 2018
€ million 2017
Taxation
2,575
1,667
Tax impact of:
Non-underlying items within operating profit(a)
(259
)
77
Non-underlying items not in operating profit but within net profit(a)
(29
)
578
Taxation before tax impact of
non-underlying
2,287
2,322
Profit before taxation
12,383
8,153
Non-underlying items within operating profit before tax(a)
(3,176
)
543
Non-underlying items not in operating profit but within net profit
before tax(b)
(122
)
382
Share of net (profit)/loss of joint ventures and associates
(185
)
(155
)
Profit before tax excluding
non-underlying items before tax and share of net profit/ (loss) of joint ventures and associates
8,900
8,923
Underlying effective tax rate
25.7
%
26.0
%
(a)
Refer to note 3 for further details on these items.
(b)
2018 amount excludes €32 million gain on disposal of spreads
business by the joint venture in Portugal which is included in the share of net profit/(loss) of joint ventures and associates line. Including the €32 million, total non-underlying items not in operating profit but within net profit before tax is €154 million. See note 3.
CONSTANT UNDERLYING EARNINGS PER SHARE
Constant underlying earnings per share
(constant underlying EPS) is calculated as underlying profit attributable to shareholders’ equity at constant exchange rates and excluding the impact of both translational hedges and price inflation in Venezuela (for the whole of 2018) and
Argentina (from July 2018) divided by the diluted average number of ordinary shares. This measure reflects the underlying earnings for each ordinary share of the Group in constant exchange rates.
The reconciliation of underlying profit attributable to shareholders’ equity to constant underlying earnings
attributable to shareholders’ equity and the calculation of constant underlying EPS is as follows:
€ million 2018
€ million 2017
Underlying profit attributable to
shareholders’ equity(a)
6,365
6,315
Impact of translation from current to constant exchange rates and translational hedges
7,112
95
Impact of Venezuela and Argentina price inflation(b)
(6,551
)
–
Constant underlying earnings attributable to shareholders’
equity
6,926
6,410
Diluted combined average number of share units (millions of units)
2,694.8
2,814.0
Constant underlying EPS
(€)
2.57
2.28
(a)
See note 7.
(b)
See pages 23 and 24 for further details.
From 2018, in our reporting of growth in constant underlying EPS, we translate the prior period using an annual average exchange rate rather than monthly averages. This
change has been made to align with the prior period constant exchange rate used for calculating USG. The impact of this is an increase of €0.01 per share in 2017 constant underlying EPS.
FREE CASH FLOW
Free cash flow (FCF) is defined as cash flow from operating
activities, less income taxes paid, net capital expenditures and net interest payments and preference dividends paid. It does not represent residual cash flows entirely available for discretionary purposes; for example, the repayment of principal
amounts borrowed is not deducted from FCF. FCF reflects an additional way of viewing our liquidity that we believe is useful to investors because it represents cash flows that could be used for distribution of dividends, repayment of debt or to fund
our strategic initiatives, including acquisitions, if any.
The reconciliation of net profit to FCF is as follows:
€ million 2018
€ million 2017
Net profit
9,808
6,486
Taxation
2,575
1,667
Share of net profit of joint ventures/associates and other income from
non-current investments
(207
)
(173
)
Net monetary gain arising from hyperinflationary economies
Return on assets is a measure of the return generated on assets for each division. This measure provides additional insight on the performance of the divisions and
assists in formulating long-term strategies with respect to allocation of capital, across divisions. Division return on assets is calculated as underlying operating profit after tax for the division divided by the annual average of: property, plant
and equipment, net assets held for sale (excluding goodwill and intangibles), inventories, trade and other current receivables, and trade payables and other current liabilities, for each division. The annual average is computed by adding the amounts
at the beginning and the end of the calendar year and dividing by two.
€ million
€ million
€ million
Beauty &
Foods &
Home
€ million
2018
Personal Care
Refreshment
Care
Total
Underlying operating profit before tax
4,508
3,534
1,317
9,359
Tax on underlying operating profit
(1,159
)
(908
)
(338
)
(2,405
)
Underlying operating profit after tax
3,349
2,626
979
6,954
Property plant and equipment
3,631
4,783
1,933
10,347
Net assets held for sale
1
25
–
26
Inventories
1,737
1,761
803
4,301
Trade and other receivables
2,319
3,027
1,139
6,485
Trade payables and other current
liabilities
(5,478
)
(5,984
)
(2,995
)
(14,457
)
Period end assets (net)
2,210
3,612
880
6,702
Average assets for the period (net)
2,178
3,830
799
6,807
Division return on assets
154
%
69
%
123
%
102
%
2017
Underlying Operating Profit before tax
4,375
3,737
1,288
9,400
Tax on underlying operating profit
(1,139
)
(972
)
(335
)
2,446
Underlying Operating Profit after tax
3,236
2,765
953
6,954
Property plant and equipment
3,520
5,104
1,787
10,411
Net assets held for sale
1
742
–
743
Inventories
1,590
1,637
735
3,962
Trade and other receivables
2,018
2,172
1,032
5,222
Trade payables and other current
liabilities
(4,984
)
(5,606
)
(2,836
)
(13,426
)
Period end assets (net)
2,145
4,049
718
6,912
Average assets for the period (net)
2,122
4,201
778
7,101
Division return on assets
152
%
66
%
122
%
98
%
NET DEBT
Net debt is defined as
the excess of total financial liabilities, excluding trade payables and other current liabilities, over cash, cash equivalents and other current financial assets, excluding trade and other current receivables. It is a measure that provides valuable
additional information on the summary presentation of the Group’s net financial liabilities and is a measure in common use elsewhere.
The reconciliation of
total financial liabilities to net debt is as follows:
€ million 2018
€ million 2017
Total financial liabilities
(24,885
)
(24,430
)
Current financial liabilities
(3,235
)
(7,968
)
Non-current financial liabilities
(21,650
)
(16,462
)
Cash and cash equivalents as per balance sheet
3,230
3,317
Cash and cash equivalents as per cash flow statement
3,090
3,169
Add bank overdrafts deducted therein
140
167
Less cash and cash equivalents held for sale
–
(19
)
Other current financial assets
874
770
Net debt
(20,781
)
(20,343
)
RETURN ON INVESTED CAPITAL
Return on invested capital (ROIC) is a measure of the return generated on capital invested by the Group. The measure provides a guide rail for long-term value creation
and encourages compounding reinvestment within the business and discipline around acquisitions with low returns and long payback. ROIC is calculated as underlying operating profit after tax divided by the annual average of: goodwill, intangible
assets, property, plant and equipment, net assets held for sale, inventories, trade and other current receivables, and trade payables and other current liabilities.
€ million 2018
€ million 2017
Underlying operating profit before tax(a)
9,359
9,400
Tax on underlying operating profit(b)
(2,405
)
(2,446
)
Underlying operating profit after
tax
6,954
6,954
Goodwill
17,341
16,881
Intangible assets
12,152
11,520
Property, plant and equipment
10,347
10,411
Net assets held for sale
108
3,054
Inventories
4,301
3,962
Trade and other current receivables
6,485
5,222
Trade payables and other current
liabilities
(14,457
)
(13,426
)
Period-end
invested capital
36,277
37,624
Average invested capital for the
period
36,951
36,222
Return on average invested capital
18.8
%
19.2
%
(a)
See reconciliation of operating profit to underlying operating profit on page 25.
(b)
Tax on underlying operating profit is calculated as underlying operating profit before tax multiplied by underlying
effective tax rate of 25.7% (2017: 26.0%) which is shown on page 25.
Risk management is
integral to Unilever’s strategy and to the achievement of Unilever’s long-term goals. Our success as an organisation depends on our ability to identify and exploit the opportunities generated by our business and the markets we are in. In
doing this we take an embedded approach to risk management which puts risk and opportunity assessment at the core of the Board agenda, which is where we believe it should be.
Unilever adopts a risk profile that is aligned to our vision to grow our business, while decoupling our environmental footprint from our growth and increasing our
positive social impact. Our appetite for risk is driven by the following:
•
Our growth should be consistent, competitive, profitable and responsible.
•
Our behaviours must be in line with our Code of Business Principles and Code Policies.
•
We strive to continuously improve our operational efficiency and effectiveness.
•
We aim to maintain a single A credit rating on a long-term basis.
Our approach to risk management is designed to provide
reasonable, but not absolute, assurance that our assets are safeguarded, the risks facing the business are being assessed and mitigated and all information that may be required to be disclosed is reported to Unilever’s senior management
including, where appropriate, the Chief Executive Officer and Chief Financial Officer.
ORGANISATION
The Boards assume overall accountability for the management of risk and for reviewing the effectiveness of Unilever’s risk management and internal control systems.
The Boards have established a clear organisational structure with well defined accountabilities for the principal risks that Unilever faces in the short, medium and
long term. This organisational structure and distribution of accountabilities and responsibilities ensure that every country in which we operate has specific resources and processes for risk reviews and risk mitigation. This is supported by the
Unilever Leadership Executive, which takes active responsibility for focusing on the principal areas of risk to Unilever. The Boards regularly review these risk areas, including consideration of environmental, social and governance matters, and
retain responsibility for determining the nature and extent of the significant risks that Unilever is prepared to take to achieve its strategic objectives.
FOUNDATION AND PRINCIPLES
Unilever’s approach to doing business is framed
by our Purpose and values (see page 1). Our Code of Business Principles sets out the standards of behaviour that we expect all employees to adhere to. Day-to-day
responsibility for ensuring these principles are applied throughout Unilever rests with senior management across categories, geographies and functions. A network of Business Integrity Officers and Committees supports the activities necessary to
communicate the Code, deliver training, maintain processes and procedures (including support lines) to report and respond to alleged breaches, and to capture and communicate learnings.
We have a framework of Code Policies that underpins
the Code of Business Principles and set out the non-negotiable standards of behaviour expected from all our employees.
For
each of our principal risks we have a risk management framework detailing the controls we have in place and who is responsible for managing both the overall risk and the individual controls mitigating that risk.
Unilever’s functional standards define mandatory requirements across a range of specialist areas such as health and safety, accounting and reporting and financial
risk management.
PROCESSES
Unilever operates a wide range of processes
and activities across all its operations covering strategy, planning, execution and performance management. Risk management is integrated into every stage of this business cycle. These procedures are formalised and documented and are increasingly
being centralised and automated into transactional and other information technology systems.
ASSURANCE AND RE-ASSURANCE
Assurance on compliance with the Code of Business Principles and all of our Code Policies is obtained annually from Unilever management via a formal Code
declaration. In addition, there are specialist awareness and training programmes which are run throughout the year and vary depending on the business priorities. These specialist compliance programmes supplement the Code declaration. Our Corporate
Audit function plays a vital role in providing to both management and the Boards an objective and independent review of the effectiveness of risk management and internal control systems throughout Unilever.
BOARDS’ ASSESSMENT OF COMPLIANCE WITH THE RISK MANAGEMENT FRAMEWORKS
The Boards, advised by the Committees where appropriate, regularly review the significant risks and decisions that could have a material impact on Unilever. These reviews
consider the level of risk that Unilever is prepared to take in pursuit of the business strategy and the effectiveness of the management controls in place to mitigate the risk exposure.
The Boards, through the Audit Committee, have reviewed the assessment of risks, internal controls and disclosure controls and procedures in operation within Unilever.
They have also considered the effectiveness of any remedial actions taken for the year covered by this Annual Report and Accounts and up to the date of its approval by the Boards.
Details of the activities of the Audit Committee in relation to this can be found in the Report of the Audit Committee on pages 43 to 45.
Further statements on compliance with the specific risk management and control requirements in the Dutch Corporate Governance Code, the UK Corporate Governance Code, the
US Securities Exchange Act (1934) and the Sarbanes-Oxley (2002) Act can be found on pages 41 and 42.
The Directors have reviewed the long-term prospects of the Group in order to assess its viability. This review incorporated the activities
and key risks of the Group together with the factors likely to affect the Group’s future development, performance, financial position, cash flows, liquidity position and borrowing facilities as described on pages 1 to 26. In addition, we
describe in notes 15 to 18 on pages 104 to 120 the Group’s objectives, policies and processes for managing its capital, its financial risk management objectives, details of its financial instruments and hedging activities and its exposures to
credit and liquidity risk.
ASSESSMENT
In order to report on the long-term
viability of the Group, the Directors reviewed the overall funding capacity and headroom available to withstand severe events and carried out a robust assessment of the principal risks facing the Group, including those that would threaten its
business model, future performance, solvency or liquidity. The assessment assumes that any debt maturing in the next three years can be re-financed at commercially acceptable terms or via our current standby
facility. This assessment also included reviewing and understanding the mitigation factors in respect of each of those risks. The risk factors are summarised on pages 29 to 33.
The viability assessment has two parts:
•
First, the Directors considered the period over which they have a reasonable expectation that the Group will continue to
operate and meet its liabilities, taking into account current debt facilities and debt headroom; and
•
Second, they considered the potential impact of severe but plausible scenarios over this period, including:
•
assessing scenarios for each individual principal risk, for example the termination of our relationships with the three
largest global customers; the loss of all material litigation cases; a major IT data breach and the lost cost and growth opportunities from not keeping up with technological changes; and
•
assessing scenarios that involve more than one principal risk including the following multi risk scenarios:
Multi risk
scenarios modelled
Level of
severity reviewed
Link to
principal risk
Contamination issue with one of our products leading to
lower sales of products of this brand and the temporary closure of our largest sourcing unit.
A fine equal to 1% of Group turnover was considered along with damage to our largest brand and disruption to
supply chain.
• Safe and high-quality products
• Brand preference
• Supply chain
Major global incident affecting one or more of the
Group’s key locations resulting in an outage for a year in a key sourcing unit and significant water shortages in our key developing markets.
The complete loss of all of our turnover in our largest geographic market was considered along with destruction
of a key sourcing unit and reduced demand for our products that require water.
• Economic and political instability
• Supply chain
• Climate change
Global economic downturn leading to an increase in funding costs and the loss of our three largest customers.
Significant business disruption in our largest emerging market was considered with the impact of losing our three key customers.
• Economic and political instability
• Treasury and pensions
• Customer relationships
FINDINGS
•
Firstly, a three-year period is considered appropriate for this viability assessment because it is the period covered by the
strategic plan; and it enables a high level of confidence in assessing viability, even in extreme adverse events, due to a number of factors such as:
•
the Group has considerable financial resources together with established business relationships with many customers and
suppliers in countries throughout the world;
•
high cash generation by the Group’s operations and access to the external debt markets;
•
flexibility of cash outflow with respect to significant marketing programmes and capital expenditure projects which usually
have a 2-3 year horizon; and
•
the Group’s diverse product and geographical activities which are impacted by continuously evolving technology and
innovation.
•
Secondly, for each of our 14 principal risks, worst case plausible scenarios have been assessed together with multiple risk
scenarios. None of the scenarios reviewed, either individually or in aggregate would cause Unilever to cease to be viable.
CONCLUSION
On the basis described above, the Directors have a reasonable expectation that the Group will be able to continue in operation and meet its liabilities as they fall due
over the three-year period of their assessment.
PRINCIPAL RISK FACTORS
Our business is subject to risks and uncertainties.
On the following pages we have identified the risks that we regard as the most relevant to our business. These are the risks that we see as most material to Unilever’s business and performance at this time. There may be other risks that could
emerge in the future.
All the principal risks could impact our business within the next two years (ie short-term risks), or could impact our business over the next
three to five years (ie medium-term risks). Some principal risks, such as climate change, could also impact over the longer term (ie beyond five years).
Our
principal risks have not fundamentally changed this year apart from the addition of a plastic packaging risk. Given the nature of our business, a reduction in the amount of plastic packaging and increase in the use of recyclable content in our
packaging is critical to our future success.
As well as identifying the most relevant risks for our business we reflect on whether we think the level of risk associated with each of our principal risks is increasing
or decreasing. In addition to our plastic packaging risk there are three areas where we believe there is an increased level of risk:
•
Customer Relationships: technology is changing our channel landscape and hence changing the nature of the relationships with
our traditional customers as well as requiring us to develop relationships with new customers who are driving e-commerce development;
•
Systems and Information: the number of cybersecurity attacks is still increasing significantly, and incidents are becoming
more sophisticated as technology further evolves; and
•
Business Transformation: this risk has increased as a result of the speed of technological change which means the pressure
to digitalise our business to take advantage of the opportunities it presents, both in terms of growth and cost efficiency, is increasing.
If the
circumstances in these risks occur or are not successfully mitigated, our cash flow, operating results, financial position, business and reputation could be materially adversely affected. In addition, risks and uncertainties could cause actual
results to vary from those described, which may include forward-looking statements, or could impact on our ability to meet our targets or be detrimental to our profitability or reputation.
DESCRIPTION OF
RISK
BRAND PREFERENCE
As a branded goods business, Unilever’s success depends on the value and relevance of our brands and products to consumers around the world and on our ability to
innovate and remain competitive.
Consumer tastes, preferences and behaviours are changing
more rapidly than ever before, and Unilever’s ability to identify and respond to these changes is vital to our business success.
Technological change is disrupting our traditional brand communication models. Our ability to develop and deploy the right communication, both in terms of messaging
content and medium is critical to the continued strength of our brands.
We are dependent on
creating innovative products that continue to meet the needs of our consumers and getting these new products to market with speed. If we are unable to innovate effectively, Unilever’s sales or margins could be materially adversely affected.
PORTFOLIO MANAGEMENT
Unilever’s strategic investment choices will affect the long-term growth and profits of our business.
Unilever’s growth and profitability are determined by our portfolio of categories, geographies
and channels and how these evolve over time. If Unilever does not make optimal strategic investment decisions, then opportunities for growth and improved margin could be missed.
SUSTAINABILITY
The success of our business depends on finding sustainable solutions to support long-term growth.
Unilever’s vision to grow our business, while decoupling our environmental footprint from our
growth and increasing our positive social impact, will require more sustainable ways of doing business. In a world where resources are scarce and demand for them continues to increase, it is critical that we succeed in reducing our resource
consumption and converting to sustainably sourced supplies. In doing this we are dependent on the efforts of partners and various certification bodies. We are also committed to improving health and well-being and enhancing livelihoods around the
world so Unilever and our communities grow successfully together. There can be no assurance that sustainable business solutions will be developed and failure to do so could limit Unilever’s growth and profit potential and damage our corporate
reputation.
Climate changes and governmental actions to reduce such changes may disrupt our operations and/or reduce consumer demand for our products.
Climate changes are occurring around the globe which may impact our business in various ways. They
could lead to water shortages which would reduce demand for those of our products that require a significant amount of water during consumer use. They could also lead to an increase in raw material and packaging prices or reduced availability.
Governments may take action to reduce climate change such as the introduction of a carbon tax or zero net deforestation requirements which could impact our business through higher costs or reduced flexibility of operations.
Increased frequency of extreme weather (storms and floods) could cause increased incidence of
disruption to our manufacturing and distribution network. Climate change could result therefore in making products less affordable or less available for our consumers resulting in reduced growth and profitability.
PLASTIC PACKAGING
A
reduction in the amount of plastic and an increase in the use of recyclable content in our packaging is critical to our future success.
Both consumer and customer responses to the environmental impact of plastic waste and emerging regulation by governments to tax or ban the use of certain plastics
requires us to find solutions to reduce the amount of plastic we use; increase recycling post-consumer use; and to source recycled plastic for use in our packaging. We are also dependent on the work of our industry partners to create and improve
recycling infrastructures throughout the globe.
Not only is there a risk around finding
appropriate replacement materials, due to high demand the cost of recycled plastic or other alternative packaging materials could significantly increase in the foreseeable future and this could impact our business performance. We could also be
exposed to higher costs as a result of taxes or fines if we are unable to comply with plastic regulations which would again impact our profitability and reputation.
CUSTOMER RELATIONSHIPS
Successful customer relationships are vital to our business and continued growth.
Maintaining strong relationships with our existing customers and building relationships with new customers who have built new technology-enabled business models to serve
changing shopper habits are necessary to ensure our brands are well presented to our consumers and available for purchase at all times.
The strength of our customer relationships also affects our ability to obtain pricing and competitive trade terms. Failure to maintain strong relationships with customers
could negatively impact our terms of business with affected customers and reduce the availability of our products to consumers.
A
skilled workforce and agile ways of working are essential for the continued success of our business.
Our ability to attract, develop and retain the right number of appropriately qualified people is critical if we are to compete and grow effectively.
This is especially true in our key emerging markets where there can be a high level of competition
for a limited talent pool. The loss of management or other key personnel or the inability to identify, attract and retain qualified personnel could make it difficult to manage the business and could adversely affect operations and financial
results.
SUPPLY CHAIN
Our
business depends on purchasing materials, efficient manufacturing and the timely distribution of products to our customers.
Our supply chain network is exposed to potentially adverse events such as physical disruptions, environmental and industrial accidents, trade restrictions or disruptions
at a key supplier, which could impact our ability to deliver orders to our customers.
The cost
of our products can be significantly affected by the cost of the underlying commodities and materials from which they are made. Fluctuations in these costs cannot always be passed on to the consumer through pricing.
Changes in trade relationships between Europe and the UK as a result of Brexit could give rise to
both a supply and cost issue.
SAFE AND HIGH QUALITY PRODUCTS
The
quality and safety of our products are of paramount importance for our brands and our reputation.
The risk that raw materials are accidentally or maliciously contaminated throughout the supply chain or that other product defects occur due to human error, equipment
failure or other factors cannot be excluded.
SYSTEMS AND INFORMATION
Unilever’s operations are increasingly dependent on IT systems and the management of information.
The cyber-attack threat of unauthorised access and misuse of sensitive information or disruption to
operations continues to increase. Such an attack could inhibit our business operations in a number of ways, including disruption to sales, production and cash flows, ultimately impacting our results.
In addition, increasing digital interactions with customers, suppliers and consumers place ever
greater emphasis on the need for secure and reliable IT systems and infrastructure and careful management of the information that is in our possession to ensure data privacy.
Successful execution of business transformation projects is key to delivering their intended business benefits and avoiding disruption to other business
activities.
Unilever is continually engaged in major change projects, including
acquisitions, disposals and organisational transformation, to drive continuous improvement in our business and to strengthen our portfolio and capabilities. A number of key projects were announced in 2017 to accelerate sustainable shareholder value
creation. Failure to execute such initiatives successfully could result in under-delivery of the expected benefits and there could be a significant impact on the value of the business.
Continued digitalisation of our business models and processes together with enhancing data
management capabilities is a critical part of our transformation. Failure to keep pace with such technological change would significantly impact our growth and profitability.
ECONOMIC AND POLITICAL INSTABILITY
Unilever operates around the globe and is exposed to economic and political instability that may reduce consumer demand for our products, disrupt sales operations
and/or impact the profitability of our operations.
Adverse economic conditions may affect
one or more countries within a region, or may extend globally.
Government actions such as
foreign exchange or price controls can impact on the growth and profitability of our local operations.
Unilever has more than half its turnover in emerging markets which can offer greater growth opportunities but also expose Unilever to related economic and political
volatility.
TREASURY AND PENSIONS
Unilever is exposed to a variety of external financial risks in relation to Treasury and Pensions.
The relative values of currencies can fluctuate widely and could have a significant impact on
business results. Further, because Unilever consolidates its financial statements in euros it is subject to exchange risks associated with the translation of the underlying net assets and earnings of its foreign subsidiaries.
We are also subject to the imposition of exchange controls by individual countries which could
limit our ability to import materials paid in foreign currency or to remit dividends to the parent company.
Unilever may face liquidity risk, ie difficulty in meeting its obligations, associated with its financial liabilities. A material and sustained shortfall in our cash flow
could undermine Unilever’s credit rating, impair investor confidence and also restrict Unilever’s ability to raise funds.
We are exposed to market interest rate fluctuations on our floating rate debt. Increases in benchmark interest rates could increase the interest cost of our floating rate
debt and increase the cost of future borrowings.
In times of financial market volatility, we
are also potentially exposed to counter-party risks with banks, suppliers and customers.
Certain businesses have defined benefit pension plans, most now closed to new employees, which are exposed to movements in interest rates, fluctuating values of
underlying investments and increased life expectancy. Changes in any or all of these inputs could potentially increase the cost to Unilever of funding the schemes and therefore have an adverse impact on profitability and cash flow.
Acting in an ethical manner, consistent with the expectations of customers, consumers and other stakeholders, is essential for the protection of the reputation of
Unilever and its brands.
Unilever’s brands and reputation are valuable assets and the
way in which we operate, contribute to society and engage with the world around us is always under scrutiny both internally and externally. Despite the commitment of Unilever to ethical business and the steps we take to adhere to this commitment,
there remains a risk that activities or events cause us to fall short of our desired standard, resulting in damage to Unilever’s corporate reputation and business results.
LEGAL AND REGULATORY
Compliance with laws and regulations is an essential part of Unilever’s business operations.
Unilever is subject to national and regional laws and regulations in such diverse areas as product
safety, product claims, trademarks, copyright, patents, competition, employee health and safety, data privacy, the environment, corporate governance, listing and disclosure, employment and taxes.
Failure to comply with laws and regulations could expose Unilever to civil and/or criminal actions
leading to damages, fines and criminal sanctions against us and/or our employees with possible consequences for our corporate reputation.
Changes to laws and regulations could have a material impact on the cost of doing business. Tax, in particular, is a complex area where laws and their interpretation are
changing regularly, leading to the risk of unexpected tax exposures. International tax reform remains a key focus of attention with the OECD’s Base Erosion & Profit Shifting project and further potential tax reform in the EU and
Switzerland.
IN FOCUS:
CLIMATE CHANGE RISKS AND OPPORTUNITIES
UNILEVER HAS PUBLICLY COMMITTED TO IMPLEMENTING THE RECOMMENDATIONS OF THE TASK FORCE ON CLIMATE-RELATED FINANCIAL
DISCLOSURES.
Unilever recognises the importance of disclosing climate-related risks and opportunities. Adopting the Taskforce on Climate-Related Financial
Disclosures (TCFD) recommendations is an important step forward in enabling market forces to drive efficient allocation of capital and support a smooth transition to a low-carbon economy.
In this Annual Report and Accounts, we continue to integrate climate-related disclosures throughout the Strategic Report narrative. However, in recognition of the growing
significance of the impacts of climate change on our business, we have also summarised the risks and opportunities arising from climate change, and our response below.
The Boards take overall accountability for the management of climate change risks and opportunities with support from the ULE and the USLP Steering Team (see page 46).
Chaired by Keith Weed in 2018, the USLP Steering Team includes nine members of the ULE and meets five times a year. During 2018, there were numerous agenda items on topics related to climate change including our overall climate strategy and our
renewable electricity target.
For management employees (including the ULE), incentives include fixed pay, a bonus as a percentage of fixed pay and a long-term
management co-investment plan (MCIP) linked to financial and USLP performance. The USLP component accounts for 25% of total MCIP award. The sustainability component of MCIP includes consideration of our
progress against climate change, water and palm oil targets, which among others, underpin our climate strategy. See pages 52 to 54 for more on MCIP.
UNDERSTANDING IMPACT
Climate change has been identified as a principal risk to Unilever which has the potential to impact our business in the short, medium and long-term. Further details on
the nature of climate risks and opportunities for Unilever can be found in our 2018 CDP Climate submission (see further climate change disclosures on pages 7 and 14).
To further understand the impact that climate change could have on Unilever’s business we performed a high-level assessment of the impact of 2°C and 4°C
global warming scenarios. The 2°C and 4°C scenarios are constructed on the basis that average global temperatures will have increased by 2°C and 4°C in the year 2100.
Between today and 2100 there will be gradual changes towards these endpoints and we have looked at the impact on our business in 2030 assuming we have the same business
activities as we do today. We also made the following simplifying assumptions:
•
In the 2°C scenario, we assumed that in the period to 2030 society acts rapidly to limit greenhouse gas emissions and puts in place measures to restrain deforestation and discourage emissions (for example
implementing carbon pricing at $75-$100 per tonne, taken from the International Energy Agency’s 450 scenario). We have assumed that there will be no significant impact to our business from the physical
ramifications of climate change by 2030 – ie from greater scarcity of water or increased impact of severe weather events. The scenario assesses the impact on our business from regulatory changes.
•
In the 4°C scenario, we assumed climate policy is less ambitious and emissions remain high so the physical manifestations of climate change are increasingly apparent by 2030. Given this we have not included impacts
from regulatory restrictions but focus on those resulting from the physical impacts.
We identified the material impacts on Unilever’s business arising from each of these scenarios based on existing
internal and external data. The impacts were assessed without considering any actions that Unilever might take to mitigate or adapt to the adverse impacts or to introduce new products which might offer new sources of revenue as consumers adjust to
the new circumstances.
The main impacts of the 2°C scenario were as follows:
•
Carbon pricing is introduced in key countries and hence there are increases in both manufacturing costs and the costs of raw materials such as dairy ingredients and the metals used in packaging.
•
Zero net deforestation requirements are introduced and a shift to sustainable agriculture puts pressure on agricultural production, raising the price of certain raw materials.
The main impacts of the 4°C scenario were as follows:
•
Chronic and acute water stress reduces agricultural productivity in some regions, raising prices of raw materials.
•
Increased frequency of extreme weather (storms and floods) causes increased incidence of disruption to our manufacturing and distribution networks.
•
Temperature increase and extreme weather events reduce economic activity, GDP growth and hence sales levels fall.
Our
analysis shows that, without action, both scenarios present financial risks to Unilever by 2030, predominantly due to increased costs. However, while there are financial risks which would need to be managed, we would not have to materially change
our business model. The most significant impacts of both scenarios are on our supply chain where costs of raw materials and packaging rise, due to carbon pricing and rapid shift to sustainable agriculture in a 2°C scenario and due to chronic
water stress and extreme weather in a 4°C scenario. The impacts on sales and our own manufacturing operations are relatively small.
The results of this analysis
confirm the importance of doing further work to ensure that we understand the critical dependencies of climate change on our business and to ensure we have action plans in place to help mitigate these risks and thus prepare the business for the
future environment in which we will operate.
During 2018 we developed and piloted an approach to assess the impact of climate change on our key commodities. We
selected soy for this pilot based on its importance to Unilever (large purchased volume), it being a high-profile crop in the countries where it is grown and the availability of good historical price data and
suitable climate models.
We developed a methodology which combined forecasting future yields and quantifying the impact on commodity prices of soybean oil. Climate
change was the only price factor accounted for in the model used to calculate the impact. Other factors which impact price, such as technology and acreage, were excluded. The model considered the direct risks from climate change to the price of
soybean oil, such as change in yield and change in supply. Three modelling steps were performed:
•
Yield estimation: We analysed multiple agriculture and climate models to provide a forecast range of expected yields in key growing regions.
•
Price relationship: An econometric model was developed, based on an analysis of the soybean oil market and historical trends, to estimate the impact of climate-induced yield changes on future prices. This model
considered the importance of co-products eg soybean meal, substitution potential eg with sunflower oil and industrial uses of soybean oil, as well as the impact of yield on price.
•
Impact estimation: Future yields and price impacts were then translated into an estimated financial exposure from climate change for our business, using our forecast procurement volumes.
Our pilot analysis showed that soybean yields may increase over the 2030 and 2050-time horizon and that subsequent lower prices may then lead to small potential
reductions in our procurement spend on soy. While the results may indicate a low financial risk to our business, we would need to consider a wider range of risk factors when determining our strategic response. Indirect risks from climate change,
such as catastrophic events or external policy response and adaptation could also have an impact but were not included in our modelling. Furthermore, these pilot results are
specific to soy and can’t be applied to other crops. We have therefore decided to get broader understanding on the
climate change risks to our agricultural sourcing and extend our analysis to two other important crops to Unilever: Palm Oil and Tea, for which suitable climate change models for yield predictions will be available in 2019.
RESPONDING TO RISKS AND OPPORTUNITIES
Unilever’s vision is to grow our
business whilst decoupling our growth from our environmental footprint and increasing positive social impact. This vision explicitly recognises that sustainable growth – including management of climate-related risks and opportunities – is
the only way to create long-term value for all our stakeholders.
The Unilever Sustainable Living Plan (USLP) was developed to deliver our vision. It is fully
integrated with our business strategy. Climate-related issues are integral to the USLP. Two of our GHG reduction targets included in the USLP are recognised as science-based:
•
Halve the greenhouse gas impact of our products across the lifecycle by 2030 (this target covers all the phases across the lifecycle of our products: ingredients/raw materials, manufacturing, distribution, retail,
packaging, consumer use and disposal)
•
Reduce scope 1 and 2 greenhouse gas emissions by 100% from our own operations by 2030 (this is part of our ambition to be become carbon positive in our manufacturing by 2030)
We are taking action across our value chain to reduce our emissions, creating growth opportunities and minimising risk. Our commitment to source 100% of our palm oil from
sustainable sources is helping to avoid emissions from deforestation (see pages 14 and 47). Our efforts to reduce energy and GHG emissions in manufacturing are helping us to save costs. For example, by using less energy, we have already avoided
energy costs in our factories of over €600 million since our baseline year of 2008.
Our divisions are
taking action to reduce emissions. In Home Care we are focusing on concentrated liquid laundry detergents such as Persil, Omo and Surf Small & Mighty which help consumers to wash clothes at lower temperatures, reducing GHG by up to 50% per
load. We have removed phosphates from all laundry powders worldwide, resulting in lower greenhouse gas emissions of up to 50% per consumer use. Our Foods & Refreshment division has prioritised reducing greenhouse gas emissions from ice
cream freezers since 2008. As the world’s largest producer of ice cream, we have committed to accelerating the roll-out of freezer cabinets that use more climate-friendly natural (hydrocarbon)
refrigerants. By 2018 our total purchase of these cabinets had increased to around 2.9 million.
Detailed Lifecycle Analysis has shown that our GHG contribution
from animal-based agriculture, including fats and proteins, is relatively low: 7.5% for Foods & Refreshment and 2.5% for total Unilever. While emissions are comparatively low, the business opportunity is significant for natural and
plant-based foods and beverages. We have a range of vegan and vegetarian variants such as Hellmann’s vegan mayonnaise, Ben & Jerry’s non-dairy ice creams, Magnum vegan and other options (see
pages 11 to 12). We continue to actively promote vegetarian and vegan recipes, notably via our Knorr brand websites.
A number of our targets directly address risks
and opportunities related to water scarcity caused by climate change. We estimate that the sale of products which address water scarcity issues could increase in our Home Care and Beauty & Personal Care divisions where a number of products
are available which address water scarcity and/ or have a lower GHG in use. For example, our Beauty & Personal Care division is investing in water smart product innovations such as dry shampoo and cleansing conditioner which help consumers
use less water while also offering relevant benefits such as reduced colour loss and damage which can arise from frequent washing. Home Care is combining insights in consumer behaviour and water consumption with innovative technology to develop new
market opportunities, launching products and formulations that address water scarcity and help our consumers save water. Day2, the world’s first dry wash spray is made with only 0.02% of the water in a normal laundry load. Sunlight 2-in-1 Handwashing Laundry Powder and Rin (Radiant) detergent bar are also helping to reduce water consumption at point of use in water-stressed countries.
Home Care is home to three brands, Pureit, Truliva/Qinyuan and Blueair, which are responding directly to issues related to
climate change. Pureit and Truliva, our water purification businesses, offer products which provide safe drinking water to millions of people with a lower carbon footprint than alternatives. Our detailed lifecycle analysis shows that Pureit’s
total carbon footprint is at least 80% lower than boiled or bottled water. Blueair, our indoor air purification business acquired in 2016, removes contaminants from the air, including hazardous sooty particles associated with the combustion of
fossil fuels.
Several other targets in our USLP indirectly address climate risk and opportunities by aiming to support groups who are vulnerable to the effects of
climate change and who are critical to our future growth, notably smallholder farmers and women in low income countries.
Unilever continues to support a number of
policy measures to accelerate the transition to a low-carbon economy, including the pricing of carbon and removal of fossil fuel subsidies which act as negative carbon prices. We believe that carbon pricing is
a fundamental part of the global response to climate change and without it, the world is unlikely to meet its greenhouse gas reduction targets. We have publicly supported calls for carbon pricing and are members of The Carbon Pricing Leadership
Coalition, hosted by the World Bank. In 2016, we implemented an internal price on carbon as part of the business case appraisal for large capital expenditure projects. The carbon price is also applied to emissions from our manufacturing sites to
raise a clean-tech fund. So far, €73 million has been allocated to this fund for energy and water saving projects. In January 2018 the price of carbon was €40 per tonne.
MEASURING AND REPORTING
We have been measuring and reporting on our energy and water consumption and carbon emissions since 1995. The USLP includes a number of stretching targets which relate to
climate risks and opportunities across our value chain. Performance against key targets can be found on page 7 with commentary on page 13 and 14. Our website contains detailed commentary on our USLP targets as well as actions we are taking to
achieve them.
Our ability to meet our climate-related targets partly depends on changes in the energy markets worldwide, such as the rate of installation of
renewable electricity in many countries. We have a role to play as an industry leader to help shape those markets. We are working collaboratively with partners, suppliers and others to achieve our ambition.
We’ve created a detailed plan to annually assess the feasibility for Unilever to reach our target to halve the greenhouse gas impact of our products across the
lifecycle by 2030, taking both external transitions towards a low-carbon economy as well as the latest available data and assumptions about our GHG footprint into account. The basis of this plan is the set of
around 2,800 products representative of our global portfolio across all divisions for which we have full value-chain lifecycle analysis results.
We recalculated the
footprint of these products using the latest 2030 projections on external transitions to a low-carbon economy (eg International Energy Agency 2030 projection on grid changes to renewable energy), low-carbon transition plans in our operations (eg achieving zero net deforestation by 2020, using 100% renewable energy by 2020) and Innovation Roadmaps (eg redesign for lower embedded carbon emissions, transforming
the temperature-controlled supply chain).
In line with the Large and Medium sized Companies and Groups (Accounts and Reports) Regulations 2008 as amended by the
Companies Act 2006 (Strategic Report and Directors’ Report) Regulations 2013 our greenhouse gas (GHG) emissions are set out below. For Scope 1 and 2 we report our CO2 emissions only but
not other GHG emissions as these are considered to be not material. For Scope 3 we report our GHG emissions (eg CO2, CH4, N2O) in terms of CO2 equivalents.
We report our emissions
with reference to the latest Greenhouse Gas Protocol Corporate Accounting and Reporting Standard (GHG Protocol) to calculate emissions of carbon dioxide from the combustion of fuels and the operation of facilities (Scope 1) and from purchased
electricity, heat, steam and cooling (Scope 2, market-based method). Each year PwC assure selected manufacturing environmental metrics including carbon emissions from energy use and energy use per tonne of production.
The GHG data below relates to emissions during the 12-month period from
1 October to 30 September. This period is different from the Strategic Report, Directors’ Report and Financial Statements which are calendar year.
UNILEVER GREENHOUSE GAS EMISSIONS BY ACTIVITY^
2018
2017
Manufacturing (scope 1 and 2)
Scope 1 (tonnes CO2)
711,875
773,856
Scope 2* (tonnes CO2)
726,167
793,472
Total Scope 1 & 2* (tonnes CO2)
1,438,042
1,567,328
Intensity ratio (kg CO2 per tonne of production)
70.46
76.77
Distribution centres, research laboratories, marketing and sales offices (scope 1 and 2)
Scope 1 (tonnes CO2)
20,052
20,039
Scope 2* (tonnes CO2)
100,924
102,292
Total Scope 1 & 2* (tonnes CO2)
120,976
122,331
Upstream and downstream of Unilever operations – top 3 emissions sources (scope 3)
Consumer use
(downstream) (tonnes CO2e)q
39,895,946
38,697,432
Ingredients and packaging
(upstream) (tonnes CO2e)‡
14,985,897
15,000,941
Distribution and retail
(downstream) (tonnes CO2e)
4,368,626
3,895,589
^
Carbon emission factors are used to convert energy used in our operations to emissions of CO2. Carbon emission factors for fuels are provided by the Intergovernmental Panel on Climate Change (IPCC).
+
For manufacturing we have selected an intensity ratio based on production. This aligns with our long-standing reporting of
manufacturing performance. Emissions from the combustion of biogenic fuels (biomass, fuel crops etc) within our operations are reported separately to other Scope 1 and 2 emissions, as recommended by the GHG Protocol, and excluded from our intensity
ratio calculation. The data also excludes Scope 3 emissions (including consumer use of our products) which we report as part of our Unilever Sustainable Living Plan.
*
Carbon emission factors for grid electricity calculated according to the ‘market-based method’ are
supplier-specific emissions factors reflecting contractual arrangements with electricity suppliers. Where supplier-specific emissions factors are not available, carbon emissions factors reflect the country where each operation is located and are
provided by the International Energy Agency (IEA).
q
We measure the full GHG footprint of our product portfolio and annual sales using an LCA method compliant with the ISO
14040 standard. We measure the consumer use phase using a combination of primary habits data and on pack recommendations of use combined with lifecycle inventory data. We measure a representative sample of products across 14 countries which account
for around 60-70% of our annual sales volume.
‡
We use a combination of external lifecycle inventory databases (secondary data) and supplier specific data (primary data
eg for surfactants, perfumes and some of food ingredients) to measure the GHG emissions of purchased ingredients and packaging materials used in the production of our products.
Downstream distribution is calculated using average distances and modes of transport derived from data collected from our
distribution network and logistic providers.
FURTHER CLIMATE CHANGE DISCLOSURES
This Annual Report and Accounts contains additional disclosures on our climate change risks and opportunities:
•
Governance and remuneration: pages 46 to 47 and 52 to 54
•
Strategy for climate change: page 14
•
Risk management: page 30
•
Metrics and targets: pages 7 and 13 to 14
Our website contains disclosures on our greenhouse gas and water USLP targets.
Since its formation in 1930, the Unilever Group
has operated as nearly as practicable as a single economic entity. This is achieved by special provisions in the Articles of Association of NV and PLC, together with a series of agreements between NV and PLC which are together known as the
Foundation Agreements (described below). These agreements enable Unilever to achieve unity of management, operations, shareholders’ rights, purpose and mission and can be found on our website.
The Equalisation Agreement makes the economic position of the shareholders of NV and PLC, as far as possible, the same as if they held shares in a single company and also
regulates the mutual rights of the shareholders of NV* and PLC. Under this agreement, NV and PLC must adopt the same financial periods and accounting policies.
The
Deed of Mutual Covenants provides that NV and PLC and their respective subsidiary companies shall co-operate in every way for the purpose of maintaining a common operating policy. They shall exchange all
relevant information about their respective businesses – the intention being to create and maintain a common operating platform for the Unilever Group throughout the world. This Deed also contains provisions for the allocation of assets within
the Unilever Group.
Under the Agreement for Mutual Guarantees of Borrowing between NV and PLC, each company will, if asked by the other, guarantee the borrowings of
the other and the other’s subsidiaries. These arrangements are used, as a matter of financial policy, for certain significant borrowings. They enable lenders to rely on our combined financial strength.
Each NV ordinary share represents the same underlying economic interest in the Unilever Group as each PLC ordinary share. However, NV and PLC remain separate legal
entities with different shareholder constituencies and separate stock exchange listings. Shareholders cannot convert or exchange the shares of one for the shares of the other. More information on the exercise of voting rights can be found in
NV’s and PLC’s Articles of Association and in the Notices of Meetings for our NV and PLC AGMs, all of which can be found on our website.
*
Throughout this report, when referring to NV shares or shareholders, the term ‘shares’ or
‘shareholder’ also encompasses a depositary receipt or a holder of depositary receipts.
The Boards of NV and PLC have ultimate
responsibility for the management, general affairs, direction, performance and long-term success of our business as a whole. The Boards are one-tier boards, the same people are on both Boards and the
responsibility of the Directors is collective, taking into account their respective roles as Executive Directors and Non-Executive Directors. The majority of the Directors are
Non-Executive Directors who essentially have a supervisory role. In the normal course Unilever has two Executive Directors, the Chief Executive Officer (CEO) and the Chief Financial Officer (CFO). On
31 December 2018 the current CEO resigned and his successor, Alan Jope, was appointed on 1 January 2019. Alan will be proposed to be appointed as an Executive Director at the 2019 AGMs. Consequently, between 1 January 2019 and
the 2019 AGMs in May we have one Executive Director.
A list of our current Directors, their roles on the Boards, their dates of appointment, tenure and their other major
appointments is set out on page 3.
The Boards have delegated the operational running of the Unilever Group to the CEO with the exception of the following
matters which are reserved for the Boards: structural and constitutional matters, corporate governance, approval of dividends, approval and monitoring of overall strategy for the Unilever Group, approval of significant transactions or arrangements
in relation to mergers, acquisitions, joint ventures and pensions. The CEO is responsible to the Boards in relation to the operational running of the Group and other powers delegated to him by the Boards. The CEO can delegate any of his powers and
discretions, and he does so delegate to members of the Unilever Leadership Executive (ULE) (with power to sub-delegate). The ULE is composed of the CEO, CFO and other senior executives who assist the CEO in
the discharge of the powers delegated to the CEO by the Boards. Members of the ULE report to the CEO, and the CEO supervises and determines the roles, activities and responsibilities of the ULE. While ULE members (other than the CEO and the CFO) are
not part of the Boards’ decision-making process, to provide the Boards with deeper insights, ULE members often attend those parts of the Board meetings which relate to the operational running of the Group. The ULE currently consists of the CEO,
CFO, the Division Presidents, the Presidents for Europe and North America, and the Chief Research and Development Officer, Chief HR Officer, Chief Legal Officer and Group Secretary, Chief Marketing and Communications Officer and Chief Supply Chain
Officer.
The biographies of ULE members are on page 5.
BOARD COMMITTEES
The Boards have established four Board Committees: the Audit Committee, the Compensation Committee, the Corporate Responsibility Committee and the Nominating and
Corporate Governance Committee. The terms of reference of these Committees can be found on our website and the reports of each Committee, including attendance at meetings in 2018, can be found on pages 43 to 65.
Further details
of the roles and responsibilities of the Chairman, Senior Independent Director/Vice-Chairman, CEO, CFO and other corporate officers and how our Boards effectively operate as one board, govern themselves and delegate their authorities are set out in
the document entitled ‘The Governance of Unilever’, which can be found on our website.
The Governance of Unilever also describes the Foundation Agreements,
Directors’ appointment, tenure, induction and training, Directors’ ability to seek independent advice at Unilever’s expense and details about Board and Management Committees (including the Disclosure Committee).
A minimum of five face-to-face meetings are planned throughout the calendar year to consider important corporate events and actions, for example, the half-year and full-year results
announcements of the Unilever Group; the development of and approval of the overall strategy of the Unilever Group; oversight of the performance of the business; review of risks and internal risk management and control systems; authorisation of
major transactions; declaration of dividends; convening of shareholders’ meetings; succession planning; review of the functioning of the Boards and their Committees; culture; and review of corporate responsibility and sustainability, in
particular the Unilever Sustainable Living Plan. Other ad hoc Board meetings are convened to discuss strategic, transactional and governance matters that arise. In 2018 the Boards met physically in January, March, May, July, October and November.
Meetings of the Boards may be held either in London or in Rotterdam or such other locations as the Boards think fit, with one or two off-site Board meetings a year. The Chairman sets the Boards’ agenda,
ensures the Directors receive accurate, timely and clear information, and promotes effective relationships and open communication between the Executive and Non-Executive Directors.
ATTENDANCE
The table showing the attendance of current Directors at Board
meetings in 2018 can be found on page 3. If Directors are unable to attend a Board meeting they have the opportunity beforehand to discuss any agenda items with the Chairman. Ann Fudge attended four of the Board meetings she was eligible to attend
before retiring from the Boards on 3 May 2018.
NON-EXECUTIVE DIRECTOR MEETINGS
The Non-Executive Directors usually meet as a group, without the Executive Directors present, when there is a face-to-face Board meeting. In 2018 they met five times. The Chairman, or in his absence the Senior Independent Director/Vice-Chairman, chairs such meetings.
BOARD EVALUATION
Each year the Boards formally assess their own performance
with the aim of helping to improve the effectiveness of both the Boards and the Committees. At least once every three years an independent third party facilitates the evaluation. The last external evaluation was performed in 2017. The evaluation
consists of individual interviews with the Directors by the Chairman and, when relevant, by the external evaluator. These interviews are complemented by the completion by all Directors of three confidential online evaluation questionnaires on the
efficiency and effectiveness of our Boards, CEO and Chairman. The Boards evaluation questionnaire this year focused on a number of key areas including Strategy, Risk/Financial Controls, Board Effectiveness and Information/Knowledge. The
Chairman’s statement on page 2 describes the key actions agreed by the Boards following the evaluation.
The evaluation of the performance of the Chairman and
CEO is led by the Senior Independent Director/Vice-Chairman and Chairman respectively, and the bespoke questionnaires will be used to support these evaluations. Committees of the Boards evaluate themselves annually under supervision of their
respective Chairs taking into account the views of respective Committee members and the Boards. The key actions agreed by each Committee in the 2018 evaluations can be found in each Committee Report.
APPOINTMENT
In seeking to ensure that NV and PLC have the same Directors, the
Articles of Association of NV and PLC contain provisions which are designed to ensure that both NV and PLC shareholders are presented with the same candidates for election as Directors. Anyone being elected as a Director of NV must also be elected
as a Director of PLC and vice versa. Therefore, if an individual fails to be elected to both companies he or she will be unable to take his or her place on either Board.
The report of the Nominating and Corporate Governance Committee (NCGC) on pages 48 and 49 describes the work of the NCGC in
Board appointments and recommendations for re-election. In addition, shareholders are able to nominate Directors. The procedure for shareholders to nominate Directors is contained within the document entitled
‘Appointment procedure for NV and PLC Directors’ which is available on our website. To do so they must put a resolution to both the NV and PLC AGMs in line with local requirements. Directors are appointed by shareholders by a simple
majority vote at each AGM.
All new
Directors participate in a comprehensive induction programme when they join the Boards. The Chairman ensures that ongoing training is provided for Directors by way of site visits, presentations and circulated updates at (and between) Board and Board
Committee meetings on, among other things, Unilever’s business, environmental, social, corporate governance, regulatory developments and investor relations matters. For example, in 2018 the Directors received presentations on Information
Security, Digital, the Supply Chain and Simplification.
INDEPENDENCE AND CONFLICTS
As the Non-Executive Directors make up the Committees of the Boards, it is important that they can be considered to be
independent. Each year the Boards conduct a thorough review of the Non-Executive Directors’, and their related or connected persons’, relevant relationships referencing the criteria set out in
‘The Governance of Unilever’ which is derived from the relevant best practice guidelines in the Netherlands, UK and US. The Boards currently consider all our Non-Executive Directors to be independent
of Unilever.
We attach special importance to avoiding conflicts of interest between NV and PLC and their respective Directors. The Boards ensure that there are
effective procedures in place to avoid conflicts of interest by Board members. A Director must without delay report any conflict of interest or potential conflict of interest to the Chairman and to the other Directors, or, in case any conflict of
interest or potential conflict of interest of the Chairman, to the Senior Independent Director/Vice-Chairman and to the other Directors. The Director in question must provide all relevant information to the Boards, so that the Boards can decide
whether a reported (potential) conflict of interest of a Director qualifies as a conflict of interest within the meaning of the relevant laws. A Director may not vote on, or be counted in a quorum in relation to, any resolution of the Boards in
respect of any situation in which he or she has a conflict of interest. The procedures that Unilever has put in place to deal with conflicts of interest operate effectively.
Unilever recognises the benefit to the individual and the Unilever Group of senior executives acting as directors of other companies but, to ensure outside directorships
of our Executive Directors do not involve an excessive commitment or conflict of interest, the number of outside directorships of listed companies is generally limited to one per Executive Director and approval is required from the Chairman.
INDEMNIFICATION
The terms of NV Directors’ indemnification are provided
for in NV’s Articles of Association. The power to indemnify PLC Directors is provided for in PLC’s Articles of Association and deeds of indemnity have been agreed with all PLC Directors. Third-party directors’ and officers’
liability insurance was in place for all Unilever Directors throughout 2018 and is currently in force.
In addition, PLC provides indemnities (including, where
applicable, a qualifying pension scheme indemnity provision) to the Directors of three subsidiaries each of which acts as trustee of a Unilever UK pension fund. Appropriate trustee liability insurance is also in place.
NV’s issued share capital on 31 December 2018* was made up of:
•
€274,356,432 split into 1,714,727,700 ordinary shares of €0.16 each; and
•
€1,028,568 split into 2,400 special ordinary shares numbered 1 – 2,400 known as special ordinary shares.
*
When referred to the issued share capital on 31 December 2018 also
€62,065,550 split into two classes (6% and 7%) of cumulative preference shares was outstanding. All 6% and 7% cumulative preference shares were held in treasury as a result of which these shares
cannot be voted upon in the General Meeting of NV. The resolutions of the General Meeting of NV and the Board of NV to cancel these shares were filed on 29 November 2018 with the Dutch Trade Register and an announcement thereof in a daily and
nationally distributed newspaper in the Netherlands was made on 5 December 2018. These shares were cancelled on 6 February 2019.
LISTINGS
NV has ordinary shares (UNIA) and depositary receipts for such ordinary shares (UNA) listed on Euronext Amsterdam and, as US
New York Registry Shares* (UN) on the New York Stock Exchange.
*
One New York Registry Share represents one NV ordinary share with a nominal value of €0.16.
VOTING RIGHTS
NV shareholders can cast one vote for each €0.16 nominal capital they hold and can vote in person or by proxy. The
voting rights attached to NV’s outstanding shares are split as follows:
Total number
of votes
% of issued
capital
1,714,727,700 ordinary shares
1,714,727,700
(a)
99.63
2,400 special shares
6,428,550
0.37
As at 31 December 2018:
(a)
254,012,896 shares were held in treasury and 9,336,215 shares were held to satisfy obligations under share-based incentive
schemes. These shares and the special shares are not voted on. All 6% and 7% cumulative preference shares were held in treasury as a result of which these shares cannot be voted upon, as described within the Share Capital section above.
SHARE ISSUES AND PURCHASE OF SHARES
At the NV AGM held on 3 May 2018 the Board of NV was designated as the corporate body authorised to resolve on the issue of, or on the granting of rights to
subscribe for, shares not yet issued and to restrict or exclude the statutory pre-emption rights that accrue to shareholders upon issue of shares, on the understanding that this authority is limited to 33% of
NV’s issued ordinary share capital and to disapply pre-emption rights to 5% of NV’s issued share capital for general corporate purposes and an additional 5% authority only in connection with an
acquisition or specified capital investment.
In addition, at NV’s 2018 AGM the NV Board was designated as the corporate body authorised to purchase
(i) ordinary shares with a maximum of 10% of the issued share capital as well as (ii) any and all 6% and 7% cumulative preference shares.
These authorities
expire on the earlier of the conclusion of the 2019 NV AGM or the close of business on 30 June 2019 (the last date by which NV must hold an AGM in 2019). Such authorities (other than with respect to the 6% and 7% cumulative preference shares)
are renewed annually.
During 2018 companies within the Unilever Group purchased 4,000,000 NV ordinary shares, representing 0.23% of the issued ordinary share
capital, for €183,380,649. These purchases were made to facilitate grants made in connection with Unilever’s employee compensation programmes. Further information on these purchases can be
found in note 4C to the consolidated accounts on page 93.
In addition, NV conducted a share buyback programme during 2018 with an aggregate market value of approximately €3 billion bought back in the form of 62,202,168 NV ordinary shares (or depositary receipts in respect of such ordinary shares).
Following a public offer and a subsequent squeeze out procedure, Unilever Corporate Holdings Nederland B.V. (UCHN), an indirect wholly owned subsidiary of PLC, acquired
all 6% cumulative preference shares and 7% cumulative preference shares. Unilever N.V. purchased these 6% cumulative preference shares and 7% cumulative preference shares on 2 October 2018. The resolutions of the General Meeting of NV and the
Board of NV to cancel these shares were filed on 29 November 2018, as described within the Share Capital section above.
Further information on these purchases
can be found in note 4C to the consolidated accounts on page 93.
NV SPECIAL ORDINARY SHARES
To ensure unity of management, the provisions within the NV Articles of Association containing the rules for appointing NV Directors cannot be changed without the
permission of the holders of the special ordinary shares numbered 1 – 2,400 inclusive. These NV special ordinary shares may only be transferred to one or more other holders of such shares. The joint holders of these shares are N.V. Elma and
United Holdings Limited, which are subsidiaries of NV and PLC respectively. The Boards of N.V. Elma and United Holdings Limited comprise three Directors of the Unilever Boards.
TRUST OFFICE
The Foundation Unilever N.V. Trust
Office (Stichting Administratiekantoor Unilever N.V.) is a trust office with a board independent of Unilever. As part of its corporate objects, the Trust Office issues depositary receipts in exchange for the NV ordinary shares. These depositary
receipts are listed on Euronext Amsterdam, as are the NV ordinary shares themselves
Holders of depositary receipts can under all circumstances exchange their
depositary receipts for the underlying shares (and vice versa) and are entitled to dividends and all economic benefits on the underlying shares held by the Trust Office. There are no limitations on the holders’ voting rights, they can attend
all General Meetings of NV, either personally or by proxy, and have the right to speak. The Trust Office only votes shares that are not represented at a General Meeting. The Trust Office votes in such a way as it deems to be in the long-term
interests of the holders of the depositary receipts. This voting policy is laid down in the Conditions of Administration that apply to the depositary receipts.
The
Trust Office’s shareholding fluctuates daily. Its holdings on
31 December 2018 were 1,268,051,254 NV ordinary shares (73.95%).
At the 2018 NV AGM, the Trust Office represented 36.95% of all votes present at the meeting.
The current members of the board at the Trust Office are Mr J H Schraven (Chairman), Mr P M L Frentrop, Mr A Nühn and Ms C M S Smits-Nusteling. The Trust Office
reports periodically on its activities. Further information on the Trust Office, including its Articles of Association, Conditions of Administration and Voting Policy, can be found on its website.
PLC’s issued share capital on
31 December 2018 was made up of:
•
£36,934,840 split into 1,187,191,284 ordinary shares of 31⁄9p each; and
•
£100,000 of deferred stock of £1 each.
LISTINGS
PLC has ordinary shares (ULVR) listed on the London Stock Exchange and, as American Depositary Receipts* (UL), on the New York Stock Exchange.
*
One American Depository Receipt represents one PLC ordinary share with a nominal value of
31⁄9p.
VOTING RIGHTS
PLC shareholders can cast one vote for each 31⁄9p nominal capital they hold and can
vote in person or by proxy. The voting rights attached to PLC’s outstanding shares are split as follows:
Total number
of votes
% of issued
capital
1,187,191,284 ordinary shares
1,187,191,284
99.73
£100,000 deferred stock
3,214,285
0.27
As at 31 December 2018:
(a)
18,660,634 shares were held by PLC in treasury and 5,645,392 shares were held by NV group companies. These shares and the
deferred stock are not voted on.
SHARE ISSUES AND PURCHASE OF SHARES
At the 2018 PLC AGM held on 2 May 2018 the PLC Directors were authorised to issue new shares, up to a maximum of £12,755,555 nominal value (which at the time
represented approximately 33% of PLC’s issued ordinary share capital) and to disapply pre-emption rights up to approximately 5% of PLC’s issued ordinary share capital for general corporate purposes
and an additional 5% authority only in connection with an acquisition or specified capital investment.
In addition, at PLC’s 2018 AGM the PLC Board was
authorised to make market purchases of its ordinary shares, up to a maximum of just under 10% of PLC’s issued ordinary share capital and within the limits prescribed in the resolution until the earlier of the conclusion of PLC’s 2019 AGM
and 30 June 2019. These authorities are renewed annually and authority will be sought at PLC’s 2019 AGM.
During 2018 companies within the Unilever Group
purchased 2,222,000 PLC ordinary shares, representing 0.19% of the issued share capital, for £87,978,671. These purchases were made to facilitate grants made in connection with its employee compensation programmes. Further information on these
purchases can be found in note 4C to the consolidated accounts on page 93.
In addition, PLC conducted a share buyback programme during 2018 with an aggregate market
value of approximately £3 billion bought back in the form of 63,236,433 PLC ordinary shares.
On 31 July 2018, PLC cancelled 110,493,623 PLC ordinary
shares of 31⁄9p each held in treasury, representing 8.43% of the issued share capital. On 19 September 2018, PLC cancelled a further 12,471,454 PLC ordinary
shares of 31⁄9p each held in treasury, representing 1.04% of the issued share capital.
PLC DEFERRED STOCK
To support unity of
management, the holders of PLC’s deferred stock have rights within PLC’s Articles of Association relating to any changes in the rules for appointing PLC Directors. The joint holders of the PLC deferred stock are N.V. Elma and United
Holdings Limited, which are subsidiaries of NV and PLC respectively. The Boards of N.V. Elma and United Holdings Limited comprise three Directors of the Unilever Boards.
OUR
SHAREHOLDERS
SIGNIFICANT SHAREHOLDERS OF NV
As far as Unilever is
aware, the only holder of more than 3% of, or 3% of voting rights attributable to, NV’s share capital (‘Disclosable Interests’) on 31 December 2018 (apart from the Foundation Unilever N.V. Trust Office, see page 38) is BlackRock,
Inc. (BlackRock) as indicated in the table below.
Shareholder
Class of shares
Total number of shares held
% of relevant class
BlackRock
ordinary shares
66,947,018
3.90
BlackRock notified the AFM that its holding changed to 4.02% on
19 February 2019. Between 1 January 2016 and 21 February 2019, BlackRock, NN Group N.V. (NN), ASR Nederland N.V. (ASR) and UCHN, see page 38, have held
more than 3% in the share capital of NV.
SIGNIFICANT SHAREHOLDERS OF PLC
As far as Unilever is aware, the only holders of more than 3% of, or 3% of voting rights attributable to, PLC’s ordinary share capital on 31 December 2018
(apart from shares held in treasury by PLC, see page 39), are BlackRock and the Leverhulme Trust as indicated in the table below.
Shareholder
Class of shares
Total number
of shares held
% of relevant class
BlackRock
ordinary shares
77,176,319
6.60
The Leverhulme Trust
ordinary shares
46,931,182
4.02
As far as Unilever is aware, no new Disclosable Interests have been notified to PLC between 1 January 2019 and 21 February 2019
(the latest practicable date for inclusion in this report). Between 1 January 2016 and 21 February 2019, (i) BlackRock, and (ii) the aggregated holdings of the trustees of the Leverhulme Trust and the Leverhulme Trade Charities Trust,
have held more than 3% of, or 3% of voting rights attributable to, PLC’s ordinary shares.
STAKEHOLDER ENGAGEMENT
We value open and effective communication with our stakeholders. The primary responsibility for stakeholder engagement, which is generally related to the operations of
the business, rests with our Executive Directors. Non-Executive Directors also actively engage with stakeholders as part of their oversight duties and responsibilities that have not been delegated to the
Executive Directors.
SHAREHOLDERS
The CFO
has lead responsibility for shareholder engagement, with the active involvement of the CEO and supported by the Investor Relations department.
The Executive
Directors’ investor relations programme continued in 2018 with meetings held with institutional shareholders in major cities globally. The Executive Directors and members of the Investor Relations team also meet a large number of investors at
the industry conferences they attend. In 2018 industry conferences attended by Unilever representatives included events in London, Paris, Stockholm, Boston and New York.
Our annual investor seminar in December also allowed investors to meet the Chairman, CEO, CEO-designate, CFO and other members of
senior management. The event was held at the offices of Hindustan Unilever in Mumbai and focused on Unilever’s emerging markets expertise as well as the digital transformation of the business.
In 2018, as part of the strategic review of options to accelerate sustainable value creation and our proposal to simplify the Unilever corporate structure, the Chairman
met and spoke with global investors during the year. The Chair of the Compensation Committee also extensively engaged with and sought feedback from investors in relation to our Remuneration Policy.
On an ongoing basis, the Boards are briefed on investor reactions to the Unilever Group’s quarterly results
announcements and on any issues raised by shareholders that are relevant to their responsibilities.
We maintain a frequent dialogue with our principal institutional
shareholders and regularly collect feedback. Private shareholders are encouraged to give feedback via shareholder.services@unilever.com. Our shareholders are also welcome to raise any issues directly with the Chairman or the Senior Independent
Director/Vice-Chairman, and the Chairman, Executive Directors and Chairs of the Committees are also generally available to answer questions from the shareholders at the AGMs each year.
OTHERS
Our Executive Directors and Non-Executive Directors also engage with a wide-ranging group of stakeholders during specific Unilever events. For example, we annually organise one or more Board Relationship meetings offering our Directors the
opportunity to directly meet our key customers, suppliers, agencies, NGOs, trade associations and advisers. In 2018, such meetings were held in the Netherlands and the UK.
EMPLOYEES
In order to allow our Non-Executive Directors to gain first-hand experience of our operations and to engage in a broader context, we organise one or more site visits annually. During these site
visits, Non-Executive Directors are informed about local market conditions and operations as well as relevant local matters. Typically, the programme allows
Non-Executive to meet management and young talent at these sites. In 2018, such site visits were held in China, Germany, the Netherlands and the US. In terms of engaging with employees, our Non-Executive Directors actively participate in our management development programme sharing knowledge and insight on a mutual basis.
www.unilever.com/investor-relations/
GENERAL MEETINGS
Both NV and PLC hold an AGM
each year. At the AGMs the Chairman gives his thoughts on governance aspects of the preceding year and the CEO gives a detailed review of the performance of the Unilever Group over the last year. Shareholders are encouraged to attend the relevant
meeting and to ask questions at or in advance of the meeting. Indeed, the question and answer session forms an important part of each meeting. The external auditors are welcomed to the AGMs and are entitled to address the meetings.
Provision 4.1.8 of the Corporate Governance Code in the Netherlands (Dutch Code) and Code Provision E.2.3 of the UK Corporate Governance Code (UK Code) require all
Directors to attend both the NV and PLC AGMs. As questions asked at our AGMs tend to focus on business related matters, governance and the remit of our Board Committees, the Chairman, CEO, CFO and the Chairs of our four Committees of the Board
attend both our AGMs and the remaining members of the Board attend at least one AGM.
The 2018 AGMs were held in Rotterdam and London in May and the topics raised by shareholders included: e-commerce, mergers & acquisitions, sustainability, Simplification, remuneration, total shareholder return, Brexit and data protection.
Shareholders of NV may propose resolutions if they individually or together hold at least 1% of NV’s issued capital in the form of shares or depositary receipts
issued for NV shares. Shareholders who together represent at least 10% of the issued capital of NV can, under certain circumstances, also requisition the District Court to allow them to convene an Extraordinary General Meeting to deal with specific
resolutions.
Shareholders of PLC may propose resolutions if they individually or together hold shares representing at least 5% of the total voting rights of PLC, or
100 shareholders who hold on average £100 each in nominal value of PLC share capital can require PLC to propose a resolution at a General Meeting. PLC shareholders holding in aggregate 5% of the issued PLC ordinary shares are able to convene a
General Meeting of PLC.
Information on the 2019 AGMs can be found within the NV and PLC AGM Notices which will be published in March 2019.
REQUIRED MAJORITIES
Resolutions are usually adopted at NV and PLC General
Meetings by an absolute majority of votes cast, unless there are other requirements under the applicable laws or NV’s or PLC’s Articles of Association. For example, there are special requirements for resolutions relating to the alteration
of the Articles of Association, the liquidation of NV or PLC and the alteration of the Equalisation Agreement.
A proposal to alter the Articles of Association of NV
can only be made by the NV Board. A proposal to alter the Articles of Association of PLC can be made either by the PLC Board or by requisition of shareholders in accordance with the UK Companies Act 2006. Unless expressly specified to the contrary
in PLC’s Articles of Association, PLC’s Articles of Association may be amended by a special resolution. Proposals to alter the provisions in the Articles of Association of NV and PLC respectively relating to the unity of management require
the prior approval of meetings of the holders of the NV special ordinary shares and the PLC deferred stock. The Articles of Association of both NV and PLC can be found on our website.
Unilever’s constitutional documents place no limitations on the right to hold or transfer NV and PLC ordinary shares. There are no limitations on the right to hold
or exercise voting rights on the ordinary shares of NV and PLC imposed by Dutch or English law.
We conduct our operations in accordance
with internationally accepted principles of good governance and best practice, while ensuring compliance with the corporate governance requirements applicable in the countries in which we operate. Unilever is subject to corporate governance
requirements (legislation, codes and/or standards) in the Netherlands, the UK and the US and in this section we report on our compliance against these.
MATERIAL
CONTRACTS
Under the European Takeover Directive as implemented in the Netherlands and the UK, the UK Companies Act 2006 and rules of the US Securities and
Exchange Commission, Unilever is required to provide information on contracts and other arrangements essential or material to the business of the Unilever Group. Other than the Foundation Agreements referred to on page 36, we believe we do not have
any such contracts or arrangements.
THE NETHERLANDS
In 2018, NV complied
with almost all the principles and best practice provisions of the Dutch Code, with the exception of Dutch Code Provision 4.1.8 as noted in the General Meetings section above and the best practice provision set out below. The Dutch Code is available
on the Monitoring Committee Corporate Governance Code’s website.
Best Practice Provision 3.2.3
The Dutch Code provides that in case of dismissal, the remuneration of an Executive Director should not exceed one year’s salary.
It is our policy to set the level of severance payments for Executive Directors at no more than one year’s salary, unless the Boards, on the recommendation of the
Compensation Committee, find this manifestly unreasonable given circumstances or unless otherwise dictated by applicable law.
Corporate Governance Statements:
In addition to an explanation of non-compliance to the Dutch Code, as set out above, the Dutch Code also requires the
Board to confirm, and the Board hereby confirms that:
•
this Annual Report and Accounts provides sufficient insights into any failings in the effectiveness of the internal risk management and control systems;
•
the systems mentioned above provide reasonable assurance that the financial reporting does not contain any material inaccuracies;
•
based on the current state of affairs, it is justified that the financial reporting is prepared on a going concern basis; and
•
this Annual Report and Accounts states those material risks and uncertainties that are relevant to the expectation of NV’s continuity for the period of 12 months after the preparation of this Annual Report and
Accounts.
The statements in this paragraph are not statements in accordance with the requirements of Section 404 of the US Sarbanes-Oxley Act of
2002.
Furthermore, NV is required to make a statement concerning corporate governance as referred to in article 2a of the decree on the content of the management
report (Besluit inhoud bestuursverslag) (the Decree).
The information required to be included in this corporate governance statement as described in articles 3, 3a
and 3b of the Decree can be found on our website.
www.commissiecorporategovernance.nl
www.unilever.com/corporategovernance
THE UNITED KINGDOM
In 2018, PLC complied with all UK Code provisions with the exception of UK Code Provision E.2.3 as noted in the General Meetings section above. The UK Code is available
on the Financial Reporting Council’s (FRC) website.
Risk Management and Control: Our approach to risk management and systems of internal control is in line with
the recommendations in the FRC’s revised guidance ‘Risk management, internal control and related financial and business reporting’ (the Risk Guidance). It is Unilever’s practice to review acquired companies’ governance
procedures and to align them to the Unilever Group’s governance procedures as soon as is practicable.
Greenhouse Gas (GHG) Emissions: Information on GHG
emissions can be found on page 35.
Employee Involvement and Communication: Unilever’s UK companies maintain formal processes to inform, consult and involve
employees and their representatives. A National Consultative Forum comprising employees and management representatives from key locations meets regularly to provide a forum for discussing issues relating to Unilever sites in the United Kingdom. We
recognise collective bargaining on a number of sites and engage with employees via the Sourcing Unit Forum, which includes national officer representation from the three recognised trade unions. A European Works Council, embracing employee and
management representatives from countries within Europe, has been in existence for several years and provides a forum for discussing issues that extend across national boundaries.
Equal Opportunities and Diversity: Consistent with our Code of Business Principles, Unilever aims to ensure that applications for employment from everyone are given full
and fair consideration and that everyone is given access to training, development and career opportunities. Every effort is made to retrain and support employees who become disabled while working within the Group.
Both NV and
PLC are listed on the New York Stock Exchange (NYSE). As such, both companies must comply with the requirements of US legislation, regulations enacted under US securities laws and the Listing Standards of the NYSE, that are applicable to foreign
private issuers, copies of which are available on their websites.
We are substantially compliant with the Listing Standards of the NYSE applicable to foreign private
issuers except as set out below.
We are required to disclose any significant ways in which our corporate governance practices differ from those typically followed by
US companies listed on the NYSE. Our corporate governance practices are primarily based on the requirements of the UK Listing Rules, the UK Code and the Dutch Code but substantially conform to those required of US companies listed on the NYSE. The
only significant way in which our corporate governance practices differ from those followed by domestic companies under Section 303A Corporate Governance Standards of the NYSE is that the NYSE rules require that shareholders must be given the
opportunity to vote on all equity-compensation plans and material revisions thereto, with certain limited exemptions. The UK Listing Rules require shareholder approval of equity-compensation plans only if new or treasury shares are issued for the
purpose of satisfying obligations under the plan or if the plan is a long-term incentive plan in which a director may participate. Amendments to plans approved by shareholders generally only require approval if they are to the advantage of the plan
participants. Furthermore, Dutch law and NV’s Articles of Association require shareholder approval of equity-compensation plans only if the Executive Directors are able to participate in such plans. Under Dutch law, shareholder approval is not
required for material revisions to equity-compensation plans unless the Executive Directors participate in a plan and the plan does not contain its own procedure for revisions.
Attention is drawn to the Report of the Audit Committee on pages 43 to 45. In addition, further details about our corporate governance are provided in the document
entitled ‘The Governance of Unilever’ which can be found on our website.
www.nyse.com/index
www.sec.gov
All senior executives and senior financial officers have declared their understanding of and compliance with
Unilever’s Code of Business Principles and the related Code Policies. No waiver from any provision of the Code of Business Principles or Code Policies was granted in 2018 to any of the persons falling within the scope of the SEC requirements.
The Code of Business Principles and related Code Policies are published on our website.
Risk Management and Control: Following a review by the Disclosure Committee,
Audit Committee and Boards, the CEO and the CFO concluded that the design and operation of the Unilever Group’s disclosure controls and procedures, including those defined in the United States Securities Exchange Act of 1934 – Rule 13a
– 15(e), as at 31 December 2018 were effective.
Unilever is required by Section 404 of the US Sarbanes-Oxley Act of 2002 to report on the
effectiveness of its internal control over financial reporting. This requirement is reported on within the section entitled ‘Management’s Report on Internal Control over Financial Reporting’ on page 156.
In February 2017, the Group received a public potential offer by The Kraft Heinz Company for $50 per share in respect of all of NV and PLC shares. Unilever rejected the
proposal.
This table shows the membership of the Committee together with their attendance at meetings during 2018. If Directors are unable to attend a meeting, they have the
opportunity beforehand to discuss any agenda items with the Committee Chair. Attendance is expressed as the number of meetings attended out of the number eligible to be attended.
HIGHLIGHTS OF 2018
• Annual Report and Accounts
• Tax regulations, provisions and disclosure
• Information security, including Cyber, and IT resilience
• Supply Chain flexibility and continuity of supply
• Accounting for significant Mergers and Acquisitions
• Acquisition Review
• Spreads Disposal
• IFRS 15 ‘Revenue from Contracts with Customers’ and IFRS 16 ‘Leases’
PRIORITIES FOR 2019
• Tax regulations, provisions and disclosure
• Information Security, including Cyber, and IT resilience
• IFRS 16 ‘Leases’
• Accounting for significant Mergers and Acquisitions
MEMBERSHIP OF THE COMMITTEE
The Audit Committee
is comprised only of independent Non-Executive Directors with a minimum requirement of three such members. It is chaired by John Rishton and the other members are Nils Andersen and Judith Hartmann. For the
purposes of the US Sarbanes-Oxley Act of 2002 John Rishton is the Audit Committee’s financial expert. The Boards have satisfied themselves that the current members of the Audit Committee are competent in financial matters and have recent and
relevant experience. Other attendees at Committee meetings (or part thereof) were the Chief Financial Officer, Chief Auditor, EVP Financial Control, Risk Management, Pensions & Sustainability, Chief Legal Officer and Group Secretary and the
external auditors. Throughout the year the Committee members periodically met without others present and also held separate private sessions with the Chief Financial Officer, Chief Auditor and the external auditors, allowing the Committee to discuss
any issues in more detail.
ROLE OF THE COMMITTEE
The role
and responsibilities of the Audit Committee are set out in written terms of reference which are reviewed annually by the Committee, taking into account relevant legislation and recommended good practice. The terms of reference are contained within
‘The Governance of Unilever’ which is available on our website at www.unilever.com/corporategovernance. The Committee’s responsibilities include,
but are not limited to, the following matters, and relevant issues are brought to the attention of the Boards:
•
oversight of the integrity of Unilever’s financial statements;
•
review of Unilever’s quarterly and annual financial statements (including clarity and completeness of disclosure) and approval of the quarterly trading statements for quarter 1 and quarter 3;
•
oversight of risk management and internal control arrangements;
•
oversight of compliance with legal and regulatory requirements;
•
oversight of the external auditors’ performance, objectivity, qualifications and independence; the approval process of non-audit services; recommendation to the Boards of the
nomination of the external auditors for shareholder approval; and approval of their fees, refer to note 25 on page 126;
•
the performance of the internal audit function; and
•
approval of the Unilever Leadership Executive (ULE) expense policy and the review of Executive Director expenses.
In
order to help the Committee meet its oversight responsibilities, each year management organise knowledge sessions for the Committee on subject areas within its remit. In 2018, a session was held with Unilever Management on the acquisition of the
Dollar Shave Club, which included a briefing on the acquisition case, recent performance, and key learnings that might be relevant for future acquisitions. In addition, John Rishton visited the Indian MCO in Mumbai, where the developments of routes
to market, controls automation and centralisation were reviewed and discussed in detail. Mr Rishton also visited the Indian finance and IT hub in Bangalore where progress being made on monitoring systems of potential cyber threat and access controls
were reviewed.
HOW THE COMMITTEE HAS DISCHARGED ITS RESPONSIBILITIES
During the year, the Committee’s principal activities were as follows:
FINANCIAL STATEMENTS
The Committee reviewed prior to publication the quarterly
financial press releases together with the associated internal quarterly reports from the Chief Financial Officer and the Disclosure Committee and, with respect to the half-year and full-year results, the external auditors’ reports. It also
reviewed this Annual Report and Accounts and the Annual Report on Form 20-F 2018. These reviews incorporated the accounting policies and significant judgements and estimates underpinning the financial
statements as disclosed within note 1 on pages 79 to 82. Particular attention was paid to the following significant issues in relation to the financial statements:
•
revenue recognition – estimation of discounts, incentives on sales made during the year, refer to note 2 on pages 82 to 84;
•
direct tax provisions, refer to note 6 on pages 94 to 96; and
•
indirect tax provisions and contingent liabilities, refer to note 19 on page 120.
The external auditors have agreed the list of significant issues discussed by the Audit Committee. In addition to these
risks KPMG, as required by auditing standards, also consider the risk of management override of controls. Nothing has come to either our attention or the attention of KPMG to suggest any material suspected or actual fraud relating to management
override of controls.
For each of the above areas the Committee considered the key facts and judgements outlined by management. Members of management attended the
section of the meeting of the Committee where their item was discussed to answer any questions or challenges posed by the Committee. The issues were also discussed with the external auditors and further information can be found on pages 67 to 74.
The Committee was satisfied that there are relevant accounting policies in place in relation to these significant issues and management have correctly applied these policies.
At the request of the Boards the Committee undertook to:
•
review the appropriateness of adopting the going concern basis of accounting in preparing the annual financial statements; and
•
assess whether the business was viable in accordance with the requirement of the UK Corporate Governance Code. The assessment included a review of the principal risks facing Unilever, their potential impact, how they
were being managed, together with a discussion as to the appropriate period for the assessment. The Committee recommended to the Boards that there is a reasonable expectation that the Group will be able to continue in operation and meet its
liabilities as they fall due over the three-year period (consistent with the period of the strategic plan) of the assessment.
At the request of the
Boards the Committee also considered whether the Unilever Annual Report and Accounts 2018 was fair, balanced and understandable and whether it provided the necessary information for shareholders to assess the Group’s position and performance,
business model and strategy. The Committee was satisfied that, taken as a whole, the Unilever Annual Report and Accounts 2018 is fair, balanced and understandable.
RISK MANAGEMENT AND INTERNAL CONTROL ARRANGEMENTS
The Committee reviewed
Unilever’s overall approach to risk management and control, and its processes, outcomes and disclosure. It reviewed:
•
the Controller’s Quarterly Risk and Control Status Report, including Code of Business Principles cases relating to frauds and financial crimes and significant issues received through the Unilever Code Support Line;
•
the 2018 corporate risks for which the Audit Committee had oversight and the proposed 2019 corporate risks identified by the ULE;
•
management’s improvements to reporting and internal financial control arrangements, through further automation and centralisation;
•
processes related to information security, including cyber security;
•
tax planning, and related risk management;
•
treasury policies, including debt issuance and hedging; and
•
litigation and regulatory investigations.
The Committee reviewed the application of the requirements under
Section 404 of the US Sarbanes-Oxley Act of 2002 with respect to internal controls over financial reporting. In addition, the Committee reviewed the annual financial plan and Unilever’s dividend policy and dividend proposals.
During 2018 the Committee continued its oversight of the independent assurance work that is performed on a number of our USLP metrics (selected on the basis of their
materiality to the USLP).
In fulfilling its oversight responsibilities in relation to risk management, internal control and the financial statements, the Committee
met regularly with senior members of management and is satisfied with the key judgements taken.
INTERNAL AUDIT FUNCTION
The
Committee reviewed Corporate Audit’s audit plan for the year and agreed its budget and resource requirements. It reviewed interim and year-end summary reports and management’s response. The Committee
engaged an independent third party to perform an effectiveness review of the function. The review concluded that the function is compliant with the IIA (Chartered Institute of Internal Auditors) Standards in all material aspects. The Committee also
carried out an evaluation of the performance of the internal audit function and was satisfied with the effectiveness of the function. The Committee met independently with the Chief Auditor during the year and discussed the results of the audits
performed during the year.
AUDIT OF THE ANNUAL ACCOUNTS
KPMG,
Unilever’s external auditors and independent registered public accounting firm, reported in depth to the Committee on the scope and outcome of the annual audit, including their audit of internal controls over financial reporting as required by
Section 404 of the US Sarbanes-Oxley Act of 2002. Their reports included audit and accounting matters, governance and control, and accounting developments.
The
Committee held independent meetings with the external auditors during the year and reviewed, agreed, discussed and challenged their audit plan, including their assessment of the financial reporting risk profile of the Group. The Committee discussed
the views and conclusions of KPMG regarding management’s treatment of significant transactions and areas of judgement during the year. The Committee considered these views and comments and is satisfied with the treatment in the financial
statements.
EXTERNAL AUDITORS
KPMG have been the Group’s auditors
since 2014 and shareholders approved their re-appointment as the Group’s external auditors at the 2018 AGMs. On the recommendation of the Committee, the Directors will be proposing the re-appointment of KPMG at the AGMs in May 2019.
Both Unilever and KPMG have safeguards in place to avoid the possibility that the
external auditors’ objectivity and independence could be compromised, such as audit partner rotation and the restriction on non-audit services that the external auditors can perform as described below.
Both the KPMG partners with overall responsibility for the audit of NV and PLC will rotate off the assignment after completion of the 2018 year-end financial statements. One of the new partners already has
experience of the Unilever global audit, and the other partner underwent an induction programme through much of this year-end to ensure a smooth transition. KPMG has issued a formal letter to the Committee
outlining the general procedures to safeguard independence and objectivity, disclosing the relationship with the Company and confirming their audit independence.
Each year, the Committee assesses the effectiveness of the external audit process which includes discussing feedback from the members of the Committee and stakeholders at
all levels across Unilever. Interviews are also held with key senior management within both Unilever and KPMG.
The Committee also reviewed the statutory audit, audit
related and non-audit related services provided by KPMG and compliance with Unilever’s documented approach, which prescribes in detail the types of engagements, listed below, for which the external
auditors can be used:
•
statutory audit services, including audit of subsidiaries;
•
audit related engagements – services that involve attestation, assurance or certification of factual information that may be required by external parties;
•
non-audit related services – work that our external auditors are best placed to undertake, which may include:
Unilever has for many years maintained a policy which prescribes in detail the types of engagements for which the external
auditors can be used and prohibits several types of engagements, including:
•
bookkeeping or similar services;
•
design and/or implementation of systems or processes related to financial information or risk management;
•
valuation, actuarial and legal services;
•
internal audit;
•
broker, dealer, investment adviser or investment bank services;
•
transfer pricing advisory services
•
staff secondments of any kind;
•
Payroll tax;
•
Customs duties; and
•
Tax services (except in exceptional and rare circumstances such as where they are the only firm able to provide the service).
All audit related engagements over €250,000 and non-audit related
engagements over €100,000 required specific advance approval by the Audit Committee Chairman. The Committee further approved all engagements below these levels which have been authorised by the
EVP Financial Control, Risk Management, Pension & Sustainability. These authorities are reviewed regularly and, where necessary, updated in the light of internal developments, external developments and best practice. Since the appointment
of KPMG in 2014 to 2016 the level of non-audit fees has been below 7% of the annual audit fee. In 2017 and 2018 the level of non-audit fees has been higher at 41% and
31% respectively due to assurance work relating to the disposal of our Spreads business and the Simplification project.
The Committee confirms that the Group is in
compliance with The Statutory Audit Services for Large Companies Market Investigation (Mandatory use of Competitive Tender Processes and Audit Committee Responsibilities) Order 2014. The last tender for the audit of the annual accounts was performed
in 2013.
EVALUATION OF THE AUDIT COMMITTEE
As part of the internal Board
evaluation carried out in 2018, the Boards evaluated the performance of the Committee. The Committee also carried out an assessment of its own performance in 2018. While overall the Committee members concluded that the Committee is performing
effectively, the Committee agreed that to further enhance its effectiveness it needed to ensure the Committee members continued to develop their knowledge of the Group’s operations which would involve further knowledge sessions and site visits.
This table shows the membership of the Committee together with their attendance at meetings during 2018. If Directors are unable to attend a meeting, they have the
opportunity beforehand to discuss any agenda items with the Committee Chair. Attendance is expressed as the number of meetings attended out of the number eligible to be attended.
HIGHLIGHTS OF 2018
• Competition and anti-bribery compliance
• Third-party compliance
• Product quality and safety
• Unilever Sustainable Living Plan (USLP)
PRIORITIES FOR 2019
• Compliance with Unilever policies on fair competition and anti-bribery and requirements for third parties
• Product quality and safety
• Unilever Sustainable Living Plan (USLP) including plastic packaging
ROLE OF THE COMMITTEE
The Corporate
Responsibility Committee oversees Unilever’s conduct as a responsible global business. As the Unilever Sustainable Living Plan (USLP) is at the heart of Unilever’s vision to grow its business whilst decoupling its environmental footprint
from its growth and increasing its positive social impact, the Committee tracks the progress and potential risks associated with the USLP.
The Committee is also
charged with ensuring that Unilever’s reputation is protected and enhanced. Therefore a central element of its role is the need to identify any external developments that are likely to have an influence upon Unilever’s standing in society,
and to ensure that appropriate and effective communications policies are in place to support the company’s reputation.
The Committee’s discussions are
informed by the experience of the senior leaders invited to the Committee to share their views on a variety of topics and external trends. Many of these leaders are members of the Unilever Sustainable Living Plan Steering Team, the group of senior
executives accountable for driving sustainable growth through Unilever’s brands and operations. These discussions ensure the Committee stays abreast of current and emerging trends and any potential risks arising from sustainability issues. This
enables the Boards to draw on a well-rounded view of issues.
During 2018 the Committee reviewed its terms of reference and approved minor changes to the terms.
The Committee’s responsibilities are complemented by those of the Audit Committee, which is responsible for reviewing significant breaches of the Code of Business
Principles as part of its remit to review risk management and for overseeing the independent assurance programme for the USLP.
The Committee’s terms of
reference are set out www.unilever.com/ corporategovernance and details of the USLP Steering Team at www.unilever.com/sustainable-living/our-strategy/our-sustainability-governance/
MEMBERS OF THE COMMITTEE
The Corporate Responsibility Committee comprises
three Non-Executive Directors: Strive Masiyiwa (Chair), Feike Sijbesma and Youngme Moon. The Chief Marketing & Communications Officer and the Chief Sustainability Officer attend the Committee’s
meetings. The Chief Business Integrity Officer also attends to present Unilever’s company report that covers cases under Unilever’s Code of Business Principles (the Code) as well as updates on third-party compliance, product quality and
safety.
MEETINGS
Meetings are held
quarterly and ad hoc as required – four were held in 2018. The Committee Chairman is responsible for reporting the findings from meeting to the Boards, thus ensuring that the Boards can fulfil their oversight responsibilities.
Following the Committee’s terms of reference and Unilever’s principal risks and priorities, the Committee’s agenda covers the Code and third-party
compliance, alongside litigation, occupational and product safety, the USLP and corporate reputation as well as a range of strategic and current issues. In addition to the areas listed below, in 2018 the Committee also reviewed topics such as media
communications, the process for integrating business acquisitions and progress on alternatives to animal testing.
CODE OF BUSINESS PRINCIPLES
The Code and associated Code Policies set out the standards of conduct expected of all Unilever employees in their business endeavours. Compliance with these is an
essential element in ensuring Unilever’s continued business success and is identified as an ethical and legal and regulatory risk to Unilever.
While the Chief
Executive Officer is responsible for implementing these principles, supported by the Global Code and Policy Committee, the Corporate Responsibility Committee is responsible for oversight of the Code and Code Policies, ensuring that they remain fit
for purpose and are appropriately applied. It maintains close scrutiny of the mechanisms for implementing the Code and Code Policies. This is vital as compliance is essential to promote and protect Unilever’s values and standards, and hence the
good reputation of the Group. At each meeting the Committee reviews an analysis of investigations into non-compliance with the Code and Code Policies and is alerted to any trends arising from these
investigations.
The Chief Legal Officer and Group Secretary reports to the Committee on litigation and regulatory matters which may have a reputational impact
including environmental issues, bribery and corruption compliance and competition law compliance. The Committee studied how compliance was achieved during 2018. For further information please see notes 19 and 20 to the consolidated financial
statements.
As another of its other priorities in 2018, the Committee also scrutinised the mechanisms for anti-bribery compliance. The primary mechanism is to
understand the profiles of the markets Unilever operates in and to ensure that there are robust internal and third-party compliance programmes in place. These are complemented by training for all employees in tandem with advanced capacity building
for those in the Business Integrity and Legal functions.
PRINCIPLES AND STANDARDS FOR THIRD PARTIES
The Committee retained its focus on third-party compliance in 2018. Extending Unilever’s values to third parties remains a priority, not only to generate continued
responsible growth and a positive social impact on the industry, but to counter the significant risk that non-compliance by third parties can pose, particularly in the context of increasing regulation around
the world.
The Committee tracks compliance with Unilever’s Responsible Sourcing Policy (RSP) for suppliers and its Responsible Business Partner Policy (RBPP)
for customers and distributors. Together they set out Unilever’s requirements that third parties conduct business with integrity, openness and respect for universal human rights and core labour principles. Sourcing 100% of Unilever’s
procurement spend in line with the RSP is also a target within the USLP.
The policies enable Unilever to evaluate risk and provide the right measures to address the
diversity of market conditions in which it operates and the range of third parties it works with. The Committee was briefed on progress. For the RSP, this detailed the number of suppliers making a positive commitment to the policy, greater alignment
on industry standards via the process of mutual recognition and a substantial increase in site audits and resulting corrective action plans. Enhanced anti-bribery and corruption screening was also put in place. The training and enhancements
developed for the RBPP include new IT tools launched in over 180 countries, simpler assessment processes, enhanced due diligence and risk mitigation plans.
Sustainable growth is
only achieved if Unilever also grows responsibly – by providing safe, high quality products, and protecting employees and the people and communities in which it operates. Safe and high quality products are one of Unilever’s principal
risks, see page 31.
Occupational safety continues to be the personal and everyday responsibility of all those working at Unilever. Reducing Unilever’s Total
Recordable Frequency Rate (TRFR) is also a target within the USLP. In 2018 TRFR continued to decrease – from 0.89 accidents per 1 million hours worked in 2017 to 0.69 in 2018 (measured 1 October 2017 to 30 September 2018).
In factories, Unilever’s World Class Manufacturing programme hardwires safety into all aspects of the production process – by enabling good design
principles, engineering and operating practices to be applied from the start of any project. This focus drove a reduction of 39.5% in process safety incidents in 2018. Capacity building and leadership also improved safety for contractors (those who
work on Unilever sites under the direct supervision of their own management), reducing their recordable injuries by half 51% over 2014-2018 (measured by Lost-Time Injuries Frequency Rate, LTIFR).
Unilever’s approach to product safety is based on risk identification and mitigation. This approach covers all aspects of the value chain – from development,
sourcing, manufacture and transport to consumer use and disposal of the product – and is centred on the application of rigorous standards based on sound science and the principle of Safe by Design and Safe in Execution. Thanks to a strong focus
on product quality, a significant improvement was achieved in 2018 with potentially serious marketplace incidents reduced by 40%. Over 2017-2018, potentially serious marketplace incidents originating in manufacturing have been reduced by 88% and
those originating in suppliers of raw and packing materials have been halved.
HUMAN RIGHTS
By addressing strategic human rights issues and helping the business tackle and prevent endemic abuses in global value chains, Unilever is seeking to deliver a positive
social impact alongside business growth.
Unilever’s human rights aims are part of the Enhancing Livelihoods goal of the USLP and human rights are included
within the company’s sustainability and ethical risks. See pages 29 and 33.
In 2018 Unilever continued to embed human rights with a focus on its eight salient
issues (ie those at risk of the most severe negative impact through Unilever’s activities or business relationships). These are set out in Unilever’s Human Rights Report 2017, with an update on further progress at the end of 2018. The
Committee noted that Unilever’s approach to this work is sophisticated and that while there is still much to do, it is making good progress in this complex field. See page 14 for more.
PALM OIL
Palm oil is one of Unilever’s most significant raw materials and
Unilever is one of the world’s major buyers of palm oil. Alongside sustainability and supply chain, Unilever has identified climate change as one of its principal risks (see page [29]) and is committed to eliminating the deforestation
associated with unsustainable palm oil production. Securing supplies of sustainable palm oil is therefore a critical element in Unilever’s business and climate strategy and represents a significant target in the USLP.
The Committee was briefed on plans for driving transformational change in the palm oil sector. Unilever’s Sustainable Palm Oil Sourcing Policy has a focus on the
implementation of No Deforestation, No Peat, No Exploitation of people or communities (NDPE) commitments by 2020. However, implementation and enforcement remain challenging. To support the transformation of the sector and the implementation of its
Policy, Unilever is investing in multiple initiatives. One example is the &Green Fund which is designed to kick-start investments in deforestation-free agriculture in countries that are working to reduce deforestation and peat degradation.
Unilever was announced as the first investor. The Fund aims to protect over 5 million hectares of forest and peatlands by 2020, by de-risking private capital investments into large-scale
deforestation-free production, protection and inclusion initiatives. With an aim to trigger $1.6 billion in private capital investments, the Fund is an opportunity to jointly shape solutions to mitigate deforestation and a good illustration of
the collaborative, transformational approaches the company is seeking to scale.
To promote transparency and traceability of palm oil sourcing, in 2018 Unilever was also the first consumer goods company
to publish the names of its suppliers and a map of the 1,400 palm oil mills in its extended supply chain on its website. This was accompanied by a more visible grievance mechanism to facilitate the reporting of issues of non-compliance in the supply chain.
Another important step was an industry-first partnership with Indonesian government-owned palm
oil plantation company PT Perkebunan Nusantara (PTPN). The partnership is designed to support local mills and smallholder farmers to produce palm oil according to the NDPE standards that are key to multi-sector efforts to transform the palm oil
industry.
PACKAGING WASTE
Packaging waste, particularly post-consumer
plastic packaging waste in oceans and waterways, has never been higher on the global agenda than in 2018. Plastic packaging now sits alongside climate change as a major environmental challenge and is identified as a risk for Unilever’s
business, see page 30.
Unilever has reduced the waste associated with the disposal of its products by 31% since 2010 (measured as impact per consumer use, towards a
target of 50%) and is making strong progress in its own operations and product design. However, the challenge for post-consumer waste is in having the right infrastructure in place to ensure materials are collected and processed, while encouraging
consumers to segregate and recycle them.
To support its specific, time-bound targets, at the beginning of 2018 Unilever introduced a new three-part framework
designed to sharpen thinking on plastic packaging and innovation: i) Less Plastic means using lighter, stronger and better materials which have a lower environmental impact; ii) Better Plastic entails eliminating problematic materials and using
recyclable plastics with a minimum 25% recycled content; iii) No Plastic involves using alternative materials, new packaging formats and alternative models of consumption such as vending – to help reduce use of
single-use plastics through innovation, behaviour change and new business models. See page 15 for more.
MCIP
Unilever’s Reward Framework includes the Management Co-investment Plan (MCIP), a long-term incentive plan that is linked to
financial and USLP performance (see page 53). Corporate Responsibility Committee members shared their views on the context and progress of the USLP and sustainability initiatives with the Compensation Committee to help inform its recommendation on
MCIP.
EVALUATION OF THE CORPORATE RESPONSIBILITY COMMITTEE
As part of the
internal board evaluation carried out in 2018, the Boards evaluated the performance of the Committee. The Committee also carried out an assessment of its own performance in 2018. While overall the Committee members concluded that the Committee is
performing effectively, the Committee has agreed to further enhance its effectiveness by keeping close track on progress on the ambitious Unilever Sustainable Living Plan. This will ensure the Group maintains its sustainability momentum and
leadership.
Strive Masiyiwa
Chair of the Corporate Responsibility
Committee
Youngme Moon
Feike Sijbesma
Further details on the USLP will be set out in Unilever’s online Sustainable Living Report 2018, to be published in April 2019.
COMMITTEE MEMBERS, MEMBERSHIP STATUS AND ATTENDANCE
ATTENDANCE
Marijn Dekkers Chair
5/5
Laura Cha
5/5
Feike Sijbesma (Chair
until May 2018)
5/5
This table shows the membership of the Committee together with their attendance at meetings during 2018. If Directors are unable to attend a meeting, they have the
opportunity beforehand to discuss any agenda items with the Committee Chair. Attendance is expressed as the number of meetings attended out of the number eligible to be attended.
HIGHLIGHTS OF 2018
• Continued focus on development of a strong pipeline of potential
Non-Executive and Executive Director candidates and managing succession
• CEO succession
• Follow up on actions agreed from the 2017 external Board evaluation
• Continued focus on Board Diversity
PRIORITIES FOR 2019
• Continued focus on development of a strong pipeline of potential
Non-Executive and Executive Director candidates and managing succession, with focus on Board Diversity
• Follow up on actions agreed from the 2018 external Board evaluation
• Continued focus on Corporate Governance
ROLE AND MEMBERSHIP OF THE COMMITTEE
The
Nominating and Corporate Governance Committee is responsible for evaluating the balance of skills, experience, independence, diversity and knowledge on the Boards and for drawing up selection criteria, ongoing succession planning and appointment
procedures for both internal and external appointments. It also has oversight of all matters relating to corporate governance and brings any issues in this respect to the attention of the Boards.
The Committee’s terms of reference are set out in ‘The Governance of Unilever’ which can be found on our website at www.unilever.com/corporategovernance. During the year, the Committee reviewed its own terms of reference to determine whether its responsibilities are properly
described. The amended terms became effective on 1 January 2019.
The Committee is comprised of two Non-Executive
Directors and the Chairman. The Group Secretary acts as secretary to the Committee. Other attendees at Committee meetings in 2018 (or part thereof) were the Chief Executive Officer and the Chief HR Officer.
In 2018 the Committee met five times. At the start of the year the Committee considered the results of the Committee’s annual self-evaluation for 2017 and its
priorities for the year and used these to help create an annual plan for meetings for 2018.
APPOINTMENT AND REAPPOINTMENT OF DIRECTORS AND ULE
Reappointment: All Directors (unless they are retiring) are nominated by the Boards for re-election at the AGMs each year
on the recommendation of the Committee who, in deciding whether to nominate a Director, take into consideration the outcomes of the Chairman’s discussions with each Director on individual performance, the evaluation of the Boards and its
Committees and the continued good performance of individual Directors. Non-Executive Directors normally serve for a period of up to nine years. The average tenure of the
Non-Executive Directors who have retired from the Boards over the past ten years has been seven years. The schedule the Committee uses for orderly succession planning of
Non-Executive Directors can be found on our website at unilever.com/committees. Ann Fudge did not put herself forward for re-election at the AGMs in May 2018. She had
served nine years on the Boards. The Committee proposed the reappointment of all other Directors and the Directors were appointed by shareholders by a simple majority vote at the AGMs.
The Committee also recommends to the Boards candidates for election as Chairman and Senior Independent Director/Vice-Chairman. After being reappointed as Non-Executive Directors at the 2018 AGMs, Youngme Moon became the Senior Independent Director/Vice-Chairman and John Rishton and Strive Masiyiwa remained Chairs of the Audit Committee and the Corporate
Responsibility Committee respectively. Vittorio Colao became Chair of the Compensation Committee and Marijn Dekkers became Chair of the Nominating and Corporate Governance Committee.
Succession Planning and Appointment: In consultation with the Committee, the Boards review the adequacy of succession planning processes and the actual succession
planning at Board level.
When recruiting, the Committee will take into account the profile of Unilever’s Boards of Directors set out in ‘The Governance of
Unilever’ which is in line with the recommendations of applicable governance regulations and best practice. Pursuant to the profile the Boards should comprise a majority of Non-Executive Directors who are
independent of Unilever, free from any conflicts of interest and able to allocate sufficient time to carry out their responsibilities effectively. With respect to composition and capabilities, the Boards should be in keeping with the size of
Unilever, its strategy, portfolio, consumer base, culture, geographical spread and its status as a listed company and have sufficient understanding of the markets and business where Unilever is active in order to understand the key trends and
developments relevant for Unilever. The objective pursued by the Boards is to have a variety of nationality, race, gender, ethnicity and relevant skills and expertise. It is important that the Boards have sufficient global experience and outlook,
and financial literacy. As discussed later in this Report, Unilever currently has diverse Boards in terms of gender and nationality and, as can be seen from the subset ofthe mapping that this Committee has done of the current Non-Executive Directors’ skills and capabilities on page 3, composition and capabilities in line with our Board profile described above.
2018 appointments: The Committee recommended to the Boards to nominate Andrea Jung as a new Non-Executive Director at the
2018 AGMs taking into account the views of Egon Zehnder. In May 2018 the AGMs resolved to appoint Andrea Jung with immediate effect. She has further strengthened the Boards in the areas of consumer/FMCG insights, sales & marketing and
leadership of global entities.
Upon Paul Polman’s notice of retirement as CEO and Executive Director effective 31 December 2018, the Committee recommended
to appoint Alan Jope as his successor. In forming its recommendation, the Committee had reviewed the selection criteria which had been developed as part of succession planning and the extensive slate of potential candidates and their respective
capabilities by reference to those criteria. Considering Alan Jope’s skills set, depth of understanding and experience of Unilever and the sector and markets in which the Group operates, as well as his track record of delivering high quality
performance, the Committee recommended that Alan Jope be nominated by the Boards as the new CEO effective 1 January 2019, which appointment was approved by the Board of Directors in November 2018. Alan Jope will be proposed to be appointed as
Executive Director at the AGMs in May 2019.
Unilever Leadership Executive (ULE) Succession Planning and Appointment: In consultation with the Committee, the
Boards review the adequacy of succession planning processes and the actual succession planning at ULE level. In 2018 the Boards were consulted by the Chief Executive Officer upon the selection criteria and appointment procedures for senior
management changes.
DIVERSITY POLICY
Unilever has long understood the
importance of diversity within our workforce because of the wide range of consumers we connect with globally. This goes right through our organisation, starting with the Boards. Unilever’s Board Diversity Policy, which is reviewed by the
Committee each year, is reflected on our website at www.unilever.com/boardsofunilever. The Boards feel that, while gender and ethnicity are an important part of
diversity, Unilever Directors will continue to be selected on the basis of their wide-ranging experience, backgrounds, skills, knowledge and insight.
In 2018
the Committee also reviewed and considered relevant recommendations on diversity and remains pleased that 45% of our Non-Executive Directors are women and that there are nine nationalities represented on the
Boards.
CORPORATE GOVERNANCE DEVELOPMENTS
The Committee reviews relevant
proposed legislation and changes to relevant corporate governance codes at least twice a year. It carefully considers whether and how the proposed laws/rules would impact upon Unilever and whether Unilever should participate in consultations on the
proposed changes. For example, during 2018, developments of the Dutch and the UK Corporate Governance Codes, the EU Shareholders Rights Directive and Boardroom diversity were discussed by the Committee.
EVALUATION
As part of the Board evaluation carried out in 2018, the Boards
evaluated the performance of the Committee. The Committee also carried out an assessment of its own composition and performance in 2018. The Committee members concluded that the Committee is performing effectively.
This table shows the membership of the Committee together with their attendance at meetings during 2018. If Directors are unable to attend a meeting, they have the
opportunity beforehand to discuss any agenda items with the Committee Chair. Attendance is expressed as the number of meetings attended out of the number eligible to be attended.
LETTER FROM THE CHAIR
DEAR SHAREHOLDERS,
As the new Compensation Committee Chair, I am pleased to present Unilever’s Directors’ Remuneration Report (DRR) 2018. In the sections below, I set out the
Committee’s activities in 2018, including remuneration outcomes for 2018 and describe our Executive Director changes. I also reflect on the feedback we received on our new Remuneration Policy which was approved at the 2018 AGMs and detail our
remuneration decisions for 2019.
BUSINESS PERFORMANCE AND REMUNERATION OUTCOMES FOR 2018
ANNUAL BONUS
In determining the Underlying Sales
Growth (USG) target for the annual bonus plan we assumed a full year of Argentinian price growth. Due to the application of IAS 29 hyperinflationary accounting from 1 July and the consequent removal of Argentinian pricing in our reported USG of
2.9%, we have included the Argentinian pricing to give a sales growth of 3.4% for the bonus calculation. Underlying Operating Margin (UOM) improved by 90bps to 18.4% driven by 50bps gross margin improvement and 30 bps of overheads reduction
reflecting both the impact of our innovations and ongoing savings programmes. In 2018 we delivered over €2 billion of savings. In determining the Free Cash Flow (FCF) target for the annual
bonus plan we assumed that Unilever would retain the working capital balances related to the Spreads business at closing. However as part of the deal we received payment for the working capital, thus the reported FCF of €5.0 billion was adjusted to €5.6 billion for the bonus calculation to both include the cash tax on disposals (€0.2 billion) per the definition and cash received (€0.4 billion) in respect of the transfer of working capital to KKR at closing.
These results are solid, demonstrating Unilever’s ability to continue to grow profitably and keep generating value in challenging market conditions. Performance
against 2018 targets resulted in an outcome for the 2018 annual bonus of 76% of target. Accordingly, having assessed the quality of results and satisfied itself that this outcome reflected the underlying performance of the business in 2018, the
Committee confirmed a bonus of 76% of target opportunity (114% of Fixed Pay against a target of 150%) for the former CEO, Paul Polman, and of 76% of target opportunity (91% of Fixed Pay against a target of 120%) for the CFO, Graeme Pitkethly, as
detailed on page 55.
GLOBAL SHARE INCENTIVE PLAN (GSIP) AND MANAGEMENT CO-INVESTMENT PLAN (MCIP)
Unilever has delivered consistent top and bottom line growth with USG at an average of 3.4% over the past three years, and margin improvement at an
average of +83 basis points. Unilever also generated strong cumulative operating cash flow of €19.1 billion and finished 5th out of 19 in our peer group for total shareholder return (TSR).
This performance against 2016-2018 targets resulted in an outcome for GSIP and MCIP of 132%. Having confirmed that this outcome reflected the underlying performance of the business over
HIGHLIGHTS OF 2018
• Review and adaptation of Unilever’s new Reward Framework for our Executive Directors, with an emphasis
on alignment with strategy and long-term value creation, personal investment in Unilever shares, and simplified variable pay with safeguards to prevent high levels of pay not justified by performance.
• Constructive engagement with
shareholders and shareholder representative bodies during the year both before and after the implementation of this new Reward Framework for our Executive Directors.
• Executive Director changes, with the announcement of Paul Polman’s retirement and his replacement by
Alan Jope as CEO.
the plan duration, the Committee confirmed a vesting ratio of 132%
(corresponding to 66% of maximum for GSIP and 88% of maximum for MCIP, which is capped at 150% for the Executive Directors), as detailed on page 56.
The Committee
did not apply any discretionary adjustments to annual bonus or GSIP/MCIP outcomes.
EXECUTIVE DIRECTOR CHANGES
Paul Polman stepped down from the role of CEO and Executive Director on 31 December 2018 and will retire from employment on 2 July 2019. He will continue to be
paid in line with our Remuneration Policy during this period. Paul was awarded a bonus for 2018, and his GSIP and MCIP 2016-2018 awards vested on 11 February 2019, as set out below. His other inflight long-term incentive awards will vest on
their normal timeframe based on Unilever’s performance and will be pro-rated to his retirement date. No new incentive awards (neither bonus nor MCIP) will be made to Paul Polman. Further details are set
out on page 60.
Alan Jope has been appointed CEO effective 1 January 2019 and will be proposed for election as Executive Director to the Boards at the AGMs in
May 2019. Alan Jope’s Fixed Pay for his role as CEO has been set at €1,450,000, with annual bonus and MCIP opportunity in line with our Remuneration Policy. Further details of Alan
Jope’s remuneration package are set out on page 52.
UNILEVER’S REMUNERATION POLICY
Unilever’s Remuneration Policy is based on simplicity and transparency with just three elements: Fixed Pay, annual bonus and the MCIP through which executives must
invest their bonus (after having paid tax) in Unilever shares to receive match shares that may vest based on Unilever’s performance over the following four years.
The Policy was approved at our May 2018 AGMs with a significant minority voting against. Through the year we undertook extensive consultation with our shareholders and
their representative bodies to ensure we fully understood the concerns that some investors had with our Policy.
I was very encouraged that most shareholders
appreciated the direction our Remuneration Policy is taking in terms of simplification, increased share ownership commitment and lengthened timeframes for performance measurement. However, the extent of the changes we made over the previous two
years clearly led to an impression of complexity, which we underestimated.
The Committee carefully considered all of the feedback received, both negative and
positive. I summarise below the principal issues together with the Committee’s decisions, highlighting where we have made changes to the implementation of the Remuneration Policy to reflect shareholders’ feedback and where we concluded
that the Policy supports the achievement of Unilever’s strategy and shareholders’ interests.
•
Increase of 2018 fixed pay, annual bonus and maximum pay opportunity of former CEO Paul Polman:
This concern was largely addressed by Paul’s decision not to accept the proposed 5% increase in Fixed Pay. Alan Jope has been appointed CEO at a
Fixed Pay level 14% lower than Paul’s previous rate.
www.unilever.com/investor-relations/agm-and-corporate- governance/ (Statement on Remuneration
Policy)
In addition, the Committee retains the additional safeguard outlined in the 2017 DRR: if the result of combined annual
bonus and MCIP performance outcomes exceeds 75% of the maximum total opportunity (excluding the effects of share price change and dividends on share awards) the Committee will review rigorously the quality and sustainability of underlying
performance and then may apply its discretion to reduce or cap the MCIP performance outcome applicable to the Executive Directors. For Alan Jope, this ‘handbrake test’ consequently would apply when his total pay level reaches approximately
€8.8m (a level more than 20% below Paul Polman’s previous maximum pay opportunity), as indicated in the CEO Pay Comparison table below.
The Committee has decided to apply no increases to Executive Directors’ Fixed Pay levels for 2019. It is the Committee’s intention to review
remuneration levels and award Fixed Pay increases in future years subject to the development and performance of the Executive Directors in their role.
CEO Pay Comparison table:
CEO Target Total Pay €m p.a.
Alan
Jope
Paul
Polman
Paul Polman
Previous Policy
Fixed Pay
1.450
1.689
1.689
Annual Bonus
2.175
2.534
1.487
MCIP* Match Share Award
2.175
2.534
0.892
GSIP Share Award
2.478
Total
5.800
6.757
6.546
Personal MCIP* Investment
in
Unilever shares
1.450
1.689
0.892
CEO Maximum Total Pay €m p.a.
Alan
Jope
Paul
Polman
Paul Polman
Previous Policy
Fixed Pay
1.450
1.689
1.689
Annual Bonus
3.263
3.801
2.478
MCIP* Match Share Award
6.525
7.602
2.230
GSIP Share Award
4.956
Total
11.238
13.092
11.353
Personal MCIP* Investment in Unilever shares
2.175
2.534
1.652
75% Safeguard Test
(‘Handbrake’)
8.791
10.241
*
MCIP at maximum investment
•
Consolidation of pension and allowances into a single Fixed Pay number: The consolidation of all fixed pay elements into one single number provides simplicity and transparency and since 2017 applies across the
Unilever Leadership Executive (ULE) and our ‘Top 100’ managers. We continue to position Fixed Pay levels for our Executive Directors conservatively against our peer group. The Committee will therefore continue with the consolidated Fixed
Pay approach.
•
Mandatory minimum threshold of 33% of bonus investment into MCIP: In response to feedback received, the Committee will reintroduce a requirement for members of the ULE, including CEO and CFO to invest at least
33% of their bonus in Unilever shares through MCIP.
•
Sustainability Progress Index assessment: Many investors wanted to know how we will assess our progress on sustainability, which was introduced as a performance measure for MCIP from 2017. The Committee will
provide an annual progress report in the DRR providing transparency on the assessment of the Sustainability Progress Index, based on a joint assessment conducted with the Corporate Responsibility Committee. On page 53 we report the update for 2017
and 2018 performance.
•
Buy-out awards for Executive Directors: The Committee’s intention in normal circumstances is to use only transition awards when hiring executive directors from outside
Unilever to replace awards forgone. The Committee intends to state this position formally in the Remuneration Policy when it is next renewed.
Overall,
the Committee has concluded that the Remuneration Policy supports the reshaping of our business and acceleration of our transformation as we move towards achieving our strategic 2020 objectives. In implementing the Policy, the Committee will
continue to seek investors’ feedback and review any concerns. We will ensure that the Policy continues to provide strong and clear links between Unilever’s business strategy, shareholders’ interests and executives’ incentives.
During the coming year, the Committee will continue to monitor developments in remuneration policy and prevailing market practice, including the implementation of
the changes to the UK Corporate Governance Code and remuneration reporting regulations. We value a continuing dialogue with institutional investors, employees and other stakeholders to make sure that our Remuneration Policy remains fit for purpose
and aligned to support the delivery of Unilever’s strategy.
ENGAGING WITH EMPLOYEES
The Committee is aware of and takes into consideration reward conditions elsewhere in the Group. We are proud of the Framework for Fair Compensation introduced by
Unilever as part of the USLP, which includes the target to achieve living wage compliance for all our employees globally by 2020, a goal we are on track to complete earlier than planned:
The Committee welcomes recent UK corporate governance developments, which apply from 1 January 2019 and we are working towards
implementing and reporting against these new standards. We have decided to adopt early the key features of the new remuneration reporting regulations including disclosure of the CEO pay ratio, which can be found on page 63. We already comply with
many of the principles of the new UK Corporate Governance Code.
The Boards decided to share the responsibility for workforce engagement among all Non-Executive Directors as a collective point of contact. We have developed a number of initiatives to ensure that the Non-Executive Directors are able to engage with the
workforce and get a sense of employee sentiment. These will include the chance to meet and hear from cohorts of employees of all levels, face-to-face, allowing for an
open discussion on issues important to our employees.
We are also looking at ways we can use technology to give the Committee clear visibility of all employees’
pay across the Unilever Group, so that the Committee can better consider colleagues’ pay and their views on it to provide for the best possible alignment with Executive pay.
IMPLEMENTATION REPORT
The Annual Remuneration Report overleaf describes the
implementation of our Remuneration Policy in 2018 and our remuneration decisions for 2019. Both PLC and NV shareholders will have an advisory vote on the implementation of our Remuneration Policy at the 2019 AGMs.
On behalf of the Committee and the entire Board, I thank all shareholders and their representatives for the constructive engagement in 2018 and 2019 and the valuable
feedback and suggestions. We are grateful for your continuing support and welcome any future guidance.
The following sets out how Unilever’s
remuneration policy (which was approved by shareholders at the May 2018 AGMs and is available on our website) was implemented in 2018, and how it will be implemented in 2019.
www.unilever.com/remuneration-policy
IMPLEMENTATION OF THE REMUNERATION POLICY IN
2019 FOR OUR CEO (ALAN JOPE) AND CFO (GRAEME PITKETHLY)
ELEMENTS OF REMUNERATION
ALAN JOPE
Alan Jope became CEO on 1 January
2019. He will be proposed for election as an Executive Director of the Boards of NV and PLC at the AGMs in May 2019. The Committee approved the remuneration package for Alan Jope set out in the table below (shown as for “CEO”), which came
into effect from 1 January 2019, and will remain unchanged if he is appointed as an Executive Director at the May 2019 AGMs. His remuneration package is in accordance with the approved Remuneration Policy. The Committee believes that the
positioning of the package represents an acceptable balance in view of various considerations, such as Paul Polman’s package, competitive external market pay rates across Unilever’s peer group and Alan’s previous package and
experience.
ELEMENTS OF
REMUNERATION
AT A GLANCE
ADDITIONAL INFORMATION
FIXED PAY
Annual Fixed Pay effective from January
2019:
• CEO: €1,450,000
• CFO: €1,102,874
Details of the rationale for our Executive Directors’ Fixed Pay amounts can be found above and in the Chair Letter on page 51.
OTHER BENEFIT ENTITLEMENTS
Implemented in line with the 2018 Remuneration Policy.
n/a
ANNUAL BONUS
• Implemented in line with the 2018 Remuneration
Policy.
• Target annual bonus of 150% of Fixed Pay for the CEO and 120% of Fixed Pay for the CFO.
• Business Performance Multiplier of between 0% and 150% based on achievement against business targets over the
year.
• Maximum annual bonus is 225% of Fixed Pay for the CEO and 180% for the CFO.
For 2019, the Business Performance
Multiplier will be based on the following metrics:
A 0% multiplier will be applied for threshold performance, and up
to 150% multiplier for maximum performance. Performance target ranges are considered to be commercially sensitive and will be disclosed in full with the corresponding performance outcomes retrospectively following the end of the relevant performance
year.
MCIP
• Implemented in line with the 2018 Remuneration
Policy.
• With effect from the 2018 bonus Executive Directors are required to invest a minimum of 33% of
their bonus into MCIP.
• Matching shares are awarded based on performance up to a maximum of 3 x matching
shares.
• MCIP award to be made on 23 April 2019, vesting 9 February 2023 (with a requirement to
hold vested matching shares for a further one-year retention period).
• Alan Jope and Graeme Pitkethly both elected to invest the maximum value of their 2018 bonus into MCIP
investment shares, giving a maximum value from the matching shares for the CEO of €1,748,972 and for the CFO of €2,021,700.
Performance conditions are assessed
over a four-year period. The performance conditions and target ranges for 2019 awards under the MCIP will be as follows:
Performance at threshold results in no matching shares being awarded, target performance results in an award of 1.5 x matching shares, up to a maximum award of 3 x
matching shares, with straight-line vesting between threshold and maximum. Participants are required to hold all their own investment shares and remain employed by Unilever for the duration of the relevant performance period.
The target range for ROIC has been reduced by 50bps from the MCIP 2018- 21 cycle to reflect the dilutive impact of IFRS16 Lease Accounting. The target range for UEPS was
increased in previous MCIP cycles to reflect the benefit of the Share Buyback programmes in 2017 and 2018 and the significant step up in margin required to achieve an Underlying Operating Margin of 20% by 2020. The target range has now been
normalised to reflect the reduction in operational leverage following the earlier years of margin improvement and the reduction in benefit from the Share Buyback programmes over the 2019-2022 performance cycle. Accordingly, the UEPS target range
returns towards the levels originally set for MCIP 2017-2020 of 5% to 10%. The range has been widened to reflect the impact of exchange rate volatility in delivering current currency UEPS over a four-year plan cycle. The Committee views 6% compound
annual growth in UEPS as a stretching but achievable target for 2019-2022. It should also be noted that the Remuneration Policy provides the Committee with the ability to adjust the formulaic outcome of MCIP by +/- 10% to reflect the underlying
performance of the business.
Performance update on Sustainability Progress Index for
MCIP:
With effect from 2017, one of the performance measures for MCIP is our progress on sustainability, measured by the sustainability progress index (SPI). The
SPI is an assessment made jointly by the Compensation Committee and the Corporate Responsibility Committee (CRC) taking into account Unilever’s wider progress on sustainability together with progress towards the targets in our reported USLP
scorecard. The Committees determine a numerical rating for the previous year’s SPI in the range of zero to 200%; annual ratings will then be tallied as an average SPI Index for each four-year MCIP performance period. At the end of the year, the
Committees will disclose a progress report on the year’s SPI performance assessment. At the end of the MCIP performance period the Committee will disclose a narrative setting out the SPI performance achieved and the corresponding outcome that
the Committee has determined for the SPI over the four-year cycle.
The SPI score for MCIP
performance years 2017 and 2018 (relating to the USLP reports of 2016 and 2017 respectively) is set out below.
To avoid over-focus on a small number of elements, the 2017 SPI assessment was undertaken on a holistic basis. USLP targets were assessed on progress towards the
target’s end date, rather than in the year. Each target was rated as: on-plan for target date achievement; off-plan for target date; and percentage achieved by
target date (where the target date has already passed).
For the 2018 assessment, the SPI was
reviewed in terms of: (i) progress towards the 10 USLP pillar targets; (ii) Unilever’s transformational change agenda; (iii) our performance on sustainable living brands; and (iv) the impact of Unilever’s activity on Sustainability.
Thereby, the SPI assessment included progress of important workstreams as well as towards wider ambitions which flow from the USLP about how we should lead industry and coalition groups to drive change. This recognises major problems that are
central to our business, such as for example the contribution of Palm Oil to deforestation and climate change, or the damage to the oceans, food chains and fresh water supplies from single use plastics.
MCIP performance year (USLP Report year)
SPI
score
Summary of rationale for SPI score
2017 (USLP Report 2016)
120
2016 saw good progress across the USLP with 80% of our detailed targets ‘on track’, and seven of the nine pillar targets on track. We continued to pursue our
transformational change agenda with impact, driving action on Water Sanitation and Hygiene (WASH), climate change, sustainable agriculture and empowering women at the same time as driving business growth through more
purpose-led brands. Our Sustainable Living Brands grew 50% faster than the rest of the business. We had the top position in the most important independent rankings and indices worldwide.
In 2017 we made significant progress on our transformational change agenda with impact, driving action on WASH, climate change,
sustainable agriculture, empowering women and responsible digital marketing. We also improved our progress on brands with purpose, with Sustainable Living Brands contributing 70% of turnover growth. Unilever’s activities remained highly
influential with consistently high scores on independent rankings and indices worldwide. Internally our employee engagement scores showed very strong affiliation with our USLP and sustainable growth. We remained ‘on track’ for seven of the
nine pillar targets (except Water and the Inclusive Business pillar) and around 80% of our 50+ USLP targets. A number have been achieved well in advance of their target date.
For 2019, the CRC will again review which elements should be included in the SPI performance assessment. Throughout 2019 the CRC will review progress on sustainability
with a view to providing the Committee with their annual SPI assessment and recommendation.
ULTIMATE REMEDY/MALUS AND CLAW-BACK
Grants under the GSIP and MCIP are subject to ultimate remedy as explained in the Remuneration Policy. Malus and claw-back apply to all performance-related payments as
explained in the Remuneration Policy.
In 2018, the Committee did not reclaim or claw back any of the value of awards of performance-related payments to Executive
Directors.
SINGLE FIGURE OF REMUNERATION AND IMPLEMENTATION OF THE REMUNERATION POLICY IN 2018 FOR OUR CEO (PAUL POLMAN) AND CFO (GRAEME PITKETHLY)
The table below shows a single figure of remuneration for each of our Executive Directors for the years 2017 and 2018. The year-on-year comparison reflects the implementation of our new Reward Framework for Executive Directors in May 2018, and so is impacted by both mid-year structural
change (with prior figures refreshed to provide a comparison point as detailed in the explanatory footnotes) and ongoing fluctuation in the exchange rates used to convert pay elements denominated in pounds sterling to euros for reporting purposes. A
full overview of our ‘Fixed Pay’ model as it now applies to our Executive Directors is set out in the Chair Letter on page 50.
Paul Polman
CEO (UK) (€’000)
Graeme Pitkethly CFO (UK) (€’000)
2018
2017
2018
2017
Fixed Pay elements
(A) Fixed Pay(a)
1,602
1,439
1,058
978
(B) Conditional supplemental pension(b)
44
134
–
–
Fixed Pay elements (sub-total)
1,646
1,573
1,058
978
(C) Other benefits
526
613
26
24
(D) Annual bonus
1,926
2,307
1,006
1,124
Long-term incentives
(E) MCIP matching shares – (required by UK law)
2,742
2,042
683
(c)
285
(c)
(F) GSIP performance shares – (required by UK law)
4,886
5,126
2,267
(c)
704
(c)
Long-term incentives (sub-total)
7,628
7,168
2,950
989
Total remuneration paid – (required by UK law) (A+B+C+D+E+F)
11,726
11,661
5,040
3,115
(G) Share awards (required by Dutch law)
4,535
7,154
1,774
2,187
Total remuneration paid – (required by Dutch law)
(A+B+C+D+G)
8,633
11,647
3,864
4,313
(a)
‘Fixed Pay’ for these purposes comprises each individual’s basic salary and fixed allowance paid in the
period prior to May 2018 and each individual’s Fixed Pay paid thereafter following the implementation of our new Reward Framework for Executive Directors. 2017 numbers are restated to provide a comparison point, with the 2017 figure for Fixed
Pay comprising base salary plus fixed allowance accordingly (with 2017 Fixed Pay of 1,439 for Paul Polman comprising 1,154 base salary plus 285 fixed allowance, and 2017 Fixed Pay of 978 for Graeme Pitkethly comprising 750 base salary plus 228 fixed
allowance (all figures in €‘000)).
(b)
‘Conditional Supplemental Pension’ for these purposes comprises the conditional supplemental pension paid to
Paul Polman in the period prior to May 2018, at which point it was incorporated into his ‘Fixed Pay’ as described in last year’s Directors’ Remuneration Report.
(c)
Graeme Pitkethly’s GSIP and MCIP values in the above single figure table for 2017 include GSIP performance shares and
MCIP matching shares previously granted to him in 2015 before his appointment as an Executive Director, and include gross delivery costs (including tax and social security).
Where relevant, amounts for 2018 have been translated into euros using the average exchange rate over 2018 (€1 =
£0.8835 / CHF 1.1573), excluding amounts in respect of MCIP and GSIP which have been translated into euros using the exchange rate at vesting date of 11 February 2019 (€1 =
£0.8784). Amounts for 2017 have been translated into euros using the average exchange rate over 2017 (€1 = £0.8756 / CHF 1.1061), excluding amounts in respect of MCIP and GSIP which
have been translated into euros using the exchange rate at vesting date of 13 February 2018 (€1 = £0.8882).
We do not grant our Executive Directors any personal loans or guarantees.
For 2018, this comprises each individual’s base salary and fixed allowance paid prior to 1 May 2018 (translated into euros where necessary
using the average exchange rate over 2018 of €1 = £0.8835), and each individual’s Fixed Pay paid from 1 May 2018 onwards following the implementation of our new Reward Framework
for Executive Directors (paid in euros), for a total of:
•
CEO – €1,601,582
•
CFO – €1,058,298
(B) CONDITIONAL SUPPLEMENTAL PENSION
CEO (Paul
Polman): Conditional supplemental pension provision agreed with Paul Polman on hiring, which will be paid on his retirement (or his death or total disability prior to retirement). Contributions were made for the period up to 1 May 2018
(when this item was discontinued upon the implementation of our new Reward Framework for Executive Directors) at the rate of 12% of a capped salary equivalent to £976,028, resulting in contributions for 2018 of £39,041.
(C) OTHER BENEFITS
For 2018 this comprises:
Paul Polman CEO (UK)
(€)
(a)
Graeme Pitkethly CFO (UK)
(€)
(a)
2018
2018
Medical insurance cover and actual tax return preparation costs
44,896
17,702
Provision of death-in-service
benefits and administration
11,707
8,340
Payment to protect against difference between employee social security obligations in country of residence
versus UK
469,788
0
Total
526,391
26,042
(a)
The numbers in this table are quoted in euros (translated where necessary using the average exchange rate over 2018 of €1 = £0.8835 / CHF 1.1573.
(D) ANNUAL BONUS
Annual bonus 2018 actual outcomes
•
CEO – €1,925,810 (which is 51% of maximum, 114% of Fixed Pay).
•
CFO – €1,005,821 (which is 51% of maximum, 91% of Fixed Pay).
This includes cash and the portion of annual bonus that Executive Directors have indicated will be
re-invested in shares under the MCIP (satisfying the requirement now effective to invest at least 33%). See below for details. Performance against targets:
Further details of the annual bonus outcomes are described in the Chair Letter on page 50. The calculated pay-out for Unilever’s 2018 performance ratio of 76% was endorsed by the Committee as representing a balanced assessment of underlying performance of the business.
•
Paul Polman
*
Figure reflects Paul Polman’s decision not to accept the 5% increase in Fixed Pay proposed at the 2018 AGMs.
Annual bonus measures are not impacted by share price growth. Paul Polman’s annual bonus was paid to him wholly in Unilever N.V. shares (after deduction for tax
withholding) which he will be required to hold until the second anniversary of his retirement date (see page 60 for further details about leaving arrangements for Paul Polman).
(E) MCIP – UK LAW REQUIREMENT
2018 OUTCOMES
This includes MCIP matching shares granted on 11 February 2016 (based on the percentage of 2015 annual bonus that Paul Polman and Graeme Pitkethly had invested
in Unilever shares, as well as performance in the three-year period to 31 December 2018) which vested on 11 February 2019. Further details of the performance measures (including the impact of our April 2017 toughening of performance
measures to align the non- GAAP margin measure from COM to UOM) are disclosed below in note (F).
The values included in the
single figure table for 2018 are calculated by multiplying the number of shares granted on 11 February 2016 (including additional shares in respect of accrued dividends through to 31 December 2018) by the level of vesting (132% of target
award) and the share prices on the date of vesting (NV €48.55 and PLC £42.06). Performance measures and performance against them are as set out in the table under heading (F) below.
These have been translated into euros using the exchange rate on the date of vesting (€1 = £0.8784). These results indicate a value of
€669,930 delivered through performance and €2,072,491 delivered through share price growth for Paul Polman, and a value of €188,506 delivered through performance and €492,950 delivered through share price growth for Graeme Pitkethly.
(F) GSIP – UK LAW REQUIREMENT
2018 OUTCOMES
This includes GSIP performance shares granted on 11 February 2016, based on performance in the three-year period to 31 December 2018, which vested on
11 February 2019.
The values included in the single figure table for 2018 are calculated by multiplying the number of shares granted on 11 February 2016
(including additional shares in respect of accrued dividends through to 31 December 2018) by the level of vesting (132% of target award) and the share price on the date of vesting (NV €48.55
and PLC £42.06). These have been translated into euros using the exchange rate on the date of vesting (€1 = £0.8784). These results indicate a value of €1,347,596 delivered through performance and €3,524,011 delivered through share price growth for Paul Polman, and a value of €625,424 delivered through performance and €1,635,506 delivered through share price growth for Graeme Pitkethly.
Performance against targets:
(a)
For the relative TSR measure, Unilever’s TSR is measured against a comparator group of other consumer goods
companies. TSR measures the return received by a shareholder, capturing both the increase in share price and the value of dividend income (assuming dividends are reinvested). The TSR results are measured on a common currency basis to better reflect
the shareholder experience. The current TSR peer group consists of 18 companies (19 including Unilever) as follows:
Avon
Colgate-Palmolive
Henkel
L’Oréal
Reckitt Benckiser
Beiersdorf
Danone
Kao
Nestlé
Shiseido
Campbell Soup
General Mills
Kellogg’s
PepsiCo
Coca-Cola
Estée Lauder
Kimberly-Clark
Procter & Gamble
The Committee may change the TSR vesting levels set out above if the number of companies in the TSR comparator group
changes (eg via M&A activity etc).
Further details of the GSIP and MCIP outcomes are described in the Chair Letter on page 50, with details of our stepped-up plans for shareholder value creation (and related treatment of inflight legacy awards) available on our website:
www.unilever.com/ara2017/downloads (Compensation Committee Statement: Alignment of Performance Measures for 2017)
On the basis of this performance, the Committee determined that the GSIP and MCIP awards to the end of 2018 will vest at 132% of initial
target award levels (ie 66% of maximum for GSIP and 88% of maximum for MCIP (which is capped at 150% for the Executive Directors)).
(G)
SHARE INCENTIVES – DUTCH LAW REQUIREMENT
As per the Dutch requirements, these costs are non-cash costs and
relate to the expenses recognised for the period following IFRS 2. This is based on share prices on grant dates and a 98% adjustment factor for GSIP shares and MCIP matching shares awarded in 2018, 2017 and 2016.
Conditional matching share award made on 3 May 2018
GSIP
Conditional share award made
on 16 February 2018
BASIS OF AWARD
Based on the level of 2017 annual bonus paid in 2018 invested by the CEO and CFO. The following numbers of
matching shares were awarded on 3 May 2018(a):
CEO:
PLC – 0
NV – 50,519
CFO:
PLC – 12,408
NV – 12,408
Maximum vesting results in 150% of the above awards vesting.
The CEO received a target award of
200% of base salary at the time (as disclosed in the Directors’ Remuneration Report 2017).
CEO:
PLC – 26,209
NV – 26,209
The CFO received a target award of 150% of base salary at the time (as disclosed in the Directors’ Remuneration Report 2017).
CFO:
PLC – 12,772
NV – 12,772
Maximum vesting results in 200% of target awards vesting, which translates to a maximum vesting
of 400% of base salary for the CEO and 300% of base salary for the CFO.
MAXIMUM FACE
VALUE OF AWARDS
CEO: €3,469,898(b)
CFO: €1,685,412(b)
CEO: €4,560,247(c)
CFO: €2,222,270(c)
THRESHOLD VESTING
(% OF TARGET AWARD)
Four equally weighted long-term performance measures. 0% of the target award vests for threshold performance.
Four equally weighted long-term
performance measures. For the three business-focused metrics, 25% of the target award vests for threshold performance. For the TSR measure, 50% of the target award vests for threshold performance.
PERFORMANCE PERIOD
1 January 2018 – 31 December 2021
(with a requirement to hold vested matching shares for a further one-year retention period).
1 January 2018 –
31 December 2020
(with a requirement to hold vested shares for a further one-year retention period).
DETAILS OF PERFORMANCE MEASURES
Subject to four equally weighted performance measures:
Subject to four equally weighted performance measures:
Participants are required to hold all their own investment shares and normally to remain employed by Unilever for the duration of the relevant performance period.
(a)
Under MCIP, Executive Directors invest in NV or PLC shares, and receive a corresponding number of performance-related
matching shares. On 3 May 2018, the CEO invested 67% (£1,353,400) and the CFO invested 67% (£659,531) of their 2017 annual bonus in MCIP investment shares (the CEO elected to invest fully in NV shares, and the CFO elected to receive
an equal number of shares in each of PLC and NV, in line with the share choice provisions in operation at the time).
(b)
Face values are calculated by multiplying the number of shares granted on 3 May 2018 by the share price on that day
of PLC £39.55 and NV €45.79 respectively, assuming maximum performance and therefore maximum vesting of 150% for MCIP and then translating into euros using an average exchange rate over
2018 of €1 = £0.8835.
(c)
Face values are calculated by multiplying the number of shares granted on 16 February 2018 by the share price on that
day of PLC £38.02 and NV €43.97 respectively, assuming maximum performance and therefore maximum vesting of 200% for GSIP and then translating into euros using an average exchange rate over
2018 of €1 = £0.8835.
MINIMUM SHAREHOLDING REQUIREMENT AND EXECUTIVE DIRECTOR SHARE INTERESTS (UNAUDITED)
The remuneration arrangements applicable to our Executive Directors require them to build and retain a personal shareholding in Unilever (by the later of 2018 or five
years from their date of appointment) to align their interests with those of Unilever’s shareholders. Incoming Executive Directors will be required to retain all shares vesting from any share awards made since their appointment until their
minimum shareholding requirements have been met in full.
The table below shows the Executive Directors’ share ownership against the minimum shareholding
requirements as at 31 December 2018 and the interest in NV and PLC ordinary shares of Executive Directors and their connected persons as at 31 December 2018.
When calculating an Executive Director’s personal shareholding the following methodology is used:
•
Fixed Pay at the date of measurement, in line with the application of the new Reward Framework to our Executive Directors
(resulting in a de facto increase in the share ownership requirement applicable to them from the previous multiple of base salary).
•
Shares in either Unilever PLC or Unilever N.V. (or a combination of both) will qualify provided they are personally owned by
the Executive Director, by a member of his (immediate) family or by certain corporate bodies, trusts or partnerships as required by law from time to time (each a ‘connected person’).
•
Shares purchased under the MCIP, whether from the annual bonus or otherwise, will qualify as from the moment of purchase as
these are held in the individual’s name and are not subject to further restrictions.
•
Shares or entitlements to shares that are subject only to the Director remaining in employment will qualify on a net of tax
basis.
•
Shares awarded on a conditional basis by way of the GSIP or MCIP will not qualify until the moment of vesting (ie once the
precise number of shares is fixed after the three-year vesting period for the GSIP, or a four-year vesting period for the MCIP, has elapsed).
•
The shares will be valued on the date of measurement or, if that outcome fails the personal shareholding test, on the date
of acquisition.
The share price for the relevant measurement date will be based on the average closing share prices and the euro/sterling/US dollar
exchange rates from the 60 calendar days prior to the measurement date.
Executive Directors are required to hold shares to the value of 100% of their shareholding
requirement for 12 months post cessation of employment at Unilever, and 50% of these shares for 24 months post cessation of employment with Unilever. ULE members are required to build a shareholding of 400% of Fixed Pay (500% for the CEO). This
requirement is 150% of Fixed Pay for the ‘Top 100’ management layer below ULE.
EXECUTIVE DIRECTORS’ AND THEIR CONNECTED
PERSONS’ INTERESTS IN SHARES AND SHARE OWNERSHIP
Share
ownership
Actual share ownership as
Shares held as at
1 January 2018(b)
Shares held as at 31 December 2018(b)
guideline as %
of Fixed Pay (as
at 31 December
2018)
Have guidelines
been met (as at 31 December
2018)?
a % of Fixed Pay (as at 31
December
2018)(a)
NV
PLC
NV
PLC
CEO: Paul Polman
500
Yes
4,116%
952,374
314,130
1,118,459
324,351
CFO: Graeme
Pitkethly
400
Yes
471%
44,496
55,797
35,340
73,495
(a)
Calculated based on the minimum shareholding requirements and methodology set out above and the headline Fixed Pay for the
CEO and CFO as at 31 December 2018 (ie €1,689,307 for the CEO and €1,102,874 for the CFO).
(b)
NV shares are ordinary €0.16 shares and PLC shares are ordinary 31⁄9p shares.
During the period between 31 December 2018 and
21 February 2019, the following changes in interests have occurred:
•
Graeme Pitkethly purchased 6 PLC shares under the Unilever PLC ShareBuy Plan: 3 on 9 January 2019 at a share price of
£40.88, and a further 3 on 8 February 2019 at a share price of £41.75; and
•
as detailed under headings (E) and (F) on page 56, on 11 February 2019:
•
Paul Polman acquired 56,487 NV shares following the vesting of his 2016 MCIP award, and 101,887 NV shares following the
vesting of his 2016 GSIP award; and
•
Graeme Pitkethly acquired 7,057 NV shares and 7,118 PLC shares following the vesting of his 2016 MCIP award, and 46,729 PLC
shares following the vesting of his 2016 GSIP award.
The voting rights of the Directors (Executive and
Non-Executive) and members of the ULE who hold interests in the share capital of NV and PLC are the same as for other holders of the class of shares indicated. As at 21 February 2019 none of the
Directors’ (Executive and Non-Executive) or other ULE members’ shareholdings amounted to more than 1% of the issued shares in that class of share, excluding the holdings of the Leverhulme Trust and
the Leverhulme Trade Charities Trust, which amounted to 4.19%. All shareholdings in the table above are beneficial. In addition, 46,931,182 shares are held by the Leverhulme Trust and 2,035,582 shares are held by the Leverhulme Trade Charities
Trust, of which Paul Polman is a director.
INFORMATION IN RELATION TO OUTSTANDING SHARE INCENTIVE AWARDS
As at 31 December 2018, Paul Polman held awards over a total of 317,936 shares which are subject to performance conditions, and Graeme Pitkethly held awards over a
total of 139,570 shares which are subject to performance conditions. There are no awards of shares without performance conditions and no awards in the form of options.
The following conditional shares vested during 2018 or were outstanding at 31 December 2018 under the MCIP:
Balance of conditional shares at 1 January 2018
Conditional shares awarded in 2018(a)
Balance of conditional shares at 31 December 2018
Share type
Original
award
Performance period
1 January 2018 to 31 December 2021
Price at award
Dividend shares accrued during the year(d)
Vested in 2018(e)
Additional shares earned
in 2018
Price at vesting
Shares lapsed
No. of shares
Paul Polman
NV
100,071
(b)
50,519
€
45.79
3,477
46,878
15,204
€
43.57
0
122,393
PLC
0
(b)
0
£
39.55
0
0
0
£
37.91
0
0
Graeme Pitkethly
NV
10,678
(c)
12,408
€
45.79
653
0
0
€
43.57
0
23,739
PLC
13,154
(c)
12,408
£
39.55
688
3,454
1,023
£
37.91
0
23,819
(a)
Each award of conditional matching shares vests four years after the date of the award, subject to performance conditions
and an additional retention period (further details can be found on page 57). Awards are all subject to continued employment and maintenance of the underlying investment shares. Under MCIP, Executive Directors are able to choose whether they invest
in PLC or NV shares or an equal number of shares in each, and receive a corresponding number of performance-related matching shares (currently 1.5 x matching shares for each investment share purchased). Matching shares will be awarded in the same
form as the investment shares (ie in PLC shares, NV shares or an equal number of shares in each). On 3 May 2018, Paul Polman and Graeme Pitkethly each invested in the MCIP 67% of their annual bonus earned during 2017 and paid in 2018, and
received a corresponding award of 1.5 x matching shares (which will vest, subject to performance, on 16 February 2022).
(b)
This includes a grant of 29,128 NV shares made on 13 February 2015 (which vested on 13 February 2018), a grant
of 39,318 NV shares made on 11 February 2016 (which vested on 11 February 2019), a grant of 26,578 NV shares made on 17 May 2017 (vesting on 16 February 2021), and 5,047 NV shares from reinvested dividends accrued in prior years
in respect of awards.
(c)
This includes grants that were made to Graeme Pitkethly before his appointment as Executive Director on 21 April 2016
(being a grant of 2,215 PLC shares made on 13 February 2015 (which vested on 13 February 2018) and a grant of 4,912 of each of NV and PLC shares made on 11 February 2016 (which vested on 11 February 2019), a grant of 5,423 of
each of NV and PLC shares made on 17 May 2017 (vesting on 16 February 2021) and 343 NV shares and 604 PLC shares from reinvested dividends accrued in prior years in respect of awards.
(d)
Reflects reinvested dividend equivalents accrued during 2018 and subject to the same performance conditions as the
underlying matching shares.
(e)
The 13 February 2015 grant vested on 13 February 2018 at 148% for Paul Polman and 142% for Graeme Pitkethly. In
accordance with Unilever’s existing remuneration policy, Executive Directors are able to choose whether they receive any shares due to vest under MCIP in PLC or NV shares or an equal number of shares in each. Paul Polman elected for share
choice and chose to receive his shares in the form of 100% NV shares, and Graeme Pitkethly elected to receive his shares in the form of an equal number of shares in each of PLC and NV.
GLOBAL SHARE INCENTIVE PLAN
The following
conditional shares vested during 2018 or were outstanding at 31 December 2018 under the GSIP:
Balance of conditional shares at 1 January 2018
Conditional shares awarded in 2018(a)
Balance of
conditional shares at 31 December 2018
Share type
Original
award
Performance period 1 January 2018 to 31 December 2020
Price at award
Dividend shares accrued during the
year(d)
Vested in 2018(e)
Additional shares earned in 2018
Price at vesting
Shares lapsed
No. of shares
Paul Polman
NV
107,885
(b)
26,209
€
43.970
3,100
58,738
19,051
€
43.57
0
97,507
PLC
108,583
(b)
26,209
£
38.015
3,309
59,294
19,231
£
37.91
0
98,038
Graeme Pitkethly
NV
35,149
(c)
12,772
€
43.970
1,459
4,966
1,469
€
43.57
0
45,883
PLC
35,332
(c)
12,772
£
38.015
1,557
5,013
1,482
£
37.91
0
46,130
(a)
Each award of conditional shares vests three years after the date of the award, subject to performance conditions (further
details can be found on page 57). The 2018 award was made on 16 February 2018 (vesting 17 February 2021).
(b)
This includes a grant of 36,497 of each of NV and PLC shares made on 13 February 2015 (which vested on
13 February 2018), a grant of 35,115 of each of NV and PLC shares made on 11 February 2016 (which vested on 11 February 2019), a grant of 30,532 of each of NV and PLC shares made on 13 February 2017 (vesting on 13 February
2020) and 5,741 NV shares and 6,439 PLC shares from reinvested dividends accrued in prior years in respect of awards.
(c)
This includes grants that were made to Graeme Pitkethly before his appointment as Executive Director on 21 April 2016
(being a grant of 3,216 of each of NV and PLC shares made on 13 February 2015 (which vested on 13 February 2018) and a grant of 16,297 of each of NV and PLC shares made on 11 February 2016 (which vested on 11 February 2019)), a
grant of 14,171 of each of NV and PLC shares made on 13 February 2017 (vesting on 13 February 2020), and 1,465 NV shares and 1,648 PLC shares from reinvested dividends accrued in prior years in respect of awards.
(d)
Reflects reinvested dividend equivalents accrued during 2018, subject to the same performance conditions as the underlying
GSIP shares.
(e)
The 13 February 2015 grant vested on 13 February 2018 at 148% for Paul Polman and 142% for Graeme Pitkethly. In
accordance with Unilever’s existing remuneration policy, Executive Directors are able to choose whether they receive any shares due to vest under GSIP in PLC or NV shares or an equal number of shares in each. Paul Polman elected for share
choice and chose to receive his shares in the form of 100% NV shares. Therefore, upon vesting, his 13 February 2015 PLC award was cancelled and converted and delivered to him as 58,234 NV shares (resulting in a total vesting for the
13 February grant of 116,972 NV shares). Graeme Pitkethly elected to receive his shares in the form of an equal number of shares in each of PLC and NV.
Starting dates of our Executive Directors’ service contracts:
•
Paul Polman (CEO and Executive Director to 31 December 2018): 1 October 2008 (signed on 7 October 2008, and
terminated due to retirement with effect from 2 July 2019); and
•
Graeme Pitkethly: 1 October 2015 (signed on 16 December 2015).
Arrangements for Alan Jope will be in line with our Remuneration Policy and effective from his date of appointment as CEO on 1 January 2019.
Service contracts are available to shareholders to view at the AGMs or on request from the Group Secretary, and can be terminated with 12 months’ notice from
Unilever or six months’ notice from the Executive Director. A payment in lieu of notice can be made of no more than one year’s base salary, fixed allowance and other benefits. Other payments that can be made to Executive Directors in the
event of loss of office are disclosed in our Remuneration Policy which is available on our website.
www.unilever.com/remuneration-policy
PAYMENTS TO FORMER DIRECTORS / PAYMENTS FOR LOSS OF OFFICE
There have been no payments to former Directors or payments for loss of office during the year.
Paul Polman stepped down as CEO and Executive Director with effect from 31 December 2018, and will retire from employment with Unilever effective 2 July 2019
(the “Retirement Date”). Until his Retirement Date he will assist with an orderly transition and handover of responsibilities.
In accordance with his
service agreement and our Remuneration Policy, Paul Polman:
•
will continue to receive Fixed Pay and benefits up to the Retirement Date;
•
remained eligible to receive a discretionary bonus in respect of 2018, determined by the Compensation Committee in the
normal way and at the normal time dependent on the Company’s performance, and paid to him wholly in Unilever N.V. shares (after deduction for tax withholding) which he will be required to hold until the second anniversary of the Retirement Date
(see pages 55 to 56 for details);
•
will not participate in the MCIP 2019-2022 and will not receive any bonus in respect of the 2019 financial year;
•
as he is retiring, will be treated as a good leaver and hence his outstanding awards under the MCIP and GSIP long term share
incentive plans will remain capable of vesting in accordance with the rules of the relevant plan. Consequently, it is anticipated that these awards will be pro-rated as follows reflecting Paul Polman’s
actual length of service within the vesting period:
a) GSIP and MCIP 2016 – 2018 vested on 11 February 2019: 100% (see
page 56 for details);
b) GSIP 2017 – 2019 vesting around 13 February 2020: 79%;
c) MCIP 2017 – 2020 vesting around 17 February 2021: 57%;
d) GSIP 2018 – 2020 vesting around 17 February 2021: 46%; and
e) MCIP 2018 – 2021 vesting around 16 February 2022: 31%;
and will then vest, subject to Company performance, on the respective vesting dates;
•
will remain subject to the Company’s minimum shareholding requirements and needs to retain Unilever shares worth at
least 5 times his annual Fixed Pay level until the first anniversary of the Retirement Date and 50% of that amount until the second anniversary of the Retirement Date. Additionally, the Company will continue to pay Paul Polman’s social security
obligation in his country of residence on all Unilever source income arising to protect him against the difference between the employee social security obligations in his country of residence versus the UK. The precise cost of this provision will
depend on Paul Polman’s total earnings (which will primarily be influenced by the value of his outstanding MCIP and GSIP share awards when they vest) and applicable rates of social security;
•
will continue to receive tax return preparation services in respect of total Unilever earnings;
•
through to the Retirement Date or to the later date as specified below, after which such benefits will cease, will continue
to receive:
•
Family Medical Cover to 31 December 2019; and
•
Death & Disability Insurance Cover.
Details of all payments made to and receivable by Paul Polman will be disclosed in the Directors’ Remuneration Report within the Annual Report and Accounts as
required going forward.
IMPLEMENTATION OF THE REMUNERATION POLICY IN 2019 FOR NON-EXECUTIVE DIRECTORS
The current Non-Executive Director fee levels will not be changed for 2019, and we will review fee levels for 2020 during the
course of the year. The table below outlines the current fee structure with fees paid 50% by each of Unilever N.V. and Unilever PLC (at a constant exchange rate of £1 = €1.2817):
Roles and responsibilities
Current Annual Fee €
Basic Non-Executive Director Fee
108,949
Chairman (all inclusive)
801,092
Vice Chairman (modular)
51,270
Member of Nominating and Corporate Governance Committee
19,226
Member of Compensation Committee
19,226
Member of Corporate Responsibility Committee
19,226
Member of Audit Committee
25,635
Chair of Nominating and Corporate Governance Committee
38,452
Chair of Compensation Committee
38,452
Chair of Corporate Responsibility Committee
38,452
Chair of Audit Committee
51,270
All reasonable travel and other expenses incurred by Non-Executive Directors in the course of
performing their duties are considered to be business expenses. Non-Executive Directors also receive expenses relating to the attendance of the Director’s spouse or partner, when they are invited by
Unilever.
SINGLE FIGURE OF REMUNERATION IN 2018 FOR NON-EXECUTIVE DIRECTORS
The table below shows a single figure of remuneration for each of our Non-Executive Directors, for the years 2017 and 2018.
2018
2017
Total
Total
Fees
(a)
Benefits
(b)
remuneration
Fees
(a)
Benefits
(b)
remuneration
Non-Executive Director
€’000
€’000
€’000
PLC
NV
€’000
Marijn Dekkers(c)
744
13
757
727
13
740
Nils Andersen
121
9
130
109
3
112
Laura Cha
115
–
115
107
–
107
Vittorio Colao(d)
127
–
127
103
–
103
Louise Fresco(e)
–
–
–
38
–
38
Ann Fudge(f)
50
–
50
151
24
175
Judith Hartmann
121
7
128
109
3
112
Andrea Jung(g)
80
–
80
–
–
–
Mary Ma
115
–
115
105
–
105
Strive Masiyiwa(h)
131
–
131
111
–
111
Youngme Moon
147
–
147
103
–
103
John Rishton(i)
143
–
143
127
–
127
Feike Sijbesma
135
–
135
127
–
127
Total
2,029
29
2,058
1,917
43
1,960
(a)
This includes fees received from NV in euros and PLC in sterling for 2017 and 2018 respectively. Includes basic Non-Executive Director fee and Committee chairmanship and/or membership. Where relevant, amounts for 2018 have been translated into euros using the average exchange rate over 2018 (€1 = £0.8835). Amounts for 2017 have been translated into euros using the average exchange rate over 2017 (€1 = £0.8756).
(b)
The only benefit received relates to travel by spouses or partners where they are invited by Unilever.
(c)
Chairman and Chair of the Nominating and Corporate Governance Committee.
(d)
Chair of the Compensation Committee from 3 May 2018.
(e)
Chair of the Corporate Responsibility Committee until 27 April 2017 (retired from the Boards at the April 2017 AGMs).
(f)
Vice Chairman and Chair of the Compensation Committee until 3 May 2018 (retired from the Boards at the May 2018
AGMs).
(g)
Appointed at the May 2018 AGMs.
(h)
Chair of the Corporate Responsibility Committee.
(i)
Chair of the Audit Committee.
We do not grant our Non-Executive Directors any personal loans or guarantees, nor are they entitled to any severance payments.
NON-EXECUTIVE DIRECTORS’ INTERESTS IN SHARES
Non-Executive Directors are encouraged to build up a personal shareholding of at least 1 x their annual fees over the five years
from 1 January 2012 (or appointment, if later). The table shows the interests in NV and PLC ordinary shares of Non-Executive Directors and their connected persons as at 31 December 2018. There has
been no change in these interests between 31 December 2018 and 21 February 2019.
Share type
Shares held at 1 January 2018
Shares held at 31 December
2018
Marijn Dekkers
NV NY
20,000
20,000
PLC ADRs
–
–
Nils Andersen
NV
6,014
6,014
PLC
–
–
Laura Cha
NV
660
2,660
PLC
858
858
Vittorio Colao
NV
4,600
4,600
PLC
–
–
Ann Fudge
NV NY
282
282
(a)
PLC ADRs
5,000
5,000
(a)
Judith Hartmann
NV
2,500
2,500
PLC
–
–
Share type
Shares held at 1 January 2018
Shares held at 31 December
2018
Andrea Jung
NV
4,576
(b)
4,576
PLC
–
–
Mary Ma
NV
860
860
PLC
860
860
Strive Masiyiwa
NV
–
–
PLC
1,130
1,130
Youngme Moon
NV NY
2,000
2,000
PLC ADRs
–
–
John Rishton
NV
3,340
3,340
PLC
2,000
2,000
Feike Sijbesma
NV
10,000
10,000
PLC
–
–
(a)
Shares held at 3 May 2018 (the date by which Ann Fudge retired from the Boards).
(b)
Shares held at 3 May 2018 (the date when Andrea Jung was appointed to the Boards).
All Non-Executive Directors were reappointed to the Boards at the 2018 AGMs, with the exception of Andrea Jung (who was appointed
for the first time) and Ann Fudge (who retired from the Boards).
Date first appointed
Effective date of
Non-Executive Director
to the Boards
current appointment
(a)
Marijn Dekkers
21 April 2016
3 May 2018
Nils Andersen
30 April 2015
3 May 2018
Laura Cha
15 May 2013
3 May 2018
Vittorio Colao
1 July 2015
3 May 2018
Ann Fudge
14 May 2009
n/a
Judith Hartmann
30 April 2015
3 May 2018
Andrea Jung
3 May 2018
3 May 2018
Mary Ma
15 May 2013
3 May 2018
Strive Masiyiwa
21 April 2016
3 May 2018
Youngme Moon
21 April 2016
3 May 2018
John Rishton
15 May 2013
3 May 2018
Feike Sijbesma
1 November 2014
3 May 2018
(a)
The unexpired term for all Non-Executive Directors’ letters of appointment is
the period up to the 2019 AGMs, as they all, unless they are retiring, submit themselves for annual reappointment.
OTHER DISCLOSURES RELATED TO
DIRECTORS’ REMUNERATION
SERVING AS A NON-EXECUTIVE ON THE BOARD OF ANOTHER COMPANY
Executive Directors serving as non-executive directors on the boards of other companies are permitted to retain
all remuneration and fees earned from outside directorships subject to a maximum of one outside listed directorship (see ‘Independence and Conflicts’ on page 37 for further details).
Paul Polman is a non-executive director of DowDuPont Inc. (formerly The Dow Chemical Company) and received an annual fee of €97,051 ($115,000) based on the average exchange rate over the year 2018 of €1 = $1.1850. In addition, he received a restricted award of 2,680
ordinary shares with a nominal value of $2.50 per share in the capital of DowDuPont Inc. The shares include the rights to vote and to receive dividends thereon. The shares cannot be sold or transferred until Paul Polman leaves the board of directors
of DowDuPont Inc., and in any case not earlier than 25 April 2020.
TEN-YEAR HISTORICAL TOTAL
SHAREHOLDER RETURN (TSR) PERFORMANCE
The graph below includes:
•
growth in the value of a hypothetical £100 holding over ten years’ FTSE 100 comparison based on 30-trading-day average values; and
•
growth in the value of a hypothetical €100 investment over ten
years’ AEX comparison based on 30-trading-day average values.
The Committee has decided to show Unilever’s performance against the FTSE 100 Index, London and also the Euronext 100 index (AEX), Amsterdam as these are the most
relevant indices in the UK and the Netherlands where we have our principal listings. Unilever is a constituent of both these indices.
The table below shows the ten-year history of the CEO single figure of total remuneration:
2009
2010
2011
2012
2013
2014
2015
2016
2017
2018
CEO
Single figure of total remuneration (€‘000)
3,859
6,292
6,010
7,852
7,740
9,561
10,296
8,370
11,661
11,726
Annual bonus award rates against maximum opportunity
82
%
80
%
68
%
100
%
78
%
66
%
92
%
92
%
100
%
51%
GSIP performance shares vesting rates against maximum opportunity
n/a
47
%
44
%
55
%
64
%
61
%
49
%
35
%
74
%
66%
MCIP matching shares vesting rates against maximum opportunity
n/a
n/a
n/a
n/a
n/a
81
%
65
%
47
%
99
%
88%
Share Matching Plan vesting rates against maximum opportunity(a)
100
%
100
%
n/a
n/a
n/a
n/a
n/a
n/a
n/a
n/a
(a)
Shown in year of award.
PERCENTAGE CHANGE IN REMUNERATION OF EXECUTIVE DIRECTORS (CEO/CFO)
The table below shows the percentage change from 2017 to 2018 for Fixed Pay, other benefits (excluding pension) and bonus for the CEO, CFO and all UK and Dutch management
in Unilever. The subset of UK and Dutch management has been used as a fair representation of our dual listing status.
% change from 2017 to 2018
Fixed Pay
Bonus
Other benefits (not including pension)
CEO(a)(b)
11.3%
-16.5%
-19.2%
CFO(a)(c)
8.2%
-10.5%
8.3%
UK and Dutch
management(d)
8.0%
4.9%
-0.2%
(a)
Calculated using the data from the Executive Directors’ single figure table on page 54 (for information on exchange
rates please see the footnotes in that table).
(b)
The CEO Fixed Pay and other benefits figures reflect the implementation of our new Reward Framework in 2018, including the
consolidation of conditional supplemental pension accrual into Fixed Pay from the 2018 AGMs, and changes in the relevant sterling:euro exchange rates. The reduction in benefits value is also due to variations in charges for social security and tax
return preparation fees, both of which decreased in 2018.
(c)
The increase in Fixed Pay shown for the CFO reflects the implementation of our new Reward Framework in 2018, including a
5% increase in Fixed Pay with effect from the 2018 AGMs, and changes in the relevant sterling:euro exchange rates. The increase in benefits value is due to an increase in private medical insurance costs.
(d)
For the UK and Dutch management population, Fixed Pay numbers have been restated to include cash-related benefits
employees receive as part of their total compensation, to ensure we can accurately compare Fixed Pay for the management population against that of the CEO and CFO. Figures are also affected by changes in the average sterling:euro exchange rates for
2017 and 2018, as well as a lower bonus performance ratio in 2018 compared to 2017.
EXECUTIVE DIRECTORS (CEO/CFO) PAY
RATIO COMPARISON
The table below shows how pay for the CEO compares to our UK employees at the 25th percentile, median and 75th percentile.
Year
25th Percentile
Median Percentile
75th Percentile
Mean Pay Ratio
Year ending 31 December 2018
Salary:
£28,804
£37,000
£50,021
Pay and benefits
(excluding pension):
£34,400
£41,443
£57,800
Pay ratio (Option A):
301
250
179
147
Figures for the CEO are calculated using the data from the Executive Directors’ single figure table on page 54 (where relevant,
translated into pounds using the average exchange rate over 2018 (€1 = £0.8835)).
Option A was used to
calculate the pay and benefits (excluding pension) of the 25th percentile, median and 75th percentile UK employees because the data was readily available for all UK employees of the group and Option A is the most accurate method (as it is based on
total full-time equivalent total reward for all UK employees for the relevant financial year). Figures are calculated by reference to 31 December 2018, and the respective salary and pay and benefits (excluding pension) figures for each quartile
are set out in the table above. Full-time equivalent figures are calculated on a pro-rated basis.
Annual bonus and long-term
incentives (GSIP and MCIP) were not calculated following the statutory method for single-figure pay. Instead, variable pay figures were calculated using:
•
target annual bonus values multiplied by the actual bonus performance ratio for the respective year (so disregarding
personal performance multipliers, which equal out across the population as a whole);
•
target GSIP values (multiplied by the actual GSIP performance ratio for the respective year, based on closing share prices
on the vesting date); and
•
MCIP values calculated at an appropriate average for the relevant Work Level of employees, ie an average 45% investment of
bonus for WL3 employees; 60% for WL4-5 employees (with vesting again at actual MCIP performance ratio, based on closing share prices on the vesting date); and for WL6, based on actual variable pay awards and
corresponding vesting rates.
The reason for this is it would be unduly onerous to recalculate these figures when, based on a sample, the impact of
such recalculation is expected to be limited.
We expect to report on trends in these figures and links to wider pay, reward and progression policies in future years
in line with relevant reporting requirements.
The table below provides a more detailed breakdown of the fixed and variable pay elements for each of our UK and Dutch Work Levels, showing how each Work Level compares
to the CEO and CFO in 2018 (with equivalent figures from 2017 included for comparison purposes).
Figures for the CEO and CFO are calculated using the data from the Executive Directors’ single figure table on page 54.
Accordingly, the year-on-year comparison reflects the implementation of our new Reward Framework for Executive Directors in May 2018, and so is impacted by both mid-year structural change and ongoing fluctuation in the exchanges rates used to convert pay elements denominated in pounds sterling to euros for reporting purposes.
For our other Work Levels, variable pay figures are calculated on the basis set out in the preceding paragraphs. Fixed Pay figures reflect all elements of pay (including
allowances) and benefits paid in cash, but exclude pensions. This year, we have also expanded the table to include data for our WL1 (non-management) staff in the UK and Netherlands.
Changes in pay ratios between 2017 and 2018 reflect a lower bonus performance ratio in 2018 (90%, compared to 122% in 2017), and lower GSIP and MCIP vesting outcomes
(which play an increasing part in total reward from WL3 upwards, particularly with the introduction of the new Reward Framework for our WL4-6 employees in 2017 and our WL3 employees in 2018, with an invitation
to participate in MCIP extended to WL2 employees in 2018 as well). Year-on-year comparisons also reflect changes in the average sterling:euro exchange rates for 2017 and
2018; where relevant, amounts for 2018 have been translated using the average exchange rate over 2018 (€1 = £0.8835), and amounts for 2017 have been translated using the average exchange
rate over 2017 (€1 = £0.8756).
RELATIVE IMPORTANCE OF SPEND ON PAY
The chart below shows the relative spend on pay compared with dividends paid to Unilever shareholders and underlying earnings. Underlying earnings
represent the underlying profit attributable to Unilever shareholders, adjusted to eliminate various items, and provides a good reference point to compare spend on pay.
*
In calculating underlying profit attributable to shareholders’ equity, net profit attributable to shareholders’
equity is adjusted to eliminate the post-tax impact of non-underlying items in operating profit and any other significant unusual terms within net profit but not
operating profit (see note 7 on page 96 for details).
The Committee’s
membership was further refreshed in 2018. Vittorio Colao, Marijn Dekkers and Mary Ma served throughout this period, with Vittorio Colao being appointed Chair on 3 May 2018, upon Ann Fudge’s retirement; Andrea Jung joined the Committee on
the same date.
The Committee reviewed its terms of reference during the year. The Committee’s revised terms of reference are contained within ‘The
Governance of Unilever’, and are also set out on our website.
As part of the Board evaluation carried out in 2018, the Boards evaluated the performance of the Committee. The Committee also carried out
an assessment of its own performance in 2018. While overall the Committee members concluded that the Committee is performing effectively, the Committee has agreed to further enhance its effectiveness by monitoring the responsiveness of the Reward
Framework to rapidly evolving market conditions and adding a finance briefing session on the continued appropriateness of performance measures for incentive plans.
ADVISERS
While it is the Committee’s responsibility to exercise independent judgement, the Committee does request advice from
management and professional advisers, as appropriate, to ensure that its decisions are fully informed given the internal and external environment.
Tom Gosling of
PricewaterhouseCoopers (PwC) provided the Committee with independent advice on various matters it considered. During 2018, the wider PwC firm has also provided tax and consultancy services to Unilever including tax compliance, transfer pricing,
other tax-related services, contract compliance reviews, internal audit advice and secondees, third-party risk and compliance advice, cyber security advice, sustainability assurance and consulting; PwC has
also been assisting with financial due diligence on M&A transactions undertaken by the Unilever Group. PwC is a member of the Remuneration Consultants Group and, as such, voluntarily operates under the code of conduct in relation to executive
remuneration consulting in the UK, which is available online.
www.remunerationconsultantsgroup.com (Code of Conduct: Executive Remuneration Consulting)
The Committee is satisfied that the PwC engagement partner and team, which provide remuneration advice to the Committee, do not have
connections with Unilever N.V. or Unilever PLC that might impair their independence. The Committee reviewed the potential for conflicts of interest and judged that there were appropriate safeguards against such conflicts. The fees paid to PwC in
relation to advice provided to the Committee in the year to 31 December 2018 were £146,650. This figure is calculated based on time spent and expenses incurred for the majority of advice provided, but on occasion for specific projects a
fixed fee may be agreed.
During the year, the Committee also sought input from the CEO (Paul Polman), the Chief Human Resources Officer (Leena Nair) and the EVP
Global Head of Reward (Peter Newhouse) on various subjects including the remuneration of senior management. No individual Executive Director was present when their own remuneration was being determined to ensure a conflict of interest did not arise,
although the Committee has separately sought and obtained Executive Directors’ own views when determining the amount and structure of their remuneration before recommending individual packages to the Boards for approval. The Committee also
received legal and governance advice from the Chief Legal Officer and Group Secretary (Ritva Sotamaa) and the General Counsel – Executive Remuneration & Employment (Margot Fransen).
SHAREHOLDER VOTING
Unilever remains committed to
ongoing shareholder dialogue and takes an active interest in voting outcomes. In the event of a substantial vote against a resolution in relation to Directors’ remuneration, Unilever would seek to understand the reasons for any such vote and
would set out in the following Annual Report and Accounts any actions in response to it (as set out in the Letter from the Chair on page 50 in relation to our further engagement with shareholders following last year’s voting on our Remuneration
Policy). The following table sets out actual voting in respect of our previous report:
18,758,929 votes were withheld (approximately 2.09% of share capital represented on 2 May 2018).
(b)
38,734,868 votes were withheld (approximately 4.31% of share capital represented on 2 May 2018).
(c)
15,018,135 votes were withheld (approximately 1.03% of share capital represented on 3 May 2018).
The Directors’ Remuneration Report is not subject to a shareholder vote in the Netherlands. It has been approved by the Boards, and signed on
their behalf by Ritva Sotamaa, Chief Legal Officer and Group Secretary.
The Directors
are required by Part 9 of Book 2 of the Civil Code in the Netherlands and by the UK Companies Act 2006 to prepare accounts for each financial year which give a true and fair view of the state of affairs of the Unilever Group, and the NV and PLC
entities, as at the end of the financial year and of the profit or loss and cash flows for that year.
The Directors consider that, in preparing the accounts, the
Group and the NV and PLC entities have used the most appropriate accounting policies, consistently applied and supported by reasonable and prudent judgements and estimates, and that all International Financial Reporting Standards as adopted by the
EU and as issued by the International Accounting Standards Board (in the case of the consolidated financial statements), Financial Reporting Standard 101 ‘Reduced Disclosure Framework’ (FRS 101) and Dutch law (in the case of the NV parent
company accounts) which they consider to be applicable have been followed.
The Directors have responsibility for ensuring that NV and PLC keep accounting records
which disclose with reasonable accuracy their financial position and which enable the Directors to ensure that the accounts comply with the relevant legislation. They also have a general responsibility for taking such steps as are reasonably open to
them to safeguard the assets of the Group, and to prevent and detect fraud and other irregularities.
This statement, which should be read in conjunction with the
Independent Auditors’ reports, is made with a view to distinguishing for shareholders the respective responsibilities of the Directors and of the auditors in relation to the accounts.
A copy of the financial statements of the Unilever Group is placed on our website at www.unilever.com/investorrelations. The maintenance and integrity of the website are
the responsibility of the Directors, and the work carried out by the auditors does not involve consideration of these matters. Accordingly, the auditors accept no responsibility for any changes that may have occurred to the financial statements
since they were initially placed on the website. Legislation in the UK and the Netherlands governing the preparation and dissemination of financial statements may differ from legislation in other jurisdictions.
INDEPENDENT AUDITORS AND DISCLOSURE OF INFORMATION TO AUDITORS
UK law sets out
additional responsibilities for the Directors of PLC regarding disclosure of information to auditors. To the best of each of the Directors’ knowledge and belief, and having made appropriate enquiries, all information relevant to enabling the
auditors to provide their opinions on PLC’s consolidated and parent company accounts has been provided. Each of the Directors has taken all reasonable steps to ensure their awareness of any relevant audit information and to establish that
Unilever PLC’s auditors are aware of any such information.
DIRECTORS’ RESPONSIBILITY STATEMENT
Each of the Directors confirms that, to the best of his or her knowledge:
•
The Unilever Annual Report and Accounts 2018, taken as a whole, is fair, balanced and understandable, and provides the information necessary for shareholders to assess the Group’s position and performance, business
model and strategy;
•
The financial statements which have been prepared in accordance with International Financial Reporting Standards as adopted by the EU and as issued by the International Accounting Standards Board (in the case of the
consolidated financial statements) and Financial Reporting Standard 101 ‘Reduced Disclosure Framework’ (FRS 101) and UK accounting standards and Part 9 of Book 2 of the Dutch Civil Code (in the case of the NV parent company accounts), give
a true and fair view of the assets, liabilities, financial position and profit or loss of the Group and the undertakings included in the consolidation taken as a whole; and
•
The Strategic Report includes a fair review of the development and performance of the business and the position of the Group and the undertakings included in the consolidation taken as a whole, together with a
description of the principal risks and uncertainties that they face.
The Directors and their roles are listed on pages 3 and 36.
GOING CONCERN
The activities of the Group, together with the factors likely to
affect its future development, performance, the financial position of the Group, its cash flows, liquidity position and borrowing facilities are described on pages 1 to 26. In addition, we describe in notes 15 to 18 on pages 104 to 120 the
Group’s objectives, policies and processes for managing its capital; its financial risk management objectives; details of its financial instruments and hedging activities and its exposures to credit and liquidity risk. Although not assessed
over the same period as going concern, the viability of the Group has been assessed on page 28.
The Group has considerable financial resources together with
established business relationships with many customers and suppliers in countries throughout the world. As a consequence, the Directors believe that the Group is well placed to manage its business risks successfully despite the current uncertain
outlook.
After making enquiries, the Directors consider it appropriate to adopt the going concern basis of accounting in preparing this Annual Report and Accounts.
INTERNAL AND DISCLOSURE CONTROLS AND PROCEDURES
Please refer to pages 28
and 29 for a discussion of Unilever’s principal risk factors and to pages 29 to 33 for commentary on the Group’s approach to risk management and control.
REPORT OF INDEPENDENT REGISTERED PUBLIC ACCOUNTING FIRMS
To the Shareholders and Board of Directors
Unilever N.V. and Unilever PLC:
OPINIONS ON THE CONSOLIDATED FINANCIAL STATEMENTS AND INTERNAL CONTROL OVER FINANCIAL REPORTING
We have audited the accompanying consolidated balance sheets of the Unilever Group (Unilever N.V. and Unilever PLC, together with their subsidiaries) as of
31 December 2018 and 2017, the related consolidated income statements, consolidated statements of comprehensive income, consolidated statements of changes in equity, and consolidated cash flow statements for each of the years in the three-year
period ended 31 December 2018, and the related notes on pages 75 to 127 of the Unilever Group’s Annual Report (excluding note 25 on page 126) and the Guarantor financial information included in the Guarantor Statements on pages 158 to 162
of this Form 20-F (hereafter referred to as Consolidated Financial Statements). We also have audited the Unilever Group’s internal control over financial reporting as of 31 December 2018, based on
criteria established in Internal Control – Integrated Framework (2013) issued by the Committee of Sponsoring Organizations of the Treadway Commission.
In
our opinion, the Consolidated Financial Statements referred to above present fairly, in all material respects, the financial position of the Unilever Group as of 31 December 2018 and 2017, and the results of its operations and its cash flows
for each of the years in the three-year period ended 31 December 2018, in conformity with International Financial Reporting Standards (IFRS) as issued by the International Accounting Standards Board and in conformity with IFRS as adopted by the
European Union. Also in our opinion, the Unilever Group maintained, in all material respects, effective internal control over financial reporting as of 31 December 2018, based on criteria established in Internal Control – Integrated
Framework (2013) issued by the Committee of Sponsoring Organizations of the Treadway Commission.
The Unilever Group acquired Adityaa Milk, Equilibra, Betty Ice,
Denny Ice and Vegetarian Butcher on 27 September 2018, 1 October 2018,
1 November 2018, 3 December 2018 and 31 December 2018, respectively,
and management excluded from its assessment of the effectiveness of the Unilever Group’s internal control over financial reporting as of 31 December 2018, Adityaa Milk, Equilibra, Betty Ice, Denny Ice and Vegetarian Butcher’s internal
control over financial reporting associated with approximately 0.5% of the Unilever Group’s total assets and approximately 0.02% of the Unilever Group’s turnover included in the Consolidated Financial Statements of the Unilever Group as of
and for the year ended 31 December 2018. Our audit of internal control over financial reporting of the Unilever Group also excluded an evaluation of the internal control over financial reporting of Adityaa Milk, Equilibra, Betty Ice, Denny Ice
and Vegetarian Butcher.
BASIS FOR OPINIONS
The Unilever Group’s
management is responsible for these Consolidated Financial Statements, for maintaining effective internal control over financial reporting, and for its assessment of the effectiveness of internal control over financial reporting, included in the
accompanying Management’s Report on Internal Control over Financial Reporting included on page 156 of this Form 20-F. Our responsibility is to express an opinion on the Unilever Group’s Consolidated
Financial Statements and an opinion on the Unilever Group’s internal control over financial reporting based on our audits. We are a public accounting firm registered with the Public Company Accounting Oversight Board (United States) (PCAOB) and
are required to be independent with respect to the Company in accordance with the U.S. federal securities laws and the applicable rules and regulations of the Securities and Exchange Commission and the PCAOB.
We conducted our audits in accordance with the standards of the PCAOB. Those standards require that we plan and perform the audits to obtain reasonable assurance about
whether the Consolidated Financial Statements are free of material misstatement, whether due to error or fraud, and whether effective internal control over financial reporting was maintained in all material respects.
Our audits of the Consolidated Financial Statements included performing procedures to assess the risks of material misstatement of the Consolidated Financial Statements,
whether due to error or fraud, and performing procedures that respond to those risks. Such procedures included examining, on a test basis, evidence regarding the amounts and disclosures in the Consolidated Financial Statements. Our audits also
included evaluating the accounting principles used and significant estimates made by management, as well as evaluating the overall presentation of the Consolidated Financial Statements. Our audit of internal control over financial reporting included
obtaining an understanding of internal control over financial reporting, assessing the risk that a material weakness exists, and testing and evaluating the design and operating effectiveness of internal control based on the assessed risk. Our audits
also included performing such other procedures as we considered necessary in the circumstances. We believe that our audits provide a reasonable basis for our opinions.
DEFINITION AND LIMITATIONS OF INTERNAL CONTROL OVER FINANCIAL REPORTING
A
company’s internal control over financial reporting is a process designed to provide reasonable assurance regarding the reliability of financial reporting and the preparation of financial statements for external purposes in accordance with
generally accepted accounting principles. A company’s internal control over financial reporting includes those policies and procedures that (1) pertain to the maintenance of records that, in reasonable detail, accurately and fairly reflect
the transactions and dispositions of the assets of the company; (2) provide reasonable assurance that transactions are recorded as necessary to permit preparation of financial statements in accordance with generally accepted accounting
principles, and that receipts and expenditures of the company are being made only in accordance with authorizations of management and directors of the company; and (3) provide reasonable assurance regarding prevention or timely detection of
unauthorized acquisition, use, or disposition of the company’s assets that could have a material effect on the financial statements.
Because of its inherent
limitations, internal control over financial reporting may not prevent or detect misstatements. Also, projections of any evaluation of effectiveness to future periods are subject to the risk that controls may become inadequate because of changes in
conditions, or that the degree of compliance with the policies or procedures may deteriorate.
/s/ KPMG LLP
/s/ KPMG Accountants N.V.
KPMG LLP
KPMG Accountants N.V.
London, United Kingdom
Amsterdam, the Netherlands
We have served as the Unilever Group’s auditors since 2014.
Net monetary gain/(loss) arising from hyperinflationary economies
1
122
–
–
Share of net profit/(loss) of joint ventures and associates
11
185
155
127
After crediting non-underlying items
3
32
–
–
Other income/(loss) from non-current investments and
associates
22
18
104
Profit before taxation
12,383
8,153
7,469
Taxation
6A
(2,575
)
(1,667
)
(1,922
)
After (charging)/crediting tax impact of non-underlying
items
3
(288
)
655
213
Net profit
9,808
6,486
5,547
Attributable to:
Non-controlling interests
419
433
363
Shareholders’ equity
9,389
6,053
5,184
Combined earnings per share
7
Basic earnings per share (€)
3.50
2.16
1.83
Diluted earnings per share (€)
3.48
2.15
1.82
CONSOLIDATED STATEMENT OF COMPREHENSIVE INCOME
for
the year ended 31 December
Notes
€ million
2018
€ million
2017
€ million
2016
Net profit
9,808
6,486
5,547
Other comprehensive income
6C
Items that will not be reclassified to profit or loss, net of tax:
Gains/(losses) on equity instruments measured at fair value through other comprehensive income(a)
51
–
–
Remeasurement of defined benefit pension plans
15B
(328
)
1,282
(980
)
Items that may be reclassified subsequently to profit or loss, net of tax:
Gains/(losses) on cash flow hedges
(55
)
(68
)
–
Currency retranslation gains/(losses)
15B
(861
)
(983
)
217
Fair value gains/(losses) on financial instruments(a)
15B
–
(7
)
(15
)
Total comprehensive income
8,615
6,710
4,769
Attributable to:
Non-controlling interests
407
381
374
Shareholders’ equity
8,208
6,329
4,395
(a)
Classification has changed following adoption of IFRS 9. See note 1 for further details.
References in the consolidated income statement, consolidated statement of comprehensive income, consolidated statement of changes in equity, consolidated balance sheet
and consolidated cash flow statement relate to notes on pages 79 to 127, which form an integral part of the consolidated financial statements.
Fair value gains/(losses) on financial instruments(a)
–
–
(15
)
–
(15
)
–
(15
)
Remeasurement of defined benefit pension plans net of tax
–
–
–
(980
)
(980
)
–
(980
)
Currency retranslation gains/(losses)
–
–
189
17
206
11
217
Total comprehensive income
–
–
174
4,221
4,395
374
4,769
Dividends on ordinary capital
–
–
–
(3,600
)
(3,600
)
–
(3,600
)
Movements in treasury shares(d)
–
–
(45
)
(213
)
(258
)
–
(258
)
Share-based payment credit(e)
–
–
–
198
198
–
198
Dividends paid to non-controlling interests
–
–
–
–
–
(364
)
(364
)
Currency retranslation gains/(losses) net of tax
–
(18
)
–
–
(18
)
–
(18
)
Other movements in equity
–
–
244
(46
)
198
(27
)
171
31 December 2016
484
134
(7,443
)
23,179
16,354
626
16,980
Profit or loss for the period
–
–
–
6,053
6,053
433
6,486
Other comprehensive income net of tax:
Fair value gains/(losses) on financial instruments(a)
–
–
(76
)
–
(76
)
1
(75
)
Remeasurement of defined benefit pension plans net of tax
–
–
–
1,282
1,282
–
1,282
Currency retranslation gains/(losses)
–
–
(903
)
(27
)
(930
)
(53
)
(983
)
Total comprehensive income
–
–
(979
)
7,308
6,329
381
6,710
Dividends on ordinary capital
–
–
–
(3,916
)
(3,916
)
–
(3,916
)
Repurchase of shares(b)
–
–
(5,014
)
–
(5,014
)
–
(5,014
)
Other movements in treasury shares(d)
–
–
(30
)
(174
)
(204
)
–
(204
)
Share-based payment credit(e)
–
–
–
284
284
–
284
Dividends paid to non-controlling interests
–
–
–
–
–
(345
)
(345
)
Currency retranslation gains/(losses) net of tax
–
(4
)
–
–
(4
)
–
(4
)
Other movements in equity
–
–
(167
)
(33
)
(200
)
96
(104
)
31 December 2017
484
130
(13,633
)
26,648
13,629
758
14,387
Hyperinflation restatement to 1 January 2018 (see note 1)
–
–
–
393
393
–
393
1 January 2018 after restatement
484
130
(13,633
)
27,041
14,022
758
14,780
Profit or loss for the period
–
–
–
9,389
9,389
419
9,808
Other comprehensive income, net of tax:
Gains/(losses) on:(a)
Equity instruments
–
–
51
–
51
–
51
Cash flow hedges
–
–
(56
)
–
(56
)
1
(55
)
Remeasurement of defined benefit pension plans
–
–
–
(330
)
(330
)
2
(328
)
Currency retranslation gains/(losses)
–
–
(836
)
(10
)
(846
)
(15
)
(861
)
Total comprehensive income
–
–
(841
)
9,049
8,208
407
8,615
Dividends on ordinary capital
–
–
–
(4,081
)
(4,081
)
–
(4,081
)
Repurchase of shares(b)
–
–
(6,020
)
–
(6,020
)
–
(6,020
)
Cancellation of treasury shares(c)
(20
)
–
5,069
(5,049
)
–
–
–
Other movements in treasury shares(d)
–
–
(8
)
(245
)
(253
)
–
(253
)
Share-based payment credit(e)
–
–
–
196
196
–
196
Dividends paid to non-controlling interests
–
–
–
–
–
(342
)
(342
)
Currency retranslation gains/(losses) net of tax
–
(1
)
–
–
(1
)
–
(1
)
Hedging gain/(loss) transferred to non-financial assets
–
–
71
–
71
–
71
Other movements in equity(f)
–
–
76
(646
)
(570
)
(103
)
(673
)
31 December 2018
464
129
(15,286
)
26,265
11,572
720
12,292
(a)
Classification in 2018 has changed following adoption of IFRS 9. See note 1 for further details.
(b)
Repurchase of shares reflects the cost of acquiring ordinary shares as part of the share buyback programmes announced on
19 April 2018 and 6 April 2017.
(c)
During 2018 122,965,077 PLC ordinary shares were cancelled. The amount paid to repurchase these shares was initially
recognised in other reserves and is transferred to retained profit on cancellation.
(d)
Includes purchases and sales of treasury shares other than the share buyback programme, transfer from treasury shares to
retained profit of share-settled schemes arising from prior years and differences between exercise and grant price of share options.
(e)
The share-based payment credit relates to the non-cash charge recorded in operating profit in respect of the fair value of
share options and awards granted to employees.
(f)
Includes a €662 million premium paid for purchase of the
non-controlling interest in Unilever South Africa from Remgro.
Share of net profit of joint ventures/associates and other income/(loss) from
non-current investments and associates
(207
)
(173
)
(231
)
Net monetary gain arising from hyperinflationary economies
(122
)
–
–
Net finance costs
5
481
877
563
Operating profit
12,535
8,857
7,801
Depreciation, amortisation and impairment
1,747
1,538
1,464
Changes in working capital:
(793
)
(68
)
51
Inventories
(471
)
(104
)
190
Trade and other receivables
(1,298
)
(506
)
142
Trade payables and other liabilities
976
542
(281
)
Pensions and similar obligations less payments
(128
)
(904
)
(327
)
Provisions less payments
55
200
65
Elimination of (profits)/losses on disposals
(4,299
)
(298
)
127
Non-cash charge for share-based compensation
196
284
198
Other adjustments(a)
(266
)
(153
)
(81
)
Cash flow from operating activities
9,047
9,456
9,298
Income tax paid
(2,294
)
(2,164
)
(2,251
)
Net cash flow from operating activities
6,753
7,292
7,047
Interest received
110
154
105
Purchase of intangible assets
(203
)
(158
)
(232
)
Purchase of property, plant and equipment
(1,329
)
(1,509
)
(1,804
)
Disposal of property, plant and equipment
108
46
158
Acquisition of group companies, joint ventures and associates
(1,336
)
(4,896
)
(1,731
)
Disposal of group companies, joint ventures and associates
7,093
561
30
Acquisition of other non-current investments
(94
)
(317
)
(208
)
Disposal of other non-current investments
151
251
173
Dividends from joint ventures, associates and other non-current
investments
154
138
186
(Purchase)/sale of financial assets
(10
)
(149
)
135
Net cash flow (used in)/from investing activities
4,644
(5,879
)
(3,188
)
Dividends paid on ordinary share capital
(4,066
)
(3,916
)
(3,609
)
Interest and preference dividends paid
(477
)
(470
)
(472
)
Net change in short-term borrowings
(4,026
)
2,695
258
Additional financial liabilities
10,595
8,851
6,761
Repayment of financial liabilities
(6,594
)
(2,604
)
(5,213
)
Capital element of finance lease rental payments
(10
)
(14
)
(35
)
Buyback of preference shares
–
(448
)
–
Repurchase of shares
24
(6,020
)
(5,014
)
–
Other movements on treasury shares
(257
)
(204
)
(257
)
Other financing activities
(693
)
(309
)
(506
)
Net cash flow (used in)/from financing activities
(11,548
)
(1,433
)
(3,073
)
Net increase/(decrease) in cash and cash equivalents
(151
)
(20
)
786
Cash and cash equivalents at the beginning of the year
3,169
3,198
2,128
Effect of foreign exchange rate changes
72
(9
)
284
Cash and cash equivalents at the end of the year
17A
3,090
3,169
3,198
(a)
2018 includes a non-cash credit of
€277 million from early settlement of contingent consideration relating to Blueair.
The
cash flows of pension funds (other than contributions and other direct payments made by the Group in respect of pensions and similar obligations) are not included in the Group cash flow statement.
The accounting policies adopted are the same as those which were applied for the previous financial year, except as set out
below under the heading ‘Recent accounting developments’.
UNILEVER
The two parent companies, NV and PLC, together with their group companies, operate as a single economic entity (the Unilever Group, also referred to as Unilever or the
Group). NV and PLC have the same Directors and are linked by a series of agreements, including an Equalisation Agreement, which are designed so that the positions of the shareholders of both companies are as closely as possible the same as if they
held shares in a single company.
The Equalisation Agreement provides that both companies adopt the same accounting principles. It also requires that dividends and
other rights and benefits attaching to each ordinary share of NV, be equal in value to those rights and benefits attaching to each ordinary share of PLC, as if each such unit of capital formed part of the ordinary share capital of one and the same
company.
BASIS OF CONSOLIDATION
Due to the operational and contractual
arrangements referred to above, NV and PLC form a single reporting entity for the purposes of presenting consolidated financial statements. Accordingly, the financial statements of Unilever are presented by both NV and PLC as their respective
consolidated financial statements. Group companies included in the consolidation are those companies controlled by NV or PLC. Control exists when the Group has the power to direct the activities of an entity so as to affect the return on investment.
The net assets and results of acquired businesses are included in the consolidated financial statements from their respective dates of acquisition, being the date on
which the Group obtains control. The results of disposed businesses are included in the consolidated financial statements up to their date of disposal, being the date control ceases.
Intra-group transactions and balances are eliminated.
COMPANIES LEGISLATION AND
ACCOUNTING STANDARDS
The consolidated financial statements have been prepared in accordance with International Financial Reporting Standards (IFRS) as adopted by
the European Union (EU) and IFRIC Interpretations. They are also in compliance with IFRS as issued by the International Accounting Standards Board (IASB).
These
financial statements are prepared under the historical cost convention unless otherwise indicated.
These financial statements have been prepared on a going concern
basis. Refer to the going concern statement on page 66.
ACCOUNTING POLICIES
Accounting policies are included in the relevant notes to the consolidated financial statements. These are presented as text highlighted in grey on pages 79 to 127. The
accounting policies below are applied throughout the financial statements.
FOREIGN CURRENCIES
The consolidated financial statements are presented in euros. The functional currencies of NV and PLC are euros and sterling respectively. Items included in the financial
statements of individual group companies are recorded in their respective functional currency which is the currency of the primary economic environment in which each entity operates.
Foreign currency transactions in individual group companies are translated into functional currency using exchange rates at the date of the transaction. Foreign exchange
gains and losses from settlement of these transactions, and from translation of monetary assets and liabilities at year-end exchange rates, are recognised in the income statement except when deferred in equity
as qualifying hedges.
In preparing the consolidated financial statements, the balances in individual group companies are translated from their functional currency
into euros. Apart from the financial statements of group companies in hyperinflationary economies (see below), the income
statement, the cash flow statement and all other movements in assets and liabilities are translated at average rates of
exchange as a proxy for the transaction rate, or at the transaction rate itself if more appropriate. Assets and liabilities are translated at year-end exchange rates.
The financial statements of group companies whose functional currency is the currency of a hyperinflationary economy are adjusted for inflation and then translated into
euros. Amounts shown for prior years for comparative purposes are not modified. To determine the existence of hyperinflation, the Group assesses the qualitative and quantitative characteristics of the economic environment of the country, such as the
cumulative inflation rate over the previous three years.
The ordinary share capital of NV and PLC is translated in accordance with the Equalisation Agreement. The
difference between the value for PLC and the value by applying the year-end rate of exchange is taken to other reserves (see note 15B on page 106).
The effect of exchange rate changes during the year on net assets of foreign operations is recorded in equity. For this purpose net assets include loans between group
companies and any related foreign exchange contracts where settlement is neither planned nor likely to occur in the foreseeable future.
The Group applies hedge
accounting to certain exchange differences arising between the functional currencies of a foreign operation and NV or PLC as appropriate, regardless of whether the net investment is held directly or through an intermediate parent. Differences
arising on retranslation of a financial liability designated as a foreign currency net investment hedge are recorded in equity to the extent that the hedge is effective. These differences are reported within profit or loss to the extent that the
hedge is ineffective.
Cumulative exchange differences arising since the date of transition to IFRS of 1 January 2004 are reported as a separate component of
other reserves. In the event of disposal or part disposal of an interest in a group company either through sale or as a result of a repayment of capital, the cumulative exchange difference is recognised in the income statement as part of the profit
or loss on disposal of group companies.
CLASSIFICATION OF ARGENTINA AS
A HYPER-INFLATIONARY ECONOMY
The Argentinian economy was designated as
hyperinflationary from
1 July 2018. As a result, application of IAS 29 ‘Financial Reporting in Hyperinflationary Economies’ has been applied to all
Unilever entities whose functional currency is the Argentinian Peso. IAS 29 requires that adjustments are applicable from the start of the relevant entity’s reporting period. For Unilever that is from 1 January 2018. The application of IAS
29 includes:
•
Adjustment of historical cost non-monetary assets and liabilities for the change in purchasing power caused by inflation from the date of initial recognition to the balance sheet
date;
•
Adjustment of the income statement for inflation during the reporting period;
•
The income statement is translated at the period end foreign exchange rate instead of an average rate; and
•
Adjustment of the income statement to reflect the impact of inflation and exchange rate movement on holding monetary assets and liabilities in local currency.
The main effects on the Group consolidated financial statements for 2018 are:
•
Total assets increased by €538 million driven by an increase of €369 million to goodwill (see note 9)
and €171 million due to property, plant and equipment (see note 10);
•
Opening retained profit increased by €393 million reflecting the impact of adjusting the historical cost of non-monetary
assets and liabilities from the date of their initial recognition to 1 January 2018 for the effect of inflation;
•
Turnover is reduced by €75 million;
•
Operating profit is reduced by €37 million; and
•
A net monetary gain of €122 million is recognised from the inflation and exchange rate movements in the year on the net monetary items held in Argentinian Peso.
The preparation of financial statements requires management to make judgements and estimates in the application of accounting policies that affect the reported amounts of
assets, liabilities, income and expenses. Actual results may differ from these estimates. Estimates and judgements are continuously evaluated and are based on historical experience and other factors, including expectations of future events that are
believed to be reasonable. Revisions to accounting estimates are recognised in the period in which the estimate is revised and in any future period affected.
The
following judgements are those that management believe have the most significant effect on the amounts recognised in the Group’s financial statements:
•
Separate presentation of items in the income statement – certain items of income or expense are presented separately as non-underlying items. These are excluded in several of
our performance measures, including underlying operating profit and underlying earnings per share due to their nature and/or frequency of occurrence. See note 3 for further details.
•
Utilisation of tax losses and recognition of other deferred tax assets – The Group operates in many countries and is subject to taxes in numerous jurisdictions. Management uses judgement to assess the
recoverability of tax assets such as whether there will be sufficient future taxable profits to utilise losses – see note 6B.
•
Likelihood of occurrence of provisions and contingent liabilities – events can occur where there is uncertainty over future obligations. Judgement is required to determine if an outflow of economic resources is
probable, or possible but not probable. Where it is probable, a liability is recognised and further judgement is used to determine the level of the provision. Where it is possible but not probable, further judgement is used to determine if the
likelihood is remote, in which case no disclosures
are provided; if the likelihood is not remote then judgement is used to determine the contingent liability disclosed. Unilever does not have provisions and contingent liabilities for the same
matters. External advice is obtained for any material cases. See notes 6A, 19 and 20.
The following estimates are those that management believe
have the most significant risk of causing a material adjustment to the carrying amounts of assets and liabilities within the next financial year are:
•
Measurement of defined benefit obligations – the valuations of the Group’s defined benefit pension plan obligations are dependent on a number of assumptions. These include discount rates, inflation and life
expectancy of scheme members. Details of these assumptions and sensitivities are in note 4B.
•
Assumptions used in discounted cash flow projections – estimates of future business performance, cash generation, long-term growth and discount rates are used in our assessment of impairment of assets at the
balance sheet date. Details of the estimates used in the impairment reviews for significant cash generating units are set out in note 9; no reasonably plausible changes in a key assumption would cause an impairment.
•
Measurement of consideration and assets and liabilities acquired as part of business combinations – contingent consideration depends on an acquired business achieving targets within a fixed period. Estimates of
future performance are required to calculate the obligations at the time of acquisition and at each subsequent reporting date. See note 21 for further information. Additionally, estimates are required to value the assets and liabilities acquired in
business combinations. Intangible assets such as brands are commonly a core part of an acquired business as they allow us to obtain more value than would otherwise be possible.
RECENT ACCOUNTING DEVELOPMENTS
ADOPTED BY THE GROUP
The Group applied for the first-time amendments to the following standards from 1 January 2018.
APPLICABLE
STANDARD
KEY REQUIREMENTS
IMPACT ON GROUP
IFRS 9
‘Financial Instruments’
This standard introduces new requirements in three areas:
Classification and measurement:
Financial assets are now classified based on
1) the objective of the Group in holding the asset and
2) the contractual cash flows.
Impairment:
A new expected credit loss model is used for calculating impairment
on financial assets. A loss event does not have to occur before credit losses are recognised.
Hedge accounting:
New general hedge accounting requirements allow hedge
accounting based on the Group’s risk management policies rather than only prescribed scenarios.
On 1 January 2018, the Group adopted IFRS 9 ‘Financial Instruments’, which replaced IAS 39 ‘Financial Instruments – Recognition and
Measurement’. As there was no material impact from the adoption of this standard, the Group has not restated the comparative information relating to prior years.
Classification and measurement:
On 1 January 2018, the Group reclassified
its financial assets to the new categories based on the Group’s reason for holding the assets and the nature of the cash flows from the assets. See note 17A for further information. There were no changes to the classification or measurement of
the Group’s financial liabilities.
Impairment:
From 1 January 2018, the Group implemented an expected credit loss impairment model for financial assets. For trade receivables, the calculation methodology has been
updated to consider expected losses based on ageing profile. The adoption of the expected loss approach has not resulted in a material change in impairment provision for any financial asset.
Hedge accounting:
The Group applied the hedge accounting requirements of IFRS 9 prospectively. At the date of initial application all of the Group’s existing hedge relationships were
eligible to be treated as continuing hedge relationships.
The
standard clarifies the accounting for bundled services and identifying each ‘performance obligation’ in contractual arrangements. It also provides more guidance on the measurement of revenue contracts which have discounts, rebates,
payments to suppliers and consignment stock.
On 1 January 2018 the Group adopted IFRS 15 ‘Revenue from Contracts with Customers’ with no impact as the accounting policies were already in line with the
new standard.
All other standards or amendments to standards that have been issued by the IASB and were effective by 1 January 2018 were not
applicable to Unilever.
NEW STANDARDS, AMENDMENTS AND INTERPRETATIONS OF EXISTING STANDARDS THAT ARE NOT YET EFFECTIVE AND HAVE NOT BEEN
EARLY ADOPTED BY THE GROUP
The following new standards have been released but are not yet adopted by the Group. The expected impact and progress is shown
below.
APPLICABLE
STANDARD
KEY REQUIREMENTS OR CHANGES IN ACCOUNTING POLICY
IMPLEMENTATION PROGRESS AND EXPECTED IMPACT
IFRS 16 ‘Leases’
Effective from the year ended 31 December 2019
The standard has been endorsed by the EU
This standard changes the recognition, measurement, presentation and disclosure of leases. In particular it requires lessees to record all leases on the balance sheet
with exemptions available for low value and short-term leases. At the commencement of a lease, a lessee will recognise lease payments (lease liability) and an asset representing the right to use the asset during the lease term (right-of-use asset). Lessees will subsequently reduce the lease liability when paid and recognise depreciation on the right-of-use asset.
A lease liability is remeasured
upon the occurrence of certain events such as a change in the lease term or a change in an index or rate used to determine lease payments. The remeasurement normally also adjusts the
right-of-use asset.
The standard has no impact on the actual cash flows of a group. However the standard requires the capitalisation, and subsequent depreciation, of costs that are currently
expensed as paid which impacts disclosures of cash flows within the cash flow statement. The amounts currently expensed as operating cash outflows which will instead be capitalised are presented as financing cash outflows.
The preparations for this standard are substantially complete. The Group intends on adopting the ‘full retrospective’ approach and in our 2019 reporting the
comparative information relating to prior years will be restated.
The Group has reviewed all
relevant contracts to identify leases. This review included an assessment about whether the contract depends on a specific asset, whether the Group obtains substantially all the economic benefits from the use of that asset and whether the Group has
the right to direct the use of that asset. Based on this assessment, we calculated the restatement impact as at the transition date. From 1 January 2019 the Group will focus on ensuring that the revised process for identifying and accounting
for leases is followed.
The Group intends to use the exemptions provided by IFRS 16 for
short-term leases (less than a year) and leases for low-value assets.
The estimated impact of IFRS 16 on the Group’s financial statements at 31 December 2018 is as follows:
Balance sheet:
The Group estimates that the adoption of IFRS 16 will result in an increase in total assets of approximately
€1.7 billion, split between land and buildings of €1.3 billion and plant and machinery of
€0.4 billion.
Based on the
geographies, this is approximately €0.5 billion in Europe, €0.5 billion in The Americas and
€0.7 billion in Asia/AMET/ RUB.
Financial liabilities are expected to increase by approximately €1.9 billion.
Income statement:
The Group estimates that the adoption of IFRS 16 will result in increased depreciation of approximately
€470 million from the right-of-use assets. This will offset the reduction in operating lease expenses of
around €550 million per year, resulting in an overall increase in operating profit of €80 million. Finance costs are expected to
increase by approximately €90 million per year due to the interest recognised on lease liabilities.
Statement of Cash Flows:
The Group estimates that the adoption of IFRS 16 will
increase cash flows from operating activities by approximately €550 million with a related increase in cash flows used in financing activities of
€550 million which relates to lease payments previously expensed as paid.
In addition to the above, based on an initial review the Group does not currently believe adoption of the following
standard/amendments will have a material impact on the consolidated results or financial position of the Group.
APPLICABLE
STANDARD
KEY REQUIREMENTS
OR CHANGES IN ACCOUNTING POLICY
IFRIC 23 ‘Uncertainty over income tax treatments’
Effective from the year ended 31 December 2019
The IFRIC Interpretation has been endorsed by the EU
This interpretation clarifies how entities should reflect uncertainties over income tax treatments, in particular when assessing the outcome a tax authority might reach
with full knowledge and information if it were to make an examination. Based on preliminary work, the impact is estimated to be immaterial.
IFRS 17 ‘Insurance Contracts’
Effective from the year ended 31 December 2021
The standard is not yet endorsed by the EU
This standard introduces a new model for accounting for insurance contracts. Work continues to review existing arrangements to determine the impact on adoption. Based on
preliminary work the impact is estimated to be immaterial.
Amendments to IAS 19 ‘Employee Benefits’
Effective from the year ended 31 December 2019
The standard is not yet endorsed by the EU
The change requires that following plan amendments, curtailments or settlements, current service and net interest costs for the remainder of the reporting period should
be calculated in line with updated actuarial assumptions. The amendment is to be applied prospectively.
All other standards or amendments to standards that have been issued by the IASB and are effective from 1 January 2019 onwards are
not applicable to Unilever.
2. SEGMENT INFORMATION
SEGMENTAL REPORTING
Beauty & Personal Care
–
primarily sales of skin care and hair care products, deodorants and oral care products.
Foods & Refreshment
–
primarily sales of soups, bouillons, sauces, snacks, mayonnaise, salad dressings, margarines and spreads, ice cream and tea-based beverages
Home Care
–
primarily sales of home care products, such as powders, liquids and capsules, soap bars and a wide range of cleaning products.
REVENUE
Turnover comprises sales of goods after the deduction of discounts, sales taxes and estimated returns. It does not include sales between
group companies. Discounts given by Unilever include rebates, price reductions and incentives given to customers, promotional couponing and trade communication costs. Accumulated experience is used to estimate the provision for discounts, using the
most likely amount method; revenue is only recognised to the extent that it is highly probable a significant reversal will not occur.
Turnover is recognised when control of the products being sold has transferred to our customer and when there are no longer any
unfulfilled obligations to the customer. This is generally on delivery to the customer but depending on individual customer terms, this can be at the time of dispatch, delivery or upon formal customer acceptance. This is considered the appropriate
point where the performance obligations in our contracts are satisfied as Unilever no longer have control over the inventory.
Our
customers have the contractual right to return goods only when authorised by Unilever. At 31 December 2018, an estimate has been made of goods that will be returned and a liability has been recognised for this amount. An asset has also been
recorded for the corresponding inventory that is estimated to return to Unilever using a best estimate based on accumulated experience.
Some of our customers are distributors who may be able to return unsold goods in consignment arrangements. A liability is recognised
where we receive payment from a customer before transferring control of the goods being sold.
UNDERLYING OPERATING PROFIT
Underlying operating profit means operating profit before the impact of
non-underlying items within operating profit (see note 3). Underlying operating profit represents our measure of segment profit or loss as it is the primary measure used for the purpose of making decisions
about allocating resources and assessing performance of segments. Underlying operating margin is calculated as underlying operating profit divided by turnover.
The Group has revised its operating segments to align with the new structure under which the business is managed. Beginning 2018, operating segment information is
provided based on three product areas: Beauty & Personal Care, Foods & Refreshment and Home Care.
Notes
€ million
Beauty &
Personal Care
€ million
Foods &
Refreshment
(a)
€ million
Home
Care
€ million
Total
2018
Turnover
20,624
20,227
10,131
50,982
Operating profit
4,130
7,245
1,160
12,535
Non-underlying items
3
378
(3,711
)
157
(3,176
)
Underlying operating profit
4,508
3,534
1,317
9,359
Share of net profit/(loss) of joint ventures and associates
(1
)
183
3
185
Significant non-cash charges:
Within underlying operating profit:
Depreciation and amortisation
510
773
256
1,539
Share-based compensation and other non-cash charges(b)
102
102
46
250
Within non-underlying items:
Impairment and other non-cash charges(c)
122
164
263
549
2017
Turnover
20,697
22,444
10,574
53,715
Operating profit
4,103
3,616
1,138
8,857
Non-underlying items
3
272
121
150
543
Underlying operating profit
4,375
3,737
1,288
9,400
Share of net profit/(loss) of joint ventures and associates
8
143
4
155
Significant non-cash charges:
Within underlying operating profit:
Depreciation and amortisation
488
802
248
1,538
Share-based compensation and other non-cash charges(b)
164
174
79
417
Within non-underlying items:
Impairment and other non-cash charges(c)
80
191
48
319
2016
Turnover
20,172
22,532
10,009
52,713
Operating profit
3,704
3,148
949
7,801
Non-underlying items
3
329
357
137
823
Underlying operating profit
4,033
3,505
1,086
8,624
Share of net profit/(loss) of joint ventures and associates
(5
)
131
1
127
Significant non-cash charges:
Within underlying operating profit:
Depreciation and amortisation
437
791
236
1,464
Share-based compensation and other non-cash charges(b)
134
135
86
355
Within non-underlying items:
Impairment and other non-cash charges(c)
74
124
45
243
(a)
Foods & Refreshment is reported together from 2018. For the prior year figures, Foods and Refreshment have been
combined to align with the current structure.
(b)
Other non-cash charges within underlying operating profit include movements in
provisions from underlying activities, excluding movements arising from non-underlying activities.
(c)
Other non-cash charges within
non-underlying items includes movements in restructuring provisions, movements in certain legal provisions (in 2018 and 2017), and foreign exchange losses resulting from remeasurement of the Argentinian
business (2016).
Transactions between the Unilever Group’s reportable segments are immaterial and are carried out on an arm’s length
basis.
The Unilever Group is not reliant on revenues from transactions with any single customer and does not receive 10% or more of its revenues from transactions
with any single customer.
Segment assets and liabilities are not provided because they are not reported to or reviewed by our chief operating decision-maker, which
is Unilever Leadership Executive (ULE) as explained in the Corporate Governance Section.
The home countries of the Unilever Group are the Netherlands and the United Kingdom. Turnover and non-current assets for these two countries combined, for the United States (being the largest country outside the home countries) and for all other countries are:
€ million
€ million
€ million
€ million
Netherlands/ United Kingdom
United
States
Others
Total
2018
Turnover
3,679
8,305
38,998
50,982
Non-current assets(d)
4,070
12,193
24,225
40,488
2017
Turnover
3,849
8,532
41,334
53,715
Non-current assets(d)
3,781
11,820
23,768
39,369
2016
Turnover
3,819
8,263
40,631
52,713
Non-current assets(d)
4,770
11,696
23,358
39,824
(d) Non-current assets excluding financial assets, deferred tax assets and pension assets for funded schemes in surplus.
No other country had turnover or non-current assets (as
shown above) greater than 10% of the Group total.
ADDITIONAL INFORMATION BY
GEOGRAPHIES
Although the Group’s operations are managed by product area, we provide additional information based on geographies. The analysis of turnover by
geographical area is stated on the basis of origin.
€ million
€ million
€ million
€ million
Asia/ AMET/RUB
(e)
The
Americas
Europe
Total
2018
Turnover
22,868
16,020
12,094
50,982
Operating profit
4,777
3,586
4,172
12,535
Non-underlying items
(437
)
(892
)
(1,847
)
(3,176
)
Underlying operating profit
4,340
2,694
2,325
9,359
Share of net profit/(loss) of joint ventures and
associates
–
114
71
185
2017
Turnover
23,266
17,525
12,924
53,715
Operating profit
3,802
3,086
1,969
8,857
Non-underlying items
306
(23
)
260
543
Underlying operating profit
4,108
3,063
2,229
9,400
Share of net profit/(loss) of joint ventures and
associates
12
112
31
155
2016
Turnover
22,445
17,105
13,163
52,713
Operating profit
3,275
2,504
2,022
7,801
Non-underlying items
254
401
168
823
Underlying operating profit
3,529
2,905
2,190
8,624
Share of net profit/(loss) of joint ventures and
associates
(2
)
108
21
127
(e)
Refers to Asia, Africa, Middle East, Turkey, Russia, Ukraine and Belarus.
Transactions between the Unilever Group’s geographical regions are immaterial and are carried out on an arm’s length basis.
Brand and marketing investment includes costs incurred for the purpose of building and maintaining brand equity and awareness. These
include media, advertising production, promotional materials and engagement with consumers. These costs are charged to the income statement as incurred.
RESEARCH AND DEVELOPMENT
Expenditure on research and development includes staff costs, material costs, depreciation of property, plant and equipment and other
costs directly attributable to research and product development activities. These costs are charged to the income statement as incurred, except for those development costs which meet the criteria for capitalisation - see note 9.
NON-UNDERLYING ITEMS
Non-underlying items are costs and revenues relating to gains and losses on business disposals,
acquisition and disposal-related costs, restructuring costs, impairments and other one-off items within operating profit, and other significant and unusual items within net profit but outside of operating
profit, which we collectively term non-underlying items due to their nature and/or frequency of occurrence. These items are significant in terms of nature and/or amount and are relevant to an understanding of
our financial performance.
Restructuring costs are charges associated with activities planned by management that
significantly change either the scope of the business or the manner in which it is conducted.
€ million
€ million
€ million
2018
2017
2016
Turnover
50,982
53,715
52,713
Cost of sales
(28,769
)
(30,547
)
(30,229
)
of which: Distribution costs
(3,098
)
(3,241
)
(3,246
)
Gross profit
22,213
23,168
22,484
Selling and administrative expenses
(9,678
)
(14,311
)
(14,683
)
of which: Brand and marketing investment
(7,164
)
(7,566
)
(7,731
)
Research and
development
(900
)
(900
)
(978
)
Operating profit
12,535
8,857
7,801
NON-UNDERLYING ITEMS
Non-underlying items are disclosed on the face of the income statement to provide additional information to users to help them
better understand underlying business performance.
€ million
€ million
€ million
2018
2017
2016
Non-underlying items within operating profit before tax
3176
(543
)
(823
)
Acquisition and disposal-related costs(a)
76
(159
)
(132
)
Gain/(loss) on disposal of group companies(b)
4,331
334
(95
)
Restructuring costs
(914
)
(638
)
(578
)
Impairments and other one-off items(c)
(317
)
(80
)
(18
)
Tax on non-underlying items within operating profit
(259
)
77
213
Non-underlying items
within operating profit after tax
2,917
(466
)
(610
)
Non-underlying items not in operating profit but within net profit
before tax
154
(382
)
–
Premium paid on buyback of preference shares
–
(382
)
–
Share of gain on disposal of Spreads business in Portugal JV
32
–
–
Net monetary gain arising from hyperinflationary economies
122
–
–
Tax impact of non-underlying items not in operating profit but within
net profit
(29
)
578
–
Tax on premium paid on buyback of preference shares (non deductible)
–
–
–
Impact of US tax reform(d)
(29
)
578
–
Non-underlying items not
in operating profit but within net profit after tax
125
196
–
Non-underlying items after tax(e)
3,042
(270
)
(610
)
Attributable to:
Non-controlling interest
18
(8
)
(9
)
Shareholders’ equity
3,024
(262
)
(601
)
(a)
2018 includes a credit of €277 million from early settlement of
contingent consideration relating to Blueair.
(b)
2018 includes a gain of €4,331 million on disposal of spreads
business. 2017 includes a gain of €309 million from the sale of AdeS soy beverage business in Latin America.
(c)
2018 includes a charge of €208 million relating to impairment
of Blueair intangible asset. Also included is a charge of €98 million for litigation matters comprised of €48 million for UK
pension obligations and €50 million for legal cases in relation to investigations by national competition authorities. 2017 includes an
€80 million charge for legal cases in relation to investigations by national competition authorities including those within Italy and South Africa. 2016 includes €18 million in foreign exchange losses resulting from remeasurement of the Argentinian business.
(d)
On 22 December 2017, HR1, formerly known as the Tax Cuts and Jobs Act was signed into law in the United States. As a
result, tax benefit of €578 million was recognised in 2017, primarily due to re-measurement of deferred tax assets and liabilities at the new lower
21% federal tax rate.
(e)
Non-underlying items after tax is calculated as
non-underlying items within operating profit after tax plus non-underlying items not in operating profit but within net profit after tax.
3. OPERATING COSTS AND NON-UNDERLYING ITEMS CONTINUED
OTHER
Other significant cost items within operating costs include:
€ million
€ million
€ million
Notes
2018
2017
2016
Staff costs
4A
(6,552
)
(6,712
)
(6,523
)
Raw and packaging materials and goods purchased for resale
(20,526
)
(21,579
)
(21,122
)
Amortisation of finite-life intangible assets and software
9
(348
)
(365
)
(310
)
Depreciation of property, plant and equipment
10
(1,191
)
(1,173
)
(1,154
)
Exchange gains/(losses):
(49
)
(214
)
(209
)
On underlying transactions
(116
)
(51
)
(28
)
On covering forward contracts
67
(163
)
(181
)
Lease rentals:
(556
)
(557
)
(531
)
Minimum operating lease payments
(568
)
(568
)
(536
)
Less: Sub-lease income relating to operating lease
agreements
12
11
5
4. EMPLOYEES
4A. STAFF AND MANAGEMENT COSTS
€ million
€ million
€ million
Staff costs
2018
2017
2016
Wages and salaries
(5,346
)
(5,416
)
(5,347
)
Social security costs
(571
)
(613
)
(606
)
Other pension costs
(439
)
(399
)
(372
)
Share-based compensation costs
(196
)
(284
)
(198
)
(6,552
)
(6,712
)
(6,523
)
‘000
‘000
‘000
Average number of employees during the year
2018
2017
2016
Asia/AMET/RUB
88
93
95
The Americas
40
41
42
Europe
30
31
32
158
165
169
€ million
€ million
€ million
Key management compensation
2018
2017
2016
Salaries and short-term employee benefits
(40
)
(34
)
(31
)
Post-employment benefits
–
–
(1
)
Share-based benefits(a)
(19
)
(20
)
(17
)
(59
)
(54
)
(49
)
Of which: Executive Directors
(15
)
(14
)
(13
)
Other(b)
(44
)
(40
)
(36
)
Non-Executive Directors’ fees
(2
)
(2
)
(2
)
(61
)
(56
)
(51
)
(a)
Share-based benefits are shown on a vesting basis.
(b)
Other includes all members of the Unilever Leadership Executive, other than Executive Directors.
Key management are defined as the members of Unilever Leadership Executive (ULE) and the Non-Executive Directors. Compensation for
the ULE includes the full-year compensation for ULE members who joined part way through the year.
For defined benefit plans, operating and finance costs are recognised separately in the income statement. The amount
charged to operating cost in the income statement is the cost of accruing pension benefits promised to employees over the year, plus the costs of individual events such as past service benefit changes, settlements and curtailments (such events are
recognised immediately in the income statement). The amount charged or credited to finance costs is a net interest expense calculated by applying the liability discount rate to the net defined benefit liability or asset. Any differences between the
expected interest on assets and the return actually achieved, and any changes in the liabilities over the year due to changes in assumptions or experience within the plans, are recognised immediately in the statement of comprehensive income.
The defined benefit plan surplus or deficit on the balance sheet comprises the total for each plan of the fair value of plan assets less
the present value of the defined benefit liabilities (using a discount rate based on high-quality corporate bonds, or a suitable alternative where there is no active corporate bond market).
All defined benefit plans are subject to regular actuarial review using the projected unit method, either by external consultants or by
actuaries employed by Unilever. The Group policy is that the most material plans, representing approximately 84% of the defined benefit liabilities, are formally valued every year. Other material plans, accounting for a further 12% of the
liabilities, have their liabilities updated each year. Group policy for the remaining plans requires a full actuarial valuation at least every three years. Asset values for all plans are updated every year.
For defined contribution plans, the charges to the income statement are the company contributions payable, as the
company’s obligation is limited to the contributions paid into the plans. The assets and liabilities of such plans are not included in the balance sheet of the Group.
DESCRIPTION OF PLANS
The Group increasingly operates a number of defined
contribution plans, the assets of which are held in external funds. In certain countries the Group operates defined benefit pension plans based on employee pensionable remuneration and length of service. The majority of defined benefit plans are
either career average, final salary or hybrid plans and operate on a funded basis. Benefits are determined by the plan rules and are linked to inflation in some countries. Our largest plans are in the UK and Netherlands. In the UK, we operate a
combination of an open career average defined benefit plan with a salary limit for benefit accrual, and a defined contribution plan. In the Netherlands, we operate a collective defined contribution plan for all new benefit accrual and a closed
career average defined benefit plan for benefits built up to April 2015.
The Group also provides other post-employment benefits, mainly post-employment healthcare
plans in the United States. These plans are predominantly unfunded.
GOVERNANCE
The majority of the Group’s externally funded plans are established as trusts, foundations or similar entities. The operation of these entities is governed by local
regulations and practice in each country, as is the nature of the relationship between the Group and the Trustees (or equivalent) and their composition. Where Trustees (or equivalent) are in place to operate plans, they are generally required to act
on behalf of the plan’s stakeholders. They are tasked with periodic reviews of the solvency of the fund in accordance with local legislation and play a role in the long-term investment and funding strategy. The Group also has an internal body,
the Pensions and Equity Committee, that is responsible for setting the company’s policies and decision-making on plan matters, including but not limited to design, funding, investments, risk management and governance.
INVESTMENT STRATEGY
The Group’s investment strategy in respect of its
funded plans is implemented within the framework of the various statutory requirements of the territories where the plans are based. The Group has developed policy guidelines for the allocation of assets to different classes with the objective of
controlling risk and maintaining the right balance between risk and long-term returns in order to limit the cost to the Group of the benefits provided. To achieve this, investments are well diversified, such that the failure of any single investment
would not have a material impact on the overall level of assets. The plans continue to invest a good proportion of the assets in equities, which the Group believes offer the best returns over the long term, commensurate with an acceptable level of
risk. The plans expose the Group to a number of actuarial risks such as investment risk, interest rate risk, longevity risk and, in certain markets, inflation risk. There are no unusual entity or plan-specific risks to the Group. For risk control,
the pension funds also have significant investments in liability matching assets (bonds) as well as in property and other alternative assets; additionally, the Group uses derivatives to further mitigate the impact of the risks outlined above. The
majority of assets are managed by a number of external fund managers with a small proportion managed in-house. Unilever has a pooled investment vehicle (Univest) which it believes offers its pension plans
around the world a simplified externally managed investment vehicle to implement their strategic asset allocation models, currently for bonds, equities and alternative assets. The aim is to provide high-quality, well diversified, cost-effective,
risk-controlled vehicles. The pension plans’ investments are overseen by Unilever’s internal investment company, the Univest Company.
ASSUMPTIONS
With the objective of presenting the assets and liabilities of the pensions and other post-employment benefit plans at their fair value on the balance sheet,
assumptions under IAS 19 are set by reference to market conditions at the valuation date. The actuarial assumptions used to calculate the benefit liabilities vary according to the country in which the plan is situated. The following table shows the
assumptions, weighted by liabilities, used to value principal defined benefit plans (representing approximately 96% of total pension liabilities and other post-employment benefit liabilities).
31 December 2018
31 December 2017
Defined
benefit pension plans
Other post-
employment benefit plans
Defined
benefit pension plans
Other post-
employment benefit plans
Discount rate
2.7%
4.8%
2.5%
4.2%
Inflation
2.5%
n/a
2.5%
n/a
Rate of increase in salaries
2.8%
3.0%
2.8%
3.0%
Rate of increase for pensions in payment (where provided)
2.4%
n/a
2.4%
n/a
Rate of increase for pensions in deferment (where provided)
2.6%
n/a
2.6%
n/a
Long-term medical cost inflation
n/a
5.3%
n/a
5.3%
The valuations of other post-employment benefit plans generally assume a higher initial level of medical cost inflation, which falls from
7% to the long-term rate within the next five years. Assumed healthcare cost trend rates have a significant effect on the amounts reported for healthcare plans.
For the UK and Netherlands pension plans, representing approximately 68% of all defined benefit pension liabilities, the
assumptions used at 31 December 2018 and 2017 were:
United Kingdom
Netherlands
2018
2017
2018
2017
Discount rate
2.8
%
2.5
%
1.8
%
1.8
%
Inflation
3.2
%
3.1
%
1.6
%
1.7
%
Rate of increase in salaries
3.1
%
3.0
%
2.1
%
2.2
%
Rate of increase for pensions in payment (where provided)
3.1
%
3.0
%
1.6
%
1.7
%
Rate of increase for pensions in deferment (where
provided)
3.1
%
3.0
%
1.6
%
1.7
%
Number of years a current pensioner is expected to live beyond age 65:
Men
22.1
22.1
22.5
22.5
Women
24.0
24.0
24.0
24.3
Number of years a future pensioner currently aged 45 is expected to live beyond age 65:
Men
22.7
22.6
24.4
24.6
Women
25.6
25.6
26.1
26.6
Demographic assumptions, such as mortality rates, are set with having regard to the latest trends in life expectancy (including
expectations of future improvements), plan experience and other relevant data. These assumptions are reviewed and updated as necessary as part of the periodic actuarial valuation of the pension plans. The years of life expectancy for 2018 above have
been translated from the following tables:
UK: The year of use S2 series all pensioners (‘S2PA’) tables have been adopted, which are based on the
experience of UK pension schemes over the period 2004-2011. Scaling factors are applied reflecting the experience of our pension funds appropriate to the member’s gender and status. Future improvements in longevity have been allowed for in line
with the 2016 CMI core projections (Sk = 7.5) and a 1% pa long-term improvement rate.
Netherlands: The Dutch Actuarial Society’s AG Prognosetafel 2018 table is
used with correction factors (2017) to allow for the typically longer life expectancy for fund members relative to the general population. This table has an in-built allowance for future improvements in
longevity.
The remaining defined benefit plans are considered immaterial. Their assumptions vary due to a number of factors including the currency and long-term
economic conditions of the countries where they are situated.
INCOME STATEMENT
The charge to the income statement comprises:
€ million
€ million
€ million
Notes
2018
2017
2016
Charged to operating profit:
Defined benefit pension and other benefit plans:
Current service cost
(220
)
(245
)
(226
)
Employee contributions
17
18
17
Special termination benefits
(16
)
(4
)
(6
)
Past service cost including (losses)/gains on curtailments
(41
)
23
32
Settlements
–
4
(2
)
Defined contribution plans
(179
)
(195
)
(187
)
Total operating cost
4A
(439
)
(399
)
(372
)
Finance income/(cost)
5
(25
)
(96
)
(94
)
Net impact on the income statement (before tax)
(464
)
(495
)
(466
)
STATEMENT OF COMPREHENSIVE INCOME
Amounts
recognised in the statement of comprehensive income on the remeasurement of the net defined benefit liability.
€ million
€ million
€ million
2018
2017
2016
Return on plan assets excluding amounts included in net finance income/(cost)
(1,108
)
1,475
1,877
Actuarial gains/(losses) arising from changes in demographic assumptions
42
222
(217
)
Actuarial gains/(losses) arising from changes in financial assumptions
611
(210
)
(2,963
)
Experience gains/(losses) arising on pension plan and other benefit plan liabilities
18
133
82
Total of defined benefit costs recognised in other comprehensive
income
The assets,
liabilities and surplus/(deficit) position of the pension and other post-employment benefit plans at the balance sheet date were:
€ million 2018
€ million 2017
Pension plans
Other post- employment benefit plans
Pension plans
Other post- employment benefit plans
Fair value of assets
20,867
13
22,361
21
Present value of liabilities
(21,288
)
(466
)
(22,420
)
(523
)
Pension liability net of assets
(421
)
(453
)
(59
)
(502
)
Of which in respect of:
Funded plans in surplus:
Liabilities
(16,182
)
–
(17,132
)
–
Assets
17,909
1
19,302
3
Pension asset net of liabilities
1,727
1
2,170
3
Funded plans in deficit:
Liabilities
(4,149
)
(30
)
(4,267
)
(35
)
Assets
2,958
12
3,059
18
Pension liability net of assets
(1,191
)
(18
)
(1,208
)
(17
)
Unfunded plans:
Pension liability
(957
)
(436
)
(1,021
)
(488
)
A surplus is deemed recoverable to the extent that the Group can benefit economically from the surplus. Unilever assesses the maximum
economic benefit available through a combination of refunds and reductions in future contributions in accordance with local legislation and individual financing arrangements with each of our funded defined benefit plans.
RECONCILIATION OF CHANGE IN ASSETS AND LIABILITIES
Movements in assets during
the year:
The group of plans within “Rest of world” category in the tables below are not materially different with respect to their risks that would
require disaggregated disclosure.
UK
Netherlands
Rest of world
€ million 2018
Total
UK
Netherlands
Rest of world
€ million 2017 Total
1 January
11,038
5,357
5,987
22,382
9,963
5,116
6,104
21,183
Employee contributions
–
–
17
17
–
1
17
18
Settlements
–
–
(1
)
(1
)
–
–
(8
)
(8
)
Actual return on plan assets (excluding amounts in net finance income/charge)
Past service costs including (losses)/gains on curtailments
(46
)
8
(3
)
(41
)
5
12
6
23
Settlements
–
–
1
1
–
–
12
12
Interest cost
(254
)
(87
)
(235
)
(576
)
(286
)
(86
)
(264
)
(636
)
Actuarial gain/(loss) arising from changes in demographic assumptions
–
53
(11
)
42
312
(96
)
6
222
Actuarial gain/(loss) arising from changes in financial assumptions
351
84
176
611
(189
)
–
(21
)
(210
)
Actuarial gain/(loss) arising from experience adjustments
(45
)
37
26
18
144
(37
)
26
133
Benefit payments
472
166
561
1,199
457
169
613
1,239
Currency retranslation
147
–
14
161
397
–
474
871
Others
–
(8
)
18
10
–
8
–
8
31 December
(9,739
)
(4,664
)
(7,351
)
(21,754
)
(10,255
)
(4,913
)
(7,775
)
(22,943
)
Movements in (deficit)/surplus during the year:
UK
Netherlands
Rest of world
€ million
2018
Total
UK
Netherlands
Rest of world
€ million
2017
Total
1 January
783
444
(1,788
)
(561
)
(1,018
)
239
(2,394
)
(3,173
)
Current service cost
(109
)
(4
)
(107
)
(220
)
(114
)
(6
)
(125
)
(245
)
Employee contributions
–
–
17
17
–
1
17
18
Special termination benefits
–
–
(16
)
(16
)
–
–
(4
)
(4
)
Past service costs including (losses)/gains on curtailments
(46
)
8
(3
)
(41
)
5
12
6
23
Settlements
–
–
–
–
–
–
4
4
Actual return on plan assets (excluding amounts in net finance income/charge)
(459
)
(303
)
(346
)
(1,108
)
863
275
337
1,475
Interest cost
(254
)
(87
)
(235
)
(576
)
(286
)
(86
)
(264
)
(636
)
Interest income
274
95
182
551
270
91
179
540
Actuarial gain/(loss) arising from changes in demographic assumptions
–
53
(11
)
42
312
(96
)
6
222
Actuarial gain/(loss) arising from changes in financial assumptions
351
84
176
611
(189
)
–
(21
)
(210
)
Actuarial gain/(loss) arising from experience adjustments
(45
)
37
26
18
144
(37
)
26
133
Employer contributions
95
14
274
383
778
43
284
1,105
Benefit payments
–
–
–
–
–
–
–
–
Currency retranslation
–
–
26
26
18
–
162
180
Others
–
(9
)
9
–
–
8
(1
)
7
31 December
590
332
(1,796
)
(874
)
783
444
(1,788
)
(561
)
The actual return on plan assets during 2018 was €(557) million, being €(1,108) million of asset returns and €551 million of interest income shown in the tables above (2017:
€2,015 million).
The duration of the principal defined benefit plan liabilities (representing 96% of total pension liabilities and other
post-employment benefit liabilities) and the split of liabilities between different categories of plan participants are:
UK
Netherlands
Rest of world
(a)
2018
Total
UK
Netherlands
Rest of world
2017 Total
Duration (years)
17
18
12
7 to 23
17
19
13
8 to 24
Active members
12
%
15
%
21
%
15
%
14
%
22
%
16
%
18
%
Deferred members
33
%
38
%
16
%
29
%
32
%
30
%
15
%
26
%
Retired members
55
%
47
%
63
%
56
%
54
%
48
%
69
%
56
%
(a) Rest of world numbers shown
are weighted averages by liabilities.
PLAN ASSETS
The fair value of plan assets, which are reported net of fund liabilities that are not employee benefits, at the end of the reporting period for each category are as
follows:
The group of plans within “Rest of world” category in the tables below are
not materially different with respect to their risks that would require disaggregated disclosure.
€ million
31 December 2018
€
million
31 December 2017
UK
Netherlands
Rest of world
2018
Total
UK
Netherlands
Rest of world
2017 Total
Total plan assets
10,329
4,996
5,542
20,867
11,038
5,357
5,966
22,361
Assets
Equities total
3,182
1,594
1,505
6,281
4,538
1,876
1,909
8,323
Europe
731
480
451
1,662
1,093
703
594
2,390
North America
1,723
714
682
3,119
2,320
668
842
3,830
Other
728
400
372
1,500
1,125
505
473
2,103
Fixed income total
4,963
2,595
2,947
10,505
4,210
2,500
2,954
9,664
Government bonds
2,474
769
1,253
4,496
2,162
879
1,376
4,417
Investment grade corporate bonds
984
502
1,167
2,653
1,368
485
1,207
3,060
Other fixed income
1,505
1,324
527
3,356
680
1,136
371
2,187
Private equity
363
82
2
447
401
89
3
493
Property and real estate
852
451
276
1,579
810
411
246
1,467
Hedge funds
663
–
120
783
673
–
297
970
Other
435
293
389
1,117
463
427
274
1,164
Other plans
–
–
312
312
–
–
312
312
Fund liabilities that are not employee benefits
Derivatives
(129
)
(19
)
(9
)
(157
)
(57
)
54
(29
)
(32
)
The fair values of the above equity and fixed income instruments are determined based on quoted market prices in active markets. The fair
value of private equity, properties, derivatives and hedge funds are not based on quoted market prices in active markets. The Group uses derivatives and other instruments to hedge some of its exposure to inflation and interest rate risk – the
degree of this hedging of liabilities was 55% for interest rate and 55% for inflation for the UK plan and 32% for interest rate and 29% for inflation for the Netherlands plan. Foreign currency exposures in part are also hedged by the use of forward
foreign exchange contracts. Assets included in the Other category are commodities, cash and insurance contracts which are also unquoted assets.
Equity securities
include Unilever securities amounting to €12 million (0.1% of total plan assets) and €14 million (0.1% of total plan assets) at
31 December 2018 and 2017 respectively. Property includes property occupied by Unilever amounting to
€28 million at 31 December 2018 (2017: €32 million).
The pension assets above exclude the assets in a Special Benefits Trust amounting to €59 million (2017: €63 million) to fund pension and similar liabilities in the United States (see also note 17A on page 117). In 2017, as a result of the triennial valuation of the UK fund, the monies held in escrow (€68 million at the end of 2016) were returned to the Group.
SENSITIVITIES
The sensitivity of the overall pension liabilities to changes in the weighted key assumptions are:
Change in liabilities
Change in assumption
UK
Netherlands
Total
Discount rate
Increase by 0.5%
-8%
-9%
-7%
Inflation rate
Increase by 0.5%
7%
9%
6%
Life expectancy
Increase by 1 year
4%
4%
4%
Long-term medical cost inflation(b)
Increase by 1.0%
0%
0%
2%
(b)
Long-term medical cost inflation only relates to post-retirement medical plans.
An equivalent decrease in each assumption would have an equal and opposite impact on liabilities.
The sensitivity analyses above have been determined based on reasonably possible changes of the respective assumptions
occurring at the end of the reporting period and may not be representative of the actual change. It is based on a change in the key assumption while holding all other assumptions constant. When calculating the sensitivity to the assumption, the same
method used to calculate the liability recognised in the balance sheet has been applied. The methods and types of assumptions used in preparing the sensitivity analysis did not change compared with the previous period.
CASH FLOW
Group cash flow in respect of pensions and similar post-employment
benefits comprises company contributions paid to funded plans and benefits paid by the company in respect of unfunded plans. The table below sets out these amounts:
€ million
2019
€ million 2018
€ million 2017
€ million 2016
Estimate
Company contributions to funded plans:
Defined benefit
230
238
954
355
Defined contributions
185
179
195
187
Benefits paid by the company in respect of unfunded plans:
Defined benefit
150
144
151
157
Group cash flow in respect of pensions and similar
benefits
565
561
1,300
699
Following the conclusion of the 2016 triennial valuation of the UK pension fund the Group in agreement with the trustees, decided to
contribute £600 million into the fund in 2017. Deficit contributions to the UK pension fund are expected to be nil for the next few years
The Group’s
funding policy is to periodically review the contributions made to the plans while taking account of local legislations.
4C. SHARE-BASED COMPENSATION PLANS
The fair value of awards at grant date is calculated using appropriate pricing models. This value is expensed over their
vesting period, with a corresponding credit to equity. The expense is reviewed and adjusted to reflect changes to the level of awards expected to vest, except where this arises from a failure to meet a market condition. Any cancellations are
recognised immediately in the income statement.
As at 31 December 2018, the Group had share-based compensation plans in the form of performance shares,
share options and other share awards.
The numbers in this note include those for Executive Directors and key management shown in note 4A on page 86. Non-Executive Directors do not participate in any of the share-based compensation plans.
The charge in each of the last three years
is shown below, and relates to equity-settled plans:
€ million
€ million
€ million
Income statement charge
2018
2017
2016
Performance share plans
(183
)
(273
)
(185
)
Other plans
(13
)
(11
)
(13
)
(196
)
(284
)
(198
)
PERFORMANCE SHARE PLANS
Performance share
awards are made in respect of the Global Share Incentive Plan (GSIP) and the Management Co-Investment Plan (MCIP). The awards of each plan will vest between 0 and 200% of grant level, subject to the level of
satisfaction of performance measures (limits for Executive Directors may vary, and are detailed in the Directors’ Remuneration Report on pages 50 to 65).
Under
the GSIP, Unilever’s managers receive annual awards of NV and PLC shares. The performance measures for GSIP are underlying sales growth, underlying operating margin, and cumulative operating cash flow for the Group, although GSIP awards to
certain managers below Unilever Leadership Executive level may be subject to similar performance measures specific to their business unit. There is an additional target based on relative total shareholder return for senior executives. GSIP awards
will vest after three years.
The MCIP allows Unilever’s managers to invest a proportion of their annual bonus (a maximum of 67% for Executive Directors, 100%
for other managers) in shares in Unilever, and to receive a corresponding award of performance-related shares. The performance measures for MCIP are underlying sales growth, underlying EPS growth, and sustainability progress index for the Group.
There is an additional target of return on invested capital for senior executives. MCIP awards will vest after four years.
A summary of the status of the Performance
Share Plans as at 31 December 2018, 2017 and 2016 and changes during the years ended on these dates is presented below:
At 31 December
2018, shares and options in NV or PLC totalling 14,595,111 (2017: 14,760,786) were outstanding in respect of share-based compensation plans of NV, PLC and its subsidiaries, including North American plans.
To satisfy the options and awards granted, certain NV group companies hold 15,010,429 (2017: 15,802,464) ordinary shares of NV or PLC. Shares acquired during 2018
represent 0.21% of the Group’s called up share capital. The balance of shares held in connection with share plans at
31 December 2018 represented 0.5%
(2017: 0.5%) of the Group’s called up share capital.
The book value of €704 million (2017: €695 million) of all shares held in respect of share-based compensation plans for both NV and PLC is eliminated on consolidation by deduction from other reserves. Their market value at 31 December
2018 was €700 million (2017: €739 million). At 31 December 2018, the exercise price of Nil PLC options (2017: Nil) were above the
market price of the shares.
Shares held to satisfy options and awards are accounted for in accordance with IAS 32 ‘Financial Instruments: Presentation’.
All differences between the purchase price of the shares held to satisfy options and awards granted and the proceeds received for the shares, whether on exercise or lapse, are charged to reserves. The basis of the charge to operating profit for the
economic value of options granted is discussed on page 92.
Between 31 December 2018 and 21 February 2019 (the latest practicable date for inclusion in this
report), Nil shares were granted, 5,534,564 shares were vested and 92,699 shares were forfeited related to the Performance Share Plans.
5. NET FINANCE COSTS
Net finance costs are comprised of finance costs and finance income, including net finance costs in relation to pensions
and similar obligations.
Finance income includes income on cash and cash equivalents and income on other financial assets. Finance
costs include interest costs in relation to financial liabilities.
Borrowing costs are recognised based on the
effective interest method.
Net finance costs
Notes
€ million
2018
€
million
2017
€
million
2016
Finance costs
(591
)
(556
)
(584
)
Bank loans and overdrafts
(44
)
(46
)
(67
)
Interest on bonds and other loans(a)
(560
)
(519
)
(501
)
Dividends paid on preference shares(b)
–
(4
)
(4
)
Net gain/(loss) on transactions for which hedge accounting is not applied(c)
13
13
(12
)
On foreign exchange derivatives
144
384
(215
)
Exchange difference on underlying items
(131
)
(371
)
203
Finance income
135
157
115
Pensions and similar obligations
4B
(25
)
(96
)
(94
)
Net finance costs before non-underlying items(d)
(481
)
(495
)
(563
)
Premium paid on buyback of preference shares
–
(382
)
–
(481
)
(877
)
(563
)
(a)
Interest on bonds and other loans’ includes the impact of interest rate derivatives that are part of hedge accounting
relationships and the related recycling of results from the hedge accounting reserve. Includes an amount of €(15) million (2017: €(26)
million) relating to unwinding of discount on deferred consideration for acquisitions and €38 million (2017: €65 million) release of
provision for interest on indirect tax cases in Brazil.
(b)
Preference shares were repurchased in 2017.
(c)
For further details of derivatives for which hedge accounting is not applied, please refer to note 16C.
(d)
See note 3 for explanation of non-underlying items.
Income tax on the profit for the year comprises current and deferred tax. Income tax is recognised in the income
statement except to the extent that it relates to items recognised directly in equity.
Current tax is the expected tax payable on
the taxable income for the year, using tax rates enacted or substantively enacted at the balance sheet date, and any adjustments to tax payable in respect of previous years.
Current tax in the consolidated income statement will differ from the income tax paid in the consolidated cash flow statement primarily
because of deferred tax arising on temporary differences and payment dates for income tax occurring after the balance sheet date.
Unilever is subject to taxation in the many countries in which it operates. The tax legislation of these countries
differs, is often complex and is subject to interpretation by management and the government authorities. These matters of judgement give rise to the need to create provisions for tax payments that may arise in future years with respect to
transactions already undertaken. Provisions are made against individual exposures and take into account the specific circumstances of each case, including the strength of technical arguments, recent case law decisions or rulings on similar issues
and relevant external advice. The provision is estimated based on the individual most likely outcome approach.
€ million
€ million
€ million
Tax charge in income statement
2018
2017
2016
Current tax
Current year
(2,647
)
(2,398
)
(2,026
)
Over/(under) provided in prior years
(10
)
(21
)
158
(2,657
)
(2,419
)
(1,868
)
Deferred tax
Origination and reversal of temporary differences
3
51
(65
)
Changes in tax rates
(13
)
609
(7
)
Recognition of previously unrecognised losses brought forward
92
92
18
82
752
(54
)
(2,575
)
(1,667
)
(1,922
)
The reconciliation between the computed weighted average rate of income tax expense, which is generally applicable to Unilever companies,
and the actual rate of taxation charged is as follows:
Reconciliation of effective tax rate
%
2018
%
2017
%
2016
Computed rate of tax(a)
25
26
26
Differences between computed rate of tax and effective tax rate due to:
Incentive tax credits
(3
)
(4
)
(4
)
Withholding tax on dividends
2
2
3
Expenses not deductible for tax purposes
1
1
1
Irrecoverable withholding tax
1
1
1
Income tax reserve adjustments – current and prior year
1
–
(1
)
Transfer to/(from) unrecognised deferred tax assets
–
1
–
Others
(1
)
(1
)
–
Underlying effective tax rate
26
26
26
Non-underlying items within operating profit(b)
(1
)
1
–
Premium paid on Buyback of preference shares(b)
–
1
–
Impact of US tax reform(b)
–
(7
)
–
Impact of Spreads disposal(b)
(4
)
–
–
Effective tax rate
21
21
26
(a)
The computed tax rate used is the average of the standard rate of tax applicable in the countries in which Unilever
operates, weighted by the amount of underlying profit before taxation generated in each of those countries. For this reason, the rate may vary from year to year according to the mix of profit and related tax rates.
(b)
See note 3 for explanation of non-underlying items.
Our tax rate is reduced by incentive tax credits, the benefit from preferential tax regimes that have been legislated by the countries and provinces concerned in order to
promote economic development and investment. The tax rate is increased by business expenses which are not deductible for tax, such as entertainment costs and some interest expense and by irrecoverable withholding taxes on dividends paid by
subsidiary companies and on other cross-border payments such as royalties and service fees, which cannot be offset against other taxes due. In 2018 the effective tax rate was reduced by the impact of the spreads disposals where a significant part of
the disposals benefited from the participation exemption in the Netherlands.
The Group’s future tax charge and effective tax rate could be affected by several
factors, including changes in tax laws and their interpretation and still to be determined tax reform proposals in the EU, Switzerland and the continuing OECD international tax reform work, as well as the impact of acquisitions, disposals and any
restructuring of our businesses.
Deferred tax is recognised using the liability method on taxable temporary differences between the tax base and the
accounting base of items included in the balance sheet of the Group. Certain temporary differences are not provided for as follows:
•
goodwill not deductible for tax purposes;
•
the initial recognition of assets or liabilities that affect neither accounting nor taxable profit; and
•
differences relating to investments in subsidiaries to the extent that it is probable that they will not reverse in the
foreseeable future.
The amount of deferred tax provided is based on the expected manner of realisation or settlement
of the carrying amount of assets and liabilities, using tax rates enacted, or substantively enacted, at the year end.
A deferred tax asset is recognised only to the extent that it is probable that future taxable profits will be
available against which the asset can be utilised. Deferred tax assets are reduced to the extent that it is no longer probable that the related tax benefit will be realised.
€ million
€ million
€ million
€ million
€ million
€ million
€ million
€ million
Movements in 2018 and 2017
As at 1 January 2018
Income statement
Other
As at 31 December 2018
As at 1 January 2017
Income statement
Other
As at 31 December 2017
Pensions and similar obligations
316
(26
)
114
404
766
(16
)
(434
)
316
Provisions and accruals
653
193
(25
)
821
922
(154
)
(115
)
653
Goodwill and intangible assets
(1,652
)
(154
)
(105
)
(1,911
)
(1,928
)
654
(378
)
(1,652
)
Accelerated tax depreciation
(679
)
5
(5
)
(679
)
(870
)
109
82
(679
)
Tax losses
130
11
(11
)
130
131
(36
)
35
130
Fair value gains
100
58
(3
)
155
(7
)
104
3
100
Fair value losses
24
(2
)
–
22
29
65
(70
)
24
Share-based payments
194
(14
)
(5
)
175
169
(5
)
30
194
Other
86
11
(20
)
77
81
31
(26
)
86
(828
)
82
(60
)
(806
)
(707
)
752
(873
)
(828
)
At the balance sheet date, the Group had unused tax losses of €5,346 million
(2017: €4,676 million) and tax credits amounting to €570 million (2017: €612
million) available for offset against future taxable profits. Deferred tax assets have not been recognised in respect of unused tax losses of €4,914 million (2017: €4,179 million) and tax credits of €570 million (2017: €612 million), as it is not
probable that there will be future taxable profits within the entities against which the losses can be utilised. Many of these tax losses and credits arise in tax jurisdictions where they do not expire with the exception of €4,752 million (2017: €2,934 million) comprising mainly corporate income tax losses in the Netherlands which expire between now and 2027.
Other deductible temporary differences of €48 million (2017:
€51 million) have not been recognised as a deferred tax asset. There is no expiry date for these differences.
At the balance sheet date, the aggregate amount of temporary differences associated with undistributed earnings of subsidiaries for which deferred tax liabilities have
not been recognised was €2,681 million (2017: €1,719 million). No liability has been recognised in respect of these differences because
the Group is in a position to control the timing of the reversal of the temporary differences, and it is probable that such differences will not reverse in the foreseeable future.
Deferred tax assets and liabilities are offset when there is a legally enforceable right to set off current tax assets against current tax liabilities and when the
deferred income taxes relate to the same fiscal authority. The following amounts, determined after appropriate offsetting, are shown in the consolidated balance sheet:
€ million
€ million
€ million
€ million
€ million
€ million
Deferred tax assets and liabilities
Assets 2018
Assets 2017
Liabilities 2018
Liabilities 2017
Total
2018
Total
2017
Pensions and similar obligations
334
294
70
22
404
316
Provisions and accruals
578
465
243
188
821
653
Goodwill and intangible assets
41
86
(1,952
)
(1,738
)
(1,911
)
(1,652
)
Accelerated tax depreciation
(64
)
(21
)
(615
)
(658
)
(679
)
(679
)
Tax losses
126
125
4
5
130
130
Fair value gains
12
23
143
77
155
100
Fair value losses
2
3
20
21
22
24
Share-based payments
59
74
116
120
175
194
Other
29
36
48
50
77
86
1,117
1,085
(1,923
)
(1,913
)
(806
)
(828
)
Of which deferred tax to be recovered/(settled) after more than 12
months
Income tax is recognised in other comprehensive income for items recognised directly in equity.
Tax effects of the components of other comprehensive income were as follows:
€ million
€ million
€ million
€ million
€ million
€ million
Before
tax
2018
Tax (charge)/ credit
2018
After
tax
2018
Before
tax
2017
Tax (charge)/ credit
2017
After
tax
2017
Gains/(losses) on:(a)
Equity instruments at fair value through other comprehensive income
51
–
51
–
–
–
Cash flow hedges
(70
)
15
(55
)
(62
)
(6
)
(68
)
Other financial instruments
–
–
–
1
(8
)
(7
)
Remeasurements of defined benefit pension plans
(437
)
109
(328
)
1,620
(338
)
1,282
Currency retranslation gains/(losses)
(869
)
8
(861
)
(1,024
)
41
(983
)
(1,325
)
132
(1,193
)
535
(311
)
224
(a)
Classification has changed following adoption of IFRS 9. See note 1 for further details.
7. COMBINED EARNINGS PER SHARE
The combined earnings per share calculations are based on the average number of share units representing the combined
ordinary shares of NV and PLC in issue during the period, less the average number of shares held as treasury shares.
In calculating
diluted earnings per share and underlying earnings per share, a number of adjustments are made to the number of shares, principally, the exercise of share options by employees.
Underlying earnings per share is calculated as underlying profit attributable to shareholders’ equity divided by
the diluted combined average number of share units. In calculating underlying profit attributable to shareholders’ equity, net profit attributable to shareholders’ equity is adjusted to eliminate the
post-tax impact of non-underlying items in operating profit and any other significant unusual items within net profit but not operating profit.
Earnings per share for total operations for the 12 months were as follows:
€
€
€
2018
2017
2016
Basic earnings per share
3.50
2.16
1.83
Diluted earnings per share
3.48
2.15
1.82
Underlying earnings per share
2.36
2.24
2.03
Millions
of share units
Calculation of average number of share units
2018
2017
2016
Average number of shares: NV
1,714.7
1,714.7
1,714.7
PLC
1,264.0
1,310.2
1,310.2
Less treasury shares held by employee share trusts and companies
(295.4
)
(223.3
)
(184.7
)
Combined average number of share units – used for basic earnings per share
2,683.3
2,801.6
2,840.2
Add dilutive effect of share-based compensation plans
11.5
12.4
13.7
Diluted combined average number of share units – used for
diluted and underlying earnings per share
2,694.8
2,814.0
2,853.9
Calculation of earnings
Notes
€ million 2018
€ million 2017
€ million 2016
Net profit
9,808
6,486
5,547
Non-controlling interests
(419
)
(433
)
(363
)
Net profit attributable to shareholders’ equity – used for basic and diluted earnings per
share
9,389
6,053
5,184
Post tax impact of non-underlying items
3
(3,024
)
262
601
Underlying profit attributable to shareholders’ equity –
used for underlying earnings per share
Dividends are recognised on the date that the shareholder’s right to receive payment is established. This is
generally the date when the dividend is declared.
€ million
€ million
€ million
Dividends on ordinary capital during the year
2018
2017
2016
NV dividends
(2,262
)
(2,154
)
(1,974
)
PLC dividends
(1,819
)
(1,762
)
(1,626
)
(4,081
)
(3,916
)
(3,600
)
Four quarterly interim dividends were declared and paid during 2018 totalling €1.52
(2017: €1.40) per NV ordinary share and £1.33 (2017: £1.22) per PLC ordinary share.
Quarterly
dividends of €0.39 per NV ordinary share and £0.34 per PLC ordinary share were declared on 31 January 2019, to be paid in March 2019. See note 26 ‘Events after the balance sheet
date’ on page 127. Total dividends declared in relation to 2018 were €1.55 (2017: €1.43) per NV ordinary share and £1.35 (2017:
£1.26) per PLC ordinary share.
9. GOODWILL AND INTANGIBLE ASSETS
GOODWILL
Goodwill is initially recognised based on the accounting policy for business combinations (see note 21). Goodwill is subsequently
measured at cost less amounts provided for impairment. The Group has nine cash generating units (CGUs) based on the three geographical areas and three divisions. Global Spreads business which was recognised as a separate CGU in 2017 has been
disposed off in 2018.
Goodwill acquired in a business combination is allocated to the Group’s CGUs, or groups of CGUs, that are
expected to benefit from the synergies of the combination. These might not always be the same as the CGUs that include the assets and liabilities of the acquired business. Each unit or group of units to which the goodwill is allocated represents the
lowest level within the Group at which the goodwill is monitored for internal management purposes, and is not larger than an operating segment.
INTANGIBLE ASSETS
Separately
purchased intangible assets are initially measured at cost, being the purchase price as at the date of acquisition. On acquisition of new interests in group companies, Unilever recognises any specifically identifiable intangible assets separately
from goodwill. These intangible assets are initially measured at fair value as at the date of acquisition.
Development expenditure
for internally-produced intangible assets is capitalised only if the costs can be reliably measured, future economic benefits are probable, the product is technically feasible and the Group has the intent and the resources to complete the project.
Research expenditure to support development of internally-produced intangible assets is recognised in profit or loss as incurred.
Indefinite-life intangibles mainly comprise trademarks and brands, for which there is no foreseeable limit to the period over which they
are expected to generate net cash inflows. These are considered to have an indefinite life, given the strength and durability of our brands and the level of marketing support.These assets are not amortised but are subject to a review for impairment
annually, or more frequently if events or circumstances indicate this is necessary. Any impairment is charged to the income statement as it arises.
Finite-life intangible assets mainly comprise software, patented and
non-patented technology, know-how and customer lists. These assets are amortised on a straight-line basis in the income statement over the period of their expected
useful lives, or the period of legal rights if shorter. None of the amortisation periods exceeds ten years.
Goodwill and intangibles amounting to €283 million has been
reclassified as held for sale in relation to the Spreads and Alsa baking and dessert businesses. In 2017 €2,311 million goodwill and intangibles related to Spreads business were reclassified
as held for sale.
(b)
Within the indefinite-life intangible assets there are three brands that have a significant carrying value: Knorr €1,789 million (2017: €1,770 million), Carver Korea €1,534 million (2017: € 1,520 million) and Hellmann’s €1,195 million (2017: €1,160 million).
There are no significant carrying amounts of goodwill and intangible assets that are allocated across multiple cash generating units.
Goodwill acquired in a business combination is allocated to Unilever’s cash generating units for the purposes of impairment testing. The assets acquired in business
combinations are also assessed to determine the impact on the Group’s cash generating units, particularly whether new cash generating units are created. This assessment and allocation has not been completed for any of the acquisitions completed
during 2018 except for goodwill and assets acquired in the Quala acquisition which are included in the Beauty & Personal Care The Americas and Home Care The Americas cash generating units. At 31 December 2018, there is no indication
that the acquired goodwill and assets are impaired.
The impact of applying IAS 29 for Argentina has increased goodwill by
€369 million. The goodwill that relates to our business in Argentina was initially recognised in 2000 when Unilever acquired Bestfoods. In accordance with IAS 29 this goodwill has been
adjusted for inflation from the date of recognition until 31 December 2018. Our impairment testing included this inflated amount.
We have
tested all material goodwill and indefinite-life intangible assets for impairment. No impairments were identified except for the Blueair intangibles. The Blueair acquisition included an element of deferred consideration payable in 2021. The terms
relating to this element allowed the sellers to request an early settlement for a reduced sum. Such a request was made in 2018 and the payment was made to the sellers, reducing the consideration payable by
€277 million and generating a credit in non-underlying items within the line ‘acquisition & disposal related costs’. This early
termination has been considered as a trigger event for an impairment review for Blueair intangible assets and a €208 million charge has been recognised in
non-underlying items within the line ‘impairments and other one-off items’ (see note 3)
SIGNIFICANT CGUS
The goodwill and indefinite-life intangible assets held in
the CGUs relating to Foods & Refreshment Europe, Foods & Refreshment The Americas, Beauty & Personal Care The Americas and Beauty & Personal Care Asia/AMET/RUB are considered significant within the total carrying
amounts of goodwill and indefinite-life intangible assets at 31 December 2018 in terms of size, headroom and sensitivity to assumptions used.
The goodwill and
indefinite-life intangible assets held in the significant CGUs are:
€ billion
€ billion
2018 CGUs
Goodwill
Indefinite-life intangible assets
Foods & Refreshment Europe
3.9
1.6
Foods & Refreshment The Americas
3.9
2.1
Beauty & Personal Care The Americas
4.0
2.8
Beauty & Personal Care Asia/AMET/RUB
1.7
2.0
€ billion
€ billion
2017 CGUs
Goodwill
Indefinite-life
intangible assets
Foods (excluding spreads) Europe
4.5
1.6
Foods (excluding spreads) The Americas
2.8
1.4
Foods (excluding spreads) Asia/AMET/RUB
1.5
0.4
Beauty & Personal Care The Americas
2.5
1.5
In 2017 the global spreads CGU was also considered significant, with a carrying value of
€2,228 million in goodwill and €82 million in indefinite-life intangible assets. These were classified as assets held for sale.
Value in use has been calculated as the present value of projected cash flows. A pre-tax discount rate of 7.4% (2017: 7.4%)
was used. For the significant CGUs, the following key assumptions were used in the discounted cash flow projections:
Foods &
Refreshment
Foods &
Refreshment
Beauty &
Personal Care
Beauty &
Personal Care
Europe
The Americas
The
Americas
Asia/
AMET/RUB
Longer-term sustainable growth rates
1.2%
1.6%
1.6%
3.8%
Average near-term nominal growth rates
0.0%
0.7%
2.8%
3.9%
Average operating margins
16%
15%
20%
22%
The projections cover a period of five years, as we believe this to be the most appropriate timescale over which to review and consider
annual performances before applying a fixed terminal value multiple to the final year cash flows.
The growth rates and margins used to estimate future performance
are based on the conservative end of the range of estimates from past performance, our annual forecast and three year strategic plan extended to year 4 and 5.
We
have performed sensitivity analyses around the base assumptions. There are no reasonably possible changes in a key assumption that would cause the carrying amount to exceed the recoverable amount.
Property, plant and equipment is measured at cost including eligible borrowing costs less depreciation and accumulated
impairment losses.
Depreciation is provided on a straight-line basis over the expected average useful lives of the assets. Residual
values are reviewed at least annually. Estimated useful lives by major class of assets are as follows:
• Freehold buildings (no depreciation on freehold land)
40 years
• Leasehold land and buildings
40 years (or life of lease if less)
• Plant and equipment
2–20 years
Property, plant and equipment is subject to review for impairment if triggering
events or circumstances indicate that this is necessary. If an indication of impairment exists, the asset’s or cash generating unit’s recoverable amount is estimated and any impairment loss is charged to the income statement as it arises.
€ million
€ million
€ million
Land and
Plant and
Movements during 2018
buildings
equipment
Total
Cost
1 January 2018
4,462
14,936
19,398
Hyperinflation restatement to 1 January 2018
37
182
219
Acquisitions of group companies
11
31
42
Additions
249
1,091
1,340
Disposals
(97
)
(607
)
(704
)
Hyperinflationary adjustment
49
93
142
Currency retranslation
(91
)
(351
)
(442
)
Reclassification as held for sale
(17
)
(54
)
(71
)
31 December 2018
4,603
15,321
19,924
Accumulated depreciation
1 January 2018
(1,429
)
(7,558
)
(8,987
)
Hyperinflation restatement to 1 January 2018
(10
)
(106
)
(116
)
Depreciation charge for the year
(125
)
(1,066
)
(1,191
)
Disposals
62
529
591
Hyperinflationary adjustment
(7
)
(53
)
(60
)
Currency retranslation
15
128
143
Reclassification as held for sale
10
33
43
31 December 2018
(1,484
)
(8,093
)
(9,577
)
Net book value 31 December 2018(a)
3,119
7,228
10,347
Includes capital expenditures for assets under
construction
130
956
1,086
(a)
Includes €302 million of freehold land.
The Group has commitments to purchase property, plant and equipment of €324 million
(2017: €323 million).
Includes capital expenditures for assets under
construction
93
972
1,065
(a)
Includes €548 million in property plant and equipment related
to the Spreads business.
(b)
Includes €247 million of freehold land.
11. OTHER NON-CURRENT ASSETS
Joint ventures are undertakings in which the Group has an interest and which are jointly controlled by the Group and one
or more other parties. Associates are undertakings where the Group has an investment in which it does not have control or joint control but can exercise significant influence.
Interests in joint ventures and associates are accounted for using the equity method and are stated in the consolidated balance sheet at
cost, adjusted for the movement in the Group’s share of their net assets and liabilities. The Group’s share of the profit or loss after tax of joint ventures and associates is included in the Group’s consolidated profit before
taxation.
Where the Group’s share of losses exceeds its interest in the equity accounted investee, the carrying amount of the
investment is reduced to zero and the recognition of further losses is discontinued, except to the extent that the Group has an obligation to make payments on behalf of the investee.
Biological assets are measured at fair value less costs to sell with any changes recognised in the income statement.
€ million
€ million
2018
2017
Interest in net assets of joint ventures
14
32
Interest in net assets of associates
40
44
Long-term trade and other receivables(a)
307
265
Operating lease prepayments for land
118
116
Fair value of biological assets
18
17
Other non-current
assets(b)
151
83
648
557
(a)
Mainly relates to indirect tax receivables where we do not have the contractual right to receive payment within 12 months.
Our principal joint ventures are Unilever FIMA LDA for Portugal, the Pepsi/Lipton Partnership for the US and Pepsi Lipton
International for the rest of the world.
(b)
In 2018, includes capital reduction in joint venture of Unilever FIMA LDA for
€64 million.
(c)
Associates as at 31 December 2018 primarily comprise our investments in Langholm Capital Partners.
The joint ventures and associates have no contingent liabilities to which the Group is exposed, and the Group has no contingent liabilities in
relation to its interests in the joint ventures and associates.
The Group has no outstanding capital commitments to joint ventures.
Outstanding balances with joint ventures and associates are shown in note 23 on page 126.
12. INVENTORIES
Inventories are valued at the lower of weighted average cost and net realisable value. Cost comprises direct costs and,
where appropriate, a proportion of attributable production overheads. Net realisable value is the estimated selling price less the estimated costs necessary to make the sale.
Inventories
€ million 2018
€ million 2017
Raw materials and consumables
1,365
1,274
Finished goods and goods for resale
2,936
2,688
4,301
3,962
Inventories with a value of €124 million (2017: €92 million) are carried at net realisable value, this being lower than cost. During 2018 €92 million (2017: €109 million) was charged to the income statement for damaged, obsolete and lost inventories. In 2018 €72 million (2017: €90 million) was utilised or released to the income statement from inventory provisions taken in earlier years.
13. TRADE AND OTHER CURRENT RECEIVABLES
Trade and other current receivables are initially recognised at fair value plus any directly attributable transaction
costs. Subsequently these assets are held at amortised cost, using the effective interest method and net of any impairment losses.
We do not consider the fair
values of trade and other current receivables to be significantly different from their carrying values. Concentrations of credit risk with respect to trade receivables are limited, due to the Group’s customer base being large and diverse. Our
historical experience of collecting receivables, supported by the level of default, is that credit risk is low across territories and so trade receivables are considered to be a single class of financial assets. Impairment for trade receivables are
calculated for specific receivables with known or anticipated issues affecting the likelihood of recovery and for balances past due with a probability of default based on historical data as well as relevant forward-looking information.
2018 includes €677 million due from KKR as a result of an
arrangement following the sale of the global spreads business (excluding Southern Africa). Unilever will provide services to KKR including IT infrastructure, bookkeeping, payroll, marketing and co-packing for up to two years from completion of the
disposal and KKR pays Unilever for materials sourced on its behalf. See also trade payables on page 104.
Included within trade receivables are
rebates payable to customers of €3,062 million (2017: €2,766 million). Other receivables comprise financial assets of €299 million (2017: €281 million), and non-financial assets of
€1,142 million (2017: €1,050 million). Financial assets include supplier and customer deposits, employee advances and certain
derivatives. Non-financial assets mainly consist of reclaimable sales tax.
Ageing of trade receivables
€ million 2018
€ million 2017
Total trade receivables
4,538
3,599
Less impairment provision for trade receivables
(188
)
(160
)
4,350
3,439
Of which:
Not overdue
3,440
2,714
Past due less than three months
747
621
Past due more than three months but less than six months
132
95
Past due more than six months but less than one year
74
59
Past due more than one year
145
110
Impairment provision for trade receivables
(188
)
(160
)
4,350
3,439
Impairment provision for total trade and other receivables
€ million
2018
€ million 2017
1 January
184
166
Charge to income statement
65
51
Reduction/releases
(29
)
(21
)
Currency translations
(6
)
(12
)
31 December
214
184
The total impairment provision includes €188 million (2017: €160 million) for current trade receivables, €13 million (2017: €10 million) for other
current receivables and €13 million (2017: €14 million) for non-current trade and other
receivables.
14. TRADE PAYABLES AND OTHER LIABILITIES
TRADE PAYABLES
Trade payables are initially recognised at fair value less any directly attributable transaction costs. Trade payables are subsequently
measured at amortised cost, using the effective interest method.
OTHER LIABILITIES
Other liabilities are initially recognised at fair value less any directly attributable transaction costs. Subsequent measurement depends
on the type of liability:
•
Accruals are subsequently measured at amortised cost, using the effective interest method.
•
Social security and sundry taxes are subsequently measured at amortised cost, using the effective interest method.
•
Deferred consideration is subsequently measured at fair value with changes in the income statement as explained below.
•
Others are subsequently measured either at amortised cost, using the effective interest method or at fair value, with
changes being recognised in the income statement.
Deferred Consideration
Deferred consideration represents any payments to the sellers of a business that occur after the acquisition date. These typically
comprise of contingent consideration and fixed deferred consideration:
•
Fixed deferred consideration is a payment with a due date after acquisition that is not dependent on future conditions
•
Contingent consideration is a payment which is dependent on certain conditions being met in the future and is often variable
All deferred consideration is initially
recognised at fair value as at the acquisition date, which includes a present value discount. Subsequently, deferred consideration is measured to reflect the unwinding of discount on the liability, with changes recognised in finance cost within the
income statement. In the balance sheet it is remeasured to reflect the latest estimate of the achievement of the conditions on which the consideration is based; changes in value other than the discount unwind are recognised as acquisition and
disposal-related costs within non-underlying items in the income statement.
We do not consider the fair values of trade
payables and other liabilities to be significantly different from their carrying values.
14. TRADE PAYABLES AND OTHER LIABILITIES CONTINUED
Trade payables and other liabilities
€ million 2018
€ million 2017
Current: due within one year
Trade payables(a)
9,121
8,217
Accruals
3,724
3,666
Social security and sundry taxes
498
539
Deferred consideration
14
26
Others
1,100
978
14,457
13,426
Non-current: due after more than one year
Accruals
121
146
Deferred consideration
173
485
Others
52
69
346
700
Total trade
14,803
14,126
(a)
2018 includes €311 million due to KKR as a result of an
arrangement following the sale of the global spreads business (excluding Southern Africa). Unilever will provide certain services for up to two years from completion of the disposal and pays KKR for amounts collected on its behalf. See also trade
receivables on page 103.
Included in others are certain derivatives, withholding tax on dividends and third-party payables related to audit and
agency fees.
Deferred Consideration
At 31 December 2018 the total
balance of deferred consideration for acquisitions is €187 million (2017: €511 million), of which contingent consideration is €142 million (2017: €445 million). These contingent consideration payments fall due up until 2024 with a maximum possible total payment of €1,082 million. The movement during 2018 is mainly due to release of contingent consideration relating to Blueair which arose from early settlement through cash payment of €122 million and a non-cash credit to operating profit of €277 million.
15. CAPITAL AND FUNDING
ORDINARY SHARES
Ordinary shares are classified as equity. Incremental costs directly attributable to the issue of ordinary shares are recognised as a
deduction from equity, net of any tax effects.
INTERNAL HOLDINGS
The ordinary shares numbered 1 to 2,400 (inclusive) in NV (‘Special Shares’) and deferred stock of PLC are held as to one half
of each class by N.V. Elma – a subsidiary of NV – and one half by United Holdings Limited – a subsidiary of PLC. This capital is eliminated on consolidation.
SHARE-BASED COMPENSATION
The Group operates a number of share-based compensation plans involving options and awards of ordinary shares of NV and PLC. Full details
of these plans are given in note 4C on pages 92 and 93.
OTHER RESERVES
Other reserves include the fair value reserve, the foreign currency translation reserve, the capital redemption reserve and treasury
shares.
SHARES HELD BY EMPLOYEE SHARE TRUSTS AND GROUP COMPANIES
Certain PLC trusts, NV and group companies purchase and hold NV and PLC shares to satisfy performance shares granted, share options
granted and other share awards (see note 4C). The assets and liabilities of these trusts and shares held by group companies are included in the consolidated financial statements. The book value of shares held is deducted from other reserves, and
trusts’ borrowings are included in the Group’s liabilities. The costs of the trusts are included in the results of the Group. These shares are excluded from the calculation of earnings per share.
FINANCIAL LIABILITIES
Financial liabilities are initially recognised at fair value, less any directly related transaction costs. Certain bonds are designated
as being part of a fair value hedge relationship. In these cases, the bonds are carried at amortised cost, adjusted for the fair value of the risk being hedged, with changes in value shown in profit and loss. Other financial liabilities, excluding
derivatives, are subsequently carried at amortised cost, with the exception of:
•
Financial liabilities which the group has elected to measure at fair value through profit or loss;
•
Derivative financial liabilities – see note 16 on page 110
The Group’s Treasury activities are designed to:
•
maintain a competitive balance sheet in line with at least A/A2 rating (see below);
•
secure funding at lowest costs for the Group’s operations, M&A activity and external dividend payments (see below);
•
protect the Group’s financial results and position from financial risks (see note 16);
•
maintain market risks within acceptable parameters, while optimising returns (see note 16); and
•
protect the Group’s financial investments, while maximising returns (see note 17).
The Treasury department provides central deposit taking, funding and foreign exchange management services for the Group’s operations. The department
is governed by standards and processes which are approved by Unilever Leadership Executive (ULE). In addition to guidelines and exposure limits, a system of authorities and extensive independent reporting covers all major areas of activity.
Performance is monitored closely by senior management. Reviews are undertaken periodically by corporate audit.
Key instruments used by the treasury department are:
•
short-term and long-term borrowings;
•
cash and cash equivalents; and
•
plain vanilla derivatives, including interest rate swaps and foreign exchange contracts.
The Treasury department maintains a list of approved financial instruments. The use of any new instrument must be approved by the Chief Financial Officer. The use of
leveraged instruments is not permitted.
Unilever considers the following components of its balance sheet to be managed capital:
•
total equity – retained profit, other reserves, share capital, share premium,
non-controlling interests (notes 15A and 15B);
•
short-term debt – current financial liabilities (note 15C); and
The Group manages its capital so as to safeguard its ability to continue as a going concern and to optimise returns to our shareholders through an
appropriate balance of debt and equity. The capital structure of the Group is based on management’s judgement of the appropriate balance of key elements in order to meet its strategic and day-to-day needs. We consider the amount of capital in proportion to risk and manage the capital structure in light of changes in economic conditions and the risk characteristics of the underlying assets.
Our current long-term credit rating is A+/A1 and our short-term credit rating is A1/P1. We aim to maintain a competitive balance sheet which we consider to be the
equivalent of a credit rating of at least A/A2 in the long term. This provides us with:
•
appropriate access to the debt and equity markets;
•
sufficient flexibility for acquisitions;
•
sufficient resilience against economic and financial uncertainty while ensuring ample liquidity; and
•
optimal weighted average cost of capital, given the above constraints.
Unilever monitors the qualitative and quantitative factors utilised by the rating agencies. This information is publicly available and is updated by the credit rating
agencies on a regular basis.
15A. SHARE CAPITAL
Authorised
(a)
Issued, called up and fully paid
(b)
Authorised
(a)
Issued, called up and fully paid
(b)
2018
2018
2017
2017
Unilever N.V.
€ million
€ million
€ million
€ million
NV ordinary shares of €0.16 each
480
274
480
274
NV ordinary shares of €428.57 each (shares numbered 1
to 2,400 – Special Shares’)
1
1
1
1
Internal holdings eliminated on consolidation (€428.57
shares)
–
(1
)
–
(1
)
481
274
481
274
Unilever PLC
£ million
€ million
PLC ordinary shares of 31/9p each
40.8
40.8
PLC deferred stock of £1 each
0.1
0.1
Internal holding eliminated on consolidation (£1 stock)
(0.1
)
(0.1
)
Cancellation of treasury shares(c)
(3.8
)
–
37.0
40.8
€ million
€ million
Euro equivalent in millions (at £1.00 = €5.143)(d)
190
210
Unilever Group
€ million
€ million
Ordinary share capital of NV
274
274
Ordinary share capital of PLC
190
210
464
484
(a)
At 31 December 2018 Unilever N.V. had 3,000,000,000 (2017: 3,000,000,000) authorised ordinary shares. The requirement
for a UK company to have an authorised share capital was abolished by the UK Companies Act 2006. In May 2010 Unilever PLC shareholders approved new Articles of Association to reflect this.
(b)
At 31 December 2018 the following quantities of shares were in issue: 1,714,727,700 of NV ordinary shares; 2,400 of
NV Special Shares; 1,187,191,284 of PLC ordinary shares and 100,000 of PLC deferred stock. At 31 December 2017, 1,714,727,700 of NV ordinary shares; 2,400 of NV Special Shares; 1,310,156,361 of PLC ordinary shares and 100,000 of PLC deferred
stock were in issue.
(c)
At 31 December 2018 122,965,077 of PLC ordinary shares that were repurchased as part of the share buyback programme
in 2018 and prior years, were cancelled. And 24,334,848 shares have not been cancelled and are recognised as treasury shares.
(d)
Conversion rate for PLC ordinary shares nominal value to euros is £1 =
€5.143 (which is calculated by dividing the nominal value of NV ordinary shares by the nominal value of PLC ordinary shares).
For information on the rights of shareholders of NV and PLC and the operation of the Equalisation Agreement, see the Corporate Governance report on pages 36 to 42.
A nominal dividend of 6% per annum is paid on the deferred stock of PLC.
Unilever is the majority shareholder of all material subsidiaries and has control in all cases. Information in relation to significant subsidiaries is provided on page
127.
SUBSIDIARIES WITH SIGNIFICANT NON-CONTROLLING INTERESTS
Unilever has one subsidiary company which has a material non-controlling interest, Hindustan Unilever Limited (HUL). Summary
financial information in relation to HUL is shown below.
€ million
€ million
HUL balance sheet as at 31 December
2018
2017
Non-current assets
881
819
Current assets
1,333
1,274
Current liabilities
(1,130
)
(1,030
)
Non-current
liabilities
(190
)
(135
)
HUL comprehensive income for the year ended 31 December
Turnover
4,527
4,464
Profit after tax
617
595
Total comprehensive income
576
529
HUL cash flow for the year ended 31 December
Net increase/(decrease) in cash and cash-equivalents
14
(71
)
HUL non-controlling interest
1 January
(288
)
(282
)
Share of (profit)/loss for the year ended 31 December
(203
)
(195
)
Other comprehensive income
(4
)
(3
)
Dividend paid to the non-controlling interest
183
172
Other changes in equity
–
–
Currency translation
13
20
31 December
(299
)
(288
)
CONSOLIDATED STATEMENT OF CHANGES IN EQUITY: ANALYSIS OF OTHER RESERVES
€ million
€ million
€ million
Total
Total
Total
2018
2017
2016
Fair value reserves
(194
)
(189
)
(113
)
Equity instruments(a)
98
–
–
Cash flow hedges
(292
)
(236
)
(168
)
Available-for-sale financial
assets
–
47
55
Currency retranslation of group companies – see following table
(4,764
)
(3,927
)
(3,034
)
Adjustment on translation of PLC’s ordinary capital at
31/9p = €0.16
(150
)
(164
)
(164
)
Capital redemption reserve
32
32
32
Book value of treasury shares – see following table
(10,181
)
(9,208
)
(4,164
)
Hedging gains/(losses) transferred to non-financial assets(a)
71
–
–
Other(b)
(100
)
(177
)
–
(15,286
)
(13,633
)
(7,443
)
(a)
Classification has changed following adoption of IFRS 9. See note 1 for further details.
(b)
Relates to option on purchase of subsidiary for non-controlling interest and
hyperinflation adjustment arising on current year profit translated at closing exchange rate.
Unilever acquired 66,202,168 (2017: 53,003,099) NV
ordinary shares and 65,458,433 (2017: 53,359,284) PLC shares through purchases on the stock exchanges during the year, which includes the share buyback programme as explained in note 24. 122,965,077 of PLC ordinary shares were cancelled and the
remaining shares were held as treasury shares as a separate component of other reserves.
The total number of treasury shares held at 31 December 2018 was
263,349,111 (2017: 201,538,909) NV shares and 24,334,848 (2017: 84,463,561) PLC shares. Of these, 9,336,215 NV shares and 5,674,214 PLC shares were held in connection with share-based compensation plans (see note 4C on pages 92 to 93).
Currency retranslation reserve – movements during the year
2018
2017
1 January
(3,927
)
(3,034
)
Currency retranslation during the year
(843
)
(50
)
Movement in net investment hedges and exchange differences in net investments in foreign operations
77
(909
)
Recycled to income statement
(71
)
66
31 December
(4,764
)
(3,927
)
STATEMENT OF COMPREHENSIVE INCOME: OTHER COMPREHENSIVE INCOME RECONCILIATION
€ million
€ million
Fair value gains/(losses) on financial instruments – movement during the year
2018
2017
1 January
(189
)
(113
)
Equity instruments
51
–
Cash flow hedges
(55
)
(68
)
Available for sale financial assets
–
(8
)
31 December
(193
)
(189
)
Refer to the consolidated statement of comprehensive income on page 75, the consolidated statement of changes in equity on page 76, and note
6C on page 96.
€ million
€ million
Remeasurement of defined benefit pension plans net of tax
2018
2017
1 January
(1,171
)
(2,453
)
Movement during the year
(328
)
1,282
31 December
(1,499
)
(1,171
)
Refer to the consolidated statement of comprehensive income on page 75, the consolidated statement of changes in equity on page 76, note 4B
from page 87 to 92 and note 6C on page 96.
€ million
€ million
Currency retranslation gains/(losses) – movement during the year
For the purposes of this note and note 17A, financial assets and liabilities exclude trade and other current receivables
and trade payables and other liabilities which are covered in notes 13 and 14 respectively.
(b)
Financial liabilities include €5 million (2017: €1 million) of secured liabilities.
(c)
Includes options and other financial liabilities to acquire non-controlling
interests in EAC Myanmar, refer to note 21.
RECONCILIATION OF LIABILITIES ARISING FROM FINANCING ACTIVITIES
Non-cash movement
Opening
Cash
Business
Foreign
Fair
Other
Closing
balance at
movement
acquisitions/
exchange
value
movements
balance at
1 January
disposals
changes
changes
31 December
Movements in 2018 and 2017
€ million
€ million
€ million
€ million
€ million
€ million
€ million
2018
Bank loans and overdrafts(a)
(992
)
158
(10
)
17
–
13
(814
)
Bonds and other loans(a)
(22,709
)
(135
)
–
(543
)
–
(4
)
(23,391
)
Finance lease creditors
(131
)
10
–
1
–
(8
)
(128
)
Derivatives
(421
)
–
–
–
19
–
(402
)
Other financial liabilities
(177
)
51
–
10
(4
)
(30
)
(150
)
Total
(24,430
)
84
(10
)
(515
)
15
(29
)
(24,885
)
2017
Preference shares
(68
)
68
–
–
–
–
–
Bank loans and overdrafts(a)
(1,146
)
66
(3
)
98
–
(7
)
(992
)
Bonds and other loans(a)
(15,053
)
(9,008
)
–
1,346
(2
)
8
(22,709
)
Finance lease creditors
(143
)
14
–
6
–
(8
)
(131
)
Derivatives
(185
)
–
–
–
(236
)
–
(421
)
Other financial liabilities(a)
–
–
–
–
–
(177
)
(177
)
Total
(16,595
)
(8,860
)
(3
)
1,450
(238
)
(184
)
(24,430
)
(a)
These cash movements are included within the following lines in the consolidated cash flow statement: net change in
short-term liabilities, additional financial liabilities and repayment of financial liabilities. The difference of €2 million (2017: €1
million) represents cash movements in overdrafts that are not included in financing cash flows.
Of which €Nil (2017:
€2 million) relates to a fair value adjustment following the fair value hedge accounting of a fixed-for-floating
interest rate swap.
Information in relation to the derivatives used to hedge bonds and other loans within a fair value hedge relationship is shown
in note 16.
Derivatives are measured at fair value with any related transaction costs expensed as incurred. The treatment of changes in the value of
derivatives depends on their use as explained below.
(I) FAIR VALUE HEDGES(a)
Certain derivatives are held to hedge the risk of changes in value of a specific bond or other loan. In these situations, the Group
designates the liability and related derivative to be part of a fair value hedge relationship. The carrying value of the bond is adjusted by the fair value of the risk being hedged, with changes going to the income statement. Gains and losses on the
corresponding derivative are also recognised in the income statement. The amounts recognised are offset in the income statement to the extent that the hedge is effective. When the relationship no longer meets the criteria for hedge accounting, the
fair value hedge adjustment made to the bond is amortised to the income statement using the effective interest method.
(II) CASH FLOW HEDGES(a)
Derivatives are also held to hedge the uncertainty in timing or amount of
future forecast cash flows. Such derivatives are classified as being part of cash flow hedge relationships. For an effective hedge, gains and losses from changes in the fair value of derivatives are recognised in equity. Cost of hedging, where
material and opted for, is recorded in a separate account within equity. Any ineffective elements of the hedge are recognised in the income statement. If the hedged cash flow relates to a non-financial asset,
the amount accumulated in equity is subsequently included within the carrying value of that asset. For other cash flow hedges, amounts deferred in equity are taken to the income statement at the same time as the related cash flow.
When a derivative no longer qualifies for hedge accounting, any cumulative gain or loss remains in equity until the related cash flow
occurs. When the cash flow takes place, the cumulative gain or loss is taken to the income statement. If the hedged cash flow is no longer expected to occur, the cumulative gain or loss is taken to the income statement immediately.
(III) NET INVESTMENT HEDGES(a)
Certain derivatives are designated as hedges of the currency risk on the Group’s investment in foreign subsidiaries. The accounting
policy for these arrangements is set out in note 1.
(IV) DERIVATIVES FOR WHICH HEDGE ACCOUNTING IS NOT APPLIED
Derivatives not classified as hedges are held in order to hedge certain balance sheet items and commodity exposures.
No hedge accounting is applied to these derivatives, which are carried at fair value with changes being recognised in the income statement.
(a)
Applying hedge accounting has not led to material ineffectiveness being recognised in the income statement for both 2018
and 2017.
The Group is exposed to the following risks that arise from its use of financial instruments, the management of which is described in the
following sections:
•
liquidity risk (see note 16A);
•
market risk (see note 16B); and
•
credit risk (see note 17B).
16A. MANAGEMENT OF LIQUIDITY RISK
Liquidity risk is the risk that the Group will face
in meeting its obligations associated with its financial liabilities. The Group’s approach to managing liquidity is to ensure that it will have sufficient funds to meet its liabilities when due without incurring unacceptable losses. In doing
this, management considers both normal and stressed conditions. A material and sustained shortfall in our cash flow could undermine the Group’s credit rating, impair investor confidence and also restrict the Group’s ability to raise funds.
The Group maintained a cautious funding strategy. This was the result of cash delivery from the business, coupled with the proceeds from bond issuances. This cash
has been invested conservatively with low risk counter-parties at maturities of less than six months.
Cash flow from operating activities provides the funds to
service the financing of financial liabilities on a day-to-day basis. The Group seeks to manage its liquidity requirements by maintaining access to global debt markets
through short-term and long-term debt programmes. In addition, Unilever has committed credit facilities for general corporate use.
On 31 December 2018 Unilever
had undrawn revolving 364-day bilateral credit facilities in aggregate of $7,865 million (2017: $7,865 million) with a 364-day term out. As part of the regular
annual process, the intention is that these facilities will again be renewed in 2019.
The following table shows Unilever’s contractually agreed undiscounted cash flows, including expected interest
payments, which are payable under financial liabilities at the balance sheet date:
The following table shows cash flows for which cash flow hedge accounting is applied. The derivatives in the cash flow
hedge relationships are expected to have an impact on profit and loss in the same periods as the cash flows occur.
€ million
€ million
€ million
€ million
€ million
€ million
€ million
€ million
Due
Due
Due
Due
Net carrying
Due
between
between
between
between
Due
amount of
within
1 and
2 and
3 and
4 and
after
related
1 year
2 years
3 years
4 years
5 years
5 years
Total
derivatives
(a)
2018
Foreign exchange cash inflows
3,426
–
–
–
–
–
3,426
–
Foreign exchange cash outflows
(3,435
)
–
–
–
–
–
(3,435
)
14
Interest rate swaps cash inflows
103
795
433
1,158
525
1,406
4,420
–
Interest rate swaps cash outflows
(23
)
(756
)
(347
)
(1,147
)
(464
)
(1,423
)
(4,160
)
(199
)
Commodity contracts cash flows
(74
)
–
–
–
–
–
(74
)
(74
)
2017
Foreign exchange cash inflows
3,510
–
–
–
–
–
3,510
–
Foreign exchange cash outflows
(3,536
)
–
–
–
–
–
(3,536
)
(8
)
Interest rate swaps cash inflows
349
64
727
50
753
1,380
3.323
–
Interest rate swaps cash outflows
(319
)
(19
)
(753
)
(19
)
(797
)
(1,440
)
(3,347
)
(351
)
Commodity contracts cash flows
(19
)
–
–
–
–
–
(19
)
(7
)
(a)
See note 16C.
16B.
MANAGEMENT OF MARKET RISK
Unilever’s size and operations result in it being exposed to the following market risks that arise from its use of financial
instruments:
•
commodity price risk;
•
currency risk; and
•
interest rate risk.
The above risks may affect the Group’s income and expenses, or the value of its financial instruments. The objective of the Group’s management of market risk is
to maintain this risk within acceptable parameters, while optimising returns. Generally, the Group applies hedge accounting to manage the volatility in profit and loss arising from market risk.
The Group’s exposure to, and management of, these risks is explained below. It often includes derivative financial instruments, the uses of which are described in
note 16C.
POTENTIAL IMPACT OF RISK
MANAGEMENT POLICY AND
HEDGING STRATEGY
SENSITIVITY TO THE RISK
(I) COMMODITY PRICE RISK
The Group is exposed to the risk of changes in
commodity prices in relation to its purchase of certain raw materials.
At 31 December 2018, the
Group had hedged its exposure to future commodity purchases with commodity derivatives valued at €580 million (2017: €382 million).
The
Group uses commodity forward contracts to hedge against this risk. All commodity forward contracts hedge future purchases of raw materials and the contracts are settled either in cash or by physical delivery.
Commodity derivatives are generally designated as hedging instruments in cash flow hedge accounting
relations. All commodity forward contracts are done in line with approvals from the Global Commodity Executive which is chaired by the Unilever Chief Supply Chain Officer (CSCO).
A 10% increase in commodity prices as at 31 December 2018 would have led to a €51 million gain on the commodity
derivatives in the cash flow hedge reserve (2017: €38 million gain in the cash flow hedge reserve). A decrease of 10% in commodity prices on a full–year basis would have the equal but
opposite effect.
(II) CURRENCY RISK
Currency risk on sales, purchases andborrowings
Because of Unilever’s global reach, it is subject to the risk that changes in foreign currency values impact the Group’s sales, purchases
and borrowings.
At 31 December 2018, the exposure to the Group from companies holding financial
assets and liabilities other than in their functional currency amounted to €105 million (2017: €45 million).
The
Group manages currency exposures within prescribed limits, mainly through the use of forward foreign currency exchange contracts.
Operating companies manage foreign exchange exposures within prescribed limits. Local compliance is monitored centrally.
Exchange risks related to the principal amounts of the US$and Swiss franc denominated debt either
form part of hedging relationships themselves, or are hedged through forward contracts.
The aim
of the Group’s approach to management of currency risk is to leave the Group with no material residual risk. This aim has been achieved in all years presented.
As an estimation of the approximate impact of the residual risk, with respect to financial instruments, the Group has calculated the impact of a 10% change in exchange
rates.
Impact on income statement
A 10% strengthening of the euro against key currencies to which the Group is exposed would have led to approximately an additional
€11 million gain in the income statement (2017: €5 million gain). A 10% weakening of the euro against these currencies would have led to an
equal but opposite effect.
The Group is also subject to
exchange risk in relation to the translation of the net investments of its foreign operations into euros for inclusion in its consolidated financial statements.
These net investments include Group financial loans, which are monetary items that form part of our net investment in foreign operations, of €7.5 billion (2017: €7.3 billion), of which €3.3 billion (2017: €3.4 billion) is denominated in GBP. In accordance with IAS 21, the exchange differences on these financial loans are booked through reserves.
Part of the currency exposure on the Group’s investments is also managed using US$ and Swiss
franc net investment hedges with a nominal value of €4.4 billion (2017: €3.9 billion) for US$ and €(1.3) billion (2017: €(1.1) billion) for Swiss francs.
At 31 December 2018, the net exposure of the net investments in foreign currencies amounts to
€14.5 billion (2017: €16.2 billion).
Unilever aims to minimise this foreign investment exchange exposure by borrowing in local currency in the operating companies themselves. In some locations, however, the
Group’s ability to do this is inhibited by local regulations, lack of local liquidity or by local market conditions.
Where the residual risk from these countries exceeds prescribed limits, Treasury may decide on a
case-by-case basis to actively hedge the exposure. This is done either through additional borrowings in the related currency, or through the use of forward foreign
exchange contracts.
Where local currency borrowings, or forward contracts, are used to hedge
the currency risk in relation to the Group’s net investment in foreign subsidiaries, these relationships are designated as net investment hedges for accounting purposes.
Impact on equity – trade-related cash flow hedges
A 10% strengthening of
the euro against other currencies would have led to €146 million loss (out of which €93 million loss would relate to strengthening
against US Dollar) [2017: €210 million (out of which €152 million loss would relate to strengthening against US Dollar)] on hedges used
to cover future trade cash flows to which cash flow hedge accounting is applied.
A 10%
weakening of the euro against other currencies would have led to an equal but opposite effect.
Impact on equity – net investment hedges
A 10% strengthening of the euro
against other currencies would have led to a €312 million (2017: €277 million) loss on the net investment hedges used to manage the
currency exposure on the Group’s investments.
A 10% weakening of the euro against other
currencies would have led to an equal but opposite effect.
Impact on equity – net
investments in group companies
A 10% strengthening of the euro against all other currencies would have led to a
€1,455 million negative retranslation effect (2017: €1,619 million negative retranslation effect). A 10% weakening of the euro against
those currencies would have led to an equal but opposite effect. In line with accepted hedge accounting treatment and our accounting policy for financial loans, the retranslation differences would be recognised in equity.
(III) INTEREST RATE RISK(a)
The Group is exposed to market interest rate fluctuations on its floating rate debt. Increases in benchmark interest rates could increase the interest cost of our
floating-rate debt and increase the cost of future borrowings. The Group’s ability to manage interest costs also has an impact on reported results.
Taking into account the impact of interest rate swaps, at 31 December 2018, interest rates were fixed on approximately 99% of the expected net debt for 2019, and 85%
for 2020 (76% for 2018 and 63% for 2019 at 31 December 2017).
For interest management
purposes, transactions with a maturity shorter than six months from inception date are not included as fixed interest transactions.
The average interest rate on short-term borrowings in 2018 was 0.9% (2017: 0.9%).
Unilever’s interest rate management approach aims for an optimal balance between fixed and floating-rate interest rate exposures on expected net debt. The objective
of this approach is to minimise annual interest costs after tax and to reduce volatility.
This
is achieved either by issuing fixed or floating-rate long-term debt, or by modifying interest rate exposure through the use of interest rate swaps.
Furthermore, Unilever has interest rate swaps for which cash flow hedge accounting is applied.
Impact on income statement
Assuming that all other variables remain constant, a
1 percentage point increase in floating interest rates on a full-year basis as at 31 December 2018 would have led to an additional €8 million of finance income (2017: €41 million additional finance costs).
A 1
percentage point decrease in floating interest rates on a full-year basis would have an equal but opposite effect.
Impact on equity – cash flow hedges
Assuming that all other variables
remain constant, a 1 percentage point increase in interest rates on a full-year basis as at 31 December 2018 would have led to an additional €17 million credit in equity from derivatives in
cash flow hedge relationships (2017: €23 million credit).
A 1 percentage point decrease in interest rates on a full-year basis would have led to an additional
€19 million debit in equity from derivatives in cash flow hedge relationships (2017: €28 million debit).
(a)
See the weighted average amount of net debt with fixed rate interest shown in the following table.
The following table shows the split in fixed and floating-rate interest exposures, taking into account the impact of
interest rate swaps and cross-currency swaps:
€ million 2018
€ million 2017
Cash and cash equivalents
3,230
3,317
Current other financial assets
874
770
Current financial liabilities
(3,235
)
(7,968
)
Non-current financial liabilities
(21,650
)
(16,462
)
Net debt
(20,781
)
(20,343
)
Of which:
Fixed rate (weighted average amount of fixing for the following
year)
(21,586
)
(16,216
)
16C. DERIVATIVES AND HEDGING
The Group does not use
derivative financial instruments for speculative purposes. The uses of derivatives and the related values of derivatives are summarised in the following table. Derivatives used to hedge:
€ million
€ million
€ million
€ million
€ million
€ million
Trade
and other receivables
Financial assets
Trade payables
and other liabilities
Current financial liabilities
Non- current financial liabilities
Total
31 December 2018
Foreign exchange derivatives
Fair value hedges
–
–
–
–
–
–
Cash flow hedges
39
–
(25)
–
–
14
Hedges of net investments in foreign operations
–
58
(a)
–
(21
)(a)
–
37
Hedge accounting not applied
42
67
(a)
(41)
(105
)(a)
–
(37
)
Cross-currency Interest rate swaps
Fair value hedges
–
–
–
–
–
–
Cash flow hedges
–
69
–
–
(268
)
(199
)
Hedge accounting not applied
–
–
–
–
(8
)
(8
)
Commodity contracts
Cash flow hedges
–
–
(74)
–
–
(74
)
Hedge accounting not applied
1
–
–
–
–
1
82
194
(140)
(126
)
(276
)
(266
)
Total assets
276
Total liabilities
(542
)
(266
)
31 December 2017
Foreign exchange derivatives
Fair value hedges
–
–
–
–
–
–
Cash flow hedges
32
–
(40)
–
–
(8
)
Hedges of net investments in foreign operations
–
9
(a)
–
(103
)(a)
–
(94
)
Hedge accounting not applied
13
73
(a)
(54)
35
(a)
–
67
Cross-currency Interest rate swaps
Fair value hedges
–
2
–
–
–
2
Cash flow hedges
–
2
–
(18
)
(335
)
(351
)
Hedge accounting not applied
–
30
–
–
–
30
Commodity contracts
Cash flow hedges
12
–
(19)
–
–
(7
)
Hedge accounting not applied
–
–
–
–
–
–
57
116
(113)
(86
)
(335
)
(361
)
Total assets
173
Total liabilities
(534
)
(361
)
(a)
Swaps that hedge the currency risk on intra-group loans and offset ‘Hedges of net investments in foreign
operations’ are included within ‘Hedge accounting not applied’. See below for further details.
A number of legal entities within our Group enter into derivative transactions under International Swap and Derivatives Association (ISDA) master netting agreements. In
general, under such agreements the amounts owed by each counter-party on a single day in respect of all transactions outstanding in the same currency are aggregated into a single net amount that is payable by one party to the other. In certain
circumstances, such as when a credit event such as a default occurs, all outstanding transactions under the agreement are terminated, the termination value is assessed and only a single net amount is payable in settlement of all transactions.
The ISDA agreements do not meet the criteria for offsetting the positive and negative values in the consolidated balance sheet. This is because the Group does not have
any currently legally enforceable right to offset recognised amounts, between various Group and bank affiliates, because the right to offset is enforceable only on the occurrence of future credit events such as a default.
The column ‘Related amounts not set off in the balance sheet – Financial instruments’ shows the netting impact of our ISDA agreements, assuming the
agreements are respected in the relevant jurisdiction.
(I) FINANCIAL ASSETS
The following financial assets are subject to offsetting, enforceable master netting arrangements and similar agreements.
Related amounts not set
off in the balance sheet
€ million
€ million
€ million
€ million
€ million
€ million
Gross
amounts of recognised
Gross
amounts of recognised financial
assets set
off in the
Net amounts of financial assets
presented
in the
Cash
As at 31 December 2018
financial
assets
balance
sheet
balance
sheet
Financial
instruments
collateral received
Net amount
Derivative financial assets
339
(63
)
276
(164
)
(10
)
102
As at 31 December 2017
Derivative financial assets
276
(103
)
173
(108
)
(6
)
59
(II) FINANCIAL LIABILITIES
The following
financial liabilities are subject to offsetting, enforceable master netting arrangements and similar agreements.
Cash and cash equivalents in the balance sheet include deposits, investments in money market funds and highly liquid investments. To be
classified as cash and cash equivalents, an asset must:
•
be readily convertible into cash;
•
have an insignificant risk of changes in value; and
•
have a maturity period of three months or less at acquisition.
Cash and cash equivalents in the cash flow statement also include bank overdrafts and are
recorded at amortised cost.
OTHER FINANCIAL ASSETS
The Group classifies its financial assets into the following measurement categories:
•
those to be measured subsequently at fair value (either through other comprehensive income, or through profit or loss), and
•
those to be measured at amortised cost.
This classification depends on our business model for managing the financial asset and the
contractual terms of the cash flows.
At initial recognition, the Group measures a financial asset at its fair value plus, in the
case of a financial asset not at fair value through profit or loss, transaction costs that are directly attributable to the acquisition of the financial asset. Transaction costs of financial assets carried at fair value through profit or loss are
expensed in profit or loss.
All financial assets are either debt instruments or equity instruments. Debt instruments are those that
provide the Group with a contractual right to receive cash or another asset. Equity instruments are those where the Group has no contractual right to receive cash or another asset.
Debt instruments
The
subsequent measurement of debt instruments depends on the Groups business model for managing the asset and the cash flow characteristics of the asset. There are three measurement categories that debt instruments are classified as:
•
amortised cost;
•
financial assets at fair value through other comprehensive income; or
•
financial assets at fair value through profit or loss.
(I) Amortised cost
Assets measured at amortised cost are those which are held to collect cash flows on the repayment of principal or interest. A gain or
loss on a debt investment recognised at amortised cost on de-recognition or impairment is recognised in profit or loss. Interest income is recognised within finance income using the effective interest rate
method.
(II) Fair value through other comprehensive income
Assets that are held at fair value through other comprehensive income are those that are held to collect cash flows on the repayment of
principal and interest or which are held to recognise a capital gain through the sale of the asset. Movements in the carrying amount are recognised in other comprehensive income except for the recognition of impairment, interest income and foreign
exchange gains or losses which are recognised in profit or loss. On de-recognition, the cumulative gain or loss recognised in other comprehensive income is reclassified from equity to profit or loss. Interest
income is included in finance income using the effective interest rate method.
(III) Fair value through profit or loss
Assets that do not meet the criteria for either amortised cost or fair value through other comprehensive income are
measured as fair value through profit or loss. Related transaction costs are expensed as incurred. Unless they form part of a hedging relationship, these assets are held at fair value, with changes being recognised in the income statement. Interest
income from these assets is included within finance income.
Equity instruments
The Group subsequently measures all equity instruments at fair value. Where the Group has elected to present fair value gains and losses
on equity investments in other comprehensive income, there is no subsequent reclassification of fair value gains or losses to profit or loss. Dividends from these investments continue to be recognised in profit or loss.
IMPAIRMENT OF FINANCIAL ASSETS
Financial instruments classified as amortised cost and debt instruments classified as fair value through other comprehensive income are
assessed for impairment. The Group assesses the probability of default of an asset at initial recognition and then whether there has been a significant increase in credit risk on an ongoing basis.
To assess whether there is a significant increase in credit risk the Group compares the risk of a default occurring on the asset as at
the reporting date with the risk of default as at the date of initial recognition. It considers available reasonable and supportive forwarding-looking information. Macroeconomic information (such as market interest rates or growth rates) is also
considered
Financial assets are written off when there is no reasonable expectation of recovery, such as a
debtor failing to engage in a repayment plan with the company. Impairment losses on assets classified as amortised cost are recognised in profit or loss. When a later event causes the impairment losses to decrease, the reduction in impairment loss
is also recognised in profit or loss. Permanent impairment losses on debt instruments classified as fair value through other comprehensive income are recognised in profit or loss.
The Group’s Treasury function aims to protect the
Group’s financial investments, while maximising returns. The fair value of financial assets is the same as the carrying amount for 2018 and 2017. The Group’s cash resources and other financial assets are shown below.
€ million
€ million
€ million
€ million
€ million
€ million
Non-
Non-
Current
current
Total
Current
current
Total
Financial assets(a)
2018
2018
2018
2017
2017
2017
Cash and cash equivalents
Cash at bank and in hand
2,174
–
2,174
1,904
–
1,904
Short-term deposits with maturity of less than three months
1,024
–
1,024
1,333
–
1,333
Other cash equivalents
32
–
32
80
–
80
3,230
–
3,230
3,317
–
3,317
Other financial assets
Amortised cost(b)
382
247
629
–
–
–
Financial assets at fair value through other comprehensive income(c)
154
175
329
–
–
–
Financial assets at fair value through profit or loss:
Derivatives
194
–
194
116
–
116
Other(d)
144
220
364
137
2
139
Held-to-maturity
investments
–
–
–
38
125
163
Loans and receivables
–
–
–
277
186
463
Available-for-sale financial
assets
–
–
–
202
362
564
874
642
1,516
770
675
1,445
Total
4,104
642
4,746
4,087
675
4,762
(a)
For the purposes of this note and note 15C, financial assets and liabilities exclude trade and other current receivables
and trade payables and other liabilities which are covered in notes 13 and 14 respectively.
(b)
Current amortised cost assets include short-term deposits with banks with maturities of longer than three months. These
are reclassified from loans and receivables under IAS 39, on adoption of IFRS9.
(c)
Current financial assets at fair value through other comprehensive income include Indian government securities.
Included within non-current financial assets at fair value through other comprehensive income are equity investments of €148 million. These
investments are not held by Unilever for trading purposes and hence the Group has opted to recognise fair value movements through other comprehensive income. These assets are reclassified from available-for-sale financial assets on adoption of IFRS 9. The fair value movement in 2018 of these equity investments was €(9) million.
(d)
Current other financial assets at fair value through profit or loss include A- or
higher rated money and capital market instruments. Included within non-current financial assets at fair value through profit or loss are assets in a trust to fund benefit obligations in the US (see also note
4B) of €59 million (2017: €63 million) and investments in a number of companies and financial institutions in Europe, Australia, India
and the US.
Other than changes arising on adoption of IFRS 9, there were no significant changes on account of change in business model in
classification of financial assets since 31 December 2017.
ADOPTION OF IFRS 9 – IMPACT ON MEASUREMENT OF OTHER FINANCIAL ASSETS
On the date of initial application of IFRS 9, 1 January 2018, financial assets of
€207 million previously measured at fair value through equity were reclassified as fair value through profit or loss. Fair value gains or losses on these financial assets were immaterial in
2017 and 2018. Financial assets of €6 million previously measured at fair value through profit or loss were reclassified to amortised cost under IFRS 9.
Cash and cash equivalents and trade receivables, which were classified as loans and other receivables under IAS 39, are classified as amortised cost under IFRS 9.
€ million
€ million
Cash and cash equivalents reconciliation to the cash flow statement
2018
2017
Cash and cash equivalents per balance sheet
3,230
3,317
Less: bank overdrafts
(140
)
(167
)
Add: cash and cash equivalents included in assets held for sale
–
19
Cash and cash equivalents per cash flow statement
3,090
3,169
Approximately €0.8 billion (or 26%) of the Group’s cash and cash
equivalents are held in the parent and central finance companies, for maximum flexibility. These companies provide loans to our subsidiaries that are also funded through retained earnings and third party borrowings. We maintain access to global debt
markets through an infrastructure of short and long-term debt programmes. We make use of plain vanilla derivatives, such as interest rate swaps and foreign exchange contracts, to help mitigate risks. More detail is provided in notes 16, 16A, 16B and
16C on pages 110 to 115.
The remaining €2.4 billion (74%) of the Group’s cash and cash equivalents
are held in foreign subsidiaries which repatriate distributable reserves on a regular basis. For most countries, this is done through dividends which are in some cases subject to withholding or distribution tax. This balance includes €154 million (2017: €206 million, 2016: €240 million) of cash that is held in a few
countries where we face cross-border foreign exchange controls and/or other legal restrictions that inhibit our ability to make these balances available for general use by the wider business. The cash will generally be invested or held in the
relevant country and, given the other capital resources available to the Group, does not significantly affect the ability of the Group to meet its cash obligations.
Credit risk is the risk of financial loss to the Group if a customer or counter-party fails to meet its contractual obligations. Additional information in relation to
credit risk on trade receivables is given in note 13. These risks are generally managed by local controllers. Credit risk related to the use of treasury instruments, including those held at amortised cost and at fair value through other
comprehensive income, is managed on a Group basis. This risk arises from transactions with financial institutions involving cash and cash equivalents, deposits and derivative financial instruments. The maximum exposure to credit risk at the
reporting date is the carrying value of each class of financial assets. To reduce this risk, Unilever has concentrated its main activities with a limited number of counter-parties which have secure credit ratings. Individual risk limits are set for
each counter-party based on financial position, credit rating and past experience. Credit limits and concentration of exposures are actively monitored by the Group’s treasury department. Netting agreements are also put in place with
Unilever’s principal counter-parties. In the case of a default, these arrangements would allow Unilever to net assets and liabilities across transactions with that counter-party. To further reduce the Group’s credit exposures on derivative
financial instruments, Unilever has collateral agreements with Unilever’s principal counter-parties in relation to derivative financial instruments. Under these arrangements, counter-parties are required to deposit securities and/or cash as a
collateral for their obligations in respect of derivative financial instruments. At 31 December 2018 the collateral held by Unilever under such arrangements amounted to €10 million
(2017: €6 million), of which €10 million (2017: €6 million] was in cash, and €Nil (2017: €Nil) was in the form of bond securities. The non-cash collateral has not been recognised as an
asset in the Group’s balance sheet.
Further details in relation to the Group’s exposure to credit risk are shown in note 13 and note 16A.
18. FINANCIAL INSTRUMENTS FAIR VALUE RISK
The Group is exposed to the risks
of changes in fair value of its financial assets and liabilities. The following table summarises the fair values and carrying amounts of financial instruments.
€ million
€ million
€ million
€ million
Fair values of financial assets and financial liabilities
Fair value 2018
Fair value 2017
Carrying amount 2018
Carrying amount 2017
Financial assets
Cash and cash equivalents
3,230
3,317
3,230
3,317
Held-to-maturity investments(a)
–
163
–
163
Loans and receivables(a)
–
463
–
463
Available-for-sale financial
assets(a)
–
564
–
564
Amortised cost(a)
629
–
629
–
Financial assets at fair value through other comprehensive income(a)
329
–
329
–
Financial assets at fair value through profit or loss:
Derivatives
194
116
194
116
Other
364
139
364
139
4,746
4,762
4,746
4,762
Financial liabilities
Bank loans and overdrafts
(816
)
(995
)
(814
)
(992
)
Bonds and other loans
(23,691
)
(23,368
)
(23,391
)
(22,709
)
Finance lease creditors
(141
)
(147
)
(128
)
(131
)
Derivatives
(402
)
(421
)
(402
)
(421
)
Other financial liabilities
(150
)
(177
)
(150
)
(177
)
(25,200
)
(25,108
)
(24,885
)
(24,430
)
(a)
Classification has changed following adoption of IFRS 9. See page 117 and note 1 for further details.
The fair value of trade receivables and payables is considered to be equal to the carrying amount of these items due to their short-term nature.
The instruments that have a fair value that is different from the carrying amount are classified as Level 2 for both 2017 and 2018.
FAIR VALUE HIERARCHY
The fair values shown in notes 15C and 17A have been
classified into three categories depending on the inputs used in the valuation technique. The categories used are as follows:
•
Level 1: quoted prices for identical instruments;
•
Level 2: directly or indirectly observable market inputs, other than Level 1 inputs; and
•
Level 3: inputs which are not based on observable market data.
18. FINANCIAL INSTRUMENTS FAIR VALUE RISK CONTINUED
For assets and liabilities which are carried at fair value, the classification of fair value calculations by category is summarised below:
€ million
€ million
€ million
€ million
€ million
€ million
€ million
€ million
Notes
Level 1 2018
Level 1 2017
Level 2 2018
Level 2 2017
Level 3 2018
Level 3 2017
Total fair value 2018
Total fair value 2017
Assets at fair value
Financial assets at fair value through other comprehensive income
17A
160
–
5
–
164
–
329
–
Available-for-sale financial
assets
17A
–
215
–
7
–
342
–
564
Financial assets at fair value through profit or loss:
Derivatives(a)
16C
–
–
276
173
–
–
276
173
Other
17A
145
137
–
–
219
2
364
139
Liabilities at fair value
Derivatives(b)
16C
–
–
(542
)
(534
)
–
–
(542
)
(534
)
Contingent consideration
14
–
–
–
–
(142
)
(445
)
(142
)
(445
)
(a)
Includes €82 million (2017: €57 million) derivatives, reported within trade receivables, that hedge trading activities.
(b)
Includes €(140) million (2017: €(113) million) derivatives, reported within trade payables, that hedge trading activities.
Other
than changes arising on adoption of IFRS 9, there were no significant changes in classification of fair value of financial assets and financial liabilities since 31 December 2017. There were also no significant movements between the fair value
levels since 31 December 2017.
The impact in 2018 income statement due to level 3 instruments is a gain of
€272 million (2017: gain of €26 million).
Reconciliation of Level 3 fair value measurements of financial assets and financial liabilities is given below:
Reconciliation of movements in Level 3 valuations
€ million 2018
€ million 2017
1 January
(101
)
(106
)
Gains and losses recognised in profit and loss
272
26
Gains and losses recognised in other comprehensive income
(9
)
2
Purchases and new issues
4
(89
)
Sales and settlements
75
(17
)
Transfers into Level 3
–
83
31 December
241
(101
)
SIGNIFICANT UNOBSERVABLE INPUTS USED IN LEVEL 3 FAIR VALUES
The largest asset valued using Level 3 techniques is an executive Life Insurance of €17 million (2017: €22 million). A change in one or more of the inputs to reasonably possible alternative assumptions would not change the value significantly.
The gains and losses recognised in profit and loss includes a credit from early settlement of contingent consideration for Blueair.
CALCULATION OF FAIR VALUES
The fair values of the financial assets and
liabilities are defined as the price that would be received to sell an asset or paid to transfer a liability in an orderly transaction between market participants at the measurement date. Methods and assumptions used to estimate the fair values are
consistent with those used in the year ended 31 December 2017.
ASSETS AND LIABILITIES CARRIED AT FAIR VALUE
•
The fair values of quoted investments falling into Level 1 are based on current bid prices.
•
The fair values of unquoted financial assets at fair value through other comprehensive income and at fair value through
profit or loss are based on recent trades in liquid markets, observable market rates, discounted cash flow analysis and statistical modelling techniques such as the Monte Carlo simulation. If all significant inputs required to fair value an
instrument are observable, the instrument is included in Level 2. If one or more of the significant inputs is not based on observable market data, the instrument is included in Level 3.
•
Derivatives are valued using valuation techniques with market observable inputs. The models incorporate various inputs
including the credit quality of counter-parties, foreign exchange spot and forward rates, interest rate curves and forward rate curves of the underlying commodities.
•
For listed securities where the market is not liquid, and for unlisted securities, valuation techniques are used. These
include the use of recent arm’s length transactions, reference to other instruments that are substantially the same and discounted cash flow calculations.
18. FINANCIAL INSTRUMENTS FAIR VALUE RISK CONTINUED
OTHER FINANCIAL ASSETS AND LIABILITIES (FAIR VALUES FOR DISCLOSURE PURPOSES ONLY)
•
Cash and cash equivalents, trade and other current receivables, bank loans and overdrafts, trade payables and other current
liabilities have fair values that approximate to their carrying amounts due to their short-term nature.
•
The fair values of preference shares and listed bonds are based on their market value.
•
Non-listed bonds, other loans, bank loans and
non-current receivables and payables are based on the net present value of the anticipated future cash flows associated with these instruments using rates currently available for debt on similar terms, credit
risk and remaining maturities.
•
Fair values for finance lease creditors have been assessed by reference to current market rates for comparable leasing
arrangements.
POLICIES AND PROCESSES USED IN RELATION TO THE CALCULATION OF LEVEL 3 FAIR VALUES
Assets valued using Level 3 valuation techniques are primarily made up of long-term cash receivables and unlisted investments. Valuation techniques used are specific
to the circumstances involved. Unlisted investments include €254 million (2017: €195 million) of investments within Unilever Ventures
companies.
19. PROVISIONS
Provisions are recognised where a legal or constructive obligation exists at the balance sheet date, as a result of a
past event, where the amount of the obligation can be reliably estimated and where the outflow of economic benefit is probable.
€ million
€ million
Provisions
2018
2017
Due within one year
624
525
Due after one year
697
794
Total provisions
1,321
1,319
€ million
€ million
€ million
€ million
€ million
Movements during 2018
Restructuring
Legal
Brazil indirect taxes
Other
Total
1 January 2018
352
192
356
419
1,319
Income Statement:
Charges
320
90
26
164
600
Releases
(51
)
(10
)
(55
)
(116
)
(232
)
Utilisation
(161
)
(130
)
(10
)
(26
)
(327
)
Reclassification(a)
(7
)
16
(85
)
76
–
Currency translation
(8
)
(15
)
(29
)
(13
)
(39
)
31 December 2018
445
143
203
530
1,321
(a)
Includes amounts transferred between classes of provisions.
Restructuring provisions primarily include people costs such as redundancy costs and cost of compensation where manufacturing, distribution, service or selling agreements
are to be terminated. The group expects these provisions to be substantially utilised within the next few years.
The Group is involved from time to time in legal and
arbitration proceedings arising in the ordinary course of business. As previously disclosed, along with other consumer products companies and retail customers, Unilever is involved in a number of ongoing investigations by national competition
authorities. These proceedings and investigations are at various stages and concern a variety of product markets. Where specific issues arise, provisions are made to the extent appropriate. Due to the nature of the legal cases, the timing of
utilisation of these provisions is uncertain.
In 2018 the group paid €104 million for legal cases in
relation to investigations by national competition authorities, of which €76 million was provided in previous years.
Provisions for Brazil indirect taxes are comprised of disputes with Brazilian authorities, in particular relating to tax credits that can be taken for the PIS and COFINS
indirect taxes. These provisions are separate from the matters listed as contingent liabilities in note 20; Unilever does not have provisions and contingent liabilities for the same matters. Due to the nature of disputed indirect taxes the timing of
utilisation of these provisions is uncertain.
20. COMMITMENTS AND CONTINGENT LIABILITIES
Leases are classified as finance leases whenever the terms of the lease transfer substantially all the risks and rewards
of ownership. All other leases are classified as operating leases.
Assets held under finance leases are initially recognised at the
lower of fair value at the date of commencement of the lease and the present value of the minimum lease payments. Subsequent to initial recognition, these assets are accounted for in accordance with the accounting policy relating to that specific
asset. The corresponding liability is included in the balance sheet as a finance lease obligation. Lease payments are apportioned between finance costs in the income statement and reduction of the lease obligation so as to achieve a constant rate of
interest on the remaining balance of the liability. Lease payments under operating leases are charged to the income statement on a straight-line basis over the term of the lease.
Contingent liabilities are either possible obligations that will probably not require a transfer of economic
benefits, or present obligations that may, but probably will not, require a transfer of economic benefits. It is not appropriate to make provisions for contingent liabilities, but there is a chance that they will result in an obligation in the
future. Assessing the amount of liabilities that are not probable is highly judgemental so contingent liabilities are disclosed on the basis of the known maximum exposure.
20. COMMITMENTS AND CONTINGENT LIABILITIES
CONTINUED
€ million
€ million
€ million
€ million
€ million
€ million
Long-term finance lease commitments
Future minimum lease payments 2018
Finance Cost
2018
Present value
2018
Future minimum lease payments 2017
Finance
cost
2017
Present value
2017
Buildings(a)
174
57
117
195
75
120
Plant and machinery
13
2
11
11
–
11
187
59
128
206
75
131
The commitments fall due as follows:
Within 1 year
20
7
13
20
9
11
Later than 1 year but not later than 5 years
71
20
51
68
23
45
Later than 5 years
96
32
64
118
43
75
187
59
128
206
75
131
(a)
All leased land is classified as operating leases.
The table below shows the net book value of property, plant and equipment under a number of finance lease agreements.
€ million
€ million
€ million
Net book value
Buildings
Plant and equipment
Total
Cost
216
106
322
Accumulated depreciation
(94
)
(95
)
(189
)
31 December 2018
122
11
133
Cost
206
125
331
Accumulated depreciation
(84
)
(108
)
(192
)
31 December 2017
122
17
139
The Group has sublet part of the leased properties under finance leases. Future minimum sublease payments of €26 million (2017: €29 million) are expected to be received.
€ million
€ million
Long-term operating lease commitments
2018
2017
Land and buildings
1,803
1,885
Plant and machinery
661
569
2,464
2,454
€ million
€ million
€ million
€ million
Operating lease and other commitments fall due as follows:
Operating leases
2018
Operating leases
2017
Other commitments 2018
Other commitments 2017
Within 1 year
481
418
1,099
1,274
Later than 1 year but not later than 5 years
1,259
1,250
780
935
Later than 5 years
724
786
31
31
2,464
2,454
1,910
2,240
The Group has sublet part of the leased properties under operating leases. Future minimum sublease payments of €10 million (2017: €12 million) are expected to be received.
Other commitments principally comprise commitments under contracts to purchase materials and services. They do not include commitments to purchase property, plant and
equipment, which are reported in note 10 on pages 100 and 101.
CONTINGENT LIABILITIES
Contingent liabilities are possible obligations that are not probable. They arise in respect of litigation against group companies, investigations by competition,
regulatory and fiscal authorities and obligations arising under environmental legislation. In many markets, there is a high degree of complexity involved in the local tax regimes. The majority of contingent liabilities are in respect of fiscal
matters in Brazil.
Assessing the amount of liabilities that are not probable is highly judgemental. Contingent liabilities are disclosed on the basis of the known
maximum exposure. In the case of fiscal matters the known maximum exposure is the amount included on a tax assessment.
20. COMMITMENTS AND CONTINGENT LIABILITIES CONTINUED
A summary of our contingent liabilities is shown in the table below:
€ million 2018
€ million 2017
Corporate reorganisation – IPI, PIS and COFINS taxes and penalties(a)
2,032
2,092
Inputs for PIS and COFINS taxes
52
16
Goodwill amortisation
177
121
Other tax assessments – approximately 600 cases
916
1,095
Total Brazil Tax
3,177
3,324
Brazil other
67
19
Contingent liabilities outside Brazil
414
324
Total contingent liabilities
3,658
3,667
(a)
During 2004, and in common with many other businesses operating in Brazil, one of our Brazilian subsidiaries received a
notice of infringement from the Federal Revenue Service in respect of indirect taxes. The notice alleges that a 2001 reorganisation of our local corporate structure was undertaken without valid business purpose. The 2001 reorganisation was
comparable with restructurings done by many companies in Brazil. The original dispute was resolved in the courts in the Group’s favour. However, in 2013 a new assessment was raised in respect of a similar matter. Additionally, during the course
of 2014 and again in 2017 and in 2018 other notices of infringement were issued based on the same grounds argued in the previous assessments. The total amount of the tax assessments in respect of this matter is €2,032 million (2017: €2,092 million). The judicial process in Brazil is likely to take a number of years to conclude.
The Group believes that the likelihood that the tax authorities will ultimately prevail is low, however there can be no guarantee of success in court. In each case we
believe our position is strong so they have not been provided for and are considered to be contingent liabilities. Due to the fiscal environment in Brazil the possibility of further tax assessments related to the same matters cannot be ruled out.
The contingent liabilities reported for indirect taxes relating to disputes with the Brazilian authorities are separate from the provisions listed in note 19;
Unilever does not have provision and contingent liabilities for the same matters.
21. ACQUISITIONS AND DISPOSALS
Business combinations are accounted for using the acquisition accounting method as at the acquisition date, which is the
date at which control is transferred to the Group.
Goodwill is measured at the acquisition date as the fair value of consideration
transferred, plus non-controlling interests and the fair value of any previously-held equity interests less the net recognised amount (which is generally fair value) of the identifiable assets and liabilities
assumed. Goodwill is subject to an annual review for impairment (or more frequently if necessary) in accordance with our accounting policies. Any impairment is charged to the income statement as it arises. Detailed information relating to goodwill
is provided in note 9 on pages 97 to 99.
Transaction costs are expensed as incurred, within
non-underlying items.
Changes in ownership that do not result in a
change of control are accounted for as equity transactions and therefore do not have any impact on goodwill. The difference between consideration and the non-controlling share of net assets acquired is
recognised within equity.
2018
In 2018 the Group completed the
following business acquisitions and disposals as listed below. In each case 100% of the businesses were acquired unless stated otherwise. Total payment for 2018 acquisitions is
€1,294 million (2017: €4,912 million for acquisitions completed during that year). More information related to the 2018
acquisitions is provided on pages 123 and 124.
DEAL COMPLETION DATE
ACQUIRED/DISPOSED BUSINESS
15 January 2018
Acquired the remaining 2% non-controlling interest of Carver Korea bringing the Group’s ownership to 100%.
28 February 2018
Acquired Quala beauty & personal and home care business in Latin America.
2 July 2018
Sold the global Spreads business (excluding Southern Africa) to KKR.
2 July 2018
Sold the Spreads business in Southern Africa to Remgro plus a cash consideration of €306 million in exchange for
Remgro’s 25.75% shareholding in Unilever South Africa.
27 September 2018
Acquired Adityaa Milk, an ice cream business in India. The acquisition strengthens Unilever front end distribution reach in India.
1 October 2018
Acquired 75% of Equilibra, the Italian personal care and wellbeing business. The acquisition complements Unilever’s product range through its presence in the
‘natural’ personal care segment.
1 November 2018
Acquired Betty Ice, a leading ice cream business in Romania. The acquisition enriches Unilever product range through local offerings and price tiers.
3 December 2018
Acquired Denny Ice, an ice cream business in Bulgaria to strengthen local product knowledge.
31 December 2018
Acquired Vegetarian Butcher, a vegetarian meat replacement, foods business in the Netherlands. The acquisition fits with
Unilever’s strategy to expand its portfolio into plant-based foods responding to the growing trend of vegetarian and vegan meals.
In addition to the completed deals in the table above:
–
On 3 December 2018 the Group announced that it had signed an agreement to acquire the health food drinks portfolio of
GlaxoSmithKline in India and 20 other predominantly Asian markets. The consideration is payable via a combination of cash and shares of Hindustan Unilever Limited and estimated to be approximately
€3.3 billion based on the share price of Hindustan Unilever Limited and exchange rates at the time of the agreement. The transaction is expected to complete in Q4 2019. In 2018 the health
food drinks portfolio of GlaxoSmithKline delivered turnover of around €550 million primarily from products under the Horlicks and Boost brands.
–
On 27 January 2019 the Group completed the acquisition of The Laundress, a premium
eco-friendly laundry care business in the US. The acquisition expands Unilever’s portfolio into the home care premium market and fits with Unilever’s Sustainable Living Plan.
–
On 5 February 2019 the Group completed the acquisition of Graze, a healthy snacking business in the UK. The
acquisition accelerates Unilever’s presence in the healthy snacking and out of home markets.
–
On 1 March 2019 the Group completed the sale of its Alsa baking and dessert business to Dr. Oetker.
EFFECT ON CONSOLIDATED INCOME STATEMENT
The
acquisition deals completed in 2018 have contributed €253 million to Group revenue and €55 million to Group operating profit since
the relevant acquisition dates.
If the acquisition deals completed in 2018 had all taken place at the beginning of the year, Group revenue would have been €51,140 million and Group operating profit would have been €12,551 million.
2017
In 2017 the Group completed the following business acquisitions and
disposals listed below. For the businesses acquired, the acquisition accounting has been finalised and subsequent changes to the provisional numbers published last year were immaterial.
DEAL COMPLETION DATE
ACQUIRED/DISPOSED BUSINESS
1 February 2017
Acquired Living Proof, an innovative premium hair care business, using patented technology and breakthrough science. Living Proof forms part of our prestige Personal Care
business.
28 March 2017
Sold the AdeS soy beverage business in Latin America to Coca-Cola FEMSA and The Coca-Cola Company.
1 May 2017
Acquired Kensington’s, a condiment maker. Kensington’s is a mission-driven company with a leading brand sold in the organic and naturals marketplace.
1 August 2017
Acquired 60% of EAC Myanmar, a home care business to form Unilever EAC Myanmar Company Limited.
1 August 2017
Acquired Hourglass, a luxury colour cosmetics business, known for innovation and exceptional product. Hourglass forms part of our prestige Personal Care
business.
7 September 2017
Acquired Pukka Herbs, an organic herbal tea business, that enhances our presence in the Naturals segment of Refreshment.
9 September 2017
Acquired Weis, an ice cream business. Weis is a second-generation Australian ice cream and frozen dessert manufacturer with the original iconic Fruito Bar and aims to
increase our market position in Refreshment.
1 November 2017
Acquired 98% of Carver Korea, a leading skincare business in North Asia from Bain Capital Private Equity and Goldman Sachs. The brands acquired provide Unilever a presence
in South Korea. Further details are provided below.
1 December 2017
Acquired Mãe Terra, a Brazilian naturals and organic food business. Mãe Terra is a fast-growing and well- loved brand in Brazil and adds to the Foods
business by providing health-conscious consumers with organic and nutritious food products.
11 December 2017
Acquired TAZO, the leading brand in the speciality tea category, which enhances our presence in the Black, Green and Herbal tea segments of Refreshment.
18 December 2017
Acquired Sundial Brands, a leading haircare and skincare company recognised for its innovative use of high-quality and culturally authentic ingredients.
31 December 2017
Acquired Schmidt’s Naturals, a personal care company. Schmidt’s Naturals is a strong, innovative brand in the fast-growing
naturals category, that will complement our existing portfolio of US deodorants.
EFFECT ON CONSOLIDATED BALANCE SHEET
ACQUISITIONS
The following table sets out the effect of the acquisitions in
2018, 2017 and 2016 on the consolidated balance sheet. The fair values currently used for opening balances of all acquisitions made in 2018 are provisional, with the exception of Quala, whose opening balance sheet was finalised within 2018. Balances
remain provisional due to missing relevant information about facts and circumstances that existed as of the acquisition date and where valuation work is still ongoing, notably for acquisitions which completed in the second half of 2018.
Detailed information relating to goodwill is provided in note 9 on pages 97 to 99. The value of goodwill which is
expected to be tax deductible is €5 million.
€ million
€ million
€ million
2018
2017
2016
Net assets acquired
815
2,423
929
Non-controlling interest
(17
)
(50
)
–
Goodwill
496
2,539
1,140
Total payment for acquisition
1,294
4,912
2,069
Exchange rate gain/(loss) on cash flow hedge
(100
)
51
14
Total consideration
1,194
4,963
2,083
In 2018 the net assets acquired and total payment for acquisition consist of:
€ million 2018
Intangible assets
859
Other non-current assets
45
Trade and other receivables
25
Other current assets
45
Non-current liabilities
(134
)
Current liabilities
(25
)
Net assets acquired
815
Non-controlling interest
(17
)
Goodwill
496
Exchange rate gain/(loss) on cash flow hedges(a)
(100
)
Cash consideration
1,172
Deferred consideration
22
Total consideration
1,194
(a)
Exchange rate gain/(loss) on the cash flow hedge in relation to the acquisition of Quala.
No contingent liabilities were acquired in the acquisitions described above. In 2018 a credit to acquisition and disposal related costs of €277 million was recognised as a result of the early settlement of the contingent consideration for Blueair. This credit more than offset an impairment charge of
€208 million related to a Blueair intangible asset.
Goodwill represents the future value which the Group
believes it will obtain through operational synergies and the application of acquired company ideas to existing Unilever channels and businesses.
DISPOSALS
The following table sets out the effect of the disposals in 2018, 2017 and 2016 on the consolidated balance sheet. The results of disposed businesses are
included in the consolidated financial statements up to their date of disposal.
€ million
€ million
€ million
2018
2017
2016
Goodwill and intangible assets
2,510
71
85
Other non-current assets
666
92
29
Current assets
261
10
5
Trade creditors and other payables
(107
)
(8
)
–
Net assets sold
3,330
165
119
(Gain)/loss on recycling of currency retranslation on disposal
(71
)
66
–
Profit/(loss) on sale attributable to Unilever
4,331
332
(95
)
Consideration
7,590
563
24
Cash
7,135
560
16
Cash balances of businesses sold
321
–
8
Non-cash items and deferred consideration
134
3
–
7,590
563
24
On 2 July 2018 Unilever sold the global Spreads business (excluding Southern Africa) to KKR for €7,144 million cash consideration and the Southern Africa Spreads business to Remgro for a non-cash consideration of
€446 million. The intangible assets sold include brands such as Becel, Flora, Country Crock, Blue Brand, I Can’t Believe It’s Not Butter, Rama, and
Pro-Activ. Goodwill of €2,429 million was allocated from the Foods CGUs. Manufacturing assets in 28 countries were disposed. Profit on these disposals
was €4,331 million, recognised as a non-underlying item (see note 3).
Non-current assets and groups of assets and liabilities which comprise disposal
groups are classified as ‘held for sale’ when all of the following criteria are met: a decision has been made to sell; the assets are available for sale immediately; the assets are being actively marketed; and a sale has been agreed or is
expected to be concluded within 12 months of the balance sheet date.
Immediately prior to classification as held
for sale, the assets or groups of assets are remeasured in accordance with the Group’s accounting policies. Subsequently, assets and disposal groups classified as held for sale are valued at the lower of book value or fair value less disposal
costs. Assets held for sale are neither depreciated nor amortised.
€ million
€ million
2018
Total
2017
Total
Property, plant and equipment held for sale
4
30
Disposal groups held for
sale(a)(b)
Non-current assets
Goodwill and intangibles
82
2,311
Property, plant and equipment
19
552
Deferred tax assets
–
145
Other non-current assets
–
1
101
3,009
Current assets
Inventories
8
130
Trade and other receivables
2
18
Current tax assets
–
13
Cash and cash equivalents
–
19
Other
4
5
14
185
Assets held for sale
119
3,224
Current liabilities
Trade payables and other current liabilities
5
106
Current tax liabilities
–
11
Provisions
–
1
5
118
Non-current liabilities
Pensions and post-retirement healthcare liabilities
2
9
Provisions
–
1
Financial liabilities
1
–
Deferred tax liabilities
3
42
6
52
Liabilities held for sale
11
170
(a)
In 2018, disposal groups held for sale consists of assets mainly relating to Alsa baking and dessert business.
(b)
In 2017, disposal groups held for sale were primarily related to the Spreads business which was disposed during the year.
A related party is a person or entity that is related to the Group. These include both people and entities that have, or
are subject to, the influence or control of the Group.
The following related party balances existed with associate or joint venture businesses at 31 December:
Related party balances
€ million 2018
€ million
2017
Trading and other balances due from joint ventures
121
124
Trading and other balances due from/(to) associates
–
–
JOINT VENTURES
Sales by Unilever group
companies to Unilever FIMA, LDA (formerly known as Unilever Jerónimo Martins) and Pepsi Lipton joint ventures were €107 million and
€65 million in 2018 (2017: €117 million and €65 million) respectively. Sales
from Unilever FIMA, LDA and from Pepsi Lipton joint ventures to Unilever group companies were €83 million and €51 million in 2018
(2017: €68 million and €65 million) respectively. Royalties and service fee paid by Unilever FIMA LDA to Unilever group companies were €16 million (2017: €17 million). Balances owed by/(to) Unilever FIMA, LDA and Pepsi Lipton joint ventures at 31 December 2018 were €127 million and €(6) million (2017: €130 million and €(6) million) respectively.
ASSOCIATES
Langholm Capital Partners invests in private European companies with above-average longer-term growth prospects.
Langholm Capital II was launched in 2009. Unilever has invested €62 million in Langholm II, with an outstanding
commitment at the end of 2018 of €13 million (2017: €17 million). During 2018, Unilever received
€0.3 million (2017: €10 million) from its investment in Langholm Capital II.
24. SHARE BUYBACK
During 2018 the group repurchased 62,202,168 Unilever N.V.
ordinary shares (2017: 50,250,099) and 63,236,433 Unilever PLC ordinary shares (2017: 51,692,284). Consideration paid for the repurchase of these shares including transaction costs was
€6,020 million (2017: €5,014 million) which was initially recorded in other reserves.
25. REMUNERATION OF AUDITORS
This note includes all amounts paid to the
Group’s auditors, whether in relation to their audit of the Group or otherwise. During the year the Group (including its subsidiaries) obtained the following services from the Group auditors and its associates:
€ million 2018
€ million 2017
€ million 2016
Fees payable to the Group’s auditors for the audit of the consolidated and parent company accounts of
Unilever N.V. and Unilever PLC(a)
6
4
4
Fees payable to the Group’s auditors for the audit of accounts of subsidiaries of Unilever N.V. and
Unilever PLC pursuant to legislation(b)
10
10
10
Total statutory audit fees(c)
16
14
14
Audit-related assurance services
–
(d)
–
(d)
–
(d)
Other taxation advisory services
–
(d)
–
(d)
–
(d)
Services relating to corporate finance transactions
–
–
–
Other assurance services
5
(e)
5
(e)
–
(d)
All other non-audit
services
–
(d)
–
(d)
–
(d)
(a)
Of which €1 million was payable to KPMG Accountants N.V. (2017:
€1 million; 2016: €1 million) and €5 million was payable to KPMG LLP (2017: €4 million; 2016: €3 million).
(b)
Comprises fees payable to the KPMG network of independent member firms affiliated with KPMG International Cooperative for
audit work on statutory financial statements and Group reporting returns of subsidiary companies.
(c)
Amount payable to KPMG in respect of services supplied to associated pension schemes was less than €1 million individually and in aggregate (2017: less than €1 million individually and in aggregate; 2016: less than €1 million individually and in aggregate).
(d)
Amounts paid in relation to each type of service are individually less than
€1 million. In aggregate the fees paid were less than €1 million (2017:
€1 million; 2016: €1 million).
(e)
2018 includes €4 million (2017: €5 million) for audits and reviews of carve-out financial statements of the Spreads business and
€1 million (2017: €Nil) for assurance work on Simplification.
Where events occurring after the balance sheet date provide evidence of conditions that existed at the end of the
reporting period, the impact of these events is adjusted within the financial statements. Otherwise, events after the balance sheet date of a material size or nature are disclosed below.
On 31 January 2019 Unilever announced a quarterly dividend with the 2018 fourth quarter results of €0.3872 per
NV ordinary share and £0.3361 per PLC ordinary share.
27. SIGNIFICANT SUBSIDIARIES
The following represents the significant
subsidiaries of the Group as 31 December 2018, that principally affect the turnover, profit, and net assets of the Group. The percentage of share capital is shown below represents the aggregate percentage of equity capital directly or
indirectly held by NV or PLC in the company. The companies are incorporated and principally operated in the countries under which they are shown except where stated otherwise.
Country
Name of company
NV %
PLC %
Argentina
Unilever de Argentina S.A.
64.55
35.45
Australia
Unilever Australia Limited
–
100
Brazil
Unilever Brasil Ltda.
64.55
35.45
Canada
Unilever Canada Inc.
64.55
35.45
China
Walls (China) Co. Ltd.
100.00
–
China
Unilever Services (Hefei) Co Ltd
100.00
–
England and Wales
Unilever UK & CN Holdings Limited
–
100
England and Wales
Unilever U.K. Holdings Limited
–
100
England and Wales
Unilever UK Limited
5.61
94.39
France
Unilever France S.A.S
64.54
35.45
Germany
Maizena Grundstücksverwaltung GmbH & Co. OHG
63.61
36.39
Germany
Pfanni GmbH & Co. OHG Stavenhagen
64.55
35.45
Germany
Unilever Deutschland GmbH
64.55
35.45
Germany
Unilever Deutschland Holding GmbH
64.55
35.45
Germany
Unilever Deutschland Produktions GmbH & Co. OHG
64.55
35.45
India
Hindustan Unilever Limited
–
67.19
Indonesia
PT Unilever Indonesia, Tbk.
54.86
30.13
Italy
Unilever Italia Mkt Operations S.R.L
100.00
–
Japan
Unilever Japan Customer Marketing K.K.
100.00
–
Mexico
Unilever de Mexico, S. de R.I. de C.V.
64.55
35.45
Netherlands
Mixhold B.V.
64.55
35.45
Netherlands
Unilever Finance International B.V.
100.00
–
Netherlands
Unilever Nederland B.V.
100.00
–
Netherlands
UNUS Holding B.V.
55.40
44.60
Pakistan
Unilever Pakistan Limited
–
99.23
Philippines
Unilever Philippines, Inc.
64.55
35.45
Poland
Unilever Polska Sp. z o.o.
–
100.00
Russia
OOO Unilever Rus
11.89
88.11
Singapore
Unilever Asia Private Limited
100.00
–
South Africa
Unilever South Africa (Pty) Limited
8.98
91.02
Spain
Unilever Espana S.A.
100.00
–
Switzerland
Unilever ASCC AG
100.00
–
Switzerland
Unilever Finance International AG
100.00
–
Switzerland
Unilever Supply Chain Company AG
100.00
–
Thailand
Unilever Thai Trading Limited
64.55
35.45
Turkey
Unilever Sanayi ve Ticaret Turk A.S
64.54
35.44
USA
Conopco, Inc.
55.40
44.60
USA
Unilever Capital Corporation
55.40
44.60
USA
Unilever United States, Inc.
55.40
44.60
Vietnam
Unilever Vietnam International Company Limited
100.00
–
Due to the inclusion of certain partnerships in the consolidated group financial statements of Unilever, para 264(b) of the German trade
law grants an exemption from the duty to prepare individual statutory financial statements and management reports in accordance with the requirements for limited liability companies and to have these audited and published.
In accordance with Articles 2:379 and 2:414 of the
Dutch Civil Code and Section 409 of the Companies Act 2006 a list of subsidiaries, partnerships, associates, and joint ventures as at 31 December 2018 is set out below. All subsidiary undertakings are subsidiary undertakings of their
immediate parent undertaking(s) pursuant to section 1162 (2) (a) of the Companies Act 2006 unless otherwise indicated – see the notes on page 145. All subsidiary undertakings not included in the consolidation are not included because they are
not material for such purposes. All associated undertakings are included in the Unilever Group’s financial statements using the equity method of accounting unless otherwise indicated – see the notes on page 145. See page 127 of the Annual
Report and Accounts for a list of the significant subsidiaries.
Companies are listed by country and under their registered office address. The aggregate percentage
of capital held by the Unilever Group is shown after the subsidiary company name, except where it is 100%. If the Nominal Value field is blank, then the Share Class Note will identify the type of interest held in the entity.
SUBSIDIARY UNDERTAKINGS INCLUDED IN THE CONSOLIDATION
Name of Undertaking
% holding
as
between
NV /PLC
Nominal
Value
Share Class Note
Algeria – Zone Industrielle Hassi Ameur Oran 31000
Unilever Algérie SPA (72.50)
72.50/0
DZD1,000.00
1
Argentina – Tucumán 1, Piso 4°, Cdad. de Buenos Aires
Arisco S.A.
64.55/35.45
ARA1.00
1
Unilever De Argentina S.A.
64.55/35.45
ARA1.00
1
S.A.G.R.A. S.A. (98)
63.26/34.74
ARA1.00
1
Argentina – Mendoza km 7/8 – Pocitos, San Juan
Helket S.A.
64.55/35.45
ARA1.00
1
Australia – Level 17, 2-26 Park Street, Sydney, NSW
2000
Ben & Jerry’s Franchising Australia Limited
0/100
AUD1.00
1
Tea Too Pty Limited
0/100
AUD1.00
1
TIGI Australia Pty Limited
0/100
AUD1.00
2
0/100
AUD1.00
3
Unilever Australia (Holdings) Pty Limited
0/100
AUD1.00
1
Unilever Australia Group Partnership
0/100
4
Unilever Australia Group Pty Limited
0/100
AUD2.00
1
0/100
AUD1.00
2
0/100
AUD1.00
3
Unilever Australia Limited
0/100
AUD1.00
1
Unilever Australia Supply Services Limited
0/100
AUD1.00
1
Unilever Australia Trading Limited
0/100
AUD1.00
1
Australia – 111 Chandos Street, Crows Nest, NSW 2065
Dermalogica Holdings Pty Limited
0/100
AUD1.00
1
Dermalogica Pty Limited
0/100
AUD2.00
1
Australia – DLA Piper - Australia. Level 22, No. 1 Martin Place, Sydney NSW 2000
Dollar Shave Club Australia Pty Limited
55.40/44.60
AUD1.00
1
Austria -Stella-Klein-Löw Weg 13, 1023 Wien
Delico Handels GmbH
100/0
EUR36,337.00
1
Kuner Nahrungsmittel GmbH
100/0
EUR36,336.00
1
TIGI Handels GmbH
100/0
EUR36,336.00
1
ULPC Handels GmbH
100/0
EUR218,019.00
1
Unilever Austria GmbH
100/0
EUR10,000,000.00
1
Bangladesh – 51 Kalurghat Heavy Industrial Area, Kalurghat, Chittagong
Palestine – Ersal St. Awad Center P.O.B 3801 Al-Beireh,
Ramallah
Unilever Market Development Company
0/100
ILS1.00
1
Panama – Punta Pacífica, Calle Isaac Hanoro Missri, P.H. Torre de las Américas, Torre C, Oficina
32, corregimiento de San Francisco, Distrito y Provincia de Panamá
Unilever Regional Services Panama S.A.
100/0
USD1.00
1
Panama – Calle Isaac Honoro, Torre de las Americas, torre C, piso 32, corregimiento de San Francisco, distrito
y provincia de Panamá
Unilever de Centroamerica S.A.
100/0
No Par Value
1
Paraguay – 4544 Roque Centurión Miranda N° 1635 casi San Martin. Edificio Aymac II,
Asunción
Unilever de Paraguay S.A.
100/0
PYG1,000,000.00
1
Peru – Av. Paseo de la Republica 5895 OF. 401, Miraflores, Lima 18
Unilever Andina Perú S.A.
100/0
PEN1.00
1
Philippines – Linares Road, Gateway Business Park, Gen. Trias, Cavite
Metrolab Industries, Inc.
64.55/35.45
PHP1.00
7
64.55/35.45
PHP10.00
14
Philippines – 7th Floor, Bonifacio Stopover Corporate Center, 31st Street corner 2nd Avenue, Bonifacio Global
City, Taguig City
Unilever Philippines, Inc.
64.55/35.45
PHP50.00
7
Philippines – 11th Avenue corner 39th Street, Bonifacio Triangle, Bonifacio Global City, Taguig
City
Unilever Philippines Body Care, Inc.
64.55/35.45
PHP100.00
7
Philippines – Manggahan Light Industrial Compound, A. Rodriguez Avenue, Bo. Manggahan, Pasig City
Unilever RFM Ice Cream, Inc. (50)
32.28/17.72
PHP1.00
29
Poland – Jerozolimskie 134, 02-305, Warszawa
Unilever Polska Sp. z o.o.
0/100
PLN50.00
1
Unilever Poland Services Sp. z o.o.
0/100
PLN50.00
1
Unilever Polska S.A.
0/100
PLN10.00
1
Puerto Rico – Professional Services Park 997, San Roberto St., Suite 7, San Juan
1: Ordinary, 2: Ordinary-A, 3: Ordinary-B, 4: Partnership, 5: Quotas, 6:
Class- A Common, 7: Common, 8: Class A, 9: Class B, 10: Class C, 11: Class II Common, 12: Class III Common, 13: Membership Interest, 14: Preference, 15: Redeemable Preference, 16: Limited by Guarantee, 17: C Ordinary Shares,
18: Viscountcy, 19: Redeemable Golden Share, 20: Deferred, 21: Ordinary-C, 22: Preferred, 23: Redeemable Preference Class A, 24: Redeemable Preference Class B, 25: Special, 26: Cumulative Preference,
27: 5% Cumulative Preference, 28: Non-Voting Ordinary B, 29: Common B, 30:Management, 31: Dormant, 32: A, 33: B, 34: Cumulative Redeemable Preference, 35: A-Ordinary,
36: Preferred Ordinary, 37: Ordinary-G, 38: Class Common-B, 39: Series A Participating Preference, 40: H-Ordinary, 41: I-Ordinary, 42: J-Ordinary, 43: Series A Preferred Convertible, 44: A Preferred, 45: A1 Preferred, 46: B Preferred, 47: Series 2 Preferred, 48: Series 3 Preferred, 49:Series
A2 Convertible Redeemable Preference, 50: D Preferred, 51: Series A-3 Preferred, 52: C Preferred, 53:E Ordinary, 54: G Preferred, 55: Series Seed, 56: Nominal, 57: Preferred A, 58: Series A Preferred, 59:
Series Seed-2 Preferred, 60: Series C-2, 61: Series D, 62: Series A1 Preferred, 63: Series B-2 Preference, 64: Class A
Interests, 65: Class B Interests, 66. Ownership Units, 67. Seed B CCPS, 68. Office Holders, 69. Security, 70. Series B-3 Preference, 71. Series B Preferred, 72. Series Seed B CPPS, 73. Series A CPPS, 74.
Series A2 CPPS, 75. Equity, 76. Series B CPPS, 77. Series B Preferred Convertible, 78. Class A Ordinary Redeemable Non Voting Ordinary, 79. B Ordinary Shares, 80. N Preferred, 81. A-1 Com, 82. A-2 Com, 83. A-3 Com.
*
Indicates an undertaking for which Unilever N.V. has issued a declaration of assumption of liability in accordance with
Article 2:403 of the Dutch Civil Code.
o
Indicates an undertaking directly held by N.V. or PLC. All other undertakings are indirectly held. In the case of
Hindustan Unilever Limited 51.48% is directly held and the remainder of 15.70% is indirectly held. In the case of Unilever Kenya Limited 39.13% is directly held and the remainder of 60.87% is indirectly held. In the case of Unilever Sri Lanka
Limited 5.49% is directly held and the remainder of 94.51% is indirectly held. In the case of Mixhold B.V. 27.71% is directly held and the remainder of 72.29% is indirectly held. In the cases of each of Unilever Gida Sarayi ve Ticaret A.Ş. and
Unilever Sarayi ve Ticaret Turk A.Ş. a fractional amount is directly held and the remainder is indirectly held. In the case of United Holdings Limited, the ordinary shares are directly held and the preferred shares are indirectly held. In the
case of Mixhold N.V., 55.37% of the ordinary – A shares are directly held, the remainder of 44.63% are indirectly held and the other share classes are indirectly held. In the case of Naamlooze Vernootschap Elma the ordinary shares are directly
held and the cumulative preference shares are indirectly held.
†
Shares the undertaking holds in itself.
D
Denotes an undertaking where other classes of shares are held by a third party.
X
Unilever Trading LLC, Binzagr Unilever Limited, Unilever Home and Personal Care Products Manufacturing LLC and UTIC
Distribution S.A. are subsidiary undertakings pursuant to section 1162(2)(b) Companies Act 2006. Servern Gulf FZCO is a subsidiary undertaking pursuant to section 1162(4)(a) Companies Act 2006. The Unilever Group is entitled to 50% of the profits
made by Binzagr Unilever Limited. The Unilever Group is entitled to 80% of the profits made by Unilever Trading LLC, Unilever Home and Personal Care Products Manufacturing LLC and Unilever General Trading LLC.
◇
Accounted for as non-current investments within
non-current financial assets.
¥
Exemption pursuant to Section 264b German Commercial Code.
Further to the above disclosures (1) due to the unified board of Unilever N.V. and Unilever PLC, Unilever N.V. and Unilever PLC are each considered
to be a subsidiary undertaking of the other in accordance with section 1162 (4) (b) of the Companies Act 2006 and (2) details of holdings of subsidiary undertakings in the share capitals of Unilever N.V. and Unilever PLC are given under the
heading Our Shares on pages 38 to 40.
In addition, we have revenues either from our own operations or otherwise in the following locations:
Afghanistan, Albania, Andorra, Angola, Antigua, Armenia, Azerbaijan, Bahamas, Barbados, Belarus, Belize, Benin, Bhutan, Bosnia and Herzegovina, Botswana, Brunei Darussalam, Burkina Faso, Burundi, Cameroon, Cape Verde, Central African Republic, Chad,
Comoros, Congo, Democratic Republic of Congo, Dominica, Equatorial Guinea, Eritrea, Fiji, Gabon, Gambia, Georgia, Grenada, Guinea, Guinea-Bissau, Guyana, Iceland, Iraq, Kiribati, Kuwait, Kyrgyzstan, Lesotho, Liberia, Libya, Liechtenstein,
Luxembourg, Macedonia, Madagascar, Maldives, Mali, Malta, Marshall Islands, Martinique, Mauritania, Mauritius, Micronesia (Federated States of), Monaco, Mongolia, Montenegro, Namibia, Nauru, Palau, Papua New Guinea, Qatar, Saint Kitts and Nevis,
Saint Lucia, Saint Vincent and the Grenadines, Samoa, San Marino, Senegal, Seychelles, Sierra Leone, Slovenia, Solomon Islands, Somalia, South Sudan, Sudan, Suriname, Swaziland, Syrian Arab Republic, Tajikistan, Timor Leste, Togo, Tonga,
Turkmenistan, Tuvalu, Uzbekistan, Vanuatu and Yemen.
The Group has established branches in Argentina, Azerbaijan, Cote d’Ivoire, Cuba, the
Dominican Republic, Kazakhstan, Moldova, the Netherlands, the Philippines, Rwanda, Saudi Arabia, Slovenia, Turkey and United Kingdom.
Shareholders are
encouraged to visit our website which has a wealth of information about Unilever.
There is a section on our website designed specifically for investors. It includes
detailed coverage of the Unilever share price, our quarterly and annual results, performance charts, financial news and investor relations speeches and presentations. It also includes details of the 2018 Share Buyback programme and conference and
investor/analyst presentations.
You can also view the Unilever Annual Report and Accounts 2018 (and the Additional Information for US Listing Purposes) on our
website, and those for prior years.
Copies of the Unilever Annual
Report and Accounts 2018 (and the Additional Information for US Listing Purposes) and the Annual Report on Form 20-F 2018 can be accessed directly or ordered via the website.
www.unilever.com/investorrelations
UNILEVER ANNUAL REPORT AND ACCOUNTS 2018
The
Unilever Annual Report and Accounts 2018 (and the Additional Information for US Listing Purposes) forms the basis for the Annual Report on Form 20-F that is filed with the United States Securities and Exchange
Commission, which is also available free of charge from their website.
ADDITIONAL INFORMATION FOR US LISTING PURPOSES CONTINUED
DIRECTORS, SENIOR MANAGEMENT AND EMPLOYEES
EMPLOYEES
The average number of employees for the last three years is provided
in note 4A on page 86. The average number of employees during 2018 included 7,996 seasonal workers. We believe our relationship with our employees and any labour unions of which they may be part is satisfactory in all material respects.
GLOBAL EMPLOYEE SHARE PLANS (SHARES)
In November
2014, Unilever’s global employee plan ‘SHARES’ was launched in 17 countries. SHARES gives eligible Unilever employees below senior management level the opportunity to invest between
€25 and €200 per month from their net salary in Unilever shares. For every three shares our employees buy (Investment Shares), Unilever will
give them one free Matching Share, which will vest if employees hold their Investment Shares for at least three years. The Matching Shares are not subject to any performance conditions. In 2015, SHARES was rolled out globally and is now offered in
more than 100 countries. Executive Directors are not eligible to participate in SHARES. As of 21 February 2019, awards for 291,657 NV and 219,423 PLC shares were outstanding under SHARES.
NORTH AMERICAN SHARE PLANS
Unilever also maintains
share plans for its North American employees that are governed by an umbrella plan referred to as the Unilever North America Omnibus Equity Compensation Plan. These plans are the North American equivalents of the Unilever Share Plan 2017 and the
GSIP, MCIP and SHARES plans. The rules governing these share plans are materially the same as the rules governing the Unilever Share Plan 2017, GSIP, MCIP and SHARES plans, respectively. However, the plans contain
non-competition and non-solicitation covenants and they are subject to US and Canadian employment and tax laws. The plans are administered by the North America
Compensation Committee of Unilever United States Inc. and they are governed by New York law.
The foregoing description of the Unilever North America Omnibus Equity
Compensation Plan does not purport to be complete and is qualified in its entirety by reference to the Unilever North America Omnibus Equity Compensation Plan, including all amendments thereto, filed as Exhibit 99.1 to the Form S-8 (File No. 333-185299) filed with the SEC on 6 December 2012, which is incorporated herein by reference.
COMPENSATION COMMITTEE
The Committee is concerned
with the remuneration of the Executive and Non-Executive Directors and the tier of management directly below the Boards. It also has responsibility for the cash and executive and all employee share-based
incentive plans, the Remuneration Policy and performance evaluation of the Unilever Leadership Executive.
DIRECTORS AND SENIOR MANAGEMENT
FAMILY RELATIONSHIP
There are no family
relationships between any of our Executive Directors, members of the ULE or Non-Executive Directors.
OTHER ARRANGEMENTS
None of our Non-Executive Directors, Executive Directors or other key management personnel are elected or appointed under any arrangement or understanding with any major shareholder, customer, supplier or others.
The voting rights of
the significant shareholders of NV and PLC are the same as for other holders of the class of share held by such significant shareholder.
The principal trading
markets upon which Unilever shares are listed are Euronext Amsterdam for NV ordinary shares and the depositary receipts thereof, and the London Stock Exchange for PLC ordinary shares. NV ordinary shares mainly trade in the form of depositary
receipts for shares.
In the United States, NV New York Registry Shares and PLC American Depositary Receipts are traded on the New York Stock Exchange. Deutsche Bank
Trust Company Americas (Deutsche Bank) acts for NV and PLC as issuer, transfer agent and, in respect of the PLC American Depositary Receipts, depositary.
At
21 February 2019 (the latest practicable date for inclusion in this report), there were 4,134 registered holders of NV New York Registry Shares and 841 registered holders of PLC American Depositary Receipts in the United States. We estimate
that approximately 10% of NV’s ordinary shares (including shares underlying NV New York Registry shares) were held in the United States (approximately 11% in 2017) and approximately 11% of PLC’s ordinary shares (including shares underlying
PLC American Depositary Receipts) were held in the United States (approximately 10% in 2017).
NV and PLC are separate companies with separate stock exchange listings
and different shareholders. Shareholders cannot convert or exchange the shares of one for shares of the other and the relative share prices on the various markets can, and do, fluctuate. Each NV ordinary share represents the same underlying economic
interest in the Unilever Group as each PLC ordinary share (save for exchange rate fluctuations).
If you are a shareholder of NV, you have an interest in a Dutch
legal entity, your dividends will be paid in euros (converted into US dollars if you have shares registered in the United States) and you may be subject to tax in the Netherlands. If you are a shareholder of PLC, your interest is in a UK legal
entity, your dividends will be paid in sterling (converted into US dollars if you have American Depositary Receipts) and you may be subject to UK tax. Nevertheless, the Equalisation Agreement means that as a shareholder of either company you
effectively have an interest in the whole of Unilever. On a going concern basis, you have largely equal rights over our combined net profit and capital reserves as shown in the consolidated accounts.
To Unilever’s knowledge, the Unilever Group is not owned or controlled, directly or indirectly, by another corporation, any foreign government or by any other legal
or natural person, severally or jointly. The Group is not aware of any arrangements the operation of which may at any subsequent date result in a change of control of Unilever.
RELATED PARTY TRANSACTIONS
Transactions with
related parties are conducted in accordance with agreed transfer pricing policies and include sales to joint ventures and associates. Other than those disclosed in Notes 23 to 24 to the consolidated financial statements (and incorporated herein as
above), there were no related party transactions that were material to the Group or to the related parties concerned that are required to be reported in 2018 up to 21 February 2019 (the latest practicable date for inclusion in this report).
DIVIDEND RECORD
The following tables show
the dividends declared and dividends paid by NV and PLC for the last five years, expressed in terms of the revised share denominations which became effective from 22 May 2006. Differences between the amounts ultimately received by US holders of
NV and PLC shares are the result of changes in exchange rates between the equalisation of the dividends and the date of payment.
Following agreement at the 2009
Annual General Meetings (AGMs) and separate meetings of ordinary shareholders, the Equalisation Agreement was modified to facilitate the payment of quarterly dividends from 2010 onwards.
ADDITIONAL INFORMATION FOR US LISTING PURPOSES CONTINUED
ARTICLES
OF ASSOCIATION
NV’s Articles of Association contain, among other things, the objects clause, which sets out the scope of activities that NV is authorised to
undertake. They are drafted to give a wide scope and provide that the primary objectives are: to carry on business as a holding company, to manage any companies in which it has an interest and to operate and carry into effect the Equalisation
Agreement. At the 2010 PLC AGM, the shareholders agreed that the objects clause be removed from PLC’s Articles of Association so that there are no restrictions on its objects.
DIRECTORS’ BORROWING POWERS
The borrowing
powers of NV Directors on behalf of NV are not limited by NV’s Articles of Association. PLC Directors have the power to borrow on behalf of PLC up to three times the PLC proportion of the adjusted capital and reserves of the Unilever Group, as
defined in PLC’s Articles of Association, without the approval of shareholders (by way of an ordinary resolution).
ALLOCATION OF
PROFITS
Under NV’s Articles of Association, available profits after reserves have been provided for by virtue of law, the Equalisation Agreement or
deemed necessary by the Board, are distributed first to 7% and 6% cumulative preference shareholders by a dividend of 7% and 6%, respectively, calculated on the basis of the original nominal value of 1,000 Dutch guilders converted to euros at the
official conversion rate. The remaining profits are distributed to ordinary shareholders in proportion to the nominal value of their holdings.
Distributable profits
of PLC are paid first at the rate of 5% per year on the paid-up nominal capital of 31⁄9p of the ordinary shares, in a
further such dividend at a rate of 5% per year on the paid-up nominal capital of 31⁄9p of the ordinary shares and then at
the rate of 6% per year on the paid-up nominal capital of the deferred stock of £100,000. The surplus is paid by way of a dividend on the ordinary shares.
LAPSE OF DISTRIBUTIONS
The right to cash and the
proceeds of share distributions by NV lapses five and 20 years, respectively, after the first day the distribution was obtainable. Unclaimed amounts revert to NV. Any PLC dividend unclaimed after 12 years from the date of the declaration of the
dividend reverts to PLC.
REDEMPTION PROVISIONS AND CAPITAL CALL
Under Dutch law, NV may only redeem treasury shares (including shares underlying depositary receipts) or shares whose terms permit redemption. Outstanding PLC ordinary
shares and deferred shares cannot be redeemed. NV and PLC may make capital calls on money unpaid on shares and not payable on a fixed date. NV and PLC only issue fully paid shares.
MODIFICATION OF RIGHTS
Modifications to NV’s
or PLC’s Articles of Association must be approved by a general meeting of shareholders. Any modification of the NV Articles of Association that prejudices the rights of 7% or 6% cumulative preference shareholders of NV must be approved by three
quarters of votes cast (excluding treasury shares) at a meeting of affected holders.
Modifications that prejudicially affect the rights and privileges of a class of
PLC shareholders require the written consent of three quarters of the affected holders (excluding treasury shares) or a special resolution passed at a general meeting of the class at which at least two persons holding or representing at least one
third of the paid-up capital (excluding treasury shares) must be present. Every shareholder is entitled to one vote per share held on a poll and may demand a poll vote. At any adjourned general meeting,
present affected class holders may establish a quorum.
MATERIAL CONTRACTS
The descriptions of the foundation agreements set forth in the Unilever Annual Report and Accounts 2018 do not purport to be complete and are qualified in their entirety
by reference to the Equalisation Agreement between NV and PLC, the Deed of Mutual Covenants and the Agreement for Mutual Guarantees of Borrowing, including all amendments thereto, filed as Exhibits 4.1(a), 4.1(b) and 4.1(c), respectively, to this
report, which are incorporated herein by reference.
EXCHANGE CONTROLS
Under the Dutch External Financial Relations Act of 25 March 1994, the Minister of Finance is authorised to issue regulations relating to financial transactions
concerning the movement of capital to or from other countries with respect to direct investments, establishment, the performing of financial services, the admission of negotiable instruments or goods with respect to which regulations have been
issued under the Import and Export Act in the interest of the international legal system or an arrangement relevant thereto. These regulations may contain a prohibition to perform any of the actions indicated in those regulations without a licence.
To date, no regulations of this type, have been issued which are applicable to NV.
Other than certain economic sanctions which may be in place from time to time,
there are currently no UK laws, decrees or regulations restricting the import or export of capital or affecting the remittance of dividends or other payments to holders of the PLC’s shares who are
non-residents of the UK. Similarly, other than certain economic sanctions which may be in force from time to time, there are no limitations relating only to
non-residents of the UK under English law or the PLC’s Articles of Association on the right to be a holder of, and to vote in respect of, the company’s shares.
UNILEVER ANNUAL REPORT ON FORM 20-F 2018
Filed with the SEC on the SEC’s website. Printed copies are available, free of charge, upon request to Unilever PLC, Investor Relations department, 100 Victoria
Embankment, London, EC4Y 0DY United Kingdom.
DOCUMENTS ON DISPLAY IN THE UNITED STATES
Unilever files and furnishes reports and information with the United States SEC. Certain of our reports and other information that we file or furnish to the SEC are also
available to the public over the internet on the SEC’s website.
The following notes are provided for guidance. US persons should consult their local tax advisers, particularly in connection with potential liability to pay US taxes on
disposal, lifetime gift or bequest of their shares. A US person is a US individual citizen or resident, a corporation organised under the laws of the United States, or any other legal person subject to United States Federal Income Tax on its
worldwide income.
TAXATION ON DIVIDENDS IN THE NETHERLANDS
As of 1 January 2007, dividends paid by companies in the Netherlands are in principle subject to dividend withholding tax of 15%. Where a shareholder is entitled to
the benefits of the current Income Tax Convention (the Convention) concluded on 18 December 1992 between the United States and the Netherlands, when dividends are paid by NV to:
•
a corporation organised under the laws of the United States (or any territory of it) having no permanent establishment in the Netherlands of which such shares form a part of the business property; or
•
any other legal person subject to United States Federal Income Tax with respect to its worldwide income, having no permanent establishment in the Netherlands of which such shares form a part of the business property,
these dividends qualify for a reduction of withholding tax on dividends in the Netherlands from 15% to 5%, if the beneficial owner is a company which directly holds at least 10% of the voting power of NV shares.
Where a United States person has a permanent establishment in the Netherlands, which has shares in NV forming part of its business property, dividends it receives on
those shares are included in that establishment’s profit. They are subject to income tax or corporation tax in the Netherlands, as appropriate, and tax on dividends in the Netherlands will generally be applied at the full rate of 15% with, as
appropriate, the possibility to claim a credit for that tax on dividends in the Netherlands against the income tax or corporation tax in the Netherlands. The net tax suffered may be treated as foreign income tax eligible for credit against
shareholders’ United States income taxes.
The Convention provides, subject to certain conditions, for a complete exemption from, or refund of, Dutch dividend
withholding tax if the beneficial owner is a qualified ‘Exempt Pension Trust’ as defined in Article 35 of the Convention or a qualified ‘Exempt Organisation’ as defined in Article 36 of the Convention. It is noted that, subject
to certain conditions, foreign (non-Dutch) tax exempt entities may also be entitled to a full refund of any Dutch dividend withholding tax suffered based on specific provisions in the Dividend Tax Act in the
Netherlands. This tax refund opportunity under Dutch domestic tax law already applied to European Union and European Economic Area entities as of 1 January 2007 and has been extended as of 1 January 2012 to all foreign tax exempt entities
including, if appropriate, United States tax exempt entities.
Under the Convention, qualifying United States organisations that are generally exempt from United
States taxes and that are constituted and operated exclusively to administer or provide pension, retirement or other employee benefits may be exempt at source from withholding tax on dividends received from a Dutch corporation. A Competent Authority
Agreement between the US and Dutch tax authorities on 6 August 2007, published in the US as Announcement 2007-75, 2007-2 Cumulative Bulletin 540, as amended by a
Competent Authority Agreement published in the United States as Announcement 2010-26, 2010-1 Cumulative Bulletin 604, describes the eligibility of these US organisations
for benefits under the Convention and procedures for claiming these benefits.
Under the Convention, a United States trust, company
or organisation that is operated exclusively for religious, charitable, scientific, educational or public purposes is subject to an initial 15% withholding tax rate. Such an exempt organisation may be entitled to reclaim from tax authorities in the
Netherlands a refund of the Dutch dividend tax, if and to the extent that it is exempt from United States Federal Income Tax and it would be exempt from tax in the Netherlands if it were organised and carried on all its activities there. If you are
an NV shareholder resident in any country other than the United States or the Netherlands, any exemption from, or reduction or refund of, dividend withholding tax in the Netherlands may be governed by specific provisions in Dutch tax law, the
‘Tax Regulation for the Kingdom of the Netherlands’, or by the tax convention or any other agreement for the avoidance of double taxation, if any, between the Netherlands and your country of residence.
UNITED STATES TAXATION ON DIVIDENDS
If you are a
United States person, the dividend (including the withheld amount) up to the amount of NV earnings and profits for United States Federal Income Tax purposes will be ordinary dividend income. Dividends received by an individual will be taxed at a
maximum rate of 15% or 20%, depending on the income level of the individual, provided the individual has held the shares for more than 60 days during the 121-day period beginning 60 days before the ex-dividend date, that NV is a qualified foreign corporation and that certain other conditions are satisfied. NV is a qualified foreign corporation for this purpose. In addition, an additional tax of 3.8% will apply
to dividends and other investment income received by individuals with incomes exceeding certain thresholds. The dividends are not eligible for the dividends received deduction allowed to corporations.
For US foreign tax credit purposes, the dividend is foreign source income, and withholding tax in the Netherlands is a foreign income tax that is eligible for credit
against the shareholder’s United States income taxes. However, the rules governing the US foreign tax credit are complex, and additional limitations on the credit apply to individuals receiving dividends eligible for the maximum tax rate on
dividends described above.
Any portion of the dividend that exceeds NV’s United States earnings and profits is subject to different rules. This portion is a tax-free return of capital to the extent of your basis in NV’s shares, and thereafter is treated as a gain on a disposition of the shares.
Under a provision of the Dividend Tax Act in the Netherlands and provided certain conditions are satisfied, NV is entitled to a credit (up to a maximum of 3% of the gross
dividend from which dividend tax is withheld) against the amount of dividend tax withheld before remittance to tax authorities in the Netherlands. The United States tax authority may take the position that withholding tax in the Netherlands eligible
for credit should be limited accordingly.
DISCLOSURE REQUIREMENTS FOR US INDIVIDUAL HOLDERS
US individuals that hold certain specified foreign financial assets, including stock in a foreign corporation, with values in excess of certain thresholds are required to
file Form 8938 with their United States Federal Income Tax return. Such Form requires disclosure of information concerning such foreign assets, including the value of the assets. Failure to file the form when required is subject to penalties. An
exemption from reporting applies to foreign assets held through a US financial institution, generally including a non-US branch or subsidiary of a US institution and a US branch of a non-US institution. Investors are encouraged to consult with their own tax advisers regarding the possible application of this disclosure requirement to their investment in the shares.
ADDITIONAL INFORMATION FOR US LISTING PURPOSES CONTINUED
TAXATION ON CAPITAL GAINS IN THE NETHERLANDS
Under the Convention, if you are a United States person and you have capital gains on the sale of shares of a Dutch company, these are generally not subject to taxation
by the Netherlands. An exception to this rule generally applies if you have a permanent establishment in the Netherlands and the capital gain is derived from the sale of shares which form part of that permanent establishment’s business
property.
SUCCESSION DUTY AND GIFT TAXES IN THE NETHERLANDS
Under the Estate and Inheritance Tax Convention between the United States and the Netherlands of 15 July 1969, individual US persons who are not Dutch citizens who
have shares will generally not be subject to succession duty in the Netherlands on the individual’s death, unless the shares are part of the business property of a permanent establishment situated in the Netherlands.
A gift of shares of a Dutch company by a person who is not a resident or a deemed resident of the Netherlands is generally not subject to gift tax in the Netherlands. A non-resident Netherlands citizen, however, is still treated as a resident of the Netherlands for gift tax purposes for ten years and any other non-resident person for one year
after leaving the Netherlands.
TAXATION FOR US PERSONS HOLDING SHARES OR AMERICAN DEPOSITARY SHARES IN PLC
The following notes are provided for guidance. US persons should consult their local tax advisers, particularly in connection with potential liability to pay US taxes on
disposal, lifetime gift or bequest of their shares or American Depositary Shares (ADSs). A US person is a US individual citizen or resident, a corporation organised under the laws of the United States, or any other legal person subject to United
States Federal Income Tax on its worldwide income.
UNITED KINGDOM TAXATION ON DIVIDENDS
Under United Kingdom law, income tax is not withheld from dividends paid by United Kingdom companies. Shareholders, whether resident in the United Kingdom or not, receive
the full amount of the dividend actually declared.
UNITED STATES TAXATION ON DIVIDENDS
If you are a US person, the dividend up to the amount of PLC’s earnings and profits for United States Federal Income Tax purposes will be ordinary dividend income.
Dividends received by an individual will be taxed at a maximum rate of 15% or 20%, depending on the income level of the individual, provided the individual has held the shares or ADSs for more than 60 days during the
121-day period beginning 60 days before the ex-dividend date, that PLC is a qualified foreign corporation and certain other conditions are satisfied. PLC is a qualified
foreign corporation for this purpose. In addition, an additional tax of 3.8% will apply to dividends and other investment income received by individuals with incomes exceeding certain thresholds. The dividend is not eligible for the dividends
received deduction allowable to corporations. The dividend is foreign source income for US foreign tax credit purposes.
Any portion of the dividend that exceeds
PLC’s United States earnings and profits is subject to different rules. This portion is a tax-free return of capital to the extent of your basis in PLC’s shares or ADSs, and thereafter is treated as
a gain on a disposition of the shares or ADSs.
DISCLOSURE REQUIREMENTS FOR US INDIVIDUAL HOLDERS
US individuals that hold certain specified foreign financial assets, including stock in a foreign corporation, with values in excess of certain thresholds are required to
file Form 8938 with their United States Federal Income Tax return. Such Form requires disclosure of information concerning such foreign assets, including the value of the assets. Failure to file the form when required is subject to penalties. An
exemption from reporting applies to foreign assets held through a US financial institution, generally including a non-US branch or subsidiary of a US institution and a US branch of a non-US institution. Investors are encouraged to consult with their own tax advisers regarding the possible application of this disclosure requirement to their investment in the shares or ADSs.
UK TAXATION ON CAPITAL GAINS
Under United Kingdom
law, when you dispose of shares you may be liable to pay United Kingdom tax in respect of any gain accruing on the disposal. However, if you are either:
•
an individual who is not resident in the United Kingdom for the year in question; or
•
a company which is not resident in the United Kingdom when the gain accrues
you will generally not be liable to United
Kingdom tax on any capital gains made on disposal of your shares.
Two exceptions are: if the shares are held in connection with a trade or business which is
conducted in the United Kingdom through a branch, agency or permanent establishment; or if the shares are held by an individual who becomes resident in the UK having left the UK for a period of non-residence
of five years or less and who was resident for at least four of the seven tax years prior to leaving the UK.
UK INHERITANCE TAX
Under the current estate and gift tax convention between the United States and the United Kingdom, ordinary shares held by an individual shareholder who
is:
•
domiciled for the purposes of the convention in the United States; and
•
is not for the purposes of the convention a national of the United Kingdom
will generally not be subject to United
Kingdom inheritance tax:
•
on the individual’s death; or
•
on a gift of the shares during the individual’s lifetime.
Where ordinary shares are held on trust, they will
generally not be subject to United Kingdom inheritance tax where the settlor at the time of the settlement:
•
was domiciled for the purposes of the convention in the United States; and
•
was not for the purposes of the convention a national of the United Kingdom.
An exception is if the shares are part of
the business property of a permanent establishment of the shareholder in the United Kingdom or, in the case of a shareholder who performs independent personal services, pertain to a fixed base situated in the United Kingdom.
Where ordinary shares are subject to United Kingdom inheritance tax and United States federal gift or federal estate tax, the amount of the tax paid in one jurisdiction
can generally be credited against the tax due in the other jurisdiction.
Where a United Kingdom inheritance tax liability is prima facie not payable by virtue of the
convention, that tax can become payable if any applicable federal gift or federal estate tax on the shares in the United States is not paid.
DESCRIPTION OF SECURITIES OTHER THAN EQUITY SECURITIES
Deutsche Bank serves
as both the transfer agent and registrar pursuant to the NV New York Registered Share Program and the depositary (Depositary) for PLC’s American Depositary Receipt Program.
TRANSFER AGENT FEES AND CHARGES FOR NV
Although
Items 12.D.3 and 12.D.4 are not applicable to NV the following fees, charges and transfer agent payments are listed, as any fee arrangement with Deutsche Bank will cover both programs.
Under the terms of the Transfer Agent Agreement for the NV New York Registered Share program, a New York Registry Share (NYRS) holder may have to pay the following
service fees to the transfer agent:
•
Issuance of NYRSs: up to US 5¢ per NYRS issued.
•
Cancellation of NYRSs: up to US 5¢ per NYRS cancelled.
An NYRS holder will also be responsible to pay certain fees
and expenses incurred by the transfer agent and certain taxes and governmental charges such as:
•
fees for the transfer and registration of shares charged by the registrar and transfer agent for the shares in the Netherlands (ie upon deposit and withdrawal of shares);
•
expenses incurred for converting foreign currency into US dollars;
•
expenses for cable, telex and fax transmissions and for delivery of securities;
•
taxes and duties upon the transfer of securities (ie when shares are deposited or withdrawn from deposit); and
•
fees and expenses incurred in connection with the delivery or servicing of shares on deposit.
Transfer agent fees payable
upon the issuance and cancellation of NYRSs are typically paid to the transfer agent by the brokers (on behalf of their clients) receiving the newly-issued NYRSs from the transfer agent and by the brokers (on behalf of their clients) delivering the
NYRSs to the transfer agent for cancellation.
The brokers in turn charge these transaction fees to their clients. Note that the fees and charges an investor may be
required to pay may vary over time and may be changed by us and by the transfer agent. Notice of any changes will be given to investors.
DEPOSITARY FEES AND CHARGES FOR PLC
Under the
terms of the Deposit Agreement for the PLC American Depositary Shares (ADSs), an ADS holder may have to pay the following service fees to the depositary bank:
•
Issuance of ADSs: up to US 5¢ per ADS issued.
•
Cancellation of ADSs: up to US 5¢ per ADS cancelled.
•
Processing of dividend and other cash distributions not made pursuant to a cancellation or withdrawal: up to US 5¢ per ADS held.
An ADS holder will also be responsible for paying certain fees and expenses incurred by the depositary bank and certain
taxes and governmental charges such as:
•
fees for the transfer and registration of shares charged by the registrar and transfer agent for the shares in the United Kingdom (ie upon deposit and withdrawal of shares);
•
expenses incurred for converting foreign currency into US dollars;
•
expenses for cable, telex and fax transmissions and for delivery of securities;
•
taxes and duties upon the transfer of securities (ie when shares are deposited or withdrawn from deposit);
•
fees and expenses incurred in connection with the delivery or servicing of shares on deposit; and
•
fees incurred in connection with the distribution of dividends.
Depositary fees payable upon the issuance and
cancellation of ADSs are typically paid to the depositary bank by the brokers (on behalf of their clients) receiving the newly-issued ADSs from the depositary bank and by the brokers (on behalf of their clients) delivering the ADSs to the depositary
bank for cancellation. The brokers in turn charge these transaction fees to their clients.
Note that the fees and charges an investor may be required to pay may vary
over time and may be changed by us and by the depositary bank. Notice of any changes will be given to investors.
TRANSFER AGENT PAYMENTS
– FISCAL YEAR 2018 FOR NV
In relation to 2018, NV received $612,500.00 from Deutsche Bank, the transfer agent and registrar for its New York
Registered Share program since 1 July 2014, including the reimbursement of listing fees (NYSE), reimbursement of settlement infrastructure fees (including DTC feeds), reimbursement of proxy process expenses (printing, postage and distribution),
tax reclaim services and program-related expenses (that include expenses incurred from the requirements of the Sarbanes-Oxley Act of 2002).
DEPOSITARY PAYMENTS – FISCAL YEAR 2018 FOR PLC
In relation to 2018, PLC received $1,774,188.02 from Deutsche Bank, the depositary bank for its American Depositary Receipt Program since 1 July 2014, including
processing of cash distributions, reimbursement of listing fees (NYSE), reimbursement of settlement infrastructure fees (including DTC feeds), reimbursement of proxy process expenses (printing, postage and distribution), dividend fees and
program-related expenses (that include expenses incurred from the requirements of the Sarbanes-Oxley Act of 2002).
DEFAULTS, DIVIDEND ARREARAGES AND
DELINQUENCIES
DEFAULTS
There has been no
material default in the payment of principal, interest, a sinking or purchase fund instalment or any other material default relating to indebtedness of the Group.
DIVIDEND ARREARAGES AND DELINQUENCIES
There have been no arrears in payment of dividends on, and material delinquency with respect to,
any class of preferred stock of any significant subsidiary of the Group.
ADDITIONAL INFORMATION FOR US LISTING PURPOSES CONTINUED
PURCHASES
OF EQUITY SECURITIES
SHARE PURCHASES DURING 2018
Please also refer to
‘Our shares’ section on pages 38 to 39.
€ million
Of which, number of
Maximum value that
shares purchased
may yet be purchased
Total number of
Average price
as part of publicly
as part of publicly
shares purchased
paid per share (€)
announced plans(b)
announced plans
January
February
March
April(a)
6,222,000
45.63
–
May
26,547,961
47.62
26,547,961
June
26,492,822
47.16
26,492,822
July
20,461,397
48.41
20,461,397
August
20,971,789
49.50
20,971,789
September
15,866,919
48.16
15,866,919
October
8,591,175
46.67
8,591,175
November
6,506,538
47.75
6,506,538
December
Total
131,660,601
125,438,601
(a)
6,222,000 shares were purchased to satisfy commitments to deliver shares under our share-based plans as described in note
4C ‘Share-based compensation plans’ on pages 92 and 93.
(b)
On 19 April 2018 Unilever announced a share buyback programme of
€6 billion in 2018.
Between 31 December 2018 and 21 February 2019 (the latest
practicable date for inclusion in this report) neither NV or PLC conducted any share repurchases.
MANAGEMENT’S REPORT ON INTERNAL CONTROL OVER
FINANCIAL REPORTING
In accordance with the requirements of Section 404 of the US Sarbanes-Oxley Act of 2002, the following report is provided by management
in respect of the Group’s internal control over financial reporting (as defined in rule 13a–15(f) or rule 15d–15(f) under the US Securities Exchange Act of 1934):
•
Unilever’s management is responsible for establishing and maintaining adequate internal control over financial
reporting for the Group;
•
Unilever’s management has used the Committee of Sponsoring Organizations of the Treadway Commission (COSO) framework
(2013) to evaluate the effectiveness of our internal control over financial reporting. Management believes that the COSO framework (2013) is a suitable framework for its evaluation of our internal control over financial reporting because
it is free from bias, permits reasonably consistent qualitative and quantitative measurements of internal controls, is sufficiently complete so that those relevant factors that would alter a conclusion about the effectiveness of internal controls
are not omitted and is relevant to an evaluation of internal control over financial reporting;
•
Management has assessed the effectiveness of internal control over financial reporting as of 31 December 2018, and has
concluded that such internal control over financial reporting is effective. Management’s assessment and conclusion excludes Adityaa Milk, Equilibra, Betty Ice, Denny Ice, and Vegetarian Butcher from this assessment, as they were acquired on
27 September 2018, 1 October 2018, 1 November 2018, 3 December 2018, and 31 December 2018 respectively. These entities are included in our 2018 consolidated financial statements, and together they constituted approximately
0.5% of our total assets as at 31 December 2018 and approximately 0.02% of total turnover for the year ended 31 December 2018; and
•
KPMG LLP and KPMG Accountants N.V., who have audited the consolidated financial statements of the Group for the year ended
31 December 2018, have also audited the effectiveness of internal control over financial reporting as at 31 December 2018 and have issued an attestation report on internal control over financial reporting.
PRINCIPAL ACCOUNTANT FEES AND SERVICES
€ million 2018
€ million 2017
€ million 2016
Audit fees(a)
16
14
14
Audit-related fees(b)
5
(d)
5
(d)
–
(c)
Tax fees
–
(c)
–
(c)
–
(c)
All other fees
–
(c)
–
(c)
–
(c)
(a)
Amount payable to KPMG in respect of services supplied to associated pension schemes was less than €1 million individually and in aggregate (2017: less than €1 million individually and in aggregate; 2016: less than €1 million individually and in aggregate).
(b)
Includes other audit services which comprise audit and similar work that regulations or agreements with third parties
require the auditors to undertake.
(c)
Amounts paid in relation to each type of service are individually less than
€1 million. In aggregate the fees paid were less than €1 million (2017:
€1 million, 2016: €1 million).
(d)
2018 includes €4 million (2017: €5 million) for audits and reviews of carve-out financial statements of the Spreads business and
€1 million (2017: €Nil) for assurance work on Simplification.
ADDITIONAL INFORMATION FOR US LISTING PURPOSES CONTINUED
Ratios and other metrics
2018
2017
2016
2015
2014
Operating margin (%)
24.6
16.5
14.8
14.1
16.5
Net profit margin (%)(a)
18.4
11.3
9.8
9.2
10.7
Number of Shares issued
Unilever N.V. ordinary shares (Millions of units)
1,715
1,715
1,715
1,715
1,715
Unilever N.V. special shares (units)
2,400
2,400
2,400
2,400
2,400
Unilever PLC ordinary shares (Millions of units)
1,187
1,310
1,310
1,310
1,310
Unilever PLC deferred stock (units)
100,000
100,000
100,000
100,000
100,000
(a)
Net profit margin is expressed as net profit attributable to shareholders’ equity as a percentage of turnover.
GUARANTOR STATEMENTS (AUDITED)
On 27 July 2017, Unilever N.V. and
Unilever Capital Corporation (UCC) filed a US Shelf registration, which is unconditionally and fully guaranteed, jointly and severally, by Unilever N.V., Unilever PLC and Unilever United States, Inc. (UNUS) and that superseded the NV and UCC US
Shelf registration filed on 30 September 2014, which was unconditionally and fully guaranteed, jointly and severally, by NV, PLC and UNUS. UCC and UNUS are each indirectly 100% owned by the Unilever parent entities (as defined below). Of the US
Shelf registration, $12.5 billion of Notes were outstanding at 31 December 2018 (2017: $8.9 billion; 2016: $6.3 billion) with coupons ranging from 1.375% to 5.9%. These Notes are repayable between 15 February 2019 and
15 November 2032.
Provided below are the income statements, cash flow statements and balance sheets of each of the companies discussed above, together with the
income statement, cash flow statement and balance sheet of non-guarantor subsidiaries. These have been prepared under the historical cost convention and, aside from the basis of accounting for investments at net asset value (equity accounting),
comply in all material respects with International Financial Reporting Standards. The financial information in respect of NV, PLC and UNUS has been prepared with all subsidiaries accounted for on an equity basis. Information on NV and PLC is shown
collectively as Unilever parent entities. The financial information in respect of the non–guarantor subsidiaries has been prepared on a consolidated basis.
€ million
€ million
€ million
€ million
€ million
€ million
Unilever Capital
Unilever United
Corporation
Unilever
(a)
States Inc.
Non-
Income statement
for the year ended 31 December 2018
subsidiary issuer
parent entities
subsidiary guarantor
guarantor subsidiaries
Eliminations
Unilever Group
Turnover
–
–
–
50,982
–
50,982
Operating profit
–
1,985
(4
)
10,554
–
12,535
Net finance income/(costs)
–
(104
)
(426
)
74
–
(456
)
Pensions and similar obligations
–
(2
)
(19
)
(4
)
–
(25
)
Other income/(losses)
–
–
–
207
–
207
Premium paid on buyback of preference shares
–
(382
)
–
382
–
–
Net monetary gain arising from hyperinflationary economies
–
–
–
122
–
122
Profit before taxation
–
1,497
(449
)
11,335
–
12,383
Taxation
–
(199
)
–
(2,376
)
–
(2,575
)
Net profit before subsidiaries
–
1,298
(449
)
8,959
9,808
Equity earnings of subsidiaries
–
8,091
1,787
(20,326
)
10,448
–
Net profit
–
9,389
1,338
(11,367
)
10,448
9,808
Attributable to:
Non-controlling interests
–
–
–
419
–
419
Shareholders’ equity
–
9,389
1,338
(11,786
)
10,448
9,389
Other comprehensive income
–
(24
)
25
(1,194
)
–
(1,193
)
Total comprehensive income
–
9,365
1,363
(12,561
)
10,448
8,615
(a)
The term ‘Unilever parent entities’ includes Unilever N.V. and Unilever PLC. Though Unilever N.V. and Unilever
PLC are separate legal entities, with different shareholder constituencies and separate stock exchange listings, they operate as nearly as practicable as a single economic entity. Debt securities issued by entities in the Unilever Group are fully
and unconditionally guaranteed by both Unilever N.V. and Unilever PLC.
ADDITIONAL INFORMATION FOR US LISTING PURPOSES CONTINUED
€ million
€ million
€ million
€ million
€ million
€ million
Unilever
Unilever
Capital
United
Corporation
Unilever
(a)
States Inc.
Non-
Balance sheet
subsidiary
parent
subsidiary
guarantor
Unilever
at 31 December 2018
issuer
entities
guarantor
subsidiaries
Eliminations
Group
Assets
Non-current assets
Goodwill and intangible assets
–
3,058
–
26,435
–
29,493
Deferred tax assets
–
–
4
1,113
–
1,117
Other non-current assets
–
20
2
13,343
–
13,365
Amounts due from group companies
17,211
10,379
–
–
(27,590
)
–
Net assets of subsidiaries (equity accounted)
–
22,299
22,463
–
(44,762
)
–
17,211
35,756
22,469
40,891
(72,352
)
43,975
Current assets
Amounts due from group companies
–
11,883
5,413
33,032
(50,328
)
–
Trade and other current receivables
–
155
4
6,326
–
6,485
Current tax assets
–
15
–
457
–
472
Other current assets
6
7
–
8,511
–
8,524
6
12,060
5,417
48,326
(50,328
)
15,481
Total assets
17,217
47,816
27,886
89,217
(122,680
)
59,456
Liabilities
Current liabilities
Financial liabilities
2,381
30
2
822
–
3,235
Amounts due to group companies
4,895
25,010
3,127
17,296
(50,328
)
–
Trade payables and other current liabilities
96
327
15
14,019
–
14,457
Current tax liabilities
–
–
72
1,373
–
1,445
Other current liabilities
–
2
–
633
–
635
7,372
25,369
3,216
34,143
(50,328
)
19,772
Non-current liabilities
Financial liabilities
9,525
10,767
–
1,358
–
21,650
Amounts due to group companies
–
–
13,290
14,300
(27,590
)
–
Pensions and post-retirement healthcare liabilities:
Funded schemes in deficit
–
7
136
1,066
–
1,209
Unfunded schemes
–
87
388
918
–
1,393
Other non-current liabilities
–
141
1
2,998
–
3,140
9,525
11,002
13,815
20,640
(27,590
)
27,392
Total liabilities
16,897
36,371
17,031
54,783
(77,918
)
47,164
Shareholders’ equity
320
11,445
10,855
33,714
(44,762
)
11,572
Non-controlling interests
–
–
–
720
–
720
Total equity
320
11,445
10,855
34,434
(44,762
)
12,292
Total liabilities and equity
17,217
47,816
27,886
89,217
(122,680
)
59,456
(a)
The term ‘Unilever parent entities’ includes Unilever N.V. and Unilever PLC. Though Unilever N.V. and Unilever
PLC are separate legal entities, with different shareholder constituencies and separate stock exchange listings, they operate as nearly as practicable as a single economic entity. Debt securities issued by entities in the Unilever Group are fully
and unconditionally guaranteed by both Unilever N.V. and Unilever PLC.
Pensions and post-retirement healthcare liabilities:
Funded schemes in deficit
–
8
103
1,114
–
1,225
Unfunded schemes
–
93
439
977
–
1,509
Other non-current liabilities
–
5
1
3,519
–
3,525
7,377
7,677
15,060
16,838
(24,231
)
22,721
Total liabilities
16,826
38,039
15,096
44,050
(68,113
)
45,898
Shareholders’ equity
306
13,498
11,852
45,474
(57,501
)
13,629
Non-controlling interests
–
–
–
758
–
758
Total equity
306
13,498
11,852
46,232
(57,501
)
14,387
Total liabilities and equity
17,132
51,537
26,948
90,282
(125,614
)
60,285
(a)
The term ‘Unilever parent entities’ includes Unilever N.V. and Unilever PLC. Though Unilever N.V. and Unilever
PLC are separate legal entities, with different shareholder constituencies and separate stock exchange listings, they operate as nearly as practicable as a single economic entity. Debt securities issued by entities in the Unilever Group are fully
and unconditionally guaranteed by both Unilever N.V. and Unilever PLC.
ADDITIONAL
INFORMATION FOR US LISTING PURPOSES CONTINUED
€ million
€ million
€ million
€ million
€ million
€ million
Unilever
Unilever
Capital
United
Corporation
Unilever
(a)
States Inc.
Non-
Cash flow statement
subsidiary
parent
subsidiary
guarantor
Unilever
for the year ended 31 December 2018
issuer
entities
guarantor
subsidiaries
Eliminations
Group
Net cash flow from/(used in) operating activities
–
945
(6
)
5,814
–
6,753
Net cash flow from/(used in) investing activities
1,088
1,196
(63
)
4,619
(2,196
)
4,644
Net cash flow from/(used in) financing activities
(1,097
)
(2,183
)
69
(10,533
)
2,196
(11,548
)
Net increase/(decrease) in cash and cash equivalents
(9
)
(42
)
–
(100
)
–
(151
)
Cash and cash equivalents at beginning of year
–
23
(1
)
3,147
–
3,169
Effect of foreign exchange rates
15
26
–
31
–
72
Cash and cash equivalents at end of year
6
7
(1
)
3,078
–
3,090
€ million
€ million
€ million
€ million
€ million
€ million
Unilever
Unilever
Capital
United
Corporation
Unilever
(a)
States Inc.
Non-
Cash flow statement
subsidiary
parent
subsidiary
guarantor
Unilever
for the year ended 31 December 2017
issuer
entities
guarantor
subsidiaries
Eliminations
Group
Net cash flow from/(used in) operating activities
–
941
(40
)
6,391
–
7,292
Net cash flow from/(used in) investing activities
(3,884
)
(7,123
)
(1,062
)
5,136
1,054
(5,879
)
Net cash flow from/(used in) financing activities
3,873
6,261
1,103
(11,616
)
(1,054
)
(1,433
)
Net increase/(decrease) in cash and cash equivalents
(11
)
79
1
(89
)
–
(20
)
Cash and cash equivalents at beginning of year
–
5
(2
)
3,195
–
3,198
Effect of foreign exchange rates
11
(61
)
–
41
–
(9
)
Cash and cash equivalents at end of year
–
23
(1
)
3,147
–
3,169
€ million
€ million
€ million
€ million
€ million
€ million
Unilever
Unilever
Capital
United
Corporation
Unilever
(a)
States Inc.
Non-
Cash flow statement
subsidiary
parent
subsidiary
guarantor
Unilever
for the year ended 31 December 2016
issuer
entities
guarantor
subsidiaries
Eliminations
Group
Net cash flow from/(used in) operating activities
–
45
(177
)
7,179
–
7,047
Net cash flow from/(used in) investing activities
(1,053
)
(679
)
(783
)
(1,712
)
1,039
(3,188
)
Net cash flow from/(used in) financing activities
1,048
621
959
(4,662
)
(1,039
)
(3,073
)
Net increase/(decrease) in cash and cash equivalents
(5
)
(13
)
(1
)
805
–
786
Cash and cash equivalents at beginning of year
–
3
(1
)
2,126
–
2,128
Effect of foreign exchange rates
5
15
–
264
–
284
Cash and cash equivalents at end of year
–
5
(2
)
3,195
–
3,198
(a)
The term ‘Unilever parent entities’ includes Unilever N.V. and Unilever PLC. Though Unilever N.V. and Unilever
PLC are separate legal entities, with different shareholder constituencies and separate stock exchange listings, they operate as nearly as practicable as a single economic entity. Debt securities issued by entities in the Unilever Group are fully
and unconditionally guaranteed by both Unilever N.V. and Unilever PLC.
The following discussion summarises the results of the Group during the years 2017 and 2016. The
figures quoted are in euros, at current rates of exchange, being the average rates applying in each period as applicable, unless otherwise stated.
In 2017 and 2016,
no disposals qualified to be disclosed as discontinued operations for purposes of reporting.
2017
2016
% change
Turnover (€ million)
53,715
52,713
2
Operating profit (€ million)
8,857
7,801
14
Underlying operating profit (€ million)
9,400
8,624
9
Profit before tax (€ million)
8,153
7,469
9
Net profit (€ million)
6,486
5,547
17
Diluted earnings per share (€)
2.15
1.82
18
Underlying earnings per share (€)
2.24
2.03
11
Turnover increased by 1.9% to €53.7 billion including an unfavourable currency
impact of 2.1% (2016: 5.1% unfavourable currency impact) mainly due to strengthening of the euro. Underlying sales growth was 3.1% (2016: 3.7%), with a positive contribution from all categories. Underlying volume growth was 0.8% (2016: 0.9%) and
underlying price growth was 2.3% (2016: 2.8%). Acquisitions and disposals had a favourable contribution of 0.9% (2016: 0.6%) reflecting acquisitions including Blueair, Living Proof and Carver Korea. Emerging markets contributed 58% of total turnover
(2016: 57%) with underlying sales growth of 5.9% (2016: 6.5%) coming from price growth of 4.2% and volume growth of 1.6%. Developed markets underlying sales declined by 0.6% evenly balanced between price and volume.
Underlying operating margin improved by 1.1 percentage points to 17.5%. Gross margin improved by 0.4 percentage points driven by positive mix and the roll-out of the ‘5-S’ savings programme that more than offset increases in commodity costs. The absolute level of brand and marketing investment was flat in local
currencies versus 2016, as savings from advertising production were re-invested in increased media spend. As a percentage of turnover, brand and marketing investment was down by 0.6 percentage points.
Overheads reduced by 0.1 percentage points, driven by a further reduction in the cost base partially offset by investment in capabilities including new business models and e-commerce.
Operating profit was up 13.5% to €8.9 billion (2016: €7.8
billion) including €543 million of non-underlying items. Non-underlying items within operating profit are €638 million restructuring costs, acquisition and disposal-related costs of €159 million and
one-off costs of €80 million partly offset by gain on disposal of group companies of
€334 million.
Net finance costs increased by
€314 million to €877 million (2016: €563 million) as they included a one-off finance charge of €382 million relating to the book premium paid on the buyback of preference shares in Unilever N.V. The net cost of financing
borrowings was €399 million, €70 million lower than 2016. The decrease was due to a lower average interest rate of 2.7% compared to
3.5% in 2016, and to lower other interest costs from one-off credits in Brazil. Pension financing was a charge of €96 million compared to €94 million in 2016.
The effective tax rate was 20.8% versus 26.2% in 2016. The change was mainly due to the impact of US tax reform that led to
a one-off tax benefit coming from restating deferred tax balances at the new lower federal tax rate, partially offset by the tax impact of the AdeS business disposal.
Net profit from joint ventures and associates was up 22% at €155 million, an increase coming from growth in
profits from the Pepsi Lipton joint venture and profit from disposal of an investment in a joint venture in India. Other income from non-current investments was
€18 million compared to €104 million in the prior year which included a gain of
€107 million from the sale of financial assets.
Diluted earnings per share increased by 18.4% to €2.15 reflecting improved operating margins, €578 million US tax reform and a
€309 million gain on disposal of the AdeS business. Underlying earnings per share increased by 10.7% to €2.24. This measure excludes the
post tax impact of non-underlying items.
ADDITIONAL COMMENTS ON 2017 EXPENSES AND OPERATING PROFIT
Underlying operating profit increased by €0.8 billion compared to 2016 driven by an improvement
across all divisions, with an increase in Beauty & Personal Care by €0.4 billion and Home Care and Foods and Refreshment by
€0.2 billion each. Operating profit increased by €1.1 billion, including a gain on disposal of AdeS Soy beverage business in Latin
America of €0.3 billion.
Cost of raw and packing material and goods purchased for resale (material costs)
increased by €0.5 billion. This included a favourable exchange rate impact of €0.4 billion; at constant exchange rates it was up by
€0.9 billion. At constant exchange rates, gross total input costs (including material costs, distribution and supply chain indirects) increase of
€1.9 billion was more than offset by favourable price changes of €1.2 billion, and material costs savings of €1.4 billion during the year, resulting in gross margin improvement of 0.5 percentage points to 43.1%.
Staff
costs increased by €0.2 billion despite a decrease in the average number of employees, primarily due to share based compensation and bonuses, which were higher due to stronger performance
against targets as compared to 2016. There were also higher redundancy costs incurred during the year. These were partially offset by savings delivered through the C4G programme. The absolute level of our brand and marketing investment in local
currencies was flat versus 2016. At current rates, the brand and marketing investment as a percentage of turnover was down by 0.6 percentage points to 14.1%.
The
impact of input costs and investment in our brands is discussed further in our segmental disclosures, which also provide additional details of the impact of brands, products and sub categories on driving
top-line growth.
ADDITIONAL INFORMATION FOR US LISTING PURPOSES CONTINUED
BEAUTY & PERSONAL CARE
2017
2016
% change
Turnover (€ million)
20,697
20,172
2.6
Operating profit (€ million)
4,103
3,704
10.8
Underlying operating profit (€ million)
4,375
4,033
8.5
Operating margin (%)
19.8
18.4
1.4
Underlying operating margin (%)
21.1
20.0
1.1
Underlying sales growth (%)
2.9
4.2
Underlying volume growth (%)
1.4
1.6
Underlying price growth (%)
1.5
2.6
KEY DEVELOPMENTS
•
Turnover growth of 2.6% included a negative currency impact of 1.9%. Acquisitions and disposals contributed 1.7% and underlying sales growth was 2.9%. Beauty & Personal Care benefited from a strong set of
innovations that included five new brand launches. The portfolio continued to grow organically and through acquisitions in attractive segments and channels. Acquisitions of 2017 included Living Proof, Hourglass, Carver Korea, Sundial Brands and
Schmidt’s Naturals. Previous acquisitions of Dollar Shave Club and Kate Somerville grew in double digits, while Dermalogica grew 5%. Growth was negatively impacted by difficult market conditions particularly in Brazil and Indonesia. Skin
cleansing delivered good growth helped by Dove shower foam, and Baby Dove which was rolled-out to 26 countries. In hair care, the global expansion into natural propositions contributed to volume-led growth.
•
Underlying operating profit increased by €342 million. Underlying operating margin and underlying sales growth improvement added €237 million and €116 million respectively, offset by a €11 million adverse
impact from exchange rate movements. Acquisition and disposal related activities had no net impact. Underlying operating margin improvement was principally driven by higher gross margins and brand and marketing efficiencies from zero based
budgeting.
FOODS & REFRESHMENT
2017
2016
% change
Turnover (€ million)
22,444
22,532
(0.4
)
Operating profit (€ million)
3,616
3,148
14.8
Underlying operating profit (€ million)
3,737
3,505
6.6
Operating margin (%)
16.1
14.0
2.1
Underlying operating margin (%)
16.7
15.6
0.3
Underlying sales growth (%)
2.7
2.7
Underlying volume growth (%)
(0.2
)
0.1
Underlying price growth (%)
3.0
2.6
KEY DEVELOPMENTS
•
Turnover declined by 0.4% including an adverse currency impact of 2.4%. Underlying sales growth was 2.7% after an adverse effect from a 2.4% underlying sales decline of the spreads business which was divested in 2018.
The division continued to modernise the portfolio through innovations and acquisitions such as Mae Terra. Innovations behind premium ice cream brands performed well, including Magnum pints that deliver the ultimate chocolate and ice cream experience
in a tub. T2 continued to show double-digit growth while Pure Leaf was introduced to Canada and the United Kingdom after successful launch in the United States.
•
Underlying operating profit was €232 million higher, mainly from underlying operating margin improvement, which contributed €242 million. Underlying sales growth added €80 million, while acquisition and disposal related activities and exchange rate movements
had a negative impact of €23 million and €67 million respectively. Underlying operating margin was up primarily due to gross margin
improvement and efficiencies in brand and marketing investment and overheads.
HOME CARE
2017
2016
% change
Turnover (€ million)
10,574
10,009
5.6
Operating profit (€ million)
1,138
949
19.9
Underlying operating profit (€ million)
1,288
1,086
18.6
Operating margin (%)
10.8
9.5
1.3
Underlying operating margin (%)
12.2
10.9
1.3
Underlying sales growth (%)
4.4
4.9
Underlying volume growth (%)
2.1
1.3
Underlying price growth (%)
2.3
3.6
KEY DEVELOPMENTS
•
Turnover grew 5.6% including a negative currency impact of 1.7%. Underlying sales growth was 4.4% coming from volume growth of 2.1% and price growth of 2.3%. Acquisitions and disposals contributed a favourable 2.9%. The
roll-outs of Surf into Central and Eastern Europe and Omo into Iran performed well. In laundry, growth was driven by strong performances of the fabric conditioner Comfort in Asia and Europe, and the value brand Brilhante in Latin America. In 2017,
the portfolio benefited from the acquisition of EAC Myanmar.
•
The acquisition of Seventh Generation in 2016 with its natural proposition performed well and started to contribute to underlying sales growth towards the end of the year.
•
Underlying operating profit increased by €202 million including a €56 million adverse contribution
from exchange rate movements. Underlying operating margin added €141 million and underlying sales growth contributed €48 million.
Acquisition and disposal related activities contributed €70 million. Underlying operating margin improvement reflects strong delivery of the 5-S
programme and zero-based budgeting.
Approximately €1.0 billion (or 31%) of the Group’s cash and cash equivalents were held in the parent and
central finance companies, for ensuring maximum flexibility. These companies provide loans to our subsidiaries that are also funded through retained earnings and third party borrowings. We maintain access to global debt markets through an
infrastructure of short and long-term debt programmes. We make use of plain vanilla derivatives, such as interest rate swaps and foreign exchange contracts, to help mitigate risks.
The remaining €2.3 billion (69%) of the Group’s cash and cash equivalents were held in foreign
subsidiaries which repatriate distributable reserves on a regular basis. For most countries, this is done through dividends free of tax. This balance included €206 million (2016: €240 million, 2015: €284 million) of cash that was held in a few countries where we face cross-border foreign exchange controls and/or other
legal restrictions that inhibit our ability to make these balances available in any means for general use by the wider business. The cash is generally invested or held in the relevant country and, given the other capital resources available to the
Group, does not significantly affect the ability of the Group to meet its cash obligations.
We closely monitor all our exposures and counter-party limits. Unilever
has committed credit facilities in place for general corporate purposes. The undrawn bilateral committed credit facilities in place on 31 December 2017 were $7,865 million. In addition, Unilever had undrawn revolving 364-day bilateral credit facilities in aggregate of €4,000 million.
NON-GAAP MEASURES
UNDERLYING SALES GROWTH (USG)
The reconciliation of USG to changes in the GAAP measure turnover is as follows:
TOTAL GROUP
2017
2016
vs 2016
vs 2015
Turnover growth (%)(a)
1.9
(1.0
)
Effect of acquisitions (%)
1.3
0.8
Effect of disposals (%)
(0.4
)
(0.2
)
Effect of exchange rates (%)(b)
(2.1
)
(5.1
)
Underlying sales growth (%)(b)
3.1
3.7
BEAUTY & PERSONAL CARE
2017
2016
vs 2016
vs 2015
Turnover growth (%)(a)
2.6
0.5
Effect of acquisitions (%)
1.8
1.7
Effect of disposals (%)
(0.1
)
(0.3
)
Effect of exchange rates (%)
(1.9
)
(4.9
)
Underlying sales growth (%)
2.9
4.2
FOODS & REFRESHMENT
2017
2016
vs 2016
vs 2015
Turnover growth (%)(a)
(0.4
)
(2.2
)
Effect of acquisitions (%)
0.2
0.1
Effect of disposals (%)
(0.8
)
(0.2
)
Effect of exchange rates (%)
(2.4
)
(4.7
)
Underlying sales growth (%)
2.7
2.7
HOME CARE
2017
2016
vs 2016
vs 2015
Turnover growth (%)(a)
5.6
(1.5
)
Effect of acquisitions (%)
3.1
0.6
Effect of disposals (%)
(0.2
)
(0.2
)
Effect of exchange rates (%)
(1.7
)
(6.5
)
Underlying sales growth (%)
4.4
4.9
(a)
Turnover growth is made up of distinct individual growth components, namely underlying sales, currency impact,
acquisitions and disposals. Turnover growth is arrived at by multiplying these individual components on a compounded basis as there is a currency impact on each of the other components. Accordingly, turnover growth is more than just the sum of the
individual components.
UNDERLYING VOLUME GROWTH
The relationship between UVG and USG is set out below:
2017
2016
vs 2016
vs 2015
Underlying volume growth (%)
0.8
0.9
Underlying price growth (%)
2.3
2.8
Underlying sales growth (%)
3.1
3.7
UNDERLYING EFFECTIVE TAX RATE
The reconciliation of taxation to taxation before tax impact of non-underlying items is as follows:
€ million
€ million
2017
2016
Taxation
1,667
1,922
Tax impact of:
Non-underlying items within operating profit
77
213
Non-underlying items not in operating profit but within net profit
578
–
Taxation before tax impact of
non-underlying items
2,322
2,135
Profit before taxation
8,153
7,469
Non-underlying items within operating profit before tax
543
823
Non-underlying items not in operating profit but within Net profit
before tax
382
–
Share of net (profit)/loss of joint ventures and associates
(155
)
(127
)
Profit before tax excluding non-underlying items before tax and
share of net profit/(loss) of joint ventures and associates
8,923
8,165
Underlying effective tax
rate
26.0%
26.1%
CONSTANT UNDERLYING EARNINGS PER SHARE
The reconciliation of underlying profit attributable to shareholders’ equity to constant underlying earnings attributable to shareholders’ equity and the
calculation of constant underlying EPS is as follows:
€ million
€ million
2017
2016
Underlying profit attributable to shareholders’ equity
6,315
5,785
Impact of translation from current to constant exchange rates and translational hedges
310
128
Impact of Q4 Venezuela price inflation
(153
)
–
Constant underlying earnings attributable to shareholders’
equity
6,472
5,913
Diluted combined average number of share units (millions of units)
2,814.0
2,853.9
Constant underlying EPS (€)
2.30
2.07(a)(b)
(a)
Represents 2016 underlying EPS as adjusted for translational hedges and the impact of translation of earnings using annual
average 2016 exchange rates
(b)
From 2018, in our reporting of growth in constant underlying EPS, we translate the prior period using an annual average
exchange rate rather than monthly averages. This change has been made to align with the prior period constant exchange rate used for calculating USG. The impact of this is €0.00 per share in 2016
constant underlying EPS.
ADDITIONAL INFORMATION FOR US LISTING PURPOSES CONTINUED
FREE CASH FLOW (FCF)
The reconciliation of FCF to net profit is as follows:
€ million
€ million
2017
2016
Net profit
6,486
5,547
Taxation
1,667
1,922
Share of net profit of joint ventures/associates and other income from
non-current investments
(173
)
(231
)
Net finance costs
877
563
Depreciation, amortisation and impairment
1,538
1,464
Changes in working capital
(68
)
51
Pensions and similar obligations less payments
(904
)
(327
)
Provisions less payments
200
65
Elimination of (profits)/losses on disposals
(298
)
127
Non-cash charge for share-based compensation
284
198
Other adjustments
(153
)
(81
)
Cash flow from operating activities
9,456
9,298
Income tax paid
(2,164
)
(2,251
)
Net capital expenditure
(1,621
)
(1,878
)
Net interest and preference dividends paid
(316
)
(367
)
Free cash flow
5,355
4,802
Net cash flow (used in)/from investing activities
(5,879
)
(3,188
)
Net cash flow (used in)/from financing activities
(1,433
)
(3,073
)
NET DEBT
The
reconciliation of net debt to the GAAP measure total financial liabilities is as follows:
€ million
€ million
2017
2016
Total financial liabilities
(24,430
)
(16,595
)
Current financial liabilities
(7,968
)
(5,450
)
Non-current financial liabilities
(16,462
)
(11,145
)
Cash and cash equivalents as per balance sheet
3,317
3,382
Cash and cash equivalents as per cash flow statement
3,169
3,198
Bank overdrafts deducted therein
167
184
Less cash and cash equivalents held for sale
(19
)
–
Current financial assets
770
599
Net debt
(20,343
)
(12,614
)
UNDERLYING OPERATING PROFIT AND UNDERLYING OPERATING MARGIN
The reconciliation of underlying operating profit to operating profit is as follows:
€ million
€ million
2017
2016
Operating profit
8,857
7,801
Non-underlying items within operating profit
543
823
Underlying operating profit
9,400
8,624
Turnover
53,715
52,713
Operating margin
16.5%
14.8%
Underlying operating margin
17.5%
16.4%
2016 ACQUISITIONS AND DISPOSALS
On 31 March 2016 the Group sold the bread and bakery business under the brand ‘Modern’ in India to Nimman Foods Private Limited, part of the Everstone
Group.
On 7 April 2016 the Group acquired Indulekha and Vayodha brands from Mosons Group.
On 6 May 2016 the Group sold local Alberto Culver brands Antiall, Farmaco, Veritas, the rights for VO5 in Argentina and a manufacturing plant to Santiago Saenz.
On 31 July 2016 the Group sold the Rice Exports business in India to LT Foods Middle East DMCC, a Group company of LT Foods Limited.
On 10 August 2016 the Group acquired Dollar Shave Club, a subscription-based
direct-to-consumer male grooming business.
On 20 October 2016 the Group acquired
Seventh Generation, a North American home and personal care eco-friendly naturals business.
1 December 2016 the Group
acquired Blueair, a supplier of innovative mobile indoor air purification technologies and solutions.
FINANCIAL INSTRUMENTS AND RISK
The key financial instruments used by Unilever are short-term and long-term borrowings, cash and cash equivalents, and certain plain vanilla derivative instruments,
principally comprising interest rate swaps and foreign exchange contracts. Treasury processes are governed by standards approved by the Unilever Leadership Executive. Unilever manages a variety of market risks, including the effects of changes in
foreign exchange rates, interest rates, commodity costs and liquidity.
OUTLOOK
Looking forward, our priority is to accelerate quality growth. That means an investment-led approach based on delivering our 4G growth strategy – consistent growth,
competitive growth, profitable growth and responsible growth, with an equal focus on each. In 2019 we expect market conditions to remain challenging. We anticipate underlying sales growth will be in the lower half of our multi-year 3–5% range,
with continued improvement in underlying operating margin and another year of strong free cash flow. We remain on track for our 2020 goals.
OTHER INFORMATION ON THE COMPANY
RAW MATERIALS
Our products use a wide variety of raw and packaging materials
which we source internationally and which may be subject to price volatility either directly or as a result of movements in foreign exchange rates. In 2018 we saw higher market inflation than in 2017 with price rises in crude-derived materials
including plastic packaging and surfactants. Foreign exchange rates deteriorated over the second half of the year across most emerging markets, with significant impact from Argentina, India, Brazil and Turkey. Looking ahead to 2019 we remain
watchful for volatility in commodity and foreign exchange markets.
SEASONALITY
Certain of our businesses, such as ice cream, are subject to significant seasonal fluctuations in sales. However, Unilever operates globally in many different markets and
product categories, and no individual element of seasonality is likely to be material to the results of the Group as a whole.
INTELLECTUAL PROPERTY
We have a large portfolio of patents and trademarks, and we conduct some of our operations under licences that are based on patents or trademarks owned or controlled by
others. We are not dependent on any one patent or group of patents. We use all appropriate efforts to protect our brands and technology.
As a fast-moving
consumer goods (FMCG) company, we are competing with a diverse set of competitors. Some of these operate on an international scale like ourselves, while others have a more regional or local focus. Our business model centres on building brands which
consumers know, trust, like and buy in conscious preference to competitors’. Our brands command loyalty and affinity and deliver superior performance.
INFORMATION PRESENTED
Unless otherwise stated, share refers to value share.
The market data and competitive set classifications are taken from independent industry sources in the markets in which Unilever operates.
IRAN-RELATED REQUIRED
DISCLOSURE
Unilever operates in Iran through a non-US subsidiary. In 2018, sales in Iran were significantly less than one
percent of Unilever’s worldwide turnover. During the year, this non-US subsidiary had approximately €1,528 in gross revenues and less than €382 in net profits attributable to the sale of food, personal care and home care products to the Hotel Homa Group, which is owned by the Social Security Organization of Iran, and IRR Mohammad
Rasoullah Pharmacy, which is affiliated with the Islamic Revolutionary Guard Corps. We advertised our products on television networks that are owned by the Government of Iran or affiliated entities. Income, payroll and other taxes, duties and fees
(including for utilities) were payable to the Government of Iran and affiliated entities in connection with our operations. Our non-US subsidiary maintains bank accounts in Iran with various banks to
facilitate our business in the country and make any required payments to the Government of Iran and affiliated entities. Our activities in Iran comply in all material respects with applicable laws and regulations, including US and other
international trade sanctions, and we plan to continue these activities.
PROPERTY, PLANT AND EQUIPMENT
We
have interests in properties in most of the countries where there are Unilever operations. However, none are material in the context of the Group as a whole. The properties are used predominantly to house production and distribution activities and
as offices. There is a mixture of leased and owned property throughout the Group. We are not aware of any environmental issues affecting the properties which would have a material impact upon the Group, and there are no material encumbrances on our
properties. Any difference between the market value of properties held by the Group and the amount at which they are included in the balance sheet is not significant. We believe our existing facilities are satisfactory for our current business and
we currently have no plans to construct new facilities or expand or improve our current facilities in a manner that is material to the Group.
This
document may contain forward-looking statements, including ‘forward-looking statements’ within the meaning of the United States Private Securities Litigation Reform Act of 1995. Words such as ‘will’, ‘aim’,
‘expects’, ‘anticipates’, ‘intends’, ‘looks’, ‘believes’, ‘vision’, or the negative of these terms and other similar expressions of future performance or results, and their negatives, are
intended to identify such forward-looking statements. These forward-looking statements are based upon current expectations and assumptions regarding anticipated developments and other factors affecting the Unilever Group (the ‘Group’).
They are not historical facts, nor are they guarantees of future performance.
Because these forward-looking statements involve risks and uncertainties, there are
important factors that could cause actual results to differ materially from those expressed or implied by these forward-looking statements. Among other risks and uncertainties, the material or principal factors which could cause actual results to
differ materially are: Unilever’s global brands not meeting consumer preferences; Unilever’s ability to innovate and remain competitive; Unilever’s investment choices in its portfolio management; inability to find sustainable
solutions to support long-term growth including to plastic packaging; the effect of climate change on Unilever’s business; significant changes or deterioration in customer relationships; the recruitment and retention of talented employees;
disruptions in our supply chain and distribution; increases or volatility in the cost of raw materials and commodities; the production of safe and high quality products; secure and reliable IT infrastructure; execution of acquisitions, divestitures
and business transformation projects; economic, social and political risks and natural disasters; financial risks; failure to meet high and ethical standards; and managing regulatory, tax and legal matters.
These forward-looking statements speak only as of the date of this document. Except as required by any applicable law or regulation, the Group expressly disclaims any
obligation or undertaking to release publicly any updates or revisions to any forward-looking statements contained herein to reflect any change in the Group’s expectations with regard thereto or any change in events, conditions or circumstances
on which any such statement is based.
Further details of potential risks and uncertainties affecting the Group are described in the Group’s filings with the
London Stock Exchange, Euronext Amsterdam and the US Securities and Exchange Commission, including in the Unilever Annual Report and Accounts 2018.
This document is
not prepared in accordance with US GAAP and should not therefore be relied upon by readers as such.
In addition, a printed copy of the Annual Report on Form 20-F 2018 is available, free of charge, upon request to Unilever, Investor Relations Department, 100 Victoria Embankment, London EC4Y 0DY, United Kingdom.
This document comprises regulated information within the meaning of Sections 1:1 and 5:25c of the Act on Financial Supervision (‘Wet op het financieel toezicht
(Wft)’) in the Netherlands.
The brand names shown in this report are trademarks owned by or licensed to companies within the Group.
References in this document to information on websites (and/or social media sites) are included as an aid to their location and such information is not incorporated in,
and does not form part of, the Annual Report on Form 20-F 2018.
Designed and produced by Unilever Communications.
Printed at Pureprint Group, ISO
14001. FSC® certified and CarbonNeutral®.
This
document is printed on Revive 100% Recycled Silk. These papers have been exclusively supplied by Denmaur Independent Papers which has offset the carbon produced by the production and delivery of them to the printer.
These papers are 100% recycled and manufactured using de-inked post-consumer waste. All the pulp is bleached using an elemental
chlorine free process (ECF). Printed in the UK by Pureprint using its pureprint® environmental printing technology. Vegetable inks were used throughout. Pureprint is a CarbonNeutral® company. Both the manufacturing mill and the printer are registered to the Environmental Management System ISO 14001 and are Forest Stewardship Council® (FSC) chain-of-custody certified.
If you have finished with this document and no longer wish to retain it, please pass it on to other interested readers or dispose of it in your recycled paper waste.
Thank you.
Certain instruments which define rights of holders of long-term debt of the Company and its subsidiaries are not being filed
because the total amount of securities authorized under each such instrument does not exceed 10% of the total consolidated assets of the Company and its subsidiaries. The Company and its subsidiaries hereby agree to furnish a copy of each such
instrument to the Securities and Exchange Commission upon request.
1.
Incorporated by reference to Exhibit 1.1 of Form 20-F (File No: 001-04546) filed with the SEC on March 08, 2013.
2.
Incorporated by reference to Exhibit 2.2 of Form 20-F (File No: 001-04546) filed with the SEC on March 28, 2002.
3.
Incorporated by reference to Exhibit 2.2 on Form 20 -F (File no 001-04546) filed with the SEC on 28 February 2017
4.
Incorporated by reference to Exhibit 2.3 of Form 20-F (File No: 333-196985) filed with the SEC on March 6, 2015.
5.
Incorporated by reference to Exhibit 99(A) of Form F-6 (File No: 001-04546) filed with the SEC on June 24, 2014.
6.
Incorporated by reference to Exhibit 4.1 of Form 20-F (File No: 001-04546) filed with the SEC on March 5, 2010.
7.
Incorporated by reference to Exhibit 4.1(b) of Form 20-F (File No: 001-04546) filed with the SEC on March 6, 2015.
8.
Incorporated by reference to Exhibit 4.1(c) of Form 20-F (File No: 001-04546) filed with the SEC on March 6, 2015.
9.
Incorporated by reference to Exhibit 99.1 of Form S-8 (File No: 333-185299) filed with the SEC on December 6, 2012.
10.
Incorporated by reference to Exhibit 4.5 of Form 20-F (File No: 001-04546) filed with the SEC on March 28, 2002.
11.
Incorporated by reference to Exhibit 4.7 of Form 20-F (File No: 001-04546) filed with the SEC on March 28, 2002.
12.
Incorporated by reference to Exhibit 4.7 of Form 20-F (File No: 001-04546) filed with the SEC on March 26, 2008.
13.
Incorporated by reference to Exhibit 4.8 of Form 20-F (File No: 001-04546) filed with the SEC on March 4, 2011.
The
registrant hereby certifies that it meets all of the requirements for filing on Form 20-F and that it has duly caused and authorised the undersigned to sign this Annual Report on its behalf.