MANAGEMENT REPORT | |||||||||||||||||||
Annual review | Sustainability statement | Financial statements and additional information | |||||||||||||||||
 |  |  |  |  | |||||||||||||||
3 4 7 8 9 10 11 | 12 13 14 20 26 32 | 35 36 37 39 41 | 45 51 71 132 | 82 120 125 131 | |||||||||||||||
– – – | 4 | ||
Sharpening our focus for a new era | 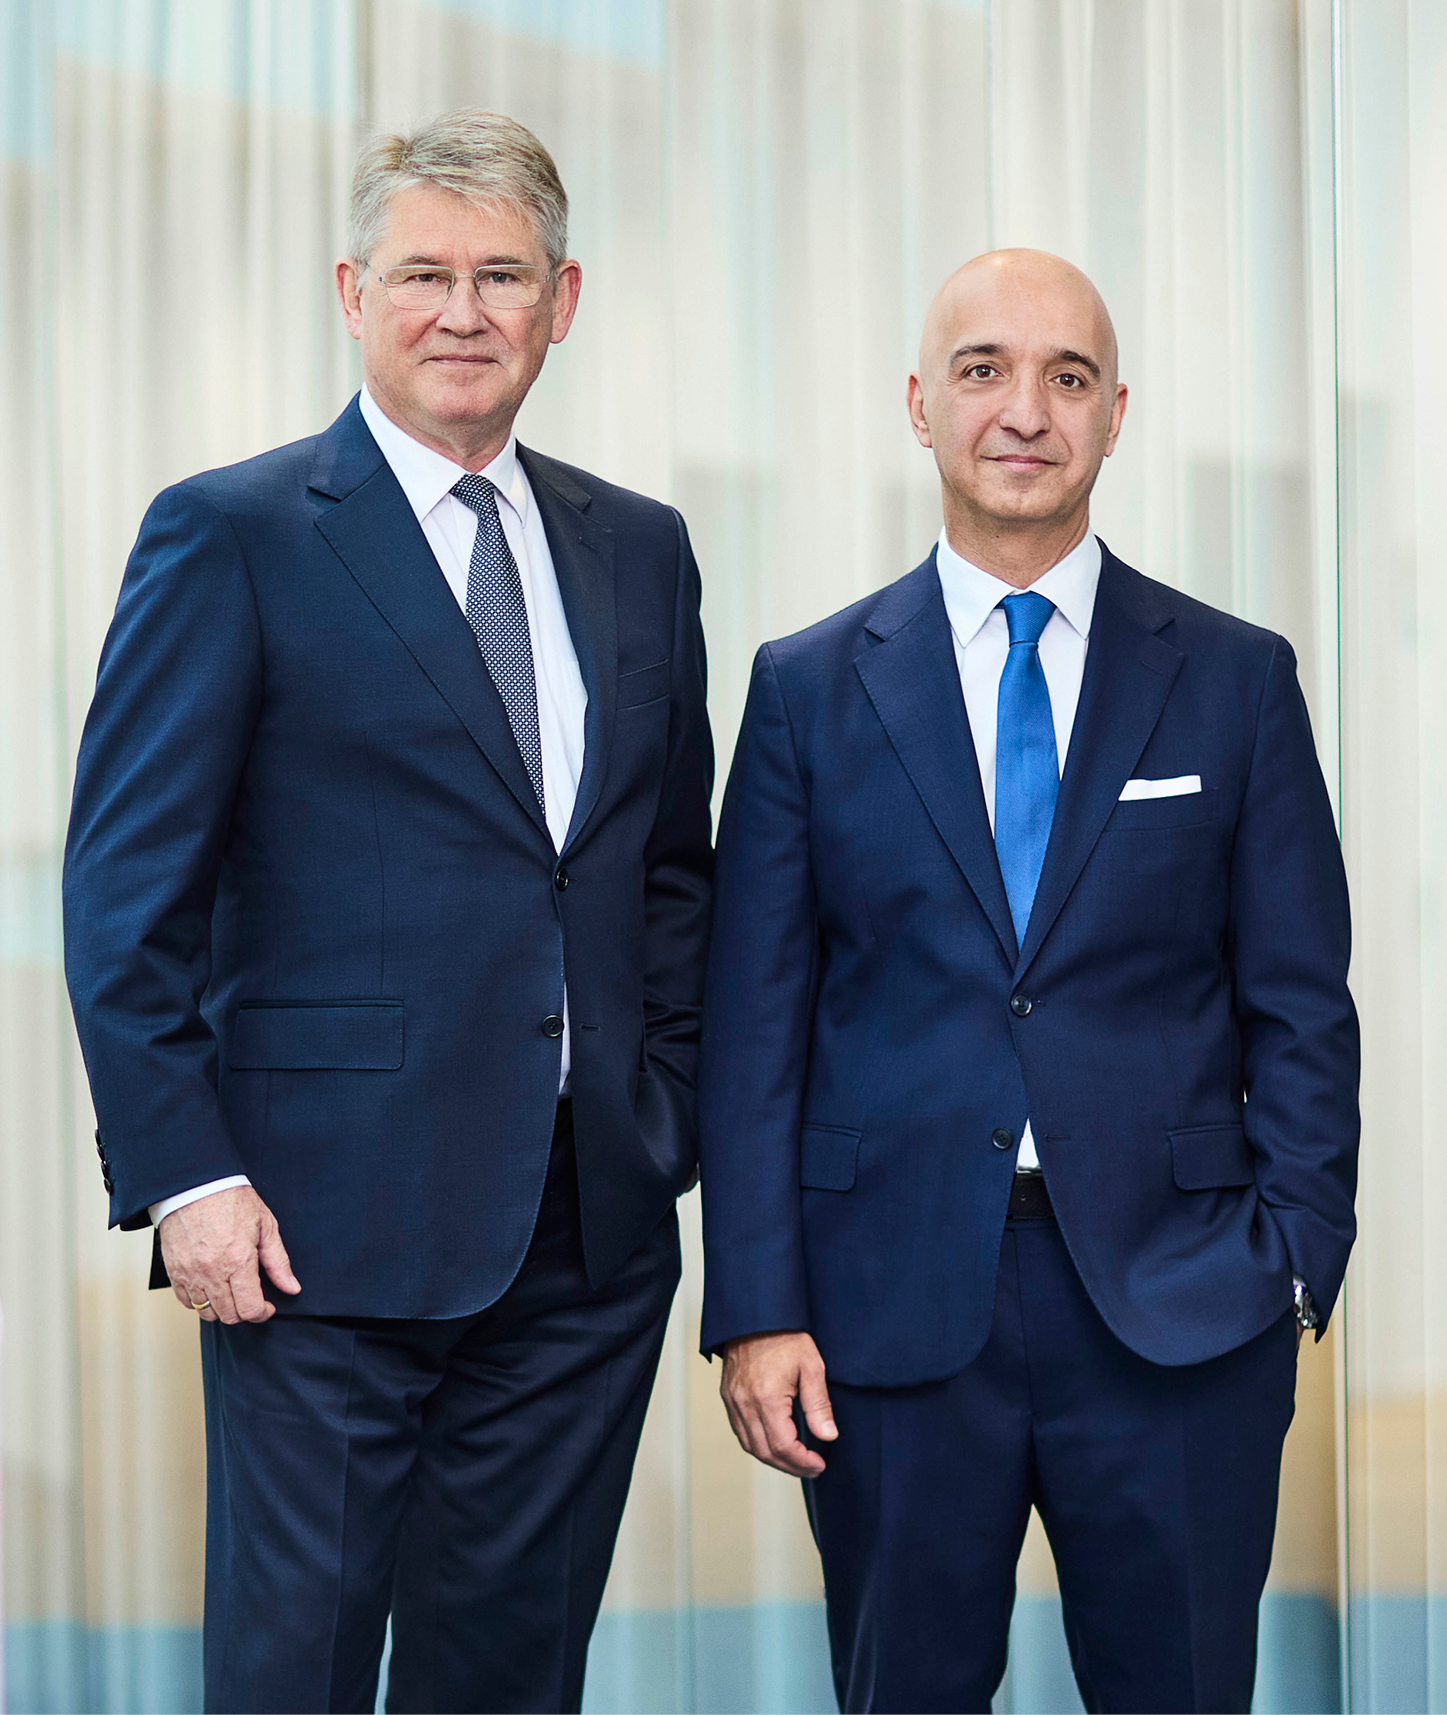 | ||||
As we reflect on 2025 and look towards the future, we write at a pivotal moment in Novo Nordisk’s journey. The past year has been one of profound transformation; testing our resilience, sharpening our focus and positioning us for sustainable success in an increasingly dynamic healthcare landscape. | |||||
For decades, Novo Nordisk flourished in the diabetes market, building expertise patient by patient, innovation by innovation. Our entry into obesity treatment – a field we pioneered and shaped – thrust us into an era of unprecedented growth that, frankly, surprised even us. This huge demand changed everything: people with obesity actively seeking our medicines, self-paying consumers seeking faster access and a global spotlight on our every move. This extraordinary period taught us important lessons about serving consumer-driven markets. We discovered that people living with obesity face completely different challenges than those living with diabetes. Instead of fear, they often feel shame or stigmatisation. Instead of conventional clinical support, they want discretion. This realisation demanded different approaches than our traditional physician- focused model, forcing us to rethink our traditional approaches to patient care and market access. The competitive landscape has evolved just as dramatically. Where we once enjoyed clear market leadership in obesity treatment, virtually every major pharmaceutical company now recognises this as an attractive market. This competition, whilst challenging, validates the therapeutic area we pioneered and drives continued innovation for patients. We are not intimidated by this new reality; after all, our century-long experience in diabetes has taught us how to compete successfully in crowded markets. What sets us apart remains compelling: unmatched global reach, extensive manufacturing investments and an unparalleled understanding of metabolic diseases. We have also seen encouraging recognition from the World Health Organization, which has acknowledged the multiple health benefits of GLP-1 treatments and has committed to exploring ways to expand access globally. This growing institutional support opens exciting new pathways to bring our life-changing treatments to more people with obesity and diabetes, wherever they are. | |||||
Chair of the Board of Directors Lars Rebien Sørensen (left) and President and CEO Maziar Mike Doustdar (right). | |||||
– – – | 5 | ||
In response to these market shifts, we have made decisive changes to remain the leader in obesity and diabetes care. We have refocused our strategy on these core therapeutic areas – not as a limitation, but as recognition that serving the two billion people living with obesity, overweight or diabetes provides massive opportunities for growth and impact. This sharpened focus reflects our DNA: throughout our history, we have always succeeded when concentrating our efforts where we make the greatest difference. Operationally, we have merged our research and development functions to accelerate innovation without compromise, creating seamless progression from early research through clinical development. We have also simplified governance structures to increase our operational speed whilst maintaining our commitment to ethics and compliance. The most challenging decision of 2025 was the reduction of our workforce – the largest in our company’s history. After scaling up rapidly during a period of hyper-growth, we recognised staffing levels had become unsustainable as market dynamics shifted, requiring difficult but necessary action to ensure financial discipline. We approached this with deep respect for those colleagues affected, conducting the process swiftly and with dignity, consistent with the Novo Nordisk Way. These actions preserved our ability to redirect resources towards obesity and diabetes growth opportunities essential to serving patients and driving our future success. Furthermore, changes to the composition of our Board reflect our commitment to having the right competencies for this new business reality. Following dialogue between Novo Nordisk’s Board and the board of the Novo Nordisk Foundation, different visions for the pace and extent of board renewal made an extraordinary general meeting necessary to provide clarity on governance. Our reconfigured Board stands ready to support management in responding rapidly to market conditions in this dynamic environment. Moving forward, we are committed to constructive engagement with shareholders, ensuring that their perspectives help shape the road ahead. Our path forward centres on expanding access whilst accelerating innovation. We will develop products for different patient needs, price points and preferences. Just as we serve people living with diabetes with multiple insulin formulations, we will build a comprehensive obesity portfolio offering diverse treatment options. This means developing therapies that address the full spectrum of patient circumstances – from those seeking the highest efficacy outcomes to those who need different delivery methods, dosing frequencies or treatment profiles that better suit their individual needs. A significant milestone has been the record-breaking launch of the Wegovy® pill – the world’s first and only once-daily oral GLP-1 therapy approved for weight management. This breakthrough addresses patient preferences whilst leveraging the proven efficacy and safety profile of semaglutide, positioning us uniquely in an increasingly competitive field. | With our expanding treatment options, we view the upcoming loss of exclusivity for semaglutide in certain markets as an opportunity, not a threat. When you have multiple ways to serve patients, patent cliffs become stepping stones to broader access. Generic competition will expand access to obesity treatments, creating a stronger foundation for next-generation innovations whilst our oral formulation, higher-strength versions and novel mechanisms will serve diverse patient needs. As our transformation continues, so does our long-standing commitment to sustainable business practices. The triple bottom line – balancing financial performance with social responsibility and environmental stewardship – remains fundamental to our identity. Long-term value creation requires attention to these broader impacts, and we continue to invest in sustainable practices whilst setting realistic, achievable targets that we can deliver upon. Throughout this evolution, we remain anchored by the same patient-first obsession that has guided us for more than a century. Every decision and every innovation must ultimately serve the health and wellbeing of the more than 45.6 million patients who depend on us today, and the hundreds of millions more we aim to serve in future. This patient-centric approach extends across our entire value chain: from researchers designing molecules with real-world patient needs in mind, to pricing strategies reflecting diverse affordability requirements, to commercial approaches that meet people where and how they want to access care. As we look to 2026 and beyond, we are not promising a rapid return to the extraordinary growth rates of recent years. Market conditions have evolved, competition has intensified and expanding access to our life-changing medicines means finding new ways to reach more patients whilst continuing to invest in the breakthrough treatments of tomorrow. In response, we are building a stronger, more focused organisation that can deliver sustainable value whilst fulfilling our mission to defeat obesity, diabetes and related comorbidities. The year ahead will test our resolve and capabilities. We face it with confidence, knowing that our renewed focus, strengthened competencies and uncompromising commitment to people with serious chronic diseases position us well for the challenges and opportunities ahead. Thank you for your continued trust and support as we write Novo Nordisk’s next chapter. | ||||||
 |  | ||||||
Lars Rebien Sørensen Chair of the Board of Directors | Maziar Mike Doustdar President and CEO | ||||||
– – – | 6 | ||
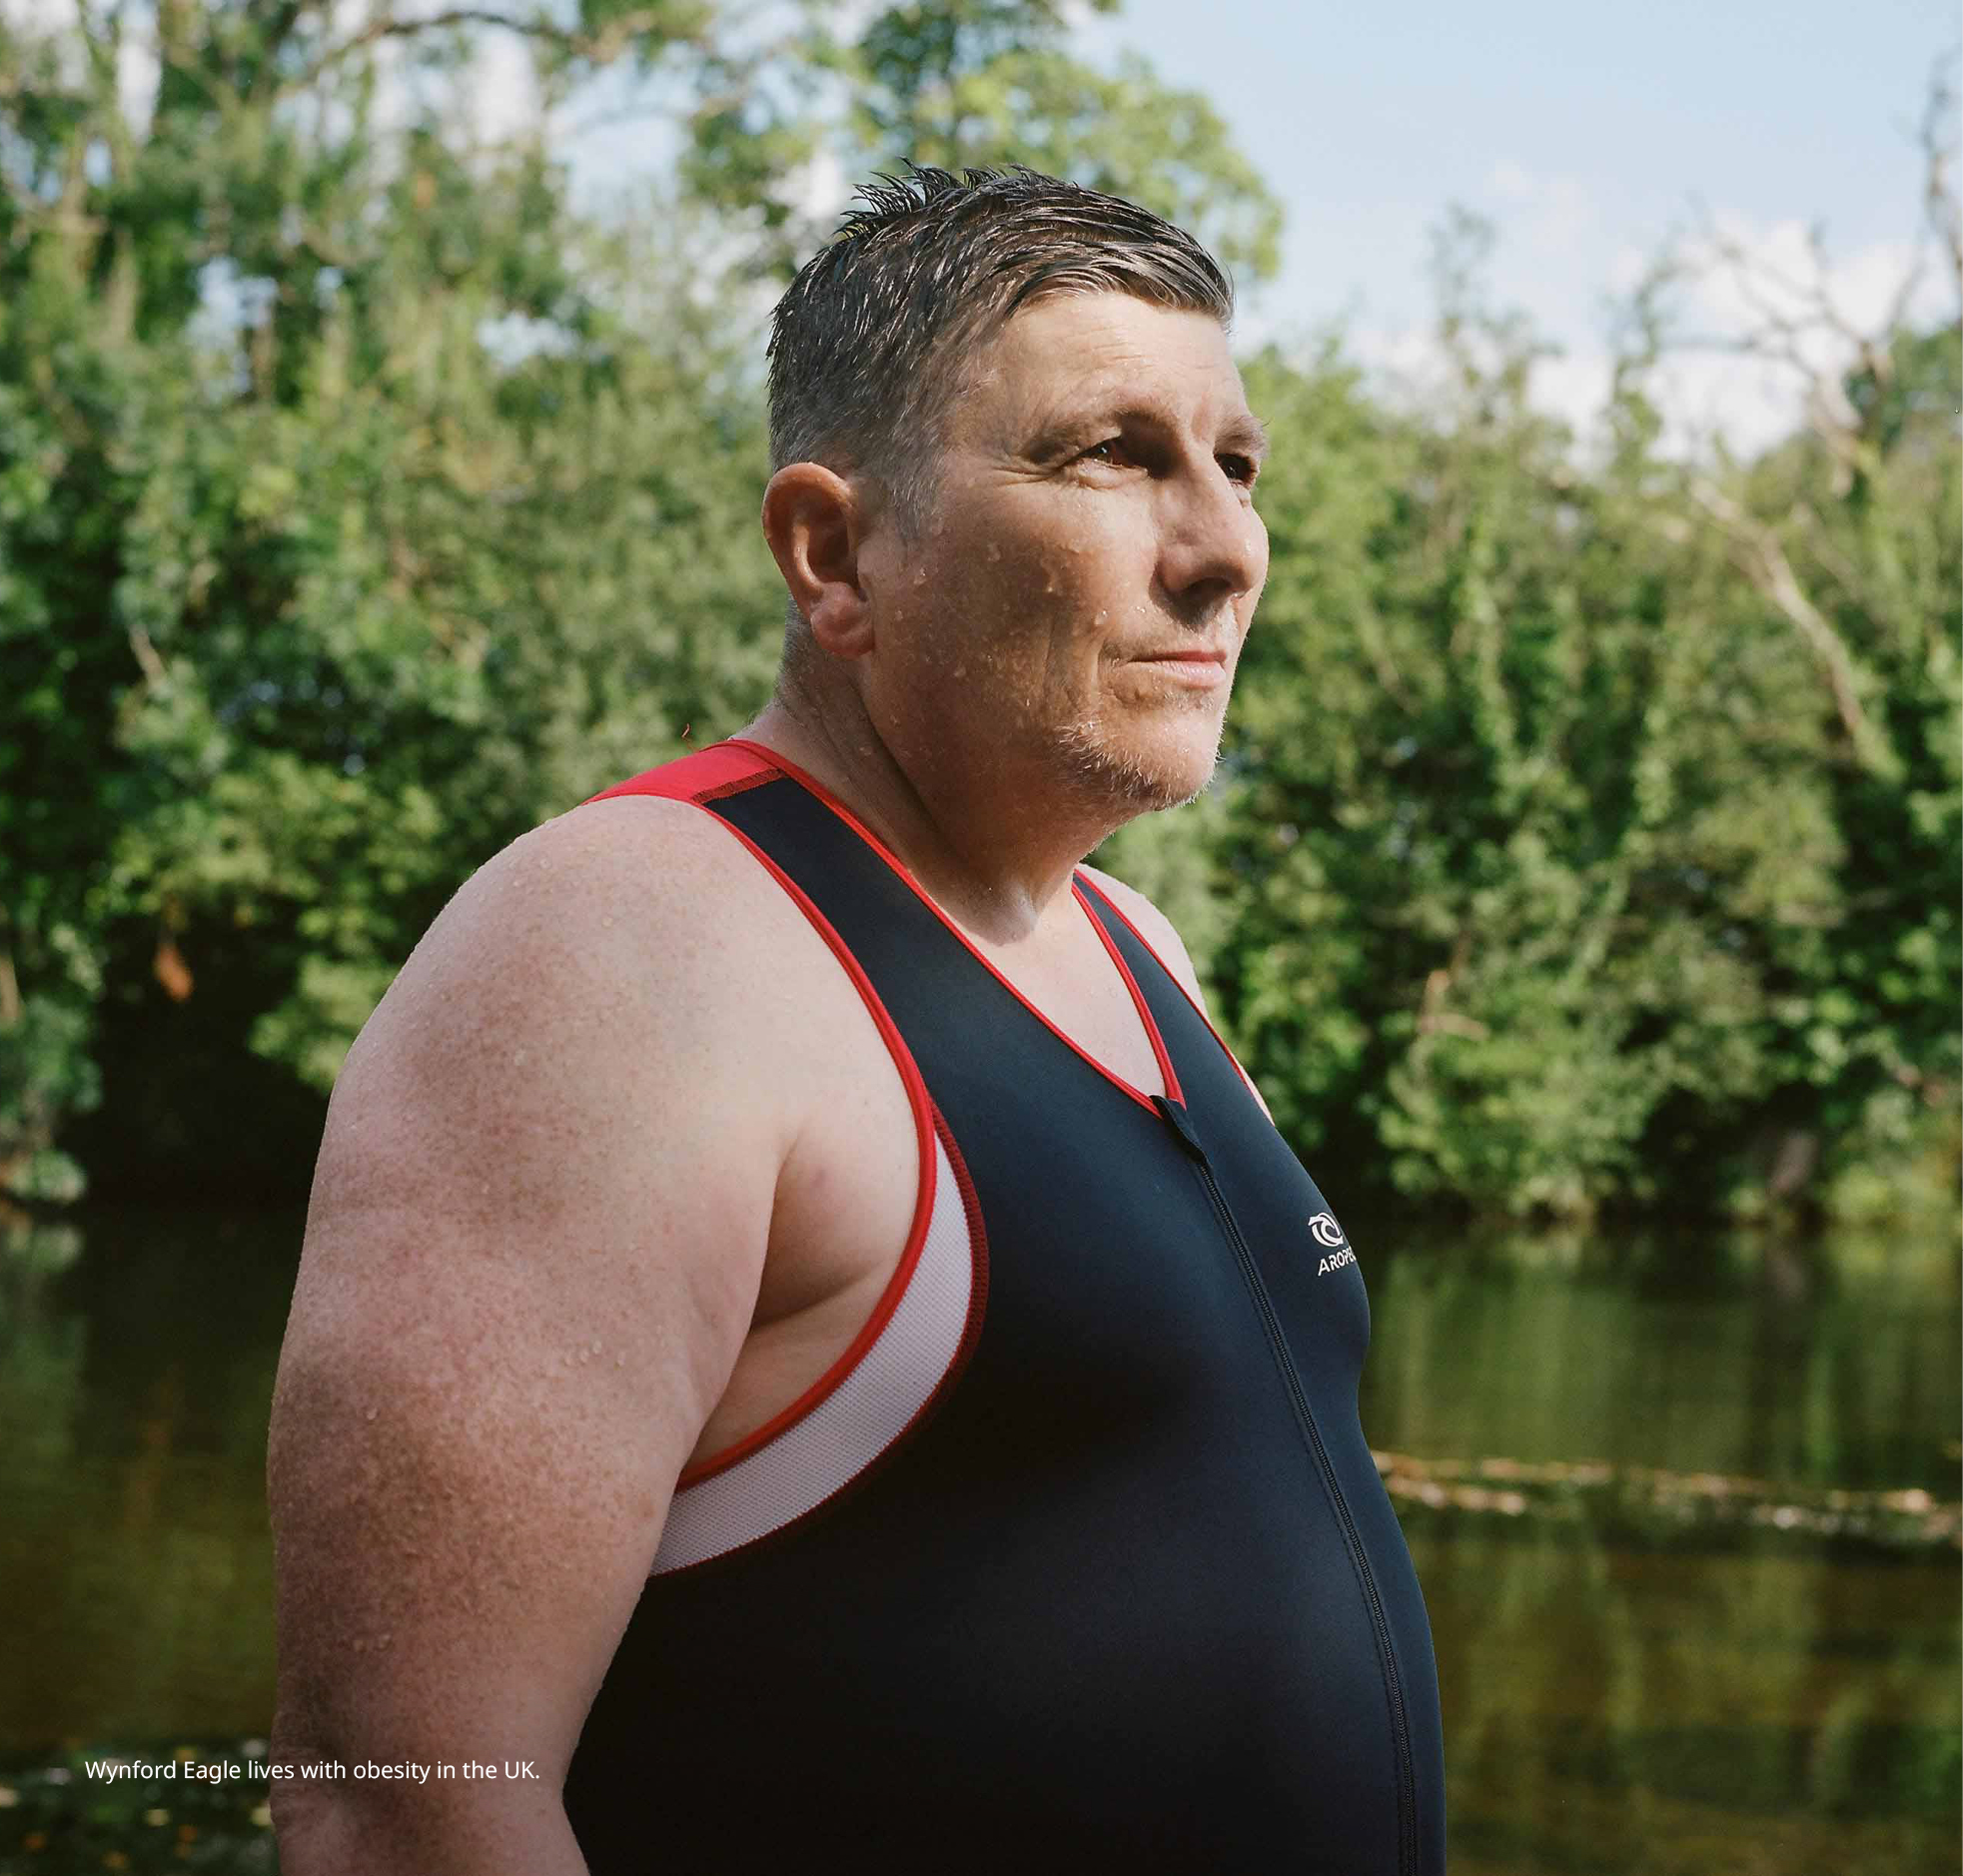
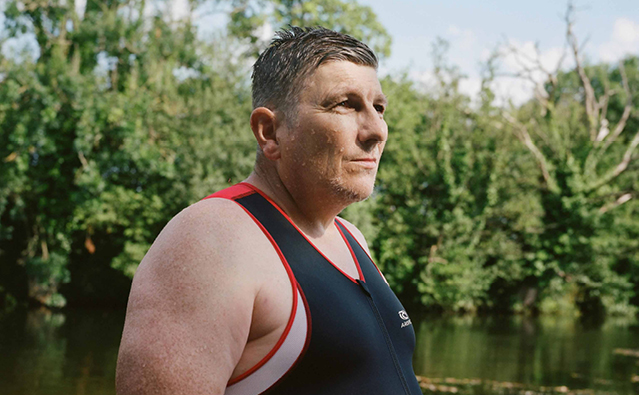
Q&A WITH THE CEO Leading through change |  | The soaring demand for obesity treatment has also highlighted critical patient safety issues with unapproved compounded products that do not undergo rigorous review for safety, effectiveness and quality. This reinforces why authentic, thoroughly tested medicines matter. Our responsibility extends beyond serving people with obesity to actively seeking to protect them from the safety and efficacy risks posed by unapproved compounded products. How does Novo Nordisk’s portfolio strategy address these diverse patient needs? Reaching millions more people means we need a portfolio that works for everyone – from affordable options to cutting-edge treatments. In obesity, we are building a strong pipeline with higher-dose and oral formulations of Wegovy® and exciting next-generation therapies like zenagamtide (amycretin) and CagriSema. But that is just part of the story. We are also focused on diabetes with the continued rollout of Awiqli® and the EU approval of Kyinsu® (IcoSema), plus we are preparing for the launch of denecimig (Mim8) for people living with haemophilia A. Different patients have different motivations and preferences. Some need treatment to address serious underlying health risks, others to improve their quality of life. Some prefer oral medications whilst others are comfortable with injections. Our portfolio must reflect this segmentation. The impending loss of exclusivity for semaglutide actually strengthens this approach. Generic competition will help establish an affordable foundation whilst we build differentiated innovations on top of that. We will not shy away from business development activities that complement our focused strategy, ensuring we serve people with serious chronic diseases with as many treatment options as needed. What should stakeholders expect as Novo Nordisk moves forward? As we enter 2026, I want to set realistic expectations. As you can see in our financial outlook for the year ahead, we are projecting a sales decline in 2026 and are not promising a rapid return to the extraordinary growth rates of recent years. We are focused on sustainable, long-term value creation by expanding our reach and advancing our pipeline. This means providing access to many more people while building the foundation for future growth. We are pursuing impact growth, measured by how many additional people gain access to life-changing treatments, rather than revenue growth for its own sake. This means building sustainable competitive advantages through breakthrough science, strategic partnerships and access programmes that serve people with serious chronic diseases regardless of their economic circumstances. What gives you confidence in Novo Nordisk’s future? When you reflect on the history of Novo Nordisk, you can see that it has never been one smooth ride. Innovation is never a straight line – what has made us successful over the past 102 years is our ability to show resilience and create new innovations time and again. That same spirit drives us today. The hundreds of millions of people we are yet to reach represent an enormous opportunity. We have the right people, guided by the right values, to meet that challenge whilst living up to our triple bottom line principle. Most importantly, I see colleagues who genuinely care about the patients we serve. That focus on putting patients’ health and wellbeing first remains our greatest strength. This combination of proven resilience and untapped potential is why our best years are still ahead of us. | ||||||
In his first Annual Report as CEO, Maziar Mike Doustdar reflects on a challenging year, the strength of Novo Nordisk's foundations and his vision for sustainable growth through innovation and expanded access. | ||||||||
This has been a difficult year for Novo Nordisk. How do you reflect on your first six months as CEO? It has been a difficult year for our employees and our shareholders. We said goodbye to many good colleagues and we were not able to meet our growth expectations, which has been tough on our colleagues and shareholders alike. Our hyper-growth period led to unsustainable increases in staffing and costs that required difficult but necessary corrections to ensure we could redirect resources towards obesity and diabetes growth opportunities – the areas that will ultimately serve patients. But I have no doubt that the foundations of this company are as strong as ever. We serve millions of people across obesity, diabetes and rare diseases, with so many more yet to reach. During my first six months as CEO, I have interacted with colleagues from across the value chain, and I am more persuaded each time that we have an incredibly talented workforce. What strikes me most is the sense of purpose that guides us: an unwavering commitment to innovation and a genuine obsession to serve patients that has defined our 102-year journey, always guided by the Novo Nordisk Way. How do you view the competitive landscape in obesity treatment? We have pioneered an area of unmet need that has created robust competition, and competition has always served innovation and the needs of patients. What motivates me is that the obesity market contains hundreds of millions of people with diverse needs; this is not a constraint, it is an enormous opportunity for a company with our capabilities. The competitive environment has also taught us valuable lessons about truly understanding our patients. For example, we have learned that some people living with obesity prefer accessing treatment through online providers from the privacy of their homes rather than in traditional clinical settings. Understanding these real patient preferences is crucial to our success. | ||||||||
– – – | 7 |
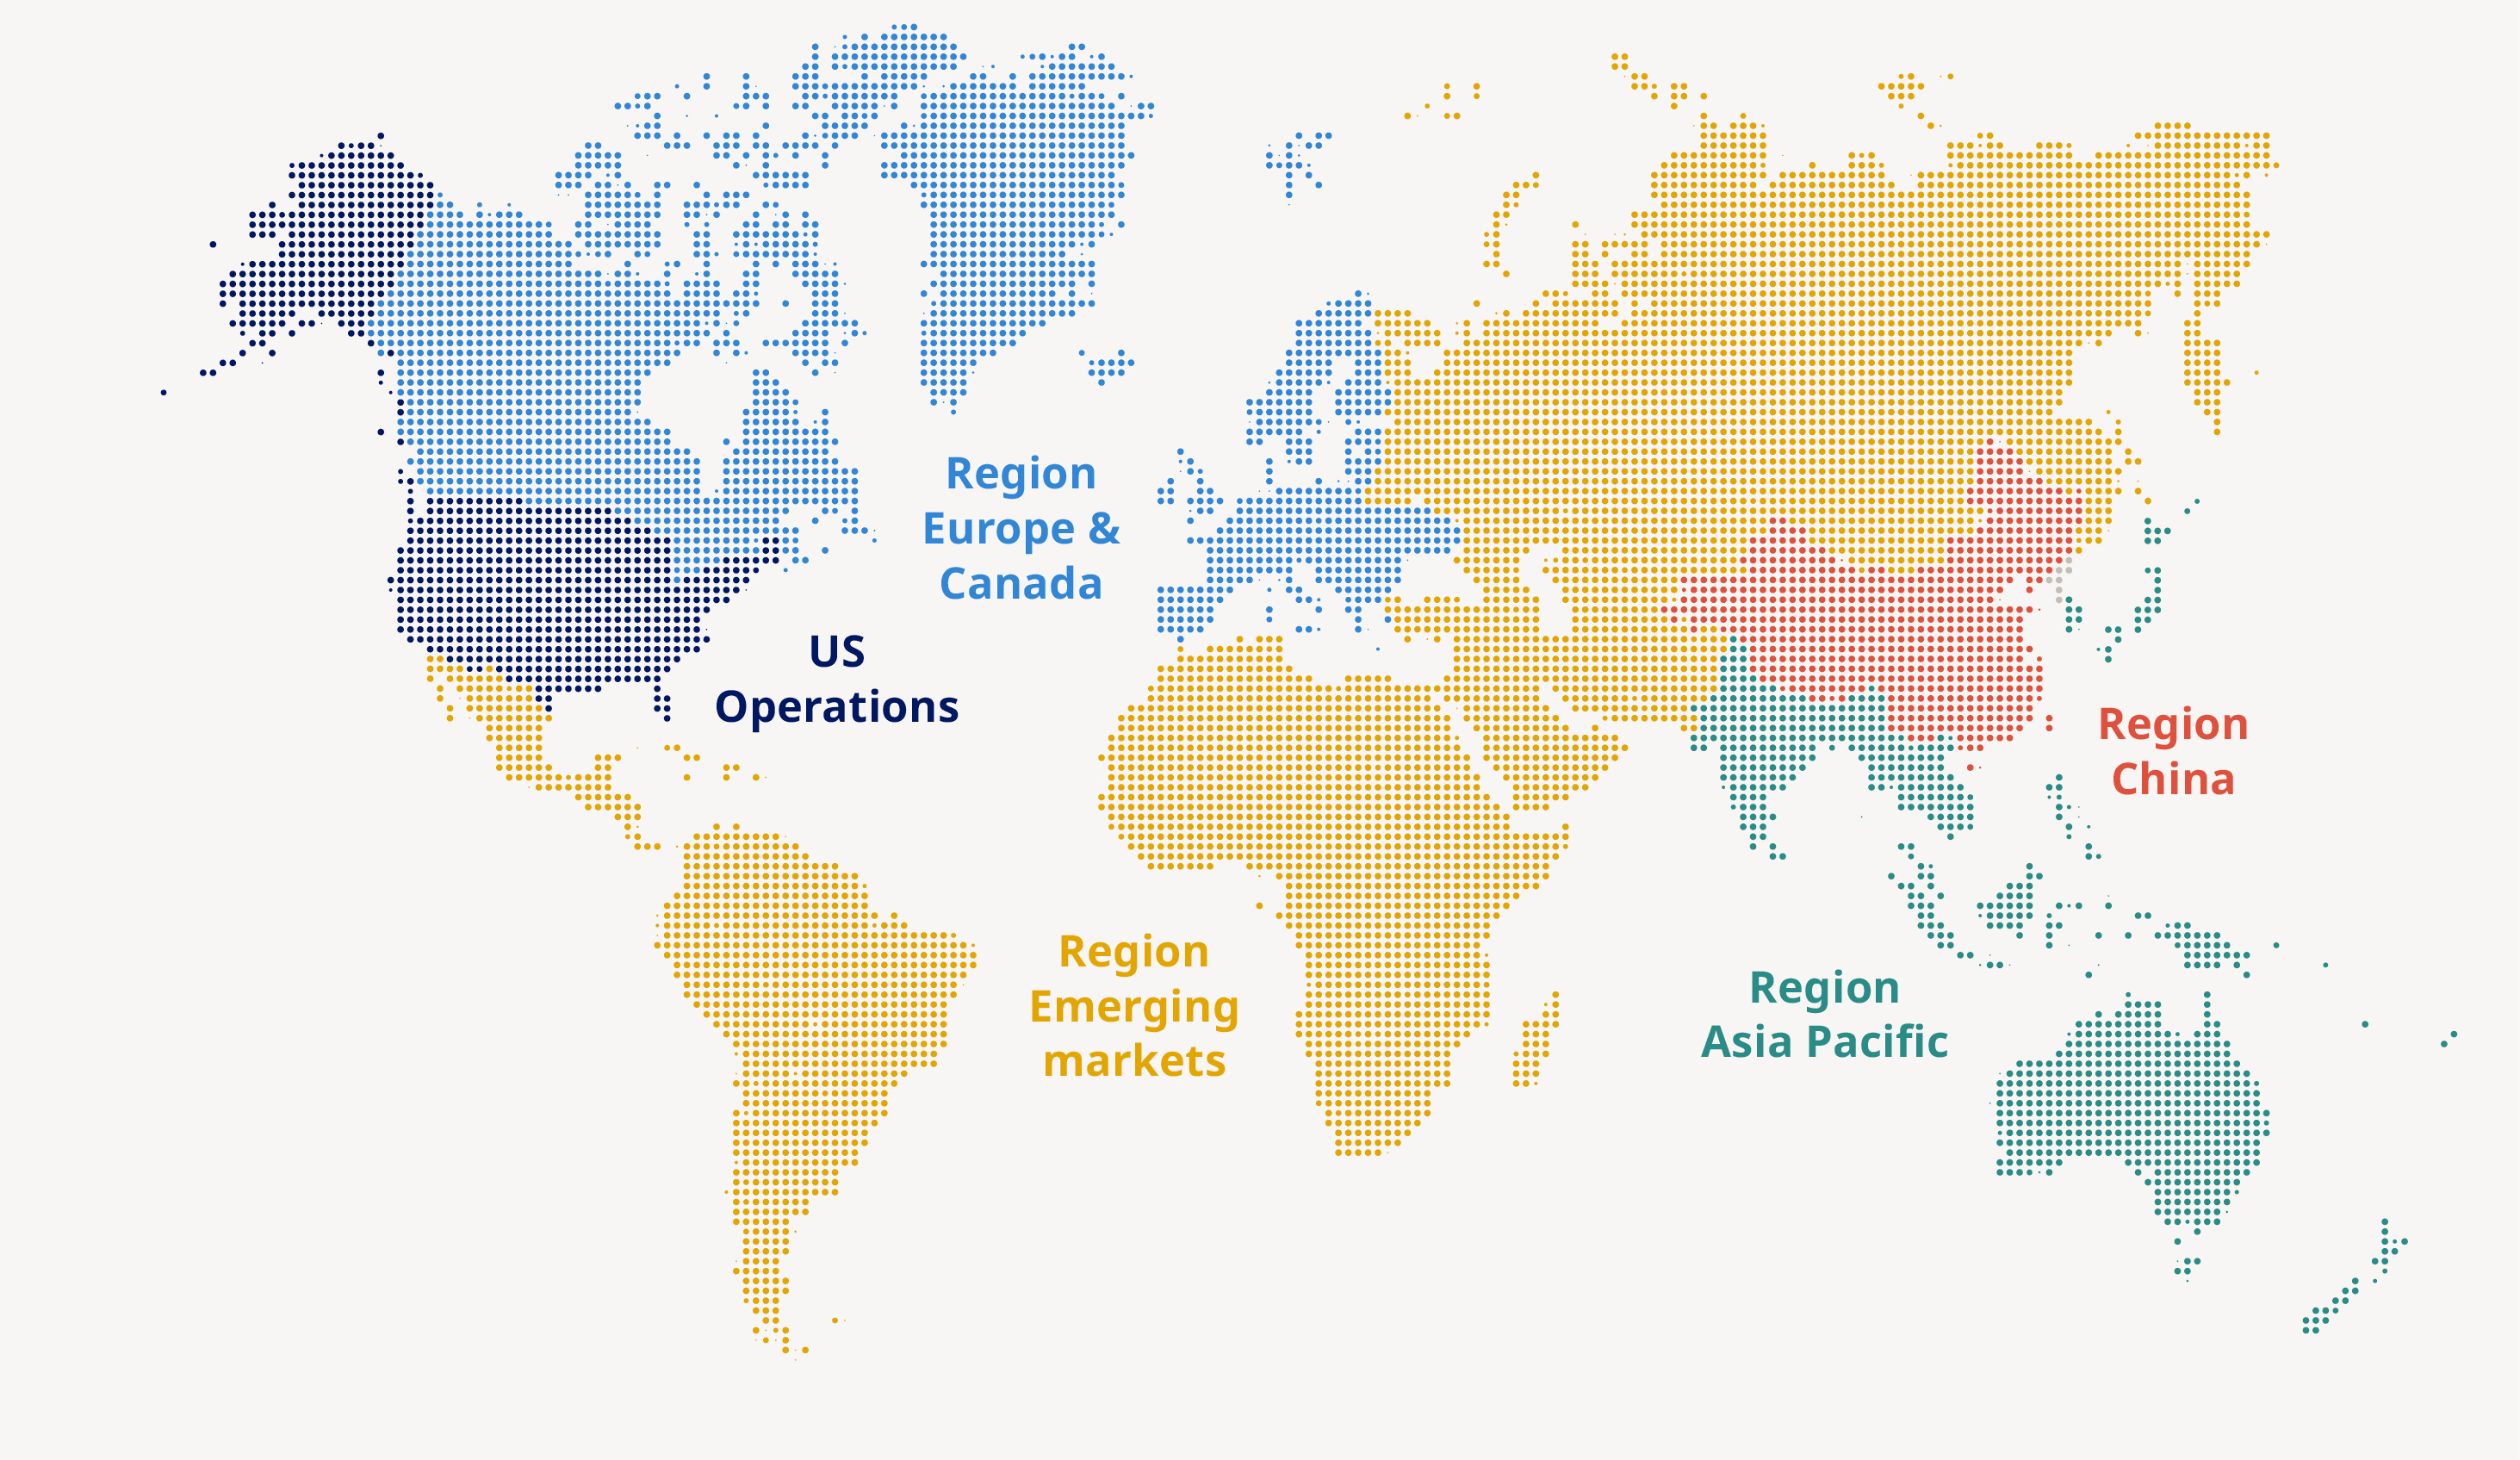
2025 at a glance Novo Nordisk is a leading global healthcare company, founded in 1923 and headquartered in Denmark. | GEOGRAPHICAL AREAS | 45.6 million people living with obesity and diabetes reached (45.2 million in 2024) | 6.4% sales growth as reported (25% in 2024) | ||||
 | |||||||
52 countries with Wegovy® available (17 in 2024) | 11.70 dividend per share (DKK 11.40 in 2024) | ||||||
673 submissions and approvals of new products (593 in 2024) | 69,505 employees worldwide (77,349 in 2024) | ||||||
KEY EVENTS | ||||||||||||||
 | ||||||||||||||
Acquisitions and licencing to enhance portfolio of treatments. Included the acquisition of Akero Therapeutics, Inc. and its phase 3 asset (MASH) and licence agreements with The United Laboratories (triple receptor agonist) and Septerna, Inc. (small molecules). | Maziar Mike Doustdar appointed as president and chief executive officer of Novo Nordisk. Maziar Mike Doustdar, formerly executive vice president of International Operations, succeeded Lars Fruergaard Jørgensen in the role. | Wegovy® approved in the US for the treatment of MASH. The Food and Drug Administration (FDA) approval positioned Wegovy® as the first and only GLP-1 treatment approved for MASH, complementing proven weight loss and cardiovascular benefits. | Company-wide transformation plan to streamline operations and reinvest for growth. Included a global workforce reduction of around 9,000 positions with annualised savings of DKK 8 billion from 2026 and onwards redirected to obesity and diabetes growth opportunities. | Expanded affordability options to bring our GLP-1s to more Americans. Expanding access and affordability for our semaglutide medicines on top of existing initiatives such as lower self-pay prices and collaborations with select telehealth providers. | Advanced pipeline programmes and submitted new medicines for approval. Key progress included advancing zenagamtide (amycretin) to initiate phase 3 trials in 2026, and filing weight management medicine CagriSema to the FDA. | FDA approval and launch of Wegovy® pill in the US. First and only approved once- daily oral GLP-1 medicine for weight management. With efficacy on par with injectable semaglutide and more optionality, this advancement opens new possibilities for the more than 100 million people living with obesity in the US. | ||||||||
– – – | 8 |
Five-year overview |
Financial performance | Change | ||||||
DKK million | 2021 | 2022 | 2023 | 2024 | 2025 | 2024-25 | |
Net sales | 140,800 | 176,954 | 232,261 | 290,403 | 309,064 | 6.4% | |
Sales growth as reported | 10.9% | 25.7% | 31.3% | 25.0% | 6.4% | ||
Sales growth in constant exchange rates1 | 13.8% | 16.4% | 35.6% | 25.7% | 10.3% | ||
Operating profit | 58,644 | 74,809 | 102,574 | 128,339 | 127,658 | (0.5%) | |
Operating profit growth as reported | 8.3% | 27.6% | 37.1% | 25.1% | (0.5%) | ||
Operating profit growth in constant exchange rates1 | 12.7% | 14.6% | 43.7% | 26.2% | 6.0% | ||
Depreciation, amortisation and impairment losses | 6,025 | 7,362 | 9,413 | 19,107 | 21,982 | 15.0% | |
EBITDA1,2 | 64,669 | 82,171 | 111,987 | 147,446 | 149,640 | 1.5% | |
EBITDA growth as reported1, 2 | 8.0% | 27.1% | 36.3% | 31.7% | 1.5% | ||
EBITDA growth in constant exchange rates1, 2 | 12.0% | 14.9% | 42.4% | 32.7% | 7.3% | ||
Net financials | 436 | (5,747) | 2,100 | (1,148) | 2,882 | ||
Profit before income taxes | 59,080 | 69,062 | 104,674 | 127,191 | 130,540 | 2.6% | |
Effective tax rate3 | 19.2% | 19.6% | 20.1% | 20.6% | 21.5% | ||
Net profit | 47,757 | 55,525 | 83,683 | 100,988 | 102,434 | 1.4% | |
Adjusted net profit1 | 49,146 | 57,370 | 86,229 | 110,557 | 116,407 | ||
Purchase of property, plant and equipment | 6,335 | 12,146 | 25,806 | 47,164 | 60,140 | 28% | |
Purchase of intangible assets | 1,050 | 2,607 | 13,090 | 4,145 | 29,973 | 623% | |
Cash used for acquisition of businesses | 18,283 | 7,075 | — | 82,163 | — | ||
Free cash flow1 | 29,319 | 57,362 | 68,326 | (14,707) | 28,295 | ||
Total assets | 194,508 | 241,257 | 314,486 | 465,630 | 542,902 | 17% | |
Net debt1 | (5,031) | 2,319 | 8,950 | (69,713) | (95,424) | 37% | |
Equity | 70,746 | 83,486 | 106,561 | 143,486 | 194,047 | 35% | |
1. See Non-IFRS financial measures. 2. EBITDA is defined as ’net profit’, adjusted for 'income taxes', 'financial items', 'depreciation and amortisation' and 'impairment losses and reversals'. 3. See Financial definitions and ratios. 4. Total dividend for the year including interim dividend of DKK 3.75 per share, corresponding to DKK 16,663 million, which was paid in August 2025. The remaining DKK 7.95 per share, corresponding to DKK 35,312 million, will be paid subject to approval at the Annual General Meeting in March 2026. 5. Total number of patients reached by obesity and diabetes products. 6. GHG: Greenhouse Gas. | |||||||
Financial ratios | Change | ||||||
DKK million | 2021 | 2022 | 2023 | 2024 | 2025 | 2024-25 | |
Gross margin3 | 83.2% | 83.9% | 84.6% | 84.7% | 81.0% | ||
Sales and distribution costs in percentage of sales | 26.3% | 26.1% | 24.4% | 21.4% | 20.8% | ||
Research and development costs in percentage of sales | 12.6% | 13.6% | 14.0% | 16.6% | 16.8% | ||
Cash to earnings1 | 61.4% | 103.3% | 81.6% | (14.6%) | 27.6% | ||
Operating margin3 | 41.7% | 42.3% | 44.2% | 44.2% | 41.3% | ||
Net profit margin3 | 33.9% | 31.4% | 36.0% | 34.8% | 33.1% | ||
Return on invested capital1 | 69.0% | 73.6% | 88.5% | 63.9% | 39.3% | ||
Share performance and capital allocation | |||||||
Basic earnings per share/ADR in DKK3 | 10.40 | 12.26 | 18.67 | 22.67 | 23.06 | 1.7% | |
Diluted earnings per share/ADR in DKK3 | 10.37 | 12.22 | 18.62 | 22.63 | 23.03 | 1.8% | |
Adjusted diluted earnings per share/ADR in DKK1 | 10.67 | 12.62 | 19.18 | 24.77 | 26.17 | 5.7% | |
Total number of shares (million), end of year | 4,620 | 4,560 | 4,510 | 4,465 | 4,465 | 0.0% | |
Dividend per share in DKK4 | 5.20 | 6.20 | 9.40 | 11.40 | 11.70 | 2.6% | |
Total dividend (DKK million)4 | 23,711 | 27,950 | 41,987 | 50,683 | 51,975 | 2.5% | |
Dividend payout ratio3 | 49.6% | 50.3% | 50.2% | 50.2% | 50.7% | ||
Share repurchases (DKK million) | 19,447 | 24,086 | 29,924 | 20,181 | 1,388 | (93%) | |
Closing share price (DKK) | 368 | 469 | 698 | 624 | 325 | (48%) | |
Sustainability performance | |||||||
Total number of patients reached (in millions)5 | 34.9 | 36.9 | 41.6 | 45.2 | 45.6 | 1% | |
Total number of employees (headcount) | 48,478 | 55,185 | 64,319 | 77,349 | 69,505 | (10%) | |
Total GHG6 emissions – market-based (1,000 tonnes CO2e) | — | — | 1,836 | 2,261 | 2,690 | 19% | |
Plastic footprint per patient (kg/patient) | — | — | — | 0.38 | 0.36 | (5%) |
– – – | Novo Nordisk Annual Report 2025 / Annual review / Introducing Novo Nordisk / Purpose, strategy and culture | 9 |
Purpose, strategy and culture | |||||||
PURPOSE At Novo Nordisk, our purpose remains clear: driving change to defeat serious chronic diseases. Alongside our purpose, balancing our triple bottom line of financial, social and environmental responsibility remains fundamental to our identity. | CULTURE The Novo Nordisk Way Essentials 1 We create value by having a patient-centred business approach. 2 We set ambitious goals and are empowered to achieve them. 3 We are accountable for our financial, environmental and social performance. 4 We are curious and innovate for the benefit of patients and society at large. 5 We build and maintain good relations with our stakeholders. 6 We value diversity and treat everyone with respect. 7 We focus on performance and personal development. 8 We have a healthy and engaging working environment. 9 We strive for agility and simplicity in everything we do. 10 We never compromise on quality and ethics. | ||||||
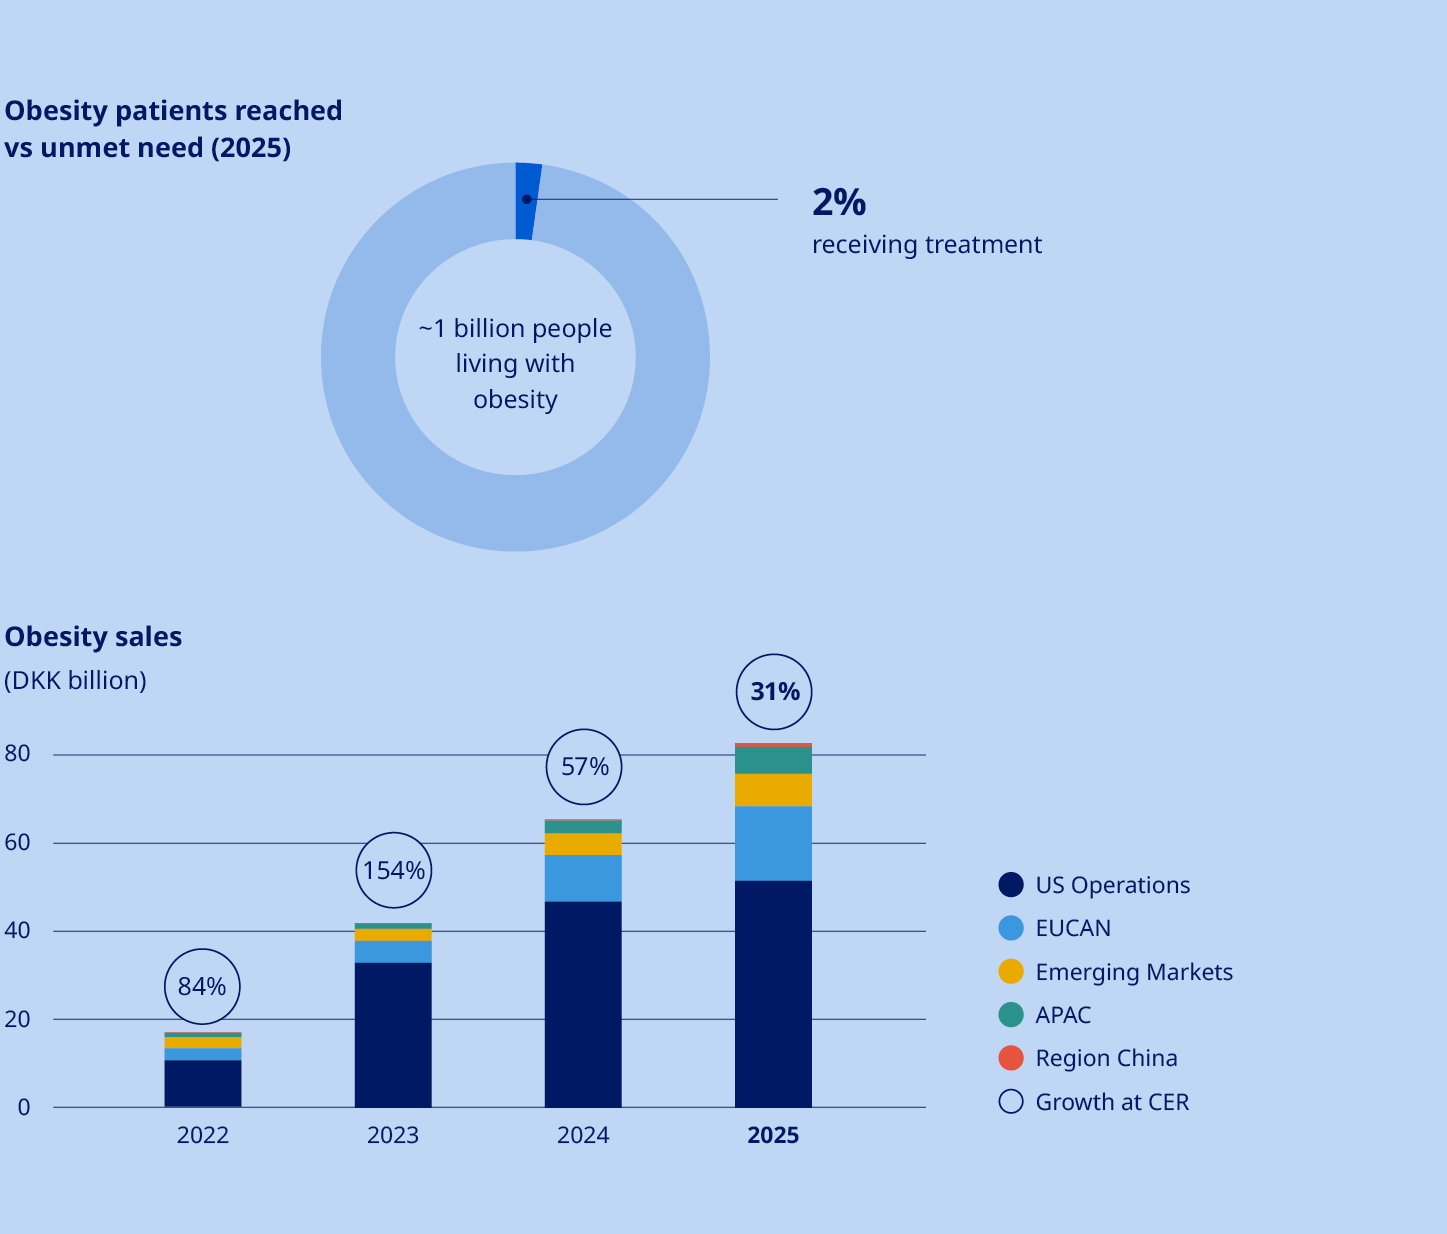
STRATEGY Our strategy focuses on leading in Obesity, Diabetes & related comorbidities, through patient centricity, innovation and affordable access. In Obesity, we will lead by addressing patients’ diverse needs and supporting them throughout their care journey. In Diabetes, we will strengthen leadership with a cardiorenal focus. In addition, we will continue to strengthen Rare Disease leadership in rare blood and rare endocrine disorders. Significant unmet need persists with almost 1 billion people living with obesity and around 600 million living with diabetes. This represents a major opportunity and obligation to serve many more patients. The updated strategy marks a shift from expansion into new, dedicated therapy areas as standalone (CVD, CKD, MASH) towards going deeper into our core areas, Obesity and Diabetes. | 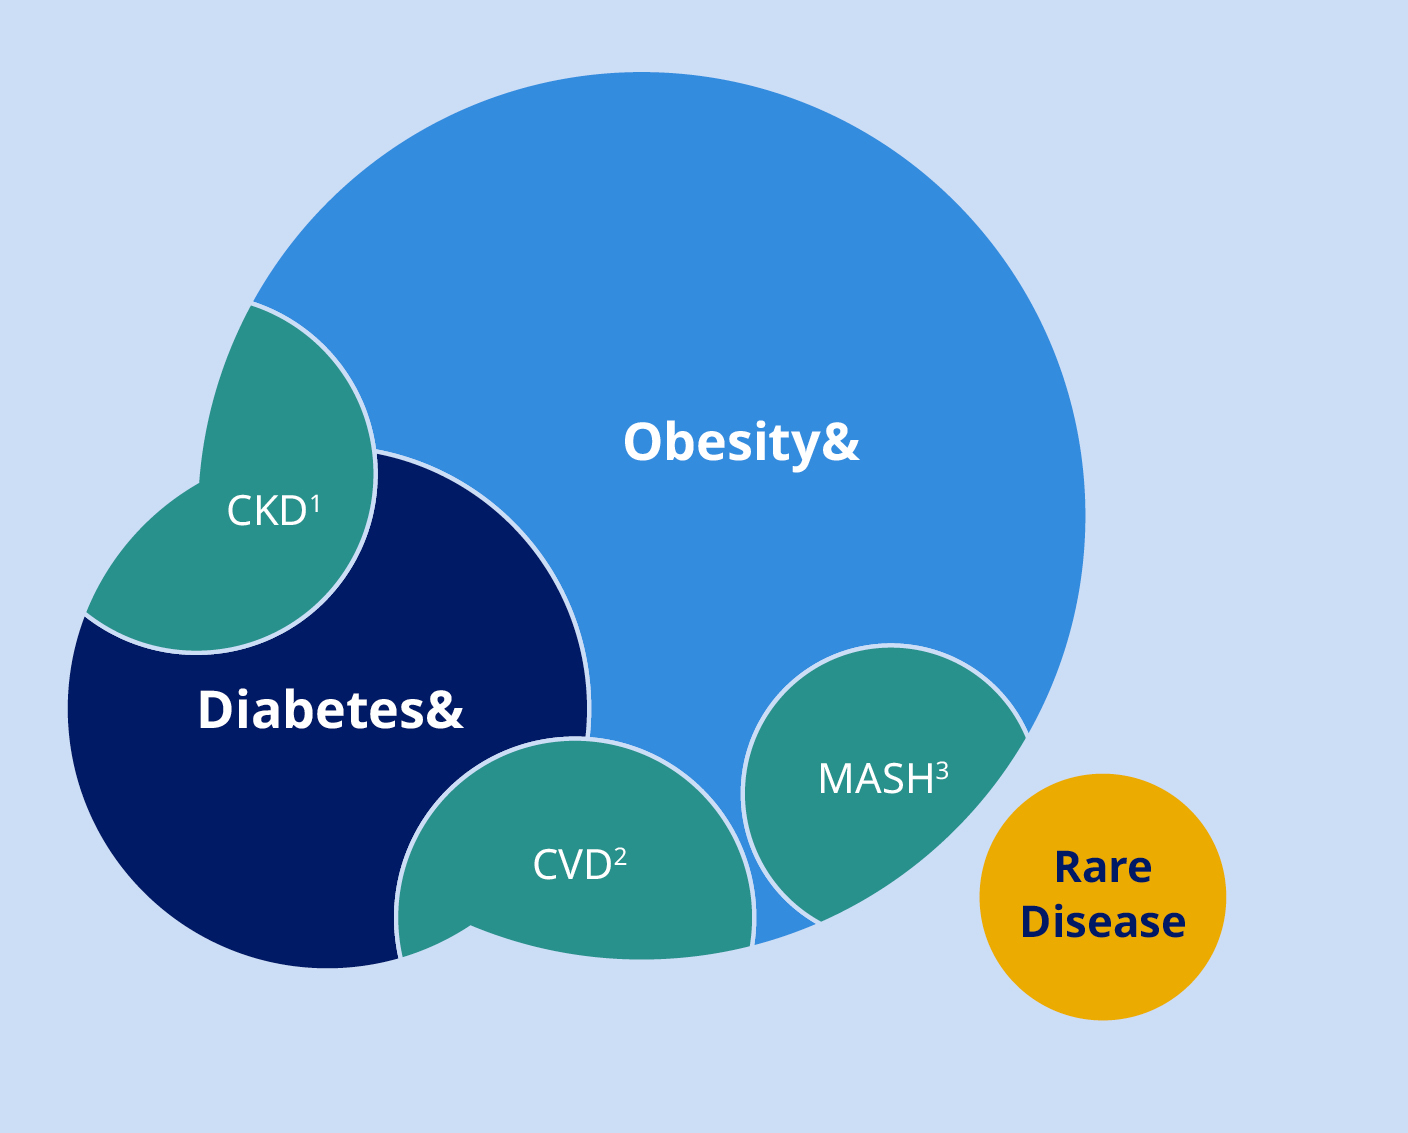 | ||||||
1. Chronic kidney disease. 2. Cardiovascular disease. 3. Metabolic dysfunction-associated steatohepatitis. | |||||||
– – – | 10 |
Value creation | |||
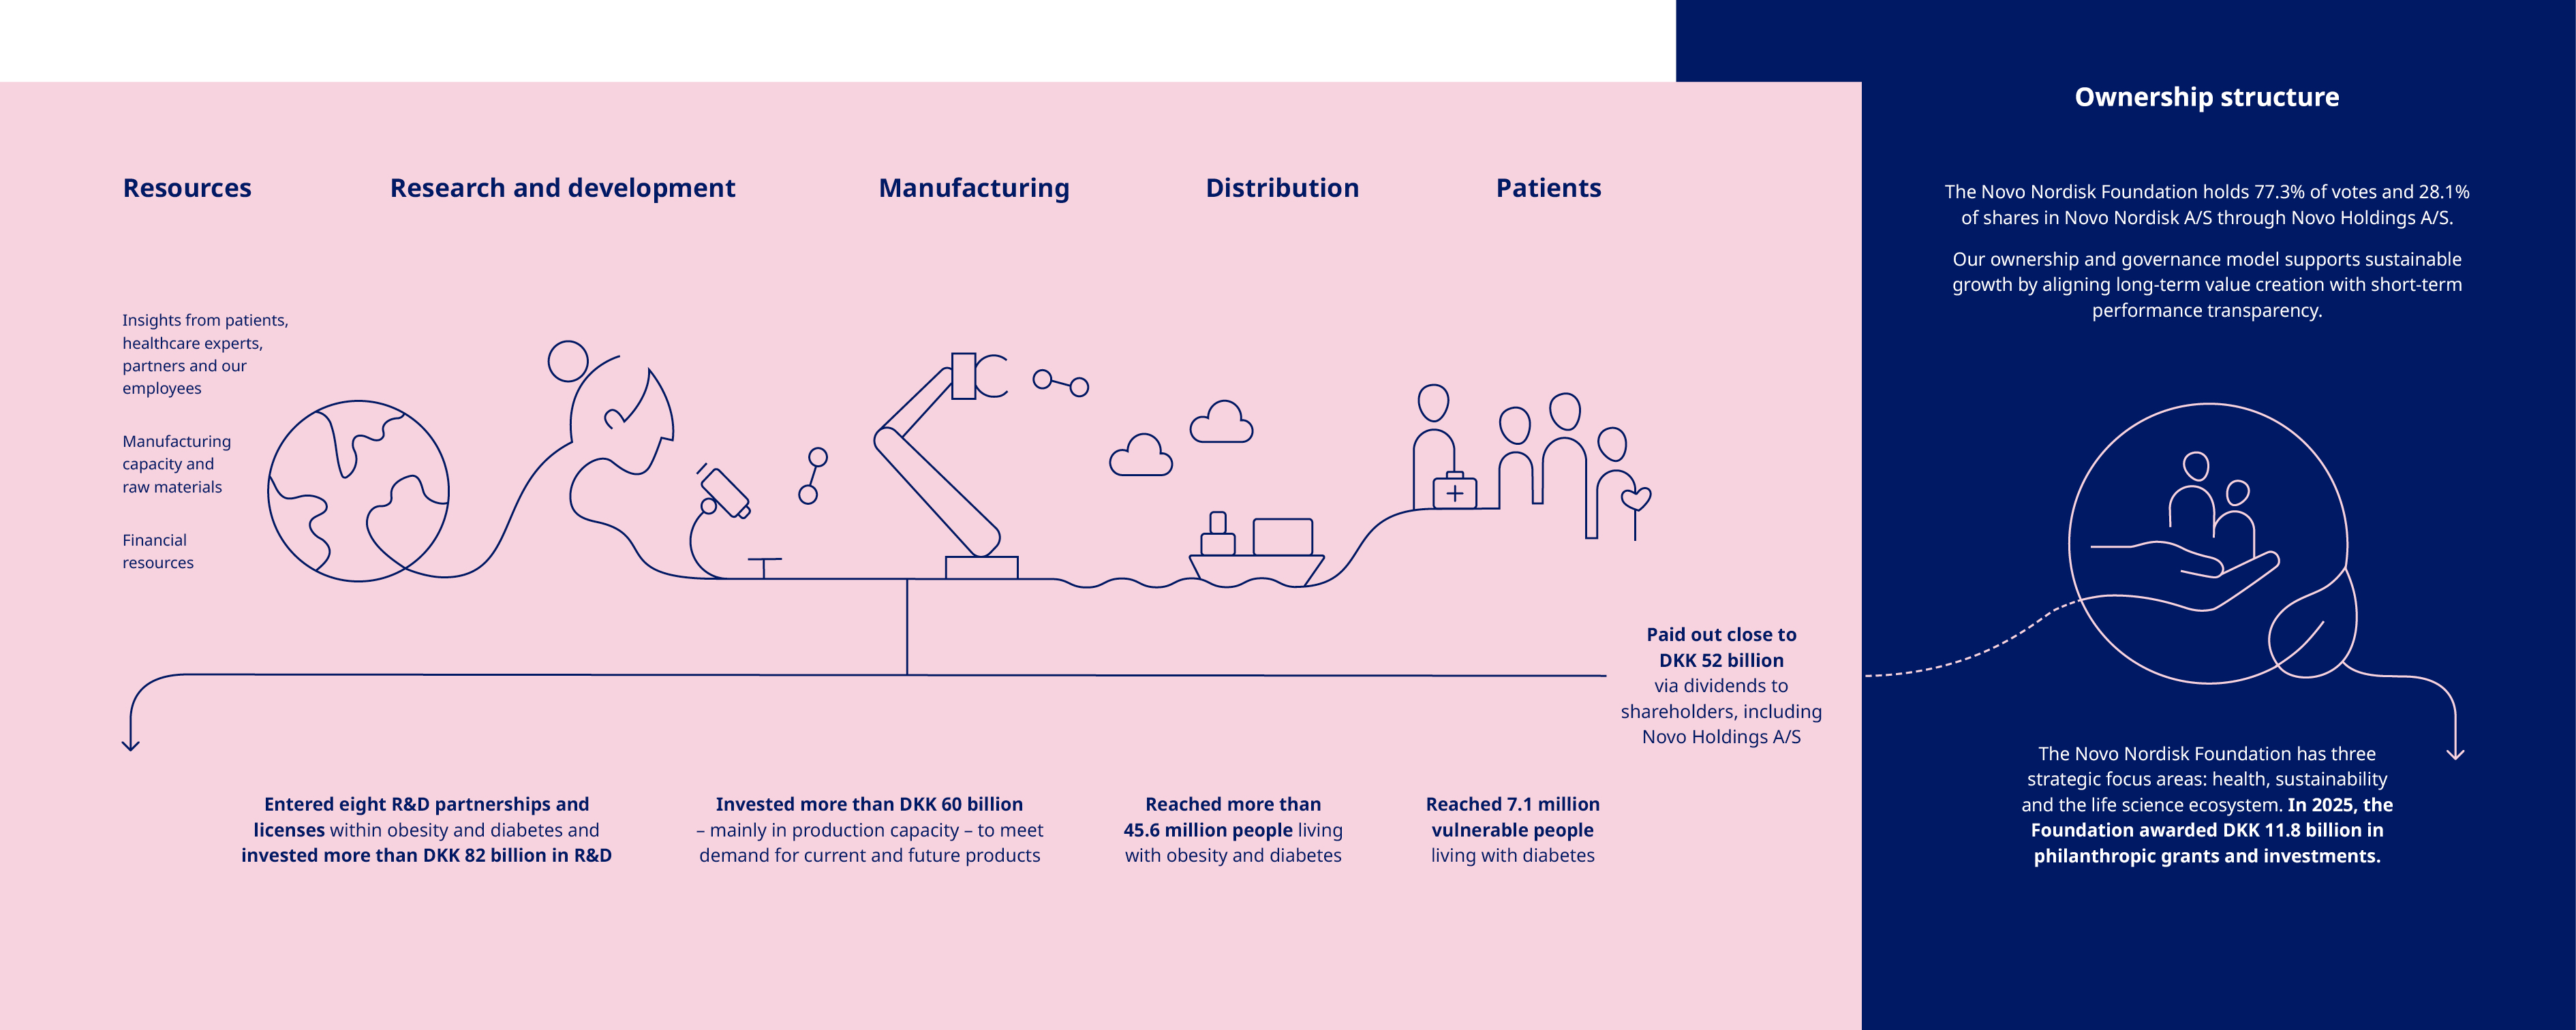
We focus on creating lasting value for society and our business with a strong commitment to our triple bottom line. Following the Novo Nordisk Way, we are dedicated to delivering long-term value for people with serious chronic diseases, our employees, partners, shareholders and society. Our value chain covers every stage from identifying new treatments through R&D, manufacturing, supplier partnerships and distribution to the people we serve. | |||
 | |||
– – – | Novo Nordisk Annual Report 2025 / Annual review / Introducing Novo Nordisk / Inside the discovery of semaglutide | 11 |
The molecule that changed everything: Inside the discovery of semaglutide |  | The breakthrough came through clever chemistry: attaching a fatty acid to semaglutide. This allowed the drug to bind with albumin, a natural blood protein, creating a protective shield that prevented breakdown by the kidneys and kept it circulating in the body for longer. What surprised them most was semaglutide’s superior efficacy. The engineering for once-weekly dosing had also created a more potent GLP-1 receptor agonist than ever before. “We set out to create a weekly GLP-1 therapy – that was the task,” Jesper reflects. “But we had also created something much more potent, with unique properties leading to significantly greater effects on both blood sugar and appetite regulation.” Today, their molecule has evolved beyond its original injectable form. Novo Nordisk has successfully developed oral semaglutide – first as Rybelsus® for diabetes, and more recently as the Wegovy® pill, the first and only FDA-approved oral GLP-1 therapy for weight management. Semaglutide now represents the vast majority of our revenue. Clinical trials continue confirming its unforeseen potential in cardiovascular, kidney and liver diseases – research that reinforces Thomas’s evolving perspective: “I used to be sceptical about treating obesity with medicine, but I’m now convinced that it’s both meaningful and necessary,” he says. “It lowers the risk of various comorbidities, and it saves society money in the long run.” Although their names are on the patent, the pair are quick to credit colleagues across Novo Nordisk who have also played key roles in bringing their invention to life. “Successful drug development is always a team effort,” Jesper adds. “It’s fantastic knowing you’ve been part of creating something with such a profound impact on human health.” The journey so far, born from a reluctant chemist’s leap into the unknown, has already changed millions of lives – and the story continues. | |||||||
A chance encounter with peptide chemistry led a team of Novo Nordisk scientists on a seven-year journey to create one of modern medicine’s most transformative treatments. | |||||||||
Jesper Lau (left) and Thomas Kruse (right). | |||||||||
Thomas Kruse still remembers the moment he was asked to park his expertise in organic chemistry and move into peptides. It was spring 2002, and the Danish researcher had spent nearly a decade crafting small molecules in Novo Nordisk’s laboratories. But his boss, then-Chief Scientific Officer Mads Krogsgaard Thomsen, had a different vision – one that would ultimately reshape how the world treats obesity and diabetes. “I sometimes describe myself as one of Mads Krogsgaard’s guinea pigs,” Thomas jokes. The transition to peptide engineering wasn’t easy, but this reluctant shift would become the foundation for the creation of semaglutide, a medicine now changing millions of lives worldwide. By late 2002, Thomas had been joined by Jesper Lau, another chemist who shared the daunting task of establishing Novo Nordisk’s new protein and peptide engineering department. Together with laboratory technician Paw Bloch (who is now enjoying his retirement) and a team of “repurposed” small molecule scientists, they embarked on a seemingly impossible task: creating a once-weekly injectable GLP-1 receptor agonist. The scientific challenge was formidable. Natural GLP-1 – which stimulates insulin production and regulates appetite – has a half-life of just minutes; far too short for therapeutic use. The team needed to extend this dramatically whilst maintaining potency. Years of painstaking work followed. The team synthesised compound after compound. Semaglutide was compound number 217 – meaning 216 previous attempts had fallen short. “The real challenge was solving several difficult technical problems at once,” Jesper explains. “It was about half-life, optimal potency and physical stability.” | |||||||||
Unlocking the value of semaglutide Broader adoption of semaglutide can relieve pressure on health systems by reducing obesity- and diabetes- related complications, hospitalisations and productivity losses. According to a detailed UK analysis from 2023, GLP-1 medicines can reduce hospitalisations and bed days by almost 10%, potentially saving approximately GBP 1.68 billion vs glucose‑only care by 2040. With global healthcare costs related to chronic diseases projected to surge 56% – from USD 10.2 trillion today to an estimated USD 15.9 trillion worldwide by 2050 – scaling access to semaglutide offers a unique path to a healthier society and more sustainable public finances. Source: Novo Nordisk. Unlocking the full value of GLP‑1 for people, health systems and society. 2025. Available at: https:// www.novonordisk.com/content/dam/nncorp/global/en/media/ pdfs/novo-nordisk-unlocking-the-power-of-glp-1.pdf (The contents of the company's website do not form a part of this Form 6-K) | UK modelling shows expanded GLP-1 use could deliver... 8% fewer CV events 7% fewer hospitalisations 7% fewer bed days – than a glucose management approach |  | GBP ~1.68 billion in UK cost savings by 2040 | ||||||
 | |||||
Strategic Aspirations | |||||
– – – | Novo Nordisk Annual Report 2025 / Annual review / Strategic Aspirations / Strategic Aspirations 2025 | 13 |
Strategic Aspirations 2025 | Strategic Aspirations 2025 | Progress in 2025 | |||||||
Financials | Deliver solid sales and operating profit growth | •Sales growth of 10% (CER) •Operating profit growth of 6% (CER), impacted by one-off restructuring costs related to a company- wide transformation as well as acquisition of three former Catalent sites •Had Novo Nordisk not incurred such restructuring costs, of around DKK 8 billion, operating profit would have increased by 13% (CER) | |||||||
Drive operational efficiencies | •Operational leverage reflecting sales growth when adjusting for restructuring costs | ||||||||
Enable attractive capital allocation to shareholders | •Free cash flow of DKK 28.3 billion •DKK 52 billion returned to shareholders | ||||||||
The 2025 Strategic Aspirations were introduced in 2019 and are set to conclude this year: • Sales have more than doubled, reaching DKK 309 billion in 2025 with a compound annual growth rate (CAGR) of 17%. • Operating profit has more than doubled, reaching DKK 128 billion in 2025 with a CAGR of 16%. • Obesity care sales have increased from DKK 6 billion in 2019 to DKK 82 billion in 2025. • Rare Disease positioned for sustained growth with late-stage pipeline of denecimig (Mim8) and etavopivat. • DKK 306 billion has been returned to shareholders from 2020 to 2025. • Treatment provided to 46 million people living with obesity and diabetes, an increase of ~16 million patients since 2019. Novo Nordisk expects to introduce new Strategic Aspirations as part of Capital Markets Day on 21 September 2026. Until that time, reporting and tracking of progress will continue across key dimensions of the Novo Nordisk business. | Innovation and therapeutic focus | Develop superior treatment solutions for Obesity | •In-license agreements of a triple agonist and two oral molecules •Novo Nordisk to advance subcutaneous and oral zenagamtide (amycretin) for weight management into phase 3 •Semaglutide 2.4 mg approved in the US for the treatment of MASH •Phase 3 programme with cagrilintide initiated •Closing of Akero acquisition and its phase 3 FGF21 analogue in MASH •Semaglutide 7.2 mg submitted in the EU and in the US •Wegovy® pill for weight management approved in the US and submitted in the EU •Phase 1a/2b trial initiated with UBT251, a triple agonist •CagriSema submitted for regulatory approval in the US | ||||||
Further raise innovation bar for Diabetes treatment | •Ozempic® approved by EMA for the treatment of peripheral arterial disease in the EU •Resubmission of Awiqli® in the US for treatment of type 2 diabetes •Phase 3 trial with coramitug initiated in people living with Amyloid Transthyretin (ATTR) cardiomyopathy •IcoSema (Kyinsu®) approved in the EU for the treatment of type 2 diabetes in adults •Evoke phase 3 trials did not demonstrate a statistically significant reduction in Alzheimer's disease progression •Phase 3 trial with CagriSema, REIMAGINE 2 and 3, in diabetes successfully completed •Phase 2 trial successfully completed with subcutaneous and oral zenagamtide (amycretin) | ||||||||
Strengthen and progress Rare disease pipeline | •Alhemo® approved in the US for the treatment of haemophilia A and B without inhibitors •Sogroya® non-replacement indications submitted in the US and Japan •Denecimig (Mim8) submitted for regulatory approval in the EU and in the US •Closing of the acqusition of clinical-stage MASP-3 inhibitor zaltenibart •Sogroya® approved in China | ||||||||
Commercial execution | Strengthen Diabetes leadership to more than one-third | •Diabetes value market share declined by 3.6 percentage points to 30.1% (MAT) | |||||||
More than DKK 25 billion in Obesity care sales by 2025 | •Obesity care sales increased by 31% (CER) to DKK 82.3 billion | ||||||||
Secure a sustained growth outlook for Rare disease | •Rare disease sales increased by 9% (CER) to DKK 19.6 billion | ||||||||
Purpose and sustainability | Progress towards zero environmental impact | •Overall CO2e emissions (scope 1, 2 and full scope 3) increased by 19% compared to 2024 | |||||||
Adding value to society and being recognised as a sustainable employer | •Medical treatment provided to 42.0 million people living with diabetes and 3.6 million people living with obesity |
– – – | 14 |
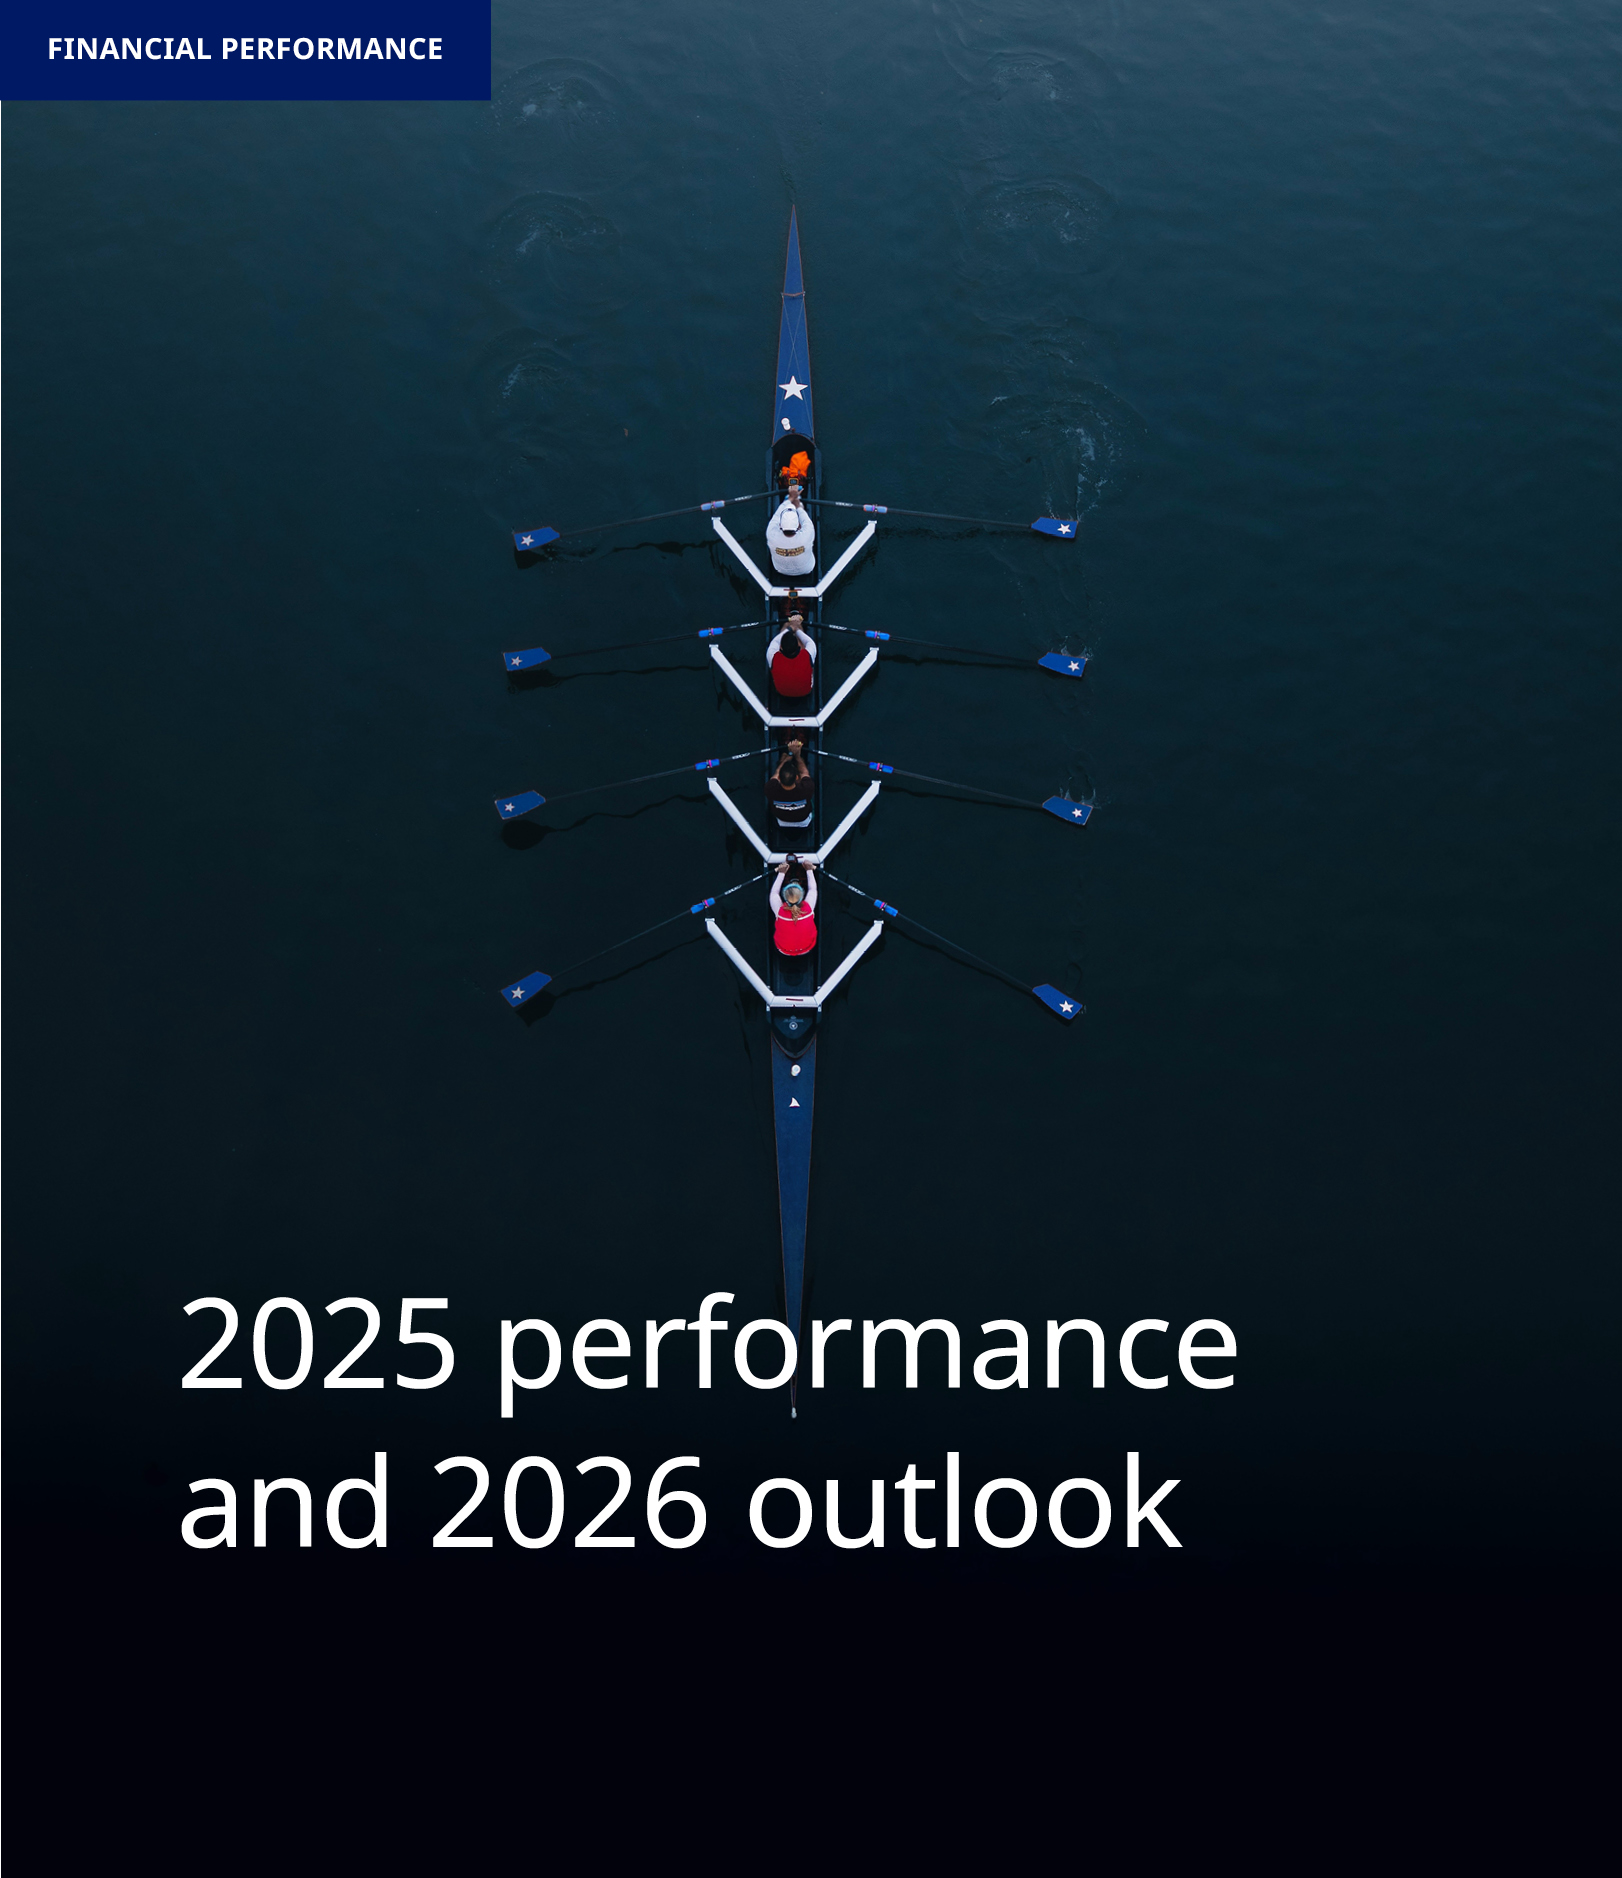 | 2025 performance Financial performance Sales increased by 6% measured in Danish kroner and by 10% at CER to DKK 309,064 million in 2025. Novo Nordisk’s 2025 sales and operating profit performance measured at CER were within the ranges provided in November 2025. The effective tax rate, capital expenditure, free cash flow as well as depreciation, amortisation and impairment losses were all in line with the guidance. Geographic sales development Sales in US Operations increased by 3% measured in Danish kroner and by 8% at CER. Sales in International Operations increased by 10% measured in Danish kroner and by 14% at CER. Sales in EUCAN increased by 15% measured in Danish kroner and by 16% at CER. Sales in Emerging Markets increased by 3% measured in Danish kroner and by 8% at CER. Sales in APAC increased by 19% measured in Danish kroner and by 25% at CER. Sales in Region China increased by 1% measured in Danish kroner and by 5% at CER. Sales development across therapeutic areas Sales of Obesity care products increased by 26% measured in Danish kroner and by 31% at CER. Sales in Diabetes care remained unchanged in Danish kroner and increased by 4% at CER. Rare disease sales increased by 5% measured in Danish kroner and by 9% at CER. In the following sections, unless otherwise noted, market data are based on moving annual total (MAT) from November 2024 and November 2025 provided by the independent data provider IQVIA. EUCAN covers Europe and Canada, Emerging Markets covers mainly Latin America, the Middle East and Africa. APAC covers Japan, Korea, Oceania, and Southeast Asia. Region China covers Mainland China, Hong Kong and Taiwan. 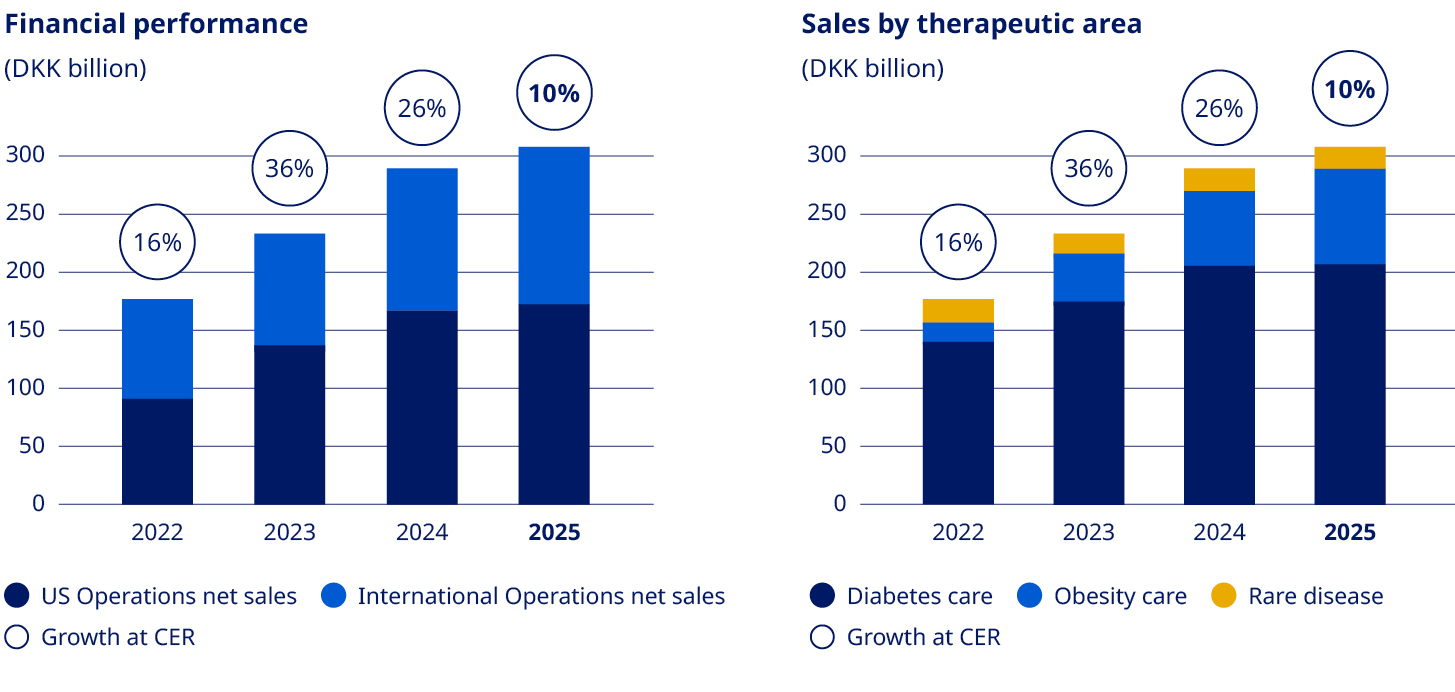 | |||
– – – | 15 |
Obesity care Sales of Obesity care products increased by 26% measured in Danish kroner and by 31% at CER to DKK 82,347 million. Sales growth was driven by both US Operations and International Operations. The volume growth of the global branded GLP-1 obesity market was 104%. Novo Nordisk is the global market leader with a branded volume market share of 59.6%. In International Operations, tirzepatide is categorised under GLP-1 diabetes only in IQVIA data, despite having indications for diabetes and obesity in most launched countries. Diabetes care Sales in Diabetes care remained unchanged in Danish kroner and increased by 4% at CER to DKK 207,109 million, mainly driven by growth of GLP-1-based products. Novo Nordisk's global diabetes value market share decreased by 3.6 percentage points over the last 12 months to 30.1%. The market share development was driven by market share losses in US Operations and International Operations. GLP-1-based therapies for type 2 diabetes Sales of GLP-1-based products for type 2 diabetes increased by 2% measured in Danish kroner and by 6% at CER to DKK 152,202 million. The estimated global GLP-1 share of total diabetes prescriptions increased to 8.1% compared with 6.7% 12 months ago. It is possible for a patient to have a prescription for more than one diabetes treatment. Novo Nordisk has a value market share of 45.8%. •Ozempic® sales increased by 6% measured in Danish kroner and by 10% at CER to DKK 127,089 million. Sales growth was driven by both US Operations and International Operations. US sales were positively impacted by gross-to-net sales adjustments. •Rybelsus® sales decreased by 5% measured in Danish kroner and by 2% at CER to DKK 22,093 million. Sales growth was driven by International Operations, offset by decreasing sales in US Operations. Sales in US and International operations are negatively impacted by a reprioritisation of activities towards other GLP-1 treatments. •Victoza® sales decreased by 45% measured in Danish kroner and by 43% at CER to DKK 3,020 million. The decline was driven by the GLP-1 diabetes market moving towards once-weekly treatments and in line with portfolio priorities in both US Operations and International Operations. Insulin sales Sales of insulin decreased by 4% measured in Danish kroner and by 1% at CER to DKK 53,137 million. Rare disease Rare disease sales increased by 5% measured in Danish kroner and by 9% at CER to DKK 19,608 million. Rare endocrine disorders Sales of rare endocrine disorder products increased by 19% measured in Danish kroner and by 24% at CER to DKK 5,959 million. Rare blood disorders Sales of rare blood disorder products decreased by 2% measured in Danish kroner and increased by 2% at CER to DKK 11,955 million. | Development in costs and operating profit The cost of goods sold increased by 32% measured in Danish kroner and by 31% at CER to DKK 58,788 million, resulting in a gross margin of 81.0%, measured in Danish kroner, compared with 84.7% in 2024. The decline in gross margin is impacted by amortisations and depreciations related to the three former Catalent manufacturing sites as well as one-off restructuring costs related to the company-wide transformation. In addition, costs are related to ongoing capacity expansions and negative currency impacts, partially countered by a positive product mix, driven by increased sales of GLP-1-based treatments. Sales and distribution costs increased by 4% measured in Danish kroner and by 7% at CER to DKK 64,310 million. The increase in costs is driven by both US Operations and International Operations. In US Operations, the cost increase is mainly driven by promotional activities related to Wegovy®. In International Operations, the increase is primarily related to the Wegovy® launches and promotional activities. Sales and distribution costs amount to 20.8% as a percentage of sales, including impact from one-off restructuring costs related to the company-wide transformation. Research and development costs increased by 8% measured in Danish kroner and by 10% at CER to DKK 52,039 million, driven by investments within Obesity care, reflecting increased late-stage clinical trial activity, increased early research activities, and increased development investments related to the cardiovascular portfolio. This is partially countered by the impairment loss related to ocedurenone of DKK 5.7 billion and other impairments of intangible assets in 2024. Research and development costs amounted to 16.8% as a percentage of sales, including one-off restructuring costs related to the company-wide transformation. | ||||
Administration costs increased by 13% measured in Danish kroner and by 16% at CER to DKK 5,969 million, or 1.9% of sales. Administration costs are impacted by severance costs related to previously announced changes in Executive Management and one-off restructuring costs related to the company- wide transformation. Other operating income and expenses (net) showed a loss of DKK 300 million compared to a loss of DKK 2,103 million in 2024. Other operating income in 2024 was impacted by impairments related to a partnership agreement of a company and transaction costs related to the Catalent transaction. Operating profit decreased by 1% measured in Danish kroner and increased by 6% at CER to DKK 127,658 million, mainly impacted by one-off restructuring costs related to the company-wide transformation during the third quarter of around DKK 8 billion and by impacts | 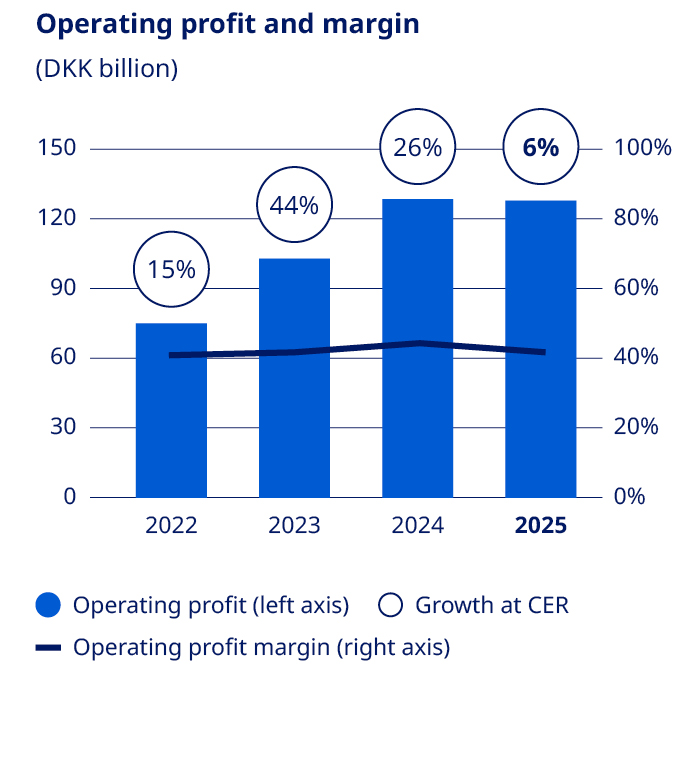 | ||||
– – – | 16 |
related to the acquisition of the three former Catalent manufacturing sites. This is partially countered by the impairment loss related to ocedurenone in 2024. Had Novo Nordisk not incurred such restructuring cost amounting to around DKK 8 billion, operating profit would have increased by 6% in Danish kroner and 13% at CER. Financial items (net) and tax Financial items (net) showed a net gain of DKK 2,882 million, compared with a net loss of DKK 1,148 million in 2024. This primarily reflects gains from hedging the US dollar, which is partly offset by financing costs related to the funding of the Catalent transaction. In line with Novo Nordisk’s treasury policy, the most significant foreign exchange risks for Novo Nordisk have been hedged, primarily through foreign exchange forward contracts. The foreign exchange result was a net gain of DKK 6,007 million compared with a net loss of DKK 1,023 million in 2024. At the end of December 2025, a positive market value of financial contracts of DKK 4,339 million had been deferred for recognition in 2026. The effective tax rate was 21.5% in 2025, compared with an effective tax rate of 20.6% in 2024. Net profit increased by 1% to DKK 102,434 million and diluted earnings per share increased by 2% to DKK 23.03. | 2026 outlook Novo Nordisk will from 2026 present outlook for sales and operating profit using new non-IFRS measures of adjusted sales growth and adjusted operating profit growth. For further details, please see Company Announcement No 4 / 2026. | |||||
Guidance | Full-year expectations 3 February 2026 | |||||
Adjusted sales growth | ||||||
at CER | -5% to -13%1 | |||||
as reported in Danish kroner | Around 3 percentage points lower than at CER | |||||
Adjusted operating profit growth | ||||||
at CER | -5% to -13%1 | |||||
as reported in Danish kroner | Around 5 percentage points lower than at CER | |||||
1. On a non-adjusted basis, the mid-point of sales and operating profit growth guidance for 2026, both at CER, would be -1% and 11%, respectively | ||||||
Key modelling considerations | ||||||
Financial items (net) | Gain of around 2.3 bDKK | |||||
Effective tax rate | 21% to 23% | |||||
Capital expenditure (PP&E) | Around 55 bDKK | |||||
Free cash flow | Between 35 and 45 bDKK | |||||
Note: Expectations are as reported in Danish kroner, if not otherwise stated Note: Free cash flow defined as net cash generated from operating activities, less purchase of property, plant and equipment | ||||||
Cash flow and capital allocation Free cash flow in 2025 was DKK 28.3 billion compared to DKK (14.7) billion in 2024. The increase in free cash flow compared to last year is mainly due to the USD 11.7 billion acquisition of the three former Catalent manufacturing sites in 2024, partially countered by increased capital expenditures. Capital expenditure for property, plant and equipment was DKK 60.1 billion compared with DKK 47.2 billion in 2024, primarily reflecting investments in additional capacity for active pharmaceutical ingredient (API) production and fill-finish capacity for both current and future injectable and oral products. Capital expenditure related to intangible assets was DKK 30.0 billion in 2025 compared with DKK 4.1 billion in 2024, reflecting business development activities, mainly related to the acquisition of Akero Therapeutics, Inc. | 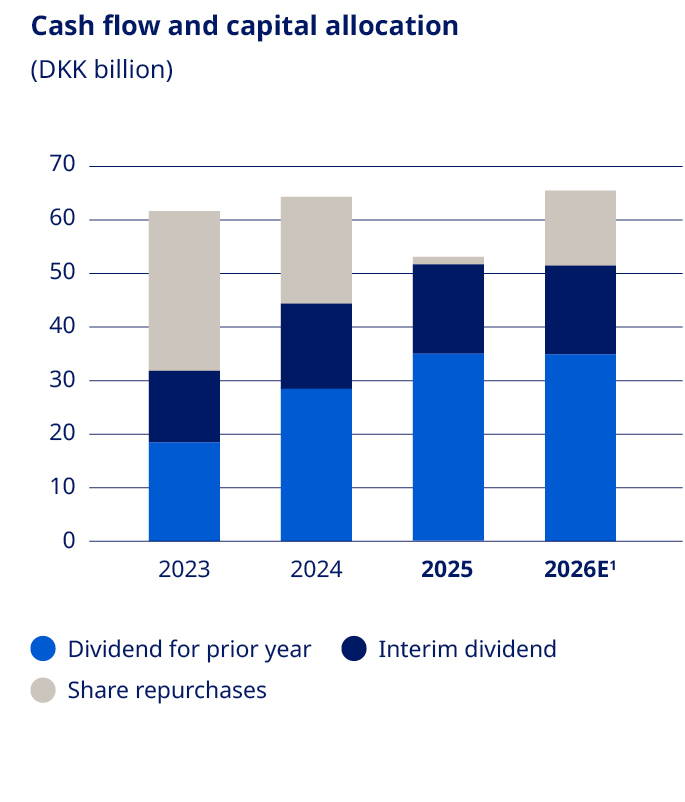 1. Expectations for 2026. | Adjusted sales growth is expected to be -5% to -13% at CER, with fluctuations in growth rates expected across quarters. Given the current exchange rates versus the Danish krone, adjusted sales growth reported in Danish kroner is expected to be 3 percentage points lower than at CER, primarily due to depreciation of the USD/DKK exchange rate. The outlook reflects expectations for sales growth within International Operations and expectations for a sales decline within US Operations. In 2026, the global GLP-1 market expansion is assumed to continue, enabling Novo Nordisk to increase patient reach and expand volumes. This is countered by lower realised prices, including the MFN ("Most Favoured Nations") agreement in the US and the loss of exclusivity for the semaglutide molecule in certain markets in International Operations. Lastly, positive impacts related to US gross-to-net sales adjustments during 2025 are not anticipated to reoccur. In International Operations, the outlook is based on current growth trends, including continued volume penetration from GLP-1 treatments and market expansion, mainly within obesity, as well as intensifying competition and negative impacts from the compound patent expiry of the semaglutide molecule in certain markets. Novo Nordisk continues to roll-out Wegovy® in more markets during 2026 and expects to introduce the 7.2 mg dose in a number of countries. In US Operations, the outlook is based on current prescription trends for the injectable GLP-1 portfolio, intensifying competition as well as negative impact from reduced obesity medication coverage in Medicaid. Further, lower realised prices linked to investments in market access, amplified by the MFN agreement with the US Administration to bring GLP-1s to more Americans at a lower cost is assumed. | ||||
– – – | 17 |
Novo Nordisk further focuses on expanding access to Wegovy®, particularly in the self-pay channel through NovoCare® Pharmacy and collaborations with telehealth organisations. Uptake related to the launch of Wegovy® pill in January 2026 is reflected in the outlook, based on a range of assumptions related hereto such as market penetration, potential negative impact on the growth of the injectable obesity medication category as well as channel mix. Adjusted operating profit growth is expected to be -5% to -13% at CER. Adjusted operating profit growth reported in Danish kroner is expected to be 5 percentage points lower than at CER. The expectation for adjusted operating profit growth primarily reflects the sales outlook, combined with targeted investments in current and future growth opportunities within R&D and Commercial, partly funded by re- investment of savings from the company-wide transformation in 2025 as well as further optimisation initiatives. Within R&D, investments are related to the continued expansion and progression of the early and late-stage pipeline mainly within Obesity and Diabetes, and includes impact related to acquisition of Akero Therapeutics, Inc. Commercial investments are mainly related to the GLP-1 portfolio within Obesity and Diabetes. Key modelling considerations Novo Nordisk expects financial items (net) for 2026 to amount to a gain of around DKK 2.3 billion. This is driven by gains on hedged currencies, mainly the US dollar, partially countered by increased interest expenses related to net debt. The effective tax rate for 2026 is expected to be in the range of 21-23%. Capital expenditure is expected to be around DKK 55 billion in 2026 compared to DKK 60 billion in 2025, reflecting the expansion of the global supply chain. The investments will create additional capacity and flexibility across the supply chain, including the manufacturing of active pharmaceutical ingredients (API), additional aseptic production and finished production processes as well as packaging capacity. In the coming years, the capital expenditure investments are expected to decline. To better reflect the underlying cash generation, Novo Nordisk, as of 2026, defines free cash flow as net cash generated from operating activities, less purchase of property, plant and equipment. The free cash flow is expected to be DKK 35-45 billion, reflecting the lower sales, primarily within US Operations, and related cash flow implications amplified by the US gross-to-net system, combined with CAPEX expenditure. All of the above expectations are based on assumptions that the global or regional macroeconomic and political environment will not significantly change business conditions for Novo Nordisk during 2026, including energy and supply chain disruptions, the potential implications from major healthcare reforms and legislative changes, taxation changes, including changes in tariffs, duties and pricing policies, (incl Most Favoured Nations in the US), as well as outcome of legal cases, and that the currency exchange rates, especially the US dollar, will remain at the current level versus the Danish krone. The guidance is also based on assumptions in relation to the estimation of gross-to-net developments in the US. Finally, the guidance does not include the financial implications of any new significant business development transactions. Novo Nordisk has hedged expected net cash flows in a number of invoicing currencies, and, all other things being equal, movements in key invoicing currencies will impact Novo Nordisk’s operating profit as outlined in note 4.4 on Financial risks. | Forward-looking statements Novo Nordisk’s statutory Annual Report 2025, Form 20-F, any quarterly financial reports, and written information released, shown, or oral statements made, to the public in the future by or on behalf of Novo Nordisk, may contain certain forward-looking statements relating to the operating, financial and sustainability performance and results of Novo Nordisk and/or the industry in which it operates. Forward-looking statements can be identified by the fact that they do not relate to historical or current facts and include guidance. Words such as ‘believe’, ‘expect’, ‘may’, ‘will’, ‘plan’, ‘strategy’, ‘transition plan’, ‘prospect’, ‘foresee’, ‘estimate’, ‘project’, ‘anticipate’, ‘can’, ‘intend’, ‘target’ and other words and terms of similar meaning in connection with any discussion of future operating, financial or sustainability performance identify forward-looking statements. Examples of such forward-looking statements include, but are not limited to: •Statements of targets, future guidance, (transition) plans, objectives or goals for future operations, including those related to operating, financial and sustainability matters, Novo Nordisk’s products, product research, product development, product introductions and product approvals as well as cooperation in relation thereto; •Statements containing projections of or targets for revenues, costs, income (or loss), earnings per share, capital expenditures, dividends, capital structure, net financials and other financial measures; •Statements regarding future economic performance, future actions and outcome of contingencies, such as legal proceedings; and •Statements regarding the assumptions underlying or relating to such statements. These statements are based on current plans, estimates, opinions, views and projections. Although Novo Nordisk believes that the expectation reflected in such forward-looking statements are reasonable, there can be no assurance that such expectation will prove to be correct. By their very nature, forward-looking statements involve risks, uncertainties and assumptions, both general and specific, and actual results may differ materially from those contemplated, expressed or implied by any forward-looking statement. Factors that may affect future results include, but are not limited to, global as well as local political, economic and environmental conditions, such as interest rate and currency exchange rate fluctuations or climate change, delay or failure of projects related to research and/or development, unplanned loss of patents, interruptions of supplies and production, including as a result of interruptions or delays affecting supply chains on which Novo Nordisk relies, shortages of supplies, including energy supplies, product recalls, unexpected contract breaches or terminations, government-mandated or market- driven price decreases for Novo Nordisk’s products, introduction of competing products, reliance on information technology including the risk of cybersecurity breaches, Novo Nordisk’s ability to successfully market current and new products, exposure to product liability and legal proceedings and investigations, changes in governmental laws and related interpretation thereof, including on reimbursement, intellectual property protection and regulatory controls on testing, approval, manufacturing and marketing, and taxation changes, including changes in tariffs and duties, perceived or actual failure to | |||
– – – | 18 |
adhere to ethical marketing practices, investments in and divestitures of domestic and foreign companies, unexpected growth in costs and expenses, strikes and other labour market disputes, failure to recruit and retain the right employees, failure to maintain a culture of compliance, epidemics, pandemics or other public health crises, effects of domestic or international crises, civil unrest, war or other conflict and factors related to the foregoing matters and other factors not specifically identified herein. For an overview of some, but not all, of the risks that could adversely affect Novo Nordisk’s results or the accuracy of forward-looking statements in the Annual Report 2025, reference is made to the overview of risk factors in ‘Risk management’ of the Annual Report 2025. None of Novo Nordisk or its subsidiaries or any such person's officers, or employees accept any responsibility for the future accuracy of the opinions expressed in the Annual Report 2025, Form 20-F, any quarterly financial reports, and written information released, shown, or oral statements made, to the public in the future by or on behalf of Novo Nordisk or the actual occurrence of the forecasted developments. Unless required by law, Novo Nordisk has no duty and undertakes no obligation to update or revise any forward-looking statement, whether as a result of new information, future events, or otherwise. Shares and capital structure Through open and proactive communication, Novo Nordisk aims to provide the basis for fair and efficient pricing of our shares. | 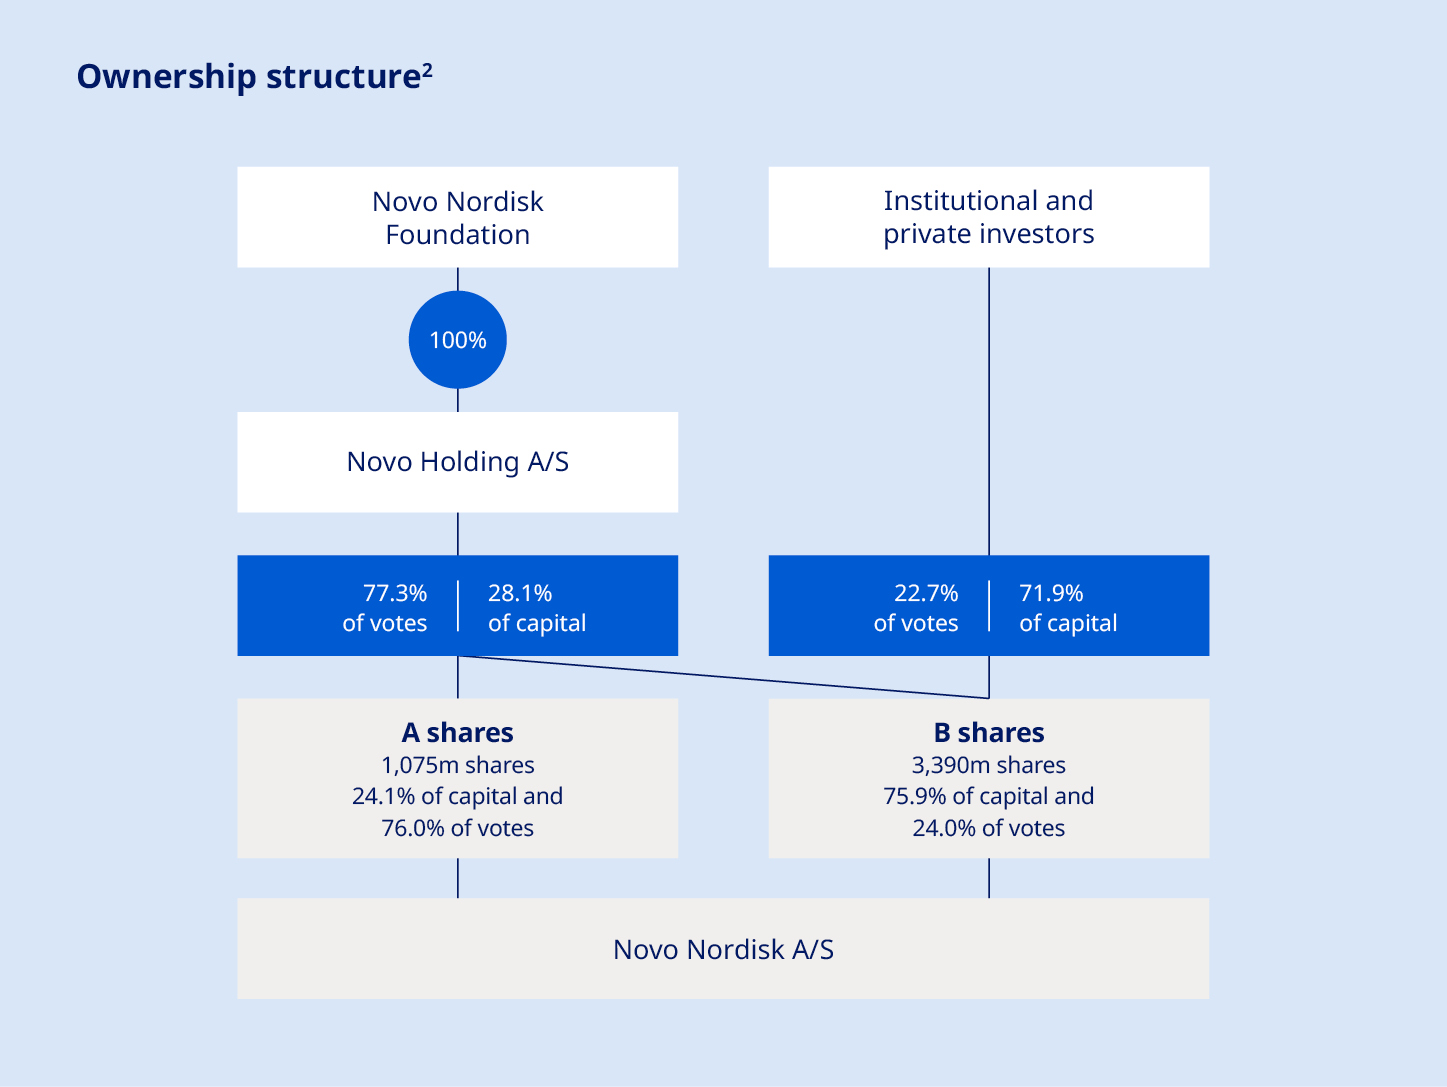 The company’s A shares are not listed and are held by Novo Holdings A/S3, a Danish public limited liability company wholly owned by the Novo Nordisk Foundation. According to the Articles of Association of the Foundation, the A shares cannot be divested. Special rights attached to A shares include pre-emptive subscription rights in the event of an increase in the A share capital and pre-emptive purchase rights in the event of a sale of A shares, while B shares take priority for liquidation proceedings. A shares take priority for dividends below 0.5%, and B shares take priority for dividends between 0.5 and 5%. However, in practice, A and B shares receive the same amount of dividend per share. As of 31 December 2025, Novo Holdings A/S held a B share capital of a nominal value of DKK 17,756,050. Together with the A shares, Novo Holdings A/S’s total ownership amounted to a nominal value of DKK 125,243,250. Novo Holdings A/S ownership is reflected in the ‘Ownership structure’ chart. | |||||||
Share capital and ownership Novo Nordisk’s share capital of DKK 446.5 million is divided into A and B share capital. The A and B shares are calculated in units of DKK 0.10, amounting to 4.5 billion shares. The A share capital, consisting of 1,075 million shares, has a nominal value of DKK 107,487,200 and the B share capital, consisting of 3,390 million shares, has a nominal value of DKK 339,012,800. Each A share of a nominal value of DKK 0.10 carries 100 votes and each B share of a nominal value of DKK 0.10 carries 10 votes. Novo Nordisk’s B shares are listed on Nasdaq Copenhagen and on the New York Stock Exchange (NYSE) as American Depository Receipts (ADRs). The general meeting has authorised the Board of Directors to distribute extraordinary dividends, issue new shares in accordance with the Articles of Association and repurchase shares in accordance with authorisations granted. | 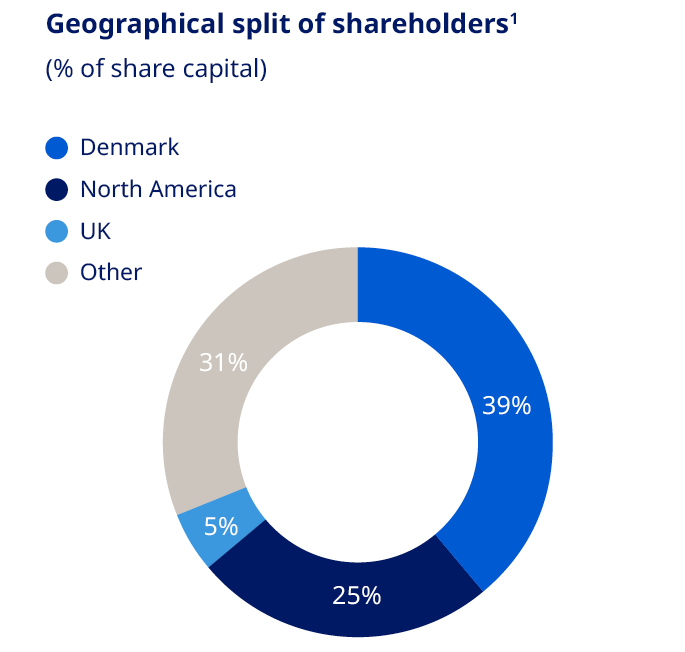 | |||||||
1. Split of shareholders is denoted according to the location of legal deposit-owners. 2. Treasury shares are included; however, voting rights of treasury shares cannot be exercised. 3. Novo Holdings A/S’s registered address is Tuborg Havnevej 19, DK-2900 Hellerup, Denmark. | ||||||||
– – – | 19 |
There is no complete record of all shareholders; however, based on available sources of information, as of 31 December 2025 it is estimated that shares were geographically distributed as shown in the ‘Geographical split of shareholders’ chart. As of 31 December 2025, the free float of listed B shares was 94.13% (of which approximately 15.31% are listed as ADRs), excluding Novo Holdings A/S and Novo Nordisk’s holding of shares. As of 31 December 2025, Novo Holdings A/S and Novo Nordisk’s holding of B shares equaled 198,935,780 shares and had a nominal value of DKK 19,893,578. For details about the share capital, see note 4.3 to the consolidated financial statements. Capital structure Novo Nordisk’s Board of Directors and Executive Management consider that the current capital and share structure of Novo Nordisk serves the interests of the shareholders and the company well. Novo Nordisk’s capital structure strategy offers a balance between long-term shareholder value creation and competitive shareholder return in the short-term. In 2025, Novo Nordisk issued Eurobonds totaling EUR 10 billion. The total outstanding Eurobonds as of the end of 2025 amounted to EUR 16.3 billion. For details on issuance of Eurobonds, refer to note 4.6 in the Consolidated financial statements. Dividend policy The company’s dividend policy, which applies a pharmaceutical industry benchmark to ensure a competitive payout ratio for dividend payments, may be complemented by share repurchase programmes. The final dividend for 2024 paid in 2025 after the AGM in March was equal to DKK 7.90 per A and B share of DKK 0.10, as well as for ADRs. The total dividend for 2024 was DKK 11.40 per A and B share of DKK 0.10, corresponding to a payout ratio of 50.2%. The 2024 pharma peer group average was 58.9%. In August 2025, an interim dividend was paid equaling DKK 3.75 per A and B share of DKK 0.10, as well as for ADRs. For 2025, the Board of Directors will propose a final dividend of DKK 7.95 to be paid in March 2026, equivalent to a total dividend for 2025 of DKK 11.70 and a payout ratio of 50.7%. The company expects to distribute an interim dividend in August 2026. Further information regarding this interim dividend will be announced in connection with the financial report for the first six months of 2026. Dividends are paid from distributable reserves. Novo Nordisk does not pay a dividend on its holding of treasury shares. Share repurchase programme for 2026 For the next 12 months, Novo Nordisk has decided to implement a new share repurchase programme. The expected total repurchase cash value of B shares, for the 12 months beginning 2026, is up to DKK 15 billion. The total programme may be reduced in size if significant business development opportunities arise during 2026. Novo Nordisk expects to conduct the new share repurchase programme according to the safe harbour rules under the EU Market Abuse Regulation (MAR). | Share price development Between the end of December 2024 and end of December 2025, Novo Nordisk’s share price decreased from DKK 624 to DKK 325, a decrease of -48%. The total market value of Novo Nordisk’s B shares, excluding treasury shares and Novo Holdings A/S shares, was DKK 1,037,935,269,555 as of 30 December 2025. | |||||||
Share price performance 2025 Novo Nordisk share price and indexed peers4 (%) 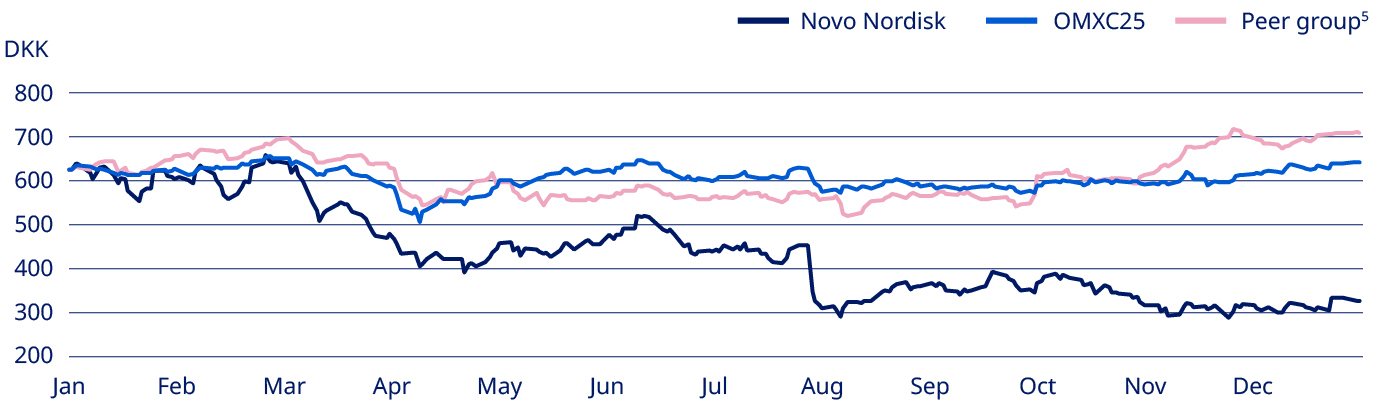 | ||||||||
2026 financial calendar | ||||||||
Annual General Meeting 2026 | 26 Mar 2026 | |||||||
Ex-dividend, B shares | 27 Mar 2026 | |||||||
Ex-dividend, ADRs | 30 Mar 2026 | |||||||
Record date, B shares and ADRs | 30 Mar 2026 | |||||||
Payment, B shares | 31 Mar 2026 | |||||||
Payment, ADRs | 7 Apr 2026 | |||||||
Financial statement for the first three months of 2026 | 6 May 2026 | |||||||
Financial statement for the first six months of 2026 | 5 Aug 2026 | |||||||
Ex-dividend, B shares | 14 Aug 2026 | |||||||
Ex-dividend, ADRs | 17 Aug 2026 | |||||||
Record date, B shares and ADRs | 17 Aug 2026 | |||||||
Payment, B shares | 18 Aug 2026 | |||||||
Payment, ADRs | 25 Aug 2026 | |||||||
Capital Markets Day | 21 Sep 2026 | |||||||
Financial statement for the first nine months of 2026 | 4 Nov 2026 | |||||||
Financial statement for 2026 and Annual Report 2026 | 3 Feb 2027 | |||||||
4. OMXC25 and pharmaceutical industry development have been rebased to Novo Nordisk share price in January 2025. 5. AstraZeneca, Bristol-Meyers, Eli Lilly, GlaxoSmithKline, Lundbeck, Merck, Novartis, Pfizer, Roche and Sanofi. | ||||||||
– – – | 20 |
 | We are not standing still. Our commercial strategy is built for real‑world impact: expanding access, protecting patient safety and competing where it counts. Guided by our purpose of driving change to defeat serious chronic diseases, we bring scale, speed and responsibility to the challenge, reaching 45.6 million people living with obesity and diabetes in 2025. Central to this approach is defending and expanding our leadership in the increasingly competitive market for GLP-1 therapies, where we hold close to 43% market share of global volumes. Powered by semaglutide, these game-changing medicines address two of the world’s most pressing health challenges: obesity, impacting over 1 billion people worldwide, and diabetes, affecting around 600 million. Semaglutide is the only molecule that demonstrates cardiovascular protection in both diseases. Our portfolio spans injectable and oral options with FDA‑approved indications to reduce risk of heart attack, stroke or cardiovascular (CV) death – giving us unmatched therapeutic breadth. We are acting urgently to strengthen our portfolio through targeted investment in next‑generation therapies and business development. Our pipeline across obesity, type 2 diabetes and related comorbidities continues to advance, whilst we enhance optionality by tailoring solutions to individual needs. Building this market taught us that what works for diabetes does not necessarily work for obesity – people with obesity have different concerns, different needs and often prefer more discreet ways to access treatment. Executing this strategy demands market-specific approaches deployed at speed. “We are acting urgently to strengthen our portfolio through targeted investment in next‑generation therapies and business development” The US remains our biggest market and demands our boldest moves. We are transforming our position through multiple direct-to-consumer pathways by rapidly expanding our NovoCare® direct-to-patient platform to simplify access and reduce costs, forging new telehealth collaborations and securing retail pharmacy agreements including CVS to improve continuity of care. From 2026, our new agreement with the US Administration – once finalised – will lower prices across Medicare Part D and Medicaid programmes whilst piloting broader obesity coverage – significantly expanding Wegovy® access. We are also pursuing legal action against unlawful sales and marketing of mass compounded drugs, working with regulators, law enforcement and healthcare professionals to protect patients, the US drug approval framework and market integrity. Outside the US, we are turning challenges into opportunities. As semaglutide nears loss of exclusivity in certain key markets, we are acting decisively, launching second brands in lower‑priced segments, fast‑tracking differentiated devices and sharpening our channel strategies, while reinforcing quality and pharmacovigilance as generics enter the market. We are playing to win. Backed by robust evidence and patient‑centred execution, we are not just competing in an increasingly challenging landscape – we are reshaping it. Every decision, every initiative and every innovation is driven by our unwavering commitment to get our life-changing medicines to the people who need them – faster than ever before. | |||
– – – | 21 |
OBESITY& RELATED COMORBIDITIES | ||||
Expanding the global reach and impact of Wegovy® | Obesity is one of the defining health challenges of our time, impacting almost 1 billion people worldwide. Our goal is to translate scientific leadership into choice, access and evidence – bringing new options to patients and meeting needs across related comorbidities. In 2025, our obesity portfolio delivered 31% sales growth at constant exchange rates (CER), reaching 3.6 million people worldwide. We have recently expanded the Wegovy® brand with two new offerings: higher‑dose Wegovy® (semaglutide 7.2 mg), which demonstrated 20.7% weight loss in phase 3 studies, and the Wegovy® pill, offering 16.6% weight loss and the convenience of once-daily oral dosing. The latter is the world’s first and only oral GLP‑1‑based medicine to be approved for chronic weight management and is now being produced domestically in the US, with API manufactured at our Clayton, North Carolina site and tablets made and packed at our Durham, North Carolina site. Momentum continued across launches and label expansions. By the end of 2025, Wegovy® had almost doubled its global footprint to reach 52 countries – with further roll‑outs planned in 2026, subject to local regulatory approvals. In the US, the label was expanded to include treatment of adults with metabolic dysfunction-associated steatohepatitis (MASH) with moderate to advanced liver fibrosis – an important milestone given the high overlap between obesity and metabolic liver disease. “By the end of 2025, Wegovy® had almost doubled its global footprint to reach 52 countries” New clinical and real‑world evidence further strengthened the profile of Wegovy® in obesity care. Real‑world data from STEER show a 57% lower risk of heart attack, stroke or death associated with Wegovy® compared with tirzepatide. STEER was conducted among adults with overweight or obesity and established cardiovascular disease, without type 2 diabetes, during periods of continuous treatment (no treatment gaps longer than 30 days). While observational by design and subject to the usual limitations of real‑world data, these findings add to growing evidence that Wegovy® delivers proven cardiovascular protection in addition to meaningful weight loss benefits for appropriate patients. Beyond clinical endpoints, we are also advancing understanding of how obesity treatments affect everyday life. INFORM, a survey‑based real‑world evidence study, suggested that people taking Wegovy® experienced reduced food noise – persistent, intrusive and unwanted thoughts about food – and improved mental wellbeing. These insights are important for sustained behaviour change and long‑term outcomes, reinforcing the role of GLP‑1 therapy alongside lifestyle support. | |||
 | ||||
– – – | 22 |
OBESITY& RELATED COMORBIDITIES | ||||
Breaking down obesity care barriers in the US | Obesity care in the US is at an inflection point. Demand for GLP‑1 medicines is surging, while access remains limited by uneven insurance coverage, affordability barriers and administrative hurdles. In parallel, the spread of unapproved compounded products poses quality and safety risks and can disrupt continuity of care. We are acting across the system – providing near‑term relief for self‑pay patients, partnering to broaden coverage and safeguarding patient safety – so more people can access authorised, FDA‑approved medicines through trusted pathways. To provide immediate relief for self-paying patients, in November 2025, we introduced an introductory self‑pay offer of USD 199 per month for the first two doses (0.25 mg and 0.5 mg) of Wegovy® or Ozempic® for new self‑pay patients through 31 March 2026, and lowered the standard monthly self‑pay price to USD 349 thereafter. These offers are available across more than 70,000 pharmacies nationwide, with home delivery through NovoCare® Pharmacy and telehealth partners, and are designed to help patients afford authentic, FDA‑approved semaglutide medicines and reduce the lure of unapproved, compounded alternatives. “We introduced an introductory self‑pay offer of USD 199 per month for the first two doses (0.25 mg and 0.5 mg) of Wegovy® or Ozempic®” Patient safety underpins everything we do. With the expiry of all FDA grace periods for shortage‑based semaglutide compounding in May 2025, it is now illegal under US compounding laws to make or sell compounded semaglutide drugs, with rare exceptions. Since then, we have stepped up action – pursuing legal remedies against unlawful marketing and sales, and working with regulators, law enforcement, healthcare professionals, patient and provider groups and other stakeholders to protect patients and uphold the integrity of the FDA drug approval framework. We are raising awareness among healthcare professionals and consumers about the safety and efficacy risks of unapproved compounded products, while expanding access to FDA‑approved medicines through trusted pathways, including NovoCare® Pharmacy and telehealth partners. In addition, we have agreed to a framework with the US Administration to lower semaglutide prices across Medicare Part D (government insurance for seniors), Medicaid (government insurance for low-income Americans) and direct‑to‑patient channels from 2026 onwards, and to broaden coverage through a Medicare pilot programme for Part D beneficiaries with qualifying comorbidities. This agreement is a significant step toward expanding access to authentic, FDA-approved obesity and diabetes medicines for millions of people living in the US. We are finalising details and remain committed to constructive dialogue. | |||
 | ||||
– – – | 23 |
DIABETES& RELATED COMORBIDITIES | ||||||||||
Additional Ozempic® benefits drive strengthened diabetes leadership | Simplifying insulin treatment with once-weekly options | |||||||||
The global burden of diabetes and related complications is vast. By developing products that meet the complex needs of people living with diabetes, our innovations create long- term value for health systems and society. In 2025, we reached 42 million people with our diabetes portfolio, delivering 4% sales growth at CER. Against this backdrop, the clinical profile of semaglutide – our flagship GLP-1 innovation – continued to strengthen. Regulatory authorities in Europe and the US now recognise its cardiovascular benefits, with the FDA approving Rybelsus® (oral semaglutide) to reduce the risk of major adverse cardiovascular events in adults with type 2 diabetes at high risk. Rybelsus® is the only oral GLP‑1 therapy shown to lower blood glucose and body weight with a confirmed cardiovascular benefit, highlighting the comprehensive benefits of semaglutide. Meanwhile, Ozempic® – the injectable form of semaglutide approved for the treatment of type 2 diabetes – is proving its worth in new areas. The phase 3b STRIDE study showed that Ozempic® helped people with peripheral arterial disease walk further without pain, leading European regulators to update the medicine's label to reflect these mobility and quality-of-life improvements. In the US, the FDA approved Ozempic® – based on results from the FLOW trial – to reduce the risk of kidney disease progression, kidney failure and cardiovascular death in adults with type 2 diabetes and chronic kidney disease (CKD), making Ozempic® the only medicine in its class with a CKD indication. | 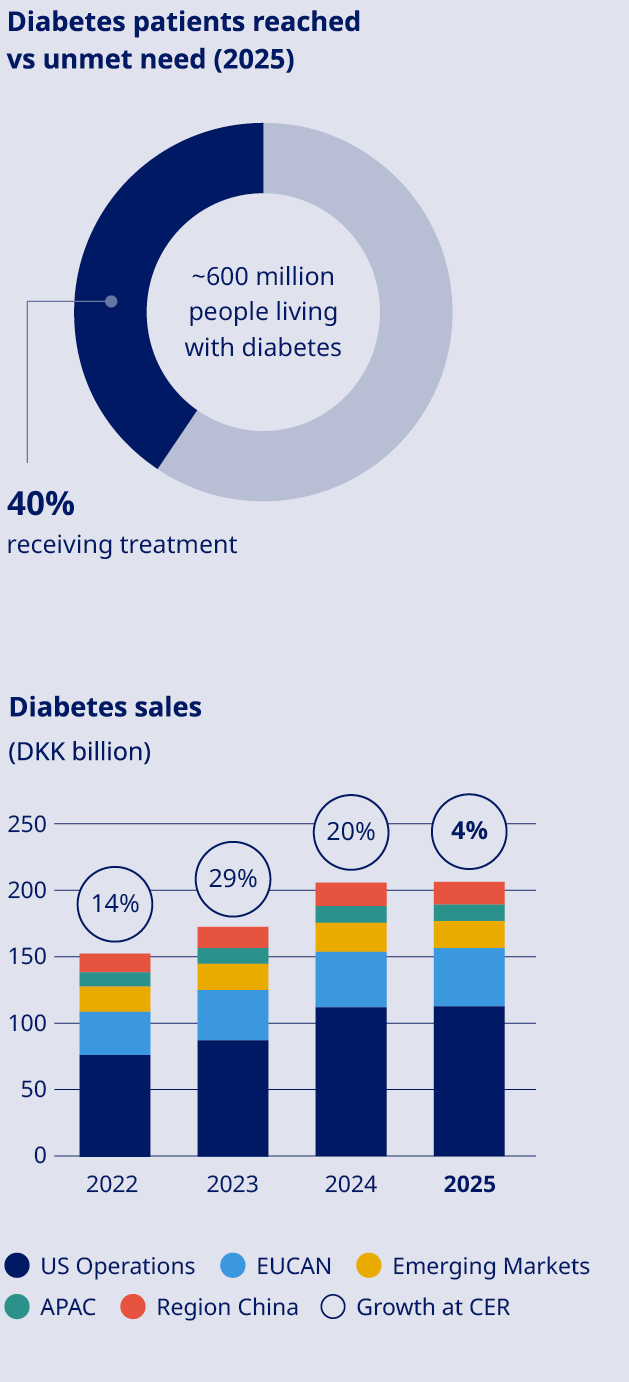 | For many adults with diabetes, basal insulin is essential yet burdensome: daily injections, complex titration and busy schedules can hinder adherence. Awiqli® – the world’s first and only once‑weekly basal insulin – reduces the treatment burden, helping both people with diabetes and healthcare professionals stay focused on achieving and maintaining individual glycaemic targets. As a once‑weekly option, it reduces the weekly injection burden from seven to one. Awiqli® is approved in the EU and 12 other countries, with launches progressing across markets. In the US, we resubmitted the Biologics License Application to the FDA in September 2025, following a 2024 action letter. Further reviews are underway in other markets and additional approvals are expected in 2026. This rollout is underpinned by evidence from ONWARDS – five phase 3a trials in about 4,000 adults with type 2 diabetes – where change in HbA1c was the primary endpoint, supporting clinical decision‑making. Alongside Awiqli®, our once‑weekly portfolio advanced with the European Commission’s approval of Kyinsu® (IcoSema), a once‑weekly combination of basal insulin icodec and the GLP‑1 RA semaglutide. The decision, based on the COMBINE phase 3a programme where all three trials met primary endpoints, confirms a well‑tolerated safety profile and expands options for adults insufficiently controlled on basal insulin or GLP‑1 RAs. |  | |||||||
Nathalia de Souza Santos lives with type 1 diabetes in Brazil. | ||||||||||
– – – | 24 |
RARE DISEASE | PRODUCTION | |||||||||
Expanding therapeutic impact in rare bleeding and growth disorders | Strategic investments to expand manufacturing capacity | |||||||||
Novo Nordisk has a rich legacy and an enduring commitment to people living with rare diseases. Our portfolio is focused on innovative medicines that combine strong efficacy profiles with simple administration to ease the treatment burden. In 2025, our rare disease portfolio delivered 9% sales growth at CER, with Sogroya® leading in the long‑acting growth hormone segment across launch markets and Alhemo® expanding its presence in haemophilia prophylaxis. Sogroya®, our long-acting growth hormone treatment, gained significant momentum in 2025 as new international consensus guidance standardised the approach to paediatric growth hormone deficiency. This clinical framework – covering diagnosis, dosing and weekly monitoring regimens – is helping clinicians deliver more consistent care and expanding access to treatment. Building on this foundation, we maintained Sogroya®’s leadership across its first five launch markets whilst expanding into France, Argentina and Canada, with further entries planned for 2026. In rare bleeding disorders, the FDA and EMA approved expanded use of Alhemo® for people aged 12 or older with haemophilia A or B without inhibitors, broadening access and sustaining our momentum in this therapy area while addressing the remaining unmet needs in haemophilia B. | 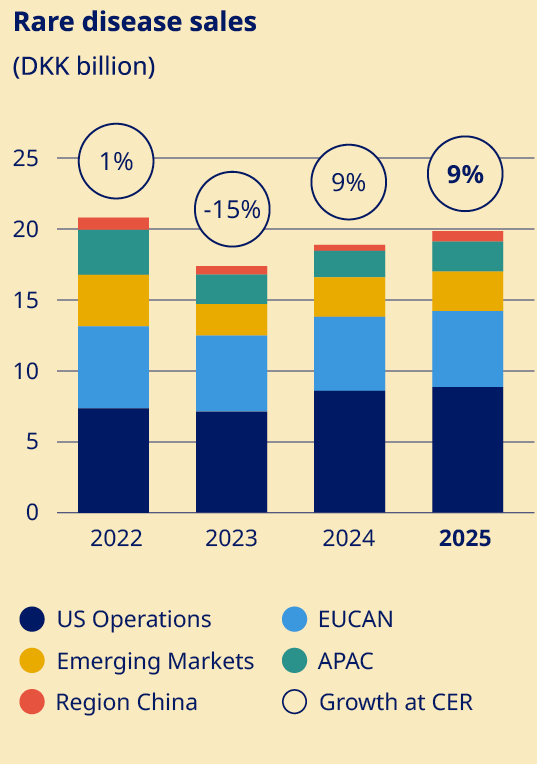 | In February 2025, the FDA declared the shortage of semaglutide injectables resolved, confirming that supply meets or exceeds current and projected US demand. To ensure consistent, sustainable access to authentic, FDA‑approved medicines, we are continuing to expand US manufacturing capacity and to strengthen our supply chain. Patient safety and uninterrupted care remain our top priorities. Following the FDA’s declaration, we continue to work closely with regulators and supply partners to ensure consistent availability and reduce the risk of interruptions as demand continues to evolve. We strive to operate our US production facilities around the clock and have accelerated capital expenditure, including approximately USD 2 billion in US manufacturing in 2025 and plans to invest a further USD 5.6 billion towards 2028. These investments will add new lines, increase fill‑finish and packaging capacity, and significantly expand multiple US sites to address national supply needs. This complements ongoing work to scale production across our global manufacturing network, with major expansions underway in Denmark, France, Brazil and China. Following our 2024 acquisition of three fill‑finish sites formerly operated by Catalent Inc., these facilities are now being transitioned into our network. Once fully integrated, they will enhance flexibility and optionality across the supply chain and complement our significant internal expansions. | 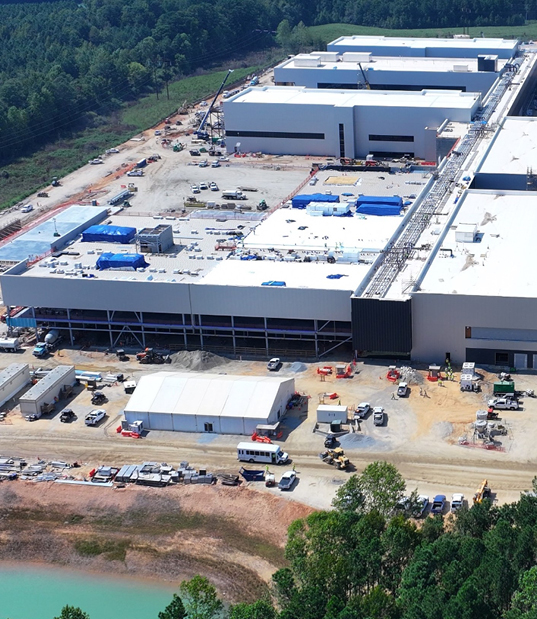 | |||||||
Expansion at our Clayton, North Carolina site in the US. | ||||||||||
“Our portfolio is focused on innovative medicines that combine strong efficacy profiles with simple administration to ease the treatment burden” | “Patient safety and uninterrupted care remain our top priorities” | |||||||||
– – – | 25 |
Product overview1 | Patent status for products with marketing authorisation | |||||||||||||||||
OBESITY& | RARE DISEASE | |||||||||||||||||
GLP-1 •Saxenda®, liraglutide 3.0 mg •Wegovy®, semaglutide 2.4 mg •Wegovy® pill, semaglutide 25 mg Obesity delivery systems •Saxenda®, FlexTouch® •Wegovy®, Single Dose Device and FlexTouch® | GLP-1 •Victoza®, liraglutide •Ozempic®, semaglutide •Rybelsus®, oral semaglutide Pre-filled delivery systems •FlexTouch®, U100, U200, U700 •FlexPen® •InnoLet® •Ozempic®, FlexTouch® Durable delivery systems •NovoPen® 6 •NovoPen® 5 •NovoPen® 4 •NovoPen Echo® Plus •NovoPen Echo® Other delivery systems •PumpCart®, NovoRapid® and Fiasp® cartridge to be used in pump •Penfill® cartridge Oral antidiabetic agents •NovoNorm®, repaglinide Glucagon •GlucaGen®, glucagon (vial and Hypokit®) •Zegalogue®, dasiglucagon Needles •NovoFine® Plus •NovoFine® •NovoTwist® •NovoFine® AutoCover® | Rare blood disorders •NovoSeven®4, eptacog alfa •NovoEight®5, turoctocog alfa •Esperoct®, turoctocog alfa pegol, N8-GP •Alhemo®, concizumab •Refixia®6, nonacog beta pegol, N9-GP •NovoThirteen®7, catridecacog Rare haemato-renal disorders •Rivfloza™, nedosiran Rare endocrine disorders •Norditropin®, somatropin •Sogroya®, somapacitan Pre-filled human growth hormone delivery systems •FlexPro® Other delivery systems •PenMate®, automatic needle inserter for FlexPro® Hormone replacement therapies •Vagifem®8, estradiol hemihydrate •Activelle®, estradiol/norethisterone acetate •Eviana®, estradiol/norethisterone acetate •Kliogest®, estradiol/norethisterone acetate •Novofem®, estradiol/norethisterone acetate •Trisequens®, estradiol/norethisterone acetate •Estrofem®, estradiol | The patent expiry dates for products with marketing authorisation1 are shown in the tables below. The dates provided are for expiry in the US, China, Japan and Europe of patents on the active ingredient, unless otherwise indicated, and include actual and estimated extensions of patent term, when applicable. For several products, in addition to the active ingredient patent, Novo Nordisk holds other patents on manufacturing processes, formulations or uses that may be relevant for exclusivity beyond the expiration of the active ingredient patent. Furthermore, regulatory data protection and/or orphan exclusivity may apply. | |||||||||||||||
DIABETES& | Product | US | China | Japan | Europe2 | |||||||||||||
Once-weekly insulin •Awiqli®, insulin icodec New generation insulin and combinations •Tresiba®, insulin degludec •Ryzodeg®, insulin degludec/insulin aspart •Fiasp®, fast-acting insulin aspart •Xultophy®2, insulin degludec/ liraglutide Modern insulin •Levemir®, insulin detemir •NovoRapid®3, insulin aspart •NovoMix® 30, biphasic insulin aspart •NovoMix® 50, biphasic insulin aspart Human insulin •Insulatard® isophane (NPH) insulin •Actrapid®, regular human insulin •Mixtard® 30, biphasic human insulin •Mixtard® 50, biphasic human insulin | ||||||||||||||||||
OBESITY& | ||||||||||||||||||
Wegovy® injection | 2032 | 2026 | 2031 | 2031 | ||||||||||||||
Wegovy® pill | 2032 | 2026 | 2031 | 2031 | ||||||||||||||
Saxenda® | Expired | Expired | Expired | Expired | ||||||||||||||
DIABETES& | ||||||||||||||||||
Ozempic® | 2032 | 2026 | 2031 | 2031 | ||||||||||||||
Rybelsus® | 2032 | 2026 | 2031 | 2031 | ||||||||||||||
Tresiba® | 2029 | Expired | 2027 | 2028 | ||||||||||||||
Xultophy® | 2029 | Expired | Expired | 2028 | ||||||||||||||
Ryzodeg® | 2029 | Expired | Expired | 2028 | ||||||||||||||
Victoza® | Expired | Expired | Expired | Expired | ||||||||||||||
Human insulin and Modern insulins3 | Expired | Expired | Expired | Expired | ||||||||||||||
RARE DISEASE | ||||||||||||||||||
NovoSeven® | Expired | Expired | Expired | Expired | ||||||||||||||
Norditropin® | Expired | Expired | Expired | Expired | ||||||||||||||
1. Products listed may not be available or approved in all markets. 2. In the US approved under the brand name Xultophy® 100/3.6. 3. In the US approved as NovoLog®. 4. In the US approved as NovoSeven® RT. 5. In the US approved as Novoeight®. 6. In the US approved under the name of REBINYN®. 7. In the US approved under the name tretten®. 8. In the UK also approved as gina®. | 1. This overview excludes products that account for less than 1% of Novo Nordisk’s total sales. 2. Patent status varies from country to country. The figures in the table are based on Germany. 3. Modern insulins are NovoRapid® (NovoLog®), NovoMix® 30 (NovoLog® Mix 70/30), NovoMix® 50, NovoMix® 70 and Levemir®. | |||||||||||||||||
– – – | Novo Nordisk Annual Report 2025 / Annual review / Strategic Aspirations / Innovation and therapeutic focus | 26 |
 | Building on Novo Nordisk’s long-standing expertise in obesity and diabetes, our Research & Development (R&D) organisation is developing multi‑target medicines addressing weight, blood glucose, cardiovascular risk and other related comorbidities together. Our innovation engine builds on decades of leadership in incretin biology, exemplified by semaglutide, and is now advancing dual and triple agonists to deliver stronger, more comprehensive outcomes tailored to different patient needs. Key assets include CagriSema, a once-weekly combination therapy in phase 3 trials, and zenagamtide, a novel unimolecular GLP-1 and amylin receptor agonist in phase 3 development for obesity and diabetes. These assets target clinically meaningful weight reduction and improved glycaemic control, alongside favourable effects on blood pressure and other comorbidities. Aligned with our updated corporate strategy, we prioritise programmes with the greatest potential to improve outcomes in obesity and diabetes. Our pipeline continues to deliver breakthrough results, with recent approvals for higher‑dose Wegovy® (semaglutide 7.2 mg) and the Wegovy® pill, reinforcing our focused approach to incretin biology. Semaglutide 7.2 mg achieved 20.7% mean weight loss if all trial participants adhered to treatment, among the highest observed in clinical studies to date. Meanwhile, oral semaglutide 25 mg became the first and only once-daily oral GLP‑1 medicine approved for chronic weight management, delivering 16.6% weight loss if all study participants adhered to treatment – on par with injectable Wegovy® (semaglutide 2.4 mg). “Our pipeline continues to deliver breakthrough results, with recent approvals for higher‑dose Wegovy® (semaglutide 7.2 mg) and the Wegovy® pill” In parallel, recent phase 2 results in type 2 diabetes with zenagamtide further underscore the clinical impact of our R&D, with HbA1c reductions enabling up to 89% of participants to achieve target levels below 7% and with significant weight loss of up to 14.5% after just 36 weeks. The goal is clear: translate breakthrough science into therapies that work in real‑world care. To sustain momentum from discovery to delivery, we have created a more seamless, end-to-end engine with the 2025 reconfiguration of our R&D organisation. This integrated approach, enhanced by AI and digital technologies, accelerates our pipeline and decision-making, while bringing manufacturability and supply considerations into drug development earlier to enhance speed and efficiency. Across R&D, we remain focused on meeting the rising unmet need in obesity and diabetes with therapies that deliver durable, meaningful improvements in health and quality of life – as quickly and responsibly as possible. | |||
– – – | Novo Nordisk Annual Report 2025 / Annual review / Strategic Aspirations / Innovation and therapeutic focus | 27 |
OBESITY& RELATED COMORBIDITIES | ||||
Next-generation obesity treatments move closer to market | Almost 1 billion people worldwide live with obesity, often alongside type 2 diabetes and other cardiometabolic conditions. Addressing this complex disease requires a range of treatment options that can achieve sustained weight loss, are tolerable for long‑term use and can be tailored to diverse individual needs and preferences. Unlike traditional clinical pathways, obesity care demands approaches that recognise people’s need for discretion and personalised support – insights that have fundamentally reshaped our treatment philosophy. Because appetite, satiety and glucose regulation are governed by peptide hormones – including GLP‑1, GIP, amylin and glucagon – and their protein receptors, our approach harnesses protein and peptide science alongside complementary mechanisms, rigorous clinical development and targeted partnerships to create multiple pathways for personalised care. CagriSema, a unique fixed‑dose combination of the amylin analogue cagrilintide and semaglutide, brings together two peptide‑based mechanisms that act on complementary protein receptors, offering patients a dual‑action approach. CagriSema has now completed two pivotal phase 3a trials with clinically meaningful results. In REDEFINE 1, CagriSema delivered weight loss of 22.7% vs 2.3% with placebo at 68 weeks if all trial participants adhered to treatment – with more than 40% of patients achieving weight loss of 25% or more. The REDEFINE 2 trial in adults with obesity or overweight and type 2 diabetes, showed average weight loss of 15.7% vs 3.1% with placebo when all participants adhered to treatment. We filed for the first regulatory approval for CagriSema in the US in December 2025. “CagriSema delivered weight loss of 22.7% vs 2.3% with placebo at 68 weeks if all trial participants adhered to treatment – with more than 40% of patients achieving weight loss of 25% or more” For patients who may benefit from a different therapeutic approach, cagrilintide is being advanced as a monotherapy. A sub‑analysis of the phase 3 REDEFINE 1 trial showed that once‑weekly cagrilintide 2.4 mg produced an average 11.8% body‑weight reduction vs 2.3% with placebo after 68 weeks, if all adhered to treatment. More than 30% of participants achieved at least 15% weight loss compared with less than 5% on placebo. Based on these results, cagrilintide has entered the RENEW phase 3 programme. We are also initiating phase 3 development of zenagamtide (formerly known as amycretin) – a unimolecular, long‑acting GLP‑1 and amylin receptor agonist – available in both subcutaneous and oral formulations to address diverse patient preferences. This single‑molecule peptide engages two complementary protein receptors, leveraging the additive effects of two key biologies. Following end‑of‑phase 2 regulatory interactions and completed clinical studies, phase 3 for weight management is underway in the first quarter of 2026. The goal is to provide robust efficacy with flexible delivery options, reflecting our understanding that obesity care must move beyond traditional physician-focused models to embrace individualised approaches. | |||
Robert Williams lives with obesity in Brazil. |  | |||
– – – | Novo Nordisk Annual Report 2025 / Annual review / Strategic Aspirations / Innovation and therapeutic focus | 28 |
OBESITY& RELATED COMORBIDITIES | DIABETES& RELATED COMORBIDITIES | |||||||||
Expanding opportunities through strategic partnerships | Improving lives through safer and smarter diabetes solutions | |||||||||
Strategic partnerships and alliances are enhancing the breadth of our biology and modality portfolio in obesity, expanding our toolkit of potential treatment options. This approach allows us to explore novel biological pathways, exemplified by our exclusive licence for UBT251, a GLP-1/GIP/ glucagon triple receptor agonist that targets yet another mechanism for tackling obesity’s complex biology. Beyond injectables, we are also advancing oral treatment options through targeted collaborations. Our exclusive Septerna partnership targets GLP-1, GIP and glucagon receptors across four programmes, whilst we have licensed LX9851 from Lexicon Pharmaceuticals, a first-in-class oral ACSL5 inhibitor. Preclinical data demonstrate that when combined with semaglutide, LX9851 enhanced weight reduction, limited weight regain and showed positive steatosis effects after discontinuation – addressing the critical challenge of weight maintenance. Our partnership strategy extends to related metabolic conditions, particularly metabolic dysfunction-associated steatohepatitis (MASH). Following FDA approval of Wegovy® for noncirrhotic MASH with moderate to advanced fibrosis, we acquired Akero Therapeutics and efruxifermin (EFX), a once- weekly FGF21 analogue now in phase 3 development and the only investigational drug ever to have demonstrated reversal of fibrosis in patients with cirrhosis due to MASH. This acquisition supports people across the disease spectrum, with potential for EFX as a standalone therapy or combined with Wegovy® to tackle this rapidly growing metabolic burden. |  | For the nearly 600 million people living with diabetes, progress is measured in everyday moments: more time‑ in‑range, fewer hypoglycaemic episodes and weight that stays off. Our pipeline aspires to deliver those outcomes. CagriSema leads this approach – a once‑weekly fixed‑ dose combination of amylin analogue, cagrilintide and semaglutide in phase 3 development for type 2 diabetes. The landmark REIMAGINE 2 trial demonstrated 1.91%‑point HbA1c reduction and 14.2% weight loss after 68 weeks, with 43% of participants achieving ≥15% weight loss. These outcomes demonstrate superiority over semaglutide alone – validating our innovative dual‑target approach. Zenagamtide reinforces this strategy, delivering compelling phase 2 results by targeting both GLP-1 and amylin receptors. Subcutaneous zenagamtide achieved HbA1c reductions of up to 1.8%, with 89% of participants reaching target levels below 7%. The oral formulation demonstrated improvements of up to 1.5%, with 78% reaching target. With phase 3 initiation planned for 2026, we are closer to offering treatment options that align with patient preferences and everyday routines. Beyond type 2 diabetes, our commitment to type 1 diabetes remains unwavering. Following the closure of our in-house cell therapy unit, an expanded partnership with Aspect Biosystems seeks to advance cellular medicines that could restore natural blood sugar control – pursuing the ultimate ambition of a cure. Separately, we continue exploring GLP‑1‑based medicines in people at risk of developing type 1 diabetes to delay disease onset. |  | |||||||
Juan Pablo Villaseñor lives with obesity and cardiovascular disease in Mexico. | Gulshan Lal Suchdev lives with type 2 diabetes in Spain. Pictured here with his granddaughter Luna. | |||||||||
– – – | Novo Nordisk Annual Report 2025 / Annual review / Strategic Aspirations / Innovation and therapeutic focus | 29 |
DIABETES& RELATED COMORBIDITIES | RARE DISEASE | |||||||||
Tackling diabetes comorbidities with targeted therapies | Building on rare disease leadership with next-generation therapies | |||||||||
People living with diabetes face interconnected health challenges that extend far beyond blood glucose management. Comorbidities such as cardiovascular disease and chronic kidney disease frequently accompany type 2 diabetes, sharing the same biological roots of metabolic dysfunction and chronic inflammation. Our approach recognises these connections, developing treatments that address the broader cardiometabolic spectrum affecting people living with diabetes. Ziltivekimab, our monoclonal antibody targeting interleukin-6, represents this integrated strategy in cardiovascular medicine. By addressing cardiovascular inflammation – a key driver of complications in people with diabetes – phase 3 trials are testing whether targeted anti- inflammatory therapy can transform care from symptom management to disease modification. With readouts expected between 2026 and 2027 across three clinical settings, ziltivekimab could offer people with diabetes crucial protection against cardiovascular complications. Meanwhile, the evoke programme explored whether semaglutide’s benefits could extend to neurodegeneration, specifically early Alzheimer’s disease. Building on growing evidence linking diabetes and cognitive decline, we evaluated semaglutide in two of the largest early-stage Alzheimer’s trials ever conducted. While results showed no meaningful reduction in disease progression vs placebo, this research advanced scientific understanding within the field of neurodegeneration. | 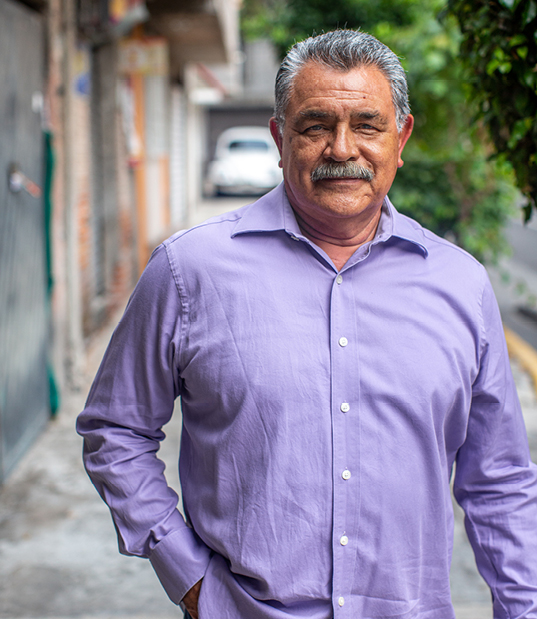 | For people living with rare diseases, each innovation can be life-changing. Our focus is to reduce the care burden with therapies that are effective, tolerable and easier to use. Denecimig (Mim8), a Factor VIIIa mimetic bispecific antibody now under FDA and EMA review, significantly reduced treated bleeds with once‑monthly, fortnightly or once-weekly subcutaneous injections in clinical studies, offering the potential for both strong efficacy and less frequent dosing. Etavopivat, an investigational oral therapy for sickle cell disease, reduced pain crises and improved haemoglobin in phase 2, pointing to a treatment that could help support daily management and patient outcomes. We have also strengthened our portfolio with an asset purchase and global licence agreement for zaltenibart from Omeros Corporation. This antibody blocks MASP‑3, a key switch in the alternative complement pathway – part of the immune system that can become overactive and damage healthy cells. By calming that response without compromising core defences, zaltenibart has best‑in‑class potential across multiple rare blood and kidney disorders. Together, these programmes reflect our patient‑centred approach: advancing life-changing options to change the course of disease while lowering treatment burden and improving overall quality of life. |  | |||||||
Lazaro Montantes lives with type 2 diabetes and cardiovascular disease in Mexico. | Emil Grullón lives with haemophilia A in the Dominican Republic. | |||||||||
– – – | Novo Nordisk Annual Report 2025 / Annual review / Strategic Aspirations / Innovation and therapeutic focus | 30 |
Pipeline overview We remain committed to bringing innovative therapies to patients. In 2025, two assets entered phase 1, one was acquired in late-stage phase 2 and one advanced in phase 2, two progressed to phase 3 and two assets initiated submissions for regulatory approval in key markets. |
Phase 1 | |||||
Project | Indication | Description | Phase progress* | ||
Amylin 355 NN9638 | Obesity | Amylin receptor agonist | |||
Amylin 1213 NN9839 | Obesity | Amylin receptor agonist | New | ||
SLC25A5 NN4005 | MASH1 | siRNA2 | |||
GSI3 Albumin NN1644 | T1D4 | Insulin | |||
GYS2 GalXC NN9733 | T2D5 | siRNA | New | ||
Ventus NLRP3i6 NN6022 | CVD7 | NLRP3 inhibitor | |||
CNP HF8 NN6537 | Heart failure | C-type natriuretic peptide | |||
Inno8 NN7441 | Haemophilia A w/wo inhibitors | FVIIIa9 mimetic bispecific antibody fragment | |||
* Compared to 2024 1. MASH: Metabolic dysfunction-associated steatohepatitis. 2. siRNA: Small interfering RNA. 3. GSI: Glucose-sensitive insulin. 4. T1D: Type 1 diabetes. 5. T2D: Type 2 diabetes. 6. NLRP3i: NOD-like receptor protein 3 inhibitor. 7. CVD: Cardiovascular disease. 8. HF: Heart failure. 9. FVIIIa: Activated factor VIII (FVIIIa). 10. CB-1: Cannabinoid receptor-1. 11. GLP-1: Glucagon-like peptide-1. 12. GIP: Gastric inhibitory polypeptide. 13. PKR: Pyruvate kinase-R. 14. PNH: Paroxysmal Nocturnal Haemoglobinuria. 15. CKD: Chronic kidney disease. 16. ASCVD: Atherosclerotic cardiovascular disease. 17. AMI: Acute myocardial infarction. 18. HFpEF: Heart failure with preserved ejection fraction. |
Phase 2 | |||||
Project | Indication | Description | Phase progress* | ||
Monlunabant NN9440 | Obesity | CB-110 receptor inverse agonist | |||
Zenagamtide (amycretin) NN9487 | Obesity | Unimolecular GLP-111 and amylin receptor agonist | |||
Triple NN9662 | Obesity | GLP-1/ GIP12/amylin | 1 → 2 | ||
UBT 251 NN9559 | Obesity and T2D | A triple agonist | New | ||
CDR132L NN6706 | Heart failure | Oligonucleotide inhibitor | |||
Zenagamtide (amycretin) NN9490 | T2D | Unimolecular GLP-1 and amylin receptor agonist | |||
Etavopivat NN7536 | Thalassemia | PKR13-activator | |||
NDec NN7533 | Sickle cell disease | Combination of decitabine and tetrahydrouridine in collaboration with EpiDestiny | |||
Zaltenibart NN9064 | PNH14 | Antibody | New | ||
Phase 3 | |||||
Project | Indication | Description | Phase progress* | ||
CagriSema NN9388 | Obesity | Long-acting amylin receptor agonist in combination with a long- acting GLP-1 analogue | |||
Cagrilintide NN9833 | Obesity | Amylin receptor agonist | 2 → 3 | ||
Efruxifermin NN9064 | MASH | FGF21 agonist | |||
CagriSema NN9388 | T2D | Long-acting amylin receptor agonist in combination with a long- acting GLP-1 analogue | |||
Ziltivekimab NN6018 | CKD15 ASCVD16 AMI17 HFpEF18 | Monoclonal antibody | |||
Coramitug NN6019 | CVD | Monoclonal antibody | 2 → 3 | ||
Etavopivat NN7535 | Sickle cell disease | PKR-activator | |||
Obesity& Diabetes& Rare Disease    | |||||
Submission and/or approval | |||||
Project | Indication | Description | Phase progress* | ||
Oral Semaglutide NN9932 | Obesity | GLP-1 receptor agonist | 3 → Subm/ Appr. | ||
Semaglutide 7.2 mg NN9536 | Obesity | GLP-1 receptor agonist | 3 → Subm/ Appr. | ||
CagriSema NN9838 | Obesity | Long-acting amylin receptor agonist in combination with a long- acting GLP-1 receptor agonist | 3 → Subm/ Appr. | ||
Semaglutide NN9931 | MASH | GLP-1 receptor agonist | 3 → Subm/ Appr. | ||
IcoSema NN1535 | T2D | Semaglutide and basal insulin | |||
Icodec NN1436 | T1D and T2D | Basal insulin analogue | |||
Denecimig (Mim8) NN7769 | Haemophilia A w/wo inhibitors | FVIIIa mimetic bispecific antibody | 3 → Subm/ Appr. | ||
– – – | Novo Nordisk Annual Report 2025 / Annual review / Strategic Aspirations / Innovation and therapeutic focus | 31 |
Research and development progress | |||||||||
OBESITY& | DIABETES& | RARE DISEASE | |||||||
Regulatory events •Wegovy® received accelerated approval by the Food and Drug Administration (FDA) for the treatment of metabolic dysfunction-associated steatohepatitis (MASH) and data were submitted to European Medicines Agency (EMA), Pharmaceuticals and Medical Devices Agency (PMDA) and Centre for Drug Evaluation (CDE). •CagriSema new drug application was submitted to the FDA for initial marketing authorisation for weight management. •Wegovy® pill, oral semaglutide (25 mg), was approved by the FDA for weight management and reduction of major adverse cardiovascular events and data were submitted to the EMA. •Wegovy® label update was approved by the FDA to reflect reduction in hospitalisations for heart failure or urgent heart failure visits in people with overweight or obesity and atherosclerotic cardiovascular disease based on SELECT data. •Wegovy®, subcutaneous (sc.) semaglutide 7.2 mg, received a positive opinion by EMA for weight management and was submitted to the FDA for marketing authorisation. Clinical progress •Phase 3a trial REDEFINE 2, investigating CagriSema (cagrilintide 2.4 mg in combination with semaglutide 2.4 mg) to evaluate efficacy and safety in people with overweight/obesity and type 2 diabetes (T2D), was completed. •Phase 3a trials RENEW 1 and RENEW 2, investigating cagrilintide in people with obesity, with and without T2D, were initiated. •Acquisition of Akero Therapeutics, Inc., with lead compound efruxifermin (EFX) in Phase 3 for the treatment of MASH, was completed. •Phase 3b trials REDEFINE 8 and REDEFINE 11, investigating CagriSema for long- term weight loss and its full weight-loss potential, were initiated. •In-licensing of lead asset UBT-251 and an early-stage glucagon for the treatment of obesity, T2D, and other diseases from The United Bio-Technology (Hengqin) Co., Ltd. (United Biotechnology) was completed. •Phase 2 trial investigating once-weekly GIP–GLP-1 was completed. •Phase 1b/2 trial investigating Triple in people with obesity was initiated. •Phase 1 trial investigating SLC25A5 in MASH was initiated. •Phase 1 trial investigating oral zenagamtide (amycretin) was completed. | Regulatory events •Kyinsu® (IcoSema) was approved by the EMA for the treatment of T2D in adults insufficiently controlled by basal insulin or GLP-1 receptor agonists. •Kyinsu® was submitted to the PMDA and the CDE for initial marketing authorisation for the treatment of T2D. •Awiqli® Biologics License Application (BLA) was resubmitted to the FDA for the treatment of people with T2D. •Ozempic® label expansion was approved by the FDA to reflect the reduction in kidney disease related events in people with T2D based on FLOW results. •Rybelsus® label expansion was approved by the FDA and EMA to reflect the risk reduction of major cardiovascular events in people with T2D based on SOUL results. •Ozempic® label expansion was approved by the EMA to reflect the improvements of functional outcomes in people with T2D and peripheral artery disease (PAD) based on STRIDE results. Clinical progress •Phase 3a trials REIMAGINE 2 and 3, investigating CagriSema in people with T2D, were completed. •Phase 3a trial CLEOPATRA, investigating Coramitug in people living with transthyretin amyloidosis (ATTR) cardiomyopathy, was initiated. •Phase 3a trials evoke and evoke+, investigating semaglutide in Alzheimer’s disease, completed interim readouts and the programme was terminated. •Phase 3b trial REMODEL, a mechanistic study investigating semaglutide in patients with T2D and chronic kidney disease, was completed. •Phase 2 trial investigating sc. and oral zenagamtide in people with T2D was completed. •Phase 2 trial investigating once-weekly GIP–GLP-1 in people with T2D was completed. •Phase 2 trial investigating Coramitug in people living with ATTR cardiomyopathy was completed. •Phase 1 trial investigating GalXC GYS2 was initiated. •Early-stage projects STAT3 (oncology/acromegaly), PD‑L1 (oncology) and XDH GalXC‑lipid (gout) were terminated. •Phase 1 trial investigating Ventus NLRP3i was completed. •Alternative routes were pursued for early-stage projects within stem cell therapy. | Regulatory events •Denecimig (Mim8) BLA was submitted to the FDA and Marketing authorization application (MAA) to the EMA for initial marketing authorization for treatment of haemophilia A in people with and without inhibitors. •Sogroya® label label extension for the treatment of non-replacement indications was submitted to FDA, EMA, CDE and PMDA. •Alhemo® (concizumab) was approved by FDA and EMA for the expanded treatment of haemophilia A or B in people without inhibitors. Clinical progress •Phase 3a trial HIBISCUS 2, investigating etavopivat in people with sickle cell disease (SCD), was initiated. •Phase 3a FRONTIER 2 and Frontier3 trials, investigating denecimig in adults/ adolescents and children with haemophilia A, were completed. •Phase 2 part, of the HIBISCUS phase 2/3 trial, investigating etavopivat in people with SCD, was completed. •Phase 2 trial ASCENT1, investigating NDec in people with SCD, was completed. •Acquisition of MASP‑3 inhibitor zaltenibart from Omeros Corporation for the treatment of rare blood and kidney disease, of which the phase 2 trial was completed. | |||||||
– – – | 32 |
 | In 2025, our medicines reached 45.6 million people worldwide – a testament to our expanding therapeutic footprint. Alongside this broad reach, our diabetes access programmes supported 7.1 million vulnerable patients; a decline from 2024 levels primarily driven by lower insulin tender sales due to portfolio consolidation. This underscores the complex balance we must strike between sustainable growth and ensuring continuity of care for those who need us most – a challenge that has prompted renewed efforts to restore and strengthen our reach. Central to this mission is strengthening access where millions lack essential treatments. Prevention and early access set the course for a healthier life, but as serious chronic diseases rise worldwide, strained healthcare systems face increasing pressure. Our response combines targeted partnerships with systematic affordability initiatives. In the US, we provide assistance for people with or without insurance and have reduced monthly costs for self‑pay patients. In other parts of the world, our Changing Diabetes® in Children programme supports children under 25 with type 1 diabetes in low- and middle-income countries, while our Access to Insulin Commitment guarantees low-priced human insulin for the least developed countries and humanitarian settings. Recognising that treatment alone will not bend the obesity curve, we go beyond medicine, addressing the root causes of this chronic disease. By focusing on reaching people where they live, learn and play, our Cities for Better Health programme – now active in 54 cities worldwide – partners with communities to reduce risk of obesity and type 2 diabetes through targeted interventions addressing the social determinants of health. “We go beyond medicine, addressing the root causes of this chronic disease” Sustaining our growth and impact requires both expanded reach and financial discipline. We simplified our organisation in 2025 to address complexities that emerged during hyper-growth while reducing costs to ensure long-term sustainability. To enable faster decisions, sharper execution and improved efficiency, we made the difficult decision to reduce approximately 9,000 positions globally. From 2026, these changes will deliver around DKK 8 billion in annualised savings, which we will reinvest in obesity and diabetes growth opportunities. Our commitment to sustainable growth extends beyond organisational efficiency to environmental accountability. Our environmental performance demands urgent action. While scaling production to serve unprecedented patient demand, our emissions have increased – a trajectory that challenges our sustainability ambitions. We are working to implement initiatives across emissions, nature and plastics to reverse this trend through partnerships and systematic transformation. Building on this foundation of access, prevention and environmental responsibility, we will align our organisation to deliver health impact at scale whilst confronting environmental challenges with urgency. We will strengthen partnerships with health systems, expand programmes to reach those who need our medicines the most and build supply chains that serve people and the planet – ensuring our innovations deliver lasting value for the communities we serve and the world we share. | |||
– – – | 33 |
SOCIAL | ||||
Strengthening global access and affordability programmes | Reaching vulnerable people with diabetes involves addressing coverage, affordability and supply challenges in different ways across different markets. Despite this reach declining in 2025 due to portfolio consolidation affecting insulin tenders, we strengthened access through practical, locally tailored solutions that make quality treatment attainable. In the US, we are expanding practical pathways to treatment across multiple channels. Through NovoCare® – our patient assistance programme – patients can check coverage, access savings and, where eligible, receive assistance. In late 2025, we introduced time‑limited introductory pricing for new self‑pay patients for Wegovy® and Ozempic®, followed by a lower standard monthly self‑pay price for most doses, helping reduce costs and discouraging the use of illicit compounded products. “In the US, we are expanding practical pathways to treatment across multiple channels. Through NovoCare® – our patient assistance programme – patients can check coverage, access savings and, where eligible, receive assistance” Our global programmes focus on people facing the greatest barriers to care. Changing Diabetes® in Children (CDiC) supports children under 25 living with type 1 diabetes in low‑ and middle‑income countries; since 2009, we have reached almost 82,000 children with life‑saving care delivered through a holistic model. In Sub‑Saharan Africa, our iCARE approach – integrating capacity, affordability, reach and empowerment across 49 countries – strengthens healthcare infrastructure, supports workforce development and improves product affordability through tiered pricing in collaboration with local partners. Our Access to Insulin Commitment, established in 2001, continues to guarantee a low price for human insulin for least‑developed and other low‑income countries, and for organisations providing relief in humanitarian settings, helping to ensure continuity of care where health systems are under strain. We are also aligning efforts across the broader Novo Nordisk family to maximise impact, with our humanitarian focus prioritising product donations while the Novo Nordisk Foundation and World Diabetes Foundation lean in on complementary elements of care and prevention. | |||
Olivia Aka lives with type 1 diabetes in Ivory Coast and is supported by the CDiC programme. Pictured here with her grandmother. |  | |||
– – – | 34 |
SOCIAL | ENVIRONMENTAL | |||||||||
Partnering for prevention | Scaling responsibly on the road to Net Zero | |||||||||
Preventing serious chronic diseases starts with healthier environments. We invest in primary prevention to help children, families and communities reduce risk before illness takes hold, aligning policy, data and local action to create lasting change, bringing partners together across sectors and government levels. Through Cities for Better Health (CBH), we work with local authorities, schools and community organisations to make healthy choices easier in 54 cities worldwide. CBH supports practical, evidence‑based measures – such as healthier school meals, daily activity programmes and safer streets and parks – co‑designed with local communities and replicated across participating cities. The CBH Childhood Obesity Prevention Initiative breaks new ground with a five-year, DKK 250 million investment spanning six countries across six continents. Using a rigorous trial-like design developed with partners including Oxford University, the initiative pilots community-based interventions for children aged 6-13 – from school-day activity and nutrition programmes to safe routes for walking and cycling – building robust evidence for policy change and national scale-up. Since 2019, we have partnered with UNICEF to advance childhood obesity prevention, combining policy advocacy, robust data and implementation support to create healthier environments for children and adolescents. From 2024 to 2025, more than 468,000 young people benefited directly via local programmatic activities. |  | We remain committed to delivering on our environmental targets for 2033 and 2045. As with any major transition, meaningful results do not materialise overnight, requiring sustained effort to achieve the fundamental changes needed. Our rapid production scale-up to meet growing demand for life-saving medicines has driven year-on-year increases in our environmental metrics – presenting a clear challenge to our sustainability ambitions. Getting back on track will require substantial time, effort and investment, but our ambition remains unwavering. We continue reporting transparently on both progress and setbacks as we work to reverse this trend. Supplier collaboration forms one of the cornerstones of our Net Zero strategy. More than 3,000 suppliers have committed to renewable electricity sourcing, accounting for 54% of our total CO2e emissions. In our own production, we began sourcing bio- ammonia in 2025, with potential to reduce GHG emissions by around 80% compared to conventional ammonia. Beyond energy, we are working to reduce the plastic footprint per patient by changing to reusable devices and therapies requiring less frequent dosing. We source e-methanol from Europe’s first large- scale e-methanol facility in Kassø, Denmark, together with the LEGO Group and Maersk, allowing us to explore alternative ways to make lower carbon plastic for our injection pens. Our ReMedTM programme, meanwhile, facilitates pen returns across seven countries. Even our raw materials reflect this commitment. We are exploring regenerative production methods for glucose – a key raw material in our medicine manufacturing – to improve soil health and biodiversity while securing supply of the natural resources our therapies depend upon. | Environmental targets and ambitions1 Climate •Reduce scope 3 emissions by 33% by 20332 •Reach Net Zero in 2045 Plastic •Reduce plastic footprint per patient by 30% by 2033 Nature •Halt the loss of nature by 2033 •Become nature positive by 2045 | |||||||
Children in Madrid, Spain, one of the cities of our Childhood Obesity Prevention Initiative. | ||||||||||
% of GHG emissions from suppliers who have committed to sourcing renewable electricity 54% 41% in 2024 | ||||||||||
1. Find more information on targets and ambitions, incl. progress, on p. 63–67. 2. vs 2024 baseline, covering ~67% of scope 3 emissions. | ||||||||||
– – – | 36 |
Executive Management | ||||||||||||||
 | 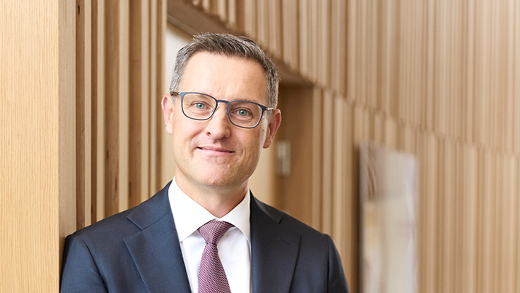 |  |  |  |  | |||||||||
Maziar Mike Doustdar1 | Karsten Munk Knudsen1 | Thilde Hummel Bøgebjerg | Ludovic Helfgott | Martin Holst Lange | Emil Kongshøj Larsen | |||||||||
President and Chief Executive Officer (CEO). Born in August 1970. Male. Other positions and management duties Member of the board of directors of Orion Corporation. | Executive Vice President. Chief Financial Officer (CFO). Born in December 1971. Male. Other positions and management duties Member of the board of directors of Hempel A/S. Member of the board of directors of 3Shape Holding A/S. Chair of NNE board of directors. | Executive Vice President. Enterprise IT and Quality. Born in March 1982. Female. Other positions and management duties No other management positions. | Executive Vice President. Product & Portfolio Strategy. Born in July 1974. Male. Other positions and management duties President of the Novo Nordisk Haemophilia & Haemaglobinopathies Foundation Council. | Executive Vice President. Research & Development and Chief Scientific Officer (CSO). Born in October 1970. Male. Other positions and management duties Member of the board of directors of Pharmacosmos A/S. | Executive Vice President. International Operations. Born in September 1975. Male. Other positions and management duties Member of the board of the European Federation of Pharmaceutical Industries and Associations (EFPIA). | |||||||||
 |  |  |  |  | ||||||||||
Kasper Bødker Mejlvang2 | David Moore | Tania Sabroe | Elin Jäger | John F. Kuckelman | ||||||||||
Executive Vice President. Chemistry, Manufacturing & Control (CMC) & Product Supply. Born in August 1977. Male. Other positions and management duties No other management positions. | Executive Vice President. US Operations. Born in January 1974. Male. Other positions and management duties Member of the board of directors of Novasenta Inc. | Executive Vice President. People, Organisation & Corporate Affairs. Born in July 1977. Female. Other positions and management duties Member of the Danish Life Science Council. | Senior Vice President. Chief of Staff to CEO; Corporate Strategy & Sustainability. Born in September 1986. Female. Other positions and management duties Vice chair of the World Diabetes Foundation. | Senior Vice President. Group General Counsel, Global Legal, IP and Security. Born in February 1972. Male. Other positions and management duties No other management positions. | ||||||||||
1. Maziar Mike Doustdar and Karsten Munk Knudsen are registered as executives with the Danish Business Authority. The other members of Executive Management are not registered as executives with the Danish Business Authority. 2. Kasper Bødker Mejlvang, previously SVP of Region Japan, was promoted to executive vice president of CMC & Product Supply with effect from 1 January 2026. | ||||||||||||||
– – – | 37 |
Board of Directors | |||||||||||
 |  |  |  |  | |||||||
Lars Rebien Sørensen Chair | Cees de Jong Vice Chair | Elisabeth Dahl Christensen | Stephan Engels | Liselotte Hyveled | |||||||
Danish. Born in October 1954. Male. Member since 2025. Term 2026. Chair of the Board and Chair of the People & Governance Committee. Positions and management duties Chair of the board of directors of Novo Nordisk Foundation. Vice chair of the board of directors of Ferring Pharmaceuticals. Member of the board of directors of Jungbunzlauer Suisse AG. Adjunct professor at the University of Copenhagen’s School of Life Sciences. Adjunct professor at Center for Corporate Governance at Copenhagen Business School. Competences Global corporate leadership; healthcare & pharma industry; business development, M&A and external innovation sourcing; medicine & science; human capital management; environmental, social & governance (ESG). | Dutch. Born in May 1961. Male. Member since 2025. Term 2026. Vice Chair of the Board and Chair of the Remuneration Committee and member of the Audit Committee. Positions and management duties Chair of the board of directors of Novonesis A/S. Chair of the Nomination and Remuneration Committee of Novonesis A/S. Member of the Audit Committee of Novonesis A/S. Chair of the board of directors of Meatable. Member of the board of Oterra. Venture Partner, Forbion BioEconomy Fund I. Competences Global corporate leadership; finance & accounting; business development, M&A and external innovation sourcing; environmental, social & governance (ESG); human capital management. | Danish. Born in November 1965. Female. Member since 2022. Term 2026. Employee representative. Member of the Remuneration Committee. Positions and management duties Full-time union representative at Novo Nordisk A/S. Competences Not mapped for employee representatives. | German. Born in March 1962. Male. Member since 2025. Term 2026. Chair of the Audit Committee and member of the Remuneration Committee and member of the People & Governance Committee. Positions and management duties Member of the board of directors of SimCorp A/S. Chair of the Audit and Risk Committee of SimCorp A/S. Member of the Remuneration and Nomination Committee of SimCorp A/S. Competences Global corporate leadership; finance & accounting; human capital management; business development, M&A and external innovation sourcing. | Danish. Born in January 1966. Female. Member since 2022. Term 2026. Employee representative. Member of the Research & Development Committee. Positions and management duties Associate vice president, external innovation, scientific partnership and integration, Novo Nordisk A/S. Member of the board of directors of TriSalus Life Sciences. Competences Not mapped for employee representatives. | |||||||
– – – | 38 |
Board of Directors (continued) | |||||||||||
 |  |  |  | ||||||||
Mette Bøjer Jensen | Britt Meelby Jensen | Kasim Kutay | Tanja Villumsen | ||||||||
Danish. Born in December 1975. Female. Member since 2018. Term 2026. Employee representative. Member of the Audit Committee. Member of the People & Governance Committee. Positions and management duties Wash & Sterilisation specialist in Product Supply, Novo Nordisk A/S. Competences Not mapped for employee representatives. | Danish. Born in June 1973. Female. Member since 2025. Term 2026. Member of the Remuneration Committee and member of the Research & Development Committee. Positions and management duties CEO of Ambu A/S. Vice chair of the board of directors of Novo Holdings A/S. Member of the board of directors of Hempel A/S. Competences Global corporate leadership; healthcare & pharma industry; human capital management; technology, data & digital; business development, M&A and external innovation sourcing. | British. Born in May 1965. Male. Member since 2017. Term 2026. Member of the People & Governance Committee and the Research & Development Committee. Positions and management duties CEO of Novo Holdings A/S. Member of the board of directors and member of the nomination and remuneration committee of Novonesis A/S. Competences Global corporate leadership; healthcare and pharma industry; finance and accounting; business development, M&A and external innovation sourcing; human capital management. | Danish. Born in June 1980. Member since 2026. Term 2026. Employee representative. Positions and management duties Associate Project Director, Clinical Supplies, CMC & Product Supply. Member of the board of directors of PFA Pension. Member of the Audit Committee of PFA Pension. Member of the board of directors of PFA Holdings. Vice chair of the board of directors of Pharmadanmark. Vice chair of the board of directors of Life Science Danmark ApS. Member of PAF advisory board to PFA Pension (pharmacists). Chair of the Negotiation Committee of Pharmadanmark. Member of the Strategic Advisory Board of Nordic Cell Therapy Group ApS. Competences Not mapped for employee representatives. | ||||||||
– – – | 39 |
Board of Directors (continued) | Corporate governance | |||||||||||
Independence and meeting attendance overview | Governance structure The shareholders of Novo Nordisk exercise their rights at the general meeting, which is the supreme governing body of the company. General meetings may be held annually and extraordinarily. While the Annual General Meeting, inter alia, adopts the company’s Articles of Association, approves the Annual Report and elects the Board of Directors, an Extraordinary General Meeting serves a specific purpose. On 14 November 2025, Novo Nordisk held an Extraordinary General Meeting to elect new members to the Board of Directors. At the Extraordinary General Meeting, seven members of the then Board of Directors stepped down, whilst four new members were elected to the Board of Directors. Following the election at the Extraordinary General Meeting, less than half of the shareholder-elected Board members (two of five) are considered independent. It is the intention of the Board to increase the number of independent Board members to at least four at the Annual General Meeting in March 2026 at which point more than half of the shareholder-elected Board members will accordingly be considered independent. Any shareholder has the right to raise questions at general meetings. Resolutions can generally be passed by a simple majority. However, resolutions to amend the Articles of Association require two- thirds of the votes cast and capital represented, unless other adoption requirements are imposed by the Danish Companies Act. Novo Nordisk has a two-tier management structure consisting of the Board of Directors and Executive Management. The governance structure and rules of Novo Nordisk are further described in our Articles of Association and our Corporate Governance Report, both available at: https://www.novonordisk.com/ about/corporate-governance.html (The contents of the company's website do not form a part of this Form 6-K) Foundation ownership Novo Holdings A/S, a Danish company wholly owned by the Novo Nordisk Foundation, holds the majority of votes at Novo Nordisk A/S’ general meetings. The combination of foundation ownership and stock listing enables Novo Nordisk to embark on long-term sustainable strategies while maintaining short-term transparency on performance. Our foundation ownership supports the overarching imperative to be both commercially successful and responsive to the wider needs of society. The Novo Nordisk Foundation has four objectives: to provide a stable basis for the commercial and research activities of Novo Nordisk, Novonesis and additional companies in Novo Holdings’ investment portfolio; to support physicological, endocrinological, metabolic and other medical research; to support research hospital activities within diabetes in Denmark; and to support scientific, humanitarian and social purposes. Please refer to the section on value creation on page 10. For more information about the ownership structure of Novo Nordisk, see page 18. | |||||||||||
Meeting attendance in 20251 | ||||||||||||
Name | Independence2 | Board of Directors | Chair Committee | Audit Committee12 | People & Governance Committee | Remuneration Committee | R&D Committee | |||||
Helge Lund3 | Independent | 18/18 | 6/6 | 3/3 | ||||||||
Henrik Poulsen4, 5, 6, 7 | Not independent | 18/18 | 6/6 | 4/4 | 4/4 | |||||||
Elisabeth Dahl Christensen8 | Not independent | 19/19 | 4/4 | |||||||||
Laurence Debroux5, 6, 7 | Independent | 18/18 | 4/4 | 4/4 | ||||||||
Andreas Fibig | Independent | 18/18 | 8/8 | |||||||||
Sylvie Grégoire5 | Independent | 18/18 | 4/4 | 3/3 | 7/8 | |||||||
Liselotte Hyveled8, 9 | Not independent | 19/19 | 8/8 | |||||||||
Mette Bøjer Jensen5, 8, 10 | Not independent | 19/19 | 5/5 | |||||||||
Kasim Kutay4 | Not independent | 18/19 | 3/3 | 6/8 | ||||||||
Christina Law5 | Independent | 18/18 | 4/4 | 2/3 | ||||||||
Martin Mackay | Independent | 18/18 | 4/4 | 8/8 | ||||||||
Thomas Rantzau8 | Not independent | 19/19 | 3/3 | |||||||||
Lars Rebien Sørensen11 | Not independent | 1/1 | 1/1 | |||||||||
Cees de Jong10, 11 | Independent | 1/1 | 1/1 | 1/1 | 1/1 | |||||||
Britt Meelby Jensen4, 11 | Not independent | 1/1 | 1/1 | |||||||||
Stephan Engels6, 7, 10, 11 | Independent | 1/1 | 1/1 | 1/1 | ||||||||
1. Number of meetings attended by each Board member out of the total number of meetings within the member’s term. 2. As of 31 December 2025, 40% of shareholder-elected board members and 22% of all board members, including employee representatives, are considered independent. 3. Helge Lund was also a member of the Board of Directors for a one-year term from 2014-2015. 4. Member of the board of directors or executive management of Novo Holdings A/S. 5. Pursuant to the US Securities Exchange Act, Laurence Debroux, Sylvie Grégoire and Christina Law qualified as independent Audit Committee members, while Mette Bøjer Jensen and Henrik Poulsen relied on an exemption from the independence requirements. 6. Laurence Debroux, Henrik Poulsen and Stephan Engels possess the qualifications within accounting and auditing required under part 8 of the Danish Act on Approved Auditors and Audit Firms. 7. Designated as financial experts as defined by the US Securities and Exchange Commission (SEC). 8. Elected by employees of Novo Nordisk. 9. Liselotte Hyveled was also an employee-elected member of the Board of Directors for one four-year term from 2014-2018. 10. Under the US Securities Exchange Act on Audit Committee requirements, Stephan Engels and Cees de Jong qualify as independent, while Mette Bøjer Jensen relies on an exemption to the independence requirements. 11. Was elected to the Board of Directors at the Extraordinary General Meeting on 14 November 2025. 12. Collectively, the members have relevant industry expertise. | ||||||||||||
– – – | 40 |
Corporate governance reporting Novo Nordisk reports in accordance with the Danish Corporate Governance Recommendations, which are implemented by Nasdaq Copenhagen in the Nordic Main Market Rulebook for Issuer of Shares, as well as the Corporate Governance Standards of the New York Stock Exchange applicable to foreign private issuers. Novo Nordisk complies with the Danish Corporate Governance Recommendations because we account for which recommendations we comply with or deviate from and explain our chosen approach. Find further information about our corporate governance practices and a statement on our approach to each of the Danish Corporate Governance Recommendations as well as the Corporate Governance Standards of the New York Stock Exchange in our Corporate Governance Report, are available at: https://www.novonordisk.com/about/corporate-governance.html (The contents of the company's website do not form a part of this Form 6-K) Remuneration Executive remuneration is linked to financial performance as well as non-financial performance (e.g., innovation and sustainability). Both short- and long-term incentive programmes include sustainability metrics, aligning executive pay with our sustainability objectives. Novo Nordisk has prepared a separate Remuneration Report describing the remuneration awarded or due during 2025 to the Board of Directors and Executive Management members registered with the Danish Business Authority. The Remuneration Report is submitted to the Annual General Meeting for an advisory vote. The Remuneration Policy and the Remuneration Report are available at: https://www.novonordisk.com/about/corporate-governance.html (The contents of the company's website do not form a part of this Form 6-K) Disclosure regarding change of control provisions It is disclosed that Novo Nordisk does not have any material contracts that take effect, alter or terminate upon a change of control of Novo Nordisk following implementation of a takeover bid. In the event of termination – whether by Novo Nordisk or by the individual – due to a merger, acquisition or takeover of Novo Nordisk, members of Executive Management registered with the Danish Business Authority are, in addition to the notice period, entitled to a severance payment of 24 months’ base salary plus pension contribution. Ethics and compliance In Novo Nordisk, we have an ethics and compliance programme comprised of a code of conduct (OneCode), requirements (The Ethics Navigator), processes and awareness and capability building as stipulated in the seven elements of an effective compliance programme. Data privacy is a key component in our ethical principles, ensuring guardrails are in place to manage and mitigate risks, thus safeguarding our patients and society at large. We have also adopted set of principles for data and artificial intelligence (AI) ethics to support ethical decision- making. Our global AI Ethics compliance framework sets out principles, requirements and operational guidelines, while also cataloguing all deployed AI systems across the organisation. The framework standardises risk assessment processes and strengthens organisational capabilities through AI literacy training. Find more information about these principles, in accordance with the Danish Financial Statements Act Section 99d, at: https://www.novonordisk.com/ data-privacy-and-user-rights/data-ethics.html (The contents of the company's website do not form a part of this Form 6-K) | Sustainability governance The Board of Directors oversees sustainability, including material impacts, risks and opportunities (IROs), culture and business conduct. These matters are addressed through dedicated reviews and regular updates from Executive Management and the Audit Committee. The Board is supported by its committees: the Audit Committee oversees financial and sustainability reporting, due diligence outcomes and risk management; the Remuneration Committee integrates sustainability metrics into executive incentives; and the People & Governance Committee ensures board competencies align with business conduct and sustainability needs. These responsibilities are formalised in the Committee charters. While Executive Management sets and monitors the progress of the sustainability targets and strategy, the operational responsibility is anchored in Corporate Sustainability within the CEO Office. Corporate Sustainability works with business units to integrate environmental and social considerations into strategy, risk management and the product lifecycle. The Board ensures it has access to the skills and expertise needed to oversee sustainability matters and address Novo Nordisk’s material sustainability IROs during the reporting period. 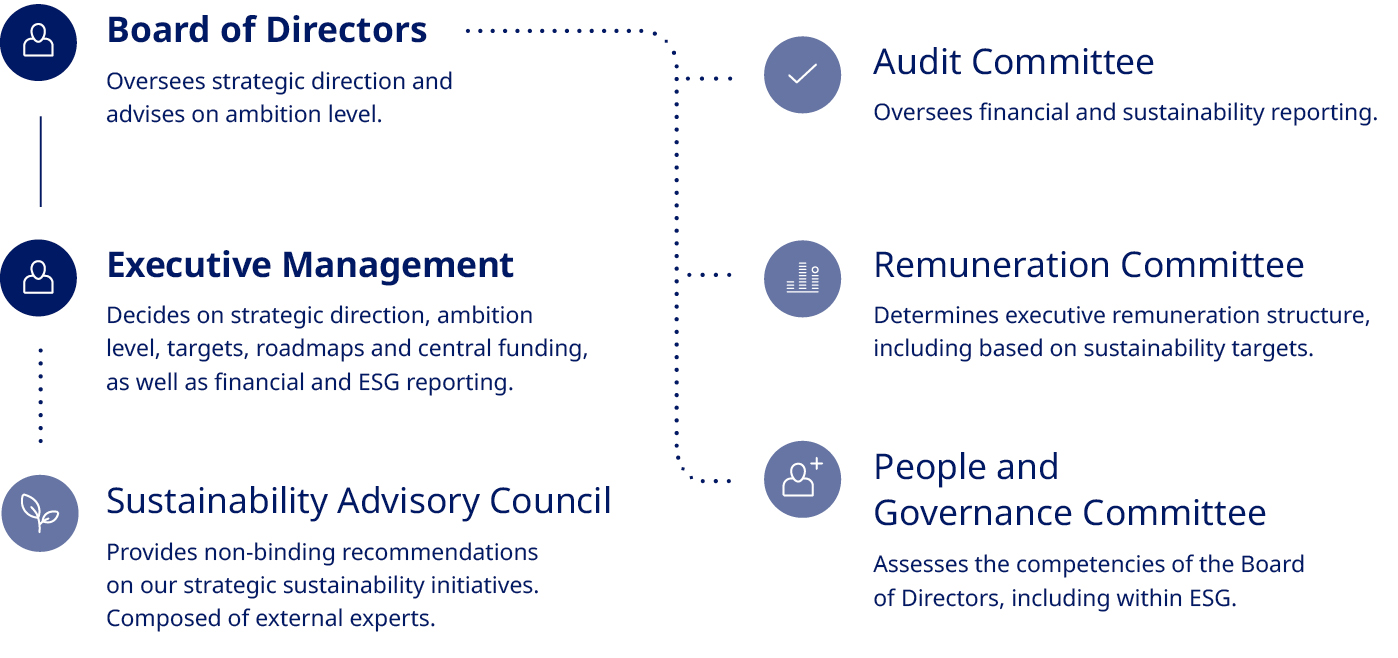 | |||
– – – | 41 |
Risk management | |||
Risk-taking is integral to our business, and we are exposed to both risks that are inherent to the pharmaceutical industry and specific to our business. 2025 has been an exceptional year, exposing Novo Nordisk to unprecedented geopolitical, macroeconomic and competitive pressures. Through systematic risk management, we have maintained a risk profile proportionate to our innovation ambitions and long-term commitments. While we do not compromise on product quality, business ethics, and safety of our patients and employees, we recognise that there are other risks that cannot be fully mitigated and must be accepted to enable business successes that make a difference and maximise societal value. As part of our integrated approach to risk management, we identify, assess and mitigate risks across short and long horizons. This enables us to address risks to our short- and medium-term plans and risks that could hinder the long- term realisation of our corporate strategy. Executive Management and the Board of Directors review Novo Nordisk’s enterprise-wide risk profile quarterly, which focuses on the most significant risks based on likelihood and impact, including potential financial loss or reputational damage. Complementing this, sustainability risks from the double materiality assessment in the Sustainability statement are also considered. The key risk themes below outline our broad areas of exposure, followed by key risks and mitigations, which detail specific risks, potential impacts and mitigation actions. Key risks themes Innovation and competition Novo Nordisk is exposed to portfolio dependency with multiple brands relying on semaglutide as the active pharmaceutical ingredient. To remain competitive in the long-term and thereby mitigate the innovation risk, we invest in internal and external pipeline opportunities, as well as effectively attracting talent to continue providing patients with innovative treatments. Geopolitical uncertainty Conflicts, geopolitical tensions and social unrest represent a volatile landscape, leading to risks of trade restrictions. Most notably, the US administration continues to assess a range of trade actions affecting US imports, including tariffs and reference pricing measures which may continue targeting pharmaceuticals, with potential spillover effects to other countries. We navigate this uncertainty by monitoring developments, engaging in policy making and diversifying our supply chain. Healthcare reform Some governments are adopting changes to their pharmaceutical frameworks, increasing system complexity and regulatory uncertainty. This may increase price pressure and affect profitability. We continuously educate healthcare providers about the value and benefits of our products and engage with policymakers and stakeholders, to communicate potential consequences of healthcare reform to the innovative life science environment. | Commercialisation Complex market dynamics and intensified competition from branded and generic competitors and compounders lead to risks of price pressure, lowered sales volumes and supply rebalancing. We address this by generating robust clinical and real world evidence to substantiate product value and negotiating with payers to secure access and reimbursement. In parallel, a more consumer driven market introduces risks related to direct to consumer marketing, new capability requirements and brand reputation. We manage these risks by investing in consumer engagement, telehealth channels and partnerships, building necessary competencies and actively monitoring consumer trends. Production capacity and supply chain risks Demand fluctuations, resource shortages, geopolitical instability, trade disputes and local manufacturing requirements strain global supply chains. Furthermore, expanding production capacity is complex and associated with long lead times. We continuously evaluate and manage investments in our production capacity and supply chain to mitigate this risk. Access and affordability Access to affordable care is a global issue as healthcare systems struggle to provide quality care at a sustainable cost, while the burden of chronic diseases keeps rising. Ensuring access and affordability is a risk and responsibility Novo Nordisk shares with all stakeholders involved in healthcare. We continue to scale capacity to meet patient demand, broaden access to medicines and meet our social responsibilities. Digital disruption New digital technologies offer opportunities to deliver greater value and improve patient outcomes but also risk disruption by intensifying competition through accelerated and enhanced drug discovery and development. To remain competitive, we continuously innovate and integrate these technologies into our processes. Ethics and compliance Our commitment to ethics and compliance remains central to our operations. This is essential to navigate a rapidly evolving regulatory landscape, which may affect product approvals, market access, pricing and product liability. Our values, encapsulated in the Novo Nordisk Way and our code of conduct, guide every decision we make and enable us to maintain integrity, adhere to ethics and compliance standards and fulfil our purpose effectively. Environmental impact Novo Nordisk’s expansion efforts significantly increase our greenhouse gas emissions. We address this challenge through our Circular for Zero strategy. This includes an increased focus on our global emissions, encompassing scope 3 emissions, as well as assessing, monitoring and mitigating environmental risks across the value chain. | ||
– – – | 42 |
Risk management (continued) | ||||||||||
Key risks and mitigations | ||||||||||
Risk area | Description | Impact | Mitigating actions | 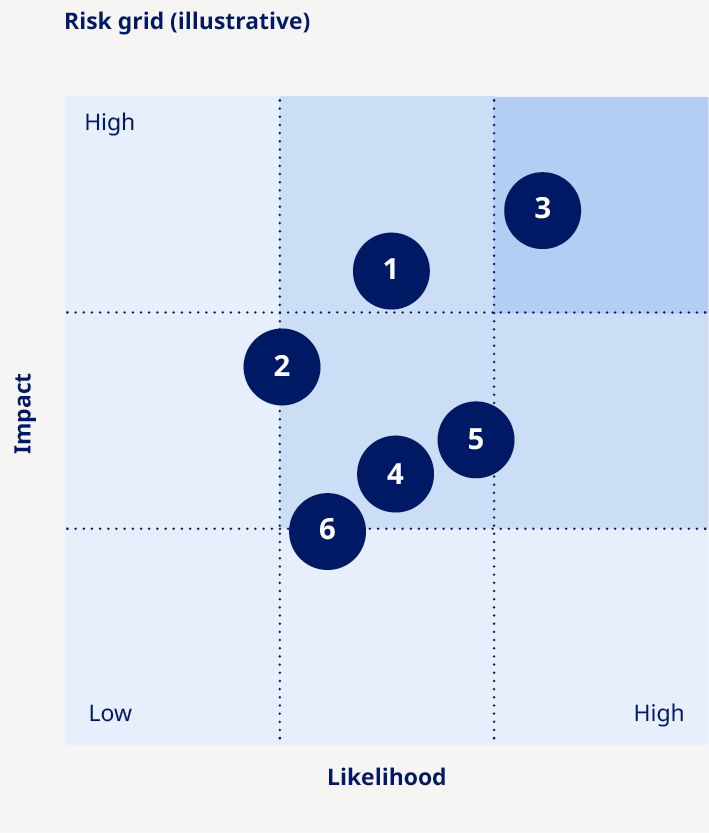 | ||||||
 Research and clinical pipeline risks | Findings in clinical activities, regulatory processes or misjudging of commercial potential, leading to delays or failure of products in the pipeline. | •Patients would not have access to innovative treatment options. •Could adversely impact sales, profits and market position. | •Pre-clinical and clinical activities to demonstrate safety and efficacy. •Consultations with regulators to review pre-clinical and clinical findings and obtain guidance on development path. •Rigorous market assessment to validate potential and inform development decisions. | |||||||
 Product supply, quality and safety risks | Higher-than-expected demand or disruption of product supply due to, e.g., geopolitical instability or quality issues, may compromise product availability, ultimately impacting patients and representing a lost commercial opportunity. In addition, there could be risks related to safety and product liability. | •Product shortages could have potential implications for patients. •Could jeopardise reputation and licence to operate if regulatory compliance is not ensured. •Compromised patient safety and exposure to product liability legal proceedings. •Could diminish trust in Novo Nordisk, impacting our reputation. •Could have an adverse impact on sales, profits and market position. | •Optimising global production and safety stock to reduce supply risk. •Planning and management of supply chain. •Regular quality audits of internal units and suppliers to document Good Manufacturing Practice (GMP) compliance. •Identification and correction of root causes when issues are identified. If necessary, products are recalled. | |||||||
 Commercial- isation risks | Competitive pressures and market dynamics (e.g., generics and compounding), as well as geopolitical, macroeconomic or healthcare crises, reduce payer ability and willingness to pay and ultimately lower prices and volumes. | •Market dynamics could impact price levels and patient access. •Could adversely impact sales, profits and market position. | •Innovation of novel products, clinical trial data and real-world evidence demonstrate added value of new products. •Payer negotiations to ensure improved patient access. •Increased and new access and affordability initiatives. | |||||||
 IT security risks | Disruption to IT systems, such as cyber- attacks or infrastructure failure, resulting in business disruption or breach of data confidentiality. | •Could limit our ability to produce and safeguard product quality. •Could compromise patients’ or other individuals’ privacy. •Could limit our ability to maintain operations or limit future business opportunities if proprietary information is lost. •Could have an adverse impact on sales, profits and market position. | •Proactive company-wide information security awareness initiatives. •Continuity plans for non-availability of IT systems. •Company-wide internal audit of IT security controls. •Detection and protection mechanisms in IT systems and business processes. | |||||||
 Financial risks | Exchange rate fluctuations (mainly in USD, CNY and JPY), geopolitical risks (e.g., tariffs), disputes with tax authorities and changes to tax legislation and interpretation. | •Could lead to tax adjustments, fines and higher-than-expected tax level. •Could adversely impact sales and profits. •Geopolitical developments could lead to an increase in corporate taxes and duties. | •Hedging for selected currencies. •Integrated treasury management. •Applicable taxes paid in jurisdictions where business activity generates profits and multi-year Advance Pricing Agreements with tax authorities. | |||||||
 Legal, patents and compliance risks | Breach of legislation, industry codes or company policies. Competitors asserting patents against Novo Nordisk or challenging patents critical for protection of commercial product and pipeline candidates. | •Potential exposure to investigations, criminal and civil sanctions and other penalties. •Could compromise our reputation and the rights and integrity of individuals involved. •Could lead to unexpected loss of exclusivity for, or injunctions against, existing and pipeline products. •Could have an adverse impact on sales, profits and market position. | •Code of Conduct integrated in our business. •Compliance Hotline in place. •Legal review of key activities and internal audit of compliance with business ethics standards. •Internal controls to minimise vulnerability to patent infringement and invalidity actions. | |||||||
 | |||||
Sustainability statement | |||||
Sustainability statement contents | |||||||
Sustainability statement reading guide Our Sustainability statement is structured into three chapters: ‘General information’, ‘Prioritised topics’ and ‘Other material topics’ plus 'Additional Sustainability statement information' as an appendix. The majority of ESRS disclosures can be found in these sections with additional ESRS 2 disclosures addressed in the Annual review, Corporate Governance Report and Remuneration Report through incorporation by reference (see Table 4 in the Additional Sustainability statement information, p. 134). Novo Nordisk has updated the Double Materiality Assessment (DMA) in 2025 taking the point of departure in the ESRS standards across Social, Environment and Governance (see illustration below). The DMA resulted in four ’Prioritised topics’, which are those that 1) are double-material, 2) have scored the highest in our DMA and 3) are linked to our Strategic Aspirations (see p. 13). This is where we focus our sustainability efforts and where we can make the greatest difference for our patients, employees, the environment and our business. Moreover, we have 'Other material topics', which are those that are double-material (E3 and G1) or single-material (E4, E2 and S2) related to sustainability commitments beyond our strategic topics, where we take targeted action to enable a resilient, responsible and sustainable business. More information on how we work with sustainability in Novo Nordisk is provided on the following page. The Sustainability statement has been structured with the ‘Prioritised topics’ presented first followed by ‘Other material topics’. This sequencing is intended to guide readers to the most decision-relevant topics quickly and to improve clarity for readers who prioritise strategic sustainability topics.  | |||||||
General information | |||||||
1.1 | 45 | ||||||
1.2 | 47 | ||||||
1.3 | 48 | ||||||
1.4 | 49 | ||||||
2. | 51 | ||||||
3. | 57 | ||||||
4. | 63 | ||||||
5. | 68 | ||||||
6. | 71 | ||||||
7. | 72 | ||||||
8. | Pollution | 74 | |||||
9. | Business conduct | 75 | |||||
10. | EU Taxonomy | 80 | |||||
Table 1 - Sustainability statement policy overview | 132 | ||||||
133 | |||||||
134 | |||||||
Table 4 - List of incorporation by reference | 134 | ||||||
135 | |||||||
– – – | 45 |
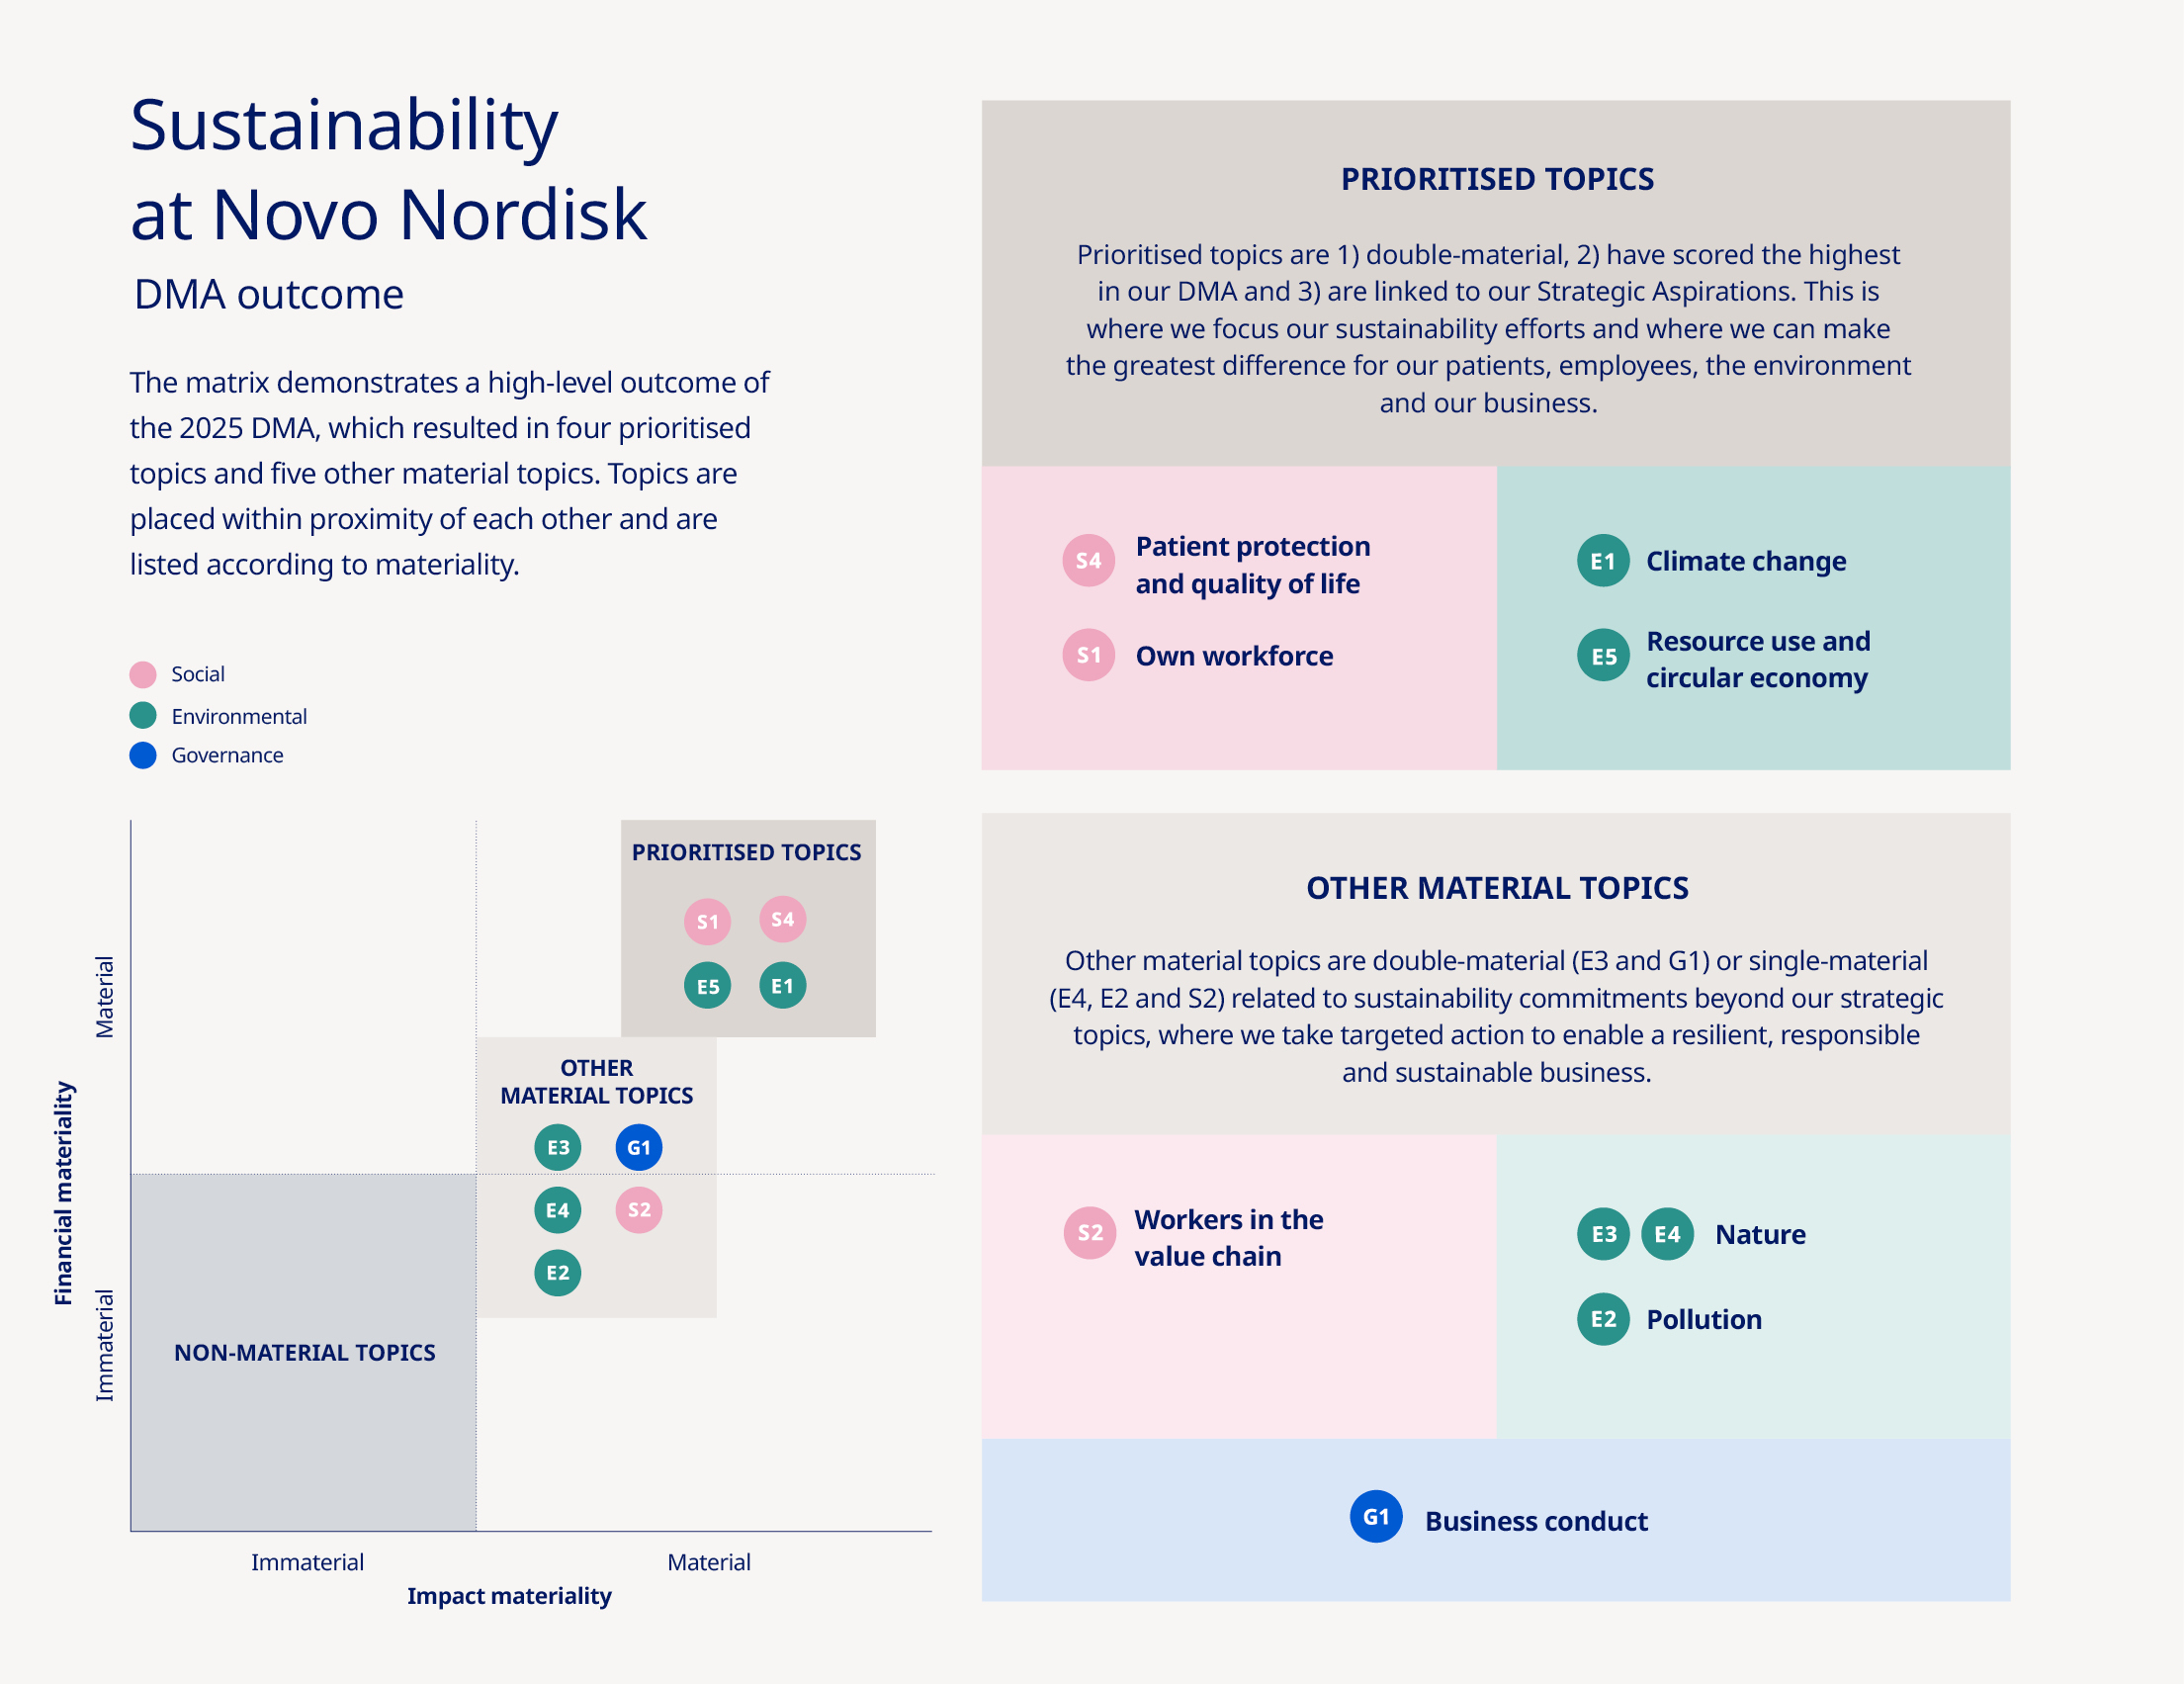

Core elements of environmental and social due diligence | Pages | |
a) | Embedding due diligence in governance, strategy and business model | 40, 47-49, 134 |
b) | Engaging with affected stakeholders in key steps of due diligence | 48, 52, 55, 57, 71, 75-77, 134 |
c) | Identifying and assessing adverse impacts | 48-51, 57, 63, 68, 71-72, 74, 75 |
d) | Taking actions to address those adverse impacts | 52-56, 58-60, 64-65, 68-69, 71, 73, 74, 77 |
e) | Tracking effectiveness of these efforts and communicating | 52-54, 56, 58-61, 64-66, 69-71, 73, 74, 76-78 |
Updated reporting structure The reporting structure for 2025 has changed compared to 2024. Whilst acknowledging the prescribed structure in the ESRS (see visualisation on p. 44), the Sustainability statement now presents the prioritised topics first, followed by other material topics to guide readers to the most material, decision-relevant topics first. Basic information and references within the Sustainability statement Scope of consolidation and organisational boundaries •Scope is the same as the Consolidated Financial Statements. •For GHG emissions and pollution the operational scope is defined based on financial control. •NNE is excluded from 'Own workforce' policies, actions and targets as it operates under a different business model and thereby follows own processes. Value chain inclusion •Material IROs across our own operations and the up- and downstream value chain are addressed. •The inclusion of our value chain in policies, actions and targets is determined by our double materiality assessment. •A visualisation of our value chain is provided in the section 'Value creation' on p. 10. Incorporation by reference •See Table 4 in 'Additional Sustainability statement information' on p. 134. | ||
Stakeholder group | Purpose and engagement channels | Examples of how outcomes are taken into account | |
 | Patient organisations, healthcare professionals and healthcare organisations | We take a patient-centred business approach to improve prevention, detection, treatment and access to quality care for people living with serious chronic diseases. We deliver on these efforts through for example research collaborations, clinical trials, conferences and scientific and medical communications. | •Development of new treatments and product improvements, see section '2.1 Innovation' p. 52 •Protecting the quality and safety of our products and product communication, see '2.3 Patient protection' on p. 55 |
 | Employees | We strive to continuously improve the health and safety of our employees, as well as provide equitable opportunities and competitive working conditions, in order to attract and retain talent. Interests and views are obtained via our annual employee survey, individual career development, workers’ councils, Novo Nordisk Way facilitations, the Ombudsman function, etc. | •Foster a culture of safety with attention to increasing employee health and total wellbeing, including new measures to address symptoms of stress, see '3.2 Health and safety' p. 59 •Update of our Global strategy on Diversity, Equity, Inclusion and Belonging to leverage our differences and further drive innovation, see '3.3. Equal treatment and opportunities for all' p. 60 |
 | Suppliers and third-party representatives | We depend on suppliers and third-party representatives, for example when purchasing goods and services to manufacture or distribute products and and when partnering on activities such as filling or assembling final products or performing clinical trials. Our Responsible Sourcing Programme, supplier audits and established contracting processes drive our engagement. | •Integration of responsible sourcing principles into contracts with our business partners, see 'Workers in the value chain' p. 71 •Partnering with suppliers on low-carbon materials and feedstocks, see actions in section 4 'Climate change' p. 65 |
 | Governments, public officials and regulators | We advance public health issues and ensure early awareness of regulatory developments and standards by organising and sponsoring events, engaging with industry associations and driving bilateral dialogues with local, national and international agencies and authorities. | •Advocacy on issues related to therapy areas that can help address global health challenges, see '9.4 Political influence and lobbying activities' p. 77 |
 | Partners and peers | We seek perspectives from partners and peers to advance our commitments, with the aim of having long-term impacts and improving the resiliency of systems and communities that we are a part of. We take a multi-level approach to partnerships and collaborate with different actors such as NGOs, academia and other industry partnerships across our social and environmental efforts. | •Prevent childhood obesity through UNICEF partnership and reduce risk of lifetime cardiometabolic diseases through the Childhood Obesity Prevention Initiative with partners such as cities and academic institutions, see '2.2 Social responsibility: prevention and access', p. 53. •Advance our environmental commitments, for example through partnerships on lower carbon plastics, see 'Resource use and circular economy' p. 68 |
 | Investors | We strive to provide timely, accurate and transparent information to our investors through engagements such as Capital Markets Day, the Annual General Meeting, ESG rating providers and recurring engagement in response to investor queries. | •Improved sustainability disclosure transparency through investor feedback. •Learnings from engagement with ESG rating providers to improve ESG performance, see latest performance in margin to the right. |
Performance of ESG ratings and rankings Novo Nordisk’s sustainability performance is recognised by multiple global ESG rating agencies. Below are the latest 2025 recognitions on our prioritised ESG ratings:  CDP B (Climate Change) B (Water Security) On a scale from A-D  MSCI ESG ratings A On a scale from AAA-CCC  Corporate Knights Global 100 51 Among 100 most sustainable companies  Access to Medicine Index 12 Out of 20 largest pharma companies  Sustainalytics Low risk On a scale from negligible to severe risk | ||
Prioritised topics | ||||
 | Patient protection and quality of life | |||
 | Own workforce | |||
 | Climate Change | |||
 | Resource use and circular economy | |||
Other material topics | ||||
 | Workers in the value chain | |||
  | Nature | |||
 | Pollution | |||
 | Business conduct | |||
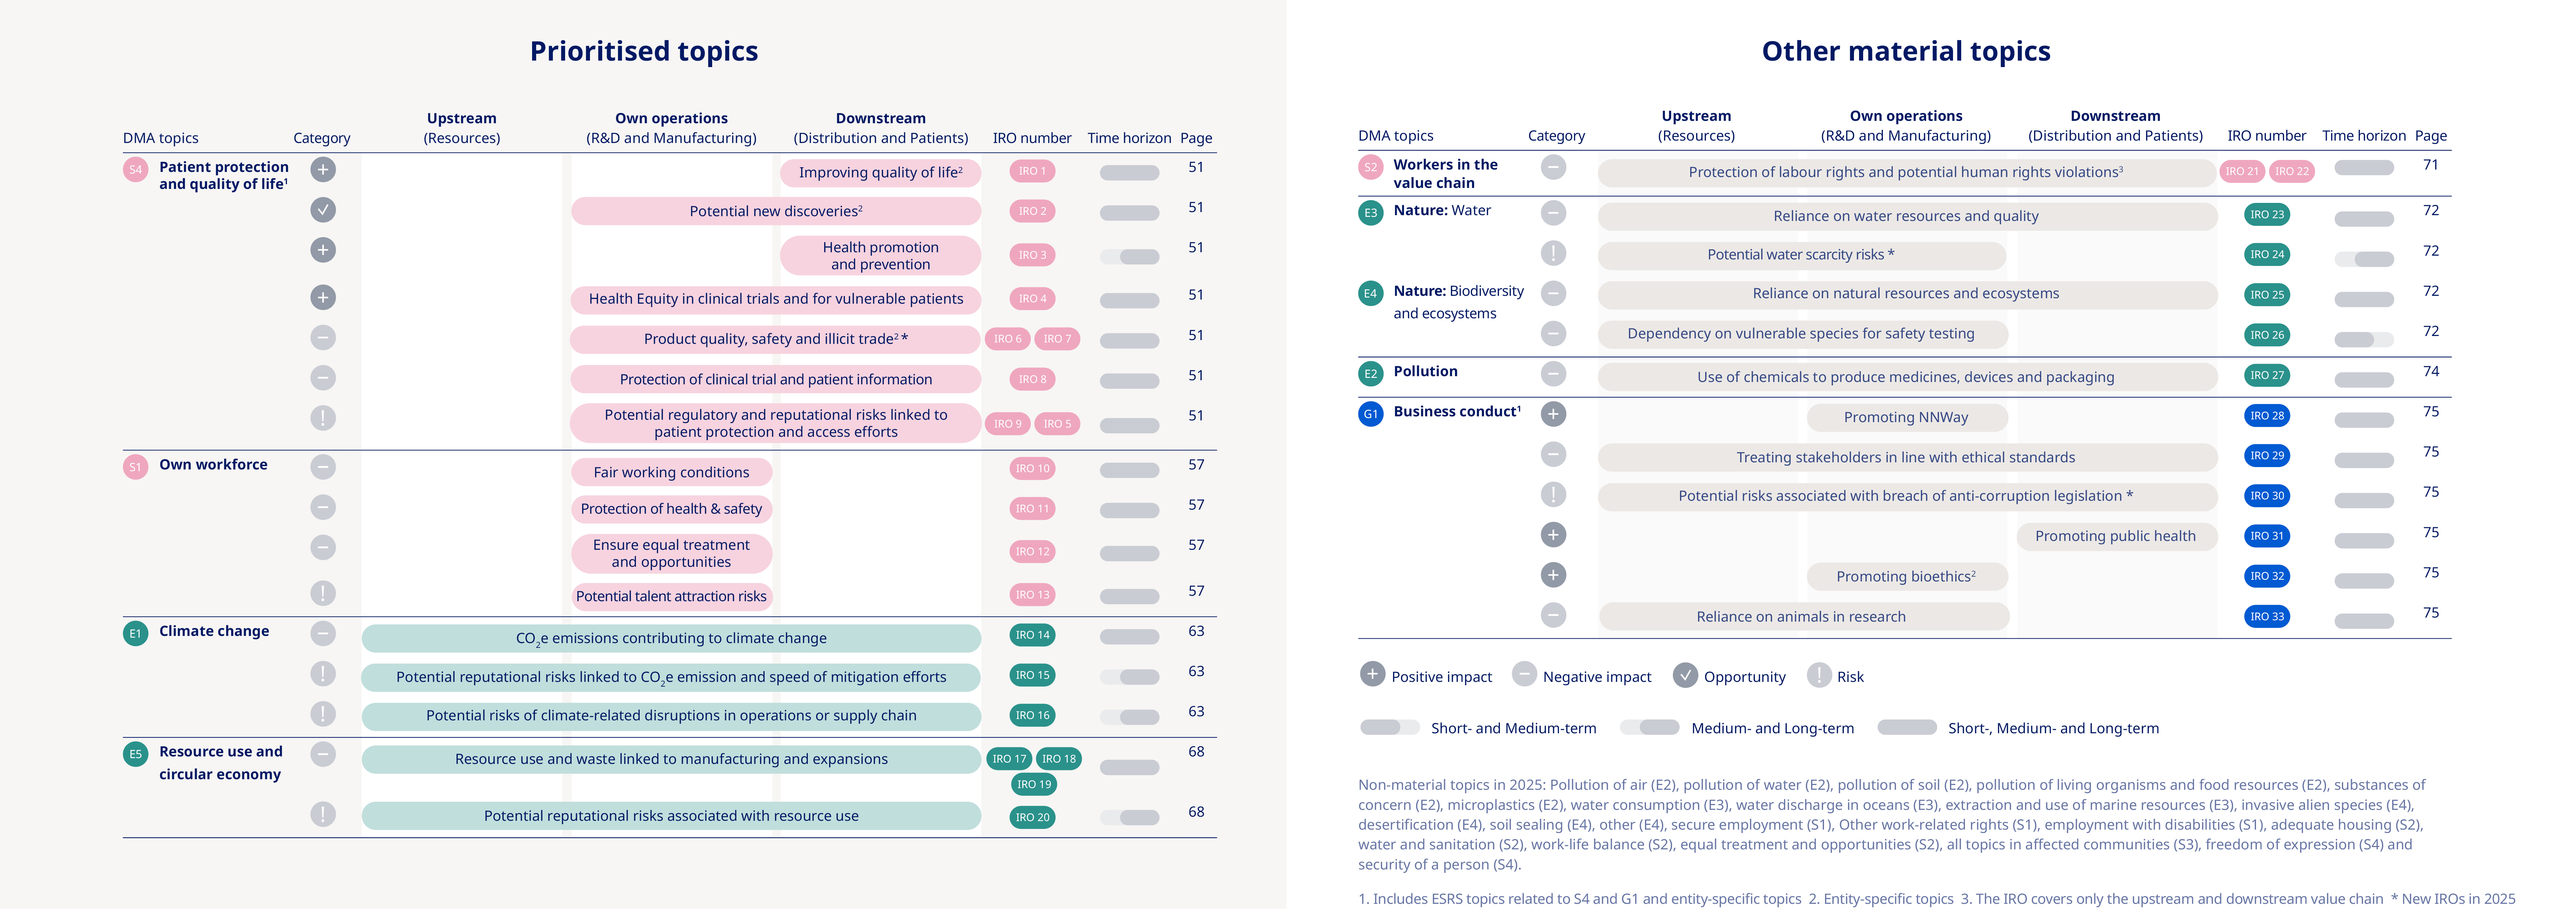
– – – | Novo Nordisk Annual Report 2025 / Sustainability statement / Prioritised topics / 2. Patient protection and quality of life | 51 | |
Prioritised topics | ||||
 | Patient protection and quality of life | |||
 | Own workforce | |||
 | Climate Change | |||
 | Resource use and circular economy | |||
Ambition Being respected for adding value to society Policy https://www.novonordisk.com/ content/dam/nncorp/global/en/ sustainable-business/pdfs/esg-portal/ Cover_Code_of_conduct.pdf (The contents of the company's website do not form a part of this Form 6-K) https://www.novonordisk.com/ content/dam/nncorp/global/en/ sustainable-business/pdfs/esg-portal/ novo-nordisk-human-rights- commitment-2022.pdf (The contents of the company's website do not form a part of this Form 6-K) Performance Patient reach for obesity and diabetes products remained at a similar level to 2024 Sub-topics Patient protection and quality of life is addressed in three sub-topics: •Innovation •Social responsibility •Patient protection | ||||
IRO name | Category | Sustainability topic | Value chain location | |
 | Improving quality of life |  | •Innovation | •Downstream |
 | Potential new discoveries |  | •Own operations •Downstream | |
 | Health promotion and prevention | | •Social responsibility: prevention and access | •Downstream |
 | Health equity in clinical trials and for vulnerable patients | | •Own operations •Downstream | |
 | Potential reputational risks related to access efforts |  | •Own operations | |
 | Product quality and safety, including clinical trials |  | •Patient protection | •Own operations •Downstream |
 | Protection of patient safety against illicit trade of our medicines | | •Downstream | |
 | Protection of clinical trial and patient information | | •Own operations •Downstream | |
 | Potential regulatory and reputational risks linked to patient protection and clinical trial participants | | •Own operations •Downstream | |
 | ||||
2.1.1 Patients reached with obesity and diabetes care products (Number in millions) 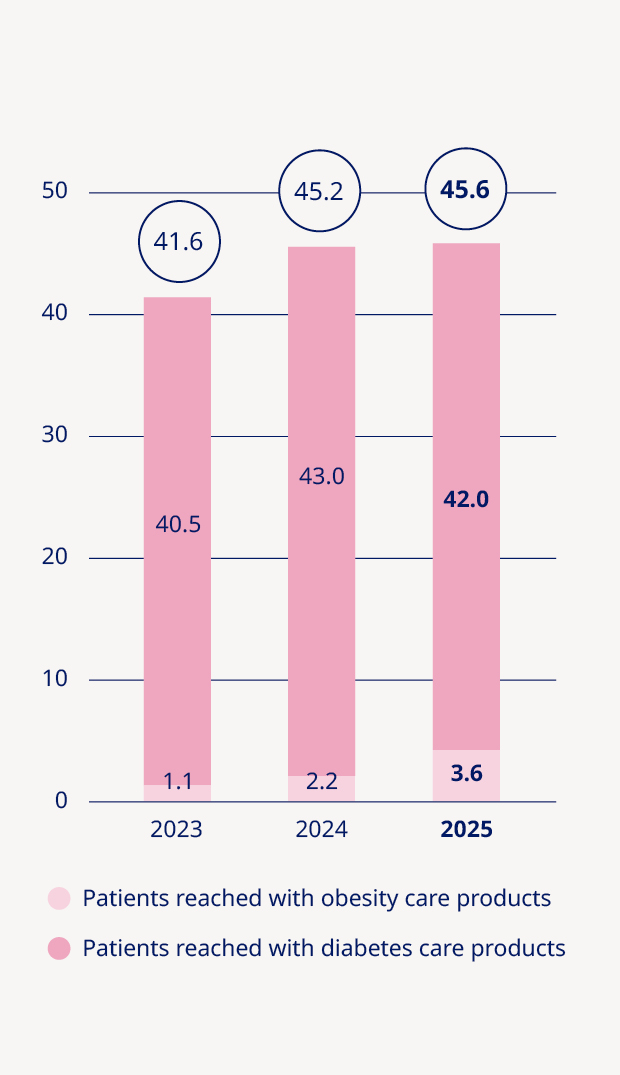 |
2025 actions | |
| Partnership with UNICEF •Prevent childhood overweight and obesity by fostering healthy environments through policy change, advocacy and innovation in food and urban systems. •Countries with direct programmatic activities: Brazil, Columbia, Mexico and Indonesia. •From June 2024 - June 2025, more than 468,000 children under the age of 19 benefited from UNICEF’s local programmatic activities. |
Communities for Better Health •Prevent chronic diseases in vulnerable populations in the US by funding partners across 27 US states and Washington D.C., supporting initiatives that address food-related social determinants of health. •From August 2024 - September 2025, we invested over USD 20 millions in 29 projects, and our partners served up to 280,000 community members. |
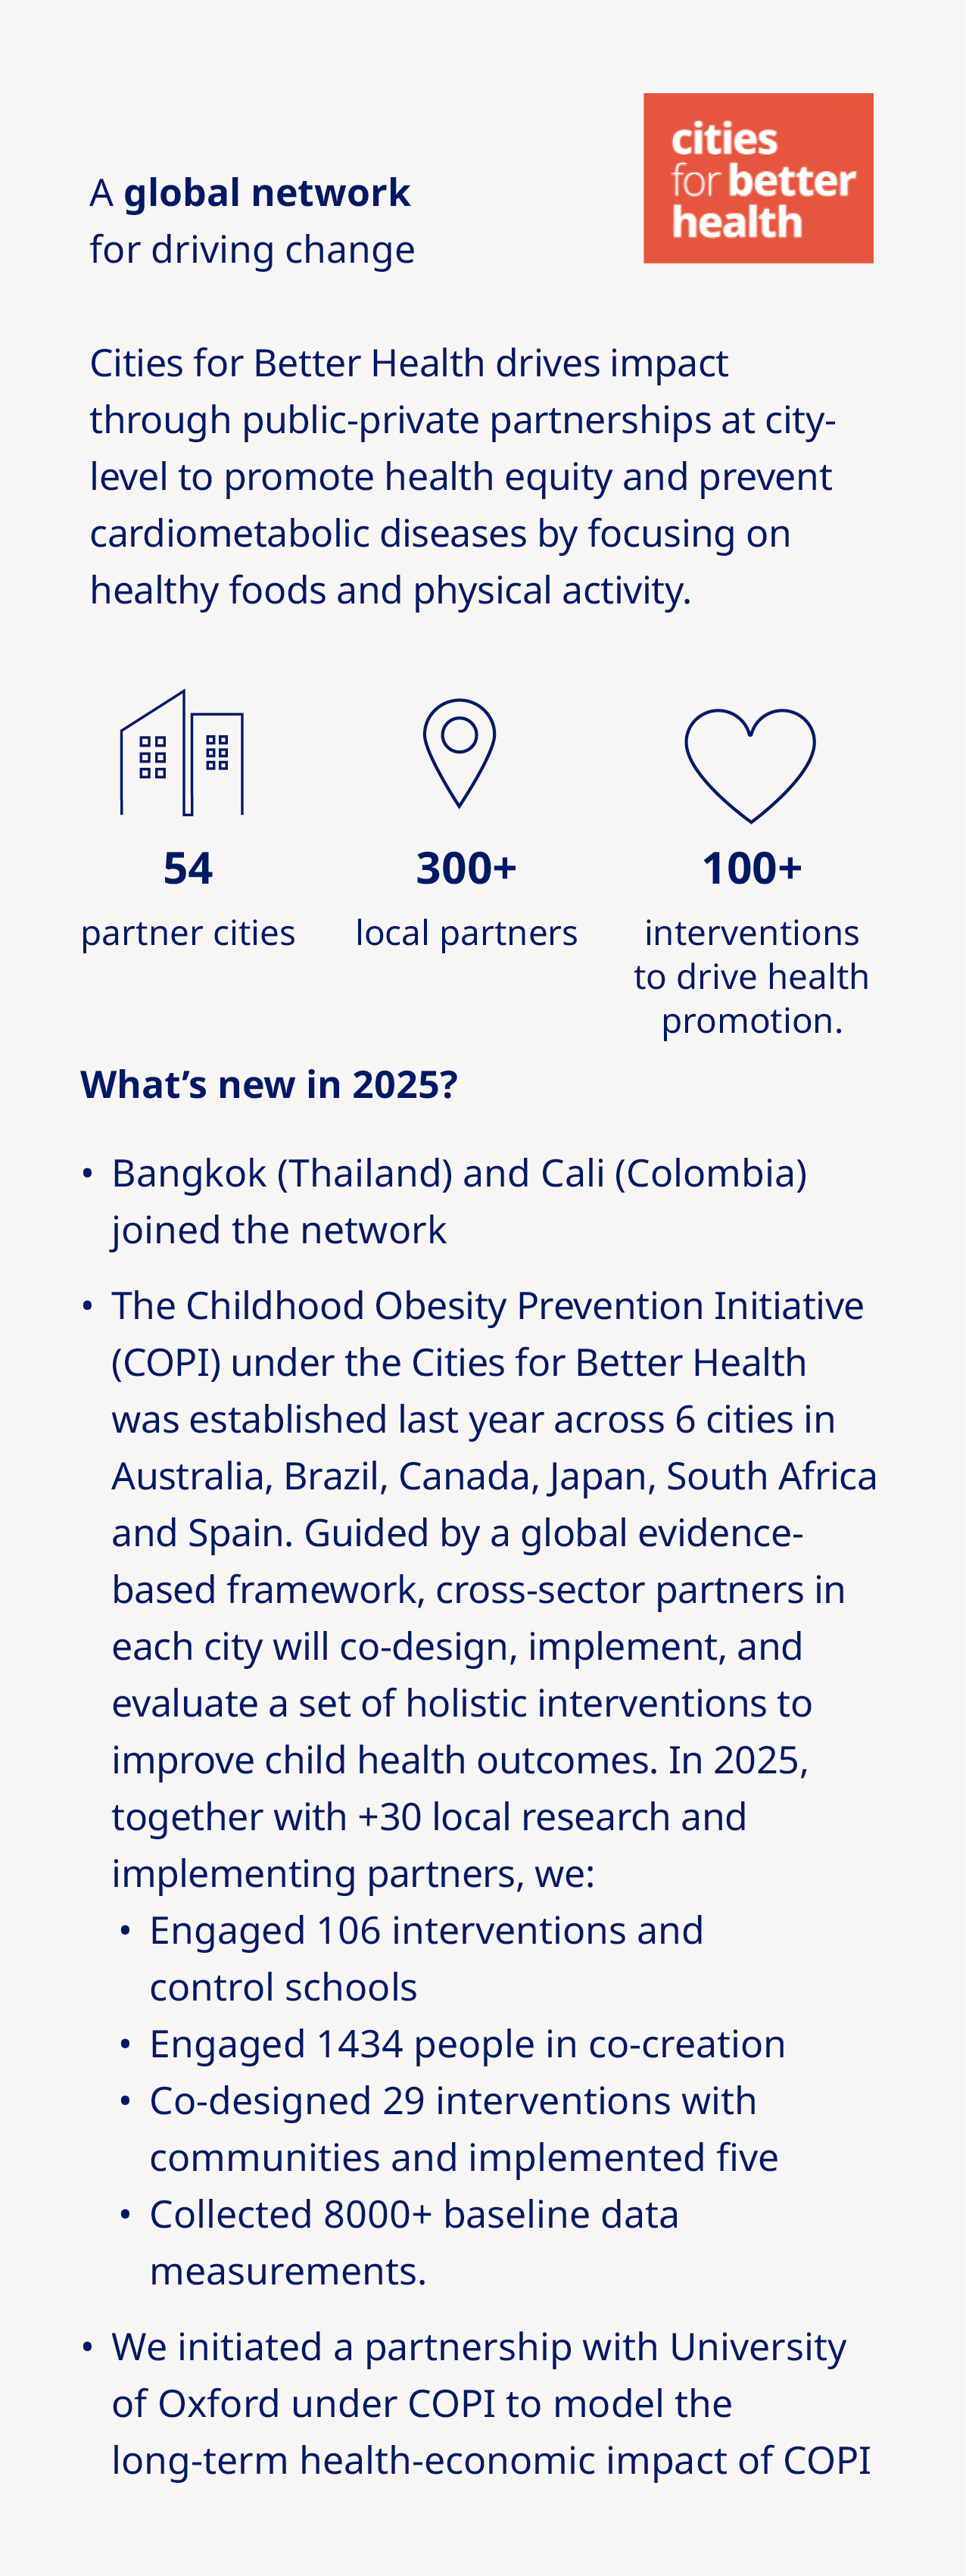
2025 actions | |
| Changing Diabetes® in Children •Provide diabetes care to children and youth with type 1 diabetes living in LMICs. This can include life-saving medicine, blood glucose monitoring equipment and medical supplies. •Target: 100,000 children by 2030. •Metric: 2.2.1 |
iCARE Integrated Business Model •Improve access to cardiometabolic care for vulnerable populations by embedding social responsibility into commercial objectives of affiliates guided by four pillars: capacity, affordability, reach and empowerment. •It includes 49 countries in sub-Saharan Africa and Indonesia. •2024 Action on Access Innovation Incubator has been integrated into the iCARE model •In 2025, Indonesia implemented the iCARE model, which is now evolving into a holistic, cross-therapy approach in existing markets. •Metric: 2.2.3 | |
Human Insulin Thermal Solutions (HITS) •Develop new flexible storage options for two human insulin products: Actrapid® and Insulatard®, to provide access to care for people with diabetes in settings where refrigeration is a challenge. •In 2025, the accumulated number of label updates for Actrapid® and Insulatard® reached more than 40 countries, informing users of the new storage options. The ambition is to reach more than 50 countries, where the products are launched. •Metric: 2.2.3 |
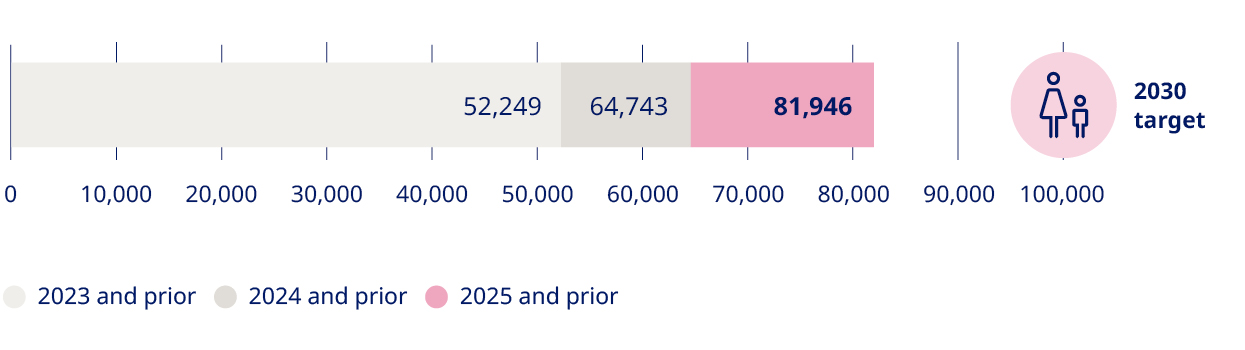
2.2.2 Donations and other contributions | |||
mDKK | 2025 | 2024 | 2023 |
World Diabetes Foundation (WDF) | 121 | 120 | 119 |
Novo Nordisk Haemophilia & Haemoglobinopathies Foundation (NNHF)1 | 29 | 26 | 19 |
Total donations and other contributions | 150 | 146 | 138 |
1. Previously reported as Novo Nordisk Haemophilia Foundation (NNHF). | |||
2.2.3 Vulnerable patients reached with diabetes care products (Number in millions) 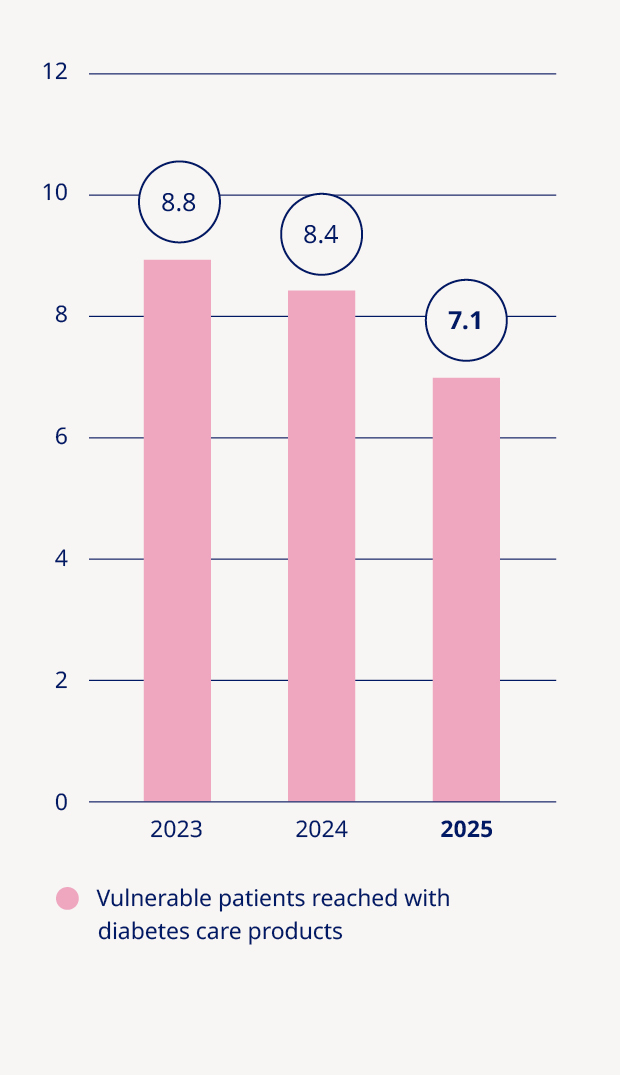 |
Illicit trade •Illicit trade encompasses a range of criminal activities including: •Counterfeiting •Illicit diversion •Illicit compounding •These practices pose serious threats to patient safety, public health and business integrity. Policies and approach •Management of illicit trade is anchored in our OneCode policy and covered in our standard operating procedures and quality management system. •Our Prevent, Detect and Respond strategy outlines how we address potential adverse impacts of illicit trade e.g., educating global communities, driving efforts to reinforce regulations, maintaining supply chain integrity, detecting illegal products via patient/HCP complaints, field and online monitoring and responding to cases by reporting these to authorities and taking legal action, when relevant. •Our positions on https:// www.novonordisk.com/content/ dam/nncorp/global/en/sustainable- business/pdfs/esg-portal/ sustainability-statement/2025/ Position_on_falsified_medicines.pdf (The contents of the company's website do not form a part of this Form 6-K) and https:// www.novonordisk.com/content/ dam/nncorp/global/en/sustainable- business/pdfs/esg-portal/ sustainability-statement/2025/ Our_position_on_illicit_compoundin g_of_semaglutide.pdf (The contents of the company's website do not form a part of this Form 6-K) provides further details on our principles. Actions •We have increased detection and takedowns of fraudulent online offers by expanding the scope of our proactive monitoring to address illicit trade risks. As a member of the Pharmaceutical Security Institute, Novo Nordisk also contributes to joint industry action. | ||
2025 actions | |
| Capability building for combatting illicit trade •We delivered targeted awareness sessions in most affected markets, training more than 1,500 law enforcement and customs officials. •Internally, over 2,000 employees responsible for incidents response were trained to report to authorities and ensure proactive engagement with regulators. •As a measure of effectiveness, an increase in law enforcement vigilance and information sharing was observed. |
| Patient data protection and AI •Enhance data ethics risk management across our processes, supplier interactions and use of AI technologies. The scope is global for relevant suppliers, systems and processes. •New AI clauses in contract templates were implemented, and the Data Protection Impact Assessment was refined across projects to 1) identify patient data protection risks and 2) implement actionable measures to mitigate these. |
Patient-centric lay language documents •Obtain and implement patient insights on our communication in lay language to enhance the comprehension and accessibility of clinical trial information. •Lay language documents in clinical reporting were in scope for feedback from the established Innovation Patient Advisory Board. Based on the insights, relevant template updates will be rolled out in 2026. | |
e-labelling •Develop e-labelling to provide an additional channel for accessing labelling information and allowing for faster access to labelling updates (e.g., safety information updates) for end-users. e-labelling is applied in mandated or accepted markets. •In 2025, a global process for e-labelling was implemented. |
2.3.1 Product recalls and failed inspections | |||
Number | 2025 | 2024 | 2023 |
Product recalls | 4 | 3 | 2 |
Failed inspections | 1 | 0 | 0 |
Prioritised topics | ||||
| Patient protection and quality of life | |||
| Own workforce | |||
| Climate Change | |||
| Resource use and circular economy | |||
Ambition Being recognised as a sustainable employer Policy https://www.novonordisk.com/ content/dam/nncorp/global/en/ sustainable-business/pdfs/esg- portal/labour-code-of-conduct.pdf (The contents of the company's website do not form a part of this Form 6-K) https://www.novonordisk.com/ content/dam/nncorp/global/en/ sustainable-business/pdfs/esg- portal/sustainability- statement/2025/ Health_and_safety.pdf (The contents of the company's website do not form a part of this Form 6- K) https://www.novonordisk.com/ content/dam/nncorp/global/en/ sustainable-business/pdfs/esg- portal/sustainability- statement/2025/ Diversity_and_inclusion_policy.pdf (The contents of the company's website do not form a part of this Form 6-K) Performance •Gender distribution in Senior Leadership was 56:44 (men/women) •The LTIR remained on par with the 2024 level Sub-topics: Own workforce is addressed in the following three sub-topics: •Working conditions •Health and safety •Equal treatment and opportunities For more information on our Compliance Hotline, see section 9.2 on p. 76 | ||||
IRO name | Category | Sustainability topic | Value chain location | |
 | Fair working conditions | | •Working conditions | •Own operations |
 | Protection of health and safety | | •Working conditions | •Own operations |
 | Ensure equal treatment and opportunities | | •Equal treatment and opportunities | •Own operations |
 | Potential talent attraction risks | | •Working conditions •Equal treatment and opportunities | •Own operations |
| ||||
3.1.1 Characteristics of Novo Nordisk’s employees1 | |||
Number | 2025 | 2024 | 2023 |
Total number of employees (FTEs)2 | 68,794 | 73,109 | 63,370 |
Total number of employees (headcount)2 | 69,505 | 74,156 | 64,319 |
•Men | 35,453 | 37,416 | – |
•Women | 33,992 | 36,711 | – |
•Other/ not reported | 60 | 29 | – |
Country by country3 | |||
•EUCAN (Europe and Canada) | 39,004 | 42,308 | 35,402 |
•Hereof Denmark | 29,613 | 34,185 | 28,692 |
•USA | 9,961 | 8,829 | 7,869 |
•APAC (Japan, Korea, Oceania and Southeast Asia) | 8,862 | 9,953 | 8,806 |
•Region China (Mainland China, Hong Kong and Taiwan) | 6,188 | 6,977 | 6,485 |
•Emerging Markets (Latin America, the Middle East and Africa) | 5,490 | 6,089 | 5,757 |
Number of leavers | 13,274 | 3,574 | – |
Employee turnover | 18.4% | 5.5% | 5.5% |
1. All 2024 employee related metrics exclude Catalent. 2. 2024 figures: FTE and headcount are excluding Catalent. Including Catalent, FTE is 76,302 and headcount is 77,349. 3. Geographical split has been reorganised to align with the geographical regions applied throughout the Annual report. Hence 2024 and 2023 figures have been restated. | |||
3.1.2 Enterprise Evolve score | |||
Favorable % score | 2025 | 2024 | 2023 |
Enterprise Evolve score | 84 | 85 | 86 |
3.1.3 Incidents and complaints | |||
Number | 2025 | 2024 | 2023 |
Substantiated people-related cases | 175 | 167 | – |
•Hereof substantiated cases of harassment, including discrimination | 150 | 139 | – |
Amount of material fines, penalties and compensation related to the above-mentioned incidents (mDKK) | – | – | – |
2025 actions | |
| Protecting psychological safety •An enterprise-wide psychological safety concept was developed for all employees globally, with tools, frameworks, processes and awareness training in place. •In 2025, external vendors offering classes and workshops to support the psychological safety journey of employees were identified. •Metric: 3.2.1 (see table to the right) |
Executing safely on construction and expansion projects •Introduced a construction safety standard for high-risk activities identified in 2024 mapping, rolled out across major construction projects. •A 2025 gap analysis, supported by independent consultants, guided site improvements. •Metric: 3.2.1 (see table to the right) |
3.2.1 Health and safety (own employees) | |||
Number | 2025 | 2024 | 2023 |
Recordable work-related lost time injuries | 182 | 173 | 153 |
Lost time injury rate (LTIR) (ppm) | 1.2 | 1.2 | 1.3 |
Fatalities as result of work-related lost time injuries, incl. other workers working on Novo Nordisk sites | 0 | 0 | 1 |
Employees reporting symptoms of stress | 14.0% | 13.8% | 13.8% |
Employees reporting symptoms of work-related physical pain | 6.7% | 6.8% | 7.1% |
Workforce (headcount) covered by health and safety management system | 100% | 100% | – |
3.2.2 Lost time injury rate Lost time injuries per million hours worked (ppm) 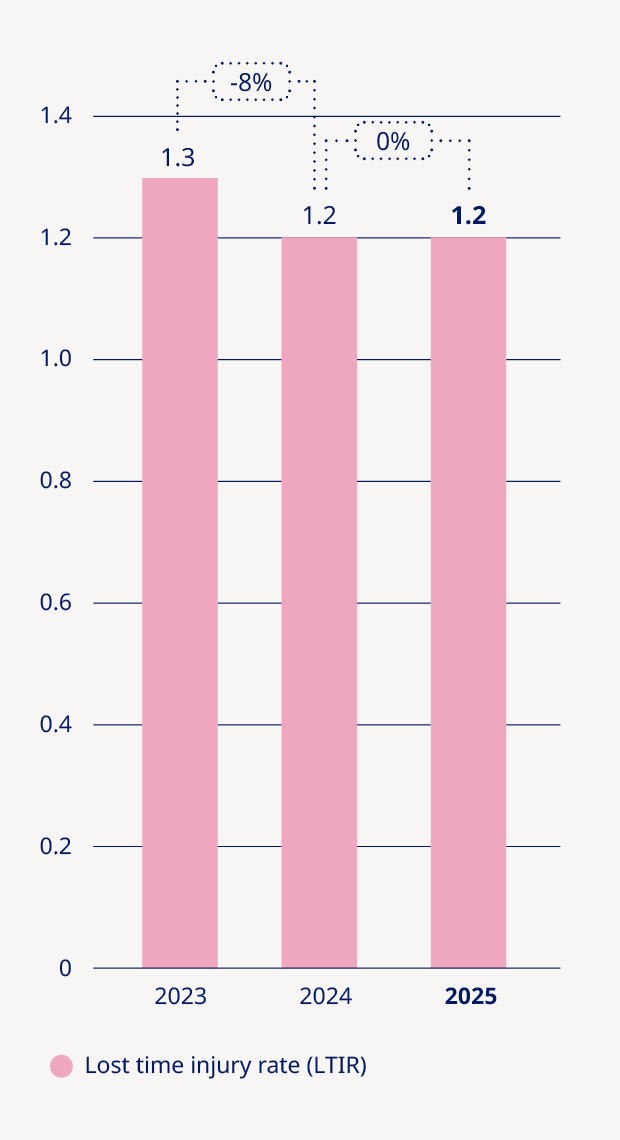 |
3.3.1 Remuneration metrics | 2025 | 2024 | 2023 |
Gender pay gap1 | (1.2%) | (0.4%) | – |
Annual total remuneration ratio2 | 37 | 63 | – |
1. 2024 figure for Gender pay gap has been restated from (3)% due to a methodological change. 2. Based on present CEO as highest paid employee. If calculated based on former CEO's remuneration, the ratio would be 148 due to severance payment in 2025. | |||
3.3.2 Gender in senior leadership positions (CEO, EVP, SVP, CVP, and VP) (% men:women) 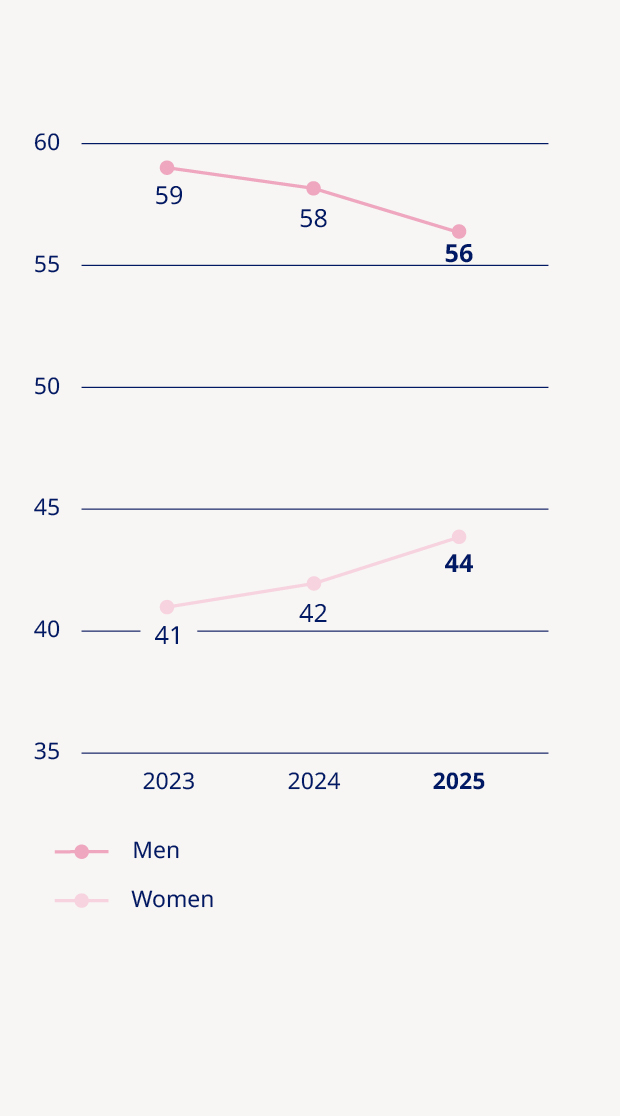 |
3.3.3 Diversity metrics – Management levels | |||||||
Men | Women | ||||||
Number | 2025 | 2024 | 2023 | 2025 | 2024 | 2023 | |
Number of employees (headcount) at senior leadership – CEO, EVP, SVP, GVP and VP1 | 491 | 504 | – | 379 | 361 | – | |
Percentage of employees (headcount) at senior leadership – CEO, EVP, SVP, GVP and VP | 56% | 58% | 59% | 44% | 42% | 41% | |
Number of employees (headcount) at other leadership levels – Director, manager, team leader | 4,598 | 4,726 | – | 4,075 | 4,171 | – | |
Percentage of employees (headcount) at other leadership levels – Director, manager, team leader | 53% | 53% | 54% | 47% | 47% | 46% | |
Gender in leadership positions (overall) | 53% | 54% | 54% | 47% | 46% | 46% | |
Gender on the Board of Directors | 56% | 50% | 50% | 44% | 50% | 50% | |
Gender on the Board of Directors without employee representatives | 80% | 62% | 62% | 20% | 38% | 38% | |
1. Historical data for Number of employees (headcount) at senior leadership level has been merged into one row instead of two in last year’s reporting. This has not impacted the reported number (headcount) at senior leadership level. | |||||||
Gender Balance Act - Applicable for Novo Nordisk A/S only Novo Nordisk A/S, as resident in Denmark, is subject to the Danish Gender Balance Act and obliged to disclose information on gender diversity in the Board of Directors and other management levels for employees employed in Novo Nordisk A/S. Other management levels are defined as two levels of management under the Board of Directors: (i) Executive Management (EVPs employed by Novo Nordisk A/S), and (ii) individuals with personnel responsibility who report directly to the first management level1. Hence, Other management levels are not equal to senior leadership levels. Measures taken to achieve gender balance When evaluating candidates for election and re-election for the shareholder-elected Board members, the People & Governance Committee and the Board considers the Competency Profile of the Board of Directors of Novo Nordisk A/S which includes diversity in terms of e.g., gender and other relevant criteria. In regards to employee representatives, Novo Nordisk A/S has employee representation in its Board of Directors and promotes the election to all eligible employees regardless of backgrounds. For selecting employees at Other management levels, Novo Nordisk A/S ensures a strong leadership pipeline of diverse talents through its commitment to promoting equality of opportunities within Novo Nordisk A/S. Status on achieving gender balance Novo Nordisk A/S has achieved gender balance as defined in the Danish Gender Balance Act for employee representatives in the Board of Directors and in Other management levels, however, it has not achieved gender balance for Board of Directors elected by shareholders. | 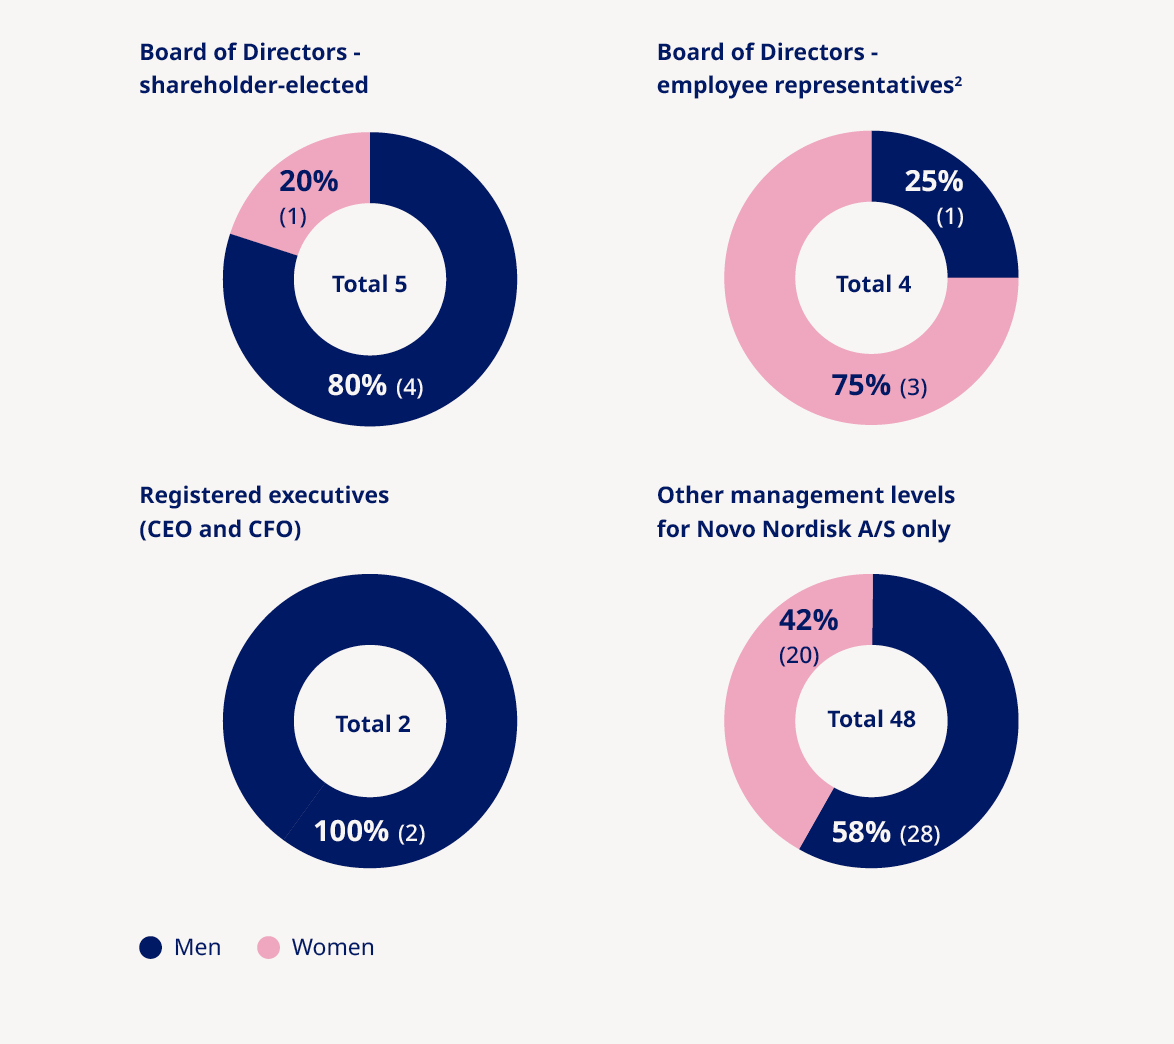 | |||
1. For other management levels, the reporting only regards employees of Novo Nordisk A/S. 2. Ratio as of 31 December 2025. As of 31 January 2026, all employee representatives are women. |
Prioritised topics | ||||
 | Patient protection and quality of life | |||
 | Own workforce | |||
 | Climate Change | |||
 | Resource use and circular economy | |||
Ambition We aim to build a climate-resilient business by assessing and adapting to climate risks, reducing GHG emissions in line with a well-below 2°C pathway, and transparently reporting across our value chain under the GHG Protocol. Policy https://www.novonordisk.com/ content/dam/nncorp/global/en/ sustainable-business/pdfs/esg-portal/ sustainability-statement/2025/ Environmental_policy.pdf (The contents of the company's website do not form a part of this Form 6-K) Performance •Scope 1, 2 and 3 emissions increased 19% since 2024 Suppliers for Zero Programme •In 2025, we launched the Suppliers for Zero programme to align suppliers with our climate, nature and plastics goals. •All Tier 1 suppliers must source 100% renewable electricity by 2033. •Suppliers must also meet our Responsible Sourcing Standards •Additional initiatives will be defined by Novo Nordisk in individual engagements. | ||||
IRO name | Category | Sustainability topic | Value chain location | |
 | CO2e emissions contributing to climate change | | •Mitigation •Energy | •Upstream •Own operations •Downstream |
 | Potential reputational risks linked to CO2e emissions and speed of mitigation efforts | | •Mitigation •Energy | •Upstream •Own operations •Downstream |
 | Potential risks of climate-related disruptions in operations or supply chain | | •Adaptation | •Upstream •Own operations •Downstream |
| ||||
4.1.1 Scope 1, 2 and 3 GHG emissions targets | Annual % (target/ base) | |||||
1,000 tCO2e | 20241 | 2025 | 2030 | 2033 | 2045 | |
Scope 1 and 2 GHG emissions - market-based | 101 | 183 | 0 | 0 | 0 | 17% |
Scope 3 GHG emissions2 (SBTi) | 1,448 | 1,616 | – | 970 | 03 | 4% |
Scope 3 GHG emissions (excluded from SBTi target) | 712 | 891 | Not applicable | |||
Scope 3 GHG emissions | 2,160 | 2,507 | ||||
1. Base year 2. Following the target validation by SBTi in 2025, we revised base-year emissions from 1,493 to 1,448. 3. Net emissions with residual emissions after the decarbonisation levers (150 thousand tCO2e) to be neutralized through carbon removals. | ||||||
4.1.2 Main decarbonisation levers for our 2033 scope 3 target and 2045 net-zero target (1,000 tonnes CO2e) 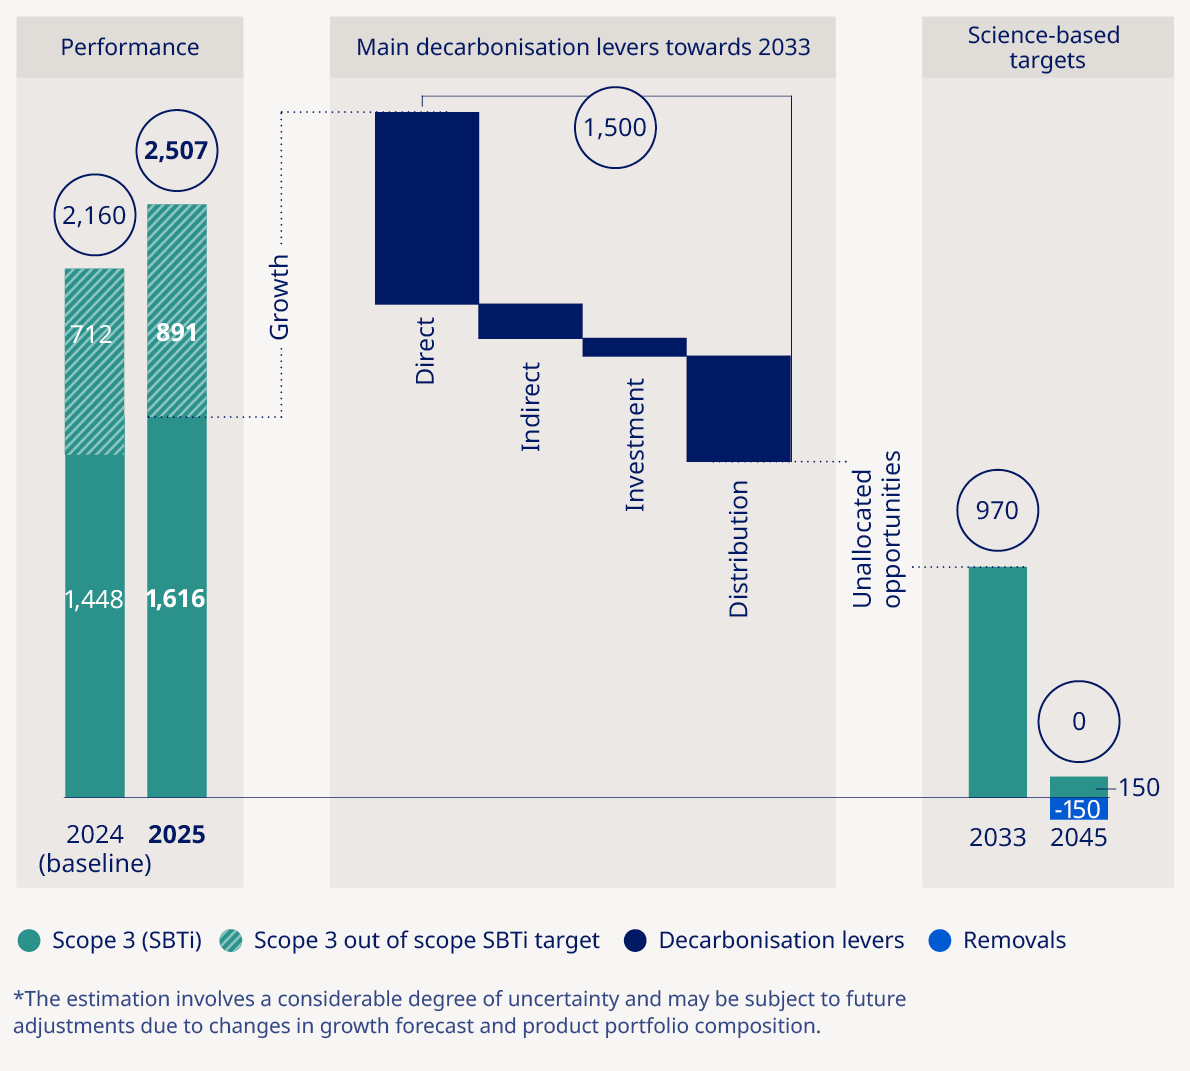 |
Targets within transition plan •2030: Zero scope 1 and 2 emissions. •Ambition: 1.5°C aligned •2033: 33% reduction in scope 31 emissions compared with 2024 baseline. •Ambition: Well-below 2°C, not 1.5°C aligned •2045: Net-zero emissions, •Ambition: Aligned with the Corporate Net-Zero Standard  | ||
1. Our 2033 scope 3 target covers ~67% of emissions, excluding categories 3, 5, 7, 12 and parts of 1, 2 and 6, in line with SBTi provisions for high-uncertainty categories. The target follows a sectoral decarbonisation pathway. The 2045 net- zero target includes all scope 1, 2 and 3 emissions. The targets and the transition plan have been approved by our Board of Directors and Executive Management. |
2025 actions | |||
| Scope 1 and 2: Energy efficiency and optimisation, ongoing to 2030. •Advanced district cooling and heating ring in Kalundborg (completion 2026, ~20,000 MWh/yearly savings) and new heat pump in Hillerød completed in 2025 (~3,300 MWh/yearly savings). •Target: Zero scope 1 and 2 by 2030, Metric: 4.1.4 | ||
Scope 1 and 2: Converting to renewable heat and steam, ongoing to 2030. •Investigating heat and steam decarbonisation levers across production sites to enable cost-efficient implementation. Specific roadmap to be finalized in 2026. •Target: Zero scope 1 and 2 by 2030, Metric: 4.1.4 | |||
Scope 1 and 2: Reducing emissions from fossil-based vehicles, ongoing to 2030. •Expanding EV transition in alignment with local infrastructure across operational countries. •Target: Zero scope 1 and 2 by 2030, Metric: 4.1.4 | |||
Scope 3: Reducing emissions from purchased good and services, until 2033 and beyond. •Partnering with suppliers on low-carbon materials and feedstocks: first large-scale e-methanol project in Kassø for e-POM production. •In 2025, over 10% of the glucose we procured was from regenerative agriculture and a large share of purchased ammonia was low-carbon. •Converting to low-carbon (e.g., steel, concrete) and recycled materials at site Clayton. •Target: Reduce scope 3 by 33% by 2033, Metric: 4.1.4 | |||
Scope 3: Reducing emissions from air and sea distribution, to 2033 and beyond. •Securing sustainable aviation fuel (SAF) and marine fuel (SMF) agreements with logistics partners. •Target: Reduce scope 3 by 33% by 2033, Metric: 4.1.4 | |||
| Climate adaptation to address physical climate risks, until 2033 and beyond •In 2025, natural hazard exposure reassessed for all production sites and critical suppliers, with detailed climate and nature risk evaluations for key commodities. The analysis indicated 5 key commodities that could potentially be impacted by climate change. | ||
4.1.3 Energy consumption and mix | |||
GWh | 2025 | 2024 | 2023 |
Total energy consumption related to own operations | 1,726 | 1,400 | 1,051 |
Total energy consumption from fossil sources | 742 | 476 | – |
•Fuel consumption from crude oil and petroleum products | 169 | 188 | – |
•Fuel consumption from natural gas | 369 | 196 | – |
•Consumption of purchased or acquired electricity, heat, steam, and cooling2 | 204 | 92 | – |
Total energy consumption from renewable sources | 984 | 924 | – |
•Fuel consumption from renewable sources | 156 | 154 | – |
•Consumption of purchased or acquired electricity, heat, steam and cooling from renewable sources2 | 827 | 770 | – |
•Total self-generated non-fuel renewable energy | 1 | 0 | – |
Percentage of fossil sources in total energy consumption | 43% | 34% | – |
Percentage of renewable sources in total energy consumption1 | 57% | 66% | – |
Energy intensity (total energy consumption per net revenue2) (MWh/mDKK) | 5.58 | 4.82 | – |
1. Contractual biomass-derived heat and steam is included under renewable sources in 2025 and the 2024 values were restated from 54% to 66%, 46% to 34%. Accordingly, the values for consumption of fossil-based electricity heat and steam was restated from 264 GWh to 92 GWh in 2024 and consumption of renewable electricity, heat and steam was restated from 599, GWh to 770 GWh. 2. Please see note 2.1 'Net sales and rebates' on page 88 in the Consolidated financial statements. | |||
 Suppliers for Zero Program To reach our scope 3 targets, we need our suppliers and CMOs to implement specific decarbonisation levers and support us to improve data foundations to measure impacts and potentials. We provide support to our suppliers through collaborative partnerships and free training  % of GHG emissions from suppliers who have committed to sourcing renewable electricity1 54% 41% in 2024 | ||
1. Commitments cover electricity consumption from suppliers to Novo Nordisk within scope 3 category 1 and 2. |
4.1.4 Scope 1, 2 and 3 GHG emissions | ||||
1,000 tCO2e | 2025 | 2024 | 2023 | % change (2025/2024) |
Scope 1 GHG emissions | 120 | 85 | 78 | 41% |
Scope 2 GHG emissions - market-based | 63 | 16 | 15 | 294% |
Scope 2 GHG emissions - location-based | 198 | 174 | – | 14% |
Scope 1 and 2 GHG emissions - market-based | 183 | 101 | 93 | 81% |
Scope 3 GHG emissions | 2,507 | 2,160 | 1,743 | 16% |
•Category 1: Purchased goods and Services | 1,383 | 1,215 | 1,018 | 14% |
•Category 2: Capital goods | 609 | 465 | 303 | 31% |
•Category 3: Fuel- and energy-related activities | 86 | 74 | 56 | 16% |
•Category 4: Upstream transportation and distribution | 116 | 101 | 108 | 15% |
•Category 5: Waste generated in operations | 7 | 6 | 6 | 17% |
•Category 6: Business travel | 190 | 188 | 154 | 1% |
•Category 7: Employee commuting | 56 | 52 | 43 | 8% |
•Category 9: Downstream transportation and distribution | 57 | 57 | 52 | 0% |
•Category 12: End-of-life treatment of sold products | 3 | 2 | 3 | 50% |
Total GHG emissions - market-based | 2,690 | 2,261 | 1,836 | 19% |
Total GHG emissions - location-based | 2,825 | 2,419 | – | 17% |
GHG emissions intensity, market-based (total GHG emissions per net revenue1) (tCO2e/mDKK) | 8.7 | 7.8 | – | 12% |
GHG emissions outside of scope 1 and 2 (1,000 tCO2) | 108 | 110 | – | (2%) |
•Biogenic emissions (scope 1) | 38 | 37 | – | 3% |
•Biogenic emissions (scope 2) | 70 | 73 | – | (4%) |
1. Please see note 2.1 'Net sales and rebates' on p. 88 in the Consolidated financial statements. | ||||
4.1.5 Scope 1, 2 and 3 emissions (1,000 tCO2e) 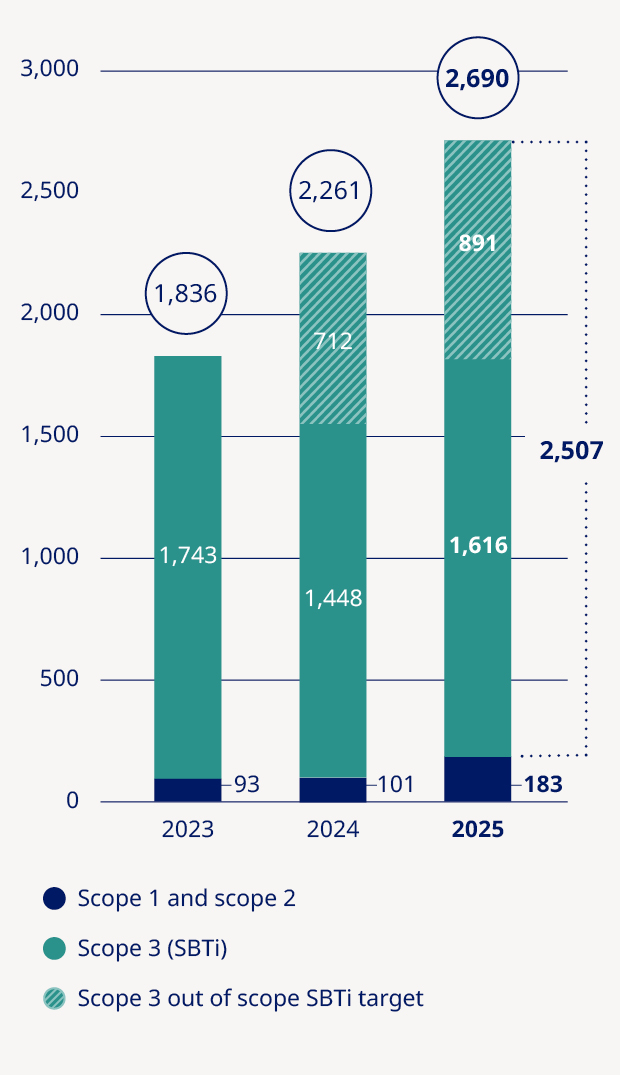 |
Prioritised topics | ||||
| Patient protection and quality of life | |||
| Own workforce | |||
| Climate Change | |||
| Resource use and circular economy | |||
Ambition We aim to reduce our plastic footprint by extending the life of materials beyond patient use and minimising plastic through smarter design, reusable solutions, optimised processes and sustainable alternatives. Policy https://www.novonordisk.com/ content/dam/nncorp/global/en/ sustainable-business/pdfs/esg- portal/sustainability- statement/2025/ Environmental_policy.pdf (The contents of the company's website do not form a part of this Form 6-K) Performance •Plastic footprint per patient decreased 5% since 2024 Plastic roadmap 1.Reduce by converting to reusable devices and less frequent dosing 2.Change by transitioning to non- virgin-fossil plastic 3.Avoid by expanding the ReMedTM take-back programme | ||||
IRO name | Category | Sustainability topic | Value chain location | |
 | Resource use associated with manufacturing and capacity expansions | | •Resource inflow | •Upstream •Own operations |
 | End-of-life waste from products | | •Resource outflow | •Own operations •Downstream |
 | Resource waste associated with manufacturing | | •Waste | •Own operations •Downstream |
 | Potential reputational risks associated with resource use | | •Resource inflow •Resource outflow •Waste | •Upstream •Own operations •Downstream |
| ||||
2025 actions | |
| Convert to lower-carbon plastics (non-virgin-fossil alternatives with a lower carbon footprint) in our medical devices globally by 2033. •In 2025, first large-scale e-methanol project in Kassø (DK) inaugurated for e-POM production. •Target: Reduce scope 3 CO2e emissions by 33% by 2033, Metric: 4.1.4 |
Fostering circularity in construction of new sites towards 2033. •In 2025, new LCA thresholds launched to drive sustainable building design and material choices. •In 2025, new standard introduced for designing sites for deconstruction and adaptability, promoting long-term reuse and procurement of more sustainable or recycled materials. •For our expansion at site Clayton (USA), approximately 46% of civil, architectural and structural (CSA) materials procured are classified as more sustainable (bio-based, FSC- certified wood, or recycled content); the target for circularity in expansions is to reach 50%.. •Target: Reduce scope 3 CO2e emissions by 33% by 2033, Metric: 4.1.4 | |
| Converting to reusable devices by 2033 to treat more patients with reusable devices. •In 2025, we worked on preparing a cost-efficient reusable injection pen for launch. •Target: Reduce our plastic footprint per patient by 30% by 2033. •Metric: 5.1.3 Plastic footprint per patient (kg/patient). |
Innovating treatment methods by 2033 •Awiqli® - the world's first once-weekly basal insulin; going from daily to weekly injection reduces the need for injection pens, thereby reducing the plastic footprint of treatment by approximately two thirds compared to once daily treatment. •In 2025, Awiqli® was launched in two additional markets: Italy and Japan. •Target: Reduce our plastic footprint per patient by 30% by 2033. •Metric: 5.1.3 Plastic footprint per patient (kg/patient). |
5.1.1 Resource outflows | 2025 | 2024 | 2023 |
Plastic footprint (absolute) (tonnes)1 | 16,463 | 17,128 | – |
Plastic footprint per patient (kg/patient)2 | 0.36 | 0.38 | – |
Recyclable content in products packaging | 29% | 28% | – |
1. Plastic footprint (absolute) restated from 15,654 to 17,128 tonnes in 2024 due to the inclusion of primary packaging for needles. 2. Relative plastic footprint restated from 0.35 to 0.38 in 2024. | |||
5.1.2 Resource inflows | |||
1,000 tonnes | 2025 | 2024 | 2023 |
Overall total weight of technical and biological materials used | 259 | 226 | – |
Percentage of biological materials (and biofuels used for non- energy purposes) that are sustainably sourced | 11% | 0% | – |
5.1.3 Plastic footprint (Plastic footprint per patient, kg/patient/year) 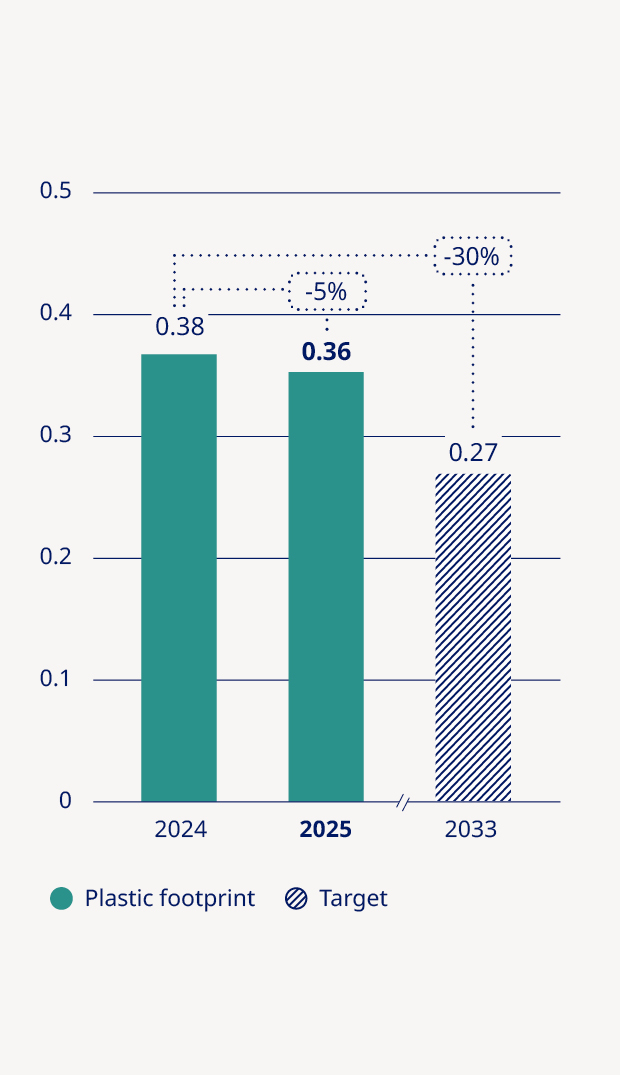 |
5.1.4 Resource outflows - Waste | ||||
Tonnes | 2025 | 2024 | 2023 | |
Total | Total waste generated | 271,771 | 229,690 | 189,091 |
Non-recycled waste | 33,416 | 34,132 | - | |
Percentage of non-recycled waste | 12% | 15% | - | |
Hazardous | Total hazardous waste | 48,282 | 52,982 | |
Waste diverted from disposal | 24,145 | 26,713 | - | |
• Preparation for Reuse | 43 | - | - | |
• Recycling | 16,561 | 14,099 | - | |
• Other recovery operations | 7,541 | 12,614 | - | |
Waste directed to disposal | 24,137 | 26,269 | - | |
• Incineration | 24,129 | 26,022 | - | |
• Landfill | 8 | 0 | - | |
• Other disposal operations | 0 | 247 | - | |
Non-hazardous | Total non-hazardous waste | 223,489 | 176,708 | |
Waste diverted from disposal | 214,210 | 168,845 | - | |
• Preparation for Reuse | 981 | 40 | - | |
• Recycling | 197,810 | 149,853 | - | |
• Other recovery operations | 15,419 | 18,952 | - | |
Waste directed to disposal | 9,279 | 7,863 | - | |
• Incineration | 9,113 | 7,743 | - | |
• Landfill | 166 | 120 | 638 | |
• Other disposal operations | 0 | - | - | |
– – – | Novo Nordisk Annual Report 2025 / Sustainability statement / Other material topics / 6. Workers in the value chain | 71 | |
Other material topics | |||||
 | Workers in the value chain | ||||
  | Nature | ||||
 | Pollution | ||||
 | Business conduct | ||||
Ambition Safeguarding human rights, protecting labour and social rights Ensuring safe, secure and healthy working conditions and preserving the environment and climate. Policy https://www.novonordisk.com/ content/dam/nncorp/global/en/ contact/pdfs/2024-responsible- sourcing-standards.pdf (The contents of the company's website do not form a part of this Form 6-K) https://www.novonordisk.com/ content/dam/nncorp/global/en/ sustainable-business/pdfs/esg-portal/ novo-nordisk-human-rights- commitment-2022.pdf (The contents of the company's website do not form a part of this Form 6-K) https://www.novonordisk.com/ content/dam/nncorp/global/en/ sustainable-business/pdfs/esg-portal/ novo-nordisk-modern-slavery- statement-2024.pdf (The contents of the company's website do not form a part of this Form 6-K) Performance •19 Responsible Sourcing Audits performed in 2025 For more information on supplier engagement and our Compliance Hotline, see section 9.2 on page 76 | |||||
IRO name | Category | Sustainability topic | Value chain location | |
 | Protect labour rights and health and safety | | •Working conditions | •Upstream •Downstream |
 | Potential human rights violations | | •Other work- related rights | •Upstream •Downstream |
| ||||
2025 actions | |
| Implementation of supplier due diligence tool •The tool enables automated risk screenings, covering areas such as human rights, environmental impacts and governance. The aim is to further strengthen responsible sourcing across our supply chain in compliance with evolving regulation. •In 2025, we have initiated configuration of the tool with the future scope being active suppliers with spend recorded in the latest 12 months. •We will continue configurations and implementation of the supplier due diligence tool in 2026. |
Other material topics | |||||
 | Workers in the value chain | ||||
  | Nature | ||||
 | Pollution | ||||
 | Business conduct | ||||
Ambition We aim to halt the loss of nature by 2033 and become nature positive by 2045 as guided by the Nature Roadmap. Policy https://www.novonordisk.com/ content/dam/nncorp/global/en/ sustainable-business/pdfs/esg-portal/ sustainability-statement/2025/ Environmental_policy.pdf (The contents of the company's website do not form a part of this Form 6-K) Performance •Water withdrawal increased 15% since 2024 Nature roadmap Approved in 2024, implementation will run from 2025–2045 and cover our entire value chain. Five broad ambitions •Avoid degradation of land •Reduce our relative impact on water at priority sites •Restore biodiversity at priority sites •Initiate restoration projects •Reduce and replace glucose | |||||
IRO name | Category | Sustainability topic | Value chain location | |
 | Reliance on water resources and quality | | •Water withdrawal •Water discharge | •Upstream •Own operations •Downstream |
 | Potential water scarcity risks | | •Water withdrawal | •Upstream •Own operations |
 | Reliance on natural resources and ecosystems | | •Direct impact drivers •Impacts on the condition of ecosystems •Impacts and dependencies on ecosystem services | •Upstream •Own operations •Downstream |
 | Dependency on vulnerable species for safety testing | | •Impact on the state of species | •Upstream •Own operations |
| ||||
7.1.1 Priority sites | |
Water | Chartres (FR), Tianjin (CN) |
Water and biodiversity | Kalundborg (DK), Hillerød (DK), Montes Claros (BR), Clayton (US) |
Biodiversity | Durham (US), New Hampshire (US), Tietgenbyen (DK), Bagsværd (DK), Køge (DK) |
2025 actions | ||
| Engaging priority suppliers water stewardship programme towards 2033 •Screened and prioritised suppliers for engagement on water stewardship based on their water risks and maturity on the topic. | |
Saving water and increasing wastewater treatment •Phasing out surface water withdrawal from Lake Tissø through industrial collaboration in Kalundborg (DK). Completion expected in 2026, with projected annual savings of 400,000 m3 •Expansion of on-site wastewater treatment operated by Novonesis, increasing the industrial wastewater and biomass treatment capacity. Completion expected in 2026. •Metric: 7.1.2 Water. | ||
| Avoiding degradation of land in supply chain by sourcing glucose from regenerative agriculture. Programme running until 2033. •Supplier engagement to transition our glucose to regenerative sources to restore soils and reduce nature and carbon impacts. •In 2025, more than 10% of the glucose we sourced was from regenerative sources. •Metric: 4.1.4 | |
| Nature restoration near priority sites •In 2025, we entered into a partnership with Conservation International to restore 170 hectares of forest in the same water basin as our production site in Tianjin (China). •We made a landmark investment in a carbon removal initiative with Re.green to restore 500 hectares of Amazon rainforest in Brazil and capture over 87,000 tonnes of CO2 over the project’s lifetime across 20 years. | |
7.1.2 Water | |||
1,000 m3 | 2025 | 2024 | 2023 |
Total water withdrawal | 5,988 | 5,213 | 4,150 |
Total water discharge | 5,275 | 4,583 | – |
Total water recycled and reused | 408 | 416 | – |
7.1.3 Impact on Nature1 (%) 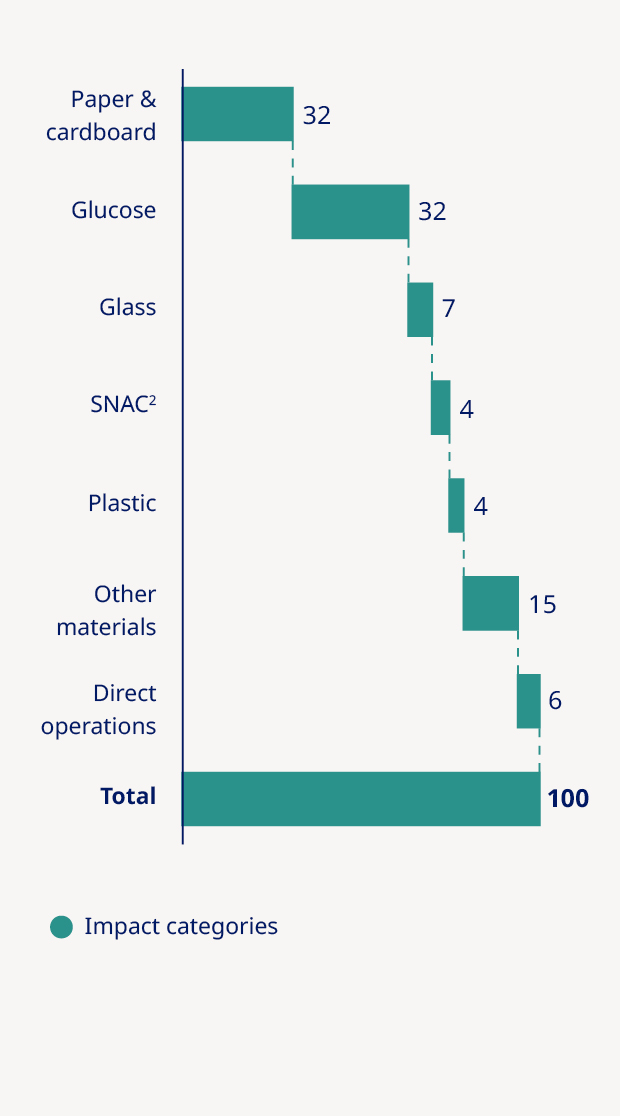 |
1. Nature Baseline Assessment for Novo Nordisk conducted in 2025. Nature impact represents the average contribution (%) of each category to the impact from seven distinct nature pressures. 2. Raw material used in the production of tablets |
– – – | 74 | ||
Other material topics | |||||
| Workers in the value chain | ||||
| Nature | ||||
| Pollution | ||||
| Business conduct | ||||
Ambition Our ambition is to take ownership to reduce the use of toxic chemicals and minimise pharmaceuticals in the environment. Policy overview https://www.novonordisk.com/ content/dam/nncorp/global/en/ sustainable-business/pdfs/esg-portal/ sustainability-statement/2025/ Environmental_policy.pdf (The contents of the company's website do not form a part of this Form 6-K) Performance •Substances of very high concern declined overall since 2024 Our chemical roadmap Approved in 2025, implementation will run from 2026–2033 and cover our entire value chain. Four focus areas to reduce SVHCs: •Design products •Design processes •Optimise and scale production •Develop data tools and enablers | |||||
IRO name | Category | Sustainability topic | Value chain location | |
 | Use of chemicals to produce medicines, devices and packaging | | •Substances of very high concern | •Upstream •Own operations •Downstream |
| ||||
2025 actions | |
| Reducing SVHCs and similar substances in production of medicines •Scope includes own production, contract manufacturers and suppliers. •In 2025, we optimised the manufacturing processes for Ozempic® and Wegovy®, oral GLP-1 products for obesity and diabetes and reduced the use of SVHCs in the process. •Metric: 8.1.1 |
8.1.1 Substances of very high concern | |||
Tonnes | 2025 | 2024 | 2023 |
Total amount of substances of very high concern that are procured | 1,500 | 1,859 | - |
Total amount of substances of very high concern leaving facilities as emissions, as products, or as part of products | 0.8 | 1.5 | - |
• Substances leaving facilities as emissions1 | 0.3 | 0.3 | - |
• Substances leaving facilities as products, or part of products2 | 0.5 | 1.2 | - |
1. 2024 value was overestimated and had to be restated from 1 to 0.3 tonnes. 2. 2024 value was restated from 0.003 to 1.2 tonnes due to a new SVHC identified in our devices. | |||
– – – | Novo Nordisk Annual Report 2025 / Sustainability statement / Other material topics / 9. Business conduct | 75 | |
Other material topics | |||||
 | Workers in the value chain | ||||
  | Nature | ||||
 | Pollution | ||||
 | Business conduct | ||||
Ambition We define good ethics as conducting every interaction in a way that protects trust, prevents harm and promotes fairness, ensuring that our values are consistently embedded in daily practice and rooted in the practices of our founders. Policy https://www.novonordisk.com/ content/dam/nncorp/global/en/ sustainable-business/pdfs/esg-portal/ Cover_Code_of_conduct.pdf (The contents of the company's website do not form a part of this Form 6-K) https://www.novonordisk.com/ content/dam/nncorp/global/en/ sustainable-business/pdfs/esg-portal/ labour-code-of-conduct.pdf (The contents of the company's website do not form a part of this Form 6-K) https://www.novonordisk.com/ content/dam/nncorp/global/en/ contact/pdfs/2024-responsible- sourcing-standards.pdf (The contents of the company's website do not form a part of this Form 6-K) https://www.novonordisk.com/ content/dam/nncorp/global/en/ sustainable-business/pdfs/esg-portal/ sustainability-statement/2025/ Bioethics.pdf (The contents of the company's website do not form a part of this Form 6-K) Performance Total supplier audits decreased by 6% since 2024 Animals purchased for research decreased 5% since 2024 | |||||
IRO name | Category | Sustainability topic | Value chain location | |
 | Promoting Novo Nordisk Way | | •Corporate culture | •Own operations |
 | Treating stakeholders in line with ethical standards | | •Protection of whistleblowers •Corruption and bribery •Management of relationships with suppliers •Political influence and lobbying | •Upstream •Own operations •Downstream |
 | Potential risks associated with breach of anti-corruption legislation | | •Corruption and Bribery | •Upstream •Own operations •Downstream |
 | Promoting public health | | •Political engagement and lobbying | •Downstream |
 | Promoting bioethics | | •Bioethics | •Own operations |
 | Reliance on animals in research | | •Animal welfare | •Upstream •Own operations |
| ||||
9.1.1 Facilitations of the Novo Nordisk Way | |||
Number | 2025 | 2024 | 2023 |
Facilitations of the Novo Nordisk Way | 63 | 51 | 42 |
9.2.1 Anti-corruption and anti-bribery | |||
Number | 2025 | 2024 | 2023 |
Employees trained in ethics and compliance | 99% | 99% | 99% |
Convictions for violation of anti-corruption and anti-bribery laws | – | – | – |
Substantiated cases reported within accounting issues, fraud and business ethics matters via the Compliance Hotline | 261 | 242 | 221 |
9.3.1 Supplier audits | |||
Number | 2025 | 2024 | 2023 |
Total supplier audits | 403 | 429 | 382 |
9.3.2 Payment practices | |||
Days | 2025 | 2024 | 2023 |
Average number of days to pay invoice | 44 | 42 | – |
• Small suppliers | 26 | 24 | – |
• Large suppliers | 50 | 49 | – |
Percentage of payments aligned with standard payment terms | 85% | 83% | – |
• Small suppliers | 82% | 77% | – |
• Large suppliers | 85% | 84% | – |
Outstanding legal proceedings for late payments (Number) | 0 | 0 | – |
2025 actions | |
| Advocacy via EFPIA •Advocacy via the EFPIA Obesity Policy Platform to advance care for people living with obesity, recognise it as a relapsing chronic disease and highlight its economic burden. •Ongoing collaboration with the EFPIA Health Systems Working Group to tackle key challenges to health system resilience. |
Advocacy via European Diabetes Forum •Advocacy through the European Diabetes Forum for policy change that enables healthcare systems to better manage diabetes care. |
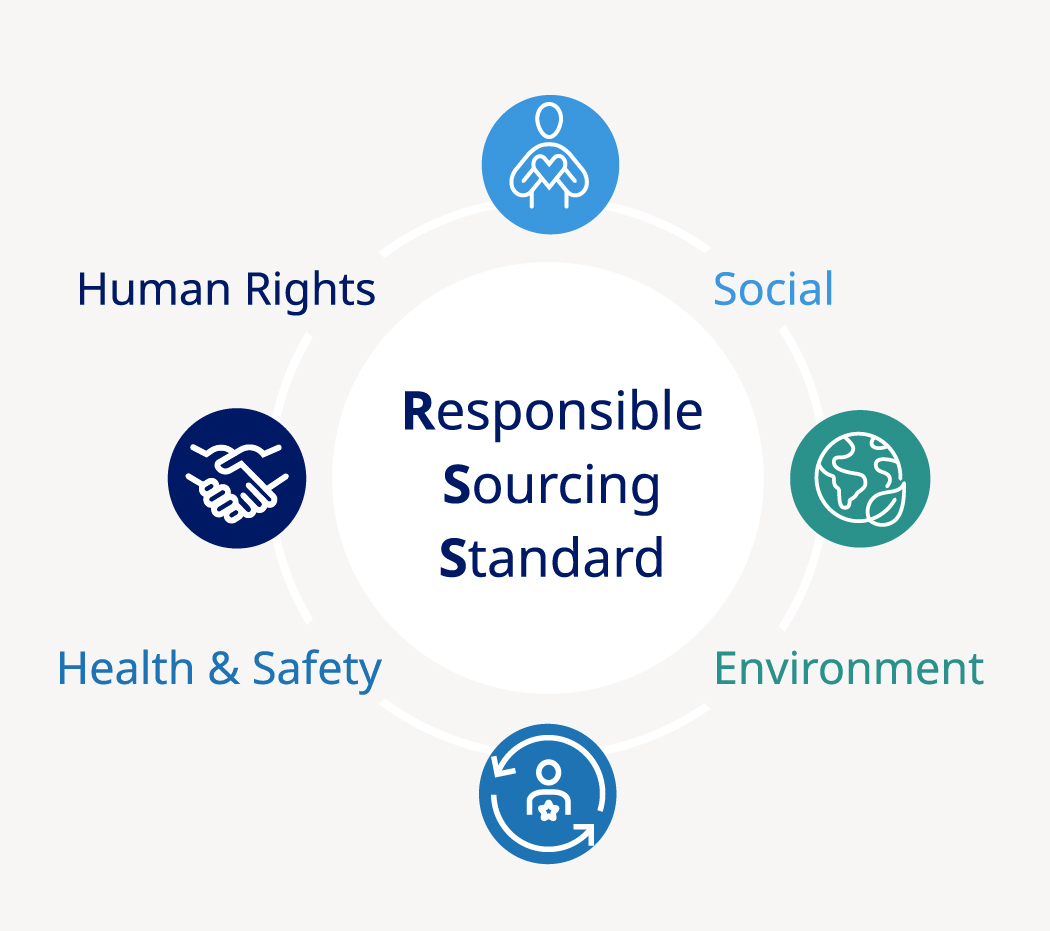 Approach to suppliers and sustainability We engage suppliers through a risk- based approach, guided by global standards (UNGP, OECD, CSDDD), with audits, corrective actions and continuous improvement requirements. Our supplier selection and management embed sustainability criteria, ensuring labour rights including health and safety, human rights, and environmental stewardship are central to every partnership. We hold suppliers accountable through due diligence, requiring documentation, risk assessments and enforcing consequences for non-compliance. RSS applies globally but we emphasise proportionate support for SMEs, enabling inclusion of smaller and local suppliers in our supply chain. | ||
9.4.1 Financial and in-kind political contributions made | |||
mDKK | 2025 | 2024 | 2023 |
Amount disclosed in the EU Transparency Register | 8.2–9 | – | – |
In-kind political contributions made | – | – | – |
9.5.1 Animals purchased for research | |||
Number | 2025 | 2024 | 2023 |
Mice, rats and other rodents | 44,917 | 47,478 | 54,410 |
Pigs | 521 | 615 | 608 |
Rabbits | 214 | 689 | 289 |
Dogs | 529 | 126 | 356 |
Non-human primates | 475 | 366 | 807 |
Fish | 202 | 0 | 36 |
Other vertebrates | 11 | 10 | 2 |
Total animals purchased | 46,869 | 49,284 | 56,508 |
– – – | 80 | ||
Novo Nordisk adjusted EU Taxonomy overview1 | Turnover | CapEx | ||||
2025 | 2025 | |||||
Environmental objective | Economic activity | (mDKK) | (%) | (mDKK) | (%) | |
Total Turnover and CapEx | 309,064 | 100 | 94,249 | 100 | ||
Not assessed activities considered non-material | 0 | 0 | 2,491 | 3 | ||
Taxonomy-non-eligible activities | 0 | 0 | 26,282 | 28 | ||
Climate change mitigation | 7.1 Construction of new buildings | 17,298 | 18 | |||
7.2 Renovation of existing buildings | 2,472 | 3 | ||||
Pollution prevention and control | 1.2 Manufacture of medicinal products | 309,064 | 100 | 39,871 | 42 | |
Eligible not aligned | 309,064 | 100 | 59,641 | 63 | ||
Eligible and aligned | 7.1 Construction of new buildings | 0 | 0 | 5,835 | 6 | |
1. See mandatory reporting templates Tables 5a, 5b and 5c in 'Additional Sustainability statement information' on p. 135 and 136 | ||||||
EU Taxonomy The EU Taxonomy is a classification system with a shared definition of economic activities identified as environmentally sustainable, in accordance with established technical criteria. Contextual information about the KPIs •We consider all Novo Nordisk’s turnover Taxonomy-eligible under economic activity 1.2 'Manufacture of medicinal products'. •Taxonomy-eligible CapEx includes only CapEx directly associated with the manufacturing process or related to construction or renovation of buildings; intangible assets are included (excluding goodwill). •Eligible CapEx mainly relates to equipment for manufacture of medicinal products and additions to property, plant and equipment, as per note 3.3 'Property, plant and equipment' on p. 96 in the Consolidated financial statement For a description of our Taxonomy disclosure process, incl. substantial contribution and 'do no significant harm' (DNSH), accounting policies and the mandatory reporting templates, please refer to the 'Additional Sustainability statement information', p. 135. | ||
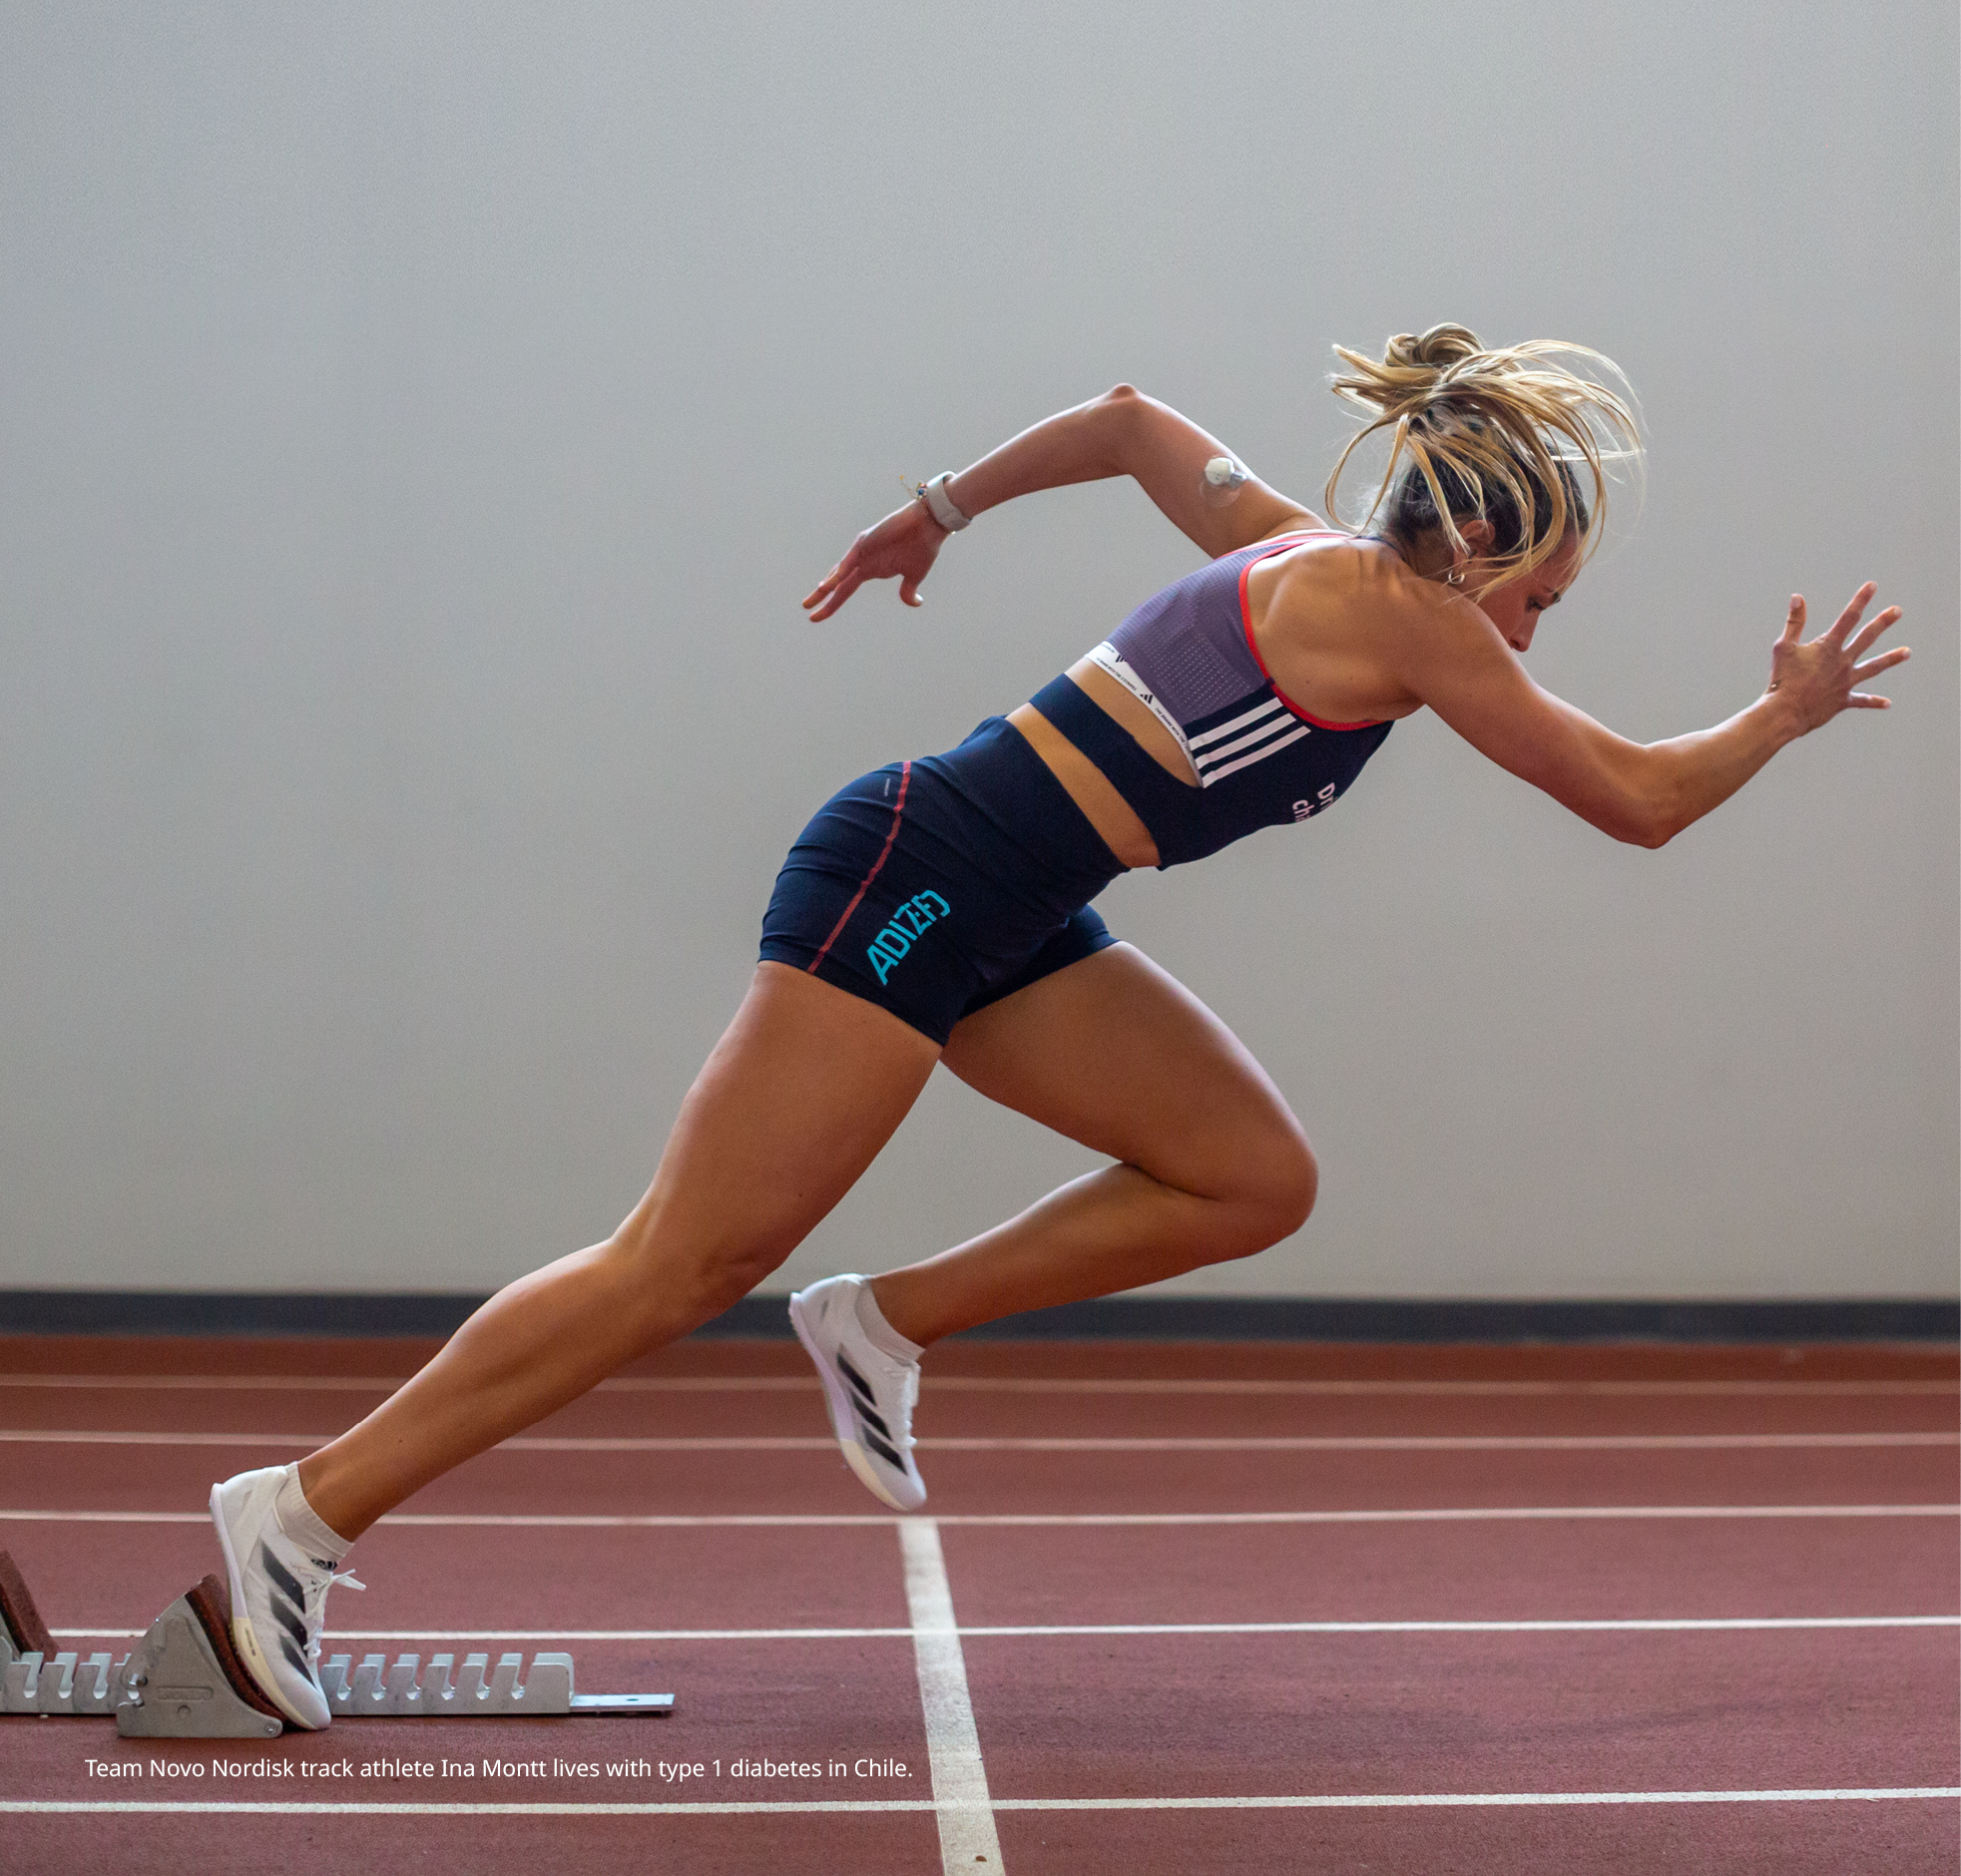 | |||||
Financial statements | |||||
– – – | 82 |
Consolidated financial statements | |||||||||
83 | 100 | ||||||||
84 | 100 | ||||||||
85 | 4.1 | 100 | |||||||
86 | 4.2 | 100 | |||||||
4.3 | 100 | ||||||||
87 | 4.4 | 101 | |||||||
87 | 4.5 | 103 | |||||||
87 | 4.6 | 104 | |||||||
87 | 4.7 | 106 | |||||||
1.2 | 87 | 4.8 | 107 | ||||||
4.9 | 108 | ||||||||
88 | |||||||||
88 | 109 | ||||||||
2.1 | 88 | 109 | |||||||
2.2 | 89 | 5.1 | 109 | ||||||
2.3 | 91 | 5.2 | 110 | ||||||
2.4 | 91 | 5.3 | 110 | ||||||
2.5 | 92 | 5.4 | 111 | ||||||
2.6 | 92 | 5.5 | 112 | ||||||
5.6 | Companies in the Novo Nordisk Group | 113 | |||||||
94 | |||||||||
94 | 114 | ||||||||
3.1 | 94 | 114 | |||||||
3.2 | 95 | 115 | |||||||
3.3 | 96 | ||||||||
3.4 | 97 | ||||||||
3.5 | 97 | ||||||||
3.6 | 98 | ||||||||
– – – | Novo Nordisk Annual Report 2025 / Financial statements / Consolidated financial statements / Income statement and Statement of comprehensive income | 83 |
DKK million | Note | 2025 | 2024 | 2023 | ||
Income statement | ||||||
Net sales | 2.1, 2.2 | |||||
Cost of goods sold | 2.2 | ( | ( | ( | ||
Gross profit | ||||||
Sales and distribution costs | 2.2 | ( | ( | ( | ||
Research and development costs | 2.2, 2.3 | ( | ( | ( | ||
Administrative costs | 2.2 | ( | ( | ( | ||
Other operating income and expenses | 2.2, 2.5 | ( | ( | |||
Operating profit | ||||||
Financial income | 4.9 | |||||
Financial expenses | 4.9 | ( | ( | ( | ||
Profit before income taxes | ||||||
Income taxes | 2.6 | ( | ( | ( | ||
Net profit | ||||||
Earnings per share | ||||||
Basic earnings per share (DKK) | 4.1 | |||||
Diluted earnings per share (DKK) | 4.1 |
DKK million | Note | 2025 | 2024 | 2023 | ||
Statement of comprehensive income | ||||||
Net profit | ||||||
Other comprehensive income: | ||||||
Exchange rate adjustments of investments in subsidiaries | 4.3 | ( | ( | |||
Cash flow hedges: | ||||||
Realisation of previously deferred (gains)/losses | 4.3, 4.5 | ( | ( | |||
Deferred gains/(losses) related to acquisition of businesses | 4.3 | |||||
Deferred gains/(losses) on hedges open at year-end | 4.3, 4.5 | ( | ||||
Tax and other items | 4.3 | ( | ( | |||
Items that will be reclassified subsequently to the income statement | ( | ( | ( | |||
Remeasurements of retirement benefit obligations | ( | |||||
Items that will not be reclassified subsequently to the income statement | ( | |||||
Other comprehensive income | ( | ( | ( | |||
Total comprehensive income |
– – – | Novo Nordisk Annual Report 2025 / Financial statements / Consolidated financial statements / Cash flow statement | 84 |
DKK million | Note | 2025 | 2024 | 2023 | ||
Cash flow statement | ||||||
Net profit | ||||||
Adjustment of non-cash items: | ||||||
Income taxes in the income statement | 2.6 | |||||
Depreciation, amortisation and impairment losses | 3.1, 3.3 | |||||
Other non-cash items1 | 4.7 | ( | ||||
Changes in working capital1 | 4.7 | |||||
Interest received | ||||||
Interest paid | ( | ( | ( | |||
Income taxes paid | 2.6 | ( | ( | ( | ||
Net cash flows from operating activities | ||||||
Purchase of intangible assets | 3.1 | ( | ( | ( | ||
Purchase of property, plant and equipment | 3.3 | ( | ( | ( | ||
Cash used for acquisition of businesses | 5.3 | ( | ||||
Settlement for prior year's acquisition of businesses | 5.3 | |||||
Proceeds from other financial assets | ||||||
Purchase of other financial assets | ( | ( | ( | |||
Purchase of marketable securities | ( | ( | ( | |||
Sale of marketable securities | ||||||
Net cash flows from investing activities | ( | ( | ( | |||
1. Effective 1 January 2025, 'Sales deductions and product returns' are presented as a separate line item on the balance sheet to enhance clarity of presentation and disclosures. In prior years, a portion of these balances was included within 'Provisions' and has therefore been reclassified from 'Other non-cash items', which captures movements in provisions, to 'Changes in working capital'. Refer to note 4.7 for further information. | ||||||
DKK million | Note | 2025 | 2024 | 2023 | ||
Purchase of treasury shares | 4.2 | ( | ( | ( | ||
Dividends paid | 4.2 | ( | ( | ( | ||
Proceeds from borrowings | 4.6 | |||||
Repayment of borrowings | 4.6 | ( | ( | ( | ||
Net cash flows from financing activities | ( | ( | ||||
Net cash generated from activities | ||||||
Cash and cash equivalents at the beginning of the year | ||||||
Exchange gains/(losses) on cash and cash equivalents | ( | ( | ||||
Cash and cash equivalents at the end of the year |
– – – | Novo Nordisk Annual Report 2025 / Financial statements / Consolidated financial statements / Balance sheet | 85 | |
DKK million | Note | 2025 | 2024 | ||
Assets | |||||
Intangible assets1 | 3.1 | ||||
Goodwill1 | 3.2 | ||||
Property, plant and equipment | 3.3 | ||||
Investments in associated companies | |||||
Deferred income tax assets | 2.6 | ||||
Other receivables and prepayments | |||||
Other financial assets | 4.8 | ||||
Total non-current assets | |||||
Inventories | 3.4 | ||||
Trade receivables | 3.5 | ||||
Tax receivables | |||||
Other receivables and prepayments | |||||
Marketable securities | 4.4 | ||||
Derivative financial instruments | 4.5 | ||||
Cash at bank | 4.4 | ||||
Total current assets | |||||
Total assets |
DKK million | Note | 2025 | 2024 | ||
Equity and liabilities | |||||
Share capital | 4.3 | ||||
Treasury shares | 4.3 | ( | ( | ||
Retained earnings | |||||
Other reserves | 4.3 | ( | ( | ||
Total equity | |||||
Borrowings | 4.6 | ||||
Deferred income tax liabilities | 2.6 | ||||
Retirement benefit obligations | |||||
Provisions2 | 3.6 | ||||
Sales deductions and product returns2 | 2.1 | ||||
Total non-current liabilities | |||||
Borrowings | 4.6 | ||||
Trade payables2 | 4.8 | ||||
Tax payables | |||||
Other liabilities2 | 4.8 | ||||
Derivative financial instruments | 4.5 | ||||
Provisions2 | 3.6 | ||||
Sales deductions and product returns2 | 2.1 | ||||
Total current liabilities | |||||
Total liabilities | |||||
Total equity and liabilities |
– – – | Novo Nordisk Annual Report 2025 / Financial statements / Consolidated financial statements / Equity statement | 86 | |
2025 | 2024 | 2023 | ||||||||||||||||||
DKK million | Share capital | Treasury shares | Retained earnings | Other reserves | Total | Share capital | Treasury shares | Retained earnings | Other reserves | Total | Share capital | Treasury shares | Retained earnings | Other reserves | Total | |||||
Balance at the beginning of the year | ( | ( | ( | ( | ||||||||||||||||
Net profit | ||||||||||||||||||||
Other comprehensive income | ( | ( | ( | ( | ( | ( | ( | |||||||||||||
Total comprehensive income | ( | ( | ( | |||||||||||||||||
Transfer of cash flow hedge reserve to intangible assets (note 4.3) | — | — | ( | ( | — | — | ||||||||||||||
Transactions with owners: | ||||||||||||||||||||
Dividends (note 4.2) | ( | ( | ( | ( | ( | ( | ||||||||||||||
Share-based payments (note 5.1) | ||||||||||||||||||||
Purchase of treasury shares (note 4.2) | (0) | ( | ( | ( | ( | ( | ( | ( | ( | |||||||||||
Reduction of the B share capital (note 4.3) | — | — | — | ( | ( | |||||||||||||||
Tax related to transactions with owners | ||||||||||||||||||||
Balance at the end of the year | ( | ( | ( | ( | ( | |||||||||||||||
– – – | Novo Nordisk Annual Report 2025 / Financial statements / Consolidated financial statements / Notes to the Consolidated financial statements / Section 1 Basis of preparation | 87 | |
Key accounting estimates and judgements | Risk | Note(s) | ||||
Estimate and judgement related to US sales deductions and liabilities for sales deductions | High | 2.1, 3.6 | ||||
Estimate in determining the fair values of assets acquired in prior year's business combinations | Medium | 5.3 | ||||
Estimate in determining the fair values of intangible assets in impairment reviews | Medium | 3.1 | ||||
Estimate regarding deferred income tax assets and provision for uncertain tax positions | Medium | 2.6 | ||||
Estimate of ongoing legal disputes, litigation and investigations | Medium | 3.6 | ||||
– – – | Novo Nordisk Annual Report 2025 / Financial statements / Consolidated financial statements / Notes to the Consolidated financial statements / Section 2 Results for the year | 88 | |
Gross-to-net sales reconciliation | |||||
DKK million | 2025 | 2024 | 2023 | ||
Gross sales | |||||
US Managed Care and Medicare | ( | ( | ( | ||
US wholesaler charge-backs | ( | ( | ( | ||
US Medicaid rebates | ( | ( | ( | ||
Other US discounts and sales returns | ( | ( | ( | ||
US rebates, discounts and sales returns | ( | ( | ( | ||
Non-US rebates, discounts and sales returns | ( | ( | ( | ||
Total gross-to-net sales adjustments | ( | ( | ( | ||
Net sales | |||||
Liabilities for sales deductions and product returns | |||||
DKK million | 2025 | 2024 | 2023 | ||
Sales deductions at beginning of the year | |||||
Additions, including increases to existing liabilities | |||||
Amount paid during the year | ( | ( | ( | ||
Adjustments regarding prior years, including unused amounts reversed during the year | ( | ( | ( | ||
Effect of exchange rate adjustment | ( | ( | |||
Sales deductions at end of the year | |||||
Liabilities for product returns | |||||
Sales deductions and product returns | |||||
– – – | Novo Nordisk Annual Report 2025 / Financial statements / Consolidated financial statements / Notes to the Consolidated financial statements / Section 2 Results for the year | 89 | |
Reconciliation of new line item 'sales deductions and product returns' | ||||
DKK million | 2025 | 2024 | 2023 | |
Estimated sales rebates, discounts and charge-backs | ||||
Expected product returns | ||||
Sales deductions and product returns (non-current) | ||||
Estimated sales rebates, discounts and charge-backs | ||||
Confirmed sales rebates | ||||
Expected product returns | ||||
Sales deductions and product returns (current) | ||||
Total sales deductions and product returns | ||||
Operating segments – Key figures | |||||||||||||||
Obesity and Diabetes care | Rare disease | Total | |||||||||||||
DKK million | 2025 | 2024 | 2023 | 2025 | 2024 | 2023 | 2025 | 2024 | 2023 | ||||||
Net sales | |||||||||||||||
Cost of goods sold | ( | ( | ( | ( | ( | ( | ( | ( | ( | ||||||
Sales and distribution costs | ( | ( | ( | ( | ( | ( | ( | ( | ( | ||||||
Research and development costs | ( | ( | ( | ( | ( | ( | ( | ( | ( | ||||||
Administrative costs | ( | ( | ( | ( | ( | ( | ( | ( | ( | ||||||
Other operating income and expenses | ( | ( | ( | ( | ( | ( | ( | ||||||||
Segment operating profit | |||||||||||||||
Operating margin | |||||||||||||||
Depreciation and amortisation expenses | ( | ( | ( | ( | ( | ( | ( | ( | ( | ||||||
Impairment losses and reversals | ( | ( | ( | ( | ( | ( | ( | ( | |||||||
Total depreciation, amortisation, impairment losses and reversals | ( | ( | ( | ( | ( | ( | ( | ( | ( | ||||||
– – – | Novo Nordisk Annual Report 2025 / Financial statements / Consolidated financial statements / Notes to the Consolidated financial statements / Section 2 Results for the year | 90 | |
Net sales – Segments and geographical areas | |||||||||||||||||||||
US Operations | International Operations | Total Novo Nordisk net sales | |||||||||||||||||||
USA | Total IO | EUCAN | Emerging Markets | APAC | Region China | ||||||||||||||||
DKK million | 2025 | 20241 | 20231 | 2025 | 20241 | 20231 | 2025 | 20241 | 20231 | 2025 | 20241 | 20231 | 2025 | 20241 | 20231 | 2025 | 20241 | 20231 | 2025 | 20241 | 20231 |
Obesity and Diabetes care segment: | |||||||||||||||||||||
Ozempic® | |||||||||||||||||||||
Rybelsus® | |||||||||||||||||||||
Victoza® | |||||||||||||||||||||
Total GLP-1 | |||||||||||||||||||||
Long-acting insulin | |||||||||||||||||||||
•of which Awigli® | |||||||||||||||||||||
•of which Tresiba® | |||||||||||||||||||||
•of which Xultophy® | |||||||||||||||||||||
•of which Levemir® | |||||||||||||||||||||
Premix insulin | |||||||||||||||||||||
•of which Ryzodeg® | |||||||||||||||||||||
•of which NovoMix® | |||||||||||||||||||||
Fast-acting insulin | |||||||||||||||||||||
•of which Fiasp® | |||||||||||||||||||||
•of which NovoRapid® | |||||||||||||||||||||
Human insulin | |||||||||||||||||||||
Total insulin | |||||||||||||||||||||
Other Diabetes care | |||||||||||||||||||||
Total Diabetes care | |||||||||||||||||||||
Wegovy® | |||||||||||||||||||||
Saxenda® | |||||||||||||||||||||
Total Obesity care | |||||||||||||||||||||
Obesity and Diabetes care total | |||||||||||||||||||||
Rare disease segment: | |||||||||||||||||||||
Rare blood disorders | |||||||||||||||||||||
•of which Haemophilia A | |||||||||||||||||||||
•of which Haemophilia B | |||||||||||||||||||||
•of which NovoSeven® | |||||||||||||||||||||
Rare endocrine disorders | ( | ||||||||||||||||||||
Other Rare disease | |||||||||||||||||||||
Rare disease total | |||||||||||||||||||||
Total sales by geographical area | |||||||||||||||||||||
Total sales growth as reported | |||||||||||||||||||||
1. Comparative information has been restated to reflect the new geographical structure. | |||||||||||||||||||||
– – – | Novo Nordisk Annual Report 2025 / Financial statements / Consolidated financial statements / Notes to the Consolidated financial statements / Section 2 Results for the year | 91 | |
DKK million | 2025 | 2024 | 2023 | ||
Employee costs (note 2.4) | |||||
Amortisation, intangible assets (note 3.1) | |||||
Impairment losses and reversals, intangible assets (note 3.1) | |||||
Depreciation, property, plant and equipment (note 3.3) | |||||
Impairment losses, property, plant and equipment (note 3.3) | |||||
Clinical trial cost | |||||
Other research and development costs | |||||
Total research and development costs | |||||
As percentage of net sales |
DKK million | 2025 | 2024 | 2023 | |
Wages and salaries | ||||
Share-based payment costs (note 5.1) | ||||
Pensions – defined contribution plans | ||||
Pensions – defined benefit plans | ||||
Other social security contributions | ||||
Other employee costs | ||||
Total employee costs for the year | ||||
Employee costs capitalised as intangible assets and property, plant and equipment | ( | ( | ( | |
Change in employee costs capitalised as inventories | ( | ( | ( | |
Total employee costs in the income statement | ||||
Included in the income statement: | ||||
Cost of goods sold | ||||
Sales and distribution costs | ||||
Research and development costs | ||||
Administrative costs | ||||
Other operating income and expenses | ||||
Total employee costs in the income statement |
Number | 2025 | 2024 | 2023 | ||
Average number of full-time employees | |||||
Year-end number of full-time employees | |||||
Year-end employees (total) |
– – – | Novo Nordisk Annual Report 2025 / Financial statements / Consolidated financial statements / Notes to the Consolidated financial statements / Section 2 Results for the year | 92 | |
Income taxes expensed | ||||
DKK million | 2025 | 2024 | 2023 | |
Current tax on profit for the year | ||||
Deferred tax on profit for the year | ( | ( | ( | |
Tax on profit for the year | ||||
Current tax adjustments recognised for prior years | ( | ( | ||
Deferred tax adjustments recognised for prior years | ( | |||
Income taxes in the income statement | ||||
Tax on other comprehensive income for the year, (income)/expense | ( | |||
Computation of effective tax rate | ||||||
% DKK million | 2025 | 2024 | 2023 | |||
Statutory corporate income tax rate in Denmark | ||||||
Deviation in foreign subsidiaries' tax rates compared to the Danish tax rate (net) | ( | ( | ||||
Non-taxable income less non-tax- deductible expenses (net) | ( | ( | ( | |||
Other adjustments (net) | ( | ( | ( | |||
Effective tax rate | ||||||
Income taxes paid | |||||
DKK million | 2025 | 2024 | 2023 | ||
Income taxes paid in Denmark | |||||
Income taxes paid outside Denmark | |||||
Income taxes paid | |||||
– – – | Novo Nordisk Annual Report 2025 / Financial statements / Consolidated financial statements / Notes to the Consolidated financial statements / Section 2 Results for the year | 93 | |
Development in deferred income tax assets and liabilities | Property, plant and equipment | Intangible assets | Inventories | Liabilities | Other | Offset within countries | Total | ||
DKK million | |||||||||
2025 | |||||||||
Net deferred tax asset/(liability) at the beginning of the year | ( | ( | |||||||
Income/(charge) to the income statement | ( | ( | ( | — | |||||
Income/(charge) to other comprehensive income | ( | ( | ( | — | ( | ||||
Income/(charge) to equity | ( | — | ( | ||||||
Additions from acquisitions | — | ||||||||
Effect of exchange rate adjustment | ( | ( | ( | — | ( | ||||
Net deferred tax asset/(liability) at the end of the year | ( | ( | |||||||
Classified as follows: | |||||||||
Deferred tax asset at the end of the year | ( | ||||||||
Deferred tax liability at the end of the year | ( | ( | ( | ( | ( | ( | |||
2024 | |||||||||
Net deferred tax asset/(liability) at the beginning of the year | ( | ( | |||||||
Income/(charge) to the income statement | ( | — | |||||||
Income/(charge) to other comprehensive income | ( | ( | — | ||||||
Income/(charge) to equity | ( | — | ( | ||||||
Additions from acquisitions1 | ( | — | |||||||
Effect of exchange rate adjustment | ( | ( | — | ||||||
Net deferred tax asset/(liability) at the end of the year | ( | ( | |||||||
Classified as follows: | |||||||||
Deferred tax asset at the end of the year1 | ( | ||||||||
Deferred tax liability at the end of the year1 | ( | ( | ( | ( | ( | ( | |||
1. Comparatives were restated to reflect changes in the provisional purchase price allocation from business combination in 2024. Reference is made to note 5.3. | |||||||||
– – – | Novo Nordisk Annual Report 2025 / Financial statements / Consolidated financial statements / Notes to the Consolidated financial statements / Section 3 Operating assets and liabilities | 94 | |
Amortisation | |||||
DKK million | 2025 | 2024 | 2023 | ||
Cost of goods sold | |||||
Sales and distribution costs | |||||
Research and development costs | |||||
Administrative costs | |||||
Other operating income and expenses | |||||
Total amortisation | |||||
Impairment losses and reversals | |||||
DKK million | 2025 | 2024 | 2023 | ||
Cost of goods sold | |||||
Research and development costs | |||||
Other operating income and expenses | |||||
Total impairment losses and reversals | |||||
DKK million | Intellectual property rights and know-how | Software and other intangibles | Total intangible assets | |||
2025 | ||||||
Cost at the beginning of the year | ||||||
Additions during the year | ||||||
Disposals during the year | ( | ( | ||||
Effect of exchange rate adjustment | ( | ( | ( | |||
Cost at the end of the year | ||||||
Amortisation and impairment losses at the beginning of the year | ||||||
Amortisation for the year | ||||||
Impairment losses for the year | ||||||
Amortisation and impairment losses reversed on disposals during the year | ( | ( | ||||
Effect of exchange rate adjustment | ( | ( | ( | |||
Amortisation and impairment losses at the end of the year | ||||||
Carrying amount at the end of the year | ||||||
2024 | ||||||
Cost at the beginning of the year | ||||||
Additions from acquisition of businesses (note 5.3)1 | ||||||
Additions during the year | ||||||
Disposals during the year | ( | ( | ( | |||
Effect of exchange rate adjustment | ||||||
Cost at the end of the year | ||||||
Amortisation and impairment losses at the beginning of the year | ||||||
Amortisation for the year | ||||||
Impairment losses for the year | ||||||
Amortisation and impairment losses reversed on disposals during the year | ( | ( | ( | |||
Effect of exchange rate adjustment1 | ||||||
Amortisation and impairment losses at the end of the year | ||||||
Carrying amount at the end of the year | ||||||
1. Comparatives were restated to reflect changes in the provisional purchase price allocation from business combination in 2024. | ||||||
– – – | Novo Nordisk Annual Report 2025 / Financial statements / Consolidated financial statements / Notes to the Consolidated financial statements / Section 3 Operating assets and liabilities | 95 | |
DKK million | 2025 | 2024 | ||
Cost at the beginning of the year | ||||
Additions during the year1 | ||||
Effect of exchange rate adjustment | ( | |||
Cost at the end of the year | ||||
Carrying amount at the end of the year | ||||
1. Comparatives were restated to reflect changes in the provisional purchase price allocation from business combination in 2024. Reference is made to note 5.3. | ||||
– – – | Novo Nordisk Annual Report 2025 / Financial statements / Consolidated financial statements / Notes to the Consolidated financial statements / Section 3 Operating assets and liabilities | 96 | |
Depreciation | |||||
DKK million | 2025 | 2024 | 2023 | ||
Cost of goods sold | |||||
Sales and distribution costs | |||||
Research and development costs | |||||
Administrative costs | |||||
Other operating income and expenses | |||||
Total depreciation | |||||
Of which related to leased assets | |||||
Impairment losses and reversals | |||||
DKK million | 2025 | 2024 | 2023 | ||
Cost of goods sold | |||||
Sales and distribution costs | |||||
Research and development costs | |||||
Other operating income and expenses | |||||
Total impairment losses and reversals | |||||
Of which related to leased assets | |||||
DKK million | Land and buildings | Plant and machinery | Other equipment | Assets under construction | Property, plant and equipment | ||
2025 | |||||||
Cost at the beginning of the year | |||||||
Additions during the year | |||||||
Disposals during the year | ( | ( | ( | ( | ( | ||
Transfer and reclassifications | ( | ||||||
Effect of exchange rate adjustment | ( | ( | ( | ( | ( | ||
Cost at the end of the year | |||||||
Depreciation and impairment losses at the beginning of the year | |||||||
Depreciation for the year | |||||||
Impairment losses for the year | |||||||
Depreciation and impairment losses reversed on disposals during the year | ( | ( | ( | ( | ( | ||
Effect of exchange rate adjustment | ( | ( | ( | ( | |||
Depreciation and impairment losses at the end of the year | |||||||
Carrying amount at the end of the year | |||||||
2024 | |||||||
Cost at the beginning of the year | |||||||
Additions from acquisition of businesses (note 5.3)1 | |||||||
Additions during the year | |||||||
Disposals during the year | ( | ( | ( | ( | ( | ||
Transfer and reclassifications | ( | ||||||
Effect of exchange rate adjustment | |||||||
Cost at the end of the year | |||||||
Depreciation and impairment losses at the beginning of the year | |||||||
Depreciation for the year | |||||||
Impairment losses for the year | |||||||
Depreciation and impairment losses reversed on disposals during the year | ( | ( | ( | ( | ( | ||
Effect of exchange rate adjustment | |||||||
Depreciation and impairment losses at the end of the year | |||||||
Carrying amount at the end of the year | |||||||
1. Comparatives were restated to reflect changes in the provisional purchase price allocation from business combination in 2024. | |||||||
– – – | Novo Nordisk Annual Report 2025 / Financial statements / Consolidated financial statements / Notes to the Consolidated financial statements / Section 3 Operating assets and liabilities | 97 | |
Leased property, plant and equipment | |||
DKK million | 2025 | 2024 | |
Land and buildings | |||
Other equipment | |||
Total | |||
DKK million | 2025 | 2024 | ||
Raw materials | ||||
Work in progress | ||||
Finished goods | ||||
Total inventories (gross) | ||||
Write-downs at year-end | ( | ( | ||
Total inventories (net) | ||||
Indirect production costs included in work in progress and finished goods | ||||
Share of total inventories (net) | ||||
Movements in inventory write-downs: | ||||
Write-downs at the beginning of the year | ||||
Write-downs during the year | ||||
Utilisation of write-downs | ( | ( | ||
Reversal of write-downs | ( | ( | ||
Write-downs at the end of the year |
DKK million | Gross carrying amount | Loss allowance | Net carrying amount | ||
2025 | |||||
Not yet due | ( | ||||
1-90 days | ( | ||||
91-180 days | ( | ||||
181-270 days | ( | ||||
271-360 days | ( | ||||
More than 360 days past due | ( | ||||
Trade receivables | ( | ||||
2024 | |||||
Not yet due | ( | ||||
1-90 days | ( | ||||
91-180 days | ( | ||||
181-270 days | ( | ||||
271-360 days | ( | ||||
More than 360 days past due | ( | ||||
Trade receivables | ( |
Allowance for doubtful trade receivables | ||||
DKK million | 2025 | 2024 | ||
Carrying amount at the beginning of the year | ||||
Reversal of allowance on realised losses | ( | ( | ||
Net movement recognised in income statement | ||||
Effect of exchange rate adjustment | ( | ( | ||
Allowance at the end of the year | ||||
– – – | Novo Nordisk Annual Report 2025 / Financial statements / Consolidated financial statements / Notes to the Consolidated financial statements / Section 3 Operating assets and liabilities | 98 | |
DKK million | Provisions for legal disputes | Other provisions2 | 2025 Total | Provisions for legal disputes | Other provisions2 | 2024 Total | |||||
At the beginning of the year | |||||||||||
Additional provisions, including increases to existing provisions | |||||||||||
Additional provisions from acquisition of businesses (note 5.3) 1 | |||||||||||
Amount used during the year | ( | ( | ( | ( | ( | ||||||
Adjustments regarding prior years, including unused amounts reversed during the year | ( | ( | ( | ( | ( | ( | |||||
Effect of exchange rate adjustment | ( | ( | ( | ( | |||||||
At the end of the year | |||||||||||
Non-current liabilities3 | |||||||||||
Current liabilities | |||||||||||
1. Comparatives were restated to reflect changes in the provisional purchase price allocation from business combination in 2024. 2. Other provisions consist of various types of provisions, including contingent payments arising from business combinations and obligations in relation to employee benefits such as jubilee benefits. 3. For non-current liabilities related to legal disputes, the timing of settlement cannot be determined. | |||||||||||
– – – | Novo Nordisk Annual Report 2025 / Financial statements / Consolidated financial statements / Notes to the Consolidated financial statements / Section 3 Operating assets and liabilities | 99 | |
– – – | Novo Nordisk Annual Report 2025 / Financial statements / Consolidated financial statements / Notes to the Consolidated financial statements / Section 4 Capital structure and financial items | 100 | |
2025 | 2024 | 2023 | ||||
Net profit | DKK million | |||||
Average number of shares outstanding1 | in million shares | |||||
Average dilutive effect of restricted stock units | in million shares | |||||
Average number of shares outstanding, including dilutive effect | in million shares | |||||
Basic earnings per share | DKK | |||||
Diluted earnings per share | DKK | |||||
1. Excluding treasury shares. | ||||||
DKK million | 2025 | 2024 | 2023 | |
Interim dividend for the year | ||||
Dividend for prior year | ||||
Dividend payout in the year | ||||
Share repurchases for the year | ||||
Total distribution for the year |
DKK million | 2025 | 2024 | 2023 | |
Interim dividend1 | ||||
Final dividend2 | ||||
Total dividend |
DKK per share | 2025 | 2024 | 2023 | |
Interim dividend1 | ||||
Final dividend2 | ||||
Total dividend | ||||
1. Interim dividend was paid in August 2025. 2. Final dividend for 2025 is expected to be distributed pending approval at the Annual General Meeting in March 2026. Final dividend for 2024 was approved in March 2025 and paid in March 2025 (final dividend on A shares) and April 2025 (final dividend on B shares). | ||||
Number of shares (million) | A shares | B shares | Total issued shares | Treasury shares | Out- standing shares | ||
Shares beginning of 2024 | ( | ||||||
Shares cancelled in 2024 | ( | ( | |||||
Released allocated shares to employees | |||||||
Shares purchased in 2024 | ( | ( | |||||
Number of shares end of 2024 | ( | ||||||
Released allocated shares to employees | |||||||
Shares purchased in 2025 | ( | ( | |||||
Number of shares end of 2025 | ( |
– – – | Novo Nordisk Annual Report 2025 / Financial statements / Consolidated financial statements / Notes to the Consolidated financial statements / Section 4 Capital structure and financial items | 101 | |
Specification of Other reserves | |||||
DKK million | Exchange rate adjustments | Cash flow hedges1 | Tax and other items | Total | |
Reserve at 1 January 2023 | |||||
Other comprehensive income, net | ( | ( | ( | ||
Reserve at 31 December 2023 | ( | ( | |||
Other comprehensive income, net | ( | ( | |||
Transferred to intangible assets2 | ( | ( | |||
Reserve at 31 December 2024 | ( | ( | |||
Other comprehensive income, net | ( | ( | ( | ||
Reserve at 31 December 2025 | ( | ( | ( | ||
1. Refer to note 4.5 for information on cash flow hedges. 2. A gain from cash flow hedges related to acquisition of businesses of DKK reserve on an after-tax basis to the initial cost of net assets acquired leading to a net hedging effect of DKK | |||||
Type | Financial risk |
Foreign exchange risk | High |
Credit risk | Low |
Interest rate risk | Low |
Liquidity risk | Low |
Exchange rates applied for hedged currencies1 | |||
USD | CNY | JPY | |
Average exchange rate applied (DKK per 100) | |||
2025 | |||
2024 | |||
2023 | |||
Year-end exchange rate applied (DKK per 100) | |||
2025 | |||
2024 | |||
2023 | |||
1. Exchange rates applied for EUR are not included because the exchange rate risk exposure in EUR is regarded as low. | |||
Sensitivity on financial instruments of an immediate 5% decrease in currency rates on 31 December vs DKK2 | |||
DKK million | 2025 | 2024 | |
Sensitivity of all currencies | |||
Impact on profit before tax | ( | ( | |
Impact on equity | |||
Total | |||
Of which sensitivity to USD | |||
Impact on profit before tax | |||
Impact on equity | |||
Total | |||
2. An immediate | |||
– – – | Novo Nordisk Annual Report 2025 / Financial statements / Consolidated financial statements / Notes to the Consolidated financial statements / Section 4 Capital structure and financial items | 102 | |
Financial contracts coverage at year end | |||
Months | USD | CNY3 | JPY |
2025 | |||
2024 | |||
3. Chinese yuan traded offshore (CNH) is used to hedge Novo Nordisk's CNY currency exposure. | |||
Credit exposure for cash at bank, marketable securities and derivative financial instruments (fair value) | |||||||
DKK million | Cash at bank | Marketable securities | Derivative financial instruments | Total | |||
2025 | |||||||
AAA range | |||||||
AA range | |||||||
A range | |||||||
BBB range | |||||||
Not rated or below BBB range | |||||||
Total | |||||||
2024 | |||||||
AAA range | |||||||
AA range | |||||||
A range | |||||||
BBB range | |||||||
Not rated or below BBB range | |||||||
Total | |||||||
DKK million | 2025 | 2024 | 2023 | ||
US | |||||
Japan |
Financial reserves | |||||
DKK million | 2025 | 2024 | 2023 | ||
Cash at bank | |||||
Marketable securities | |||||
Undrawn committed credit facility4 | |||||
Undrawn bridge facility | |||||
Borrowings | ( | ( | ( | ||
Financial reserves | |||||
4. The undrawn committed credit facility comprises a facility of EUR The facility matures in 2030. | |||||
– – – | Novo Nordisk Annual Report 2025 / Financial statements / Consolidated financial statements / Notes to the Consolidated financial statements / Section 4 Capital structure and financial items | 103 | |
2025 | 2024 | ||||||||
DKK million | Average rate | Contract amount at year-end | Positive fair value at year-end | Negative fair value at year-end | Average rate | Contract amount at year-end | Positive fair value at year-end | Negative fair value at year-end | |
Cash flow hedges | |||||||||
Forward contracts USD | |||||||||
Forward contracts CNH and JPY | |||||||||
Forward contracts recognised in other comprehensive income | |||||||||
Fair value hedges | |||||||||
Forward contracts USD | |||||||||
Forward contracts EUR1 | |||||||||
Forward contracts CNH, JPY and others | |||||||||
Forward contracts recognised in the income statement | |||||||||
Total derivative financial instruments | |||||||||
1.The EUR forward contracts hedge the Eurobonds, see note 4.6. Despite the foreign exchange risk from EUR being considered low, the Eurobonds are hedged due to the size of the outstanding balance. | |||||||||
– – – | Novo Nordisk Annual Report 2025 / Financial statements / Consolidated financial statements / Notes to the Consolidated financial statements / Section 4 Capital structure and financial items | 104 | |
Liabilities arising from financing activities | Non-cash movements | ||||||||
DKK million | Beginning of the year | Re- payments | Proceeds | Additions1 | Disposals | Exchange rates | Other | End of the year | |
2025 | |||||||||
Lease liabilities | ( | ( | ( | ||||||
Eurobonds | ( | ||||||||
Loans | ( | ( | |||||||
Commercial papers | ( | ||||||||
Bank overdrafts | ( | ( | ( | ||||||
Total borrowings | ( | ( | ( | ||||||
2024 | |||||||||
Lease liabilities | ( | ( | |||||||
Eurobonds | ( | ||||||||
Loans | |||||||||
Commercial papers | ( | ||||||||
Bank overdrafts | ( | ||||||||
Total borrowings | ( | ( | |||||||
1. Non-cash additions in 2024 include additions from acquisitions of businesses. | |||||||||
Issuance of Eurobonds | Nominal value in millions | |||
Interest | Issue date | Maturity | EUR | DKK |
May 2024 | May 2026 | |||
3mEuribor + | May 2025 | May 2027 | ||
Mar 2022 | Sep 2027 | |||
3mEuribor + | Nov 2025 | Nov 2027 | ||
May 2025 | May 2028 | |||
Jun 2021 | Jun 2028 | |||
May 2024 | Jan 2029 | |||
Nov 2025 | Feb 2029 | |||
Mar 2022 | Mar 2030 | |||
May 2025 | Aug 2030 | |||
May 2024 | Jan 2031 | |||
Nov 2025 | Feb 2032 | |||
May 2025 | May 2033 | |||
May 2024 | May 2034 | |||
Nov 2025 | Feb 2035 | |||
May 2025 | May 2037 | |||
Nov 2025 | Feb 2038 | |||
Nov 2025 | Nov 2045 | |||
– – – | Novo Nordisk Annual Report 2025 / Financial statements / Consolidated financial statements / Notes to the Consolidated financial statements / Section 4 Capital structure and financial items | 105 | |
Contractual undiscounted cash flows | 2025 | |||||
DKK million | Leases | Eurobonds | Loans | Commercial papers | Bank overdrafts | Total |
2025 | ||||||
Within 1 year | ||||||
1-3 years | ||||||
3-5 years | ||||||
More than 5 years | ||||||
Total | ||||||
Carrying amount end of the year | ||||||
Non-current borrowings | ||||||
Current borrowings | ||||||
2024 | ||||||
Within 1 year | ||||||
1-3 years | ||||||
3-5 years | ||||||
More than 5 years | ||||||
Total | ||||||
Carrying amount end of the year | ||||||
Non-current borrowings | ||||||
Current borrowings | ||||||
– – – | Novo Nordisk Annual Report 2025 / Financial statements / Consolidated financial statements / Notes to the Consolidated financial statements / Section 4 Capital structure and financial items | 106 | |
Other non-cash items | |||||
DKK million | 2025 | 2024 | 2023 | ||
Interest income and interest expenses, net (note 4.9) | ( | ( | |||
Capital gain/(loss) on investments, net (note 4.9) | ( | ||||
Results of associated companies (note 4.9) | ( | ||||
Share-based payment costs (note 5.1) | |||||
Increase/(decrease) in provisions and retirement benefit obligations1 | ( | ||||
Exchange rate effects on provisions and retirement benefit obligations1 | ( | ||||
Adjustment for remeasurements of retirement benefit obligations | ( | ||||
Adjustment of provisions and retirement benefit obligations related to acquisition of businesses | ( | ||||
Unrealised gain/(loss) on fair value hedge through profit or loss (note 4.9) | ( | ( | |||
Unrealised gain/(loss) from foreign exchange | ( | ||||
Other | ( | ( | ( | ||
Total other non-cash items1 | ( | ||||
1. Amounts relating to the reclassification from 'provisions' to 'sales deductions and product returns' in 2024 and 2023 have been reclassified from 'Other non-cash items' to 'Changes in working capital'. | |||||
Change in working capital | |||||
DKK million | 2025 | 2024 | 2023 | ||
Inventories | ( | ( | ( | ||
Trade receivables | ( | ( | |||
Other current receivables and prepayments | ( | ( | |||
Sales deductions and product returns1 2 | ( | ||||
Trade payables2 | |||||
Other liabilities2 | |||||
Other non-current receivables and prepayments | ( | ( | ( | ||
Adjustment for payables related to non-current assets | ( | ( | |||
Adjustment related to acquisition (note 5.3) of businesses | |||||
Adjustment related to settlement for prior year's acquisition of businesses (note 5.3) | ( | ||||
Change in working capital including exchange rate adjustments | ( | ||||
Exchange rate adjustments1 | ( | ||||
Cash flow change in working capital1 | |||||
1. Amounts relating to the reclassification from 'provisions' to 'sales deductions and product returns relating to 2024 and 2023 have been reclassified from 'Other non-cash items' to 'Changes in working capital'. 2. Amounts included in 'sales deductions and product returns relating to 2024 and 2023 have been reclassified from 'trade payables' and 'other liabilities'. | |||||
– – – | Novo Nordisk Annual Report 2025 / Financial statements / Consolidated financial statements / Notes to the Consolidated financial statements / Section 4 Capital structure and financial items | 107 | |
Financial instruments by measurement category | ||||||||||||
2025 | 2024 | |||||||||||
DKK million | Amortised cost | Fair value through the income statement | Fair value through other comprehensive income | Derivatives used as hedging instruments | Total | Amortised cost4 | Fair value through the income statement4 | Fair value through other comprehensive income | Derivatives used as hedging instruments | Total | ||
Other receivables and prepayments1 | — | — | — | — | — | |||||||
Other financial assets | — | — | — | — | ||||||||
Trade receivables (note 3.5) | — | — | — | — | ||||||||
Marketable securities | — | — | — | — | — | — | ||||||
Derivative financial instruments (note 4.5) | — | — | — | — | — | — | ||||||
Cash at bank (note 4.4) | — | — | — | — | — | — | ||||||
Financial assets at the end of the year | ||||||||||||
Borrowings (note 4.6) | — | — | — | — | — | — | ||||||
Other liabilities2,3 | — | — | — | — | — | — | ||||||
Trade payables3 | — | — | — | — | — | — | ||||||
Sales deductions and product returns (note 2.1)3 | — | — | — | — | — | — | ||||||
Derivative financial instruments (note 4.5) | — | — | — | — | — | — | ||||||
Financial liabilities at the end of the year | — | — | — | — | ||||||||
1. The balance sheet item 'other receivables and prepayments' includes prepayments and VAT receivables amounting to DKK 2. The balance sheet item 'other liabilities' includes VAT and duties payable amounting to DKK 3. Comparatives were restated to reflect the new balance sheet item 'sales deductions and product returns' and the reclassification of confirmed sales rebates from 'trade payables' and 'other liabilities' to 'sales deductions and product returns'. Reference is made to note 2.1. 4. Comparatives for 'other receivables and prepayments' were restated to reflect changes in the provisional purchase price allocation from business combination in 2024. Reference is made to note 5.3. | ||||||||||||
Fair value measurement hierarchy | ||||
DKK million | 2025 | 2024 | ||
Active market data (level 1) | ||||
Directly or indirectly observable market data (level 2) | ||||
Not based on observable market data (level 3)1 | ||||
Total financial assets at fair value | ||||
Directly or indirectly observable market data (level 2) | ||||
Total financial liabilities at fair value | ||||
1. Comparatives were restated to reflect changes in the provisional purchase price allocation from business combination in 2024. Reference is made to note 5.3. | ||||
– – – | Novo Nordisk Annual Report 2025 / Financial statements / Consolidated financial statements / Notes to the Consolidated financial statements / Section 4 Capital structure and financial items | 108 | |
DKK million | 2025 | 2024 | 2023 | ||
Financial income | |||||
Interest income1 | |||||
Foreign exchange gain (net) | |||||
Financial gain from forward contracts (net) | |||||
Capital gain on investments | |||||
Capital gain on marketable securities | |||||
Result of associated companies | |||||
Total financial income | |||||
Financial expenses | |||||
Interest expenses on debts and borrowings | |||||
Foreign exchange loss (net) | |||||
Financial loss from forward contracts (net) | |||||
Capital loss on investments | |||||
Capital loss on marketable securities | |||||
Result of associated companies | |||||
Other financial expenses | |||||
Total financial expenses | |||||
1. Interest income include DKK income statement (2024: DKK income is derived from financial assets at amortised cost. | |||||
Financial impact from forward contracts, specified | |||||
DKK million | 2025 | 2024 | 2023 | ||
Income/(loss) transferred from other comprehensive income | ( | ||||
Realised fair value adjustment of transferred contracts | ( | ||||
Unrealised fair value adjustments of forward contracts2 | ( | ||||
Realised foreign exchange gain/(loss) on forward contracts | ( | ||||
Financial income/(expense) from forward contracts | ( | ||||
2. Refer to note 4.5 for information on open fair value hedge contracts at 31 December. | |||||
– – – | Novo Nordisk Annual Report 2025 / Financial statements / Consolidated financial statements / Notes to the Consolidated financial statements / Section 5 Other disclosures | 109 | |
Share-based payment expensed in the income statement | ||||
DKK million | 2025 | 2024 | 2023 | |
Restricted stock units to employees | ||||
Long-term share-based incentive programme (Management Board) | ||||
Long-term share-based incentive programme (Management group below Management Board) | ||||
Restricted stock units to individual employees | ||||
Share-based payment expensed in the income statement | ||||
General terms and conditions of 2025-2023 programmes | |||||||||||||||||
100 year anniversary programme | Management Board | Management group below Management Board | Individual employees | ||||||||||||||
Year of launch | 2023 | 2025 | 2024 | 2023 | 2025 | 2024 | 2023 | 2025 | 2024 | 2023 | |||||||
Preliminary number of shares outstanding1 (million) | |||||||||||||||||
Fair value per restricted stock unit at grant date (DKK) | |||||||||||||||||
Performance and vesting period | 2023 to 2026 | 2025 to 2027 | 2024 to 2026 | 2023 to 2025 | 2025 to 2027 | 2024 to 2026 | 2023 to 2025 | 2025 to 2028 | 2024 to 2027 | 2023 to 2026 | |||||||
Allocation date | Aug 2026 | Feb 2028 | Feb 2027 | Feb 2026 | Feb 2028 | Feb 2027 | Feb 2026 | 2028 | 2027 | 2026 | |||||||
Amortisation period | |||||||||||||||||
1. The number of shares to be allocated at target under the LTIPs to Management Board and management group below Management Board, respectively, may potentially be reduced or increased depending on whether Novo Nordisk's performance during the to targets determined by the Board of Directors. The maximum number is capped. | |||||||||||||||||
– – – | Novo Nordisk Annual Report 2025 / Financial statements / Consolidated financial statements / Notes to the Consolidated financial statements / Section 5 Other disclosures | 110 | |
Contractual obligations not recognised in the balance sheet | |||||
DKK million (undiscounted) | Current | Non- current | Total | ||
2025 | |||||
Leases1 | |||||
Research and development obligations | |||||
Research and development – potential milestone payments2 | |||||
Commercial product launch – potential milestone payments2 | |||||
Purchase obligations relating to investments in property, plant and equipment | |||||
Purchase obligations relating to contract manufacturers | |||||
Other purchase obligations | |||||
Total obligations not recognised in the balance sheet | |||||
2024 | |||||
Leases1 | |||||
Research and development obligations | |||||
Research and development – potential milestone payments2 | |||||
Commercial product launch – potential milestone payments2 | |||||
Purchase obligations relating to investments in property, plant and equipment | |||||
Purchase obligations relating to contract manufacturers | |||||
Other purchase obligations | |||||
Total obligations not recognised in the balance sheet | |||||
Fair value recognised at date of acquisition (final) | ||||
2024 | ||||
Fill-finish sites | Other acquisi- tions | |||
DKK million | Provisional | Final | Total | |
Know-how | ||||
Intellectual property rights and other intangible assets | ||||
Property, plant and equipment | ||||
Deferred tax assets (liabilities), net | ( | |||
Provisions | ( | ( | ( | |
Other net assets | ( | |||
Net identifiable assets acquired | ||||
Goodwill | ||||
Purchase price | ||||
Settlement from closing mechanism (receivable) | ||||
Settlement of pre-existing relationships | ( | ( | ( | |
Cash consideration transferred | ||||
Cash acquired | ( | ( | ( | |
Cash used for acquisition of businesses; net of cash acquired | ||||
– – – | Novo Nordisk Annual Report 2025 / Financial statements / Consolidated financial statements / Notes to the Consolidated financial statements / Section 5 Other disclosures | 111 | |
Material transactions with related parties | ||||
DKK million | 2025 | 2024 | 2023 | |
Novo Holdings A/S | ||||
Purchase of Novo Nordisk B shares | ||||
Acquisition of fill-finish sites (note 5.3) | ||||
Settlement for prior year's acquisition of fill-finish sites (note 5.3) | ( | |||
Dividend payment to Novo Holdings A/S | ||||
Services provided by Novo Nordisk | ( | ( | ( | |
Subsidiaries of Novo Holding A/S | ||||
•Catalent Group | ||||
Services provided by Catalent | ||||
•Novonesis Group | ||||
Services provided by Novo Nordisk | ( | ( | ( | |
Services provided by Novonesis | ||||
Assets purchased from Novonesis | ||||
•Altasciences Group | ||||
Services provided by Altasciences | ||||
•Other subsidiaries | ||||
Services provided to Novo Nordisk | ||||
NNIT Group | ||||
Services provided by NNIT | ||||
– – – | Novo Nordisk Annual Report 2025 / Financial statements / Consolidated financial statements / Notes to the Consolidated financial statements / Section 5 Other disclosures | 112 | |
Remuneration to Executives and Board of Directors | |||||
DKK million | 2025 | 2024 | 2023 | ||
Salary and short-term incentive | |||||
Pension | |||||
Benefits | |||||
Long-term incentive1 | |||||
Termination payments2 | |||||
Executives in total3, 4 | |||||
Fees to Board of Directors5 | |||||
Total | |||||
1. Refer to note 5.1 for further information on share-based payment schemes. 2. Includes recruitment-related payments for all years which for 2025 amounted to DKK 6 million. 3. Total remuneration for persons registered as members of Executive Management with the Danish Business Authority amounts to DKK 2023). 4. Executive Management comprises the Chief Executive Officer, Executive Vice Presidents and two Senior Vice Presidents. The remuneration disclosed includes only the Executives, meaning the Chief Executive Officer and Executive Vice Presidents. 5. All members of the Board of Directors are registered with the Danish Business Authority. Fees paid to observers in Novo Nordisk's board meetings amounted to DKK included in the table above (no payments to observers in 2024 and 2023). | |||||
DKK million | 2025 | 2024 | 2023 | ||
Statutory audit1 | |||||
Audit-related services | |||||
Tax advisory services | |||||
Other services | |||||
Total fees to statutory auditors | |||||
1. Statutory audit fees in 2024 include DKK acquisitions. | |||||
– – – | Novo Nordisk Annual Report 2025 / Financial statements / Consolidated financial statements / Notes to the Consolidated financial statements / Section 5 Other disclosures | 113 | |
Activity: | • | Sales and marketing | • | Production |
• | Research and development | • | Services/investments |
Company and country | Activity | |||||
Parent company | ||||||
Novo Nordisk A/S, Denmark | • | • | • | • | ||
Subsidiaries by geographical area | ||||||
Company and country | Percentage of shares owned | Activity | ||||
US Operations | ||||||
Novo Nordisk Inc., US | • | |||||
Novo Nordisk Pharmaceutical Industries LP, US | • | |||||
Novo Nordisk Pharmatech US, Inc., US | • | |||||
Novo Nordisk Pharma, Inc., US | • | |||||
Novo Nordisk Corporate Development US, Inc., US | • | |||||
Novo Nordisk Research & Development US, Inc., US | • | |||||
Novo Nordisk US Bio Production, Inc., US | • | |||||
Novo Nordisk US Holdings Inc., US | • | |||||
Akero Therapeutics Inc., US | • | |||||
Catalent Indiana LLC, US | • | |||||
Dicerna Pharmaceuticals, Inc., US | • | |||||
Emisphere Technologies, Inc., US | • | |||||
Forma Therapeutics, Inc., US | • | |||||
International Operations | ||||||
Aldaph SpA, Algeria | • | • | ||||
Novo Nordisk Pharma Argentina S.A., Argentina | • | |||||
Novo Nordisk Pharmaceuticals Pty. Ltd., Australia | • | |||||
Novo Nordisk Pharma GmbH, Austria | • | |||||
Novo Nordisk Azerbaijan LLC, Azerbaijan | • | |||||
Novo Nordisk Pharma (Private) Limited, Bangladesh | • | |||||
Novo Nordisk Production Belgium S.A, Belgium | • | |||||
S.A. Novo Nordisk Pharma N.V., Belgium | • | |||||
Novo Nordisk Pharma d.o.o., Bosnia and Herzegovina | • | |||||
Novo Nordisk Farmacêutica do Brasil Ltda., Brazil | • | |||||
Novo Nordisk Produção Farmacêutica do Brasil Ltda., Brazil | • | |||||
Novo Nordisk Pharma EAD, Bulgaria | • | |||||
Inversago Pharma Inc., Canada | • | |||||
Novo Nordisk Canada Inc., Canada | • | |||||
Novo Nordisk Farmacéutica Limitada, Chile | • | |||||
Beijing Novo Nordisk Pharmaceuticals Science & Technology Co., Ltd., China | • | |||||
Novo Nordisk (China) Pharmaceuticals Co. Ltd., China | • | • | ||||
Novo Nordisk Region China A/S, Denmark | • | |||||
Novo Nordisk (Shanghai) Pharma Trading Co., Ltd., China | • | |||||
Novo Nordisk Colombia SAS, Colombia | • | |||||
Company and country | Percentage of shares owned | Activity | ||||
Novo Nordisk Hrvatska d.o.o., Croatia | • | |||||
Novo Nordisk Production Czech s.r.o, Czech Republic | • | |||||
Novo Nordisk s.r.o., Czech Republic | • | |||||
Novo Nordisk Denmark A/S, Denmark | • | |||||
Novo Nordisk North America Operations A/S, Denmark | • | |||||
Novo Nordisk Pharmaceuticals A/S, Denmark | • | |||||
Novo Nordisk Pharma Operations A/S, Denmark | • | • | ||||
Novo Nordisk Region AAMEO and LATAM A/S, Denmark | • | |||||
Novo Nordisk Region Europe A/S, Denmark | • | |||||
Novo Nordisk Region Japan & Korea A/S, Denmark | • | |||||
Novo Nordisk Pharmatech A/S, Denmark | • | • | ||||
Novo Nordisk Egypt LLC, Egypt | • | |||||
Novo Nordisk Egypt Pharmaceuticals Ltd., Egypt | • | |||||
Novo Nordisk Estonia OÜ, Estonia | • | |||||
Novo Nordisk Farma OY, Finland | • | |||||
Biocorp Production S.A., France | • | • | ||||
Novo Nordisk Production SAS, France | • | |||||
Novo Nordisk, France | • | |||||
Cardior Pharmaceuticals GmbH, Germany | • | |||||
Novo Nordisk Pharma GmbH, Germany | • | |||||
Novo Nordisk Hellas Epe., Greece | • | |||||
Novo Nordisk Hong Kong Limited, Hong Kong | • | |||||
Novo Nordisk Hungária Kft., Hungary | • | |||||
Novo Nordisk India Private Limited, India | • | |||||
Novo Nordisk Service Centre (India) Pvt. Ltd., India | • | |||||
PT. Novo Nordisk Indonesia, Indonesia | • | |||||
Novo Nordisk Pars Co. (PJS), Iran | • | • | ||||
Novo Nordisk Limited, Ireland | • | |||||
Novo Nordisk Production Ireland Ltd., Ireland | • | |||||
Novo Nordisk Ltd, Israel | • | |||||
Catalent Anagni S.R.L, Italy | • | |||||
Novo Nordisk S.P.A., Italy | • | |||||
Novo Nordisk Pharma Ltd., Japan | • | • | ||||
Novo Nordisk Kazakhstan LLP, Kazakhstan | • | |||||
Novo Nordisk Kenya Ltd., Kenya | • | |||||
Novo Nordisk Latvia SIA, Latvia | • | |||||
Novo Nordisk Pharma SARL, Lebanon | • | |||||
UAB Novo Nordisk Pharma, Lithuania | • | |||||
Novo Nordisk Pharma (Malaysia) Sdn Bhd, Malaysia | • | |||||
Novo Nordisk Pharma Operations (Business Area) Sdn, Malaysia | • | |||||
Novo Nordisk Mexico S.A. de C.V., Mexico | • | |||||
Novo Nordisk Service Centre Mexico, S.A., Mexico | • | |||||
Novo Nordisk Pharma SAS, Morocco | • | |||||
Novo Nordisk B.V., Netherlands | • | |||||
Company and country | Percentage of shares owned | Activity | ||||
Novo Nordisk Finance (Netherlands) B.V., Netherlands | • | |||||
Novo Nordisk Pharmaceuticals Ltd., New Zealand | • | |||||
Novo Nordisk Pharma Limited, Nigeria | • | |||||
Novo Nordisk Farma dooel, North Macedonia | • | |||||
Novo Nordisk Norway AS, Norway | • | |||||
Novo Nordisk Pharma (Private) Limited, Pakistan | • | |||||
Novo Nordisk Panama S.A., Panama | • | |||||
Novo Nordisk Peru S.A.C., Peru | • | |||||
Novo Nordisk Pharmaceuticals (Philippines) Inc., Philippines | • | |||||
Novo Nordisk Pharma Sp.z.o.o., Poland | • | |||||
Novo Nordisk Pharmaceutical Services Sp. z.o.o., Poland | • | |||||
Novo Nordisk Portugal, Lda., Portugal | • | |||||
Novo Nordisk Farma S.R.L., Romania | • | |||||
Novo Nordisk Limited Liability Company, Russia | • | • | ||||
Novo Nordisk Production Support LLC, Russia | • | |||||
Novo Nordisk Saudi for Trading, Saudi Arabia | • | |||||
Novo Nordisk Regional Headquarters Company, Saudi Arabia | • | |||||
Novo Nordisk Pharma d.o.o. Belgrade (Serbia), Serbia | • | |||||
Novo Nordisk Pharma (Singapore) Pte Ltd., Singapore | • | |||||
Novo Nordisk Slovakia s.r.o., Slovakia | • | |||||
Novo Nordisk, d.o.o., Slovenia | • | |||||
Novo Nordisk (Pty) Limited, South Africa | • | |||||
Novo Nordisk Pharma Korea Ltd., South Korea | • | |||||
Novo Nordisk Pharma S.A., Spain | • | |||||
Novo Nordisk Lanka (PVT) Ltd, Sri Lanka | • | |||||
Novo Nordisk Scandinavia AB, Sweden | • | |||||
Novo Nordisk Health Care AG, Switzerland | • | • | • | |||
Novo Nordisk Pharma AG, Switzerland | • | |||||
Novo Nordisk Pharma (Taiwan) Ltd., Taiwan | • | |||||
Novo Nordisk Pharma (Thailand) Ltd., Thailand | • | |||||
Novo Nordisk Tunisie SARL, Tunisia | • | |||||
Novo Nordisk Saglik Ürünleri Tic. Ltd. Sti., Turkey | • | |||||
Novo Nordisk Ukraine, LLC, Ukraine | • | |||||
Novo Nordisk Pharma Gulf FZE, United Arab Emirates | • | |||||
Novo Nordisk Limited, UK | • | |||||
Novo Nordisk Research Centre Oxford Limited, UK | • | |||||
Novo Nordisk Vietnam Ltd., Vietnam | • | |||||
Other subsidiaries and associated companies | ||||||
NNE A/S, Denmark | • | |||||
NNIT A/S, Denmark | • | |||||
CS Solar Fund XIV, LLC, US | • | |||||
– – – | Part of the Annual review – not audited | 114 | |
– – – | Part of the Annual review – not audited | 115 | |
Net sales in constant exchange rates | |||||
DKK million | 2025 | 2024 | 2023 | ||
Net sales IFRS | 309,064 | 290,403 | 232,261 | ||
Effect of exchange rate | 11,219 | 1,575 | 7,658 | ||
Net sales in constant exchange rates | 320,283 | 291,978 | 239,919 | ||
Net sales previous year | 290,403 | 232,261 | 176,954 | ||
% increase/(decrease) in reported currencies | 6.4% | 25.0% | 31.3% | ||
% increase/(decrease) in constant exchange rates | 10.3% | 25.7% | 35.6% | ||
Operating profit in constant exchange rates | |||||
DKK million | 2025 | 2024 | 2023 | ||
Operating profit IFRS | 127,658 | 128,339 | 102,574 | ||
Effect of exchange rate | 8,419 | 1,096 | 4,898 | ||
Operating profit in constant exchange rates | 136,077 | 129,435 | 107,472 | ||
Operating profit previous year | 128,339 | 102,574 | 74,809 | ||
% increase/(decrease) in reported currencies | (0.5%) | 25.1% | 37.1% | ||
% increase/(decrease) in constant exchange rates | 6.0% | 26.2% | 43.7% | ||
EBITDA and EBITDA growth at constant exchange rates | |||||
DKK million | 2025 | 2024 | 2023 | ||
Net profit IFRS | 102,434 | 100,988 | 83,683 | ||
Income taxes IFRS | 28,106 | 26,203 | 20,991 | ||
Financial income IFRS | (9,660) | (6,198) | (2,945) | ||
Financial expenses IFRS | 6,778 | 7,346 | 845 | ||
Operating profit (EBIT) IFRS | 127,658 | 128,339 | 102,574 | ||
Depreciation and amortisations IFRS | 14,666 | 8,545 | 7,289 | ||
Impairment losses and reversals IFRS | 7,316 | 10,562 | 2,124 | ||
EBITDA | 149,640 | 147,446 | 111,987 | ||
Effect of exchange rate | 8,632 | 1,146 | 5,043 | ||
EBITDA in constant exchange rates | 158,272 | 148,592 | 117,030 | ||
EBITDA previous year | 147,446 | 111,987 | 82,171 | ||
% increase/(decrease) in reported currencies | 1.5% | 31.7% | 36.3% | ||
% increase/(decrease) in constant exchange rates | 7.3% | 32.7% | 42.4% | ||
– – – | Part of the Annual review – not audited | 116 | |
Adjusted net profit and Adjusted diluted EPS | |||||
DKK million | 2025 | 2024 | 2023 | ||
Net profit IFRS | 102,434 | 100,988 | 83,683 | ||
Impairment losses and reversals on intangible assets1 IFRS | 2,760 | 9,513 | 1,414 | ||
Amortisations on intangible assets IFRS | 6,529 | 2,512 | 1,834 | ||
Major restructuring costs | 8,014 | — | — | ||
Tax effects of adjustments | (3,330) | (2,456) | (702) | ||
Adjusted net profit | 116,407 | 110,557 | 86,229 | ||
Average number of shares outstanding, including dilutive effect (million) | 4,447.7 | 4,463.0 | 4,494.8 | ||
Adjusted diluted EPS | 26.17 | 24.77 | 19.18 | ||
1. In 2025, impairment losses on intangible assets (DKK 2,760 million) include impairments related to substantial restructuring plans (DKK 1,352 million). These are detailed in the table 'Specification of major restructuring costs' | |||||
Specification of major restructuring costs | |||||
DKK million | Costs of goods sold | Sales and distributi on costs | Research and develop ment costs | Administ rative costs | 2025 |
Severance and termination benefits | 1,685 | 1,600 | 1,126 | 809 | 5,220 |
Committed expenses for contracts or projects terminated | — | — | 424 | — | 424 |
Impairment losses on property, plant and equipment | 1,369 | — | 1,001 | — | 2,370 |
Major restructuring costs excluded from Adjusted net profit | 3,054 | 1,600 | 2,551 | 809 | 8,014 |
Impairment losses on intangible assets | — | — | 1,352 | — | 1,352 |
Total major restructuring costs | 3,054 | 1,600 | 3,903 | 809 | 9,366 |
Free Cash Flow | |||||
DKK million | 2025 | 2024 | 2023 | ||
Net cash generated from operating activities IFRS | 119,102 | 120,968 | 108,908 | ||
Purchase of property,plant and equipment IFRS | (60,140) | (47,164) | (25,806) | ||
Purchase of intangible assets IFRS | (29,973) | (4,145) | (13,090) | ||
Cash used for acquisition of businesses IFRS | — | (82,163) | — | ||
Settlement for prior year's acquisition of businesses IFRS | 1,004 | — | — | ||
Proceeds from other financial assets IFRS | 30 | — | 33 | ||
Purchase of other financial assets IFRS | (225) | (786) | (271) | ||
Repayment of lease liabilities IFRS | (1,503) | (1,417) | (1,448) | ||
Free cash flow | 28,295 | (14,707) | 68,326 | ||
– – – | Part of the Annual review – not audited | 117 | |
Cash to earnings | |||||
DKK million | 2025 | 2024 | 2023 | ||
Free cash flow | 28,295 | (14,707) | 68,326 | ||
/ Net profit IFRS | 102,434 | 100,988 | 83,683 | ||
Cash to earnings | 27.6% | (14.6%) | 81.6% |
Net debt and Net debt/EBITDA | |||||
DKK million | 2025 | 2024 | 2023 | ||
Borrowings, non-current IFRS | (118,941) | (89,674) | (20,528) | ||
Borrowings, current IFRS | (12,017) | (13,113) | (6,478) | ||
Add-back of lease liabilities IFRS | 8,572 | 6,766 | 5,726 | ||
Cash at bank IFRS | 26,464 | 15,655 | 14,392 | ||
Marketable securities IFRS | 498 | 10,653 | 15,838 | ||
Net debt | (95,424) | (69,713) | 8,950 | ||
EBITDA | 149,640 | 147,446 | 111,987 | ||
Net debt/EBITDA | 64% | 47% | (8%) |
ROIC | |||||
DKK million | 2025 | 2024 | 2023 | ||
Operating profit after tax | 100,212 | 101,901 | 81,957 | ||
/ Average net operating assets | 254,687 | 159,548 | 92,566 | ||
ROIC in % | 39.3% | 63.9% | 88.5% | ||
DKK million | 2025 | 2024 | 2023 | ||
Equity IFRS | 194,047 | 143,486 | 106,561 | ||
Investment in associated companies | (366) | (400) | (410) | ||
Other financial assets | (2,141) | (2,277) | (1,253) | ||
Marketable securities | (498) | (10,653) | (15,838) | ||
Derivative financial instruments | (6,682) | (6,326) | (2,344) | ||
Cash at bank | (26,464) | (15,655) | (14,392) | ||
Borrowings – non-current | 118,941 | 89,674 | 20,528 | ||
Borrowings – current | 12,017 | 13,113 | 6,478 | ||
Derivative financial instruments | 2,026 | 7,531 | 1,272 | ||
Net operating assets | 290,880 | 218,493 | 100,602 |
DKK million | 2025 | 2024 | 2023 | ||
Operating profit IFRS | 127,658 | 128,339 | 102,574 | ||
Tax on operating profit (using effective tax rate) | (27,446) | (26,438) | (20,617) | ||
Operating profit after tax | 100,212 | 101,901 | 81,957 |
DKK million | 2025 | 2024 | 2023 | ||
Intangible assets | 110,208 | 90,804 | 55,941 | ||
Goodwill | 19,845 | 20,017 | 4,465 | ||
Property, plant and equipment | 208,378 | 161,680 | 90,961 | ||
Deferred income tax assets | 23,647 | 24,648 | 20,380 | ||
Other receivables and prepayments (non- current) | 5,864 | 4,016 | 1,430 | ||
Inventories | 49,623 | 40,849 | 31,811 | ||
Trade receivables | 70,856 | 71,949 | 64,770 | ||
Tax receivables | 4,848 | 2,853 | 2,423 | ||
Other receivables and prepayments (current) | 13,482 | 13,503 | 8,068 | ||
Deferred income tax liabilities | (6,611) | (5,515) | (10,162) | ||
Retirement benefit obligations | (861) | (903) | (742) | ||
Provisions (non-current) | (5,730) | (6,982) | (5,585) | ||
Sales deductions and product returns (non-current) | (1,051) | (1,456) | (1,064) | ||
Trade payables | (19,758) | (17,140) | (12,130) | ||
Tax payables | (8,416) | (9,716) | (7,116) | ||
Other liabilities (current) | (39,721) | (35,372) | (26,159) | ||
Provisions (current) | (374) | (289) | (132) | ||
Sales deductions and product returns (current) | (133,349) | (134,453) | (116,557) | ||
Net operating assets | 290,880 | 218,493 | 100,602 | ||
Average net operating assets | 254,687 | 159,548 | 92,566 |
– – – | Part of the Annual review – not audited | 118 | |
Part of the Annual review – not audited | 119 | ||
TAXES BY REGION (THREE-YEAR AVERAGE 2023-2025) | |||||
Region | Intellectual property rights1 | Production2 | Sales3 | Corporate income taxes (DKK billion) | Paid taxes (DKK billion) |
International Operations |  |  |  | 23.4 | 24.1 |
Denmark |  |  |  | 20.4 | 21.4 |
EUCAN (excl. Denmark) |  |  |  | 1.5 | 1.0 |
Emerging Markets |  |  |  | 0.3 | 0.4 |
APAC | |  |  | 0.3 | 0.4 |
Region China | | | | 0.9 | 1.0 |
US Operations | |  |  | 1.7 | 5.1 |
Total | 25.1 | 29.2 | |||
 | |||||
1: Intellectual property rights based on sales from where intellectual property rights are located. 2: Production based on number of production employees in the region. 3: Sales based on location of the customer. | |||||
– – – | Novo Nordisk Annual Report 2025 / Financial statements / Statements and auditor's report / Statement by the Board of Directors and Executive Management | 120 | |
Registered Executive Management | Board of Directors | |||||||||
Maziar Mike Doustdar President and Chief Executive Officer (CEO) | Karsten Munk Knudsen Chief Financial Officer (CFO) | Lars Rebien Sørensen Chair | Cees de Jong Vice Chair | Elisabeth Dahl Christensen | Stephan Engels | |||||
Liselotte Hyveled | Mette Bøjer Jensen | Britt Meelby Jensen | Kasim Kutay | |||||||
Tanja Villumsen | ||||||||||
DKK million | Note | 2025 | 2024 | ||
Net sales | 2 | 289,015 | 261,712 | ||
Cost of goods sold | 3 | (73,168) | (48,930) | ||
Gross profit | 215,847 | 212,782 | |||
Sales and distribution costs | 3 | (49,129) | (48,921) | ||
Research and development costs | 3 | (49,049) | (40,296) | ||
Administrative costs | 3 | (2,561) | (1,905) | ||
Other operating income and expenses | 1,095 | 692 | |||
Operating profit | 116,203 | 122,352 | |||
Profit in subsidiaries, net of tax | 8 | 7,070 | 8,578 | ||
Financial income | 4 | 10,348 | 6,230 | ||
Financial expenses | 4 | (10,495) | (12,568) | ||
Profit before income taxes | 123,126 | 124,592 | |||
Income taxes | (22,744) | (22,908) | |||
Net profit | 100,382 | 101,684 |
DKK million | Note | 2025 | 2024 | ||
Assets | |||||
Intangible assets | 6 | 86,049 | 93,202 | ||
Property, plant and equipment | 7 | 119,882 | 86,376 | ||
Financial assets | 8 | 145,275 | 116,186 | ||
Other receivables and prepayments | 9 | 5,697 | 3,429 | ||
Total non-current assets | 356,903 | 299,193 | |||
Raw materials | 13,678 | 11,075 | |||
Work in progress | 23,062 | 20,439 | |||
Finished goods | 6,276 | 5,038 | |||
Inventories | 43,016 | 36,552 | |||
Trade receivables | 3,115 | 3,289 | |||
Amounts owed by affiliated companies | 42,674 | 47,106 | |||
Tax receivables | — | 7 | |||
Other receivables and prepayments | 9 | 6,795 | 6,402 | ||
Receivables | 52,584 | 56,804 | |||
Marketable securities | 498 | 10,653 | |||
Derivative financial instruments | 11 | 6,682 | 6,326 | ||
Cash at bank | 21,112 | 11,750 | |||
Total current assets | 123,892 | 122,085 | |||
Total assets | 480,795 | 421,278 |
DKK million | Note | 2025 | 2024 | ||
Equity and liabilities | |||||
Share capital | 10 | 446 | 446 | ||
Net revaluation reserve | 12,907 | 18,952 | |||
Development costs reserve | 2,104 | 1,994 | |||
Reserve for cash flow hedges and exchange rate adjustments | 3,570 | (4,243) | |||
Proposed dividends | 35,330 | 35,100 | |||
Retained earnings | 137,475 | 91,074 | |||
Total equity | 191,832 | 143,323 | |||
Borrowings | 12 | 113,360 | 85,368 | ||
Deferred income tax liabilities | 5 | 5,802 | 4,886 | ||
Other provisions | 1,799 | 1,576 | |||
Total non-current liabilities | 120,961 | 91,830 | |||
Borrowings | 12 | 10,764 | 11,557 | ||
Derivative financial instruments | 11 | 2,026 | 7,531 | ||
Trade payables | 10,906 | 9,099 | |||
Amounts owed to affiliated companies | 119,090 | 137,678 | |||
Tax payables | 4,196 | 3,883 | |||
Other liabilities | 21,020 | 16,377 | |||
Total current liabilities | 168,002 | 186,125 | |||
Total liabilities | 288,963 | 277,955 | |||
Total equity and liabilities | 480,795 | 421,278 |
DKK million | Share capital | Net revaluation reserve | Development costs reserve | Reserve for cash flow hedges and exchange rate adjustments | Proposed dividends | Retained earnings | 2025 | 2024 | ||||||||
Balance at the beginning of the year | 446 | 18,952 | 1,994 | (4,243) | 35,100 | 91,074 | 143,323 | 105,682 | ||||||||
Net profit | 7,057 | 51,993 | 41,332 | 100,382 | 101,684 | |||||||||||
Dividend received from subsidiaries | (4,676) | 4,676 | — | — | ||||||||||||
Exchange rate adjustments | (7,692) | (67) | (7,759) | 3,066 | ||||||||||||
Development costs | 110 | (110) | — | — | ||||||||||||
Realisation of previously deferred (gains)/losses on cash flow hedges | 5,763 | 5,763 | (1,547) | |||||||||||||
Deferred gains/(losses) on cash flow hedges open at year-end | 4,339 | 4,339 | (5,763) | |||||||||||||
Transactions with owners: | ||||||||||||||||
Reduction of the B share capital | — | — | ||||||||||||||
Dividends paid during the period | (51,763) | (51,763) | (44,140) | |||||||||||||
Purchase of treasury shares | (1,439) | (1,439) | (20,181) | |||||||||||||
Share-based payments | 983 | 452 | 1,435 | 2,289 | ||||||||||||
Other adjustments | (1,717) | 1,791 | 74 | 401 | ||||||||||||
Tax on equity entries | (2,222) | (301) | (2,523) | 1,832 | ||||||||||||
Balance at the end of the year | 446 | 12,907 | 2,104 | 3,570 | 35,330 | 137,475 | 191,832 | 143,323 | ||||||||
Refer to note 4.3 in the Consolidated financial statements for details on the number of shares, treasury shares and total number of A and B shares in Novo Nordisk A/S. | ||||||||||||||||
Refer to note 4.2 in the Consolidated financial statements for details on the dividends paid and shares repurchased in Novo Nordisk A/S. | ||||||||||||||||
DKK million | 2025 | 2024 | ||
Net sales by segment | ||||
Obesity and Diabetes care | 288,847 | 261,556 | ||
Rare disease | 168 | 156 | ||
Total net sales | 289,015 | 261,712 | ||
Net sales by geographical segment | ||||
US Operations | 159,077 | 155,197 | ||
International Operations: | ||||
EUCAN | 57,313 | 47,855 | ||
Emerging Markets | 25,527 | 22,879 | ||
APAC | 17,506 | 12,425 | ||
Region China | 29,592 | 23,356 | ||
Total net sales | 289,015 | 261,712 |
DKK million | 2025 | 2024 | ||
Wages and salaries | 29,821 | 25,252 | ||
Share-based payment costs | 452 | 626 | ||
Pensions | 2,531 | 2,211 | ||
Other social security contributions | 466 | 417 | ||
Other employee costs | 1,548 | 1,371 | ||
Total employee costs | 34,818 | 29,877 | ||
Average number of full-time employees | 31,059 | 29,288 | ||
Year-end number of full-time employees | 26,773 | 31,096 |
DKK million | 2025 | 2024 | ||
Interest income relating to subsidiaries | 418 | 227 | ||
Interest income relating to external counterparties | 1,089 | 1,589 | ||
Foreign exchange gain (net) | 8,675 | — | ||
Financial gain from forward contracts (net) | — | 4,355 | ||
Capital gain from marketable securities (net) | — | 2 | ||
Other financial income | 166 | 57 | ||
Total financial income | 10,348 | 6,230 | ||
Interest expenses relating to subsidiaries | 6,369 | 6,763 | ||
Interest expense relating to external counterparties | 1,547 | 529 | ||
Result of associated company | 13 | 4 | ||
Foreign exchange loss (net) | — | 5,076 | ||
Financial loss from forward contracts (net) | 2,405 | — | ||
Capital loss from marketable securities (net) | 9 | — | ||
Other financial expenses | 152 | 196 | ||
Total financial expenses | 10,495 | 12,568 |
DKK million | 2025 | 2024 | ||
Net deferred tax asset/(liability) at the beginning of the year | (4,886) | (6,282) | ||
Income/(charge) to the income statement | 1,699 | (349) | ||
Additions from acquisitions | — | 254 | ||
Income/(charge) to equity | (2,615) | 1,491 | ||
Net deferred tax asset/(liability) at the end of the year | (5,802) | (4,886) |
DKK million | Intellectual property rights and similar rights | Software and other intangibles | 2025 | 2024 | |||||||||
Cost at the beginning of the year | 102,660 | 4,670 | 107,330 | 35,657 | |||||||||
Additions during the year | 3,561 | 439 | 4,000 | 72,692 | |||||||||
Disposals during the year | (1,184) | (31) | (1,215) | (1,019) | |||||||||
Cost at the end of the year | 105,037 | 5,078 | 110,115 | 107,330 | |||||||||
Amortisation and impairment losses at the beginning of the year | 12,015 | 2,113 | 14,128 | 6,902 | |||||||||
Amortisation during the year | 7,214 | 260 | 7,474 | 1,399 | |||||||||
Impairment losses for the year | 2,456 | 39 | 2,495 | 6,056 | |||||||||
Amortisation and impairment losses reversed on disposals during the year | — | (31) | (31) | (229) | |||||||||
Amortisation and impairment losses at the end of the year | 21,685 | 2,381 | 24,066 | 14,128 | |||||||||
Carrying amount at the end of the year | 83,352 | 2,697 | 86,049 | 93,202 | |||||||||
Intangible assets primarily relate to intellectual property rights and similar rights, which includes access to capacity asset (acquired in 2024) amounting to DKK 50,665 million (DKK 57,496 million in 2024), and software and other intangibles, which mainly consists of internally developed software and costs related to major IT projects. Intangible assets which are not yet available for use amount to DKK 15,854 million (DKK 17,610 million in 2024). For further information on impairments, refer to note 3.1 in the Consolidated financial statements. | |||||||||||||
DKK million | Land and buildings | Plant and machinery | Other equipment | Assets under construction | 2025 | 2024 | ||
Cost at the beginning of the year | 27,168 | 27,904 | 5,134 | 61,030 | 121,236 | 86,351 | ||
Additions during the year | 2,270 | 1,683 | 365 | 35,925 | 40,243 | 35,819 | ||
Disposals during the year | (99) | (162) | (145) | (3,211) | (3,617) | (934) | ||
Transfer from/(to) other items | 1,102 | 1,452 | 398 | (2,952) | — | — | ||
Cost at the end of the year | 30,441 | 30,877 | 5,752 | 90,792 | 157,862 | 121,236 | ||
Depreciation and impairment losses at the beginning of the year | 13,338 | 18,230 | 3,292 | — | 34,860 | 32,529 | ||
Depreciation for the year | 1,417 | 1,283 | 418 | — | 3,118 | 2,938 | ||
Impairment losses for the year | 64 | 186 | 105 | 3,211 | 3,566 | 322 | ||
Depreciation reversed on disposals during the year | (85) | (159) | (109) | (3,211) | (3,564) | (929) | ||
Depreciation and impairment losses at the end of the year | 14,734 | 19,540 | 3,706 | — | 37,980 | 34,860 | ||
Carrying amount at the end of the year | 15,707 | 11,337 | 2,046 | 90,792 | 119,882 | 86,376 | ||
Of which related to leased property, plant and equipment | 1,832 | — | 81 | — | 1,913 | 1,461 | ||
Leased property, plant and equipment primarily relates to lease of office buildings, warehouses, laboratories and vehicles. | ||||||||
DKK million | Investments in subsidiaries | Amounts owed by affiliated companies | Investment in associated company | Other securities and investments | 2025 | 2024 | ||
Cost at the beginning of the year | 93,778 | 2,839 | 105 | 963 | 97,685 | 63,171 | ||
Investments during the year | 33,757 | 1,703 | 82 | 35,542 | 34,990 | |||
Divestments and repayments during the year | (373) | (130) | (503) | (476) | ||||
Cost at the end of the year | 127,535 | 4,169 | 105 | 915 | 132,724 | 97,685 | ||
Value adjustments at the beginning of the year | 18,904 | (90) | 48 | (361) | 18,501 | 24,372 | ||
Profit/(loss) after tax | 7,070 | (13) | 7,057 | 8,574 | ||||
Dividends received | (4,676) | (4,676) | (21,762) | |||||
Divestments during the year | 94 | 94 | — | |||||
Effect of exchange rate adjustment charged to the income statement | 63 | 63 | 42 | |||||
Effect of exchange rate adjustment charged to equity | (7,692) | (67) | (7,759) | 3,066 | ||||
Share-based payments | 983 | 983 | 1,663 | |||||
Other adjustments | (1,717) | 5 | (1,712) | 2,546 | ||||
Value adjustments at the end of the year | 12,872 | (157) | 35 | (199) | 12,551 | 18,501 | ||
Carrying amount at the end of the year | 140,407 | 4,012 | 140 | 716 | 145,275 | 116,186 | ||
The presentation of Financial assets was updated to enhance clarity and readability by grouping items into broader categories of a similar nature. Comparative figures impacted were restated accordingly without impact on net book values. | ||||||||
For a list of companies in the Novo Nordisk Group, refer to note 5.6 in the Consolidated financial statements. | ||||||||
DKK million | 2025 | 2024 | ||
Within 1 year | 10,764 | 11,557 | ||
1-5 years | 59,378 | 63,815 | ||
More than 5 years | 53,982 | 21,553 | ||
Total borrowings | 124,124 | 96,925 |
Parent company's share of transactions with related parties | |||
DKK million | 2025 | 2024 | |
Catalent Group | |||
Services provided by Catalent | 526 | — | |
Novonesis Group | |||
Services provided by Novo Nordisk | (37) | (38) | |
Services provided by Novonesis | 167 | 115 | |
Other subsidiaries of Novo Holding A/S | |||
Services provided to Novo Nordisk | 78 | 34 | |
NNIT Group | |||
Services provided by NNIT | 168 | 189 | |
DKK million | 2025 | 2024 | ||
Statutory audit1 | 14 | 14 | ||
Audit-related services | 4 | 3 | ||
Tax advisory services | 7 | 4 | ||
Other services | 6 | 13 | ||
Total fee to statutory auditors | 31 | 34 | ||
1. 2024 statutory audit fee includes DKK 5 million of additional fees mainly related to business acquisitions. | ||||
DKK million | 2025 | 2024 | ||
Commitments | ||||
Leases1,4 | 511 | 1,346 | ||
Research and development obligations | 21,523 | 31,511 | ||
Research and development - potential milestones2 | 18,744 | 33,614 | ||
Commercial product launch - potential milestones2 | 25,561 | 15,749 | ||
Purchase obligations relating to investments in property plant and equipment | 6,750 | 4,956 | ||
Purchase obligation relating to contract manufacturers | 91,031 | 71,061 | ||
Other purchase obligations4 | 5,618 | 6,338 | ||
Guarantees given for subsidiaries3 | 140,183 | 68,081 | ||
Other guarantees | 1,014 | 1,003 | ||
1. Lease commitments predominantly relate to lease agreements executed but not commenced and estimated variable property taxes and low value assets. 2. Potential milestone payments are associated with uncertainty because they are linked to successful achievements in research activities; refer to note 5.2 in the Consolidated financial statements. 3. Guarantees given for subsidiaries mainly relate to guarantees towards Novo Nordisk Finance (Netherlands) B.V. related to issuance of Eurobonds. 4. Committed service costs have been reclassified from ‘Leases’ to ‘Other purchase obligations’ to better reflect the nature of these commitments. Comparative figures have been restated accordingly. | ||||
– – – | 131 | ||
 | More information Additional reporting Novo Nordisk provides additional disclosure to satisfy legal requirements and stakeholder interests. Supplementary reports can be downloaded at: https://www.novonordisk.com/investors/annual-report.html (The contents of the company's website do not form a part of this Form 6-K), while additional information can be found at: https://www.novonordisk.com/ (The contents of the company's website do not form a part of this Form 6-K). Annual Report This Annual Report is Novo Nordisk’s full statutory Annual Report pursuant to Section 149(1) of the Danish Financial Statements Act. The statutory Annual Report will be presented and adopted at the Annual General Meeting on 26 March 2026 and will subsequently be submitted to and be available at the Danish Business Authority. The consolidated financial statements included in this Annual Report have been prepared in accordance with IFRS Accounting Standards (IFRS) as issued by the International Accounting Standards Board (IASB) and in accordance with IFRS Accounting Standards endorsed by the EU and further requirements in the Danish Financial Statements Act. The Sustainability statement included in this Annual Report has been prepared in accordance with the European Sustainability Reporting Standards (ESRS) as required by the Danish Financial Statement Act, as well as article 8 in the EU Taxonomy regulation. Form 20-F The Form 20-F is filed using a standardised reporting form so that investors can evaluate the company alongside US domestic equities. It is an annual reporting requirement of the US Securities and Exchange Commission (SEC) for foreign private issuers with equity shares listed on exchanges in the United States. Corporate Governance Report The Corporate Governance Report discloses Novo Nordisk’s compliance with corporate governance to meet the requirements of the Danish Financial Statements Act. Remuneration Report The Remuneration Report describes the remuneration awarded or due during 2025 to members of the Board and Executive Management registered with the Danish Business Authority in accordance with section 139b of the Danish Companies Act. The Remuneration Report is submitted to the Annual General Meeting for an advisory vote. Disclaimer The patients, employees and relatives portrayed in this Annual Report and ancillary reports have participated of their own accord and solely to express their own personal opinions on topics referred to, which do not necessarily reflect the views and opinions of Novo Nordisk. Use of the pictures as illustrations is in no way intended to associate the patients, employees or relatives with the promotion of any Novo Nordisk products. | |||
– – – | Novo Nordisk Annual Report 2025 / Additional Sustainability statement information (part of the Sustainability statement) | 132 | |
Policy | Most senior accountable | Scope | Internationally recognised instruments | Availability | Pages covered | ||
OneCode | Executive Management | All Representatives | UN Guiding Principles on Business and Human Rights | https:// www.novonordisk.co m/content/dam/ nncorp/global/en/ sustainable-business/ pdfs/esg-portal/ Cover_Code_of_condu ct.pdf (The contents of the company's website do not form a part of this Form 6-K) | 51, 52, 53, 55, 75-77 | ||
Labour Code of Conduct | Executive Management | All Employees* | ILO's Declaration on Fundamental Principles and Rights at Work | https:// www.novonordisk.co m/content/dam/ nncorp/global/en/ sustainable-business/ pdfs/esg-portal/ labour-code-of- conduct.pdf (The contents of the company's website do not form a part of this Form 6-K) | 57 | ||
Health and Safety | Executive Management | All Operations* | ISO 45001 | https:// www.novonordisk.co m/content/dam/ nncorp/global/en/ sustainable-business/ pdfs/esg-portal/ sustainability- statement/2025/ Health_and_safety.pdf (The contents of the company's website do not form a part of this Form 6-K) | 57, 59 | ||
Diversity and Inclusion | Executive Management | All Employees* | N/A | https:// www.novonordisk.co m/content/dam/ nncorp/global/en/ sustainable-business/ pdfs/esg-portal/ sustainability- statement/2025/ Diversity_and_inclusio n_policy.pdf (The contents of the company's website do not form a part of this Form 6-K) | 57, 60 | ||
Responsible Sourcing Standards | Senior VP of Global Solutions | Global Activities | UN Guiding Principles on Business and Human Rights OECD Guidelines for Multinational Enterprises on Responsible Business Conduct Eight ILO Conventions International Bill of Human Rights | https:// www.novonordisk.co m/content/dam/ nncorp/global/en/ contact/pdfs/2024- responsible-sourcing- standards.pdf (The contents of the company's website do not form a part of this Form 6-K) | 63, 71, 75, 77 | ||
Human Rights Commitment | Chief Compliance Officer | All Activities | International Bill of Human Rights ILO Declaration on Fundamental Principles and Rights at Work The Convention on the Rights of the Child | https:// www.novonordisk.co m/content/dam/ nncorp/global/en/ sustainable-business/ pdfs/esg-portal/novo- nordisk-human-rights- commitment-2022.pdf (The contents of the company's website do not form a part of this Form 6-K) | 51-52, 71 | ||
Environmental | Executive Management | Global Activities | ISO 14001 ISO 50001 | https:// www.novonordisk.co m/content/dam/ nncorp/global/en/ sustainable-business/ pdfs/esg-portal/ sustainability- statement/2025/ Environmental_policy. pdf (The contents of the company's website do not form a part of this Form 6-K) | 63, 68, 72, 74 | ||
Anti-retaliation | Chief Compliance Officer | All Representatives | N/A | https:// www.novonordisk.co m/content/dam/ nncorp/global/en/ sustainable-business/ pdfs/esg-portal/ sustainability- statement/2025/ Report_suspected_mis conduct.pdf (The contents of the company's website do not form a part of this Form 6-K) | 76 | ||
Global Procurement | Corporate VP of Corporate Procurement | All Sourced Goods and Services | N/A | N/A | 76 | ||
Bioethics Policy | Executive Management | Global Activities | Declaration of Helsinki ICH Good Clinical Practice Nuremberg Code Belmont Report UN Guiding Principles on Business and Human Rights UNESCO’s Universal Declaration on Bioethics and Human Right | https:// www.novonordisk.co m/content/dam/ nncorp/global/en/ sustainable-business/ pdfs/esg-portal/ sustainability- statement/2025/ Bioethics.pdf (The contents of the company's website do not form a part of this Form 6-K) | 75, 78 | ||
*Policies related to 'Own workforce' excludes NNE, as the subsidiary has its own process in place. | |||||||
– – – | Novo Nordisk Annual Report 2025 / Additional Sustainability statement information (part of the Sustainability statement) | 133 | |
Disclosure requirement | Data point | SFDR reference | Pillar 3 reference | Benchmark regulation reference | EU Climate Law reference | Page |
ESRS 2 GOV-1 | 21 (d) | x | x | 61 | ||
ESRS 2 GOV-1 | 21 (e) | x | 39 | |||
ESRS 2 GOV-4 | 30 | x | 47 | |||
ESRS 2 SBM-1 | 40 (d) i | x | x | x | Not applicable | |
ESRS 2 SBM-1 | 40 (d) ii | x | x | Not applicable | ||
ESRS 2 SBM-1 | 40 (d) iii | x | x | Not applicable | ||
ESRS 2 SBM-1 | 40 (d) iv | x | Not applicable | |||
ESRS E1-1 | 14 | x | 64 | |||
ESRS E1-1 | 16 (g) | x | x | Not material | ||
ESRS E1-4 | 34 | x | x | x | 64 | |
ESRS E1-5 | 38 | x | 65 | |||
ESRS E1-5 | 37 | x | 65 | |||
ESRS E1-5 | 40-43 | x | 65 | |||
ESRS E1-6 | 44 | x | x | x | 66 | |
ESRS E1-6 | 53-55 | x | x | x | 66 | |
ESRS E1-7 | 56 | x | Not applicable | |||
ESRS E1-9 | 66 | x | Phase-in | |||
ESRS E1-9 | 66 (a); 66 (c) | x | Phase-in | |||
ESRS E1-9 | 67 (c) | x | Phase-in | |||
ESRS E1-9 | 69 | x | Phase-in | |||
ESRS E2-4 | 28 | x | Not applicable | |||
ESRS E3-1 | 9 | x | 72 | |||
ESRS E3-1 | 13 | x | Not applicable | |||
ESRS E3-1 | 14 | x | Not applicable | |||
ESRS E3-4 | 28 (C) | x | 73 | |||
ESRS E3-4 | 29 | x | Not material | |||
ESRS 2- IRO 1 - E4 | 16 (a) i | x | Phase-in | |||
ESRS 2- IRO 1 - E4 | 16 (b) | x | Phase-in | |||
ESRS 2- IRO 1 - E4 | 16 (c) | x | 72, 73 | |||
ESRS E4-2 | 24 (b) | x | 72 | |||
ESRS E4-2 | 24 (c) | x | Not applicable | |||
ESRS E4-2 | 24 (d) | x | 72 |
Disclosure requirement | Data point | SFDR reference | Pillar 3 reference | Benchmark regulation reference | EU Climate Law reference | Page |
ESRS E5-5 | 37 (d) | x | 70 | |||
ESRS E5-5 | 39 | x | 70 | |||
ESRS 2- SBM 3 - S1 | 14 (f) | x | Not material | |||
ESRS 2- SBM 3 - S1 | 14 (g) | x | Not material | |||
ESRS S1-1 | 20 | x | Not material | |||
ESRS S1-1 | 21 | x | 57 | |||
ESRS S1-1 | 22 | x | Not material | |||
ESRS S1-1 | 23 | x | 59 | |||
ESRS S1-3 | 32 (c) | x | 58, 76 | |||
ESRS S1-14 | 88 (b), 88 (c) | x | x | 59 | ||
ESRS S1-14 | 88 (e) | x | Phase-in | |||
ESRS S1-16 | 97 (a) | x | x | 60 | ||
ESRS S1-16 | 97 (b) | x | 60 | |||
ESRS S1-17 | 103 (a) | x | 58 | |||
ESRS S1-17 | 104 (a) | x | x | Not material | ||
ESRS 2- SBM 3 - S2 | 11 (b) | x | 71 | |||
ESRS S2-1 | 17 | x | 71 | |||
ESRS S2-1 | 18 | x | 71 | |||
ESRS S2-1 | 19 | x | x | 71 | ||
ESRS S2-1 | 19 | x | 71 | |||
ESRS S2-4 | 36 | x | Phase-in | |||
ESRS S3-1 | 16 | x | Not material | |||
ESRS S3-1 | 17 | x | x | Not material | ||
ESRS S3-4 | 36 | x | Not material | |||
ESRS S4-1 | 16 | x | 52 | |||
ESRS S4-1 | 17 | x | x | 53, 55 | ||
ESRS S4-4 | 35 | x | Phase-in | |||
ESRS G1-1 | 10 (b) | x | Not applicable | |||
ESRS G1-1 | 10 (d) | x | Not applicable | |||
ESRS G1-4 | 24 (a) | x | x | 76 | ||
ESRS G1-4 | 24 (b) | x | 76 |
– – – | Novo Nordisk Annual Report 2025 / Additional Sustainability statement information (part of the Sustainability statement) | 134 | |
Table 3 – Disclosure requirements in ESRS covered by the Sustainability statement | Table 4 – List of incorporations by reference | |||||||||||||
ESRS 2 – General disclosures | ESRS E2 – Pollution | ESRS E5 – Resource use and circular economy | ESRS S2 – Workers in the value chain | ESRS disclosure requirement | Incorporation by reference | |||||||||
Disclosure requirement | Page | Disclosure requirement | Page | ESRS 2 GOV-1 (21 a-e, 22a-d, 23 a, b); G1 GOV-1 (5 a, b): Roles and responsibilities of the Board of Directors and Executive Management | See Annual review, section 'Governance' pages 35-40 (incl. Sustainability statement: table 3.3.3 'Diversity metrics – Management levels' on page 61). For additional details on Board competences, see Corporate Governance Report p. 4, section 'Board competences and composition' | |||||||||
BP-1: Basis for preparation | 47 | ESRS 2 IRO-1: Processes | 74 | Disclosure requirement | Page | Disclosure requirement | Page | |||||||
BP-2: Specific circumstances | 47 | E2-1: Policies | 74 | ESRS 2 IRO-1: Processes | 68 | ESRS 2 SBM 2: Stakeholders | 48 | |||||||
GOV-1: Governance roles | 40 | E2-2: Actions | 74 | E5-1: Policies | 68 | ESRS 2 SBM 3: Strategy | 71 | ESRS 2 GOV-2 (26 a-c): Overseeing sustainability matters and sustainability matters discussed; ESRS 2 GOV-5 (36e): Periodic reporting of risks | See Corporate Governance Report, page 4-7, sub-section ‘4. Board of Directors' and '5. Board Committees', Annual review, section 'Governance' pages 35-40, 'Sustainability commitment' pages 32-34, and 'Risk management' section pages 41-42 | |||||
GOV-2: Governance | 40 | E2-3: Targets | N/A | E5-2: Actions | 68, 69 | S2-1: Policies | 71 | |||||||
GOV-3: Incentives schemes | 40 | E2-4: Pollution | N/A | E5-3: Targets | 69 | S2-2: Processes | 71, 76 | |||||||
GOV-4: Due diligence | 47 | E2-5: Substances | 74 | E5-4: Resource inflows | 69 | S2-3: Remediate impacts | 71, 76 | ESRS 2 GOV-3 (29 a-e): Incentive schemes dependent on sustainability-related targets and performance metrics | See Remuneration Report, pages 13-15, 3.5 ‘Short-term incentive programme 2025’ and pages 16-19, 3.6-3.8 ‘Long-term incentive programmes 2023, 2024 and 2025– programme design’, page 5, table 1, rows: Short-term cash-based incentive programme and Long-term share-based incentive programme for the Board of Directors, and page 9, table 7, rows: Short-term incentive programme (STIP) and Long-term incentive programme (LTIP) for Executive Management | |||||
GOV-5: Risk management | 47 | E2-6: Financial effects | N/A | E5-5: Resource outflows | 69, 70 | S2-4: Actions | 71 | |||||||
SBM-1: Value chain | 10 | E5-6: Financial effects | N/A | S2-5: Targets | N/A | |||||||||
SBM-2: Stakeholders | 48 | ESRS E3 – Water and marine resources | ||||||||||||
SBM-3: Strategy | 9, 49 | ESRS S1 – Own workforce | ESRS S4 – Patient protection and quality of life | |||||||||||
IRO-1: Processes | 49 | Disclosure requirement | Page | Disclosure requirement | Page | ESRS E1, 13 (related to ESRS 2 GOV-3): Portion of total expensed remuneration to registered executives dependent on performance against climate related targets; ESRS 2 GOV-3 (29 d): Portion of total expensed variable remuneration to registered executives dependent on performance against ESG related targets | See Remuneration Report, pages 13-15, 3.5 ‘Short-term incentive programme 2025’, pages 16-19, 3.6-3.8 ‘Long-term incentive programmes 2023, 2024 and 2025– programme design’, and page 20, table 24 | |||||||
IRO-2: ESRS DR's covered | 134 | ESRS 2 IRO-1: Processes | 72 | ESRS 2 SBM 2: Stakeholders | 48 | Disclosure requirement | Page | |||||||
E3-1: Policies | 72 | ESRS 2 SBM 3: Strategy | 57 | ESRS 2 SBM 2: Stakeholders | 48 | |||||||||
ESRS E1 – Climate change | E3-2: Actions | 73 | S1-1: Policies | 57, 59, 60 | ESRS 2 SBM 3: Strategy | 51 | ||||||||
Disclosure requirement | Page | E3-3: Targets | N/A | S1-2: Processes | 57, 58, 76 | S4-1: Policies | 52, 53, 55 | |||||||
ESRS 2 GOV-3: Governance | 134 | E3-4: Water consumption | 73 | S1-3: Remediate impacts | 58, 76 | S4-2: Processes | 52, 55 | |||||||
E1-1: Transition plan | 63, 64, 65 | E3-5: Financial effects | N/A | S1-4: Actions | 58, 59, 60 | S4-3: Remediate impacts | 52, 55 | ESRS 2 SBM-1 (40 a i, ii, e-f): Sustainability- related goals and significant products | See Annual review, section 'Product overview' on p. 25 for product overview, 'Sustainability commitment' pages 32-34, and 'Commercial execution' p. 20-25 for key markets (and as additional reference within the Sustainability statement: see p. 58, table 3.1.1 'Employees and employee turnover') | |||||
ESRS 2 SBM-3: Strategy | 63 | S1-5: Targets | 59 | S4-4: Actions | 52-56 | |||||||||
ESRS 2 IRO-1: Processes | 63 | ESRS E4 – Biodiversity and ecosystems | S1-6: Own employees | 58 | S4-5: Targets | 54 | ||||||||
E1-2: Policies | 63 | S1-7: Non-employees | N/A | ESRS 2 BP-2 (12): Forward-looking information | See Annual review, page 17, section ‘Financial performance’, sub-chapter 'Forward-looking statements' | |||||||||
E1-3: Actions | 65 | Disclosure requirement | Page | S1-8: Bargaining coverage | 58 | ESRS G1 – Business conduct | ||||||||
E1-4: Targets | 64 | E4-1: Transition plan | 72 | S1-9: Diversity | 60-61 | Disclosure requirement | Page | ESRS 2 SBM-1 (40g; 42, b-c): Business model and value chain | See Annual review, section 'Purpose, strategy and culture' p. 9 and p. 10 on 'Value creation' showcasing the stages from resources to patients, and Strategic Aspirations on p. 13 | |||||
E1-5: Energy consumption | 65 | ESRS 2 SBM-3: Strategy | 72 | S1-10: Adequate wages | 57 | ESRS 2 GOV-1: Governance | 37, 38, 40 | |||||||
E1-6: Scopes 1, 2, and 3 | 66 | ESRS 2 - IRO 1: Processes | 72 | S1-11: Social protection | N/A | ESRS 2 IRO-1: Processes | 75 | |||||||
E1-7: GHG removals | N/A | E4-2: Policies | 72 | S1-12: Disabilities | N/A | G1-1: Corporate culture | 75, 76 | ESRS S4-4 MDR-A (33b): Overview of what action is planned or underway to pursue material opportunities for the undertaking in relation to consumers and/or end-users | See Annual review, section 'Innovation and therapeutic focus', p. 27-32, for an overview of opportunities to accelerate healthcare innovation across obesity, diabetes and rare diseases | |||||
E1-8: Internal carbon pricing | N/A | E4-3: Actions | 73 | S1-13:Training | N/A | G1-2: Suppliers | 77 | |||||||
E1-9: Financial effects | N/A | E4-4: Targets | N/A | S1-14: Health and safety | 59 | G1-3: Prevention | 76 | |||||||
E4-5: Impacts | 72, 73 | S1-15: Work-life balance | 57 | G1-4: Incidents | 76 | |||||||||
E4-6: Financial effects | N/A | S1-16: Compensation | 60 | G1-5: Political influence | 77, 78 | |||||||||
S1-17: Complaints | 58 | G1-6: Payment practices | 77 | |||||||||||
1. In addition, a detailed description of the material IROs is given in the topical sections of this Sustainability statement. | ||||||||||||||
– – – | Novo Nordisk Annual Report 2025 / Additional Sustainability statement information (part of the Sustainability statement) | 135 | |
Table 5a – Proportion of turnover and CapEx from products or services associated with Taxonomy-eligible or Taxonomy-aligned economic activities – disclosure covering year 2025 | |||||||||||||||
Financial year | 2025 | ||||||||||||||
KPI (1) | Total (2) | Proportion of Taxonomy- eligible activities (3) | Taxonomy- aligned activities (4) | Proportion of Taxonomy- aligned activities (5) | Breakdown by environmental objectives of Taxonomy-aligned activities | Proportion of enabling activities (12) | Proportion of transitional activities (13) | Not assessed activities considered non-material (14) | Taxonomy- aligned activities in previous financial year (N-1) (15) | Proportion of Taxonomy- aligned activities in previous financial year (N-1) (16) | |||||
Climate change mitigation (6) | Climate change adaptation (7) | Water (8) | Circular Economy (9) | Pollution (10) | Biodiversity (11) | ||||||||||
mDKK | % | mDKK | % | % | % | % | % | % | % | % | % | % | mDKK | % | |
Turnover | 309,064 | 100 | 0 | 0 | 0 | 0 | 0 | 0 | 0 | 0 | 0 | 0 | 0 | ||
CapEx | 94,249 | 63 | 5,835 | 6 | 6 | 0 | 0 | 0 | 0 | 0 | 3 | 3,494 | 3 | ||
OpEx immateriality •In accordance with the new Delegated Act, we have opted to not report on OpEx eligibility due to immateriality. •Eligible OpEx only includes R&D costs directly related to the manufacturing process. •We allocate only a small part of R&D related to CMC (Chemistry, Manufacturing and Control Development and Scaling), and the remaining R&D is related to patents etc.). •For this reason, OpEx is immaterial. •Total OpEx: 49,308 mDKK | ||
– – – | Novo Nordisk Annual Report 2025 / Additional Sustainability statement information (part of the Sustainability statement) | 136 | |
Reported KPI | Turnover | ||||||||||||
Financial year (N) | 2025 | ||||||||||||
Economic Activities (1) | Code (2) | Proportion of Taxonomy eligible Turnover (3) | Taxonomy- aligned KPI (4) | Taxonomy- aligned KPI (5) | Environmental objective of Taxonomy-aligned activities | Enabling activity (12) | Transitional activity (13) | Proportion of Taxonomy- aligned in Taxonomy- eligible (14) | |||||
Climate change mitigation (6) | Climate change adaptation (7) | Water (8) | Circular Economy (9) | Pollution (10) | Biodiversity (11) | ||||||||
% | mDKK | % | % | % | % | % | % | % | (E where applicable) | (T where applicable) | % | ||
Manufacture of medical products | 1.2 | 100 | 0 | 0 | 0 | 0 | 0 | 0 | 0 | 0 | 0 | ||
Sum of aligned per objective | 0 | 0 | 0 | 0 | 0 | 0 | 0 | ||||||
Total KPI (Turnover) | 100 | 0 | 0 | 0 | 0 | 0 | 0 | 0 | 0 | ||||
Reported KPI | CapEx | ||||||||||||
Financial year (N) | 2025 | ||||||||||||
Economic Activities (1) | Code (2) | Proportion of Taxonomy- eligible CapEx (3) | Taxonomy- aligned KPI (4) | Taxonomy- aligned KPI (5) | Environmental objective of Taxonomy-aligned activities | Enabling activity (12) | Transitional activity (13) | Proportion of Taxonomy- aligned in Taxonomy- eligible (14) | |||||
Climate change mitigation (6) | Climate change adaptation (7) | Water (8) | Circular Economy (9) | Pollution (10) | Biodiversity (11) | ||||||||
% | mDKK | % | % | % | % | % | % | % | (E where applicable) | (T where applicable) | % | ||
Manufacture of medical products | 1.2 | 42 | 0 | 0 | 0 | 0 | 0 | 0 | 0 | 0 | 0 | ||
Construction of new buildings | 7.1 | 18 | 5,835 | 6 | 6 | 0 | 0 | 0 | 0 | 0 | 34 | ||
Renovation of existing buildings | 7.2 | 3 | 0 | 0 | 0 | 0 | 0 | 0 | 0 | 0 | 0 | ||
Sum of aligned per objective | 6 | 6 | 0 | 0 | 0 | 0 | 0 | ||||||
Total KPI (CapEx) | 63 | 5,835 | 6 | 6 | 0 | 0 | 0 | 0 | 0 | 10 | |||