SECURITIES AND EXCHANGE COMMISSION
Washington, D.C. 20549
Form 20-F
(Mark One)
| ☐ | REGISTRATION STATEMENT PURSUANT TO SECTION 12(b) OR (g) OF THE SECURITIES EXCHANGE ACT OF 1934 |
or
| ☑ | ANNUAL REPORT PURSUANT TO SECTION 13 OR 15(d) OF THE SECURITIES EXCHANGE ACT OF 1934 |
For the fiscal year ended December 31, 2020
or
| ☐ | TRANSITION REPORT PURSUANT TO SECTION 13 OR 15(d) OF THE SECURITIES EXCHANGE ACT OF 1934 |
or
| ☐ | SHELL COMPANY REPORT PURSUANT TO SECTION 13 OR 15(d) OF THE SECURITIES EXCHANGE ACT OF 1934 |
Commission file number: 1-10409
InterContinental Hotels Group PLC
(Exact name of registrant as specified in its charter)
England and Wales
(Jurisdiction of incorporation or organization)
Broadwater Park,
Denham, Buckinghamshire UB9 5HR
(Address of principal executive offices)
Nicolette Henfrey
General Counsel and Company Secretary
+44 (0) 1895 512000
companysecretariat@ihg.com
Securities registered or to be registered pursuant to Section 12(b) of the Act:
| Title of each class |
Trading Symbol(s) |
Name of each exchange on which registered | ||
| American Depositary Shares Ordinary Shares of 20340/399 pence each |
IHG IHG |
New York Stock Exchange New York Stock Exchange* |
* Not for trading, but only in connection with the registration of American Depositary Shares, pursuant to the requirements of the Securities and Exchange Commission.
Securities registered or to be registered pursuant to Section 12(g) of the Act:
None
Securities for which there is a reporting obligation pursuant to Section 15(d) of the Act:
None
Indicate the number of outstanding shares of each of the issuer’s classes of capital or common stock as of the close of the period covered by the annual report:
| Ordinary Shares of 20340/399 pence each | 187,717,720 |
Indicate by check mark if the registrant is a well-known seasoned issuer, as defined in Rule 405 of the Securities Act: Yes ☑ No ☐
If this report is an annual or transition report, indicate by check mark if the registrant is not required to file reports pursuant to Section 13 or 15(d) of the Securities Exchange Act of 1934: Yes ☐ No ☑
Indicate by check mark whether the registrant (1) has filed all reports required to be filed by Section 13 or 15(d) of the Securities Exchange Act of 1934 during the preceding 12 months (or for such shorter period that the Registrant was required to file such reports) and (2) has been subject to such filing requirements for the past 90 days: Yes ☑ No ☐
Indicate by check mark whether the registrant has submitted electronically, every Interactive Data File required to be submitted pursuant to Rule 405 of Regulation S-T (§ 232.405 of this chapter) during the preceding 12 months (or for such shorter period that the registrant was required to submit such files). Yes ☑ No ☐
Indicate by check mark whether the registrant is a large accelerated filer, an accelerated filer, a non-accelerated filer, or an emerging growth company. See definition of “large accelerated filer,” “accelerated filer” and “emerging growth company” in Rule 12b-2 of the Exchange Act.
| Large accelerated filer | ☑ | Accelerated filer | ☐ | |||
| Non-accelerated filer | ☐ | Emerging growth company | ☐ | |||
If an emerging growth company that prepares its financial statements in accordance
with U.S. GAAP, indicate by check mark if the registrant has elected not to use the extended transition period for complying with any new or revised financial accounting standards provided
pursuant to
Section 13(a) of the Exchange Act. ☐
Indicate by check mark whether the registrant has filed a report on and attestation to its management’s assessment of the effectiveness of its internal control over financial reporting under Section 404(b) of the Sarbanes-Oxley Act (15 U.S.C. 7262(b)) by the registered public accounting firm that prepared or issued its audit report. ☑
Indicate by check mark which basis of accounting the registrant has used to prepare the financial statements included in this filing:
| US GAAP ☐ |
International Financial Reporting Standards as issued by the International Accounting Standards Board ☑ |
Other ☐ |
If “Other” has been checked in response to the previous question, indicate by check mark which financial statement item the registrant has elected to follow.
☐ Item 17 ☐ Item 18
If this is an annual report, indicate by check mark whether the registrant is a shell company (as defined in Rule 12b-2 of the Exchange Act):
Yes ☐ No ☑
(Applicable only to Issuers involved in bankruptcy proceedings during the past five years).
Indicate by check mark whether the registrant has filed all documents and reports required to be filed by Sections 12, 13 or 15(d) of the Securities Exchange Act of 1934 subsequent to the distribution of securities under a plan confirmed by a court.
☐ Yes ☐No
Our purpose
is to provide
True Hospitality
for Good.
It shapes our culture, brings our brands to life
and represents a commitment to make a difference
every day to our people, guests and communities,
and to protect the world around us.
Engaging with a wide range of stakeholders,
together we work towards common goals and help
ensure we create shared value for all.

|
See pages 22 to 33 for more information on how we work with our stakeholders. | |

Front cover
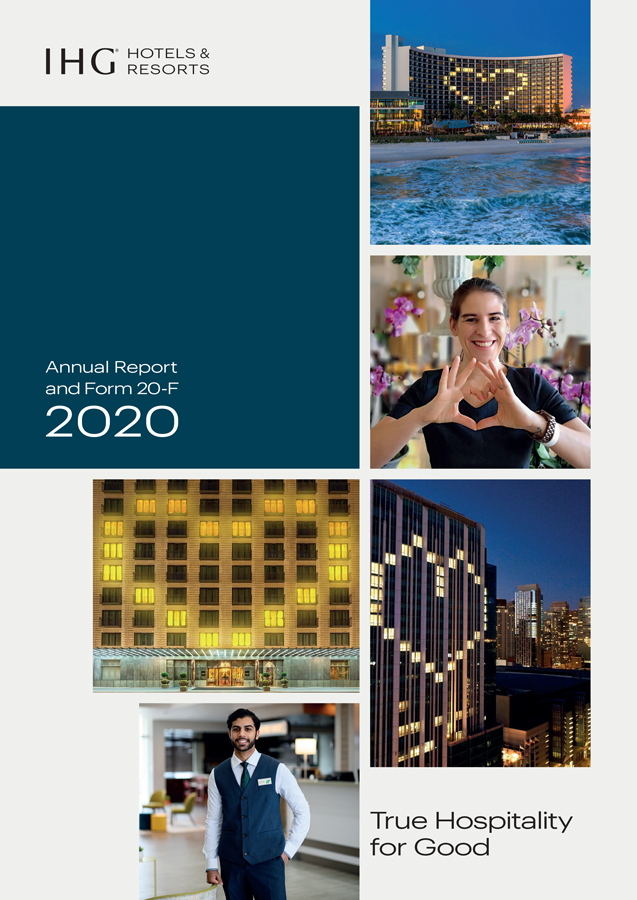
Our Lights of Love social media campaign became a beacon of hope for the industry in 2020,
with hundreds of hotels globally creating light hearts in their windows
and colleagues doing the same with their hands.

| A response shaped by our purpose
|
Shareholders and investors
The impact of Covid-19 on our industry has led to difficult but unavoidable decisions to protect IHG in the short and long-term. We’ve had to make savings, protect cash and thoughtfully align our cost base to a longer period of lower demand, while still protecting investments in future growth.
• Fee business costs reduced by ~$150m in 2020 through reductions in discretionary costs, temporarily reduced salaries and redundancies
• Targeted ~$75m of fee business costs to be sustainable into 2021, while still investing for growth
• Reduced gross capital expenditure by over $100m, with investment focused on high-priority growth areas
• Suspended dividend payments
• Increased liquidity and extended debt maturities
| |||||||
| In an unimaginably challenging year, we’ve worked tirelessly to care for our stakeholders, protect our business and ensure our purpose of True Hospitality for Good is felt even in the toughest of times – all while ensuring we’re ready to grow strongly in a recovery.
|
||||||||
|
Financial performance | ||||||||
| L |
ike every company, our plans and expectations for 2020 were transformed by Covid-19. The global response to the pandemic, including lockdowns, travel bans and border closures, has impacted the lives of billions of people, severely damaged economies and posed | Global RevPAR (52.5)% 2019: (0.3)% |
Net system size growth +0.3% 2019: +5.6% | |||||
| the biggest challenge our hospitality industry has ever faced. For IHG, a 52.5% reduction in RevPAR led to operating profit from reportable segments falling by 75%.
We’ve committed to responding quickly with great care and thought, doing what’s right to support our guests, colleagues, hotel owners and communities, keep our business protected and help our industry recover. On these pages, and within this year’s Annual Report, you will see some of the actions we have taken in response to the pandemic and to ensure the right foundations are in place for a successful recovery and continued growth. |
Total gross revenue in IHG’s Systema $13.5bn 2019: $27.9bn |
Total revenue $2,394m 2019: $4,627m | ||||||
|
We know things will take time to improve, but as vaccinations roll out and the world feels confident to rediscover travel, we’re ready to deliver clean and trusted stays.
We’re focused on ensuring IHG and our hotels can outperform as demand returns, and we continue to sign and open new properties around the world. Looking to future growth, our pipeline of 1,815 hotels represents 11% of the industry, with ~40% already under construction. |
Revenue from reportable segmentsa $992m 2019: $2,083m |
Operating (loss)/profit $(153)m 2019: $630m | ||||||
|
Operating profit from reportable segmentsa $219m 2019: $865ma |
Basic EPSb (142.9)¢ 2019: 210.4¢ | |||||||
|
a Use of Non-GAAP measures: in addition to performance measures directly observable in the Group Financial Statements (IFRS measures), other financial measures (described as Non-GAAP) are presented that are used internally by management as key measures to assess performance. Non-GAAP measures are either not defined under IFRS or are adjusted IFRS figures. Further explanation in relation to these measures can be found on pages 47 to 51 and reconciliations to IFRS figures, where they have been adjusted, are on pages 212 to 216. b Adjusted EPSa 31.3¢ (-90%); 2019: 303.3¢. | ||||||||
| 2 | IHG | Annual Report and Form 20-F 2020 | |
| 2020 in review | IHG | Annual Report and Form 20-F 2020 | 3 |
Strategic Report

| T |
he Covid-19 pandemic gripped the world in 2020, changing lives and challenging economies, societal norms and the existence of many businesses. Without doubt, hospitality was one of |
| the sectors hardest hit, and our success this year has been defined as much by our financial health and strategic progress as it has by our ability to offer clarity and care during an unprecedented crisis.
Border closures and restrictions designed to slow the spread of the virus have presented the travel sector with its greatest ever challenge. The World Travel & Tourism Council estimates as many as 174 million jobs have been lost, as businesses have closed or been forced to reduce staff and costs, with entire supply chains feeling the knock-on effect.
No pre-prepared response could have matched the magnitude of the situation. Instead, organisations will have learnt if they were equipped to manage such a crisis or not, and I am proud of IHG’s principled response, which has been guided by our purpose of True Hospitality.
Indeed, the experience has outlined the importance of purpose, giving new meaning to our potential to effect positive change, and highlighted the growing expectation that we must deliver that change in a challenging world. We have therefore evolved our purpose from True Hospitality for everyone, to True Hospitality for Good – still committed to looking after all those we interact with, but now more focused on the difference we can make to our people, guests, communities and planet.
We have strived to do the right thing for every stakeholder. As a global company, our asset-light, fee-based, predominantly franchised model, and industry-leading position in upper midscale, means that while Covid-19’s impact on our business has been severe, there is also a level of resilience. Nevertheless, working back from the initial peak in April, when one in six of our hotels were closed and global occupancy was at historic lows of ~20%, we have had to focus on costs and target pockets of leisure and business demand to help maintain cash flow in difficult circumstances.
Ensuring our business remains robust has, of course, been important, but there are many other dimensions to consider, not least the anxiety this crisis has caused colleagues, or the help that our owners – many of whom are small or medium enterprises – have |
“ Reflecting what we’ve learnt and what’s needed to succeed in an evolving environment, we entered 2021 with a refreshed strategy.” | |||
|
|
||||
| 4 | IHG | Annual Report and Form 20-F 2020 |
| Chair’s statement | IHG | Annual Report and Form 20-F 2020 | 5 |
Strategic Report
Officer’s review

|
“Globally, we’ve worked as a team with such speed and compassion – leading, learning and listening to keep colleagues and guests feeling safe, protect IHG and our owners, and support our industry”. |
e arrived in 2020 on the back of a record year of openings and real momentum behind the growth of our brands in a thriving industry. Our clear strategy and the changes made in recent years were enabling us to move faster, accelerate our growth and take advantage of new opportunities. The arrival of the Covid-19 pandemic has since presented enormous challenges for travel and tourism, and for IHG. Yet, in spite of this, the thoughtful, swift and decisive actions of so many dedicated colleagues have helped us emerge a stronger company.
The enormity of this crisis means very little has escaped its impact. From socioeconomic challenges to mental and physical health, it has touched everyone’s life, and as a company, it has shifted how we’ve worked together, partnered with our owners, and looked after our guests and communities.
Globally, we’ve worked as a team with such speed and compassion – leading, learning and listening to help keep colleagues, guests and communities feeling safe, protect IHG and our owners, and support our industry. We’ve seen past the barriers of remote working and physical distancing to find ways to work together closer than ever before. I am immensely proud of how everyone from our leadership, corporate teams and reservation offices, to our owners and hotel colleagues have helped IHG and those around us through such difficult times, including our frontline workers and people in need. Collectively, we provided not just hospitality but True Hospitality for Good.
Our 2020 journey People’s appetite to explore, rest or work on their travels hasn’t changed, but understandably their confidence in when it’s safe to do so has, and we’ve had to respond. To help keep colleagues and guests feeling safe, we quickly aligned new training and operating procedures with guidance from world health bodies. We further enhanced our IHG Way of Clean programme with new science-led protocols, backed by an IHG Clean Promise and Meet with Confidence offer. We also accelerated the rollout of technology enhancements such as digital check-in, introduced flexible cancellation and booking options, and protected points and status for our loyalty members.
Working with governments and authorities, some of our hotels switched focus to accommodate nurses, doctors and other frontline workers. Others supported the
| |
| 6 | IHG | Annual Report and Form 20-F 2020 |
| Chief Executive Officer’s review | IHG | Annual Report and Form 20-F 2020 | 7 |
| Industry overview | IHG | Annual Report and Form 20-F 2020 | 9 |
Strategic Report
|
Masterbrand and Loyalty
|
HOTELS & RESORTS
|
REWARDS
|
| Luxury & Lifestyle
| ||||||||||

|

|

|

|

|
Timeless legacy bound together by distinctive design and unforgettable service. Making every journey a celebration of extraordinary experiences, each in their unique way. | |||||
|
16 open 31 pipeline |
7 open 6 pipeline |
205 open 69 pipeline |
73 open 32 pipeline |
125 open 104 pipeline | ||||||
|
Premium | ||||||||

|

|

|

|
Making travel personal and purposeful. Giving guests a sense of belonging and wellbeing, with the thoughtful details to make every trip matter.
| ||||
|
18 open 29 pipeline
|
12 open 25 pipeline
|
429 open 89 pipeline
|
16 open 31 pipeline
| |||||
|
Essentials | ||||||||
|
2,966 open 683 pipeline
|
1,248 open 262 pipeline |
24 open 192 pipeline |
Always there, always just what you need. With the warmth and trusted experience that has come to define True Hospitality. | |||||
|
Suites | ||||||||
|
0 open 19 pipeline |
303 open 155 pipeline |
28 open 0 pipeline |
366 open 73 pipeline |
When you’re not at home, be here. We invite guests to settle in for longer stays, knowing the comforts of home are always within reach. | ||||
| 10 | IHG | Annual Report and Form 20-F 2020 |

| Our Brands | IHG | Annual Report and Form 20-F 2020 | 11 |
| Our business model | IHG | Annual Report and Form 20-F 2020 | 13 |
Strategic Report
Our business model continued
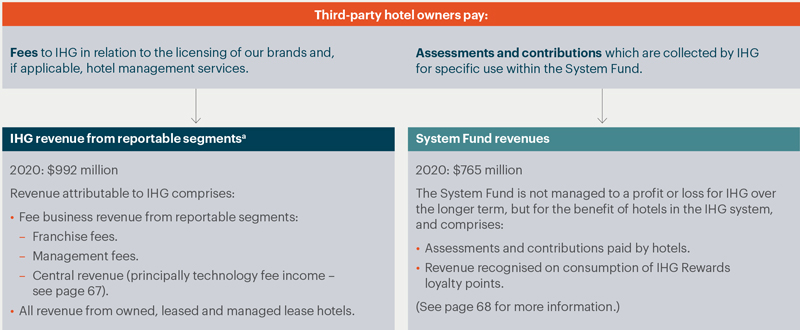
IHG revenue from reportable segmentsa and the System Fund
Disciplined approach to capital allocation and managing liquidity
| 14 | IHG | Annual Report and Form 20-F 2020 |
| Our business model | IHG | Annual Report and Form 20-F 2020 | 15 |
| Our strategy | IHG | Annual Report and Form 20-F 2020 | 17 |
Strategic Report
Our strategy continued

| Customer centric in all we do |
We have two types of customers: our guests – business and leisure – and our owners, and it’s critical that we put them at the heart of every plan. Consistently acting with this mindset and insight will allow us to create the tailored services and solutions that increase demand for our brands, strengthen consumer preference, deliver stronger owner returns and drive industry-leading rooms net growth.
Where we’re coming from We’ve invested heavily in recent years in ensuring IHG works even more closely and effectively with our owners. This customer-centric mindset came to the fore more than ever in 2020 – not just for our owners but for our guests, corporate clients and loyalty members, too.
The importance of this approach was illustrated by the Guest Satisfaction Index measure being net positive for IHG throughout the year, outperforming competitors.
What’s next With a greater customer focus, we will refine elements of our offer for guests, loyalty members and owners to deepen brand loyalty, drive revenue and create more value.
Priority areas for our guests include: maintaining an increased focus on cleanliness; developing a hybrid meetings offer for corporate customers; and continuing to enhance our loyalty offer, building on improved member marketing in 2020 and features such as dynamic pricing for Reward Nights, which offers members more value outside of peak times.
For our owners, we know the importance of managing costs to build, open and operate, and we continue to collaborate and innovate to develop new services and solutions that both increase revenue and deliver more efficient and sustainable operations. Key programmes include: the roll out of our Owner Engagement Portal, which gives owners real-time oversight of performance metrics; and expansion of our central procurement services to use our scale to create additional savings for owners. |
|
| 18 | IHG | Annual Report and Form 20-F 2020 |
| Our strategy | IHG | Annual Report and Form 20-F 2020 | 19 |
Strategic Report
Our strategy continued

| Care for our people, communities and planet |
We are passionate about working and growing together within a culture that respects and invests in our people, and embraces opportunities to contribute positively to local communities and operate responsibly and sustainably in the world around us.
Where we’re coming from We have ambitious growth plans, but equally important to us is how we grow. We’re proud to be a business that invests in a highly engaged workforce, supports its communities and looks after our planet. However, we recognise that to deliver on those things requires a commitment to constantly reflect on evolving expectations around what it means to operate as a responsible business.
What’s next We enter 2021 with a determination to go even further – whether that’s in how we work or grow as individuals, how we build more diverse teams and a more inclusive culture, or how we operate around the world in ways that positively impact people and protect the environment.
Journey to Tomorrow, our new responsible business plan, starts a decade of action. Working with colleagues and those who stay and partner with us, together we will help shape the future of responsible travel. We’ll continue the work we’ve done so far on employee wellbeing and respect for human rights; supporting communities through skills training and disaster relief; and working with our hotels to reduce their environmental impact. We also made important strides in diversity and inclusion in 2020, and must now deliver on our commitment to listen and learn, advocate and act, as part of a pledge to create a more inclusive, equitable IHG for all.
Alongside Journey to Tomorrow, to keep everyone performing at their best and to attract more talented people, we are focusing on how we create a more flexible and dynamic working environment among our corporate teams, taking into account all we have learnt as a business by operating remotely for much of 2020.
We will also continue to work to the recommendations of the Task Force on Climate-related Financial Disclosures, and remain focused on collaborating with owners, partners, peers and governments to achieve a sustainable recovery.
|
| 20 | IHG | Annual Report and Form 20-F 2020 |
| Our strategy | IHG | Annual Report and Form 20-F 2020 | 21 |
Strategic Report
The impact of Covid-19 during 2020 presented an unprecedented challenge for the Board, with the Company’s response to the pandemic dominating decisions and considerations. The Directors guided, supported and challenged management, giving them, where appropriate, a clear mandate to take short-term decisions at pace whilst still keeping focus on long-term strategic impact, helping to weigh competing priorities, and ensuring that all factors and stakeholders were taken into consideration. In their deliberations they focused on IHG’s values, business ethics, purpose, other stakeholders, risks, post-pandemic strategy and the financial and organisational resilience of the Company.
Section 172 of the Companies Act 2006 requires a director of a company to act in the way he or she considers, in good faith, would be most likely to promote the success of the company for the benefit of its members as a whole. In doing this, Section 172 requires directors to have regard, amongst other matters to: the likely consequences of any decision in the longer term; the interests of the company’s employees; the need to foster the company’s business relationships with suppliers, customers and others; the impact of the company’s operations on the community and the environment; the desirability of the company maintaining a reputation for high standards of business conduct; and the need to act fairly between members of the company.
IHG’s Directors give careful consideration to the factors set out above in discharging their duties under Section 172 including in taking decisions of strategic importance to the Group. The information set out on pages 22 and 23 below describes the importance of each factor set out in Section 172(1)(a) – (f) to IHG and gives examples of how the Directors have had regard to each of those factors in certain decisions taken during 2020.
| Factor | Our engagement and commitment | 2020 examples of key decisions and considerations | ||||
|
|
|
| ||||
| The likely consequences of any decisions in the long-term
and16 to 21 |
• As set out in the Schedule of Matters reserved for the Board, there are a number of key decisions and matters the Board is responsible for, including the Group’s overall business and commercial strategy, annual operating and capital expenditure budget and financial plans. The Board, through its schedule of meetings, focuses on strategic and operational matters, corporate governance, investor relations and risk management. Board papers, reports and presentations are structured to include relevant stakeholder considerations and the likely consequences of each decision for the long-term success of the Company. |
• As detailed on pages 2, 7 and 14, the Board, in the face of the pandemic and its impact on the business, took decisions throughout 2020 to protect the Company and position the business for recovery by reducing costs, strengthening liquidity and preserving cash. All discretionary costs were challenged, and salary and incentive reductions were made, including substantial remuneration decreases for Board and Executive Committee members. The Board withdrew its recommendation for a final 2019 dividend of 85.9¢ (~$150m), deferred consideration of further dividends until visibility improved, and took other decisions in relation to IHG’s financing arrangements to bolster IHG’s liquidity. In taking these decisions, the Board considered both the short and long term impact on its people, owners and investors.
• During the course of the year, the Board, having taken into consideration the impact of Covid-19, changing guest and societal expectations, and considering the long-term success of the Company, approved a refreshed strategy and purpose. See pages 16 to 21 for further information. | ||||
|
|
|
| ||||
| The interests of the company’s employees
|
• IHG’s direct workforce is made up of employees working in corporate offices, reservation centres and owned, managed, leased and managed lease hotels. Our employees are key to delivering both our purpose of True Hospitality for Good and our strategic initiatives. The Board acknowledges that their key concerns include continued employment, remuneration, diversity and inclusion and career development.
• The designated non-executive director with responsibility for workforce engagement provides a vital portal for the Board to hear employee views and receive their feedback, alongside regular Board and Committee agenda items relating to employee matters and Company culture. In addition, wherever and whenever possible all Directors directly engage with employees. |
• During 2020, the Board made decisions and supported management to ensure employee engagement methods were prioritised and effective for working remotely during the pandemic, and concentrated on employee wellbeing and business cohesion. Regular internal communications and Staying In Touch forums were put in place to make sure employees were kept up to date on business performance and developments. Tools and resources were also selected to aid flexible and remote working, as well as the extension of our Employee Assistance Programme to cover mental health and wellbeing.
• The Board took key decisions to temporarily reduce compensation, furlough a large proportion of employees and implement a programme of redundancies. When considering these decisions, the Board balanced the immediate impact on the affected employees with the broader implications for all stakeholders. Measures to temporarily reduce compensation were taken quickly in recognition of the immediate and severe impact on revenues. Decisions on the scale and extent of furlough and redundancies were deferred until informed by a greater understanding of the impact of Covid-19 on the business. The Board kept all measures under regular review, and with growing confidence in the delivery of cost savings and successful management of cash flows, was able to reverse salary reductions ahead of original expectations. | ||||
|
|
|
| ||||
| The need to foster the company’s business relationships with suppliers, customers and others
|
• Building and maintaining relationships with both new and long-standing hotel owners, managing connections with critical suppliers and others within our supply chain, and focusing on guest experiences and loyalty are vital to our continued success. These stakeholders in turn look to IHG and rely on our trusted reputation, the advantages of our scale, our owner proposition, consistent guest experiences and rewards for loyalty.
• The Board maintains oversight and fosters relationships through focusing on strategic and operational matters as part of its regular meeting agendas and interactions with owners, either through the IHG Owners Association or in one to one meetings. It also reviews Guest and Owner HeartBeat surveys to understand the needs and interests of guests and owners. In addition, the Responsible Business Committee keeps under review the Group’s approach to its supply chain and our Supplier Code of Conduct. |
• During the first quarter of the year the Board supported decisions to put Covid-19 health and safety operating procedures into place globally, including the IHG’s Way of Clean programme and IHG Clean Promise, protecting both guests and hotel colleagues. Decisions also allowed for revised flexible booking and cancellation options to be implemented, and protection of guest loyalty membership status.
• With Board review and support, IHG worked with owners to balance the need to keep hotels open with reduced occupancy, and reduce costs, advising them on adjusting operations, providing fee relief and payment flexibility, delaying renovation requirements, and relaxing brand standards to conserve owner funds. In addition, the Board supported the repurposing of many hotels to provide essential services including accommodation to frontline workers, military personnel and vulnerable members of society. The Company, including Executive Directors, supported hotel owners and lobbied to secure broad government support for the industry, including reliefs and other hospitality-related incentives.
• The Board reviewed and supported management in engaging with strategic suppliers to adjust service levels, anticipate continuity risks, and address payment terms. | ||||
|
|
|
| ||||
| 22 | IHG | Annual Report and Form 20-F 2020 |
| Section 172 statement | IHG | Annual Report and Form 20-F 2020 | 23 |
| Our culture and responsible business | IHG | Annual Report and Form 20-F 2020 | 25 |
Strategic Report
Our people
|
Our people are fundamental to IHG achieving its purpose and strategic goals. IHG’s business model means that we do not employ all colleagues. We directly employ individuals in our corporate offices, reservation centres, and managed, owned, leased and managed lease hotels. However, not all individuals in managed, owned, leased and managed lease hotels are directly employed, and we do not employ any individuals in franchised hotels (nor do we control their day-to-day operations, policies or procedures).
|
| 26 | IHG | Annual Report and Form 20-F 2020 |
| Our culture and responsible business | IHG | Annual Report and Form 20-F 2020 | 27 |
Strategic Report
Our people continued
| 28 | IHG | Annual Report and Form 20-F 2020 |
| Our culture and responsible business | IHG | Annual Report and Form 20-F 2020 | 29 |
Strategic Report
TCFD
Governance
The IHG Board has collective responsibility for managing climate-related risks and opportunities and is advised by the Board’s Responsible Business Committee on the Group’s corporate responsibility strategy, including our approach to climate-related risks and opportunities. Committee meetings are regularly attended by our Chair, CEO, EVP, Global Corporate Affairs and VP, Global Corporate Responsibility.
Our CFO, EVP, Global Corporate Affairs and EVP, General Counsel and Company Secretary co-lead executive level management of climate-related risks and opportunities and report to our CEO. Our regional CEOs for the Americas, EMEAA and Greater China lead the implementation of environmental programmes at an operational level, supported by IHG’s Global Corporate Responsibility team.
During 2020, we established an internal TCFD Steering Group, with senior representation from Finance, Risk and Assurance, Strategy, Corporate Responsibility, and the Legal, Compliance and Company Secretariat team, who are responsible for leading the project.
Strategy
Led by our TCFD Steering Group and working with specialist consultants, during 2020 we carried out over 30 Senior Leader stakeholder interviews to identify key value drivers for the business and completed a global qualitative risk assessment to understand where and how climate change may affect these value drivers over the short, medium and long term.
We held two scenario planning workshops with cross-functional Business Unit leaders, to review potential risks at 2°C and 4°C scenarios over one, five, 10, 15 and 30 year time horizons. Our analysis covered acute and chronic physical risks, including droughts or floods, water stress, wildfires and rising sea levels, as well as transition risks, such as changes in stakeholder expectations, travel patterns, climate policy and regulation.
This work culminated in a dedicated TCFD session with our Board in December 2020, to discuss climate change as a strategic resilience issue, review actions already completed and identify priorities for 2021 to close any gaps to TCFD alignment. The focus for next year will be an in-depth financial evaluation of key risks identified during the qualitative analysis, as well as an assessment of potential impacts on IHG’s growth strategy and financial planning.
Risk management
We consider climate change within the context of environmental and social megatrends as one of our principal risks. To reduce our carbon footprint and manage our exposure to climate-related risks, in 2019 we made carbon reduction a metric for all hotels globally (see below) and in 2020 we launched our science-based targets and started more formal implementation of the TCFD recommendations.
Our Risk Management team is part of our core TCFD working group and as such is closely involved in the work to assess in more detail IHG’s potential exposure to both physical and transition risks over the short, medium and long term. This will facilitate further embedding of climate-related risks into our global risk management and mitigation procedures, as appropriate, to support the long-term resilience of the business.
Metrics and targets
The IHG Green Engage™ system is our global environmental management platform and is critical to our ability to identify, assess and mitigate climate-related risks. As part of our brand standards, all IHG hotels globally are required to use the platform and report their monthly utility use on the platform, which in turn provides hotels with trend data, benchmarking information, green building solutions and return on investment information, to help them identify key opportunities for maximising carbon, energy, water and waste efficiency and reducing their overall utility costs.
Carbon reduction is one of IHG’s 10 global metrics, with both Group and hotel level targets set on an annual basis. Achievement of the global metrics is one of the criteria used in the annual performance plan calculations for corporate employees and General Managers of managed hotels.
In 2020, we launched our science-based carbon reduction targets – to reduce absolute carbon emissions from our managed, owned, leased and managed lease hotels by 15% by 2030, and to reduce carbon emissions per square metre from our franchised hotels by 46% by 2030, both against a 2018 base year. For more information on our Scope 1, 2 and 3 emissions and our performance against our targets, please see page 221.
As we complete our financial impact assessment of climate-related risks, this will inform the development of any additional metrics and targets around the management and mitigation of risks and the strengthening of IHG’s business resilience against climate change.
| Management objectives for 2021 |
|
• Complete financial quantification of key climate-related risks and opportunities.
• Analysis of the relative importance of these climate-related risks compared to our wider enterprise risks.
• Develop roadmap for embedding climate-related risks and opportunities into IHG strategy, financial planning and decision-making.
• Present findings and proposals for discussion at our annual Board strategy day.
• Embed findings into 2021 Annual Report disclosures, to demonstrate full alignment with TCFD recommendations.
|

|
Please see further information in the preceding pages of the Strategic Report, as well as risk management and Governance and Directors’ Reports. |

|
See our Responsible Business Report on our website at www.ihgplc.com/responsible-business |
| 30 | IHG | Annual Report and Form 20-F 2020 |
| Our culture and responsible business | IHG | Annual Report and Form 20-F 2020 | 31 |
Strategic Report
Our guests, owners & suppliers continued

| 32 | IHG | Annual Report and Form 20-F 2020 |
| Our culture and responsible business | IHG | Annual Report and Form 20-F 2020 | 33 |
Strategic Report
The Board’s role in risk management – stewardship and active partnership
The Board is ultimately accountable for establishing a framework of prudent and effective controls, which enable risk to be assessed and managed, and is supported by the Audit Committee, Executive Committee and delegated committees. Our governance framework and Committee agendas establish procedures for Board members to receive information on risk from the Executive Committee and Senior Leaders and a range of other internal and external sources.
In 2020, our Board and management team, supported by the Risk and Assurance team, have reviewed our risk profile with increased frequency, and evaluated the appropriateness and resilience of our risk management and internal control arrangements. Throughout the management of the Covid-19 crisis, the Board has also considered the longer-term impact of the pandemic and other external and internal factors on our risk profile.
|
Emerging risks During 2020, alongside the close focus on responding to Covid-19, Board and Committee discussions have allowed for consideration of other emerging and evolving risks, including:
• competitor and macroeconomic risk factors within the Board’s discussion of strategy and key management presentations (e.g. for Brand strategies, Commercial & Technology, Loyalty, Corporate Governance and Regulatory Developments);
• workforce related risks at the Remuneration and Nomination Committees, including the impact of Covid-19 on attraction, retention and succession arrangements; and risks relating to the competitiveness of Executive remuneration and Board composition;
|
• regulatory and financial governance risks at the Audit Committee (e.g. tax risks relating to digital businesses, treasury and liquidity risks linked to volatility and sentiment in the capital markets, and financial control risks in a cost-constrained environment);
• risks relating to people and culture at the Responsible Business Committee, including updates on employee engagement and well-being; diversity and inclusion; community impact; sustainability; human rights; and our continuing responsibilities across our supply chain; and
• potential risks relating to the impact of climate change on IHG in the future at a dedicated Board briefing on our progress to comply with the TCFD reporting requirements.
|
The most prominent emerging risk we face is a sustained downturn caused by further waves of the pandemic and/or a slower than anticipated industry recovery. This could create further volatility in our risk factors and also challenging conditions in the capital markets, making it more difficult to obtain additional funding if required and manage our liquidity, potentially impacting financial performance. Our financial planning includes identifying levers which could be pulled to enable flexibility and adaptability to changes to our financial assumptions and circumstances. More detail on the topics covered by the Board and Committees is available in the Governance Report, pages 74 to 95. |
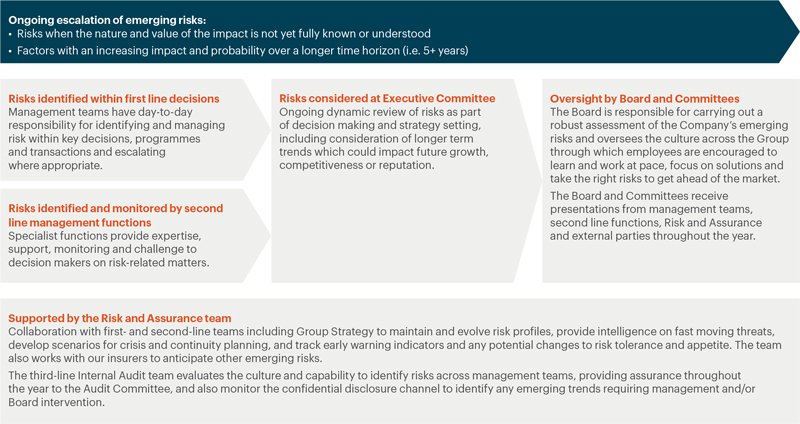
Procedures for identifying, discussing and escalating emerging risks
Many topics and potential risks to longer term viability and sustainability are considered as part of our ongoing management decision making, as well as Board and Committee agendas and presentations, enabling escalation of emerging risks where appropriate. These combined elements have also enabled us to react to uncertainties and changing circumstances as the Covid-19 crisis evolved.
| 34 | IHG | Annual Report and Form 20-F 2020 |
| Our risk management | IHG | Annual Report and Form 20-F 2020 | 35 |
Strategic Report
Our risk management continued
|
Risk trend and speed of impact We assess whether the risk area is stable or dynamic in its impact and/ or likelihood (inherent risk trend), and the rate at which there could be a material impact on IHG. The trend and speed of impact are summarised in the diagram with further detail on activities to manage each of these risks in the following pages.
|
Principal risk – assessment of trend and speed of impact
|
| Principal risks descriptions |
Inherent risk trend | Risk impact – link to our strategic priorities | ||||||

|
Dynamic/Rapid |

|
Build loved and trusted brands | |||||

|
Dynamic/Gradual |

|
Customer centric in all we do | |||||

|
Stable/Rapid |

|
Create digital advantage | |||||

|
Stable/Gradual |

|
Care for our people, communities and planet | |||||
| 36 | IHG | Annual Report and Form 20-F 2020 |
| Our risk management | IHG | Annual Report and Form 20-F 2020 | 37 |
Strategic Report
Our risk management continued
| Risk description |
Trend | Impact | Initiatives to manage these risks | |||||||||
|
|
|
|
| |||||||||
| Attracting, developing and retaining leadership and talent and failure to do this could impact our ability to achieve growth ambitions and execute effectively.
Risks relating to people underpin the majority of processes and controls across IHG, and our ability to develop talent is critical to delivering value to our brands and hotels in the global markets where we operate and compete. It is essential that we retain key executive, leadership and specialist talent, both at the corporate and hotel levels, in an uncertain hospitality industry and in a resource constrained, highly competitive, and remote working environment. |

|

|
• At the start of the Covid-19 crisis a cross-functional taskforce was established to guide how we protect our employer reputation and culture. While we have had to take actions to reduce costs at corporate and hotel levels, HR teams have partnered with operations and functional teams to develop guiding principles to protect our reputation as a responsible employer; maintain our culture during the crisis period; and equip teams to bounce back with great talent and people practices. This has enabled us to maintain engagement, avoid burnout and bolster support to leadership. Our approach to managing our people during 2020 is outlined in detail on pages 26 to 28 and our normal business planning process includes a review of workforce risks.
• Due to the Covid-19 crisis, our programme of engagement surveys and HR scorecards adapted to reflect the realities of virtual and remote working and a challenging period of furloughs and reduced hours. We have monitored key workforce indicators, leveraged our existing virtual learning platforms to understand employee sentiment, and utilised short pulse surveys to gather employee feedback throughout the crisis and to shape our thinking on returning to office working.
• The Executive Committee has regularly discussed talent retention risks, and the HR team is focusing on talent plans with each leadership team. We have refined our diversity and inclusion strategy to drive recruitment and retention, and employee resource groups help educate employees and build a culture of inclusion.
• Effective communications have been established for internal audiences, including regular all employee calls with the Chief Executive Officer to provide latest updates, ongoing leadership communications and virtual team meetings at regional and functional levels, and continued development of our flexible learning summits. Through these channels, leaders are able to answer questions from employees at all levels.
• IHG has the ability to manage talent and retention risks directly in relation to IHG employees but relies on owners and third-party suppliers to manage these risks within their own businesses. Our Procurement, Legal and Risk teams also consider more indirect workforce risks relating to our third-party relationships.
• The Remuneration Committee reviews our approach to executive remuneration, aligned with the interests of shareholders and the UK corporate governance environment. | |||||||||
|
|
|
|
| |||||||||
| Inherent threats to cybersecurity and information governance remain significant and dynamic and external attacks against the hospitality industry have continued in 2020.
We are aware of our responsibilities in relation to a range of high-value assets (critical systems and employee and other sensitive data) which may be targeted by various threat ‘actors’ (including organised criminals, third parties and colleagues). Rapid societal, regulatory and media scrutiny of privacy arrangements mean that the potential impact of data loss to IHG financially, reputationally or operationally remains a dynamic risk factor. The disrupted working conditions (including increased remote access) caused by the pandemic for our employees and suppliers and advances in attack sophistication also heighten inherent information security risks.
|

|

|
• While Covid-19 has modified the threat profile, our Information Security team has pivoted to implement new solutions and controls to address potential vulnerabilities, and to focus resources on those operational tasks that best protect our sensitive data sets and systems and detect and respond to potentially malicious events in an appropriate way.
• In the early stages of the pandemic, we deployed our Intelligence functions to gain early knowledge of potential new attack campaigns; implemented controls to prevent malicious emails from getting to email inboxes; and educated employees worldwide on the increased dangers from phishing, business email compromise and social engineering. We also accelerated the rollout of multi-factor authentication to limit successful phishing attacks. To respond to heightened inherent risks from remote working, we reviewed controls for remote access solutions and increased monitoring to more quickly identify malicious activity. Our Procurement team engaged key providers on their approach for maintaining operations and fulfilling their contractual obligations for the safety and security of our data and systems.
• We have continued to work with our specialist technology providers to continuously improve key operational security processes and capabilities such as Identity & Access Management, Security Monitoring, Incident Response, and the support and maintenance of technical solutions architecture.
• Preserving security across our complex corporate and hotel estate requires continuous maintenance and enhancement or replacement of hardware and software. With finances at a premium for hotel owners, our Information Security and Technology teams collaborate to provide reliable, scalable and cost-effective solutions, targeted at areas of greatest opportunity for future attacks.
• Our information security programme is supported and reviewed by internal and external assurance activities, including our Internal Audit and Financial Governance teams and PCI assessments. The Board receives regular reports using key risk indicators to track inherent risk trends and mitigation activities. We also continue to work closely with our insurers to ensure we are adequately protecting against our risks, and have assessed and quantified potential cyber incident scenarios to drive risk-based discussions on investing in remediation versus risk acceptance and transfer opportunities.
| |||||||||
|
|
|
|
| |||||||||
| 38 | IHG | Annual Report and Form 20-F 2020 |
| Our risk management | IHG | Annual Report and Form 20-F 2020 | 39 |
Strategic Report
Our risk management continued
| Risk description | Trend | Impact | Initiatives to manage these risks | |||||||||
|
|
|
|
| |||||||||
| The global business regulatory and contractual environment and societal expectations have continue to evolve throughout 2020. Failure to ensure legal, regulatory and ethical compliance would impact IHG operationally and reputationally, and non-regulatory stakeholders (including corporate sales clients) and investors continue to focus on IHG’s performance as a corporate entity to uphold ethical and social expectations. Significant fines can be imposed for regulatory non-compliance, most notably in relation to privacy obligations and data security. In an uncertain hospitality industry, there may be increased pressure on compliance programmes, and a heightened risk of liabilities relating to our franchise model both in relation to brand reputation issues as well as litigation.
|

|

|
• Our Ethics and Compliance team focuses on ensuring IHG has a globally coordinated approach to material ethical and compliance risks, taking into account the regulatory environment, stakeholder expectations and IHG’s commitment to a culture of responsible business. The overarching framework for ethics and compliance is the IHG Code of Conduct (see page 24) and we provide e-learning training on an annual basis to all corporate, reservation offices and managed hotel employees and new joiners.
• We continue to monitor changes and advise stakeholders on risks across a range of regulatory issues, including safety, employment, contract, privacy, anti-bribery and anti-trust, while also addressing legal and regulatory issues that have emerged as a result of Covid-19. We also continue to participate in Transparency International UK’s 2020 Corporate Anti-Corruption Benchmark. This is a comprehensive tool that measures and compares the performance of anti-corruption programmes across companies on an anonymous and confidential basis.
• We continue to focus on key human rights risks, particularly those heightened by Covid-19. For example, to address migrant worker staff accommodation risks which may have been heightened by the pandemic, we developed a guidance note on staff living accommodation for hotel teams.
• Monitoring of sanctions continues to be an increasingly important part of our due diligence processes as their use by the US, UK and EU in particular continues to grow. A sanctions update is communicated annually to the Legal, Development and Strategy teams and other relevant employees providing a reminder of ‘No Go’ countries and sanctions issues that may restrict IHG. Our owner legal due diligence process also requires that all new owners are screened against sanctions lists and we utilise due diligence tools for this purpose. Ethics and compliance country-level due diligence is also undertaken for new country entry assessments, taking into account country- specific risks and impacts.
• The Ethics and Compliance team currently monitors training completions, gifts and entertainment reporting and the owner due diligence process, and they receive informal queries/escalation of issues directly from colleagues and via an Ethics and Compliance email channel which is publicised in training and awareness materials. The Board receives regular reports on the Confidential Reporting Channel and matters directly related to our responsible business agenda.
| |||||||||
|
|
|
|
| |||||||||
| The manner in which IHG responds to operational risk and the steps taken to safeguard the safety and security of colleagues and guests will continue to receive heightened scrutiny, particularly in light of the Covid-19 pandemic, and could affect IHG’s reputation for high standards of business conduct, result in financial damage, and undermine confidence in our brands.
The rapid progression of Covid-19 has also given rise to significantly increased litigation risk across all markets. These risks relate both to our direct operations in hotels and other locations where we have management responsibility, and also to outsourced activities and others with whom we collaborate and trade, including the owners of our franchised hotels which operate as independent businesses.
|

|

|
• Our Business Reputation and Responsibility team coordinates and monitors IHG’s risk management system, which is designed to anticipate and identify relevant operational safety and security risks and provide appropriate levels of control necessary to mitigate against significant incidents, whether in hotels or corporate offices. Regional and global subject matter experts in safety and security work regularly with relevant stakeholders, including hotels, operations leaders, and operations support teams such as Design & Engineering, Food and Beverage and Human Resources, to review and set operational safety and security policies and procedures.
• The Covid-19 pandemic has led to the enhancement of IHG’s operational safety and crisis management procedures for hotels and corporate offices. In early 2020, our safety experts worked closely with Operations and Global Corporate Affairs to develop a Hotel and Corporate Office Response Toolkit of guidance, processes and procedures for operating a safe work environment in line with the advice issued by government authorities and public health officials. As the pandemic has progressed, this guidance has been revised and expanded to address emerging operational safety issues, and changes in local government requirements or public health advice.
• Alongside Covid-19, subject matter experts in safety and security have continued to monitor external trends that may impact the safe operation of hotels, customer expectations, and development opportunities (e.g. fire safety, food allergens), and we continue to review our relevant standards and guidance as these issues evolve and/or new regulatory requirements and best practices are published.
• Our experts also track a range of internal indicators relating to safety and security to assess their potential impact on the safety of hotels, colleagues and guests as well as the impact on the reputation of IHG and its brands. Despite our best efforts, incidents may occur across our global hotel operations and corporate offices and an assessment of severity and impact is made before the most serious are promptly forwarded to senior management. The Board receives and reviews regular safety reports and monitors safety performance. Through this monitoring, IHG can determine where additional standards or guidance may be necessary or whether existing controls may need to be adjusted.
| |||||||||
|
|
|
|
| |||||||||
| 40 | IHG | Annual Report and Form 20-F 2020 |
| Our risk management | IHG | Annual Report and Form 20-F 2020 | 41 |
| Key performance indicators | IHG | Annual Report and Form 20-F 2020 | 43 |
Strategic Report
Key performance indicators (KPIs) continued
| KPIs | 2020 status and 2021 priorities | |||||
|
|
| |||||
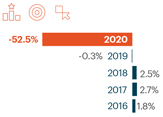
| Global RevPAR growth Revenue per available room: rooms revenue divided by the number of room nights that are available.
RevPAR growth indicates the increased value guests ascribe to our brands in the markets in which we operate and is a key measure widely used in our industry (see page 8). |
|
2020 status • RevPAR declined by an unprecedented level due to the global impact of Covid-19 on domestic and international travel demand, with disruption throughout the year as countries around the world introduced travel restrictions to limit the spread of the pandemic.
• Throughout the crisis we supported owners to maximise revenues by:
– Providing advice and support to help keep hotels open, including how to flex operations and reduce costs, or how to temporarily close and re-open most efficiently and effectively.
– Coordinating Covid-related demand, such as government repurposing of hotels with enhancements made to demand driver mapping, rate loading and centralised booking to manage urgent and bespoke needs.
• Enterprise contribution (previously defined as system contribution) had been growing each year. However in 2020, as a direct result of Covid-19, a greater number of guests chose to phone hotels direct in order to check for the latest updates and availability, or drive straight to hotels without any advanced booking. Our Enterprise Contribution metric therefore declined marginally but the overall strength of our brand equity continued to be reflected in direct to hotel business.
• Enhanced and leveraged our technology and loyalty platforms and services to drive revenue by:
– Optimising our Revenue Management for Hire (RMH) services using machine learning technology, to provide enhanced capabilities to help owners protect pricing and returns during periods of volatile demand.
– Commencing rollout of digital check-in, implemented in over 1,000 properties, and digital check-out, implemented in 4,000 hotels worldwide, and piloted other mobile-enabled improvements including in-room dining orders.
– Expanded pilot of attribute pricing via IHG Concerto™ platform, across regions and brands, ahead of full roll out in 2021.
– Enhancing our Owner Engagement Portals to provide real-time scorecard metrics to our global owner community, including Guest Love measures, RevPAR, financial and operational performance with recommendations for action.
– Commencing roll out of dynamic pricing for Reward Nights, with rates now set daily, enabling more than 80% of hotels to reduce their points pricing to deliver around 25% more value for guests outside of peak times, leading to increased penetration since launch.
• Further strengthened IHG Rewards by completing integration of Mr & Mrs Smith partnership, allowing members access to over 400 Mr & Mrs Smith hotels at which to earn and redeem points.
• Launched a new, sharper, more engaging identity under IHG Hotels & Resorts to strengthen perception, making a clearer connection to our hotels and better promoting the breadth of our portfolio.
2021 priorities • Apply focused data analytics to drive more efficient and effective marketing to identify and target available demand during the recovery.
• Complete roll out of attribute pricing across the entire estate via IHG Concerto.
• Continue roll out of digital check-in to 4,500 hotels by the end of the year.
• Continue to develop strategic partnerships to enhance the value of our loyalty programme for members.
• Continue to innovate our loyalty offering including in-hotel experiences and brand integrations, to provide greater opportunities for our members to earn and redeem IHG Rewards points.
• Maintain our focus on increasing contribution from IHG Rewards members and through direct bookings via our website or call centres. | ||||
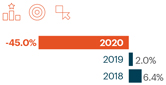
| Growth in underlying fee revenuesa,b Group revenue from reportable segments excluding revenue from owned, leased and managed lease hotels, significant liquidated damages and current year acquisitions, stated at constant currency.
Underlying fee revenue growth demonstrates the continued attractiveness to owners and guests of IHG’s franchised and managed business (see page 13). |
|
|||||
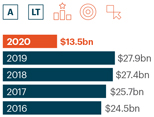
| Total gross revenue from hotels in IHG’s Systemb Total rooms revenue from franchised hotels and total hotel revenue from managed, owned, leased and managed lease hotels. Other than for owned, leased and managed lease hotels, it is not revenue wholly attributable to IHG, as it is mainly derived from hotels owned by third parties.
The growth in gross revenue from IHG’s System illustrates the value of our overall System to our owners (see page 14). |
|
|||||
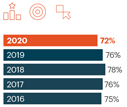
| Enterprise contribution to revenuec The percentage of room revenue booked through IHG managed channels and sources: direct via our websites, apps and call centres; through our interfaces with Global Distribution Systems (GDS) and agreements with Online Travel Agencies (OTAs); other distribution partners directly connected to our reservation system; and Global Sales Office business or IHG Reward members that book directly at a hotel.
Enterprise contribution is one indicator of IHG value-add and the success of our technology platforms and our marketing, sales and loyalty distribution channels (see page 13). |
|
|||||
|
|
| |||||
| a | In 2019 the underlying fee revenue calculation was restated for 2017 onwards following a change in the definition of how we calculate constant currency. The 2017 and 2016 growth figures are not comparable and thus excluded from comparison. |
| b | Use of Non-GAAP measures: In addition to performance measures directly observable in the Group Financial Statements (IFRS measures), additional financial measures (described as Non-GAAP) are presented that are used internally by management as key measures to assess performance. Non-GAAP measures are either not defined under IFRS or are adjusted IFRS figures. Further explanation in relation to these measures can be found on pages 47 to 51 and reconciliations to IFRS figures, where they have been adjusted, are on pages 212 to 216. A reconciliation of total gross revenue to owned, leased and managed lease revenue as recorded in the Group Financial Statements can be found on page 53. |
| c | In 2020, changes were made to the calculation of enterprise contribution (previously system contribution) and 2019 was restated. This followed an enhanced level of analysis enabled by the roll out of the new Guest Reservation System (GRS). Restatement of years prior to the implementation of the GRS is not possible. The 2019 enterprise contribution of 76% is 3% lower than the 79% previously reported as system contribution under the prior calculation. We would not anticipate a material impact of the change in prior years. |
| 44 | IHG | Annual Report and Form 20-F 2020 |
| Key performance indicators | IHG | Annual Report and Form 20-F 2020 | 45 |
Strategic Report
Key performance indicators (KPIs) continued
| KPIs | 2020 status and 2021 priorities | |||||
|
|
| |||||
| IHG® Academy Number of people participating in IHG Academy programmes.
Sustained participation in the IHG Academy indicates the strength of our progress in creating career building opportunities and engagement with the communities in which we operate (see page 29). |

|
2020 status • Covid-19 significantly impacted the vast majority of IHG Academy face-to-face offerings such as internships and work experience. In some locations we pivoted our offering to deliver online events, introducing participants to IHG and the hospitality industry through virtual challenges.
• Evolved our partnership with Junior Achievement Worldwide, offering young people opportunities to gain skills and experience, empowering them to consider career opportunities in the industry, pivoting to virtual solutions.
2021 priorities • Continue to provide skills and improved employability through IHG Academy, ensuring a positive impact for local communities, our owners and IHG. We will flex our approach to delivery between face-to-face and virtual solutions depending on regional recovery.
• Launch a Global IHG Academy NGO Portal hosting a variety of resources bespoke to entry level participants. NGOs can use the resource to educate participants about the hospitality industry, increase their awareness of IHG, and develop their skills to ensure a great start in the hospitality industry.
• Drive quality growth in the programme through enabling our regional teams to measure impact through a robust reporting solution and convert IHG Academy hires into employees. | ||||
|
|
| |||||
| Carbon footprint per occupied room (CPOR)a We work with our hotels to drive energy efficiency and carbon reductions across our estate. In 2017, we set ourselves a target to reduce CPOR by 6-7% by 2020. This is therefore the last reporting year against this target, while we shift our focus towards achieving our science-based carbon reduction targets to 2030 (see page 29). |
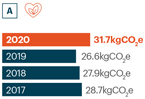
|
2020 status • At the end of 2019, we reported a 5.9%a reduction in CPOR against our 2017 baseline, nearly meeting our three-year intensity target a year early.
• CPOR was significantly affected by the impacts of Covid-19 on our industry, and 2020 closed with a 10.2% increase against our 2017 baseline. Over the same period, our absolute carbon emissions fell by 23.6% (see page 29). This was largely due to the impacts of Covid-19, but also in part a result of targeted efforts in our estate to help minimise energy consumption during hotel closures and maximise energy efficiency at re-opening.
2021 priorities • Continue to work with our hotels to maximise energy efficiency and reduce our carbon footprint.
• Use a bespoke decarbonisation tool, developed with a third party during 2020, to model the possible impacts of different interventions on our carbon footprint and develop a roadmap to 2030.
• Enhance our environmental reporting systems, to continue building more robust and complete datasets, and providing more detailed performance insights and guidance for our hotels to support continuous improvement.
• Assess renewable energy opportunities for IHG to maximise/optimise the role of renewable energy in achieving our carbon reduction targets. | ||||
|
|
| |||||
| Employee engagement survey scoresb Revised Colleague HeartBeat survey, completed by our corporate, customer reservations office and managed hotel general managers (excluding our joint ventures).
We measure employee engagement to monitor risks relating to talent (see page 38) and to help us understand the issues that are relevant to our people as we build a diverse and inclusive culture (see page 28). |
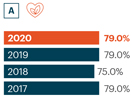
|
2020 status • The 2020 score of 79% was 2% higher than external benchmarks.
• In response to the pandemic our priorities pivoted to developing training, tools and support to maintain colleague engagement during remote working and furlough, including flexible learning summits, ‘keeping in touch’ mechanisms and more frequent leadership communications.
• Prioritised support for employee health and wellbeing including:
– creation of an Employee Assistance Programme (EAP), containing details of local support services that employees could call on;
– launch of a resilience and wellbeing newsletter in Greater China plus online resources to assist our support centre employees; and
– monthly dedicated ‘re-charge days’ from June to August for corporate employees to focus on health, wellbeing or personal development.
• Established ERGs to champion and drive our diverse, inclusive culture.
• Advanced our General Manager talent pipeline by developing new systems and processes to enable visibility of key talent in hotels.
2021 priorities • Build our future career proposition to remain a leading employer within the industry via a compelling employer value proposition.
• Engage our corporate employees with our new behaviours to support our future strategy and cultural shifts.
• Continue to purposefully grow and develop our corporate Senior Leaders and General Managers to help lead our recovery strategy and future growth.
• Continue to build an inclusive culture and increase the diversity of our leadership and talent pipelines to enable IHG to maximise the talents and contributions of all employees. | ||||
|
|
| |||||
| a | Carbon intensity figures for 2017 to 2019 have been restated in a move to calendar reporting in 2020. Prior reported growth based on previous methodology. The 2016 figure could not be restated. |
| b | Due to the complexity of survey administration in hotels during the pandemic the employee engagement survey process was amended. The 2020 score reflects the results of a single survey and includes employees in corporate, reservations offices and general managers (in managed hotels). Prior results from 2017 to 2019 have been restated for comparability to exclude the results of surveys from the managed estate, other than general managers. The 2016 survey results could not be restated. |
| 46 | IHG | Annual Report and Form 20-F 2020 |
Strategic Report
Performance continued
| Measure |
Commentary | |
| Revenue and operating profit measures continued | • Revenues related to the reimbursement of costs – as described within the Group’s accounting policies (page 139), there is a cost equal to these revenues so there is no profit impact. Cost reimbursements are not applicable to all hotels and growth in these revenues is not reflective of growth in the performance of the Group. As such, management do not include these revenues in their analysis of results. | |
| • Exceptional items – these are identified by virtue of either their size, nature, or incidence and can include, but are not restricted to, gains and losses on the disposal of assets, impairment charges and reversals, and reorganisation costs. As each item is different in nature and scope, there will be little continuity in the detailed composition and size of the reported amounts which affect performance in successive periods. Separate disclosure of these amounts facilitates the understanding of performance including and excluding such items. | ||
| In further discussing the Group’s performance in respect of revenue and operating profit, additional non-IFRS measures are used and explained further below: | ||
| • Underlying revenue; | ||
| • Underlying operating profit; | ||
| • Underlying fee revenue; and | ||
| • Fee margin. | ||
| Operating profit measures are, by their nature, before interest and tax. Management believes such measures are useful for investors and other stakeholders when comparing performance across different companies as interest and tax can vary widely across different industries or among companies within the same industry. For example, interest expense can be highly dependent on a company’s capital structure, debt levels and credit ratings. In addition, the tax positions of companies can vary because of their differing abilities to take advantage of tax benefits and because of the tax policies of the various jurisdictions in which they operate. | ||
| Although management believes these measures are useful to investors and other stakeholders in assessing the Group’s ongoing financial performance and provide improved comparability between periods, there are limitations in their use as compared to measures of financial performance under IFRS. As such, they should not be considered in isolation or viewed as a substitute for IFRS measures. In addition, these measures may not necessarily be comparable to other similarly titled measures of other companies due to potential inconsistencies in the methods of calculation. | ||
|
|
| |
| Underlying revenue and underlying operating profit | These measures adjust revenue from reportable segments and operating profit from reportable segments, respectively, to exclude revenue and operating profit generated by owned, leased and managed lease hotels which have been disposed, and significant liquidated damages, which are not comparable year-on-year and are not indicative of the Group’s ongoing profitability. The revenue and operating profit of current year acquisitions are also excluded as these obscure underlying business results and trends when comparing to the prior year. In addition, in order to remove the impact of fluctuations in foreign exchange, which would distort the comparability of the Group’s operating performance, prior year measures are restated at constant currency using current year exchange rates.
Management believes these are meaningful to investors and other stakeholders to better understand comparable year-on-year trading and enable assessment of the underlying trends in the Group’s financial performance. | |
|
|
| |
| Underlying fee revenue growth
|
Underlying fee revenue is used to calculate underlying fee revenue growth. Underlying fee revenue is calculated on the same basis as underlying revenue as described above but for the fee business only. | |
| Management believes underlying fee revenue is meaningful to investors and other stakeholders as an indicator of IHG’s ability to grow the core fee-based business, aligned to IHG’s asset-light strategy. | ||
|
|
| |
| 48 | IHG | Annual Report and Form 20-F 2020 |
| Performance | IHG | Annual Report and Form 20-F 2020 | 49 |
Strategic Report
Performance continued
| Measure |
Commentary | |
| Net debt Net debt is included in note 23 to the Group Financial Statements. |
Net debt is used in the monitoring of the Group’s liquidity and capital structure and is used by management in the calculation of the key ratios attached to the Group’s bank covenants and with the objective of maintaining an investment grade credit rating (see page 14 for further discussion). Net debt is used by investors and other stakeholders to evaluate the financial strength of the business. | |
| Net debt comprises loans and other borrowings, lease liabilities, the exchange element of the fair value of derivatives hedging debt values, less cash and cash equivalents. | ||
|
|
| |
| Adjusted EBITDA Operating profit recorded in the Group Financial Statements is reconciled to adjusted EBITDA on page 216. |
Adjusted EBITDA has been added as a measure in 2020 as it has become an increasingly useful measure to investors for comparing the performance of different companies.
| |
| One of the key measures used by the Group in monitoring its debt and capital structure is the net debt: adjusted EBITDA ratio, which is managed with the objective of maintaining an investment grade credit rating. The Group has a stated aim of maintaining this ratio at 2.5-3.0x. Adjusted EBITDA is defined as operating profit, excluding System Fund revenues and expenses, exceptional items and depreciation and amortisation. | ||
| Adjusted EBITDA is useful to investors and other stakeholders for comparing the performance of different companies as depreciation, amortisation and exceptional items are eliminated. It can also be used as an approximation of operational cash flow generation. This measure is relevant to the Group’s banking covenants, which have been waived until 31 December 2021. Details of covenant levels and performance against these is provided in note 24 to the Group Financial Statements. The leverage ratio uses a Covenant EBITDA measure which is calculated on a ‘frozen GAAP’ basis, which excludes the effect of IFRS 16. | ||
|
|
| |
| Gross capital expenditure, net capital expenditure, free cash flow The reconciliation of the Group’s statement of cash flows (i.e. net cash from investing activities, net cash from operating activities, accordingly) to the non-IFRS capital expenditure and cash flow measures are included on pages 215 to 216. |
These measures have limitations as they omit certain components of the overall cash flow statement. They are not intended to represent IHG’s residual cash flow available for discretionary expenditures, nor do they reflect the Group’s future capital commitments. These measures are used by many companies, but there can be differences in how each company defines the terms, limiting their usefulness as a comparative measure. Therefore, it is important to view these measures only as a complement to the Group statement of cash flows. | |
|
|
| |
| Gross capital expenditure | Gross capital expenditure represents the consolidated capital expenditure of IHG inclusive of System Fund capital investments (see page 15 for a description of System Fund capital investments and recent examples). | |
| Gross capital expenditure is defined as net cash from investing activities, adjusted to include contract acquisition costs (key money). In order to demonstrate the capital outflow of the Group, cash flows arising from any disposals or distributions from associates and joint ventures are excluded. The measure also excludes any material investments made in acquiring businesses, including any subsequent payments of deferred or contingent purchase consideration included within investing activities, which represent ongoing payments for acquisitions. | ||
| Gross capital expenditure is reported as either maintenance, recyclable, or System Fund. This disaggregation provides useful information as it enables users to distinguish between: | ||
| • System Fund capital investments which are strategic investments to drive growth at hotel level; | ||
| • recyclable investments (such as investments in associates and joint ventures), which are intended to be recoverable in the medium term and are to drive the growth of the Group’s brands and expansion in priority markets; and | ||
| • maintenance capital expenditure (including contract acquisition costs), which represents a permanent cash outflow. | ||
| Management believes gross capital expenditure is a useful measure as it illustrates how the Group continues to invest in the business to drive growth. It also allows for comparison year-on-year. | ||
|
|
| |
| 50 | IHG | Annual Report and Form 20-F 2020 |
| Performance | IHG | Annual Report and Form 20-F 2020 | 51 |
Strategic Report
Performance continued
Group results
| 12 months ended 31 December | ||||||||||||||||||||||||||||
|
2020 $m |
2019 $m |
2020 vs 2019 % change |
2018 $m |
2019 vs 2018 % change | ||||||||||||||||||||||||
| Revenuea | ||||||||||||||||||||||||||||
| Americas | 512 | 1,040 | (50.8 | ) | 1,051 | (1.0) | ||||||||||||||||||||||
| EMEAA | 221 | 723 | (69.4 | ) | 569 | 27.1 | ||||||||||||||||||||||
| Greater China | 77 | 135 | (43.0 | ) | 143 | (5.6) | ||||||||||||||||||||||
| Central | 182 | 185 | (1.6 | ) | 170 | 8.8 | ||||||||||||||||||||||
| Revenue from reportable segments | 992 | 2,083 | (52.4 | ) | 1,933 | 7.8 | ||||||||||||||||||||||
| System Fund revenues | 765 | 1,373 | (44.3 | ) | 1,233 | 11.4 | ||||||||||||||||||||||
| Reimbursement of costs | 637 | 1,171 | (45.6 | ) | 1,171 | – | ||||||||||||||||||||||
| Total revenue | 2,394 | 4,627 | (48.3 | ) | 4,337 | 6.7 | ||||||||||||||||||||||
| Operating profita | ||||||||||||||||||||||||||||
| Americas | 296 | 700 | (57.7 | ) | 673 | 4.0 | ||||||||||||||||||||||
| EMEAA | (50 | ) | 217 | (123.0 | ) | 206 | 5.3 | |||||||||||||||||||||
| Greater China | 35 | 73 | (52.1 | ) | 70 | 4.3 | ||||||||||||||||||||||
| Central | (62 | ) | (125 | ) | (50.4 | ) | (117 | ) | 6.8 | |||||||||||||||||||
| Operating profit from reportable segments | 219 | 865 | (74.7 | ) | 832 | 4.0 | ||||||||||||||||||||||
| System Fund result | (102 | ) | (49 | ) | 108.2 | (146 | ) | (66.4) | ||||||||||||||||||||
| Operating profit before exceptional items | 117 | 816 | (85.7 | ) | 686 | 19.0 | ||||||||||||||||||||||
| Operating exceptional items | (270) | (186 | ) | 45.2 | (104 | ) | 78.8 | |||||||||||||||||||||
| Operating (loss)/profit | (153) | 630 | (124.3 | ) | 582 | 8.2 | ||||||||||||||||||||||
| Net financial expenses | (140) | (115 | ) | 21.7 | (96 | ) | 19.8 | |||||||||||||||||||||
| Fair value gains/(losses) on contingent purchase consideration | 13 | 27 | (51.9 | ) | (4 | ) | (775.0) | |||||||||||||||||||||
| (Loss)/profit before tax | (280) | 542 | (151.7 | ) | 482 | 12.4 | ||||||||||||||||||||||
| (Loss)/earnings per ordinary share | ||||||||||||||||||||||||||||
| Basic | (142.9)¢ | 210.4¢ | (167.9 | ) | 183.7¢ | 14.5 | ||||||||||||||||||||||
| Adjustedb | 31.3 | ¢ | 303.3 | ¢ | (89.7 | ) | 293.2 | ¢ | 3.4 | |||||||||||||||||||
| Average US dollar to sterling exchange rate | $1: £0.78 | $1: £0.78 | – | $1: £0.75 | 4.0 | |||||||||||||||||||||||
| a | Americas and EMEAA include revenue and operating profit before exceptional items from both fee business and owned, leased and managed lease hotels. Greater China includes revenue and operating profit before exceptional items from fee business. |
| b | Definitions for Non-GAAP revenue and operating profit measures can be found on pages 47 to 51. Reconciliations of these measures to the most directly comparable line items within the Group Financial Statements can be found on pages 212 to 215. |
| c | Comparable RevPAR includes the adverse impact of hotels temporarily closed as a result of Covid-19. |
| 52 | IHG | Annual Report and Form 20-F 2020 |
| Performance | IHG | Annual Report and Form 20-F 2020 | 53 |
Strategic Report
Performance continued
Group continued
Group hotel and room count
| Hotels | Rooms | |||||||||||||||||||||||
| Change | Change | |||||||||||||||||||||||
| At 31 December | 2020 | over 2019 | 2020 | over 2019 | ||||||||||||||||||||
| Analysed by brand | ||||||||||||||||||||||||
| Six Senses | 16 | (2 | ) | 1,129 | (319 | ) | ||||||||||||||||||
| Regent | 7 | 1 | 2,190 | 187 | ||||||||||||||||||||
| InterContinental | 205 | (7 | ) | 69,941 | (1,040 | ) | ||||||||||||||||||
| Kimpton | 73 | 7 | 13,085 | 39 | ||||||||||||||||||||
| HUALUXE | 12 | 3 | 3,433 | 723 | ||||||||||||||||||||
| Crowne Plaza | 429 | (2 | ) | 118,879 | (1,703 | ) | ||||||||||||||||||
| Hotel Indigo | 125 | 7 | 15,604 | 1,030 | ||||||||||||||||||||
| EVEN Hotels | 16 | 3 | 2,410 | 461 | ||||||||||||||||||||
| voco | 18 | 6 | 5,077 | 784 | ||||||||||||||||||||
| Holiday Inna | 1,276 | (8 | ) | 236,554 | (3,340 | ) | ||||||||||||||||||
| Holiday Inn Express | 2,966 | 91 | 309,487 | 10,253 | ||||||||||||||||||||
| avid hotels | 24 | 17 | 2,156 | 1,521 | ||||||||||||||||||||
| Staybridge Suites | 303 | 3 | 32,895 | 262 | ||||||||||||||||||||
| Candlewood Suites | 366 | (44 | ) | 32,435 | (5,897 | ) | ||||||||||||||||||
| Otherb | 128 | (14 | ) | 40,761 | (488 | ) | ||||||||||||||||||
| Total | 5,964 | 61 | 886,036 | 2,473 | ||||||||||||||||||||
| Analysed by ownership type | ||||||||||||||||||||||||
| Franchised | 5,005 | 135 | 627,348 | 12,374 | ||||||||||||||||||||
| Managed | 936 | (71 | ) | 253,288 | (8,965 | ) | ||||||||||||||||||
| Owned, leased and managed lease | 23 | (3 | ) | 5,400 | (936 | ) | ||||||||||||||||||
| Total | 5,964 | 61 | 886,036 | 2,473 | ||||||||||||||||||||
| 54 | IHG | Annual Report and Form 20-F 2020 |
| Performance | IHG | Annual Report and Form 20-F 2020 | 55 |
Strategic Report
Performance continued
The performance, plans and priorities of each of our regions have been impacted to a different extent by Covid-19, in terms of both the length and severity of disruption.
IHG’s response was shaped by our purpose of True Hospitality for Good, with each region implementing the IHG Clean Promise and developing policies, operating procedures, brand standards and training programmes to protect the health and safety of guests and colleagues. In each region, plans were developed to support owners to reduce costs and protect cash flow by relaxing brand standards, temporarily reducing fees and helping owners meet the challenge of closing and reopening hotels safely. At the same time, each region developed commercial and operational plans to support their recovery to benefit all stakeholders. These measures continue into 2021 regional priorities, with a focus on customer centricity, maximising owner returns by making sustainable savings in hotel operating costs and driving improved guest satisfaction through quality improvements. The information set out below describes each region’s delivery against our strategic priorities and measures taken to respond to Covid-19, the following pages describe each region’s 2020 performance.
|
| ||
|
|
2020 review | |
| Americas | • Ensured hotels were delivering on Covid-19 health and safety measures and the IHG Clean Promise by developing a virtual process to monitor compliance to our new standards; audited over 4,000 hotels in the region in a few short months. | |
| • Worked with the highest levels of the US government to advocate for small business funding and assisted our owners with resources to apply for federal funds. | ||
| • Assisted communities by partnering with #FirstRespondersFirst and donated 50 million IHG Rewards points to provide free accommodation at hotels across the United States for frontline Covid-19 first responders. | ||
| • Captured domestic travel demand and achieved strong share gains across our brands in the midscale segments, which demonstrated resilience during the crisis. | ||
| • Strengthened the overall portfolio with 137 new signings and 167 openings driven by Holiday Inn Express, avid hotels, and our Suites brands. | ||
| • Achieved several brand milestones with the opening of the first voco in the Americas (New York City), first avid in Mexico, and first Kimpton in Mexico. | ||
|
|
| |
| EMEAA | • Supported hotel owners and colleagues throughout Covid-19, focusing on the health and safety of our hotel colleagues and providing cost management solutions for our owners. | |
| • EMEAA’s operating model continued to unlock high-value growth opportunities, opening 61 hotels and signing 82. Highlights included the expansion of Kimpton to eight open hotels, voco to 16 and Hotel Indigo to 46, as well as eight InterContinental signings. The total EMEAA estate reached 1,149 hotels with 389 in the pipeline. | ||
| • Continued focus on delivering operations efficiency for our owners, simplifying brand standards, reducing procurement costs, and continuously strengthening our approach to commercial and operational hotel support. | ||
| • Built great momentum behind critical guest experience initiatives, with a focus on quality, service and cleanliness (IHG Way of Clean programme), resulting in increased Guest Love scores across EMEAA. | ||
| • Engaged and supported employees through a wide range of pan-regional initiatives focused on mental and physical wellbeing; continued to develop and prioritise our diversity and inclusion agenda. | ||
|
|
| |
| Greater China | • Responding to the outbreak of Covid-19, we successfully implemented the IHG Clean Promise measured through improvements in guest satisfaction scores, and developed data driven commercial and operational plans to drive business recovery. | |
| • Achieved brand milestones with opening of our 100th franchise hotel, 200th Holiday Inn Express, 100th Crowne Plaza, 50th InterContinental and launch of EVEN and voco brands. | ||
| • Strengthened market presence of IHG brand portfolio in Greater China, with 141 signings and 57 openings, including many iconic properties in key markets such as the Regent Shanghai Pudong, InterContinental Chongqing Raffles City, voco Hangzhou Binjiang Minghao and Hualuxe Shanghai Twelve at Hengshan. | ||
| • Launched mobile booking and payment solutions, a corporate travel portal and an industry first tri-party credit card. | ||
| • Developed and implemented a Franchise Performance Support platform that delivers owner and hotel solutions, focused on driving operating performance with revenue tools and support. | ||
| • Received the Magnolia Award in recognition of IHG’s contribution to Shanghai’s development and international cooperation. | ||
|
|
| |
| 56 | IHG | Annual Report and Form 20-F 2020 |
| Performance | IHG | Annual Report and Form 20-F 2020 | 57 |
Strategic Report
Performance continued

|
“During the most challenging time in our industry’s history we are focused on the health and safety of our guests and colleagues, and supporting our owners. We’ve continued to see confidence in our established brands and maintained the momentum of our newest brands, avid® hotels and Atwell Suites™, as well as introducing the voco™ brand to the Americas.”
Elie Maalouf Chief Executive Officer, Americas | |
| 58 | IHG | Annual Report and Form 20-F 2020 |
| Performance | IHG | Annual Report and Form 20-F 2020 | 59 |
Strategic Report
Performance continued
Americas continued
| 60 | IHG | Annual Report and Form 20-F 2020 |
| Performance | IHG | Annual Report and Form 20-F 2020 | 61 |
Strategic Report
Performance continued
EMEAA
EMEAA results
| 12 months ended 31 December | ||||||||||||||||||||||||||||
|
2020 $m |
2019 $m |
2020 vs 2019 % change |
2018 $m |
2019 vs 2018 | ||||||||||||||||||||||||
| Revenue from the reportable segmenta | ||||||||||||||||||||||||||||
| Fee business | 107 | 337 | (68.2 | ) | 320 | 5.3 | ||||||||||||||||||||||
| Owned, leased and managed lease | 114 | 386 | (70.5 | ) | 249 | 55.0 | ||||||||||||||||||||||
| Total | 221 | 723 | (69.4 | ) | 569 | 27.1 | ||||||||||||||||||||||
| Operating (loss)/profit from the reportable segmenta | ||||||||||||||||||||||||||||
| Fee business | (18 | ) | 202 | (108.9 | ) | 202 | – | |||||||||||||||||||||
| Owned, leased and managed lease | (32 | ) | 15 | (313.3 | ) | 4 | 275.0 | |||||||||||||||||||||
| (50 | ) | 217 | (123.0 | ) | 206 | 5.3 | ||||||||||||||||||||||
| Operating exceptional items | (128 | ) | (109 | ) | 17.4 | (12 | ) | 808.3 | ||||||||||||||||||||
| Operating (loss)/profit | (178 | ) | 108 | (264.8 | ) | 194 | (44.3) | |||||||||||||||||||||
| 62 | IHG | Annual Report and Form 20-F 2020 |
| Performance | IHG | Annual Report and Form 20-F 2020 | 63 |
Strategic Report
Performance continued
|
|
“With the outbreak of Covid-19, the increased health and safety of our guests and colleagues was made a top priority, alongside supporting our hotels, owners and communities. As China contained the pandemic, we deployed a business recovery strategy to drive revenue through to profit, and focused on continued growth through new hotel openings and signings.”
Jolyon Bulley Chief Executive Officer, Greater China | |
| 64 | IHG | Annual Report and Form 20-F 2020 |
| Performance | IHG | Annual Report and Form 20-F 2020 | 65 |
Strategic Report
Performance continued
Greater China continued
| 66 | IHG | Annual Report and Form 20-F 2020 |
| Performance | IHG | Annual Report and Form 20-F 2020 | 67 |
Strategic Report
Performance continued
Other financial information
| 68 | IHG | Annual Report and Form 20-F 2020 |
| Performance | IHG | Annual Report and Form 20-F 2020 | 69 |
Strategic Report
Performance continued
Liquidity and capital resources
| 70 | IHG | Annual Report and Form 20-F 2020 |
| Performance | IHG | Annual Report and Form 20-F 2020 | 71 |
Governance
| 74 |
||
| 76 |
||
| 80 |
||
| 82 |
||
| 83 |
||
| 83 |
||
| 84 |
||
| 85 |
||
| 86 |
||
| 91 |
||
| 92 |
||
| 93 |
||
| 94 |
||
| 96 |
||
| 96 |
||
| 99 |
||
| 100 |
||
| 101 |
||
| 72 | IHG | Annual Report and Form 20-F 2020 |
| Chair’s overview | IHG | Annual Report and Form 20-F 2020 | 75 |
Governance
| Patrick Cescau Non-Executive Chair
Appointed to the Board: 1 January 2013
|

|
Skills and experience: From 2005 to 2008, Patrick was Group Chief Executive of Unilever Group, having previously been Chair of Unilever PLC, Vice-Chair of Unilever NV and Foods Director, following a progressive career with the company, which began in France in 1973. Prior to being appointed to the board of Unilever PLC and Unilever NV in 1999, as Finance Director, he was Chair of a number of the company’s major operating companies and divisions, including in the US, Indonesia and Portugal. He was formerly a Senior Independent Director and Non-Executive Director of Pearson plc, Tesco PLC and International Airlines Group, and a Director at INSEAD. | Board contribution: Patrick has held board positions for more than 20 years in leading global businesses and brings extensive international experience in strategy, brands, consumer products, and finance. As Chair, Patrick is responsible for leading the Board and ensuring it operates in an effective manner, and promoting constructive relations with shareholders and wider stakeholders. As Chair of the Nomination Committee, he is responsible for reviewing and making recommendations on the Group’s leadership needs.
Other appointments: Patrick is a trustee of The Leverhulme Trust, Patron of the St Jude India Children’s Charity and Member of the TEMASEK European Advisory Panel. | |||
| Keith Barr Chief Executive Officer (CEO)
Appointed to the Board: 1 July 2017
|

|
Skills and experience: Keith has spent more than 25 years working in the hospitality industry across a wide range of roles. He started his career in hotel operations and joined IHG in 2000. Since April 2011 he has been a member of IHG’s Executive Committee. Directly before being appointed CEO, Keith served as Chief Commercial Officer for four years. In this role, he led IHG’s global brand, loyalty, sales and marketing functions, and oversaw IHG’s loyalty programme, IHG® Rewards. Prior to this, Keith was CEO of IHG’s Greater China business for four years, setting the foundations for growth in a key market and overseeing the launch of the HUALUXE® Hotels and Resorts brand. | Board contribution: Keith is responsible for the executive management of the Group and ensuring the implementation of Board strategy and policy.
Other appointments: Keith is a Non-Executive Director of Yum! Brands. He also sits on the Board of WiHTL (Women in Hospitality Travel & Leisure). Keith is a graduate of Cornell University’s School of Hotel Administration and is currently a member of the Dean’s Advisory Board for The School of Hotel Administration, Cornell SC Johnson College of Business. | |||
| Paul Edgecliffe-Johnson Chief Financial Officer (CFO) and Group Head of Corporate Strategy
Appointed to the Board: 1 January 2014
|

|
Skills and experience: Paul is a fellow of the Institute of Chartered Accountants and is a graduate of the Harvard Business School Advanced Management Programme. He was previously CFO of IHG’s Europe and Asia, Middle East and Africa regions, a position he held since September 2011. He joined IHG in August 2004 and has held a number of senior-level finance positions, including Head of Investor Relations, Head of Global Corporate Finance and Financial Planning & Tax, and Head of Hotel Development, Europe. Paul also acted as Interim CEO of the Europe, Middle East and Africa region (prior to the reconfiguration of our operating regions). | Board contribution: Paul is responsible, together with the Board, for overseeing the financial operations of the Group and for leading Group strategy. | |||
| Elie Maalouf Chief Executive Officer, Americas
Appointed to the Board: 1 January 2018
|

|
Skills and experience: Elie was appointed CEO, Americas at IHG in February 2015 and has 20 years’ experience working in major global franchise businesses. He joined the Group having spent six years as President and CEO of HMSHost Corporation, where he was also a member of the board of directors. Elie brings broad experience spanning hotel development, branding, finance, real estate and operations management as well as food and beverage expertise. Elie was Senior Advisor with McKinsey & Company from 2012 to 2014. | Board contribution: Elie brings a deep understanding of the global hospitality sector to the Board. He is responsible for business development and performance of all hotel brands and properties in the Americas region and has global responsibility for customer development, providing oversight of the Global Sales organisation, as well as our owner management and services strategy.
Other appointments: Elie is a member of the American Hotel & Lodging Association Executive committee of the Board, and the U.S. Travel Association CEO Roundtable. In addition, Elie serves as a member of the Global Advisory Council at the University of Virginia Darden School of Business and is a board member of the Atlanta Committee for Progress. | |||
| 76 | IHG | Annual Report and Form 20-F 2020 |
| Our Board of Directors | IHG | Annual Report and Form 20-F 2020 | 77 |
Governance
Our Board of Directors continued
| Arthur de Haast Independent Non-Executive Director
Appointed to the Board: 1 January 2020
|
Skills and experience: Arthur has held several senior roles in the Jones Lang LaSalle (JLL) group, including Chair of JLL’s Capital Markets Advisory Council and Chair and Global CEO of JLL’s Hotels and Hospitality Group. Arthur is also a former Chair of the Institute of Hospitality. | Board contribution: Arthur has more than 30 years’ experience in the capital markets, hotels and hospitality sectors, along with significant Board-level knowledge around sustainability. Arthur serves on the Remuneration and Responsible Business Committees.
Other appointments: Arthur is Chair of JLL’s Capital Markets Advisory Council, a member of JLL’s Global Sustainability Board, an Independent Non-Executive Director of Chalet Hotels Limited and a member of the Advisory Board of the Scottish Business School, University of Strathclyde, Glasgow. | ||||

| ||||||
| Ian Dyson Independent Non-Executive Director
Appointed to the Board: 1 September 2013
|
Skills and experience: Ian has held a number of senior executive and finance roles, including Group Finance and Operations Director for Marks and Spencer Group plc for five years from 2005 to 2010, where he oversaw significant changes in the business. In addition, Ian was CEO of Punch Taverns plc, Finance Director for the Rank Group Plc, a leading European gaming business, and Group Financial Controller and Finance Director for the hotels division of Hilton Group plc. More recently, Ian was Senior Independent Non- Executive Director of Flutter Entertainment plc. | Board contribution: Ian has gained significant experience from working in various senior finance roles, predominantly in the retail, leisure and hospitality sectors. Ian became Chair of the Audit Committee on 1 April 2014, and, as such, is responsible for leading the Committee to ensure effective internal controls and risk management systems are in place.
Other appointments: Currently a Non-Executive Director and Chair of the Audit Committee of SSP Group plc and Senior Independent Non-Executive Director and Chair of the Audit Committee of ASOS plc. | ||||

| ||||||
| Jo Harlow Independent Non-Executive Director
Appointed to the Board: 1 September 2014
|
Skills and experience: Jo most recently held the position of Corporate Vice President of the Phones Business Unit at Microsoft Corporation. She was previously Executive Vice President of Smart Devices at Nokia Corporation, following a number of senior management roles at Nokia from 2003. Prior to that, she held marketing, sales and management roles at Reebok International Limited from 1992 to 2003 and at Procter & Gamble Company from 1984 to 1992. | Board contribution: Jo has over 25 years’ experience working in various senior roles, predominantly in the branded and technology sectors. Jo became Chair of the Remuneration Committee on 1 October 2017, and as such she is responsible for setting the Remuneration Policy. Jo is also a member of the Nomination Committee.
Other appointments: Currently a member of the Supervisory Board of Ceconomy AG and a Non-Executive Director of Halma plc and J Sainsbury plc. | ||||

| ||||||
| Changes to the Board and its Committees, and Executive Committee | ||||
|
|
| |||
| Graham Allan | Graham was appointed to the Board from 1 September 2020 | |||
|
|
| |||
| Ian Dyson | Ian was appointed to the Nomination Committee from 18 December 2020 | |||
|
|
| |||
| Duriya Farooqui | Duriya was appointed to the Board from 7 December 2020 | |||
|
|
| |||
| Wayne Hoare | Wayne was appointed Chief Human Resources Officer from 14 September 2020 | |||
|
|
| |||
| Luke Mayhew | Luke resigned from the Board from 18 December 2020 | |||
|
|
| |||
| Malina Ngai | Malina resigned from the Board from 7 May 2020 | |||
|
|
| |||
| Sharon Rothstein | Sharon was appointed to the Board from 1 June 2020 | |||
|
|
| |||
In addition to the changes in 2020 set out above, in February 2021, the Board approved the appointment of Richard Anderson and Daniela Barone Soares as Independent Non-Executive Directors of the Company with effect from 1 March 2021. Further information relating to their appointments will be included in the Annual Report and Form 20-F 2021. In February 2021, the Board also accepted the resignation of Anne Busquet, who will retire from the Board with effect from the 2021 AGM.
| Board Committee membership key | ||||||||

|
Audit Committee member |

|
Remuneration Committee member | |||||

|
Responsible Business Committee member |

|
Chair of a Board Committee | |||||

|
Nomination Committee member | |||||||
| 78 | IHG | Annual Report and Form 20-F 2020 |
| Our Board of Directors | IHG | Annual Report and Form 20-F 2020 | 79 |
Governance
In addition to Keith Barr, Paul Edgecliffe-Johnson and Elie Maalouf, the Executive Committee comprises:
| Claire Bennett Global Chief Customer Officer
Appointed to the Executive Committee: October 2017 (joined the Group: 2017)
|
|
Skills and experience: Claire joined IHG with an in-depth knowledge of the hospitality industry having spent 11 years at American Express in a range of senior leadership roles across marketing, consumer travel and loyalty. In her tenure there, Claire was General Manager (GM), Global Travel and Lifestyle, where she led a team responsible for delivering luxury lifestyle services, and she held additional roles including GM for Consumer Loyalty, GM for US Consumer Travel, and Senior Vice President, Global Marketing and Brand Management. Claire has also held senior marketing positions at Dell, as well as finance and general management roles at PepsiCo/Quaker Oats Company, building significant expertise across technology, retail e-commerce, financial services, and travel and hospitality sectors.
|
Claire has been an Executive Board Member of the World Travel and Tourism Council (WTTC), served as a Board Member of Tumi Inc. and participated on multiple industry advisory boards. Claire is a Certified Public Accountant and holds an MBA from the J.L. Kellogg Graduate School of Management at Northwestern University.
Key responsibilities: These include all aspects of brand design and commercial delivery, loyalty, partnerships, customer experience, and marketing execution. | |||
| Jolyon Bulley Chief Executive Officer, Greater China
Appointed to the Executive Committee: November 2017 (joined the Group: 2001)
|
|
Skills and experience: Prior to his appointment as CEO for Greater China, Jolyon was Chief Operating Officer (COO) for the Americas, leading the region’s operations for franchised and managed hotels, in addition to cultivating franchisee relationships and enhancing hotel operating performance. Jolyon has also served as COO for Greater China for almost four years, with oversight of the region’s hotel portfolio and brand performance, food and beverage brand solutions, new hotel openings and owner relations. | Jolyon joined IHG in 2001, as Director of Operations in New South Wales, Australia, and then held roles of increasing responsibility across IHG’s Asia-Pacific region. He became Regional Director Sales and Marketing for Australia, New Zealand and South Pacific in 2003, relocated to Singapore in 2005 and held positions of Vice President Operations South East Asia and India, Vice President Resorts, and Vice President Operations, South East and South West Asia. Jolyon graduated from William Angliss Institute in Melbourne with a concentration on Tourism and Hospitality.
Key responsibilities: These include the management, growth and profitability of IHG’s fastest growing region, Greater China.
| |||
| Yasmin Diamond, CB Executive Vice President, Global Corporate Affairs
Appointed to the Executive Committee: April 2016 (joined the Group: 2012)
|
|
Skills and experience: Before joining IHG in April 2012, Yasmin was Director of Communications at the Home Office, where she advised the Home Secretary, ministers and senior officials on the strategic development and daily management of all the Home Office’s external and internal communications. She was previously Director of Communications at the Department for Environment, Food and Rural Affairs; Head of Communications for Welfare to Work and New Deal; and Head of Marketing at the Department for Education and Skills. Before joining government communications, Yasmin was Publicity Commissioner for the BBC, where she led communications activity around the launch of a new digital learning channel and around the BBC’s educational output for both adults and children.
|
In 2011, Yasmin was awarded a Companion of the Order of the Bath (CB) in the New Year’s honours list in recognition of her career in government communications. In addition, Yasmin sits on the Board of Trustees for the British Council, the UK’s international organisation for cultural relations and educational opportunities, and is a Board Trustee member of the Sustainable Hospitality Alliance.
Key responsibilities: Yasmin is responsible for all global corporate affairs activity, focused on supporting and enabling IHG’s broader strategic priorities. This includes all external and internal communications, covering both corporate and consumer brand PR; global government affairs work; and leading IHG’s Corporate Responsibility strategy.
| |||
| Nicolette Henfrey Executive Vice President, General Counsel and Company Secretary
Appointed to the Executive Committee: February 2019 (joined the Group: 2001)
|

|
Skills and experience: Nicolette joined IHG in 2001, and was appointed Deputy Company Secretary in August 2011, during which time she worked very closely with the Board, Executive Committee and wider organisation to ensure best-in-class delivery and compliance across our legal and regulatory areas. Nicolette is a solicitor and prior to joining IHG worked for Linklaters in London and Findlay & Tait (now Bowmans) in South Africa. Nicolette was appointed as Company Secretary on 1 March 2019. | Key responsibilities: These include overseeing our approach to corporate governance, risk management, insurance, regulatory compliance, internal audit, legal and hotel standards. | |||
| 80 | IHG | Annual Report and Form 20-F 2020 |
| Our Executive Committee | IHG | Annual Report and Form 20-F 2020 | 81 |
Governance
|
|
Working under Covid As circumstances developed, the Board adjusted its schedule to allow appropriate time to address the impact of the Covid-19 pandemic and oversee the Group’s response to it. The Board also modified its ways of working in response to the pandemic, for example:
• when physical meetings became impracticable, Board and Committee meetings were held by video and telephone conference;
• in addition to the usual scheduled Board meetings, there were regular additional meetings and update calls to monitor the impact of the pandemic and consider the Group’s response to it;
• regular contact was also established between the Board and management outside of scheduled meetings, allowing Directors to provide additional support and challenge to management to ensure the best decision-making possible;
• a Board ‘Dashboard’ containing key trading and financial metrics was produced and shared regularly with Board members; and
• the Board also liaised closely with shareholders and advisers in relation to the Group’s response to the pandemic.
|
| 82 | IHG | Annual Report and Form 20-F 2020 |
| Board activities | IHG | Annual Report and Form 20-F 2020 | 83 |
Governance
Board activities continued
Board meetings continued
| Area of discussion | Discussion topic and decisions made | |||
|
|
|
| ||
| Risk management | Cybersecurity | Discussions and presentations covered threats and trends in the hospitality industry, the Group’s key systems and risk appetite as well as managing cyber risks in a remote environment. The Board also reviewed the policies and actions taken to address threats and mitigate risks. | ||
|
|
| |||
| Internal controls and risk management systems, our risk appetite and our global insurance programme | Regular updates were received on internal controls, risk management systems, principal and emerging risks, our risk appetite and global insurance programme. Reports on risk topics were delivered by the Chair of each Committee. | |||
|
|
| |||
| Terms of Reference for each Board Committee | Minor changes to the Nomination Committee’s Terms of Reference were considered and approved. The Terms of Reference for all Committees and the Matters Reserved for the Board can be found on our website. | |||
|
|
|
| ||
| Investor relations and communications | Updates on investor perceptions and shareholder relations, consideration of analysts’ reports and media updates | The Board receives a regular report outlining share register movement, relative share price performance, Investor Relations activities and engagement with shareholders. The Board also considered feedback from the regular investor and analyst perception survey as well as individual meetings with investors. | ||
|
|
| |||
| Global communications updates | The Board receives a regular report on global communications covering areas including activity across key regions, our brands, people, and owners. | |||
|
|
| |||
| Preparations for the AGM | The Board assessed changes to plans for the 2020 AGM caused by restrictions on group meetings. Details of the 2021 AGM can be found on page 33. | |||
|
|
|
| ||
Director induction, training and development
| 84 | IHG | Annual Report and Form 20-F 2020 |
| Board activities | IHG | Annual Report and Form 20-F 2020 | 85 |
| Audit Committee | IHG | Annual Report and Form 20-F 2020 | 87 |
Governance
Audit Committee continued
| 88 | IHG | Annual Report and Form 20-F 2020 |
| Audit Committee | IHG | Annual Report and Form 20-F 2020 | 89 |
Governance
Audit Committee continued
Significant matters in the 2020 Financial Statements
| Area of focus | Issue/Role of the Committee | Conclusions/Actions taken | ||
|
|
|
| ||
| Impact of Covid-19 on the Group’s viability and going concern | Covid-19 has had a significant impact on the profitability of the Group and increased the level of uncertainty in planning scenarios. The Committee reviews management’s financial modelling to conclude on the appropriateness of the going concern and viability assessment. | The Committee reviewed and challenged the scenarios considered by management in its going concern assessment to June 2022 and viability assessment over the next three years and concluded that these were appropriate and adequate. The Committee reviewed and challenged the detailed cash flow forecasts and the mitigating actions available to management, and considered the covenant waivers and relaxations in place, and concluded that the going concern basis of accounting is appropriate. The Committee also reviewed and challenged the reverse stress test assumptions to confirm the viability of the Group. The Committee reviewed going concern disclosures (page 133) and the Viability statement (page 42) and is satisfied these are appropriate. | ||
|
|
|
| ||
| Accounting for IHG Rewards | Accounting for IHG Rewards requires significant use of estimation techniques and represents a material deferred revenue balance. The Committee reviews the controls, judgements and estimates related to accounting for IHG Rewards. | The Committee reviewed the deferred revenue balance and questioned the valuation approach, the results of the external actuarial review and procedures completed, to determine the breakage assumption for earned IHG Rewards points and the estimate that member behaviour patterns would return to pre-Covid levels. The Committee reviewed a paper from management outlining current loyalty trends (both member behaviour and changes to programme benefits) with a focus on the potential impact of Covid-19 on deferred revenue and the breakage assumption. The Committee concluded that the deferred revenue balance is appropriately stated. | ||
|
|
|
| ||
| Accounting for the System Fund | Given the unique nature of the System Fund, the Committee reviews the controls and processes related to System Fund accounting. | The Committee met with senior finance management to review and evaluate the risk areas associated with the System Fund. The Committee reviewed a paper from management summarising the principles determining the allocation of revenues and expenses to the System Fund, and the related governance and internal control environment. The Committee also reviewed a paper outlining the changes relating to intellectual property licence fee revenues and InterContinental Ambassador revenues and costs (see page 150). The Committee concluded that the accounting treatment of the System Fund, and related disclosures, were appropriate. | ||
|
|
|
| ||
| Impairment testing | Impairment reviews require significant judgement in estimating recoverable values of assets or cash-generating units and the Committee therefore scrutinises the methodologies applied and the inherent sensitivities in determining any potential asset impairment and the adequacy of the related disclosures. | The Committee reviewed management reports outlining the approach taken on impairment testing and key assumptions and sensitivities supporting the conclusion on the various asset categories. The Committee examined in detail the assumptions applied in calculating the impairments recorded in the year (see pages 135 to 137), including the underlying cash flow projections which reflect management’s expectations of the five-year recovery period from Covid-19 (see page 135). The Committee specifically focused on the North America hotels ($35m), UK portfolio property, plant and equipment ($50m) and the related fair value adjustment to contingent purchase consideration ($21m), the US corporate headquarters ($50m), Barclay associate ($13m), Six Senses management agreements ($41m) and assets associated with the SVC portfolio ($66m) as well as the assumptions applied in testing the InterContinental Boston. | ||
| The Committee considered management’s reports in respect of the appropriateness of the Group’s cash-generating units and the level at which goodwill and brands should be tested for impairment following the Group restructuring programme and the loss of the SVC portfolio. The Committee challenged management and is satisfied that no impairment would have arisen if the methodology applied in prior years had been applied. The Committee reviewed the disclosures and is satisfied that they are appropriate. | ||||
| The Committee concluded that it agreed with the determinations reached on impairment, and the related change in the fair value of the UK portfolio contingent purchase consideration, the classification of these as exceptional items and that the related disclosures were appropriate. | ||||
|
|
|
| ||
| Expected credit losses | Estimating expected credit losses on trade and other receivables has been subject to an increased level of uncertainty in 2020 due to the disruption from Covid-19 and has had a more significant impact on the Group. In this situation, the Committee reviews the provision and considers the adequacy of the disclosure. | The Committee reviewed management’s papers setting out the approach to calculating the provision for expected credit losses, which is subject to greater uncertainty given the Group’s limited experience of owners’ ability to pay during a pandemic. Factors considered include the ageing of receivables, owners known to be in financial distress and the expected mitigating impact of payment plans and other support offered by the Group. The Committee concluded it agreed with the basis of calculation (which has resulted in a charge of $40m in 2020, and an additional charge of $24m recognised in the System Fund). The Committee agreed the improvement in cash collection in the second half of the year supports the classification of expected credit losses within operating profit before exceptional items. | ||
|
|
|
| ||
| Litigation and contingencies | From time to time, the Group is subject to legal proceedings with the ultimate outcome of each being subject to many uncertainties. The Committee reviews and evaluates the need for provisioning on a case by case basis and considers the adequacy of the disclosure. | At each meeting during the year, the Committee considered a report detailing all material litigation matters. The Committee discussed and agreed any provisioning requirements for these matters based on their underlying factors. The Committee reviewed the cost of an arbitration award in the EMEAA region, and the release of a provision in respect of a lawsuit previously filed against the Group in the Americas region which has now been settled. The Committee agreed the classification of these items as exceptional and concluded that the disclosures of litigation and contingencies were appropriate. | ||
|
|
|
| ||
| Exceptional items | The Group exercises judgement in presenting exceptional items. The Committee reviews and challenges the classification of items as exceptional based on their materiality or nature. | The Committee reviewed papers prepared by management and considered the consistency of treatment and nature of items classified as exceptional. The Committee reviewed and challenged the significance, timing and nature of the exceptional items (see page 154) which as well as the items mentioned above comprise gains on derecognition of lease liabilities and right of use assets, gains on lease termination, provisions for onerous expenditure, reorganisation costs, acquisition and integration costs primarily relating to Six Senses, other impairments and financial expenses relating to the partial settlement of the Group’s outstanding bonds. The Committee concluded that the disclosures and the treatment of the items shown as exceptional were appropriate. | ||
|
|
|
| ||
| 90 | IHG | Annual Report and Form 20-F 2020 |
| Responsible Business Committee | IHG | Annual Report and Form 20-F 2020 | 91 |
| Nomination Committee | IHG | Annual Report and Form 20-F 2020 | 93 |
| Statement of compliance | IHG | Annual Report and Form 20-F 2020 | 95 |
| Directors’ Remuneration Report | IHG | Annual Report and Form 20-F 2020 | 97 |
Governance
Directors’ Remuneration Report continued
Remuneration Committee Chair’s statement continued
Summary of approved Directors’ Remuneration Policy
| Element | 2021 | 2022 | 2023 | 2024 | 2025 | Framework | Purpose/Link to strategy | |||||||
|
|
|
|
|
|
|
|
| |||||||
| Fixed | ||||||||||||||
| Base salary |

|
Increases generally in line with the range applying to the corporate population. Reviewed annually and fixed for 12 months from 1 April. | Recognises the value and impact of the role and the individual’s skills, performance and experience. | |||||||||||
|
|
|
|
|
|
|
|
| |||||||
| Benefits |

|
Relevant benefits are restricted to the typical level for the role/location. | Competitive and consistent with role/ location; helps recruit and retain. | |||||||||||
|
|
|
|
|
|
|
|
| |||||||
| Pension/ Retirement Benefit |

|
Defined Contribution or cash in lieu for UK Directors. Employee contributions with matching company contributions. Salary is the only part of pay that is pensionable. Pension contributions and/or cash allowance for new UK Executive Directors will be aligned with the maximum company contribution available to all other participants in the UK Pension Plan; incumbent UK Executive Directors will reduce to the same level at the end of 2022. | Competitive and consistent with role/ location; helps recruit and retain. | |||||||||||
|
|
|
|
|
|
|
|
| |||||||
| Variable | ||||||||||||||
| Annual Performance Plan (cash) |
|
Maximum annual opportunity is 200% of salary with 70% based an operating profit measure and 30% on key strategic objectives. 50% of the award is deferred into shares for three years. Awards are subject to global affordability gate. Full vesting after three years. Malus and clawback apply. | For 2021, the key strategic objectives, linked to business strategy, are:
• room signings (15% weighting), and
• room openings (15% weighting)
Further detail on the link to strategy of these measures can be found on page 108. | |||||||||||
|
|
|
|
|
|
| |||||||||
| Annual Performance Plan (deferred shares) |

| |||||||||||||
|
|
|
|
|
|
|
|
| |||||||
| Long Term Incentive Plan (LTIP) |
|
|
The maximum potential LTIP quantum is 350% of salary for the CEO and 275% of salary for other Executive Directors. A two-year post-vest holding period and malus and clawback apply | A focus on industry leading NSSG is at the heart of our strategy, balanced by a Return on Capital Employed (ROCE) underpin to reflect our commitment to deliver quality growth while maintaining returns. Together with TSR and Cash Flow, there is a strong alignment between Executive Director remuneration and shareholder interests. | ||||||||||
|
|
|
|
|
|
|
|
| |||||||
| Other | ||||||||||||||
| Minimum shareholding requirements | The guideline shareholding requirements are 500% of salary for the CEO and 300% for other Executive Directors. The post-employment shareholding requirement, introduced in 2018, continues to apply. | |||||||||||||
|
|
|
|
|
|
|
|
| |||||||
| 98 | IHG | Annual Report and Form 20-F 2020 |
| Directors’ Remuneration Report | IHG | Annual Report and Form 20-F 2020 | 99 |
Governance
Directors’ Remuneration Report
Remuneration at IHG – the wider context
Actions on pay as a result of the impact of Covid-19 on the business
The outbreak of Covid-19 had a significant impact on our business, as severe restrictions on travel and social contact saw demand drop to record lows. Steps had to be taken across the business to reduce costs, balanced with a need to retain key talent and continue to operate effectively as a business.
How our reward practices align across all levels of the organisation
Our reward packages are designed to attract, retain and motivate top talent. We apply a consistent approach across the corporate business, ensuring we meet employees’ needs and offer a market-driven package, which we regularly review against our competitors for talent.
| Elements of Reward | Executive Directors |
Executive Committee |
Wider Workforce |
Notes in respect of 2020 actions on pay | ||||||
|
|
| |||||||||
| Fixed |
|

|
|
|
The planned merit salary increase was not applied for all corporate employees, including Executive Directors; salaries for Executive Directors and fees for Non-Executive Directors were reduced by 30% during April to September inclusive, whilst salaries for other corporate employees were reduced by between 10% to 20%. | |||||
|
|
| |||||||||
|
|

|
|
|
Where applicable, corporate healthcare benefits, including Employee Assistance Programmes, remained in place. Taxable travel expenses for Non-Executive Directors were lower because only the February 2020 Board meeting was held in person. | ||||||
|
|
| |||||||||
|
|

|
|
|
A localised approach was taken to the treatment of pension benefits, based on local plan rules and regulations. See below for details of the approach taken in the UK and US, our largest corporate office locations. | ||||||
|
|
| |||||||||
| Variable |
|

|
|
|
The minimum financial performance threshold was not met and as a result no 2020 bonus will be paid to Executive Directors or other corporate employees. | |||||
|
|
| |||||||||
|
|

|
|
|
Performance-based LTIP largely applies at the level of Executive Committee and their direct reports. Vesting of 30.6% applies for the 2018/20 LTIP in line with performance against targets. | ||||||
|
|
|
|||||||||
|
|
|
|
In line with typical market practice, particularly in the US, and due to line-of-sight to performance measures, a gradually greater proportion of the LTIP award is made as RSUs for eligible roles below Executive Director level. These are not subject to performance conditions and will vest fully for eligible participants in respect of the 2018/20 cycle. | |||||||
|
|
| |||||||||
|
|
|
Contributions by furloughed employees were suspended during the period of furlough. | ||||||||
|
|
| |||||||||
UK and US pension and retirement benefits
Pension and retirement benefits are provided in the UK and US in line with market practice.
| 100 | IHG | Annual Report and Form 20-F 2020 |
| Directors’ Remuneration Report | IHG | Annual Report and Form 20-F 2020 | 101 |
Governance
Directors’ Remuneration Report continued
Annual Report on Directors’ Remuneration continued
AUDITED
| 102 | IHG | Annual Report and Form 20-F 2020 |
| Directors’ Remuneration Report | IHG | Annual Report and Form 20-F 2020 | 103 |
Governance
Directors’ Remuneration Report continued
Annual Report on Directors’ Remuneration continued
AUDITED
LTIP
Achievement against target is measured by reference to the three years ended 31 December 2020. This cycle will vest on 24 February 2021 and the individual outcomes for this cycle are show below.
The share price of 4,460p used to calculate the 2018/20 LTIP cycle value shown in the single-figure table is the average over the final quarter of 2020.
| % of | ||||||||||||||||||||||||||||
| Maximum | maximum | Outcome | Total value | Value of award | ||||||||||||||||||||||||
| opportunity at grant | opportunity | (number of shares | of award | attributable to share | ||||||||||||||||||||||||
| Executive Director | Award cycle | (number of shares) | vested | awarded at vest) | £000 | price appreciation | ||||||||||||||||||||||
| Keith Barr | LTIP 2018/20 | 35,381 | 30.6% | 10,826 | 483 | (18 | ) | |||||||||||||||||||||
| Paul Edgecliffe-Johnson | LTIP 2018/20 | 24,830 | 30.6% | 7,597 | 339 | (13 | ) | |||||||||||||||||||||
| Elie Maalouf | LTIP 2018/20 | 24,426 | 30.6% | 7,474 | 333 | (12 | ) | |||||||||||||||||||||
AUDITED
Other outstanding awards
Scheme interests awarded during 2019 and 2020
During 2019 and 2020, awards were granted under the LTIP cycle and made to each Executive Director over shares with a maximum value of 205% of salary using an average of the closing mid-market share price for the five days prior to grant, as in the table below. These are in the form of conditional awards over Company shares and do not carry the right to dividends or dividend equivalents during the vesting period.
The vesting date for the 2019/21 LTIP award is the day after the announcement of our financial year 2021 Preliminary Results in February 2022. These awards will vest to the extent performance targets are met and will then be restricted for a further two years, transferring to the award-holder in February 2024.
The vesting date for the 2020/22 LTIP award is the day after the announcement of our financial year 2022 Preliminary Results in February 2023. These awards will vest to the extent performance targets are met and will then be restricted for a further two years, transferring to the award-holder in February 2025.
At the 2020 AGM, shareholders approved the new DR Policy which included an increase in LTIP opportunities to 350% of salary for the CEO and 275% for the other Executive Directors. These were intended to apply to awards granted in 2020; however, to demonstrate pay restraint in response to Covid-19 and to reflect the fall in share price since the grant of awards in 2019, the increased headroom was not used, equating to a reduction of around 40% for the CEO and 25% for the other Executive Directors compared to the approved higher LTIP award levels.
The Committee discussed the views of some investors in relation to the size of share awards where the share price had fallen substantially, and the potential windfall gains when share prices recovered. The grant price for the 2020/22 cycle was £34.96, representing a reduction of c.29% from the grant price for the 2019/21 cycle awards. Given the continued uncertainty as to the likely share price recovery at the time of grant, it was determined not to use an alternative grant price or methodology to determine the number of shares granted. The use of lower opportunity levels resulted in fewer shares being awarded to the Executive Directors than would have been the case if awards were granted at the originally intended levels as outlined above. The Committee will consider whether it is appropriate to exercise discretion to adjust the formulaic outcome at the time of vesting, including taking into account the movement in share price between grant and vesting dates, as a further precaution against windfall gains.
| Executive Director | Award date | Maximum shares awarded |
Market
price £ |
Face value of award at grant £000 |
Number of shares received if minimum performance achieved |
|||||||||||||||||||
| 2019/21 cycle | ||||||||||||||||||||||||
| Keith Barr | 10 May 2019 | 34,693 | 49.43 | 1,718 | 6,938 | |||||||||||||||||||
| Paul Edgecliffe-Johnson | 10 May 2019 | 25,509 | 49.43 | 1,263 | 5,101 | |||||||||||||||||||
| Elie Maalouf | 10 May 2019 | 25,802 | 49.43 | 1,278 | 5,160 | |||||||||||||||||||
| 2020/22 cycle | ||||||||||||||||||||||||
| Keith Barr | 12 May 2020 | 49,153 | 34.96 | 1,718 | 9,830 | |||||||||||||||||||
| Paul Edgecliffe-Johnson | 12 May 2020 | 36,140 | 34.96 | 1,263 | 7,228 | |||||||||||||||||||
| Elie Maalouf | 12 May 2020 | 38,463 | 34.96 | 1,345 | 7,692 | |||||||||||||||||||
Performance measures and consideration of discretion
The performance measures are as agreed in the 2017 and 2020 Remuneration Policies. Total Shareholder Return, Total Gross Revenue, net system size growth and cash flow are measured by reference to the three years ending 31 December 2021 for the 2019/21 cycle and 31 December 2022 for the 2020/22 cycle; NSSG for 2020/22 is the first relative cycle, and is measured to 30 September 2022 rather than 31 December 2022. Minimum performance is equal to 20% of the maximum award.
As a result of the unavoidable impact of the Covid-19 pandemic on the business performance, in most cases performance against the absolute measures (TGR, cash flow and, for the 2019/21 cycle, NSSG) is tracking below the threshold level required for vesting for both
| 104 | IHG | Annual Report and Form 20-F 2020 |
| Directors’ Remuneration Report | IHG | Annual Report and Form 20-F 2020 | 105 |
Governance
Directors’ Remuneration Report continued
Annual Report on Directors’ Remuneration continued
Relative performance graph
InterContinental Hotels Group PLC is a member of the FTSE 100 share index, and the graph below shows the Company’s Total Shareholder Return (TSR) performance from 31 December 2010 to 31 December 2020, assuming dividends are reinvested, compared with the TSR performance achieved by the FTSE 100.
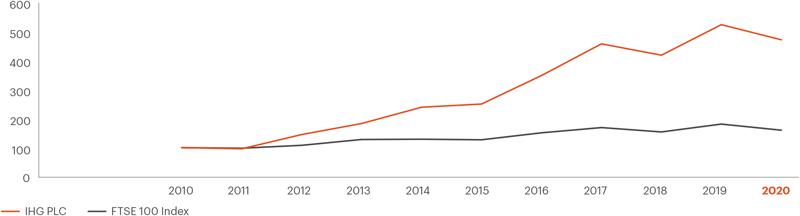
Chief Executive Officer’s remuneration
The table below shows the Chief Executive Officer’s single figure of total remuneration for the 10 years to 31 December 2020.
| Single figure |
CEO |
2011 | 2012 | 2013 | 2014 | 2015 | 2016 | 2017 | 2018 | 2019 | 2020 | |||||||||||||||||||||||||||||||
| Single figure of remuneration (£000) |
Keith Barr | 2,161 | 3,143 | a | 3,376 | 1,418 | ||||||||||||||||||||||||||||||||||||
|
|
|
|
|
|
|
|
|
|
|
|
|
|
|
|
|
|
|
|
|
|
|
|
|
|
|
|
|
|
|
| ||||||||||||
| Richard Solomons | 4,724 | 4,881 | 3,131 | 6,611 | b | 3,197 | 3,662 | 2,207 | c | |||||||||||||||||||||||||||||||||
|
|
|
|
|
|
|
|
|
|
|
|
|
|
|
|
|
|
|
|
|
|
|
|
|
|
|
|
|
|
|
| ||||||||||||
| Andrew Cosslett | 3,770 | |||||||||||||||||||||||||||||||||||||||||
|
|
|
|
|
|
|
|
|
|
|
|
|
|
|
|
|
|
|
|
|
|
|
|
|
|
|
|
|
|
|
|
| |||||||||||
| Annual incentive received (% of maximum) |
Keith Barr | 69.7 | 84.1 | 58.7 | 0 | |||||||||||||||||||||||||||||||||||||
|
|
|
|
|
|
|
|
|
|
|
|
|
|
|
|
|
|
|
|
|
|
|
|
|
|
|
|
|
|
|
| ||||||||||||
| Richard Solomons | 83.0 | 68.0 | 74.0 | 74.0 | 75.0 | 63.9 | 66.8 | |||||||||||||||||||||||||||||||||||
|
|
|
|
|
|
|
|
|
|
|
|
|
|
|
|
|
|
|
|
|
|
|
|
|
|
|
|
|
|
|
| ||||||||||||
| Andrew Cosslett | 43.3 | |||||||||||||||||||||||||||||||||||||||||
|
|
|
|
|
|
|
|
|
|
|
|
|
|
|
|
|
|
|
|
|
|
|
|
|
|
|
|
|
|
|
|
| |||||||||||
| Shares received under the LTIP (% of maximum) |
Keith Barr | 46.1 | 45.4 | 78.9 | 30.6 | |||||||||||||||||||||||||||||||||||||
|
|
|
|
|
|
|
|
|
|
|
|
|
|
|
|
|
|
|
|
|
|
|
|
|
|
|
|
|
|
|
| ||||||||||||
| Richard Solomons | 73.9 | 100.0 | 59.0 | 56.1 | 50.0 | 49.4 | 46.1 | |||||||||||||||||||||||||||||||||||
|
|
|
|
|
|
|
|
|
|
|
|
|
|
|
|
|
|
|
|
|
|
|
|
|
|
|
|
|
|
|
| ||||||||||||
| Andrew Cosslett | 61.6 | |||||||||||||||||||||||||||||||||||||||||
|
|
|
|
|
|
|
|
|
|
|
|
|
|
|
|
|
|
|
|
|
|
|
|
|
|
|
|
|
|
|
|
| |||||||||||
| a | For Keith Barr, the 2018 figure includes a one-off cash payment for relocation costs in lieu of benefits received whilst on international assignment prior to CEO position, fully explained in the 2017 report. |
| b | For Richard Solomons, the 2014 figure includes a one-off cash payment in respect of pension entitlements which was fully explained in the 2014 report. |
| c | In respect of period 1 January to 30 June 2017. |
| 106 | IHG | Annual Report and Form 20-F 2020 |
| Directors’ Remuneration Report | IHG | Annual Report and Form 20-F 2020 | 107 |
Governance
Directors’ Remuneration Report continued
Annual Report on Directors’ Remuneration continued

|
||
|
Payments for loss of office There were no payments for loss of office in 2020.
Pension entitlements No Executive Director is entitled to any Defined Benefit pension or related benefit from IHG.
|
Payments to past Directors – benefits Sir Ian Prosser Sir Ian Prosser, who retired as Director on 31 December 2003, had an ongoing healthcare benefit of £1,690.00 during the year. |
| 108 | IHG | Annual Report and Form 20-F 2020 |
| Directors’ Remuneration Report | IHG | Annual Report and Form 20-F 2020 | 109 |
Governance
Directors’ Remuneration Report continued
Annual Report on Directors’ Remuneration continued

Single total figure of remuneration: Non-Executive Directors
| Committee appointments |
Date of original appointment |
Fees £000 |
Taxable benefits £000 |
Total £000 | ||||||||||||||||||||||||||||
|
|
|
|
|
|
|
|
| |||||||||||||||||||||||||
| Non-Executive Director | 2020 | 2019 | 2020 | 2019 | 2020 | 2019 | ||||||||||||||||||||||||||
|
|
|
|
|
|
|
|
|
|
|
|
|
|
|
|
|
|
|
|
|
|
|
| ||||||||||
| Patrick Cescau |

|
01/01/13 | 377 | 435 | 7 | 14 | 384 | 449 | ||||||||||||||||||||||||
|
|
|
|
|
|
|
|
|
|
|
|
|
|
|
|
|
|
|
|
|
|
|
| ||||||||||
| Graham Allan |

|
01/09/20 | 24 | – | 0 | – | 24 | – | ||||||||||||||||||||||||
|
|
|
|
|
|
|
|
|
|
|
|
|
|
|
|
|
|
|
|
|
|
|
| ||||||||||
| Anne Busquet |

|
01/03/15 | 66 | 77 | 1 | 5 | 67 | 82 | ||||||||||||||||||||||||
|
|
|
|
|
|
|
|
|
|
|
|
|
|
|
|
|
|
|
|
|
|
|
| ||||||||||
| Arthur de Haast |

|
01/01/20 | 66 | – | 0 | – | 66 | – | ||||||||||||||||||||||||
|
|
|
|
|
|
|
|
|
|
|
|
|
|
|
|
|
|
|
|
|
|
|
| ||||||||||
| Ian Dyson |

|
01/09/13 | 88 | 102 | 0 | 2 | 88 | 104 | ||||||||||||||||||||||||
|
|
|
|
|
|
|
|
|
|
|
|
|
|
|
|
|
|
|
|
|
|
|
| ||||||||||
| Duriya Farooqui |

|
07/12/20 | 5 | – | 0 | – | 5 | – | ||||||||||||||||||||||||
|
|
|
|
|
|
|
|
|
|
|
|
|
|
|
|
|
|
|
|
|
|
|
| ||||||||||
| Jo Harlow |

|
01/09/14 | 88 | 102 | 0 | 2 | 88 | 104 | ||||||||||||||||||||||||
|
|
|
|
|
|
|
|
|
|
|
|
|
|
|
|
|
|
|
|
|
|
|
| ||||||||||
| Luke Mayhew |

|
01/07/11 | 64 | 77 | 2 | 2 | 66 | 79 | ||||||||||||||||||||||||
|
|
|
|
|
|
|
|
|
|
|
|
|
|
|
|
|
|
|
|
|
|
|
| ||||||||||
| Jill McDonald |

|
01/06/13 | 78 | 90 | 0 | 2 | 78 | 92 | ||||||||||||||||||||||||
|
|
|
|
|
|
|
|
|
|
|
|
|
|
|
|
|
|
|
|
|
|
|
| ||||||||||
| Dale Morrison |

|
01/06/11 | 95 | 110 | 2 | 11 | 97 | 121 | ||||||||||||||||||||||||
|
|
|
|
|
|
|
|
|
|
|
|
|
|
|
|
|
|
|
|
|
|
|
| ||||||||||
| Malina Ngai |

|
01/03/17 | 25 | 77 | 0 | 8 | 25 | 85 | ||||||||||||||||||||||||
|
|
|
|
|
|
|
|
|
|
|
|
|
|
|
|
|
|
|
|
|
|
|
| ||||||||||
| Sharon Rothstein |

|
01/06/20 | 38 | – | 0 | – | 38 | – | ||||||||||||||||||||||||
|
|
|
|
|
|
|
|
|
|
|
|
|
|
|
|
|
|
|
|
|
|
|
| ||||||||||
 See page 75 for Board and Committee membership key and attendance.
 |
| |||||||||||||||||||||||||||||||
Fees: Fees are paid in line with the DR Policy. As explained on page 100, Non-Executive Directors’ fees were reduced by 30% from 1 April 2020 to 30 September 2020. Malina Ngai stepped down from the Board on 07 May 2020 and Luke Mayhew stepped down on 18 December 2020 so all fees and taxable benefits for these Directors ceased on those dates.
Benefits: For Non-Executive Directors, benefits include taxable travel and accommodation expenses to attend Board meetings away from the designated home location. Under concessionary HM Revenue and Custom rules, non-UK based Non-Executive Directors are not subject to tax on travel expenses for the first five years; this is reflected in the taxable benefits for Anne Busquet, Dale Morrison, Malina Ngai and Sharon Rothstein. Due to global restrictions on travel during 2020 as a result of the Covid-19 pandemic, only the February Board meeting was held in person so taxable travel and accommodation expenses are lower this year.
Other: Non-Executive Directors are not eligible for any incentive awards or for any pension contributions or benefit.
Shares held by Non-Executive Directors as at 31 December 2020:
The Non-Executive Directors who held shares are listed in the table below:
| Non-Executive Director | 2020 | 2019b | ||||||
|
|
|
|
|
|
|
| ||
| Patrick Cescau | 11,135 | 3,605 | ||||||
|
|
|
|
|
|
|
| ||
| Ian Dyson | 1,500 | – | ||||||
|
|
|
|
|
|
|
| ||
| Arthur de Haast | 1,000 | – | ||||||
|
|
|
|
|
|
|
| ||
| Jo Harlowa | 950 | 950 | ||||||
|
|
|
|
|
|
|
| ||
| Dale Morrisona | 2,960 | 2,960 | ||||||
|
|
|
|
|
|
|
| ||
| a | Shares held in the form of American Depositary Receipts. |
| b | 2019 shares were subject to a share consolidation on 14 January 2019 on the basis of 19 new ordinary shares for every 20 existing ordinary shares. |
Fees: Non-Executive Directors
The fees for Non-Executive Directors are reviewed and agreed annually in line with the DR Policy. The Chair and Non-Executive Directors have waived any increase for 2021 and fee levels for 2021 will therefore remain as follows:
| Non-Executive Director | Role |
2021 £000 |
2020 £000 |
|||||||
|
|
|
|
|
|
|
|||||
| Patrick Cescau | Chair of the Board | 444 | 444 | |||||||
|
|
|
|
|
|
|
|||||
| Graham Allan | Non-Executive Director | 78 | 78 | |||||||
|
|
|
|
|
|
|
|||||
| Anne Busquet | Non-Executive Director | 78 | 78 | |||||||
|
|
|
|
|
|
|
|||||
| Arthur de Haast | Non-Executive Director | 78 | 78 | |||||||
|
|
|
|
|
|
|
|||||
| Ian Dyson | Chair of Audit Committee | 104 | 104 | |||||||
|
|
|
|
|
|
|
|||||
| Duriya Farooqui | Non-Executive Director | 78 | 78 | |||||||
|
|
|
|
|
|
|
|||||
| Jo Harlow | Chair of Remuneration Committee | 104 | 104 | |||||||
|
|
|
|
|
|
|
|||||
| Jill McDonald | Chair of Responsible Business Committee | 92 | 92 | |||||||
|
|
|
|
|
|
|
|||||
| Dale Morrison | Senior Independent Non-Executive Director | 112 | 112 | |||||||
|
|
|
|
|
|
|
|||||
| Sharon Rothstein | Non-Executive Director | 78 | 78 | |||||||
|
|
|
|
|
|
|
|||||
| 110 | IHG | Annual Report and Form 20-F 2020 |
| Directors’ Remuneration Report | IHG | Annual Report and Form 20-F 2020 | 111 |
Statements
| 114 | Statement of Directors’ Responsibilities | |
| 122 | Independent Auditor’s US Report | |
| 126 | Group Financial Statements | |
| 126 | Group income statement | |
| 127 | Group statement of comprehensive income | |
| 128 | Group statement of changes in equity | |
| 131 | Group statement of financial position | |
| 132 | Group statement of cash flows | |
| 133 | Accounting policies | |
| 146 | Notes to the Group Financial Statements | |
| voco Hangzhou Binjiang Minghao, China | ||
| 112 | IHG | Annual Report and Form 20-F 2020 |
| Group Financial Statements | IHG | Annual Report and Form 20-F 2020 | 113 |
| IHG | Annual Report and Form 20-F 2020 | 115 |
[THIS PAGE IS INTENTIONALLY LEFT BLANK]
| 116 | IHG | Annual Report and Form 20-F 2020 |
| IHG | Annual Report and Form 20-F 2020 | 117 |
[THIS PAGE IS INTENTIONALLY LEFT BLANK]
| 118 | IHG | Annual Report and Form 20-F 2020 |
| IHG | Annual Report and Form 20-F 2020 | 119 |
[THIS PAGE IS INTENTIONALLY LEFT BLANK]
| 120 | IHG | Annual Report and Form 20-F 2020 |
| IHG | Annual Report and Form 20-F 2020 | 121 |
| Independent Auditor’s US Report | IHG | Annual Report and Form 20-F 2020 | 123 |
Group Financial Statements
Independent Auditor’s US Report continued
| Critical Audit Matter |
Description of the Matter |
How We Addressed the Matter in Our Audit | ||
| Impairment of non-current assets | At 31 December 2020, the carrying value of non-current assets totalled $2,796 million. For the year ended 31 December 2020, the Group recognised impairment charges in respect of non-current assets totalling $274 million. An additional $41 million of impairment was charged to the System Fund.
As more fully described in the critical accounting policies and the use of judgements, estimates and assumptions, and notes to the Group Financial Statements, the impact of Covid-19 on the Group’s results and forecasts has been considered a trigger for impairment testing of non-current assets. The Group tests non-current assets for impairment using valuation techniques involving judgements, estimates and assumptions. The key assumptions used in management’s impairment assessments are cash flow forecasts, mainly driven by RevPAR growth projections, discount rates and judgments made in respect of uncertain contractual positions.
Auditing the impairment assessments performed by management was challenging due to the judgement involved in determining the significant assumptions, in particular the RevPAR growth projections. The risk has increased during the year due to the greater estimation uncertainty related to Covid-19 disruptions, for example, potential further domestic and international travel restrictions, or future economic and market conditions. |
We obtained an understanding, evaluated the design and tested the operating effectiveness of controls related to management’s assessments of impairment. For example, we tested controls over management’s preparation and review of cash flow forecasts, including over the determination of the RevPAR growth projections and approval of impairment assessments.
To test management’s impairment assessments, our audit procedures included, amongst others, evaluating the appropriateness of the methodology and assumptions used in the cash flow forecasts. Specifically, we analysed management’s historic RevPAR forecasting accuracy and evaluated the reasonableness of the RevPAR growth projections by comparison to external industry data and, where necessary, involving valuation specialists as part of our team to determine an independent estimate of an acceptable range.
We evaluated the reasonableness of cash flow forecasts made in respect of uncertain contractual positions by making enquiries of management, including those outside of a financial reporting and oversight role, and reviewing underlying contractual agreements to identify corroborating or contradictory evidence to the judgment made.
We tested the clerical accuracy of the impairment models used by management and assessed the level at which goodwill and other indefinite lived assets were tested. We considered the professional qualifications and objectivity of management’s external valuation specialists and inspected their reports to identify corroborating or contradictory evidence to the estimate of the recoverable amount.
We evaluated the disclosures provided in the accounting policies and the notes to the Group Financial Statements. | ||
|
|
|
|
/s/ Ernst & Young LLP
We have served as auditors since the Group’s listing in April 2003 and of the Group’s predecessor businesses since 1988.
London, England
22 February 2021
| 124 | IHG | Annual Report and Form 20-F 2020 |
| Independent Auditor’s US Report | IHG | Annual Report and Form 20-F 2020 | 125 |
Group Financial Statements
| For the year ended 31 December 2020 | Note |
2020 $m |
2019a $m |
2018a $m |
||||||||||||||||||||||||||||
| Revenue from fee business | 3 | 823 | 1,510 | 1,486 | ||||||||||||||||||||||||||||
| Revenue from owned, leased and managed lease hotels | 3 | 169 | 573 | 447 | ||||||||||||||||||||||||||||
| System Fund revenues | 765 | 1,373 | 1,233 | |||||||||||||||||||||||||||||
| Reimbursement of costs | 637 | 1,171 | 1,171 | |||||||||||||||||||||||||||||
| Total revenue | 2 | 2,394 | 4,627 | 4,337 | ||||||||||||||||||||||||||||
| Cost of sales | (354 | ) | (782 | ) | (671 | ) | ||||||||||||||||||||||||||
| System Fund expenses | (867 | ) | (1,422 | ) | (1,379 | ) | ||||||||||||||||||||||||||
| Reimbursed costs | (637 | ) | (1,171 | ) | (1,171 | ) | ||||||||||||||||||||||||||
| Administrative expenses | (267 | ) | (385 | ) | (415 | ) | ||||||||||||||||||||||||||
| Share of losses of associates and joint ventures | 2 | (14 | ) | (3 | ) | (1 | ) | |||||||||||||||||||||||||
| Other operating income | 16 | 21 | 14 | |||||||||||||||||||||||||||||
| Depreciation and amortisation | 2 | (110 | ) | (116 | ) | (115 | ) | |||||||||||||||||||||||||
| Impairment loss on financial assets | (88 | ) | (8 | ) | (17 | ) | ||||||||||||||||||||||||||
| Other impairment charges | 6 | (226 | ) | (131 | ) | – | ||||||||||||||||||||||||||
| Operating (loss)/profit | 2 | (153 | ) | 630 | 582 | |||||||||||||||||||||||||||
| Operating (loss)/profit analysed as: | ||||||||||||||||||||||||||||||||
| Operating profit before System Fund and exceptional items | 219 | 865 | 832 | |||||||||||||||||||||||||||||
| System Fund | (102 | ) | (49 | ) | (146 | ) | ||||||||||||||||||||||||||
| Operating exceptional items | 6 | (270 | ) | (186 | ) | (104 | ) | |||||||||||||||||||||||||
| (153 | ) | 630 | 582 | |||||||||||||||||||||||||||||
| Financial income | 7 | 4 | 6 | 5 | ||||||||||||||||||||||||||||
| Financial expenses | 7 | (144 | ) | (121 | ) | (101 | ) | |||||||||||||||||||||||||
| Fair value gains/(losses) on contingent purchase consideration | 25 | 13 | 27 | (4 | ) | |||||||||||||||||||||||||||
| (Loss)/profit before tax | (280 | ) | 542 | 482 | ||||||||||||||||||||||||||||
| Tax | 8 | 20 | (156 | ) | (132 | ) | ||||||||||||||||||||||||||
| (Loss)/profit for the year from continuing operations | (260 | ) | 386 | 350 | ||||||||||||||||||||||||||||
| Attributable to: | ||||||||||||||||||||||||||||||||
| Equity holders of the parent |
(260 | ) | 385 | 349 | ||||||||||||||||||||||||||||
| Non-controlling interest |
– | 1 | 1 | |||||||||||||||||||||||||||||
| (260 | ) | 386 | 350 | |||||||||||||||||||||||||||||
| (Loss)/earnings per ordinary share: | 10 | |||||||||||||||||||||||||||||||
| Continuing and total operations: | ||||||||||||||||||||||||||||||||
| Basic |
(142.9 | )¢ | 210.4 | ¢ | 183.7 | ¢ | ||||||||||||||||||||||||||
| Diluted |
(142.9 | )¢ | 209.2 | ¢ | 181.8 | ¢ | ||||||||||||||||||||||||||
| a | Amended for presentational changes (see page 134). |

|
Notes on pages 133 to 199 form an integral part of these Group Financial Statements. |
| 126 | IHG | Annual Report and Form 20-F 2020 |
| Group Financial Statements | IHG | Annual Report and Form 20-F 2020 | 127 |
Group Financial Statements
Group Financial Statements continued
Group statement of changes in equity
| Equity share capital $m |
Capital redemption reserve $m |
Shares held by employee share trusts $m |
Other reserves $m |
Fair value reserve $m |
Cash flow hedging reserve $m |
Currency translation reserve $m |
Retained earnings $m |
IHG share- holders’ equity $m |
Non- controlling interest $m |
Total equity $m |
||||||||||||||||||||||||||||||||||||||||||||||||||||||||||||||||||||||||||||||
| At 1 January 2020 | 151 | 10 | (5 | ) | (2,870 | ) | 57 | (6 | ) | 381 | 809 | (1,473 | ) | 8 | (1,465 | ) | ||||||||||||||||||||||||||||||||||||||||||||||||||||||||||||||||||||||||
| Loss for the year | – | – | – | – | – | – | – | (260 | ) | (260 | ) | – | (260 | ) | ||||||||||||||||||||||||||||||||||||||||||||||||||||||||||||||||||||||||||
| Other comprehensive income | ||||||||||||||||||||||||||||||||||||||||||||||||||||||||||||||||||||||||||||||||||||||||
| Items that may be subsequently reclassified to profit or loss: | ||||||||||||||||||||||||||||||||||||||||||||||||||||||||||||||||||||||||||||||||||||||||
| Losses on cash flow hedges |
– | – | – | – | – | 3 | – | – | 3 | – | 3 | |||||||||||||||||||||||||||||||||||||||||||||||||||||||||||||||||||||||||||||
| Costs of hedging |
– | – | – | – | – | (6 | ) | – | – | (6 | ) | – | (6 | ) | ||||||||||||||||||||||||||||||||||||||||||||||||||||||||||||||||||||||||||
| Hedging gains reclassified to financial expenses |
– | – | – | – | – | (13 | ) | – | – | (13 | ) | – | (13 | ) | ||||||||||||||||||||||||||||||||||||||||||||||||||||||||||||||||||||||||||
| Exchange losses on retranslation of foreign operations |
– | – | – | – | – | (2 | ) | (83 | ) | – | (85 | ) | – | (85 | ) | |||||||||||||||||||||||||||||||||||||||||||||||||||||||||||||||||||||||||
| – | – | – | – | – | (18 | ) | (83 | ) | – | (101 | ) | – | (101 | ) | ||||||||||||||||||||||||||||||||||||||||||||||||||||||||||||||||||||||||||
| Items that will not be reclassified to profit or loss: | ||||||||||||||||||||||||||||||||||||||||||||||||||||||||||||||||||||||||||||||||||||||||
| Losses on equity instruments classified as fair value through other comprehensive income |
– | – | – | – | (43 | ) | – | – | – | (43 | ) | – | (43 | ) | ||||||||||||||||||||||||||||||||||||||||||||||||||||||||||||||||||||||||||
| Gains on equity instruments transferred to retained earnings on disposal |
– | – | – | – | (3 | ) | – | – | 3 | – | – | – | ||||||||||||||||||||||||||||||||||||||||||||||||||||||||||||||||||||||||||||
| Re-measurement losses on defined benefit plans |
– | – | – | – | – | – | – | (7 | ) | (7 | ) | – | (7 | ) | ||||||||||||||||||||||||||||||||||||||||||||||||||||||||||||||||||||||||||
| Tax related to pension contributions |
– | – | – | – | – | – | – | 1 | 1 | – | 1 | |||||||||||||||||||||||||||||||||||||||||||||||||||||||||||||||||||||||||||||
| – | – | – | – | (46 | ) | – | – | (3 | ) | (49 | ) | – | (49 | ) | ||||||||||||||||||||||||||||||||||||||||||||||||||||||||||||||||||||||||||
| Total other comprehensive loss for the year | – | – | – | – | (46 | ) | (18 | ) | (83 | ) | (3 | ) | (150 | ) | – | (150 | ) | |||||||||||||||||||||||||||||||||||||||||||||||||||||||||||||||||||||||
| Total comprehensive loss for the year | – | – | – | – | (46 | ) | (18 | ) | (83 | ) | (263 | ) | (410 | ) | – | (410 | ) | |||||||||||||||||||||||||||||||||||||||||||||||||||||||||||||||||||||||
| Transfer of treasury shares to employee share trusts | – | – | (14 | ) | – | – | – | – | 14 | – | – | – | ||||||||||||||||||||||||||||||||||||||||||||||||||||||||||||||||||||||||||||
| Release of own shares by employee share trusts | – | – | 18 | – | – | – | – | (18 | ) | – | – | – | ||||||||||||||||||||||||||||||||||||||||||||||||||||||||||||||||||||||||||||
| Equity-settled share-based cost, net of $3m reclassification to cash-settled awards | – | – | – | – | – | – | – | 27 | 27 | – | 27 | |||||||||||||||||||||||||||||||||||||||||||||||||||||||||||||||||||||||||||||
| Tax related to share schemes | – | – | – | – | – | – | – | (1 | ) | (1 | ) | – | (1 | ) | ||||||||||||||||||||||||||||||||||||||||||||||||||||||||||||||||||||||||||
| Exchange adjustments | 5 | – | – | (5 | ) | – | – | – | – | – | – | – | ||||||||||||||||||||||||||||||||||||||||||||||||||||||||||||||||||||||||||||
| At 31 December 2020 | 156 | 10 | (1 | ) | (2,875 | ) | 11 | (24 | ) | 298 | 568 | (1,857 | ) | 8 | (1,849 | ) | ||||||||||||||||||||||||||||||||||||||||||||||||||||||||||||||||||||||||
All items within total comprehensive loss are shown net of tax.
|
|
Notes on pages 133 to 199 form an integral part of these Group Financial Statements. |
| 128 | IHG | Annual Report and Form 20-F 2020 |
| Group Financial Statements | IHG | Annual Report and Form 20-F 2020 | 129 |
Group Financial Statements
Group Financial Statements continued
Group statement of changes in equity continued
| Equity share capital $m |
Capital redemption reserve $m |
Shares held by employee share trusts $m |
Other reserves $m |
Fair value reserve $m |
Cash flow hedging reserve $m |
Currency translation reserve $m |
Retained earnings $m |
IHG share- holders’ equity $m |
Non- controlling interest $m |
Total equity $m |
||||||||||||||||||||||||||||||||||||||||||||||||||||||||||||||||||||||||||||||
| At 1 January 2018 | 154 | 10 | (5 | ) | (2,874 | ) | 79 | – | 377 | 898 | (1,361 | ) | 7 | (1,354 | ) | |||||||||||||||||||||||||||||||||||||||||||||||||||||||||||||||||||||||||
| Impact of adopting IFRS 9a | – | – | – | – | (18 | ) | – | – | 18 | – | – | – | ||||||||||||||||||||||||||||||||||||||||||||||||||||||||||||||||||||||||||||
| At 1 January 2018 | 154 | 10 | (5 | ) | (2,874 | ) | 61 | – | 377 | 916 | (1,361 | ) | 7 | (1,354 | ) | |||||||||||||||||||||||||||||||||||||||||||||||||||||||||||||||||||||||||
| Profit for the year | – | – | – | – | – | – | – | 349 | 349 | 1 | 350 | |||||||||||||||||||||||||||||||||||||||||||||||||||||||||||||||||||||||||||||
| Other comprehensive income | ||||||||||||||||||||||||||||||||||||||||||||||||||||||||||||||||||||||||||||||||||||||||
| Items that may be subsequently reclassified to profit or loss: | ||||||||||||||||||||||||||||||||||||||||||||||||||||||||||||||||||||||||||||||||||||||||
| Gains on cash flow hedges |
– | – | – | – | – | 5 | – | – | 5 | – | 5 | |||||||||||||||||||||||||||||||||||||||||||||||||||||||||||||||||||||||||||||
| Costs of hedging |
– | – | – | – | – | (1 | ) | – | – | (1 | ) | – | (1 | ) | ||||||||||||||||||||||||||||||||||||||||||||||||||||||||||||||||||||||||||
| Hedging gains reclassified to financial expenses |
– | – | – | – | – | (8 | ) | – | – | (8 | ) | – | (8 | ) | ||||||||||||||||||||||||||||||||||||||||||||||||||||||||||||||||||||||||||
| Exchange gains on retranslation of foreign operations |
– | – | – | – | – | – | 43 | – | 43 | 1 | 44 | |||||||||||||||||||||||||||||||||||||||||||||||||||||||||||||||||||||||||||||
| – | – | – | – | – | (4 | ) | 43 | – | 39 | 1 | 40 | |||||||||||||||||||||||||||||||||||||||||||||||||||||||||||||||||||||||||||||
| Items that will not be reclassified to profit or loss: | ||||||||||||||||||||||||||||||||||||||||||||||||||||||||||||||||||||||||||||||||||||||||
| Losses on equity instruments classified as fair value through other comprehensive income |
– | – | – | – | (14 | ) | – | – | – | (14 | ) | – | (14 | ) | ||||||||||||||||||||||||||||||||||||||||||||||||||||||||||||||||||||||||||
| Re-measurement gains on defined benefit plans |
– | – | – | – | – | – | – | 8 | 8 | – | 8 | |||||||||||||||||||||||||||||||||||||||||||||||||||||||||||||||||||||||||||||
| – | – | – | – | (14 | ) | – | – | 8 | (6 | ) | – | (6 | ) | |||||||||||||||||||||||||||||||||||||||||||||||||||||||||||||||||||||||||||
| Total other comprehensive | ||||||||||||||||||||||||||||||||||||||||||||||||||||||||||||||||||||||||||||||||||||||||
| (loss)/income for the year | – | – | – | – | (14 | ) | (4 | ) | 43 | 8 | 33 | 1 | 34 | |||||||||||||||||||||||||||||||||||||||||||||||||||||||||||||||||||||||||||
| Total comprehensive income for the year | – | – | – | – | (14 | ) | (4 | ) | 43 | 357 | 382 | 2 | 384 | |||||||||||||||||||||||||||||||||||||||||||||||||||||||||||||||||||||||||||
| Transfer of treasury shares to employee share trusts | – | – | (19 | ) | – | – | – | – | 19 | – | – | – | ||||||||||||||||||||||||||||||||||||||||||||||||||||||||||||||||||||||||||||
| Purchase of own shares by employee share trusts | – | – | (3 | ) | – | – | – | – | – | (3 | ) | – | (3 | ) | ||||||||||||||||||||||||||||||||||||||||||||||||||||||||||||||||||||||||||
| Release of own shares by employee share trusts | – | – | 24 | – | – | – | – | (24 | ) | – | – | – | ||||||||||||||||||||||||||||||||||||||||||||||||||||||||||||||||||||||||||||
| Equity-settled share-based cost | – | – | – | – | – | – | – | 39 | 39 | – | 39 | |||||||||||||||||||||||||||||||||||||||||||||||||||||||||||||||||||||||||||||
| Tax related to share schemes | – | – | – | – | – | – | – | 3 | 3 | – | 3 | |||||||||||||||||||||||||||||||||||||||||||||||||||||||||||||||||||||||||||||
| Equity dividends paid | – | – | – | – | – | – | – | (199 | ) | (199 | ) | (1 | ) | (200 | ) | |||||||||||||||||||||||||||||||||||||||||||||||||||||||||||||||||||||||||
| Exchange adjustments | (8 | ) | – | (1 | ) | 9 | – | – | – | – | – | – | – | |||||||||||||||||||||||||||||||||||||||||||||||||||||||||||||||||||||||||||
| At 31 December 2018 | 146 | 10 | (4 | ) | (2,865 | ) | 47 | (4 | ) | 420 | 1,111 | (1,139 | ) | 8 | (1,131 | ) | ||||||||||||||||||||||||||||||||||||||||||||||||||||||||||||||||||||||||
| a | IFRS 9 was applied from 1 January 2018. Under the transition method chosen, comparative information was not restated. |
All items within total comprehensive income are shown net of tax.
|
|
Notes on pages 133 to 199 form an integral part of these Group Financial Statements. |
| 130 | IHG | Annual Report and Form 20-F 2020 |
| Group Financial Statements | IHG | Annual Report and Form 20-F 2020 | 131 |
Group Financial Statements
Group Financial Statements continued
| For the year ended 31 December 2020 | Note |
2020 $m |
2019 $m |
2018 $m |
||||||||||||||||||||||||||||
| (Loss)/profit for the year | (260 | ) | 386 | 350 | ||||||||||||||||||||||||||||
| Adjustments reconciling (loss)/profit for the year to cash flow from operations before contract acquisition costs | 26 | 632 | 582 | 564 | ||||||||||||||||||||||||||||
| Cash flow from operations before contract acquisition costs | 26 | 372 | 968 | 914 | ||||||||||||||||||||||||||||
| Contract acquisition costs, net of repayments | (64 | ) | (61 | ) | (54 | ) | ||||||||||||||||||||||||||
| Cash flow from operations | 308 | 907 | 860 | |||||||||||||||||||||||||||||
| Interest paid | (132 | ) | (110 | ) | (87 | ) | ||||||||||||||||||||||||||
| Interest received | 2 | 3 | 2 | |||||||||||||||||||||||||||||
| Contingent purchase consideration paid | 25 | – | (6 | ) | – | |||||||||||||||||||||||||||
| Tax paid on operating activities | 8 | (41 | ) | (141 | ) | (66 | ) | |||||||||||||||||||||||||
| Net cash from operating activities | 137 | 653 | 709 | |||||||||||||||||||||||||||||
| Cash flow from investing activities | ||||||||||||||||||||||||||||||||
| Purchase of property, plant and equipment | (26 | ) | (75 | ) | (46 | ) | ||||||||||||||||||||||||||
| Purchase of intangible assets | (50 | ) | (104 | ) | (112 | ) | ||||||||||||||||||||||||||
| Investment in associates and joint ventures | (2 | ) | (10 | ) | (1 | ) | ||||||||||||||||||||||||||
| Investment in other financial assets | (5 | ) | (9 | ) | (33 | ) | ||||||||||||||||||||||||||
| Acquisition of businesses, net of cash acquired | 11 | – | (292 | ) | (34 | ) | ||||||||||||||||||||||||||
| Contingent purchase consideration paid | 25 | – | (2 | ) | (4 | ) | ||||||||||||||||||||||||||
| Capitalised interest paid | 7 | (1 | ) | (5 | ) | (5 | ) | |||||||||||||||||||||||||
| Distributions from associates and joint ventures | 5 | – | 32 | |||||||||||||||||||||||||||||
| Disposal of hotel assets, net of costs and cash disposed | 1 | – | – | |||||||||||||||||||||||||||||
| Repayments of other financial assets | 13 | 4 | 8 | |||||||||||||||||||||||||||||
| Disposal of equity securities | 4 | – | – | |||||||||||||||||||||||||||||
| Tax paid on disposals | 8 | – | – | (2 | ) | |||||||||||||||||||||||||||
| Net cash from investing activities | (61 | ) | (493 | ) | (197 | ) | ||||||||||||||||||||||||||
| Cash flow from financing activities | ||||||||||||||||||||||||||||||||
| Purchase of own shares by employee share trusts | – | (5 | ) | (3 | ) | |||||||||||||||||||||||||||
| Dividends paid to shareholders | 9 | – | (721 | ) | (199 | ) | ||||||||||||||||||||||||||
| Dividend paid to non-controlling interest | – | (1 | ) | (1 | ) | |||||||||||||||||||||||||||
| Transaction costs relating to shareholder returns | – | (1 | ) | – | ||||||||||||||||||||||||||||
| Issue of long-term bonds, including effect of currency swaps | 23 | 1,093 | – | 554 | ||||||||||||||||||||||||||||
| Issue of commercial paper | 23 | 738 | – | – | ||||||||||||||||||||||||||||
| Repayment of long-term bonds | 23 | (290 | ) | – | – | |||||||||||||||||||||||||||
| Principal element of lease payments | 23 | (65 | ) | (59 | ) | (35 | ) | |||||||||||||||||||||||||
| (Decrease)/increase in other borrowings | 23 | (125 | ) | 127 | (268 | ) | ||||||||||||||||||||||||||
| Proceeds from currency swaps | 23 | 3 | – | 3 | ||||||||||||||||||||||||||||
| Net cash from financing activities | 1,354 | (660 | ) | 51 | ||||||||||||||||||||||||||||
| Net movement in cash and cash equivalents in the year | 1,430 | (500 | ) | 563 | ||||||||||||||||||||||||||||
| Cash and cash equivalents at beginning of the year | 19 | 108 | 600 | 58 | ||||||||||||||||||||||||||||
| Exchange rate effects | 86 | 8 | (21 | ) | ||||||||||||||||||||||||||||
| Cash and cash equivalents at end of the year | 19 | 1,624 | 108 | 600 | ||||||||||||||||||||||||||||
Notes on pages 133 to 199 form an integral part of these Group Financial Statements.
| 132 | IHG | Annual Report and Form 20-F 2020 |
| Accounting policies | IHG | Annual Report and Form 20-F 2020 | 133 |
Group Financial Statements
Accounting policies continued
| 134 | IHG | Annual Report and Form 20-F 2020 |
| Accounting policies | IHG | Annual Report and Form 20-F 2020 | 135 |
Group Financial Statements
Accounting policies continued
| 136 | IHG | Annual Report and Form 20-F 2020 |
| Accounting policies | IHG | Annual Report and Form 20-F 2020 | 137 |
Group Financial Statements
Accounting policies continued
| 138 | IHG | Annual Report and Form 20-F 2020 |
| Accounting policies | IHG | Annual Report and Form 20-F 2020 | 139 |
Group Financial Statements
Accounting policies continued
| 140 | IHG | Annual Report and Form 20-F 2020 |
| Accounting policies | IHG | Annual Report and Form 20-F 2020 | 141 |
Group Financial Statements
Accounting policies continued
| 142 | IHG | Annual Report and Form 20-F 2020 |
| Accounting policies | IHG | Annual Report and Form 20-F 2020 | 143 |
Group Financial Statements
Accounting policies continued
| 144 | IHG | Annual Report and Form 20-F 2020 |
| Accounting policies | IHG | Annual Report and Form 20-F 2020 | 145 |
Group Financial Statements
Notes to the Group Financial Statements
1. Exchange rates
The results of operations have been translated into US dollars at the average rates of exchange for the year. In the case of sterling, the translation rate is $1=£0.78 (2019: $1=£0.78, 2018: $1=£0.75). In the case of the euro, the translation rate is $1=€0.88 (2019: $1=€0.89, 2018: $1=€0.85).
Assets and liabilities have been translated into US dollars at the rates of exchange on the last day of the year. In the case of sterling, the translation rate is $1=£0.73 (2019: $1=£0.76, 2018: $1=£0.78). In the case of the euro, the translation rate is $1=€0.81 (2019: $1=€0.89, 2018: $1=€0.87).
2. Segmental information
The Group has four reportable segments reflecting its geographical regions and its Central functions:
| • | Americas; |
| • | EMEAA; |
| • | Greater China; and |
| • | Central. |
Central functions include technology, sales and marketing, finance, human resources and corporate services; Central revenue arises principally from technology fee income.
No operating segments have been aggregated to form these reportable segments.
Management monitors the operating results of these reportable segments for the purpose of making decisions about resource allocation and performance assessment. Each of the geographical regions is led by its own Chief Executive Officer who reports to the Group Chief Executive Officer.
The System Fund is not viewed as being part of the Group’s core operations as it is not managed to generate a profit or loss for IHG over the longer term. As such, its results are not regularly reviewed by the Chief Operating Decision Maker (‘CODM’) and it does not constitute an operating segment under IFRS 8. Similarly, reimbursements of costs are not reported to the CODM and so are not included within the reportable segments.
Segmental performance is evaluated based on operating profit or loss and is measured consistently with operating profit or loss in the Group Financial Statements, excluding System Fund and exceptional items. Group financing activities, fair value gains/(losses) on contingent purchase consideration and income taxes are managed on a Group basis and are not allocated to reportable segments.
Revenue
| 2020 | 2019 | 2018 | ||||||||||||||||||||||
| Year ended 31 December | $m | $m | $m | |||||||||||||||||||||
| Americas | 512 | 1,040 | 1,051 | |||||||||||||||||||||
| EMEAA | 221 | 723 | 569 | |||||||||||||||||||||
| Greater China | 77 | 135 | 143 | |||||||||||||||||||||
| Central | 182 | 185 | 170 | |||||||||||||||||||||
| Revenue from reportable segments | 992 | 2,083 | 1,933 | |||||||||||||||||||||
| System Fund revenues | 765 | 1,373 | 1,233 | |||||||||||||||||||||
| Reimbursement of costs | 637 | 1,171 | 1,171 | |||||||||||||||||||||
| Total revenue | 2,394 | 4,627 | 4,337 | |||||||||||||||||||||
| 146 | IHG | Annual Report and Form 20-F 2020 |
| Notes to the Group Financial Statements | IHG | Annual Report and Form 20-F 2020 | 147 |
Group Financial Statements
Notes to the Group Financial Statements continued
2. Segmental information continued
Capital expenditure
| Year ended 31 December 2020 | Americas $m |
EMEAA $m |
Greater China $m |
Central $m |
Group $m |
|||||||||||||||||||||||||||||||||||
| Capital expenditure per management reporting | 46 | 44 | 2 | 56 | 148 | |||||||||||||||||||||||||||||||||||
| Contract acquisition costs | (33 | ) | (29 | ) | (2 | ) | – | (64 | ) | |||||||||||||||||||||||||||||||
| Timing differences and other adjustments | 17 | 4 | – | (1 | ) | 20 | ||||||||||||||||||||||||||||||||||
| Additions per the Group Financial Statements | 30 | 19 | – | 55 | 104 | |||||||||||||||||||||||||||||||||||
| Comprising additions to: | ||||||||||||||||||||||||||||||||||||||||
| Goodwill and other intangible assets |
1 | 1 | – | 50 | 52 | |||||||||||||||||||||||||||||||||||
| Property, plant and equipment |
12 | 13 | – | 5 | 30 | |||||||||||||||||||||||||||||||||||
| Investment in associates and joint ventures |
17 | – | – | – | 17 | |||||||||||||||||||||||||||||||||||
| Other financial assets |
– | 5 | – | – | 5 | |||||||||||||||||||||||||||||||||||
| 30 | 19 | – | 55 | 104 | ||||||||||||||||||||||||||||||||||||
| Year ended 31 December 2019 | Americas $m |
EMEAA $m |
Greater China $m |
Central $m |
Group $m |
|||||||||||||||||||||||||||||||||||
| Capital expenditure per management reporting | 57 | 71 | – | 137 | 265 | |||||||||||||||||||||||||||||||||||
| Goodwill | – | 4 | – | – | 4 | |||||||||||||||||||||||||||||||||||
| Contract acquisition costs | (27 | ) | (35 | ) | – | – | (62 | ) | ||||||||||||||||||||||||||||||||
| Timing differences and other adjustments | 4 | 1 | – | (4 | ) | 1 | ||||||||||||||||||||||||||||||||||
| Additions per the Group Financial Statements | 34 | 41 | – | 133 | 208 | |||||||||||||||||||||||||||||||||||
| Comprising additions to: | ||||||||||||||||||||||||||||||||||||||||
| Goodwill and other intangible assets |
– | 4 | – | 104 | 108 | |||||||||||||||||||||||||||||||||||
| Property, plant and equipment |
19 | 29 | – | 29 | 77 | |||||||||||||||||||||||||||||||||||
| Investment in associates and joint ventures |
14 | – | – | – | 14 | |||||||||||||||||||||||||||||||||||
| Other financial assets |
1 | 8 | – | – | 9 | |||||||||||||||||||||||||||||||||||
| 34 | 41 | – | 133 | 208 | ||||||||||||||||||||||||||||||||||||
| 148 | IHG | Annual Report and Form 20-F 2020 |
| Notes to the Group Financial Statements | IHG | Annual Report and Form 20-F 2020 | 149 |
Group Financial Statements
Notes to the Group Financial Statements continued
3. Revenue
Disaggregation of revenue
The following table presents Group revenue disaggregated by type of revenue stream and by reportable segment:
| Year ended 31 December 2020 | Americas $m |
EMEAA $m |
Greater $m |
Central $m |
Group $m |
|||||||||||||||||
| Franchise and base management fees | 452 | 93 | 61 | – | 606 | |||||||||||||||||
| Incentive management fees | 5 | 14 | 16 | – | 35 | |||||||||||||||||
| Central revenue | – | – | – | 182 | 182 | |||||||||||||||||
| Revenue from fee business | 457 | 107 | 77 | 182 | 823 | |||||||||||||||||
| Revenue from owned, leased and managed lease hotels | 55 | 114 | – | – | 169 | |||||||||||||||||
| 512 | 221 | 77 | 182 | 992 | ||||||||||||||||||
| System Fund revenues (note 33) | 765 | |||||||||||||||||||||
| Reimbursement of costs | 637 | |||||||||||||||||||||
| Total revenue | 2,394 | |||||||||||||||||||||
Following communication with the IHG Owners Association, fees and expenses associated with the InterContinental Ambassador programme (the InterContinental Hotels & Resorts paid-for loyalty programme) previously reported within Central revenue have been moved into the System Fund to align with the treatment of IHG’s other brand loyalty programmes. Revenue arising from the licence of intellectual property under co-brand credit card agreements previously recorded within the System Fund is now recorded within Central revenue (see page 139). This change is effective from 1 January 2020. For the year ended 31 December 2020, this change resulted in an increase of $20m to Central revenue and $21m to operating profit from reportable segments, and an equivalent reduction to System Fund revenues and increase to System Fund operating loss. Had this arrangement existed in the prior year, Central revenue and operating profit in 2019 would have been $18m and $22m higher respectively (2018: $15m and $20m respectively); System Fund revenues would have reduced and System Fund operating loss would have increased by the same amounts.
| Year ended 31 December 2019 | Americas $m |
EMEAA $m |
Greater $m |
Central $m |
Group $m |
|||||||||||||||||
| Franchise and base management fees | 840 | 247 | 87 | – | 1,174 | |||||||||||||||||
| Incentive management fees | 13 | 90 | 48 | – | 151 | |||||||||||||||||
| Central revenue | – | – | – | 185 | 185 | |||||||||||||||||
| Revenue from fee business | 853 | 337 | 135 | 185 | 1,510 | |||||||||||||||||
| Revenue from owned, leased and managed lease hotels | 187 | 386 | – | – | 573 | |||||||||||||||||
| 1,040 | 723 | 135 | 185 | 2,083 | ||||||||||||||||||
| System Fund revenues (note 33) | 1,373 | |||||||||||||||||||||
| Reimbursement of costs | 1,171 | |||||||||||||||||||||
| Total revenue | 4,627 | |||||||||||||||||||||
| Year ended 31 December 2018 | Americas $m |
EMEAA $m |
Greater $m |
Central $m |
Group $m |
|||||||||||||||||
| Franchise and base management fees | 835 | 227 | 94 | – | 1,156 | |||||||||||||||||
| Incentive management fees | 18 | 93 | 49 | – | 160 | |||||||||||||||||
| Central revenue | – | – | – | 170 | 170 | |||||||||||||||||
| Revenue from fee business | 853 | 320 | 143 | 170 | 1,486 | |||||||||||||||||
| Revenue from owned, leased and managed lease hotels | 198 | 249 | – | – | 447 | |||||||||||||||||
| 1,051 | 569 | 143 | 170 | 1,933 | ||||||||||||||||||
| System Fund revenues (note 33) | 1,233 | |||||||||||||||||||||
| Reimbursement of costs | 1,171 | |||||||||||||||||||||
| Total revenue | 4,337 | |||||||||||||||||||||
Contract balances
| 2020 $m |
2019 $m |
|||||||||||
| Trade receivables (note 18) | 309 | 515 | ||||||||||
| Contract assets | 336 | 334 | ||||||||||
| Deferred revenue | (1,569 | ) | (1,564 | ) | ||||||||
A trade receivable is recorded when the Group has an unconditional right to receive payment. In respect of franchise fees, base and incentive management fees, Central revenue and revenues from owned, leased and managed lease hotels, the invoice is typically issued as the related performance obligations are satisfied, as described on page 138.
| 150 | IHG | Annual Report and Form 20-F 2020 |
| Notes to the Group Financial Statements | IHG | Annual Report and Form 20-F 2020 | 151 |
Group Financial Statements
Notes to the Group Financial Statements continued
3. Revenue continued
Loyalty programme revenues, shown gross in the table on the previous page, are presented net of the corresponding redemption cost in the Group income statement.
Other deferred revenue includes technical service fees and guest deposits received by owned, leased and managed lease hotels.
Transaction price allocated to remaining performance obligations
The Group has applied the practical expedient in IFRS 15 not to disclose the aggregate amount of the transaction price allocated to the performance obligations that are unsatisfied or partially unsatisfied as at the end of the reporting period for all amounts where the Group has a right to consideration in an amount that corresponds directly with the value to the customer of the Group’s performance completed to date (including franchise and management fees).
Amounts received and not yet recognised related to performance obligations that were unsatisfied at 31 December 2020 are as follows:
| 2020 | 2019 | |||||||||||||||||||||||||||||||
| Loyalty and co-brand $m |
Other $m |
Total $m |
Loyalty and co-brand $m |
Other $m |
Total $m |
|||||||||||||||||||||||||||
| Expected timing of recognition | ||||||||||||||||||||||||||||||||
| Less than one year | 387 | 65 | 452 | 487 | 68 | 555 | ||||||||||||||||||||||||||
| Between one and two years | 313 | 40 | 353 | 292 | 34 | 326 | ||||||||||||||||||||||||||
| Between two and three years | 249 | 29 | 278 | 176 | 30 | 206 | ||||||||||||||||||||||||||
| Between three and four years | 176 | 24 | 200 | 115 | 27 | 142 | ||||||||||||||||||||||||||
| Between four and five years | 73 | 22 | 95 | 79 | 27 | 106 | ||||||||||||||||||||||||||
| More than five years | 102 | 89 | 191 | 150 | 79 | 229 | ||||||||||||||||||||||||||
| 1,300 | 269 | 1,569 | 1,299 | 265 | 1,564 | |||||||||||||||||||||||||||
Contract costs
Movements in contract costs, typically developer commissions, are as follows:
| 2020 $m |
2019 $m |
|||||||||||||
| At 1 January | 72 | 60 | ||||||||||||
| Costs incurred | 11 | 19 | ||||||||||||
| Amortisation | (9 | ) | (7 | ) | ||||||||||
| Exchange and other adjustments | 1 | – | ||||||||||||
| At 31 December | 75 | 72 | ||||||||||||
| Analysed as: | ||||||||||||||
| Current | 5 | 5 | ||||||||||||
| Non-current | 70 | 67 | ||||||||||||
| 75 | 72 | |||||||||||||
Contract costs were tested for impairment during the year. As contract costs typically constitute a very small percentage of deal value, no impairment was identified.
| 152 | IHG | Annual Report and Form 20-F 2020 |
| Notes to the Group Financial Statements | IHG | Annual Report and Form 20-F 2020 | 153 |
Group Financial Statements
Notes to the Group Financial Statements continued
6. Exceptional items
| Note | 2020 $m |
2019 $m |
2018 $m |
|||||||||||||||||||||||||||||
| Operating exceptional items: | ||||||||||||||||||||||||||||||||
| Cost of sales: | ||||||||||||||||||||||||||||||||
| Derecognition of right-of-use assets and lease liabilities |
(a)(h) | 22 | – | – | ||||||||||||||||||||||||||||
| Gain on lease termination |
(b) | 30 | – | – | ||||||||||||||||||||||||||||
| Provision for onerous contractual expenditure |
(h) | (10 | ) | – | – | |||||||||||||||||||||||||||
| Reorganisation costs |
(c)(h) | (8 | ) | – | – | |||||||||||||||||||||||||||
| 34 | – | – | ||||||||||||||||||||||||||||||
| Administrative expenses: | ||||||||||||||||||||||||||||||||
| Reorganisation costs |
(c) | (19 | ) | (20 | ) | (56 | ) | |||||||||||||||||||||||||
| Acquisition and integration costs |
(d) | (6 | ) | (7 | ) | (15 | ) | |||||||||||||||||||||||||
| Litigation |
(e) | (5 | ) | (28 | ) | (18 | ) | |||||||||||||||||||||||||
| Pension settlement cost |
27 | – | – | (15 | ) | |||||||||||||||||||||||||||
| (30 | ) | (55 | ) | (104 | ) | |||||||||||||||||||||||||||
| Impairment loss on financial assets | (f) | (48 | ) | – | – | |||||||||||||||||||||||||||
| Other impairment charges: | ||||||||||||||||||||||||||||||||
| Goodwill |
(h) | – | (49 | ) | – | |||||||||||||||||||||||||||
| Management agreements |
13 | (48 | ) | (50 | ) | – | ||||||||||||||||||||||||||
| Property, plant and equipment |
14, (h) | (90 | ) | – | – | |||||||||||||||||||||||||||
|
Right-of-use assets |
15, (h) | (16 | ) | (32 | ) | – | ||||||||||||||||||||||||||
| Associates |
16 | (19 | ) | – | – | |||||||||||||||||||||||||||
| Contract assets |
3 | (53 | ) | – | – | |||||||||||||||||||||||||||
| (226 | ) | (131 | ) | – | ||||||||||||||||||||||||||||
| Operating exceptional items | (270 | ) | (186 | ) | (104 | ) | ||||||||||||||||||||||||||
| Financial expenses | (g) | (14 | ) | – | – | |||||||||||||||||||||||||||
| Fair value gains on contingent purchase consideration | (h) | 21 | 38 | – | ||||||||||||||||||||||||||||
| Exceptional items before tax | (263 | ) | (148 | ) | (104 | ) | ||||||||||||||||||||||||||
| Tax on exceptional items | (i) | 52 | 20 | 22 | ||||||||||||||||||||||||||||
| Exceptional tax | (j) | – | – | 5 | ||||||||||||||||||||||||||||
| Tax | 52 | 20 | 27 | |||||||||||||||||||||||||||||
| Operating exceptional items analysed as: | ||||||||||||||||||||||||||||||||
| Americas |
(118 | ) | (62 | ) | (36 | ) | ||||||||||||||||||||||||||
| EMEAA |
(128 | ) | (109 | ) | (12 | ) | ||||||||||||||||||||||||||
| Greater China |
(5 | ) | – | (1 | ) | |||||||||||||||||||||||||||
| Central |
(19 | ) | (15 | ) | (55 | ) | ||||||||||||||||||||||||||
| (270 | ) | (186 | ) | (104 | ) | |||||||||||||||||||||||||||
The above items are treated as exceptional by reason of their size, nature, or incidence, as further described on page 140.
All items above relate to continuing operations.
| 154 | IHG | Annual Report and Form 20-F 2020 |
| Notes to the Group Financial Statements | IHG | Annual Report and Form 20-F 2020 | 155 |
Group Financial Statements
Notes to the Group Financial Statements continued
6. Exceptional items continued
(h) Exceptional items relating to the UK portfolio continued
The UK portfolio has continued to experience hugely challenging trading conditions as a result of Covid-19, with all 12 hotels closing for business in March 2020. The impact of Covid-19 and subsequent restrictions on travel caused the UK leased hotels to be closed for extended periods during 2020. Hotels which were able to open temporarily during the year experienced historically low occupancies. 11 of the hotels were closed as at 31 December 2020 and all hotels were closed during January 2021.
As described on page 155, the right-of-use asset ($22m) and lease liability ($40m) relating to the UK portfolio have been derecognised as a result of the re-estimation of the ‘in-substance fixed’ rent payable under the leases, resulting in a gain of $18m. The leases are now considered to be fully variable.
Under the terms of the leases, the Group is committed to certain items of contractual expenditure. A $10m provision was recognised to the extent the costs of the remaining contractual expenditure exceeded the future economic benefits expected to be received under the leases.
The hotels have incurred a total cost of $4m to restructure hotel operations in response to the future impact of Covid-19 on hotel occupancy and revenues. The reorganisation was completed in 2020.
Impairment testing was performed on the remaining property, plant and equipment in the portfolio using management forecasts covering a five-year period. The testing performed and key assumptions are detailed on page 135. In 2019, goodwill ($49m) and the right-of-use asset ($32m) (prior to derecognition) were impaired as a result of trading disruption arising from hotel renovations and rebranding.
Contingent purchase consideration comprises the present value of the above-market element of the expected lease payments to the lessor. The above-market assessment is determined by comparing the expected lease payments as a percentage of forecast hotel operating profit (before depreciation and rent) with market metrics, on a hotel by hotel basis. A fair value gain of $21m was recognised in the period (2019: $38m), arising from a reduction in expected future rentals payable such that there is no remaining above-market element. The key assumptions are detailed on page 135.
As a result of the adjustments outlined above, non-current assets, lease liabilities and contingent consideration relating to the UK portfolio were all measured at $nil at 31 December 2020.
(i) Tax on exceptional items
The tax impacts of the exceptional items are shown in the table below:
| 2020 | 2019 | 2018 | ||||||||||||||||||||||||||||||||||
| Current tax $m |
Deferred tax $m |
Current tax $m |
Deferred tax $m |
Current tax $m |
Deferred tax $m |
|||||||||||||||||||||||||||||||
| Derecognition of right-of-use assets and lease liabilities | – | (4 | ) | – | – | – | – | |||||||||||||||||||||||||||||
| Provision for onerous contractual expenditure | – | 2 | – | – | – | – | ||||||||||||||||||||||||||||||
| Reorganisation costs | 3 | 2 | 4 | – | 11 | – | ||||||||||||||||||||||||||||||
| Acquisition and integration costs | 1 | – | – | – | 2 | – | ||||||||||||||||||||||||||||||
| Litigation | – | – | – | 6 | 5 | – | ||||||||||||||||||||||||||||||
| Pension settlement cost | – | – | – | – | 5 | 1 | ||||||||||||||||||||||||||||||
| Impairment of financial assets | 4 | 2 | – | – | – | – | ||||||||||||||||||||||||||||||
| Other impairment charges | 6 | 37 | – | 18 | – | – | ||||||||||||||||||||||||||||||
| Financial expenses | – | 3 | – | – | – | – | ||||||||||||||||||||||||||||||
| Fair value gains on contingent purchase consideration | – | (4 | ) | – | (6 | ) | – | – | ||||||||||||||||||||||||||||
| Adjustments in respect of prior yearsa | – | – | – | (2 | ) | (2 | ) | – | ||||||||||||||||||||||||||||
| 14 | 38 | 4 | 16 | 21 | 1 | |||||||||||||||||||||||||||||||
| Total current and deferred tax | 52 | 20 | 22 | |||||||||||||||||||||||||||||||||
| a | In 2019, related to a 2014 disposal. In 2018, related to the 2017 sale of a minority investment. |
(j) Exceptional tax
In 2018, related to a tax credit in regard to US tax reform impacts.
| 156 | IHG | Annual Report and Form 20-F 2020 |
| Notes to the Group Financial Statements | IHG | Annual Report and Form 20-F 2020 | 157 |
Group Financial Statements
Notes to the Group Financial Statements continued
8. Tax continued
| Totala | Before exceptional items and System Fundb |
|||||||||||||||||||||||||||||||||||||||||||||||
| 2020 % |
2019 % |
2018 % |
2020 % |
2019 % |
2018 % |
|||||||||||||||||||||||||||||||||||||||||||
| Reconciliation of tax charge | ||||||||||||||||||||||||||||||||||||||||||||||||
| UK corporation tax at standard rate | 19.0 | 19.0 | 19.0 | 19.0 | 19.0 | 19.0 | ||||||||||||||||||||||||||||||||||||||||||
| Tax credits | 0.5 | (0.8 | ) | (0.5 | ) | (1.7 | ) | (0.6 | ) | (0.3 | ) | |||||||||||||||||||||||||||||||||||||
| System Fundc | (6.6 | ) | 1.1 | 5.0 | (1.1 | ) | (0.5 | ) | (0.5 | ) | ||||||||||||||||||||||||||||||||||||||
| Impairment charges | – | 1.7 | – | – | – | – | ||||||||||||||||||||||||||||||||||||||||||
| Other permanent differences | (4.2 | ) | 1.3 | 0.6 | 12.1 | 0.8 | 0.3 | |||||||||||||||||||||||||||||||||||||||||
| Non-recoverable foreign taxesd | (5.1 | ) | 3.2 | 0.7 | 16.9 | 2.4 | 0.5 | |||||||||||||||||||||||||||||||||||||||||
| Net effect of different rates of tax in overseas businessese | (4.5 | ) | 6.7 | 4.6 | 18.9 | 5.5 | 3.7 | |||||||||||||||||||||||||||||||||||||||||
| Effect of changes in tax rates and tax lawsf | 2.9 | (0.4 | ) | 0.3 | (9.6 | ) | (0.3 | ) | 0.2 | |||||||||||||||||||||||||||||||||||||||
| Reduction in current tax expense by previously unrecognised deferred tax assets | 0.7 | (0.4 | ) | (0.4 | ) | (2.4 | ) | (0.3 | ) | (0.3 | ) | |||||||||||||||||||||||||||||||||||||
| Items on which deferred tax arose but where no deferred tax is recognisedg | (1.9 | ) | – | – | 5.1 | – | – | |||||||||||||||||||||||||||||||||||||||||
| Effect of adjustments to estimated recoverable deferred tax assetsh | 5.1 | (0.4 | ) | 0.1 | (16.9 | ) | (0.3 | ) | 0.1 | |||||||||||||||||||||||||||||||||||||||
| Reduction in deferred tax expense by previously unrecognised deferred tax assets | 0.3 | – | – | – | – | – | ||||||||||||||||||||||||||||||||||||||||||
| Adjustment to tax charge in respect of prior periods | 0.9 | (2.2 | ) | (2.0 | ) | (2.7 | ) | (1.9 | ) | (1.0 | ) | |||||||||||||||||||||||||||||||||||||
| 7.1 | 28.8 | 27.4 | 37.6 | 23.8 | 21.7 | |||||||||||||||||||||||||||||||||||||||||||
| a | Calculated in relation to total (losses)/profits including exceptional items and System Fund. |
| b | Calculated in relation to profits excluding exceptional items and System Fund earnings. |
| c | The System Fund is, in general, not subject to taxation. |
| d | The large increase in 2020 when compared to 2019 is as a result of the material decrease in Group profitability. This has meant that the Group has no longer been able to obtain effective relief for withholding taxes incurred on its revenues and in respect of other taxes, primarily in the US and Singapore. The increase from 2018 to 2019 was caused by the recognition in 2018 of a carryback claim in the US in respect of foreign tax credits. |
| e | Before exceptional items and System Fund includes 18.9 percentage points (2019: 4.9 percentage points, 2018: 4.2 percentage points) driven by the relatively high blended US rate, which includes US Federal and State taxes as well as Base Erosion and Anti-Avoidance Tax (‘BEAT’). In 2020, the lower profitability has resulted in a large impact of BEAT, and the trading results in the year have led to a higher proportion of the Group’s profit being taxed in the US. |
| f | In 2020, the UK Government reversed a previously enacted drop to the UK rate of corporation tax. This has led to an increase in value to the Group’s existing deferred tax assets in the UK, contributing to a benefit to the Group effective tax rate, before exceptional items and System Fund, of 7.9 percentage points. |
| g | Predominantly in respect of losses arising in the year. |
| h | During 2020, the Group simplified its Group structure leading to an increase to existing deferred tax assets within the UK. |
A reconciliation between total tax rate and tax rate before exceptional items and System Fund is shown below:
| 2020 |
2019 | 2018 | ||||||||||||||||||||||||||||||||||||||||||||||||||||||||||||||||||||||
| (Loss)/ profit before tax $m |
Tax $m |
Rate % |
Profit before tax $m |
Tax $m |
Rate % |
Profit before tax $m |
Tax $m |
Rate % |
||||||||||||||||||||||||||||||||||||||||||||||||||||||||||||||||
| Group income statement | (280 | ) | (20 | ) | 7.1 | 542 | 156 | 28.8 | 482 | 132 | 27.4 | |||||||||||||||||||||||||||||||||||||||||||||||||||||||||||||
| Adjust for: | ||||||||||||||||||||||||||||||||||||||||||||||||||||||||||||||||||||||||
| Exceptional items (note 6) | 263 | 52 | 148 | 20 | 104 | 27 | ||||||||||||||||||||||||||||||||||||||||||||||||||||||||||||||||||
| System Fund | 102 | – | 49 | – | 146 | – | ||||||||||||||||||||||||||||||||||||||||||||||||||||||||||||||||||
| 85 | 32 | 37.6 | 739 | 176 | 23.8 | 732 | 159 | 21.7 | ||||||||||||||||||||||||||||||||||||||||||||||||||||||||||||||||

|
Information concerning Non-GAAP measures can be found in the Strategic Report on pages 47 to 51. |
| 158 | IHG | Annual Report and Form 20-F 2020 |
| Notes to the Group Financial Statements | IHG | Annual Report and Form 20-F 2020 | 159 |
Group Financial Statements
Notes to the Group Financial Statements continued
8. Tax continued
Deferred tax
|
|
|
Property, plant, equipment and software $m |
|
|
Other intangible assets $m |
|
|
Application fees $m |
|
|
Deferred gains on loan notes $m |
|
|
Associates $m |
|
|
Losses $m |
|
|
Employee benefits $m |
|
|
Deferred compen- sation |
|
|
Credit losses $m |
|
|
Contract costs $m |
|
|
Other short-term temporary differences $m |
a
|
|
Total $m |
| ||||||||||||||||
| At 1 January 2019 | (120 | ) | (18 | ) | 43 | (35 | ) | (56 | ) | 35 | 30 | 42 | 1 | (14 | ) | 31 | (61 | ) | ||||||||||||||||||||||||||||||||||
| Group income statement | – | 3 | – | 1 | (2 | ) | (9 | ) | 1 | (1 | ) | 11 | (2 | ) | 1 | 3 | ||||||||||||||||||||||||||||||||||||
| Assets of businesses acquired | – | – | – | – | – | – | – | – | – | – | 2 | 2 | ||||||||||||||||||||||||||||||||||||||||
| Group statement of comprehensive income | – | – | – | – | – | – | 1 | – | – | – | (1 | ) | – | |||||||||||||||||||||||||||||||||||||||
| Exchange and other adjustments | 1 | 1 | – | – | – | 1 | 1 | – | – | – | – | 4 | ||||||||||||||||||||||||||||||||||||||||
| At 31 December 2019 | (119 | ) | (14 | ) | 43 | (34 | ) | (58 | ) | 27 | 33 | 41 | 12 | (16 | ) | 33 | (52 | ) | ||||||||||||||||||||||||||||||||||
| Group income statement | 23 | 14 | (2 | ) | – | – | 28 | – | 1 | 10 | (1 | ) | (19 | ) | 54 | |||||||||||||||||||||||||||||||||||||
| Group statement of comprehensive income | – | – | – | – | – | 6 | 1 | – | – | – | 8 | 15 | ||||||||||||||||||||||||||||||||||||||||
| Group statement of changes in equity | – | – | – | – | – | – | (1 | ) | – | – | – | – | (1 | ) | ||||||||||||||||||||||||||||||||||||||
| Exchange and other adjustments | 1 | – | 1 | – | 1 | – | 1 | – | – | – | (2 | ) | 2 | |||||||||||||||||||||||||||||||||||||||
| At 31 December 2020 | (95 | ) | – | 42 | (34 | ) | (57 | ) | 61 | 34 | 42 | 22 | (17 | ) | 20 | 18 |
| a | The above table has been re-presented in order to separately disclose the deferred tax on ‘deferred compensation’ and ‘credit losses’ (both previously disclosed in ‘other short-term temporary differences’), to disaggregate the deferred tax on ‘application fees’ and ‘contract costs’, to present deferred tax on share-based compensation within ‘employee benefits’ (previously disclosed within ‘other short-term temporary differences’) and to disclose deferred taxes on ‘contract assets’ within ‘other short-term temporary differences’ (previously disclosed within ‘Other intangible assets and contract assets’). |
The deferred tax on the loan notes represents tax that is expected to come due in 2025 (2019: 2025). The deferred tax in respect of losses of $61m (2019: $27m) comprises $60m in respect of revenue losses (2019: $27m) and $1m in respect of capital losses (2019: $nil). There is no tax in respect of uncertain tax positions recorded within deferred taxes.
A deferred tax asset of $95m (2019: $4m) has been recognised in legal entities which have made a loss in the current or the previous year. Of the 2020 amount, $89m (2019: $nil) is within the UK tax group and predominantly represents revenue tax losses and future tax deductions for amortisation.
The recoverability of these UK deferred tax assets has been assessed by:
| • | starting with the Group profit forecasts prepared by management, consistent with those used when reviewing for impairment (see page 135); |
| • | overlaying tax principles to those forecasts; and |
| • | following the methodology required by IAS 12. |
This has demonstrated that $87m of the UK deferred tax assets should reverse over a 10-year period. Under UK law, tax losses do not expire, although can only be offset against 50% of annual UK taxable profits, and accordingly, if the anticipated recovery to previous profitability were to be over a longer period, the length of time for recovery of the deferred tax asset would increase.
The remaining $2m of the UK deferred tax asset is in a legal entity which was loss making in 2019 and became profitable in 2020, and is forecast to remain so. Additional UK deferred tax assets of $14m are recognised in legal entities which were profitable in both the current and previous years.
| 160 | IHG | Annual Report and Form 20-F 2020 |
| Notes to the Group Financial Statements | IHG | Annual Report and Form 20-F 2020 | 161 |
Group Financial Statements
Notes to the Group Financial Statements continued
8. Tax continued
Factors that may affect the future tax charge
Many factors will affect the Group’s future tax rate, the key ones being future legislative developments, future profitability of underlying subsidiaries and tax uncertainties.
The impact of Covid-19 has resulted in changes to the Group’s current geographic profit mix and this trend is expected to continue for at least the short term. This is likely to result in a higher than usual tax rate for the Group in the short term.
Worldwide tax reform continues, most notably with the OECD’s review into “Tax Challenges Arising from Digitalisation”, and this could impact the tax profile of the Group over the longer term. The Group continues to monitor activity in this area.
The Group anticipates the exit from the European Union will not cause a material impact on its future underlying effective tax rate.
9. Dividends
| 2020 | 2019 | 2018 | ||||||||||||||||||||||
| cents | cents | cents | 2020 | 2019 | 2018 | |||||||||||||||||||
| per share | per share | per share | $m | $m | $m | |||||||||||||||||||
|
|
|
|
|
|
|
|
|
|
|
|
|
|
||||||||||||
| Paid during the year | ||||||||||||||||||||||||
|
|
|
|
|
|
|
|
|
|
|
|
|
|
||||||||||||
| Final (declared for previous year) | – | 78.1 | 71.0 | – | 139 | 130 | ||||||||||||||||||
|
|
|
|
|
|
|
|
|
|
|
|
|
|
||||||||||||
| Interim | – | 39.9 | 36.3 | – | 72 | 69 | ||||||||||||||||||
|
|
|
|
|
|
|
|
|
|
|
|
|
|
||||||||||||
| Special (note 29) | – | 262.1 | – | – | 510 | – | ||||||||||||||||||
|
|
|
|
|
|
|
|
|
|
|
|
|
|
||||||||||||
| – | 380.1 | 107.3 | – | 721 | 199 | |||||||||||||||||||
|
|
|
|
|
|
|
|
|
|
|
|
|
|
||||||||||||
| Proposed (not recognised as a liability at 31 December) | ||||||||||||||||||||||||
|
|
|
|
|
|
|
|
|
|
|
|
|
|
||||||||||||
| Final | – | – | 78.1 | – | – | 141 | ||||||||||||||||||
|
|
|
|
|
|
|
|
|
|
|
|
|
|
||||||||||||
On 20 March 2020, the Board withdrew its recommendation of a final dividend in respect of 2019 of 85.9¢ per share, a payment of which would have had a cash outflow of approximately $150m in the first half of 2020. A final dividend in respect of 2020 is not proposed and there was no interim dividend for the year. The Board will consider future dividends once visibility of the pace and scale of market recovery has improved.
10. (Loss)/earnings per ordinary share
Basic (loss)/earnings per ordinary share is calculated by dividing the profit or loss for the year available for IHG equity holders by the weighted average number of ordinary shares, excluding investment in own shares, in issue during the year.
Diluted (loss)/earnings per ordinary share is calculated by adjusting basic (loss)/earnings per ordinary share to reflect the notional exercise of the weighted average number of dilutive ordinary share awards outstanding during the year.
Adjusted earnings per ordinary share is disclosed in order to show performance undistorted by exceptional items and changes in the fair value of contingent purchase consideration, to give a more meaningful comparison of the Group’s performance.
Additionally, earnings attributable to the System Fund are excluded from the calculation of adjusted earnings per ordinary share, as IHG has an agreement with the IHG Owners Association to spend Fund income for the benefit of hotels in the IHG System such that the Group does not make a gain or loss from operating the Fund over the longer term.
IHG also records an interest charge on the outstanding cash balance relating to the IHG Rewards programme. These interest payments are recognised as interest income for the Fund and interest expense for IHG. The Fund also benefits from the capitalisation of interest related to the development of the next-generation Guest Reservation System. As the Fund is included in the Group income statement, these amounts are included in reported Group net financial expenses. Given that all results related to the Fund are excluded from the calculation of adjusted earnings per ordinary share, these interest amounts are deducted from profit or loss available for equity holders.
| 162 | IHG | Annual Report and Form 20-F 2020 |
| Notes to the Group Financial Statements | IHG | Annual Report and Form 20-F 2020 | 163 |
Group Financial Statements
Notes to the Group Financial Statements continued
11. Acquisition of businesses
Six Senses
On 12 February 2019, the Group acquired a 100% ownership interest in Six Senses Hotels Resorts Spas (‘Six Senses’), a leading operator of top-tier luxury hotels, resorts and spas with a world-renowned reputation for wellness and sustainability. The total purchase consideration was $304m, comprising $299m paid on acquisition, including the settlement of working capital, and $5m of contingent purchase consideration. The fair value of net assets acquired was $246m, including brands of $189m, management agreements of $45m, and a right-of-use asset of $19m offset by an equal lease liability. Goodwill recognised was $58m.
The contingent purchase consideration has been revalued as at 31 December 2020 (see note 25).
The value of management agreements and right-of-use assets recognised on acquisition were impaired by $41m and $5m respectively in 2020 (see notes 13 and 15).
UK portfolio
On 25 July 2018, the Group completed a deal to operate nine hotels under long-term leases from Covivio which operated under the Principal and De Vere Hotels brands. An additional leased hotel was added to the portfolio on 13 November 2018 bringing the total to 10 at 31 December 2018. On 14 February 2019, the Group added a further two hotels to the portfolio bringing the total hotels in the UK portfolio to 12.
The total purchase consideration for the 12 hotels was $73m, comprising $10m paid on acquisition, a working capital refund of $3m and $66m of contingent purchase consideration. The fair value of the net assets acquired was $14m and goodwill of $64m was recognised, of which $12m was recognised in 2019.
Goodwill and non-current assets acquired were impaired in full during 2019 and 2020 such that the remaining value is $nil (see note 6).
The contingent purchase consideration was revalued to $nil as at 31 December 2020 (see note 25).
Regent
On 1 July 2018, the Group completed the acquisition of a 51% controlling interest in an agreement with Formosa International Hotels Corporation (‘FIH’) to acquire the ‘Regent Hotels & Resorts’ brand and associated management agreements (‘Regent’). The Group acquired 51% of the issued share capital of Regent Hospitality Worldwide, Inc (‘RHW’), 100% of the issued share capital of Regent International Hotels Limited and 100% of the issued share capital of Regent Berlin GmbH.
Put and call options exist over the remaining 49% shareholding in RHW which are exercisable in a phased manner from 2026. As the decision-making powers related to the remaining shares are not substantive in driving RHW’s returns and FIH do not share in any costs associated with the future development of the Regent brand, it has been determined that the Group has a present ownership interest in the remaining shares. As such, RHW has been accounted for as 100% owned with no non-controlling interest recognised.
The total purchase consideration was $88m, comprising $13m paid on acquisition, $22m of deferred purchase consideration and $53m of contingent purchase consideration. The fair value of the net assets acquired was $53m, including brands of $57m and management agreements of $6m. Goodwill recognised was $35m.
The contingent purchase consideration has been revalued as at 31 December 2020 (see note 25).
The value of management agreements recognised on acquisition were impaired by $2m in 2020 (see note 13).
Cash flows relating to acquisitions
|
|
2020 $m |
2019 $m |
2018 $m |
|||||||||||||||||||||
| Cash paid on acquisition, including working capital settlement | – | 299 | 22 | |||||||||||||||||||||
| Settlement of stamp duty liability | – | 3 | 14 | |||||||||||||||||||||
| Less: cash and cash equivalents acquired | – | (7 | ) | (2 | ) | |||||||||||||||||||
| Less: working capital settlement received in year following acquisition | – | (3 | ) | – | ||||||||||||||||||||
| Net cash outflow arising on acquisitions | – | 292 | 34 | |||||||||||||||||||||
| 164 | IHG | Annual Report and Form 20-F 2020 |
| Notes to the Group Financial Statements | IHG | Annual Report and Form 20-F 2020 | 165 |
Group Financial Statements
Notes to the Group Financial Statements continued
13. Goodwill and other intangible assets continued
Goodwill and brands
Allocation of goodwill and brands to CGUs
The Group’s CGUs are consistent with prior years; however, the level at which goodwill is monitored by management has changed to the Group’s operating segments, namely Americas, EMEAA and Greater China. This better reflects (i) how the Group’s performance is monitored, including the measurement of overheads at a regional level with no measurement at any lower level, and (ii) how management executes on its regional strategies. Both of these factors have become more pronounced in the year as a result of historic lows in occupancy levels, the termination of the SVC portfolio of management agreements (see page 137), and the corporate reorganisation. In addition to changing the level at which goodwill is tested, the same approach has been applied to the Group’s brands with indefinite lives; testing brands at the same level goodwill is allocated is consistent year on year. Prior to making this change, management reconfirmed each of the brands, which relate to the Group’s luxury and lifestyle portfolio, have indefinite lives and continue to form an integral part of the Group’s strategy. Under the prior methodology, the CGU with the smallest headroom was Americas Managed; impairment tests were performed using the prior methodology (i.e. with no aggregation of CGUs) using the Base Case scenario (see below) and the Downside Case scenario (see page 133). No impairment arose under either scenario.
The table below summarises the movements in the carrying value of goodwill and brands and the final allocation for impairment testing purposes as at 31 December 2020.
| At 1 January 2020 $m |
Additions $m |
Reallocation $m |
Exchange differences $m |
Impairment $m |
At 31 December 2020 $m |
|||||||||||||||||||||||
| Goodwill and brands | ||||||||||||||||||||||||||||
| Americas Managed | 384 | – | (384 | ) | – | – | – | |||||||||||||||||||||
| Americas Franchised | 37 | – | (37 | ) | – | – | – | |||||||||||||||||||||
| Americas (group of CGUs) | – | – | 421 | – | – | 421 | ||||||||||||||||||||||
| EMEAA – Europe Managed | 94 | – | (94 | ) | – | – | – | |||||||||||||||||||||
| EMEAA – Europe Franchised | 10 | – | (10 | ) | – | – | – | |||||||||||||||||||||
| EMEAA – rest of region | 228 | – | (228 | ) | – | – | – | |||||||||||||||||||||
| EMEAA (group of CGUs) | – | – | 332 | 7 | – | 339 | ||||||||||||||||||||||
| Greater China | 25 | – | – | – | – | 25 | ||||||||||||||||||||||
| 778 | – | – | 7 | – | 785 | |||||||||||||||||||||||
| At 1 January 2019 $m |
Additions $m |
Reallocation $m |
Exchange differences $m |
Impairment $m |
At 31 December 2019 $m |
|||||||||||||||||||||||
| Goodwill and brands | ||||||||||||||||||||||||||||
| Americas Managed | 272 | 112 | – | – | – | 384 | ||||||||||||||||||||||
| Americas Franchised | 37 | – | – | – | – | 37 | ||||||||||||||||||||||
| EMEAA – Europe Managed | 42 | 52 | – | – | – | 94 | ||||||||||||||||||||||
| EMEAA – Europe Franchised | 10 | – | – | – | – | 10 | ||||||||||||||||||||||
| EMEAA – rest of region | 136 | 92 | – | – | – | 228 | ||||||||||||||||||||||
| Greater China | 18 | 7 | – | – | – | 25 | ||||||||||||||||||||||
| UK portfolio | – | – | 49 | – | (49 | ) | – | |||||||||||||||||||||
| Unallocated | 48 | – | (49 | ) | 1 | – | – | |||||||||||||||||||||
| 563 | 263 | – | 1 | (49 | ) | 778 | ||||||||||||||||||||||
Impairment testing of goodwill and brands (excluding the UK portfolio)
The recoverable amounts of the CGUs, or groups of CGUs, have been determined from value in use calculations. The key assumption is RevPAR growth and the expected recovery period (see page 135). Cash flows beyond the five-year period are extrapolated using terminal growth rates that do not exceed the average long-term growth rates for the relevant markets. A 10% contingency factor is applied to reduce all cash flow projections before being discounted using pre-tax rates that are based on the Group’s weighted average cost of capital adjusted to reflect the risks specific to the business model and territory of the CGU being tested.
| 166 | IHG | Annual Report and Form 20-F 2020 |
| Notes to the Group Financial Statements | IHG | Annual Report and Form 20-F 2020 | 167 |
Group Financial Statements
Notes to the Group Financial Statements continued
14. Property, plant and equipment
| Land and buildings $m |
Fixtures, fittings and equipment $m |
Total $m |
||||||||||||||
| Cost | ||||||||||||||||
| At 1 January 2019 | 199 | 314 | 513 | |||||||||||||
| Acquisition of businesses | 1 | 1 | 2 | |||||||||||||
| Additions | 9 | 68 | 77 | |||||||||||||
| Transfers to assets classified as held for sale (note 12) | – | (12 | ) | (12 | ) | |||||||||||
| Fully depreciated assets written off | (2 | ) | (60 | ) | (62 | ) | ||||||||||
| Disposals | – | (6 | ) | (6 | ) | |||||||||||
| Exchange and other adjustments | – | 2 | 2 | |||||||||||||
| At 31 December 2019 | 207 | 307 | 514 | |||||||||||||
| Additions | 2 | 28 | 30 | |||||||||||||
| Fully depreciated assets written off | – | (17 | ) | (17 | ) | |||||||||||
| Disposals | (1 | ) | (2 | ) | (3 | ) | ||||||||||
| Exchange and other adjustments | – | 6 | 6 | |||||||||||||
| At 31 December 2020 | 208 | 322 | 530 | |||||||||||||
| Depreciation and impairment | ||||||||||||||||
| At 1 January 2019 | (72 | ) | (168 | ) | (240 | ) | ||||||||||
| Provided | (3 | ) | (35 | ) | (38 | ) | ||||||||||
| System Fund expense | – | (2 | ) | (2 | ) | |||||||||||
| Transfers to assets classified as held for sale (note 12) | – | 9 | 9 | |||||||||||||
| Fully depreciated assets written off | 2 | 60 | 62 | |||||||||||||
| Disposals | – | 4 | 4 | |||||||||||||
| At 31 December 2019 | (73 | ) | (132 | ) | (205 | ) | ||||||||||
| Provided | (4 | ) | (33 | ) | (37 | ) | ||||||||||
| System Fund expense | – | (5 | ) | (5 | ) | |||||||||||
| Impairment charge | (39 | ) | (51 | ) | (90 | ) | ||||||||||
| System Fund impairment charge | – | (5 | ) | (5 | ) | |||||||||||
| Fully depreciated assets written off | – | 17 | 17 | |||||||||||||
| Disposals | 1 | 1 | 2 | |||||||||||||
| Exchange and other adjustments | – | (6 | ) | (6 | ) | |||||||||||
| At 31 December 2020 | (115 | ) | (214 | ) | (329 | ) | ||||||||||
| Net book value | ||||||||||||||||
| At 31 December 2020 | 93 | 108 | 201 | |||||||||||||
| At 31 December 2019 | 134 | 175 | 309 | |||||||||||||
| At 1 January 2019 | 127 | 146 | 273 | |||||||||||||
The Group’s property, plant and equipment mainly comprises buildings and leasehold improvements on 23 hotels (2019: 26 hotels), but also offices and computer hardware, throughout the world.
Impairment testing of property, plant and equipment
Total impairment charges of $90m were recognised in relation to property, plant and equipment in the year, in addition $5m was recognised in the System Fund.
For impairment testing of hotel properties, each hotel is deemed to be a CGU. Covid-19 was considered as a trigger for impairment testing for all hotel assets and impairment charges of $50m were recognised in relation to the UK portfolio and $35m relating to three premium-branded hotels in North America, both based on value in use calculations. The key assumptions and sensitivities relating to these assets are detailed on page 135.
Impairment charges of $3m were also recognised in relation to three development land sites held by the Group in the US which were measured at fair value. The sites were appraised by a professional external valuer using comparable sales data. Within the fair value hierarchy, this is categorised as a Level 3 measurement.
Impairment charges of $7m were recognised in relation to property, plant and equipment in the US corporate headquarters. The key assumptions and sensitivities are detailed on page 136. $5m of this impairment charge was borne by the System Fund in line with existing principles for cost allocation relating to this facility.
| 168 | IHG | Annual Report and Form 20-F 2020 |
| Notes to the Group Financial Statements | IHG | Annual Report and Form 20-F 2020 | 169 |
Group Financial Statements
Notes to the Group Financial Statements continued
15. Leases continued
Impairment testing of right-of-use assets
For impairment testing of hotel properties, each hotel is deemed to be a CGU. The impact of Covid-19 and the recovery period on trading was considered as a trigger for impairment testing for all hotel assets and an impairment charge of $5m was recognised relating to one hotel in the EMEAA region, based on value in use calculations. Trading projections reflect the five-year RevPAR recovery period outlined on page 135 and estimated future cash flows were discounted at a pre-tax rate of 8.8%.
Additionally, impairment charges of $43m were recognised in relation to the US corporate headquarters, using the assumptions described on page 136. $32m of this impairment charge was borne by the System Fund in line with existing principles for cost allocation relating to this facility.
Other right-of-use assets were also tested for impairment with no resulting charge, the most significant of which was the InterContinental Boston, which has non-current assets with a total carrying value of $195m. Details of the testing performed and sensitivities are contained on page 137.
Terminations
The lease of the InterContinental San Juan was terminated in 2020, resulting in a total gain of $30m (see note 6). Other terminations relate mainly to office properties where the lease was terminated in the period.
Lease liabilities
Total lease liabilities are analysed as follows:
|
2020 $m |
2019 $m |
|||||||||||||||||||||||
| Currency |
||||||||||||||||||||||||
| US dollars |
385 | 514 | ||||||||||||||||||||||
| Sterling |
10 | 52 | ||||||||||||||||||||||
| Euros |
7 | 43 | ||||||||||||||||||||||
| Other |
48 | 51 | ||||||||||||||||||||||
| 450 | 660 | |||||||||||||||||||||||
| Analysed as: |
||||||||||||||||||||||||
| Current |
34 | 65 | ||||||||||||||||||||||
|
Non-current |
416 | 595 | ||||||||||||||||||||||
| 450 | 660 | |||||||||||||||||||||||
| Amounts recognised in profit or loss | ||||||||||||||||||||||||
| The following amounts were recognised as expense/(income) in the year: | ||||||||||||||||||||||||
|
2020 $m |
2019 $m |
2018 $m |
||||||||||||||||||||||
| Depreciation of right-of-use assets |
35 | 38 | 35 | |||||||||||||||||||||
| System Fund depreciation of right-of-use assets |
4 | 5 | 4 | |||||||||||||||||||||
| Impairment charge |
16 | 32 | – | |||||||||||||||||||||
| System Fund impairment charge |
32 | – | – | |||||||||||||||||||||
| Derecognition of right-of-use assets and lease liabilities |
(22 | ) | – | – | ||||||||||||||||||||
| Gain on lease termination |
(30 | ) | – | – | ||||||||||||||||||||
| Expense relating to variable lease payments |
7 | 58 | 48 | |||||||||||||||||||||
| Expense relating to short-term leases and low-value assets |
2 | 3 | 3 | |||||||||||||||||||||
| Income from sub-leasing right-of-use assets |
(1 | ) | (2 | ) | (2 | ) | ||||||||||||||||||
| Recognised in operating (loss)/profit |
43 | 134 | 88 | |||||||||||||||||||||
| Interest on lease liabilities |
37 | 41 | 39 | |||||||||||||||||||||
| Total recognised in the Group income statement |
80 | 175 | 127 | |||||||||||||||||||||
Amounts recognised in the Group statement of cash flows
Total cash paid during the year relating to leases of $104m (2019: $159m, 2018: $132m) comprises $39m (2019: $100m, 2018: $97m) paid in respect of operating activities and $65m (2019: $59m, 2018: $35m) paid in respect of financing activities.
Variable lease payments
Variable lease payments are payable under certain of the Group’s hotel leases and arise where the Group is committed to making additional lease payments that are contingent on the performance of the hotels.
Variable lease payments relating to the UK portfolio and two German hotels are discussed in note 6.
Exposure to future cash outflows
At 31 December 2020, the Group was committed to future cash outflows of $nil (2019: $3m) relating to leases that have not yet commenced. A lease liability is recorded when the leased assets are available for use by the Group.
The maturity analysis of lease liabilities is disclosed in note 24.
The undiscounted future cash flows receivable from subleased properties amount to $2m (2019: $3m, 2018: $3m).
| 170 | IHG | Annual Report and Form 20-F 2020 |
| Notes to the Group Financial Statements | IHG | Annual Report and Form 20-F 2020 | 171 |
Group Financial Statements
Notes to the Group Financial Statements continued
16. Investment in associates and joint ventures continued
Other associates and joint ventures
The summarised aggregated financial information for individually immaterial associates and joint ventures is set out below. These are mainly investments in entities that own hotels which the Group manages.
| Associates | Joint ventures | Total | ||||||||||||||||||||||||||||||||||||||||||||||||||||||||||||||||||||||
|
2020 $m |
2019 $m |
2018 $m |
2020 $m |
2019 $m |
2018 $m |
2020 $m |
2019 $m |
2018 $m |
||||||||||||||||||||||||||||||||||||||||||||||||||||||||||||||||
| Share of (losses)/gains | ||||||||||||||||||||||||||||||||||||||||||||||||||||||||||||||||||||||||
| (Losses)/profits from continuing operations and total comprehensive (loss)/profit for the year | (3 | ) | 7 | 2 | 2 | – | 5 | (1 | ) | 7 | 7 | |||||||||||||||||||||||||||||||||||||||||||||||||||||||||||||
Impairment testing was performed on other associate investments containing hotel assets using management forecasts covering a five-year period, as detailed on page 135. This resulted in impairment of two associates, both in the Americas region, by a total of $8m. Estimated future cash flows were discounted at pre-tax rates of 12.0% and 8.4%, resulting in recoverable amounts of $1m and $4m respectively.
A further associate with a value of $5m at 31 December 2019 was liquidated in 2020. A final dividend of $3m was received and the remaining investment of $2m was impaired to $nil; the charge is recognised within Central costs.
During 2018, the Group received a distribution of $32m from a joint venture following the sale of the hotel owned by the joint venture. A further $2m was received in 2020 on liquidation of the joint venture.
17. Other financial assets
|
2020 $m |
2019 $m |
|||||||||||||||
| Equity securities: | ||||||||||||||||
| Equity shares quoted on an active market |
– | 8 | ||||||||||||||
| Other equity shares |
88 | 125 | ||||||||||||||
| 88 | 133 | |||||||||||||||
| Restricted funds: | ||||||||||||||||
| Shortfall reserve deposit |
9 | 25 | ||||||||||||||
| Ring-fenced amounts to satisfy insurance claims: |
||||||||||||||||
| Cash |
3 | 11 | ||||||||||||||
| Money market funds |
15 | 16 | ||||||||||||||
| Bank accounts pledged as security |
43 | 41 | ||||||||||||||
| Other |
3 | 5 | ||||||||||||||
| 73 | 98 | |||||||||||||||
| Trade deposits and loans | 8 | 57 | ||||||||||||||
| 169 | 288 | |||||||||||||||
| Analysed as: | ||||||||||||||||
| Current |
1 | 4 | ||||||||||||||
|
Non-current |
168 | 284 | ||||||||||||||
| 169 | 288 | |||||||||||||||
| 172 | IHG | Annual Report and Form 20-F 2020 |
| Notes to the Group Financial Statements | IHG | Annual Report and Form 20-F 2020 | 173 |
Group Financial Statements
Notes to the Group Financial Statements continued
18. Trade and other receivables
|
2020 $m |
2019 $m |
|||||||||||||||
| Trade receivablesa | 309 | 515 | ||||||||||||||
| Other receivables | 129 | 37 | ||||||||||||||
| Prepayments | 76 | 114 | ||||||||||||||
| 514 | 666 | |||||||||||||||
| a | Including cost reimbursements of $26m (2019: $67m). |
Trade and other receivables are held at amortised cost. Trade receivables are non-interest-bearing and are generally on payment terms of up to 30 days. The fair value of trade and other receivables approximates their carrying value.
Other receivables includes $77m relating to the UK portfolio rent. The Group has deferred rent payments due since 1 April 2020 (other than payments of ground rent) with consideration given to the UK Government and other commercial tenant protection measures which are in place up to 31 March 2021. A final rent reconciliation is expected in mid-2021, at which point no further rent will be payable and any rent paid in relation to 2020 will be recoverable from the landlord. $65m has been recognised within trade and other payables in relation to the rents due under the leases at 31 December, with the receivable balance reflecting the recovery of both amounts due and amounts paid in 2020.
Expected credit losses
The impairment charge in respect of trade receivables was $40m (2019: $8m). This amount and $48m relating to trade deposits and loans (see note 17) comprise the total impairment loss on financial assets in the Group income statement. A further impairment charge of $24m was recognised within System Fund expenses (2019: $12m).
In the Group’s interim financial statements as at 30 June 2020, exceptional items included an impairment of trade receivables of $22m which had been determined to be directly as a result of Covid-19. The subsequent improvement in cash collection and the considerations required to identify whether subsequent expected credit losses over the extended period of the pandemic are due to Covid-19 have resulted in none of the full year $40m impairment of trade receivables being presented within exceptional items.
Expected credit losses were calculated as follows:
| • | By applying the Group’s historical policy for estimating the expected credit loss provision, supported by the Group’s prior experience; and |
| • | By identifying hotel owners subject to payment plans or identified as distressed and applying a percentage provision to all outstanding receivables. |
The net balances presented in the table below could result in additional credit losses if they are ultimately found to be uncollectible.
The ageing of trade receivables at the end of the reporting period is shown below; the ageing reflects the initial terms under the invoice rather than the revised terms where payment flexibility has been provided to owners. Expected credit losses relating to other receivables are immaterial.
| 2020 | 2019 | |||||||||||||||||||||||||||||||||||||||||||||||
| Gross $m |
Credit loss allowance $m |
Net $m |
Gross $m |
Credit loss allowance $m |
Net $m |
|||||||||||||||||||||||||||||||||||||||||||
| Not past due | 153 | (1 | ) | 152 | 363 | (3 | ) | 360 | ||||||||||||||||||||||||||||||||||||||||
| Past due 1 to 30 days | 59 | (2 | ) | 57 | 74 | (3 | ) | 71 | ||||||||||||||||||||||||||||||||||||||||
| Past due 31 to 90 days | 61 | (6 | ) | 55 | 56 | (5 | ) | 51 | ||||||||||||||||||||||||||||||||||||||||
| Past due more than 90 days | 40 | (7 | ) | 33 | 35 | (7 | ) | 28 | ||||||||||||||||||||||||||||||||||||||||
| Past due more than 180 days | 74 | (62 | ) | 12 | 5 | – | 5 | |||||||||||||||||||||||||||||||||||||||||
| 387 | (78 | ) | 309 | 533 | (18 | ) | 515 | |||||||||||||||||||||||||||||||||||||||||
The credit risk relating to balances not past due is not deemed to be significant.
The movement in the allowance for expected lifetime credit losses of trade receivables during the year is as follows:
| 2020 $m |
2019 $m |
2018 $m |
||||||||||||||||||||||
| At 1 January | (18 | ) | (11 | ) | (77 | ) | ||||||||||||||||||
| Adjustment arising on adoption of IFRS 9a | – | – | 67 | |||||||||||||||||||||
| Impairment loss | (40 | ) | (8 | ) | (17 | ) | ||||||||||||||||||
| System Fund impairment loss | (24 | ) | (12 | ) | (11 | ) | ||||||||||||||||||
| Amounts written off | 7 | 14 | 26 | |||||||||||||||||||||
| Exchange and other adjustments | (3 | ) | (1 | ) | 1 | |||||||||||||||||||
| At 31 December | (78 | ) | (18 | ) | (11 | ) | ||||||||||||||||||
| a | IFRS 9 was applied from 1 January 2018. Under the transition method chosen, comparative information was not restated. |
| 174 | IHG | Annual Report and Form 20-F 2020 |
| Notes to the Group Financial Statements | IHG | Annual Report and Form 20-F 2020 | 175 |
Group Financial Statements
Notes to the Group Financial Statements continued
21. Provisions
| Litigation $m |
Insurance reserves $m |
Onerous $m |
Other $m |
Total $m |
||||||||||||||||||||
| At 1 January 2019 | 2 | 25 | – | – | 27 | |||||||||||||||||||
| Provided, of which $28m is recorded within exceptional items | 30 | 13 | – | – | 43 | |||||||||||||||||||
| Utilised | – | (8 | ) | – | – | (8 | ) | |||||||||||||||||
| At 31 December 2019 | 32 | 30 | – | – | 62 | |||||||||||||||||||
| Reclassification from trade and other payables | 2 | – | – | – | 2 | |||||||||||||||||||
| Provided, of which $10m is recorded within exceptional items | 7 | 13 | 10 | 4 | 34 | |||||||||||||||||||
| Utilised | (20 | ) | (7 | ) | (3 | ) | – | (30 | ) | |||||||||||||||
| Released, of which $9m is recorded within exceptional items | (9 | ) | – | – | – | (9 | ) | |||||||||||||||||
| Exchange adjustments | – | – | 1 | – | 1 | |||||||||||||||||||
| At 31 December 2020 | 12 | 36 | 8 | 4 | 60 | |||||||||||||||||||
| 2020 $m |
2019 $m |
|||||||||||||||
| Analysed as: | ||||||||||||||||
| Current |
16 | 40 | ||||||||||||||
|
Non-current |
44 | 22 | ||||||||||||||
| 60 | 62 | |||||||||||||||
Litigation
The litigation provision is principally related to management’s best estimate of settlements required in respect of lawsuits filed against the Group in the Americas region. The Group expects the provision to be principally utilised within 12 months. There are certain claims that the Group will be able to pursue in relation to these matters, although it is not practicable to quantify the amounts at this point in time.
In 2019, amounts were provided primarily representing management’s best estimate of settlement in respect of a lawsuit filed against the Group in the Americas region, together with the cost of an arbitration award against the Group in the EMEAA region. The amounts utilised in 2020 principally reflect the final resolution of these matters.
The amount released in the year principally relates to the lawsuit within the Americas region (see above) as the Group was able to enforce certain indemnities such that the Group did not have to settle the full amount which had been provided.
Insurance reserves
The Group self-insures certain risks relating to its corporate operations and owned and leased properties, and also acts as third-party insurer for certain risks of its managed hotels. The insurance reserves held mainly relate to general liability, workers compensation, US medical and employment practices liability insurances. The amounts are based on reserves held principally in the Group’s Captive insurance company, and are established using independent actuarial assessments wherever possible, or a reasonable assessment based on past claims experience.
Over and above the actuarially determined reserves, the Group is potentially exposed to claims with individual caps which do not exceed $4m for periods prior to 2011 and up to $40m in aggregate for periods since 2011, noting that actual claims did not differ significantly to estimates in 2020 or 2019.
Amounts utilised within the reserves are paid to a third-party insurer for subsequent settlement with the claimant. In order to protect the third-party insurer against the solvency risk of the Captive, the Group has outstanding letters of credit (see note 31).
In respect of the managed hotels, the Group received insurance premiums of $19m (2019: $19m, 2018: $11m) and incurred claims expense of $16m (2019: $18m, 2018: $10m). Insurance premiums earned are included in Central revenue.
Other
Includes dilapidations provisions and is expected to be utilised over a two to three-year period.
| 176 | IHG | Annual Report and Form 20-F 2020 |
| Notes to the Group Financial Statements | IHG | Annual Report and Form 20-F 2020 | 177 |
Group Financial Statements
Notes to the Group Financial Statements continued
22. Loans and other borrowings continued
Facilities provided by banks
| 2020 | 2019 | |||||||||||||||||||||||||||||||
| Utilised $m |
Unutilised $m |
Total $m |
Utilised $m |
Unutilised $m |
Total $m |
|||||||||||||||||||||||||||
| Committed | – | 1,350 | 1,350 | 125 | 1,225 | 1,350 | ||||||||||||||||||||||||||
| Uncommitted | – | 50 | 50 | – | 54 | 54 | ||||||||||||||||||||||||||
| – | 1,400 | 1,400 | 125 | 1,279 | 1,404 | |||||||||||||||||||||||||||
| 2020 $m |
2019 $m |
|||||||||||||||
| Expiry of unutilised facilities | ||||||||||||||||
| Within one year | 50 | 54 | ||||||||||||||
| After two but before five years | 1,350 | 1,225 | ||||||||||||||
| 1,400 | 1,279 | |||||||||||||||
Utilised facilities are calculated based on actual drawings and may not agree to the carrying value of loans held at amortised cost.
23. Net debt
| 2020 $m |
2019 $m |
|||||||||||||||||
| Cash and cash equivalents | 1,675 | 195 | ||||||||||||||||
| Loans and other borrowings | – current | (869 | ) | (87 | ) | |||||||||||||
| – non-current | (2,898 | ) | (2,078 | ) | ||||||||||||||
| Lease liabilities | – current | (34 | ) | (65 | ) | |||||||||||||
| – non-current | (416 | ) | (595 | ) | ||||||||||||||
| – classified as held for sale (note 12) | – | (20 | ) | |||||||||||||||
| Derivative financial instruments hedging debt values (note 24) | 13 | (15 | ) | |||||||||||||||
| Net debt | (2,529 | ) | (2,665 | ) | ||||||||||||||
| Movement in net debt | ||||||||||||||||
| Net increase/(decrease) in cash and cash equivalents, net of overdrafts | 1,430 | (500 | ) | |||||||||||||
| Add back financing cash flows in respect of other components of net debt: | ||||||||||||||||
| Principal element of lease payments |
65 | 59 | ||||||||||||||
| Issue of long-term bonds, including effect of currency swaps |
(1,093 | ) | – | |||||||||||||
| Issue of commercial paper |
(738 | ) | – | |||||||||||||
| Repayment of long-term bonds |
290 | – | ||||||||||||||
| Decrease/(increase) in other borrowings | 125 | (127 | ) | |||||||||||||
| Decrease/(increase) in net debt arising from cash flows | 79 | (568 | ) | |||||||||||||
| Other movements: | ||||||||||||||||
| Lease liabilities |
144 | (43 | ) | |||||||||||||
| Increase in accrued interest |
(5 | ) | (7 | ) | ||||||||||||
| Acquisitions and disposals |
19 | (25 | ) | |||||||||||||
| Exchange and other adjustments |
(101 | ) | (57 | ) | ||||||||||||
| Decrease/(increase) in net debt | 136 | (700 | ) | |||||||||||||
| Net debt at beginning of the year | (2,665 | ) | (1,965 | ) | ||||||||||||
| Net debt at end of the year | (2,529 | ) | (2,665 | ) |

|
Information concerning Non-GAAP measures can be found in the Strategic Report on pages 47 to 51. |
Net debt on a frozen GAAP basis as calculated for bank covenants was $2,375m (2019: $2,241m). Further details are provided on page 181.
| 178 | IHG | Annual Report and Form 20-F 2020 |
| Notes to the Group Financial Statements | IHG | Annual Report and Form 20-F 2020 | 179 |
Group Financial Statements
Notes to the Group Financial Statements continued
24. Financial risk management and derivative financial instruments continued
Derivative financial instruments
Derivatives are recorded in the Group statement of financial position at fair value (see note 25) as follows:
| Description | Hedge relationship | 2020 $m |
2019 $m |
|||||||||||||||
| Put option | None | 4 | – | |||||||||||||||
| Currency swaps | Cash flow hedge | (17 | ) | (20 | ) | |||||||||||||
| Short-dated foreign exchange swaps | Net investment hedge | – | 1 | |||||||||||||||
| (13 | ) | (19 | ) | |||||||||||||||
| Analysed as: | ||||||||||||||||||
| Non-current assets |
5 | – | ||||||||||||||||
| Current assets |
– | 1 | ||||||||||||||||
| Non-current liabilities |
(18 | ) | (20 | ) | ||||||||||||||
| (13 | ) | (19 | ) | |||||||||||||||
The carrying amount of currency swaps of $(17)m (2019: $(20)m) comprises $13m gain (2019: $15m loss) relating to exchange movements on the underlying principal, included within net debt (see note 23), and $30m loss (2019: $5m loss) relating to other fair value movements.
Details of the credit risk on derivative financial instruments are included on page 183.
Cash flow hedges
Currency swaps have been transacted to swap the proceeds from the euro bonds to sterling as follows:
| Date of designation | Pay leg | Interest rate | Receive leg | Interest rate | Maturity | Risk | Hedge type | Hedged item | ||||||||||||
|
|
| |||||||||||||||||||
| November 2018 | £436m | 3.5% | €500m | 2.125% | May 2027 | Foreign exchange | Cash flow | €500m 2.125% bonds 2027 | ||||||||||||
|
|
| |||||||||||||||||||
| October 2020 | £454m | 2.7% | €500m | 1.625% | October 2024 | Foreign exchange | Cash flow | €500m 1.625% bonds 2024 | ||||||||||||
|
|
| |||||||||||||||||||
Hedge ineffectiveness arises where the cumulative changes in the fair value of the swaps exceed the change in the fair value of the bonds.
The change in the fair value of hedging instruments used to measure hedge ineffectiveness in the period mirrors that of the hypothetical derivative (hedged item) and was $7m (2019: $30m).
Hedge ineffectiveness may occur due to any opening fair value of the hedging instrument, or a change in the credit risk of the Group or counterparty. There was no ineffectiveness in 2020 or 2019.
Amounts recognised in the cash flow hedging reserve are analysed in note 29.
Net investment hedges
The Group designates the following as net investment hedges of its foreign operations, being the net assets of certain Group subsidiaries with a US dollar functional currency:
| • | Borrowings under the Syndicated and Bilateral Facilities; and |
| • | Short-dated foreign exchange swaps. |
The designated risk is the spot foreign exchange risk and interest on these financial instruments is taken through financial income or expense.
Short-dated foreign exchange swaps are used to manage sterling surplus cash and reduce US dollar borrowings whilst maintaining operational flexibility. The maximum amount held during the year as net investment hedges and tested for effectiveness at calendar quarter ends were short-dated foreign exchange swaps with principals of $nil (2019: $100m).
There is an economic relationship between the hedged item and the hedging instrument as the net investment creates a foreign exchange risk that will match the foreign exchange risk on the US dollar borrowing. The Group has established a hedge ratio of 1:1 as the underlying risk of the hedging instrument is identical to the hedged risk component.
The change in value of hedging instruments recognised in the currency translation reserve through other comprehensive income was $1m loss (2019: $2m loss). There was no ineffectiveness recognised in the Group income statement during the current or prior year.
| 180 | IHG | Annual Report and Form 20-F 2020 |
| Notes to the Group Financial Statements | IHG | Annual Report and Form 20-F 2020 | 181 |
Group Financial Statements
Notes to the Group Financial Statements continued
24. Financial risk management and derivative financial instruments continued
The following are the undiscounted contractual cash flows of financial liabilities, including interest payments. Liabilities relating to the Group’s deferred compensation plan are excluded; their settlement is funded entirely by the realisation of the related deferred compensation plan investments and no net cash flow arises. The payment profile of contingent purchase consideration has been based on management’s forecasts and could in reality be different from expectations.
| Less than 1 year $m |
Between 1 and 2 years $m |
Between 2 and 5 years $m |
More than 5 years $m |
Total $m |
||||||||||||||||||||
| 31 December 2020 | ||||||||||||||||||||||||
| Non-derivative financial liabilities: | ||||||||||||||||||||||||
| Bank overdrafts |
51 | – | – | – | 51 | |||||||||||||||||||
| £173m 3.875% bonds 2022 |
9 | 245 | – | – | 254 | |||||||||||||||||||
|
€500m 1.625% bonds 2024 |
10 | 10 | 634 | – | 654 | |||||||||||||||||||
| £300m 3.75% bonds 2025 |
15 | 15 | 456 | – | 486 | |||||||||||||||||||
| £350m 2.125% bonds 2026 |
10 | 10 | 31 | 488 | 539 | |||||||||||||||||||
|
€500m 2.125% bonds 2027 |
13 | 13 | 39 | 640 | 705 | |||||||||||||||||||
| £400m 3.375% bonds 2028 |
19 | 18 | 55 | 601 | 693 | |||||||||||||||||||
| Commercial paper |
819 | – | – | – | 819 | |||||||||||||||||||
| Lease liabilities |
57 | 55 | 136 | 3,257 | 3,505 | |||||||||||||||||||
| Trade and other payables (excluding deferred and contingent purchase consideration) |
453 | 2 | 1 | 1 | 457 | |||||||||||||||||||
| Deferred and contingent purchase consideration |
13 | 5 | 13 | 81 | 112 | |||||||||||||||||||
| Derivative financial liabilities: | ||||||||||||||||||||||||
| Currency swaps hedging €500m 1.625% bonds 2024 outflows |
16 | 16 | 652 | – | 684 | |||||||||||||||||||
| Currency swaps hedging €500m 1.625% bonds 2024 inflows |
(10 | ) | (10 | ) | (634 | ) | – | (654 | ) | |||||||||||||||
| Currency swaps hedging €500m 2.125% bonds 2027 outflows |
21 | 21 | 63 | 627 | 732 | |||||||||||||||||||
| Currency swaps hedging €500m 2.125% bonds 2027 inflows |
(13 | ) | (13 | ) | (39 | ) | (640 | ) | (705 | ) | ||||||||||||||
| Less than 1 year $m |
Between 1 and 2 years $m |
Between 2 and 5 years $m |
More than 5 years $m |
Total $m |
||||||||||||||||||||
| 31 December 2019 | ||||||||||||||||||||||||
| Non-derivative financial liabilities: | ||||||||||||||||||||||||
| Bank overdrafts |
87 | – | – | – | 87 | |||||||||||||||||||
| Unsecured bank loans |
125 | – | – | – | 125 | |||||||||||||||||||
| £400m 3.875% bonds 2022 |
21 | 21 | 548 | – | 590 | |||||||||||||||||||
| £300m 3.75% bonds 2025 |
15 | 15 | 45 | 411 | 486 | |||||||||||||||||||
| £350m 2.125% bonds 2026 |
10 | 10 | 29 | 482 | 531 | |||||||||||||||||||
|
€500m 2.125% bonds 2027 |
12 | 12 | 36 | 597 | 657 | |||||||||||||||||||
| Lease liabilities |
97 | 116 | 193 | 3,451 | 3,857 | |||||||||||||||||||
| Trade and other payables (excluding deferred and contingent purchase consideration) |
567 | 1 | 1 | 1 | 570 | |||||||||||||||||||
| Deferred and contingent purchase consideration |
3 | 20 | 19 | 120 | 162 | |||||||||||||||||||
| Derivative financial liabilities: | ||||||||||||||||||||||||
| Forward foreign exchange contracts |
(1 | ) | – | – | – | (1 | ) | |||||||||||||||||
| Currency swaps hedging €500m 2.125% bonds 2027 outflows |
20 | 20 | 61 | 627 | 728 | |||||||||||||||||||
| Currency swaps hedging €500m 2.125% bonds 2027 inflows |
(12 | ) | (12 | ) | (36 | ) | (597 | ) | (657 | ) | ||||||||||||||
| 182 | IHG | Annual Report and Form 20-F 2020 |
| Notes to the Group Financial Statements | IHG | Annual Report and Form 20-F 2020 | 183 |
Group Financial Statements
Notes to the Group Financial Statements continued
25. Classification and measurement of financial instruments
Accounting classification
| 2020 $m |
2019 Restateda $m |
|||||||||||||||
| Financial assets | ||||||||||||||||
| Financial assets measured at fair value through other comprehensive income: | ||||||||||||||||
| Equity securities (note 17) |
88 | 133 | ||||||||||||||
| Financial assets measured at fair value through profit or loss: | ||||||||||||||||
| Money market funds: |
||||||||||||||||
| Cash and cash equivalents (note 19) |
892 | 35 | ||||||||||||||
| Other financial assets (note 17) |
15 | 16 | ||||||||||||||
| Other financial assets (note 17) |
– | 3 | ||||||||||||||
| Derivative financial instruments (note 24) |
5 | 1 | ||||||||||||||
| Deferred compensation plan investments |
236 | 218 | ||||||||||||||
| 1,148 | 273 | |||||||||||||||
| Financial assets measured at amortised cost: | ||||||||||||||||
| Cash and cash equivalents (note 19) |
783 | 160 | ||||||||||||||
| Other financial assets (note 17) |
66 | 136 | ||||||||||||||
| Trade and other receivables, excluding prepayments (note 18) |
438 | 552 | ||||||||||||||
| 1,287 | 848 | |||||||||||||||
| Financial liabilities | ||||||||||||||||
| Financial liabilities measured at fair value through profit or loss: | ||||||||||||||||
| Contingent purchase consideration (note 20) |
(79 | ) | (91 | ) | ||||||||||||
| Derivative financial instruments (note 24) |
(18 | ) | (20 | ) | ||||||||||||
| Deferred compensation plan liabilities |
(236 | ) | (218 | ) | ||||||||||||
| (333 | ) | (329 | ) | |||||||||||||
| Financial liabilities measured at amortised cost: | ||||||||||||||||
| Loans and other borrowings (note 22) |
(3,767 | ) | (2,165 | ) | ||||||||||||
| Trade and other payables, excluding deferred and contingent purchase consideration (note 20) |
(457 | ) | (570 | ) | ||||||||||||
| Deferred purchase consideration (note 20) |
(24 | ) | (23 | ) | ||||||||||||
| (4,248 | ) | (2,758 | ) | |||||||||||||
| a | Restated for deferred compensation plan investments, see page 134. |
Right of offset
Other than in relation to cash pooling arrangements (see note 19), there are no financial instruments with a significant fair value subject to enforceable master netting arrangements and other similar agreements that are not offset in the Group statement of financial position.
| 184 | IHG | Annual Report and Form 20-F 2020 |
| Notes to the Group Financial Statements | IHG | Annual Report and Form 20-F 2020 | 185 |
Group Financial Statements
Notes to the Group Financial Statements continued
25. Classification and measurement of financial instruments continued
Contingent purchase consideration
Regent $74m (2019: $66m)
Comprises the present value of the expected amounts payable on exercise of the put and call options to acquire the remaining 49% shareholding (see note 11). The amount payable on exercise of the options is based on the annual trailing revenue of RHW in the year preceding exercise, with a floor applied. The options are exercisable in a phased manner from 2026 to 2033. The value of the contingent purchase consideration is subject to periodic reassessment as interest rates and RHW revenue expectations change. At 31 December 2020, it is assumed that $39m will be paid in 2026 to acquire an additional 25% of RHW with the remaining 24% acquired in 2028 for $42m. This assumes that the options will be exercised at the earliest permissible date which is consistent with the assumption made on acquisition. The amount recognised is the discounted value of the total expected amount payable of $81m. The discount rate applied is based on observable US corporate bond rates of similar term to the expected payment dates. The range of possible outcomes remains unchanged from the date of acquisition at $81m to $261m (undiscounted).
The significant unobservable inputs used to determine the fair value of the contingent purchase consideration are the projected trailing revenues of RHW and the date of exercising the options. If the annual trailing revenue of RHW were to exceed the floor by 10%, the amount of the contingent purchase consideration recognised in the Group Financial Statements would increase by $7m (2019: $7m). If the date for exercising the options is assumed to be 2033, the amount of the undiscounted contingent purchase consideration would be $86m (2019: $86m).
UK portfolio $nil (2019: $20m)
The contingent purchase consideration comprises the present value of the above-market element of the expected lease payments to the lessor. The above-market assessment is determined by comparing the expected lease payments as a percentage of forecast hotel operating profit (before depreciation and rent) with market metrics, on a hotel by hotel basis. There is no floor to the amount payable and no maximum amount. Market rents were initially determined with assistance of professional third-party advisers. The fair value is subject to periodic reassessment as interest rates and expected lease payments change.
A fair value adjustment of $21m was recognised in the year, resulting in a reduction to the value of the liability arising mainly from a reduction in expected future rentals payable such that there is no above-market element (see note 6). The fair value is not sensitive to reasonably possible changes in assumptions (see page 135).
Six Senses $5m (2019: $5m)
Currently expected to be paid in 2022, upon certain conditions being met relating to a project to open a pipeline property. If the conditions are not met, no amounts will be paid. The impact of discounting is not material.
Level 3 reconciliation
The following table reconciles the movements in the fair values of financial instruments classified as Level 3 during the year:
| Other financial assets $m |
Derivative financial instruments $m |
Contingent purchase consideration $m |
||||||||||||||
| At 1 January 2019 | 108 | – | (109 | ) | ||||||||||||
| Additions | 8 | – | – | |||||||||||||
| Acquisition of businesses (note 11) | 1 | – | (15 | ) | ||||||||||||
| Disposals | (1 | ) | – | – | ||||||||||||
| Valuation gains recognised in other comprehensive income | 12 | – | – | |||||||||||||
| Contingent purchase consideration paid: | ||||||||||||||||
| Included in net cash from operating activities |
– | – | 6 | |||||||||||||
| Included in net cash from investing activities |
– | – | 2 | |||||||||||||
| Change in fair value (of which $38m is recorded within exceptional items) | – | – | 27 | |||||||||||||
| Exchange and other adjustments | – | – | (2 | ) | ||||||||||||
| At 31 December 2019 | 128 | – | (91 | ) | ||||||||||||
| Additions | 5 | – | – | |||||||||||||
| Transfers into Level 3 | 8 | – | – | |||||||||||||
| Repayments and disposals | (5 | ) | – | – | ||||||||||||
| Valuation losses recognised in other comprehensive income | (47 | ) | – | – | ||||||||||||
| Change in fair valuea | – | 4 | 13 | |||||||||||||
| Exchange and other adjustments | (1 | ) | – | (1 | ) | |||||||||||
| At 31 December 2020 | 88 | 4 | (79 | ) | ||||||||||||
| a | $21m fair value gain on contingent purchase consideration and $4m gain on derivative financial instruments are recognised as exceptional items in the Group income statement (see note 6). The remaining $8m fair value loss on contingent purchase consideration relates to Regent. |
| 186 | IHG | Annual Report and Form 20-F 2020 |
| Notes to the Group Financial Statements | IHG | Annual Report and Form 20-F 2020 | 187 |
Group Financial Statements
Notes to the Group Financial Statements continued
27. Retirement benefits continued
The Group continues to maintain the unfunded Inter-Continental Hotels Non-qualified Pension Plans (‘US plans’) and unfunded InterContinental Hotels Corporation Postretirement Medical, Dental, Vision and Death Benefit Plan (‘US post-retirement plan’), both of which are defined benefit plans. Both plans are closed to new members. A Retirement Committee, comprising senior Group employees and assisted by professional advisers as and when required, has responsibility for oversight of the plans.
Other
The Group also operates a number of smaller pension schemes outside the UK, the most significant of which is a defined contribution scheme in the US; there is no material difference between the pension costs of, and contributions to, these schemes.
| Defined benefit obligation | Fair value of plan assets | Net defined benefit liability/(asset) | ||||||||||||||||||||||||||||||||||||||||||||||||||||||||||||||||||||||
|
2020 $m |
2019 $m |
2018 $m |
2020 $m |
2019 $m |
2018 $m |
2020 $m |
2019 $m |
2018 $m |
||||||||||||||||||||||||||||||||||||||||||||||||||||||||||||||||
| At 1 January | 96 | 91 | 250 | – | – | (152 | ) | 96 | 91 | 98 | ||||||||||||||||||||||||||||||||||||||||||||||||||||||||||||||
| Recognised in profit or loss | ||||||||||||||||||||||||||||||||||||||||||||||||||||||||||||||||||||||||
| Interest expense/(income) | 3 | 3 | 6 | – | – | (2 | ) | 3 | 3 | 4 | ||||||||||||||||||||||||||||||||||||||||||||||||||||||||||||||
| Exceptional item: settlement loss | – | – | 14 | – | – | 1 | – | – | 15 | |||||||||||||||||||||||||||||||||||||||||||||||||||||||||||||||
| 3 | 3 | 20 | – | – | (1 | ) | 3 | 3 | 19 | |||||||||||||||||||||||||||||||||||||||||||||||||||||||||||||||
| Recognised in other comprehensive income | ||||||||||||||||||||||||||||||||||||||||||||||||||||||||||||||||||||||||
| Actuarial loss/(gain) arising from changes in: | ||||||||||||||||||||||||||||||||||||||||||||||||||||||||||||||||||||||||
| Demographic assumptions |
(3 | ) | (1 | ) | – | – | – | – | (3 | ) | (1 | ) | – | |||||||||||||||||||||||||||||||||||||||||||||||||||||||||||
| Financial assumptions |
10 | 9 | (14 | ) | – | – | – | 10 | 9 | (14 | ) | |||||||||||||||||||||||||||||||||||||||||||||||||||||||||||||
| Experience adjustments |
1 | (1 | ) | (3 | ) | – | – | – | 1 | (1 | ) | (3 | ) | |||||||||||||||||||||||||||||||||||||||||||||||||||||||||||
| Return on plan assets | – | – | – | – | – | 8 | – | – | 8 | |||||||||||||||||||||||||||||||||||||||||||||||||||||||||||||||
| Re-measurement loss/(gain) | 8 | 7 | (17 | ) | – | – | 8 | 8 | 7 | (9 | ) | |||||||||||||||||||||||||||||||||||||||||||||||||||||||||||||
| Exchange adjustments | 2 | 1 | (1 | ) | – | – | – | 2 | 1 | (1 | ) | |||||||||||||||||||||||||||||||||||||||||||||||||||||||||||||
| 10 | 8 | (18 | ) | – | – | 8 | 10 | 8 | (10 | ) | ||||||||||||||||||||||||||||||||||||||||||||||||||||||||||||||
| Other | ||||||||||||||||||||||||||||||||||||||||||||||||||||||||||||||||||||||||
| Group contributions | – | – | – | (6 | ) | (6 | ) | (16 | ) | (6 | ) | (6 | ) | (16 | ) | |||||||||||||||||||||||||||||||||||||||||||||||||||||||||
| Benefits paid | (6 | ) | (6 | ) | (11 | ) | 6 | 6 | 11 | – | – | – | ||||||||||||||||||||||||||||||||||||||||||||||||||||||||||||
| Settlement payments | – | – | (150 | ) | – | – | 150 | – | – | – | ||||||||||||||||||||||||||||||||||||||||||||||||||||||||||||||
| (6 | ) | (6 | ) | (161 | ) | – | – | 145 | (6 | ) | (6 | ) | (16 | ) | ||||||||||||||||||||||||||||||||||||||||||||||||||||||||||
| At 31 December | 103 | 96 | 91 | – | – | – | 103 | 96 | 91 | |||||||||||||||||||||||||||||||||||||||||||||||||||||||||||||||
| Comprising: | ||||||||||||||||||||||||||||||||||||||||||||||||||||||||||||||||||||||||
| UK unfunded plan |
31 | 26 | 24 | – | – | – | 31 | 26 | 24 | |||||||||||||||||||||||||||||||||||||||||||||||||||||||||||||||
| US unfunded plans |
50 | 48 | 45 | – | – | – | 50 | 48 | 45 | |||||||||||||||||||||||||||||||||||||||||||||||||||||||||||||||
| US unfunded post-retirement plans |
22 | 22 | 22 | – | – | – | 22 | 22 | 22 | |||||||||||||||||||||||||||||||||||||||||||||||||||||||||||||||
| 103 | 96 | 91 | – | – | – | 103 | 96 | 91 | ||||||||||||||||||||||||||||||||||||||||||||||||||||||||||||||||
| Defined benefit obligation |
Fair value of plan assets |
Net defined benefit liability/(asset) | ||||||||||||||||||||||||||||||||||||||||||||||||||||||||||||||||||||||
| 2020 $m |
2019 $m |
2018 $m |
2020 $m |
2019 $m |
2018 $m |
2020 $m |
2019 $m |
2018 $m |
||||||||||||||||||||||||||||||||||||||||||||||||||||||||||||||||
| Movement in asset restriction | ||||||||||||||||||||||||||||||||||||||||||||||||||||||||||||||||||||||||
| At 1 January | – | – | – | – | – | 3 | – | – | 3 | |||||||||||||||||||||||||||||||||||||||||||||||||||||||||||||||
| Recognised in other comprehensive income | – | – | – | – | – | (3 | ) | – | – | (3 | ) | |||||||||||||||||||||||||||||||||||||||||||||||||||||||||||||
| At 31 December | – | – | – | – | – | – | – | – | – | |||||||||||||||||||||||||||||||||||||||||||||||||||||||||||||||
For the year ended 31 December 2018, the total amount of re-measurement gains and losses recorded in other comprehensive income, including the movement in the asset restriction, was a gain of $12m.
| 188 | IHG | Annual Report and Form 20-F 2020 |
| Notes to the Group Financial Statements | IHG | Annual Report and Form 20-F 2020 | 189 |
Group Financial Statements
Notes to the Group Financial Statements continued
27. Retirement benefits continued
Sensitivities
Changes in assumptions used for determining retirement benefit costs and obligations may have an impact on the Group income statement and the Group statement of financial position. The key assumptions are the discount rate, the rate of inflation, the assumed mortality rate and the healthcare costs trend rate. The sensitivity analysis below relates to the benefit obligation and is based on extrapolating reasonable changes in these assumptions, using year-end conditions and assuming no interdependency between the assumptions:
| $m | ||||||||||
| Increase/(decrease) in liabilities | ||||||||||
| Discount rate | 0.25% decrease | 3.2 | ||||||||
| 0.25% increase | (3.2 | ) | ||||||||
| Inflation rate | 0.25% decrease | (1.4 | ) | |||||||
| 0.25% increase | 1.4 | |||||||||
| Mortality rate | One-year increase | 5.7 | ||||||||
| Healthcare costs trend rate | 1% decrease | (1.6 | ) | |||||||
| 1% increase | 1.7 | |||||||||
Future payments
Group payments are expected to be $6m in 2021.
The estimated future benefit payments are:
| 2020 | 2019 | |||||||||||
| $m | $m | |||||||||||
| Within one year | 6 | 6 | ||||||||||
| Between one and five years | 22 | 22 | ||||||||||
| More than five years | 101 | 107 | ||||||||||
| 129 | 135 | |||||||||||
Average duration
The average duration of the pensions obligations is:
| 2020 | 2019 | |||||||||
| Years | Years | |||||||||
| UK plan | 19.0 | 18.0 | ||||||||
| US plans | 9.3 | 9.3 | ||||||||
| US post-retirement plan | 9.9 | 9.8 |
| 190 | IHG | Annual Report and Form 20-F 2020 |
| Notes to the Group Financial Statements | IHG | Annual Report and Form 20-F 2020 | 191 |
Group Financial Statements
Notes to the Group Financial Statements continued
28. Share-based payments continued
The Group recognised a cost of $19m (2019: $28m, 2018: $27m) in operating (loss)/profit and $nil (2019: $1m, 2018: $1m) within exceptional administrative expenses related to equity-settled share-based payment transactions during the year, net of $11m (2019: $12m, 2018: $11m) borne by the System Fund. The Group also recognised a cost of $2m (2019: $2m, 2018: $nil) in operating (loss)/profit related to cash-settled share-based payment transactions.
No consideration was received in respect of ordinary shares issued under option schemes during 2020, 2019 or 2018.
The Group uses separate option pricing models and assumptions depending on the plan. The following table sets out information about awards granted in 2020, 2019 and 2018 under the APP and LTIP. The total fair value of the Colleague Share Plan is not significant.
| APP | LTIP | |||||||||||||||||||||||||||||||||||
| Monte Carlo Simulation and | ||||||||||||||||||||||||||||||||||||
| Binomial valuation model | Binomial valuation model | |||||||||||||||||||||||||||||||||||
| 2020 | 2019 | 2018 | 2020 | 2019 | 2018 | |||||||||||||||||||||||||||||||
| Weighted average share price (pence) | 3,771.0 | 4,597.0 | 4,645.0 | 3,450.0 | 4,850.0 | 4,774.0 | ||||||||||||||||||||||||||||||
| Expected dividend yield | n/a | n/a | n/a | 1.48% | 2.16% | 2.27% | ||||||||||||||||||||||||||||||
| Risk-free interest rate | 0.02% | 0.72% | 0.84% | |||||||||||||||||||||||||||||||||
| Volatilitya | 33% | 19% | 25% | |||||||||||||||||||||||||||||||||
| Term (years) | 3.0 | 3.0 | 3.0 | 3.0 | 3.0 | 3.0 | ||||||||||||||||||||||||||||||
| a | The expected volatility was determined by calculating the historical volatility of the Company’s share price corresponding to the expected life of the share award. |
Movements in the awards outstanding under the schemes are as follows:
| APP | LTIP | |||||||||||||||
| Number of shares thousands |
Performance-related awards Number of shares thousands |
Restricted stock units | ||||||||||||||
| Outstanding at 1 January 2018 | 616 | 2,393 | 916 | |||||||||||||
| Granted | 176 | 257 | 527 | |||||||||||||
| Vested | (199 | ) | (702 | ) | – | |||||||||||
| Lapsed or cancelled | (2 | ) | (860 | ) | (142) | |||||||||||
| Outstanding at 31 December 2018 | 591 | 1,088 | 1,301 | |||||||||||||
| Granted | 217 | 287 | 540 | |||||||||||||
| Vested | (276 | ) | (293 | ) | (422) | |||||||||||
| Share capital consolidation | (21 | ) | – | – | ||||||||||||
| Lapsed or cancelled | (15 | ) | (387 | ) | (144) | |||||||||||
| Outstanding at 31 December 2019 | 496 | 695 | 1,275 | |||||||||||||
| Granted | 138 | 383 | 696 | |||||||||||||
| Vested | (188 | ) | (179 | ) | (413) | |||||||||||
| Lapsed or cancelled | (33 | ) | (85 | ) | (137) | |||||||||||
| Outstanding at 31 December 2020 | 413 | 814 | 1,421 | |||||||||||||
| Fair value of awards granted during the year (cents) | ||||||||||||||||
| 2020 | 4,965.9 | 2,473.5 | 4,397.5 | |||||||||||||
| 2019 | 5,888.7 | 4,985.6 | 5,862.1 | |||||||||||||
| 2018 | 6,066.2 | 4,748.7 | 5,966.0 | |||||||||||||
| Weighted average remaining contract life (years) | ||||||||||||||||
| At 31 December 2020 | 1.0 | 1.4 | 1.3 | |||||||||||||
| At 31 December 2019 | 1.1 | 1.3 | 1.2 | |||||||||||||
| At 31 December 2018 | 1.0 | 0.8 | 1.2 | |||||||||||||
The above awards do not vest until the performance and service conditions have been met.
The weighted average share price at the date of exercise for share awards vested during the year was 4,874.5p (2019: 4,584.8p). The closing share price on 31 December 2020 was 4,690.0p and the range during the year was 2,385.5p to 5,223.0p.
| 192 | IHG | Annual Report and Form 20-F 2020 |
| Notes to the Group Financial Statements | IHG | Annual Report and Form 20-F 2020 | 193 |
Group Financial Statements
Notes to the Group Financial Statements continued
29. Equity continued
Cash flow hedging reserve
| Cash flow hedging reserve | ||||||||||
| Value of currency swaps $m |
Costs of hedging $m |
Total $m | ||||||||
| At 1 January 2018 | – | – | – | |||||||
| Costs of hedging deferred and recognised in other comprehensive income | – | (1 | ) | (1) | ||||||
| Change in fair value of currency swaps recognised in other comprehensive income | 4 | – | 4 | |||||||
| Reclassified from other comprehensive income to profit or loss – included in financial expenses | (8) | – | (8) | |||||||
| Deferred tax | 1 | – | 1 | |||||||
| At 31 December 2018 | (3) | (1 | ) | (4) | ||||||
| Costs of hedging deferred and recognised in other comprehensive income | – | (6 | ) | (6) | ||||||
| Change in fair value of currency swaps recognised in other comprehensive income | (34) | – | (34) | |||||||
| Reclassified from other comprehensive income to profit or loss – included in financial expenses | 38 | – | 38 | |||||||
| At 31 December 2019 | 1 | (7 | ) | (6) | ||||||
| Costs of hedging deferred and recognised in other comprehensive income | – | (6 | ) | (6) | ||||||
| Change in fair value of currency swaps recognised in other comprehensive income | (1) | – | (1) | |||||||
| Reclassified from other comprehensive income to profit or loss – included in financial expenses | (13) | – | (13) | |||||||
| Deferred tax | 4 | – | 4 | |||||||
| Exchange adjustments | (2) | – | (2) | |||||||
| At 31 December 2020 | (11) | (13 | ) | (24) | ||||||
Value of currency swaps comprises the effective portion of the cumulative net change in the fair value of hedging instruments used in cash flow hedges pending subsequent recognition in profit or loss.
Costs of hedging reflects the gain or loss which is excluded from the designated hedging instrument relating to the foreign currency basis spread of currency swaps. It is initially recognised in other comprehensive income and accounted for similarly to changes in value of currency swaps.
Amounts reclassified from other comprehensive income to financial expenses comprise $9m (2019: $8m) net interest payable on the currency swaps and an exchange gain of $22m (2019: $30m loss) which offsets a corresponding loss/gain on the €500m 2.125% bonds and €500m 1.625% bonds (2019: €500m 2.125% bonds).
Currency translation reserve
This reserve records the movement in exchange differences arising from the translation of foreign operations and exchange differences on foreign currency borrowings and derivative financial instruments that provide a hedge against net investments in foreign operations. On adoption of IFRS, cumulative exchange differences were deemed to be $nil.
The fair value of derivative financial instruments designated as hedges of net investments in foreign operations outstanding at 31 December 2020 was $nil (2019: $1m asset, 2018: $1m asset).
Treasury shares
During 2020, 0.6m (2019: 0.8m, 2018: 0.8m) treasury shares were transferred to the employee share trusts. As a result of the 2019 share consolidation, the number of shares held in treasury reduced by 0.3m during 2019. At 31 December 2020, 5.1m shares (2019: 5.7m, 2018: 6.8m) with a nominal value of $1.4m (2019: $1.6m, 2018: $1.7m) were held as treasury shares at cost and deducted from retained earnings.
Non-controlling interest
A non-controlling interest is equity in a subsidiary of the Group not attributable, directly or indirectly, to the Group. Non-controlling interests are not material to the Group.
30. Capital and other commitments
| 2020 $m |
2019 $m | |||||||||
| Contracts placed for expenditure not provided for in the Group Financial Statements | ||||||||||
| Property, plant and equipment | 17 | 52 | ||||||||
| Intangible assets | 2 | 7 | ||||||||
| 19 | 59 | |||||||||
The Group has also committed to invest a further $6m (2019: $6m) in one of its associates.
| 194 | IHG | Annual Report and Form 20-F 2020 |
| Notes to the Group Financial Statements | IHG | Annual Report and Form 20-F 2020 | 195 |
Group Financial Statements
Notes to the Group Financial Statements continued
32. Related party disclosures
|
2020 $m |
2019 $m |
2018 $m | ||||||||||||||
| Total compensation of key management personnel |
||||||||||||||||
| Short-term employment benefits | 10.5 | 15.8 | 18.2 | |||||||||||||
| Contributions to defined contribution pension plans | 0.3 | 0.5 | 0.5 | |||||||||||||
| Equity compensation benefitsa | 2.3 | 12.1 | 13.0 | |||||||||||||
| 13.1 | 28.4 | 31.7 | ||||||||||||||
| a | As measured in accordance with IFRS 2. |
There were no other transactions with key management personnel during the years ended 31 December 2020, 2019 or 2018. Key management personnel comprises the Board and Executive Committee.
Related party disclosures for associates and joint ventures are as follows:
| Associates | Joint ventures | Total | ||||||||||||||||||||||||||||||||||||||||||||||||||||
|
2020 $m |
2019 $m |
2018 $m |
2020 $m |
2019 $m |
2018 $m |
2020 $m |
2019 $m |
2018 $m |
||||||||||||||||||||||||||||||||||||||||||||||
| Revenue from associates and joint ventures | 1 | 10 | 9 | – | – | 1 | 1 | 10 | 10 | |||||||||||||||||||||||||||||||||||||||||||||
| Other amounts owed by associates and joint ventures | 11 | 3 | 1 | – | – | – | 11 | 3 | 1 | |||||||||||||||||||||||||||||||||||||||||||||
| Amounts owed to associates and joint ventures | (4 | ) | (4 | ) | (2 | ) | – | – | – | (4 | ) | (4 | ) | (2 | ) | |||||||||||||||||||||||||||||||||||||||
The Group has provided a guarantee of $12m (2019: $12m) against the bank loan of one associate (see note 31) and has provided performance guarantees with a maximum pay-out remaining of $10m (2019: $10m) (see note 3).
The Group funds shortfalls in owner returns relating to the Barclay associate (see note 17). In addition, loans both to and from the Barclay associate of $237m (2019: $237m) are offset in accordance with the provisions of IAS 32 and presented net in the Group statement of financial position. Interest payable and receivable under the loans is equivalent (average interest rate of 0.8% in 2020 (2019: 2.1%)) and presented net in the Group income statement.
33. System Fund
System Fund revenues comprise:
|
2020 $m |
2019 $m |
2018 $m |
||||||||||||||||||
| Assessment fees and contributions received from hotels | 490 | 1,036 | 979 | |||||||||||||||||
| Loyalty programme revenues, net of the cost of point redemptions | 275 | 337 | 254 | |||||||||||||||||
| 765 | 1,373 | 1,233 | ||||||||||||||||||
System Fund expenses include:
|
2020 $m |
2019 $m |
2018 $m | ||||||||||||||
| Marketing | 109 | 461 | 427 | |||||||||||||
| Payroll costs (note 4) | 242 | 313 | 347 | |||||||||||||
| Depreciation and amortisation | 62 | 54 | 49 | |||||||||||||
| Impairment loss on financial assets (note 18) | 24 | 12 | 11 | |||||||||||||
| Other impairment charges | 41 | – | – | |||||||||||||
| 196 | IHG | Annual Report and Form 20-F 2020 |
| Notes to the Group Financial Statements | IHG | Annual Report and Form 20-F 2020 | 197 |
Group Financial Statements
Notes to the Group Financial Statements continued
34. Group companies continued
| 198 | IHG | Annual Report and Form 20-F 2020 |
| Notes to the Group Financial Statements | IHG | Annual Report and Form 20-F 2020 | 199 |
[THIS PAGE IS INTENTIONALLY LEFT BLANK]
| 200 | IHG | Annual Report and Form 20-F 2020 |
| IHG | Annual Report and Form 20-F 2020 | 201 |
[THIS PAGE IS INTENTIONALLY LEFT BLANK]
| 202 | IHG | Annual Report and Form 20-F 2020 |
| IHG | Annual Report and Form 20-F 2020 | 203 |
[THIS PAGE IS INTENTIONALLY LEFT BLANK]
| 204 | IHG | Annual Report and Form 20-F 2020 |
| IHG | Annual Report and Form 20-F 2020 | 205 |
[THIS PAGE IS INTENTIONALLY LEFT BLANK]
| 206 | IHG | Annual Report and Form 20-F 2020 |
| IHG | Annual Report and Form 20-F 2020 | 207 |
[THIS PAGE IS INTENTIONALLY LEFT BLANK]
| 208 | IHG | Annual Report and Form 20-F 2020 |
| IHG | Annual Report and Form 20-F 2020 | 209 |
Information
| 212 | ||
| 219 | ||
| 224 | ||
| 224 | ||
| 224 | ||
| 230 | ||
| 230 | ||
| 231 | ||
| 232 | ||
| 233 | ||
| 234 | ||
| 235 | ||
| 235 | ||
| 236 | ||
| 236 | ||
| 238 | ||
| 239 | ||
| 240 | ||
| 241 | ||
| 242 | ||
| 242 | ||
| 243 | ||
| 244 | ||
| 245 | ||
| 246 | ||
| 248 | ||
| 250 | ||
| 250 | ||
| 251 | ||
| 251 | ||
| Regent Shanghai Pudong, China | ||
| 210 | IHG | Annual Report and Form 20-F 2020 | |
Additional Information
Use of Non-GAAP measures
In addition to performance measures directly observable in the Group Financial Statements (IFRS measures), additional measures (described as Non-GAAP) are presented that are used internally by management as key measures to assess performance. Non-GAAP measures are either not defined under IFRS or are adjusted IFRS figures.

|
Further explanation in relation to these measures and their definitions can be found on pages 47 to 51. |
Revenue and operating profit Non-GAAP reconciliations
Highlights for the year ended 31 December 2020
Reportable segments
| Revenue | Operating profit | |||||||||||||||||||||||||||||||||||||||||||||||||||||||||||||
|
2020 $m |
2019 $ |
Change $m |
Change % |
2020 $m |
2019 $m |
Change $m |
Change % |
|||||||||||||||||||||||||||||||||||||||||||||||||||||||
| Per Group income statement | 2,394 | 4,627 | (2,233 | ) | (48.3 | ) | (153 | ) | 630 | (783 | ) | (124.3 | ) | |||||||||||||||||||||||||||||||||||||||||||||||||
| System Fund | (765 | ) | (1,373 | ) | 608 | (44.3 | ) | 102 | 49 | 53 | 108.2 | |||||||||||||||||||||||||||||||||||||||||||||||||||
| Reimbursement of costs | (637 | ) | (1,171 | ) | 534 | (45.6 | ) | – | – | – | – | |||||||||||||||||||||||||||||||||||||||||||||||||||
| Operating exceptional items | – | – | – | – | 270 | 186 | 84 | 45.2 | ||||||||||||||||||||||||||||||||||||||||||||||||||||||
| Reportable segments | 992 | 2,083 | (1,091 | ) | (52.4 | ) | 219 | 865 | (646 | ) | (74.7 | ) | ||||||||||||||||||||||||||||||||||||||||||||||||||
| Reportable segments analysed as: |
||||||||||||||||||||||||||||||||||||||||||||||||||||||||||||||
| Fee business | 823 | 1,510 | (687 | ) | (45.5 | ) | 278 | 813 | (535 | ) | (65.8 | ) | ||||||||||||||||||||||||||||||||||||||||||||||||||
| Owned, leased and managed lease | 169 | 573 | (404 | ) | (70.5 | ) | (59 | ) | 52 | (111 | ) | (213.5 | ) | |||||||||||||||||||||||||||||||||||||||||||||||||
| 992 | 2,083 | (1,091 | ) | (52.4 | ) | 219 | 865 | (646 | ) | (74.7 | ) | |||||||||||||||||||||||||||||||||||||||||||||||||||
|
Underlying revenue and underlying operating profit |
||||||||||||||||||||||||||||||||||||||||||||||||||||||||||||||
| Revenue | Operating profit | |||||||||||||||||||||||||||||||||||||||||||||||||||||||||||||
| 2020 $m |
2019 $m |
Change $m |
Change % |
2020 $m |
2019 $m |
Change $m |
Change % |
|||||||||||||||||||||||||||||||||||||||||||||||||||||||
| Reportable segments (see above) | 992 | 2,083 | (1,091 | ) | (52.4 | ) | 219 | 865 | (646 | ) | (74.7 | ) | ||||||||||||||||||||||||||||||||||||||||||||||||||
| Significant liquidated damages | (1 | ) | (11 | ) | 10 | (90.9 | ) | (1 | ) | (11 | ) | 10 | (90.9 | ) | ||||||||||||||||||||||||||||||||||||||||||||||||
| Owned asset disposalsa | (2 | ) | (12 | ) | 10 | (83.3 | ) | (3 | ) | (2 | ) | (1 | ) | 50.0 | ||||||||||||||||||||||||||||||||||||||||||||||||
| Currency impact | – | – | – | – | – | (2 | ) | – | – | |||||||||||||||||||||||||||||||||||||||||||||||||||||
| Underlying revenue and underlying operating profit | 989 | 2,060 | (1,071 | ) | (52.0 | ) | 215 | 850 | (635 | ) | (74.7 | %) | ||||||||||||||||||||||||||||||||||||||||||||||||||
| a | The results of the Holiday Inn Melbourne Airport have been removed in 2020 (being the year of disposal) and the prior year to determine underlying growth compared to the prior year. |
Underlying fee revenue
| Revenue | ||||||||||||||||||||||||||||||
|
2020 $m |
2019 $m |
Change $m |
Change % |
|||||||||||||||||||||||||||
| Reportable segments fee business (see above) | 823 | 1,510 | (687 | ) | (45.5 | ) | ||||||||||||||||||||||||
| Significant liquidated damages | (1 | ) | (11 | ) | 10 | (90.9 | ) | |||||||||||||||||||||||
| Currency impact | – | (4 | ) | 4 | – | |||||||||||||||||||||||||
| Underlying fee revenue | 822 | 1,495 | (673 | ) | (45.0 | )ª | ||||||||||||||||||||||||
| a | Reported as a KPI on page 44. |
| 212 | IHG | Annual Report and Form 20-F 2020 |
| Other financial information | IHG | Annual Report and Form 20-F 2020 | 213 |
Additional Information
Other financial information continued
Highlights for the year ended 31 December 2019
Reportable segments
| Revenue | Operating profit | |||||||||||||||||||||||||||||||||||||||||||||||||||||||||||||||
|
2019 $m |
2018 $m |
Change $m |
Change % |
2019 $m |
2018 $m |
Change $m |
Change % |
|||||||||||||||||||||||||||||||||||||||||||||||||||||||||
| Per Group income statement | 4,627 | 4,337 | 290 | 6.7 | 630 | 582 | 48 | 8.2 | ||||||||||||||||||||||||||||||||||||||||||||||||||||||||
| System Fund | (1,373 | ) | (1,233 | ) | (140 | ) | 11.4 | 49 | 146 | (97 | ) | (66.4 | ) | |||||||||||||||||||||||||||||||||||||||||||||||||||
| Reimbursement of costs | (1,171 | ) | (1,171 | ) | – | – | – | – | – | – | ||||||||||||||||||||||||||||||||||||||||||||||||||||||
| Operating exceptional items | – | – | – | – | 186 | 104 | 82 | 78.8 | ||||||||||||||||||||||||||||||||||||||||||||||||||||||||
| Reportable segments | 2,083 | 1,933 | 150 | 7.8 | 865 | 832 | 33 | 4.0 | ||||||||||||||||||||||||||||||||||||||||||||||||||||||||
| Reportable segments analysed as: |
||||||||||||||||||||||||||||||||||||||||||||||||||||||||||||||||
| Fee business | 1,510 | 1,486 | 24 | 1.6 | 813 | 793 | 20 | 2.5 | ||||||||||||||||||||||||||||||||||||||||||||||||||||||||
| Owned, leased and managed lease | 573 | 447 | 126 | 28.2 | 52 | 39 | 13 | 33.3 | ||||||||||||||||||||||||||||||||||||||||||||||||||||||||
| 2,083 | 1,933 | 150 | 7.8 | 865 | 832 | 33 | 4.0 | |||||||||||||||||||||||||||||||||||||||||||||||||||||||||
Underlying fee revenue
| Revenue | ||||||||||||||||||||||||||||||||
|
2019 $m |
2018 $m |
Change $m |
Change % |
|||||||||||||||||||||||||||||
| Reportable segments fee business (see above) | 1,510 | 1,486 | 24 | 1.6 | ||||||||||||||||||||||||||||
| Significant liquidated damages | (11 | ) | (13 | ) | 2 | (15.4 | ) | |||||||||||||||||||||||||
| Acquisitionsa | (14 | ) | – | (14 | ) | – | ||||||||||||||||||||||||||
| Currency impact | – | (17 | ) | 17 | – | |||||||||||||||||||||||||||
| Underlying fee revenue | 1,485 | 1,456 | 29 | 2.0 | b | |||||||||||||||||||||||||||
| a | The results of acquired businesses (Six Senses and two UK portfolio hotels) are removed only in the year of acquisition when determining underlying growth compared to the prior year. |
| b | Reported as a KPI on page 44. |
Highlights for the year ended 31 December 2018
Reportable segments
| Revenue | Operating profit | |||||||||||||||||||||||||||||||||||||||||||||||||||||||||||||||
|
2018 $m |
2017 $m |
Change $m |
Change % |
2018 $m |
2017 $m |
Change $m |
Change % |
|||||||||||||||||||||||||||||||||||||||||||||||||||||||||
| Per Group income statement | 4,337 | 4,075 | 262 | 6.4 | 582 | 744 | (162 | ) | (21.8 | ) | ||||||||||||||||||||||||||||||||||||||||||||||||||||||
| System Fund | (1,233 | ) | (1,242 | ) | 9 | (0.7 | ) | 146 | 34 | 112 | 329.4 | |||||||||||||||||||||||||||||||||||||||||||||||||||||
| Reimbursement of costs | (1,171 | ) | (1,103 | ) | (68 | ) | 6.2 | – | – | – | – | |||||||||||||||||||||||||||||||||||||||||||||||||||||
| Operating exceptional items | – | – | – | – | 104 | (4 | ) | 108 | (2,700.0 | ) | ||||||||||||||||||||||||||||||||||||||||||||||||||||||
| Reportable segments | 1,933 | 1,730 | 203 | 11.7 | 832 | 774 | 58 | 7.5 | ||||||||||||||||||||||||||||||||||||||||||||||||||||||||
| Reportable segments analysed as: |
||||||||||||||||||||||||||||||||||||||||||||||||||||||||||||||||
| Fee business | 1,486 | 1,379 | 107 | 7.8 | 793 | 731 | 62 | 8.5 | ||||||||||||||||||||||||||||||||||||||||||||||||||||||||
| Owned, leased and managed lease | 447 | 351 | 96 | 27.4 | 39 | 43 | (4 | ) | (9.3 | ) | ||||||||||||||||||||||||||||||||||||||||||||||||||||||
| 1,933 | 1,730 | 203 | 11.7 | 832 | 774 | 58 | 7.5 | |||||||||||||||||||||||||||||||||||||||||||||||||||||||||
Underlying fee revenue
| Revenue | ||||||||||||||||||||||||||||||||
|
2018 $m |
2017 $m |
Change $m |
Change % |
|||||||||||||||||||||||||||||
| Reportable segments fee business (see above) | 1,486 | 1,379 | 107 | 7.8 | ||||||||||||||||||||||||||||
| Significant liquidated damages | (13 | ) | – | (13 | ) | – | ||||||||||||||||||||||||||
| Acquisitionsa | (1 | ) | – | (1 | ) | – | ||||||||||||||||||||||||||
| Currency impact | – | 4 | (4 | ) | – | |||||||||||||||||||||||||||
| Underlying fee revenue | 1,472 | 1,383 | 89 | 6.4 | b | |||||||||||||||||||||||||||
| a | The results of acquired businesses (Regent and the UK portfolio) are removed only in the year of acquisition when determining underlying growth compared to the prior year. |
| b | Reported as a KPI on page 44. |
| 214 | IHG | Annual Report and Form 20-F 2020 |
| Other financial information | IHG | Annual Report and Form 20-F 2020 | 215 |
Additional Information
Other financial information continued
Free cash flow reconciliation
| 12 months ended 31 December | ||||||||||||||||||||||||||||||||||||||||
| |
2020 $m |
|
|
2019 $m |
|
|
2018 $m |
|
|
2017 $m |
|
|
2016 $m |
ª
| ||||||||||||||||||||||||||
| Net cash from operating activities | 137 | 653 | 709 | 616 | 710 | |||||||||||||||||||||||||||||||||||
| Adjusted for: | ||||||||||||||||||||||||||||||||||||||||
| Payment of contingent purchase consideration |
– | 6 | – | – | – | |||||||||||||||||||||||||||||||||||
| Principal element of lease payments |
(65 | ) | (59 | ) | (35 | ) | (25 | ) | – | |||||||||||||||||||||||||||||||
| Purchase of shares by employee share trusts |
– | (5 | ) | (3 | ) | (3 | ) | (10 | ) | |||||||||||||||||||||||||||||||
| Capital expenditure: maintenance (excluding contract acquisition costs) |
(43 | ) | (86 | ) | (60 | ) | (72 | ) | (54 | ) | ||||||||||||||||||||||||||||||
| Cash receipt from renegotiation of long-term partnership agreement |
– | – | – | – | (95 | ) | ||||||||||||||||||||||||||||||||||
| Free cash flowb | 29 | 509 | 611 | 516 | 551 | |||||||||||||||||||||||||||||||||||
| a | Does not include the impact of IFRS 15 or IFRS 16. |
| b | Reported as a KPI on page 45. |
Adjusted interest reconciliation
| 12 months ended 31 December |
||||||||||||||||
|
2020 $m |
2019 $m |
|||||||||||||||
| Net financial expenses | ||||||||||||||||
| Financial income | 4 | 6 | ||||||||||||||
| Financial expenses | (144 | ) | (121 | ) | ||||||||||||
| (140 | ) | (115 | ) | |||||||||||||
| Adjusted for: | ||||||||||||||||
| Interest payable on balances with the System Fund |
(3 | ) | (13 | ) | ||||||||||||
| Capitalised interest relating to System Fund assets |
(1 | ) | (5 | ) | ||||||||||||
| Exceptional financial expenses |
14 | – | ||||||||||||||
| 10 | (18 | ) | ||||||||||||||
| Adjusted interest | (130 | ) | (133 | ) | ||||||||||||
Adjusted EBITDAª reconciliation
|
2020 $m |
2019 $m |
2018 $m |
||||||||||||||||||||||
| Operating profit | (153 | ) | 630 | 582 | ||||||||||||||||||||
| Add back | ||||||||||||||||||||||||
| System Fund result |
102 | 49 | 146 | |||||||||||||||||||||
| Operating exceptional items |
270 | 186 | 104 | |||||||||||||||||||||
| Depreciation and amortisation |
110 | 116 | 115 | |||||||||||||||||||||
| Adjusted EBITDA | 329 | 981 | 947 | |||||||||||||||||||||
| a | For covenant purposes, calculated on a frozen GAAP basis, adjusted EBITDA is $272m (2019: $897m). |
| 216 | IHG | Annual Report and Form 20-F 2020 |
| Other financial information | IHG | Annual Report and Form 20-F 2020 | 217 |
Additional Information
Other financial information continued
RevPAR, average daily rate and occupancy continued
| Fee business | Owned, leased and managed lease |
|||||||||||||||||||||||||||||||
| 2020 | Change vs 2019 |
2020 | Change vs 2019 |
|||||||||||||||||||||||||||||
| EMEAA | ||||||||||||||||||||||||||||||||
| InterContinental | ||||||||||||||||||||||||||||||||
| Occupancy | 31.9% | (40.5)ppt | 24.5% | (49.7)ppt | ||||||||||||||||||||||||||||
| Average daily rate | $157.63 | (20.2)% | $304.25 | 0.6% | ||||||||||||||||||||||||||||
| RevPAR | $50.34 | (64.8)% | $74.65 | (66.7)% | ||||||||||||||||||||||||||||
| Crowne Plaza | ||||||||||||||||||||||||||||||||
| Occupancy | 30.2% | (43.5)ppt | – | – | ||||||||||||||||||||||||||||
| Average daily rate | $105.13 | (13.4)% | – | – | ||||||||||||||||||||||||||||
| RevPAR | $31.72 | (64.5)% | – | – | ||||||||||||||||||||||||||||
| Hotel Indigo | ||||||||||||||||||||||||||||||||
| Occupancy | 27.8% | (51.1)ppt | – | – | ||||||||||||||||||||||||||||
| Average daily rate | $107.49 | (25.3)% | – | – | ||||||||||||||||||||||||||||
| RevPAR | $29.90 | (73.7)% | – | – | ||||||||||||||||||||||||||||
| Holiday Inn | ||||||||||||||||||||||||||||||||
| Occupancy | 31.9% | (41.6)ppt | – | – | ||||||||||||||||||||||||||||
| Average daily rate | $80.88 | (17.8)% | – | – | ||||||||||||||||||||||||||||
| RevPAR | $25.80 | (64.3)% | – | – | ||||||||||||||||||||||||||||
| Holiday Inn Express | ||||||||||||||||||||||||||||||||
| Occupancy | 35.4% | (41.9)ppt | – | – | ||||||||||||||||||||||||||||
| Average daily rate | $67.29 | (22.4)% | – | – | ||||||||||||||||||||||||||||
| RevPAR | $23.85 | (64.5)% | – | – | ||||||||||||||||||||||||||||
| Staybridge Suites | ||||||||||||||||||||||||||||||||
| Occupancy | 41.4% | (30.2)ppt | – | – | ||||||||||||||||||||||||||||
| Average daily rate | $114.94 | (7.7)% | – | – | ||||||||||||||||||||||||||||
| RevPAR | $47.61 | (46.6)% | – | – | ||||||||||||||||||||||||||||
| Greater China | ||||||||||||||||||||||||||||||||
| InterContinental | ||||||||||||||||||||||||||||||||
| Occupancy | 45.1% | (18.7)ppt | – | – | ||||||||||||||||||||||||||||
| Average daily rate | $103.33 | (10.6)% | – | – | ||||||||||||||||||||||||||||
| RevPAR | $46.64 | (36.8)% | – | – | ||||||||||||||||||||||||||||
| HUALUXE | ||||||||||||||||||||||||||||||||
| Occupancy | 44.6% | (6.8)ppt | – | – | ||||||||||||||||||||||||||||
| Average daily rate | $58.78 | (8.2)% | – | – | ||||||||||||||||||||||||||||
| RevPAR | $26.24 | (20.4)% | – | – | ||||||||||||||||||||||||||||
| Crowne Plaza | ||||||||||||||||||||||||||||||||
| Occupancy | 40.6% | (18.3)ppt | – | – | ||||||||||||||||||||||||||||
| Average daily rate | $67.84 | (10.7)% | – | – | ||||||||||||||||||||||||||||
| RevPAR | $27.54 | (38.4)% | – | – | ||||||||||||||||||||||||||||
| Hotel Indigo | ||||||||||||||||||||||||||||||||
| Occupancy | 42.7% | (19.9)ppt | – | – | ||||||||||||||||||||||||||||
| Average daily rate | $108.63 | (17.8)% | – | – | ||||||||||||||||||||||||||||
| RevPAR | $46.34 | (44.0)% | – | – | ||||||||||||||||||||||||||||
| Holiday Inn | ||||||||||||||||||||||||||||||||
| Occupancy | 39.6% | (22.8)ppt | – | – | ||||||||||||||||||||||||||||
| Average daily rate | $52.50 | (16.4)% | – | – | ||||||||||||||||||||||||||||
| RevPAR | $20.80 | (46.9)% | – | – | ||||||||||||||||||||||||||||
| Holiday Inn Express | ||||||||||||||||||||||||||||||||
| Occupancy | 43.4% | (17.7)ppt | – | – | ||||||||||||||||||||||||||||
| Average daily rate | $37.18 | (16.5)% | – | – | ||||||||||||||||||||||||||||
| RevPAR | $16.14 | (40.6)% | – | – | ||||||||||||||||||||||||||||
| 218 | IHG | Annual Report and Form 20-F 2020 |
| Directors’ Report | IHG | Annual Report and Form 20-F 2020 | 219 |
Additional Information
Directors’ Report continued
| 220 | IHG | Annual Report and Form 20-F 2020 |
| Directors’ Report | IHG | Annual Report and Form 20-F 2020 | 221 |
Additional Information
Directors’ Report continued
| 222 | IHG | Annual Report and Form 20-F 2020 |
| Directors’ Report | IHG | Annual Report and Form 20-F 2020 | 223 |
| Group information | IHG | Annual Report and Form 20-F 2020 | 225 |
Additional Information
Group information continued
Risk factors continued
| 226 | IHG | Annual Report and Form 20-F 2020 |
| Group information | IHG | Annual Report and Form 20-F 2020 | 227 |
Additional Information
Group information continued
Risk factors continued
| 228 | IHG | Annual Report and Form 20-F 2020 |
| Group information | IHG | Annual Report and Form 20-F 2020 | 229 |
Additional Information
Group information continued
Directors’ and Executive Committee members’ shareholdings
As at 22 February 2021: (i) Executive Directors had the number of beneficial interests in shares (including Directors’ share awards under IHG’s share plans) set out in the table on page 105; (ii) Non-Executive Directors had the number of beneficial interests in shares set out in the table on page 110; and (iii) Executive Committee members had the number of beneficial interests in shares (including members’ share awards under IHG’s share plans) set out in the table below. These shareholdings indicate all Directors’ or Executive Committee members’ beneficial interests and those held by their spouses and other connected persons. As at 22 February 2021, no Director or Executive Committee member held more than 1.0% of the total issued share capital. None of the Directors have a beneficial interest in the shares of any subsidiary.
| Number of shares held outright | APP deferred share awards | LTIP share awards (unvested) | Total number of shares held | |||||||||||||||||||||||||||||||||||||||||||||||||||||||||||||||||||||
| Executive Committee |
22 Feb 2021 |
31 Dec 2020 |
31 Dec 2019 |
22 Feb 2021 |
31 Dec 2020 |
31 Dec 2019 |
22 Feb 2021 |
31 Dec 2020 |
31 Dec 2019 |
22 Feb 2021 |
31 Dec 2020 |
31 Dec 2019 |
||||||||||||||||||||||||||||||||||||||||||||||||||||||||||||
| Keith Barr | 70,279 | 70,279 | 52,832 | 37,705 | 37,705 | 32,697 | 119,227 | 119,227 | 102,537 | 227,211 | 227,211 | 188,066 | ||||||||||||||||||||||||||||||||||||||||||||||||||||||||||||
| Paul Edgecliffe- Johnson | 53,376 | 53,376 | 38,562 | 26,751 | 26,751 | 25,637 | 86,479 | 86,479 | 76,150 | 166,606 | 166,606 | 140,349 | ||||||||||||||||||||||||||||||||||||||||||||||||||||||||||||
| Elie Maalouf | 67,428 | 67,428 | 43,652 | 25,417 | 25,417 | 32,591 | 88,691 | 88,691 | 74,695 | 181,536 | 181,536 | 150,938 | ||||||||||||||||||||||||||||||||||||||||||||||||||||||||||||
| Claire Bennett | 16,521 | 16,521 | 9,152 | 14,379 | 14,379 | 8,494 | 55,340 | 55,340 | 44,675 | 86,240 | 86,240 | 62,321 | ||||||||||||||||||||||||||||||||||||||||||||||||||||||||||||
| Jolyon Bulley | 57,939 | 57,939 | 52,164 | 11,787 | 11,787 | 7,891 | 51,624 | 51,624 | 38,216 | 121,350 | 121,350 | 98,271 | ||||||||||||||||||||||||||||||||||||||||||||||||||||||||||||
| Yasmin Diamond | 7,581 | 7,581 | 2,354 | 11,016 | 11,016 | 9,491 | 36,887 |
|
36,887 |
|
30,331 | 55,484 | 55,484 | 42,176 | ||||||||||||||||||||||||||||||||||||||||||||||||||||||||||
| Nicolette Henfrey | 4,528 | 4,528 | 1,528 | 6,621 | 6,621 | 5,077 | 32,939 | 32,939 | 21,239 | 44,088 | 44,088 | 27,844 | ||||||||||||||||||||||||||||||||||||||||||||||||||||||||||||
| Wayne Hoare | 0 | 0 | n/a | 1 | 4,666 | 4,666 | n/a | 1 | 22,653 | 22,653 | n/a | 1 | 27,319 | 27,319 | n/a | 1 | ||||||||||||||||||||||||||||||||||||||||||||||||||||||||
| Kenneth Macpherson | 30,160 | 30,160 | 14,145 | 18,557 | 18,557 | 31,186 | 54,789 | 54,789 | 46,670 | 103,506 | 103,506 | 92,001 | ||||||||||||||||||||||||||||||||||||||||||||||||||||||||||||
| Ranjay Radhakrishnan | n/a | 2 | n/a | 2 | 22,128 | n/a | 2 | n/a | 2 | 16,874 | n/a | 2 | n/a | 2 | 48,498 | n/a | 2 | n/a | 2 | 87,500 | ||||||||||||||||||||||||||||||||||||||||||||||||||||
| George Turner | 27,951 | 27,951 | 17,983 | 18,151 | 18,151 | 17,288 | 55,848 | 55,848 | 46,691 | 101,950 | 101,950 | 81,962 | ||||||||||||||||||||||||||||||||||||||||||||||||||||||||||||
| 1 | Wayne Hoare joined the Company on 14 September 2020. |
| 2 | Ranjay Radhakrishnan left the Company on 29 February 2020. |
Executive Directors’ benefits upon termination of office
All current Executive Directors have a rolling service contract with a notice period from the Group of 12 months. As an alternative, the Group may, at its discretion, pay in lieu of that notice. Neither notice nor a payment in lieu of notice will be given in the event of gross misconduct.
Payment in lieu of notice could potentially include up to 12 months’ salary and the cash equivalent of 12 months’ pension contributions, and other contractual benefits. Where possible, the Group will seek to ensure that, where a leaver mitigates their losses by, for example, finding new employment, there will accordingly be a corresponding reduction in compensation payable for loss of office.

|
Further details on the policy for determination of termination payments are included in the Directors’ Remuneration Policy, which is available on IHG’s website at www.ihgplc.com/investors under Corporate governance in the Directors’ Remuneration Policy section. |
| 230 | IHG | Annual Report and Form 20-F 2020 |
| Group information | IHG | Annual Report and Form 20-F 2020 | 231 |
| Group information | IHG | Annual Report and Form 20-F 2020 | 233 |
| Group information | IHG | Annual Report and Form 20-F 2020 | 235 |
| Shareholder information | IHG | Annual Report and Form 20-F 2020 | 237 |
| Shareholder information | IHG | Annual Report and Form 20-F 2020 | 239 |
Additional Information
Shareholder information continued
Selected five-year consolidated financial information
Group income statement data
| $m, except earnings per ordinary share | ||||||||||||||||||||||||||||||||||||||||
| For the year ended 31 December | 2020 | 2019 | 2018 | 2017 | 2016 | |||||||||||||||||||||||||||||||||||
| Total revenue | 2,394 | 4,627 | 4,337 | 4,075 | 3,912 | |||||||||||||||||||||||||||||||||||
| Operating profit before System Fund and exceptional items | 219 | 865 | 832 | 774 | 706 | |||||||||||||||||||||||||||||||||||
| System Fund | (102) | (49) | (146) | (34) | 35 | |||||||||||||||||||||||||||||||||||
| Operating exceptional items | (270) | (186) | (104) | 4 | (29) | |||||||||||||||||||||||||||||||||||
| Operating (loss)/profit | (153) | 630 | 582 | 744 | 712 | |||||||||||||||||||||||||||||||||||
| Financial income | 4 | 6 | 5 | 4 | 6 | |||||||||||||||||||||||||||||||||||
| Financial expenses | (144) | (121) | (101) | (95) | (86) | |||||||||||||||||||||||||||||||||||
| Fair value gains/(losses) on contingent purchase consideration | 13 | 27 | (4) | – | – | |||||||||||||||||||||||||||||||||||
| (Loss)/profit before tax | (280) | 542 | 482 | 653 | 632 | |||||||||||||||||||||||||||||||||||
| Tax: | ||||||||||||||||||||||||||||||||||||||||
| On profit before exceptional items |
(32) | (176) | (159) | (203) | (185) | |||||||||||||||||||||||||||||||||||
| On exceptional items |
52 | 20 | 22 | (2) | 12 | |||||||||||||||||||||||||||||||||||
| Exceptional tax |
– | – | 5 | 87 | – | |||||||||||||||||||||||||||||||||||
| 20 | (156) | (132) | (118) | (173) | ||||||||||||||||||||||||||||||||||||
| (Loss)/profit for the year from continuing operations: | (260) | 386 | 350 | 535 | 459 | |||||||||||||||||||||||||||||||||||
| Attributable to: |
||||||||||||||||||||||||||||||||||||||||
| Equity holders of the parent |
(260) | 385 | 349 | 534 | 456 | |||||||||||||||||||||||||||||||||||
| Non-controlling interest |
– | 1 | 1 | 1 | 3 | |||||||||||||||||||||||||||||||||||
| (Loss)/earnings per ordinary share (continuing and total operations): | ||||||||||||||||||||||||||||||||||||||||
| Basic |
(142.9)¢ | 210.4¢ | 183.7¢ | 276.7¢ | 215.1¢ | |||||||||||||||||||||||||||||||||||
| Diluted |
(142.9)¢ | 209.2¢ | 181.8¢ | 275.3¢ | 213.1¢ | |||||||||||||||||||||||||||||||||||
|
Group statement of financial position data
|
||||||||||||||||||||||||||||||||||||||||
| $m, except number of shares |
||||||||||||||||||||||||||||||||||||||||
| 2019 | 2018 | |||||||||||||||||||||||||||||||||||||||
| For the year ended 31 December | 2020 | Restated | a | Restated | a | 2017 | 2016 | |||||||||||||||||||||||||||||||||
| Goodwill and other intangible assets | 1,293 | 1,376 | 1,143 | 967 | 858 | |||||||||||||||||||||||||||||||||||
| Property, plant and equipment and right-of-use assets | 504 | 799 | 786 | 736 | 419 | |||||||||||||||||||||||||||||||||||
| Investments and other financial assets | 249 | 394 | 364 | 369 | 359 | |||||||||||||||||||||||||||||||||||
| Non-current trade and other receivables | – | – | – | – | 8 | |||||||||||||||||||||||||||||||||||
| Retirement benefit assets | – | – | – | 3 | – | |||||||||||||||||||||||||||||||||||
| Non-current derivative financial instruments | 5 | – | 7 | – | – | |||||||||||||||||||||||||||||||||||
| Deferred compensation plan investments | 236 | 218 | 193 | – | – | |||||||||||||||||||||||||||||||||||
| Non-current tax receivable | 15 | 28 | 31 | 16 | 23 | |||||||||||||||||||||||||||||||||||
| Deferred tax assets | 113 | 66 | 63 | 78 | 69 | |||||||||||||||||||||||||||||||||||
| Non-current contract costs | 70 | 67 | 55 | 51 | 45 | |||||||||||||||||||||||||||||||||||
| Non-current contract assets | 311 | 311 | 270 | 241 | 185 | |||||||||||||||||||||||||||||||||||
| Current assets | 2,243 | 916 | 1,373 | 861 | 796 | |||||||||||||||||||||||||||||||||||
| Assets classified as held for sale | – | 19 | – | – | – | |||||||||||||||||||||||||||||||||||
| Total assets | 5,039 | 4,194 | 4,285 | 3,322 | 2,762 | |||||||||||||||||||||||||||||||||||
| Current liabilities | 1,867 | 1,365 | 1,407 | 1,306 | 1,150 | |||||||||||||||||||||||||||||||||||
| Long-term debt including lease liabilities | 3,314 | 2,673 | 2,525 | 2,267 | 1,606 | |||||||||||||||||||||||||||||||||||
| Liabilities classified as held for sale | – | 22 | – | – | – | |||||||||||||||||||||||||||||||||||
| Net liabilities | (1,849) | (1,465 | ) | (1,131 | ) | (1,354 | ) | (1,146 | ) | |||||||||||||||||||||||||||||||
| Equity share capital | 156 | 151 | 146 | 154 | 141 | |||||||||||||||||||||||||||||||||||
| IHG shareholders’ equity | (1,857) | (1,473 | ) | (1,139 | ) | (1,361 | ) | (1,154 | ) | |||||||||||||||||||||||||||||||
| Number of shares in issue at end of the year (millions) | 187 | 187 | 197 | 197 | 206 | |||||||||||||||||||||||||||||||||||
| a | Restated for the recognition of the Group’s deferred compensation assets and liabilities (see pages 134 of the Group Financial Statements for further details). |
| 240 | IHG | Annual Report and Form 20-F 2020 |
| Shareholder information | IHG | Annual Report and Form 20-F 2020 | 241 |
Additional Information
Shareholder information continued
Purchases of equity securities by the Company
and affiliated purchasers
During the financial year ended 31 December 2020, no ordinary shares were purchased by the Company or the Company’s employee share ownership trust.
| Total number of shares (or units) purchased |
Average price paid per share (or unit) (£) |
Total number of shares (or units) purchased as part of publicly announced plans or programmes |
Maximum number of shares (or units) that may be purchased under the plans or programmes |
|||||||||||||||||||||
| Month 1 (no purchases this month) | nil | nil | nil | 18,123,205 | a | |||||||||||||||||||
| Month 2 (no purchases this month) | nil | nil | nil | 18,123,205 | a | |||||||||||||||||||
| Month 3 (no purchases this month) | nil | nil | nil | 18,123,205 | a | |||||||||||||||||||
| Month 4 (no purchases this month) | nil | nil | nil | 18,123,205 | a | |||||||||||||||||||
| Month 5 (no purchases this month) | nil | nil | nil | 18,265,631 | b | |||||||||||||||||||
| Month 6 (no purchases this month) | nil | nil | nil | 18,265,631 | b | |||||||||||||||||||
| Month 7 (no purchases this month) | nil | nil | nil | 18,265,631 | b | |||||||||||||||||||
| Month 8 (no purchases this month) | nil | nil | nil | 18,265,631 | b | |||||||||||||||||||
| Month 9 (no purchases this month) | nil | nil | nil | 18,265,631 | b | |||||||||||||||||||
| Month 10 (no purchases this month) | nil | nil | nil | 18,265,631 | b | |||||||||||||||||||
| Month 11 (no purchases this month) | nil | nil | nil | 18,265,631 | b | |||||||||||||||||||
| Month 12 (no purchases this month) | nil | nil | nil | 18,265,631 | b | |||||||||||||||||||
| a | Reflects the resolution passed at the Company’s AGM held on 3 May 2019. |
| b | Reflects the resolution passed at the Company’s AGM held on 7 May 2020. |
The table below sets forth the amounts of ordinary dividends on each ordinary share and special dividends, in respect of each financial year indicated.
| Interim dividend | Final dividend |
Total dividend |
Special dividend | |||||||||||||||||||||||||||||||||||||||||||||||||||||||||||||
| pence | cents | pence | cents | pence | cents | pence | cents | |||||||||||||||||||||||||||||||||||||||||||||||||||||||||
| 2020 | – | – | – | – | – | – | – | – | ||||||||||||||||||||||||||||||||||||||||||||||||||||||||
| 2019 | 32.0 | 39.9 | – | a | – | a | 32.0 | 39.9 | – | – | ||||||||||||||||||||||||||||||||||||||||||||||||||||||
| 2018 | 27.7 | 36.3 | 60.4 | 78.1 | 88.1 | 114.4 | 203.8 | bd | 262.1 | bd | ||||||||||||||||||||||||||||||||||||||||||||||||||||||
| 2017 | 24.4 | 33.0 | 50.2 | 71.0 | 74.6 | 104.0 | 156.4 | b | 202.5 | b | ||||||||||||||||||||||||||||||||||||||||||||||||||||||
| 2016 | 22.6 | 30.0 | 49.4 | 64.0 | 72.0 | 94.0 | 438.2 | b | 632.9 | b | ||||||||||||||||||||||||||||||||||||||||||||||||||||||
| 2015 | 17.7 | 27.5 | 40.3 | 57.5 | 58.0 | 85.0 | – | – | ||||||||||||||||||||||||||||||||||||||||||||||||||||||||
| 2014 | 14.8 | 25.0 | 33.8 | 52.0 | 48.6 | 77.0 | 174.9 | b | 293.0 | b | ||||||||||||||||||||||||||||||||||||||||||||||||||||||
| 2013 | 15.1 | 23.0 | 28.1 | 47.0 | 43.2 | 70.0 | 87.1 | 133.0 | ||||||||||||||||||||||||||||||||||||||||||||||||||||||||
| 2012 | 13.5 | 21.0 | 27.7 | 43.0 | 41.2 | 64.0 | 108.4 | b | 172.0 | b | ||||||||||||||||||||||||||||||||||||||||||||||||||||||
| 2011 | 9.8 | 16.0 | 24.7 | 39.0 | 34.5 | 55.0 | – | – | ||||||||||||||||||||||||||||||||||||||||||||||||||||||||
| 2010 | 8.0 | 12.8 | 22.0 | 35.2 | 30.0 | 48.0 | – | – | ||||||||||||||||||||||||||||||||||||||||||||||||||||||||
| 2009 | 7.3 | 12.2 | 18.7 | 29.2 | 26.0 | 41.4 | – | – | ||||||||||||||||||||||||||||||||||||||||||||||||||||||||
| 2008c | 6.4 | 12.2 | 20.2 | 29.2 | 26.6 | 41.4 | – | – | ||||||||||||||||||||||||||||||||||||||||||||||||||||||||
| 2007 | 5.7 | 11.5 | 14.9 | 29.2 | 20.6 | 40.7 | 200 | b | – | |||||||||||||||||||||||||||||||||||||||||||||||||||||||
| 2006 | 5.1 | 9.6 | 13.3 | 25.9 | 18.4 | 35.5 | 118 | b | – | |||||||||||||||||||||||||||||||||||||||||||||||||||||||
| a | The Board withdrew its recommendation of a final dividend in respect of 2019 of 85.9 ¢ per share. The Board will continue to defer consideration of further dividends until visibility of the pace and scale of market recovery has improved. |
| b | Accompanied by a share consolidation. |
| c | IHG changed the reporting currency of its Consolidated Financial Statements from sterling to US dollars effective from the Half-Year Results as at 30 June 2008. Starting with the interim dividend for 2008, all dividends have first been determined in US dollars and converted into sterling prior to payment. |
| d | This special dividend was announced on 19 October 2018 and paid on 29 January 2019. |
| 242 | IHG | Annual Report and Form 20-F 2020 |
| Shareholder profiles | IHG | Annual Report and Form 20-F 2020 | 243 |
Additional Information
The following exhibits are filed as part of this Annual Report on Form 20-F with the SEC, and are publicly available through the SEC’s website at www.sec.gov, search InterContinental Hotels Group PLC, under Company Filings.
| a | Incorporated by reference. |
| 244 | IHG | Annual Report and Form 20-F 2020 |
| Exhibits | IHG | Annual Report and Form 20-F 2020 | 245 |
Additional Information
Form 20-F cross-reference guide
| Item | Form 20-F caption | Location in this document | Page | |||||||||||
|
|
|
|
| |||||||||||
| 1 | Identity of Directors, senior management and advisers | Not applicable | – | |||||||||||
|
|
|
|
| |||||||||||
| 2 | Offer statistics and expected timetable | Not applicable | – | |||||||||||
|
|
|
|
| |||||||||||
| 3 | Key information | |||||||||||||
|
|
|
| ||||||||||||
| 3A – Selected financial data | Shareholder information: Selected five-year consolidated financial information | 240 | ||||||||||||
|
|
| |||||||||||||
| Shareholder information: Dividend history | 242 | |||||||||||||
|
|
|
| ||||||||||||
| 3B – Capitalisation and indebtedness | Not applicable | – | ||||||||||||
|
|
|
| ||||||||||||
| 3C – Reason for the offer and use of proceeds | Not applicable | – | ||||||||||||
|
|
|
| ||||||||||||
| 3D – Risk factors | Group information: Risk factors | 224-229 | ||||||||||||
|
|
|
|
| |||||||||||
| 4 | Information on the Company | |||||||||||||
|
|
|
| ||||||||||||
| 4A – History and development of the Company | Group information: History and developments | 224 | ||||||||||||
|
|
| |||||||||||||
| Shareholder information: Return of funds | 241 | |||||||||||||
|
|
| |||||||||||||
| Useful information: Contacts | 251 | |||||||||||||
|
|
|
| ||||||||||||
| 4B – Business overview | Strategic Report | 2-71 | ||||||||||||
|
|
| |||||||||||||
| Group information: Working Time Regulations 1998 | 233 | |||||||||||||
|
|
| |||||||||||||
| Group Information: Risk factors | 224-229 | |||||||||||||
|
|
|
| ||||||||||||
| 4C – Organisational structure | Group Financial Statements: Note 34 – Group companies | 197-199 | ||||||||||||
|
|
| |||||||||||||
| Group Information: History and developments | 224 | |||||||||||||
|
|
|
| ||||||||||||
| 4D – Property, plant and equipment | Strategic Report: Key performance indicators | 43-46 | ||||||||||||
|
|
| |||||||||||||
| Directors’ Report: Greenhouse gas (GHG) emissions | 221-222 | |||||||||||||
|
|
| |||||||||||||
| Group Financial Statements: Note 14 – Property, plant and equipment | 168-169 | |||||||||||||
|
|
|
|
| |||||||||||
| 4A | Unresolved staff comments | None | – | |||||||||||
|
|
|
|
| |||||||||||
| 5 | Operating and financial review and prospects | |||||||||||||
|
|
|
| ||||||||||||
| 5A – Operating results | Strategic Report: Key performance indicators | 43-46 | ||||||||||||
|
|
| |||||||||||||
| Strategic Report: Performance | 47-71 | |||||||||||||
|
|
| |||||||||||||
| Group Financial Statements: Accounting policies | 133-145 | |||||||||||||
|
|
| |||||||||||||
| Group Financial Statements: New accounting standards | 145 | |||||||||||||
|
|
| |||||||||||||
| Viability statement | 42 | |||||||||||||
|
|
|
| ||||||||||||
| 5B – Liquidity and capital resources | Strategic Report: Performance – Liquidity and capital resources | 70-71 | ||||||||||||
|
|
| |||||||||||||
| Group Financial Statements: Note 19 – Cash and cash equivalents | 175 | |||||||||||||
|
|
| |||||||||||||
| Group Financial Statements: Note 22 – Loans and other borrowings | 177-178 | |||||||||||||
|
|
| |||||||||||||
| Group Financial Statements: Note 24 – Financial risk management and derivative financial instruments | 179-183 | |||||||||||||
|
|
| |||||||||||||
| Group Financial Statements: Note 25 – Classification and measurement of financial instruments | 184-186 | |||||||||||||
|
|
| |||||||||||||
| Group Financial Statements: Note 26 – Reconciliation of (loss)/profit for the year to cash flow from operations before contract acquisition costs | 187 | |||||||||||||
|
|
|
| ||||||||||||
| 5C – Research and development; intellectual property | Not applicable | – | ||||||||||||
|
|
|
| ||||||||||||
| 5D – Trend information | Strategic Report: Performance | 47-71 | ||||||||||||
|
|
|
| ||||||||||||
| 5E – Off-balance sheet arrangements | Strategic Report: Performance – Liquidity and capital resources – Off-balance sheet arrangements | 71 | ||||||||||||
|
|
|
| ||||||||||||
| 5F – Tabular disclosure of contractual obligations | Strategic Report: Performance – Liquidity and capital resources | 70-71 | ||||||||||||
|
|
|
| ||||||||||||
| 5G – Safe harbour | Additional Information: Forward-looking statements | 245 | ||||||||||||
|
|
|
| ||||||||||||
| Non-GAAP financial measures | Strategic Report: Performance | 47-71 | ||||||||||||
|
|
| |||||||||||||
| Other financial information | 212-218 | |||||||||||||
|
|
| |||||||||||||
| Group Financial Statements: Note 6 – Exceptional items | 154-156 | |||||||||||||
|
|
| |||||||||||||
| Group Financial Statements: Note 10 – (Loss)/earnings per ordinary share | 162-163 | |||||||||||||
|
|
| |||||||||||||
| Group Financial Statements: Note 23 – Net debt | 178-179 | |||||||||||||
|
|
|
|
| |||||||||||
| 6 | Directors, senior management and employees | |||||||||||||
|
|
|
| ||||||||||||
| 6A – Directors and senior management | Governance: Our Board of Directors and Our Executive Committee | 76-81 | ||||||||||||
|
|
|
| ||||||||||||
| 6B – Compensation | Directors’ Remuneration Report | 96-111 | ||||||||||||
|
|
| |||||||||||||
| Group Financial Statements: Note 27 – Retirement benefits | 187-190 | |||||||||||||
|
|
| |||||||||||||
| Group Financial Statements: Note 32 – Related party disclosures | 196 | |||||||||||||
|
|
| |||||||||||||
| Group Financial Statements: Note 28 – Share-based payments | 191-192 | |||||||||||||
|
|
|
| ||||||||||||
| 6C – Board practices | Governance structure and Board activities | 82-85 | ||||||||||||
|
|
| |||||||||||||
| Executive Directors’ benefits upon termination of office | 230 | |||||||||||||
|
|
|
| ||||||||||||
| 6D – Employees | Group Financial Statements: Note 4 – Staff costs and Directors’ remuneration | 153 | ||||||||||||
|
|
| |||||||||||||
| Group information: Working Time Regulations 1998 | 233 | |||||||||||||
|
|
| |||||||||||||
| Directors’ Report: Employees and Code of Conduct | 220 | |||||||||||||
|
|
|
| ||||||||||||
| 6E – Share ownership | Directors’ Remuneration Report: Annual Report on Directors’ remuneration – Scheme interests awarded during 2019 and 2020 | 104 | ||||||||||||
|
|
| |||||||||||||
| Directors’ Remuneration Report: Annual Report on Directors’ remuneration – Statement of Directors’ shareholdings and share interests | 105 | |||||||||||||
|
|
| |||||||||||||
| Group Financial Statements: Note 28 – Share-based payments | 191-192 | |||||||||||||
|
|
| |||||||||||||
| Group information: Directors’ and Executive Committee members’ shareholdings | 230 | |||||||||||||
|
|
|
|
| |||||||||||
| 246 | IHG | Annual Report and Form 20-F 2020 |
| Form 20-F cross-reference guide | IHG | Annual Report and Form 20-F 2020 | 247 |
| Glossary | IHG | Annual Report and Form 20-F 2020 | 249 |
| Useful information | IHG | Annual Report and Form 20-F 2020 | 251 |
|
Designed and produced by Superunion, London.
www.superunion.com
Managed by Donnelley Financial Solutions
InterContinental Hotels Group PLC’s commitment to environmental issues is reflected in this Annual Report.
This report has been printed on Symbol Matt Plus. Environmental friendly ECF (Elemental Chlorine Free Guaranteed) paper, certified by the FSC®(Forest Stewardship Council Containing a high content of selected recycled materials (minimum 25% guaranteed).
The FSC® (Forest Stewardship Council) is a worldwide label which identifies products obtained from sustainable and responsible forest management.
Printed by CPI Colour in the UK, using the latest environmental printing technology and vegetable-based inks.
CPI Colour is a CarbonNeutral® company. Registered with the Environmental Management System ISO14001 and are Forest Stewardship Council (FSC®) chain-of-custody certified.
The unavoidable carbon emissions generated during the manufacturing and delivery of this document have been reduced to net zero through a verified carbon offsetting project. |
|
| InterContinental Hotels Group PLC |
| Broadwater Park, Denham |
| Buckinghamshire UB9 5HR |
| United Kingdom |
| Tel +44 (0) 1895 512 000
|
| www.ihgplc.com |
| Make a booking at www.ihg.com |
SIGNATURE
The registrant hereby certifies that it meets all of the requirements for filing on Form 20-F and that it has duly caused and authorized the undersigned to sign this Annual Report on Form 20-F on its behalf.
| INTERCONTINENTAL HOTELS GROUP PLC (Registrant) | ||
| By: | /s/ Paul Edgecliffe-Johnson | |
| Name: | Paul Edgecliffe-Johnson | |
| Title: | Chief Financial Officer | |
| Date: | March 4, 2021 | |
 See page 33
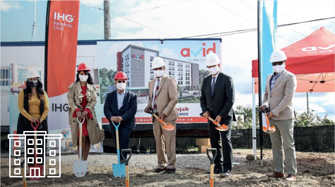

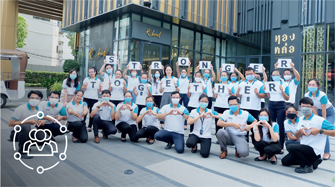








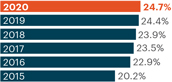
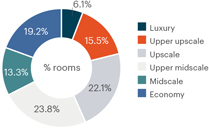
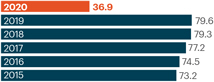
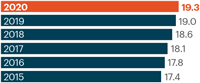
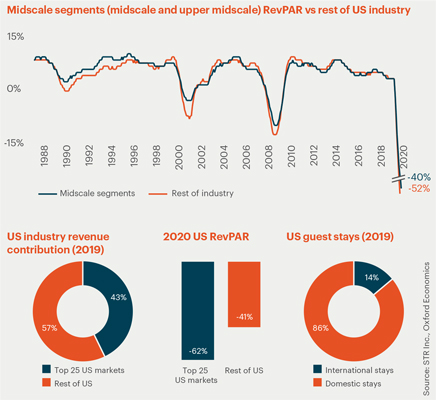
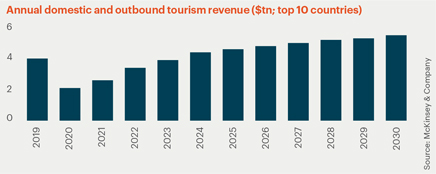




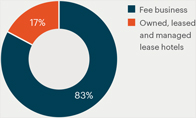
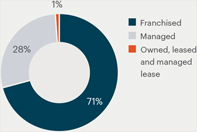
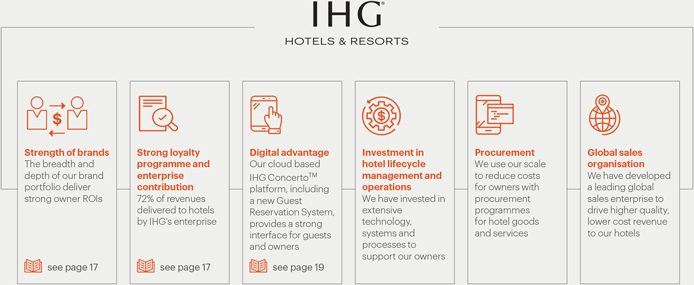
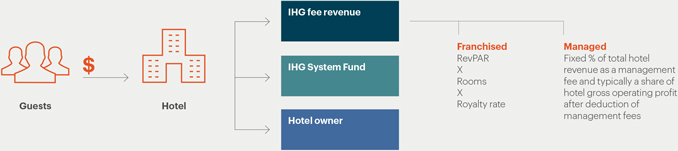

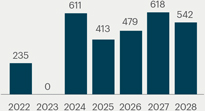
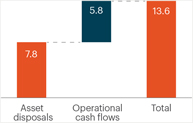




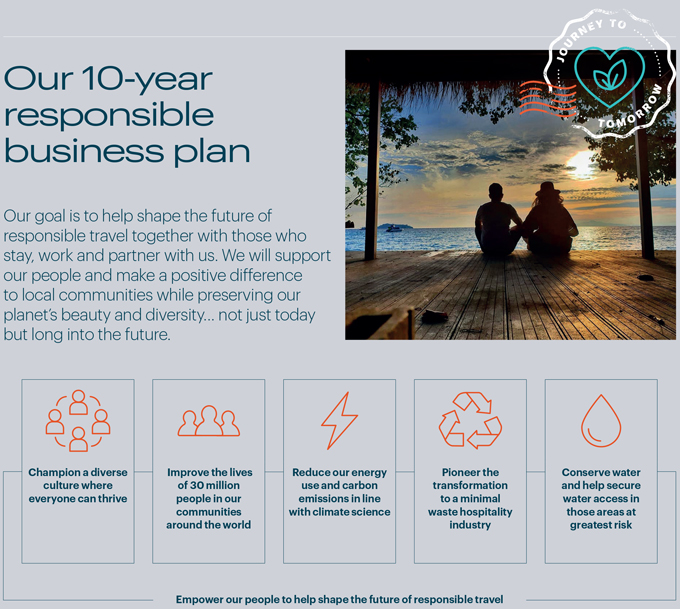


 See pages 14
 See page 26
 See page 31
 See page 29
 See page 24
 See page 33
 The above statement should be read in conjunction with the rest of the Strategic Report and the Governance Report, including the Committee Reports and Board meeting focus areas.
 The Schedule of Matters reserved for the Board and the Terms of Reference for each of the Board Committees are available on our website at www.ihgplc.com/investors under Corporate
governance.
The Schedule of Matters reserved for the Board and the Terms of Reference for each of the Board Committees are available on our website at www.ihgplc.com/investors under Corporate
governance.









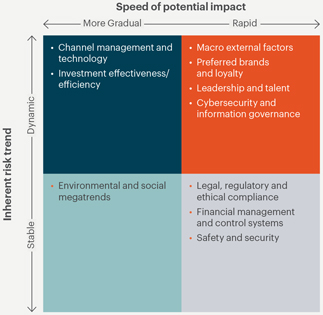


 The Annual Performance Plan
 The Long Term Incentive Plan
 For more information on Directors’ remuneration see pages 96 to 111.


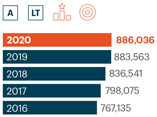
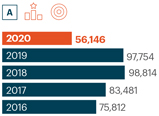
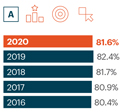
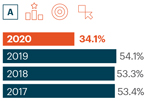
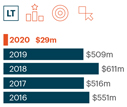


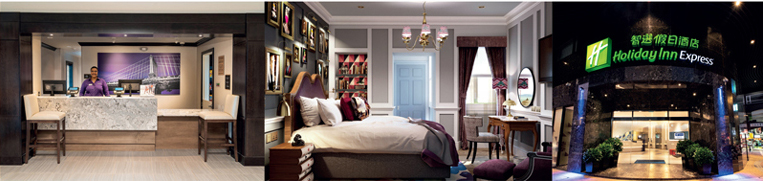
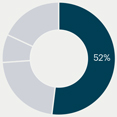
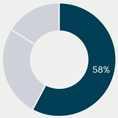
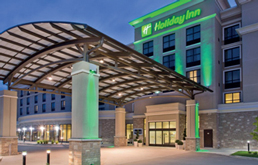

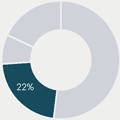
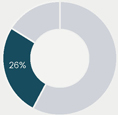
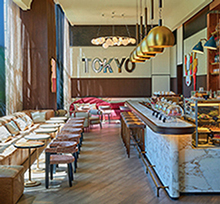


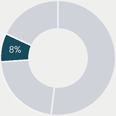
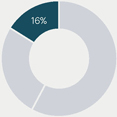
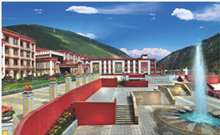
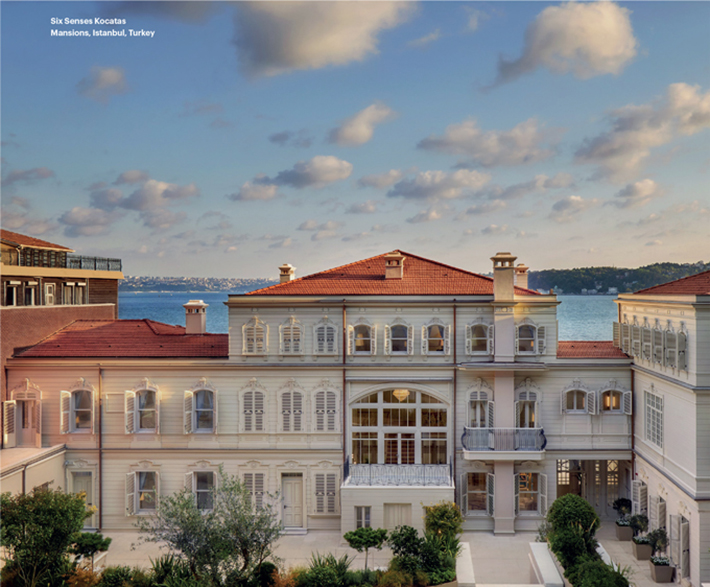
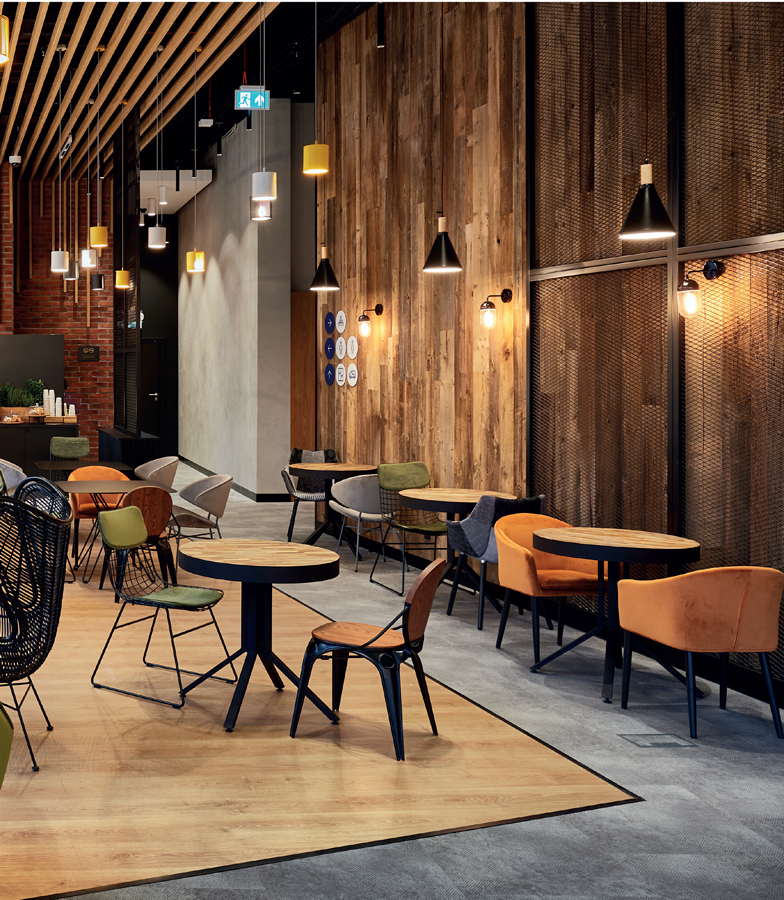












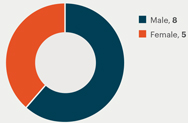
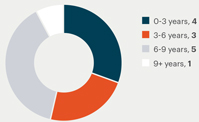





















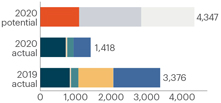
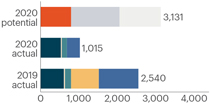
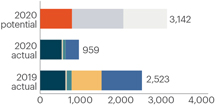
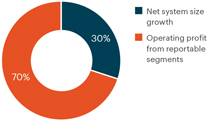
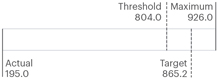
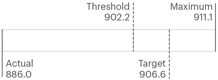
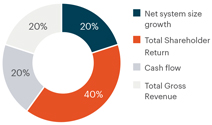
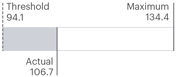
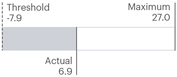
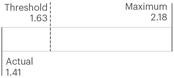
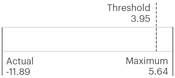

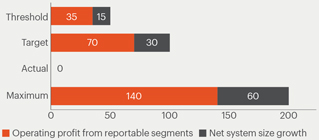
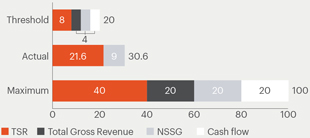


 Guideline Executive Director shareholding requirement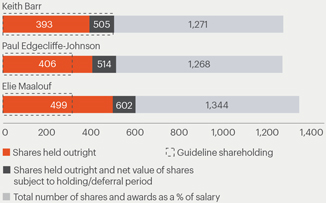
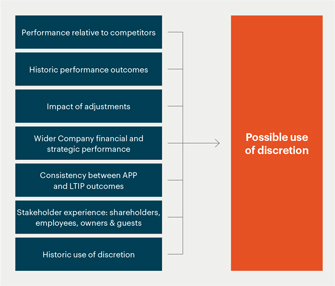
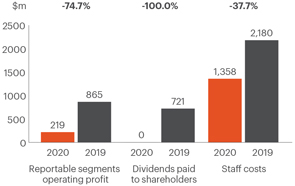



















 Information concerning Non-GAAP measures can be found in the Strategic Report on pages 47 to 51.