
| Quarterly Statement Q2 2025 |

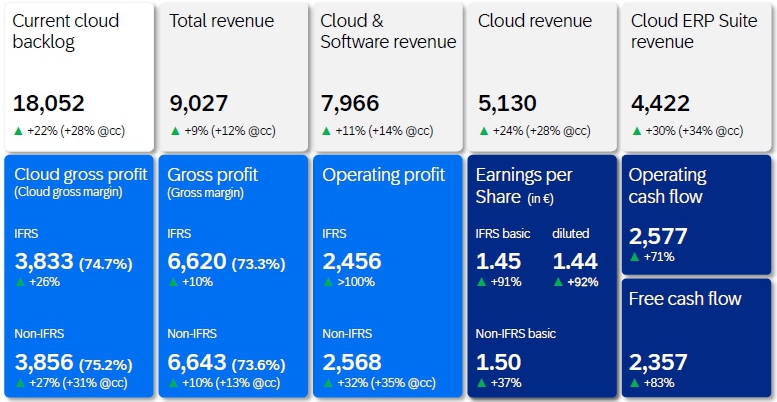
| Current cloud backlog of €18.1 billion, up 22% and up 28% at constant currencies | |
| Cloud revenue up 24% and up 28% at constant currencies | |
| Cloud ERP Suite revenue up 30% and up 34% at constant currencies | |
| Total revenue up 9% and up 12% at constant currencies | |
| IFRS operating profit of €2.5 billion; non-IFRS operating profit of €2.6 billion, up 32% and up 35% at constant currencies | |
| Outlook 2025 unchanged | |
Q2 2025 | in € millions, unless otherwise stated
1/26
| Quarterly Statement Q2 2025 |
Walldorf, Germany
– July 22, 2025
SAP SE (NYSE: SAP) announced today its financial results for the second quarter
ended June 30, 2025.
Christian Klein, CEO: We have delivered yet another quarter of outstanding results. AI innovations such as Joule becoming available “everywhere and for everything” and SAP Business Data Cloud as a powerful accelerator of AI make our portfolio ever stronger. Enterprise operations are about to enter a new era, and SAP is best positioned to benefit from that evolution. |
Dominik Asam, CFO: We achieved a very good Q2, with accelerating total revenue growth, strong profitability and free cash flow. Our performance was supported by continued customer demand and disciplined cost control. As we move into the second half, we remain cautiously optimistic, keeping a close eye on geopolitical developments and public sector trends. |
Financial Performance
Group results at a glance – Second quarter 2025
| IFRS | Non-IFRS1 | |||||||
| € million, unless otherwise stated | Q2 2025 | Q2 2024 | ∆ in % | Q2 2025 | Q2 2024 | ∆ in % | ∆ in % const. curr. | |
| SaaS/PaaS | 5,045 | 4,018 | 26 | 5,045 | 4,018 | 26 | 30 | |
| Thereof Cloud ERP Suite2 | 4,422 | 3,414 | 30 | 4,422 | 3,414 | 30 | 34 | |
| Thereof Extension Suite3 | 624 | 604 | 3 | 624 | 604 | 3 | 7 | |
| IaaS4 | 85 | 135 | –37 | 85 | 135 | –37 | –35 | |
| Cloud revenue | 5,130 | 4,153 | 24 | 5,130 | 4,153 | 24 | 28 | |
| Cloud and software revenue | 7,966 | 7,175 | 11 | 7,966 | 7,175 | 11 | 14 | |
| Total revenue | 9,027 | 8,288 | 9 | 9,027 | 8,288 | 9 | 12 | |
| Share of more predictable revenue (in %) | 86 | 84 | 2pp | 86 | 84 | 2pp | ||
| Cloud gross profit | 3,833 | 3,030 | 26 | 3,856 | 3,043 | 27 | 31 | |
| Gross profit | 6,620 | 6,017 | 10 | 6,643 | 6,029 | 10 | 13 | |
| Operating profit (loss) | 2,456 | 1,222 | >100 | 2,568 | 1,940 | 32 | 35 | |
| Profit (loss) after tax | 1,749 | 918 | 91 | 1,747 | 1,278 | 37 | ||
| Earnings per share - Basic (in €) | 1.45 | 0.76 | 91 | 1.50 | 1.10 | 37 | ||
| Net cash flows from operating activities | 2,577 | 1,509 | 71 | |||||
| Free cash flow | 2,357 | 1,288 | 83 | |||||
1 For a breakdown of the individual adjustments see table “Non-IFRS Operating Expense Adjustments by Functional Areas” in this Quarterly Statement.
2 Cloud ERP Suite references the portfolio of strategic Software-as-a-Service (SaaS) and Platform-as-a-Service (PaaS) solutions that are tightly integrated with our core ERP solutions and are included in key commercial packages, such as RISE with SAP. Further, Cloud ERP Suite also includes cloud-based capabilities enabling our customers’ ERP landscapes and their cloud transformation. The following offerings contribute to Cloud ERP Suite revenue: SAP Cloud ERP, SAP Business Technology Platform, financial- and spend management, supply chain management, core solutions for human capital management, commerce, business transformation management and AI.
3 Extension Suite references SAP’s remaining SaaS and PaaS solutions that supplement and extend the functional coverage of the Cloud ERP Suite.
4 Infrastructure as a service (IaaS): The major portion of IaaS comes from SAP HANA Enterprise Cloud.
2/26
| Quarterly Statement Q2 2025 |
Group results at a glance – Six months ended June 2025
| IFRS | Non-IFRS1 | |||||||
| € million, unless otherwise stated | Q1–Q2 2025 |
Q1-Q2 2024 |
∆ in % | Q1–Q2 2025 |
Q1-Q2 2024 |
∆ in % | ∆ in % const. curr. | |
| SaaS/PaaS | 9,935 | 7,782 | 28 | 9,935 | 7,782 | 28 | 29 | |
| Thereof Cloud ERP Suite revenue2 | 8,672 | 6,581 | 32 | 8,672 | 6,581 | 32 | 33 | |
| Thereof Extension Suite revenue3 | 1,262 | 1,202 | 5 | 1,262 | 1,202 | 5 | 7 | |
| IaaS4 | 189 | 299 | –37 | 189 | 299 | –37 | –36 | |
| Cloud revenue | 10,124 | 8,082 | 25 | 10,124 | 8,082 | 25 | 27 | |
| Cloud and software revenue | 15,904 | 14,134 | 13 | 15,904 | 14,134 | 13 | 14 | |
| Total revenue | 18,040 | 16,329 | 10 | 18,040 | 16,329 | 10 | 12 | |
| Share of more predictable revenue (in %) | 86 | 84 | 2pp | 86 | 84 | 2pp | ||
| Cloud gross profit | 7,553 | 5,867 | 29 | 7,601 | 5,892 | 29 | 30 | |
| Gross profit | 13,226 | 11,778 | 12 | 13,275 | 11,803 | 12 | 14 | |
| Operating profit (loss) | 4,789 | 434 | >100 | 5,024 | 3,473 | 45 | 45 | |
| Profit (loss) after tax | 3,545 | 94 | >100 | 3,428 | 2,223 | 54 | ||
| Earnings per share - Basic (in €) | 2.98 | 0.05 | >100 | 2.94 | 1.91 | 54 | ||
| Net cash flows from operating activities | 6,357 | 4,388 | 45 | |||||
| Free cash flow | 5,939 | 3,929 | 51 | |||||
1 For a breakdown of the individual adjustments see table “Non-IFRS Operating Expense Adjustments by Functional Areas” in this Quarterly Statement.
2 Cloud ERP Suite references the portfolio of strategic Software-as-a-Service (SaaS) and Platform-as-a-Service (PaaS) solutions that are tightly integrated with our core ERP solutions and are included in key commercial packages, such as RISE with SAP. The following offerings contribute to Cloud ERP Suite revenue: SAP S/4HANA Cloud, SAP Business Technology Platform, and core solutions for HR and payroll, spend management, commerce, customer data solutions, business process transformation, and working capital management. For additional information and historical data on Cloud ERP Suite, see SAP’s Reporting Framework.
3 Extension Suite references SAP’s remaining SaaS and PaaS solutions that supplement and extend the functional coverage of the Cloud ERP Suite.
4 Infrastructure as a service (IaaS): The major portion of IaaS comes from SAP HANA Enterprise Cloud
Financial Highlights1
Second Quarter 2025
In the second quarter, current cloud backlog grew by 22% to €18.05 billion and was up 28% at constant currencies. Cloud revenue was up 24% to €5.13 billion and up 28% at constant currencies. Cloud ERP Suite revenue was up 30% to €4.42 billion and up 34% at constant currencies.
Software licenses revenue decreased by 15% to €0.19 billion and was down 13% at constant currencies. Cloud and software revenue was up 11% to €7.97 billion and up 14% at constant currencies. Services revenue was down 5% to €1.06 billion and down 2% at constant currencies. Total revenue was up 9% to €9.03 billion and up 12% at constant currencies.
The share of more predictable revenue increased by 2 percentage points to 86%.
IFRS cloud gross profit was up 26% to €3.83 billion. Non-IFRS cloud gross profit was up 27% to €3.86 billion and was up 31% at constant currencies. IFRS Cloud gross margin was up 1.8 percentage points to 74.7%, non-IFRS cloud gross margin up 1.9 percentage points to 75.2% and up 1.8 percentage points at constant currencies to 75.0%.
IFRS operating profit increased to €2.46 billion and IFRS operating margin was up 12.5 percentage points to 27.2%. IFRS operating profit growth was positively impacted by a restructuring expense decline of €0.6 billion as compared to Q2 2024 in connection with the 2024 transformation program. Non-IFRS operating profit was up 32% to €2.57 billion and was up 35% at constant currencies, non-IFRS operating margin increased by 5.0 percentage points to 28.5% and was up 4.8 percentage points to 28.2% at constant currencies. Both, IFRS and non-IFRS operating profit growth benefitted from the operational efficiencies realized through successful execution of the 2024 transformation program and lower share-based compensation expenses.
Driven by the operating profit growth, IFRS earnings per share (basic) increased 91% to €1.45. Non-IFRS earnings per share (basic) increased 37% to €1.50. IFRS effective tax rate was 30.1% and non-IFRS effective tax rate was 30.8%. Both were mainly driven by a
1 The Q2 2025 results were also impacted by other effects. For details, please refer to the disclosures on page 26 of this document.
3/26
| Quarterly Statement Q2 2025 |
temporary inability to offset withholding taxes in Germany due to carryforward of tax losses from prior year. The IFRS effective tax rate is lower than the non-IFRS effective tax rate due to tax benefits from tax-exempt income.
Operating cash flow in the second quarter was up 71% to €2.58 billion and free cash flow increased by 83% to €2.36 billion. The increase was mainly attributable to the higher profitability and the positive development of working capital (outside of restructuring related impacts), lower payouts for share-based compensation, lower restructuring payments, and lower income-tax payments. For the first six months, operating cash flow was up 45% to €6.36 billion and free cash flow increased by 51% to €5.94 billion
Share Repurchase Program
In May 2023, SAP announced a share repurchase program with an aggregate volume of up to €5 billion and a term until December 31, 2025. As of June 30, 2025, SAP had repurchased 24,743,442 shares at an average price of €185.51 resulting in a purchased volume of approximately €4.6 billion under the program.
2024 Transformation Program: Focus on scalability of operations and key strategic growth areas
In January 2024, SAP announced a company-wide restructuring program which concluded as planned in the first quarter 2025. Overall expenses associated with the program were approximately €3.2 billion. Restructuring payouts amounted to €2.5 billion for the full-year 2024 and €0.6 billion for the first six months of 2025. Approximately €0.2 billion is expected to be paid out in the remainder of 2025.
Business Highlights
In the second quarter, customers around the globe continued to choose the “RISE with SAP” journey to drive their end-to-end business transformations. These customers included: Acron Aviation, Alibaba Group, Balluff, BALMAIN, Bell Food Group, Cementos Argos, Eberspächer Group, Ernsting's family, GSK, J-POWER, Linfox, Mannington Mills, Mercedes-AMG PETRONAS Formula One, NS Reizigers, Proximus Group, Replay, Sumitomo Rubber Industries, Synapxe, University Medical Center of the Johannes Gutenberg University Mainz, and Votorantim.
Alivus Life Sciences, Biel City Administration, Iochpe-Maxion, Rico Auto Industries, and Sinar Mas Mining went live on SAP S/4HANA Cloud in the second quarter.
Daoudata, EGYM, Gardner White Furniture, MCH Group, NEBCO, and PwC chose “GROW with SAP”, a journey helping customers adopt cloud ERP with speed, predictability, and continuous innovation.
Key customer wins across SAP’s solution portfolio included: Accenture, Adobe, BAE Systems, BMW Group, Brown-Forman, Delta, Deutsche Börse, Döhler, German Armed Forces, German Federal Pension Insurance, Helaba, HENSOLDT, IBM, Infosys, Interroll, L'Oréal, LTIMindtree, MANN+HUMMEL, Metcash, SPIE, Standard Chartered, and Zurich Cantonal Bank.
Ahlstrom, BRF, Covestro, NTN, Techcombank, and Zespri International went live on SAP solutions.
In the second quarter, SAP’s cloud revenue performance was particularly strong in APJ and EMEA and solid in the Americas region. Brazil, Chile, France, India, Italy, South Korea and Spain had outstanding performance, while Canada, China, Germany, Japan, and the U.S. were particularly strong.
On May 5, SAP announced that it had further extended the contract of CEO and chairman of the Executive Board Christian Klein to five years, until April 2030. In addition, the contract of Dominik Asam, CFO and member of the Executive Board, has been further extended for two years to March 2028.
On May 13, SAP held its Annual General Meeting (AGM) of Shareholders as a virtual event. The AGM approved all agenda items with strong support, including the dividend proposal of €2.35 per share for fiscal year 2024.
On May 20, SAP and Accenture announced joined forces to help companies enable connected intelligence across the enterprise to drive speed and agility in the AI era, through a strategic expansion of their long-standing partnership. In addition, SAP and Palantir announced a partnership to facilitate joint customers’ cloud migration journey and modernization programs, by connecting the unified, context-rich data environment of SAP Business Data Cloud with Palantir’s Ontology and AIP.
On May 27, SAP and Alibaba Group announced a strategic partnership to accelerate cloud transformation. |
4/26
| Quarterly Statement Q2 2025 |
Outlook 2025
Financial Outlook 2025
While the prevailing dynamic environment implies elevated levels of uncertainty and reduced visibility, SAP currently continues to expect:
| · | €21.6 – 21.9 billion cloud revenue at constant currencies (2024: €17.14 billion), up 26% to 28% at constant currencies. |
| · | €33.1 – 33.6 billion cloud and software revenue at constant currencies (2024: €29.83 billion), up 11% to 13% at constant currencies. |
| · | €10.3 – 10.6 billion non-IFRS operating profit at constant currencies (2024: €8.15 billion), up 26% to 30% at constant currencies. |
| · | Approximately €8.0 billion free cash flow at actual currencies (2024: €4.22 billion) |
| · | An effective tax rate (non-IFRS) of approximately 32% (2024: 32.3%)2. |
The company also continues to expect current cloud backlog growth at constant currencies to slightly decelerate in 2025.
While SAP’s 2025 financial outlook for the income statement parameters is at constant currencies (including an average exchange rate of 1.08 USD per EUR), actual currency reported figures are expected to be impacted by currency exchange rate fluctuations as the company progresses through the year, as reflected in the table below.
Currency Impact Assuming June 30, 2025 Rates Apply for the Remainder of 2025
| In percentage points | Q3 2025 | FY 2025 |
| Cloud revenue growth | -5.0pp | -3.5pp |
| Cloud and software revenue growth | -4.0pp | -3.0pp |
| Operating profit growth (non-IFRS) | -4.5pp | -3.0pp |
This includes an exchange rate of 1.17 USD per EUR.
Non-Financial Outlook 2025
As announced on May 9, SAP has replaced the Women in Executive Roles KPI with the Business Health Culture Index (BHCI). In 2025, SAP expects a BHCI score in the range of 80% to 82%.
For 2025, SAP continues to expect:
| · | A Customer Net Promoter Score of 12 to 16. |
| · | The Employee engagement index to be in a range of 74% to 78%. |
| · | To steadily decrease carbon emissions across the relevant value chain. |
2 The effective tax rate (non-IFRS) is a non-IFRS financial measure and is presented for supplemental informational purposes only. We do not provide an outlook for the effective tax rate (IFRS) due to the uncertainty and potential variability of gains and losses associated with equity securities, which are reconciling items between the two effective tax rates (non-IFRS and IFRS). These items cannot be provided without unreasonable efforts but could have a significant impact on our future effective tax rate (IFRS).
5/26
 | Quarterly Statement Q2 2025 |
Additional Information
This press release and all information therein is preliminary and unaudited. Due to rounding, numbers may not add up precisely.
SAP Performance Measures
For more information about our key growth metrics and performance measures, their calculation, their usefulness, and their limitations, please refer to the following document on our Investor Relations website: https://www.sap.com/investors/performance-measures
Webcast
SAP senior management will host a financial analyst conference call on Tuesday, July 22nd at 11:00 PM (CEST) / 10:00 PM (BST) / 5:00 PM (EDT) / 2:00 PM (PDT). The conference will be webcast on the Company’s website at https://www.sap.com/investor and will be available for replay. Supplementary financial information pertaining to the second quarter results can be found at https://www.sap.com/investor
About SAP
As a global leader in enterprise applications and business AI, SAP (NYSE: SAP) stands at the nexus of business and technology. For over 50 years, organizations have trusted SAP to bring out their best by uniting business-critical operations spanning finance, procurement, HR, supply chain, and customer experience. For more information, visit www.sap.com.
For more information, financial community only:
| Alexandra Steiger | +49 (6227) 7-767336 | investor@sap.com, CET |
Follow SAP Investor Relations on LinkedIn at SAP Investor Relations.
For more information, press only:
| Joellen Perry | +1 (650) 445-6780 | joellen.perry@sap.com, PT |
| Daniel Reinhardt | +49 (6227) 7-40201 | daniel.reinhardt@sap.com, CET |
For customers interested in learning more about SAP products:
| Global Customer Center: | +49 180 534-34-24 |
| United States Only: | +1 (800) 872-1SAP (+1-800-872-1727) |
Note to editors:
To preview and download broadcast-standard stock footage and press photos digitally, please visit www.sap.com/photos. On this platform, you can find high resolution material for your media channels.
This document contains forward-looking statements, which are predictions, projections, or other statements about future events. These statements are based on current expectations, forecasts, and assumptions that are subject to risks and uncertainties that could cause actual results and outcomes to materially differ. Additional information regarding these risks and uncertainties may be found in our filings with the Securities and Exchange Commission, including but not limited to the risk factors section of SAP’s 2024 Annual Report on Form 20-F.
© 2025 SAP SE. All rights reserved.
SAP and other SAP products and services mentioned herein as well as their respective logos are trademarks or registered trademarks of SAP SE in Germany and other countries. Please see https://www.sap.com/copyright for additional trademark information and notices.
6/26
| Quarterly Statement Q2 2025 |
Contents
7/26
| Quarterly Statement Q2 2025 |
Financial
and Non-Financial Key Facts
(IFRS and Non-IFRS)
| € millions, unless otherwise stated | Q1 2024 |
Q2 2024 |
Q3 2024 |
Q4 2024 |
TY 2024 |
Q1 2025 |
Q2 2025 |
| Revenues | |||||||
| Cloud | 3,928 | 4,153 | 4,351 | 4,708 | 17,141 | 4,993 | 5,130 |
| % change – yoy | 24 | 25 | 25 | 27 | 25 | 27 | 24 |
| % change constant currency – yoy | 25 | 25 | 27 | 27 | 26 | 26 | 28 |
| Cloud ERP Suite | 3,167 | 3,414 | 3,636 | 3,949 | 14,166 | 4,251 | 4,422 |
| % change – yoy | 31 | 33 | 34 | 35 | 33 | 34 | 30 |
| % change constant currency – yoy | 32 | 33 | 36 | 35 | 34 | 33 | 34 |
| Software licenses | 203 | 229 | 285 | 683 | 1,399 | 183 | 194 |
| % change – yoy | –26 | –28 | –15 | –18 | –21 | –10 | –15 |
| % change constant currency – yoy | –25 | –27 | –14 | –19 | –21 | –10 | –13 |
| Software support | 2,829 | 2,792 | 2,793 | 2,876 | 11,290 | 2,761 | 2,642 |
| % change – yoy | –3 | –3 | –3 | 1 | –2 | –2 | –5 |
| % change constant currency – yoy | –1 | –3 | –2 | 1 | –1 | –3 | –3 |
| Total revenue | 8,041 | 8,288 | 8,470 | 9,377 | 34,176 | 9,013 | 9,027 |
| % change – yoy | 8 | 10 | 9 | 11 | 10 | 12 | 9 |
| % change constant currency – yoy | 9 | 10 | 10 | 10 | 10 | 11 | 12 |
| Profits | |||||||
| Operating profit (loss) (IFRS) | –787 | 1,222 | 2,214 | 2,016 | 4,665 | 2,333 | 2,456 |
| Operating profit (loss) (non-IFRS) | 1,533 | 1,940 | 2,244 | 2,436 | 8,153 | 2,455 | 2,568 |
| % change - yoy | 16 | 33 | 27 | 24 | 25 | 60 | 32 |
| % change constant currency - yoy | 19 | 35 | 28 | 24 | 26 | 58 | 35 |
| Profit (loss) after tax (IFRS) | –824 | 918 | 1,441 | 1,616 | 3,150 | 1,796 | 1,749 |
| Profit (loss) after tax (non-IFRS) | 944 | 1,278 | 1,437 | 1,619 | 5,279 | 1,681 | 1,747 |
| % change - yoy | 9 | 60 | 6 | 24 | 22 | 78 | 37 |
| Margins | |||||||
| Cloud gross margin (IFRS, in %) | 72.2 | 73.0 | 73.2 | 72.8 | 72.8 | 74.5 | 74.7 |
| Cloud gross margin (non-IFRS, in %) | 72.5 | 73.3 | 73.7 | 73.5 | 73.3 | 75.0 | 75.2 |
| Gross margin (IFRS, in %) | 71.7 | 72.6 | 73.3 | 74.0 | 73.0 | 73.3 | 73.3 |
| Gross margin (non-IFRS, in %) | 71.8 | 72.7 | 73.6 | 74.3 | 73.2 | 73.6 | 73.6 |
| Operating margin (IFRS, in %) | –9.8 | 14.7 | 26.1 | 21.5 | 13.6 | 25.9 | 27.2 |
| Operating margin (non-IFRS, in %) | 19.1 | 23.4 | 26.5 | 26.0 | 23.9 | 27.2 | 28.5 |
| Order Entry and current cloud backlog | |||||||
| Current cloud backlog | 14,179 | 14,808 | 15,377 | 18,078 | 18,078 | 18,202 | 18,052 |
| % change – yoy | 27 | 28 | 25 | 32 | 32 | 28 | 22 |
| % change constant currency – yoy | 28 | 28 | 29 | 29 | 29 | 29 | 28 |
| Share of cloud orders greater than €5 million based on total cloud order entry volume (in %) | 52 | 52 | 64 | 68 | 63 | 54 | 53 |
| Share of cloud orders smaller than €1 million based on total cloud order entry volume (in %) | 21 | 20 | 16 | 11 | 15 | 20 | 20 |
| Liquidity and Cash Flow | |||||||
| Net cash flows from operating activities | 2,878 | 1,509 | 1,403 | –584 | 5,207 | 3,780 | 2,577 |
| Free cash flow | 2,642 | 1,288 | 1,200 | –908 | 4,222 | 3,583 | 2,357 |
| Cash and cash equivalents | 9,295 | 7,870 | 10,005 | 9,609 | 9,609 | 11,345 | 7,942 |
8/26
| Quarterly Statement Q2 2025 |
| € millions, unless otherwise stated | Q1 2024 |
Q2 2024 |
Q3 2024 |
Q4 2024 |
TY 2024 |
Q1 2025 |
Q2 2025 |
| Group liquidity | 13,411 | 11,449 | 11,856 | 11,080 | 11,080 | 12,760 | 9,788 |
| Financial debt (–) | –7,770 | –7,776 | –8,996 | –9,385 | –9,385 | –8,121 | –7,492 |
| Net liquidity (+) / Net debt(–) | 5,641 | 3,674 | 2,860 | 1,695 | 1,695 | 4,639 | 2,297 |
| Non-Financials | |||||||
| Number of employees (quarter end)1 | 108,133 | 105,315 | 107,583 | 109,121 | 109,121 | 108,187 | 108,929 |
Gross greenhouse gas emissions (scope 1, 2, 3 / market-based)2 (in million tons CO2 equivalents) |
1.8 | 1.8 | 1.8 | 1.8 | 6.9 | 1.6 | 1.6 |
1 In full-time equivalents.
2 Our gross greenhouse gas emissions (GHG) include the total lifecycle emissions resulting from the use of our on-premise software. The calculation of use of sold products emissions is based on the number of active maintenance contracts at quarter end. Therefore, the emissions for individual quarters will not add up to the total sum of GHG emissions at year end.
9/26
| Quarterly Statement Q2 2025 |
Primary Financial Statements of SAP Group (IFRS)
| (A) | Consolidated Income Statements |
| (A.1) | Consolidated Income Statements – Quarter |
| € millions, unless otherwise stated | Q2 2025 | Q2 2024 | ∆ in % | |
| Cloud | 5,130 | 4,153 | 24 | |
| Software licenses | 194 | 229 | –15 | |
| Software support | 2,642 | 2,792 | –5 | |
| Software licenses and support | 2,835 | 3,021 | –6 | |
| Cloud and software | 7,966 | 7,175 | 11 | |
| Services | 1,061 | 1,114 | –5 | |
| Total revenue | 9,027 | 8,288 | 9 | |
| Cost of cloud | –1,297 | –1,123 | 16 | |
| Cost of software licenses and support | –313 | –311 | 1 | |
| Cost of cloud and software | –1,610 | –1,434 | 12 | |
| Cost of services | –797 | –837 | –5 | |
| Total cost of revenue | –2,407 | –2,272 | 6 | |
| Gross profit | 6,620 | 6,017 | 10 | |
| Research and development | –1,618 | –1,605 | 1 | |
| Sales and marketing | –2,156 | –2,217 | –3 | |
| General and administration | –361 | –336 | 7 | |
| Restructuring | –18 | –631 | –97 | |
| Other operating income/expense, net | –11 | –5 | >100 | |
| Total operating expenses | –6,571 | –7,067 | –7 | |
| Operating profit (loss) | 2,456 | 1,222 | >100 | |
| Other non-operating income/expense, net | –3 | –5 | –33 | |
| Finance income | 317 | 412 | –23 | |
| Finance costs | –268 | –242 | 11 | |
| Financial income, net | 49 | 170 | –71 | |
| Profit (loss) before tax | 2,502 | 1,387 | 80 | |
| Income tax expense | –753 | –469 | 60 | |
| Profit (loss) after tax | 1,749 | 918 | 91 | |
| Attributable to owners of parent | 1,697 | 888 | 91 | |
| Attributable to non-controlling interests | 52 | 30 | 74 | |
| Earnings per share, basic (in €)1 | 1.45 | 0.76 | 91 | |
| Earnings per share, diluted (in €)1 | 1.44 | 0.75 | 92 |
1 For the three months ended June 30, 2025 and 2024, the weighted average number of shares was 1,166 million (diluted 1,175 million) and 1,166 million (diluted: 1,178 million), respectively (treasury stock excluded).
10/26
| Quarterly Statement Q2 2025 |
(A.2) Consolidated Income Statements – Year-to-Date
| € millions, unless otherwise stated | Q1–Q2 2025 | Q1–Q2 2024 | ∆ in % | |
| Cloud | 10,124 | 8,082 | 25 | |
| Software licenses | 377 | 432 | –13 | |
| Software support | 5,403 | 5,621 | –4 | |
| Software licenses and support | 5,780 | 6,053 | –4 | |
| Cloud and software | 15,904 | 14,134 | 13 | |
| Services | 2,136 | 2,195 | –3 | |
| Total revenue | 18,040 | 16,329 | 10 | |
| Cost of cloud | –2,570 | –2,214 | 16 | |
| Cost of software licenses and support | –605 | –637 | –5 | |
| Cost of cloud and software | –3,176 | –2,851 | 11 | |
| Cost of services | –1,638 | –1,699 | –4 | |
| Total cost of revenue | –4,813 | –4,550 | 6 | |
| Gross profit | 13,226 | 11,778 | 12 | |
| Research and development | –3,291 | –3,270 | 1 | |
| Sales and marketing | –4,391 | –4,496 | –2 | |
| General and administration | –719 | –696 | 3 | |
| Restructuring | –18 | –2,873 | –99 | |
| Other operating income/expense, net | –19 | –9 | >100 | |
| Total operating expenses | –13,251 | –15,894 | –17 | |
| Operating profit (loss) | 4,789 | 434 | >100 | |
| Other non-operating income/expense, net | 7 | –153 | NA | |
| Finance income | 722 | 611 | 18 | |
| Finance costs | –548 | –486 | 13 | |
| Financial income, net | 175 | 125 | 40 | |
| Profit (loss) before tax | 4,970 | 407 | >100 | |
| Income tax expense | –1,425 | –313 | >100 | |
| Profit (loss) after tax | 3,545 | 94 | >100 | |
| Attributable to owners of parent | 3,477 | 60 | >100 | |
| Attributable to non-controlling interests | 68 | 34 | 100 | |
| Earnings per share, basic (in €)1 | 2.98 | 0.05 | >100 | |
| Earnings per share, diluted (in €)1 | 2.96 | 0.05 | >100 |
1 For the six months ended June 30, 2025 and 2024, the weighted average number of shares was 1,167 million (diluted: 1,175 million) and 1,167 million (diluted: 1,178 million), respectively (treasury stock excluded).
11/26
| Quarterly Statement Q2 2025 |
(B) Consolidated Statements of Financial Position
| as at 06/30/2025 and 12/31/2024 | ||
| € millions | 2025 | 2024 |
| Cash and cash equivalents | 7,942 | 9,609 |
| Other financial assets | 2,236 | 1,629 |
| Trade and other receivables | 6,289 | 6,774 |
| Other non-financial assets | 2,652 | 2,682 |
| Tax assets | 520 | 707 |
| Total current assets | 19,638 | 21,401 |
| Goodwill | 28,537 | 31,243 |
| Intangible assets | 2,289 | 2,706 |
| Property, plant, and equipment | 4,339 | 4,493 |
| Other financial assets | 6,807 | 7,141 |
| Trade and other receivables | 118 | 209 |
| Other non-financial assets | 3,840 | 3,990 |
| Tax assets | 328 | 359 |
| Deferred tax assets | 2,503 | 2,676 |
| Total non-current assets | 48,761 | 52,817 |
| Total assets | 68,399 | 74,218 |
| € millions | 2025 | 2024 |
| Trade and other payables | 2,210 | 1,988 |
| Tax liabilities | 965 | 585 |
| Financial liabilities | 3,347 | 4,277 |
| Other non-financial liabilities | 3,913 | 5,533 |
| Provisions | 220 | 716 |
| Contract liabilities | 8,395 | 5,978 |
| Total current liabilities | 19,050 | 19,078 |
| Trade and other payables | 5 | 10 |
| Tax liabilities | 471 | 509 |
| Financial liabilities | 6,034 | 7,169 |
| Other non-financial liabilities | 542 | 749 |
| Provisions | 468 | 494 |
| Deferred tax liabilities | 292 | 313 |
| Contract liabilities | 139 | 88 |
| Total non-current liabilities | 7,950 | 9,332 |
| Total liabilities | 27,000 | 28,410 |
| Issued capital | 1,229 | 1,229 |
| Share premium | 2,776 | 2,564 |
| Retained earnings | 43,653 | 42,907 |
| Other components of equity | 463 | 4,694 |
| Treasury shares | –7,123 | –5,954 |
| Equity attributable to owners of parent | 40,998 | 45,440 |
| Non-controlling interests | 401 | 368 |
| Total equity | 41,400 | 45,808 |
| Total equity and liabilities | 68,399 | 74,218 |
12/26
| Quarterly Statement Q2 2025 |
(C) Consolidated Statements of Cash Flows
| € millions | Q1–Q2 2025 | Q1–Q2 2024 |
| Profit (loss) after tax | 3,545 | 94 |
| Adjustments to reconcile profit (loss) after tax to net cash flows from operating activities: | ||
| Depreciation and amortization | 668 | 626 |
| Share-based payment expense | 949 | 1,280 |
| Income tax expense | 1,425 | 313 |
| Financial income, net | –175 | –125 |
| Increase/decrease in allowances on trade receivables | 18 | –23 |
| Other adjustments for non-cash items | –11 | 110 |
| Increase/decrease in trade and other receivables | 103 | 372 |
| Increase/decrease in other assets | –154 | –17 |
| Increase/decrease in trade payables, provisions, and other liabilities | –1,843 | 876 |
| Increase/decrease in contract liabilities | 3,121 | 2,718 |
| Share-based payments | –378 | –778 |
| Income taxes paid, net of refunds | –911 | –1,057 |
| Net cash flows from operating activities | 6,357 | 4,388 |
| Business combinations, net of cash and cash equivalents acquired | –5 | –19 |
| Purchase of intangible assets and property, plant, and equipment | –358 | –365 |
| Proceeds from sales of intangible assets and property, plant, and equipment | 78 | 55 |
| Purchase of equity or debt instruments of other entities | –3,386 | –7,987 |
| Proceeds from sales of equity or debt instruments of other entities | 2,812 | 7,370 |
| Interest received | 187 | 287 |
| Net cash flows from investing activities | –673 | –660 |
| Dividends paid | –2,743 | –2,565 |
| Dividends paid on non-controlling interests | 0 | –6 |
| Purchase of treasury shares | –1,633 | –975 |
| Proceeds from borrowings | 2 | 1 |
| Repayments of borrowings | –1,850 | –14 |
| Payments of lease liabilities | –138 | –148 |
| Interest paid | –379 | –378 |
| Net cash flows from financing activities | –6,742 | –4,086 |
| Effect of foreign currency rates on cash and cash equivalents | –610 | 104 |
| Net increase/decrease in cash and cash equivalents | –1,668 | –254 |
| Cash and cash equivalents at the beginning of the period | 9,609 | 8,124 |
| Cash and cash equivalents at the end of the period | 7,942 | 7,870 |
13/26
| Quarterly Statement Q2 2025 |
(D) Basis of Non-IFRS Presentation
SAP disclose certain financial measures such as expense (non-IFRS) and profit measures (non-IFRS) that are not prepared in accordance with IFRS and are therefore considered non-IFRS financial measures.
For a more detailed description of all of SAP’s non-IFRS measures and their limitations as well as SAP’s constant currency and free cash flow figures, see Explanation of Non-IFRS Measures.
(E) Reconciliation from Non-IFRS Numbers to IFRS Numbers
(E.1) Reconciliation of Non-IFRS Revenue – Quarter
| € millions, unless otherwise stated | Q2 2025 | Q2 2024 | ∆ in % | |||
| IFRS | Currency Impact |
Non-IFRS Constant Currency |
IFRS | IFRS | Non-IFRS Constant Currency | |
| Revenue Numbers | ||||||
| Cloud | 5,130 | 168 | 5,298 | 4,153 | 24 | 28 |
| Software licenses | 194 | 4 | 198 | 229 | –15 | –13 |
| Software support | 2,642 | 64 | 2,706 | 2,792 | –5 | –3 |
| Software licenses and support | 2,835 | 68 | 2,904 | 3,021 | –6 | –4 |
| Cloud and software | 7,966 | 236 | 8,202 | 7,175 | 11 | 14 |
| Services | 1,061 | 33 | 1,094 | 1,114 | –5 | –2 |
| Total revenue | 9,027 | 269 | 9,296 | 8,288 | 9 | 12 |
14/26
| Quarterly Statement Q2 2025 |
(E.2) Reconciliation of Non-IFRS Operating Expenses – Quarter
| € millions, unless otherwise stated | Q2 2025 | Q2 2024 | ∆ in % | ||||||||
| IFRS | Adj. | Non- IFRS |
Currency Impact |
Non-IFRS Constant Currency |
IFRS | Adj. | Non- IFRS |
IFRS | Non-IFRS | Non-IFRS Constant Currency | |
| Operating Expense Numbers | |||||||||||
| Cost of cloud | –1,297 | 23 | –1,274 | –1,123 | 13 | –1,110 | 16 | 15 | |||
| Cost of software licenses and support | –313 | 0 | –313 | –311 | 0 | –311 | 1 | 1 | |||
| Cost of cloud and software | –1,610 | 23 | –1,587 | –1,434 | 13 | –1,422 | 12 | 12 | |||
| Cost of services | –797 | 0 | –797 | –837 | 0 | –837 | –5 | –5 | |||
| Total cost of revenue | –2,407 | 23 | –2,384 | –2,272 | 13 | –2,259 | 6 | 6 | |||
| Gross profit | 6,620 | 23 | 6,643 | 192 | 6,835 | 6,017 | 13 | 6,029 | 10 | 10 | 13 |
| Research and development | –1,618 | 1 | –1,616 | –1,605 | 1 | –1,604 | 1 | 1 | |||
| Sales and marketing | –2,156 | 68 | –2,088 | –2,217 | 65 | –2,153 | –3 | –3 | |||
| General and administration | –361 | 1 | –360 | –336 | 8 | –328 | 7 | 10 | |||
| Restructuring | –18 | 18 | 0 | –631 | 631 | 0 | –97 | NA | |||
| Other operating income/expense, net | –11 | 0 | –11 | –5 | 0 | –5 | >100 | >100 | |||
| Total operating expenses | –6,571 | 112 | –6,459 | –214 | –6,673 | –7,067 | 718 | –6,348 | –7 | 2 | 5 |
(E.3) Reconciliation of Non-IFRS Profit Figures, Income Tax, and Key Ratios – Quarter
| € millions, unless otherwise stated | Q2 2025 | Q2 2024 | ∆ in % | ||||||||
| IFRS | Adj. | Non- IFRS |
Currency Impact |
Non-IFRS Constant Currency |
IFRS | Adj. | Non- IFRS |
IFRS | Non-IFRS | Non-IFRS Constant Currency | |
| Profit Numbers | |||||||||||
| Operating profit (loss) | 2,456 | 112 | 2,568 | 55 | 2,623 | 1,222 | 718 | 1,940 | >100 | 32 | 35 |
| Other non-operating income/expense, net | –3 | 0 | –3 | –5 | 0 | –5 | –33 | –33 | |||
| Finance income | 317 | –210 | 107 | 412 | –250 | 162 | –23 | –34 | |||
| Finance costs | –268 | 119 | –149 | –242 | 70 | –171 | 11 | –13 | |||
| Financial income, net | 49 | –91 | –42 | 170 | –179 | –9 | –71 | >100 | |||
| Profit (loss) before tax | 2,502 | 22 | 2,524 | 1,387 | 539 | 1,926 | 80 | 31 | |||
| Income tax expense | –753 | –24 | –776 | –469 | –178 | –647 | 60 | 20 | |||
| Profit (loss) after tax | 1,749 | –2 | 1,747 | 918 | 361 | 1,278 | 91 | 37 | |||
| Attributable to owners of parent | 1,697 | 56 | 1,753 | 888 | 395 | 1,283 | 91 | 37 | |||
| Attributable to non-controlling interests | 52 | –58 | –6 | 30 | –34 | –4 | 74 | 44 | |||
| Key Ratios | |||||||||||
| Operating margin (in %) | 27.2 | 28.5 | 28.2 | 14.7 | 23.4 | 12.5pp | 5.0pp | 4.8pp | |||
| Effective tax rate (in %)1 | 30.1 | 30.8 | 33.8 | 33.6 | –3.8pp | –2.8pp | |||||
| Earnings per share, basic (in €) | 1.45 | 1.50 | 0.76 | 1.10 | 91 | 37 | |||||
1 The difference between our effective tax rate (IFRS) and effective tax rate (non-IFRS) in Q2 2025 mainly resulted from tax effects of equity securities. The difference between our effective tax rate (IFRS) and effective tax rate (non-IFRS) in Q2 2024 mainly resulted from tax effects of restructuring expenses.
15/26
| Quarterly Statement Q2 2025 |
(E.4) Reconciliation of Non-IFRS Revenue – Year-to-Date
| € millions, unless otherwise stated | Q1–Q2 2025 | Q1–Q2 2024 | ∆ in % | |||
| IFRS | Currency
Impact |
Non-IFRS Constant Currency |
IFRS | IFRS | Non-IFRS Constant Currency | |
| Revenue Numbers | ||||||
| Cloud | 10,124 | 110 | 10,234 | 8,082 | 25 | 27 |
| Software licenses | 377 | 4 | 381 | 432 | –13 | –12 |
| Software support | 5,403 | 40 | 5,443 | 5,621 | –4 | –3 |
| Software licenses and support | 5,780 | 44 | 5,824 | 6,053 | –4 | –4 |
| Cloud and software | 15,904 | 154 | 16,058 | 14,134 | 13 | 14 |
| Services | 2,136 | 18 | 2,154 | 2,195 | –3 | –2 |
| Total revenue | 18,040 | 172 | 18,212 | 16,329 | 10 | 12 |
(E.5) Reconciliation of Non-IFRS Operating Expenses – Year-to-Date
| € millions, unless otherwise stated | Q1–Q2 2025 | Q1–Q2 2024 | ∆ in % | ||||||||
| IFRS | Adj. | Non- IFRS |
Currency Impact |
Non-IFRS Constant Currency |
IFRS | Adj. | Non- IFRS |
IFRS | Non-IFRS | Non-IFRS Constant Currency | |
| Operating Expense Numbers | |||||||||||
| Cost of cloud | –2,570 | 48 | –2,523 | –2,214 | 25 | –2,190 | 16 | 15 | |||
| Cost of software licenses and support | –605 | 0 | –605 | –637 | 0 | –637 | –5 | –5 | |||
| Cost of cloud and software | –3,176 | 48 | –3,128 | –2,851 | 25 | –2,827 | 11 | 11 | |||
| Cost of services | –1,638 | 1 | –1,637 | –1,699 | 0 | –1,699 | –4 | –4 | |||
| Total cost of revenue | –4,813 | 48 | –4,765 | –4,550 | 25 | –4,526 | 6 | 5 | |||
| Gross profit | 13,226 | 48 | 13,275 | 124 | 13,399 | 11,778 | 25 | 11,803 | 12 | 12 | 14 |
| Research and development | –3,291 | 3 | –3,288 | –3,270 | 3 | –3,267 | 1 | 1 | |||
| Sales and marketing | –4,391 | 163 | –4,228 | –4,496 | 129 | –4,366 | –2 | –3 | |||
| General and administration | –719 | 2 | –717 | –696 | 9 | –687 | 3 | 4 | |||
| Restructuring | –18 | 18 | 0 | –2,873 | 2,873 | 0 | –99 | NA | |||
| Other operating income/expense, net | –19 | 0 | –19 | –9 | 0 | –9 | >100 | >100 | |||
| Total operating expenses | –13,251 | 235 | –13,016 | –152 | –13,168 | –15,894 | 3,039 | –12,855 | –17 | 1 | 2 |
16/26
| Quarterly Statement Q2 2025 |
(E.6) Reconciliation of Non-IFRS Profit Figures, Income Tax, and Key Ratios – Year-to-Date
| € millions, unless otherwise stated | Q1–Q2 2025 | Q1–Q2 2024 | ∆ in % | ||||||||
| IFRS | Adj. | Non- IFRS |
Currency Impact |
Non-IFRS Constant Currency |
IFRS | Adj. | Non- IFRS |
IFRS | Non-IFRS | Non-IFRS Constant Currency | |
| Profit Numbers | |||||||||||
| Operating profit (loss) | 4,789 | 235 | 5,024 | 21 | 5,044 | 434 | 3,039 | 3,473 | >100 | 45 | 45 |
| Other non-operating income/expense, net | 7 | 0 | 7 | –153 | 0 | –153 | NA | NA | |||
| Finance income | 722 | –491 | 231 | 611 | –282 | 328 | 18 | –30 | |||
| Finance costs | –548 | 192 | –356 | –486 | 159 | –327 | 13 | 9 | |||
| Financial income, net | 175 | –299 | –125 | 125 | –123 | 2 | 40 | NA | |||
| Profit (loss) before tax | 4,970 | –64 | 4,906 | 407 | 2,916 | 3,322 | >100 | 48 | |||
| Income tax expense | –1,425 | –53 | –1,478 | –313 | –787 | –1,100 | >100 | 34 | |||
| Profit (loss) after tax | 3,545 | –117 | 3,428 | 94 | 2,129 | 2,223 | >100 | 54 | |||
| Attributable to owners of parent | 3,477 | –45 | 3,432 | 60 | 2,163 | 2,222 | >100 | 54 | |||
| Attributable to non-controlling interests | 68 | –72 | –4 | 34 | –34 | 0 | 100 | NA | |||
| Key Ratios | |||||||||||
| Operating margin (in %) | 26.5 | 27.8 | 27.7 | 2.7 | 21.3 | 23.9pp | 6.6pp | 6.4pp | |||
| Effective tax rate (in %)1 | 28.7 | 30.1 | 76.9 | 33.1 | –48.3pp | –3.0pp | |||||
| Earnings per share, basic (in €) | 2.98 | 2.94 | 0.05 | 1.91 | >100 | 54 | |||||
1 The difference between our effective tax rate (IFRS) and effective tax rate (non-IFRS) in the first half of 2025 mainly resulted from tax effects of equity securities. The difference between our effective tax rate (IFRS) and effective tax rate (non-IFRS) in the first half of 2024 mainly resulted from tax effects of restructuring expenses.
17/26
| Quarterly Statement Q2 2025 |
(E.7) Reconciliation of Free Cash Flow
| € millions, unless otherwise stated | Q1–Q2 2025 | Q1–Q2 2024 |
| Net cash flows from operating activities | 6,357 | 4,388 |
| Purchase of intangible assets and property, plant, and equipment | –358 | –365 |
| Proceeds from sales of intangible assets and property, plant, and equipment | 78 | 55 |
| Payments of lease liabilities | –138 | –148 |
| Free cash flow | 5,939 | 3,929 |
| Net cash flows from investing activities | –673 | –660 |
| Net cash flows from financing activities | –6,742 | –4,086 |
18/26
| Quarterly Statement Q2 2025 |
(F) Non-IFRS Adjustments – Actuals and Estimates
| € millions, unless otherwise stated | Estimated
Amounts for Full Year 2025 |
Q2 2025 | Q1–Q2 2025 | Q2 2024 | Q1–Q2
2024 |
| Profit (loss) before tax (IFRS) | 2,502 | 4,970 | 1,387 | 407 | |
| Adjustment for acquisition-related charges | 380-460 | 94 | 217 | 87 | 166 |
| Adjustment for restructuring | approximately 100 | 18 | 18 | 631 | 2,873 |
| Adjustment for regulatory compliance matter expenses | 0 | 0 | 0 | 0 | 0 |
| Adjustment for gains and losses from equity securities, net | N/A1 | –91 | –299 | –179 | –123 |
| Profit (loss) before tax (non-IFRS) | 2,524 | 4,906 | 1,926 | 3,322 |
1 Due to the uncertainty and potential variability of gains and losses from equity securities, we cannot provide an estimate for the full year without unreasonable efforts. This item could however have a material impact on our non-IFRS measures below operating profit.
(G) Non-IFRS Operating Expense Adjustments by Functional Areas
| € millions | Q2 2025 | Q2 2024 | ||||||||
| IFRS | Acquisition- Related |
Restruc- turing |
RCM1 | Non-IFRS | IFRS | Acquisition -Related |
Restruc- turing |
RCM1 | Non-IFRS | |
| Cost of cloud | –1,297 | 23 | 0 | 0 | –1,274 | –1,123 | 13 | 0 | 0 | –1,110 |
| Cost of software licenses and support | –313 | 0 | 0 | 0 | –313 | –311 | 0 | 0 | 0 | –311 |
| Cost of services | –797 | 0 | 0 | 0 | –797 | –837 | 0 | 0 | 0 | –837 |
| Research and development | –1,618 | 1 | 0 | 0 | –1,616 | –1,605 | 1 | 0 | 0 | –1,604 |
| Sales and marketing | –2,156 | 68 | 0 | 0 | –2,088 | –2,217 | 65 | 0 | 0 | –2,153 |
| General and administration | –361 | 1 | 0 | 0 | –360 | –336 | 8 | 0 | 0 | –328 |
| Restructuring | –18 | 0 | 18 | 0 | 0 | –631 | 0 | 631 | 0 | 0 |
| Other operating income/expense, net | –11 | 0 | 0 | 0 | –11 | –5 | 0 | 0 | 0 | –5 |
| Total operating expenses | –6,571 | 94 | 18 | 0 | –6,459 | –7,067 | 87 | 631 | 0 | –6,348 |
1 Regulatory Compliance Matters
| € millions | Q1–Q2 2025 | Q1–Q2 2024 | ||||||||
| IFRS | Acquisition- Related |
Restruc- turing |
RCM1 | Non-IFRS | IFRS | Acquisition -Related |
Restruc- turing |
RCM1 | Non-IFRS | |
| Cost of cloud | –2,570 | 48 | 0 | 0 | –2,523 | –2,214 | 25 | 0 | 0 | –2,190 |
| Cost of software licenses and support | –605 | 0 | 0 | 0 | –605 | –637 | 0 | 0 | 0 | –637 |
| Cost of services | –1,638 | 1 | 0 | 0 | –1,637 | –1,699 | 0 | 0 | 0 | –1,699 |
| Research and development | –3,291 | 3 | 0 | 0 | –3,288 | –3,270 | 3 | 0 | 0 | –3,267 |
| Sales and marketing | –4,391 | 163 | 0 | 0 | –4,228 | –4,496 | 129 | 0 | 0 | –4,366 |
| General and administration | –719 | 2 | 0 | 0 | –717 | –696 | 9 | 0 | 0 | –687 |
| Restructuring | –18 | 0 | 18 | 0 | 0 | –2,873 | 0 | 2,873 | 0 | 0 |
| Other operating income/expense, net | –19 | 0 | 0 | 0 | –19 | –9 | 0 | 0 | 0 | –9 |
| Total operating expenses | –13,251 | 217 | 18 | 0 | –13,016 | –15,894 | 166 | 2,873 | 0 | –12,855 |
1 Regulatory Compliance Matters
19/26
| Quarterly Statement Q2 2025 |
If not presented in a separate line item in our income statement, the restructuring expenses would break down as follows:
| € millions | Q2 2025 | Q2 2024 |
| Cost of cloud | 1 | –28 |
| Cost of software licenses and support | 2 | –24 |
| Cost of services | –1 | –107 |
| Research and development | –6 | –144 |
| Sales and marketing | –9 | –284 |
| General and administration | –6 | –43 |
| Restructuring expenses | –18 | –631 |
20/26
| Quarterly Statement Q2 2025 |
(H.1) Segment Policies and Changes
SAP is organized in two operating segments, the Applications, Technology & Support (ATS) segment and the Core Services segment:
| – | The ATS segment represents SAP’s cohesive product portfolio which is holistically steered and commercialized. It primarily generates revenue from cloud subscriptions and from the sale of software licenses and support offerings, and it incurs cost for support, operating our solutions, and the provision of infrastructure. The revenue and cost for services arise for SAP’s training business which is highly integrated with SAP’s product portfolio. |
| – | The Core Services segment supports SAP’s product portfolio by enabling customers to transform their business and accelerate the adoption of innovations. Revenues are mainly generated from professional consulting services and premium support services. Cost is incurred primarily for the delivery of those services. The Core Services segment does not reflect the full services business. |
The segment information for comparative prior periods was restated to conform with the new segment composition.
(H.2) Segment Reporting – Quarter
Applications, Technology & Support (ATS)
€ millions (non-IFRS) |
Q2 2025 | Q2 2024 | |
Actual Currency |
Constant Currency |
Actual Currency | |
| Cloud | 5,130 | 5,298 | 4,153 |
| Software licenses | 194 | 198 | 229 |
| Software support | 2,642 | 2,706 | 2,792 |
| Software licenses and support | 2,835 | 2,904 | 3,021 |
| Cloud and software | 7,966 | 8,201 | 7,174 |
| Services | 70 | 74 | 108 |
| Total segment revenue | 8,036 | 8,275 | 7,282 |
| Cost of cloud | –1,223 | –1,281 | –1,072 |
| Cost of software licenses and support | –278 | –288 | –284 |
| Cost of cloud and software | –1,501 | –1,569 | –1,356 |
| Cost of services | –80 | –83 | –101 |
| Total cost of revenue | –1,581 | –1,652 | –1,457 |
| Segment gross profit | 6,455 | 6,623 | 5,825 |
| Other segment expenses | –3,151 | –3,258 | –3,163 |
| Segment profit (loss) | 3,304 | 3,365 | 2,662 |
Core Services
€ millions (non-IFRS) |
Q2 2025 | Q2 2024 | |
Actual Currency |
Constant Currency |
Actual Currency | |
| Services | 990 | 1,020 | 1,006 |
| Total segment revenue | 990 | 1,021 | 1,006 |
| Cost of cloud | –30 | –31 | –26 |
| Cost of software licenses and support | –10 | –10 | –13 |
| Cost of cloud and software | –39 | –41 | –39 |
| Cost of services | –697 | –718 | –706 |
| Total cost of revenue | –736 | –759 | –745 |
| Segment gross profit | 254 | 262 | 261 |
| Other segment expenses | –137 | –142 | –154 |
| Segment profit (loss) | 117 | 120 | 107 |
21/26
| Quarterly Statement Q2 2025 |
(H.3) Segment Reporting – Year-to-Date
Applications, Technology & Support
€ millions (non-IFRS) |
Q1–Q2 2025 | Q1–Q2 2024 | |
Actual Currency |
Constant Currency |
Actual Currency | |
| Cloud | 10,124 | 10,234 | 8,082 |
| Software licenses | 377 | 381 | 432 |
| Software support | 5,403 | 5,443 | 5,621 |
| Software licenses and support | 5,780 | 5,824 | 6,052 |
| Cloud and software | 15,904 | 16,058 | 14,134 |
| Services | 150 | 153 | 209 |
| Total segment revenue | 16,054 | 16,211 | 14,343 |
| Cost of cloud | –2,432 | –2,470 | –2,119 |
| Cost of software licenses and support | –553 | –561 | –584 |
| Cost of cloud and software | –2,985 | –3,031 | –2,703 |
| Cost of services | –182 | –183 | –200 |
| Total cost of revenue | –3,166 | –3,214 | –2,902 |
| Segment gross profit | 12,888 | 12,997 | 11,440 |
| Other segment expenses | –6,432 | –6,514 | –6,478 |
| Segment profit (loss) | 6,456 | 6,483 | 4,963 |
Core Services
€ millions (non-IFRS) |
Q1–Q2 2025 | Q1–Q2 2024 | |
Actual Currency |
Constant Currency |
Actual Currency | |
| Services | 1,985 | 2,000 | 1,985 |
| Total segment revenue | 1,985 | 2,000 | 1,985 |
| Cost of cloud | –59 | –60 | –53 |
| Cost of software licenses and support | –20 | –21 | –26 |
| Cost of cloud and software | –79 | –81 | –79 |
| Cost of services | –1,413 | –1,430 | –1,439 |
| Total cost of revenue | –1,493 | –1,510 | –1,518 |
| Segment gross profit | 492 | 490 | 467 |
| Other segment expenses | –287 | –290 | –320 |
| Segment profit (loss) | 206 | 200 | 147 |
22/26
| Quarterly Statement Q2 2025 |
(I) Revenue by Region (IFRS and Non-IFRS)
(I.1) Revenue by Region (IFRS and Non-IFRS) – Quarter
| € millions | Q2 2025 | Q2 2024 | ∆ in % | |||
| Actual currency | Currency Impact |
Constant Currency |
Actual currency | Actual currency | Constant Currency | |
| Cloud Revenue by Region | ||||||
| EMEA | 2,163 | 14 | 2,177 | 1,673 | 29 | 30 |
| Americas | 2,215 | 129 | 2,343 | 1,914 | 16 | 22 |
| APJ | 753 | 25 | 778 | 566 | 33 | 37 |
| Cloud revenue | 5,130 | 168 | 5,298 | 4,153 | 24 | 28 |
| Cloud and Software Revenue by Region | ||||||
| EMEA | 3,669 | 17 | 3,686 | 3,215 | 14 | 15 |
| Americas | 3,106 | 182 | 3,288 | 2,912 | 7 | 13 |
| APJ | 1,191 | 37 | 1,228 | 1,047 | 14 | 17 |
| Cloud and software revenue | 7,966 | 236 | 8,202 | 7,175 | 11 | 14 |
| Total Revenue by Region | ||||||
| Germany | 1,412 | 1 | 1,414 | 1,283 | 10 | 10 |
| Rest of EMEA | 2,746 | 19 | 2,765 | 2,444 | 12 | 13 |
| Total EMEA | 4,158 | 21 | 4,179 | 3,727 | 12 | 12 |
| United States | 2,829 | 145 | 2,974 | 2,701 | 5 | 10 |
| Rest of Americas | 725 | 63 | 787 | 690 | 5 | 14 |
| Total Americas | 3,554 | 208 | 3,761 | 3,392 | 5 | 11 |
| Japan | 392 | –7 | 385 | 337 | 16 | 14 |
| Rest of APJ | 923 | 48 | 971 | 833 | 11 | 17 |
| Total APJ | 1,315 | 41 | 1,356 | 1,170 | 12 | 16 |
| Total revenue | 9,027 | 269 | 9,296 | 8,288 | 9 | 12 |
23/26
| Quarterly Statement Q2 2025 |
(I.2) Revenue by Region (IFRS and Non-IFRS) – Year-to-Date
| € millions | Q1–Q2 2025 | Q1–Q2 2024 | ∆ in % | |||
| Actual Currency | Currency Impact |
Constant Currency |
Actual Currency | Actual Currency |
Constant Currency | |
| Cloud Revenue by Region | ||||||
| EMEA | 4,195 | –3 | 4,192 | 3,230 | 30 | 30 |
| Americas | 4,446 | 90 | 4,536 | 3,761 | 18 | 21 |
| APJ | 1,483 | 23 | 1,507 | 1,090 | 36 | 38 |
| Cloud revenue | 10,124 | 110 | 10,234 | 8,082 | 25 | 27 |
| Cloud and Software Revenue by Region | ||||||
| EMEA | 7,208 | –5 | 7,203 | 6,325 | 14 | 14 |
| Americas | 6,315 | 124 | 6,439 | 5,776 | 9 | 11 |
| APJ | 2,382 | 34 | 2,416 | 2,034 | 17 | 19 |
| Cloud and software revenue | 15,904 | 154 | 16,058 | 14,134 | 13 | 14 |
| Total Revenue by Region | ||||||
| Germany | 2,791 | –2 | 2,790 | 2,520 | 11 | 11 |
| Rest of EMEA | 5,400 | –4 | 5,396 | 4,804 | 12 | 12 |
| Total EMEA | 8,191 | –6 | 8,186 | 7,323 | 12 | 12 |
| United States | 5,781 | 59 | 5,840 | 5,369 | 8 | 9 |
| Rest of Americas | 1,437 | 81 | 1,519 | 1,359 | 6 | 12 |
| Total Americas | 7,219 | 141 | 7,359 | 6,728 | 7 | 9 |
| Japan | 789 | –10 | 779 | 662 | 19 | 18 |
| Rest of APJ | 1,841 | 47 | 1,888 | 1,615 | 14 | 17 |
| Total APJ | 2,630 | 37 | 2,668 | 2,277 | 16 | 17 |
| Total revenue | 18,040 | 172 | 18,212 | 16,329 | 10 | 12 |
24/26
| Quarterly Statement Q2 2025 |
(J) Employees by Region and Functional Areas
| Full-time equivalents | 06/30/2025 | 06/30/2024 | ||||||
| EMEA | Americas | APJ | Total | EMEA | Americas | APJ | Total | |
| Cloud and software | 4,553 | 4,486 | 5,109 | 14,148 | 4,434 | 4,148 | 4,448 | 13,029 |
| Services | 8,237 | 4,681 | 5,814 | 18,732 | 8,292 | 4,618 | 5,410 | 18,320 |
| Research and development | 18,063 | 5,761 | 13,349 | 37,174 | 18,073 | 5,441 | 12,331 | 35,844 |
| Sales and marketing | 11,694 | 9,793 | 4,981 | 26,467 | 12,053 | 9,438 | 5,112 | 26,603 |
| General and administration | 3,903 | 1,910 | 1,343 | 7,157 | 3,640 | 1,723 | 1,291 | 6,653 |
| Infrastructure | 3,123 | 1,152 | 976 | 5,252 | 2,845 | 1,129 | 890 | 4,865 |
| SAP Group (06/30) | 49,574 | 27,783 | 31,573 | 108,929 | 49,337 | 26,496 | 29,482 | 105,315 |
| Thereof acquisitions1 | 0 | 0 | 0 | 0 | 0 | 0 | 0 | 0 |
| SAP Group (six months' end average) | 49,038 | 27,695 | 31,264 | 107,997 | 49,414 | 27,689 | 29,745 | 106,848 |
1 Acquisitions closed between January 1 and June 30 of the respective year.
25/26
| Quarterly Statement Q2 2025 |
SAP’s share-based payment expenses included in SAPs non-IFRS operating expenses break down as follows:
| € millions | Q2 2025 | Q1–Q2 2025 | Q2 2024 | Q1–Q2 2024 |
| Cost of cloud | –33 | –59 | –34 | –73 |
| Cost of software licenses and support | –9 | –16 | –11 | –22 |
| Cost of services | –72 | –133 | –89 | –192 |
| Research and development | –190 | –326 | –191 | –403 |
| Sales and marketing | –180 | –331 | –218 | –476 |
| General and administration | –45 | –84 | –48 | –114 |
| Share-based payment expenses | –529 | –949 | –592 | –1,280 |
The decrease in share-based payment expenses is mainly due to a lower increase in the SAP share price as compared to 2024 (around €22 in the first half of 2025; around €50 in the first half of 2024) as well as lower grant volumes as compared to prior years. Income for the hedging of cash-settled share-based compensation programs amounted to €30 million in the first half of 2025 (first half of 2024: €0 million). For more information about share-based payment expenses, see the Notes to the Consolidated Half-Year Financial Statements, Note (B.3).
Additionally, in the second quarter of 2025 SAP recognized €6 million (Q2/2024: €107 million) of accelerated share-based payment expenses triggered by the transformation program. In the first half of 2025 accelerated share-based payment expenses amounting to €19 million (HY1/2024: €189 million) have been recognized. These share-based payment expenses are classified as restructuring expenses in SAP’s consolidated income statements.
Associated share-based payments in the first half of 2025 amounted to €62 million (HY1/2024: €2 million) and are classified as a decrease in provisions and other liabilities in SAP’s consolidated statements of cash flows.
26/26