UNITED STATES
SECURITIES AND EXCHANGE COMMISSION
Washington, D.C. 20549
FORM
CURRENT REPORT
Pursuant to Section 13 or 15(d) of the Securities Exchange Act of 1934
Date of Report (Date of earliest event reported):
(Exact name of registrant as specified in its charter)
| (State or other jurisdiction of incorporation or organization) |
(Commission File Number) | (I.R.S. Employer Identification No.) |
| (Address of principal executive offices) | (Zip Code) | |
Registrant’s telephone number, including
area code: (
(Former name or former address, if changed since last report)
Check the appropriate box below if the Form 8-K filing is intended to simultaneously satisfy the filing obligation of the registrant under any of the following provisions:
| Written communications pursuant to Rule 425 under the Securities Act (17 CFR 230.425) | |
| Soliciting material pursuant to Rule 14a-12 under the Exchange Act (17 CFR 240.14a-12) | |
| Pre-commencement communications pursuant to Rule 14d-2(b) under the Exchange Act (17 CFR 240.14d-2(b)) | |
| Pre-commencement communications pursuant to Rule 13e-4(c) under the Exchange Act (17 CFR 240.13e-4(c)) |
Securities registered pursuant to Section 12(b) of the Act:
| Title of each class | Trading Symbol(s) | Name of each exchange on which registered | ||
Indicate by check mark whether the registrant is an emerging growth company as defined in Rule 405 of the Securities Act of 1933 (§230.405 of this chapter) or Rule 12b-2 of the Securities Exchange Act of 1934 (§240.12b-2 of this chapter).
Emerging growth company
If an emerging growth company, indicate by check mark if the registrant has elected not to use the extended transition period for complying with any new or revised financial accounting standards provided pursuant to Section 13(a) of the Exchange Act. ¨
Item 7.01 Regulation FD Disclosure.
On September 23, 2026, Ivanhoe Electric Inc. (the “Company” or “Ivanhoe Electric”) issued a press release announcing the release of a report entitled “S-K 1300 Preliminary Feasibility Study & Technical Report Summary, Santa Cruz Copper Project, Arizona”, dated September 23, 2026, (the “2026 PFS”) for the Company’s Santa Cruz Copper Project located west of Casa Grande, Arizona (the “Santa Cruz Copper Project” or the “Project”). A copy of the Company’s press release dated September 23, 2026, relating to the 2026 PFS is furnished as Exhibit 99.2 to this Form 8-K.
The Company intends to hold an investor call to discuss the release of the 2026 PFS on September 23, 2026, where a slideshow presentation discussing the results of the 2026 PFS will be presented. A copy of the slideshow presentation is furnished as Exhibit 99.3 to this Form 8-K.
The information contained in Exhibit 99.2 and 99.3 hereto shall not be deemed “filed” for purposes of Section 18 of the Securities Exchange Act of 1934, as amended (the “Exchange Act”), or otherwise subject to the liabilities of that section, nor shall it be deemed incorporated by reference into any other filing under the Securities Act of 1933, as amended, or the Exchange Act, except as expressly set forth by specific reference in such a filing.
Item 8.01 Other Events.
Updated Preliminary Feasibility Study for the Santa Cruz Copper Project
On September 23, 2026, the Company provided an updated Preliminary Feasibility Study & Technical Report Summary for its Santa Cruz Copper Project, dated September 23, 2026, prepared in accordance with the Securities and Exchange Commission S-K regulations (Title 17, Part 229, Items 601 and 1300 through 1305) for the Company by the following third-party qualified persons: BBA Consultants USA LP (“BBA”), Worley Group Inc. (“Worley”), Burns & McDonnell Engineering Company, Inc. (“Burns & McDonnell”), Haley & Aldrich, Inc. (“H&A”), INTERA Incorporated (“INTERA”), KCB Consultants Ltd. (“KCB”), Life Cycle Geo, LLC (“LCG”), Met Engineering, LLC (“Met Engineering”), Paterson & Cooke USA, Ltd. (“P&C”), Stantec Consulting Services Inc. (“Stantec”), and Tetra Tech, Inc. (“Tetra Tech”). None of the qualified persons is affiliated with the Company or any other entity that has an ownership, royalty, or other interest in the property.
Mineral resources and mineral reserves are reported using the definitions in Subpart 229.1300 – Disclosure by Registrants Engaged in Mining Operations in Regulation S-K 1300 (“S-K 1300”). All capital and operating cost estimates meet the requirements of S-K 1300, with an expected accuracy of -20% to +25%. A contingency of <15% has been applied to capital cost estimates. Unless otherwise indicated, all financial values are reported in United States dollars (currency abbreviation: USD; currency symbol: US$) including all operating costs, capital costs, cash flows, taxes, revenues, expenses, and overhead distributions. All pricing is considered in second quarter 2026 dollars. Unless otherwise indicated, capital and operating costs do not include tariffs or escalations. Totals may not sum correctly due to rounding.
The information below is based on, or extracted from, the 2026 PFS. The 2026 PFS replaces and supersedes the prior S-K 1300 technical report summary for the Santa Cruz Copper Project, dated June 23, 2025.
Property Setting
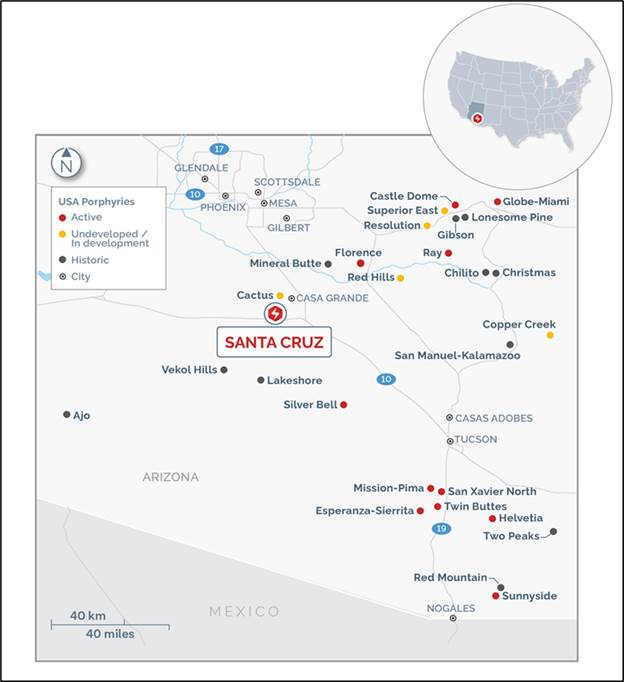
The Project is a 92 km drive south of the greater Phoenix metropolitan area and is accessed via the West Gila Bend Highway (“Highway 84”) 11 km west of the city of Casa Grande, which has a population of approximately 57,700.
The greater Phoenix area is a major population center, with approximately 4.8 million people, and features an international airport, Phoenix Sky Harbor International Airport, and well-developed infrastructure and services that support the mining industry.
The climate in the Project area is typical of the Sonoran Desert, with temperatures ranging from -7°C to 47°C (19°F to 117°F) and an annual precipitation average ranging from 76 to 500 mm (3 to 30 inches) per year. Mining and exploration activities can be performed year-round, as there are no limiting weather or accessibility factors.
Santa Cruz Copper Project Location
Source: Ivanhoe Electric, 2026
Mineral Tenure, Ownership, Surface Rights and Royalties
The Santa Cruz Copper Project is 100% owned by Ivanhoe Electric through its wholly-owned subsidiary, Mesa Cobre Holding Corporation (“Mesa Cobre”).
Mineral Tenure
In 2021, Ivanhoe Electric acquired 238 unpatented mining lode claims from Central Arizona Resources, Ltd. (“CAR”). In addition, Ivanhoe Electric acquired fee simple mineral title for two further land parcels: “CG100” and “Skull Valley”. In 2022, Ivanhoe Electric acquired the 0.08 km2 (20-acre) “Skull Valley” property from Skull Valley Capital, LLC in the southeastern area of the Project and the 0.41 km2 (100.33-acre) “CG100” from CG 100 Land Partners LLC in the northeastern area of the Project.
In 2023, Ivanhoe Electric acquired 16 Arizona State Land Department mineral exploration permits covering 27.95 km2 (~6,900 acres) of state mineral land. In 2024, Ivanhoe Electric exercised the agreement with D.R. Horton Phoenix East Construction, Inc. (“DRH”), granting Ivanhoe Electric, through Mesa Cobre, 100% of the mineral title for 26.0 km2 (~6,425 acres) of fee simple mineral estate, 39 federal unpatented mining lode claims (bringing the total claims controlled by Ivanhoe Electric to 277), and 26.6 km2 (~642.5 acres) of Stock-Raising Homestead Act lands.
The total Project area comprises fee simple land along with unpatented mining lode claims and Arizona State Land Department Mineral Exploration Permits. Annual renewal fees for the unpatented mining lode claims and mineral exploration permits have been made as required. The area of proposed mine activity lies on fee simple land. Mineral control is summarized in the below table and figure.
Summary of Ivanhoe Electric’s Mineral Control
| Land Designation | Area (km2) |
| Fee Simple Mineral Ownership | 25.98 |
| Unpatented Mining Lode Claims (277 claims) | 19.30 |
| Arizona State Land Department Mineral Exploration Permits (16 permits) | 30.47 |
Santa Cruz Copper Project Mineral Control Map
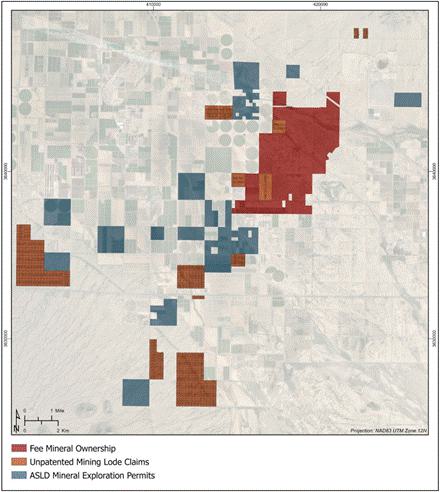
Source: Ivanhoe Electric, 2026
Surface & Water Rights
In 2022, Ivanhoe Electric acquired the surface rights to two land parcels: the 0.08 km2 (20-acre) Skull Valley property from Skull Valley Capital, LLC in the southeastern area of the Project and a 0.41 km2 (100.33-acre) land parcel “CG100” from CG 100 Land Partners LLC in the northeastern area of Project. In August 2024, Ivanhoe Electric acquired the surface title to three 0.04 km2 (10-acre) parcels located in various areas of the Project along with the mineral rights from DRH. The majority of the surface rights for the Santa Cruz Copper Project were acquired in 2023. Surface rights are shown in the below figure. Ivanhoe Electric acquired both Grandfathered Irrigation Rights (“GFR”) and Grandfathered Type 1 Non-irrigation Water Rights as part of its 2023 private land purchase. These rights provide approximately 3,600 acre-feet (“acre-ft”) per year of water for Project use.
Ivanhoe Electric Surface Control Map
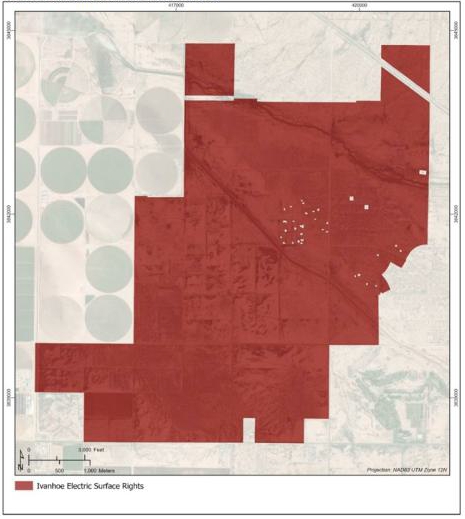
Source: Ivanhoe Electric, 2026
Royalties
Noted royalties on future mineral development of the Project are summarized in the below table and figure.
Royalties Applying to the Santa Cruz Copper Project
| Royalty Owner | Royalty Description |
| Royalty Owner A | 10% of 1/800th of the fair market value for refined copper, which amount is set by the value listed in the successor index to Metals Week as of the date the solution extraction / electrowinning (“SX/EW”) process is completed |
| Royalty Owner B | 60% of 1/800th of the fair market value for refined copper, which amount is set by the value listed in the successor index to Metals Week as of the date the SX/EW process is completed |
| Royalty Owner C | 2% NSR |
| Royalty Owner D | 0.15% net smelter return |
| Royalty Owner E | ½ of 1% net smelter return or ½ of 1% of 60% net smelter return if product is disposed of other than to a commercial smelter |
| Royalty Owner F | 10% net smelter return (capped at $7 million) |
| Royalty Owner G | 5% net smelter return |
| Royalty Owner H | 1% net smelter return |
| Royalty Owner I | $0.015/lbs of copper of additional mineable reserve copper over 2 billion pounds (“Blbs”) as determined by the “Definitive Feasibility Study” or by production beyond the amount estimated in the “Definitive Feasibility Study”; the royalty owner has the option to require payment in Ivanhoe Electric common stock at a 10% discount to the five-day volume weighted average price |
Extent of Royalties
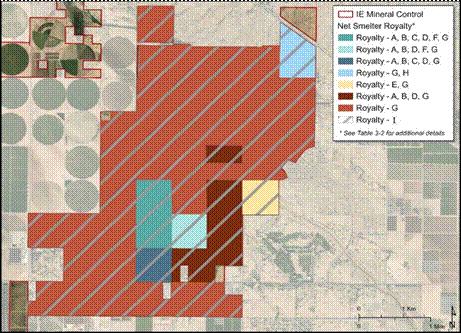
Source: Ivanhoe Electric, 2026
History
Copper mineralization, first discovered in the region in the 1960s, led to extensive drill programs across the Project area. Exploration programs by several companies and joint ventures included diamond drilling and several geophysical surveys from the 1960s through the 1990s.
Ivanhoe Electric gained access to the land in August 2021 to start drill programs, completed a Mineral Resource estimate in 2022, an updated Mineral Resource estimate in early 2023, an initial assessment in September 2023, and a preliminary feasibility study in June 2025.
Geology & Mineralization
The Santa Cruz Copper Project is situated within the Southwestern Porphyry Copper Belt, which is home to numerous productive copper deposits. Notable examples in Arizona include Mineral Park, Bagdad, Resolution, Miami-Globe, San Manuel-Kalamazoo, Ray, Morenci, Sierrita, Twin Buttes, and the historically significant Sacaton Mine. These deposits are part of the larger physiographical area known as the Basin and Range Province, which covers much of the southwestern United States.
The porphyry copper deposits in the Southwestern Porphyry Copper Belt are the result of igneous activity during the Laramide Orogeny, which occurred between 50 and 80 million years ago. This geological event was driven by the subduction of the Farallon Tectonic Plate beneath the North American Tectonic Plate, resulting in the formation of a magmatic arc and the development of associated porphyry copper systems.
The Project comprises four separate areas along a southwest-northeast corridor. These areas from southwest to northeast are known as the Southwest exploration area, the Santa Cruz deposit, the East Ridge deposit, and the Texaco deposit, all of which represent portions of one or more large porphyry copper systems separated by extensional Basin and Range normal faults. Each area has experienced variable periods of erosion, supergene enrichment, fault displacement, and tilting into their present positions.
Mineralization in the Project area is divided into the following:
| · | Supergene copper oxide mineralization mainly consists of atacamite and chrysocolla, with smaller amounts of cuprous goethite, copper-bearing smectite clays, tenorite, cuprite, copper wad, and native copper; |
| · | Secondary supergene sulfide mineralization is dominantly chalcocite, which replaces hypogene sulfide; |
| · | Primary hypogene sulfide mineralization consists of chalcopyrite and molybdenite hosted within quartz-sulfide stringers, veins, and breccias. |
Exploration, Drilling & Sampling
Ivanhoe Electric has completed geophysical surveys including two-dimensional, three-dimensional, multichannel seismic, reprocessing of proprietary Typhoon™ three-dimensional perpendicular pole dipole induced polarization data, and ambient noise tomography. The geophysical datasets from these surveys were used to assist with geological interpretation and improved drill targeting.
A comprehensive surface ionic leach sampling program has also been completed across the Project to assess in detecting copper mineralization at depth.
Drilling within the Santa Cruz Copper Project property totals 484 drillholes for 354,655 m of drilling. Of this total, 329 drillholes for 279,164 m were used in support of the Mineral Resource. The 155 drillholes excluded from the estimation do not intersect the deposit or did not have relevant information for estimation, such as shallow sonic holes with no assay samples taken.
Detailed core logging is performed by Ivanhoe Electric geologists through digital data input into MX Deposit. Data that are logged include lithology, alteration, mineralization, veining, petrophysical data, and geotechnical parameters, such as faults, joints, fractures, hardness, and rock quality (Q-system) parameters. Additional characterization fields such as rock colors, grain sizes, textures, and supergene weathering features were also captured.
Approximately 6,295 density measurements from 210 drillholes were measured for the Santa Cruz, East Ridge, and Texaco deposits.
Quality assurance and quality control (“QA/QC”) for the Ivanhoe Electric drill programs consisted of inserting duplicates, blanks, and certified reference materials (standards) into the sample stream at set sampling intervals. BBA’s review of the data indicated no material issues.
Ivanhoe Electric used 222 drillholes totaling over 70 km of geotechnical drilling to analyze geotechnical characterization of the Santa Cruz and East Ridge deposits. Historical drillholes were selected based on availability of rock quality designation data.
The groundwater flow model was calibrated and used to predict the residual passive inflows for the prefeasibility study mine plan. The predicted residual passive inflows resulting from the updated model, with grouting applied, indicate that the residual passive inflows for the first 10 years of the mine are at or below 7,200 gallons per minute (“gal/min”), compared to the 12,000 gal/min estimated in the initial assessment (“IA”) model, in addition to 2 years of 3,000 gal/min of active pumping. From Years 11 through 25, the residual passive inflows in the updated model range from approximately 3,500 to 7,200 gal/min, compared to 15,000 to 18,000 gal/min predicted in the IA model.
Data Verification
BBA personnel in the disciplines of geology, Mineral Resource estimation, Mineral Reserve estimation, and mining visited the Project site in 2024. During the visit, BBA personnel reviewed and verified data acquisition procedures with Ivanhoe Electric personnel, visited active drill sites, and performed several other verification checks to ensure data integrity.
Based on the data made available, BBA considers that a reasonable level of verification has been completed and that no material issues were identified from the programs. It is BBA’s opinion that the geological data collection and QA/QC procedures used by Ivanhoe Electric are consistent with current industry practices and that the geological database is of suitable quality to support a Mineral Resource estimate.
Metallurgical Testwork
Metallurgy and processing test work were directed by Met Engineering, LLC and conducted at McClelland Labs (“MLI”) in Sparks, Nevada, USA, at Blue Coast Research (“BCR”) in Parksville, British Columbia, Canada and at Kappes, Cassidy and Associates (“KCA”) in Reno, Nevada, USA.
Metallurgical testwork included the following:
| · | Establishing copper recoveries, based on sequential coppers for chloride-assisted, weak-sulfuric acid, heap leaching of mineralized material at the Santa Cruz Copper Project. |
| · | Determining commercial operating parameters for heap leaching mineralized material at the Santa Cruz Copper Project, including salt usage, sulfuric acid usage, ore cure/agglomeration practices, leach cell cycle times for an on/off leach pad design, annual pregnant leach solution grades, and pregnant leach solution flow rate to solvent extraction. |
| · | Additional testing at KCA in 2025-2026 answered a number of questions related to the process design criteria for value engineering: Extraction (PLS)/recovery (to cathode) at 8-m lift, optimal chloride level, use ILS or not, use rest-rinse or continuous irrigation, copper level in the irrigation solution, particle size, etc. |
A grade-recovery equation was developed based on sequential copper assays. For the life-of-mine processing, this equation produces a weighted average of 92.3% total copper recovery to cathode for leaching an 8 m lift of ore crushed to 100% passing 9.5 mm for 220 days of irrigation utilizing an on/off leach pad.
There are no deleterious elements or factors that could have a significant effect on economic extraction of the copper in the mineralized material.
Mineral Resource Estimate
Estimation Methodology
The Santa Cruz deposit has approximately 194,000 m of drilling in 226 drillholes; East Ridge has approximately 49,000 m of drilling in 62 holes; and Texaco has approximately 36,000 m of drilling in 41 holes.
Geological domains were developed for the Project based on alteration, lithological, and mineralogical characteristics, incorporating regional and local structural information. Normal faults separate the mineralization at the Santa Cruz, East Ridge, and Texaco deposits.
The Santa Cruz deposit was divided into several mineral domains: exotic domain, verde domain, leach cap, oxide domain, chalcocite enriched domain, and primary mineralization domain. The East Ridge deposit consists of a mix of oxide and chalcocite enriched domains. The Texaco deposit consists of all domains except for leach cap and exotic. The domains were further divided into subdomains based on individual grade profiles, which align with controls on mineralization. The following terms are assigned to the subdomains; these represent a local definition of the grade profile: high-grade, medium-grade, and low-grade.
Exploratory data analysis was conducted to determine the nature of element distribution and correlation of grades within individual lithological units, and to identify high-grade outlier samples. Capping was not applied to copper values as significant outliers were not identified. Samples were composited to 2 m intervals. Variograms were completed by subdomain for each deposit.
The resource estimation methodology constrains the mineralization by using hard wireframe boundaries. Ordinary kriging (“OK”) was employed for the Santa Cruz deposit, and inverse distance squared (“ID2”) was selected for the East Ridge and Texaco deposits. Multiple search passes were used for each deposit. Search parameters were based on variography and continuity of mineralization.
Validation checks were completed on the Mineral Resource estimates. These included visual comparison of estimated grade to composite grade, domain conformity, swath plots, and comparisons to alternate estimation methods.
Indicated and Inferred classification was applied to the Santa Cruz, East Ridge, and Texaco deposits based on BBA’s review that included the examination of drill spacing, visual comparison, kriging variance, distance to the nearest composite, and search pass, along with the search ellipsoid ranges. Collectively, this information was used to produce an initial classification script followed by manual wireframe application to further limit the Mineral Resource classification.
Mineral Resources used commodity prices based on long-term analyst and bank forecasts. In the opinion of BBA, this price is generally aligned with pricing over the last 1, 3, and 5 years; forward-looking pricing from internationally recognized banks is appropriate for use in a Mineral Resource estimate. Section 16 provides an explanation of the commodity price forecasts. The commodity price considered 3-year trailing averages.
Mineral Resource Statement
The Mineral Resources in this estimate were independently prepared, including estimation and classification, by BBA in accordance with the definition for Mineral Resources in S-K 1300 regulations. The in-situ Mineral Resource estimates for the Santa Cruz, East Ridge, and Texaco deposits, inclusive and exclusive of reserves, are presented in the below tables, respectively.
In-situ Mineral Resource Estimate Inclusive of Reserves for Santa Cruz, East Ridge & Texaco
| Deposit | Classification | Tonnes (kt) |
Total
Copper (%) |
Acid
Soluble Copper (%) |
Cyanide Leach |
Residual Copper (%) |
Gold (g/t) |
Silver (g/t) |
Contained Copper (kt) |
Total Acid Soluble Copper (kt) | Total Cyanide Cu (kt) |
Total Residual |
Contained Gold (koz) |
Contained Silver (koz) |
Contained Copper (Mlbs) |
| Santa Cruz | Indicated | 317,709 | 0.95 | 0.48 | 0.30 | 0.17 | 0.027 | 1.62 | 3,017 | 1,517 | 956 | 543 | 279 | 16,513 | 6,650 |
| Inferred | 31,998 | 0.73 | 0.21 | 0.17 | 0.34 | 0.021 | 1.78 | 232 | 68 | 54 | 110 | 21 | 1,832 | 512 | |
| East Ridge | Indicated | 8,742 | 1.00 | 0.45 | 0.39 | 0.16 | 0.014 | 0.68 | 88 | 40 | 34 | 14 | 4 | 191 | 193 |
| Inferred | 48,676 | 0.89 | 0.44 | 0.12 | 0.33 | 0.006 | 0.40 | 436 | 216 | 57 | 163 | 9 | 623 | 960 | |
| Texaco | Inferred | 341,345 | 0.78 | 0.06 | 0.27 | 0.45 | 0.028 | 0.81 | 2,664 | 218 | 920 | 1,537 | 302 | 8,850 | 5,873 |
| All Deposits | Indicated | 326,450 | 0.95 | 0.48 | 0.30 | 0.17 | 0.027 | 1.59 | 3,104 | 1,557 | 989 | 558 | 283 | 16,704 | 6,844 |
| All Deposits | Inferred | 422,020 | 0.79 | 0.12 | 0.24 | 0.43 | 0.025 | 0.83 | 3,332 | 503 | 1,030 | 1,809 | 333 | 11,304 | 7,346 |
Notes on Mineral Resources:
1. The Mineral Resources in this estimate were independently prepared, including estimation and classification, by BBA Consultants USA LP, and are reported in accordance with the definition for Mineral Resources in S-K 1300.
2. Mineral Resources that are not Mineral Reserves do not have demonstrated economic viability.
3. Mineral Resources are reported in situ, inclusive of Mineral Reserves.
4. The Mineral Resources for Santa Cruz, East Ridge, and Texaco deposit were completed using Datamine Studio RM software.
5. The Mineral Resources are current at September 23, 2026.
6. Mineral Resources constrained assuming underground mining methods for the Santa Cruz deposit are reported at an NSR cutoff of US$32.00 for heap leach and US$34.00 for concentrator; Texaco deposit is reported at an NSR cutoff of US$32.00 for heap leach and US$34.00 for concentrator; and East Ridge deposit is reported at an NSR cutoff of US$40.00 for longhole stoping and US$50.00 for drift-and-fill. The cutoff reflects the total operating costs to define reasonable prospects for economic extraction by conventional underground mining methods. Material from within mineable shape-optimized wireframes has been included in the Mineral Resource. Underground mineable shapes optimization parameters include a long-term copper price of US$4.00/lb, gold price of US$1,900/oz, and silver price of US$24.00/oz. Process costs of US$7.00 to US$9.00 per processed tonne; direct mining costs between US$22.00 to US$40.00 per processed tonne reflecting various mining method costs (leach, longhole or drift-and-fill), mining general and administration costs of US$2.63 per processed tonne, on-site processing costs between US$31.63 to US$49.63 per processed tonne, along with variable royalties between 5.01% to 6.96% NSR, and a mining recovery of 100%.
7. Mineral Resources are estimated using metallurgical recoveries for heap leach of 96% for acid-soluble copper, 83% for cyanide-soluble copper, 22% for residual copper, 0% for gold and 0% for silver. Recoveries for concentrator are 0% for acid-soluble copper, 90% for cyanide-soluble copper, 90% for residual copper, 59% for gold, and 69% for silver.
8. Density was applied using weighted averages by deposit subdomain.
9. Rounding, as required by reporting guidelines, may result in apparent summation differences between tonnes, grade, and contained metal content.
In-situ Mineral Resource Estimate Exclusive of Reserves for Santa Cruz, East Ridge & Texaco
| Deposit | Classification | Tonnes
(kt) |
Total
Copper (%) |
Acid
Soluble Copper (%) |
Cyanide Leach Copper (%) |
Residual Copper (%) |
Gold (g/t) |
Silver (g/t) |
Contained Copper (kt) |
Total
Acid Soluble Cu (kt) |
Total Cyanide Cu (kt) |
Total Residual Cu (kt) |
Contained Gold (koz) |
Contained Silver (koz) |
Contained Copper (Mlbs) |
| Santa Cruz | Indicated | 177,547 | 0.79 | 0.32 | 0.20 | 0.27 | 0.025 | 1.45 | 1,403 | 570 | 362 | 471 | 140 | 8,279 | 3,092 |
| Inferred | 31,998 | 0.73 | 0.21 | 0.17 | 0.34 | 0.021 | 1.78 | 232 | 68 | 54 | 110 | 21 | 1,832 | 512 | |
| East Ridge | Indicated | 4,412 | 0.94 | 0.43 | 0.31 | 0.20 | 0.015 | 0.71 | 41 | 19 | 14 | 9 | 2 | 101 | 91 |
| Inferred | 48,676 | 0.89 | 0.44 | 0.12 | 0.33 | 0.006 | 0.40 | 436 | 216 | 57 | 163 | 9 | 623 | 960 | |
| Texaco | Inferred | 341,345 | 0.78 | 0.06 | 0.27 | 0.45 | 0.028 | 0.81 | 2,664 | 218 | 920 | 1,537 | 302 | 8,850 | 5,873 |
| All Deposits | Indicated | 182,959 | 0.79 | 0.32 | 0.21 | 0.26 | 0.024 | 1.43 | 1,444 | 589 | 376 | 480 | 143 | 8,380 | 3,184 |
| All Deposits | Inferred | 422,020 | 0.79 | 0.12 | 0.24 | 0.43 | 0.025 | 0.83 | 3,332 | 503 | 1,030 | 1,809 | 333 | 11,304 | 7,346 |
Notes on Mineral Resources:
1. The Mineral Resources in this estimate were independently prepared, including estimation and classification, by BBA Consultants USA LP, and are reported in accordance with the definition for Mineral Resources in S-K 1300.
2. Mineral Resources that are not Mineral Reserves do not have demonstrated economic viability.
3. Mineral Resources are reported in situ, exclusive of Mineral Reserves.
4. The Mineral Resources for Santa Cruz, East Ridge, and Texaco deposit were completed using Datamine Studio RM software.
5. The Mineral Resources are current at September 23, 2026.
6. Mineral Resources constrained assuming underground mining methods for the Santa Cruz deposit are reported at an NSR cutoff of US$32.00 for heap leach and US$34.00 for concentrator; Texaco deposit is reported at an NSR cutoff of US$32.00 for heap leach and US$34.00 for concentrator; and East Ridge deposit is reported at an NSR cutoff of US$40.00 for longhole stoping and US$50.00 for drift-and-fill. The cutoff reflects the total operating costs to define reasonable prospects for economic extraction by conventional underground mining methods. Material from within mineable shape-optimized wireframes has been included in the Mineral Resource. Underground mineable shapes optimization parameters include a long-term copper price of US$4.00/lb, gold price of US$1,900/oz, and silver price of US$24.00/oz. Process costs of US$7.00 to US$9.00 per processed tonne; direct mining costs between US$22.00 to US$40.00 per processed tonne reflecting various mining method costs (leach, longhole or drift-and-fill), mining general and administration costs of US$2.63 per processed tonne, on-site processing costs between US$31.63 to US$49.63 per processed tonne, along with variable royalties between 5.01% to 6.96% NSR, and a mining recovery of 100%.
7. Mineral Resources are estimated using metallurgical recoveries for heap leach of 96% for acid-soluble copper, 83% for cyanide-soluble copper, 22% for residual copper, 0% for gold and 0% for silver. Recoveries for concentrator are 0% for acid-soluble copper, 90% for cyanide-soluble copper, 90% for residual copper, 59% for gold, and 69% for silver.
8. Density was applied using weighted averages by deposit subdomain.
9. Rounding, as required by reporting guidelines, may result in apparent summation differences between tonnes, grade, and contained metal content.
The current resource model iterations have not changed when compared to the iterations released in the 2025 PFS. Differences presented in Mineral Resources Exclusive of Mineral Reserves are due to the addition of stopes at the top of the mine.
Factors That May Affect the Mineral Resource Estimate
| · | Areas of uncertainty that may materially impact the Mineral Resource estimates are as follows: |
| · | Changes to long-term metal price assumptions; |
| · | Changes to the input values for mining, processing, and general and administrative (“G&A”) costs to constrain the estimate; |
| · | Changes to local interpretations of mineralization geometry and continuity of mineralized subdomains; |
| · | Changes to the density values applied to the mineralized zones; |
| · | Changes to metallurgical recovery assumptions; |
| · | Changes in assumptions of marketability of the final product; |
| · | Variations in geotechnical, hydrogeological, and mining assumptions; |
| · | Changes to assumptions with an existing agreement or new agreements; |
| · | Changes to environmental, permitting, and social license assumptions; |
| · | Logistics of securing and moving adequate services, labor, and supplies could be affected by epidemics, pandemics, and other public health crises, or geopolitical influence. |
Mineral Reserve Estimate
Estimation Methodology
Underground Mineral Reserves were estimated by BBA. Estimates were prepared for the Santa Cruz deposit, a portion of the East Ridge deposit, and the Verde domain located within the Santa Cruz deposit. The primary mining method for both deposits employs longhole stoping without pillars, utilizing a primary and secondary stoping sequence. Additionally, a few small lenses within the East Ridge deposit use a drift-and-fill mining method. Stopes will be backfilled after mining with paste backfill for the duration of the mine life. Indicated Mineral Resources were converted to Probable Mineral Reserves. Inferred Mineral Resources were not converted to Mineral Reserves; however, if Inferred Mineral Resources fell within the Mineral Reserve designs, they were assumed to have zero grade.
The underground mine approach was designed using zones that were amenable to different mining methods based on geotechnical considerations, access requirements, deposit shape, orientation and grade, and mining depths. Waste or low-grade blocks in the stope shapes were treated as internal dilution. Mine designs were modified by including the capital and operating development needed to access the stopes, and the applicable infrastructure requirements.
Net smelter return (“NSR”) represents the gross revenue generated from the sale of a refined metal product (in this case, copper cathodes) after deducting all associated off-site costs. For a mine producing copper cathodes via heap leaching and SX/EW, the traditional "smelter" and "refining" charges inherent in concentrate sales are not applicable. Instead, the off-site deductions are specific to the direct sale of cathodes.
The primary metal produced at the Santa Cruz Copper Project is copper. While byproducts of gold and silver are present, the current heap leach SX/EW process does not recover these precious metals. As is common with polymetallic deposits, the cutoff value for Mineral Reserves is determined and expressed in terms of net smelter return value per tonne.
The NSR is calculated based on unit metal values, utilizing representative smelter contract terms, freight costs, and forecasted metal prices. The metal prices and metallurgical recovery rates used for NSR calculations are summarized in the first table below. Operating cost for cutoff value calculations are summarized in the second table below. Royalties are factored into each block of the Mineral Resource model.
Mineral Reserves are assessed using commodity prices derived from long-term forecasts from analysts and banks. According to BBA, this pricing generally reflects the trends observed over the past 1, 3, and 5 years, and the forward-looking prices from internationally recognized banks are deemed appropriate for Mineral Reserve estimates.
NSR Parameters
| Product | Unit | Value |
| Acid Soluble Copper Recovery | % | 98.8 |
| Cyanide Soluble Copper Recovery | % | 85.4 |
| Residual Copper Recovery | % | 35.1 |
| Recoverable Copper | % | 90.9 |
| Net Recoverable Copper | % | 90.0 |
| Copper Price | $/lb | 4.00 |
Operating Costs for Cutoff Value Calculations
| Criteria | Unit | Santa Cruz | East Ridge | East Ridge |
| 30 m Longhole | Drift-and-fill | 15 m Longhole | ||
| Leach | Leach | Leach | ||
| Cathode Split | % | 100.0 | 100.0 | 100.0 |
| On-site Costs | ||||
| Mining Costs – Direct | $/t processed | 31.00 | 47.05 | 47.05 |
| Processing Costs | $/t processed | 10.32 | 10.32 | 10.32 |
| G&A | $/t processed | 2.63 | 2.63 | 2.63 |
| On-site Total | $/t processed | 43.95 | 60.00 | 60.00 |
| On-site Rounded NSR Breakeven Cutoff | $/t | 44.00 | 60.00 | 60.00 |
Mineral Reserve Statement
Indicated Mineral Resources were converted to Probable Mineral Reserves. Inferred Mineral Resources were excluded from the Mineral Reserve estimate. Mineral Reserves for the Santa Cruz Copper Project are estimated for the Santa Cruz deposit and a portion of the East Ridge deposit, as well as the Verde domain within the Santa Cruz deposit.
Mineral Reserves are supported by a mine plan, engineering analysis, and modifying factors.
The point of reference for the Mineral Reserves is the point where the ore is delivered to the processing plant. Mineral Reserves are reported on a 100% basis.
The Mineral Reserve estimate for the Santa Cruz Copper Project is shown in the below table. A small increase between the 2025 mineral reserve and the 2026 mineral reserve is attributed to the initial mine ramp-up and sequencing. This adjustment, which represents an increase of approximately 2% of the contained copper, facilitated access to several stopes within the 2026 mine plan that were not available in the 2025 mine plan.
Santa Cruz Copper Project Mineral Reserve Estimate
| Deposit | Classification | Tonnes (kt) |
Total
Copper (%) |
Acid Soluble Copper (%) | Cyanide
Leach Copper (%) |
Residual
Copper (%) |
Contained
Copper (kt) |
Total
Acid Soluble Cu (kt) |
Total
Cyanide Cu (kt) |
Total
Residual Cu (kt) |
| Santa Cruz | Probable | 136,022 | 1.09 | 0.63 | 0.40 | 0.05 | 1,477 | 863 | 547 | 66 |
| East Ridge | Probable | 4,107 | 1.03 | 0.46 | 0.44 | 0.13 | 42 | 19 | 18 | 5 |
| Total | Probable | 140,129 | 1.08 | 0.63 | 0.40 | 0.05 | 1,519 | 882 | 566 | 71 |
Notes on Mineral Reserves:
1. The Mineral Reserves in this estimate are current to September 23, 2026, and were independently prepared, including estimation and classification, by BBA Consultants USA LP. They are reported in accordance with the definitions for Mineral Reserves in S-K 1300.
2. The point of reference for the estimate is the point of delivery to the process facilities.
3. The Mineral Reserves for the Santa Cruz and East Ridge deposits were completed using Deswik mining software. Mineral Reserves are defined within stope designs that are prescribed by rock mechanics, considering the specific characteristics of deposits, mineral domains, mining methods, and the mining sequence. Transverse longhole stoping is the optimal mining method with uppers and cut & fill methods used where appropriate. Mining will occur in blocks, extracting ore from the bottom upwards, with paste backfill providing ground support to sustain a production rate of 20,000 tonnes per day for the first 15 years of operation.
4. Mineral Reserves are estimated at an NSR cutoff value of US$43.95/t for longhole stoping and US$60.00/t for longitudinal retreat stopes and drift-and-fill. The NSR values reflect the discrete metallurgical responses for each Mineral Reserve block using metallurgical recoveries for heap leach of 96% for acid-soluble copper, 83% for cyanide-soluble copper, 22% for residual copper. Underground mineable shapes optimization parameters include a long-term copper price of US$4.00/lb.
5. Mineral Reserves account for mining loss and dilution.
6. Mineral Reserves are a subset of the Indicated Mineral Resource and do not include the inferred Mineral Resource.
7. Rounding, as required by the guidelines, may result in apparent summation differences between tonnes, grade, and contained metal content.
Factors That May Affect the Mineral Reserve Estimate
Factors that may affect the Mineral Reserve estimate include the following:
| · | Changes to long-term metal price assumptions; |
| · | Changes to metallurgical recovery assumptions; |
| · | Changes to the input assumptions used to derive the mineable shapes applicable to the assumed underground and open pit mining methods used to constrain the estimates; |
| · | Changes to the forecast dilution and mining recovery assumptions; |
| · | Changes to the cutoff grades used to constrain the estimates; |
| · | Variations in geotechnical (including seismicity), hydrogeological, mining, and processing recovery assumptions; |
| · | Changes to environmental, permitting, and social license assumptions. |
Mining Methods
The Santa Cruz Copper Project is an undeveloped greenfield project where Mineral Reserves have been identified for two deposits: Santa Cruz and East Ridge.
The Santa Cruz deposit is located approximately 480 to 940 m below the surface. Based on the mineralization's geometry and supporting geotechnical data, transverse underground longhole stoping has been selected as the most suitable mining method. Mining will be conducted in blocks, with ore being extracted from the bottom upward within each block while utilizing paste backfill to provide ground support. A sill pillar will be maintained between the blocks. The paste backfill is designed to be strong enough to allow adjacent filled stopes to be mined without requiring additional pillars.
The stopes for the Santa Cruz deposit will have varying widths of 12 to 18 m and lengths ranging from 10 to 17 m, depending on the geotechnical domain, zone, and mining sequence (primary or secondary). The levels in the mine are spaced 30 m apart. The Verde zone is a subdomain within the Santa Cruz deposit, and the production stopes in this area will be accessed from the Santa Cruz mine levels, featuring standard dimensions of 20 m (height) x 15 m (width) x 20 m (length).
The East Ridge deposit is situated to the north of the main Santa Cruz deposit, approximately 310 to 790 m below the surface. It consists of multiple tabular lenses and will be mined using a hybrid approach that combines longhole stoping and the drift-and-fill method, depending on the geometry of the orebody in each zone. At East Ridge, longhole stopes will measure 15 m (height) x 10 m (width) x 8 m (length), accessed via longitudinal entries. For zones using the drift-and-fill method, the drifts will have dimensions of 5 m (height) x 5 m (width), with variable lengths determined by the local rock mass condition. Mining will begin with a drift sized at 5 m (height) x 5 m (width), followed by paste backfill and curing before the development of the next adjacent drift in the orebody.
Mine access will be provided through a single tunnel boring machine (“TBM”) decline from the surface. Ore will be transported from the stopes by load-haul-dump (“LHD”) equipment to an orepass system, which will transfer the ore from a chute to a conveyor system. The conveyor system will transfer the material to surface. Main intake and exhaust raises will be developed to ensure the mine workings are adequately ventilated. The combined production target for the Santa Cruz and East Ridge deposits is approximately 20,000 t/d at peak production and approximately 14,000 t/d life of mine (“LOM”).
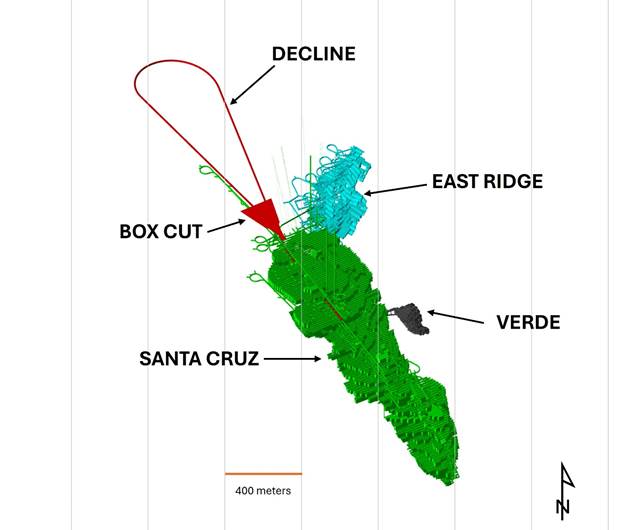
The Santa Cruz Copper Project encompasses three mining zones: Santa Cruz, Verde, and East Ridge. The Santa Cruz zone is the primary production area and is structurally divided into northern and southern regions.
Mining Zones of Santa Cruz and East Ridge Deposits, View Looking North
Source: Ivanhoe Electric, 2026
Primary (first-pass) support will be installed in conjunction with the advance of excavation and will provide support and reinforcement. Any support applied at a later stage will be considered secondary (or second-pass) support. Excavation in rock will be performed via conventional (drill and blast) methods or with a roadheader machine.
The Santa Cruz Copper Project mine life is expected to be 24 years with construction from 2027 to mid 2029 followed by schedule production to 2052. The below table summarizes the production in the mine plan. The “Ore” column represents the total development and production ore for Santa Cruz, Verde, and East Ridge mining zones.
Santa Cruz Scheduled Production Summary
| Year | Ore (kt) |
Total
Copper (%) |
AsCu (%) |
CNCu (%) |
Cu_Res (%) |
Ratio
ASCU:TCU |
| 2027 | 0 | 0.00 | 0.00 | 0.00 | 0.00 | - |
| 2028 | 101 | 0.54 | 0.13 | 0.44 | 0.00 | 0.82 |
| 2029 | 1,403 | 0.82 | 0.13 | 0.56 | 0.12 | 0.69 |
| 2030 | 4,684 | 1.37 | 0.22 | 1.09 | 0.05 | 0.80 |
| 2031 | 6,819 | 1.23 | 0.34 | 0.86 | 0.04 | 0.70 |
| 2032 | 7,286 | 1.10 | 0.47 | 0.58 | 0.05 | 0.53 |
| 2033 | 7,155 | 1.17 | 0.55 | 0.59 | 0.03 | 0.50 |
| 2034 | 7,245 | 1.16 | 0.49 | 0.62 | 0.04 | 0.54 |
| 2035 | 7,775 | 1.07 | 0.43 | 0.60 | 0.04 | 0.56 |
| 2036 | 7,679 | 1.09 | 0.31 | 0.75 | 0.03 | 0.69 |
| 2037 | 7,850 | 0.98 | 0.28 | 0.67 | 0.03 | 0.68 |
| 2038 | 8,003 | 1.02 | 0.31 | 0.66 | 0.05 | 0.65 |
| 2039 | 7,804 | 1.08 | 0.48 | 0.55 | 0.05 | 0.51 |
| 2040 | 7,105 | 1.18 | 0.64 | 0.45 | 0.09 | 0.38 |
| 2041 | 7,210 | 1.16 | 0.59 | 0.49 | 0.08 | 0.42 |
| 2042 | 7,672 | 1.09 | 0.48 | 0.57 | 0.05 | 0.52 |
| 2043 | 8,011 | 1.01 | 0.41 | 0.57 | 0.03 | 0.56 |
| 2044 | 7,447 | 1.01 | 0.32 | 0.62 | 0.08 | 0.00 |
| 2045 | 3,315 | 0.93 | 0.24 | 0.64 | 0.05 | 0.00 |
| 2046 | 3,625 | 0.98 | 0.49 | 0.46 | 0.03 | 0.47 |
| 2047 | 3,706 | 1.10 | 0.40 | 0.67 | 0.03 | 0.61 |
| 2048 | 3,647 | 1.02 | 0.27 | 0.68 | 0.07 | 0.66 |
| 2049 | 3,742 | 1.02 | 0.28 | 0.70 | 0.04 | 0.68 |
| 2050 | 3,659 | 1.05 | 0.39 | 0.58 | 0.07 | 0.55 |
| 2051 | 3,648 | 0.97 | 0.42 | 0.50 | 0.05 | 0.52 |
| 2052 | 3,537 | 1.03 | 0.21 | 0.74 | 0.08 | 0.72 |
| Total | 140,129 | 1.08 | 0.40 | 0.63 | 0.05 | - |
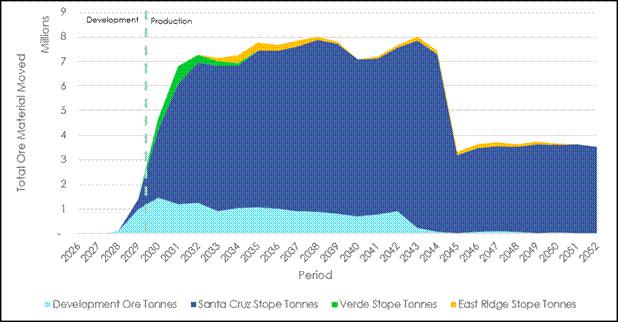
The figure below shows tonnes of material mined over the LOM from the orebodies and development.
Santa Cruz Tonnes of Mined Material
Source: BBA, 2026
Cemented paste backfill is used as the primary means of backfill to support the mining cycle and allow excavation of the adjacent voids. Spent ore from the on/off leach pad is the primary material source to produce paste. Due to the lag between the initial availability of spent ore from the on/off pad and the demand for paste, Oracle granite from the decline construction or an off-site source is used during the initial months of mine production. Milled spent ore will then be used for the remainder of the mine life. The spent ore requires conditioning and milling prior to use in the backfill system to establish suitable properties for use as paste backfill.
Grade control at the Santa Cruz mine will be enhanced through technology integrated into the materials handling system, such as cross-belt analyzers. Additionally, production hole sampling and on-site testing at the surface assay laboratory will be employed to reconcile results with the mine plan.
The underground ventilation system is designed to ensure efficient airflow and maintain appropriate working temperatures underground throughout the LOM. Using a “push-pull” system with main intake and exhaust fans, the system has a capacity of 880 m3/s, supported by one decline and three primary ventilation shafts. All main fans are planned to be installed on the surface at the shaft collars, while booster fans will be needed to regulate ventilation flow underground. Due to high ambient temperatures, mechanical cooling is provided by a central refrigeration plant with a peak capacity of 20 MW of refrigeration. The system features variable frequency drives and regulators to allow ventilation control underground, ensuring adequate air quality and efficient clearance of mine blast gases.
Recovery Methods
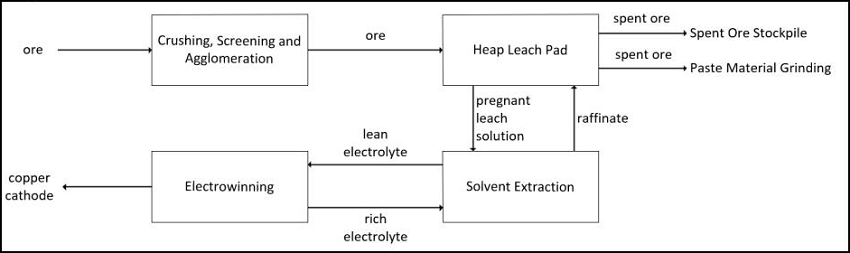
Process for the Santa Cruz Copper Project has been designed to cycle oxide and secondary sulfide ores through an on/off heap leach pad to produce a copper-rich pregnant leach solution (“PLS”) that will be processed in the on-site solvent extraction and electrowinning circuit for recovery.
The process plant and refinery designs were based on proven technologies and established operating practices, and commercially available equipment. The process and refinery plant designs are based on the results of metallurgical testwork on the mineralized material at the Santa Cruz Copper Project. The designs are conventional.
The simplified overall process flow diagram is presented in the figure below.
Simplified Process Flowsheet
Source: Worley, 2026
Ore produced from the underground mine will be processed using a heap leach and solvent extraction and electrowinning flowsheet to produce London Metal Exchange (“LME”) grade copper cathode. The heap leaching process will take place on an on/off pad. Spent ore will be removed from the leach pad and processed for paste backfill or stacked on a spent ore pile. Approximately 50% of the spent ore will be processed for use in paste backfill. Operations will be conducted 24 hours per day, 365 days per year for approximately 26 years at a design stacking rate of up to 22,000 t/d.
Run of mine (“ROM”) ore will be delivered to surface at a diameter of less than 254 mm via the conveyor. Ore from underground will be conveyed to the coarse ore stockpile for further 2-stage crushing. Fine ore (undersize from the crushing circuit) will be trucked to the agglomeration drums where sulfuric acid and sodium chloride can be added to facilitate agglomeration and leaching.
Crushed and agglomerated ore will be delivered to the leach pad via a combination of overland conveying and stacking equipment. The final mobile conveyor will feed two self-propelled indexing conveyors in series, which in turn will feed the self-propelled mobile radial stacker. The cells will be ‘retreat’ stacked by the radial stacker in a 65.5 meter-wide (half-cell) half moon shape.
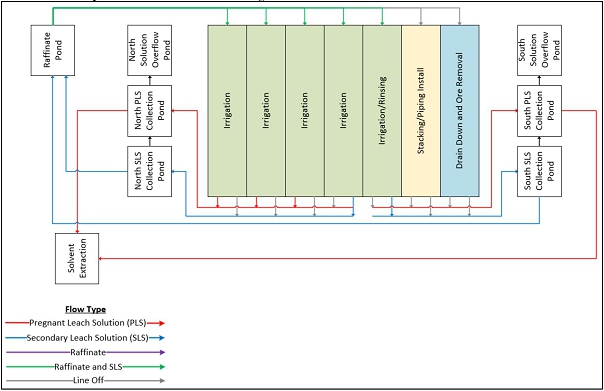
The on/off heap leach pad will be divided into seven cells, each approximately 130 x 730 meters. The cells will be separated by divider berms located near their base so that solution flow from each cell can be segregated for collection. The liner for the leach pad is comprised of a high-density polyethylene geomembrane overlaying a geosynthetic clay liner overlaying prepared native foundation materials or grading fill.
Ore will be stacked at up to 22,000 t/d, while unloading will consider a constant rate of 22,000 t/d; based on a typical interior half-cell strip (i.e., not the end cell strips on the north or south sides of the pad), it will take approximately 25 days to stack each half-cell strip at the design production rate. Each of the cells (and more specifically, each of the half-cell strips) will cycle through the following processes in sequence with an entire cell cycle, under the design production rates and idealized cell sizing, taking approximately 320 days.
The cycles are as follows:
| · | Stacking (25 days); |
| · | Piping connections and stacker relocation (3 days); |
| · | Irrigation (220 days); |
| · | Solution drain, water rinse, drain down, and piping removal (23 days); |
| · | Spent ore removal (25 days); |
| · | Inspection and maintenance (empty cell time) (26 days). |
The cells will be irrigated with raffinate (depleted pregnant leach solution from the solution extraction process) or secondary leach solution (“SLS”) produced from leaching. Leach solution will report to the solution collection ponds. At the end of the leach cycle, spent ore will be removed to the spent ore stockpile or the paste plant using dozers, loaders, grasshopper / link conveyors and trucks (see figure below).
Seven-Cell Heap Leach and Solution Management
Source: KCB, 2026
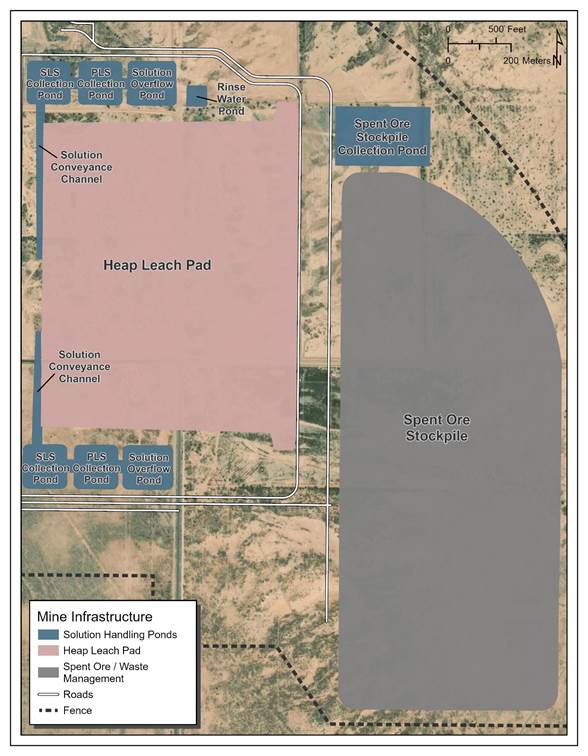
Solution will be managed in a series of lined ponds, including the raffinate pond, PLS and SLS collection ponds, solution overflow ponds, and spent ore stockpile collection pond. The pond system has been sized to contain normal operating solutions and stormwater and to maintain separation between contact and non-contact water. The proposed locations of the solution management ponds are depicted in the figure below.
Solution Management Ponds, Leach Pad, and Spent Ore Piles
Source: Ivanhoe Electric, 2026
The solvent extraction circuit design comprises two parallel trains. Each train will consist of two extraction stages, two wash stages, and one strip stage.
The copper electrowinning tankhouse will comprise electrowinning cells with lead anodes and stainless-steel cathode blanks. Cathodes (copper electroplated onto stainless steel blanks) will be harvested manually using an overhead crane and bail. Cathodes will be stripped in an industry standard automated stripping machine and the washed blanks will be returned to the cells. Product cathode copper will be bundled, sampled, weighed, labeled, and shipped.
Infrastructure
The Santa Cruz Copper Project site surface infrastructure comprises the following:
| · | An open excavation 30-meter-deep “boxcut” ramp for accessing a decline portal to the underground mine workings; |
| · | Three ventilation shafts for airflow and cooling to the underground mine workings; |
| · | Primary mine ventilation fans, hardware, and ducting to control ventilation to the underground mine workings; |
| · | Refrigeration plant to control temperatures in the underground mine workings; |
| · | Rock crushing, stockpiles and process plant; |
| · | Spent ore stockpile; |
| · | On/off leach pad with associated collection ponds and mobile stacking; |
| · | Solution extraction and electrowinning process facilities; |
| · | Mobile cement batch plant facility; |
| · | Paste backfill batch facility; |
| · | Maintenance, and warehouse facilities; |
| · | First aid/rescue building; |
| · | Multiple various ancillary outbuildings; |
| · | Entry security shack and various visitor and project parking spaces; |
| · | Equipment delivery and open laydown/storage area; |
| · | Multiple improved and unimproved access roads; |
| · | Piping and pumping systems for process and water services; |
| · | Explosives storage facility; |
| · | High-voltage transmission line, substations and medium-voltage distribution; |
| · | Environmental monitoring facilities; |
| · | Emergency power generation facility. |
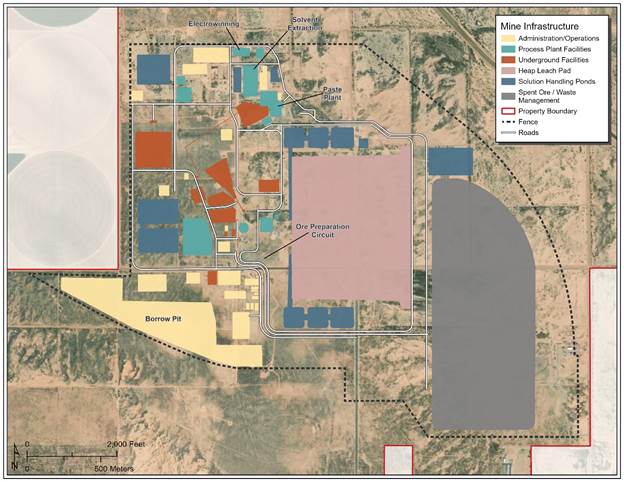
Key infrastructure locations are shown on the figure below.
Santa Cruz Site Plan
Source: Ivanhoe Electric, 2026
Power for the Project will be provided from the utility grid supply. The goal of the mine development is to achieve a minimum of 70% of the energy supply from clean sources via a “Green Select Energy Rider” provided through the local power utility, Electrical District No. 3 (“ED3”).
The Santa Cruz Copper Project will have an estimated operating load of 74 MW during peak production years (2031-2044) and a forecast annual consumption of 647,000 MWh/y during peak production years and 690,000 MWh in 2039.
Water supply for process operations will be sourced from existing grandfathered Type I non-irrigation rights and mine dewatering. Potable water will be trucked in from the city. Trucked water will be stored in a tank to service the surface facilities.
Water management operations include systems of underground dewatering, water collection and conveyance facilities, water storage, water use, and various management options for discharge of excess water. Water not used for underground mining, the paste backfill plant, the process plant, and the on/off heap leach pad can be pumped to storage reservoirs. Rapid infiltration basins are used to capture non-contact stormwater runoff to prevent stormwater from coming into contact with mining operations.
Testwork confirmed the extracted groundwater quality will be acceptable for irrigation use when applied to suitable crops (e.g., cotton, alfalfa, pasture grasses) commonly grown in the vicinity of the Project. The water distribution system is designed to distribute water to agricultural end-users, without treatment, and includes a side-stream water treatment process that may be used if the extracted groundwater does not meet the standards defined by end-users.
On-site accommodations facilities are neither required nor planned. Personnel will reside in nearby settlements including Casa Grande, Maricopa, the Phoenix metropolitan area, and Tucson, and will commute to site by vehicle. Parking, security, fencing, and a gatehouse are included in the design.
The infrastructure buildings to be built on site include explosive magazine storage; cap magazine storage; core shack; process laboratory; security and main gate; fueling station; mine, plant operations building, changehouse, and mine dry; first aid and emergency rescue facilities; mining facility warehouse.
Market Studies & Contracts
Copper is a globally traded commodity that has established benchmark pricing in the form of exchanges such as the London Metals Exchange or Commodity Exchange Inc. The Santa Cruz Copper Project aims to produce copper cathode. Ivanhoe Electric plans to sell the copper in the United States.
Refined copper cathodes will be sold with reference to the prices on the Commodity Exchange or London Metals Exchange at an agreed-upon quotational period. An additional premium to the price will be negotiated with potential buyers. Factors affecting the premium will include the shape and chemical specification of the cathode, together with the geographical location of the delivery point in relation to where the cathode is going to be consumed.
The Economic Model uses a base copper price of $4.75 per pound, which is based on a review of the 1-, 3-, and 5-year trailing averages, as well as consensus forecasts from major banks and a market study completed by Ocean Partners for Ivanhoe Electric.
Due to the shape, chemical composition, and origin point of the cathode, it is expected that a premium to the price will be negotiated with potential buyers that is marginally above the historical average. For financial modeling purposes, this premium is estimated at $0.14 per pound ($300 per tonne) (Ocean Partners, 2025).
The table below summarizes the 1-, 3-, and 5-year trailing price for copper using the LME Grade A monthly average as well as consensus forecasts from the major banks (CIBC, 2025).
Commodity Price Summary
LME
Average
|
Forecast ($/lb) |
|||||||
| 1-Year | 3-Year | 5-Year | 2026 | 2027 | 2028 | 2029 | Long-term | |
| BBA1 | 5.66 | 4.64 | 4.39 | |||||
| Banks Forecast2 | 5.97 | 5.94 | 5.78 | 5.69 | 5.03 | |||
Notes:
1BBA, Metal Pricing_R00, September 2026.
2CIBC Consensus Commodity Prices – September 2026.
LME = London Metals Exchange.
A limited number of contracts with vendors, contractors, or manufacturers including for the TBM with The Robbins Company, along with long lead items to support on-site power and the SX/EW plant, have been executed. Additional major contracts will be required. Copper cathode will be sold at mine gate.
Environmental, Closure & Permitting
Environmental studies have included examination of flora and fauna, threatened and endangered species, migratory birds, surface water mapping, cultural heritage, air quality, carbon intensity, surface water monitoring, groundwater monitoring, water quality, climate risk, soils, material characterization, and mine material environmental behavior.
Much of the Property has been previously disturbed from its natural state. These disturbances include flood control features, such as the canal identified as the Santa Cruz Wash Canal, paved and unpaved roads, and agricultural practices. These disturbances have removed all potential natural surface water features that may have existed in this area. The only features within the Property that possess characteristics of an ordinary high-water mark and may be potential Waters of the United States are the north branch of the Santa Cruz Wash and the constructed Santa Cruz Wash Canal.
The Project is committed to responsible environmental management, with a particular focus on minimizing air quality impacts. The Project is located within the West Pinal County PM10 (particulate matter emissions with a diameter less than 10 microns) nonattainment area. Accordingly, the Project will take specific measures to control and effectively mitigate dust. These measures will be in alignment with both local and state requirements.
A groundwater monitoring program to continue collecting baseline water quality data was developed and implemented in October 2023. The objective of the monitoring plan is to establish a current baseline water quality profile for the site and help inform Ivanhoe Electric on best management practices for groundwater monitoring during and after mining operations.
The major permits for the Project will require state, county, and local authorizations. Several of these permits have been issued for early construction. Other permits for full construction and operations activities are in preparation or have been submitted.
The eventual closure and reclamation of the Santa Cruz Copper Project will be directed and regulated under two separate but interconnected regulatory programs in Arizona: the Arizona State Mine Inspector (“ASMI”) and the Arizona Department of Environmental Quality (“ADEQ”). Both programs are well-established and statutes and rules are subject to licensing timeframes.
Three General Aquifer Protection Permits (“APP”) to support construction activities have been approved by ADEQ. The Areawide Aquifer Protection Program permit application was submitted to ADEQ and has been deemed administratively complete. Substantive review is in progress. A construction level Mined Land Reclamation Plan (“MLRP”) has been approved by the ASMI.
Although an operational MLRP has not yet been developed for the Project, a preliminary closure cost estimate has been developed. Based on the conceptual design plan in this report, the closure costs for the Santa Cruz Copper Project are estimated at $27 million.
In alignment with Ivanhoe Electric’s community engagement and partnership standards, the Project is being developed with a well-defined strategy to establish and uphold the support of the surrounding communities. At present, the Project is continuing outreach with Native American communities that have ancestral ties to the land. In addition, community outreach with local stakeholders, and community involvement continues, and potential partnerships are actively being pursued and/or assessed.
Capital & Operating Cost Estimates
Capital Cost Estimate
For the Santa Cruz Copper Project, capital and operating costs were determined based on the mine plan and SX/EW plant design. The estimation process incorporated assessments of material and labor requirements derived from the design, analysis of the process flowsheet, and anticipated consumption of power and supplies.
Cost estimation is based on a combination of vendor and consumable quotes and an internal database. Approximately 80% of the capital estimate is based on detailed quotes with estimated labor installation. For the purposes of this study, initial capital expenditure is assumed to be costs incurred in 2027, 2028 and mid-2029. By mid-2029, ore production from stopes has been established and the SX/EW plant has been installed to begin copper production. Additional mine and plant capital costs are incurred from 2029 and 2052 to continue meeting mine ramp up and production demands and are included in sustaining capital costs.
Total LOM capital costs are $2.85 billion: $1.43 billion in initial capital and $1.42 billion in sustaining capital. Capital costs are summarized in the below table.
Estimated Total Capital Cost
| Capital Costs Summary | Initial
Cost ($M) |
Sustaining
Cost ($M) |
Total LOM Capital Cost ($M) |
| Pre-production Mining Costs | 50 | - | 50 |
| Mining | 790 | 1,465 | 2,255 |
| Process | 384 | 60 | 444 |
| Owners Cost | 17 | - | 17 |
| Indirects | 55 | 15 | 70 |
| EPCM | 49 | 5 | 54 |
| Contingency | 79 | 0 | 79 |
| Total Initial Capital | 1,423 | - | - |
| Total Sustaining Capital | - | 1,545 | - |
| Reclamation and Closure Costs* | 3 | -121 | -119 |
| Total Life of Mine Capital Costs | 1,426 | 1,424 | 2,850 |
Note: Closure costs include land sales at the end of life of mine. Totals may not sum due to rounding.
Operating Cost Estimate
Total LOM operating costs are $4.53 billion, as summarized in the below table.
Estimated Operating Costs
| Category | $M Total | $/t Ore Processed | $/lb Copper Produced |
| Mining | |||
| Consumables | 1,452 | 10.40 | 0.47 |
| Mobile Equipment | 465 | 3.33 | 0.15 |
| Labor | 741 | 5.31 | 0.24 |
| Power | 251 | 1.80 | 0.08 |
| Mine Services and Indirect | 157 | 1.12 | 0.05 |
| Subtotal | 3,066 | 21.95 | 0.99 |
| SX/EW Plant and Infrastructure | |||
| Consumables | 285 | 2.04 | 0.09 |
| Hauling and Mobile Equipment | 171 | 1.22 | 0.06 |
| Labor | 158 | 1.13 | 0.05 |
| Power | 365 | 2.61 | 0.12 |
| Maintenance | 68 | 0.49 | 0.02 |
| Subtotal | 1,047 | 7.50 | 0.34 |
| G&A | 418 | 2.99 | 0.14 |
| Total | 4,532 | 32.45 | 1.47 |
Note: Totals may not sum due to rounding. Direct operating costs are exclusive of royalty payments.
Economic Analysis
Based on the cash flow model, the after-tax financial model resulted in an internal rate of return (“IRR”) of 18.7% and a net present value (“NPV”) of $1.52 billion using an 8% discount rate. The after-tax payback period, after start of operations, is 4.8 years. The pre-tax base case financial model resulted in an IRR of 20.2% and an NPV of $1.90 billion using an 8% discount rate.
The Santa Cruz Copper Project contemplates average annual copper cathode production of approximately 75,000 tonnes for the first 15 years of copper production and the average annual production is approximately 58,000 tonnes for the life of mine.
The total life of mine is 24 years at an average C1 cash cost of $1.47 per pound of copper and sustaining cash costs of $2.28 per pound of copper.
The financial analysis summary is shown in the below table.
Financial Analysis Summary
| Description | Units | Life of Mine | First 15 Years |
| Production Data | |||
| Mine Life | years | 24 | 15 |
| Reserve Tonnes | Mt | 140 | 110 |
| Copper Grade | % | 1.08 | 1.11 |
| Daily Throughput | t/d | 15,346 | 20,030 |
| Annual Copper Production | t/y | 58,385 | 74,722 |
| Total Copper Cathode Produced | kt | 1,401 | 1,121 |
| Recovery | % | 92.3 | 92.3 |
| Capital Costs | |||
| Initial Capital | $M | 1,426 | 1,426 |
| Sustaining Capital | $M | 1,546 | 1,463 |
| Unit Costs | |||
| Mining Cost | $/t processed | 21.95 | 21.52 |
| Processing Cost | $/t processed | 7.50 | 7.45 |
| General and Administrative Cost | $/t processed | 2.99 | 3.11 |
| Royalties | $/t processed | 6.90 | 6.93 |
| Total Operating Cost | $/t processed | 39.35 | 39.00 |
| Operating + Sustaining Cost | $/t processed | 50.41 | 52.50 |
| C1 Cash Cost | $/lb of copper | 1.47 | 1.42 |
| All-in-Sustaining Cost | $/lb of copper | 2.28 | 2.27 |
| Financial Analysis | |||
| Copper Price | $/lb | 4.75 | 4.75 |
| Domestic Cathode Premium1 | $/lb | 0.14 | 0.14 |
| Pre-Tax Cashflow | $M | 6,761 | 4,971 |
| Pre-Tax Net Present Value (8%) | $M | 1,898 | - |
| Pre-Tax Internal Rate of Return | % | 20.2 | - |
| After-Tax Cashflow | $M | 5,575 | 4,133 |
| After-Tax Net Present Value (8%) | $M | 1,519 | - |
| After-Tax Internal Rate of Return | % | 18.7 | - |
| After-Tax Payback Period | year | 4.8 | - |
1 See Section 16 for a discussion on copper premium.
Risks & Opportunities
Common to mining projects are internal and external risks that could affect the Project's reliability, confidence, and/or economic viability. External risks are generally applicable to all mining projects, such as the political situation in the Project’s region, metal prices, exchange rates, and government legislation.
Ivanhoe Electric retained BBA to facilitate a scored likelihood × consequence matrix workshop to identify development risks. Table 22-1 of the full 2026 PFS identifies what are currently deemed to be the most significant Project risks, potential impacts, and possible mitigation approaches that could reasonably affect the reliability or confidence of the Project.
Opportunities that could enhance the Project's economics and timing are summarized in Table 22-2 of the full 2026 PFS, excluding those typical to all mining projects, such as changes in metal prices, exchange rates, etc. Further information and assessments are needed before including these opportunities in the Project economics.
Conclusions
Under the assumptions presented in the 2026 PFS, the Santa Cruz Copper Project consists of Mineral Resource and Mineral Reserve estimates that support a positive cash flow.
Item 9.01 Financial Statements and Exhibits.
(d) Exhibits.
Forward Looking Statements
The Company cautions you that statements included in this Current Report on Form 8-K that are not a description of historical facts are “forward-looking statements” or “forward-looking information” within the meaning of applicable US and Canadian securities laws. Such statements and information involve known and unknown risks, uncertainties and other factors that may cause the actual results, performance or achievements of the Company, its projects, or industry results, to be materially different from any future results, performance or achievements expressed or implied by such forward-looking statements or information. Such statements can be identified by the use of words such as “may,” “would,” “could”, “will,” “intend,” “expect,” “believe,” “plan,” “anticipate,” “estimate,” “scheduled,” “forecast,” “predict” and other similar terminology, or state that certain actions, events or results “may,” “could,” “would,” “might” or “will” be taken, occur or be achieved. These statements reflect Ivanhoe Electric’s current expectations regarding future events, performance and results and speak only as of the date of this Current Report on Form 8-K.
Such statements may include, without limitation: the projections, assumptions and estimates contained in the Preliminary Feasibility Study related to the Santa Cruz Copper Project, including but not limited to those related to capital and operating costs, metal prices, cash flow, cash costs, revenue, net present value, internal rate of return, mine design and mining techniques and processes, copper production, grade and recoveries, development, throughput, life of mine, illustrative timelines related to mine construction, permitting and copper production, potential financing, jobs during construction and operations, mine sequencing, mining technology, equipment, staffing and infrastructure, emissions, use of land, water management and estimates regarding groundwater flow, power and other resources, estimates of mineral resources and reserves, potential for expansion of mineral resources, copper grade and cash costs relative to other mines, use of renewable energy, use of energy storage technologies, the ability to produce pure copper cathode, the ability to secure state and local permits, and planned or potential developments in the businesses of the Company.
Forward-looking statements are based on the author’s beliefs and assumptions and on information currently available. Such statements are subject to significant risks and uncertainties, and actual results may differ materially from those expressed or implied in the forward-looking statements due to various factors, including fluctuations in metal prices; risks related to inflation and changes in interest rates, discount rates, exchange rates, and taxes; risks due to the inherently hazardous nature of mining-related activities; uncertainties due to health and safety considerations; uncertainties related to environmental considerations, including, without limitation, climate change; uncertainties relating to obtaining approvals and permits, including renewals, from governmental regulatory authorities; uncertainties related to changes in law; uncertainty related to the availability and terms of capital; and those risk factors described in the Company’s Annual Report on Form 10-K and other disclosures made by the Company with the U.S. Securities and Exchange Commission and Canadian securities regulators.
Although the authors believe that the assumptions and factors used in preparing the forward-looking statements in this Current Report on Form 8-K are reasonable, undue reliance should not be placed on such forward-looking statements, which only apply as of the date of this Current Report on Form 8-K, and no assurance can be given that such events will occur in the disclosed time frames or at all. The authors disclaim any intention or obligation to update or revise any forward-looking statements, whether as a result of new information, future events, or otherwise, other than as required by applicable law.
SIGNATURES
Pursuant to the requirements of the Securities Exchange Act of 1934, the registrant has duly caused this report to be signed on its behalf by the undersigned hereunto duly authorized.
| IVANHOE ELECTRIC INC. | |||
| Date: September 23, 2026 | By: | /s/ Taylor Melvin | |
| Taylor Melvin | |||
| President and Chief Executive Officer | |||